


Abstract
The embedded through-section (ETS) technique is a promising method for fiber-reinforced polymer (FRP)-strengthening reinforced concrete (RC) structures, offering higher bond resistance and reduced surface preparation compared to externally bonded or near-surface mounted FRP systems. A common failure in ETS applications is debonding at the FRP bar-to-concrete interface. However, current design standards often assume uniform bond stress and lack predictive models that account for debonding propagation and its effect on load capacity. Furthermore, a detailed analysis of interfacial stress development, including debonding initiation and progression along varying bond lengths, remains limited. To address these gaps, this study introduces an analytical model that describes the complete debonding process in ETS FRP bar-to-concrete joints, incorporating both long and short bond lengths and frictional effects. Based on a trilinear cohesive material law (CML), closed-form expressions are deduced for the load–slip response, maximum load, interfacial shear stress and strain distribution along the FRP bar. The proposed model is validated experimentally through pull-out tests on glass FRP (GFRP) bars adhesively bonded to concrete with different strength grades. The results show that the analytical predictions agree well with both the self-conducted experimental data for short joints and existing test results for long joints given in the literature. Therefore, the developed design-oriented solution enables accurate evaluation of the actual contribution of ETS FRP reinforcement to RC members by explicitly modeling debonding behavior. This provides a rigorous and mechanics-based tool for performance-based design of ETS FRP-to-concrete joints, addressing a critical gap in the future refinement of current design standards.
1. Introduction
The retrofitting and strengthening of existing structures have become a prominent focus in modern construction. Driven by structural deterioration and environmental degradation, these interventions are crucial for enhancing structural performance and extending service life. Among these techniques, the embedded through-section (ETS) method has emerged as a novel approach. This technique involves embedding fiber-reinforced polymer (FRP) or steel bars into the concrete core via pre-drilled holes. Experimental investigations [1,2,3,4,5,6] have demonstrated that ETS bars provide superior a shear strengthening efficiency compared to conventional retrofitting methods. Furthermore, ETS strengthening has been shown to shift the failure mode of strengthened beams from brittle shear to ductile flexural, characterized by the yielding of longitudinal reinforcement or concrete crushing in the compression zone.
Numerical studies by Godat et al. [7] and Bui [8] employed finite element (FE) models and typically assumed a perfect bond between the ETS bars and the surrounding concrete. These simulations investigated global structural responses, such as load–deflection curves and bar strains. Concurrently, analytical models based on design codes from the Japan Society of Civil Engineers (JSCE) and the American Concrete Institute (ACI) have been proposed by Mofidi et al. [2], Breveglieri et al. [5], and Bui [6] to predict the shear resistance of ETS-strengthened members. However, a significant limitation across analytical and numerical is the inadequate consideration of the interfacial behavior between the ETS bars and the concrete, which critically influences the performance of the retrofitted beams.
The bond mechanism between reinforcement and concrete is fundamental to structural performance. However, accurately modeling this behavior in numerical tools often requires complex bond laws and intricate procedures [9,10,11,12,13]. It is well-established that the efficacy of the FRP-strengthening systems is highly dependent on the FRP–concrete interfacial response. Consequently, significant research has focused on defining this interfacial relationship. For instance, Nakaba et al. [9] developed a local bond–slip model to facilitate numerical analysis. Ueda and Dai [10,11] proposed a bond stress–slip model to improve strength and deformation predictions. Similarly, Lin and Zhang [12] utilized various existing bond models in their FE analysis of strengthened beams. Collectively, these studies indicate that incorporating a realistic bond mechanism is essential for reliable numerical simulations. Despite this understanding for other systems, comprehensive interfacial bond models specifically for ETS FRP bars and concrete remain scarce [14,15,16,17,18,19,20]. Furthermore, the applicability of existing bond models developed for externally bonded (EB) or near-surface mounted (NSM) FRP to analytically evaluate the behavior of ETS-strengthened beams has not been thoroughly validated.
Bond failure in ETS bonded systems typically occurs at the weaker of two interfaces, i.e., either between the FRP bar and the adhesive, or between the adhesive and the concrete. To address this issue, Spada et al. [21,22] investigated the mechanical response of adhesively bonded systems, comparing both simplified and detailed modeling approaches. The simplified model treats the adhesive and its two interfaces as a single, zero-thickness layer. In contrast, the detailed model explicitly simulates both the concrete-adhesive and adhesive-bar interfaces. While the detailed model offers higher fidelity, its accuracy comes at a significant cost. It requires the calibration of numerous parameters, which is only reliable if the corresponding plasticity and damage mechanisms are experimentally observed. Otherwise, parameters must be estimated, potentially degrading the correlation between numerical and experimental results, especially for complex structures. Furthermore, the detailed approach demands substantially greater computational effort. Nevertheless, comparative studies by Spada et al. [21] concluded that the simplified model provides results in good qualitative and quantitative agreement with experimental data, while being significantly less computationally intensive.
An alternative perspective, proposed by Yang et al. [23,24,25], conceptualizes the debonding process of a bonded bar-to-concrete interface as the propagation of a debonding crack within a fracture process zone (FPZ). The stress-transfer mechanism within this FPZ is characterized by a shear stress–slip (τ-s) relationship, known as a cohesive material law (CML). A defined CML facilitates the determination of stress and slip distributions along the bonded interface. Simple forms of CML shapes, such as bilinear models, facilitate analytical closed-form solutions, whereas complex shapes, like continuous exponential functions, necessitate numerical methods (e.g., [26,27]). CMLs for FRP-adhesive–concrete joints typically feature an ascending branch followed by a softening branch. A constant-friction branch is often included to account for residual stresses at the interface [28,29]. This frictional branch is critical, as residual stresses can increase the ultimate capacity of bonded joints, particularly for longer bonded lengths. For composites exhibiting this behavior, the load-carrying capacity is defined by the debonding stress, which corresponds to the full mobilization of the stress-transfer mechanism [30]. The minimum bonded length required to develop the debonding stress is known as the effective bond length (Leff) [31]. The role of friction has been widely acknowledged in modeling the bond behavior of FRP adhesive anchor systems. It has also been used to capture the full-range debonding of EB and NSM FRP plates [32] and embedded FRP bars [12,33,34,35,36,37]. Moreover, friction has been instrumental in explaining the disparity between intermediate crack (IC) and plate-end (PE) debonding in FRP bar-strengthened RC beams [38]. This concept has been incorporated into prominent design guidelines such as the fib Bulletin 90 [39]. In this framework, the debonding process is modeled using a traditional bilinear CML extended with a final frictional branch as shown in Figure 1. This branch accounts for two key phenomena: the mechanical interlocking from the bar ribs at the bonded interface, and a constant shear stress that represents the effect of confining pressure.
Figure 1.
Cohesive material law for FRP-to-concrete joints. (a) Trilinear shape with friction; (b) bilinear shape by simplified bond parameters in trilinear one.
The bond behavior between ETS FRP bars and concrete fundamentally differs from that of externally bonded (EB) FRP sheets or strips. In EB systems, debonding typically occurs within a thin layer of the concrete substrate [40], and the bond strength is governed primarily by the tensile strength of concrete. In contrast, debonding in ETS joints initiates along either the bar–adhesive or the adhesive–concrete interface, depending on which constitutes the weaker link. When ribbed FRP bars are used in combination with a high-strength adhesive, debonding progresses through the shearing of adhesive keys and bar ribs, leading to a significantly higher bond capacity compared to EB interfaces. This enhanced performance has been experimentally demonstrated by Chaallal et al. [1]. Furthermore, intentional roughening of the adhesive–concrete interface can increase mechanical interlock, further improving the bond strength. Given these distinctive mechanisms, a dedicated evaluation of the bond behavior of ETS FRP bar-to-concrete interfaces is essential for advancing the application of ETS FRP composites. Although research on this area is growing, it remains limited compared to that on EB FRP-strengthened systems.
While the FRP-to-concrete bond behavior has been extensively studied, analytical models capable of characterizing the debonding propagation in ETS FRP bar-to-concrete joints remain scarce. To address this gap, this paper proposes a trilinear cohesive material law (CML) to describe the bond response of ETS FRP bar-to-concrete joints exhibiting residual frictional stresses. This law consists of an ascending, softening, and frictional branch and can easily be reduced to bilinear laws without friction. Closed-form solutions for each stage of the stress-transfer mechanism are derived for both long (L > leff) and short (L < leff) bonded lengths. These equations are then validated against experimental data for both long and short joints, which is available in the literature. A comparison of the results demonstrates that the trilinear CML provides a simple yet comprehensive framework that accurately reproduces the observed experimental behavior.
It is noted that the debonding problem on similar bonded interfaces, such as the matrix–fiber interface [41,42,43] and FRP-to-concrete joints [32,44], has been well-established in the literature. Despite this, the novelty of the present work lies in the original application and adaptation of this established framework to a distinctly different physical problem, i.e., the debonding of ETS FRP bars embedded in concrete. Although the CML and solution structure are conceptually transferable, the reinforcing method (embedded bar versus externally bonded), reinforcement type (bar versus sheet/strip), and associated boundary conditions are fundamentally different. Consequently, the closed-form expressions derived here for the complete load–slip response, bar strain, interfacial bond stress, and ultimate capacity throughout the debonding process are original and have not been presented previously. The primary contributions of this analytical work are twofold. First, it provides a rigorous closed-form solution for the full-range debonding behavior (from elastic to complete debonding) of ETS FRP bar-to-concrete joints, explicitly accounting for both long and short bonded lengths and including post-peak frictional resistance. Second, the accuracy of this solution is validated against the self-conducted experimental data for short joints, as well as against existing test results for long joints from the literature. The good agreement between them enhances the applicability and robustness of the CML in modeling the debonding response of ETS FRP-strengthened concrete members.
2. Research Significance and Novelty
Previous research has predominantly focused on the debonding behavior of externally bonded (EB) FRP composites, where FRP sheets are applied to the side surfaces of strengthened beams. In contrast, the embedded through-section (ETS) strengthening technique involves embedding FRP bars into pre-drilled holes within the concrete beam cross-section using epoxy adhesive. In this system, the shear contribution (often termed bond resisting force [8]) relies critically on the debonding performance at the ETS bar–concrete interface. While extensive analytical expressions exist in the literature for modeling the bond behavior of EB FRP sheets, these models are not directly applicable to ETS FRP bar–concrete joints due to fundamental differences in load transfer and failure mechanisms. Moreover, there remains limited analytical studies dedicated to the complete debonding response and full-range load–displacement behavior of ETS FRP bars. To address this gap, the present work develops an analytical framework to investigate the full-range debonding behavior of ETS FRP bars from concrete, based on a trilinear cohesive material law (CML). This approach facilitates a detailed prediction of the interfacial behavior from initial loading through to complete debonding. The proposed analytical solutions demonstrate close agreement with experimental results, confirming their reliability in predicting the performance of ETS FRP bar–concrete joints and offering a new tool for the design and assessment of such strengthening systems.
3. Theoretical Background
3.1. Fundamental Assumptions
Consider an ETS FRP bar-to-concrete bonded joint under a pullout load P given in Figure 2a, the schematic view of the joint is shown in Figure 2b, where sf, sc, and tb represent axial stress in FRP bar, axial stress in concrete, and bond shear stress between the bar and the concrete. The formulation of the model is predicated on a set of core assumptions:
Figure 2.
Schematic view of (a) ETS FPR bar-to-concrete joint and (b) equilibrium of infinitesimal segment of each component. The shear stress at the bar–adhesive interface equals that at the adhesive–concrete interface because the behaviors of these two interfaces and adhesive are characterized by trilinear CML.
- (i)
- The FRP bar exhibits linear elastic behavior until failure and the axial stress with the bar is uniformly distributed across the radial direction (r).
- (ii)
- The bonded interface is represented by a zero-thickness trilinear CML.
- (iii)
- The failure occurs at the bar-to-concrete interface. Therefore, only mode II failure is considered, while the concrete is assumed to behave elasticity throughout the failure process.
- (iv)
- Concrete substrate is not rigid but a constant axial stress along the radial direction.
The analytical model implicitly neglects the shear deformability and strain of the bulk adhesive, as it simplifies the adhesive and its adjacent interfaces into a zero-thickness CML governed by a trilinear bond stress–slip law. This approach is consistent with the simplified micromodeling strategy described by Spada et al. [21], where the adhesive and the two physical interfaces (bar–adhesive and adhesive–concrete) are lumped into a single zero thickness interface element. As Spada et al. [21] demonstrated, both the simplified micromodeling strategy and the detailed micromodel which explicitly models resin and interfaces yielded results in good agreement with experimental data. They concluded that the simplified model can be preferred due to its simpler implementation and lower computational time requirement. This supports the validity of the simplified assumption when the failure is predominantly interfacial, as is typically the case in ETS systems.
However, as highlighted in the literature (e.g., Calabrese et al. [45]), adhesive strain significantly shapes the interfacial stress transfer, cohesive response, and load–slip behavior of bonded joints, particularly when the bondline thickness exceeds 2 mm. While the adhesive thickness considered in the ETS system is greater than 2 mm, it remains significantly smaller than the diameter of the FRP bar. In such a configuration, the shear deformation of the adhesive is constrained by the much stiffer FRP bar and concrete, and its contribution to the overall displacement is minor relative to that of the interfacial slip. This is consistent with experimental observations in ETS systems [46,47,48], where failure is generally governed by debonding along the interfaces. Thus, the adhesive acts primarily as a stress-transfer medium, and its behavior can be effectively represented through an interfacial cohesive law. Furthermore, the employed trilinear CML is calibrated against experimental load–slip responses. Through this calibration, the effective shear stiffness, strength, and fracture energy implicitly account for the combined contributions of the adhesive layer and the interfaces. Consequently, the calibrated fracture energy Gf represents the total energy dissipated per unit area during debonding, which encompasses (i) mechanical interlock and friction at the FRP bar–adhesive interface; (ii) mechanical interlock and friction at the adhesive–concrete interface; and (iii) shear deformation within the adhesive. Owing to the presence of bar ribs and the roughened adhesive–concrete interface, the overall fracture energy is dominated by mechanical interlock and friction, rather than by the shear deformation of the adhesive alone. This explains why the measured bond parameters in our study are consistent with values reported in the literature for ETS FRP bar-to-concrete joints [46,47,48], and why the simplified CML-based approach remains physically reasonable and efficient in modeling the load–slip response of the ETS joints.
Enforcing the force equilibrium (Figure 2b) based on the above assumptions yields the governing equation [33,34,35,36,37,38]:
The interfacial slip, s, is defined as the relative displacement between the ETS FRP bar and the surrounding concrete:
where uf and uc are the axial displacements of the FRP bar and concrete, respectively. According to assumption (i), both the bar and the concrete exhibit elastic behavior. By differentiating Equation (3) twice with respect to z and combining it with Equations (1) and (2), the governing differential equation is obtained as follows:
where , and Ef and Ec are the elastic moduli of the FRP bar and concrete, respectively. Substituting Equation (4) into Equation (1) gives the tensile stress in the bar as follows:
Therefore, once the relationship between tb and s is determined, the solution to Equation (4) can be formulated by considering the boundary conditions at both ends:
where s0 and D denote the slip at the free end and loaded end, respectively.
3.2. Cohesive Material Law and Governing Equations
A trilinear cohesive material law (CML) is employed to determine the relationship between tb and s so as to solve the bond differential equation presented in Equation (4). The CML has been extensively employed in the literature to describe interfacial debonding in adhesively bonded systems. Notably, the research group of Prof. D’Antino has applied CML-based approaches to FRCM-to-concrete joints [42,49,50], FRP-to-concrete joints [51,52], and FRP-to-steel joints [53]. The CML is fully described by the relationship between interfacial shear stress and slip, which may take multi-linear [42,43] or nonlinear [50] forms. Among these, the trilinear law, which accounts for post-debonding friction and mechanical interlock, has been widely adopted to represent the bond–slip response of FRP bars in concrete. As highlighted by D’Antino et al. [42], the inclusion of a frictional plateau can capture the increased load capacity after debonding initiation, consistent with the experimental behavior observed in the ETS FRP-bar-to-concrete joints.
As depicted in Figure 1, the CML is characterized by an initial zero shear stress (τb0 = 0 at s = 0), followed by an elastic branch with slope k1 up to the maximum shear stress, τbₘₐₓ. After reaching τbₘₐₓ at s = s1, the model exhibits a linear softening branch with slope k2 until the slip s reaches s2, at which point a horizontal friction branch with a constant shear stress, τbf is initiated. The trilinear CML can be mathematically expressed as [42]:
where , and and are maximum and frictional shear stresses, respectively. Substituting Equations (8)–(10) into Equation (4) gives the governing equations for different loading phases, and it follows that
where l1, l2, and l3 are coefficients related to the CML parameters and the material properties of bar and concrete, which can be obtained as follows:
The shape of this CML is calibrated based on previous pullout test results for ETS FRP bar-to-concrete joints [14] and similar adhesively bonded systems, including those with steel reinforcements and adhesive or grouting binders [54,55]. The failure process can be divided by various stages as shown in Figure 3, according to the variation in bond stress distributions for long and short bonded lengths, i.e., E, E-S, E-S-F, S-F, and F phases for long lengths larger than Lcri; and E, E-S, pure S, S-F, and F for short ones smaller than Lcri. The stage-by-stage analysis adopted here follows a methodology similar to that proposed by D’Antino et al. [42] for debonding of externally bonded composites, though it is specifically tailored to model the failure progression along ETS FRP-bar-to-concrete interfaces.
Figure 3.
tb distributions of ETS FRP bar-to-concrete interface using trilinear CML in the case of (a) long and (b) short bonded lengths, where the definition of long and short cases is based on the Leff value. The symbols tL and t0 are the bond stress at the loaded and free end, respectively. Elastic, softening, and friction are simplified as E, S, and F, respectively.
4. Analytical Modeling
4.1. Debonding Propagation Process for Long Bonded Lengths When
4.1.1. Stage I
During Stage I (E phase), the bonded interface exhibits linear behavior such that the solutions of s, tb, and sf can be obtained by substituting Equations (6) and (7) into the governing equation (Equation (11a)), which provides the following:
Substitution of the axial stress condition in Equation (6) into Equation (13) leads to the following P-D relationship:
The termination of Stage I is marked by the shear stress at the loaded end (z = L) attaining τbmax. The maximum force PI is subsequently obtained by imposing τb(L) = τbmax on the known distributions of τb(z) over the bonded length L [Equation (14)], yielding the following:
4.1.2. Stage II
In Stage II (E-S stage, for both long and short bonded lengths), a portion of the interface experiences the softening behavior governed by Equation (11b). During this stage, the softening zone of length ls propagates toward the zero-stress free end, while the adjacent elastic zone of length le diminishes. The solution for the elastic portion is identical to that for Stage I [Equations (13)–(15)], with the total bonded length L and applied load P substituted for le and PI, respectively. As for the softening part (), a local coordinate z1 is considered ranging from 0 to ls. The solution to Equation (11b) can be derived with the continuity of the axial stress in the FRP bar, which gives the following:
Substituting the condition Equation (6) at z = L into Equations (18a), (18b) and (19) leads to Equations (20) and (21a), which define the P-D response. The maximum load Pmax is obtained by setting . This provides the softening length and elastic length at Pmax. The value of Pmax is presented in Equation (21b).
The end of Stage II, controlled by the softening length, occurs at the first of two transitions: s0 = s1, which leads to the pure softening (S) solution, or D = s2, which results in the Stage III (E-S-F) solution, as illustrated in Figure 3. To establish the governing scenario, a key condition must be met: for the S solution to be valid (i.e., s0 = s1), the loaded-end slip, D, from Equation (20) must be less than s2. Consequently, the boundary between these two solution paths is defined by the simultaneous fulfillment of the conditions s0 = s1 and D = s2. This criterion is used to define the following critical length:
This critical length also defined as the effective bonded length Leff by Ref. [43] and the limited length by Ref. [32], which governs the subsequent debonding propagation process. Specifically, for short bonded lengths with , Stage II is followed by the pure S phase, whereas for long bonded lengths with , it is followed by Stage III (E-S-F phase). In the absence of friction, Equation (22) simplifies to . It is evident that the critical length remains controlled by the CML parameters and is independent of the bonded length.
4.1.3. Stage IIIL
In this stage (E-S-F phase), all three portions are present within the interface, as depicted in Figure 3. The analysis therefore begins by examining the slip and stress distributions for each portion, which are governed by Equations (13)–(15) and (17)–(19). Following a procedure analogous to that for the Stage II solution, these equations remain valid by replacing L with , where lf is the length of frictional zone. We now derive expressions for the frictional portion with respect to the transition coordinate z2. Consider the governing equation (Equation (11c)) and the continuity of the slip and axial stress at z2 = 0, the solution for the frictional zone can be given as follows:
The relation between le and ls is given by applying the condition s(z1 = ls) = s2 into the Stage II slip solution Equation (17), which provides the following:
From Equations (23) to (26) it follows that once the frictional length lf is known, the load–slip response can be easily formulated as follows:
Owing to the presence of the frictional component, the load will increase as the slip grows and reaches its peak when the first derivation of P in terms of lf equals zero, or when
In Equation (29), the term “” can be expressed as a function of ls according to Equation (26), i.e.,
Combination of Equations (29) and (30) leads to the following formula related to the softening length only. Accordingly, if the maximum pullout load Pmax is achieved within Stage IIIL, the lengths of the elastic and softening zones at Pmax are fixed values, regardless of the bonded length. The limit of this solution is attained when s0 = s1, a condition that corresponds to le = 0. The corresponding softening length can then be determined by substituting le = 0 into Equation (26) to give
Equation (31) has the same form with the critical length given in Equation (22), validating that Stage III can only appear for long joints with . Importantly, the onset of snapback may occur prior to reaching this limit, and this will be discussed in the next subsection.
4.1.4. Stage IV
During Stage IV (S-F phase), the interface behavior is governed by the softening and debonding branches. The response of the interface portion within the softening stress-transfer zone (0 ≤ z ≤ ls) is determined by applying the boundary conditions from Equation (7) and , which yields the solutions given in Equations (32)–(34):
For the remaining frictional portion of the interface, the distributions of s(z), σf(z), and τb(z) are obtained by applying the boundary conditions Equation (7) and continuity conditions of slip and axial stress, which yields Equations (35)–(37):
The load–slip response can be readily obtained using Equations (35) and (37) as follows:
The occurrence of the snapback behavior during Stage IV, where both the load capacity and slip decrease caused by the sudden release of stored strain energy in the frictional zone. To determine whether the snapback occurs, let the slip values at the initiation and end of the Stage IV remain constant. In the former case, the slip Ds at the start of this stage is therefore found by substituting le = 0 and ls = Ls,cri into Equation (23), which provides the following:
Conversely, the stage ends when the softening zone diminishes, i.e., ls = Ls,cri and lf = L, at which point the slip De is calculated by substituting these conditions into Equation (38) to give
From this, the critical length for snapback (hereafter denoted as snapback length lsb) can be obtained with the following equation by setting Ds = De using Equations (40) and (41):
The significance of the snapback length lies in its definition as the shortest bond length susceptible to snapback. This phenomenon can precipitate catastrophic bond failure, a risk that is exacerbated as the overall bonded length increases. If L > lsb, snapback occurs; otherwise, no snapback can be observed.
4.1.5. Stage V
The final stage, Stage V (pure frictional phase), is characterized by a fully debonded interface. The solution for this stage is derived by imposing a constant frictional shear stress , which distributes uniformly along the bonded length as slip increases. This yields the following load expression:
In the special case where the frictional stress is zero, the residual strength vanishes, and the slips at the free and loaded ends become identical.
4.2. Debonding Propagation Process for Short Bonded Lengths When
For a short bonded length, the debonding propagation process in ETS FRP bar-to-concrete joints with a trilinear CML can also be divided into five stages by replacing the conventional Stage IIIL (E-S-F phase) with Stage IIIS (pure softening phase). The evolution of this debonding process is governed by the relationship between the bonded length and the critical length. When , Stage II is followed by a pure softening phase, during which the distributions of s(z), σf(z), and τb(z) are governed by Equation (11b). The solutions are as follows:
The load-versus-slip relationship at the loaded end is given by Equation (44) using the condition Equation (7), which provides the following:
which demonstrates that the applied load experiences a decreasing trend with the increase in slip. Stage IIIS ends when increases to s2, followed by Stage IV as previously derived in Section 4.1.4.
4.3. Calculation Procedure of Load–Slip Response and Maximum Load
Provided that the distributions of slip, shear stress, and axial stress have been derived in Section 3.2, the two key indicators including the global load–slip (P-D) response and maximum load (Pmax) can be obtained in a closed-form. Table 1 summarizes the analytical solutions of the P-D response and Pmax throughout the debonding propagation process. Therefore, given the dimensions and properties of FRP bar and concrete, as well as the CML parameters, the bond behavior of ETS FRP bar-to-concrete joints can be predicted without any integrations and time-consuming calculations.
Table 1.
Summary of analytical expressions of load–slip response and maximum load.
Figure 4 illustrates the typical load–slip (P-Δ) responses for both long and short ETS FRP bar-to-concrete joints. The symbols O, A, B, C, and D denote the onset of Stages I, II, IIIL (for long joints) or IIIS (for short joints), IV, and V, respectively. As expected, long joints exhibit substantially greater load capacities than short joints, which is attributed to their longer stress transfer length (STL) along the bonded area. The primary distinctions between the responses of long and short joints are the stage at which the peak load (Pmax) occurs and the presence of a snapback, which can be explained by the following factors:
Figure 4.
Load–slip response of ETS joints with long (blue line) and short (red line) bonded lengths. Five distinct debonding stages are identified for both cases, with the primary difference in their response occurring in segment BC.
- (i)
- Peak Load Location. For long joints, the consideration of the frictional component allows the load to continue increasing even as debonding initiates and propagates during Stage IIIL (segment BC). However, as the debonding zone expands and the elastic zone diminishes, the load reaches its maximum. This peak load is determined by solving the system of Equations (28)–(30). Conversely, the bonded area in short joints is insufficient to fully develop the frictional stress-transfer mechanism; consequently, the peak load occurs during the elastic Stage II.
- (ii)
- Snapback Behavior. Snapback occurs exclusively in long joints where L > lsb. This indicates that the value of lsb must be greater than the crucial length Lcri. After Pmax is attained, when the elastic energy stored in the unbonded strip portion (encompassing both the non-bonded and debonded sections) is released. This release causes a shortening of the unbonded portion that exceeds the elongation of the bonded portion, leading to a snapback in the load response. Consequently, because the global slip decreases during this event, tests controlled by a monotonically increasing global slip cannot capture this phenomenon. However, the snapback has been successfully captured in FRP–concrete joints by controlling the displacement at the free end of the strip, which increases monotonically throughout the test [56]. In contrast, for bonded lengths shorter than lsb, the interface crack propagates stably, resulting in a softening branch in the load response without snapback.
5. Experimental Verification
To validate the proposed analytical method, its predictions are compared against two sets of experimental data. The first set is from the authors’ own experiments on FRP bar-to-concrete short bonded joints, while the second is from the pullout tests on long steel bar-to-concrete bonded joints conducted by Ren et al. [57]. The CML parameters required for the model are not typically available in the experimental procedures but can be determined using inverse analyses, which will be detailed in Section 4.2.
5.1. Experimental Program
5.1.1. Material Properties
The debonding behavior of ETS-GFRP bar-to-concrete joints was investigated through a series of pullout tests. Three concrete mixtures were designed to achieve strength grades of C30, C40, and C50. The mixtures, detailed in Table 2, consisted of P.O. 42.5 ordinary Portland cement (from Handan City, China), river sand, and crushed limestone with a maximum aggregate size of 10 mm. The river sand used had a fineness modulus of 2.6, a bulk density of 1260 kg/m3, and a silt content of 1.0%. Figure 5 shows the aggregate gradation distribution curve. A Class F fly ash from Gongyi Borun Refractory Materials Co., Ltd., Zhengzhou City, China. and a polycarboxylate-based superplasticizer with a 20% water-reducing rate (from Jiangmen City) were also incorporated. As per the Chinese code GB/T 50081-2019 [58], the compressive and tensile strengths of the concrete were determined using 150 mm cubes, while the elastic modulus was measured using 300 mm × 100 mm × 100 mm prisms. The results of these properties are summarized in Table 3.
Table 2.
Mixtures of concrete (unit: kg/m3).
Figure 5.
Particle size gradation curve.
Table 3.
Properties of concrete (average value ± standard derivation).
Ribbed GFRP bars were selected for this study as they represent a commonly used and effective surface treatment for FRP bars in structural applications. The GFRP bars used in this study, with a nominal diameter of 12 mm, were supplied by Shenzhen Haichuan New Material Company, China. The rib geometry featured a rib height of 0.65 mm, a rib angle of 60o, and a rib spacing of 9.0 mm. Their tensile strength and elastic modulus were determined as 946 MPa (standard deviation of 32.4 MPa) and 45 GPa (standard deviation of 1.8 GPa) through uniaxial tensile tests following the ACI 440.3R-15 guidelines [59]. An epoxy adhesive from Tianjin Yalaishi New Material Company, China, was used to bond the bars to the concrete. Its tensile strength was measured as 18.88 MPa (standard deviation of 1.6 MPa) in accordance with the Chinese code GB 50367-2013 [60]. The raw materials, GFRP bar, adhesive, and concrete samples used for the laboratory testing are shown in Figure 6. Figure 7 illustrates the test graphs for material properties of the bar, adhesive, and concrete.
Figure 6.
Materials and samples used in the test. (a) river sand; (b) coarse aggregate; (c) cement; (d) water reducer; (e) fly ash; (f) concrete samples; (g) GFRP bar; and (h) injection-type anchor adhesive.
Figure 7.
Material tests of (a) concrete; (b) GFRP bar; and (c) adhesive.
5.1.2. Specimen Preparation and Testing Procedure
A total of nine pullout specimens were prepared and tested with the same bar diameter of 12 mm and hole diameter of 18 mm considering three concrete strengths C30, C40, and C50. As detailed in Figure 8, each specimen consisted of a GFRP bar centrally embedded in a concrete cube and the bonded length-to-bar diameter ratio was set to 5.0, in accordance with common design codes such as ACI 440.3R-15 [59]. Unbonded segments were created using PVC breaker tubes, and the loaded end of the bar was protected by a 180 mm long steel tube filled with epoxy resin to prevent anchorage failure, consistent with the tensile test procedure. To avoid local damage to the concrete, the prefabricated hole-based method presented by Godat et al. [46] was employed.
Figure 8.
Schematic of ETS GFRP bar adhesively bonded into concrete under pullout testing.
The specimen preparation procedure was as follows: (i) Prior to concrete casting, PVC pipes wrapped with a 3 mm thick plastic wire were placed in the molds. The wire served to roughen the internal surface of the simulated hole, a technique also used by Chen et al. [61] to enhance mechanical interlock, and therefore, the adhesive-to-concrete interface bond failure can be avoided. (ii) Concrete was cast into the molds and cured under standard laboratory conditions (20 ± 2 °C, 95% relative humidity) for 28 days. (iii) After curing, the simulated holes were cleaned and dried. Teflon was inserted into the unbonded zones to prevent adhesive penetration. The PVC tube near the loaded end was then removed to create an injection port. The bar was inserted and twisted to eliminate air pockets while the adhesive was injected via a narrow nozzle until the space was completely filled. The injection was stopped once the adhesive reached the unbonded section, which was then sealed with PVC tube. (iv) Specimens were left undisturbed until the adhesive had fully hardened before testing.
The pullout tests were conducted on a WAW-1000 electrohydraulic servo universal testing machine from Jilin Guanten Automation Technology Co., Ltd., equipped with a 1000 kN load cell. The tests were performed at a displacement rate of 1 mm/min in accordance with ASTM D7913 [62]. Slips at both the loaded and free ends were measured using two pairs of linear variable differential transformers (LVDTs), as shown in Figure 9.
Figure 9.
(a) Test sample and (b) testing device and LVDT arrangement.
5.2. Test Results
All tested specimens failed by cohesive failure within the adhesive layer, where the bars were pulled out after the adhesive between the ribs was sheared off. This failure mode, which left minimal adhesive residue on the bar surface (Figure 10a), makes sense both theoretically and practically. The high bond strength of the ribbed GFRP bar and the intentionally roughened adhesive–concrete interface ensured that the adhesive itself was the weakest component. The bond stress–slip curves, calculated from the measured load–slip response using the assumption of a uniform bond stress distribution, is presented as follows:
Figure 10.
(a) Typical failure mode due to partially sheared failure of adhesive; and (b) measured bond stress–slip curves.
The displacement recorded by the transducers (see Figure 9b) inherently includes not only the interfacial slip but also the axial elongation of the unbonded free length of the GFRP bar between the loading point and the restraining plate. Due to the relatively low elastic modulus of the ribbed GFRP bars, this elastic elongation is indeed non-negligible. Herein, the true interfacial slip is derived by subtracting the elastic bar elongation from the total measured displacement. Specifically, the interfacial slip s can be calculated as follows:
where
where is the raw displacement recorded by the transducer, is the elastic elongation of the free length of the GFRP bar under pullout load P, Lf is the unbonded length between the loading point and the restraining plate, Abar is the cross-sectional area of the bar, and Ebar is the elastic modulus of the bar.
From Figure 10b it follows that there is no significant discreteness among three identical samples for each test group. The curves exhibit excellent repeatability among the three identical samples in each test group. A typical response is characterized by three distinct phases: an approximately linear ascending branch to the peak bond stress, a nonlinear softening branch descending to a residual frictional stress, and oscillations about this frictional stress caused by the interaction of the bar’s helical ribs with the cured adhesive. Increasing the concrete strength resulted in a significant increase in both the bond strength and bond stiffness. Specifically, as the concrete strength increased from C30 to C50, the peak bond stress rose from 19.44 to 33.69 MPa, and the frictional stress increased from 10.09 to 18.68 MPa.
The observed increase in bond strength from C30 to C50 concrete is primarily due to the enhanced radial confinement provided by the higher-strength concrete matrix. For ribbed GFRP bars, this improved confinement strengthens the frictional resistance and, more critically, enhances the mechanical interlock between the bar ribs and the adhesive, resulting in greater shear resistance prior to debonding initiation and consequently higher bond strength. In this experimental program, a bonded length of 5D (where D is bar diameter) was consistently used for all specimens. Within this configuration, the bond stress can be reasonably approximated as uniformly distributed along the bonded interface, as supported by established design guidelines such as ACI 440.3R-15 [47]. Therefore, the present study focused on comparing load–slip responses and bond strength values (see Figure 10 and Figure 11), rather than analyzing interfacial shear stress distributions. Notably, the ratio of frictional to peak bond stress (τbf/τbmax) remained relatively constant, ranging from 0.52 to 0.55, indicating that this ratio is insensitive to concrete strength. This conclusion is consistent with findings from pullout tests on steel bars embedded in concrete, where the τbf/τbmax ratio also remains unchanged with different concrete strengths.
Figure 11.
Comparison of load–slip responses obtained from self-conducted experimental and analytical solution for specimens (a) C30-D12, (b) C40-D12, and (c) C50-D12 with short bonded lengths.
5.3. Inverse Determination of Trilinear CML Parameters
This section delineates an inverse determination procedure for the four independent parameters of the trilinear CML (τbmax, s1, τbf, and s2). The procedure is predicated on a nonlinear optimization that fits the analytical load–slip response to experimental data. Unlike previous approaches that require numerous specimens equipped with strain gauges along the bonded length, this method utilizes the analytical solution of the load response, eliminating the need for such extensive instrumentation and therefore much easier and less time-consuming.
The theoretical framework, as detailed in Section 3, elucidates a fundamental distinction in the P-Δ response predicated on the bonded length. For long joints, the model predicts a continued load increase after debonding initiation due to the frictional contribution, which is proportional to the τb-s curve. In contrast, for short joints, the frictional stress τbf is estimated directly from the load response during the debonding stage. For both long and short joints, the inverse analysis is initiated by identifying four key features from the experimental P-Δ response: (1) the initial elastic stiffness equaling to k1; (2) the load and slip at the end of the elastic phase, i.e., PI and s1; (3) the maximum load, Pmax; and (4) the load and slip at the end of snapback Pf and s2. These features provide robust initial estimates for the four CML parameters, enabling the numerical procedure to accurately reproduce the entire debonding process. The load–slip response can be symbolically written as [36]:
The unknown CML parameters are determined by minimizing the discrepancy between the experimentally measured load–slip response and the analytical prediction from the interface law. This can be achieved through a nonlinear least-squares optimization, where the parameter vector q is defined as follows:
The objective function to be minimized is formulated as follows:
where is the load predicted by the analytical solution, and is the measured pullout force at the i-th loaded-end slip, Δᵢ. This minimization equation was solved using MATLAB R2024a to obtain the optimal set of parameters. The calibrated CML parameters for the specimens tested in this study, as well as for those from Rong et al. [63], are shown in Table 4. The proposed CML and its estimation procedure are capable of capturing the horizontal frictional plateau of the τb-versus-s relationship. In cases where no frictional plateau exists, the procedure simplifies to an elastic-to-softening bilinear CML (i.e., τbf = 0), and then the analytical solution can be employed to predict the debonding response of other bonded joints with a bilinear relationship between FRP and substrates (e.g., FRP-to-steel joints).
Table 4.
CML parameters based on inverse analysis.
It should be noted that extremely large fracture-energy values appear when the cohesive parameters reported in Table 4 are inserted into the adopted trilinear cohesive law. These values are two orders of magnitude higher than typical fracture energies reported for FRP–concrete bonded interfaces in the literature. The reason for this can be explained as follows. The fracture-mechanics formulation and the typical fracture energy values in the literature [64] generally pertain to two-phase systems, i.e., FRP reinforcement embedded directly in concrete without an adhesive layer, where the bond strength is governed mainly by concrete strength and bar surface treatment. In contrast, the present study investigates a three-phase system: an adhesively bonded, ribbed GFRP bar embedded in a pre-roughened concrete hole. Specifically, the internal surface of the concrete hole was intentionally roughened during casting by using a PVC pipe wrapped with plastic wire. This created a profiled surface that greatly enhances mechanical interlock with the adhesive, substantially increasing the bond capacity compared to smooth or flat interfaces. Moreover, the structural epoxy adhesive employed exhibits high tensile strength (18.88 MPa) and good ductility. Coupled with the mechanical interlock provided by the ribbed bar geometry, the failure mode involves progressive shearing of the adhesive keys and bar ribs, resulting in a much larger area (i.e., higher fracture energy) under the bond–slip curve prior to complete debonding.
This interpretation aligns with the existing literature. For example, Valerio et al. [48] performed pull-out tests using different reinforcement types (ribbed steel bars, sand-coated CFRP, quartz-sand-coated AFRP, and sand-coated GFRP bars) and epoxy types (non-sag, low-viscosity, and medium-strength pastes). The test results demonstrated a wide range of the bond strength from 16 to 36 MPa. Similarly, Godat et al. [46] reported that smooth CFRP bars can achieve bond strengths as high as 29.9 MPa when using Sikadur AnchorFix-4 as the bonding adhesive. These findings indicate that in the ETS FRP bar–adhesive–concrete system, the adhesive properties and bar surface geometry dominate the bond performance, often yielding bond strengths far exceeding those of conventional two-phase FRP bar–concrete interfaces.
Regarding the concern that the predicted bond capacity might exceed the tensile strength of the GFRP bar, the maximum experimental load recorded was approximately 80 kN. For the 12 mm diameter GFRP bar (nominal area ≈ 113 mm2), this corresponds to a tensile stress of about 707 MPa, which remains well below the measured tensile strength of the bar (946 MPa). Thus, the observed failure is indeed interface debonding, rather than tensile rupture of the bar. Conclusively, the high fracture energy values represent a direct consequence of the enhanced interfacial bond performance achieved through adhesive bonding, surface roughening, and ribbed bar geometry. Consequently, the calibrated model captures the bond behavior of the ETS system, which differs fundamentally from the two-phase interfaces described in conventional models.
5.4. Comparison Between Analytical and Experimental Results
The validation of the proposed analytical approach is undertaken in this section through a comparative analysis against experimental data drawn from two distinct sources: (i) pullout tests on short bonded joints conducted in the present study, and (ii) pullout tests on long bonded joints reported in the literature. To this end, the CML parameters presented in Table 4 were utilized to solve Equations (31) and (42) for the critical length Lcri governing the debonding process and the snapback length Lsn, respectively. Subsequently, the CML parameters and the calculated lengths facilitated the derivation of the analytical load–slip curves for direct comparison with the experimental measurements.
For the ETS GFRP-to-concrete joints with a short bonded length (L = 60 mm) tested, the calculated critical bonded length (Lcri) and snapback length (Lsn) were consistently greater than the bonded length. For instance, the values of Lcri and Lsn were calculated as 70.9 mm and 72.8 mm for Specimen C30-D12, 211.9 mm and 255.1 mm for Specimen C40-D12, and 177.3 mm and 210.7 for Specimen C50-D12, respectively. Consequently, these joints are classified as short bonded lengths, and their load–slip response is characterized by a nonlinear ascending branch, followed by a post-peak softening branch and a frictional plateau. As shown in Figure 11, the analytical solution accurately reproduces the experimental curves, with excellent agreement observed in both the ascending and softening branches. The primary discrepancy lies in the residual frictional branch. While the model predicts a constant residual load due to the assumed constant frictional stresses, the experimental curves experience periodic fluctuations within a narrow range as slip increases. This phenomenon is attributed to the mechanical interlocking between the ribbed GFRP bars and the surrounding concrete.
To further validate the effectiveness of the analytical model for long bonded joints, its predictions were compared with experimental data from Ren et al. [57]. Their study involved an in situ pullout test on a novel epoxy-grouted steel strand rockbolt with a diameter (Df) of 15.26 mm, an embedded length (L) of 5000 mm, and a Young’s modulus (Ef) of 200 GPa. Using these properties, the critical length (Lcri) and snapback length (Lsn) were determined from Equations (31) and (42) to be 1624.9 mm and 1837.2 mm, respectively. Since the tested bond length was substantially greater than both Lcri and Lsn, the analytically predicted load–slip response experienced significant snapback behavior that cannot be fully captured by the displacement-controlled experimental test. As shown in Figure 12, the analytical solution closely reproduces the nonlinear pullout behavior of the long bonded joint. Specifically, the predicted maximum load shows excellent agreement with the test value, with a relative error of only 1.09%. The corresponding slip prediction is also in good agreement, with a relative error of 8.83%. This slightly higher discrepancy in slip values may be attributed to the ignorance of the Poisson’s effect of the GFRP bar and potential minor variations in interface properties, which have not explicitly modeled in the present analytical framework. The frictional fluctuations in the residual stage of the bond–slip curve are governed by a stick–slip mechanism arising from the interaction between the GFRP bar ribs and the surrounding adhesive. As the bar slips after debonding, resistance is generated through sequential rib engagement: each rib intermittently catches against the adhesive (stick) before shearing or sliding past it (slip), resulting in the observed oscillatory shear stress. These fluctuations directly affect residual strength predictions, indicating that the residual capacity is not a constant frictional value but varies periodically. For reliable design, the residual strength should be based on the stabilized lower bound of these fluctuations, representing the steady sliding friction once rib engagement diminishes. Ignoring this mechanism could overestimate load capacity in fire or service scenarios involving large slip displacements.
Figure 12.
Comparison of load–slip responses obtained from Ren et al. [57] and analytical solution for long bonded length case.
Table 5 presents a comparison of experimental and analytical results in terms of average maximum load Pmax and average slip smax at Pmax for the specimens investigated in the present study and those reported by Ren et al. [57]. The analytical model exhibits a high degree of accuracy in predicting the ultimate load, yielding an average relative error of 2.46%. The predictive accuracy for the corresponding global slip at Pmax, however, was comparatively lower. For short bonded joints (L = 60 mm), the difference between the analytical and experimental slip values ranged from 1.89% to 8.90%, while for the long bonded joint (L = 5000 mm), this difference was 8.83%.
Table 5.
Comparison of experimental and analytical results in terms of average maximum load and average slip at maximum load.
It is interesting to note that the snapback length Lsn remains greater than the critical length Lcri regardless of the CML parameters and material properties. This phenomenon can be explained both theoretically and practically. The well-known snapback is caused by the release of elastic energy from the unbonded portion. As the applied load decreases post-peak, this elastic recovery reduces the global slip. Such a process requires a fully developed debonding or frictional phase along the interface. Therefore, in short joints where debonding propagation cannot fully develop, the snapback phenomenon is absent. Although the critical lengths Lsn and Lcri are independent of the total bonded length, their values are influenced by several factors, including adhesive type and bar configuration. For example, toughened adhesives often exhibit a trapezoidal CML, where the magnitude of the frictional plateau is governed by the adhesive’s shear strength. Considering that adhesive properties and bar surface texture (e.g., sand-coated, helically wrapped, or indented) significantly affect the bond strength, the limited number of specimens in this study may not provide statistically robust evidence to generalize the findings. Therefore, further studies are required to systematically investigate the effects of adhesive properties and FRP bar surface treatments.
6. Discussion
6.1. Advancements and Boundaries of the Trilinear CML
The proposed analytical solution characterizes the bond behavior of ETS FRP bar-to-concrete joints using an elastic-softening-friction trilinear CML. The key advancement of this trilinear CML over the traditional elastic-softening bilinear models commonly adopted for FRP-to-concrete interfaces [18,44,65,66] lies in its explicit physical representation of the complete interfacial failure process, including the residual frictional phase. Conventional bilinear models assume that the bond stress drops to zero upon debonding initiation, thereby neglecting the residual mechanical interlock and sliding friction between the sheared bar ribs and the surrounding adhesive. In contrast, the trilinear model captures the residual frictional resistance by incorporating a constant frictional bond stress τbf. Figure 13 compares the load–response predictions from the bilinear and trilinear CML. The bilinear CML predicts a constant load once debonding initiates and thus cannot reproduce the further load increase observed experimentally after debonding. In contrast, the trilinear CML captures this behavior by incorporating a frictional stage that allows the load to continue rising. As shown in earlier sections, this frictional contribution is significant and has been demonstrated for both long and short bonded joints. Therefore, the trilinear CML-based analytical solution provides a more accurate estimation of load responses of ETS systems than the bilinear formulation.
Figure 13.
Typical bond stress–slip relationship and load–slip curve using trilinear and bilinear CZM. Pmax is the maximum load capacity, Pe-s,max is the maximum load at the end of E-S stage, and Pres is the residual load capacity. In the absence of interfacial friction, Pres = 0 and Pmax = Pe-s,max.
From a practical standpoint, this advancement enables not only a more realistic prediction of the load–slip response and maximum load capacity, but also the quantification of residual load-bearing capacity. This is particularly valuable for assessing the ductility, deflection, and crack-control performance of ETS-strengthened RC structures under service or extreme conditions. Despite this, it is noted that the analytical model experiences a clear boundary by focusing on interface-dominated failure, where debonding at the FRP-to-concrete interface is assumed, as confirmed in our experimental program. Within this scope, treating concrete as a linear elastic material is a valid simplification that facilitates a closed-form solution focused on interfacial debonding mechanics.
6.2. Limitations and Future Work
The present study has some limitations to be addressed in future research.
First, the concrete nonlinearity and damage have not been considered. In practical scenarios involving very short bonded lengths, unconfined test setups, or high-strength concrete substrates, failure may shift toward concrete cone breakout or a mixed debonding-cone failure. In such cases, neglecting concrete cracking, crushing, and plastic deformation can lead to inaccuracies in predicting the maximum load and the complete load-deformation response. To extend the model’s applicability and improve its predictive generality, future work should integrate the trilinear CML with a damage-plasticity constitutive model for concrete. One promising approach is to introduce a damage factor that modulates the interfacial fracture energy and/or frictional resistance as a function of the accumulated plastic strain or damage in the adjacent concrete. This will be the focus of our future studies.
Second, the analytical model does not incorporate the shear deformability of the adhesive. As a result, it does not account for the shear strain development within the adhesive layer and thus cannot capture related effects, such as the influence of adhesive strain on the load response of ETS joints or the time-dependent viscoelastic behavior of the adhesive. In future work, the proposed model should be extended to investigate the long-term time-dependent response of ETS joints, taking into consideration the creep behavior of the adhesive.
Third, it should be highlighted that the analytical advance presented here is not a new fundamental theory for bonded interfaces, but rather the novel extension and experimental validation of an established theoretical approach to address a new and practical problem in ETS FRP strengthening technology. Therefore, further theoretical analyses and experimental validations should be conducted to extend the robustness and applicability of the model in simulating the mechanical behavior of ETS FRP bar-to-concrete joints under various loading and environmental conditions (e.g., dynamic loading, high temperature, freeze–thaw cycling). This will be the focus of our future studies.
In addition, the model calibrated could be used to provide estimations of the effective bonded length needed to develop the bar full capacity or, analogously, of the relationship between the bonded length and the bar peak load. Investigations into these applications, along with further experimental validation, are currently underway.
7. Conclusions
This paper presents the formulation of a trilinear cohesive material law (CML) designed to characterize the full-range response of ETS-FRP bar-to-concrete joints with arbitrary bonded lengths. A detailed analytical solution was derived for each of these six stages by solving the governing differential equation. The proposed CML was calibrated and the analytical solution validated using experimental data from self-conducted experiments on short joints and in situ pullout tests on long joints. Based on these findings, the main conclusions are as follows:
- (1)
- The analytical framework facilitates the precise calculation of two key parameters: the critical bonded length (Lcri) and the snapback length (Lsn). For bonded lengths exceeding Lsn, the post-peak response of the ETS-GFRP-to-concrete interface is characterized by snapback. Conversely, for short bonded lengths lower than Lcri, the debonding cannot be fully developed and a linear softening branch is observed after the maximum load.
- (2)
- An increase in concrete c strength significantly enhanced both the bond strength and stiffness. Specifically, elevating the concrete grade from C30 to C50 resulted in an increase in the average bond stress from 19.44 to 33.69 MPa and the frictional stress from 10.09 to 18.68 MPa. This improvement is attributed to the enhanced concrete confinement effect.
- (3)
- The predictions can reproduce the experimental load–slip curve, as well as the peak load and the slip at the peak load, with relative errors less than 10%. Therefore, the analytical expressions provide a robust tool for simulating the mechanical behavior of RC members strengthened with the ETS technique by effectively capturing the contribution of ETS-FRP bars.
- (4)
- The snapback length lsn was found to be greater than the critical length Lcri, which serves as the threshold between ‘long’ and ‘short’ joints. From a design perspective, this necessitates that the bonded length be limited to less than lsn to avoid the undesirable brittle fracture and snapback instability.
This study clarifies the distinct load responses of joints with “short” and “long” bond lengths. ETS Joints with a short bond length exhibit a softening post-peak response, while those with a long bond length show a pronounced snapback behavior. The proposed analytical solution facilitates the derivation of the critical bond length that separates these two regimes, as well as the threshold for snapback instability. These results provide a theoretical basis for a deeper understanding of the debonding mechanism and can potentially be utilized in the design of ETS FRP-strengthening systems.
Author Contributions
Conceptualization, W.L. and Y.W.; methodology, Y.W. and J.L.; software, B.Z. (Bi Zhang); validation, B.Z. (Bi Zhang) and B.Z. (Baowen Zhang); formal analysis, B.Z. (Baowen Zhang); investigation, Y.W.; resources, Y.W.; data curation, B.Z. (Bi Zhang); writing—original draft preparation, W.L.; writing—review and editing, Y.W. and J.F.; visualization, J.F.; supervision, Y.W.; project administration, Y.W.; funding acquisition, Y.W. All authors have read and agreed to the published version of the manuscript.
Funding
This work was supported by the Science and Technology Research Project of Jiangxi Provincial Department of Education (No. GJJ2404907), and the Science and Technology Research Project of Jiangxi Provincial Department of Education (No. GJJ2404914), and the National Natural Science Foundation of China (Grant No. 52308165). Yan-Jie Wang is thankful for the financial support from the China Scholarship Council (No. 202208130081) towards his visit to the University of Western Australia.
Data Availability Statement
The original contributions presented in this study are included in the article. Further inquiries can be directed to the corresponding author.
Conflicts of Interest
On behalf of all authors, the corresponding author states that there are no conflicts of interest.
References
- Chaallal, O.; Mofidi, A.; Benmokrane, B.; Neale, K. Embedded through-section FRP rod method for shear strengthening of RC beams: Performance and comparison with existing techniques. J. Compos. Constr. 2011, 15, 374–383. [Google Scholar] [CrossRef] [Scilit]
- Mofidi, A.; Chaallal, O.; Benmokrane, B.; Neale, K. Experimental tests and design model for RC beams strengthened in shear using the embedded through-section FRP method. J. Compos. Constr. 2012, 16, 540–550. [Google Scholar] [CrossRef] [Scilit]
- Breveglieri, M.; Aprile, A.; Barros, J.A. Shear strengthening of reinforced concrete beams strengthened using embedded through section steel bars. Eng. Struct. 2014, 81, 76–87. [Google Scholar] [CrossRef] [Scilit]
- Barros, J.A.O.; Dalfré, G.M. Assessment of the effectiveness of the embedded through-section technique for the shear strengthening of reinforced concrete beams. Strain 2013, 49, 75–93. [Google Scholar] [CrossRef] [Scilit]
- Breveglieri, M.; Aprile, A.; Barros, J. Embedded through-section shear strengthening technique using steel and CFRP bars in RC beams of different percentage of existing stirrups. Compos. Struct. 2015, 126, 101–113. [Google Scholar] [CrossRef] [Scilit]
- Bui, L.V.H.; Stitmannaithum, B.; Ueda, T. Mechanical performances of concrete beams with hybrid usage of steel and FRP tension reinforcement. Comput. Concr. Int. J. 2017, 20, 391–407. [Google Scholar]
- Godat, A.; Chaallal, O.; Neale, K.W. Nonlinear finite element models for the embedded through-section FRP shear-strengthening method. Comput. Struct. 2013, 119, 12–22. [Google Scholar] [CrossRef] [Scilit]
- Bui, L.V.H. Mechanical Performances of Concrete Beams with Hybrid Usage of Steel and FRP Reinforcement. Doctoral Dissertation, Chulalongkorn University, Bangkok, Thailand, 2018. [Google Scholar]
- Nakaba, K.; Kanakubo, T.; Furuta, T.; Yoshizawa, H. Bond behavior between fiber-reinforced polymer laminates and concrete. Struct. J. 2001, 98, 359–367. [Google Scholar]
- Ueda, T.; Dai, J.G. New shear bond model for FRP-concrete interface-from modeling to application. In Proceedings of the 2nd International Conference on FRP Composites in Civil Engineering—CICE, Adelaide, SA, Australia, 8–10 December 2004; pp. 69–81. [Google Scholar]
- Dai, J.; Ueda, T.; Sato, Y. Development of the nonlinear bond stress–slip model of fiber reinforced plastics sheet–concrete interfaces with a simple method. J. Compos. Constr. 2005, 9, 52–62. [Google Scholar] [CrossRef] [Scilit]
- Lin, X.; Zhang, Y. Evaluation of bond stress-slip models for FRP reinforcing bars in concrete. Compos. Struct. 2014, 107, 131–141. [Google Scholar] [CrossRef] [Scilit]
- Breveglieri, M.; Aprile, A.; Barros, J. RC beams strengthened in shear using the Embedded Through-Section technique: Experimental results and analytical formulation. Compos. Part B Eng. 2016, 89, 266–281. [Google Scholar] [CrossRef] [Scilit]
- Caro, M.; Jemaa, Y.; Dirar, S.; Quinn, A. Bond performance of deep embedment FRP bars epoxy-bonded into concrete. Eng. Struct. 2017, 147, 448–457. [Google Scholar] [CrossRef] [Scilit]
- Azevedo, A.S.; Firmo, J.P.; Correia, J.R. Bond behaviour at high temperatures between concrete and CFRP or steel strengthening bars applied according to the embedded through-section (ETS) technique. Cem. Concr. Compos. 2024, 151, 105580. [Google Scholar] [CrossRef] [Scilit]
- Azevedo, A.S.; Firmo, J.P.; Correia, J.R.; Almeida, J. Embedded through-section (ETS) technique for shear strengthening of reinforced concrete beams-Experimental and analytical study. Eng. Struct. 2025, 333, 120038. [Google Scholar] [CrossRef] [Scilit]
- Azevedo, A.; Firmo, J.; Correia, J. Fire behaviour of reinforced concrete beams strengthened in shear according to the embedded through-section (ETS) technique: Experimental and numerical study. Compos. Struct. 2025, 357, 118888. [Google Scholar] [CrossRef] [Scilit]
- Mofidi, A.; Mirzabagheri, S.; Doyle, A.K.K.; Chaallal, O. A novel analytical bond model for ETS FRP bars in shear rehabilitation of concrete members. Int. J. Concr. Struct. Mater. 2024, 18, 81. [Google Scholar] [CrossRef] [Scilit]
- Liu, H.; Ma, D.; Wang, Y.; Guo, Z.; Jia, M.; Wu, Z.; Gao, Y. Experimental and analytical study of bond-slip behavior of ETS GFRP bar-to-concrete joints subjected to elevated temperatures. Eng. Struct. 2025, 343, 121085. [Google Scholar] [CrossRef] [Scilit]
- Bui, L.V.H.; Jongvivatsakul, P.; Stitmannaithum, B.; Likitlersuang, S. Numerical modelling of bond mechanism of ETS FRP bar-concrete joints with long embedment length. Int. J. Adhes. Adhes. 2022, 117, 103179. [Google Scholar] [CrossRef] [Scilit]
- Spada, A.; Giambanco, G.; Rizzo, P. Elastoplastic damaging model for adhesive anchor systems. I: Theoretical formulation and numerical implementation. J. Eng. Mech. 2011, 137, 854–861. [Google Scholar] [CrossRef] [Scilit]
- Spada, A.; Rizzo, P.; Giambanco, G. Elastoplastic damaging model for adhesive anchor systems. II: Numerical and experimental validation. J. Eng. Mech. 2011, 137, 862–876. [Google Scholar] [CrossRef] [Scilit]
- Yang, S.; Yu, M.; Dong, K.; Yang, Y. Local bond strength prediction of deformed reinforcing bars in concrete considering heterogeneity at interface regions. Mag. Concr. Res. 2022, 74, 251–270. [Google Scholar] [CrossRef] [Scilit]
- Yang, S.; Yang, C.; Huang, M.; Liu, Y.; Jiang, J.; Fan, G. Study on bond performance between FRP bars and seawater coral aggregate concrete. Constr. Build. Mater. 2018, 173, 272–288. [Google Scholar] [CrossRef] [Scilit]
- Yang, S.; Chen, Y.; Du, D.; Fan, G. Determination of boundary effect on shear fracture energy at steel bar–concrete interface. Eng. Fract. Mech. 2016, 153, 319–330. [Google Scholar] [CrossRef] [Scilit]
- Dai, J.; Ueda, T.; Sato, Y. Unified analytical approaches for determining shear bond characteristics of FRP-concrete interfaces through pullout tests. J. Adv. Concr. Technol. 2006, 4, 133–145. [Google Scholar] [CrossRef] [Scilit]
- Milani, G.; Grande, E. Simple bisection procedure in quickly convergent explicit ODE solver to numerically analyze FRCM strengthening systems. Compos. Part B Eng. 2020, 199, 108322. [Google Scholar] [CrossRef] [Scilit]
- Bilotta, A.; Lignola, G.P. Effect of fiber-to-matrix bond on the performance of inorganic matrix composites. Compos. Struct. 2021, 265, 113655. [Google Scholar] [CrossRef] [Scilit]
- Zhang, X.; Aljewifi, H.; Li, J. Failure behaviour investigation of continuous yarn reinforced cementitious composites. Constr. Build. Mater. 2013, 47, 456–464. [Google Scholar] [CrossRef] [Scilit]
- D’antino, T.; Carloni, C.; Sneed, L.; Pellegrino, C. Matrix-fiber bond behavior in PBO FRCM composites: A fracture mechanics approach. Eng. Fract. Mech. 2014, 117, 94–111. [Google Scholar] [CrossRef] [Scilit]
- Colombi, P.; D’Antino, T. Analytical assessment of the stress-transfer mechanism in FRCM composites. Compos. Struct. 2019, 220, 961–970. [Google Scholar] [CrossRef] [Scilit]
- Vaculik, J.; Sturm, A.B.; Visintin, P.; Griffith, M.C. Modelling FRP-to-substrate joints using the bilinear bond-slip rule with allowance for friction—Full-range analytical solutions for long and short bonded lengths. Int. J. Solids Struct. 2018, 135, 245–260. [Google Scholar] [CrossRef] [Scilit]
- Wang, Y.J.; Wu, Z.M.; Zheng, J.J.; Zhou, X.M. Three-dimensional analytical model for the pull-out response of anchor-mortar-concrete anchorage system based on interfacial bond failure. Eng. Struct. 2019, 180, 234–248. [Google Scholar] [CrossRef] [Scilit]
- Wang, H.W.; Wang, Y.J.; Liu, H.B.; Ma, D.; Wu, Z.-M.; Jin, H.; Jia, M.-D.; Hu, X. Theoretical study on the bond performance of embedded through-section reinforcing bar-to-concrete joints with localized debonding defects. Structures 2025, 75, 108615. [Google Scholar] [CrossRef] [Scilit]
- Wang, Y.J.; Wu, Z.M.; Zheng, J.J.; Yu, R.C.; Zhou, X.-M. Three-dimensional axisymmetric analytical method for pull-out behaviour of adhesive anchors in concrete. Eng. Fract. Mech. 2020, 226, 106876. [Google Scholar] [CrossRef] [Scilit]
- Wang, Y.J.; Liu, H.B.; Ma, D.; Zhang, G.-Q.; Wu, Z.-M.; Jia, M.-D. Experimental and analytical investigations on debonding response of embedded through-section ribbed GFRP bar-to-concrete joints at elevated temperatures. Constr. Build. Mater. 2024, 447, 138000. [Google Scholar] [CrossRef] [Scilit]
- Pan, K.; Wang, Y.; Liu, H.; Wu, Z.; Jia, M.; Chen, Y. Closed-form solution to the debonding of embedded Through-Section FRP bar-to-concrete joints with interfacial defects. Eng. Fract. Mech. 2025, 314, 110708. [Google Scholar] [CrossRef] [Scilit]
- Wang, Y.J.; Wu, Z.M.; Zheng, J.J.; Yu, R.C.; Liu, Y. Analytical method for crack propagation process of lightly reinforced concrete beams considering bond-slip behaviour. Eng. Fract. Mech. 2019, 220, 106654. [Google Scholar] [CrossRef] [Scilit]
- Federation Internationale du Beton. FIB Bulletin 90. Externally Applied FRP Reinforcement for Concrete Structures; The International Federation for Structural Concrete: Lausanne, Switzerland, 2019. [Google Scholar] [CrossRef] [Scilit]
- Carloni, C.; Verre, S.; Sneed, L.H.; Ombres, L. Open issues on the investigation of PBO FRCM-Concrete debonding. Compos. Struct. 2022, 299, 116062. [Google Scholar] [CrossRef] [Scilit]
- Calabrese, A.S.; Colombi, P.; D’ANtino, T. Analytical solution of the bond behavior of FRCM composites using a rigid-softening cohesive material law. Compos. Part B Eng. 2019, 174, 107051. [Google Scholar] [CrossRef] [Scilit]
- D’Antino, T.; Colombi, P.; Carloni, C.; Sneed, L.H. Estimation of a matrix-fiber interface cohesive material law in FRCM-concrete joints. Compos. Struct. 2018, 193, 103–112. [Google Scholar] [CrossRef] [Scilit]
- Bertolli, V.; D’Antino, T. Modeling the behavior of externally bonded reinforcement using a rigid-trilinear cohesive material law. Int. J. Solids Struct. 2022, 248, 111641. [Google Scholar] [CrossRef] [Scilit]
- Yuan, H.; Teng, J.; Seracino, R.; Wu, Z.; Yao, J. Full-range behavior of FRP-to-concrete bonded joints. Eng. Struct. 2004, 26, 553–565. [Google Scholar] [CrossRef] [Scilit]
- Calabrese, A.S.; D’Antino, T.; Colombi, P. Effect of adhesive ductility on the bond behavior of CFRP-steel cohesive interfaces made with toughened epoxy resin. Compos. Sci. Technol. 2024, 257, 110824. [Google Scholar] [CrossRef] [Scilit]
- Godat, A.; L’hady, A.; Chaallal, O.; Neale, K.W. Bond behavior of the ETS FRP bar shear-strengthening method. J. Compos. Constr. 2012, 16, 529–539. [Google Scholar] [CrossRef] [Scilit]
- Caro, M.; Dirar, S.; Quinn, A.; Yapa, H. Shear strengthening of existing reinforced concrete beams with embedded bars–an overview. Proc. Inst. Civ. Eng.-Struct. Build. 2023, 176, 439–452. [Google Scholar] [CrossRef] [Scilit]
- Valerio, P.; Ibell, T.J.; Darby, A.P. Deep embedment of FRP for concrete shear strengthening. Proc. Inst. Civ. Eng.-Struct. Build. 2009, 162, 311–321. [Google Scholar] [CrossRef] [Scilit]
- Focacci, F.; D’Antino, T.; Carloni, C.; Sneed, L.; Pellegrino, C. An indirect method to calibrate the interfacial cohesive material law for FRCM-concrete joints. Mater. Des. 2017, 128, 206–217. [Google Scholar] [CrossRef] [Scilit]
- Zou, X.; D’ANtino, T.; Sneed, L.H. Analytical study of the bond behavior of fiber reinforced cementitious matrix (FRCM)-substrate joints based on a two-stage nonlinear cohesive material law. Compos. Struct. 2023, 304, 116457. [Google Scholar] [CrossRef] [Scilit]
- D’Antino, T.; Pisani, M.A. General analytical model for the bond capacity of NSM FRP-concrete joints. J. Compos. Constr. 2020, 24, 04020065. [Google Scholar] [CrossRef] [Scilit]
- Focacci, F.; Rahman, M.M.; D’aNtino, T.; Carloni, C. Frp strips externally bonded to quasi-brittle substrates: Discussions and advances of open research topics. J. Compos. Constr. 2024, 28, 04024055. [Google Scholar] [CrossRef] [Scilit]
- Bocciarelli, M. A new cohesive law for the simulation of crack propagation under cyclic loading. Appl. Steel-Concr.-FRP Bond. interface. Theor. Appl. Fract. Mech. 2021, 114, 102992. [Google Scholar] [CrossRef] [Scilit]
- Benmokrane, B.; Chennouf, A.; Mitri, H. Laboratory evaluation of cement-based grouts and grouted rock anchor. Int. J. Rock Mech. Min. Sci. Geomech. Abstr. 1995, 32, 633–642. [Google Scholar] [CrossRef] [Scilit]
- Lahouar, M.A.; Caron, J.-F.; Pinoteau, N.; Forêt, G.; Benzarti, K. Mechanical behavior of adhesive anchors under high temperature exposure: Experimental investigation. Int. J. Adhes. Adhes. 2017, 78, 200–211. [Google Scholar] [CrossRef] [Scilit]
- Carrara, P.; Ferretti, D.; Freddi, F.; Rosati, G. Shear tests of carbon fiber plates bonded to concrete with control of snap-back. Eng. Fract. Mech. 2011, 78, 2663–2678. [Google Scholar] [CrossRef] [Scilit]
- Ren, F.F.; Yang, Z.J.; Chen, J.F.; Chen, W.W. An analytical analysis of the full-range behaviour of grouted rockbolts based on a tri-linear bond-slip model. Constr. Build. Mater. 2010, 24, 361–370. [Google Scholar] [CrossRef] [Scilit]
- GB/T 50081-2019; Standard for Test Methods of Physical and Mechanical Properties of Concrete. Ministry of Construction of the People’s Republic of China: Beijing, China, 2019. (In Chinese)
- ACI 440.3R-15; Guide Test Methods for Fiber-Reinforced Polymers (FRPs) for Reinforcing or Strengthening Concrete Structures. American Concrete Institute (ACI): Farmington Hills, MI, USA, 2015.
- GB 50367-2013; Code for the Design of Strengthening Concrete Structures. Ministry of Housing and Urban-Rural Development: Beijing, China, 2013. (In Chinese)
- Chen, J.; Hagan, P.C.; Saydam, S. Sample diameter effect on bonding capacity of fully grouted cable bolts. Tunn. Undergr. Space Technol. 2017, 68, 238–243. [Google Scholar] [CrossRef] [Scilit]
- ASTM D7913-14; Standard Test Method for Bond Strength of Fiber-Reinforced Polymer Matrix Composite Bars to Concrete by Pullout Testing Is a New Standard Now Available. ASTM: West Conshohocken, PA, USA, 2020.
- Rong, G.; Zhu, H.C.; Zhou, C.B. Testing study on working mechanism of fully grouted bolts of thread steel and smooth steel. Chin. J. Rock Mech. Eng. 2004, 23, 469–475. [Google Scholar]
- Focacci, F.; Nanni, A.; Bakis, C.E. Local bond-slip relationship for FRP reinforcement in concrete. J. Compos. Constr. 2000, 4, 24–31. [Google Scholar] [CrossRef] [Scilit]
- Mofidi, A.; Rajabifard, M. Fracture Mechanics-Based Modelling of Post-Installed Adhesive FRP Composite Anchors in Structural Concrete Applications. J. Compos. Sci. 2025, 9, 282. [Google Scholar] [CrossRef] [Scilit]
- Guo, D.; Zhu, M.-C.; Deng, J.; Zhong, M.-T.; Zhou, H. A novel methodology for determining the FRP-to-steel/concrete bond-slip relationship from load-displacement curves under thermal effects. Compos. Struct. 2025, 377, 119886. [Google Scholar] [CrossRef] [Scilit]
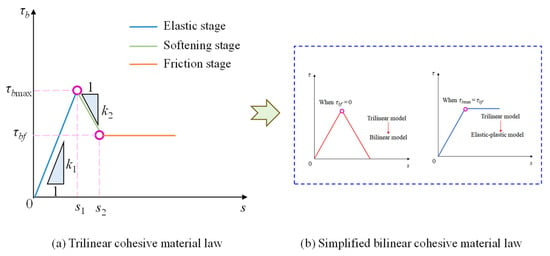
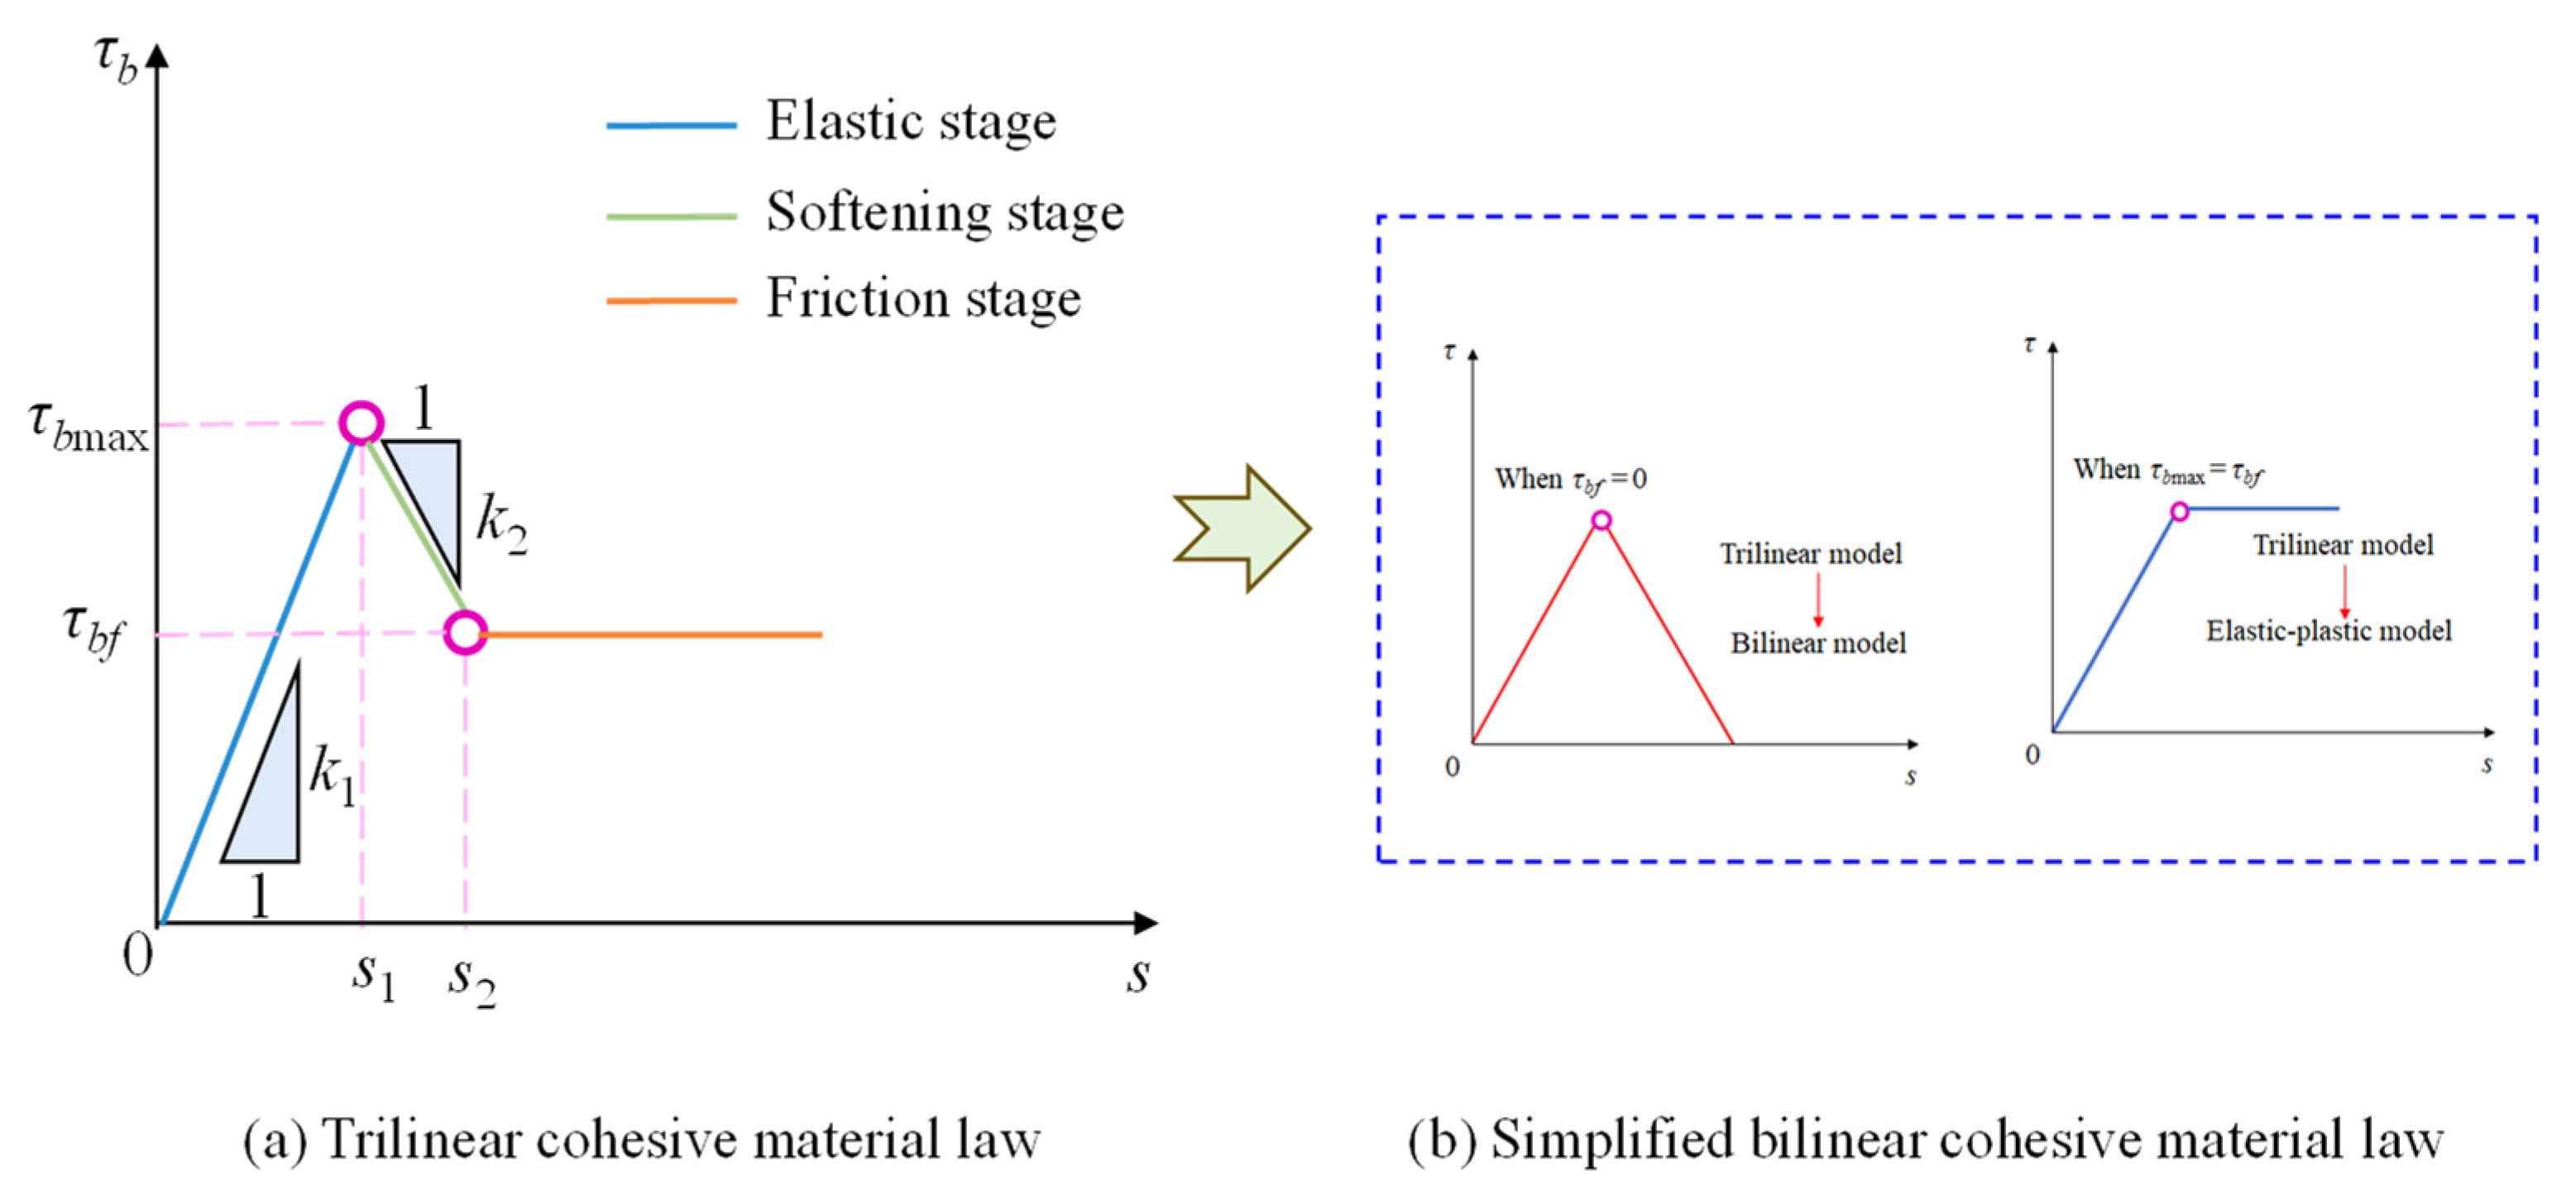
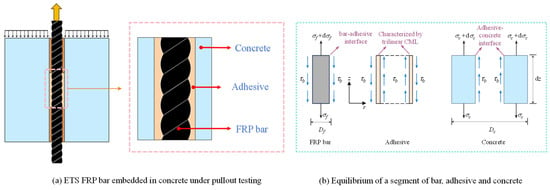
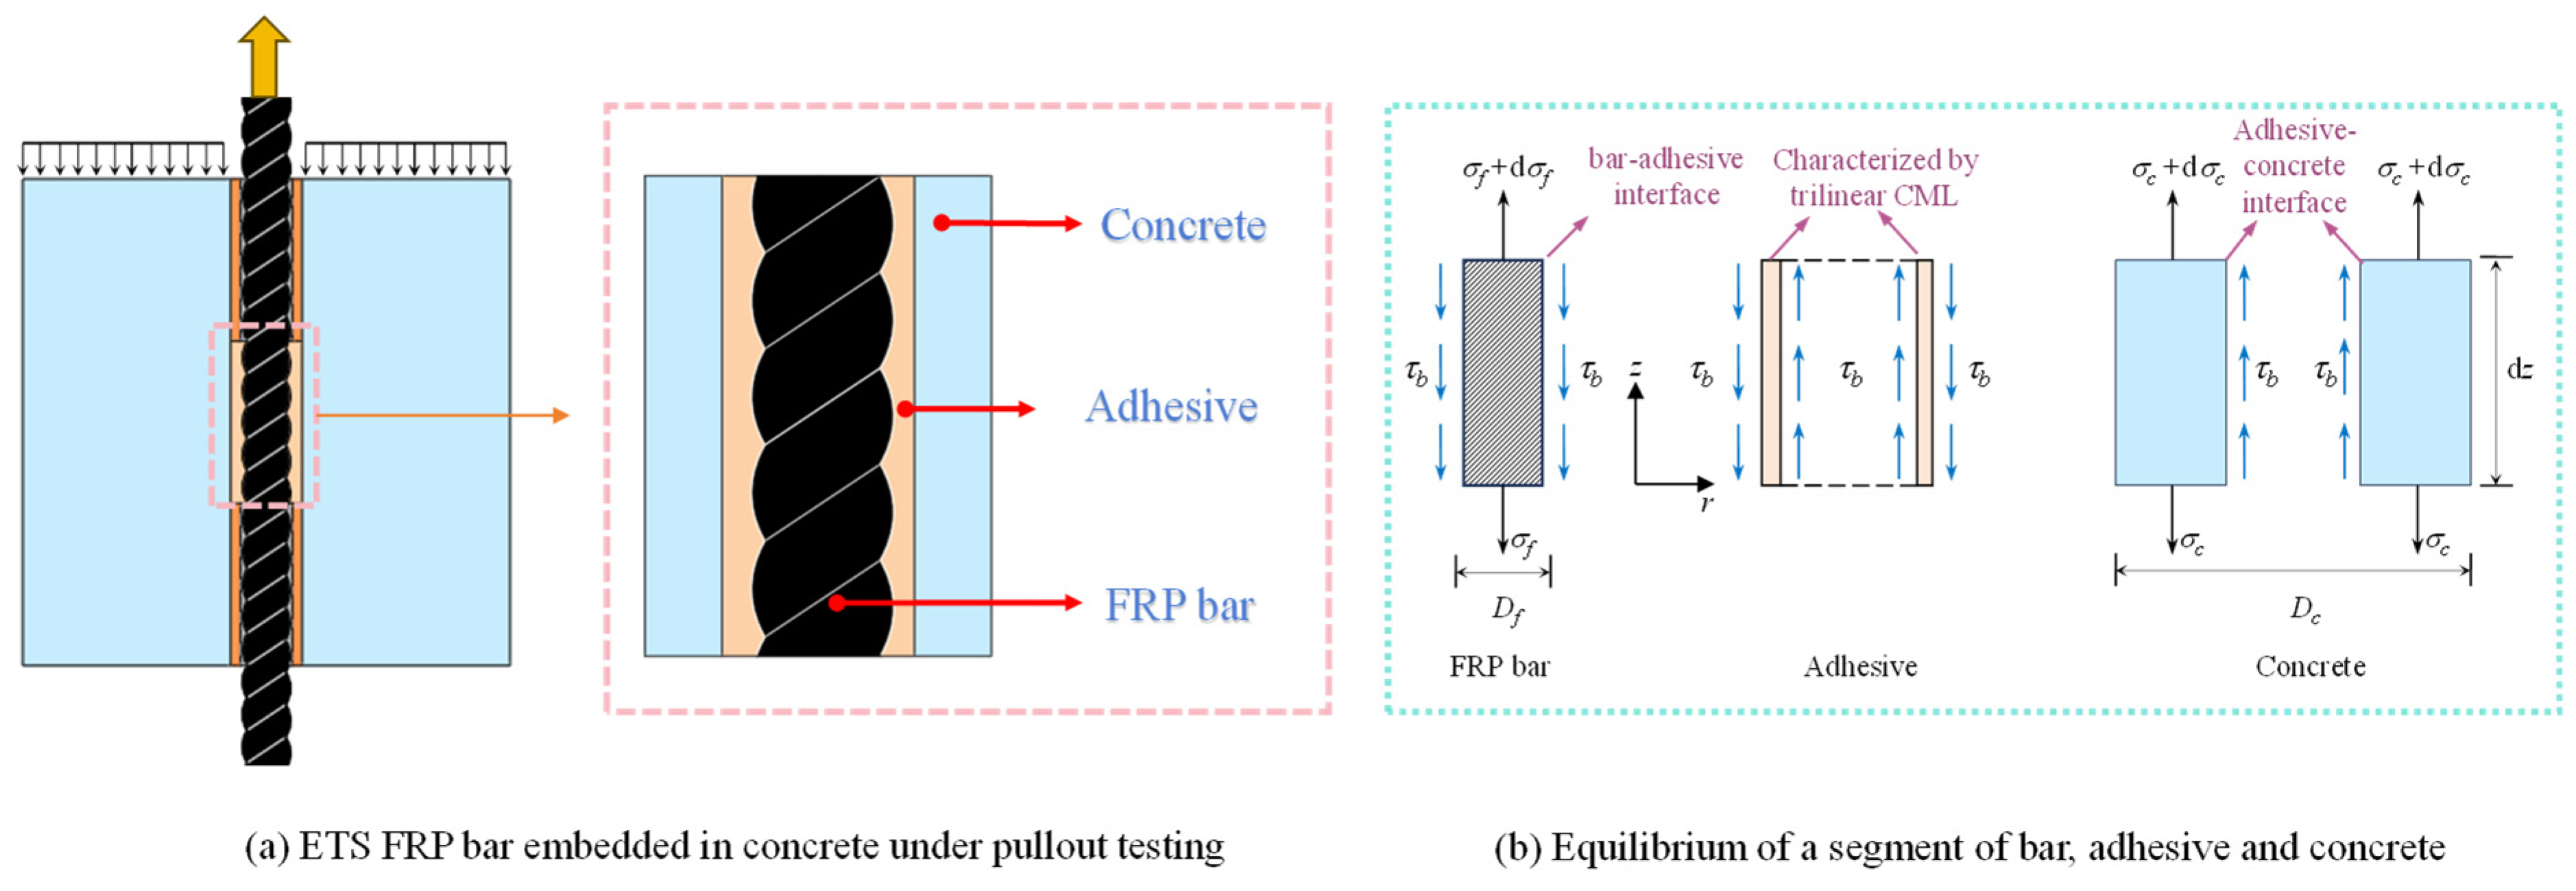
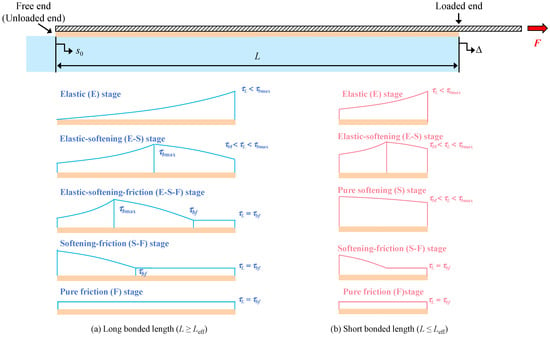
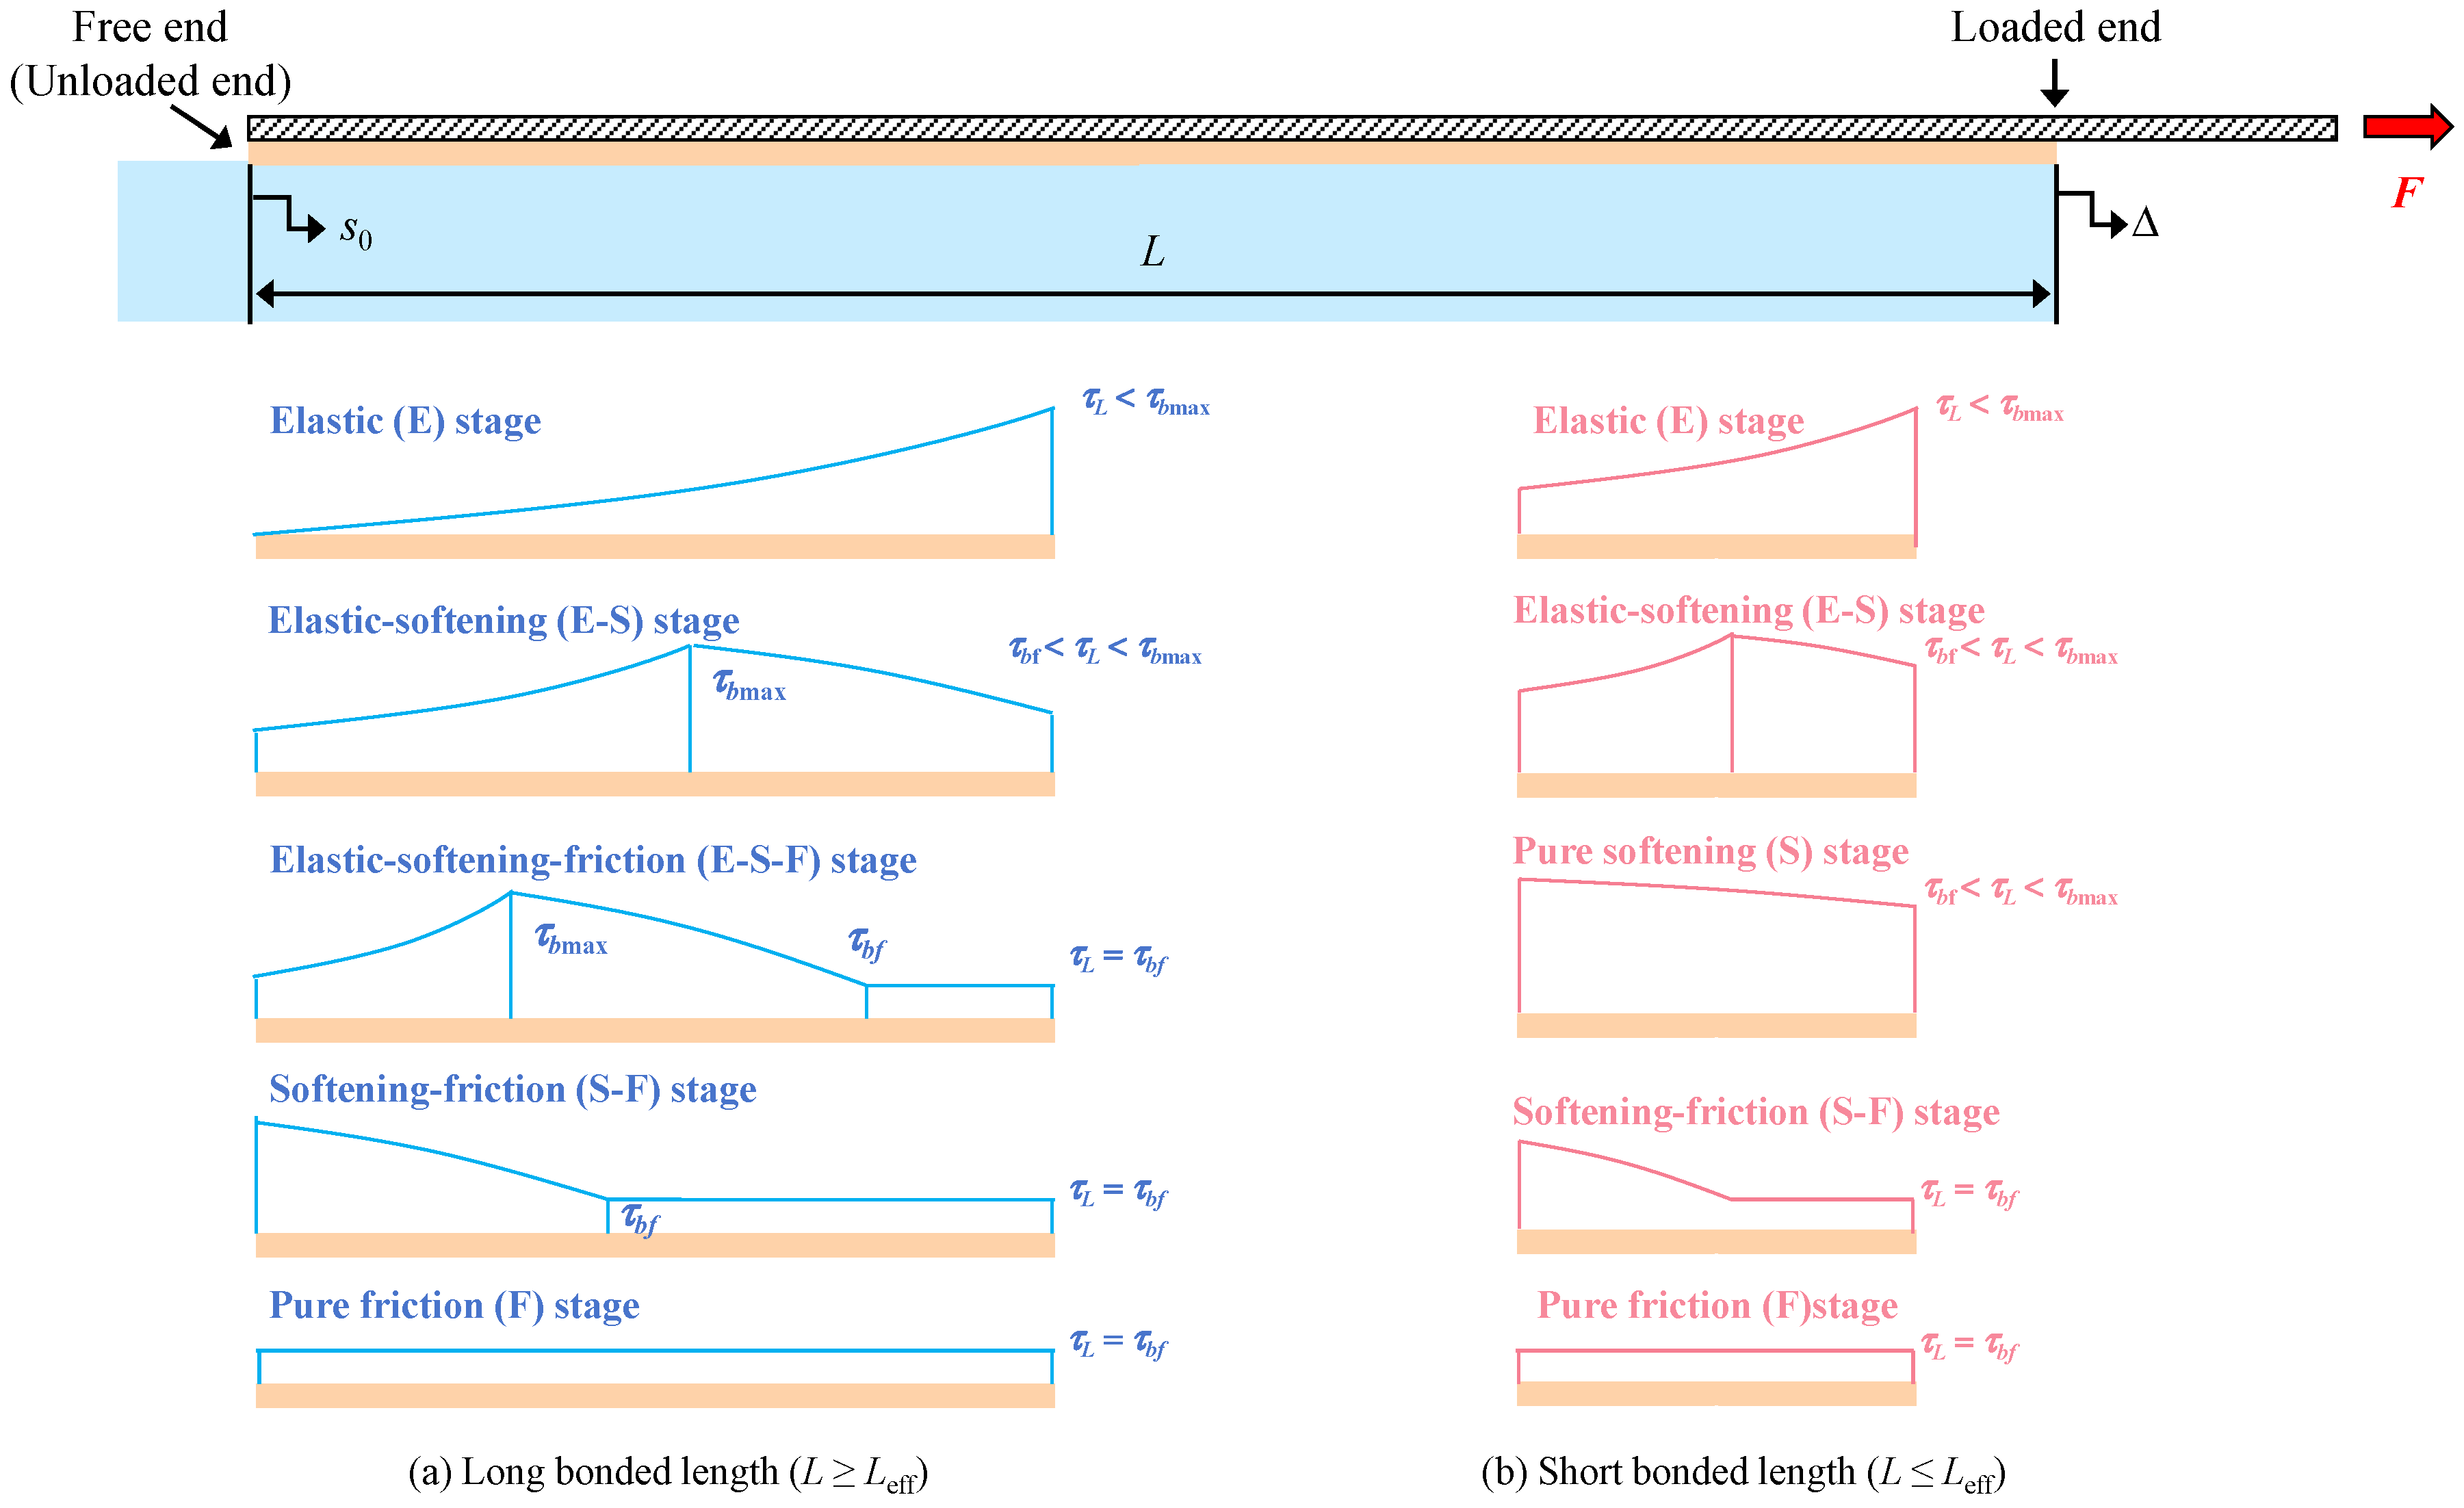
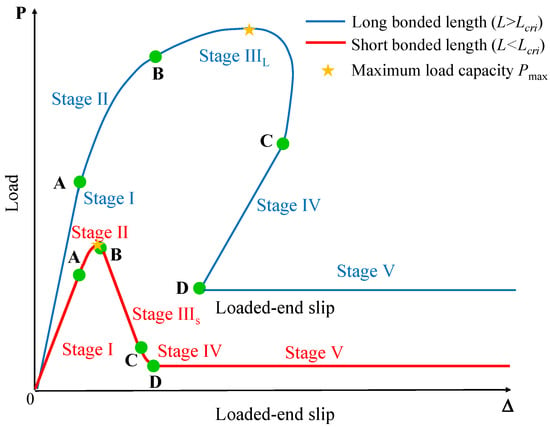
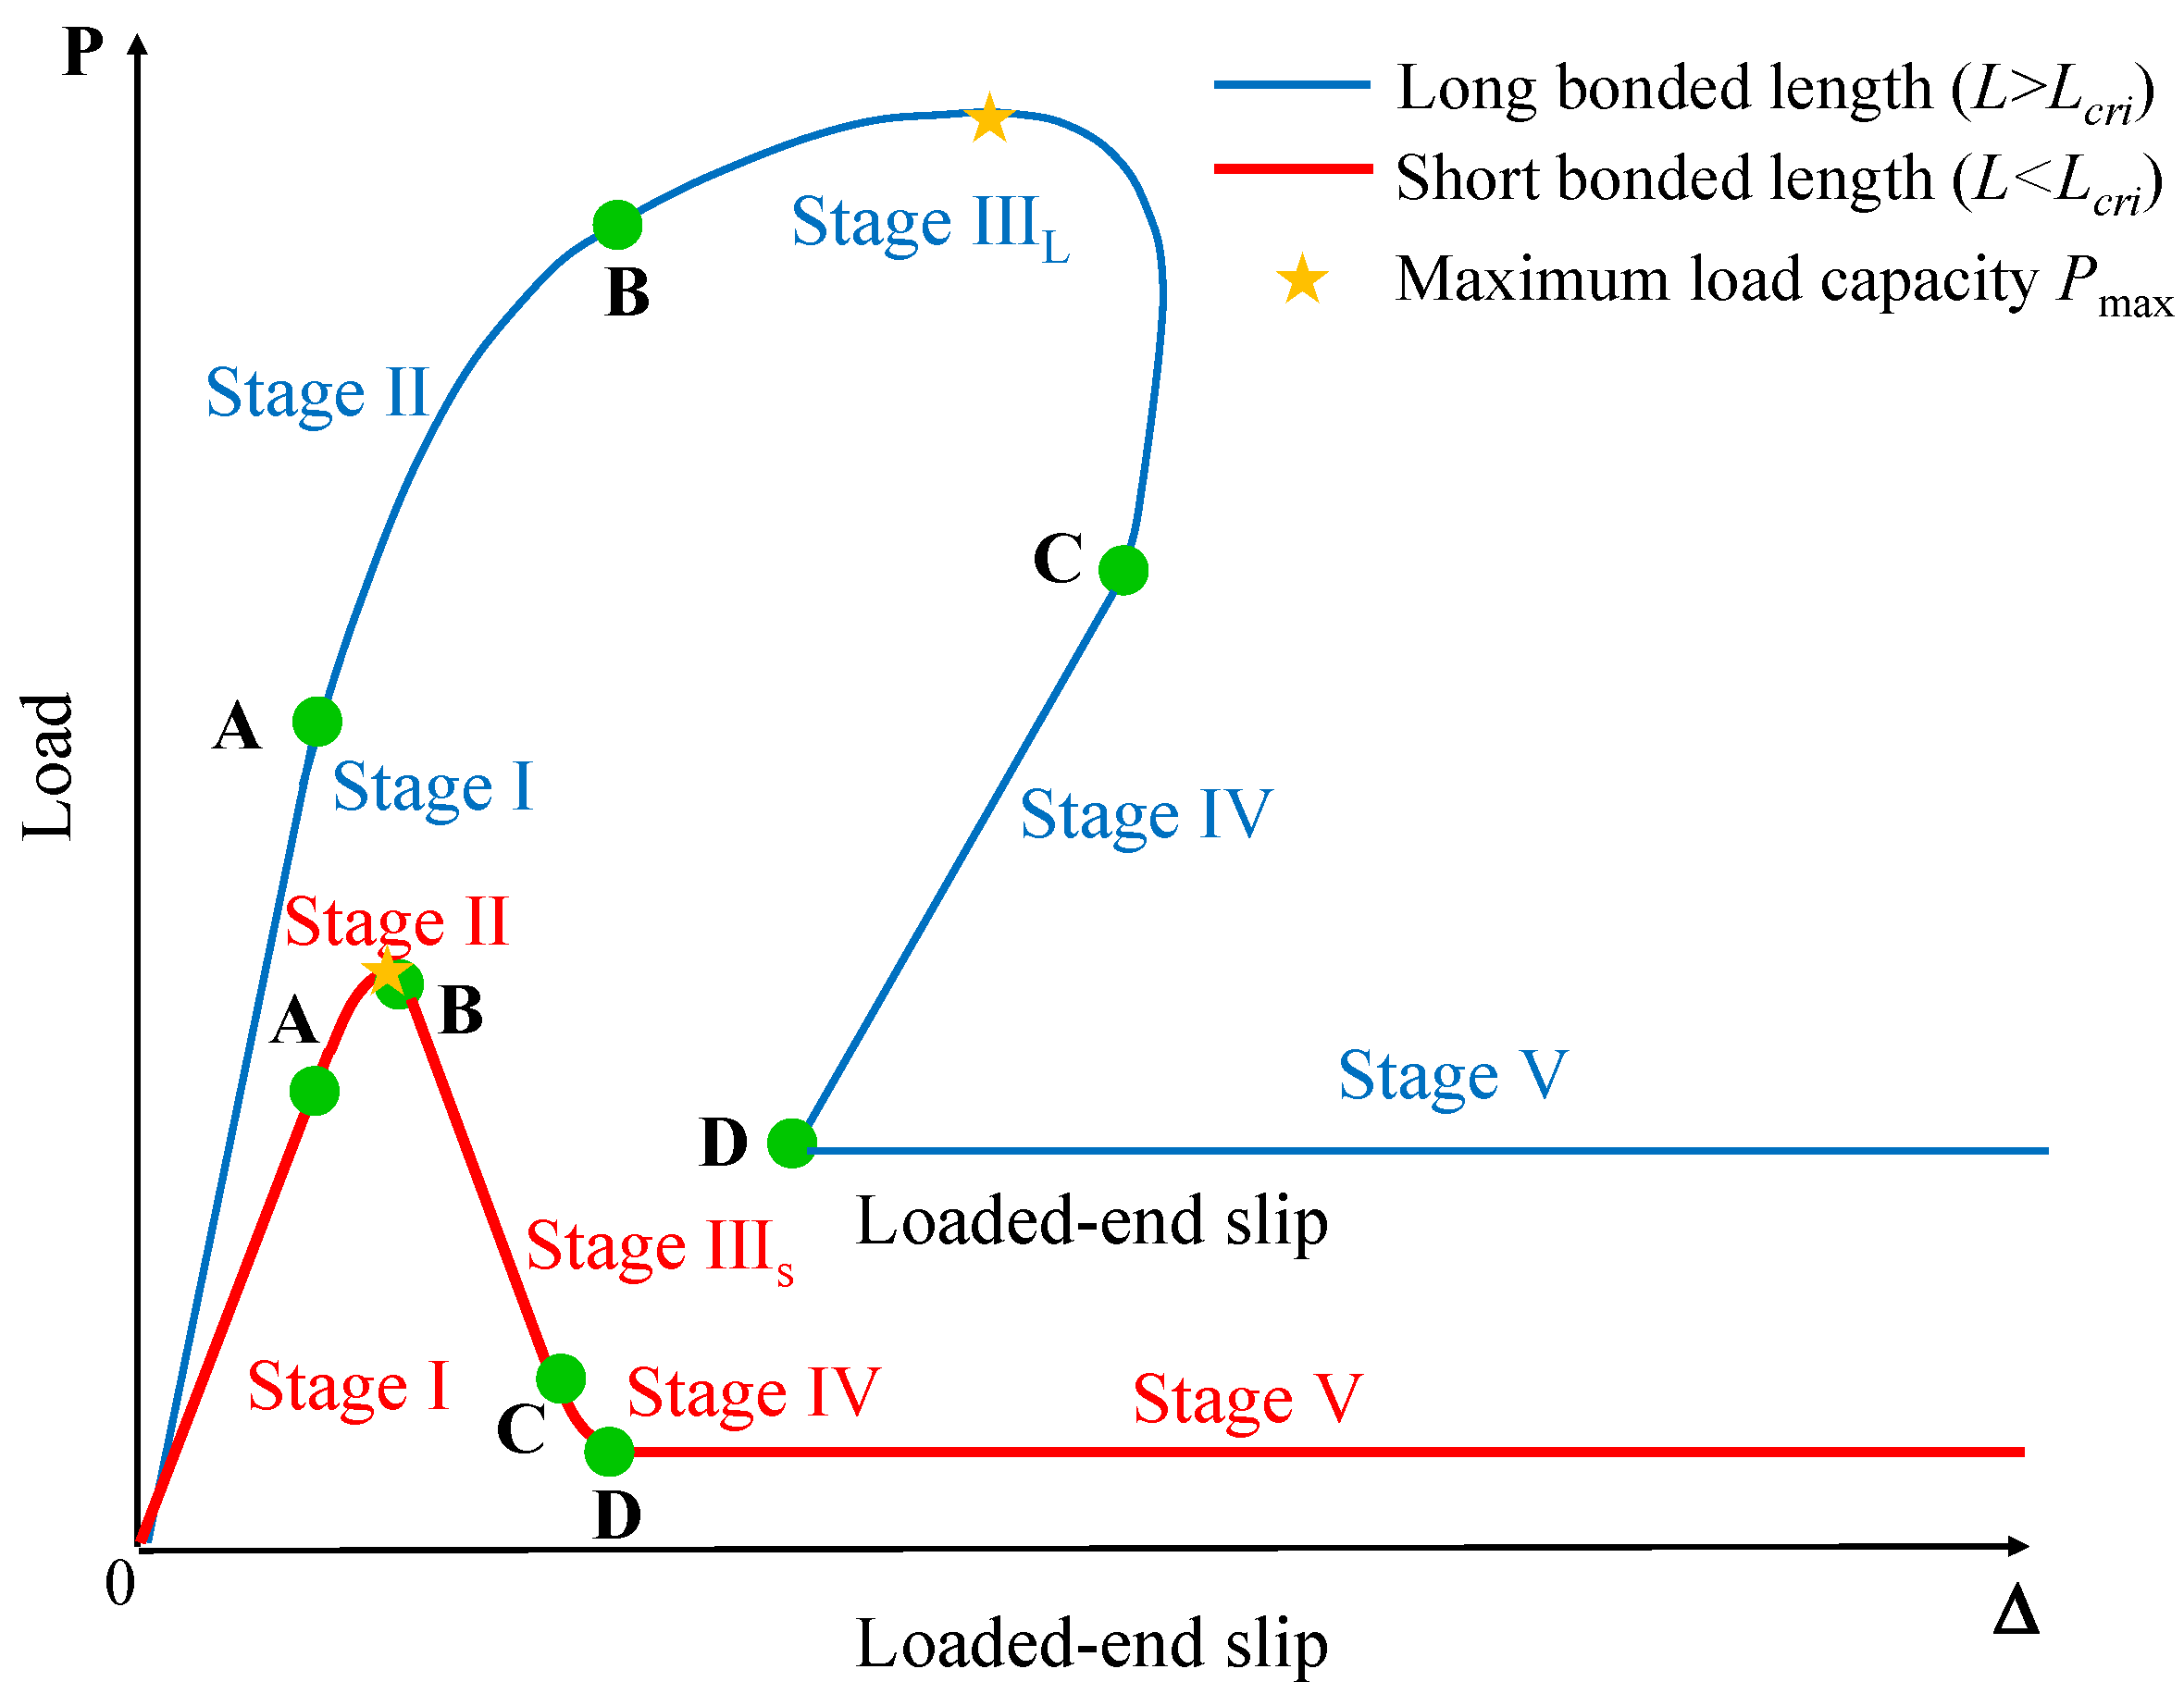
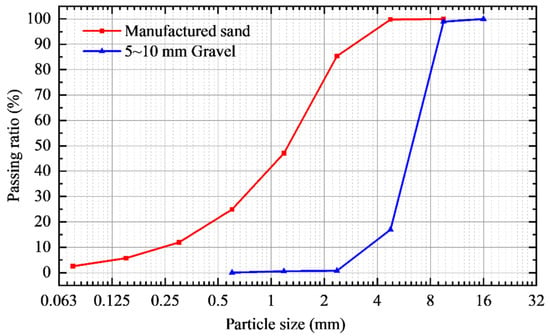
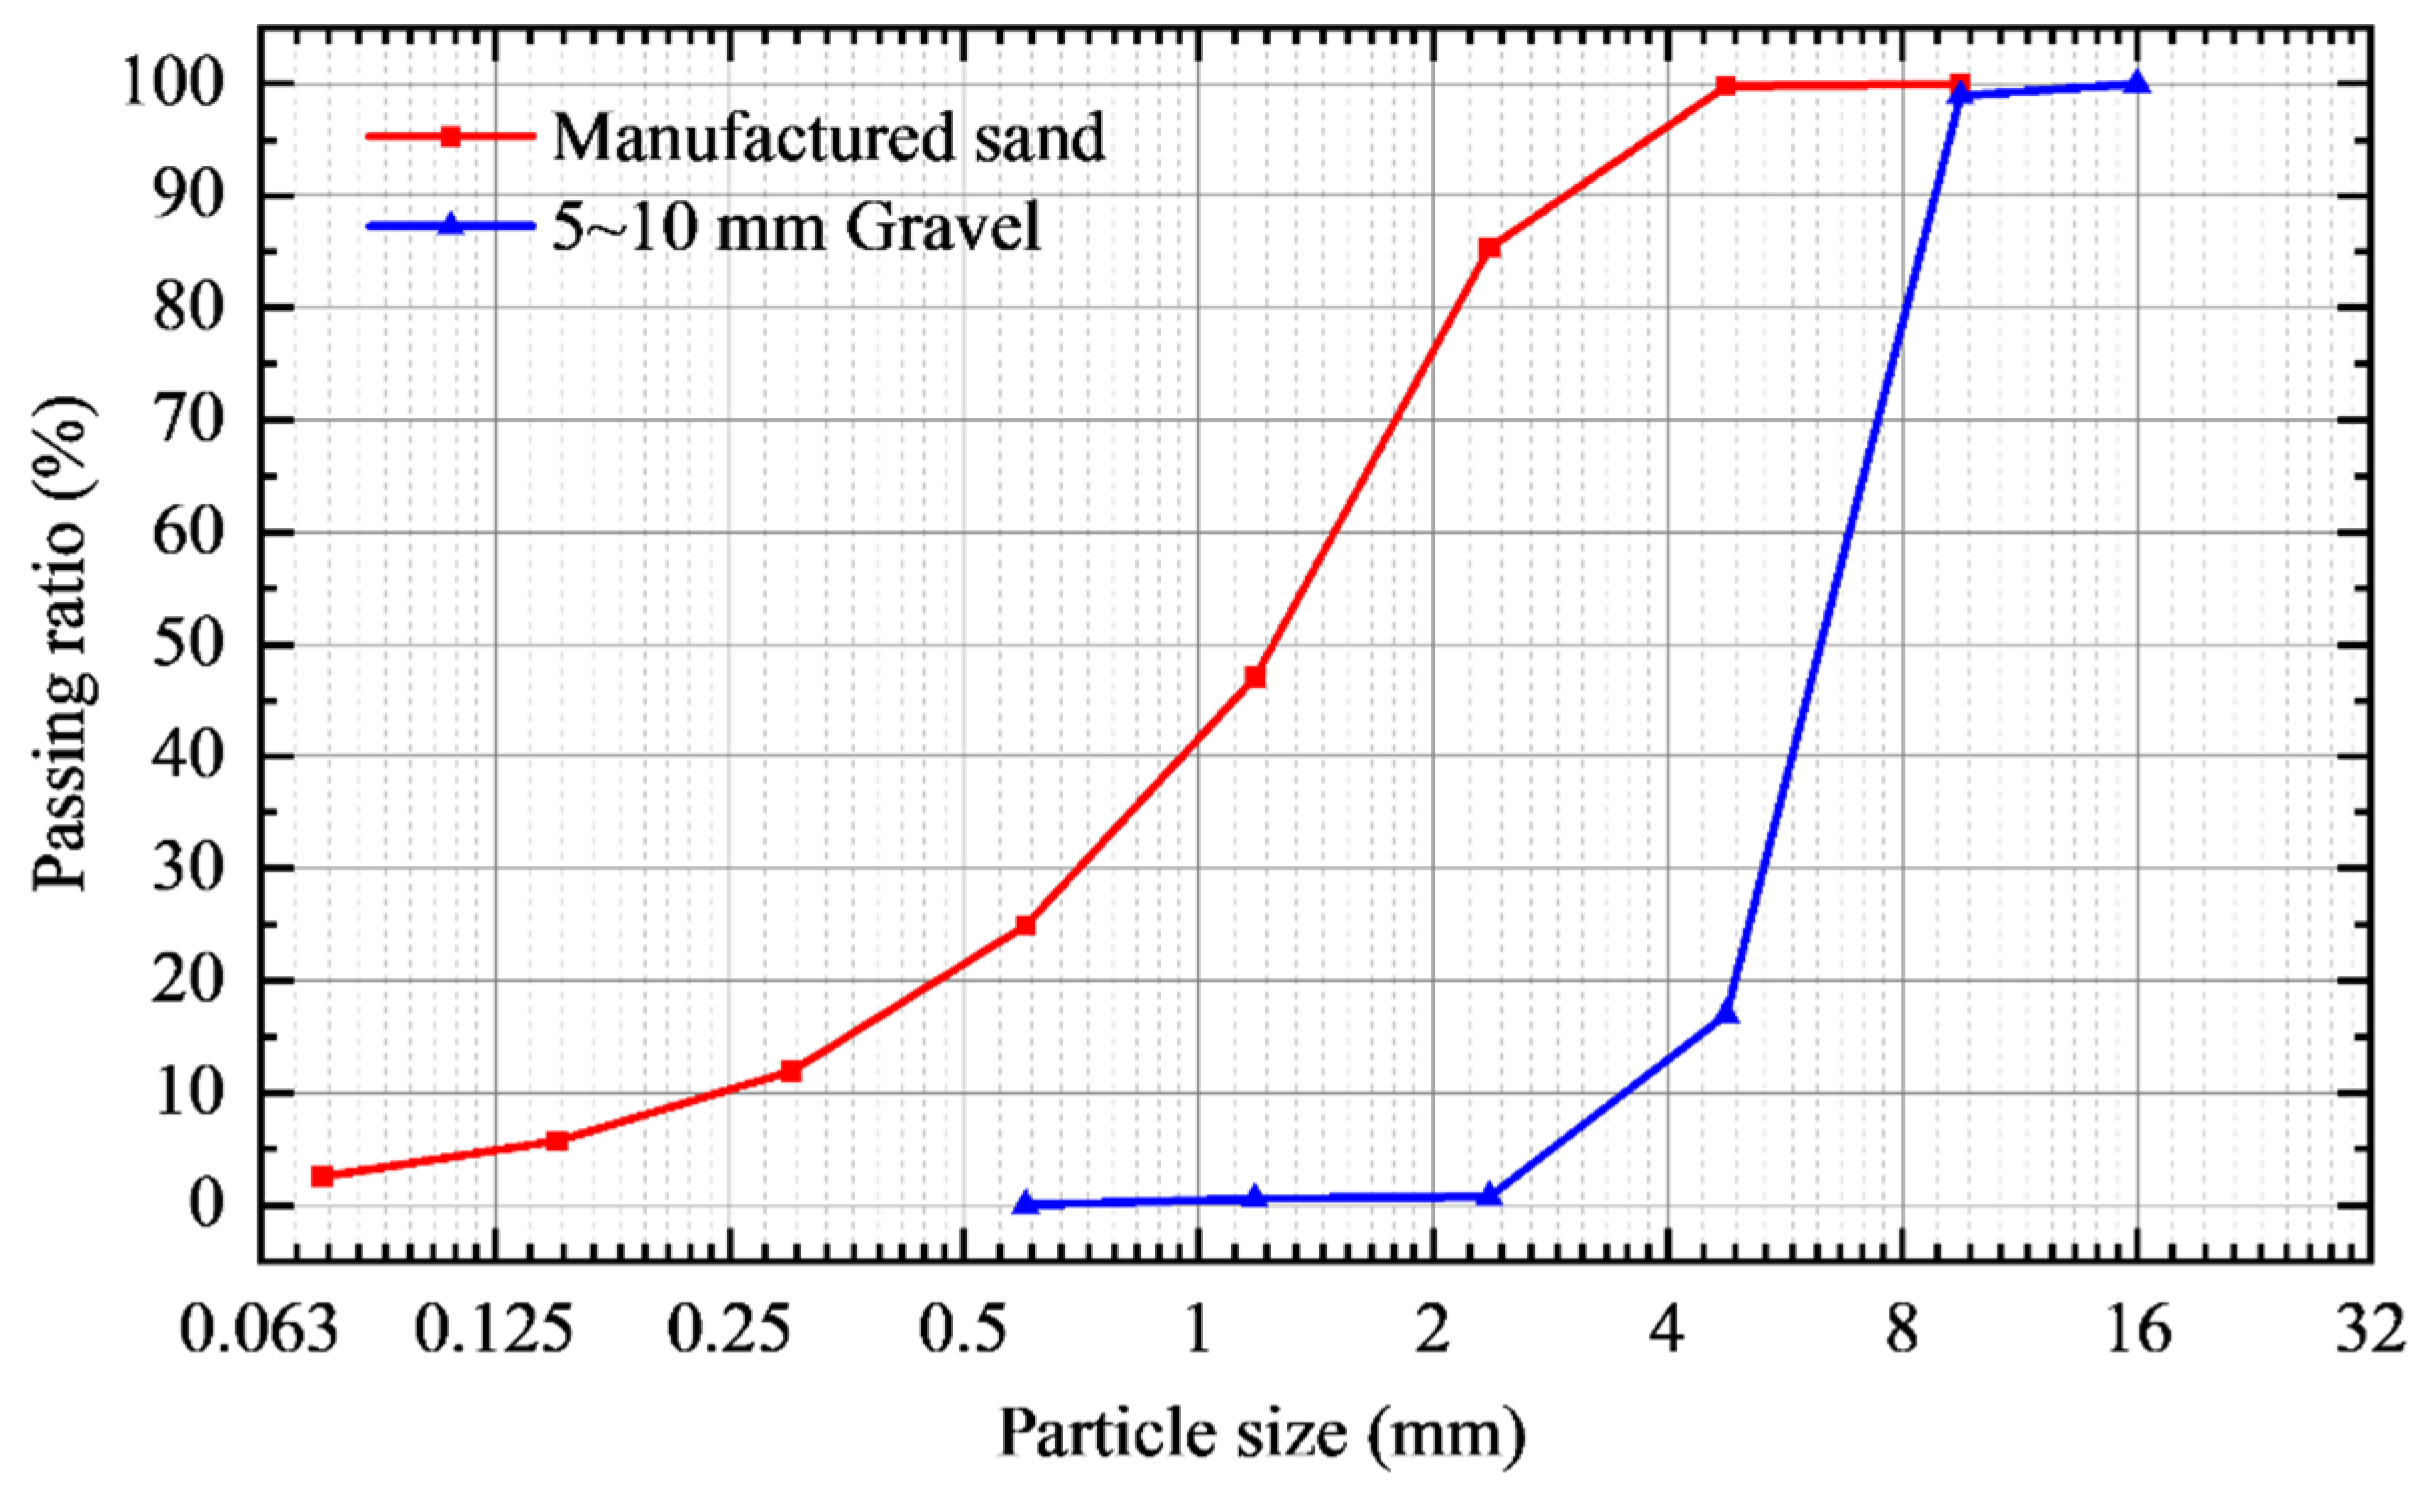
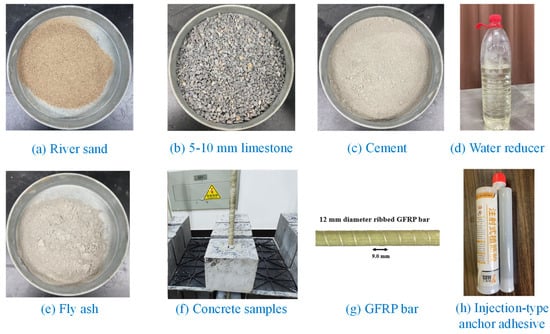
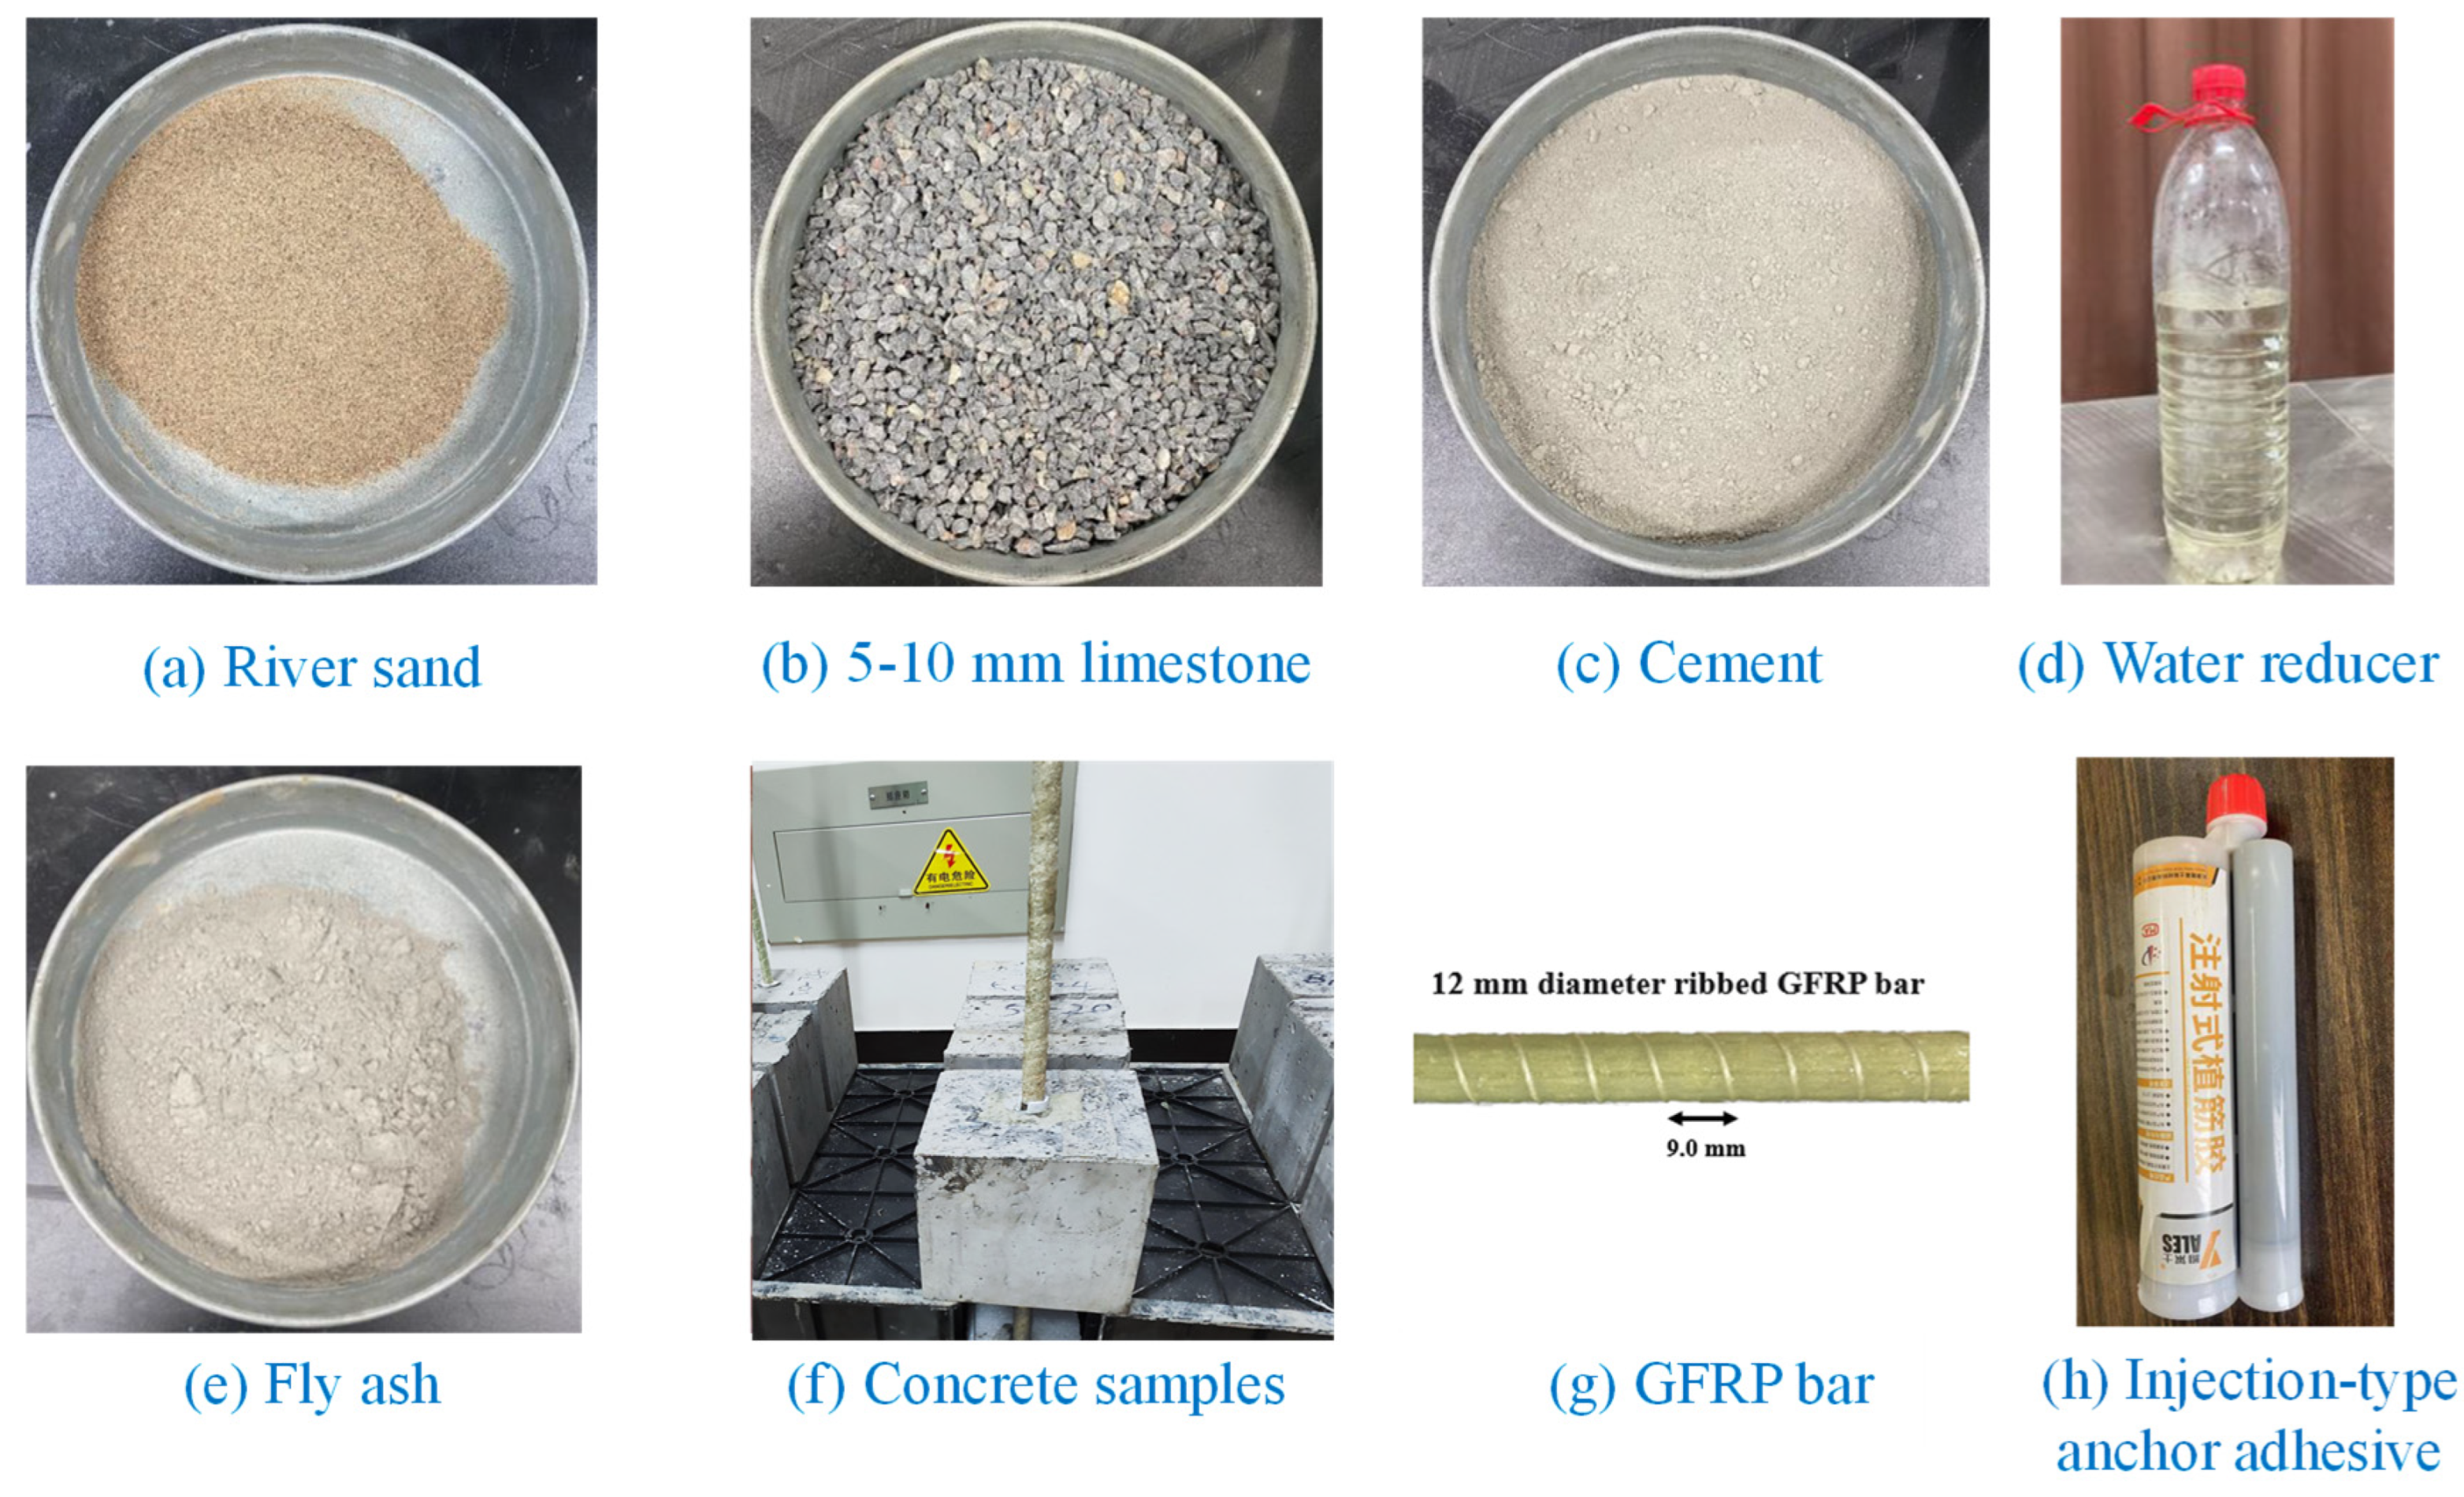
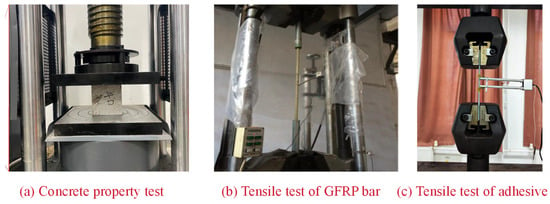
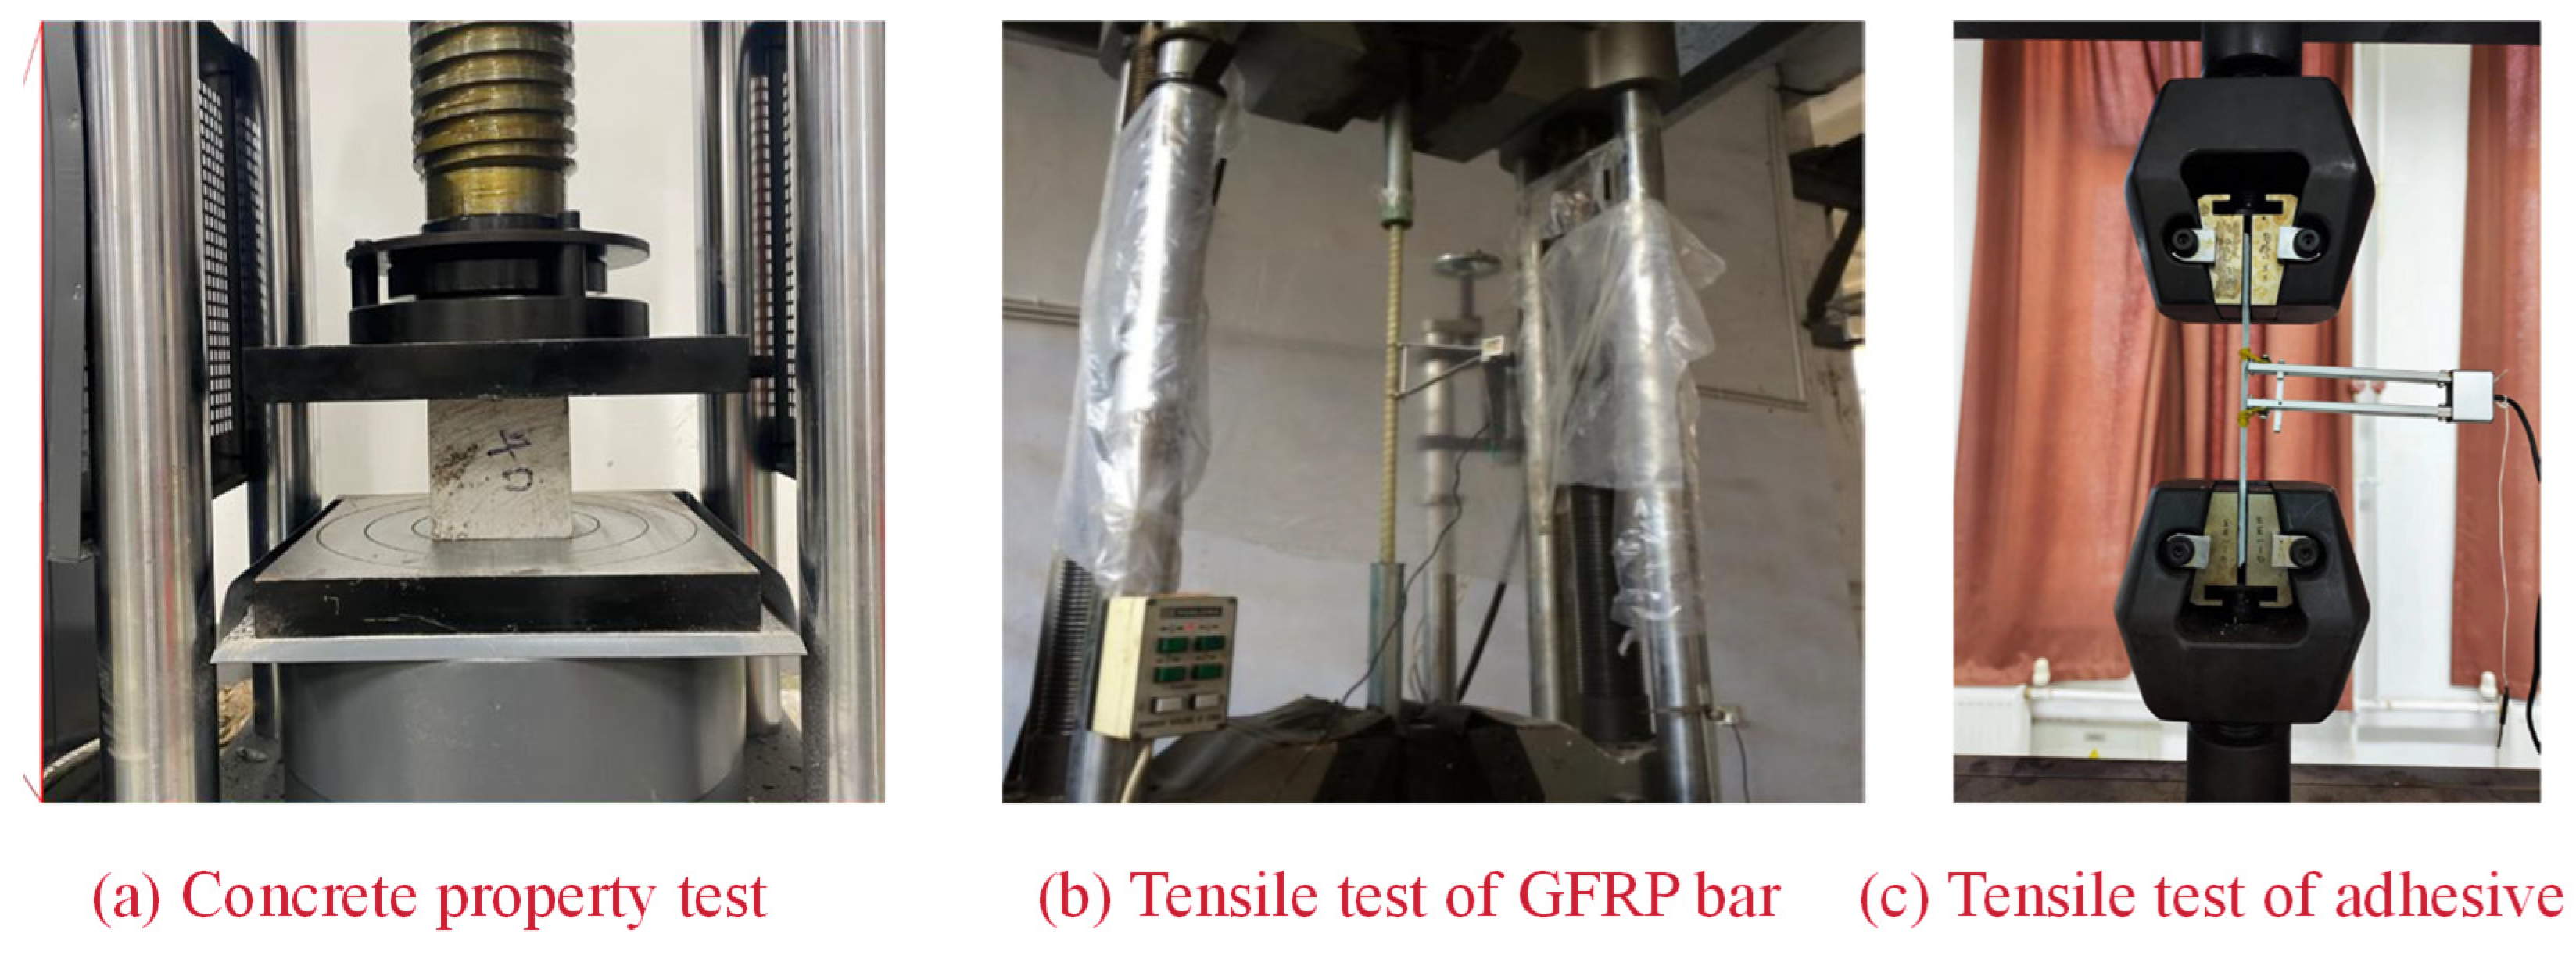
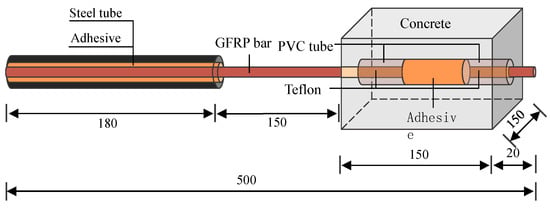
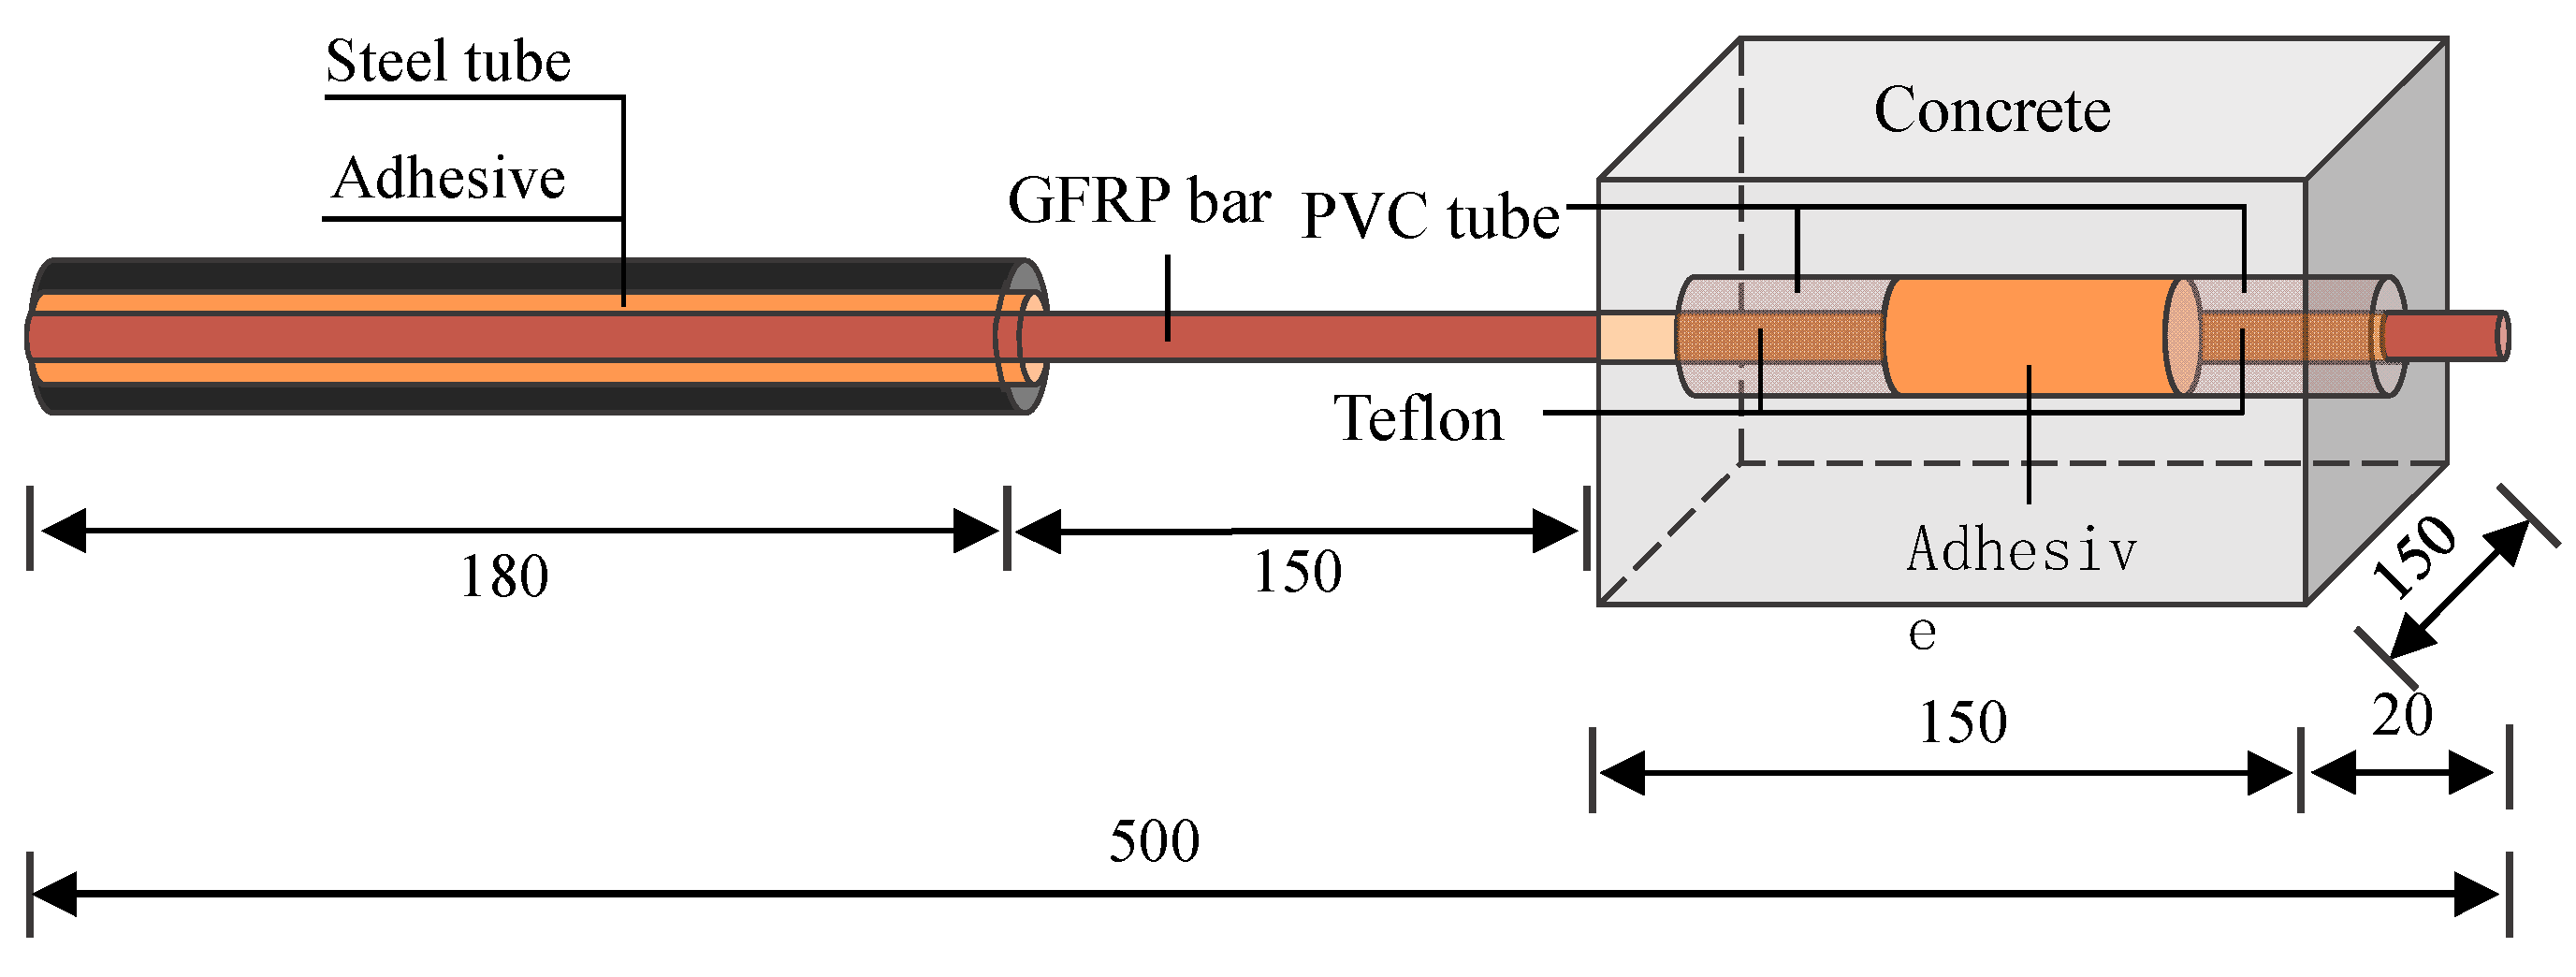
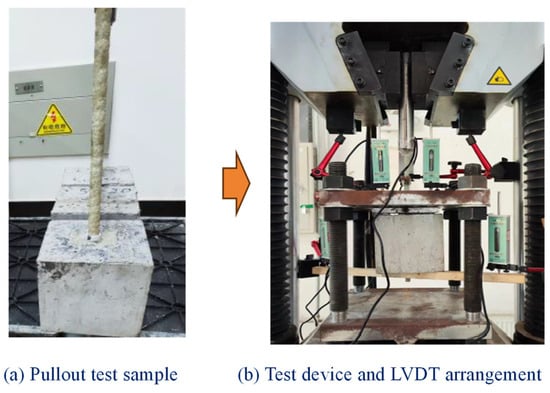
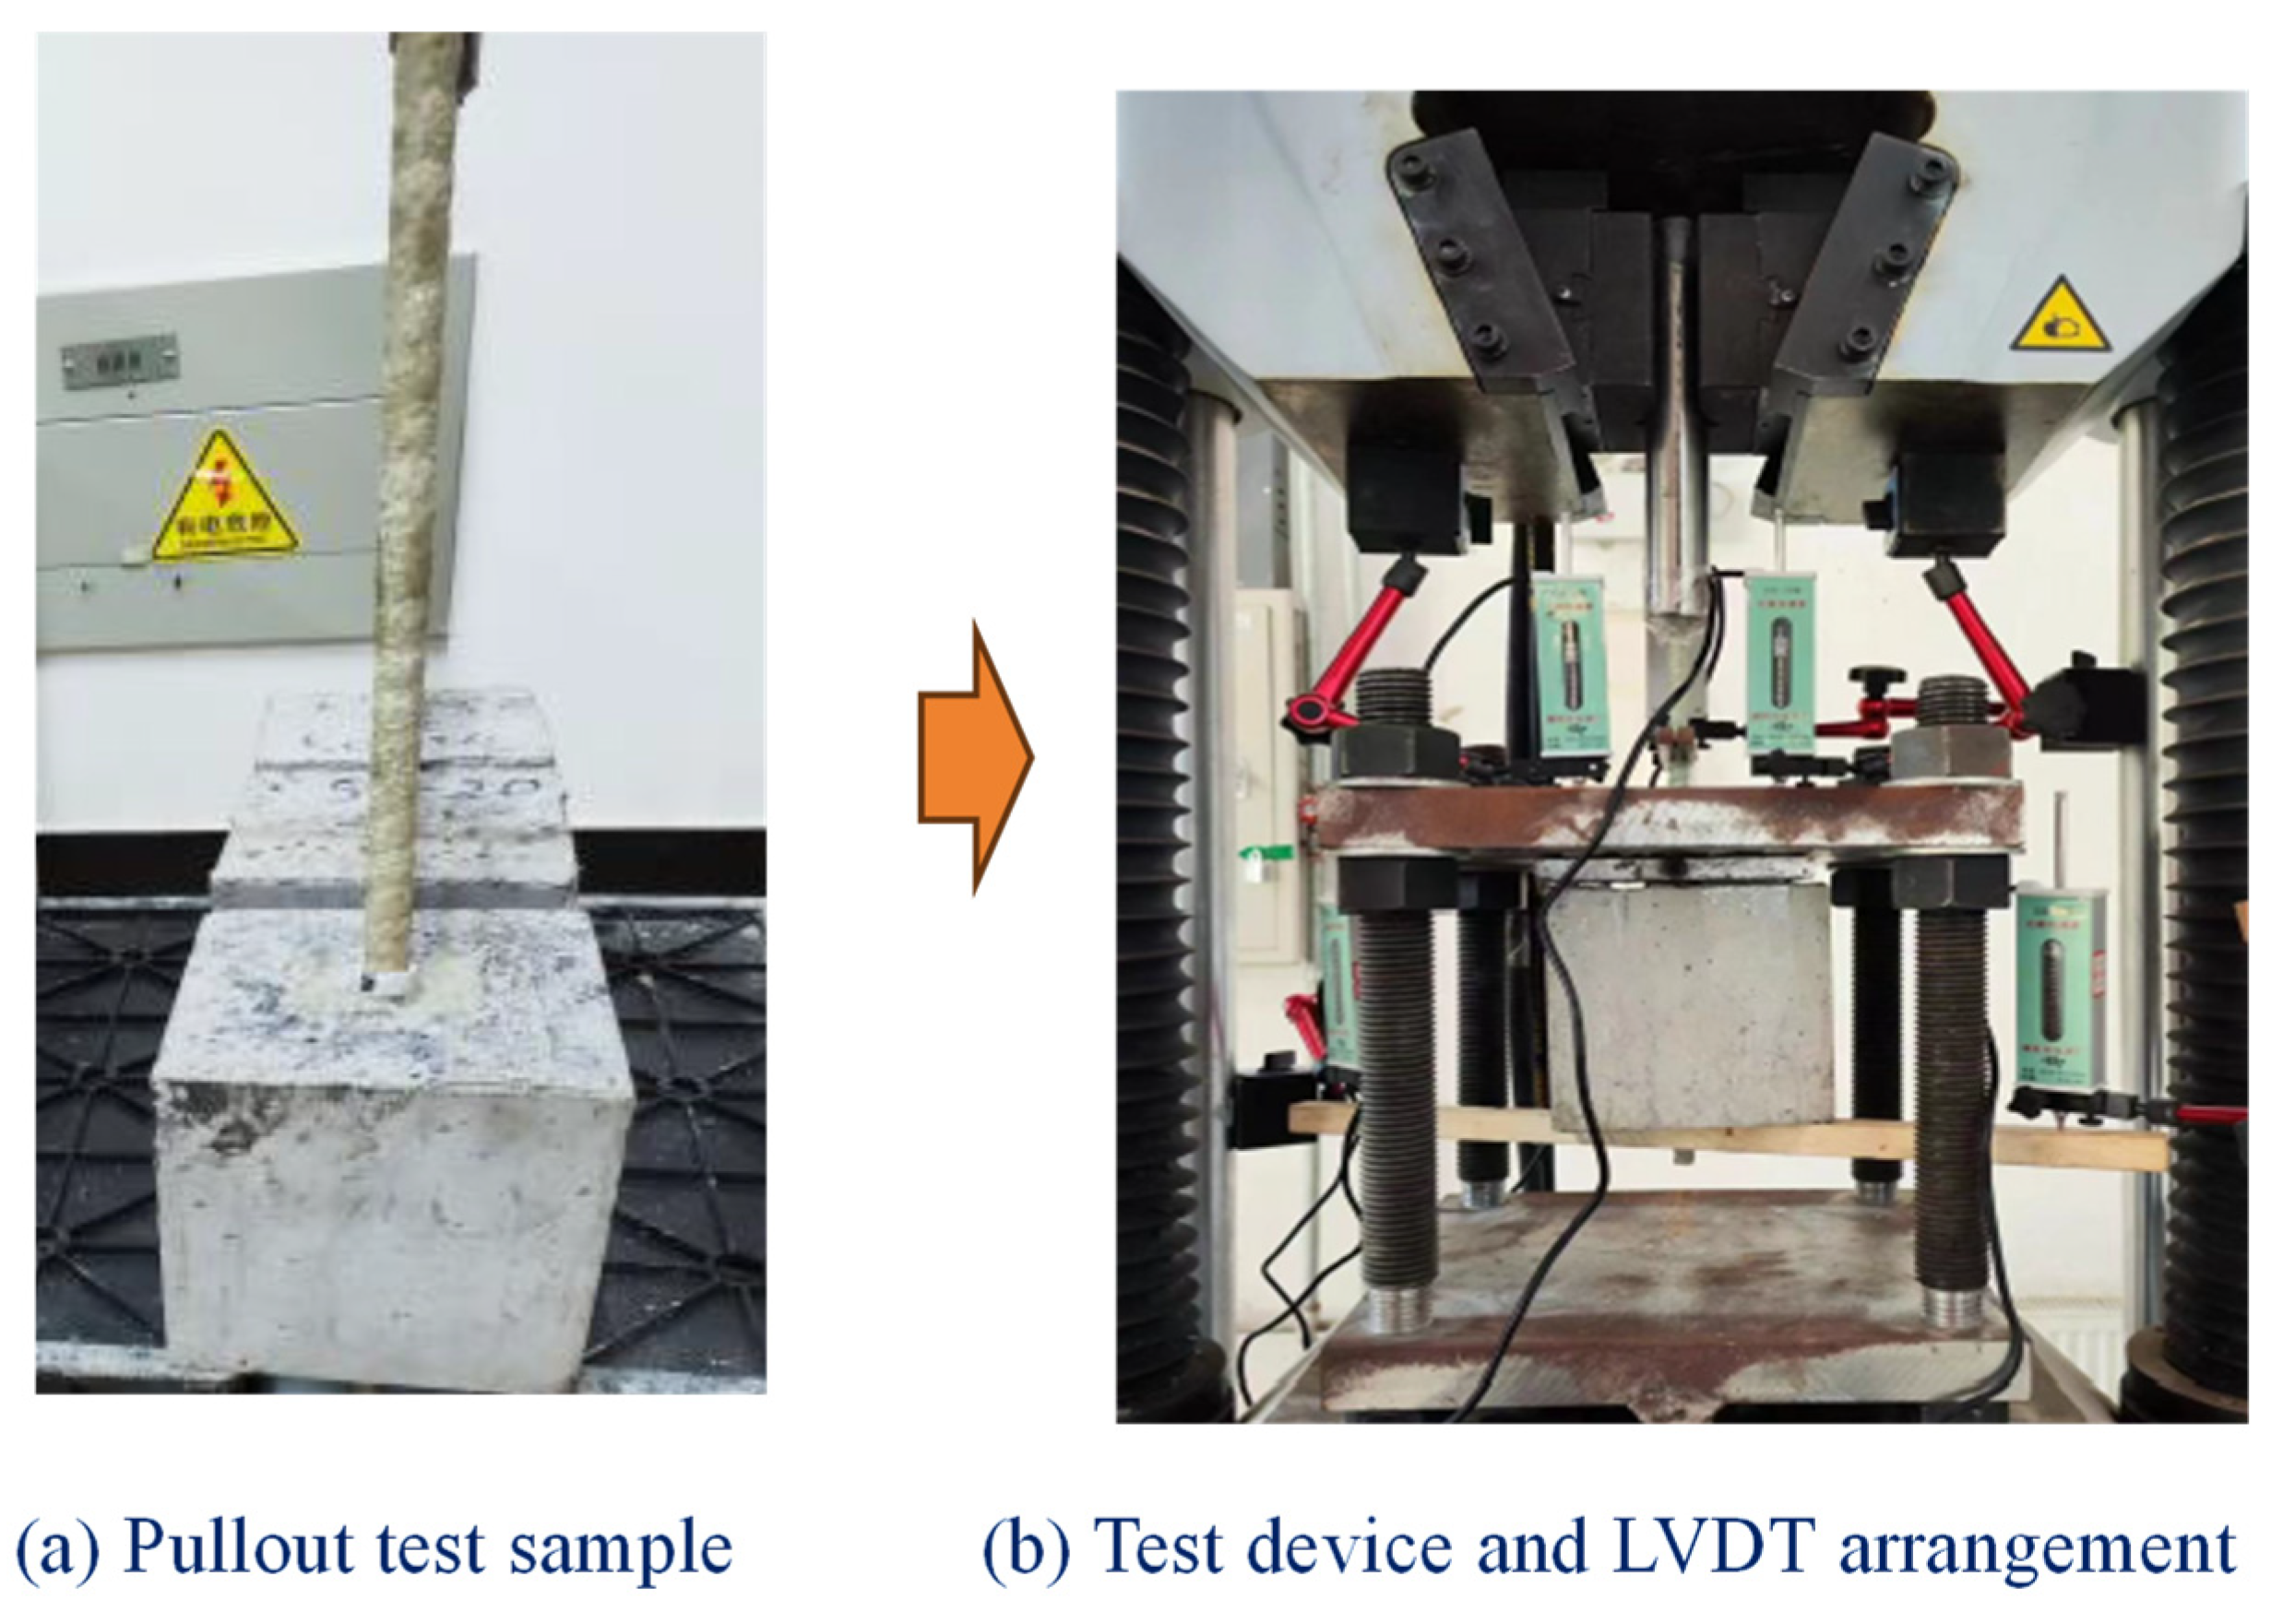
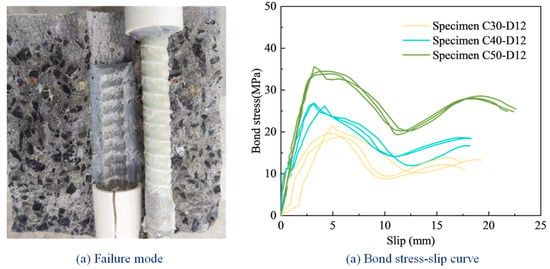
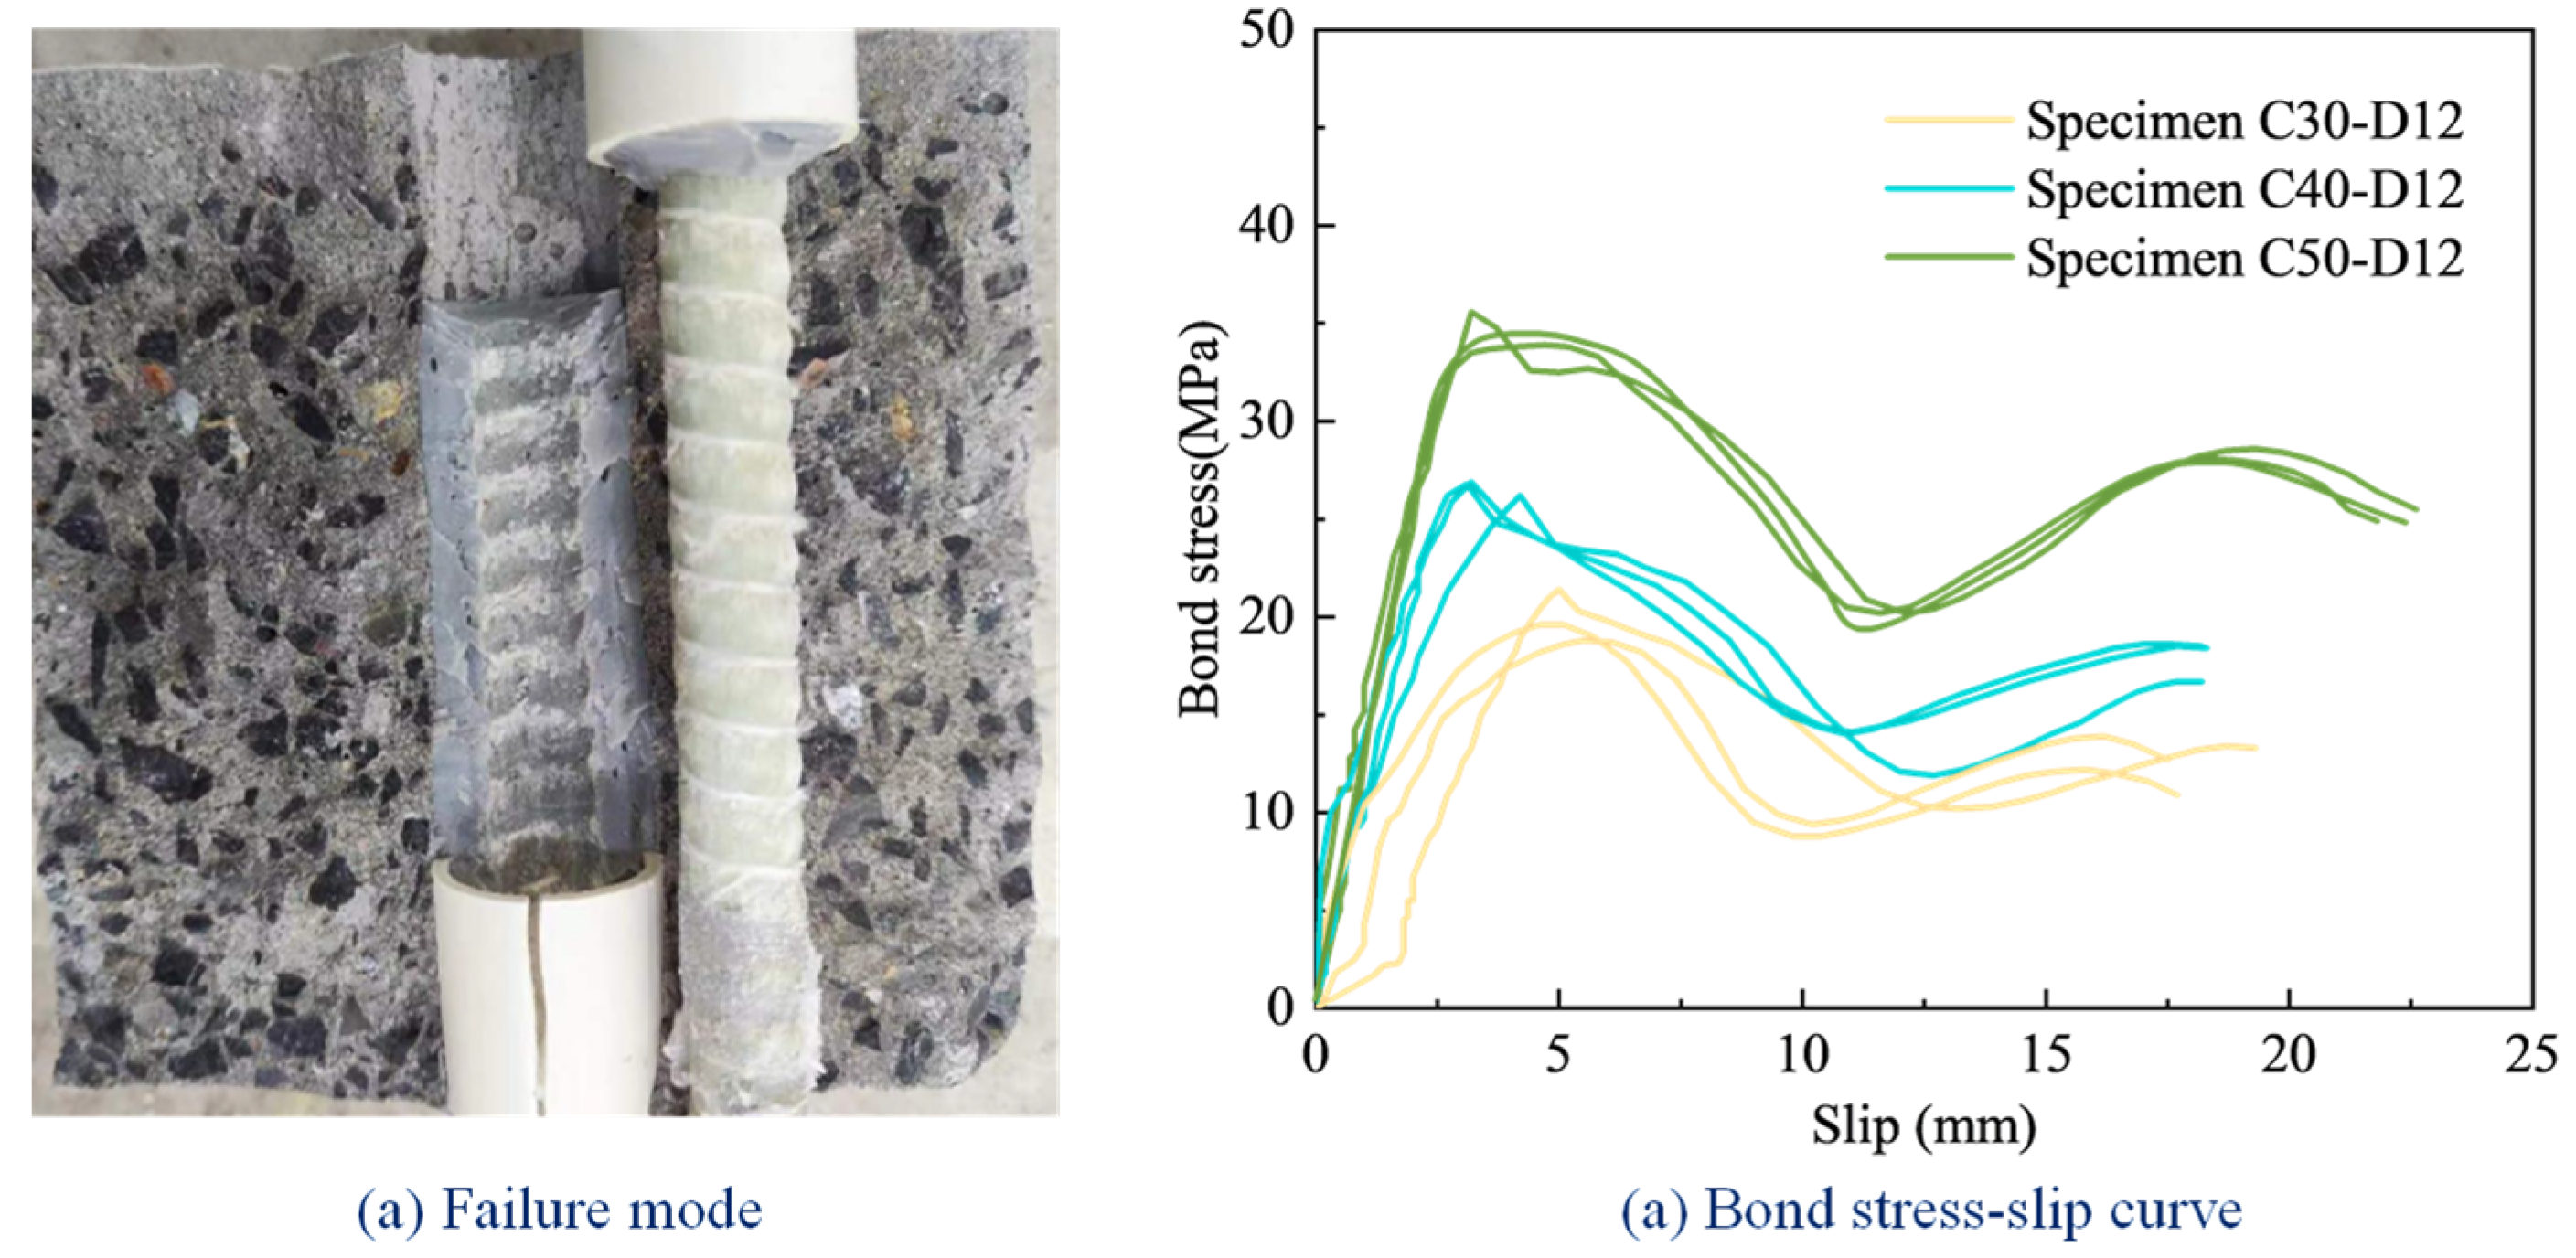
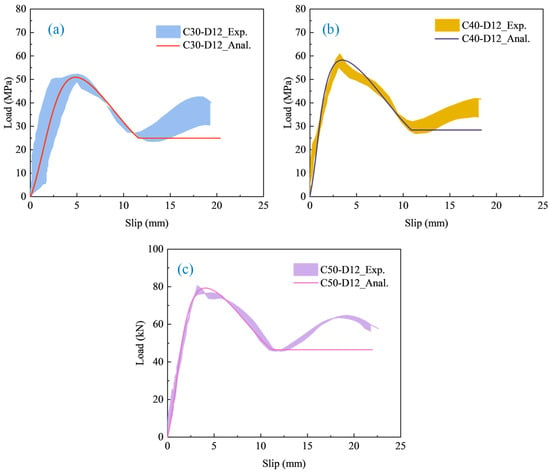
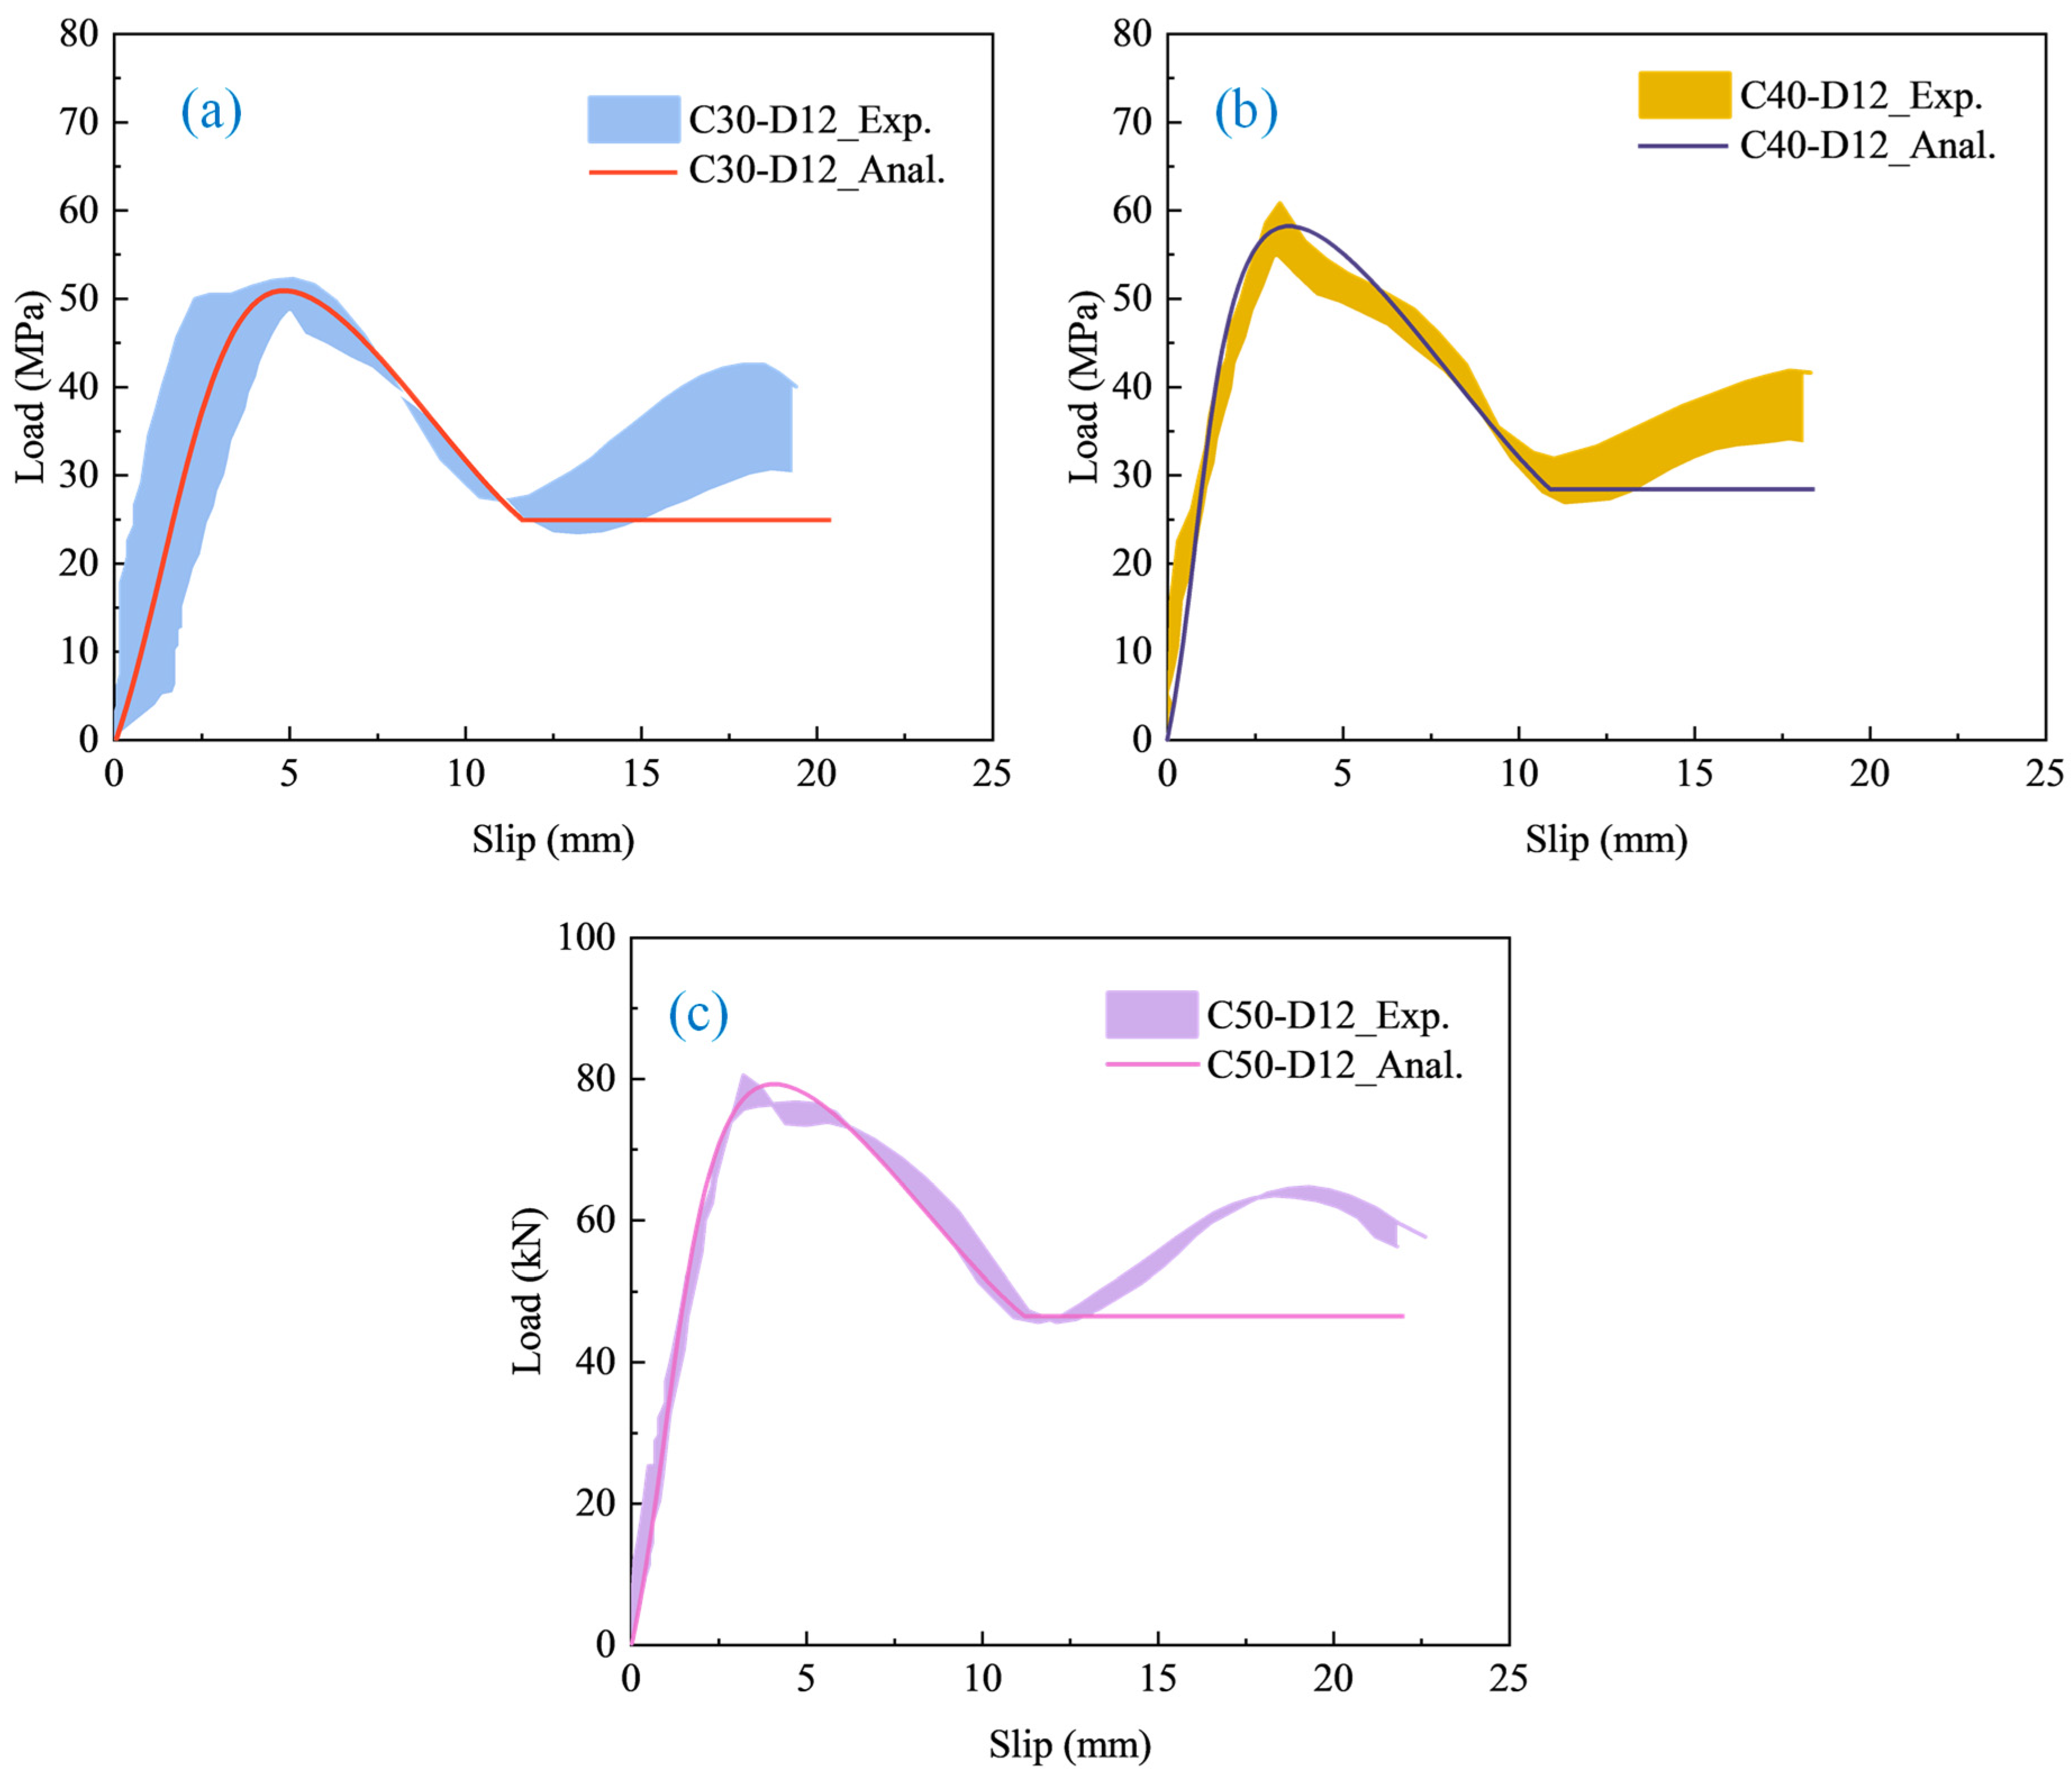
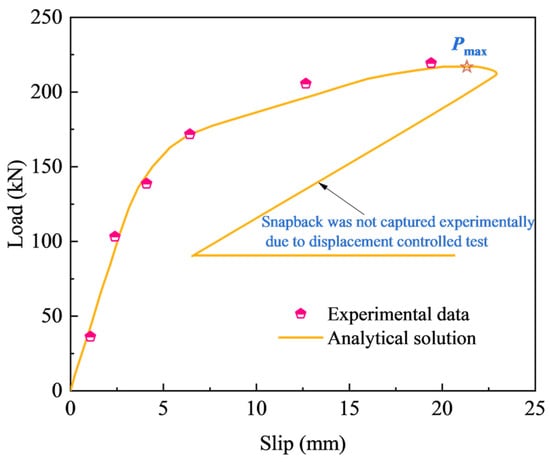
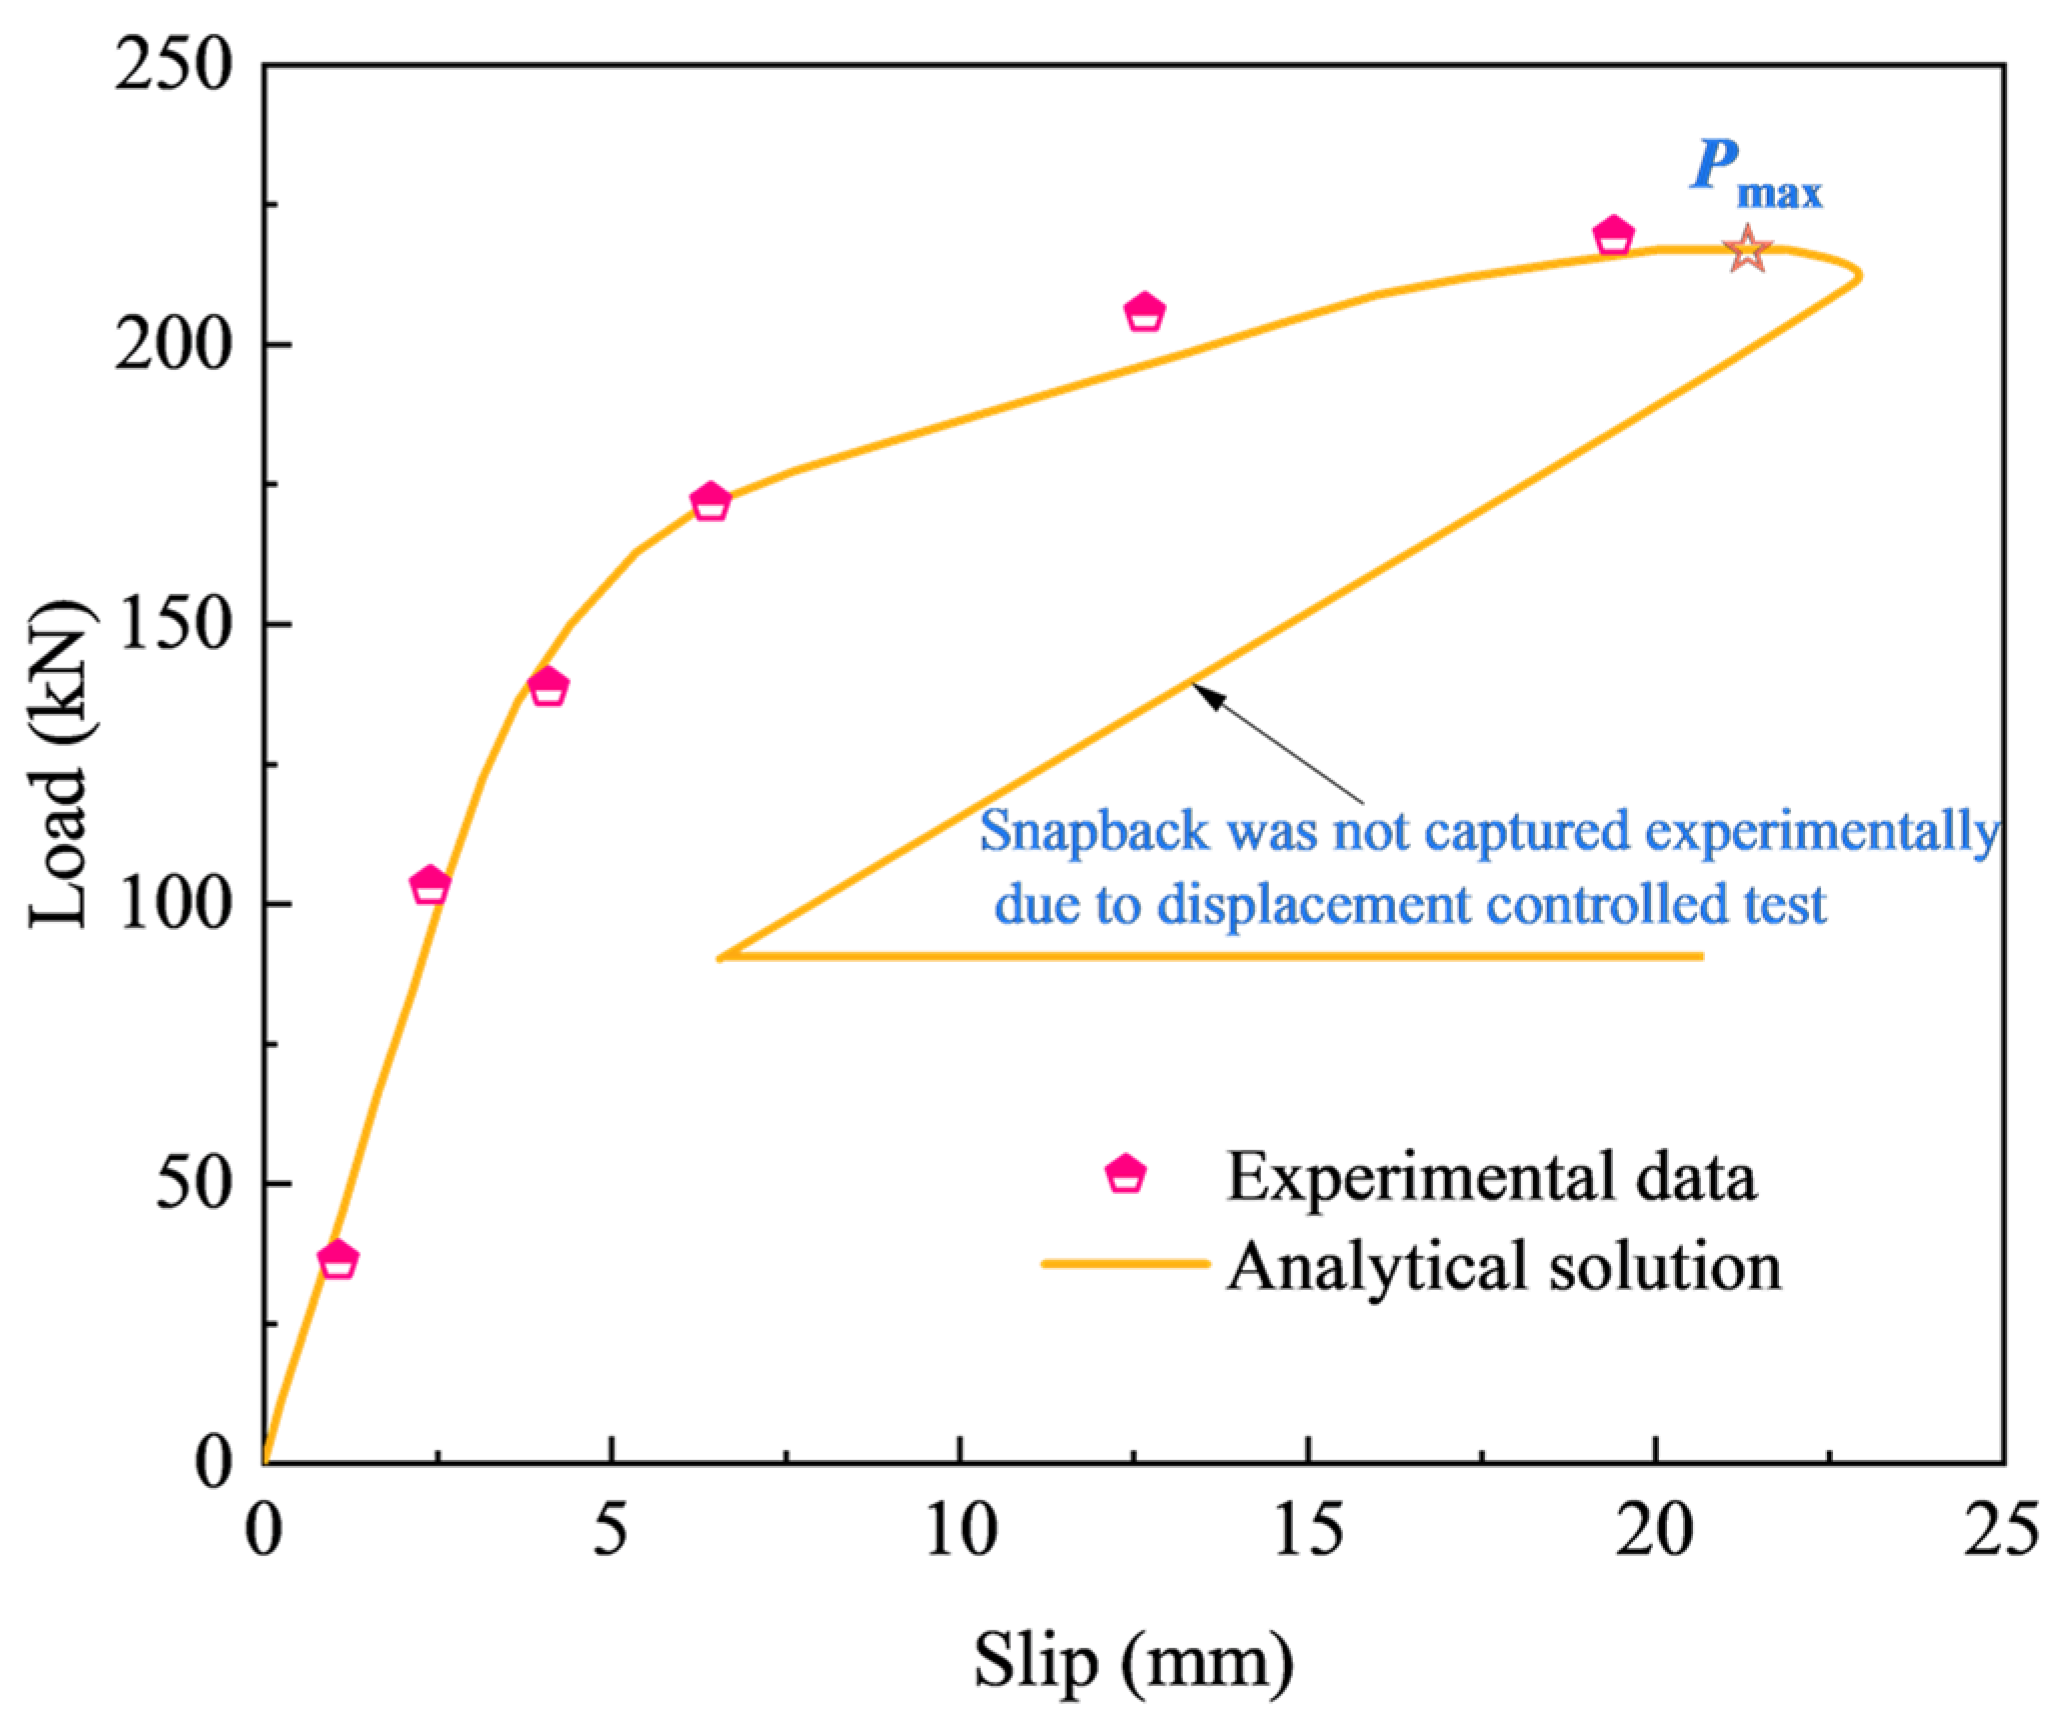
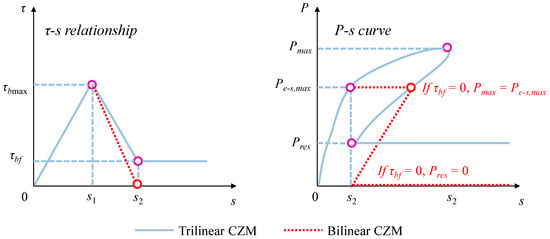
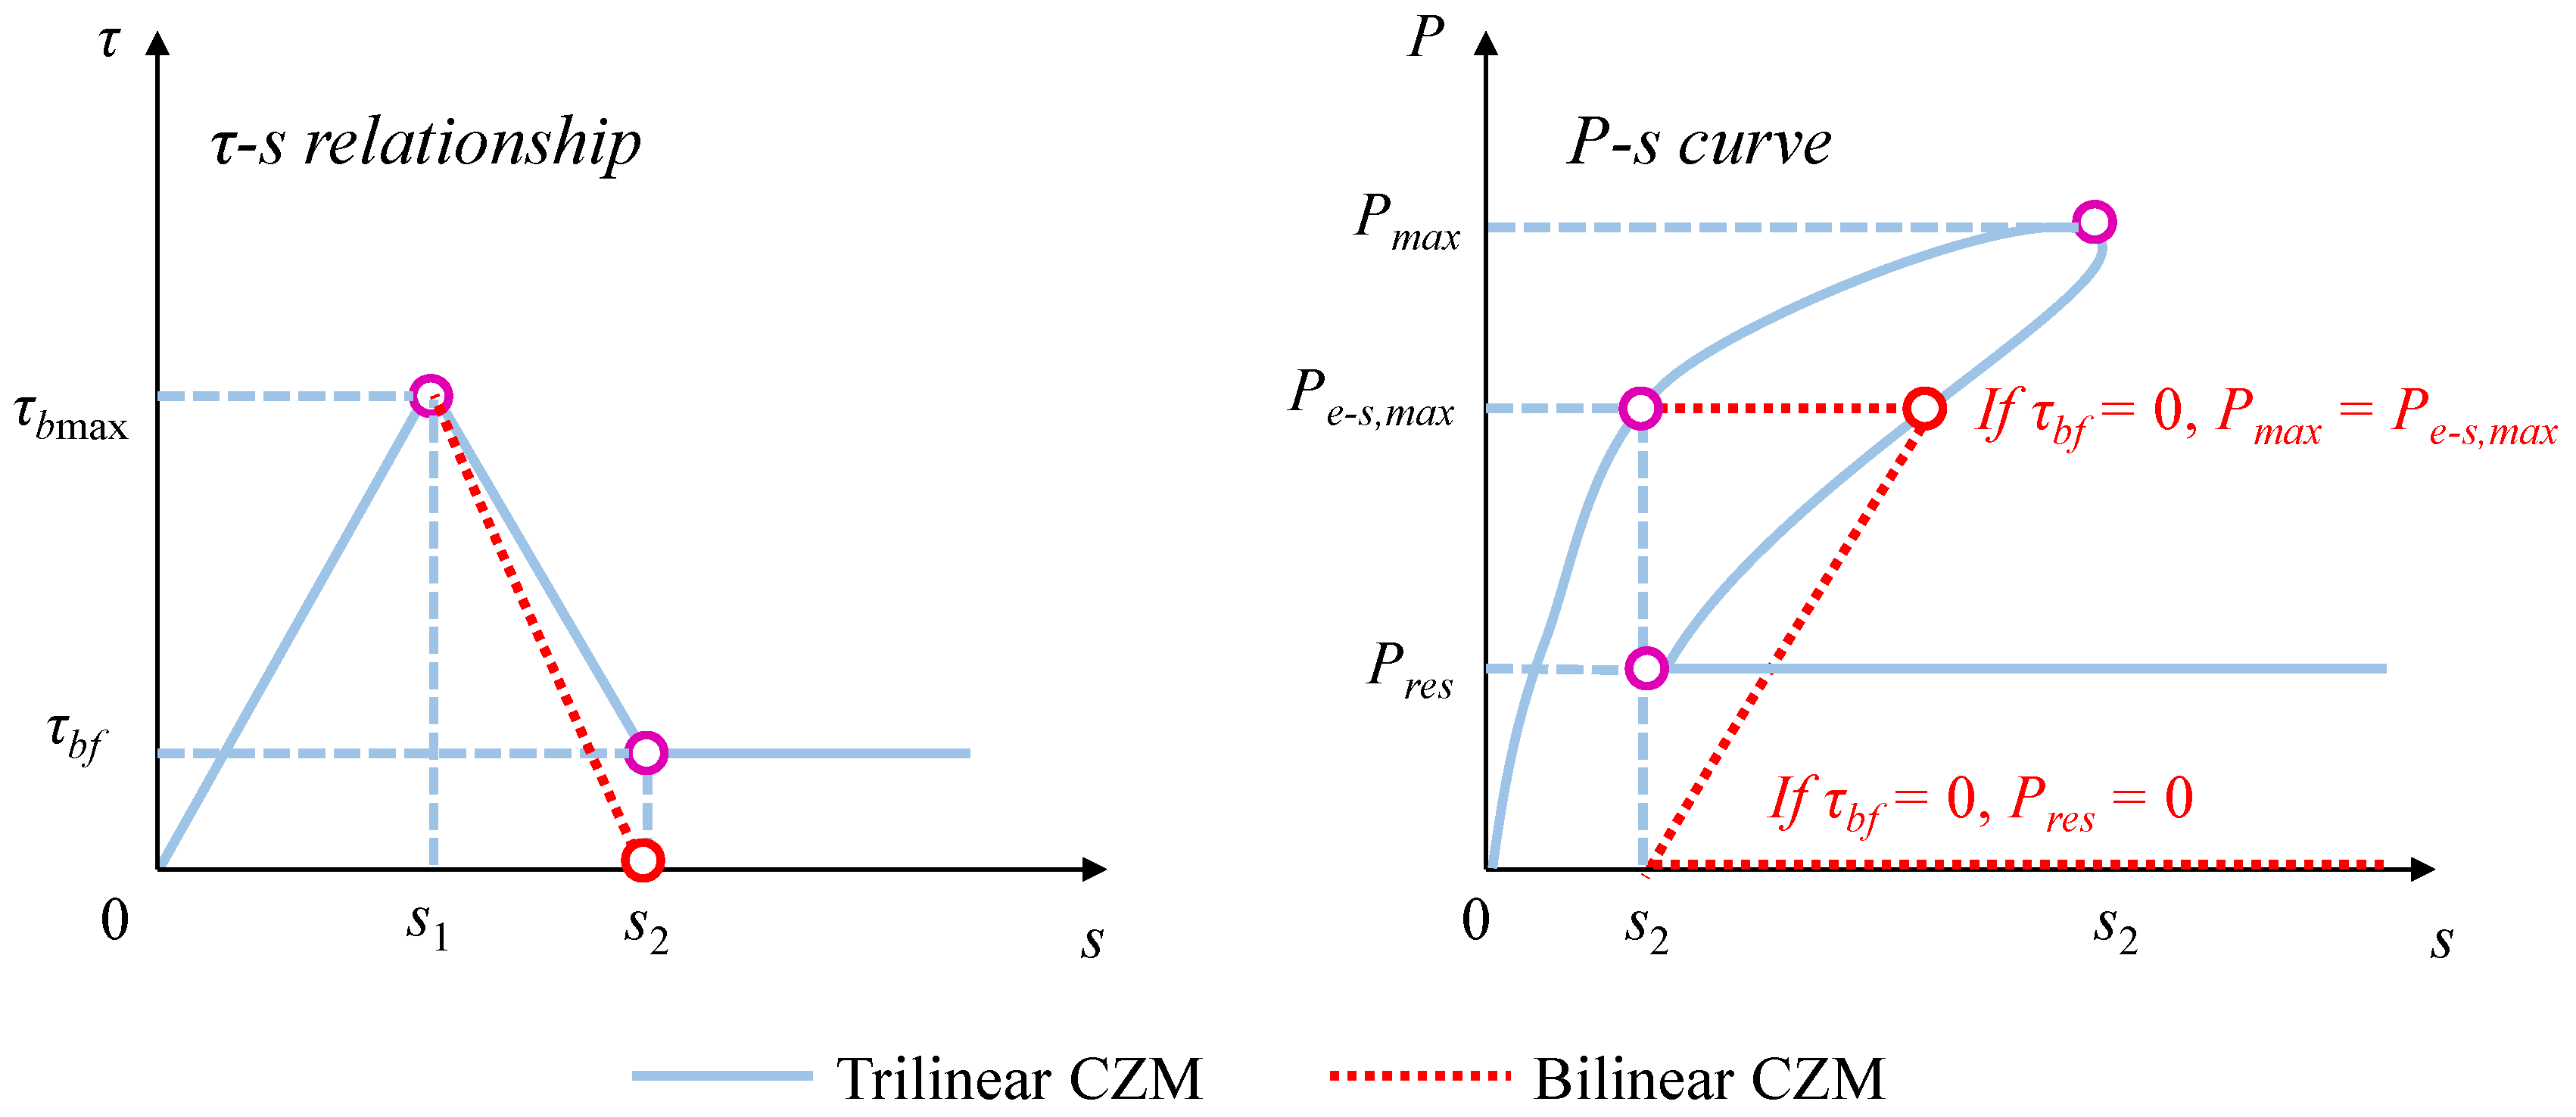

Disclaimer/Publisher’s Note: The statements, opinions and data contained in all publications are solely those of the individual author(s) and contributor(s) and not of MDPI and/or the editor(s). MDPI and/or the editor(s) disclaim responsibility for any injury to people or property resulting from any ideas, methods, instructions or products referred to in the content. |
© 2025 by the authors. Licensee MDPI, Basel, Switzerland. This article is an open access article distributed under the terms and conditions of the Creative Commons Attribution (CC BY) license.