Article

From Microstructure to Mechanical Performance: Characterization of Similar and Dissimilar Welds in Cast, Wrought, and LPBF Aluminum Alloys


1
Department of Mechanical and Industrial Engineering, University of Brescia, via Branze 38, 25123 Brescia, BS, Italy
2
Streparava SpA, Via Zocco 13, 25030 Adro, BS, Italy
*
Author to whom correspondence should be addressed.
Metals 2026, 16(9), 1046; https://doi.org/10.3390/met16091046 (registering DOI)
Submission received: 27 July 2026 / Revised: 14 September 2026 / Accepted: 17 September 2026 / Published: 20 September 2026
(This article belongs to the Special Issue Light Metals for Automotive Applications)

Abstract

Hybrid lightweight structures increasingly combine cast, wrought, and additively manufactured aluminum alloys, but the mechanical response of their welded joints remains strongly material-dependent. In this study, cast EN AC-42100-T6, wrought EN AW-6082-T6, and laser powder bed fusion (LPBF) AlSi10Mg stress-relieved plates were welded in 4 and 8 mm configurations using cold metal transfer and pulsed multi-control processes over two campaigns. Weld defects, microstructure, hardness profiles, and tensile properties were analyzed using a framework combining a hardness derived local yield-stress descriptor (σy,loc), a cumulative hardness deficit (IDHV), and a porosity increment metric (ΔP). The second campaign eliminated fusion and penetration related defects, but did not mitigate fusion zone porosity in LPBF-related joints, which reached 13.7% in the 8 mm LPBF–Cast joint. Hardness analysis showed the widest hardness-affected region in the wrought alloy, an intermediate response in the cast alloy, and localized alteration in LPBF. Tensile results identified three degradation modes: strength loss associated with heat-affected zone (HAZ) softening in wrought-containing joints, ductility limitation associated with the initial cast condition, and porosity-associated ductility loss in LPBF-related joints. The lower yield strength reduction in LPBF-related joints does not imply improved performance, as fracture remains strongly influenced by fusion zone porosity. The results support material specific mitigation and design strategies for hybrid welded aluminum structures.

1. Introduction

The transportation sector is one of the largest contributors to global greenhouse gas emissions, with road vehicles accounting for more than 70% in terms of CO2 emissions within the sector [1,2]. To address this critical issue, the development of lighter vehicles has steadily increased in all key markets over the last several years [3,4]. The adoption of lightweight materials reduces the energy demand during the vehicle operation, leading to a significant reduction in fuel or energy consumption, emissions, lifecycle CO2 output, and improved vehicle performance [5,6,7,8]. These advantages are especially pertinent for electric vehicles, where the high battery weight must be compensated [9,10].
In the context of automotive lightweighting, aluminum alloys play a key role and are widely used in both cast and wrought forms. The most common include cast EN AC-42100 (AlSi7Mg0.3) and wrought EN AW-6082, generally subjected to T6 heat treatment to enhance their mechanical properties [11]. In addition, additive manufacturing (AM) is an emerging technology that enables the production of highly complex geometries not achievable with conventional techniques. However, limitations related to production volume, cost, and productivity still hinder its large-scale adoption. Nevertheless, recent developments demonstrate its feasibility, such as the production of high-performance components (e.g., racing connecting rods) [12]. The limitations of laser powder bed fusion (LPBF), such as size constraints, high costs, and low productivity, can be mitigated by joining LPBF components with conventionally manufactured parts, enabling the effective exploitation of AM advantages. In this context, the most widely used aluminum alloy in AM is AlSi10Mg, and the most widely adopted process is LPBF, which enables the combination of tailored material properties with advanced strategies such as topology optimization [6,13,14,15,16].
Due to the variability in structural requirements and vehicle architectures, many large-scale components consist of welded assemblies made from different aluminum alloys produced through various processes. This approach enables weight reduction, geometric optimization, and tailoring of mechanical properties by combining different alloys and processes in different regions of the system. However, welding of aluminum alloys presents significant challenges, mainly due to the strong affinity of aluminum for oxygen, which promotes the rapid formation of a stable aluminum oxide (Al2O3) layer, as well as its high thermal conductivity and thermal expansion coefficient [17]. These characteristics promote defect formation during welding processes, including gas porosity, hot cracking, oxide inclusions, lack of fusion, and reduced strength in both the weld metal and the heat-affected zone (HAZ) [18,19,20,21,22,23,24]. These challenges are critical in safety-relevant applications, especially when both similar and dissimilar joints are involved [25,26,27].
Although prior work exists on dissimilar joints between cast and wrought aluminum alloys, the available literature remains limited for fusion welding of LPBF-produced components, particularly for dissimilar joints between conventionally manufactured and LPBF parts [28,29,30,31,32,33]. Notwithstanding the increasing interest in AM technologies, there is still a substantial lack of understanding of their integration through fusion welding techniques such as metal-arc inert gas (MIG), cold metal transfer (CMT), laser welding, and electron beam welding [31,33,34,35,36,37,38,39]. Among the few studies that have been conducted on dissimilar welds with LPBF, Emmelmann & Beckmann [34] reported high pore density in laser-welded AlSi10Mg (AM–Cast), with pore sizes up to 900 μm. Similar results were reported by Cui et al. [40] for CMT welding of LPBF AlSi10Mg, showing reduced tensile strength and ductility due to porosity. Moeini et al. [35] studied electron beam welding of AlSi10Mg plates produced via LPBF and casting (8 mm thickness), reporting high porosity and reduced fatigue performance in both similar and dissimilar combinations. Vishwakarma et al. [36] reported that dissimilar laser welds (LPBF AlSi10Mg–EN AW-6061) exhibited better properties than similar joints, although the strength of joints remained lower than that of the base materials, and the heat treatment of the weldment resulted in increased hardness in the fusion zone due to increased Mg content and formation of Mg2Si precipitates. Nunes et al. [37] investigated the influence of filler metal, gas shielding, and laser cleaning on CMT welds of 3 mm thick plates produced in LPBF AlSi10Mg, wrought EN-AW5083, and directed energy-deposition arc (DED-Arc) ER5183. They revealed that LPBF components exhibited higher porosity than DED-Arc parts, mainly due to powder oxidation. The use of ER 5356 (AlMg5Cr) filler wire together with pure argon shielding enhanced weld quality, while laser cleaning proved effective in reducing oxide layers and porosity. More broadly, recent studies on wire arc additive manufacturing based on CMT have further highlighted the importance of heat input control, deposition strategy, and interfacial stability when joining or depositing dissimilar metallic materials [41,42].
The purpose of this study is to systematically evaluate the joint quality of aluminum welded plates with different thicknesses produced using cast, wrought, and LPBF alloys. The study is part of a broader applied research project aimed at the development of a modular automotive system composed of multiple joined structural parts for chassis applications. Welded dissimilar aluminum structures are widely used in this class of automotive systems (i.e., subframes). In this context, the use of different aluminum alloys and manufacturing routes is motivated by the need to meet different requirements in terms of component geometry, stiffness, strength, weight, and production feasibility within the same structural assembly. The plate-level welding trials investigated here provide a preliminary basis for identifying critical material combinations and weld-induced degradation mechanisms before transferring optimized welding procedures to real prototype components. Specifically, 4 mm and 8 mm thick plates of EN AC-42100-T6 (cast), EN AW-6082-T6 (wrought), and AlSi10Mg-stress relieved (SR) (LPBF) were welded in both similar and dissimilar configurations, using CMT and Pulsed Multi-Control (PMC) technologies. The work compares three manufacturing routes within the same welding framework, including dissimilar combinations relevant to hybrid automotive structures, and combines defect analysis, microstructural characterization, hardness profiling, and tensile testing. In addition, a hardness-derived approach based on a local yield-stress descriptor (σy,loc) and a cumulative hardness deficit parameter (IDHV) is used together with a porosity-increment metric (ΔP) to relate local softening, weld-induced defect formation, and global mechanical response. This combined framework enables the identification of distinct material-dependent degradation modes and provides quantitative indications of direct relevance for the design of hybrid welded aluminum structures.

2. Materials and Methods

2.1. Materials, Design of the Joint, and Weld Production

The base materials investigated in this study were EN AW-6082-T6 wrought aluminum alloy, EN AC-42100-T6 cast aluminum alloy, and stress-relieved AlSi10Mg produced by laser powder bed fusion (LPBF). The cast plates were machined from industrial EN AC-42100-T6 low-pressure die-cast (LPDC) components, whereas the EN AW-6082-T6 plates were obtained from rolled sheet strips and subsequently blanked into the final plate geometry. The LPBF plates were produced using a Renishaw RenAM 500Q (Renishaw plc, Wotton-under-Edge, Gloucestershire, UK) system from inert-gas-atomized spherical AlSi10Mg powder (Renishaw plc, Wotton-under-Edge, Gloucestershire, UK) with a particle size distribution ranging from 20 μm to 63 μm. Rectangular plates measuring 200 mm × 150 mm, with thicknesses of 4 mm and 8 mm, were employed. The plate dimensions were determined in accordance with UNI EN ISO 15614-2 [43] to guarantee standardized specimen geometry and comparability across the examined welding conditions. The two selected plate thicknesses allow, according to the same standard, the qualification of a wider thickness range representative of real automotive assemblies and spanning from 2 mm to 16 mm. Similar and dissimilar combinations of the three materials were investigated at both thicknesses, as summarized in Table 1. The joints were designed as full-penetration butt joints. For the 8 mm configurations, the plate edges were beveled with a V-groove to promote full penetration.
The welding process utilized ER4043 (AlSi5) filler metal (DAIKO S.r.l., San Biagio di Callalta, Italy) with a wire diameter of 1.2 mm for all investigated configurations. Table 2 presents the chemical compositions of the base materials and filler wire.
The LPBF process was conducted under an inert atmosphere with argon gas purging, and the deposition parameters are listed in Table 3. All LPBF process parameters were kept constant to ensure consistent material properties across all samples. To provide a compact descriptor of laser energy input during LPBF, the volumetric energy density (VED) was calculated as:
VED = P u · h · d J mm 3
where P is the laser power in W, u is the scan speed in mm/s, h is the hatch distance in μm, and d is the layer thickness in μm. The selected LPBF parameters correspond to a VED of approximately 37 J/mm3, which falls within the commonly reported process windows for producing high-density LPBF AlSi10Mg [44,45]. However, VED is employed here as a comparative descriptor rather than a predictive parameter, since different parameter combinations may yield similar VED values yet different defect populations. Following the LPBF process, a stress-relief heat treatment was performed at 275 °C with a holding time of 120 min under an argon atmosphere, followed by air cooling. Subsequently, the plates were extracted from the build plate using electrical discharge machining and subjected to sandblasting at a pressure of 6 bar.
All joints were produced through manual welding using a Fronius TPS 500i (Fronius International GmbH, Pettenbach, Austria) power source. CMT and PMC are controlled variants of the gas metal arc welding (GMAW) process employing different metal-transfer strategies. In CMT, short-circuit metal transfer is controlled through synchronized current modulation and wire retraction, whereas PMC operates in a pulsed-arc mode with controlled pulse characteristics to stabilize arc behavior and penetration. Accordingly, CMT was employed for the 4 mm plates, whereas PMC was selected for the 8 mm plates to provide the penetration required under the investigated welding conditions [46,47]. It should be noted that, in the present experimental matrix, plate thickness and welding process mode are coupled, since 4 mm joints were welded using CMT whereas 8 mm joints were welded using PMC. Therefore, the individual effects of thickness and process mode cannot be fully separated. Comparisons between 4 mm and 8 mm joints are consequently interpreted as comparisons between two process configurations rather than as isolated thickness effects.
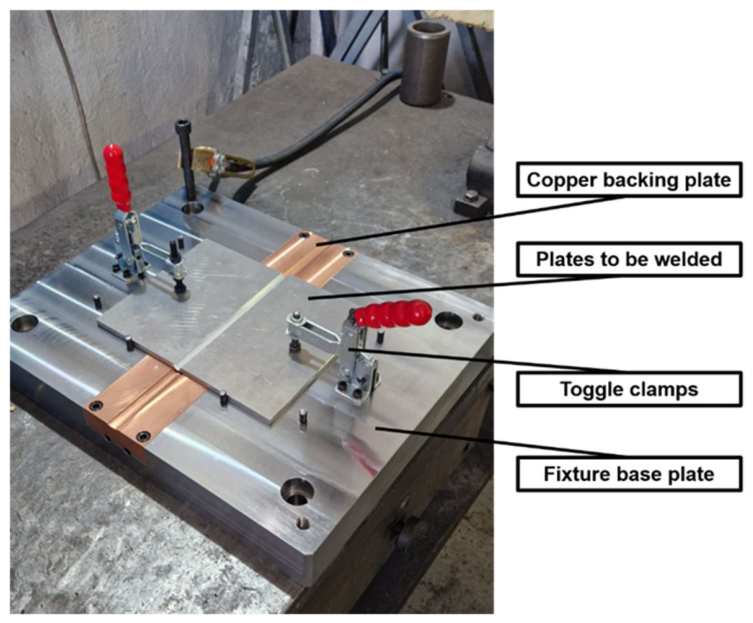
Figure 1 shows the plate positioning and fixturing arrangement used during the 2nd welding campaign. The photograph identifies the copper backing support, toggle clamps, fixture base plate, and the two plates positioned prior to welding.
Throughout each welding operation, the power source recorded the following parameters: arc-on time, welding current, arc voltage, average wire feed speed, average power, and the total energy delivered to the joint. Furthermore, the average welding speed (v) and the nominal heat input per unit length (Q) were calculated as derived parameters and used to support the process analysis. The values adopted for each welding condition are summarized in Table 4. The average welding speed was calculated as follows:
v = L t mm s
where L is the weld bead length and t is the arc-on time.
The nominal heat input per unit length was calculated according to [30,48,49,50]:
Q = U · I v · η J mm
where the arc voltage (U), the welding current (I), the average welding speed (v), and the heat transfer efficiency (η) are related. A constant heat transfer efficiency η = 0.8 was assumed for the CMT and PMC processes, in accordance with literature values [51,52,53], and was held constant across all welding conditions to enable a consistent comparison of heat input. Although process efficiency may vary with welding parameters, a constant value was adopted to ensure a uniform basis for comparing the investigated conditions.
The same set of joint configurations was adopted for two welding campaigns (1st and 2nd). The main differences between the 1st and 2nd campaigns included reduced welding speed, increased nominal heat input, the use of a copper backing support, and the adoption of a two-pass strategy for the 8 mm cast- and wrought-related joints. Process conditions were adjusted in the 2nd campaign based on the outcomes of the 1st campaign, with the aim of mitigating the lack of fusion, lack of penetration, and incomplete filling observed in the 1st campaign. Specifically, the 2nd campaign employed a copper backing plate, and selected 8 mm joints comprising wrought and cast alloys were produced using a two-pass procedure.
It is worth noting that the experimental activity was not designed as a Design of Experiments aimed at isolating and quantifying the contribution of individual welding variables, but rather as an engineering screening aimed at identifying workable parameter combinations under the investigated material and thickness conditions. Since several process modifications were introduced simultaneously, their individual contributions cannot be isolated from the present experimental design. Therefore, the comparison between the 1st and 2nd welding campaigns is interpreted in terms of the overall revised welding procedure rather than as the effect of a single process parameter.
Following welding, all joints were subjected to non-destructive testing (NDT), specifically visual testing in accordance with ISO 17637 [54], radiographic testing according to ISO 17636 [55], and liquid penetrant testing in conformity with EN 571-1 [56].
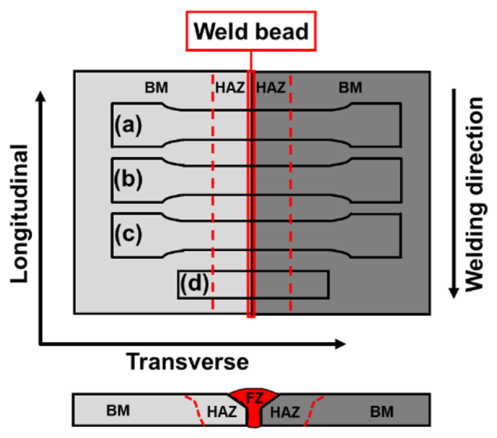
For each welding condition, three welded joints were produced and subjected to NDT. Subsequent metallographic, porosity, and hardness characterization was performed on one transverse cross-section extracted from one joint that met the applicable NDT acceptance criteria. Accordingly, porosity, HV0.3, and HRF results are descriptive of the selected accepted joint and do not provide an estimate of joint-to-joint variability. For welded joints produced in the 2nd campaign, three transverse tensile specimens were extracted from the accepted joint, as schematically shown in Figure 2.
All tensile specimens were extracted transversely to the welding direction to ensure that the fusion zone (FZ), heat-affected zones (HAZs), and base materials (BMs) were fully included within the gauge length. Tensile testing on welded joints was conducted only for the 2nd welding campaign, whereas the 1st campaign was focused on metallurgical and defect analysis, as well as hardness measurements.

2.2. Macro- and Microstructural Characterization

Metallographic examinations were conducted to characterize the weld morphology and the microstructure of the different joints. For each joint, one transverse cross-section sample was extracted perpendicular to the welding direction (see Figure 2d) and prepared using standard metallographic procedures: grinding with SiC papers from 80 to 4000 grit, followed by polishing using a 1 μm diamond suspension.
Thereafter, the samples were etched using SAPA reagent (70.8% HNO3 + 26.8% HCl + 2.4% HF) to reveal the macrostructure and enable microstructural observations in regions of interest, namely the BM, HAZ, partially melted zone (PMZ), and FZ. PMZ width was estimated metallographically from 5 local measurements for each material on etched cross-sections from two dissimilar joints. The order of magnitude of these measurements was qualitatively checked against the other examined cross-sections. Since no systematic multi-section measurement campaign was performed, the resulting width ranges are considered indicative rather than statistically representative. The macro- and microstructure of the etched samples were analyzed using a Leica DMI 5000 M (Leica Microsystems GmbH, Wetzlar, Germany) optical microscope (OM).
A statistical analysis of porosity was performed on optical micrographs using Leica Application Suite image analysis software (Leica Microsystems GmbH, Wetzlar, Germany). The porosity analysis was performed on the same transverse cross-section used for metallographic characterization. All micrographs used for porosity analysis were acquired at 50× magnification, corresponding to a field of view of approximately 1.88 mm × 1.41 mm, i.e., 2.64 mm2 per image. The FZ porosity was quantified by analyzing six micrographs for each FZ region. Three FZ regions were considered for all joints, namely the left side, center, and right side, corresponding to a total analyzed FZ area ranging from 47.5 mm2 to 63.3 mm2 per joint. The BM porosity was measured on both plates of each joint. For each BM plate, ten micrographs were analyzed, corresponding to an analyzed area of approximately 26.4 mm2 per plate. Pore area fraction was determined by grey-level histogram segmentation, separating pores from the metal matrix. The segmentation threshold was verified visually by comparing the segmented images with the corresponding original micrographs to avoid misclassification of polishing artefacts or etched microstructural features as pores. The pore area fraction was determined by image segmentation, and the equivalent pore diameter (Deq) was calculated from the area of the pores as follows:
D eq = 4 A p o r e π   [ μ m ]
where Apore is the pore area.
To relate FZ porosity to the initial BM condition, BM porosity was measured on both plates for each joint. This approach was adopted to account for the intrinsic porosity of the base metals (BMs), which could be particularly relevant for cast and LPBF-produced components. Consequently, a porosity increment metric was defined as:
P = P F Z m a x ( P B M , L ,   P B M , R )
where PFZ is the percentage porosity measured in the FZ and PBM,L, PBM,R are the BM percentage porosity values measured on left and right plates, respectively. The use of the maximum BM porosity as a reference provides a conservative baseline, since it provides the lowest estimate of the porosity increment relative to the initial defect population of the two BMs. Accordingly, ΔP is used as a comparative descriptor accounting for the initial BM porosity rather than as a direct quantitative measure of the porosity generated exclusively by the welding process. A sensitivity analysis performed using the mean and minimum BM porosity as alternative reference values showed that, although the numerical magnitude of ΔP can vary with the selected baseline, the principal ranking trends and the identification of the LPBF-related configurations exhibiting the highest porosity increments remained substantially stable.

2.3. Mechanical Characterization

The mechanical characterization was designed to correlate local microstructural features with global mechanical performance of the welded joints.

2.3.1. Hardness Test

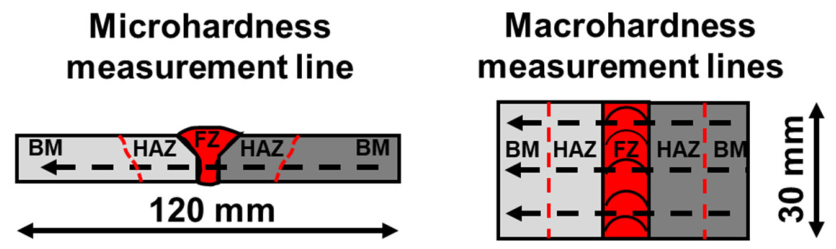
Hardness measurements were performed on the same samples used for metallurgical characterization. This was aimed at evaluating the influence of microstructural changes throughout the weld in the regions of interest. Vickers microhardness (HV0.3) was measured on the transverse cross-sections of the samples using a Mitutoyo HM-200 (Mitutoyo Corporation, Kawasaki, Kanagawa, Japan) hardness testing machine under a 2.94 N (0.3 kgf) load with a dwell time of 15 s according to ASTM E92-16 [57]. For each joint, results are presented as measurements from BM to BM along a center line with at least 60 indentations and a minimum indent spacing of 500 μm. Since one HV0.3 centerline profile was acquired from the selected transverse cross-section for each welding condition, the hardness data describe the local hardness evolution across the selected NDT-accepted joint and do not provide an estimate of joint-to-joint variability. This measurement strategy was adopted to capture the hardness gradient across the weld metal, HAZ, and BMs. For the hardness-based regional analysis, the extent conventionally reported as the HAZ width was evaluated from the fusion boundary to the BM hardness plateau. The region extending from the fusion boundary to the local hardness minimum was defined as the near-fusion boundary region (NFBR), comprising the PMZ and the adjacent portion of the HAZ exposed to the highest peak temperatures. The remaining region between the hardness minimum and the BM plateau was defined as the outer HAZ. For the regional analysis, standard deviations were calculated from the individual HV0.3 indentations falling within each defined weld region of the single centerline profile. Accordingly, these values describe within-profile spatial variability and do not represent specimen-to-specimen or joint-to-joint variability. The number of indentations falling within each region therefore depended on its width and varied with material and joint configuration. In the FZ, 13–27 indentations were included, with a mean of 20. The overall HAZ comprised approximately 10 indentations on the LPBF side, 32 on the cast side, and 40 on the wrought side. In the BM, the number ranged from 7 to 45 indentations per side, with a mean of 23.
In addition, Rockwell macrohardness (scale F, HRF) measurements were conducted on the top surface of the samples using a Rockwell Rupac 500Mra (Rupac S.r.l., Milan, Italy) hardness testing machine under a 588 N (60 kgf) load applied for 15 s with a 1.58 mm diameter steel ball indenter following ASTM E18-03 [58]. These measurements were performed only on joints produced in the 1st welding campaign. For each joint, results are presented as measurements from BM to BM along three lines with at least 15 indentations and a minimum indent spacing of 3 mm. Figure 3 schematically depicts the chosen measurement paths.
To quantify both the severity and spatial extent of hardness reduction across the weld, a hardness deficit parameter, IDHV, was calculated from the HV0.3 profiles. For each side of the joint, IDHV was defined as the summation of the positive difference between the corresponding BM hardness, HVBM, and the measured local hardness values along the softened region:
I D H V = i H V B M H V i x i
where HVi is the local hardness value, Δxi is the spacing between consecutive indentations, and only points satisfying HVi < 0.95HVBM were considered, in order to exclude the inherent scatter of HV0.3 measurements and the natural BM hardness variability while retaining all data points reflecting a meaningful softening contribution. The 0.95HVBM threshold was selected as a practical criterion to distinguish weld-induced softening from minor fluctuations around the BM hardness level. Similar 95% BM hardness criteria have been adopted in previous studies on welded aluminum alloys to identify the transition between thermally affected and unaffected material [59,60,61]. A sensitivity analysis using 0.90HVBM and 1.00HVBM as alternative thresholds showed that the principal IDHV ranking trends were preserved, with Spearman rank correlation coefficients of 1.000 and 0.993, respectively, for the 1st campaign and 0.993 and 1.000 for the 2nd campaign. Accordingly, the comparative interpretation of IDHV was not materially affected by the selected threshold. For dissimilar joints, the contribution from each side was calculated with respect to the corresponding HVBM and then summed to obtain the total hardness deficit of the joint. Therefore, IDHV provides a one-dimensional descriptor combining the depth and width of the softened region, and was used to correlate hardness-derived softening with tensile properties.
To provide a comparative descriptor of local strength gradients across the weld, the HV0.3 values were also converted into a hardness-derived local yield stress descriptor, σy,loc. The conversion was performed using a BM-calibrated hardness-to-yield factor, c, for each material class, according to [62,63]:
σ y , l o c = H V · 9.807 c
where HV is the local Vickers hardness and c is the calibration factor obtained from the corresponding BM as:
c = H V B M · 9.807 σ y , B M
where HVBM is the average BM hardness and σy,BM is the corresponding base-material yield strength from tensile testing. The hardness-to-strength relationship is not universal and depends on the material microstructure and strain-hardening response [62,63]. Therefore, c was calibrated independently for each BM condition using the corresponding experimental HVBM and σy,BM values. Hardness and indentation-based estimates of the local strength descriptor have previously shown good agreement with local mechanical measurements in welded aluminum alloys when appropriately calibrated [64,65]. For similar joints, the corresponding BM-derived calibration factor was applied to the BM, HAZ, NFBR, and FZ regions. For dissimilar joints, the material specific calibration factor was applied separately to the BM, HAZ, and NFBRs on each side, whereas the arithmetic mean of the two side specific calibration factors was adopted for the shared FZ. This latter approximation should be interpreted with caution because the FZ results from mixing of the two BMs and the AlSi5 filler metal and exhibits a heterogeneous solidification microstructure for which no independent local tensile calibration was available. Therefore, σy,loc is used throughout this work only as a comparative hardness derived descriptor of local strength gradients rather than as a direct quantitative measurement of the true local yield stress.

2.3.2. Tensile Test

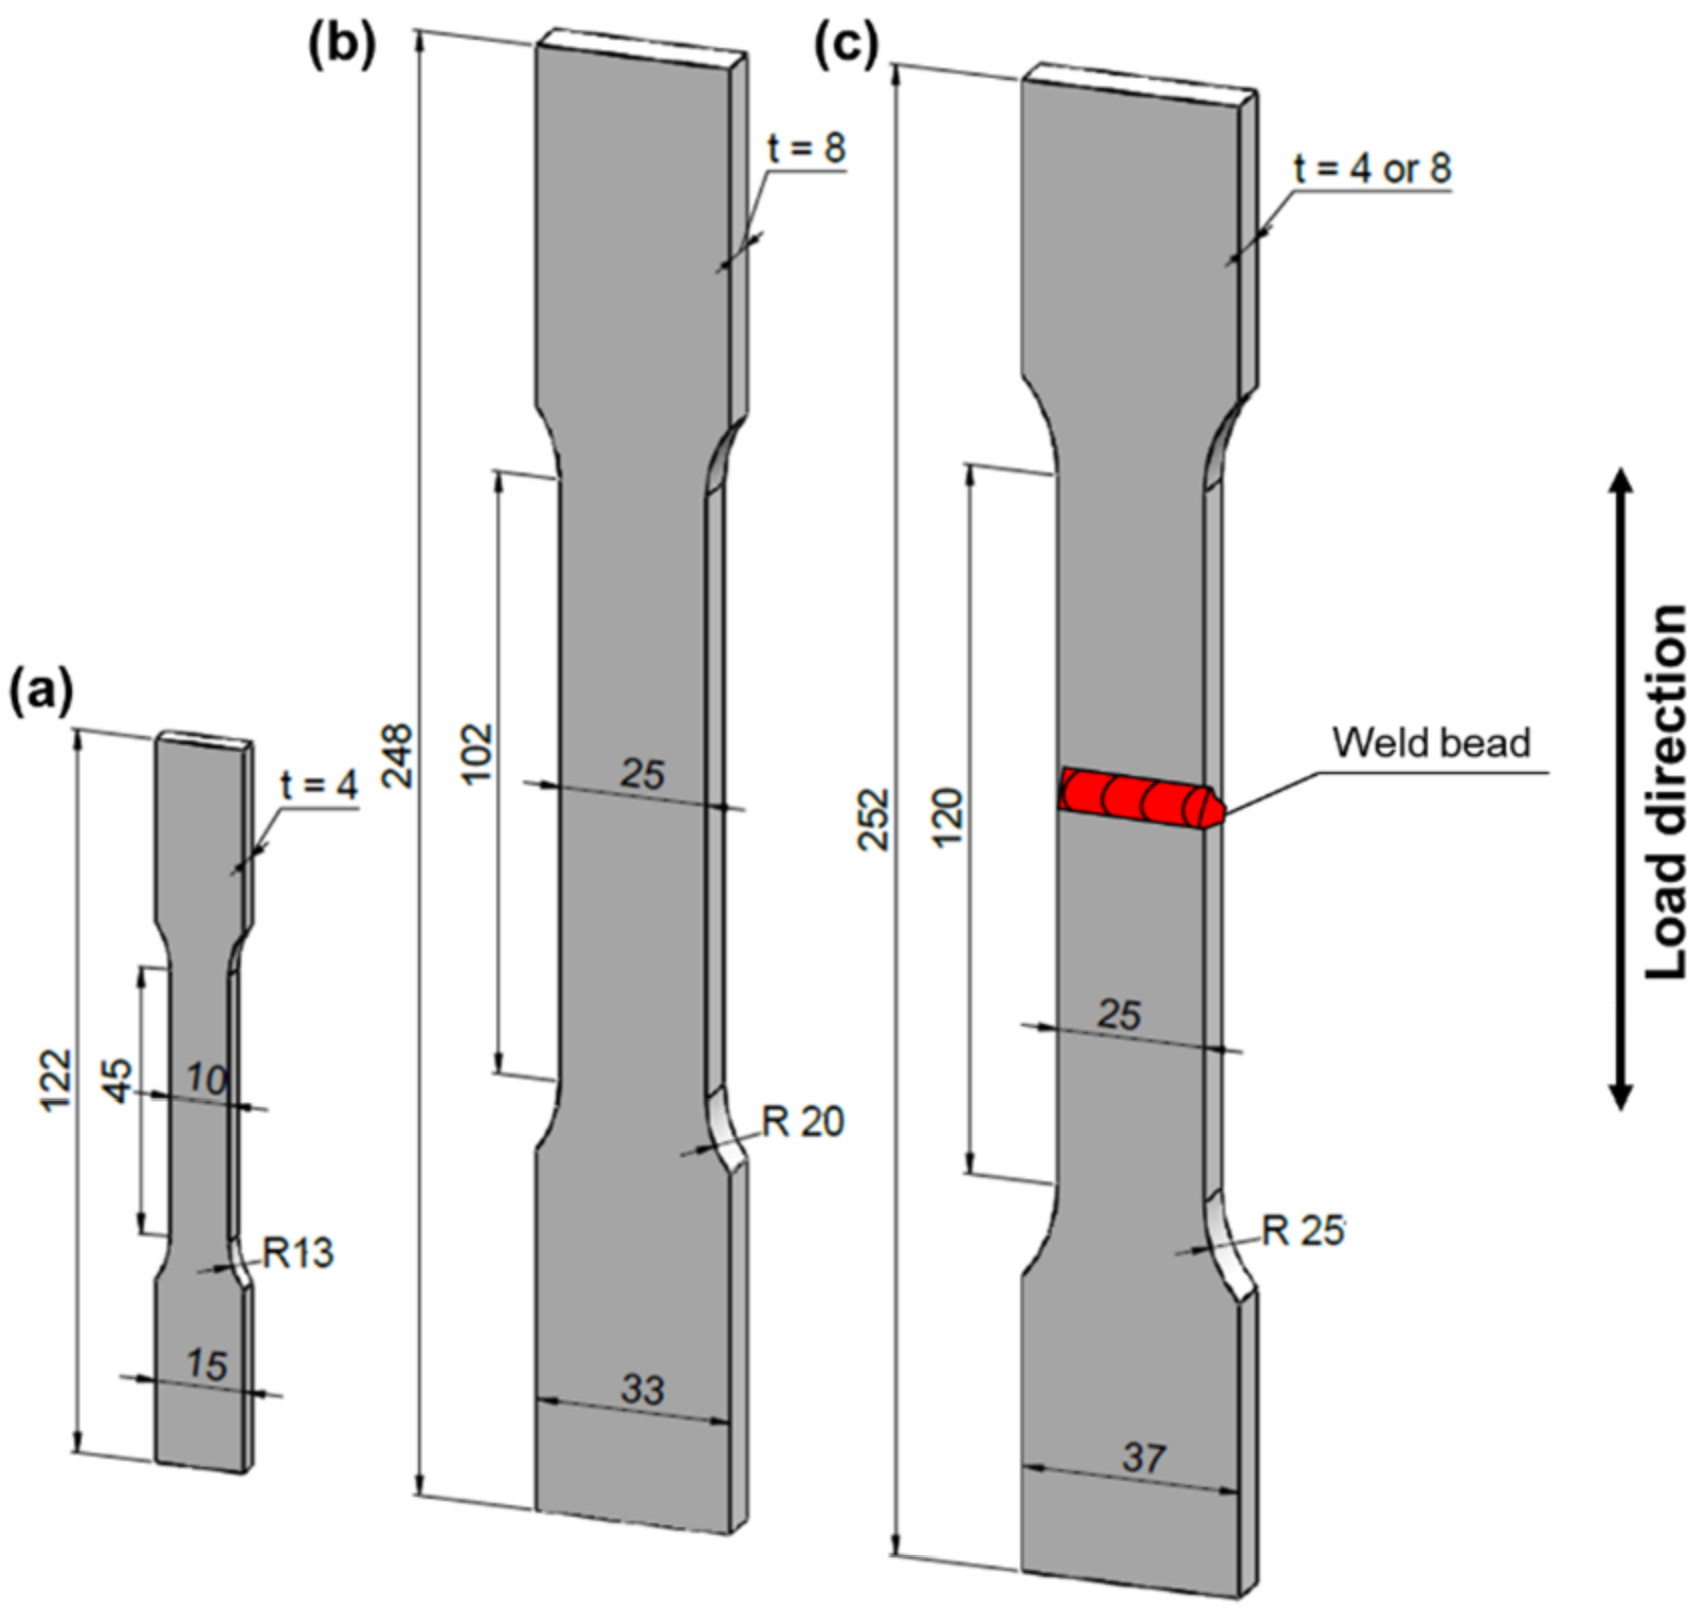
Uniaxial displacement-controlled tensile tests were conducted at room temperature on BMs and specimens from welded joints produced in the 2nd campaign to assess Young’s modulus (E), yield strength (σy), ultimate tensile strength (σR), and elongation at failure (A%). The tensile specimen geometries and nominal dimensions are reported in Figure 4. For the wrought and cast BMs, tensile specimens were machined from the corresponding plates.
LPBF BM tensile specimens were manufactured directly in their final shape (Figure 4a,b) in the same building job of the LPBF plates employed for welding to ensure a comparable processing history. Since all LPBF plates used for welding were built vertically, BM tensile specimens were produced in the same build orientation. For welded joints, transverse tensile specimens were machined across the weld (see Figure 2) in accordance with the geometry specified in ISO 4136 [66]. This configuration ensured that the FZ, HAZ, and BM of both sides were fully included within the gauge length. For the BMs, tensile tests were performed on at least three specimens for each available reference condition reported in Section 3.2.2. A separate 8 mm cast BM tensile reference was not separately measured because the cast plates of both investigated thicknesses were machined from the same industrial LPDC automotive component, whose wall thickness was larger than the investigated plate thicknesses. Therefore, the cast BM tensile properties reported in Section 3.2.2 were used as a common cast reference for both 4 mm and 8 mm cast-containing welded joints.
An electromechanical Instron 3369 (Instron, Norwood, MA, USA) testing machine equipped with a 50 kN load cell was used for the 4 mm specimens, whereas a servo-hydraulic testing machine equipped with a 100 kN load cell was used for the 8 mm specimens. In both cases, tests were carried out at a displacement rate of 2 mm/min following UNI EN ISO 6892–1:2009 [67]. The strain was measured using an extensometer.

3. Results and Discussion

3.1. Metallurgical Characterization

3.1.1. Defect Analysis

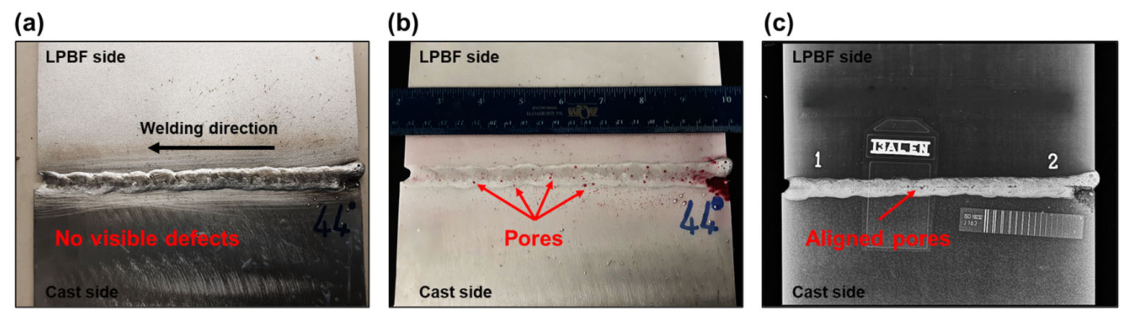
Figure 5 shows examples of the NDT performed after welding as a preliminary quality screening step. Subsequent characterizations were then performed only on samples and specimens extracted from joints that met the applicable acceptance criteria for the employed NDT methods (see Section 2.1).
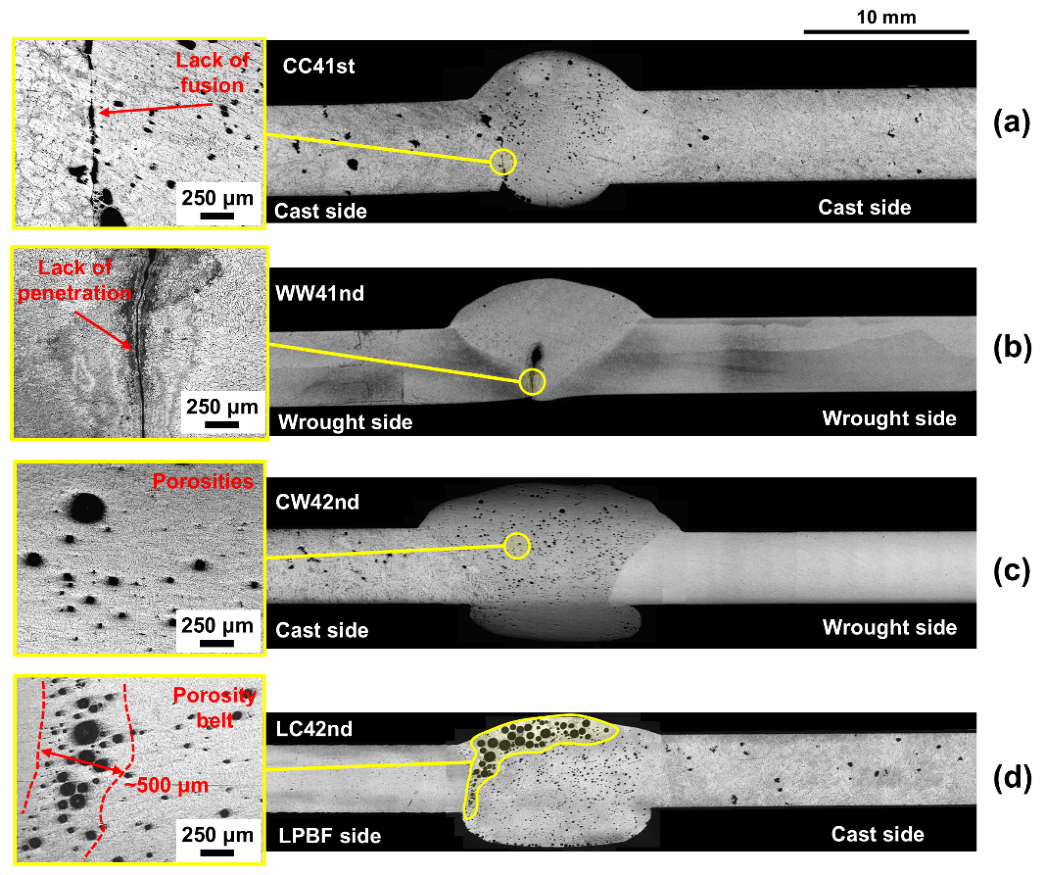
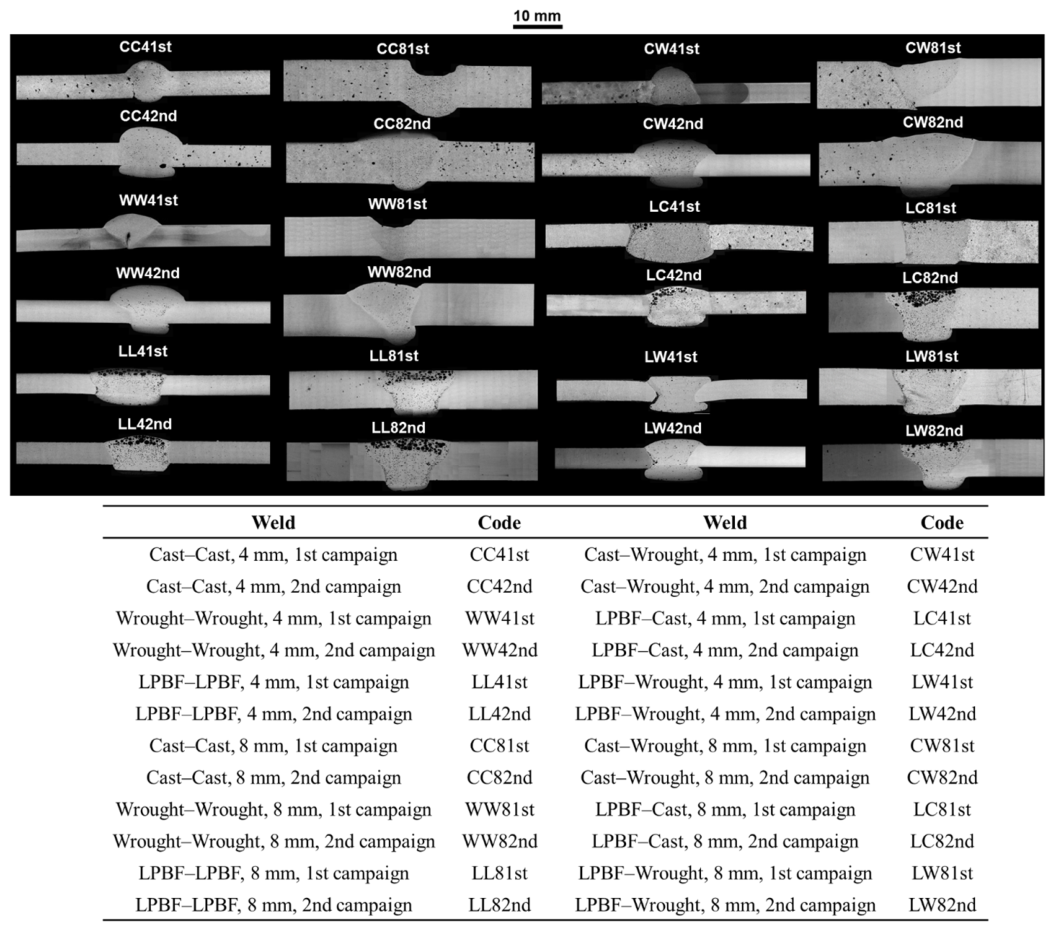
Figure 6 illustrates representative transverse macrosections of the investigated similar and dissimilar joints produced from cast, wrought, and LPBF plates with thicknesses of 4 mm and 8 mm in both 1st and 2nd campaigns. For clarity, acronym codes are used with material combination, joint thickness, and welding campaign listed in order. Preliminary analysis of the macroscopic bead morphologies indicates the presence of defects in the welded joints such as lack of fusion, lack of penetration, incomplete filling, and porosity. Selected examples are provided in Figure 7, where magnified views highlight the defect morphology.
In particular, joint CC41st (see Figure 7a) exhibits lack of root fusion, whereas joint WW41st (see Figure 7b) exhibits lack of root penetration.
Within the 1st campaign, inspection of the analyzed joints (based on NDT screening and macrosection examination) showed that lack of fusion indications were more frequently associated with Cast–Cast joints, while lack of penetration was primarily observed in Wrought–Wrought joints. In the 8 mm joints of the 1st campaign, excessive penetration associated with incomplete filling was also observed. This phenomenon was observed for CC81st and WW81st joints (see Figure 6) due to the absence of a backing support plate to limit the downward flow of material during the welding process. For the 8 mm ISO 4136 configurations, achieving full penetration was more sensitive to the BM combination, and the adopted welding parameters had to be adjusted accordingly, with the wrought alloy requiring higher Q or lower v values. These observations indicate that weldability depends on the combined effect of plate thickness, welding process mode, and BM combination, requiring distinct process windows to achieve acceptable joint geometry.
As shown in Table 4, the 2nd welding campaign was performed adopting lower v and higher Q compared with the 1st campaign, with the aim of mitigating lack of fusion, lack of penetration, and incomplete filling. In the 8 mm cast- and wrought-related joints, complete filling was achieved in the 2nd campaign as part of the revised welding procedure, which combined reduced welding speed, increased nominal heat input, copper backing support, and a two-pass strategy. Conversely, full penetration was achieved with a single pass procedure in both campaigns for LPBF joints under all the investigated combinations (refer to Figure 6). Moreover, no lack of fusion or lack of penetration indications were observed for all joints produced in the 2nd campaign. This comparison highlights a distinct trade-off: process conditions that are effective in eliminating fusion-related defects may not be optimal for controlling porosity, hence necessitating a multi-objective optimization of welding parameters.
Based on the macrosections in Figure 6, gas porosity in FZ (identified by essentially spherical cavities) represents the predominant defect across the investigated material combinations. As observed in Figure 7c, porosities were generally more uniformly distributed in the FZ of joints made with conventionally manufactured plates. In contrast, LPBF welds demonstrated increased porosity in the upper zone of the FZ, with diameters reaching up to 720 μm. Gas porosity formation can be interpreted in terms of pore nucleation caused by the hydrogen solubility gap between the liquid and solid phases, followed by growth through the Ostwald ripening mechanism [68,69,70,71]. In joints involving LPBF material, this mechanism can be further promoted by the powder-based manufacturing process and by the surface condition of the plates, which may favor oxide films, adsorbed moisture, and entrapped gas [72]. Since the same AlSi5 filler wire was used for joints, the specific effect of filler composition could not be assessed independently. Nevertheless, filler dilution varies with the BM combination and welding conditions and therefore remains part of the overall weld pool response [40]. Therefore, the higher porosity observed in LPBF related joints is interpreted as the result of the interaction between LPBF material condition, plate surface state, filler dilution, and welding thermal cycle. Furthermore, hydrogen bubbles may rise but can remain trapped within the melt pool due to limited escape time [73,74].
Despite the fact that the LPBF material was produced using process parameters corresponding to a typical VED (37 J/mm3), the observed porosity is not solely attributable to suboptimal LPBF processing conditions and may also reflect intrinsic LPBF-related defects and welding-induced pore formation and retention. Accordingly, the higher porosity observed in LPBF-related joints may be associated with the intrinsic defect population of LPBF materials, including entrapped gas and oxide-related discontinuities, which can act as preferential sites for pore nucleation and growth during welding.
Another feature observed in LPBF welds is the presence of a porosity belt on the LPBF side of the joint (see Figure 7d). The formation of the porosity belt is attributed to the metallostatic pressure exerted by the filler metal feed and the Marangoni flow, which develops in the molten pool due to strong thermal gradients [73,75]. This localized accumulation of pores may promote coalescence phenomena and act as a preferential site for crack initiation along the FZ boundary. The occurrence of this feature exclusively in LPBF-related joints suggests that local melt pool dynamics are strongly influenced by the initial condition of the LPBF base material.
Delving further into the details of the porosities, Table 4 summarizes the porosity metrics measured for all the investigated joints.
In the 1st campaign, PFZ ranged from 0.2% in the 4 mm Wrought–Wrought joint to 11.2% in the 8 mm LPBF–LPBF joint. In the 2nd campaign, PFZ ranged from 1.0% to 13.7%, with the highest value observed for the 8 mm LPBF–Cast joint.
Across both campaigns, joints involving LPBF AlSi10Mg-SR consistently exhibited the highest porosity levels. Among similar joints, LPBF–LPBF conditions showed PFZ values ranging from 9% to 11.7% for both 4 mm and 8 mm plates, whereas Wrought–Wrought joints exhibited the lowest porosity levels (0.2–1.2%). Among dissimilar joints, LPBF–Cast combinations showed the most pronounced increase in the 2nd campaign, reaching PFZ values of 11.2% for the 4 mm and 13.7% for the 8 mm thickness. These results indicate LPBF-related joints as the most critical conditions in terms of PFZ across the investigated set.
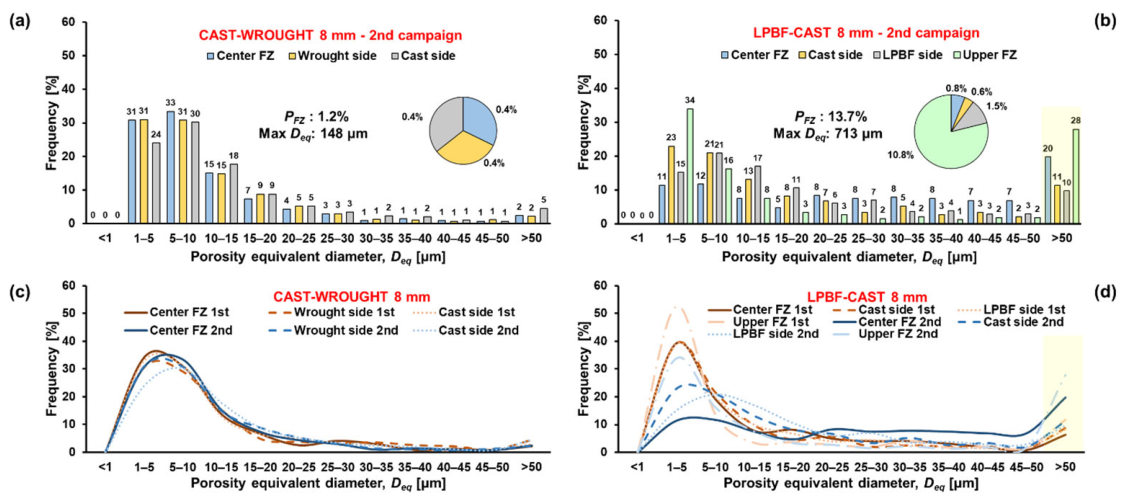
To further characterize pore severity beyond PFZ, pore size trends were assessed using Deq. Overall, Deq remained in the range of 5–35 μm, with larger scatter and higher mean values for joints involving LPBF plates, particularly in the 8 mm PMC configuration. Furthermore, the distribution of the Deq parameter within the FZ was non-uniform for LPBF-related joints, with higher dispersion in the upper region and on the LPBF side, consistent with the trends observed in Figure 6 and Figure 7 and the upward pore migration and coalescence during pool solidification. As a representative example, Figure 8 compares the Deq distributions for the 8 mm 2nd campaign Cast–Wrought (in Figure 8a) and LPBF–Cast joints (in Figure 8b), including the superposition of the two welding campaigns (in Figure 8c,d). Figure 8a,b, reveal that pores are more unevenly distributed in the LPBF–Cast joint compared to the Cast–Wrought joint, with the latter exhibiting higher frequencies of smaller pores below 10 μm. Moreover, pores exceeding 50 μm occur with higher frequency across the FZ regions in the LPBF–Cast joint (highlighted in Figure 8b,d), indicating a shift toward larger defect sizes. Although Deq distributions were compared between the two welding campaigns, the simultaneous changes in welding speed, nominal heat input, backing support, and pass strategy prevent the isolated effect of individual welding parameters on pore size evolution from being determined. Therefore, the observed differences in Deq and pore size distribution should be interpreted as the result of the overall revised welding procedure rather than as the direct effect of one individual parameter. Overall, the combined PFZ and Deq results indicate that LPBF-related joints are characterized not only by higher porosity levels, but also by a shift toward larger defects, which are expected to be more detrimental to mechanical performance than fine and uniformly distributed pores.
The comparison of the superimposed distributions from the two campaigns (Figure 8c,d) reveals that Cast–Wrought joint maintains similar distributions, with higher frequencies at smaller pore diameters. In contrast, the LPBF–Cast joints exhibit a degradation in the 2nd campaign, with flatter distributions and increased frequency of pores above 50 μm, resulting in higher dispersion and a shift towards larger Deq.
To interpret PFZ in relation to the initial material condition, Table 4 also reports the porosity increment (Equation (5)), defined using BM porosity measured on both plates as a baseline for each joint. Since BM porosity may vary between plates even within the same alloy and manufacturing route, BM porosity was quantified on both the left and right plates and ΔP was defined with respect to the higher value to provide a conservative and comparable baseline across the investigated material combinations. The sensitivity analysis described above showed that the absolute ΔP values depend on the selected BM reference, particularly when the two BM porosity levels differ markedly. However, the principal ranking trends remained substantially unchanged. Therefore, ΔP is interpreted here as a comparative porosity descriptor rather than as an isolated measure of weld-generated porosity. Across the investigated conditions, ΔP is positive, indicating that PFZ exceeds the highest BM porosity measured on either side of the joint. The ΔP values are particularly high for joints involving LPBF AlSi10Mg-SR, consistent with an increase in porosity within the FZ beyond the initial BM porosity. Conversely, for conventional cast and wrought combinations ΔP remains limited, indicating that the PFZ is closer to the BM baseline.
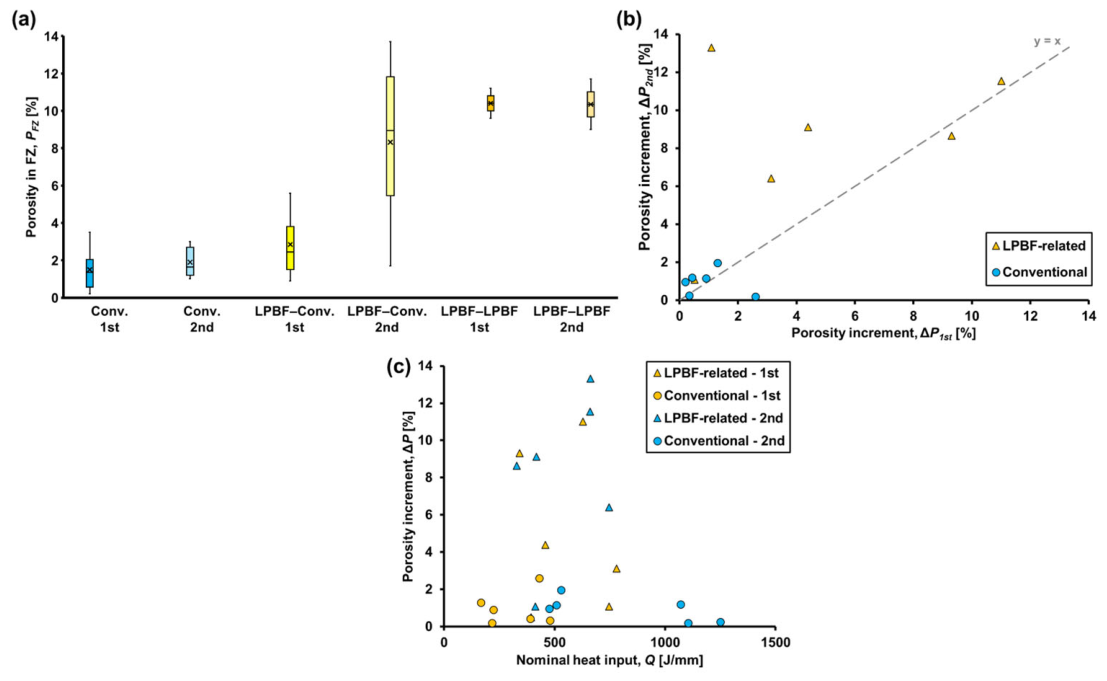
Figure 9 provides a compact visualization of the porosity trends discussed above. The PFZ boxplot (Figure 9a), separated by welding campaign, highlights that conventional joints (Cast–Cast, Wrought–Wrought, Cast–Wrought) remain confined to a low-porosity baseline in both the 1st and 2nd campaigns, with limited scatter. By contrast, joints involving LPBF show a clear shift toward higher PFZ values in both campaigns. Among LPBF-related joints, LPBF–Cast and LPBF–Wrought also exhibit the largest variability, particularly in the 2nd campaign. The comparison between campaigns in Figure 9b further confirms this material-dependent response. Conventional joints cluster near the origin and close to the y = x line, whereas LPBF-related joints exhibit substantially higher ΔP and, in most cases, lie above y = x, indicating an increase in ΔP in the 2nd campaign. Finally, ΔP as a function of Q (Figure 9c) shows that LPBF-related joints maintain higher ΔP values than conventional joints over comparable Q ranges. This indicates that process parameters such as Q alone are not sufficient to rationalize porosity trends when LPBF material is involved, and supports interpreting porosity as a material–process interaction rather than a purely process-driven outcome.
Overall, these results indicate a higher porosity susceptibility for joints involving LPBF AlSi10Mg-SR, particularly for LPBF–LPBF and LPBF–Cast combinations. The 2nd welding campaign employed adjusted process conditions aimed at mitigating fusion-related defects observed in the 1st campaign. While these defects were effectively reduced, PFZ did not decrease accordingly and increased for several conditions, most notably for joints involving LPBF AlSi10Mg-SR. This highlights that process adjustments intended to improve fusion and penetration do not necessarily translate into reduced porosity, especially when LPBF material is involved. Notably, for LPBF-related joints, PFZ and ΔP varied between the two campaigns despite broadly comparable v and Q, with ΔP remaining consistently high and generally increasing in the 2nd campaign. This indicates that porosity in LPBF-related welds cannot be interpreted solely in terms of global process descriptors or the initial BM porosity baseline, and suggests a relevant role of LPBF BM condition and its interaction with the welding thermal cycle [40,73,76]. In particular, intrinsic discontinuities typically reported in LPBF materials, such as entrapped gas and oxide-related defects, may provide preferential sites for pore nucleation and subsequent growth during welding, contributing to elevated ΔP [34,35,68]. Moreover, since the same filler wire was used for all joints, the effect of filler metal composition could not be isolated from those of the BM combination and welding conditions. Filler dilution may nevertheless contribute to the resulting weld pool chemistry and solidification behavior. These results indicate that fusion-related defects and gas porosity were not simultaneously mitigated within the investigated process window. While the former are mainly associated with energy input, joint geometry, backing support, and pass strategy, porosity formation may also be influenced by hydrogen and oxide sources, plate surface condition, filler dilution, molten pool dynamics, and bubble escape before solidification. Therefore, further optimization of LPBF-containing welds may require combining fusion and penetration control with dedicated porosity-mitigation strategies. Reported approaches include improved plate cleaning and storage, control of oxide and moisture sources, optimization of welding conditions, and suitable filler metal selection [33,37,40]. Such dedicated process optimization is necessary to achieve sufficiently robust weld quality for the reliable integration of LPBF components into hybrid structural assemblies.

3.1.2. Microstructure Analysis

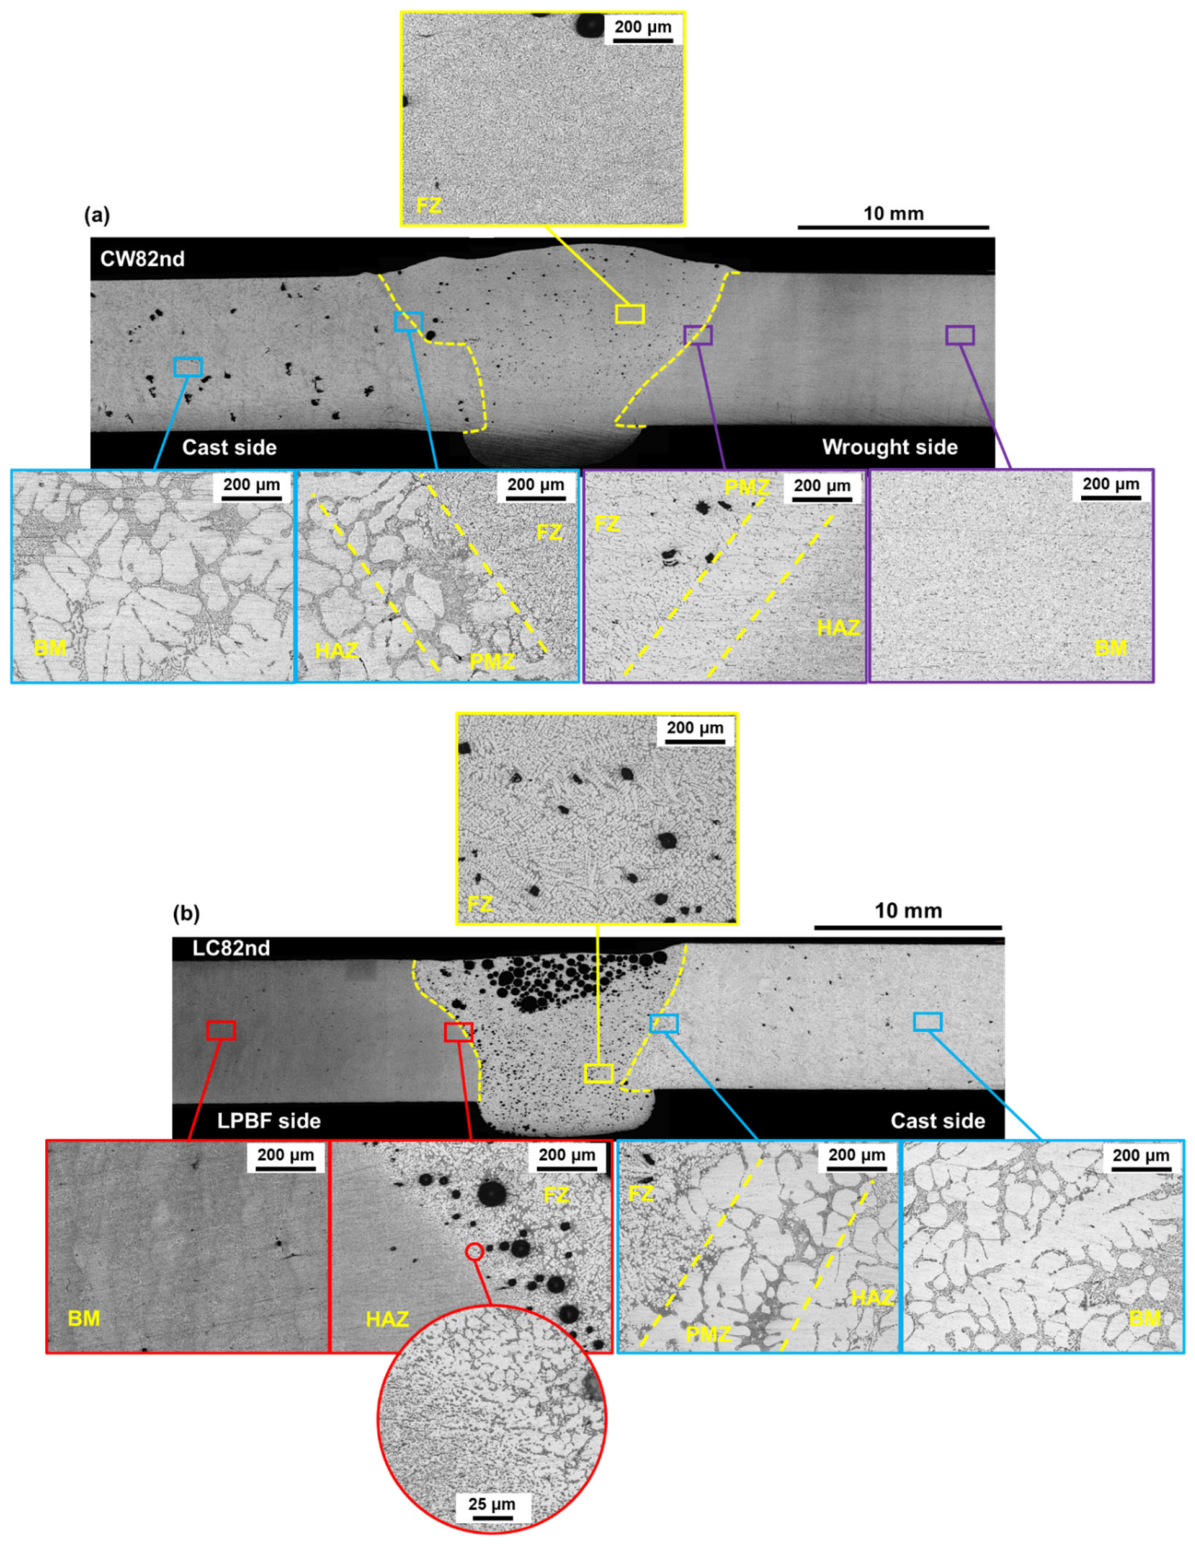
Representative macrographs from CW82nd and LC82nd welds are reported in Figure 10 to highlight the main morphological features of the investigated joints. Microstructural observations were performed in the FZ, PMZ, and the corresponding BMs. The FZ microstructure is broadly similar in CW82nd and LC82nd, exhibiting a typical cast-like dendritic solidification morphology. This morphology is consistent with rapid solidification under fusion welding conditions and reflects the re-melting and re-solidification of the base materials and filler metal.
The BMs exhibit distinct microstructures. The EN AC-42100-T6 cast alloy shows an α-Al matrix with an interdendritic Al-Si eutectic, in which Si appears finely distributed and properly refined after T6 heat treatment, together with acicular β-AlFeSi particles. The EN AW-6082-T6 wrought alloy is characterized by an α-Al matrix containing α-Al(FeMn)Si intermetallic particles, which are preferentially aligned along the rolling direction. The LPBF AlSi10Mg-SR BM retains the characteristic as-built melt pool morphology after SR with laser marks visible at lower magnification. Within each melt pool, a fine α-Al cellular structure is observed, surrounded by an interdendritic Si-rich eutectic network at the cell boundaries. This fine cellular microstructure, typical of LPBF materials, results from the very high cooling rates of the process and is associated with a heterogeneous distribution of Si-rich boundaries, oxides, and entrapped gas defects inherited from fabrication [77,78]. Upon welding, remelting of the LPBF base material may favor hydrogen release and pore nucleation within the molten pool, thus contributing to the higher porosity sensitivity observed in LPBF-related joints [79,80,81].
The PMZ was identified metallographically as the narrow region immediately adjacent to the fusion boundary showing evidence of local liquation and a transition from the HAZ microstructure toward the FZ solidification structure. Its outer boundary was taken as the position beyond which no evidence of partial melting was observed. The PMZ shows material-dependent differences in both morphology and width. On the EN AC-42100-T6 cast side, the PMZ extends over approximately 300–500 μm and is characterized by coarser α-Al dendrites compared with the BM, together with partial remelting of the eutectic constituent. A gradual microstructural transition is observed from the BM towards the fusion boundary. On the EN AW-6082-T6 wrought side, the PMZ is narrower, with an estimated width of 150–250 μm, and shows elongated grains at the transition from the HAZ toward the fusion boundary, followed by a change in solidification morphology from planar to cellular and then dendritic towards the FZ. The LPBF AlSi10Mg-SR side exhibits the narrowest PMZ, with an estimated width of 50–60 μm. In this region, the original sub-micrometric Si-rich cellular network of the BM is no longer present, and the Si phase appears as discrete spheroidal particles distributed in the α-Al matrix, indicating coarsening of the original eutectic network. The disappearance of the laser marks visible in the BM further confirms the local loss of the SR LPBF microstructure within the PMZ. The observed differences in PMZ width indicate different local thermal responses of the investigated alloys during welding. These differences may also affect the distribution of defects across the joint by modifying the extent and sharpness of the transition region adjacent to the fusion boundary. The distinct microstructural response of the LPBF material, including the fine cellular structure and narrow PMZ, may contribute to the higher susceptibility to porosity formation observed in LPBF-related joints, as previously discussed. Moreover, the coarsening observed in the PMZ and FZ indicates a loss of the fine microstructural features present in the base materials. For LPBF AlSi10Mg-SR, the welding thermal cycle produces the local disappearance of the original fine cellular microstructure accompanied by Si coarsening. This network and silicon dimension variations reduce the strengthening contribution of the LPBF microstructure, consistent with the decrease in local hardness measured on the LPBF side and contributing to the strength decrease of the welded LPBF joints [35]. It is also worth noting that the fusion welding process, combined with the use of an Al-Si filler metal, tends to partially homogenize the chemical composition and microstructural features within the FZ. As a result, the initial differences between the BMs are reduced after welding, and the joint response becomes increasingly governed by the resulting FZ microstructure and defect population rather than by the original BM condition alone.

3.2. Hardness and Tensile Tests

3.2.1. Hardness Tests

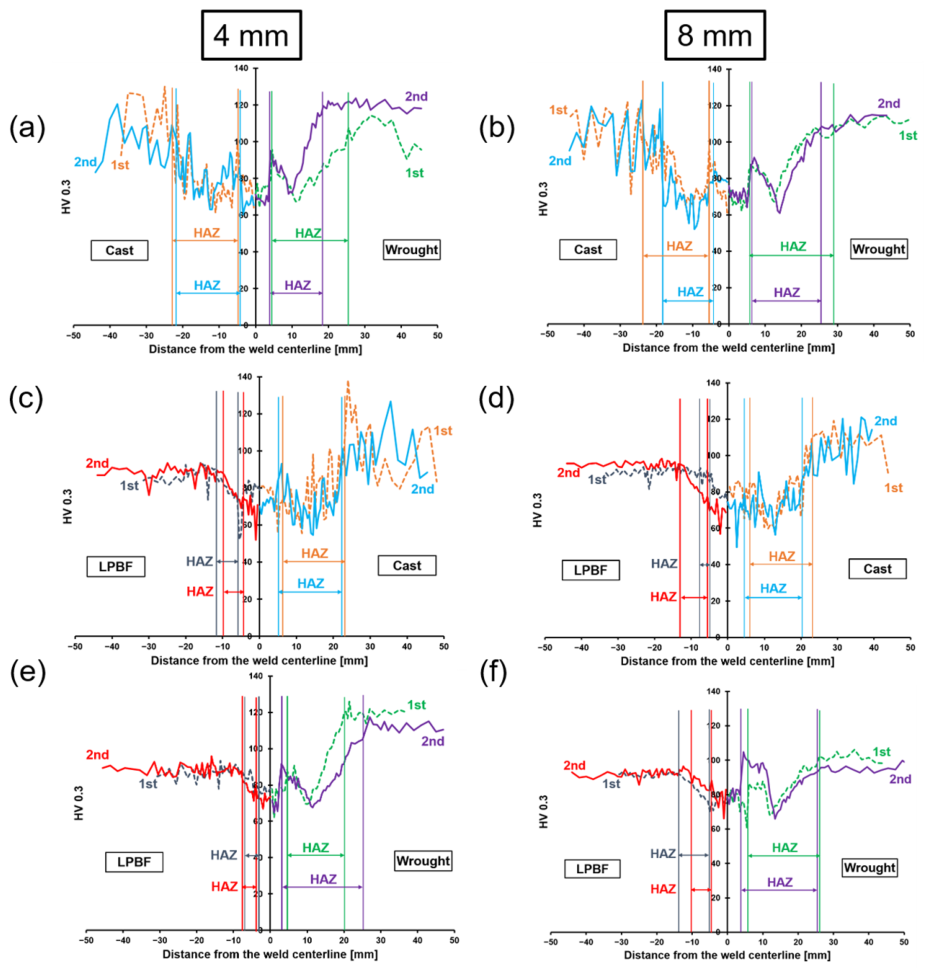
Figure 11 illustrates the HV0.3 hardness profiles measured across the dissimilar welded joints produced in the 1st and 2nd welding campaigns. These configurations were selected because they provide the most direct comparison of the hardness evolution on the two sides of the weld as a function of the coupled BMs, whereas similar joints exhibit a more symmetric response. Rockwell macrohardness measurements, available for the 1st campaign only, were consistent with the qualitative trends observed in the HV0.3 profiles. Because microhardness provides a more spatially resolved description of local hardness evolution across the weld, the following discussion is focused on the HV0.3 results. For completeness, the corresponding macrohardness profiles for the dissimilar joints are reported in the Supplementary Materials (Figure S1). In all cases, the hardness distribution is markedly asymmetric across the weld, reflecting the different microstructural and thermal response of the coupled BMs. Starting from the weld centerline towards the BM, the profiles show the FZ, followed by a local hardness increase near the fusion boundary, a subsequent decrease to a minimum in the softened region, and then a progressive recovery towards the BM plateau. A more irregular hardness evolution is observed on the cast side and, in some cases, within the FZ, due to porosity and local microstructural heterogeneity. A distinct local hardness increase close to the fusion boundary is observed mainly on the cast and wrought sides, consistently with the microstructural changes identified metallographically in the PMZ and adjacent HAZ. By contrast, the LPBF side shows a more gradual hardness increase from the FZ towards the BM, consistent with its much narrower PMZ and the localized coarsening and spheroidization of the Si-rich microstructure observed in Section 3.1.2.
At a general level, the HAZ widths derived from the HV0.3 profiles remain broadly comparable between the 1st and 2nd campaigns and confirm the same material-dependent trend, with the narrowest extent on the LPBF side, intermediate values on the cast side, and the widest softened region on the wrought side. Quantitatively, the LPBF side remains limited to only a few millimeters, whereas the cast side extends over approximately 14–20 mm and the wrought side reaches the largest values, up to about 27 mm. The differences between the two campaigns are generally limited, although the 4 mm Cast–Wrought joint shows a more evident reduction in HAZ width in the 2nd campaign, possibly due to the modified thermal boundary conditions, including the use of the copper backing support. Overall, the relative asymmetry between the coupled BMs is preserved. Importantly, the HAZ width derived from HV0.3 profiles should be interpreted as a metallurgical indicator, rather than as the simple extent of the thermal field [82,83]. In this sense, the hardness-based HAZ does not only reflect the extent of the region that experienced a thermal excursion. It primarily represents the distance over which the welding thermal cycle induced stable microstructural changes affecting the local strengthening mechanisms. Therefore, thermophysical properties and boundary conditions contribute to the thermal field, but they are not sufficient on their own to explain the hardness-based HAZ extent. This distinction is particularly relevant when comparing cast and LPBF materials with similar nominal Al–Si chemistry but markedly different as-processed microstructures and strengthening conditions [35,73,84].
For the wrought EN AW-6082-T6 alloy, the broad hardness-affected region is consistent with the sensitivity of precipitation-hardened 6xxx alloys to welding thermal cycles. In these materials, the local hardness decrease in the HAZ is associated with the evolution, dissolution, and coarsening/over-aging of strengthening Mg2Si precipitates, which results in a pronounced softening minimum and in a relatively wide softened zone. From this perspective, the wrought side appears particularly sensitive to degradation induced by the welding process, since it combines the broadest hardness-affected region with a marked hardness drop [32,85,86].
A different interpretation is required for LPBF AlSi10Mg-SR. In this case, the relatively high BM hardness is primarily associated with the fine cellular microstructure and the Si-rich network generated by rapid solidification during LPBF processing. The welding thermal cycle locally disrupts and coarsens this microstructural arrangement, leading to a decrease in hardness and to the loss of the original microstructural refinement. However, this hardness drop remains spatially more limited than in the wrought alloy, in agreement with the narrow PMZ and HAZ observed on the LPBF side. This limited character is consistent with the idea that the hardness response of LPBF AlSi10Mg-SR is controlled by the stability of the fine Si-rich cellular architecture rather than by a classical precipitation-hardening mechanism [40,87,88].
The cast side shows an intermediate response in terms of HAZ extent, although with a more irregular hardness evolution. This behavior is coherent with the heterogeneous microstructure of the cast alloy and with the local influence of porosity on the hardness measurements.
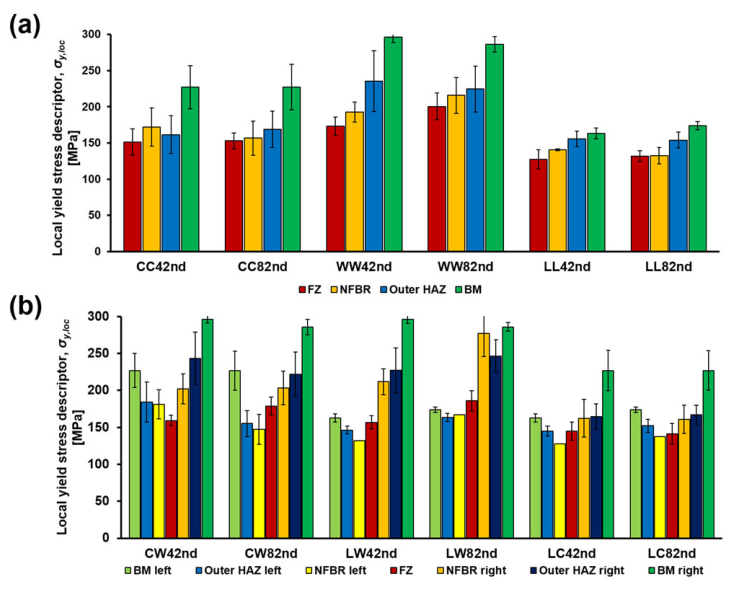
To complement the direct interpretation of the HV0.3 profiles, Figure 12 reports the hardness-derived local yield stress descriptor, σy,loc, estimated for the main weld regions of the joints produced in the 2nd campaign. For the similar joints, the comparison highlights the strongest local strength contrast in the Wrought–Wrought condition, where the drop from BM to FZ/NFBR is the most pronounced. This behavior may also be influenced by the use of the AlSi5 filler metal, whose chemistry and mechanical properties are closer to cast and LPBF Al-Si alloys than to the wrought EN AW-6082-T6. Cast–Cast joints show an intermediate response, whereas LPBF–LPBF joints exhibit a more limited reduction in σy,loc, consistent with the SR condition of the LPBF BM, which provides a lower margin for further microstructural evolution during welding than the T6 conditions of the cast and wrought alloys. These results are consistent with the hardness profiles and reinforce the interpretation of property degradation across the different weld zones by highlighting the magnitude of the local strength drop in each region. This suggests that both the magnitude of the local reduction and the spatial extent of the affected regions play a key role in determining the overall mechanical response of the joint.
Within this framework, Table 5 reports the IDHV parameter calculated from the HV0.3 profiles for all the investigated joints. For dissimilar joints, contributions are reported separately for the two sides, together with the total IDHV obtained by summing them. Unlike σy,loc, which captures the local strength level at discrete weld regions and therefore describes the depth of the hardness drop at specific areas along the profile, IDHV integrates the hardness deficit over the full extent of the softened region, providing a cumulative descriptor of the overall softening burden imposed on the joint. The two parameters are therefore complementary: σy,loc highlights how severely local strength decays within each weld zone, while IDHV reflects the combined effect of softening magnitude and spatial extent on the global mechanical response. In this sense, σy,loc describes the intensity of local degradation, whereas IDHV quantifies its cumulative structural impact. This distinction is relevant because two joints with similar σy,loc minima may differ substantially in IDHV if their softened regions differ in width.
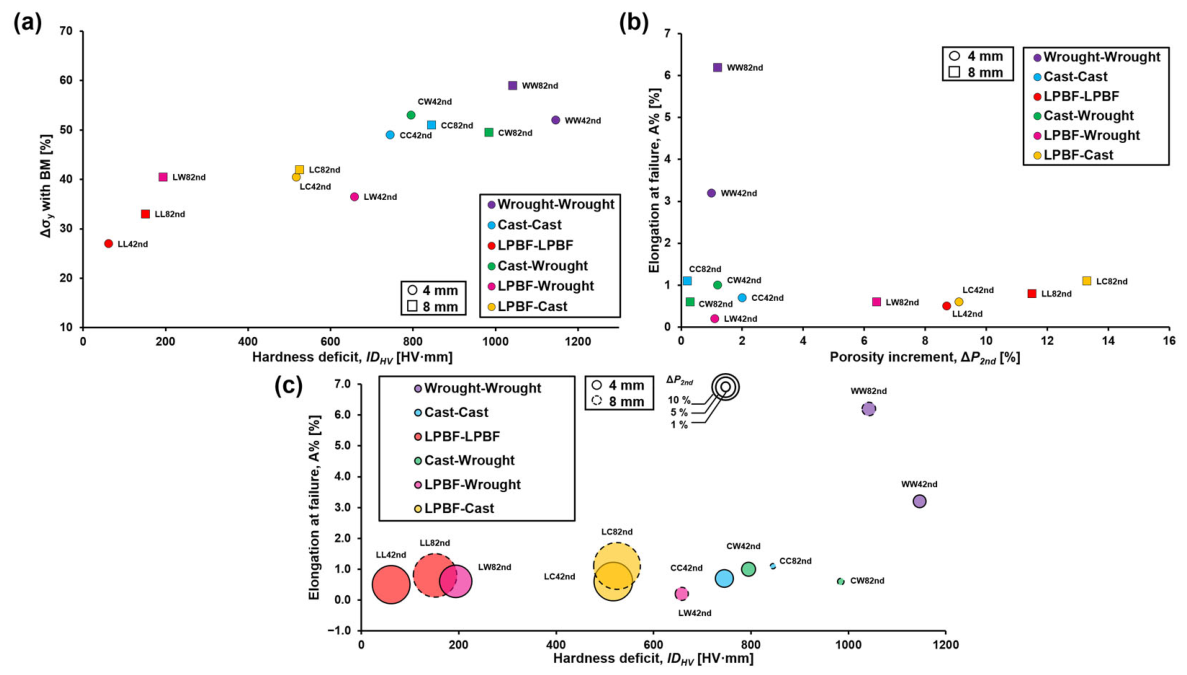
In the 2nd campaign, IDHV remains highest in the Wrought–Wrought condition, intermediate in Cast–Cast joints, and markedly lower in LPBF–LPBF joints. Quantitatively, LPBF–LPBF joints exhibit IDHV values of only 61–151 HV·mm, compared with 745–845 HV·mm for Cast–Cast and 1042–1146 HV·mm for Wrought–Wrought joints, confirming that the cumulative softening burden on the wrought alloy is qualitatively different from that on the LPBF alloy. This difference helps rationalize the yield strength trends discussed in Section 3.2.2: the low IDHV in LPBF joints is consistent with the limited σy reduction observed in tension, while the high IDHV in wrought joints drives the pronounced strength penalty despite the absence of significant FZ porosity.
The side-resolved values further reveal a markedly different distribution of the cumulative softening between the two halves of the dissimilar joints. In Cast–Wrought joints, IDHV is approximately balanced between the two sides (45–55% of the total each), whereas in LPBF-containing dissimilar joints the deficit is concentrated on the non-LPBF side, which accounts for 86–94% of the total in all four configurations. The LPBF side contribution remains consistently low (28–74 HV·mm) and essentially independent of the partner alloy, indicating that the hardness-derived softening on the LPBF side is governed by an intrinsic material response rather than by the coupling. A similar invariance is observed for the cast side across cast-containing dissimilar joints (354–487 HV·mm), whereas the wrought side shows a wider scatter (166–621 HV·mm), reflecting a stronger sensitivity of the 6082-T6 HAZ to the specific welding conditions. Consistently with this distribution, LPBF–Cast combinations show the lowest IDHV totals across both campaigns, since the wrought side, which dominates the cumulative deficit in LPBF–Wrought and Cast–Wrought configurations, is absent. From a structural standpoint, the cumulative softening of LPBF–conventional dissimilar joints is therefore dominated by the conventional counterpart, and mitigation strategies targeting IDHV reduction in such joints should primarily address the HAZ behavior of the cast or wrought counterpart.
Taken together, σy,loc and IDHV provide complementary perspectives on hardness-derived degradation: the former identifies the local strength level in each weld zone, while the latter quantifies the integrated mechanical penalty associated with the softened region as a whole, thus providing a more complete basis for interpreting the tensile response.

3.2.2. Tensile Tests

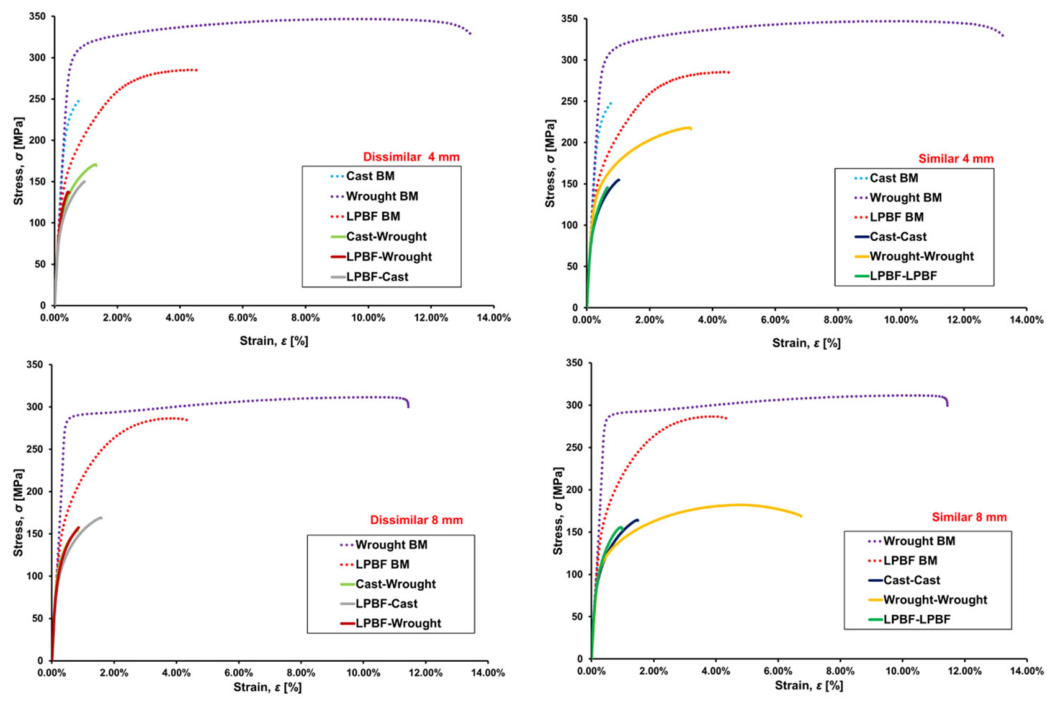
Figure 13 shows the engineering stress–strain curves of the base materials and welded joints from the 2nd campaign for similar and dissimilar configurations at both thicknesses, and Table 6 summarizes the corresponding tensile properties. The 2nd campaign welding conditions were retained following NDT screening, and destructive characterization was performed only on joints satisfying the applicable acceptance criteria. Accordingly, the tensile properties should be interpreted as the response of NDT accepted welded joints containing the residual defect population quantified in Section 3.1.1, rather than as the response of defect-free welds.
The base materials define the reference framework for joint behavior: wrought EN AW-6082-T6 exhibited the highest strength and ductility; cast EN AC-42100-T6 showed moderate strength but negligible ductility, whereas LPBF AlSi10Mg-SR displayed intermediate strength with limited ductility. For all the combinations involving a cast plate, it should be noted that the elongation at failure of the BM is already very low prior to welding. This is mainly related to the extensive presence of porosity in the cast components from which the investigated plates were extracted, as also evident from the metallographic observations. The fact that A% remains within the same low range after welding indicates that the process did not markedly aggravate an already severely constrained deformation capability, which is also influenced by the heterogeneous eutectic and intermetallic microstructure of the cast alloy.
Among the conventional joints, Wrought–Wrought joints define the upper performance bound. Despite an extensive softened HAZ up to approximately 24 mm and a substantial strength reduction of about 41–42% in σR, the joints retained the highest ductility among all welded conditions, reaching A% up to 6.2% for the 8 mm configuration. This indicates that in precipitation-hardened 6xxx alloys, HAZ softening reduces strength but still allows a certain degree of progressive plastic accommodation within the softened region, rather than promoting immediate fracture [89,90]. By contrast, Cast–Cast joints represent the opposite reference case. Lower HAZ sensitivity limits the strength penalty, with σR values of 149–158 MPa corresponding to reductions of 33–37% relative to the BM, but ductility remains negligible at A% = 0.7–1.1%. This limited variation in A% with respect to the BM is consistent with the already very low BM ductility discussed above. Cast–Wrought dissimilar joints lie between these two cases in terms of strength, with σR = 162–163 MPa, but their ductility remains low at A% ≤ 1.1%, much closer to Cast–Cast than to Wrought–Wrought behavior. This indicates that the ductile potential associated with the softened wrought side cannot fully develop in the presence of the cast counterpart. Although the wrought HAZ may locally accommodate deformation, the cast side introduces a mechanical constraint due to its very limited plasticity, thereby restricting strain compatibility across the joint. As a result, the ductility of Cast–Wrought joints (A% ≤ 1.1%) is much closer to that of Cast–Cast joints than to Wrought–Wrought, despite the presence of the softened wrought HAZ, a direct indication that strain compatibility across the joint is limited by the less ductile constituent rather than by the more deformable one.
A qualitatively different degradation mode emerges when LPBF material is involved. In LPBF–LPBF similar joints, the highest PFZ values among all investigated configurations (9–12%) are superimposed on local microstructural degradation within the FZ, resulting in the lowest ductility among similar joints (A% ≤ 0.8%). The σR reduction is about 43–46%, resulting in absolute ultimate tensile strength values comparable to or slightly lower than those of Cast–Cast joints, despite the higher BM ultimate strength of AlSi10Mg-SR. At the same time, the σy reduction remains comparatively limited, resulting in post-weld values similar to those of Cast–Cast joints despite the lower σy,BM of AlSi10Mg-SR. This suggests that, in these joints, elongation at failure is controlled primarily by FZ defect severity rather than by HAZ softening alone [40,91]. At the same time, the increase in the σRy ratio may be associated with a microstructural transformation of the original ultra-fine LPBF microstructure into a coarser one, similarly to the cast one. This transformation reduces the microstructural gap between LPBF and cast material systems, contributing to similar post-weld strength levels. The comparatively limited reduction in σy observed in LPBF-related joints should be interpreted in light of the initial condition of the LPBF BM. In AlSi10Mg-SR, both the relatively low BM σy and the more limited HAZ extent are consistent with a starting microstructure that is less prone to further microstructural change during welding than the T6 conditions of the cast and wrought alloys. Therefore, the smaller Δσy does not necessarily indicate a more favorable joint response, but rather reflects the different initial strengthening condition of the LPBF material.
As a result, LPBF–LPBF and Cast–Cast joints reach comparable post-weld yield strength values, indicating that welding drives the two joint types toward a similar post-weld microstructural and defect state. In LPBF-containing dissimilar joints, the narrower HAZ on the LPBF side likewise did not translate into better elongation-at-break performance, since the concurrent presence of high PFZ and an asymmetric HAZ reduced the residual ductility to A% ≤ 0.6, comparable with the values measured for Cast–Wrought joints, while the strength degradation remained comparatively limited. Indeed, a similar pattern is also observed for σy: LPBF-related joints consistently display lower yield strength reductions on the LPBF side (18–34%) than on the cast (44–50%) and wrought (55–59%) counterparts. However, this difference should be interpreted in light of the different initial BM conditions rather than as an intrinsic advantage of the LPBF joints, since the resulting post-weld yield strength values remain comparable to those measured in cast-containing configurations, while the high PFZ values continue to dominate fracture behavior and suppress ductility. The LPBF–Wrought 4 mm joint represents the most critical condition, with A% ≈ 0.2%, where strain localization promoted by the extensive wrought HAZ and crack initiation at pores on the LPBF side likely left virtually no capacity for plastic deformation before fracture. In LPBF–Cast joints, the outcome remains poor for a different but equally unfavorable reason: the cast side does not introduce the extensive softening typical of wrought alloys, but it also provides only limited plastic accommodation due to the severe FZ defect sensitivity. The practical implication of this multi-parameter picture is that the smaller Δσy observed in LPBF-related joints does not translate into improved structural performance. The localized HAZ on the LPBF side cannot be exploited as a full design advantage unless PFZ is effectively mitigated through optimized process strategies, since the high defect severity otherwise dominates the mechanical response and controls fracture behavior.
To further examine the relationships among hardness-derived softening, porosity, and tensile performance, Figure 14 combines the relative yield strength variation with IDHV, the elongation at failure with ΔP, and a bubble plot in which bubble size represents ΔP. This combined analysis provides a comparative and exploratory representation of the observed material-dependent responses. An exploratory Spearman rank analysis across the 12 welding configurations of the 2nd campaign showed a strong positive association between IDHV and the relative yield-strength reduction (ρs = 0.895), whereas the association between ΔP and elongation at failure was weak (ρs = −0.254). Given the limited number of investigated configurations and the structured nature of the dataset, these coefficients are interpreted as exploratory descriptors rather than as evidence of causal relationships. The relative yield strength variation generally increases with IDHV, consistent with an association between global yield strength degradation and the combined severity and spatial extent of hardness-derived softening. Accordingly, wrought-containing joints, characterized by broad softened regions and high IDHV, show the largest yield strength penalties, whereas LPBF-containing joints show comparatively lower σy reductions together with the localized nature of their hardness-affected region. The other material combinations fall between these two limiting cases. Conversely, elongation at failure cannot be rationalized by IDHV alone and the weak global ΔP-A% association indicates that porosity increment alone does not explain the ductility response across all investigated material classes. Wrought–Wrought joints combine high IDHV with low ΔP and therefore retain the highest elongation among the welded joints, a behavior consistent with HAZ softening being more closely associated with strength degradation than with an immediate loss of ductility. LPBF-related joints follow the opposite trend: despite lower IDHV, their high ΔP values are associated with very low elongation, suggesting an important contribution of the FZ defect population to their mechanical response. Cast-containing joints represent a third case: their low elongation occurs despite relatively limited ΔP values and is consistent with the intrinsically poor ductility of the cast BM and its defect-sensitive microstructure. Therefore, Figure 14 highlights distinct material-dependent associations between hardness-derived softening, porosity, and tensile response rather than identifying individual controlling factors.
Overall, the tensile behavior of the investigated joints can be interpreted in terms of three material-dependent degradation modes: pronounced strength reduction associated with the wide HAZ in wrought-containing joints; limited variation in A% likely associated with the already very low ductility of the cast BM caused by its intrinsic defect population, and marked reduction in ductility and σR, together with a comparatively smaller decrease in σy, in LPBF-related configurations, due to porosity and loss of the original fine cellular structure [65,92]. Their relative contribution varies with the material combination, which explains why conventional and LPBF-related joints require different mitigation strategies. From a practical perspective, restoring strength in wrought-related joints may benefit from approaches aimed at mitigating HAZ softening, whereas LPBF-related configurations primarily require process optimization to reduce PFZ. Cast-related joints may retain a reasonable potential in terms of ductility and ultimate tensile strength, but this aspect cannot be fully assessed in the present study because the BM was already constrained by the intrinsic defect population of the cast components.

4. Conclusions

This study systematically investigated similar and dissimilar fusion welds of EN AC-42100-T6 cast, EN AW-6082-T6 wrought, and AlSi10Mg-SR LPBF aluminum alloys in 4 mm and 8 mm plate configurations, produced by CMT and PMC processes over two welding campaigns. The main conclusions are as follows:
  • The process modifications introduced in the 2nd campaign, namely lower welding speed, higher heat input, copper backing support, and a two-pass strategy for 8 mm cast and wrought-related joints, successfully eliminated the fusion and penetration defects observed in the 1st campaign, including lack of fusion, lack of penetration, and incomplete filling. By contrast, LPBF-related joints achieved full penetration with a single pass in both campaigns, indicating a distinct welding response compared with the cast and wrought alloys.
  • Gas porosity in the FZ was the predominant defect under all investigated conditions. Cast and wrought-related joints maintained relatively low porosity levels, whereas LPBF-related joints showed markedly higher PFZ and ΔP values, with PFZ reaching 13.7% in the LPBF–Cast 8 mm joint. These results demonstrate that porosity in LPBF-related welds is governed by a material–process interaction and cannot be rationalized by nominal heat input alone.
  • Microstructural analysis revealed a material-dependent response to the welding thermal cycle. The wrought alloy showed the broadest PMZ/HAZ region, the cast alloy an intermediate response, and the LPBF alloy the most localized alteration. These differences reflect the distinct starting microstructures and strengthening mechanisms of the three alloys. Both EN AW-6082-T6 and EN AC-42100-T6 rely on a precipitation-hardened matrix obtained through T6 treatment, despite their different microstructural features, namely an elongated grain structure in the wrought alloy and a heterogeneous Al–Si eutectic in the cast alloy. By contrast, the AlSi10Mg-SR LPBF alloy is strengthened by a fine Si-rich cellular microstructure inherited from rapid solidification, and its SR condition leaves a smaller margin for further microstructural evolution during welding compared with the T6-treated alloys. On the LPBF side, the alteration was confined close to the fusion boundary, where coarsening of the Si-rich eutectic network indicated the local disruption of the original fine cellular microstructure of the LPBF BM.
  • Hardness profiles confirmed the marked asymmetry of dissimilar joints and showed that the hardness-affected region was narrowest on the LPBF side, intermediate on the cast side, and widest on the wrought side, with average values of about 5 mm, 16 mm, and 20 mm, respectively. σy,loc highlighted the local strength gradients across the weld regions, whereas IDHV quantified the cumulative hardness-derived degradation, and both parameters agreed in identifying as most severe degradation in wrought joints, moderate in cast joints, and strongly limited in LPBF joints in both campaigns. In LPBF-containing dissimilar joints, the cumulative deficit was almost entirely localized on the conventional counterpart, with the LPBF side contributing less than 15% of the total IDHV. The stronger local contrast in the FZ and PMZ regions is also consistent with the use of the AlSi5 filler metal, whose chemistry and mechanical affinity are closer to cast and LPBF Al-Si alloys than to wrought EN AW-6082-T6.
  • Tensile results identified three material-dependent degradation modes. Wrought-containing joints were mainly affected by HAZ softening, which controlled the main strength loss while still allowing some residual ductility. Cast-containing joints showed low elongation mainly because the cast BM was already constrained by its intrinsic defect-sensitive microstructure. LPBF-related joints exhibited severe ductility loss due to FZ porosity and local microstructural degradation; however, after welding, LPBF and cast-containing joints converged toward comparable mechanical property levels, indicating that the welding process drives these joint types toward a similar post-weld microstructural and defect state. Therefore, further improvement of LPBF-related welds should primarily focus on porosity mitigation through process optimization and reduction of hydrogen- and oxide-related defect formation.
From a design perspective, the present results indicate that a single generic reduction factor is insufficient and that material-specific values should be adopted for each alloy and manufacturing route. For similar T6-treated cast and wrought joints, the reduction in yield strength ranges from 49% to 59%, while the reduction in ultimate tensile strength ranges from 33% to 42% relative to the corresponding BM. By contrast, joints involving LPBF AlSi10Mg-SR show a different response: when referenced to the LPBF BM, the reduction in yield strength ranges from 18% to 34%, whereas the reduction in ultimate tensile strength ranges from 45% to 50%. Elongation at failure is the least transferable parameter, because it is strongly affected by weld-defect population and, in cast-containing joints, by the already very low ductility of the starting BM. Therefore, the structural integration of LPBF components requires effective porosity mitigation. When this is not achieved, fracture remains defect-controlled regardless of the localized HAZ on the LPBF side, and the smaller σy reduction observed in LPBF-related joints does not translate into improved joint performance. Overall, these findings provide a physically grounded basis for the design of hybrid aluminum structures combining additively manufactured and conventionally produced components, highlighting the need for material-specific design strategies.

Supplementary Materials

The following supporting information can be downloaded at https://www.mdpi.com/article/10.3390/met16091046/s1, Figure S1: HRF macrohardness profiles measured across dissimilar welded joints produced in the 1st welding campaign: (a,b) Cast–Wrought, (c,d) LPBF–Cast, and (e,f) LPBF–Wrought. Left column: 4 mm joints, right column: 8 mm joints. Each profile represents the average of three measurement lines (see Figure 3 of the main text). The HRF profiles confirm the qualitative trends observed in the corresponding HV0.3 microhardness profiles (Figure 11 of the main text), with the cast and wrought sides showing broader hardness-affected regions than the LPBF side.

Author Contributions

Conceptualization, O.B., S.C. and G.C.; methodology, O.B., S.C. and G.C.; validation, O.B., S.C., R.F. and G.C.; formal analysis, O.B.; investigation, O.B.; resources, S.C., R.F. and G.C.; data curation, O.B.; writing—original draft preparation, O.B.; writing—review and editing, S.C., R.F. and G.C.; visualization, O.B.; supervision, S.C. and G.C.; project administration, S.C. and G.C.; funding acquisition, G.C. All authors have read and agreed to the published version of the manuscript.

Funding

Financed by the European Union—NextGenerationEU (National Sustainable Mobility Center CN00000023, Italian Ministry of University and Research Decree n. 1033—17/06/2022, Spoke 11—Innovative Materials & Lightweighting). The opinions expressed are those of the authors only and should not be considered as representative of the European Union or the European Commission’s official position. Neither the European Union nor the European Commission can be held responsible for them. CUP D83C22000690001.

Data Availability Statement

The data presented in this study are available on request from the corresponding author due to commercial reasons.

Acknowledgments

The authors express their gratitude for the support provided by Streparava SpA and Renishaw.

Conflicts of Interest

Silvia Cecchel and Riccardo Ferraresi were employed by the Streparava SpA, Via Zocco 13, 25030 Adro (BS), Italy. The remaining authors declare that the research was conducted in the absence of any commercial or financial relationships that could be construed as a potential conflict of interest.

Abbreviations

The following abbreviations are used in this manuscript:
A%Elongation at failure
AMAdditive manufacturing
BMBase material
CMTCold metal transfer
DeqEquivalent pore diameter
EYoung’s modulus
FZFusion zone
HAZHeat-affected zone
HRFRockwell hardness, scale F
HV0.3Vickers microhardness measured with 0.3 kgf load
IDHVHardness deficit parameter
LPBFLaser powder bed fusion
LPDCLow-pressure die casting
MIGMetal inert gas
NDTNon-destructive testing
OMOptical microscopy
PBM,LPorosity of the left base material
PBM,RPorosity of the right base material
PFZFusion-zone porosity
PMZPartially melted zone
PMCPulsed multi-control
QNominal heat input per unit length
SRStress relieved
VEDVolumetric energy density
vWelding speed
σRUltimate tensile strength
σyYield strength
σy,BMBase-material yield strength
σy,locHardness-derived local yield stress descriptor
ΔPPorosity increment
ΔσRUltimate tensile strength variation
ΔσyYield strength variation

References

  1. Statistical Pocketbook 2024—European Commission. Available online: https://transport.ec.europa.eu/facts-funding/studies-data/eu-transport-figures-statistical-pocketbook/statistical-pocketbook-2024_en (accessed on 24 April 2026).
  2. Crippa, M.; Guizzardi, D.; Pagani, F.; Banja, M.; Muntean, M.; Schaaf, E.; Monforti-Ferrario, F.; Becker, W.E.; Quadrelli, R.; Risquez Martin, A.; et al. GHG Emissions of All World Countries. In JRC Science for Policy Report; Publications Office of the European Union: Luxembourg, 2024. [Google Scholar]
  3. Forecast for Light Vehicle Production by Major Market 2024|Statista. Available online: https://www.statista.com/statistics/202464/forecast-for-vehicle-production-of-the-leading-manufacturing-countries/ (accessed on 24 April 2026).
  4. Czerwinski, F. Current trends in automotive lightweighting strategies and materials. Materials 2021, 14, 6631. [Google Scholar] [CrossRef] [Scilit] [PubMed]
  5. Serrenho, A.C.; Norman, J.B.; Allwood, J.M. The impact of reducing car weight on global emissions: The future fleet in Great Britain. Philos. Trans. R Soc. A Math. Phys. Eng. Sci. 2017, 375, 20160364. [Google Scholar] [CrossRef] [Scilit] [PubMed]
  6. Cecchel, S. Materials and technologies for lightweighting of structural parts for automotive applications: A review. SAE Int. J. Mater. Manuf. 2021, 14, 5–14. [Google Scholar] [CrossRef] [Scilit]
  7. Kim, H.C.; Wallington, T.J. Life-cycle energy and greenhouse gas emission benefits of lightweighting in automobiles: Review and harmonization. Environ. Sci. Technol. 2013, 47, 6089–6097. [Google Scholar] [CrossRef] [Scilit] [PubMed]
  8. Gonçalves, M.; Monteiro, H.; Iten, M. Life Cycle Assessment studies on lightweight materials for automotive applications—An overview. Energy Rep. 2022, 8, 338–345. [Google Scholar] [CrossRef] [Scilit]
  9. Cimprich, A.; Sadayappan, K.; Young, S.B. Lightweighting electric vehicles: Scoping review of life cycle assessments. J. Clean. Prod. 2023, 433, 139692. [Google Scholar] [CrossRef] [Scilit]
  10. Nitin, S.P.; Swarupa, M.L.; Harivardhagini, S. A Review on Light-Weight Materials for Electric Vehicles. In Proceedings of the 2023 2nd International Conference on Smart Technologies for Smart Nation (SmartTechCon); IEEE: Bengaluru, India, 2023; pp. 735–743. [Google Scholar] [CrossRef] [Scilit]
  11. Aluminium Automotive Manual—European Aluminium Association. Available online: https://european-aluminium.eu/blog/aluminium-automotive-manual/ (accessed on 24 April 2026).
  12. Cecchel, S.; Ferrario, D.; Mega, F.; Cornacchia, G. Numerical, Mechanical, and Metallurgical Investigation of an Innovative Near Net Shape Titanium Selective Laser Melting Engine Component and Comparison with the Conventional Forged One. Adv. Eng. Mater. 2021, 23, 2100036. [Google Scholar] [CrossRef] [Scilit]
  13. Taub, A.; De Moor, E.; Luo, A.; Matlock, D.K.; Speer, J.G.; Vaidya, U. Materials for Automotive Lightweighting. Annu Rev. Mater. Res. 2019, 49, 327–359. [Google Scholar] [CrossRef] [Scilit]
  14. Merulla, A.; Gatto, A.; Bassoli, E.; Munteanu, S.I.; Gheorghiu, B.; Pop, M.A.; Bedo, T.; Munteanu, D. Weight reduction by topology optimization of an engine subframe mount, designed for additive manufacturing production. Mater. Today Proc. 2019, 19, 1014–1018. [Google Scholar] [CrossRef] [Scilit]
  15. Jankovics, D.; Barari, A. Customization of Automotive Structural Components using Additive Manufacturing and Topology Optimization. IFAC-PapersOnLine 2019, 52, 212–217. [Google Scholar] [CrossRef] [Scilit]
  16. Bruzzo, F.; Medapati, M.P.R.; Pullini, D.; Ronco, F.; Bertinetti, A.; Tommasi, A.; Riede, M.; Lòpez, E.; Brückner, F. Sustainable laser metal deposition of aluminum alloys for the automotive industry. J. Laser Appl. 2022, 34, 2008–2009. [Google Scholar] [CrossRef] [Scilit]
  17. Hatch, E.J. Aluminum: Properties and Physical Metallurgy; Aluminum Association Inc.: Arlington, VA, USA; ASM International: Metals Park, OH, USA, 1984. [Google Scholar]
  18. Kou, S. Welding Metallurgy, 2nd ed.; John Wiley & Sons, Inc: Hoboken, NJ, USA, 2003. [Google Scholar]
  19. Mathers, G. The Welding of Aluminium and Its Alloys; Woodhead Publishing: Cambridge, UK, 2002. [Google Scholar]
  20. Derbiszewski, B.; Obraniak, A.; Rylski, A. Studies on the Quality of Joints and Phenomena Therein for Welded Automotive Components Made of Aluminum Alloy—A Review. Coatings 2024, 14, 601. [Google Scholar] [CrossRef] [Scilit]
  21. Samuel, A.M.; Samuel, E.; Songmene, V.; Samuel, F.H. A Review on Porosity Formation in Aluminum-Based Alloys. Materials 2023, 16, 2047. [Google Scholar] [CrossRef] [Scilit] [PubMed]
  22. Çam, G.; Ventzke, V.; Dos Santos, J.F.; Koçak, M.; Jennequin, G.; Gonthier-Maurin, P. Characterisation of electron beam welded aluminium alloys. Sci. Technol. Weld. Join. 1999, 4, 317–323. [Google Scholar] [CrossRef] [Scilit]
  23. Malarvizhi, S.; Raghukandan, K.; Viswanathan, N. Effect of post weld aging treatment on tensile properties of electron beam welded AA2219 aluminum alloy. Int. J. Adv. Manuf. Technol. 2008, 37, 294–301. [Google Scholar] [CrossRef] [Scilit]
  24. Kah, P.; Rajan, R.; Martikainen, J.; Suoranta, R. Investigation of weld defects in friction-stir welding and fusion welding of aluminium alloys. Int. J. Mech. Mater. Eng. 2015, 10, 26. [Google Scholar] [CrossRef] [Scilit]
  25. Martinsen, K.; Hu, S.J.; Carlson, B.E. Joining of dissimilar materials. CIRP Ann.-Manuf. Technol. 2015, 64, 679–699. [Google Scholar] [CrossRef] [Scilit]
  26. Kleinbaum, S.; Jiang, C.; Logan, S. Enabling sustainable transportation through joining of dissimilar lightweight materials. MRS Bull. 2019, 44, 608–612. [Google Scholar] [CrossRef] [Scilit]
  27. Szczucka-Lasota, B.; Wegrzyn, T.; Jurek, A. Aluminum alloy welding in automotive industry. Transp. Probl. 2020, 15, 67–78. [Google Scholar] [CrossRef] [Scilit]
  28. Koli, Y.; Yuvaraj, N.; Aravindan, S.; Vipin. CMT Joining of AA6061-T6 and AA6082-T6 and Examining Mechanical Properties and Microstructural Characterization. Trans. Indian Inst. Met. 2021, 74, 313–329. [Google Scholar] [CrossRef] [Scilit]
  29. Nie, F.; Dong, H.; Chen, S.; Li, P.; Wang, L.; Zhao, Z.; Li, X.; Zhang, H. Microstructure and Mechanical Properties of Pulse MIG Welded 6061/A356 Aluminum Alloy Dissimilar Butt Joints. J. Mater. Sci. Technol. 2018, 34, 551–560. [Google Scholar] [CrossRef] [Scilit]
  30. Elrefaey, A.; Ross, N.G. Microstructure and mechanical properties of cold metal transfer welding similar and dissimilar aluminum alloys. Acta Met. Sin. Engl. Lett. 2015, 28, 715–724. [Google Scholar] [CrossRef] [Scilit]
  31. Mäkikangas, J.; Rautio, T.; Mustakangas, A.; Mäntyjärvi, K. Laser welding of AlSi10Mg aluminium-based alloy produced by Selective Laser Melting (SLM). Procedia Manuf. 2019, 36, 88–94. [Google Scholar] [CrossRef] [Scilit]
  32. Cornacchia, G.; Cecchel, S. Study and characterization of EN AW 6181/6082-T6 and EN AC 42100-T6 aluminum alloy welding of structural applications: Metal inert gas (MIG), cold metal transfer (CMT), and fiber laser-MIG hybrid comparison. Metals 2020, 10, 441. [Google Scholar] [CrossRef] [Scilit]
  33. Nunes, R.; Faes, K.; De Waele, W.; Simar, A.; Verlinde, W.; Lezaack, M.; Sneyers, W.; Arnhold, J. A Review on the Weldability of Additively Manufactured Aluminium Parts by Fusion and Solid-State Welding Processes. Metals 2023, 13, 1724. [Google Scholar] [CrossRef] [Scilit]
  34. Emmelmann, C.; Beckmann, F. Hybrid lightweight design by laser additive manufacturing and laser welding processes. In Proceedings of the Lasers in Manufacturing Conference 2015 (LiM 2015), Munich, Germany, 22–25 June 2015; Wissenschaftliche Gesellschaft Lasertechnik e.V. (WLT): Hannover, Germany, 2015; pp. 1–5. [Google Scholar]
  35. Moeini, G.; Merghany, M.; Vogelsang, J. Integrity Assessment of Electron-Beam-Welded Joints of Additively Manufactured AlSi10Mg Components. Adv. Eng. Mater. 2024, 26, 202301401. [Google Scholar] [CrossRef] [Scilit]
  36. Vishwakarma, A.K.; Debnath, D.; Pawar, M.D.; Muthiyan, V.; Gautam, B.; Khatirkar, R.; Shekhar, H.; Hiwarkar, V.D. Laser welding of additively manufactured AlSi10Mg and conventionally manufactured Al6061 alloy. Weld. World 2024, 68, 1731–1745. [Google Scholar] [CrossRef] [Scilit]
  37. Nunes, R.; Faes, K.; Verlinde, W.; De Waele, W.; Lezaack, M.; Simar, A. Optimization of GMAW welding for additively manufactured aluminium alloys: Insights into filler metal, shielding gas, and laser cleaning. Int. J. Adv. Manuf. Technol. 2025, 138, 1461–1476. [Google Scholar] [CrossRef] [Scilit]
  38. Pap, Á.; Gáspár, M.; Meilinger, Á. A review on the characteristics and different types of CMT welding process variant. Multidiszcip. Tudományok 2025, 15, 103–115. [Google Scholar] [CrossRef] [Scilit]
  39. Singh, I.J.; Kumar, P.; Murtaza, Q. An overview of cold metal transfer welding of similar materials. Int. J. Interact. Des. Manuf. 2024, 18, 1845–1861. [Google Scholar] [CrossRef] [Scilit]
  40. Cui, L.; Wu, D.; Ma, L.; Qiao, J.; Wu, X.; He, D. Effect of Al–Mg Filler Wires on Weldability of Cold Metal Transfer Welded AlSi10Mg Alloys Fabricated Using Laser Powder Bed Fusion. Metall. Mater. Trans. A Phys. Metall. Mater. Sci. 2025, 56, 840–864. [Google Scholar] [CrossRef] [Scilit]
  41. Karamimoghadam, M.; Aghayar, Y.; Morvayová, A.; Mohammadi, M.; Contuzzi, N.; Casalino, G. Experimental and numerical investigation of copper–steel cold metal transfer wire arc additive manufacturing. Can. Metall. Q. 2026, 1–19. [Google Scholar] [CrossRef] [Scilit]
  42. Karamimoghadam, M.; Aghayar, Y.; Forooghi, F.; Denora, V.; Mohammadi, M.; Contuzzi, N.; Casalino, G. Wire arc additive manufacturing of low alloyed steels, copper aluminum alloys, and their bimetals. Int. J. Adv. Manuf. Technol. 2025, 140, 2177–2194. [Google Scholar] [CrossRef] [Scilit]
  43. UNI EN ISO 15614-2:2006; Specification and Qualification of Welding Procedures for Metallic Materials—Welding Procedure Test—Part 2: Arc Welding of Aluminium and Its Alloys. International Organization for Standardization (ISO): Geneva, Switzerland, 2009.
  44. Hyer, H.; Zhou, L.; Park, S.; Gottsfritz, G.; Benson, G.; Tolentino, B.; McWilliams, B.; Cho, K.; Sohn, Y. Understanding the Laser Powder Bed Fusion of AlSi10Mg Alloy. Metallogr. Microstruct. Anal. 2020, 9, 484–502. [Google Scholar] [CrossRef] [Scilit]
  45. Mercurio, V.; Calignano, F.; Iuliano, L. Sustainable production of AlSi10Mg parts by laser powder bed fusion process. Int. J. Adv. Manuf. Technol. 2023, 125, 3117–3133. [Google Scholar] [CrossRef] [Scilit]
  46. Işıtan, A.; Aytekin, S.; Onar, V. Enhancing the Microstructure and Mechanical Properties of Cast Aluminum Matrix Composites Through Nano-Al2O3 Reinforcement via CMT and PMC Welding. Int. J. Met. 2024, 18, 3166–3179. [Google Scholar] [CrossRef] [Scilit]
  47. PMC. Available online: https://www.fronius.com/en/welding/products/process-technologies/pmc (accessed on 13 September 2026).
  48. Funderburk, S.R. A Look of Heat Input. In Welding Innovation; James F. Lincoln Arc Welding Foundation: Cleveland, OH, USA, 1999; Volume XVI. [Google Scholar]
  49. Wojsyk, K.; Macherzyński, M. Determination of Linear Welding Energy by Measuring Cross-Sectional Areas of Welds. Biul. Inst. Spaw. 2016, 60, 83–89. [Google Scholar] [CrossRef] [Scilit] [PubMed]
  50. Kumar, S.; Shahi, A.S.; Sharma, V.; Malhotra, D. Effect of Welding Heat Input and Post-weld Thermal Aging on the Sensitization and Pitting Corrosion Behavior of AISI 304L Stainless Steel Butt Welds. J. Mater. Eng. Perform. 2021, 30, 1619–1640. [Google Scholar] [CrossRef] [Scilit]
  51. Zhao, Y.; Chen, F.; Cao, S.; Chen, C.; Xie, R. Effect of CMT Welding Heat Input on Microstructure and Properties of 2A14 Aluminum Alloy Joint. Metals 2022, 12, 2100. [Google Scholar] [CrossRef] [Scilit]
  52. Pepe, N.; Egerland, S.; Colegrove, P.A.; Yapp, D.; Leonhartsberger, A.; Scotti, A. Measuring the process efficiency of controlled gas metal arc welding processes. Sci. Technol. Weld. Join. 2011, 16, 412–417. [Google Scholar] [CrossRef] [Scilit]
  53. Mezrag, B.; Deschaux Beaume, F.; Rouquette, S.; Benachour, M. Indirect approaches for estimating the efficiency of the cold metal transfer welding process. Sci. Technol. Weld. Join. 2018, 23, 508–519. [Google Scholar] [CrossRef] [Scilit]
  54. UNI EN ISO 17637; Non-Destructive Testing of Welds–Visual Testing of Fusion-Welded Joints. International Organization for Standardization (ISO): Geneva, Switzerland, 2016.
  55. UNI EN ISO 17636; Non-Destructive Testing of Welds–Radiographic Testing. International Organization for Standardization (ISO): Geneva, Switzerland, 2013.
  56. EN 571-1; Non-Destructive Testing–Liquid Penetrant Testing. European Committee for Standardization: Brussels, Belgium, 1997.
  57. ASTM E92-16; Standard Test Methods for Vickers Hardness and Knoop Hardness of Metallic Materials. ASTM International: West Conshohocken, PA, USA, 2017.
  58. ASTM E18-03; Standard Test Methods for Rockwell Hardness and Rockwell Superficial Hardness of Metallic Materials. ASTM International: West Conshohocken, PA, USA, 2003.
  59. Aleo, V.; Madugula, M.K.S.; Balachandar, R. Development of an equation for aluminum alloys to determine the width of the zone affected by welding. Can. J. Civ. Eng. 2006, 33, 151–160. [Google Scholar] [CrossRef] [Scilit]
  60. Wiechmann, P.; Panwitt, H.; Heyer, H.; Reich, M.; Sander, M.; Kessler, O. Combined calorimetry, thermo-mechanical analysis and tensile test on welded EN AW-6082 joints. Materials 2018, 11, 1396. [Google Scholar] [CrossRef] [Scilit] [PubMed]
  61. Ghrib, F.; Nazemi, N.; Sokolowski, J. The HAZ in Aluminum Welding Revisited. In Proceedings of the 3rd Specialty Conference on Engineering Mechanics and Materials, Montreal, QC, Canada, 29 May–1 June 2013. [Google Scholar]
  62. Tabor, D. The Hardness of Metals; Oxford University Press: London, UK, 1951. [Google Scholar]
  63. Zhang, P.; Li, S.X.; Zhang, Z.F. General relationship between strength and hardness. Mater. Sci. Eng. A 2011, 529, 62–73. [Google Scholar] [CrossRef] [Scilit]
  64. Ambriz, R.R.; Chicot, D.; Benseddiq, N. European Journal of Mechanics A/Solids Local mechanical properties of the 6061-T6 aluminium weld using micro-traction and instrumented indentation. Eur. J. Mech. A Solids 2011, 30, 307–315. [Google Scholar] [CrossRef] [Scilit]
  65. Afkhami, S.; Khodabakhshi, A.; Havia, J.; Kinnunen, S.; Lipiäinen, K.; Barsoum, Z.; Skriko, T. Experimental-numerical insights into heat-affected zone failure of welded aluminum alloys. Weld World 2026. [Google Scholar] [CrossRef] [Scilit]
  66. ISO 4136; Destructive Tests on Welds in Metallic Materials–Transverse Tensile Test. International Organization for Standardization (ISO): Geneva, Switzerland, 2022.
  67. ISO UNI EN 6892–1:2009; Metallic Materials–Tensile Testing–Part 1:Method of Test at Room Temperature. International Organization for Standardization (ISO): Geneva, Switzerland, 2009.
  68. Anyalebechi, P.N. Hydrogen Solubility in Liquid and Solid Pure Aluminum—Critical Review of Measurement Methodologies and Reported Values. Mater. Sci. Appl. 2022, 13, 158–212. [Google Scholar] [CrossRef]
  69. Belyaev, S.V.; Baranov, V.N.; Gubanov, I.Y. Saturation dynamics of aluminum alloys with hydrogen. ARPN J. Eng. Appl. Sci. 2017, 12, 6243–6247. [Google Scholar]
  70. Li, J.; Cui, L.; Wu, D.; Wang, C.; Shi, Z.; He, D.; Cao, Q. Welding of additive manufacturing AlSi10Mg alloys using a laser metal deposition process with different heat inputs. Weld. World 2024, 68, 2083–2101. [Google Scholar] [CrossRef] [Scilit]
  71. Michler, M.; Hollmann, P.; Zenker, R.; Buchwalder, A. Investigation of Pore Reduction in Hybrid Joints of Conventionally and Additively Manufactured AlSi10Mg Using Electron Beam Welding. Adv. Eng. Mater. 2021, 23, 2001325. [Google Scholar] [CrossRef] [Scilit]
  72. Weingarten, C.; Buchbinder, D.; Pirch, N.; Meiners, W.; Wissenbach, K.; Poprawe, R. Formation and reduction of hydrogen porosity during selective laser melting of AlSi10Mg. J. Mater. Process. Technol. 2015, 221, 112–120. [Google Scholar] [CrossRef] [Scilit]
  73. Zhang, C.; Bao, Y.; Zhu, H.; Nie, X.; Zhang, W.; Zhang, S.; Zeng, X. A comparison between laser and TIG welding of selective laser melted AlSi10Mg. Opt. Laser Technol. 2019, 120, 105696. [Google Scholar] [CrossRef] [Scilit]
  74. Nahmany, M.; Hadad, Y.; Aghion, E.; Stern, A.; Frage, N. Microstructural assessment and mechanical properties of electron beam welding of AlSi10Mg specimens fabricated by selective laser melting. J. Mater. Process Technol. 2019, 270, 228–240. [Google Scholar] [CrossRef] [Scilit]
  75. Nunes, R.; Faes, K.; Verlinde, W.; Probst, F.; De Freese, J.; Arnhold, J.; De Waele, W.; Lezaack, M.; Simar, A. Welding of additively manufactured aluminium alloy components: Challenges and mitigation strategies. Weld. World 2025, 69, 1003–1021. [Google Scholar] [CrossRef] [Scilit]
  76. Kramer, S.; Lubkowitz, V.; Haas, M.; Michel, J.; Spurk, C.; Olowinsky, A.; Faria, G.A.; Jarwitz, M.; Graf, T.; Schulze, V.; et al. Investigation of the formation and reduction of hydrogen porosity during laser welding of additively manufactured AlSi10Mg parts. Int. J. Adv. Manuf. Technol. 2026, 142, 6105–6123. [Google Scholar] [CrossRef] [Scilit]
  77. Trevisan, F.; Calignano, F.; Lorusso, M.; Pakkanen, J.; Aversa, A.; Ambrosio, E.P.; Lombardi, M.; Fino, P.; Manfredi, D. On the selective laser melting (SLM) of the AlSi10Mg alloy: Process, microstructure, and mechanical properties. Materials 2017, 10, 76. [Google Scholar] [CrossRef] [Scilit] [PubMed]
  78. Pascual, A.; Ortega, N.; Plaza, S.; de Lacalle, L.N.L.; Ukar, E. Analysis of the influence of L-PBF porosity on the mechanical behavior of AlSi10Mg by XRCT-based FEM. J. Mater. Res. Technol. 2023, 22, 958–981. [Google Scholar] [CrossRef] [Scilit]
  79. Wang, C.; He, D.; He, C.; Han, F.; Li, J.; Cui, L. Effect of heat treatments on microstructure and mechanical behavior of laser welded LPBF AlSi10Mg alloys. Mater. Today Commun. 2024, 38, 108478. [Google Scholar] [CrossRef] [Scilit]
  80. Huang, N.; Luo, Q.; Bartles, D.L.; Simpson, T.W.; Beese, A.M. Effect of heat treatment on microstructure and mechanical properties of AlSi10Mg fabricated using laser powder bed fusion. Mater. Sci. Eng. A 2024, 895, 146228. [Google Scholar] [CrossRef] [Scilit]
  81. Pu, Q.; Qian, J.; Zhang, Y.; Yang, S.; Huang, H.; Chao, Q.; Fan, G. The Influence of Post-Treatment on Micropore Evolution and Mechanical Performance in AlSi10Mg Alloy Manufactured by Laser Powder Bed Fusion. Materials 2024, 17, 4319. [Google Scholar] [CrossRef] [Scilit] [PubMed]
  82. Bunaziv, I.; Tomstad, A.J.; Kvam-Langelandsvik, G.; Eriksson, M. A through-process modelling approach of aluminium heat-affected zone softening and weld joint performance. Int. J. Adv. Manuf. Technol. 2025, 137, 4011–4022. [Google Scholar] [CrossRef] [Scilit]
  83. Krochmal, M.; Rajan, A.N.R.; Moeini, G.; Sajadifar, S.V.; Wegener, T.; Niendorf, T. Microstructural and mechanical properties of AlSi10Mg: Hybrid welding of additively manufactured and cast parts. J. Mater. Res. 2023, 38, 297–311. [Google Scholar] [CrossRef] [Scilit]
  84. Nahmany, M.; Rosenthal, I.; Benishti, I.; Frage, N.; Stern, A. Electron beam welding of AlSi10Mg workpieces produced by selected laser melting additive manufacturing technology. Addit. Manuf. 2015, 8, 63–70. [Google Scholar] [CrossRef] [Scilit]
  85. Yang, S.; Yang, X.; Lu, X.; Li, M.V.; Zuo, H.; Wang, Y. Strength calculation and microstructure characterization of HAZ softening area in 6082-T6 aluminum alloy CMT welded joints. Mater. Today Commun. 2023, 37, 107077. [Google Scholar] [CrossRef] [Scilit]
  86. Jula, M.; Dehmolaei, R.; Ranjbar, K. Softening, Hardening, and Precipitation Evolution of the AA6082-T651 Heat-Affected Zone Caused by Thermal Cycles During and After Welding. Met. Mater. Int. 2023, 29, 3664–3678. [Google Scholar] [CrossRef] [Scilit]
  87. Zhao, L.; Santos Macías, J.G.; Ding, L.; Idrissi, H.; Simar, A. Damage mechanisms in selective laser melted AlSi10Mg under as built and different post-treatment conditions. Mater. Sci. Eng. A 2019, 764, 138210. [Google Scholar] [CrossRef] [Scilit]
  88. Biffi, C.A.; Fiocchi, J.; Tuissi, A. Laser Weldability of AlSi10Mg Alloy Produced by Selective Laser Melting: Microstructure and Mechanical Behavior. J. Mater. Eng. Perform. 2019, 28, 6714–6719. [Google Scholar] [CrossRef] [Scilit]
  89. Umer Mz Ud Din, U.; Tiamiyu, A.A. X-ray Microscopic and Thermodynamic Model Assessments of Softening in TIG-Welded AA 6061-T651. J. Mater. Eng. Perform. 2025, 34, 5167–5183. [Google Scholar] [CrossRef] [Scilit]
  90. Arhumah, Z.; Pham, X.T. Microstructure and Thermal Mechanical Behavior of Arc-Welded Aluminum Alloy 6061-T6. J. Manuf. Mater. Process. 2024, 8, 110. [Google Scholar] [CrossRef] [Scilit]
  91. Tradowsky, U.; White, J.; Ward, R.M.; Read, N.; Reimers, W.; Attallah, M.M. Selective laser melting of AlSi10Mg: Influence of post-processing on the microstructural and tensile properties development. Mater. Des. 2016, 105, 212–222. [Google Scholar] [CrossRef] [Scilit]
  92. Dimatteo, V.; Liverani, E.; Ascari, A.; Fortunato, A. Weldability and mechanical properties of dissimilar laser welded aluminum alloys thin sheets produced by conventional rolling and Additive Manufacturing. J. Mater. Process Technol. 2022, 302, 117512. [Google Scholar] [CrossRef] [Scilit]
Figure 1. Welding setup used for the 2nd campaign, showing the copper backing support, toggle clamps, base plate of the fixture, and two plates positioned prior to welding.
Metals 16 01046 g001
Figure 2. Schematic representation of the location of the extracted specimens from welded joints in accordance with UNI EN ISO 15614-2: (ac) tensile specimens and (d) sample for metallurgical and hardness characterization. All tensile specimens were extracted transverse to the welding direction.
Metals 16 01046 g002
Figure 3. Schematic representation of hardness measurement path (dashed arrows) for each weld joint: HV0.3 microhardness on the transverse cross-section (left) and HRF macrohardness on the top surface (right).
Metals 16 01046 g003
Figure 4. Tensile specimen geometries. (a,b) base material (BM) specimens and (c) transverse specimens extracted from welded joints, in accordance with ISO 4136. All dimensions in mm.
Metals 16 01046 g004
Figure 5. Representative NDT results for an 8 mm LPBF–Wrought joint produced in the 2nd campaign: (a) visual inspection, (b) liquid penetrant testing, and (c) radiographic testing. The figure illustrates the NDT procedure adopted as a preliminary quality screening step prior to further metallurgical and mechanical characterization. The numerical labels in panels are markers not used in the quantitative analysis.
Metals 16 01046 g005
Figure 6. Representative transverse macrosections of welded joints from the 1st and 2nd campaigns (upper) together with the nomenclature of joint codes used throughout the study (lower).
Metals 16 01046 g006
Figure 7. Representative macrosection details of welding defects: (a) lack of root fusion in joint CC41st, (b) lack of root penetration in joint WW41st, (c) gas porosity in joint CW42nd, and (d) porosity belt in joint LC42nd.
Metals 16 01046 g007
Figure 8. Porosity analysis of 8 mm Cast–Wrought (left) and LPBF–Cast (right). Equivalent pore diameter (Deq) distributions for the 2nd campaign (a,b) and superimposed distributions for the 1st and 2nd campaigns (c,d). The shaded regions in panels (b,d) highlight pore diameters exceeding 50 μm.
Metals 16 01046 g008
Figure 9. (a) FZ porosity, PFZ, distribution grouped by joint class and welding campaign: conventional joints (Cast–Cast, Wrought–Wrought, Cast–Wrought), dissimilar LPBF–conventional joints (LPBF–Cast, LPBF–Wrought), and similar LPBF–LPBF joints for the 1st and 2nd campaigns. Boxes show the interquartile (IQR, defined as the range between the first and third quartiles, Q1–Q3). (b) Comparison of porosity increment between the 1st and 2nd welding campaigns (ΔP2nd vs. ΔP1st). (c) Porosity increment, ΔP, as a function of nominal heat input, Q, for all the investigated joints. ΔP is defined according to Equation (5).
Metals 16 01046 g009
Figure 10. Representative macrosections and optical micrographs (100×) of the dissimilar 8 mm welded joints from the 2nd welding campaign: (a) Cast–Wrought (CW82nd) and (b) LPBF–Cast (LC82nd). For each joint, representative micrographs of the base material (BM), partially melted zone (PMZ), and fusion zone (FZ) are shown. Colored frames and connecting lines identify the locations of the corresponding magnified micrographs, while the dashed lines indicate the approximate PMZ boundaries.
Metals 16 01046 g010
Figure 11. HV0.3 hardness profiles measured across dissimilar welded joints produced in the 1st and 2nd welding campaigns: (a,b) Cast–Wrought, (c,d) LPBF–Cast, and (e,f) LPBF–Wrought. Left column: 4 mm joints, right column: 8 mm joints. Continuous curves refer to the 2nd campaign and dashed curves to the 1st campaign. Vertical markers indicate the hardness-based HAZ extent on each side of the weld.
Metals 16 01046 g011
Figure 12. Hardness-derived local yield stress descriptor, σy,loc, estimated from HV0.3 values for the main weld regions of joints produced in the 2nd welding campaign: (a) similar joints and (b) dissimilar joints. For similar joints, BM, NFBR, outer HAZ, and FZ are reported. For dissimilar joints, BM, NFBR, and outer HAZ are reported separately for the left and right sides, whereas the FZ is shown as a single central region. The values are used as a comparative regional descriptor of local strength gradients across the weld. Error bars represent standard deviation derived from the individual HV0.3 indentations falling within each weld region of the single centerline profile and therefore describe within-profile spatial variability rather than joint-to-joint variability.
Metals 16 01046 g012
Figure 13. Engineering stress–strain curves of base materials and welded joints (2nd campaign) for similar (right) and dissimilar (left) configurations at 4 mm (top) and 8 mm (bottom) plate thickness. Dashed lines refer to base materials.
Metals 16 01046 g013
Figure 14. Relationship between hardness-derived softening, porosity, and tensile response for joints produced in the 2nd welding campaign. (a) Relative yield strength variation as a function of hardness deficit, IDHV. (b) Elongation at failure as a function of porosity increment, ΔP. (c) Bubble plot combining hardness deficit, elongation at failure, and ΔP, represented by bubble size. Marker color identifies the joint family, whereas marker shape identifies the plate thickness (circle: 4 mm CMT; square: 8 mm PMC).
Metals 16 01046 g014
Table 1. Experimental matrix of the investigated joints, including plate thickness, joint configuration (similar/dissimilar), material combinations, and welding technology (CMT for 4 mm and PMC for 8 mm). Each condition was produced in both welding campaigns.
Plate ThicknessJoint ConfigurationMaterial CombinationWelding Technology
4 mmSimilarCast–CastCMT
Wrought–Wrought
LPBF–LPBF
DissimilarCast–Wrought
LPBF–Wrought
LPBF–Cast
8 mmSimilarCast–CastPMC
Wrought–Wrought
LPBF–LPBF
DissimilarCast–Wrought
LPBF–Wrought
LPBF–Cast
Table 2. Chemical composition (wt%) of the base materials (EN AW-6082, EN AC-42100, and AlSi10Mg) and ER4043 filler wire. The LPBF composition refers to the nominal powder composition provided by the supplier.
Chemical Composition in wt%
Base MaterialsSiFeCuMnMgCrZnTiNOTotal Other ElementsAl
Wrought
EN AW-6082
0.9360.3300.0510.5790.8260.240.0360.035--0.04Bal.
Cast
EN AC-42100
7.600.2250.1130.0710.3340.0140.0780.131--0.04Bal.
LPBF AlSi10Mg9.00–11.00≤0.25≤0.05≤0.100.25–0.45-≤0.10≤0.15≤0.20≤0.20≤0.05 eachBal.
ER40434.5–6.00.600.300.150.20-0.100.15--≤0.05 eachBal.
Table 3. LPBF process parameters used for the fabrication of AlSi10Mg plates in the Renishaw RenAM 500Q system.
Laser Power, P
[W]
Scan Speed, u [mm/s]Layer Thickness, d [μm]Hatch Distance, h [μm]Volumetric Energy Density, VED [J/mm3]Gas Flow Rate [m3/h]
5002500609037180
Table 4. Porosity metrics in the fusion zone (PFZ, Deq, and Deq distribution), porosity increment (ΔP), and corresponding process parameters (welding speed v, heat input Q, and energy) for all investigated joints in the 1st and 2nd welding campaigns. For 8 mm joints produced with a two-pass procedure, parameters are reported separately for each pass.
1st Campaign2nd Campaign
PorosityProcessPorosityProcess
WeldPFZ
%
ΔP
%
Deq
[μm]
Deq
distribution
v
[mm/s]
Q
[J/mm]
Energy
[kJ]
PFZ
%
ΔP
%
Deq
[μm]
Deq distributionv
[mm/s]
Q
[J/mm]
Energy
[kJ]
Cast–Cast
4 mm
2.11.322 ± 22Uniform9.2166543.02.021 ± 48Right side more dispersed3.9529155
Cast–Cast
8 mm
3.52.622 ± 24Uniform6.34301102.90.218 ± 18Uniform5.1 (1st pass)641 (1st pass)161 (1st pass)
7.0 (2nd pass)464 (2nd pass)117 (2nd pass)
Wrought–Wrought
4 mm
0.20.25 ± 5Uniform7.9217681.01.014 ± 18Uniform4.4476121
Wrought–Wrought
8 mm
0.50.46 ± 10Uniform10.3391971.21.215 ± 18Uniform5.6 (1st pass)664 (1st pass)167 (1st pass)
9.0 (2nd pass)407 (2nd pass)103 (2nd pass)
LPBF-LPBF
4 mm
9.69.319 ± 41Upper zone more dispersed6.3342889.08.727 ± 40Upper zone more dispersed6.532884
LPBF-LPBF
8 mm
11.211.030 ± 58Upper zone more dispersed6.262915911.711.535 ± 35Upper zone more dispersed5.9661167
Cast–Wrought
4 mm
1.90.914 ± 19Uniform6.7223722.11.216 ± 19Uniform4.0509129
Cast–Wrought
8 mm
0.80.312 ± 14Uniform5.54801231.20.312 ± 14Uniform5.3 (1st pass)722 (1st pass)182 (1st pass)
6.3 (2nd pass)528 (2nd pass)133 (2nd pass)
LPBF–Wrought
4 mm
0.90.515 ± 23Upper zone more dispersed4.93931021.71.119 ± 21Uniform4.6413107
LPBF–Wrought
8 mm
3.23.124 ± 39Upper zone more dispersed5.07811976.76.420 ± 38LPBF side more dispersed5.3746188
LPBF–Cast
4 mm
5.64.421 ± 33Upper zone more dispersed4.645811911.29.124 ± 52Upper zone more dispersed5.3418108
LPBF–Cast
8 mm
1.71.117 ± 26Upper zone and LPBF side more dispersed5.174618913.713.334 ± 65Upper zone and LPBF side more dispersed6.0662168
Table 5. Hardness deficit parameter, IDHV, calculated from the HV0.3 profiles for the investigated joints in the 1st and 2nd welding campaigns. For dissimilar joints, contributions per side are reported in parentheses following the order of the joint name (left/right).
WeldIDHV, 1st Campaign [HV·mm]IDHV, 2nd Campaign [HV·mm]
Cast–Cast 4 mm821745
Cast–Cast 8 mm876845
Wrought–Wrought 4 mm13011146
Wrought–Wrought 8 mm8181042
LPBF–LPBF 4 mm4861
LPBF–LPBF 8 mm124151
Cast–Wrought 4 mm1085 (621/464)795 (354/441)
Cast–Wrought 8 mm909 (447/462)984 (487/497)
LPBF–Wrought 4 mm493 (5/488)658 (37/621)
LPBF–Wrought 8 mm389 (68/321)194 (28/166)
LPBF–Cast 4 mm839 (32/807)517 (48/469)
LPBF–Cast 8 mm504 (4/500)525 (74/451)
Table 6. BM tensile properties, HAZ width from HV0.3 profiles (1st and 2nd campaigns), and tensile properties of welded joints from the 2nd campaign. a Cast BM reference is common for 4 and 8 mm (see Section 2.3.2).
Properties
Base material
specimens
-Young’s modulus, E
[GPa]
Yield strength, σy [MPa]-Ultimate tensile strength, σR [MPa]-Elongation at failure, A%-
Cast70 ± 8227 ± 4238 ± 70.4 ± 0.1
Wrought 4 mm71 ± 6296 ± 7339 ± 1014 ± 1
Wrought 8 mm66 ± 3286 ± 1311 ± 214 ± 2
LPBF 4 mm69 ± 4163 ± 10272 ± 95.2 ± 0.4
LPBF 8 mm69 ± 4174 ± 2289 ± 36 ± 4
1st Campaign2nd Campaign
Properties
Weld
specimens
HAZ Width
HV0.3 [mm]
HAZ Width
HV0.3 [mm]
Yield strength, σy [MPa]Δσy with BMUltimate tensile strength, σR [MPa]ΔσR with BMElongation at failure, A%ΔA% with BM
Cast–Cast
4 mm
1514116 ± 2−49%149 ± 7−37%0.7 ± 0.175%
Cast–Cast
8 mm
1516111 ± 1−51% a158 ± 5−33% a1.1 ± 0.1175% a
Wrought–Wrought
4 mm
2319142 ± 3−52%200 ± 28−41%3.2 ± 2.5−76%
Wrought–Wrought
8 mm
2024116 ± 1−59%181 ± 2−42%6.2 ± 0.3−57%
LPBF-LPBF
4 mm
44119 ± 2−27%146 ± 12−46%0.5 ± 0.2−90%
LPBF-LPBF
8 mm
77116 ± 1−33%155 ± 4−47%0.8 ± 0.0−87%
Cast–Wrought
4 mm
20
(cast)
27
(wrought)
18
(cast)
15.5
(wrought)
121 ± 3−47% (cast)
−59% (wrought)
162 ± 8−32% (cast)
−52% (wrought)
1.0 ± 0.1150% (cast)
−92% (wrought)
Cast–Wrought
8 mm
19.5
(cast)
23.5
(wrought)
14
(cast)
18
(wrought)
129 ± 2−43% (cast) a
−55% (wrought)
163 ± 8−32% (cast) a
−48% (wrought)
0.8 ± 0.250% (cast) a
−96% (wrought)
LPBF–Wrought
4 mm
5
(LPBF)
15
(wrought)
3.5
(LPBF)
23.5
(wrought)
134 ± 1−18% (LPBF)
−55% (wrought)
135 ± 7−50% (LPBF)
−60% (wrought)
0.2 ± 0.1−96% (LPBF)
−98% (wrought)
LPBF–Wrought
8 mm
9
(LPBF)
20
(wrought)
6
(LPBF)
21.5
(wrought)
131 ± 2−25% (LPBF)
−54% (wrought)
157 ± 2−46% (LPBF)
−50% (wrought)
0.6 ± 0.1−90% (LPBF)
−96% (wrought)
LPBF–Cast
4 mm
5
(LPBF)
18
(cast)
4.5
(LPBF)
17.5
(cast)
113 ± 3−31% (LPBF)
−50% (cast)
136 ± 12−50% (LPBF)
−43% (cast)
0.6 ± 0.1−88% (LPBF)
50% (cast)
LPBF–Cast
8 mm
2
(LPBF)
17
(cast)
6
(LPBF)
16
(cast)
114 ± 2−34% (LPBF)
−50% (cast) a
160 ± 10−45% (LPBF)
−33% (cast) a
1.1 ± 0.3−83% (LPBF)
175% (cast) a
Disclaimer/Publisher’s Note: The statements, opinions and data contained in all publications are solely those of the individual author(s) and contributor(s) and not of MDPI and/or the editor(s). MDPI and/or the editor(s) disclaim responsibility for any injury to people or property resulting from any ideas, methods, instructions or products referred to in the content.