


Abstract
Temperature- and strain-rate-dependent serrated flow, localized plastic instability, and qualitative microcrack evolution in Mn13 Hadfield steel were investigated using stress–strain analysis and in situ tensile observation. Solution treatment at 1050 °C for 1–1.5 h followed by water quenching yielded homogeneous single-phase austenite. Type A and Type B serrations were dominant at room temperature at 1 × 10⁻³ s−1 and at 100 °C at 1 × 10⁻² s−1, whereas the room-temperature specimen tested at 1 × 10⁻² s−1 showed delayed serration onset and pronounced Type B stress drops only at high strains. Type C serrations occurred mainly near fracture at 100 °C at 1 × 10⁻³ s−1, 200 °C at 1 × 10⁻² s−1 and 200 °C at 5 × 10⁻² s−1. In situ observations further reveal that different serration types correspond to distinct localized deformation modes. During Type A serrations, the tracked feature exhibited unidirectional stepwise migration involving forward motion, arrest, and renewed advance. Type B serrations were associated with discontinuous pulse-like migration characterized by rapid forward motion, brief arrest, local backward motion, and renewed advance. No regular trajectory was observed during Type C stress drops; only local brightness changes and slight positional shifts occurred. These observations link macroscopic serrations to localized deformation in Mn13 steel and provide qualitative in situ evidence for grain-boundary microcrack initiation and evolution during deformation.
1. Introduction
High-manganese austenitic steels, especially Mn13 Hadfield steel, are widely used in impact-abrasive wear components such as railway crossings, crusher liners, and crawler track plates because of their excellent impact toughness and work-hardening capacity [1,2,3]. Solution treatment followed by water quenching is essential for obtaining a stable single-phase austenitic microstructure, as it promotes carbide dissolution and suppresses grain-boundary precipitation during rapid cooling, thereby providing a homogeneous initial microstructure for deformation and fracture analysis [4,5,6]. Nevertheless, the fracture behavior of Mn13 steel is governed not only by the initial microstructure but also by dislocation slip, deformation twinning, local stress/strain concentration and damage accumulation during plastic deformation. Cracks preferentially initiate at stress-concentration sites, including dense slip bands, grain boundaries, inclusions and carbide/matrix interfaces [7,8,9]. It is therefore necessary to clarify the intrinsic relationship among localized plastic deformation, damage evolution and crack propagation from the perspective of the dynamic deformation process.
The coupled effect of temperature and strain rate is a key external factor governing dynamic strain aging (DSA) and Portevin–Le Chatelier (PLC)–type plastic instability in Mn13 steel. With increasing temperature, dislocation glide, cross-slip and dynamic recovery are progressively thermally activated, while the diffusion and rearrangement of C atoms and Mn–C pairs are enhanced; consequently, solute–dislocation interactions evolve from simple pinning to dynamic dragging and repeated pinning–depinning events. In the range from room temperature to approximately 300 °C, transient Cottrell atmospheres can form when the solute-segregation time matches the waiting time of mobile dislocations temporarily arrested at obstacles such as forest dislocations, grain boundaries, or other local barriers. Collective dislocation breakaway then releases localized plastic strain rapidly and appears macroscopically as stress serrations and stress drops [8,10,11,12,13]. This interpretation is consistent with van den Beukel’s concept of matching between solute diffusion time and dislocation waiting time and with McCormick’s theory of DSA-induced plastic-flow localization [14,15]. According to PLC-band propagation behavior and stress-fluctuation morphology, serrated flow is commonly classified into Type A, Type B and Type C, corresponding to relatively continuous band propagation, intermittent or hopping propagation, and localized burst-like plastic strain release, respectively [16,17,18]. Recent studies have extended serrated-flow analysis from conventional macroscopic stress–strain curves to local strain fields and PLC-band evolution, further demonstrating that serrated flow results from the combined effects of solute–dislocation interaction, deformation-band propagation and heterogeneous localized plastic-strain release [19,20,21,22,23]. However, for Mn13 Hadfield steel, existing studies still mainly identify serration types from stress–strain curve morphology or interpret failure behavior from post-deformation microstructures and fracture morphologies. Direct and systematic experimental evidence linking different serration types to local point motion, deformation-band migration and crack initiation/propagation in in situ microscopic images remains limited.
In situ tensile observation provides an effective approach for linking macroscopic serrated flow with microscopic localized deformation. Compared with conventional post-mortem characterization, in situ microscopic observation enables real-time capture of slip-trace formation, surface-relief evolution, localized deformation-band migration, microcrack initiation and crack propagation, thereby revealing the temporal relationship between plastic deformation and damage evolution. Existing in situ microscopic or full-field deformation studies have mainly focused on stainless steels, Ni-based alloys, high-temperature hot cracking and other alloy systems, confirming the important roles of grain-boundary precipitates, grain-boundary sliding, void nucleation, localized strain-band propagation and crack growth in plastic instability and fracture [21,22,23,24,25,26]. By contrast, systematic in situ image-based analysis of serration types in Mn13 Hadfield steel under different temperature–strain rate conditions remains insufficient, particularly regarding the local motion trajectories associated with Type A, Type B and Type C serrations.
Solution-treated and water-quenched Mn13 high-manganese steel was investigated using thermodynamic calculations, microstructural characterization, tensile testing, and high-temperature confocal in situ observation. Serrated flow and localized plastic instability were characterized under different temperatures and strain rates. Type A, Type B, and Type C serrations were identified from the stress–strain responses, while time-synchronized in situ image sequences were used to track representative surface features. The results link macroscopic serrated flow, particularly Type B serrations, to localized plastic deformation. In addition, the in situ observations qualitatively capture the initiation and evolution of grain-boundary microcracks during deformation. This work provides experimental evidence for PLC-type plastic instability and qualitative crack-evolution behavior in Mn13 high-manganese steel from room temperature to 200 °C.
2. Materials and Methods
The material used in this study was hot-rolled Mn13 high-manganese steel produced by a steel plant. Its chemical composition is listed in Table 1.
Table 1.
Chemical composition of Mn13 Hadfield steel (wt.%).
2.1. Solution Treatment Followed by Water Quenching
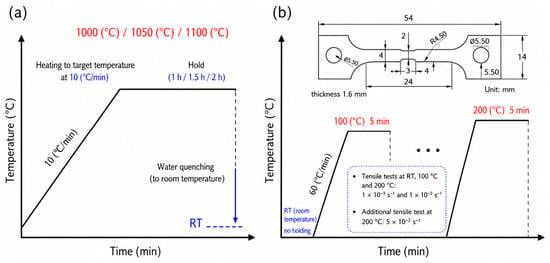
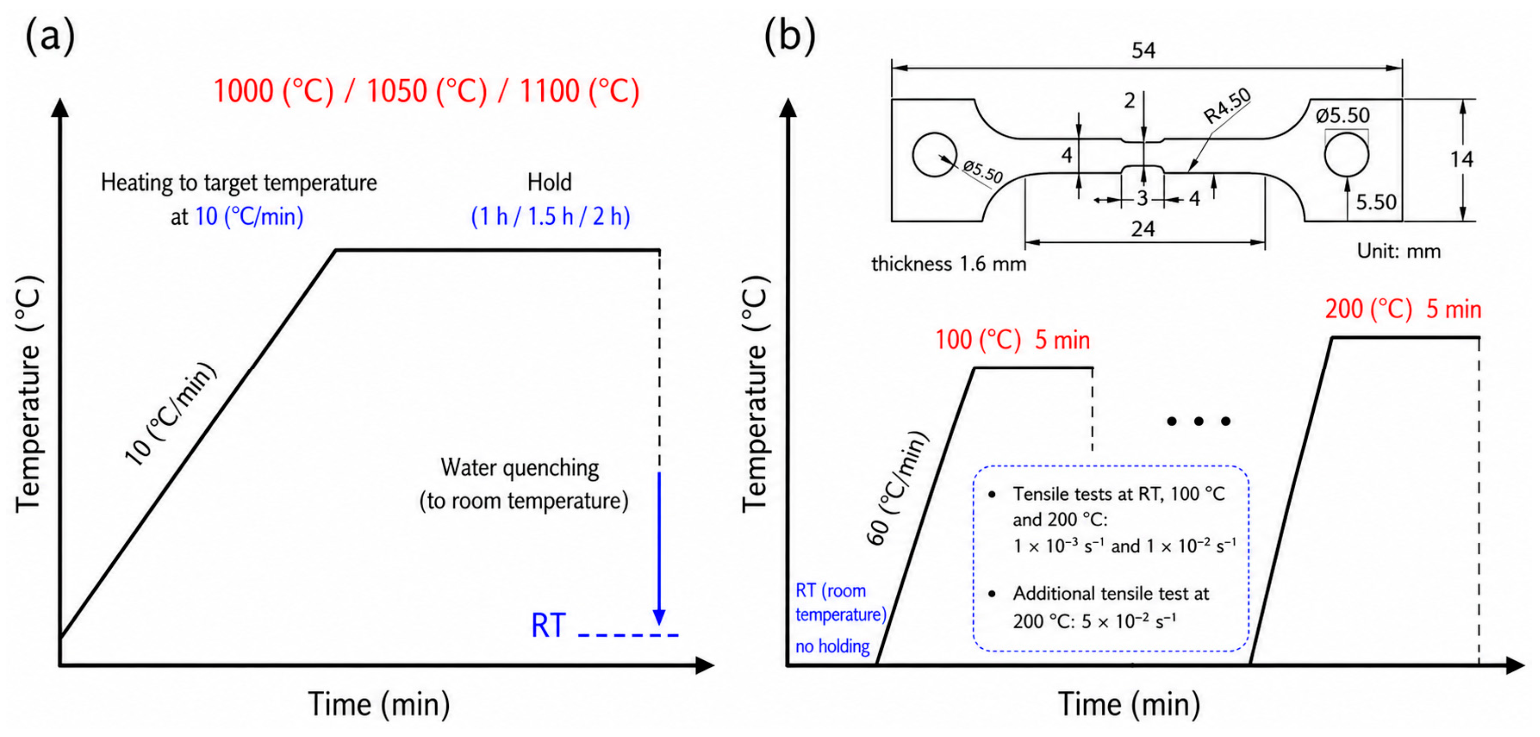
Mn13 high-manganese steel plates were machined into specimens with dimensions of 100 mm × 55 mm × 6 mm by wire electrical discharge machining. To obtain a homogeneous austenitic microstructure with stable mechanical properties, solution treatment followed by water quenching was conducted in an atmosphere-protected box furnace. Specifically, the specimens were solution-treated at three different temperatures (1000, 1050, and 1100 °C), and at each temperature, three holding times (1, 1.5, and 2 h) were applied, resulting in a total of 9 heat-treatment combinations; all specimens were then immediately water-quenched to room temperature. Metallographic observation and microhardness testing were subsequently performed to evaluate the effects of treatment temperature and holding time and to determine the optimum water-quenching condition. Specimens treated under the optimum condition were used as the starting material for subsequent investigations of serrated flow, localized deformation and crack evolution, as shown in Figure 1a.
Figure 1.
Schematic illustration of the experimental procedure for Mn13 Hadfield steel: (a) solution treatment followed by water quenching under different temperatures and holding times; (b) high-temperature in situ tensile testing under different deformation conditions.
2.2. In Situ Tensile Testing
To elucidate the temperature- and strain-rate-dependent localized deformation and crack evolution mechanisms of Mn13 high-manganese steel, in situ tensile tests were performed using a confocal laser scanning microscope (CLSM; VL2000DX-SVF17SP-SVF15FTC, Lasertec Corporation, Yokohama, Japan) equipped with a heating-tensile stage. After solution treatment, mini-tensile specimens with gauge dimensions of 54 mm × 14 mm × 1.6 mm were precision-machined from the central region of the heat-treated blocks via wire electrical discharge machining (WEDM). To eliminate the thermal and mechanical effect layers induced by WEDM, all specimen surfaces were sequentially ground, mechanically polished, and lightly etched prior to in situ testing, ensuring high surface quality and microstructural uniformity. Before testing, specimens were mounted in the heating chamber under a high-purity Ar atmosphere (99.9999%) to minimize surface oxidation. Tests were conducted at room temperature (RT), 100 °C, and 200 °C under strain rates of 1 × 10⁻³ and 1 × 10⁻², with an additional test performed at 200 °C under 5 × 10⁻² s−1. For elevated-temperature tests, specimens were heated at a rate of 60 °C/min and held for 5 min to ensure thermal equilibrium before loading. During testing, mechanical data were recorded at 25 Hz (0.04 s interval), while in situ CLSM image sequences were continuously acquired at 4 Hz (0.25 s interval). Temporal synchronization between the two datasets was established via a hardware trigger linking the tensile stage to the CLSM acquisition timestamp.
3. Results and Discussion
3.1. Initial Microstructure After Solution Treatment
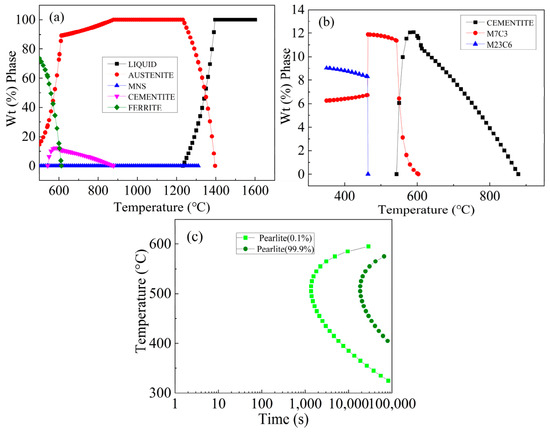
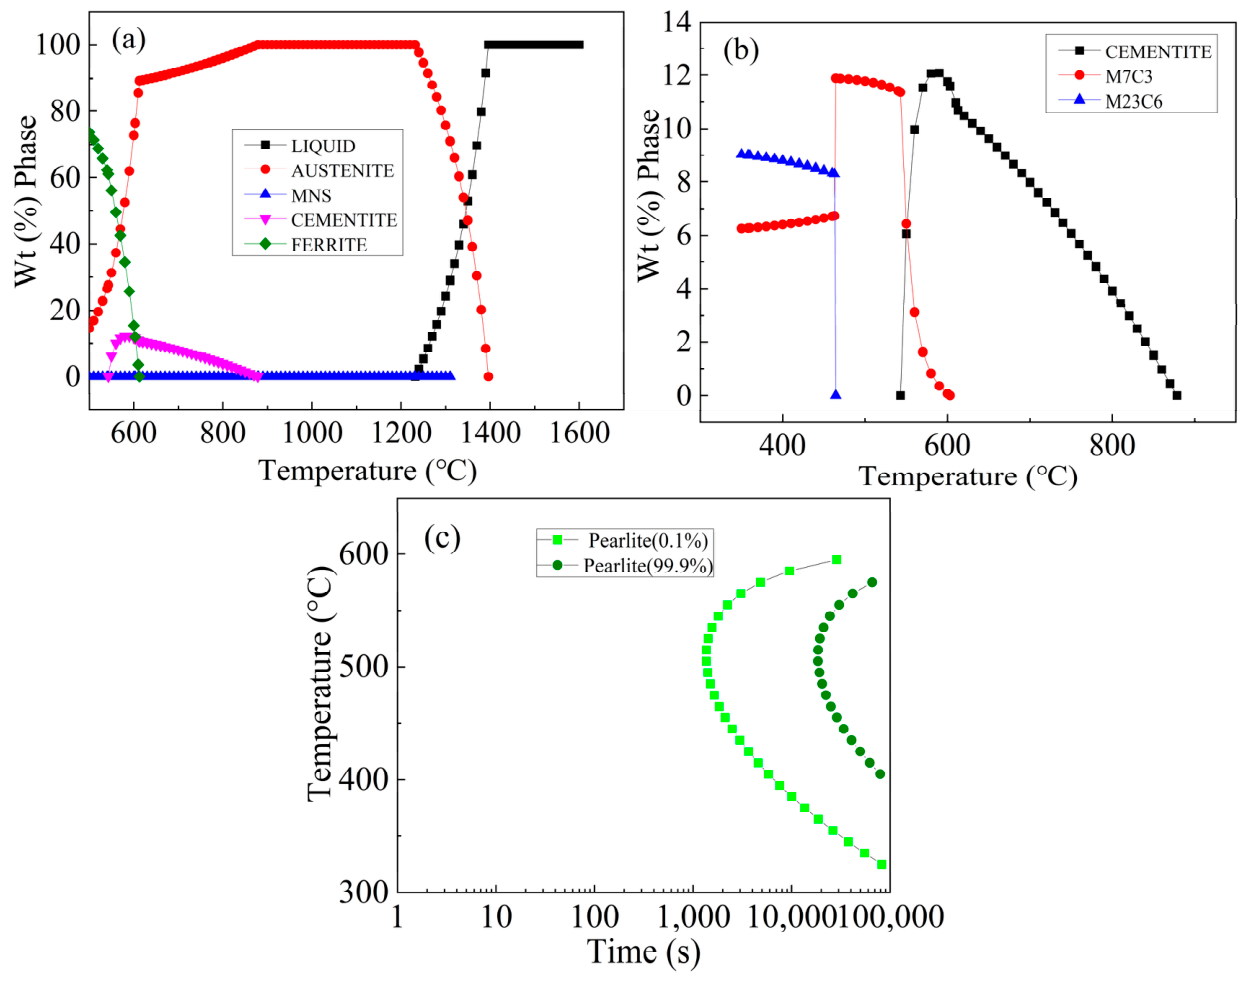
Thermodynamic and kinetic calculations using JMatPro (version 7.0) show that the complete austenitization of Mn13 steel occurs at ~875 °C, while carbide dissolution is completed above ~878 °C. To avoid the pearlite transformation sensitive zone (550–600 °C) during cooling and ensure thorough carbide dissolution without severe grain coarsening, solution temperatures of 1000, 1050, and 1100 °C were selected for subsequent heat-treatment experiments, as shown in Figure 2.
Figure 2.
JMatPro thermodynamic equilibrium and phase transformation kinetics of Mn13 steel: (a) equilibrium phase fractions as a function of temperature; (b) variation in carbide and cementite fractions with temperature; (c) TTT diagram of Mn13 steel.
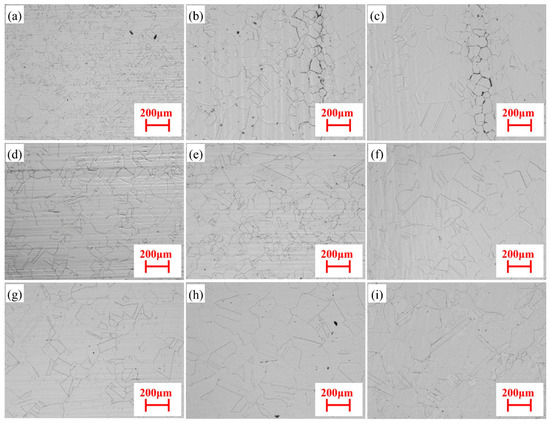
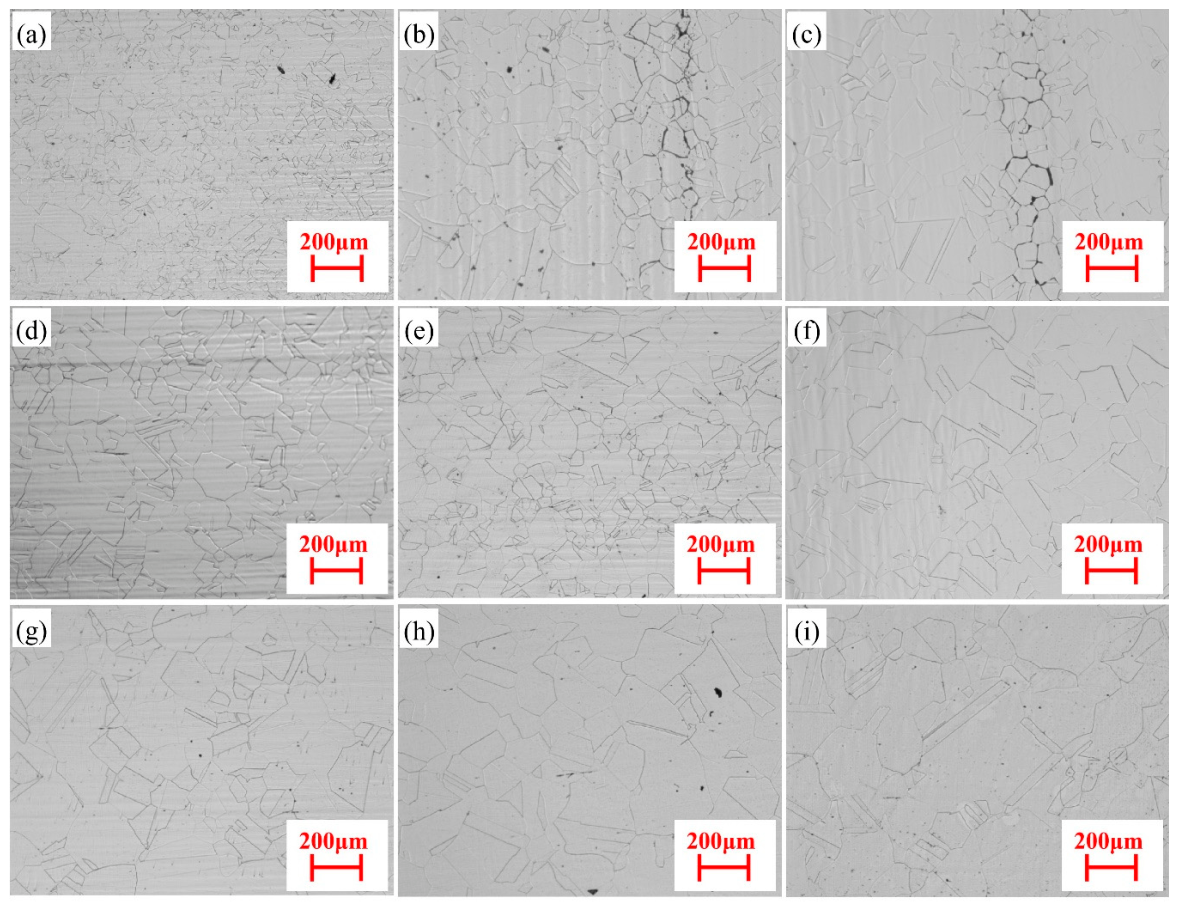
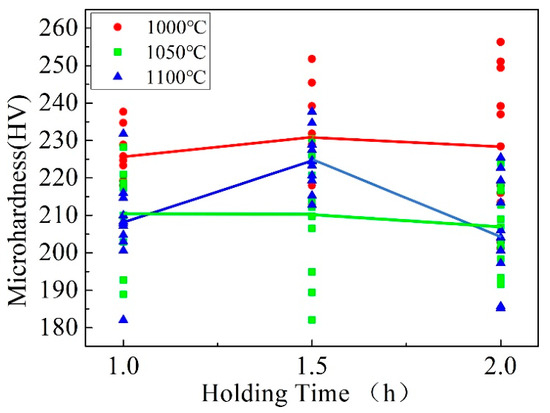
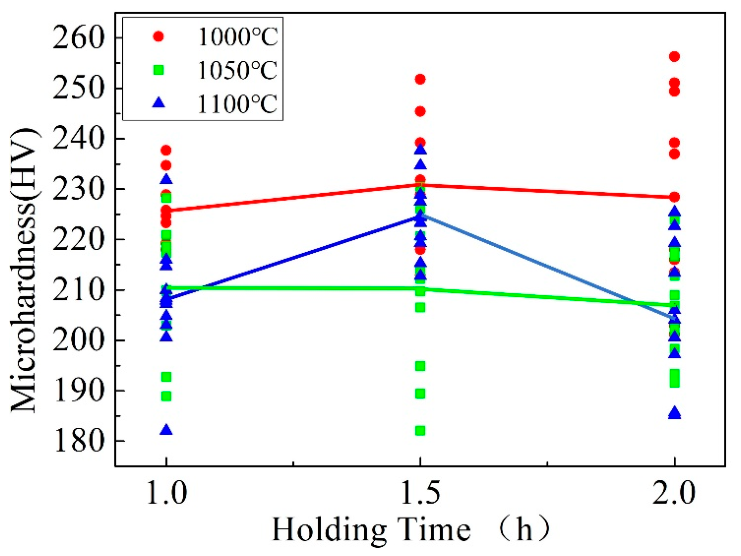
Figure 3 shows the microstructural evolution of Mn13 steel after solution treatment followed by water quenching. At 1000 °C (Figure 3a–c), residual carbides are not fully dissolved along grain boundaries, leading to microhardness fluctuations (225.8–230.6 HV, Figure 4). Treatment at 1100 °C (Figure 3g–i) achieves complete carbide dissolution; however, higher temperature markedly accelerates austenite grain coarsening with prolonged holding time, which reduces microstructural uniformity. In contrast, treatment at 1050 °C for 1–1.5 h (Figure 3d–f) results in complete carbide dissolution while maintaining a uniform, moderate grain size and stable microhardness (~206.8–210.0 HV, Figure 4). Consequently, solution treatment at 1050 °C for 1.5 h followed by water quenching provides an optimal single-phase austenitic baseline for subsequent in situ deformation studies.
Figure 3.
Microstructural evolution (50×) of Mn13 Hadfield steel after solution treatment followed by water quenching under different temperatures and holding times: (a–c) 1000 °C for 1 h, 1.5 h, and 2 h; (d–f) 1050 °C for 1 h, 1.5 h, and 2 h; (g–i) 1100 °C for 1 h, 1.5 h, and 2 h.
Figure 4.
Microhardness variation in Mn13 steel under different solution-treatment and water-quenching conditions.
3.2. Flow Stress Behavior
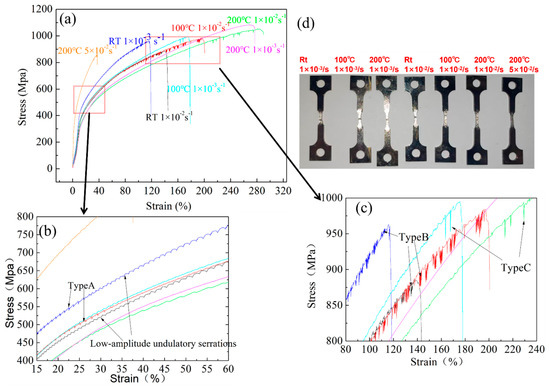
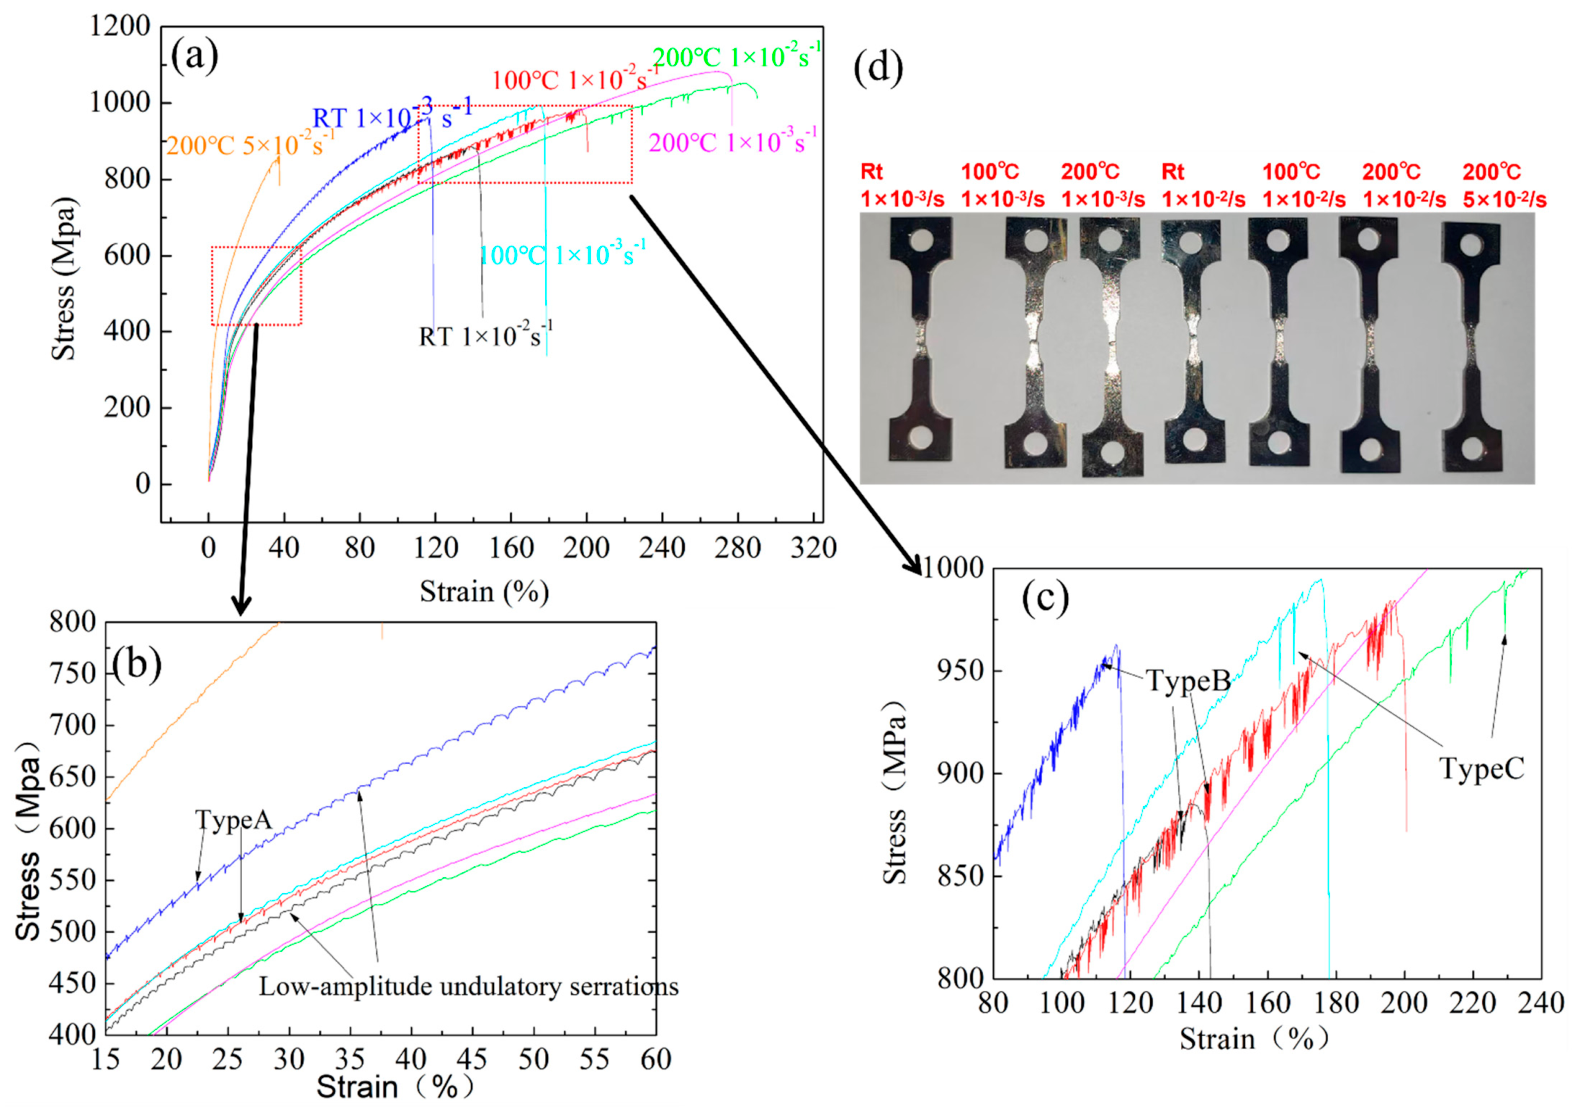
Figure 5 presents representative engineering stress–strain curves of Mn13 steel deformed at different temperatures and strain rates. Both the flow stress and serrated-flow behavior vary markedly with deformation conditions. At a given temperature, decreasing the strain rate generally increases the flow stress and yield strength, indicating negative strain-rate sensitivity, which is consistent with dynamic strain aging behavior reported for Hadfield steels [8,10,11]. The serration intensity also exhibits a non-monotonic dependence on temperature: increasing temperature does not continuously enhance serrated flow but instead strengthens the serration response only within a specific temperature–strain rate window before the response weakens or shifts to higher strains. For clarity, the marked region in Figure 5a is enlarged in Figure 5b,c. To quantitatively characterize the serrated flow behavior, serration events were analyzed using the local peak-to-valley method within the strain interval from 2% engineering strain up to the strain corresponding to the ultimate tensile strength. The stress drop magnitude (Δσ) was defined as
where σp and σv represent an adjacent local peak stress and its subsequent valley stress, respectively. A threshold of Δσ ≥ 1 MPa was adopted to define identifiable serrations. The onset strain of serrated flow was defined as the engineering strain corresponding to the first identifiable peak-to-valley stress drop satisfying Δσ ≥ 1 MPa after 2% engineering strain. Among these events, stress drops with Δσ ≥ 5 MPa were further categorized as pronounced stress drops associated with stronger intermittent plastic instability. It is worth noting that the large nominal engineering strains observed under certain high-temperature conditions (Figure 5a) stem from the geometry of the non-standard micro-specimens. The extremely short gauge length magnifies the nominal strain values during severe localized necking prior to fracture, as confirmed by the fractured specimen morphology shown in Figure 5d.
Δσ = σp − σv
Figure 5.
Stress–strain curves of Mn13 high-manganese steel at different temperatures and strain rates: (a) overall stress–strain curves; (b,c) enlarged views of the selected regions in (a); (d) photographs of the specimens after fracture.
At room temperature and 1 × 10⁻³ s−1, Mn13 steel exhibits pronounced stage-dependent serrated flow. At engineering strains of approximately 14–25%, sharp stress peaks followed by rapid stress drops first appear, and their morphology is broadly consistent with Type A serrations reported for Hadfield steel [10,11]. The average stress-fluctuation amplitude in this stage is approximately 5.03 MPa. As the strain increases to 25–70%, the sharp rise–drop serrations gradually evolve into smoother low-amplitude wave-like serrations, and the average amplitude decreases to 2.89 MPa, indicating that stress release becomes more gradual and that plastic strain is released progressively across multiple localized deformation regions. When the strain exceeds approximately 70%, numerous intermittent Type B stress drops appear, with the average amplitude increasing to 5.58 MPa and the maximum amplitude reaching 17.36 MPa. In contrast, at room temperature and 1 × 10⁻² s−1, serrated flow is delayed, typical sharp Type A serrations are not observed, and low-amplitude wave-like fluctuations appear only within 37–66% strain, with an average amplitude of 2.67 MPa. The stress fluctuations then develop an intermittent character at 66–125% strain but remain relatively small, indicating that local plastic instability is still developing. Once the strain exceeds 125%, the intermittent stress drops intensify, with the average amplitude increasing to 8.61 MPa and the maximum amplitude reaching 14.75 MPa.
At 100 °C and 1 × 10⁻² s−1, the engineering stress–strain curve shows the most pronounced and persistent serrated-flow behavior. Only a small number of Type A serrations occur at 23–70% strain, suggesting that the early-stage DSA response is still limited and that local plastic strain release is relatively dispersed. As the strain increases to 70–90%, clearer low-amplitude wave-like transitional serrations appear, and the average amplitude increases to 3.26 MPa, marking the initial transition from continuous work hardening to intermittent plastic instability. At 90–130% strain, stress fluctuations become significantly stronger; the average amplitude increases to 7.54 MPa, and the maximum amplitude reaches 15.28 MPa. This indicates that the dislocation pinning–depinning process changes from dispersed and gradual plastic strain release to more pronounced localized plastic flow. When the strain further exceeds 130%, intermittent stress drops intensify and exhibit typical Type B characteristics, with the average amplitude increasing to 10.64 MPa and the maximum amplitude reaching 22.10 MPa. After approximately 190% strain, the local stress drops become more severe, and the raw data near 191.7% strain already indicate rapid stress reduction. By comparison, at 100 °C and 1 × 10⁻³ s−1, the curve is dominated by low-amplitude fluctuations over 103–160% strain, with an average amplitude of only 1.64 MPa; distinct late-stage intermittent stress drops appear only after the strain exceeds 160%, at which point the average amplitude increases to 14.61 MPa.
At 200 °C, the overall serrated-flow response of Mn13 steel is relatively weak. Type C intermittent stress drops are observed only at strain rates of 1 × 10⁻² and 5 × 10⁻² s−1 during the late stage of tensile deformation, mainly in the high-strain regime close to fracture. This behavior is not fully consistent with previous reports showing that serrated flow in Hadfield steel is strong near 200 °C [11]. The discrepancy may arise from differences in chemical composition, initial microstructure, grain size, heat-treatment condition and the investigated strain-rate range. For the Mn13 steel examined here, although solute diffusivity is expected to increase at 200 °C, the matching between solute diffusion and dislocation waiting time appears insufficient to induce sustained and intense PLC instability. Limited Type C stress drops occur only at high strains, when dislocation density, local stress concentration and damage accumulation have increased substantially.
At a fixed strain rate, temperature mainly changes the DSA-sensitive strain range and the critical strain for serration onset. At 1 × 10⁻³ s−1, sharp Type A serrations appear in the room-temperature specimen at a relatively low strain, whereas increasing temperature weakens serrated flow and shifts it toward higher strains until it eventually disappears. This suggests that, at this low strain rate, mobile dislocations have sufficient waiting time at local obstacles for solute segregation and pinning, so further temperature increase does not necessarily strengthen observable PLC instability. Instead, higher temperature may accelerate solute redistribution, dislocation depinning and local stress relaxation, making plastic strain release more continuous and suppressing intermittent stress drops. At 1 × 10⁻² s−1, the temperature effect is more pronounced. At room temperature, the curve is mainly characterized by low-amplitude Type A and Type B serrations, indicating a relatively weak early-stage DSA response. At 100 °C, sustained and intense serrated flow appears because the solute diffusion/segregation rate more effectively matches the waiting time of mobile dislocations, allowing C atoms or Mn–C pairs to repeatedly participate in dislocation pinning–depinning. When the temperature is increased to 200 °C, Type C stress drops occur only near fracture, indicating that the DSA process no longer manifests as sustained PLC instability throughout plastic deformation but is mainly associated with dislocation-structure accumulation, local stress concentration and damage evolution at high strains. Although frequent and pronounced PLC serrations at 200 °C have been widely reported in the previous literature, serrated flow in the present Mn13 steel was largely suppressed under this condition. This discrepancy is likely due to the high sensitivity of dynamic strain aging (DSA) to microstructural and local compositional variations [12,15]. In real materials, minor differences in chemical composition and localized micro-segregation of Mn and C atoms alter the local stacking fault energy (SFE) and thermodynamic driving force for serration initiation [15]. Furthermore, variations in initial dislocation density and spatial carbon distribution (such as local carbon clustering) strongly influence the pipe diffusion efficiency and binding energy of Mn–C atom pairs with moving dislocations [8,25], thereby altering the DSA temperature boundary and accelerating rapid steady-state flow stabilization. This temperature–strain rate dependence is consistent with the classical DSA framework based on solute diffusion time and dislocation waiting time [14,15] and with recent observations that PLC behavior can change dynamically with deformation stage and local plastic-flow state [19,20].
3.3. In Situ Observation of Microstructural Evolution
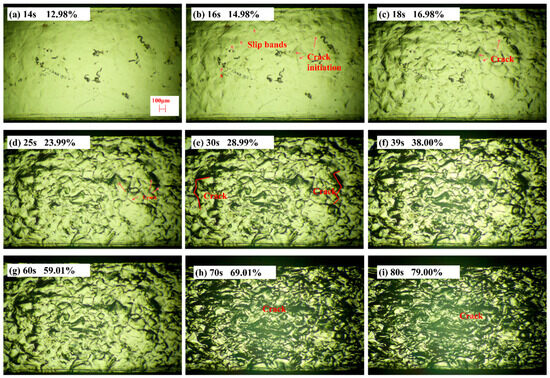
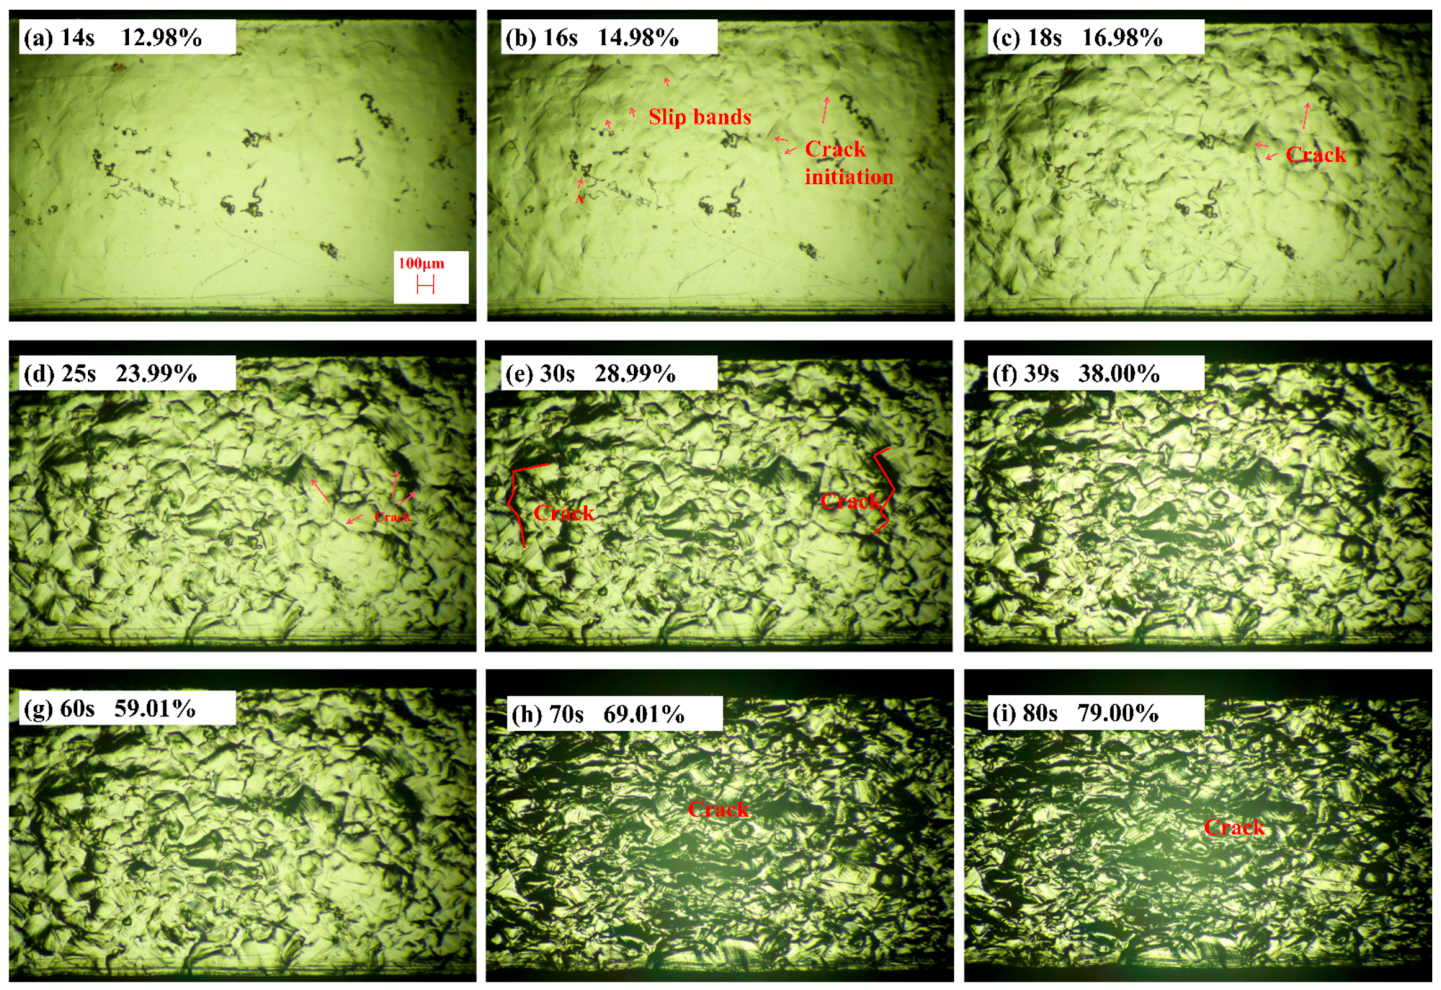
As shown in Figure 6, under 100 °C and 1 × 10⁻² s−1, the stress–strain curve begins to exhibit typical Type A serration characteristics when the tensile time reaches approximately 16 s. Compared with the image at 14 s, more pronounced surface undulations and slip traces are observed, and the local optical contrast gradually increases, indicating that plastic deformation evolves from a relatively homogeneous state toward localized deformation. Microcracks preferentially initiate at stress–concentration sites such as austenite grain boundaries and grain-boundary triple junctions, but severe macroscopic instability or rapid crack propagation is not yet observed. When deformation continues to approximately 31 s, the Type A serration stage is essentially completed; surface roughening becomes more pronounced, slip traces increase in number and locally deformed regions expand. With increasing plastic deformation, deformation incompatibility on both sides of grain boundaries intensifies, resulting in enhanced local stress/strain concentration. Microcracks initially nucleated along grain boundaries propagate laterally and gradually open under local tensile stress. Adjacent grain-boundary cracks then coalesce through crack-tip stress field interaction and accumulated grain-boundary damage, forming continuous long cracks across several grain boundaries and indicating a clear intergranular cracking tendency.
Figure 6.
In situ tensile observations of Mn13 steel deformed at 100 °C and 1 × 10⁻² s−1: (a) 14 s, 12.98% strain; (b) 16 s, 14.98% strain; (c) 18 s, 16.98% strain; (d) 25 s, 23.99% strain; (e) 30 s, 28.99% strain; (f) 39 s, 38.00% strain; (g) 60 s, 59.01% strain; (h) 70 s, 69.01% strain; (i) 80 s, 79.00% strain.
To precisely evaluate localized micro-deformation dynamics, the present study adopted the normalized cross-correlation (NCC) template-matching method combined with high-magnification CLSM. Full-field DIC techniques are highly effective for mapping macro-scale strain fields and tracking PLC-band morphology across an entire specimen gauge length [21,23]. However, DIC typically relies on spatial subset windowing, which inevitably smooths out steep local strain gradients and micro-scale displacement jumps. In contrast, the present NCC approach utilizes natural microscopic surface features to achieve sub-pixel spatial precision. This enables the detection of discrete micro-kinematic features—such as micro-arrests in Type A and localized backward relaxations in Type B serrations—that would otherwise be obscured by the subset averaging intrinsic to full-field DIC [21,22]. Therefore, while NCC provides point-based temporal and spatial precision rather than full-field continuous coverage, it offers unique microscopic insight into the localized micro-kinematics of PLC bands.
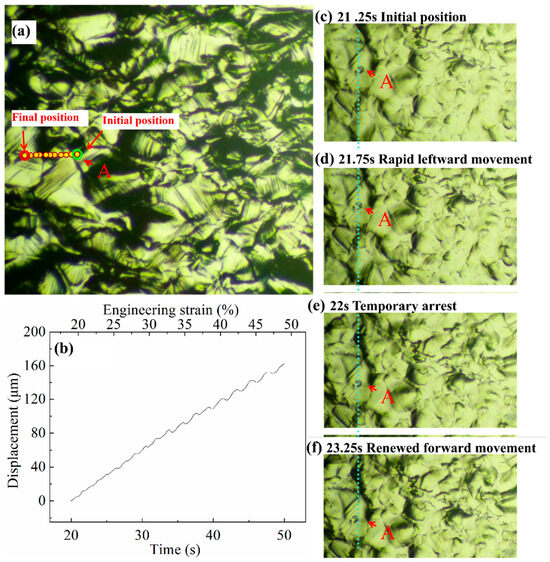
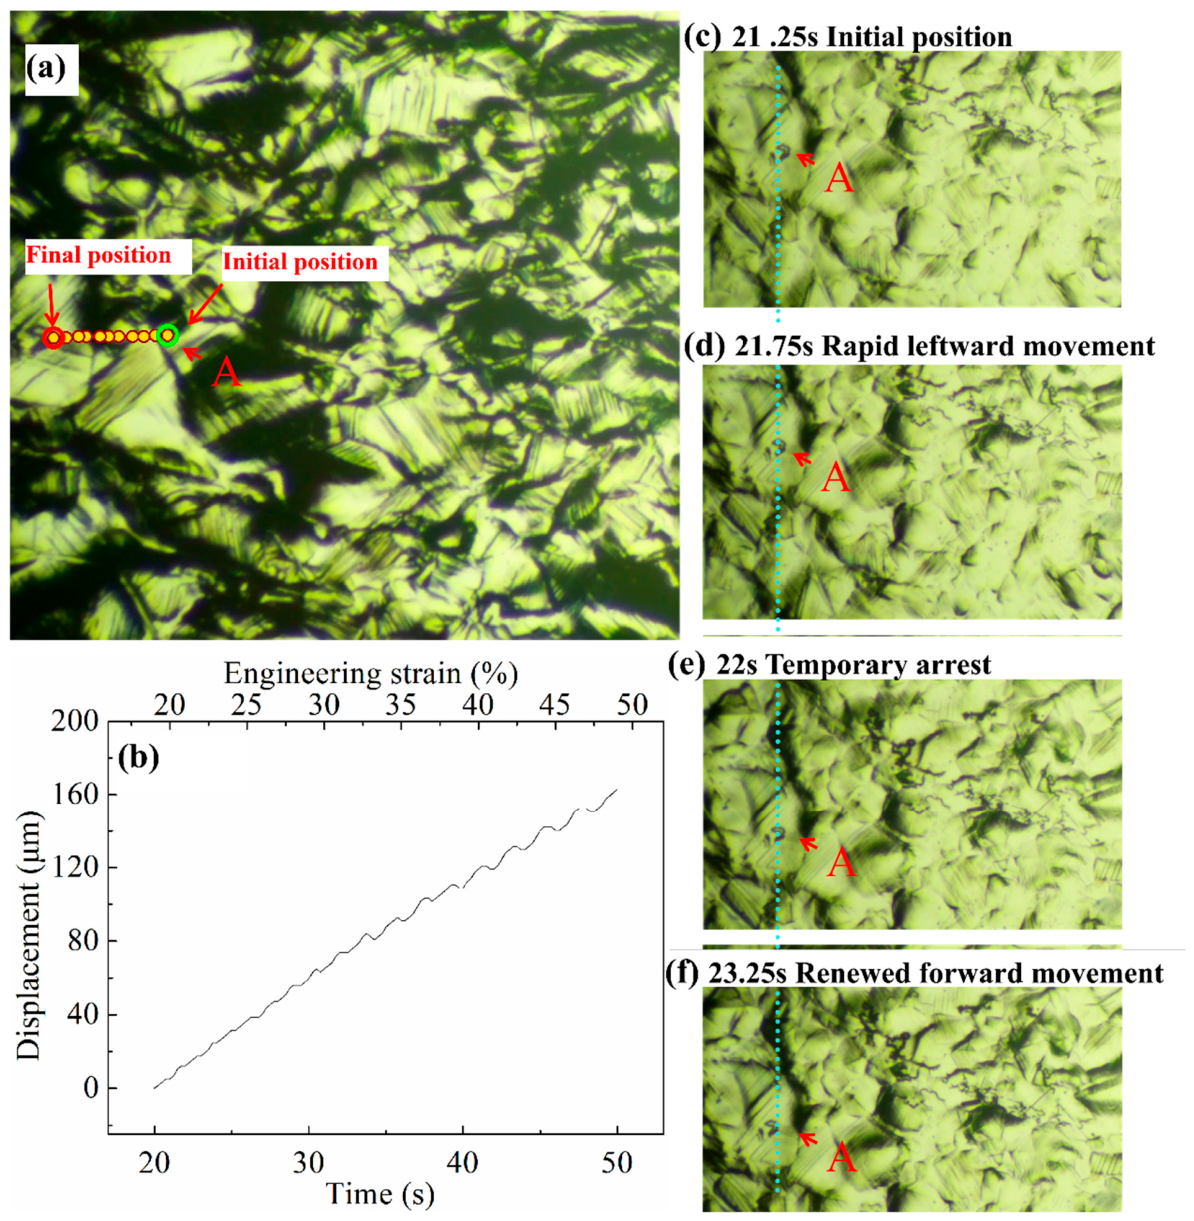
As shown in Figure 7, to quantify the motion of local surface features, a region with stable grayscale contrast near point A in the image recorded at 21 s was selected as the tracking template. A frame-by-frame local template-matching method based on normalized cross-correlation (NCC) was used to track the trajectory in the image sequence from 20 to 50 s at a sampling interval of 0.25 s. The displacement of point A does not evolve continuously and smoothly but instead shows stepwise migration characterized by rapid advance, short arrest and renewed rapid advance. During leftward motion, several short displacement plateaus are followed by local rapid displacement bursts. Although the overall migration direction remains leftward, the displacement–time response exhibits clear intermittent growth. This result indicates that early Type A serrations are not merely macroscopic stress fluctuations; rather, they correspond to intermittent motion and discontinuous displacement release of localized plastic deformation regions in the in situ images. Compared with previous studies that mainly quantified PLC bands using macroscopic curves or full-field methods [21,22,23], the present feature-tracking result provides direct microscopic evidence for the local trajectory behavior associated with Type A serrations in Mn13 steel.
Figure 7.
Motion trajectory corresponding to Type A serrations: (a) The green marker indicates the initial position of point A at 21.25 s, and the red marker indicates the position of point A at 50 s; (b) the displacement–time curve of point A; (c–f) the motion trajectory of point A from 21.25 to 23.25 s.
As the tensile time increases to 60–80 s, the specimen surface enters a transition stage from low-amplitude wave-like fluctuations to intermittent Type B stress drops. At approximately 60 s, dense slip traces and pronounced deformation-induced surface relief have formed, and the local bright–dark contrast is significantly enhanced, indicating substantial accumulation of heterogeneous surface plastic deformation. Within 70–80 s, local optical contrast and surface relief evolve more strongly, and local deformation bands and microcracks near grain boundaries become clearer. These in situ observations indicate that low-amplitude wave-like serrations reflect progressive localized plastic strain accumulation and continuous development of strain localization under DSA, rather than simple weak stress perturbations. When the tensile time reaches approximately 81 s, the stress–strain curve enters the intermittent Type B stress-drop stage.
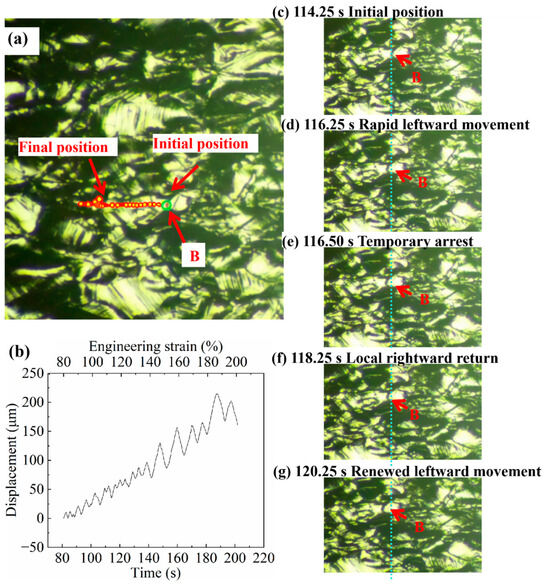
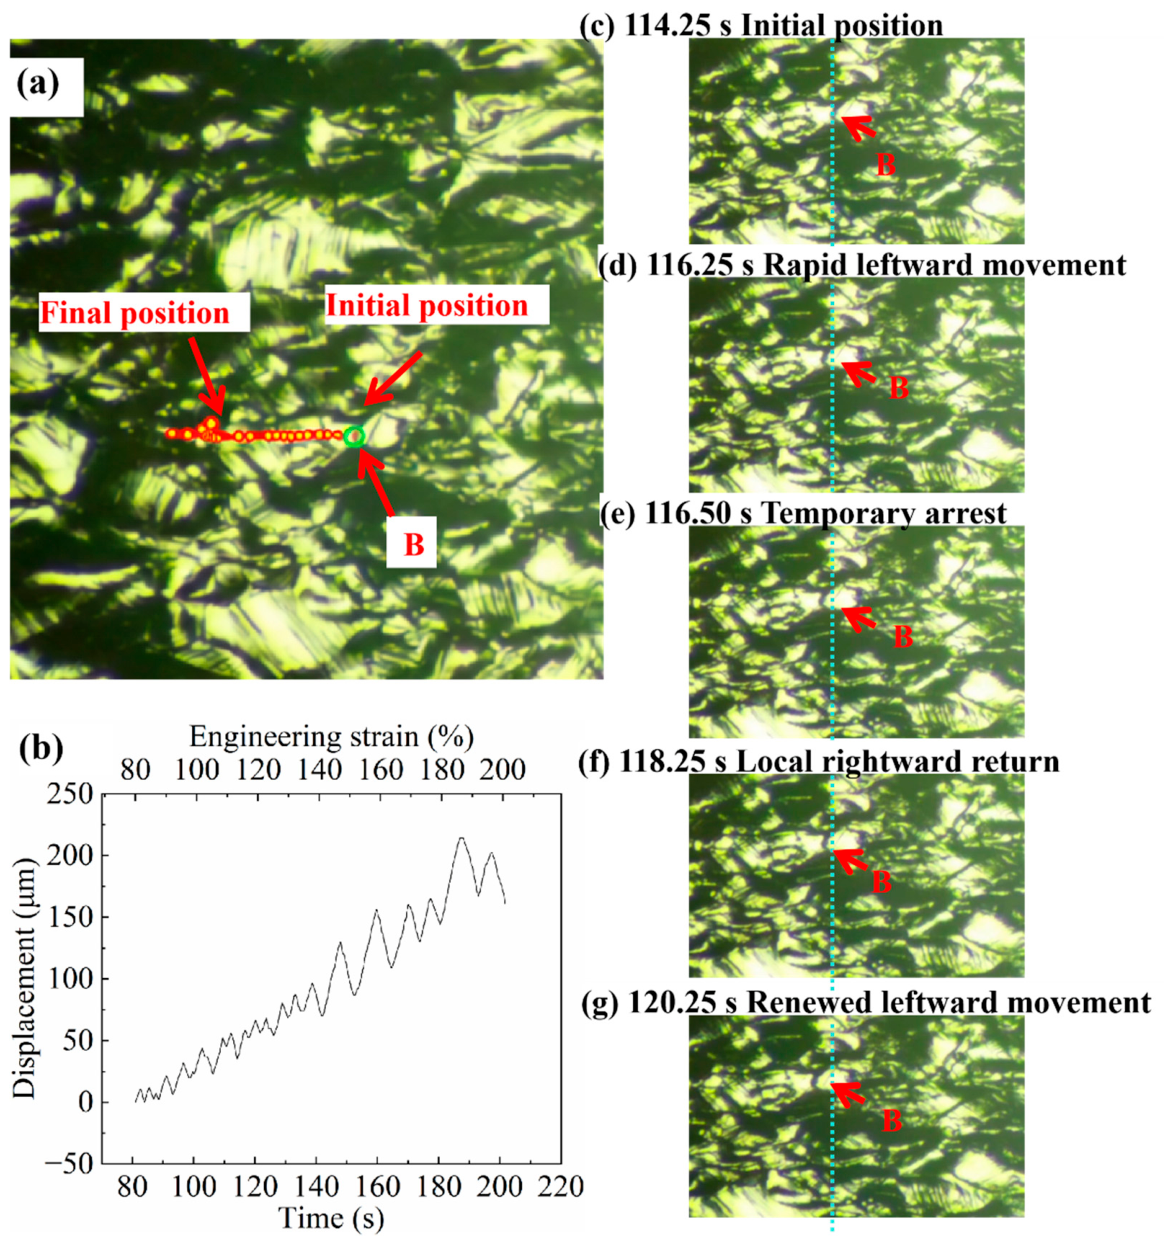
As tensile time increases further, the stress–strain response transitions into a regime characterized by intermittent Type B stress drops. To track localized plastic deformation, Point B was designated as a distinct grain boundary protrusion in Figure 8a. The strict temporal synchronization of its displacement jumps with Type B stress drops supports that the captured motion is physically real. The complete displacement–time record in Figure 8b, covering 81.00–201.75 s, shows that Point B has an overall leftward migration trend; however, its displacement does not evolve continuously or steadily. Instead, the curve shows discontinuous stepwise migration, characterized by alternating rapid forward motion, short arrest, local retreat, and renewed forward motion. The image sequence in Figure 8c–g is a representative 6.00 s interval (114.25–120.25 s) selected from this full record to visualize these intermittent events. In this representative interval, Point B undergoes rapid leftward motion from 114.25 to 116.25 s, a temporary arrest at 116.50 s, a local rightward return at 118.25 s, and renewed leftward motion at 120.25 s. This behavior indicates that local plastic deformation at this stage is highly intermittent and localized rather than uniformly continuous. Overall, the discontinuous displacement trajectory of point B corresponds well to Type B serrated flow. Rapid forward motion can be regarded as instantaneous activation of localized deformation bands and concentrated plastic-strain release, whereas short arrest and local retreat reflect strain redistribution and elastic recovery after stress drops. Thus, macroscopic Type B stress drops correspond in the in situ images to discontinuous jump-like propagation of localized plastic deformation rather than stable homogeneous plastic flow.
Figure 8.
Motion characteristics of the tracked surface feature associated with Type B serrations: (a) initial and final positions of point B, with the green and red markers indicating their positions at 114.25 and 120.25 s, respectively; (b) displacement–time curve of point B; (c–g) sequential trajectory of point B during 114.25–120.25 s.
The local migration trajectories of surface features tracked via NCC may be influenced by grain-orientation heterogeneity and intergranular compatibility constraints. Although crystallographic orientations were not measured directly in the present study, deformation incompatibility between neighboring grains and the constraint imposed by grain boundaries can affect the local propagation of PLC-related deformation. During the Type A stage, localized deformation may undergo repeated advance, temporary arrest, and renewed advance as deformation is transferred between adjacent constrained grains, giving rise to the observed unidirectional stepwise migration. During the Type B stage, macroscopic stress drops may induce local stress redistribution and elastic strain relaxation in neighboring constrained regions. Under high-magnification CLSM tracking, these transient processes may manifest as short arrests, local backward displacement shifts, or path deflections before renewed forward motion. Therefore, while macroscopic serration modes are primarily governed by temperature and strain rate, the local trajectory fluctuations of selected surface features may additionally reflect intergranular compatibility constraints and local microstructural heterogeneity.
Under 100 °C and 1 × 10⁻³ s−1, two relatively pronounced Type C stress drops were identified in the stress–strain curve at approximately 27 min 14 s and 27 min 56 s. In the in situ image sequence acquired at the same timestamps, no persistent directional propagation of a trackable surface feature could be resolved, in contrast to the relatively regular migration behavior observed during the Type A and Type B serration stages. Instead, only localized optical-contrast changes and slight positional adjustments were observed. These observations suggest that the deformation associated with Type C serrations is more instantaneous and spatially localized than the trackable band-like migration associated with Type A and Type B serrations. Such behavior is consistent with the commonly accepted interpretation that Type C serrations are associated with localized, random, and abrupt plastic events [16,17,18]. After dislocations are strongly pinned by solute atoms, abrupt depinning may occur and cause rapid stress reduction; however, because this process is transient and spatially confined, a reproducible continuous feature trajectory cannot be readily resolved within the temporal resolution and field of view of the present in situ observation.
4. Conclusions
(1) Thermodynamic calculations and solution-treatment experiments show that a relatively homogeneous single–phase austenitic microstructure can be obtained in Mn13 high-manganese steel after being held at 1050 °C for 1–1.5 h and then water-quenched.
(2) The flow behavior of Mn13 steel exhibits significant sensitivity to temperature and strain rate. The most pronounced and persistent serrated flow is observed at room temperature at 1 × 10⁻³ s−1 and 100 °C at 1 × 10⁻² s−1. Under these conditions, marked intermittent Type B stress drops occur during the later stage of deformation. In contrast, Type C serrations mainly occur at high strains during the later stages of tensile deformation under the conditions of 100 °C at 1 × 10⁻³ s−1, 200 °C at 1 × 10⁻² s−1, and 200 °C at 5 × 10⁻² s−1. No serrations of any type are observed at 200 °C and 1 × 10⁻³ s−1. These results demonstrate that different temperature–strain rate combinations significantly alter the occurrence mode of PLC–type plastic instability.
(3) In situ microscopic observation and marker tracking reveal distinct local deformation behaviors corresponding to different serration types. During the Type A stage, the tracked surface feature mainly exhibits unidirectional stepwise migration, characterized by forward motion, arrest and renewed forward motion. During the Type B stage, discontinuous pulsed migration occurs through alternating rapid forward motion, short arrest, local backward motion and renewed forward motion, indicating jump-like propagation of localized deformation bands accompanied by strain redistribution and elastic recovery after stress drops. Near Type C stress drops, no regular macroscopic migration trajectory is observed; only local brightness variations and slight positional adjustments occur, indicating that the corresponding plastic instability is more instantaneous and localized.
Author Contributions
Conceptualization, M.G. and Y.L. (Yang Liu); methodology, M.G. and Y.L. (Yang Liu); validation, Y.Z., Q.L. and L.C.; formal analysis, M.G. and L.C.; investigation, M.G., Y.L. (Yaqiang Li) and Q.L.; resources, Y.L. (Yang Liu); data curation, M.G., Q.L. and L.C.; writing—original draft preparation, M.G. and Y.Z.; writing—review and editing, Y.L. (Yang Liu), Y.Z., Y.L. (Yaqiang Li), Q.L. and L.C.; visualization, M.G.; supervision, Y.L. (Yang Liu) and Y.Z.; project administration, Y.L. (Yang Liu); funding acquisition, M.G. and Y.L. (Yaqiang Li). All authors have read and agreed to the published version of the manuscript.
Funding
This research was funded by the Fundamental Research Funds for the Central Universities, grant number FRF–TP–22–011A1; the Science Research Project of Hebei Education Department, grant number BJK2024024; and the Science and Technology Plan Project of Xingtai, grant number 2024zz015.
Data Availability Statement
The original contributions presented in this study are included in the article. Further inquiries can be directed to the corresponding author.
Acknowledgments
The authors acknowledge the experimental support provided during the in situ tensile observations and microstructural characterization.
Conflicts of Interest
The authors declare no conflicts of interest.
References
- Dziubek, M.; Rutkowska-Gorczyca, M.; Dudziński, W.; Grygier, D. Investigation into changes of microstructure and abrasive wear resistance occurring in high manganese steel X120Mn12 during isothermal annealing and re-austenitisation process. Materials 2022, 15, 2622. [Google Scholar] [CrossRef] [Scilit] [PubMed]
- Wang, Z.K.; Yang, Y.; Chen, C.; Li, Y.G.; Yang, Z.N.; Lv, B.; Zhang, F.C. Effect of surface impacting parameters on wear resistance of high manganese steel. Coatings 2023, 13, 539. [Google Scholar] [CrossRef] [Scilit]
- Russakova, A.; Zhilkashinova, A.; Alontseva, D.; Abilev, M.; Khozhanov, A. Effect of the dislocation substructure parameters of Hadfield steel on its strain hardening. Materials 2023, 16, 1717. [Google Scholar] [CrossRef] [Scilit] [PubMed]
- Jafarian, H.R.; Sabzi, M.; Eivani, A.R.; Park, N. The influence of austenitization temperature on microstructural developments, mechanical properties, fracture mode and wear mechanism of Hadfield high manganese steel. J. Mater. Res. Technol. 2021, 10, 819–831. [Google Scholar] [CrossRef] [Scilit]
- Tęcza, G.; Mordyl, N.; Bracka-Kęsek, K. The effect of heat treatment on the microstructure and hardness of an austenitic matrix of high-manganese cast steel with the addition of molybdenum. Arch. Foundry Eng. 2025, 25, 27–34. [Google Scholar] [CrossRef] [Scilit]
- Agunsoye, J.O.; Talabi, S.I.; Bello, S.A.; Awe, I.O. Wear characteristics of heat-treated Hadfield austenitic manganese steel for engineering application. Adv. Prod. Eng. Manag. 2015, 10, 97–107. [Google Scholar] [CrossRef] [Scilit]
- Rittel, D.; Roman, I. Tensile fracture of coarse-grained cast austenitic manganese steels. Metall. Trans. A 1988, 19, 2269–2277. [Google Scholar] [CrossRef] [Scilit]
- Canadinc, D.; Efstathiou, C.; Sehitoglu, H. On the negative strain rate sensitivity of Hadfield steel. Scr. Mater. 2008, 59, 1103–1106. [Google Scholar] [CrossRef] [Scilit]
- Efstathiou, C.; Sehitoglu, H. Strain hardening and heterogeneous deformation during twinning in Hadfield steel. Acta Mater. 2010, 58, 1479–1488. [Google Scholar] [CrossRef] [Scilit]
- Zhang, L.; Guo, P.; Wang, G.; Liu, S. Serrated flow and failure behaviors of a Hadfield steel at various strain rates under extensometer-measured strain control tensile load. J. Mater. Res. Technol. 2020, 9, 1500–1508. [Google Scholar] [CrossRef] [Scilit]
- Dastur, Y.N.; Leslie, W.C. Mechanism of work hardening in Hadfield manganese steel. Metall. Trans. A 1981, 12, 749–759. [Google Scholar] [CrossRef] [Scilit]
- Bayraktar, E.; Khalid, F.; Levaillant, C. Deformation and fracture behaviour of high manganese austenitic steel. J. Mater. Process. Technol. 2004, 147, 145–154. [Google Scholar] [CrossRef] [Scilit]
- Wang, X.; Li, D.Y. Wear behaviour of nanocrystallised Hadfield steel. Wear 2013, 305, 105–111. [Google Scholar] [CrossRef] [Scilit]
- Ko, S.W.; Park, H.; Yoo, I.; Kim, H.; Lee, J.; Hwang, B. In-situ observation of high-temperature fracture behaviour of 347 stainless steel subjected to simulated welding process. Arch. Metall. Mater. 2021, 66, 1019–1022. [Google Scholar] [CrossRef] [Scilit]
- Fojt-Dymara, G.; Opiela, M.; Borek, W. Susceptibility of high-manganese steel to high-temperature cracking. Materials 2022, 15, 8198. [Google Scholar] [CrossRef] [Scilit] [PubMed]
- Hosseini, V.; Harati, E.; Särnerblom, B.; Andersson, J. Hot-stage microscopy and tensile test of Haynes 282 superalloy. J. Alloys Compd. 2026, 1050, 185550. [Google Scholar] [CrossRef] [Scilit]
- van den Beukel, A. Theory of the effect of dynamic strain aging on mechanical properties. Phys. Status Solidi A 1975, 30, 197–206. [Google Scholar] [CrossRef] [Scilit]
- McCormick, P.G. Theory of flow localisation due to dynamic strain ageing. Acta Metall. 1988, 36, 3061–3067. [Google Scholar] [CrossRef] [Scilit]
- Rodriguez, P. Serrated plastic flow. Bull. Mater. Sci. 1984, 6, 653–663. [Google Scholar] [CrossRef] [Scilit]
- Chihab, K.; Estrin, Y.; Kubin, L.P.; Vergnol, J. The kinetics of the Portevin–Le Chatelier bands in an Al–5at%Mg alloy. Scr. Metall. 1987, 21, 203–208. [Google Scholar] [CrossRef] [Scilit]
- Hähner, P.; Rizzi, E. On the kinematics of Portevin–Le Chatelier bands: Theoretical and numerical modelling. Acta Mater. 2003, 51, 3385–3397. [Google Scholar] [CrossRef] [Scilit]
- Wesselmecking, S.; Song, W.; Bleck, W. Dynamic and static strain aging in a high-manganese steel. Steel Res. Int. 2022, 93, 2100707. [Google Scholar] [CrossRef] [Scilit]
- Lee, S.-Y.; Chettri, S.; Sarmah, R.; Takushima, C.; Hamada, J.; Nakada, N. Serrated flow accompanied with dynamic type transition of the Portevin–Le Chatelier effect in austenitic stainless steel. J. Mater. Sci. Technol. 2023, 133, 154–164. [Google Scholar] [CrossRef] [Scilit]
- Yamasaki, S.; Miike, T.; Mitsuhara, M.; Nakashima, H.; Akiyoshi, R.; Nakamura, T.; Kimura, S. Quantitative analysis of the Portevin–Le Chatelier effect by combining digital image correlation and dead-weight-type tensile test. Mater. Sci. Eng. A 2021, 816, 141277. [Google Scholar] [CrossRef] [Scilit]
- Xu, J.; Liu, L.; Hopperstad, O.S.; Holmedal, B.; Mánik, T.; Marthinsen, K. A simple method enabling efficient quantitative analysis of the Portevin–Le Chatelier band characteristics. Scr. Mater. 2023, 222, 115027. [Google Scholar] [CrossRef] [Scilit]
- Liu, G.-L.; Li, Y.-R.; Huang, G.-Y.; Ke, L.-L.; Wang, Y.-Z. Characterization of Portevin–Le Chatelier effect in aluminum alloy AA5052 under strain-controlled tensile test via digital image correlation and acoustic emission. J. Mater. Sci. 2024, 59, 16341–16354. [Google Scholar] [CrossRef] [Scilit]

Disclaimer/Publisher’s Note: The statements, opinions and data contained in all publications are solely those of the individual author(s) and contributor(s) and not of MDPI and/or the editor(s). MDPI and/or the editor(s) disclaim responsibility for any injury to people or property resulting from any ideas, methods, instructions or products referred to in the content. |
© 2026 by the authors. Licensee MDPI, Basel, Switzerland. This article is an open access article distributed under the terms and conditions of the Creative Commons Attribution (CC BY) license.