


Abstract
The manuscript aims to analyze the properties of gray cast iron EN GJL-250 as a function of the charge composition with an emphasis on microhardness and indentation size effect (ISE). Three compositions of cast iron were used: cast iron A as traditionally produced cast iron, B and C as inoculated and overheated cast iron micro-alloyed with FeTi70. The authors used the cutting method to assess residual stresses in castings with a stress grid designed according to Sipp. The specimens from thick and thin bars of the grid, after determination of residual stresses, were used for uniaxial tensile tests, measurement of the hardness (HBW, HV, and Vickers microhardness), metallographic, and fractographic analysis. Results of microhardness were used for the determination of ISE indices, and “true hardness” was calculated. The effect of composition has a statistically significant effect (single ANOVA; specimens from thick and thin bars are considered together) only for Meyer index n, and in the case of thick bars, also for HBW and HV.
1. Introduction
Gray cast iron is an alloy of iron and carbon (with a carbon content of around 3%) in which carbon is segregated in the form of flake graphite. Due to this structure, it is extremely popular in mechanical engineering for its excellent fluidity, easy machinability, and low price. Graphite flakes absorb vibration and noise perfectly. Graphite acts as a self-lubricant and chip breaker, which saves tools during machining. Cast iron has good fluidity and easily fills complex shapes with a low shrinkage rate. Thanks to graphite, it has excellent sliding properties, but it is brittle and has a lower tensile strength, on the other hand. However, graphite particles interrupt the metal matrix and essentially act as unwanted notches. The minimum tensile strength of 250 MPa is sufficient for many structural applications while maintaining tensile brittleness. The advantages of gray cast iron are good availability of raw materials, simple casting processes, and low requirements for final treatment of castings. The higher thermal conductivity of gray cast iron, often exceeding that of steel, enables effective heat dissipation, which makes it a material for engine blocks, brake disks, and machine tool bases. Limitations for use in construction practice are primarily the occurrence of brittle fracture under tensile stress, difficult welding, and, as regards foundry properties, susceptibility to shrinkage and porosity. These are related to the problem of residual stresses in the casting, which are also addressed in the articles [1,2].
The aim of the submitted manuscript is to analyze the influence of the composition of three types of gray cast iron (A, B, C) on the microstructure, strength, macro- and microhardness, fracture characteristics, and residual stresses: macro using the Sipp grid and micro using the Identification Size Effect (ISE) analysis.
2. Materials and Methods
By employing Meyer’s law, the Proportional Specimen Resistance (PSR) model, and the Hays–Kendall approach, the microhardness and also indices of ISE were determined, which will allow, among other things, the determination of residual (micro)stresses in a practically non-destructive manner. This work complements recent studies on other metals [3], providing comprehensive data essential for industrial applications.
Hardness measurements represent one widely employed technique for characterizing the mechanical properties of materials, offering almost non-destructive testing capabilities. In particular, microhardness measurement causes minimal damage to the surface and is also applicable to final products. The independence of the (macro)hardness on test load is an advantage of the Vickers test because Vickers indentations are geometrically similar at all test loads. For homogeneous materials, it is therefore expected that constant values of the hardness.
Considering the recommendation of the standard ISO 14577-1 [4], the loads for the microhardness tests are less than 2 N (~200 gf), with the depth of indentation h > 0.2 μm. However, the interpretation of microhardnessdata is complicated by the Indentation Size Effect (ISE), which manifests itself in a systematic dependence on applied test load. The ISE is a deviation from load-independent hardness, typically characterized by increasing or decreasing hardness with decreasing indentation load. As eloquently stated by Westbrook and Conrad, “hardness measurements are both the most infamous and the most magnificent of physical measurements,” precisely due to this phenomenon, which makes the interpretation of experimental results difficult [5,6,7].
If the measured hardness value decreases with increasing load, this phenomenon is called a “normal” indentation size effect (ISE). According to Gong et al. [6], measuring the hardness to characterize materials may result in some unreliable conclusions. In the literature, many examples exist that reveal that the “normal” ISE occurs in brittle materials.
A reverse (inverse, RISE) type of ISE exists, in contrast to “normal” ISE. In the reverse ISE, the apparent microhardness increases with increasing testing load. It mostly takes place in materials with plastic deformation—metals, plastic materials. As shown by Sangwal, reverse ISE can be explained by the existence of a distorted zone near the specimen–indenter (crystal–medium) interface, the vibration of the indenter, the applied energy loss around the indentation, and the generation of cracks [6,8].
The phenomenon of ISE, its magnitude, and character can be evaluated by measurements with a gradually increasing load. In addition to the intrinsic value of microhardness, it is also possible to calculate indices that provide additional information about the tested material, including residual (micro)stress as well as “true” microhardness that is not affected by the load.
In the operating conditions of the Slovak Foundry, experimental meltings were realized. Cast iron EN GJL-250, characterized by a degree of saturation (Sc) in the range from 0.87 to 0.93, a carbon content (C) between 3.1% and 3.3%, and a silicon content (Si) between 1.7% and 1.9%, was the experimental material.
The portion of steel scrap in the charge varied. Various metallurgical interventions were implemented to mitigate the possible negative impacts of the increased amount of steel scrap on the foundry, increase mechanical properties, and reduce residual stresses in castings.
Melting in the foundry takes place in two Otto Junker electric induction furnaces with a capacity of 2 × 6 tons [9].
Gray cast iron from these melts was used as an experimental material in three modifications:
- Cast iron produced traditionally (Melt No. 1);
- Inoculated cast iron (FeSi75), overheated to 1500 °C, micro-alloyed FeTi70 (Melt No. 3);
- Synthetic cast iron, inoculated with FeSi75, overheated to 1500 °C, and micro-alloyed with FeTi70 (Melt No. 6).
The composition of the charge material and overheating temperature of the melts are in Table 1; the chemical composition and measured mechanical properties are in Table 2 ([9], where melt No. 1 = A, 3 = B, 6 = C).
Table 1.
The composition of the charge material and the overheating temperature of the melts.
Table 2.
The chemical composition of the cast iron.
The Degree of Saturation, where Sc indicates how close the alloy is to the eutectic composition, and the Carbon Equivalent CE measures the total carbon and silicon content to predict casting properties and matrix structure.
The combination of these two parameters directly determines the nature of the resulting lamellar graphite (thickness, length, and distribution) and the metal matrix (ferritic, pearlitic, or mixed), from which the mechanical properties depend.
High CE and Sc: The melt has excellent fluidity and low shrinkage. The risk of shrinkage and pores is reduced. They lead to thicker graphite flakes and a higher proportion of ferrite in the matrix. The result is lower tensile strength, but on the other hand, better thermal conductivity, excellent machinability, and high vibration damping ability. Too high values of both indices cause the exclusion of large unwanted crystals of primary graphite (so-called “floating graphite”), which drastically reduces the strength of the material.
Low CE and Sc: The melt solidifies faster, more primary austenite is formed, but in thick-walled castings, there is a risk of defects due to greater volumetric shrinkage. They promote the formation of finer lamellar graphite and a predominantly pearlitic matrix. Such gray cast iron exhibits higher tensile strength (e.g., grade EN-GJL-250 to EN-GJL-350) and higher hardness. Extremely low CE values lead to undercooling of the melt and the formation of a hard and brittle ledeburitic (white) structure at the edges of the casting.
A stress grid according to Sipp was cast from each of the tested cast irons; the method of casting used is described in more detail in [9].
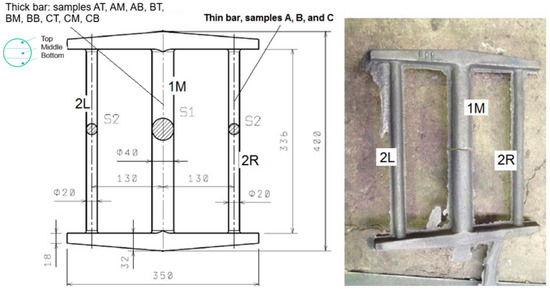
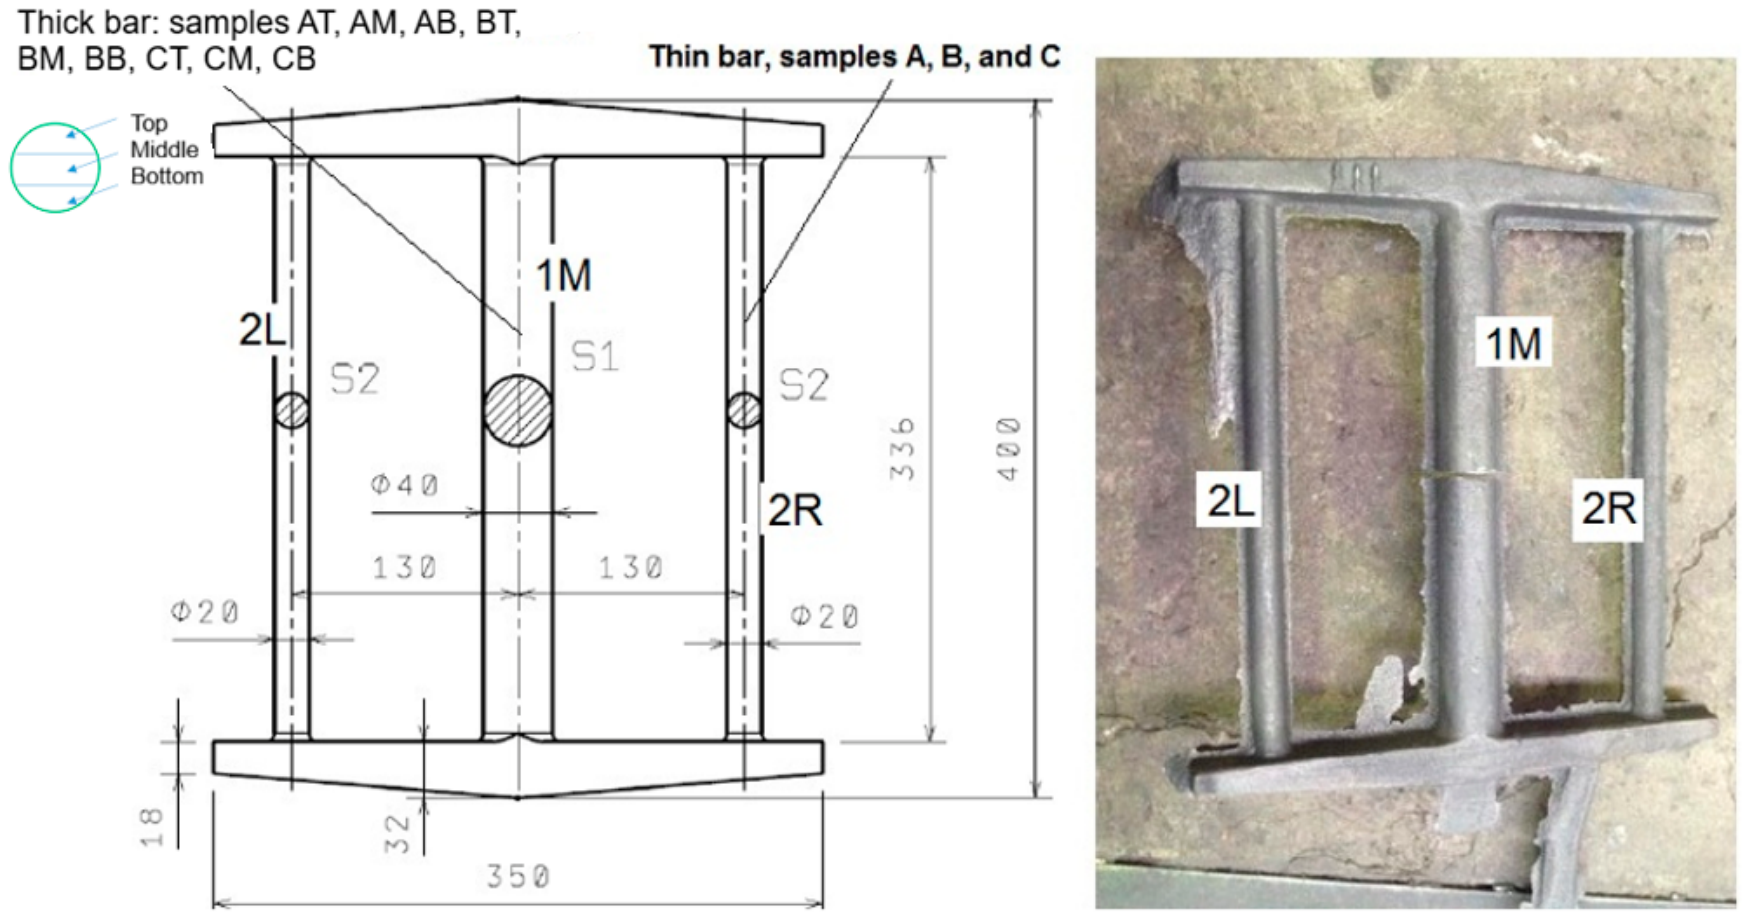
In this study, the authors used the cutting method, which is classified as a destructive technique, to assess residual stresses in castings. Measurements were performed on the grid [9,10,11]. Its specific shape and dimensions are shown in Figure 1.
Figure 1.
The stress grid was designed according to Sipp. Reprinted from Ref. [9].
The principle of the residual (macro) stress measurement process involves cutting through a thick bar and subsequently analyzing the dimensional changes that occur in the casting as a result of the inherent residual stresses. The residual stresses arise due to the higher cooling and shrinkage rate of the thick bar (marked 1M) in the temperature region of elastic deformation compared to the thinner bars (marked 2L and 2R), which are nearly cooled at that time, preventing the thick bar from shrinking. Table 3 shows the measured values of the strains read at the end of the measurement. Since the data were read at the end of the measurement (after the casting was cut), it can be concluded that the different values at the top and bottom of the bars are due to the temperature effect in the cooling process of the casting. From the measured data in the upper and lower fibers in the same cross-section, when considering tensile and bending stresses, only the axial stress component can be determined from the stress distribution over the height of the cross-section; see Table 4. The measured positive value means that after the casting was cut, the bar, which was compressed before cutting, elongated. That is, a positive value of the measured strains corresponds to compressive residual stresses, and, conversely, a negative value corresponds to tensile residual stresses.
Table 3.
Measured strains after cutting the castings [9]. Reprinted from Ref. [9].
Table 4.
Values of strain in cast rods excluding bending [9]. Reprinted from Ref. [9].
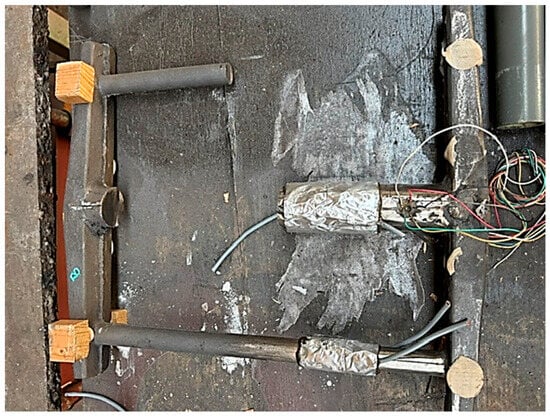
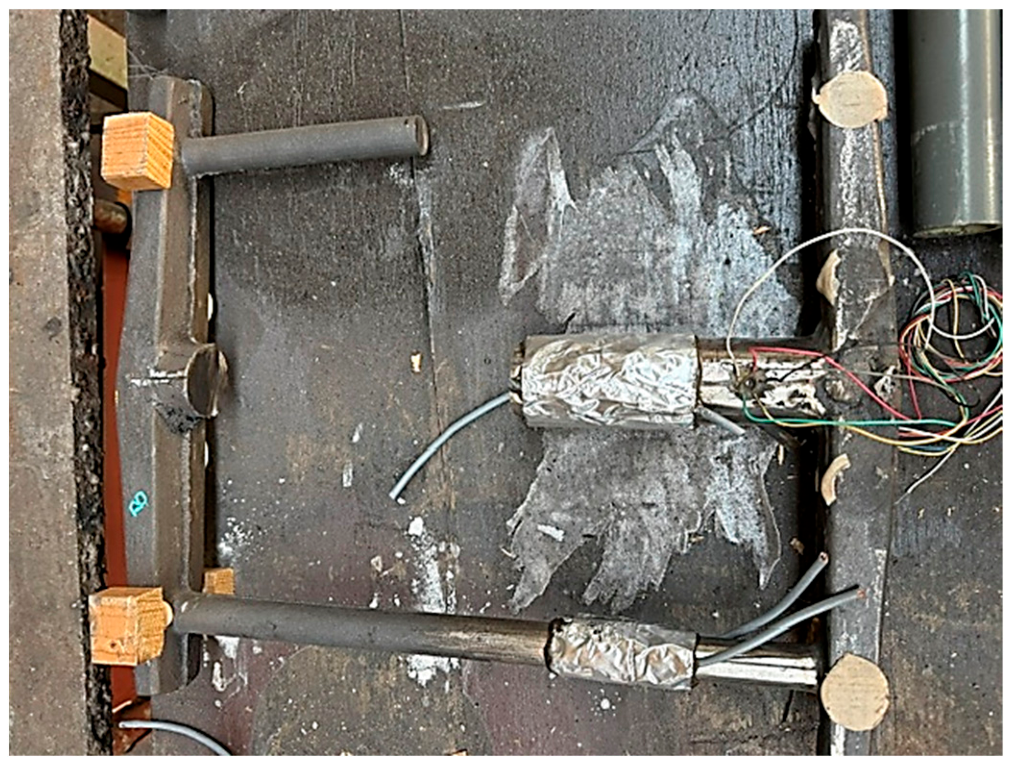
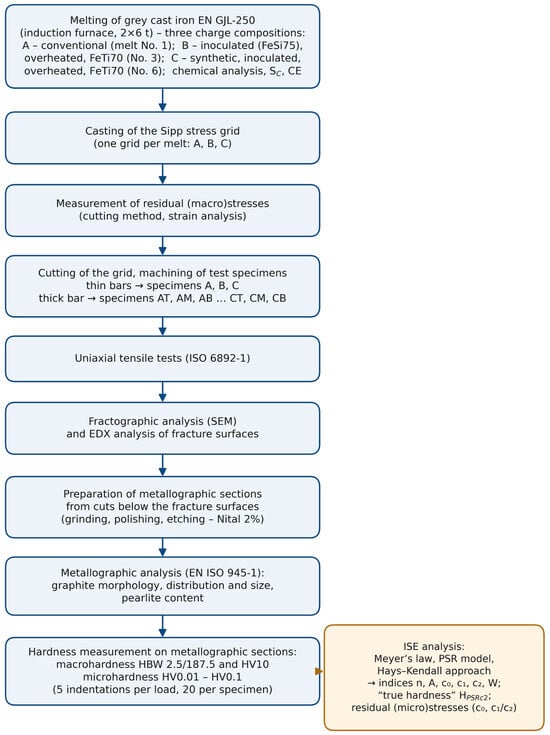
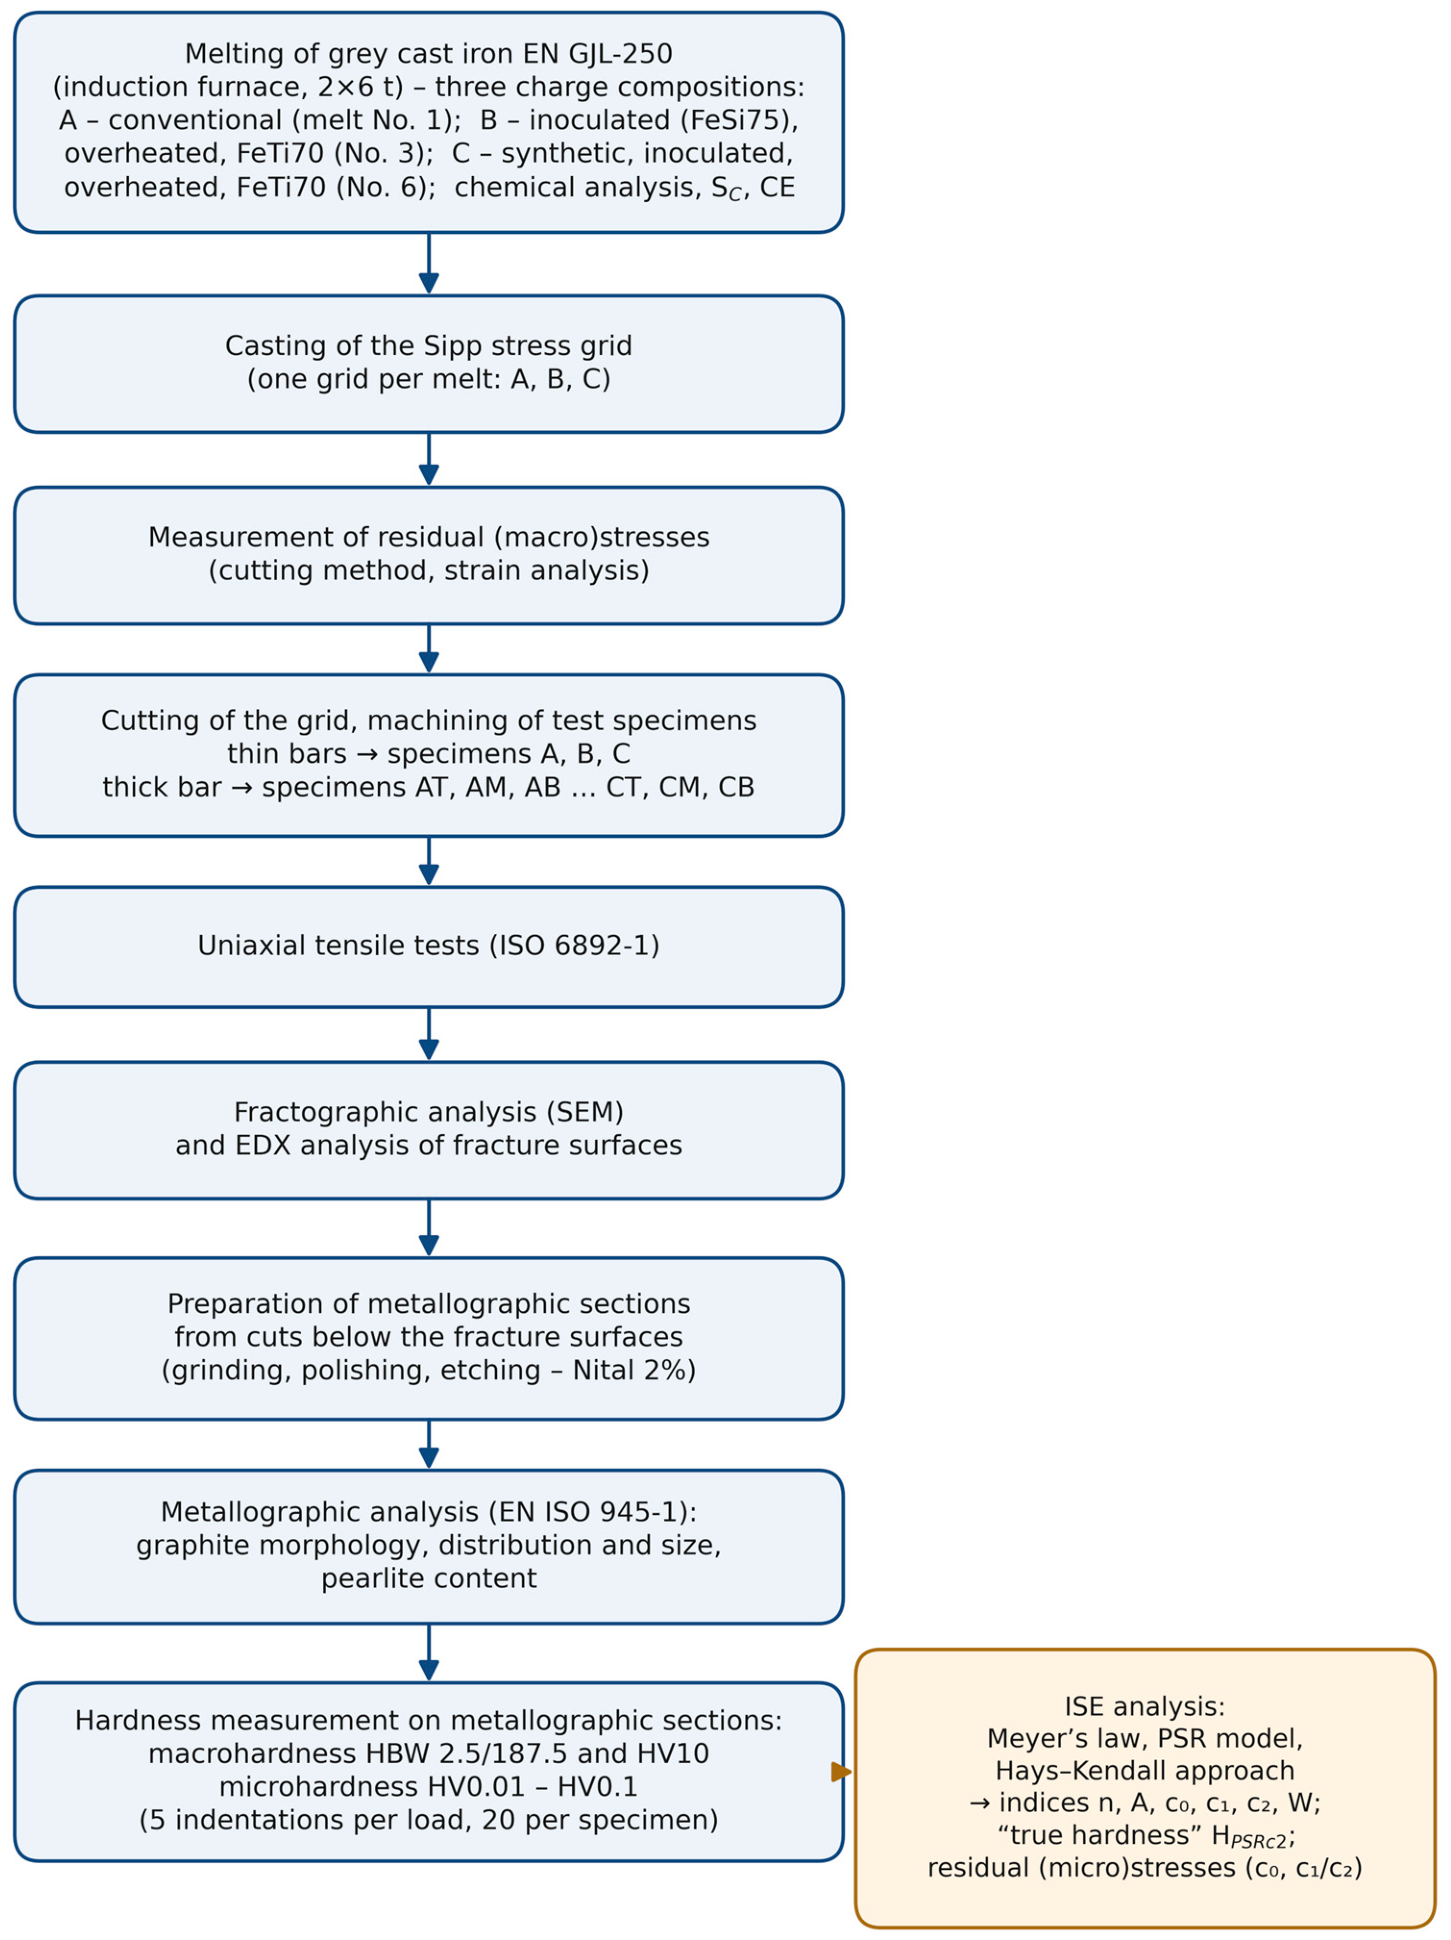
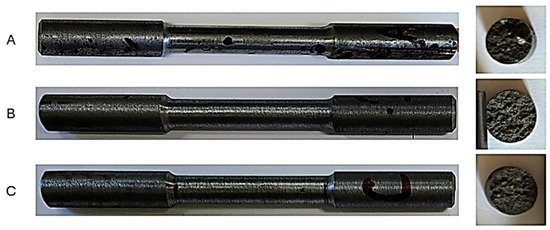
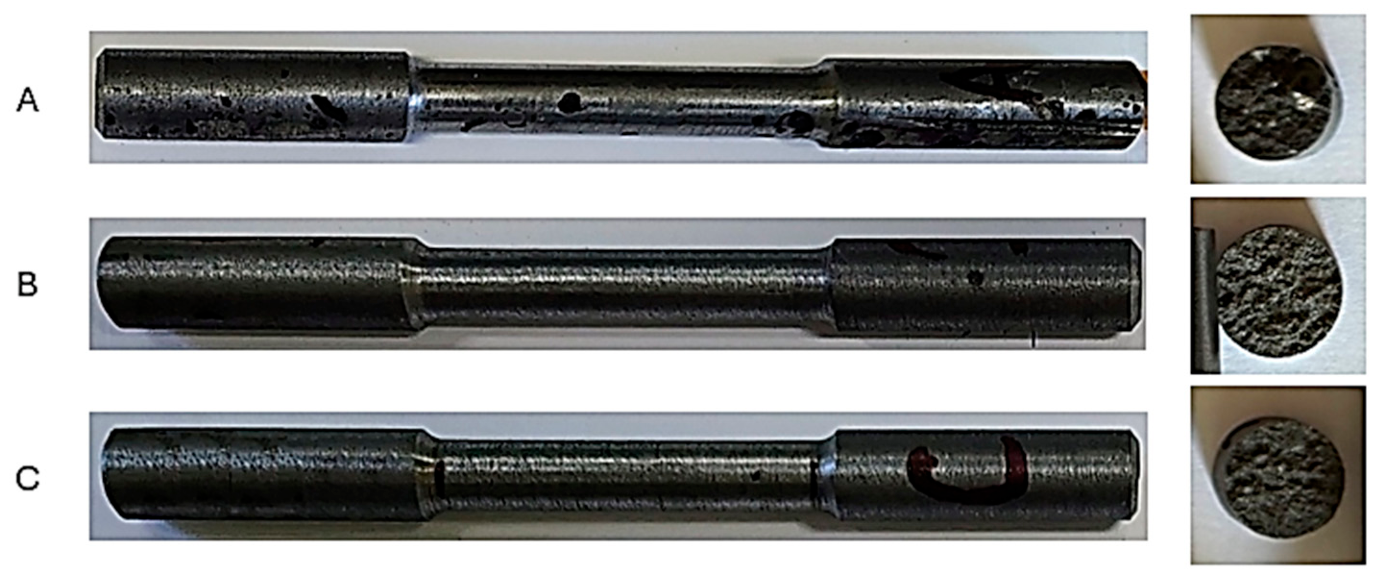
The specimens of the thin bar were cut with a water-cooling diamond saw and used to produce a test bar (one for each cast iron A, B, C) for uniaxial tensile testing and metallographic analysis, Figure 2. The tensile test was performed on the tester Tinius Olsen H300KU (manufacturer Tinius Olsen Testing Machine Company, Horsham, PA, USA with accuracy class 0.5. The sequence of individual tests is shown in the flowchart in Figure 3. The test was performed according to the standard ISO 6892-1 [12]. The speed of the tester cross-section was 0.6 m.min−1; φ = 0.00025 s−1. A total of 12 specimens were used in the tensile test, whose measured values are given in Table 5. Since each represents an individual property, the variability was not determined. The presentation of plastic properties (elasticity, contraction) is not relevant, as their values were essentially zero. The test specimens and their fractures after the test are shown in Figure 4. Tensile test specimens were made according to ISO 6892-1 [12] with a gauge length of 100 mm and a diameter of 1 mm. The direction of solidification was parallel to the specimen axis.
Figure 2.
The stress grid after sampling.
Figure 3.
The flowchart of analysis.
Table 5.
Mechanical properties of cast alloy, including the relative expanded uncertainty of the hardness value.
Figure 4.
The thin bar—the test specimens and their fractures.
3. Tensile Tests and Fractographic Characteristics
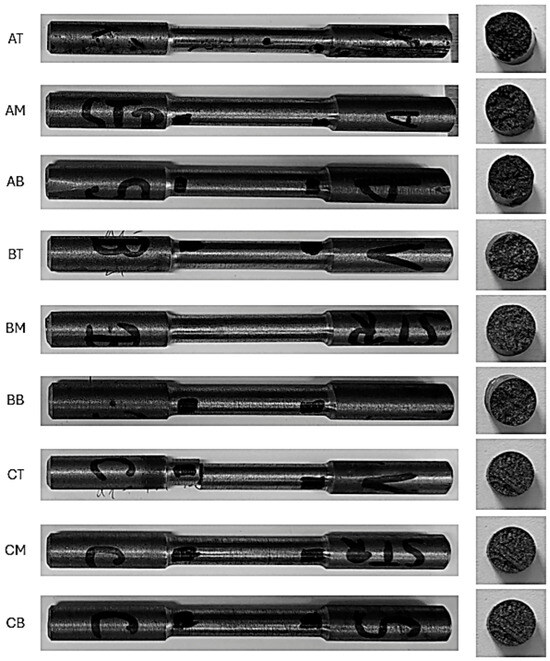
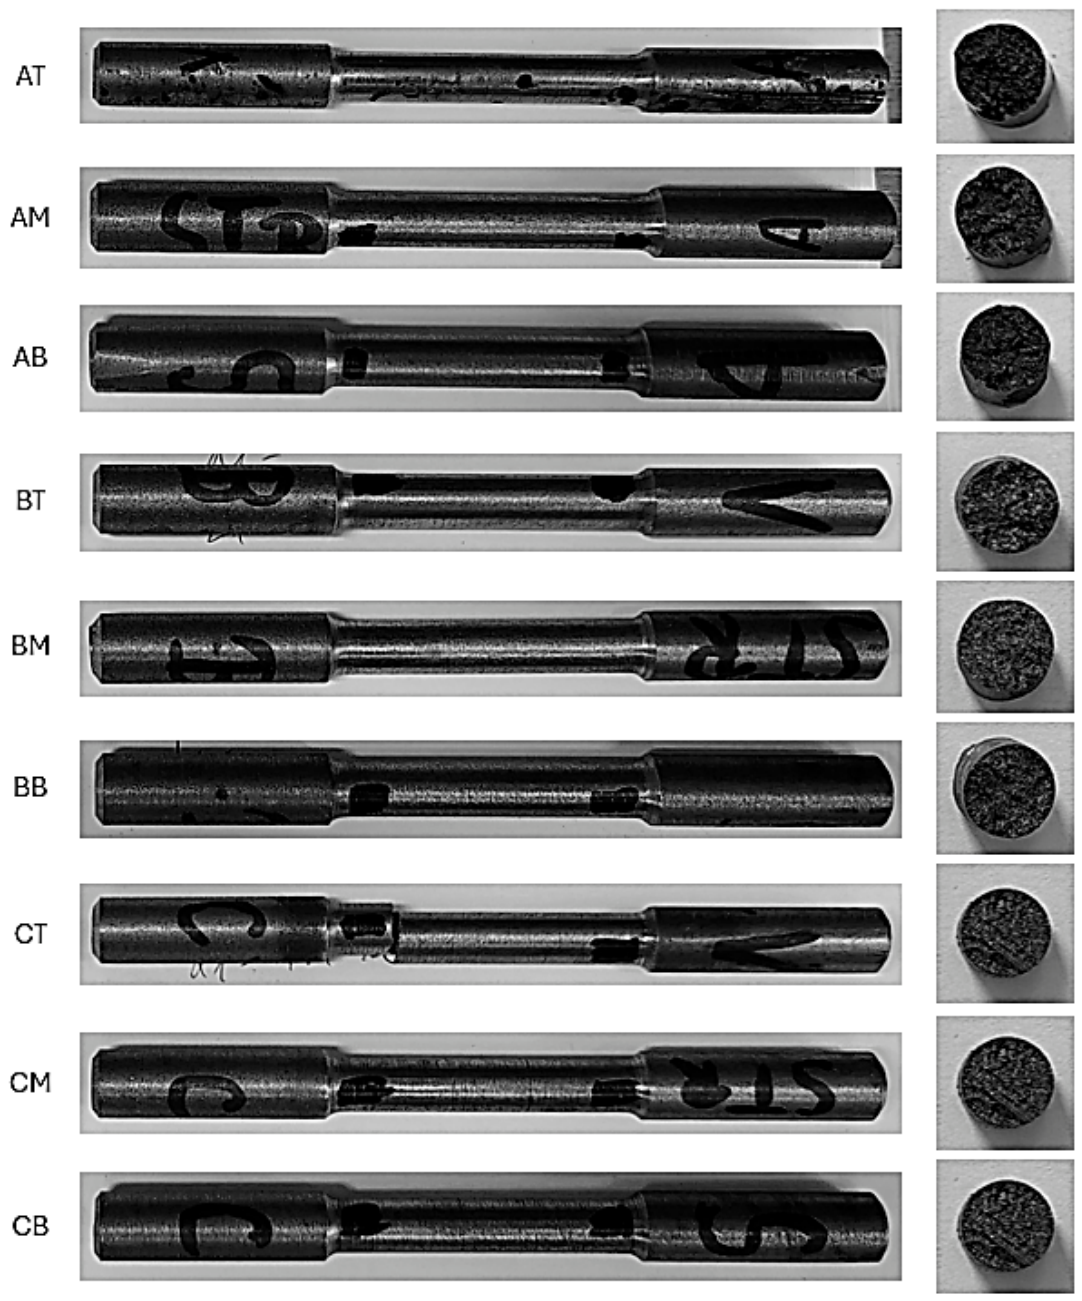
From the thick bar 2R, the specimens for uniaxial tensile testing were made (Figure 5). They were cut from the upper part of the bar, cut parallel to the axis into three parts: T (top), M (middle), and B (bottom). At the fracture site, a specimen for metallographic analysis was cut below it, perpendicular to the axis (specimens AT, AM, AB, BT, BM, BB, CT, CM, CB). The tensile test was also performed on the Tinius Olsen H300KU tester. The specimens for metallographic analysis were prepared according to the procedure described below. Specimens of fracture surfaces are shown in Figure 5.
Figure 5.
The thick bar—the test specimens and fracture surfaces.
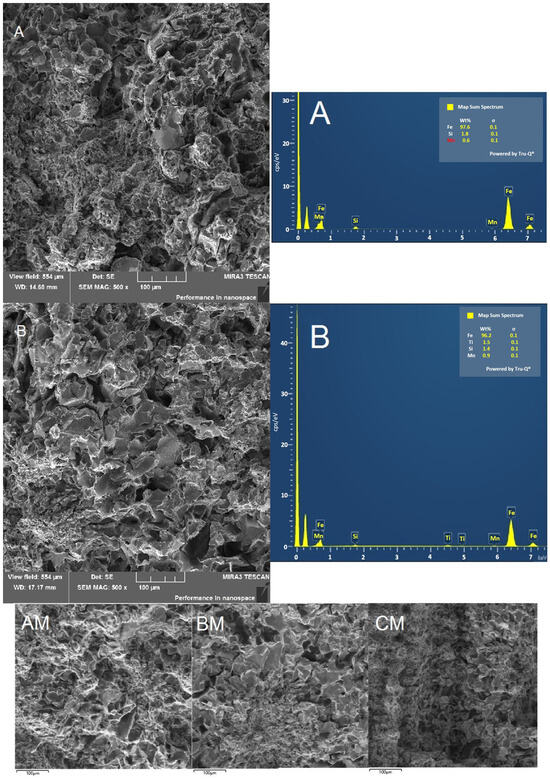
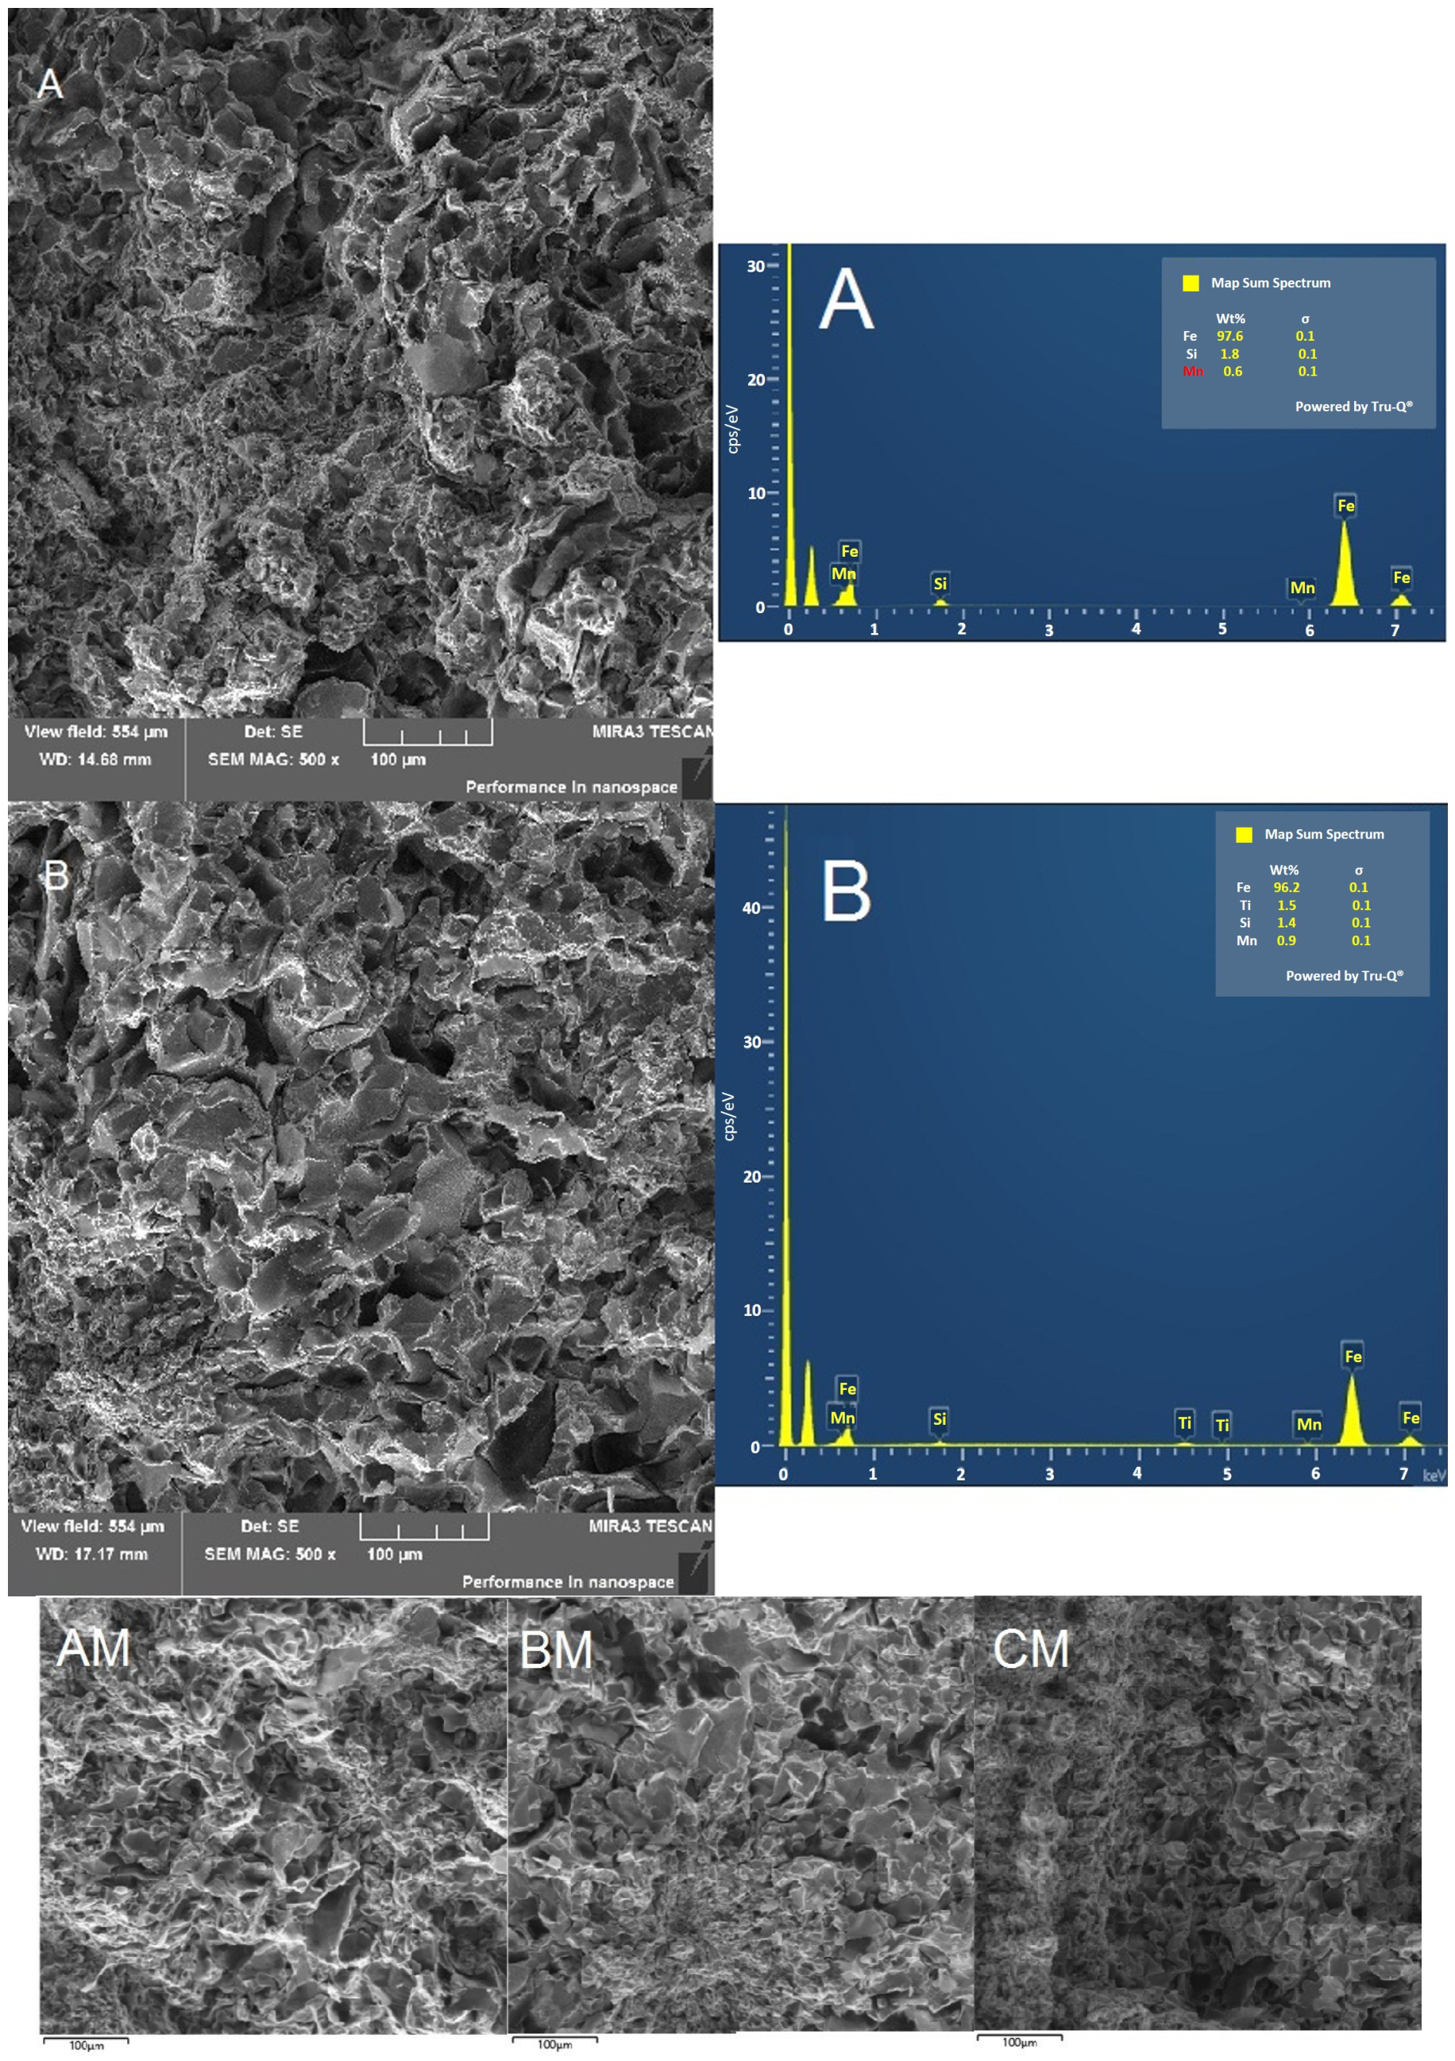
The fractography of the fracture surfaces of specimens A, B, and C was evaluated using a scanning electron microscope MIRA 3 FE TESCAN (manufacturer Tescan, Brno, Czech Republic) with an EDX OXFORD INSTRUMENTS analyzer (manufacturer High Wycombe, Buckinghamshire, England) for chemical analysis.
Fractographic characteristics of the fracture surfaces of bars A, B, and C ruptured in uniaxial tensile testing using a scanning electron microscope. The fracture surface of all specimens presents a mixture of brittle and ductile fracture. The evidence of brittle area presence is cleavage facets, which arose due to a transgranular fracture mode, as can be seen in Figure 6. The dimple morphology is clear evidence of ductile fracture. The presence of titanium in the fracture surface region of specimen B, which contains a total of 0.183 wt. % Ti is illustrated by the spectrum.
Figure 6.
The fracture surface morphology of specimens A, B, AM, BM, and CM presents a mixture of areas with both brittle and ductile fracture, regardless of the presence or absence of titanium in the specimen. The titanium content in the fracture surface region of specimen B is illustrated by the spectrum.
4. Metallographical Analysis
Specimens for metallographic analysis were cast into epoxy resin (dentacryl) for consolidation. Metallographic surfaces were prepared by grinding on 120 to 3000 ANSI/CAMI grit papers and subsequent polishing with spineline (Al2O3) moistened with water and subsequently with 0.5 μm diamond paste moistened with cerosine. In the first stage, the morphology of the graphite was evaluated on the unetched surface. This was followed by etching with 2% nital to evaluate the ferritic/pearlitic matrix. The microstructure was documented using a Keyence VHX 7000 optical microscope (manufacturer: Keyence International Belgium/Osaka, Japan).
Metallographic evaluation of the cast iron microstructures was performed in accordance with EN ISO 945-1 (STN 42 0461) [13]. The standard is used in the foundry, and casting buyers take it into account and require an assessment of the microstructure based on it as a qualitative indicator. The evaluation focused on the morphology, distribution, and size of graphite, as well as the pearlite content in the metallic matrix.
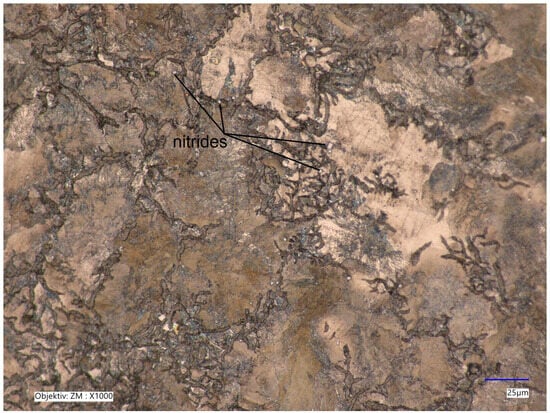
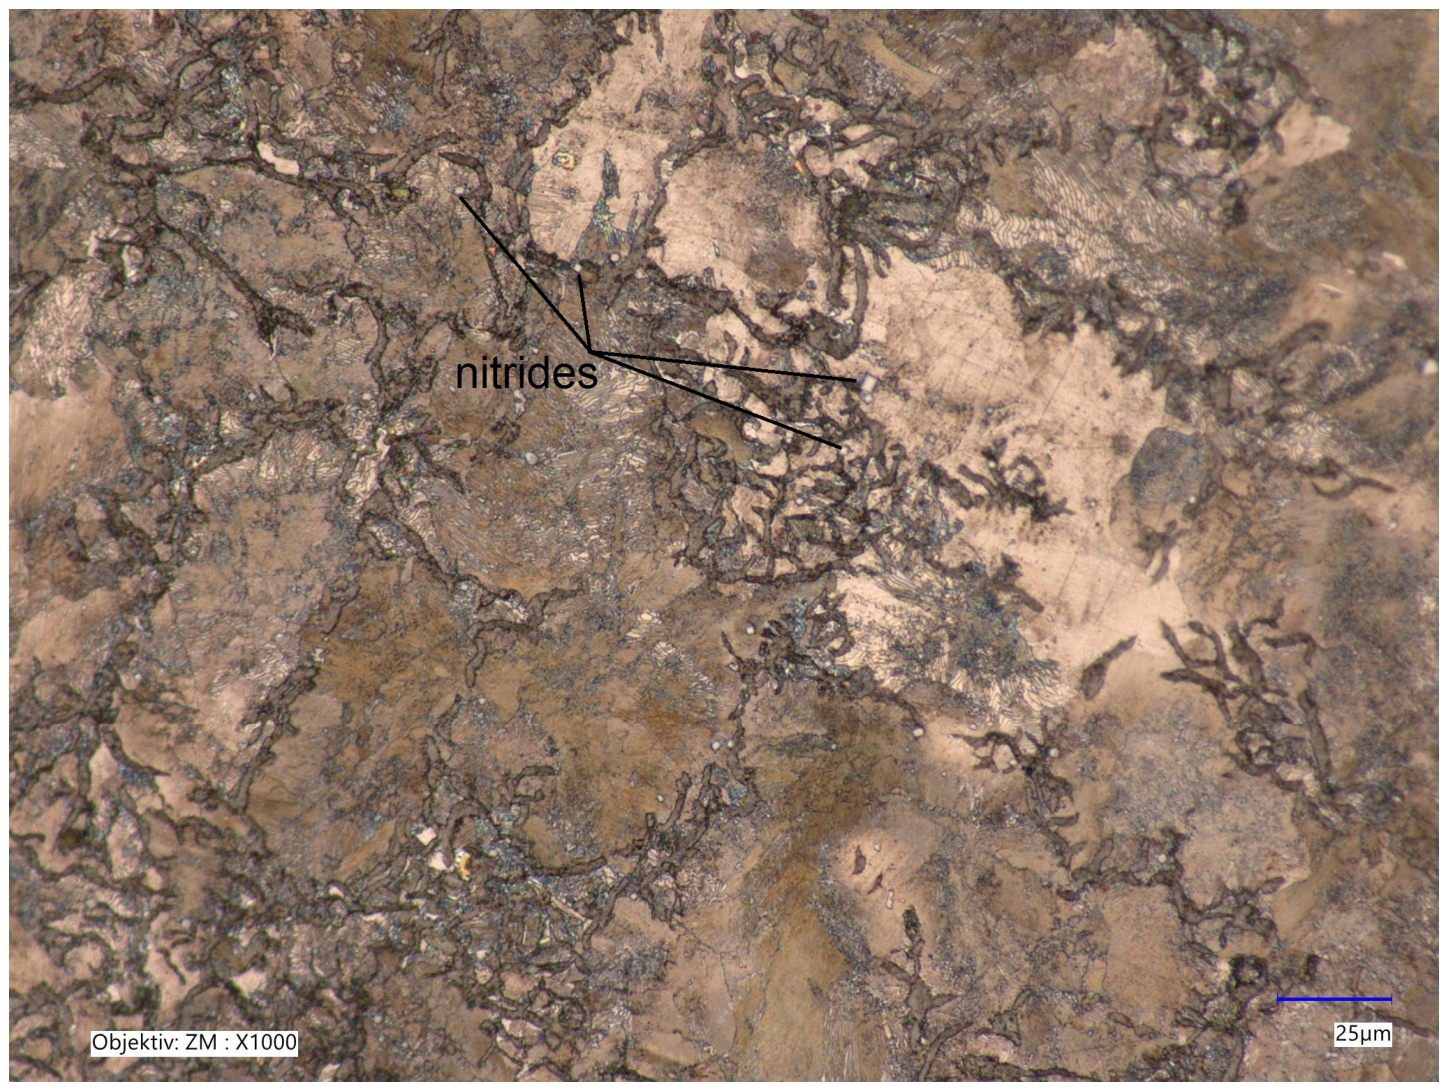
In specimen A, taken from the thin bar of the Sipp test specimen, type I graphite morphology (flake graphite) was identified. The graphite distribution corresponded to type E, characterized by an interdendritic-oriented arrangement. The graphite size ranged from 60 to 120 μm. The pearlite content in the microstructure reached 96%. In addition, the presence of nitride phases was observed in the structure (Figure 7).
Figure 7.
Microstructure of specimen A, magnification 1000×, etch. Nital 2%.
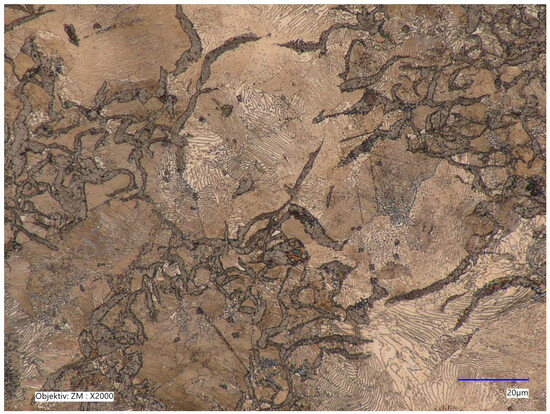
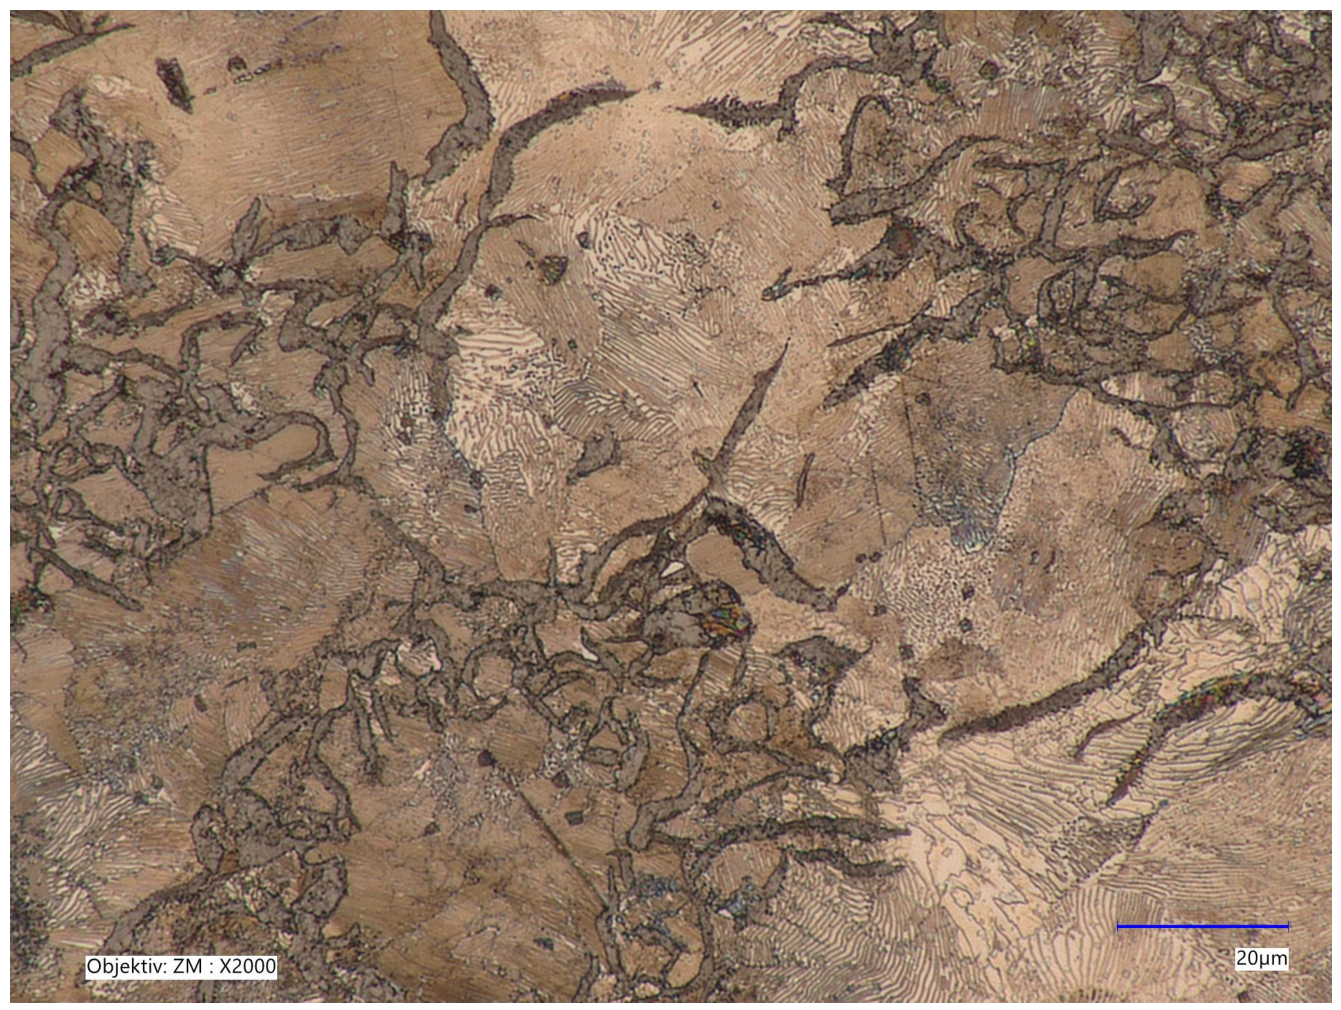
In specimen B, taken from the thin bar of the Sipp test specimen, type I flake graphite was also observed. The graphite distribution was classified as type D, corresponding to an interdendritic non-oriented arrangement. The graphite size ranged between 60 and 120 μm. No nitride phases were detected in the analyzed microstructure (Figure 8).
Figure 8.
Microstructure of specimen B, magnification 2000×, etch. Nital 2%.
Specimen C exhibited a microstructure like that of specimen B. Likewise, no occurrence of nitride phases was observed in its structure.
Table 6 presents the results of the metallographic evaluation of the microstructure of cast iron specimens taken from different locations along the Sipp test bar. The evaluation was carried out according to standard EN ISO 945-1 [13], focusing on the morphology, distribution, and size of graphite, as well as the pearlite content in the metallic matrix.
Table 6.
Results of metallographic analysis of specimens from the thick bar Sipp test.
Type I graphite morphology, corresponding to flake graphite typical of gray cast iron, was identified in all analyzed specimens. Differences between the individual specimens were mainly observed in the graphite distribution and graphite particle size.
Specimens A and B exhibited graphite sizes ranging from 60 to 120 μm. In specimen A, a graphite distribution of type D—interdendritic non-oriented—was observed. In addition, the occurrence of nitride phases was recorded in the microstructure of specimen A. In contrast, specimen B was characterized by type E graphite distribution, corresponding to an interdendritic oriented arrangement, indicating differences in solidification conditions and local segregation processes during crystallization.
Specimen C differed from the previous specimen by a larger graphite size in the range of 120–250 μm and by a type C graphite distribution. This distribution type represents a more uniform arrangement of coarser graphite flakes, which may be associated with a lower cooling rate in the given region of the casting.
The pearlite content in all evaluated areas reached high values ranging from 92 to 100%, indicating a predominantly pearlitic matrix of the analyzed cast irons. The lowest pearlite content was recorded in specimen AT (92%), whereas several areas exhibited a fully pearlitic structure. The high pearlite fraction suggests enhanced strength and hardness characteristics of the material.
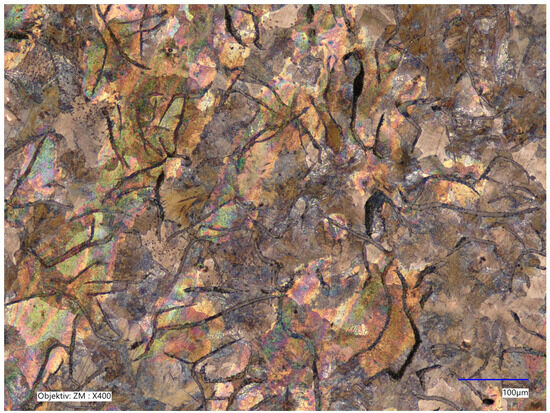
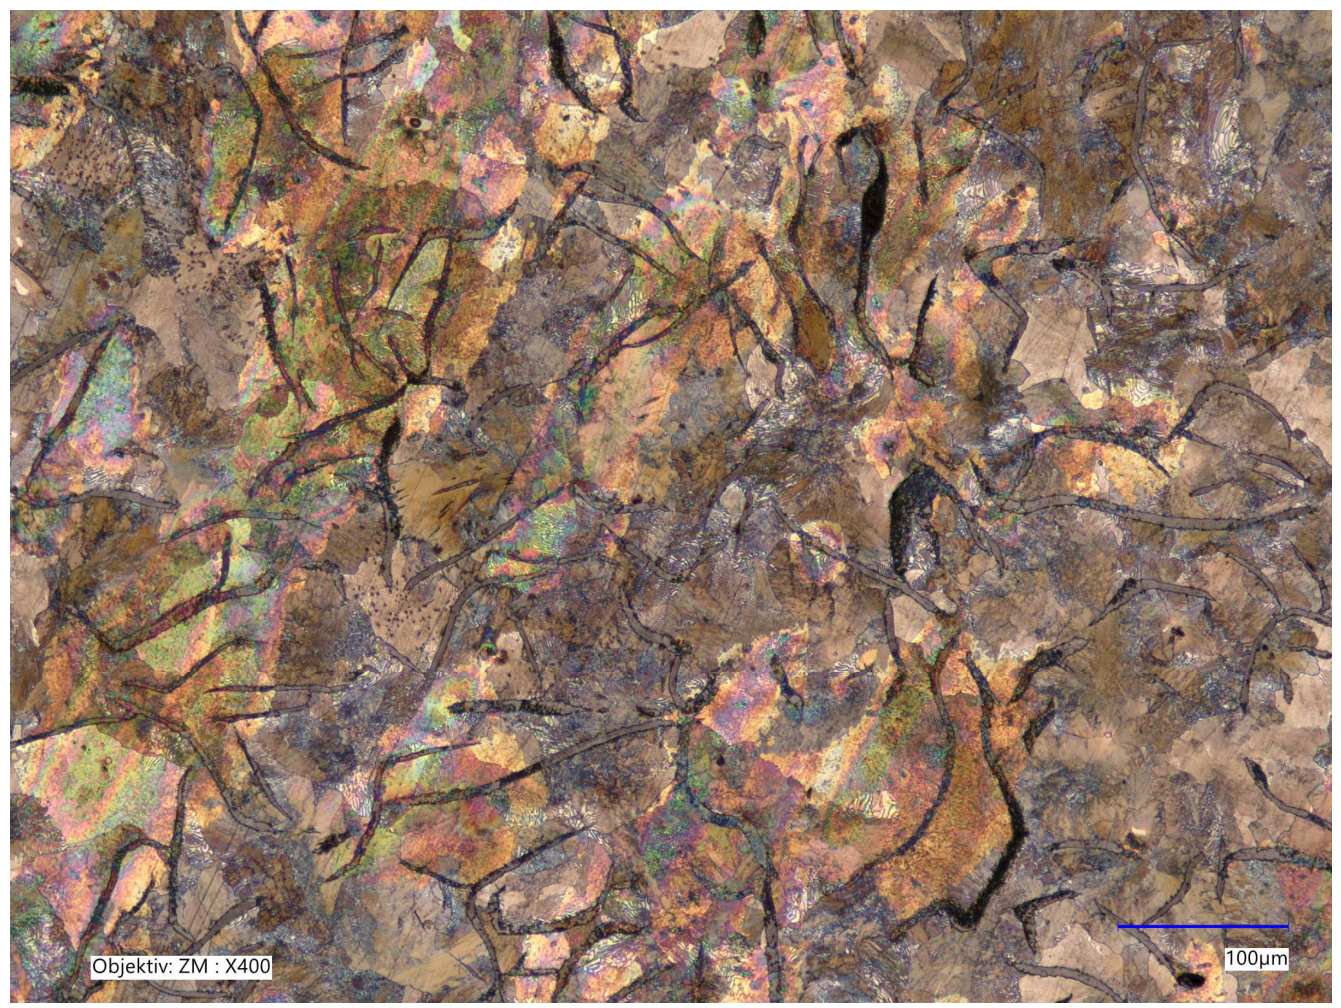
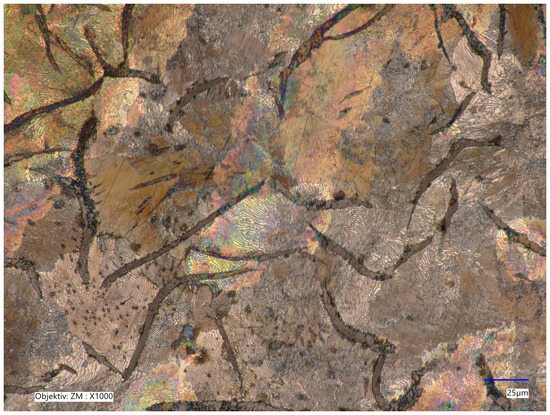
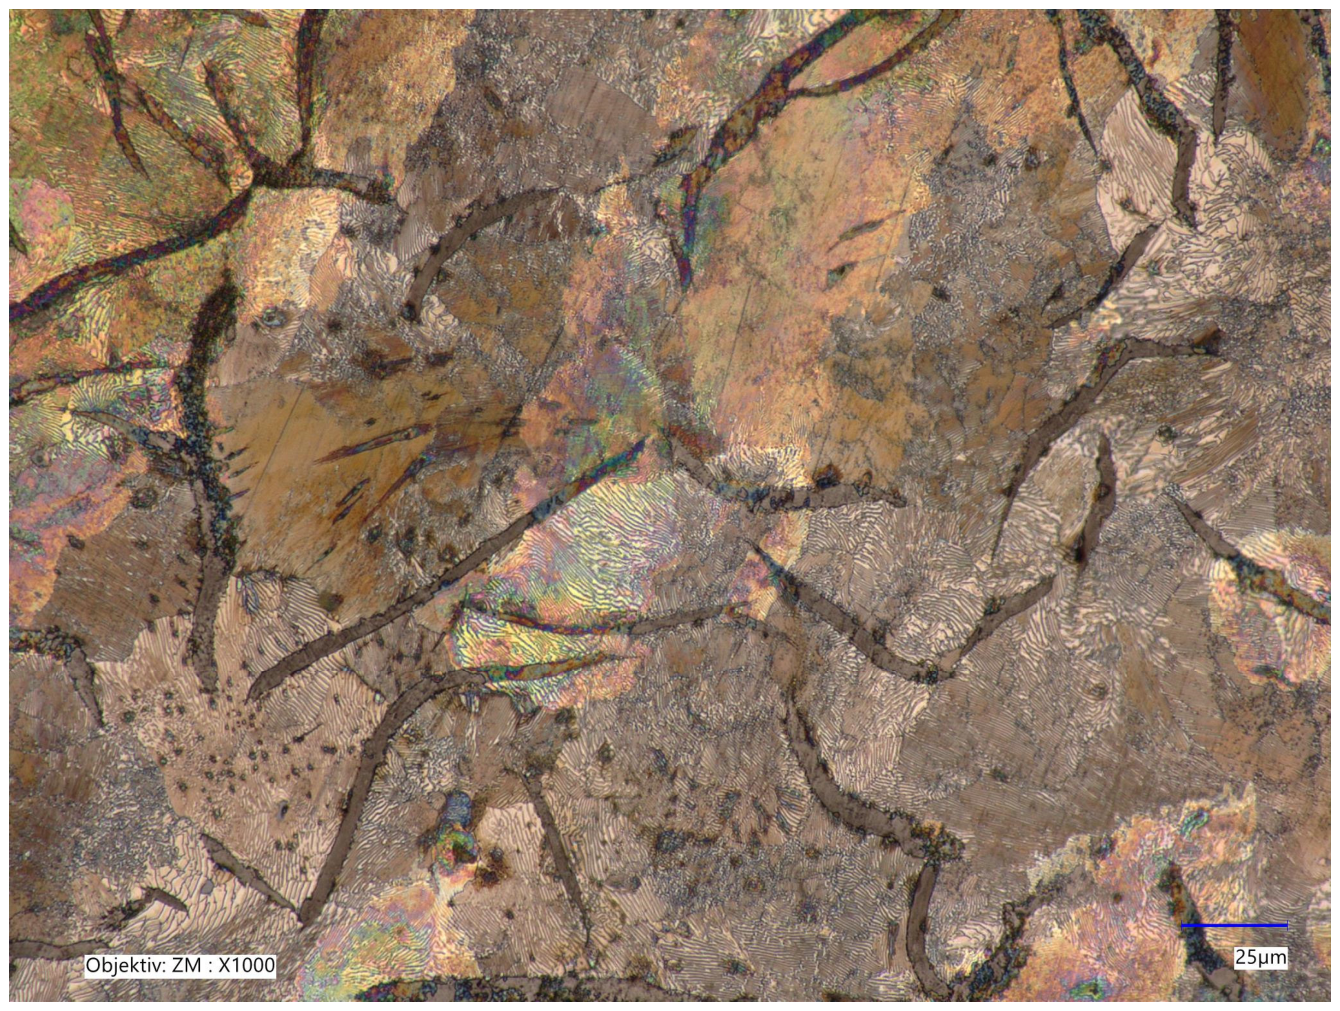
Specimen CT, in addition to carbon, is formed by lamellar pearlite; see Figure 9 and Figure 10 in detail.
Figure 9.
Pearlitic-ferritic microstructure of specimen CT with coarse graphite flakes, 400×, etch. Nital 2%.
Figure 10.
Pearlitic-ferritic microstructure of specimen CT, detail, 1000×, etch. Nital 2%.
5. Microhardness and Macrohardness
Subsequently, microhardness and macrohardness were measured on these specimens. A Hanemann hardness tester (manufacturer Carl Zeiss, Jena, Germany) with a diamond pyramidal indenter with a magnification of 480× fitted to an optical microscope NEOPHOT 32 was used as a measurement device for microhardness HV0.05 measurement. The microhardness and the hardness HV10 were measured according to STN EN ISO 6507-1:2023 [14], and the macrohardness HBW 5/250/30 hardness was measured according to STN EN ISO 6506-1:2015 [15] on an HPO 250 hardness tester (manufacturer Fritz Heckert, Leipzig, Germany).
The hardness testers were calibrated according to standards [16,17] using certified reference blocks (CRM); their parameters and results of calibration—values of repeatability rrel (%), the error of the tester Erel (%), and the relative expanded uncertainty of calibration Urel = (%) are in Table 7. The hardness testers used meet the conditions required by the relevant standards.
Table 7.
The results of the calibration of hardness testers.
When measuring macro-hardness, five indentations were applied to the surface of the cut to avoid structural anomalies, and their spacing corresponded to the requirements of the standard. The Vickers method HV10 was used, and subsequently the Brinell method HBW 2.5/187.5. The measured macro-hardness values are given in Table 5.
Relative expanded uncertainty (Urel, in %, coverage coefficient/factor k = 2) of measured macro- and microhardness values was calculated according to ISO 6506-1 [14] and ISO 6507-1 [15]. The values are given in Table 5 and Table 8. Due to the lack of repeatability, the uncertainty of tensile test results is not stated; in principle, it should not exceed 0.5% of the measured value, depending on the accuracy class of the tester used.
Table 8.
The average hardness at individual load, including the relative expanded uncertainty of the hardness value and the average hardness HV from all twenty (“cluster”) measurements with standard deviation (SD). The result of the Anderson–Darling test is the p-value. If p > 0.05, the values in “cluster” have a normal distribution. HPSR c2 is “true hardness”.
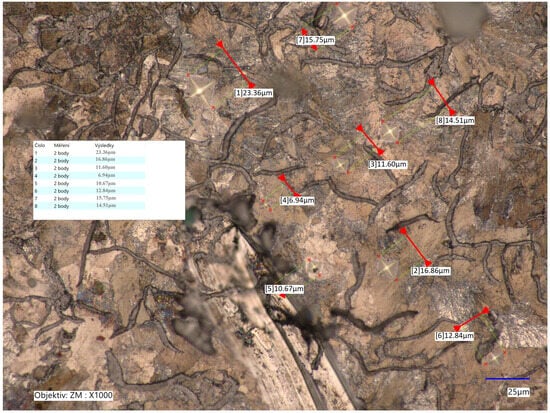
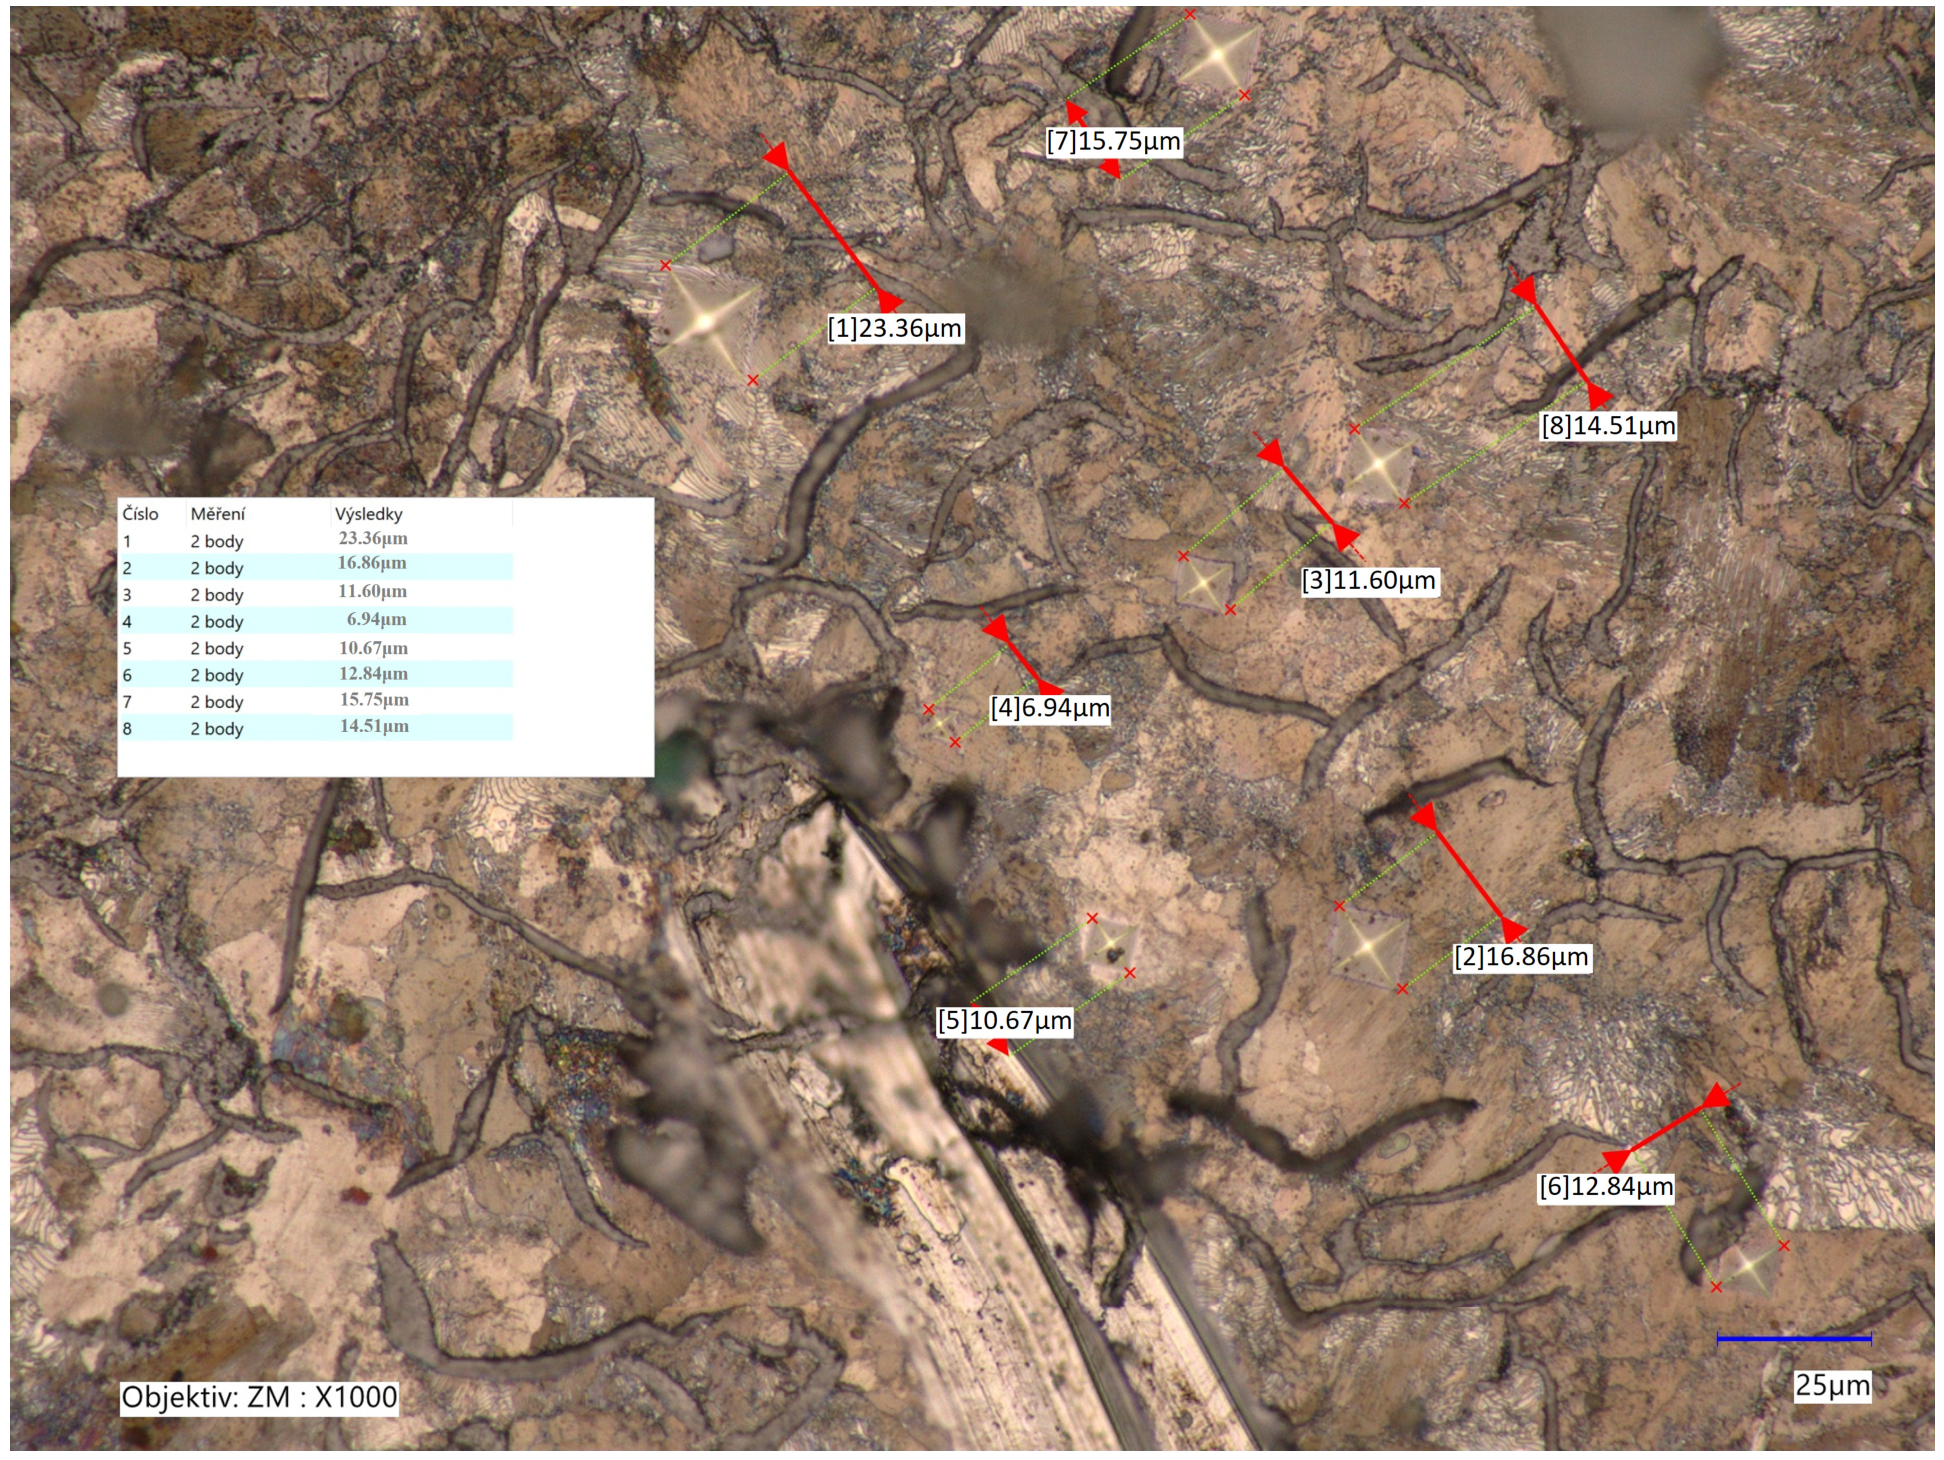
Microhardness was measured on an etched surface. Four test loads were applied: 0.09807 N (HV0.01), 0.24518 N (HV0.025), 0.49035 N (HV0.05), and 0.9807 N (HV0.1), with a 15 s dwell. All measurements were done by one operator. Manual control of the microhardness tester required maintaining consistent indenter penetration rates, which inherently influence the measured hardness values; the speeds fluctuated around 0.5 µm s−1. Indentations were made, if possible, in the center of pearlitic grains with approximately the same density of lamellae, avoiding graphite and nitride particles, grain boundaries, and anomalies in the microstructure (Figure 11). Five indentations per load were measured (“cluster” of 20 indentations for each specimen), positioned ≥3× diagonal length apart to prevent interaction effects. Indentation diagonals were measured optically with 0.000313 mm resolution.
Figure 11.
Micro-indentations on specimen A detail, 1000×, etch. Nital 2%.
The average hardness at individual loads is shown in Table 8, and the average hardness from all twenty (“cluster”) measurements is shown in Table 9.
Table 9.
The values of the ISE indices.
Proven and less demanding models (e.g., for calculation) commonly presented in the professional literature were selected. The authors avoided models (e.g., Gao, etc.) that are more accurate, but more demanding for calculation and still often the subject of professional discussion. The models used provide information on the residual microstress values, which are the object of interest.
Meyer’s power law and proportional specimen resistance (PSR) are most often used to determine ISE characteristics [18].
Meyer’s Law can be expressed using Equation (2):
The indices n and A are determined by exponential curve fitting to indentation diagonal d (mm) versus applied load P (N), or n and A are determined by straight line fitting to d (mm) versus P (N). The value d is the average value of the diagonals of all indentations done at one load. Meyer’s index n, or work-hardening coefficient, is the slope, and coefficient A is the y-intercept of the line. This relationship was derived for the ball indenter, but it has become common practice to apply Tabor’s interpretation of the strain-hardening by a pyramidal indenter and to derive a “work-hardening index” [19]. For reverse ISE, it is true that the index n >2 and n < 2 for “normal” ISE. If n = 2, the ISE is “neutral,” and microhardness is independent of the load and is given by Kick’s law.
The values of n and A are in Table 9. Both thin and thick rod specimens show a slight (A and CT) to pronounced (especially the thick rod specimens AT, Am, and BB) “normal” ISE, typical of brittle materials, including gray cast iron.
The resistance model of Li and Bradt about proportional specimen PSR is considered a modified version of the Hays/Kendall model, coming nearer to the ISE [5,6,18,20,21].
Equation (3) can be regarded as a modified form of the PSR model. Index c0 (N) is associated with residual surface stress, index c1 (N mm−1) is related to the elasticity, and index c2 (N mm−2) is related to the plastic properties of the material. Values of indices can be obtained from the quadratic regressions of P (N) against d (mm)
Index c1 characterizes the load dependence of microhardness and describes the ISE in the PSR model. It consists of two components: the elastic resistance of the test specimen and the friction resistance developed at the indenter facet/specimen interface [5,18]. The harder material with a higher Young’s modulus has a higher value of c1. The index c2 is related to load-independent microhardness the “true hardness” HPSR, calculated by Equation (4) [22,23]. The calculated values are given in Table 8.
The coefficient 0.1891 is the constant derived from the geometry of the standard Vickers pyramid indenter (where the angle between opposite faces is 136°) combined with gravitational conversion according to Equation (5) [14]:
F = The applied test force (load) in Newtons (N).
d2 = The arithmetic mean of the two indentation diagonals squared, measured in millimeters (mm2).
The measure of the residual stress, the result of mechanical processing (preparation of the metallographic surface), is the ratio c1/c2; the values of the indices calculated using modified PSR are in Table 9. The ratio c1/c2 and index c0 are correlated with each other [5], and this correlation has a well-documented physical basis.
The specimens from the thick bar (AT, AM…CB) were cast in resin together and ground and polished together, i.e., under the same conditions. Theoretically, the stress and result of mechanical processing are expected to be the same for all. Certain, although statistically insignificant, differences can be explained by differences in the conditions of specimen division—manual cutting.
Test load W (N) is the load necessary to initiate plastic deformation with a visible indentation; only elastic deformation occurs below it. In that event, the load dependence of hardness is expressed by Equation (6). This phenomenon was observed in various metals, as well as in deformed. This fact is not consistent with the definition of index W. It would be appropriate to focus future research on this problem.
Index A1 (N mm−2) is independent of load. W and A1 may be obtained from the regressions of P (N) against d2 (mm) [5]; their values are in Table 9. By analogy to c2, the “true hardness” HPSRA1 can be calculated by Equation (4).
The index is dependent on the index W (gf), which characterizes the elasticity and deformation resistance of the tested material. In practice, this is the minimum test load that causes a visible impression during the hardness test. However, visible indentations were produced with a load of 0.009807 N (1 gf), which is lower than some calculated values of index W listed in Table 9. This phenomenon was observed in various metals [3], as well as in deformed metals [24]. This fact is not consistent with the definition of index W. It would be appropriate to focus future research on this problem [25].
6. Discussion
When investigating the ISE, it is necessary to apply the requirements of the quality system, which ensure the uniformity of test conditions, the accuracy of measurements, and the objectivity of the evaluation of results. The implementation of the principles of the quality system in the experimental evaluation of alloys contributes to a more accurate identification and interpretation of the ISE and thus increases the credibility of the results of mechanical tests [26,27]. The credibility of the measurement results, and not only of microhardness and the subsequent ISE analysis, but also of other mechanical properties and microstructure, is significantly affected by their implementation under the conditions of the quality system according to the ISO 10012 [28] and, in particular, ISO 17025 [29] standards, which were used in the implementation of the measurements.
The residual stress values obtained by analyzing the dimensional changes in the Sipp grid and the ISE analysis (co and c1/c2) are not directly comparable, although both measure aspects of residual stress. They represent different physical quantities and are determined on completely different scales. Co in the PSR model acts as a “fictitious” or surface-acting load (the threshold load required to produce plastic deformation on the polished surface) and is expressed in units of force (N or g). On the other hand, the Sipp grid method calculates the residual stress as a force tensor per unit area (μɛ, MPa, or N mm−2). Since they lack dimensional equivalence, they cannot be compared numerically.
The ratio c1/c2 is a measure of the residual stress caused by machining and polishing. This ratio is in mm and represents the effective depth (or lateral dimension) of the disturbed surface layer that is created during the preparation of a metallographic section. The larger (in absolute value) the ratio c1/c2, the greater the residual stresses induced by the mechanical treatment of the surface.
The Sipp grid (a destructive cutting method, sometimes with strain gauges) measures macroscopic residual stresses (type I—macrostresses) in MPa, i.e., stresses that are homogeneous over the entire cross-sectional dimension of the bar. In contrast, the index c0 (in N) from the modified PSR model reflects micro-structural residual stresses (type II or III), i.e., stresses localized in the immediate surface layer. These are stresses at a depth of micrometers (of the order of 1–10 µm), not hundreds of millimeters.
The literature on residual (micro)stresses is scarce. It focuses more on (macro)stresses. For example, Maj [30] analyzed residual stresses in castings, including cast iron. In thin bars, there are uniaxial stresses, and in thin plates, stresses in two orthogonal directions are considered, while in castings, which are always three-dimensional objects, stresses in all planes should be considered. The complexity of calculations and possible experiments is rapidly increasing from the 1-axis to the 3-axis condition. The article presents selected methods of stress and strain testing, with particular emphasis on elasto-optical testing (the coating glued onto an actual casting). Lekakh et al. [31] studied residual stresses in high silicon and molybdenum ductile iron, which is commonly used for car exhaust systems. The article by Mirek et al. [32] presents the results of experimental studies and numerical calculations that were conducted to analyze the phenomena that occur during the operation of an ingot mold that is designed for casting steel ingots. These studies were used to create and verify a numerical model that was used to determine the temperatures, displacements, deformations, and stresses in the ingot. Chen et al. [33] in their study probed the residual stress in the gray cast iron, JIS FC 300, with synchrotron X-ray and neutron sources. High-energy resolution of X-ray and neutron allows us to acquire reliable values of the stress. In the article by Cai and Gu [34], HT250 residual stress in gray cast iron processed by laser cavitation peening (LCP) was studied.
7. Conclusions
- The effect of composition has a statistically significant effect (single ANOVA, thick and thin bar specimens considered together) for HBW, HV, HPSRA1, and Meyer’s index n.
- The fracture surface of all specimens presents a mixture of brittle and ductile fracture, practically not affected by the composition of the cast iron.
- The measured microhardness values are higher than the macrohardness values, since graphite flakes do not interfere.
- The Meyer’s index values n < 2 correspond to the “normal” ISE, characteristic of a brittle material (except for a thin rod with a composition and character close to neutral), which is also confirmed by the Rm values and the fracture surface.
- c0 and Sipp’s residual stresses measure fundamentally different levels of stress state (surface microhardness vs. macroscopic casting) and are not directly comparable.
- c1/c2 and c0 are correlated with each other, and this correlation has a well-documented physical basis.
- At the same time, these three cast irons differ in steel scrap content, inoculation, superheating temperature, and titanium microalloying. Consequently, it is not possible to attribute the observed differences to a specific processing parameter. This limitation should be explicitly acknowledged, or the experimental design should be restructured to isolate individual variables.
Author Contributions
Conceptualization, P.F. and M.P.; methodology, M.P.; software, P.F.; validation, P.B. and A.P.; formal analysis, J.P.; investigation, P.F. and M.P.; resources, P.F.; data curation, M.Ł.; writing—original draft preparation, P.F., M.P. and J.P.; writing—review and editing, A.P. and P.B.; visualization, M.Ł.; supervision, P.F.; project administration, A.P.; funding acquisition, P.F. All authors have read and agreed to the published version of the manuscript.
Funding
This manuscript was supported by the Scientific Grant Agency of the Ministry of Education of the Slovak Republic, No. VEGA 1/0001/25, VEGA 1/0359/25, VEGA 1/0292/26, KEGA 024TUKE-4/2025.
Data Availability Statement
The original contributions presented in this study are included in the article. Further inquiries can be directed to the corresponding authors.
Conflicts of Interest
The authors declare no conflicts of interest.
References
- Yakut, R. Investigation of Mechanical Properties of Grey Cast Irons Reinforced with Carbon Titanium Nitride (TiNC). Lubricants 2023, 11, 454. [Google Scholar] [CrossRef] [Scilit]
- Semih Genculu, P.E. Cast Irons; Types, Properties, Applications & Weldability, PDH Online Course M568 (2 PDH), 2015 (Rev 2019). Available online: https://pdhonline.com/courses/m568/m568content.pdf (accessed on 10 June 2026).
- Petrík, J.; Blaško, P.; Markulík, Š.; Šolc, M.; Palfy, P. The Indentation Size Effect (ISE) of Metals. Crystals 2022, 12, 795. [Google Scholar] [CrossRef] [Scilit]
- ISO 14577-1:2025; Metallic Materials—Instrumented Indentation Test for Hardness and Materials Parameters Part 1—Test Method. International Organization for Standardization: Geneva, Switzerland, 2015.
- Sangwal, K.; Surowska, B.; Błaziak, P. Analysis of the Indentation Size Effect in the Microhardness Measurement of Some Cobalt-Based Alloys. Mater. Chem. Phys. 2003, 77, 511–520. [Google Scholar] [CrossRef] [Scilit]
- Gong, J.; Wu, J.; Guan, Z. Examination of the Indentation Size Effect in Low-Load Vickers Hardness Testing of Ceramics. J. Eur. Ceram. Soc. 1999, 19, 2625–2631. [Google Scholar] [CrossRef] [Scilit]
- Westbrook, H.; Conrad, H. The Science of Hardness Testing and Its Research Application; American Society for Metals: Metals Park, OH, USA, 1973. [Google Scholar]
- Ren, X.J.; Hooper, R.M.; Griffiths, C.; Henshall, J.L. Indentation Size Effect in Ceramics: Correlation with H/E. J. Mater. Sci. Lett. 2003, 22, 1105–1106. [Google Scholar] [CrossRef] [Scilit]
- Futas, P.; Brezinová, J.; Pástor, M.; Pribulová, A. Reducing Residual Stresses in Synthetic Cast Iron by Ti Microalloying. Metals 2025, 15, 520. [Google Scholar] [CrossRef] [Scilit]
- Marberg, A.; Pal, J. Residual Stresses in Cast Iron, 2017, DiplomaWork No. 200/b, Chalmers University of Technology, Gothenburg. Available online: https://publications.lib.chalmers.se/records/fulltext/250007/250007.pdf (accessed on 11 April 2026).
- Zhang, S.; Ran, Y.; Murphy, A.; Zhang, G.; Wang, W. Residual stress analysis of gray cast iron manufacturing processes. Mater. Manuf. Process 2020, 35, 1781–1788. [Google Scholar] [CrossRef] [Scilit]
- ISO 6892-1:2016; Metallic Materials. Tensile Testing. Part 1: Method of Test at Room Temperature. International Organization for Standardization: Geneva, Switzerland, 2016.
- EN ISO 945-1:2019; Microstructure of Cast Irons—Part 1: Graphite Classification by Visual Analysis. International Organization for Standardization: Geneva, Switzerland, 2019.
- EN ISO 6507-1:2023; Metallic Materials—Vickers Hardness Test Part 1: Test Method. International Organization for Standardization: Geneva, Switzerland, 2023.
- EN ISO 6506-1:2025; Metallic Materials—Brinell Hardness Test Part 1: Test Method. International Organization for Standardization: Geneva, Switzerland, 2025.
- EN ISO 6506-2:2025; Metallic Materials—Brinell Hardness Test Part 2: Verification and Calibration of Testing Machines. International Organization for Standardization: Geneva, Switzerland, 2025.
- EN ISO 6507-2:2023; Metallic Materials—Vickers Hardness Test Part 2: Verification and Calibration of Testing Machines. International Organization for Standardization: Geneva, Switzerland, 2023.
- Sangwal, K. On the Reverse Indentation Size Effect and Microhardness Measurement of Solids. Mater. Chem. Phys. 2000, 63, 145–152. [Google Scholar] [CrossRef] [Scilit]
- Sargent, P.M. Indentation Size Effect and Strain-Hardening. J. Mater. Sci. Lett. 1989, 8, 1139–1140. [Google Scholar] [CrossRef] [Scilit]
- Li, N.; Liu, L.; Zhang, M. The Role of Friction to the Indentation Size Effect in Amorphous and Crystallized Pd-Based Alloy. J. Mater. Sci. 2009, 44, 3072–3076. [Google Scholar] [CrossRef] [Scilit]
- Li, H.; Bradt, R.C. The Microhardness Indentation Load/Size Effect in Rutile and Cassiterite Single Crystals. J. Mater. Sci. 1993, 4, 917–926. [Google Scholar] [CrossRef] [Scilit]
- Kim, H.; Kim, T. Measurement of Hardness on Traditional Ceramics. J. Eur. Ceram. Soc. 2002, 22, 1437–1445. [Google Scholar] [CrossRef] [Scilit]
- Machaka, R.; Derry, T.E.; Sigalas, I.; Herrmann, M. Analysis of the Indentation Size Effect in the Microhardness Measurements in B6O. Adv. Mater. Sci. Eng. 2011, 2011, 539252. [Google Scholar] [CrossRef] [Scilit]
- Petrík, J.; Blaško, P.; Petryshynets, I.; Mihaliková, M.; Pribulová, A.; Futáš, P. The Influence of the Degree of Tension and Compression of Aluminum on the Indentation Size Effect (ISE). Metals 2022, 12, 2063. [Google Scholar] [CrossRef] [Scilit]
- Girmanová, L.; Petrík, J.; Šolc, M.; Blaško, P.; Pribulová, A.; Futáš, P. ISE of Precious Metals: Au, Ag, Pd, and Pt. Metals 2025, 15, 1038. [Google Scholar] [CrossRef] [Scilit]
- Małysa, T.; Furman, J.; Pawlak, S.; Šolc, M. Application of Selected Lean Manufacturing Tools to Improve Work Safety in the Construction Industry. Appl. Sci. 2024, 14, 6312. [Google Scholar] [CrossRef] [Scilit]
- Šolc, M.; Markulík, Š.; Sütőová, A. Quality in Contemporary University Environment. Procedia Soc. Behav. Sci. 2014, 143, 703–707. [Google Scholar] [CrossRef] [Scilit]
- ISO 10012:2026; Quality Management—Requirements for Measurement Management Systems. International Organization for Standardization: Geneva, Switzerland, 2026.
- ISO/IEC 17025:2017; General Requirements for the Competence of Testing and Calibration Laboratories. International Organization for Standardization: Geneva, Switzerland, 2017.
- Maj, M. The Formation of the Strength of Castings including Stress and Strain Analysis. Materials 2024, 17, 2484. [Google Scholar] [CrossRef] [Scilit] [PubMed]
- Lekakh, S.N.; Bofah, A.; Godlewski, L.A.; Li, M. Effect of Micro Structural Dispersity of Si Mo Ductile Iron on High Temperature Performance during Static Oxidation. Metals 2022, 12, 661. [Google Scholar] [CrossRef] [Scilit]
- Mirek, P.; Piekło, J.; Garbacz-Klempka, A. Experimentaland NumericalAnalysisofThermal Fatigue of Grey Cast Iron Ingot Mould. Materials 2024, 17, 5735. [Google Scholar] [CrossRef] [Scilit] [PubMed]
- Chen, S.W.; Huang, E.W.; Chiu, S.M.; Reid, M.; Wu, C.Y.; Paradowska, A.M.; Lam, T.N.; Wu, Y.H.; Lee, S.Y.; Lu, S.C.; et al. Diffraction-based Residual Stress Mapping of a Stress Frame of Gray Iron via Vibratory Stress Relief Method. Front. Mater. 2022, 9, 859342. [Google Scholar] [CrossRef] [Scilit]
- Cai, H.; Gu, J. Microstructure, residual stress and electrochemical corrosion behavior of gray cast iron subjected to massive laser cavitation peening. Appl. Phys. A 2026, 132, 84. [Google Scholar] [CrossRef] [Scilit]

Disclaimer/Publisher’s Note: The statements, opinions and data contained in all publications are solely those of the individual author(s) and contributor(s) and not of MDPI and/or the editor(s). MDPI and/or the editor(s) disclaim responsibility for any injury to people or property resulting from any ideas, methods, instructions or products referred to in the content. |
© 2026 by the authors. Licensee MDPI, Basel, Switzerland. This article is an open access article distributed under the terms and conditions of the Creative Commons Attribution (CC BY) license.