


Abstract
Diffusion solidification is an effective method to produce non-dendritic microstructures and reduce casting defects in magnesium alloys. However, the influence of precursor alloy superheat on the solidification behavior and the resulting microstructure remains insufficiently understood. In this study, pure magnesium was used as the high thermal mass (HTM) alloy and three Mg-Al-Zn alloys with different aluminum and zinc contents were used as the low thermal mass (LTM) alloys. The effects of superheat on grain morphology, solute diffusion, and constitutional supercooling were investigated through a combination of experimental casting and numerical simulation using Ansys Fluent and Matlab. The results show that the solidified interface consists of five distinct regions, including two base metals, two transition zones, and a central controlled diffusion solidification zone. A higher superheat of the HTM alloy relative to the LTM alloy promotes a wider transition zone and finer globular grains, whereas equal or lower superheat leads to columnar or rosette structures. The Mg-30 wt.%Al-3.5 wt.%Zn alloy with moderate aluminum content produces fine globular grains due to a thinner constitutional supercooling layer and a higher degree of supercooling, which suppresses grain growth and increases nucleation rate. In contrast, the Mg-55 wt.%Al-6.5 wt.%Zn alloy with high aluminum content forms coarse rosette and columnar grains. Among the conditions investigated, the combination of 10 °C HTM and 5 °C LTM superheats tends to promote the formation of fine equiaxed grains. Increasing superheat above this range reduces supercooling and coarsens grains, while decreasing superheat inhibits interface diffusion and promotes solute segregation. The findings provide a theoretical basis for designing precursor alloy compositions and superheat parameters in controlled diffusion solidification of magnesium alloys.
1. Introduction
Magnesium alloys are widely used in aerospace and aviation due to their low density and high strength. Magnesium is also recognized as an important nutritional element with diverse physiological functions [1,2,3]. However, their high chemical activity leads to the formation of a loose and non-protective magnesium oxide layer, which makes the molten alloy highly susceptible to ignition at elevated temperatures. Current research on flame retardancy mainly focuses on alloying strategies. The addition of certain reactive elements can promote the formation of a dense oxide layer [4,5]. Nevertheless, such oxide layers cannot provide long-term protection for high-temperature melts. Furthermore, adding large amounts of alloying elements may adversely affect the mechanical properties of the alloy.
The growth of the protective oxide layer during the initial stage of magnesium alloy melt oxidation is governed by diffusion [6]. Therefore, lowering the melt temperature can suppress this oxidation kinetic process by reducing the diffusion rate, in addition to forming a dense protective oxide layer on the melt surface. For AZ91 magnesium alloy, holding in the semi-solid temperature range of 520 °C to 570 °C can lead to combustion. But the holding time before combustion, defined as the ignition incubation period, decreases with increasing holding temperature [7]. Consequently, lowering the pouring temperature not only shortens solidification time but also extends the ignition incubation period of the melt. Moreover, the ignition point of magnesium alloys generally lies above the solidus temperature [8]. Thus, ignition during solidification can be avoided by reducing the pouring temperature. However, an excessively low pouring temperature typically reduces the filling capacity of the alloy, resulting in incomplete castings.
Controlled diffusion solidification is a new semi-solid solidification technology recently proposed by Saha et al. [9]. The solid fraction of this method during casting is usually less than 5% [10], which is much lower than that of conventional semi-solid solidification, where the solid phase fraction is around 50%. This low solid phase fraction ensures casting integrity under non-pressure-driven filling conditions. In addition to forming a non-dendritic solidification microstructure, controlled diffusion solidification offers advantages such as efficient shrinkage feeding, elimination of segregation, and reduction of hot tearing [11,12].
The basic principle of controlled diffusion solidification involves holding two prefabricated melts, namely a high thermal mass (HTM) alloy and a low thermal mass (LTM) alloy, near their respective liquidus temperatures. These two melts are then mixed in a specific mass ratio to form the target composition alloy. The HTM alloy generally possesses a lower solute content and higher liquidus temperature, while the LTM alloy is characterized by a higher solute content and lower liquidus temperature. The mass of HTM is equal to or larger than that of the LTM. The compositions of the two precursor alloys must be matched to achieve the desired target alloy composition upon mixing. After mixing, a large number of primary crystalline nuclei appear in the HTM melt due to the cooling effect of the LTM melt [13]. Whether these nuclei can grow into a non-dendritic microstructure is closely related to the composition of the prefabricated melts and the mixing process parameters [14]. Ashtari et al. successfully combined controlled diffusion solidification with the gravity tilt casting process to fabricate castings of 2024, 6082, and 7075 aluminum alloys [13]. Saha et al. found that controlled diffusion solidification eliminated the dendritic solidification of α-Al in various wrought aluminum alloys, produced fine equiaxed grains, improved shrinkage feeding efficiency, and reduced porosity [9]. ZL205A alloy can even be cast without a riser using controlled diffusion solidification [15]. These findings demonstrate that controlled diffusion solidification technology has significant advantages in suppressing in-mold ignition and controlling defects during the casting of magnesium alloys.
At present, the formation mechanism of the non-dendritic microstructure in controlled diffusion solidification remains unclear. According to the two-step nucleation theory, controlled diffusion solidification differs from conventional nucleation theory in that energy and composition fluctuations do not occur simultaneously, and thermal equilibrium is established more rapidly than solute equilibrium [16,17]. This lack of understanding results in an insufficient theoretical basis for designing prefabricated alloy compositions.
Ashtari et al. [18] proposed three principles for designing the prefabricated alloy composition to obtain a non-dendritic microstructure. (1) The liquidus temperature difference between the HTM alloy and the LTM alloy should be at least 50–80 °C. (2) The mass ratio of HTM to LTM (HTM: LTM) is at least 3:1. (3) The equilibrium temperature of the melt mixing process should be above the liquidus temperature of the target alloy. In fact, these design criteria are derived from experimental observations and are not universally applicable. For example, even when the liquidus temperature difference between the prefabricated alloys is less than 50 °C, castings of 7xxx alloy with a non-dendritic structure can still be obtained [19]. Ashtari also pointed out that the weighted average of the free energies of the two prefabricated alloys is lower than the Gibbs free energy of the target alloy at its liquidus temperature [13]. Birsan et al. changed the microstructure of the target alloy from globular non-dendritic to rosette and then to dendritic by applying different superheats of 2 °C, 15 °C, and 25 °C to HTM [20]. This result indicates that the superheats of HTM and LTM have a great influence on the microstructure of the target alloy. However, the relationship between the superheats of HTM and LTM has not been defined, and the design of precursor alloy superheats lacks both a theoretical and an experimental basis. In this study, the effect of different superheats on the grain morphology and diffusion distance of pure magnesium (HTM) and Mg-Al-Zn magnesium alloy (LTM) during the solidification of the mixed alloy was experimentally investigated, and numerical simulations assisted in verifying the effect of temperature changes on the transition zone.
2. Materials and Experiments
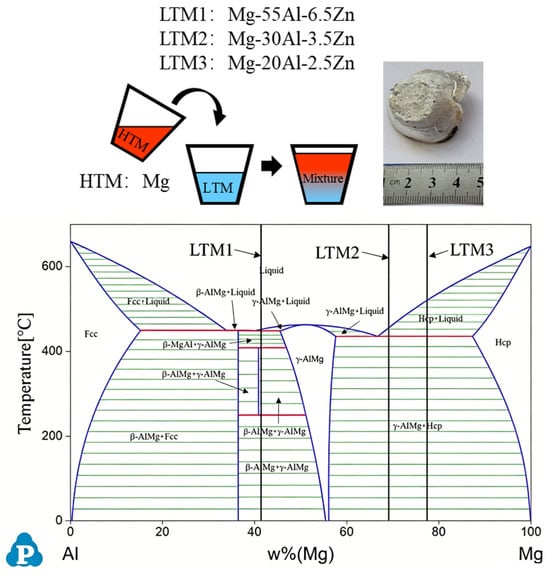
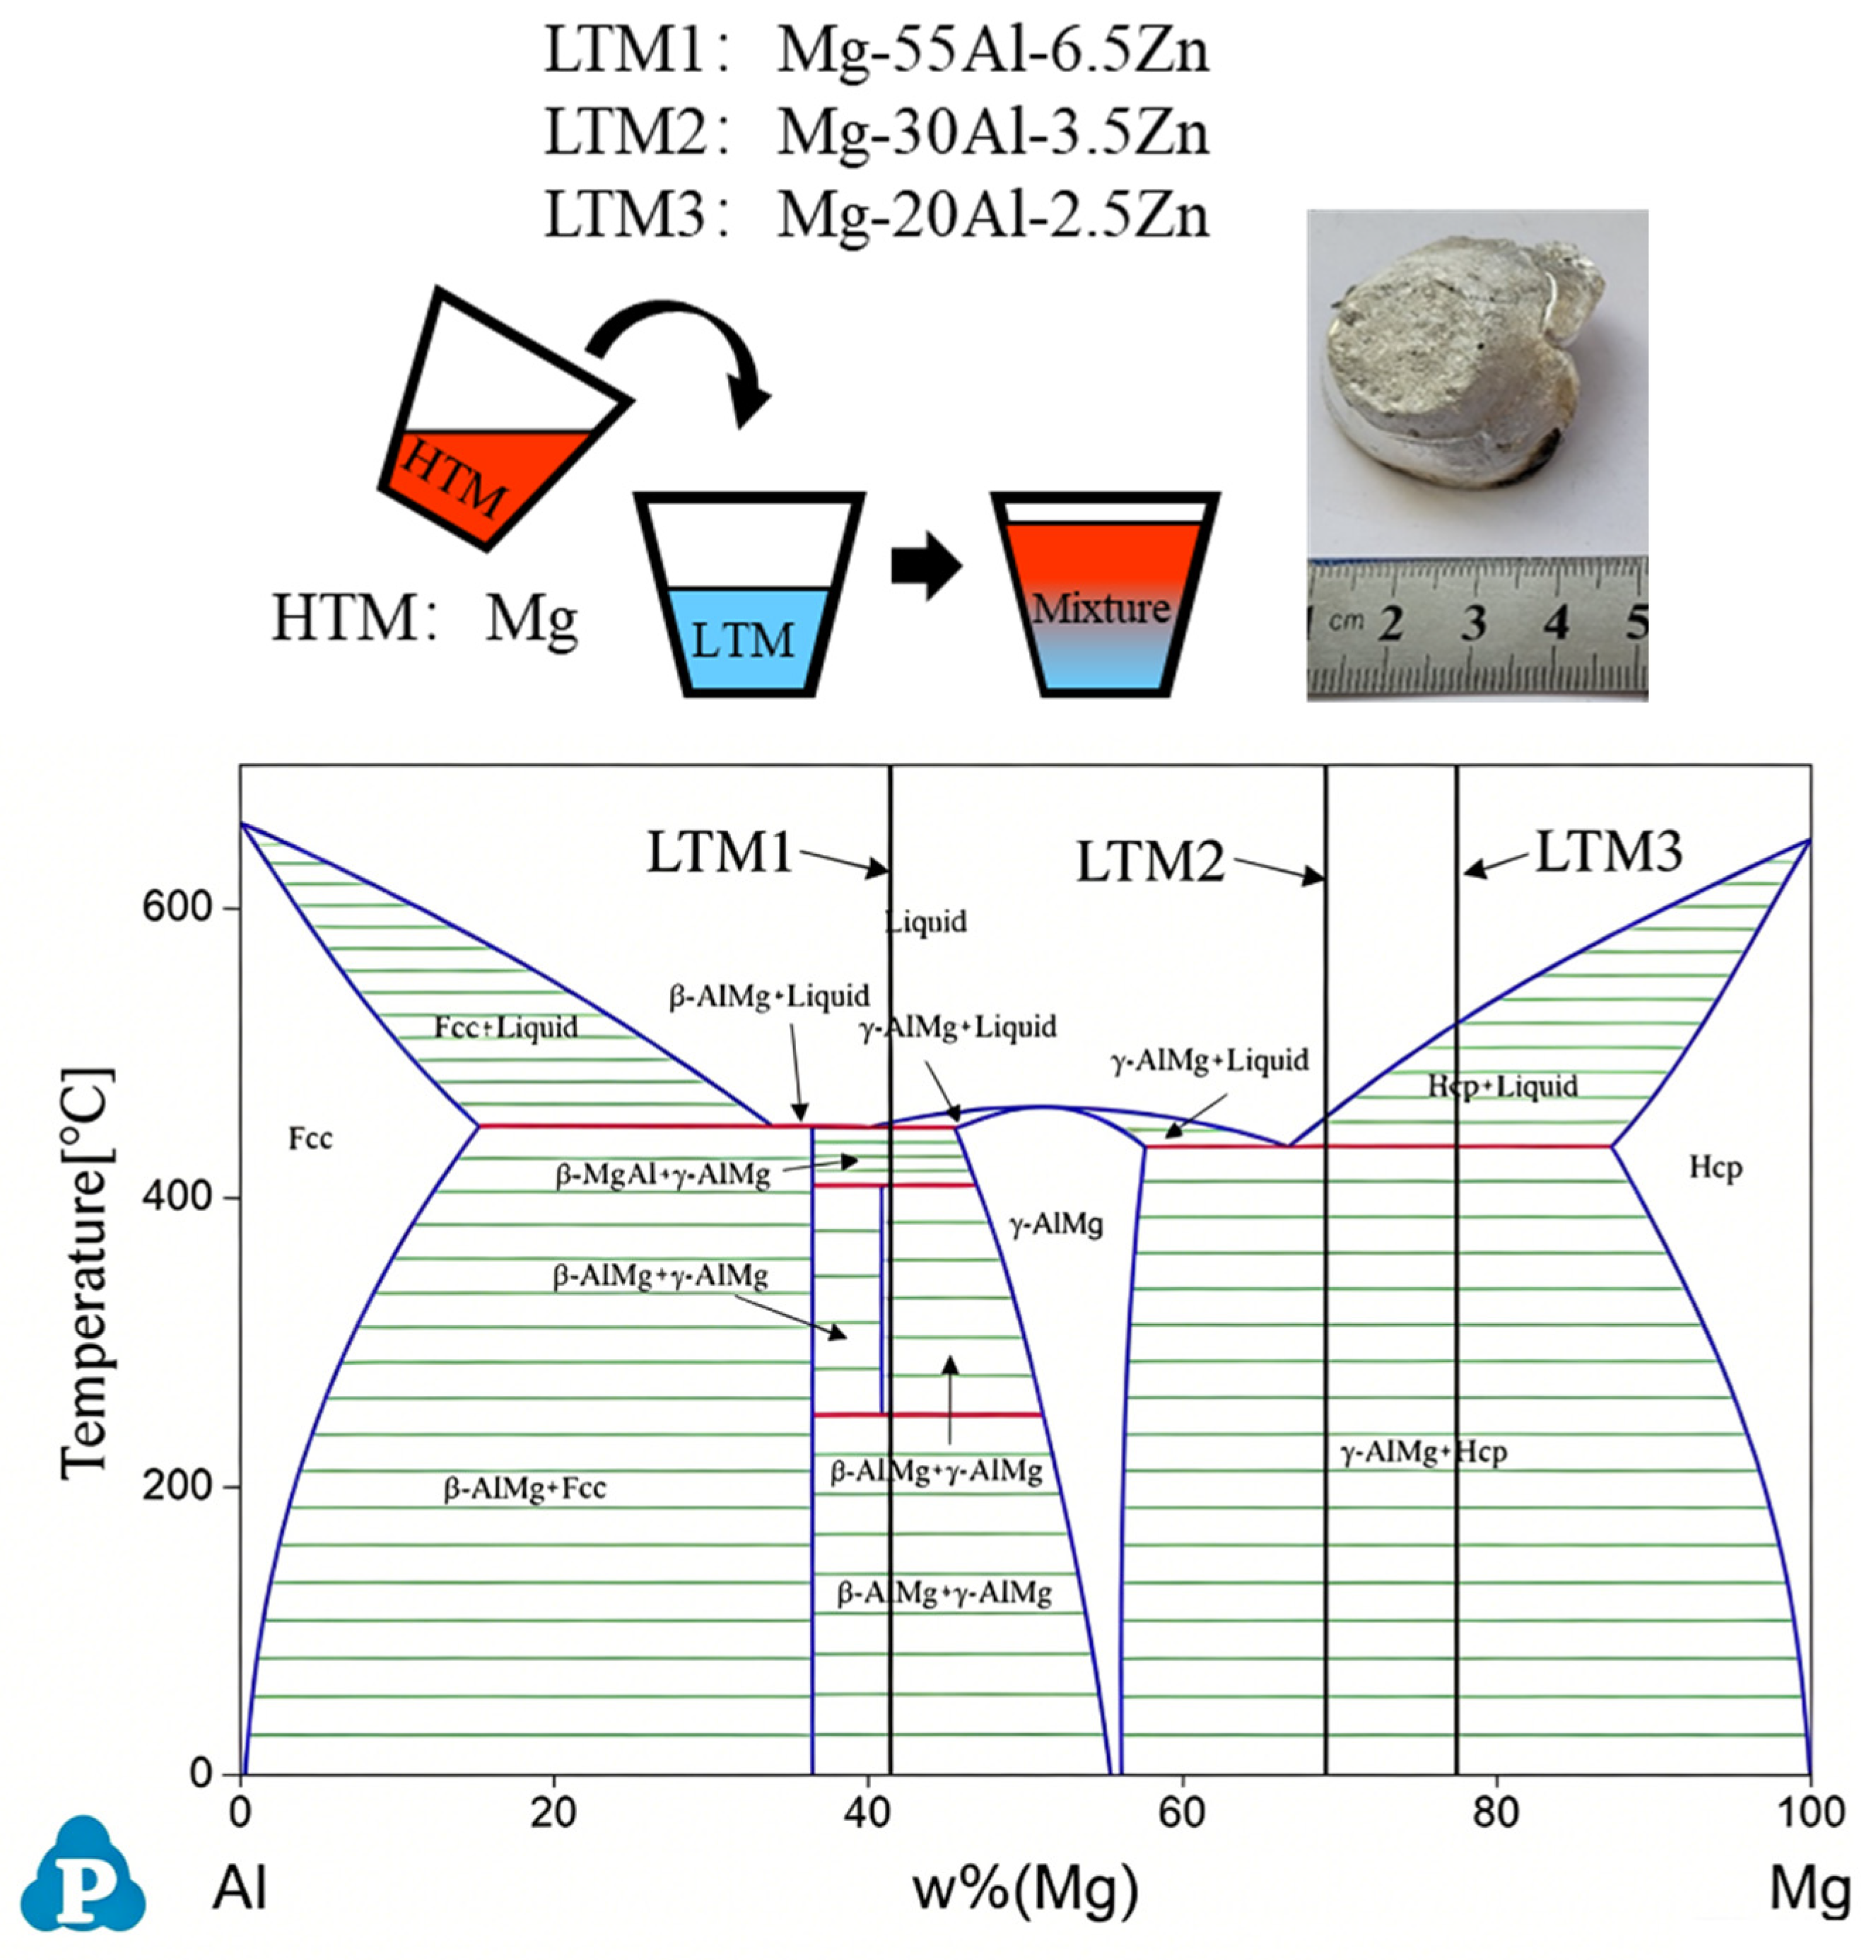
In this study, 99.95 wt.% pure magnesium (Henan Mingmei Magnesium Technology Co., Ltd., Hebi, China) was used as the HTM alloy. Three different Mg-Al-Zn magnesium alloys were used as the LTM alloys. LTM alloys were prepared by melting pure magnesium, Mg-30 wt.% Zn master alloy (Henan Mingmei Magnesium Technology Co., Ltd., Hebi, China), and pure aluminum (Huazhu Aluminium Industry Co., Ltd., Foshan, China) under a protective gas. A certain mass of pure magnesium and a certain mass of the Mg-Al-Zn alloy were placed in two separate crucibles and heated to a temperature 10 to 20 °C above the liquidus line, and then held at that temperature for 20 min, during which the temperature was continuously monitored with a thermocouple. The furnace temperature was subsequently reduced to the desired test temperature. A spoon made of 304 stainless steel was used to reach into each crucible at the designated holding temperatures. To minimize heat loss and contamination during melt transfer, the sampling spoon was kept in the holding furnace prior to use. The spoon surface was coated with boron nitride to prevent wetting and reaction with the molten alloy. The molten pure magnesium was then quickly transferred onto the surface of the molten Mg-Al-Zn alloy within 2–3 s, as illustrated in Figure 1. The melt was directly solidified in the 304 stainless steel spoons (inner diameter ~30 mm, depth ~20 mm). To avoid rapid cooling, the spoon was placed on a thermal insulation blanket immediately after pouring. A very low pouring height (~5 mm) and small droplet size were employed to ensure gentle laminar contact between the HTM and LTM, rather than impact mixing. More importantly, Figure 1 provides direct experimental evidence: a sharp, straight, and visually distinct macroscopic interface demarcation line is clearly preserved between the two melts. This feature confirms that the two melts remained in a quasi-static contact state without macroscopic convective mixing during the entire experiment, which justifies the use of a diffusion-dominated transport model in the subsequent numerical analysis. The melt superheats used in the experiments of this study are shown in Table 1. Every experimental condition was independently repeated three times.
Figure 1.
Schematic of the CDS process and the resultant ingot, and phase-diagram locations of the three LTM alloys used in this study.
Table 1.
CDS casting experimental parameters used in this study. T1 and T2 present the pouring temperature of HTM and LTM. TL1 and TL2 present the liquidus temperature of HTM and LTM. ΔT1 and ΔT2 present the pouring superheat, and mr is the mass ratio of HTM to LTM (HTM: LTM).
To study the controlled diffusion solidification behavior between pure magnesium and the Mg-Al-Zn alloys, specimen sections were cut, ground, polished, and etched with a 3% nitric acid alcohol solution. The composition distribution and phases at the interface were analyzed using a NovaNano 450 field emission scanning electron microscope (SEM) equipped with energy-dispersive X-ray spectroscopy (EDS) (FEI Company, Hillsboro, OR, USA). Surface morphology was examined with a body microscope (Nikon Corporation, Tokyo, Japan) and a metallurgical microscope (Carl Zeiss AG, Oberkochen, Germany). The actual compositions of the alloys were measured using XRF (Bruker Corporation, Billerica, MA, USA), and the results are shown in Table 2.
Table 2.
Chemical compositions of precursor alloys measured by XRF (wt.%).
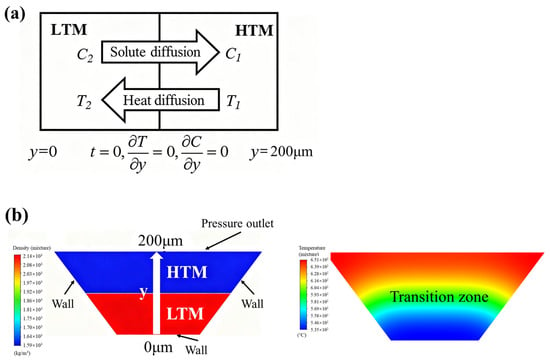
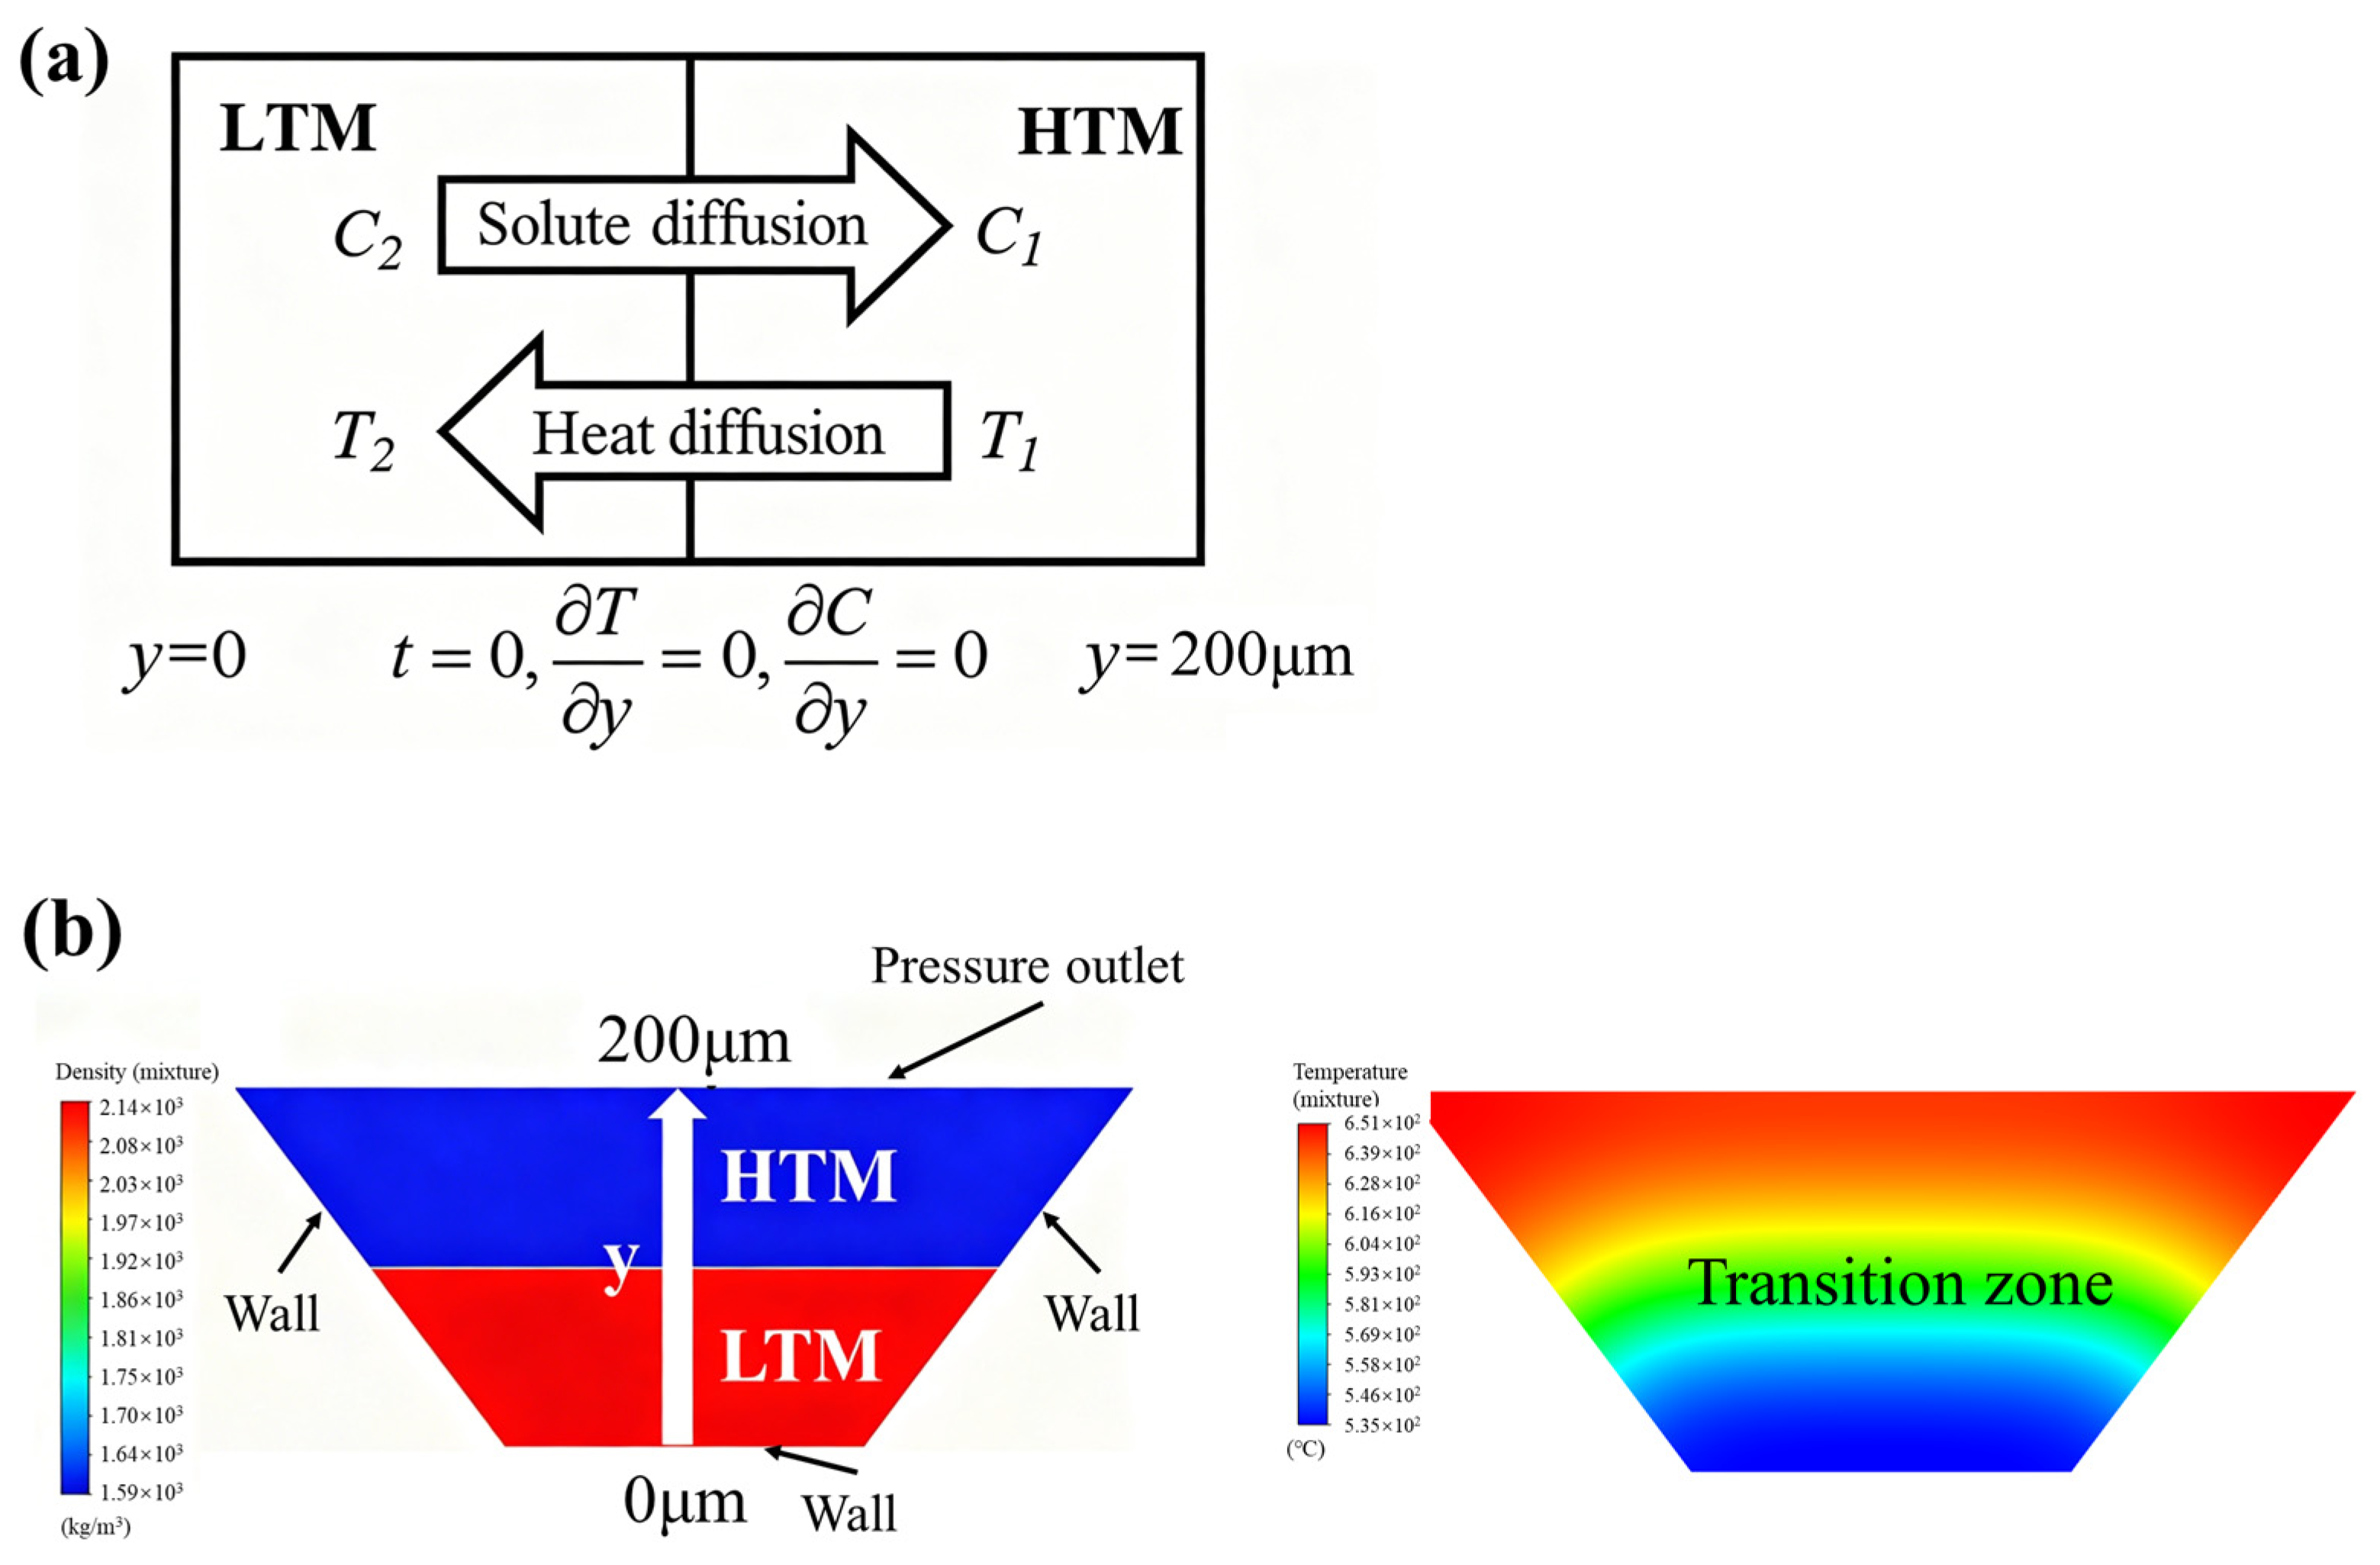
The mixing and solidification processes of the experiments listed in Table 1 were simulated using Ansys Fluent 19.2 software to understand how temperature influences solidification. A two-dimensional planar model was developed based on the volume of fluid method (VOF), combined with the laminar flow equation and the energy equation. As shown in Figure 2, two liquid phases were considered in the simulation. A uniform mesh size of 1 μm was applied, and heat losses from the funnel and crucible to the surroundings were accounted for through both radiation and convection.
Figure 2.
Schematic diagram of the numerical model for CDS solidification simulation. (a) Schematic of the solute diffusion model between the LTM and HTM. (b) Initial material configuration (left) and simulated solute concentration distribution with a transition zone (right) in the mixed alloy.
The solute diffusion behavior at the CDS interface was calculated using a one-dimensional diffusion model based on Fick’s second law (Equation (1)). It was discretized using the finite difference method and solved with MATLAB (R2022b) software. Equation (2) is an empirical formula obtained by fitting the relationship data between the liquidus temperature and the solute concentration in the hypoeutectic region of the binary Mg-Al phase diagram using MATLAB software. The R2 value for the fitting was determined to be 0.946.
TL = −3129C4 + 1826C3 − 1052C2 − 393.5C + 650
Here, t is the time (s), D is the solute diffusion coefficient (m2/s), C is the solute concentration (wt.%), y is the distance (m), and TL is the liquidus temperature (°C). The ambient temperature was set to 25.68 °C, and the convective heat transfer coefficient was 15 W/m2·K. The material properties used in this calculation were obtained from JMatPro 7.0 software as listed in Table 3. The actual compositions listed in Table 2 were used as inputs for the simulations and for Equation (2).
Table 3.
The material parameters used for simulation in this study.
The Fluent model captures the macroscopic thermal history T(t) at the HTM/LTM interface. This temperature history is then imported into the MATLAB model as a time-dependent boundary condition, where the one-dimensional diffusion equation (Equation (1)) is solved along the direction normal to the interface to obtain the solute concentration profile. The constitutional supercooling tendency is subsequently estimated using Equation (2). In this way, the two models are sequentially coupled, with Fluent providing the thermal driving conditions and MATLAB resolving the associated solute redistribution at the interface.
The numerical simulation in this work is subject to several limitations. A formal grid convergence study was not conducted. The 1 μm mesh size was adopted based on literature precedence [21] and its ability to resolve the diffusion boundary layer, but quantitative grid-independence for this specific setup remains unverified. Additionally, the one-dimensional solute diffusion model simplifies the actual transport phenomena by neglecting lateral solute redistribution, and quantitative validation against experimental measurements is lacking. Therefore, the simulation results should be regarded as semi-quantitative indicators of trends rather than precise predictions. Their primary role in this paper is to support the interpretation of the experimental microstructural observations. Future studies with systematic grid refinement and experimental validation are needed to confirm the quantitative aspects of the model.
3. Results and Discussion
3.1. Analysis of the Interfacial Composition of Mg and Mg-Al-Zn Alloy
The aluminum content of LTM1 is relatively high compared to LTM2 and LTM3. It is no longer a magnesium alloy but an aluminum alloy. As the aluminum alloy matrix cannot be corroded by nitric acid, the presence of the transition zone solidified with LTM1 is more clearly visible than those of LTM2 and LTM3.
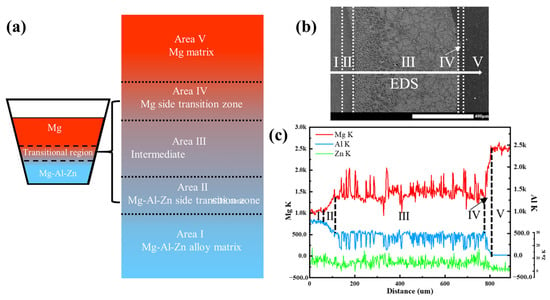
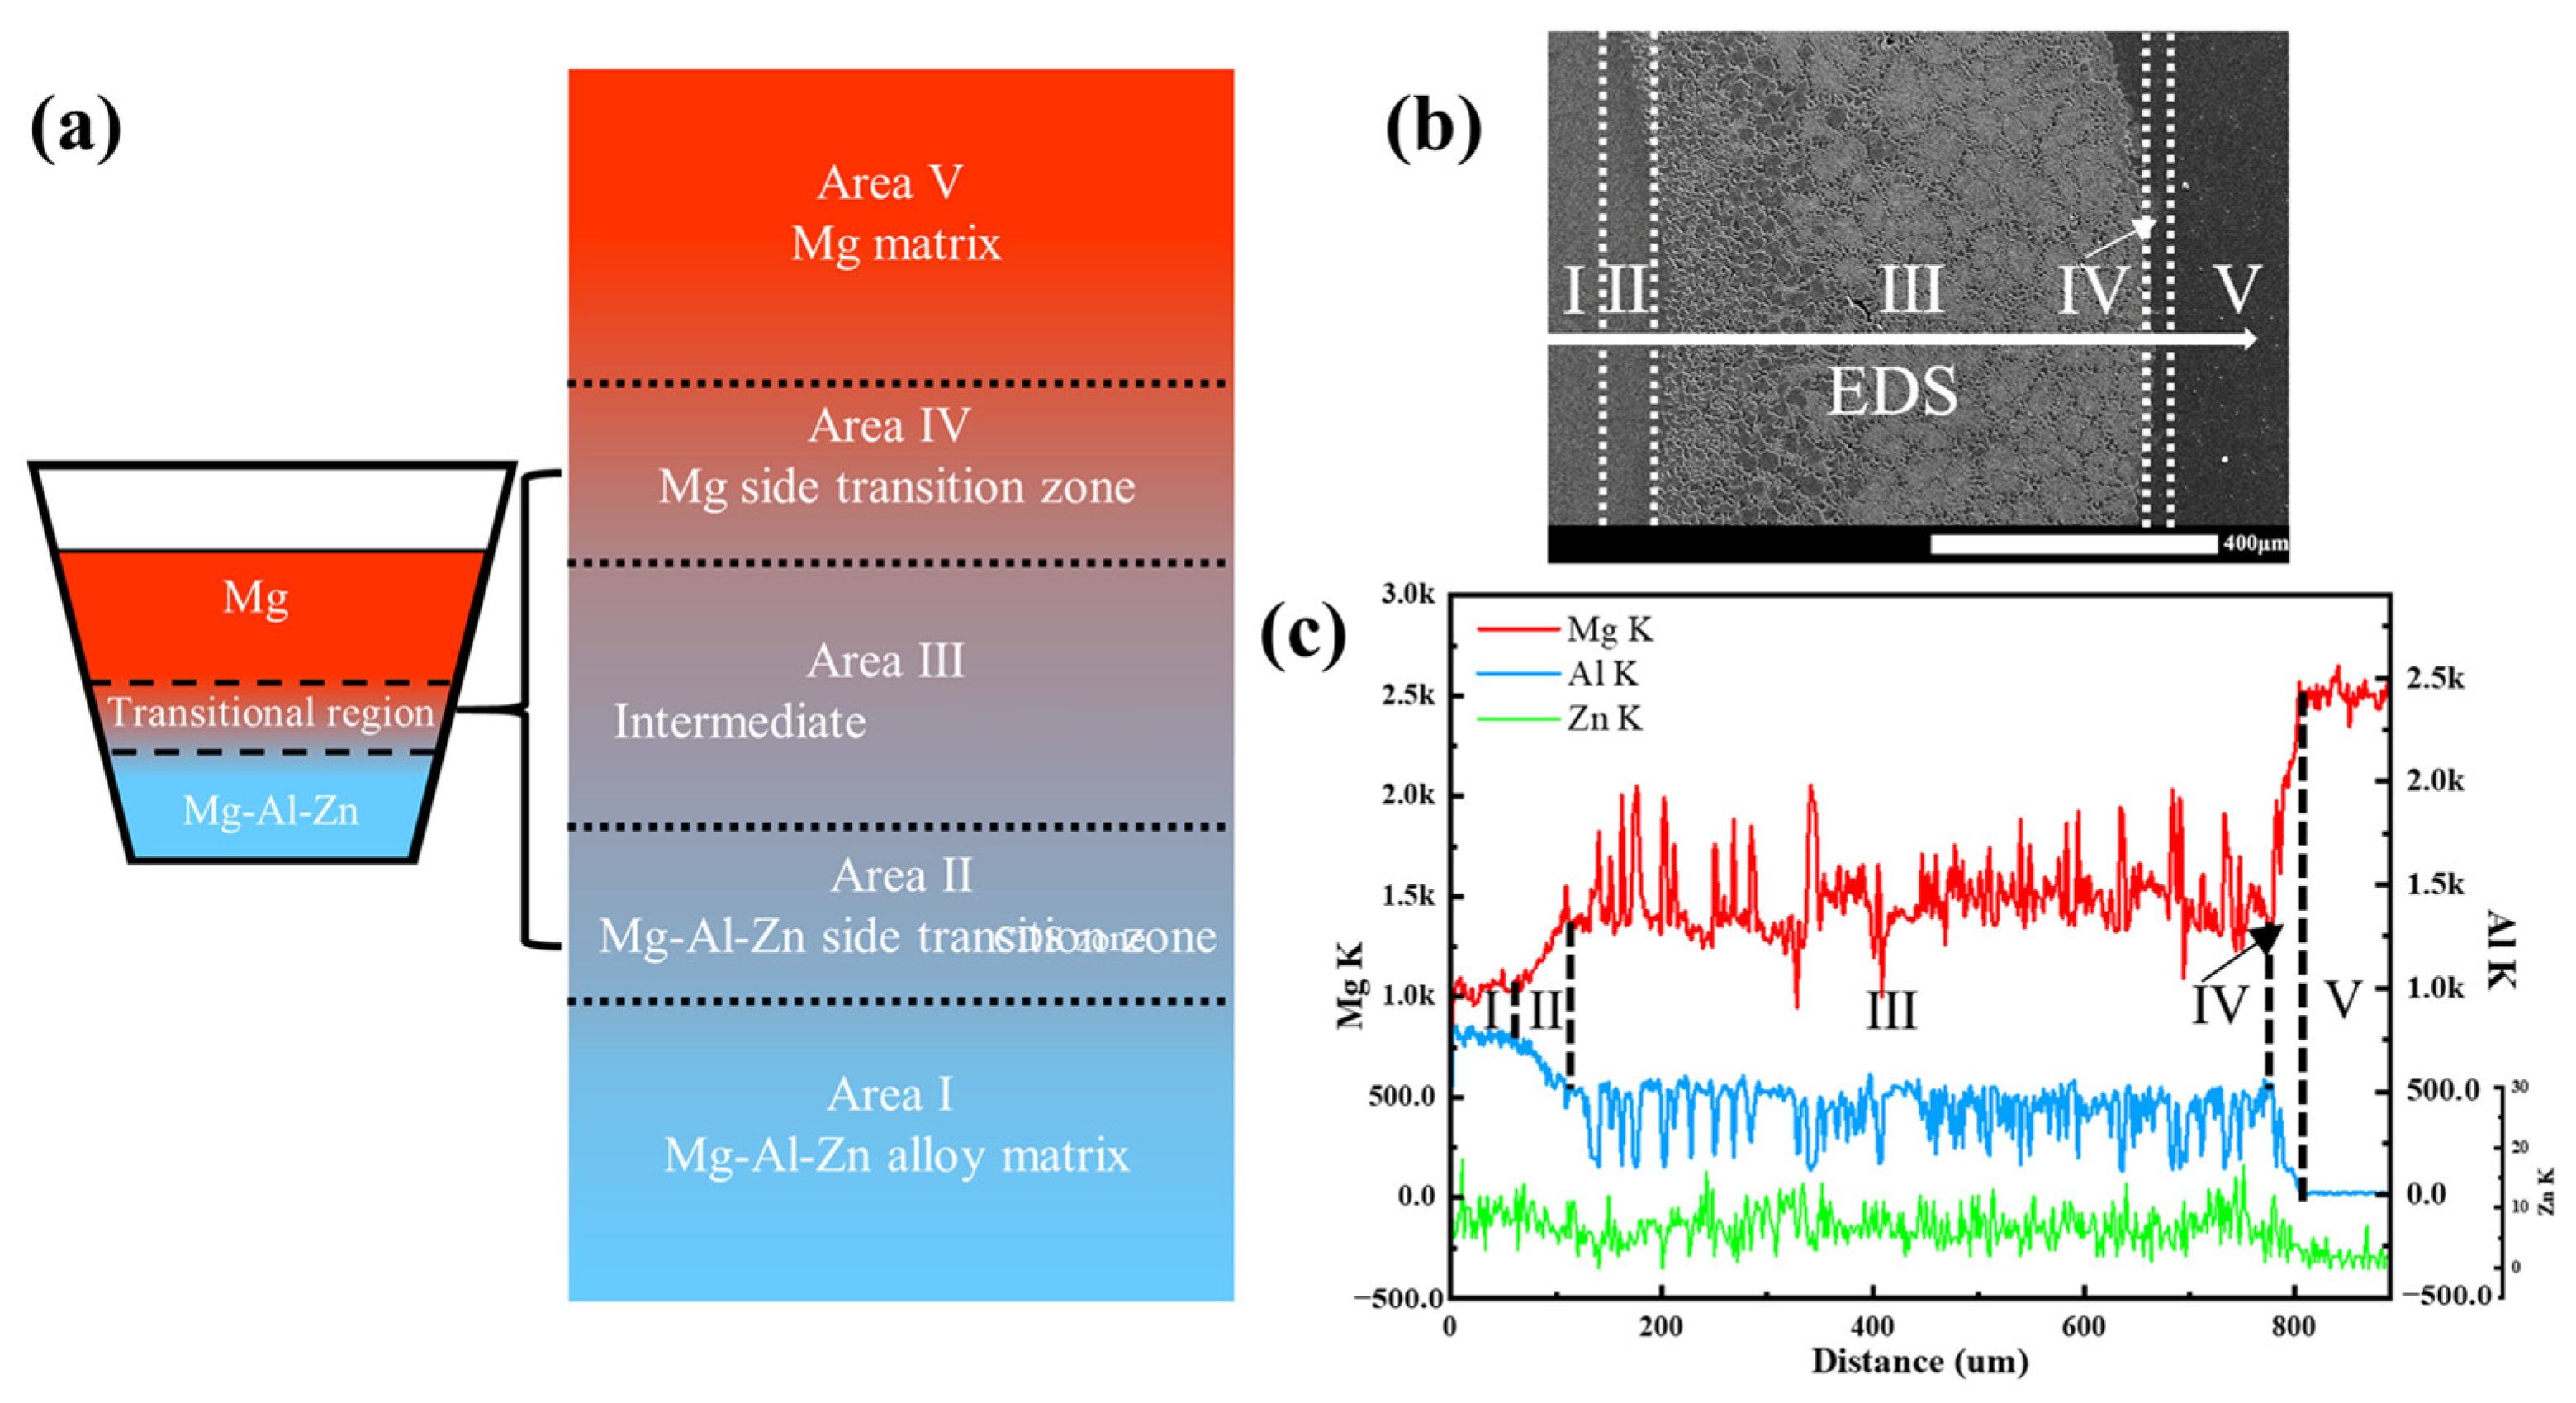
Figure 3 shows the SEM morphology of the cross-section of the mixing interface from Ex1-1. Based on the EDS line scan result shown in Figure 3c, the interface can be further divided into five regions as labeled in Figure 3a. Area I is the bottom Mg-Al-Zn matrix. Area II is the transition zone on the Mg-Al-Zn alloy side. Area III is the solidification microstructure of the central controlled diffusion solidification interface. Area IV is the transition zone on the magnesium side. Area V is the top pure magnesium matrix. Due to the differences in temperature and concentration, aluminum and zinc diffuse toward the magnesium side. In area II, the element concentration gradient exhibits a gradual transition. Near the magnesium side in area IV, the aluminum concentration decreases sharply.
Figure 3.
Interfacial microstructure between pure Mg and LTM1(Ex1-1) after controlled diffusion solidification. (a) Interfacial structure diagram; (b) SEM microstructure; (c) EDS composition analysis results.
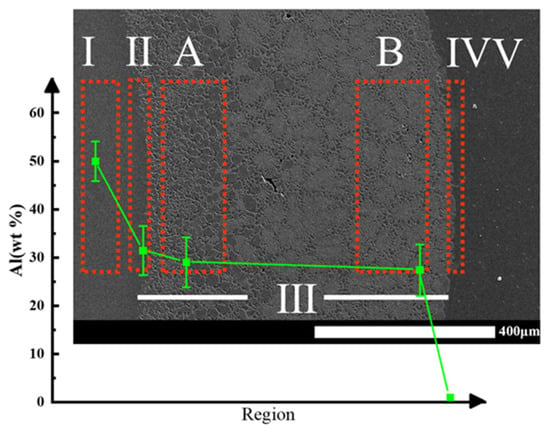
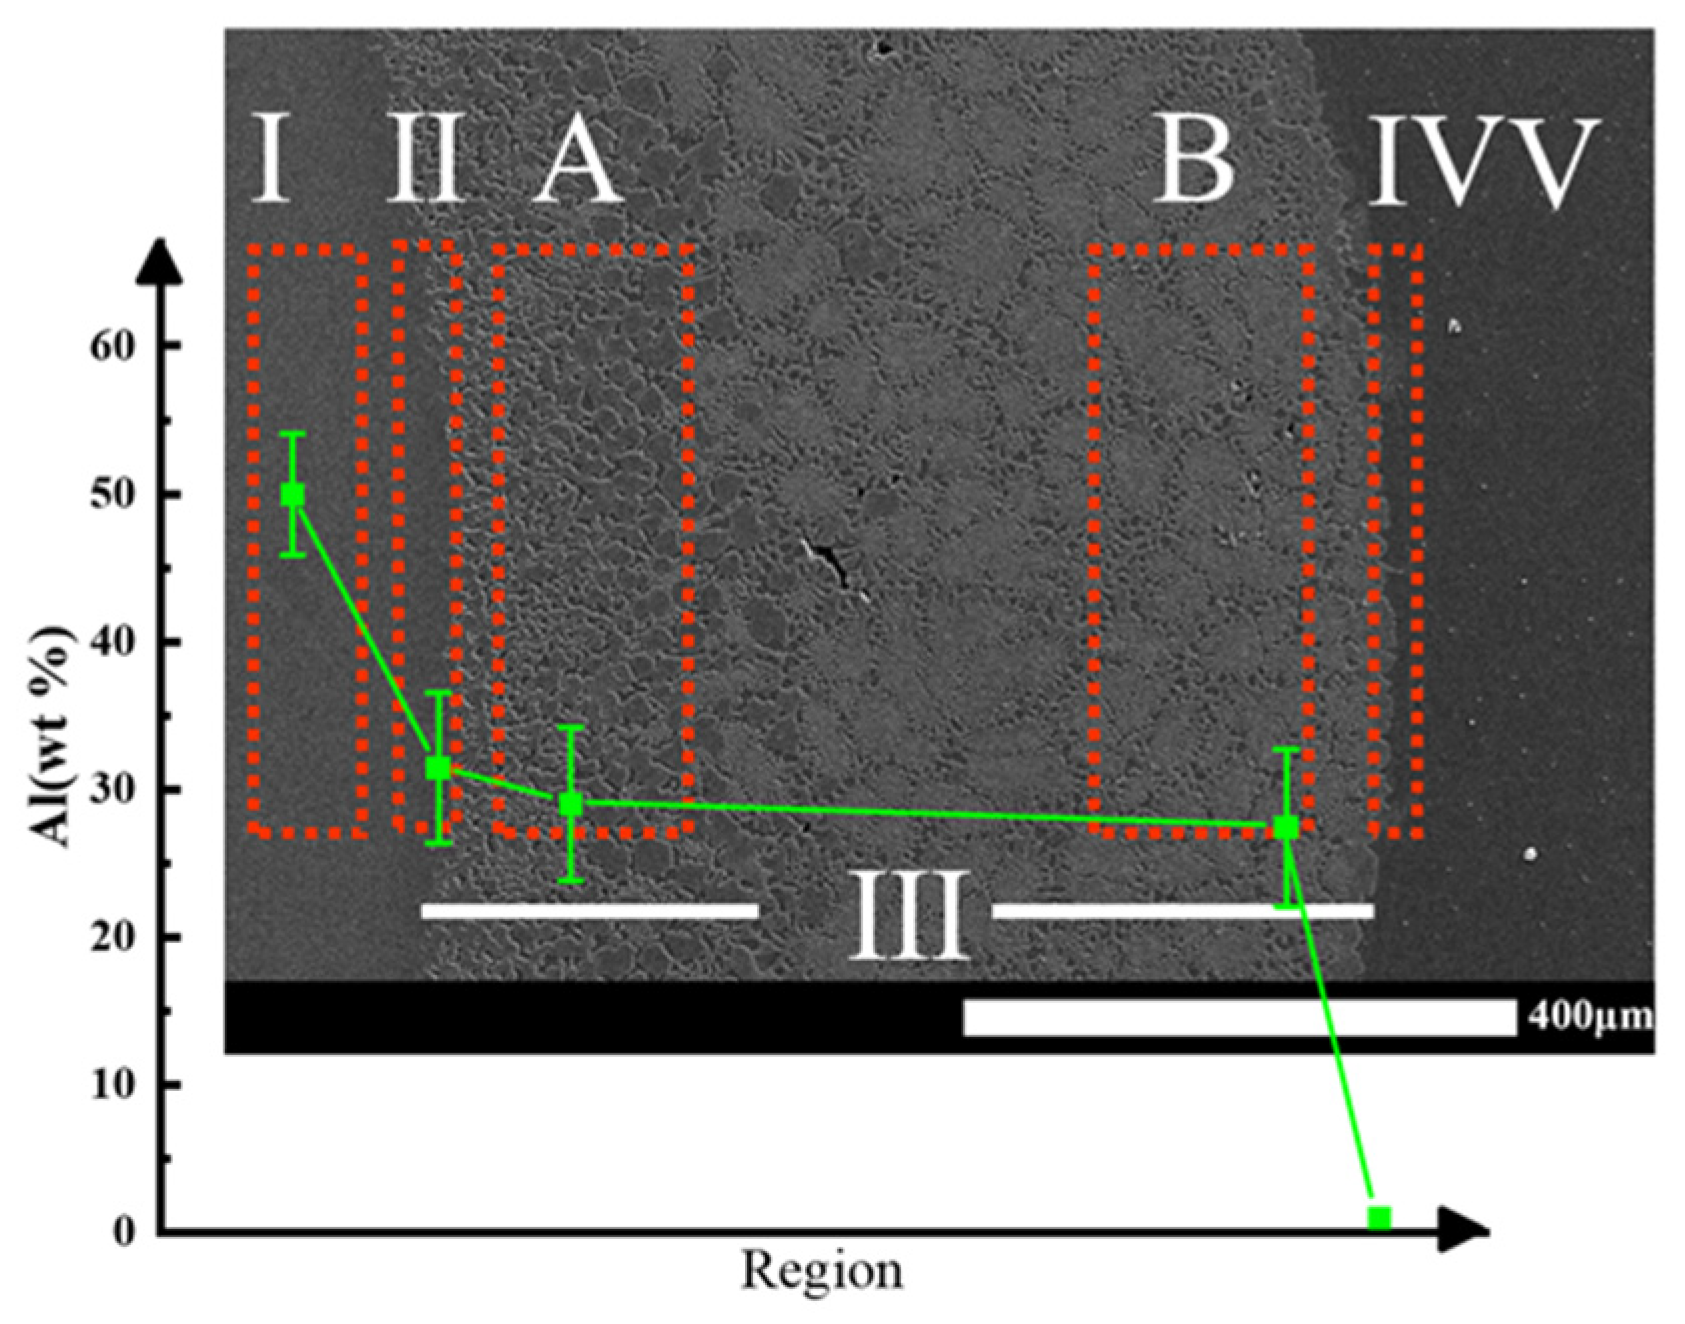
To quantitatively analyze the variation in aluminum content across the interface, local area EDS was performed as shown in Figure 4. The aluminum content decreased from 49.95 wt.% in area I to 1.02 wt.% in area IV. The decrease was relatively gradual in areas I to III, but dropped sharply in area V. During the mixing process, the diffusion of aluminum into magnesium altered the solute concentration in the liquid phase. In area III, the eutectic phase transformed from a lamellar morphology in region A to a fibrous morphology in region B. Due to the chilling effect of LTM, extensive nucleation occurred in pure magnesium. Solute atoms then diffused to form area III, while area IV resulted from solute atom diffusion toward the magnesium side. Meanwhile, because of the rapid advancement of the solid–liquid interface and the fast growth rate of nuclei, the diffusion coefficients of liquid–liquid diffusion and liquid–solid diffusion differed by orders of magnitude [22,23,24,25]. Solute atoms in area IV did not have sufficient time to diffuse further into the magnesium side, leading to a sharp concentration drop. This finding is consistent with the local interface reaction mechanism proposed by Khalaf [24] for the CDS mixing process.
Figure 4.
Variation in Al content (wt.%) at the mixing interface of pure Mg and LTM1(Ex1-1).
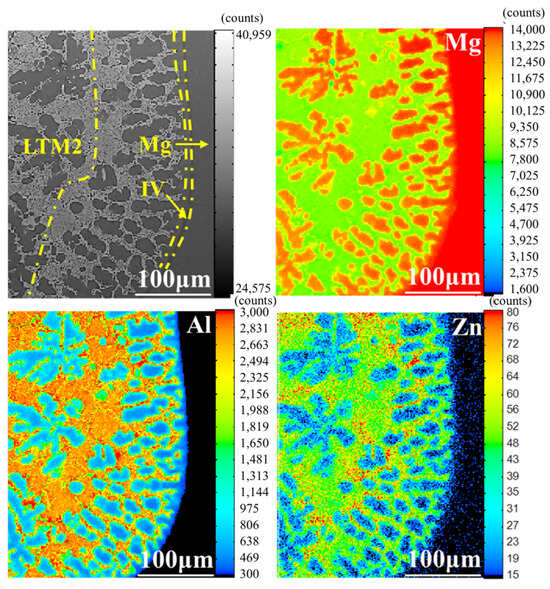
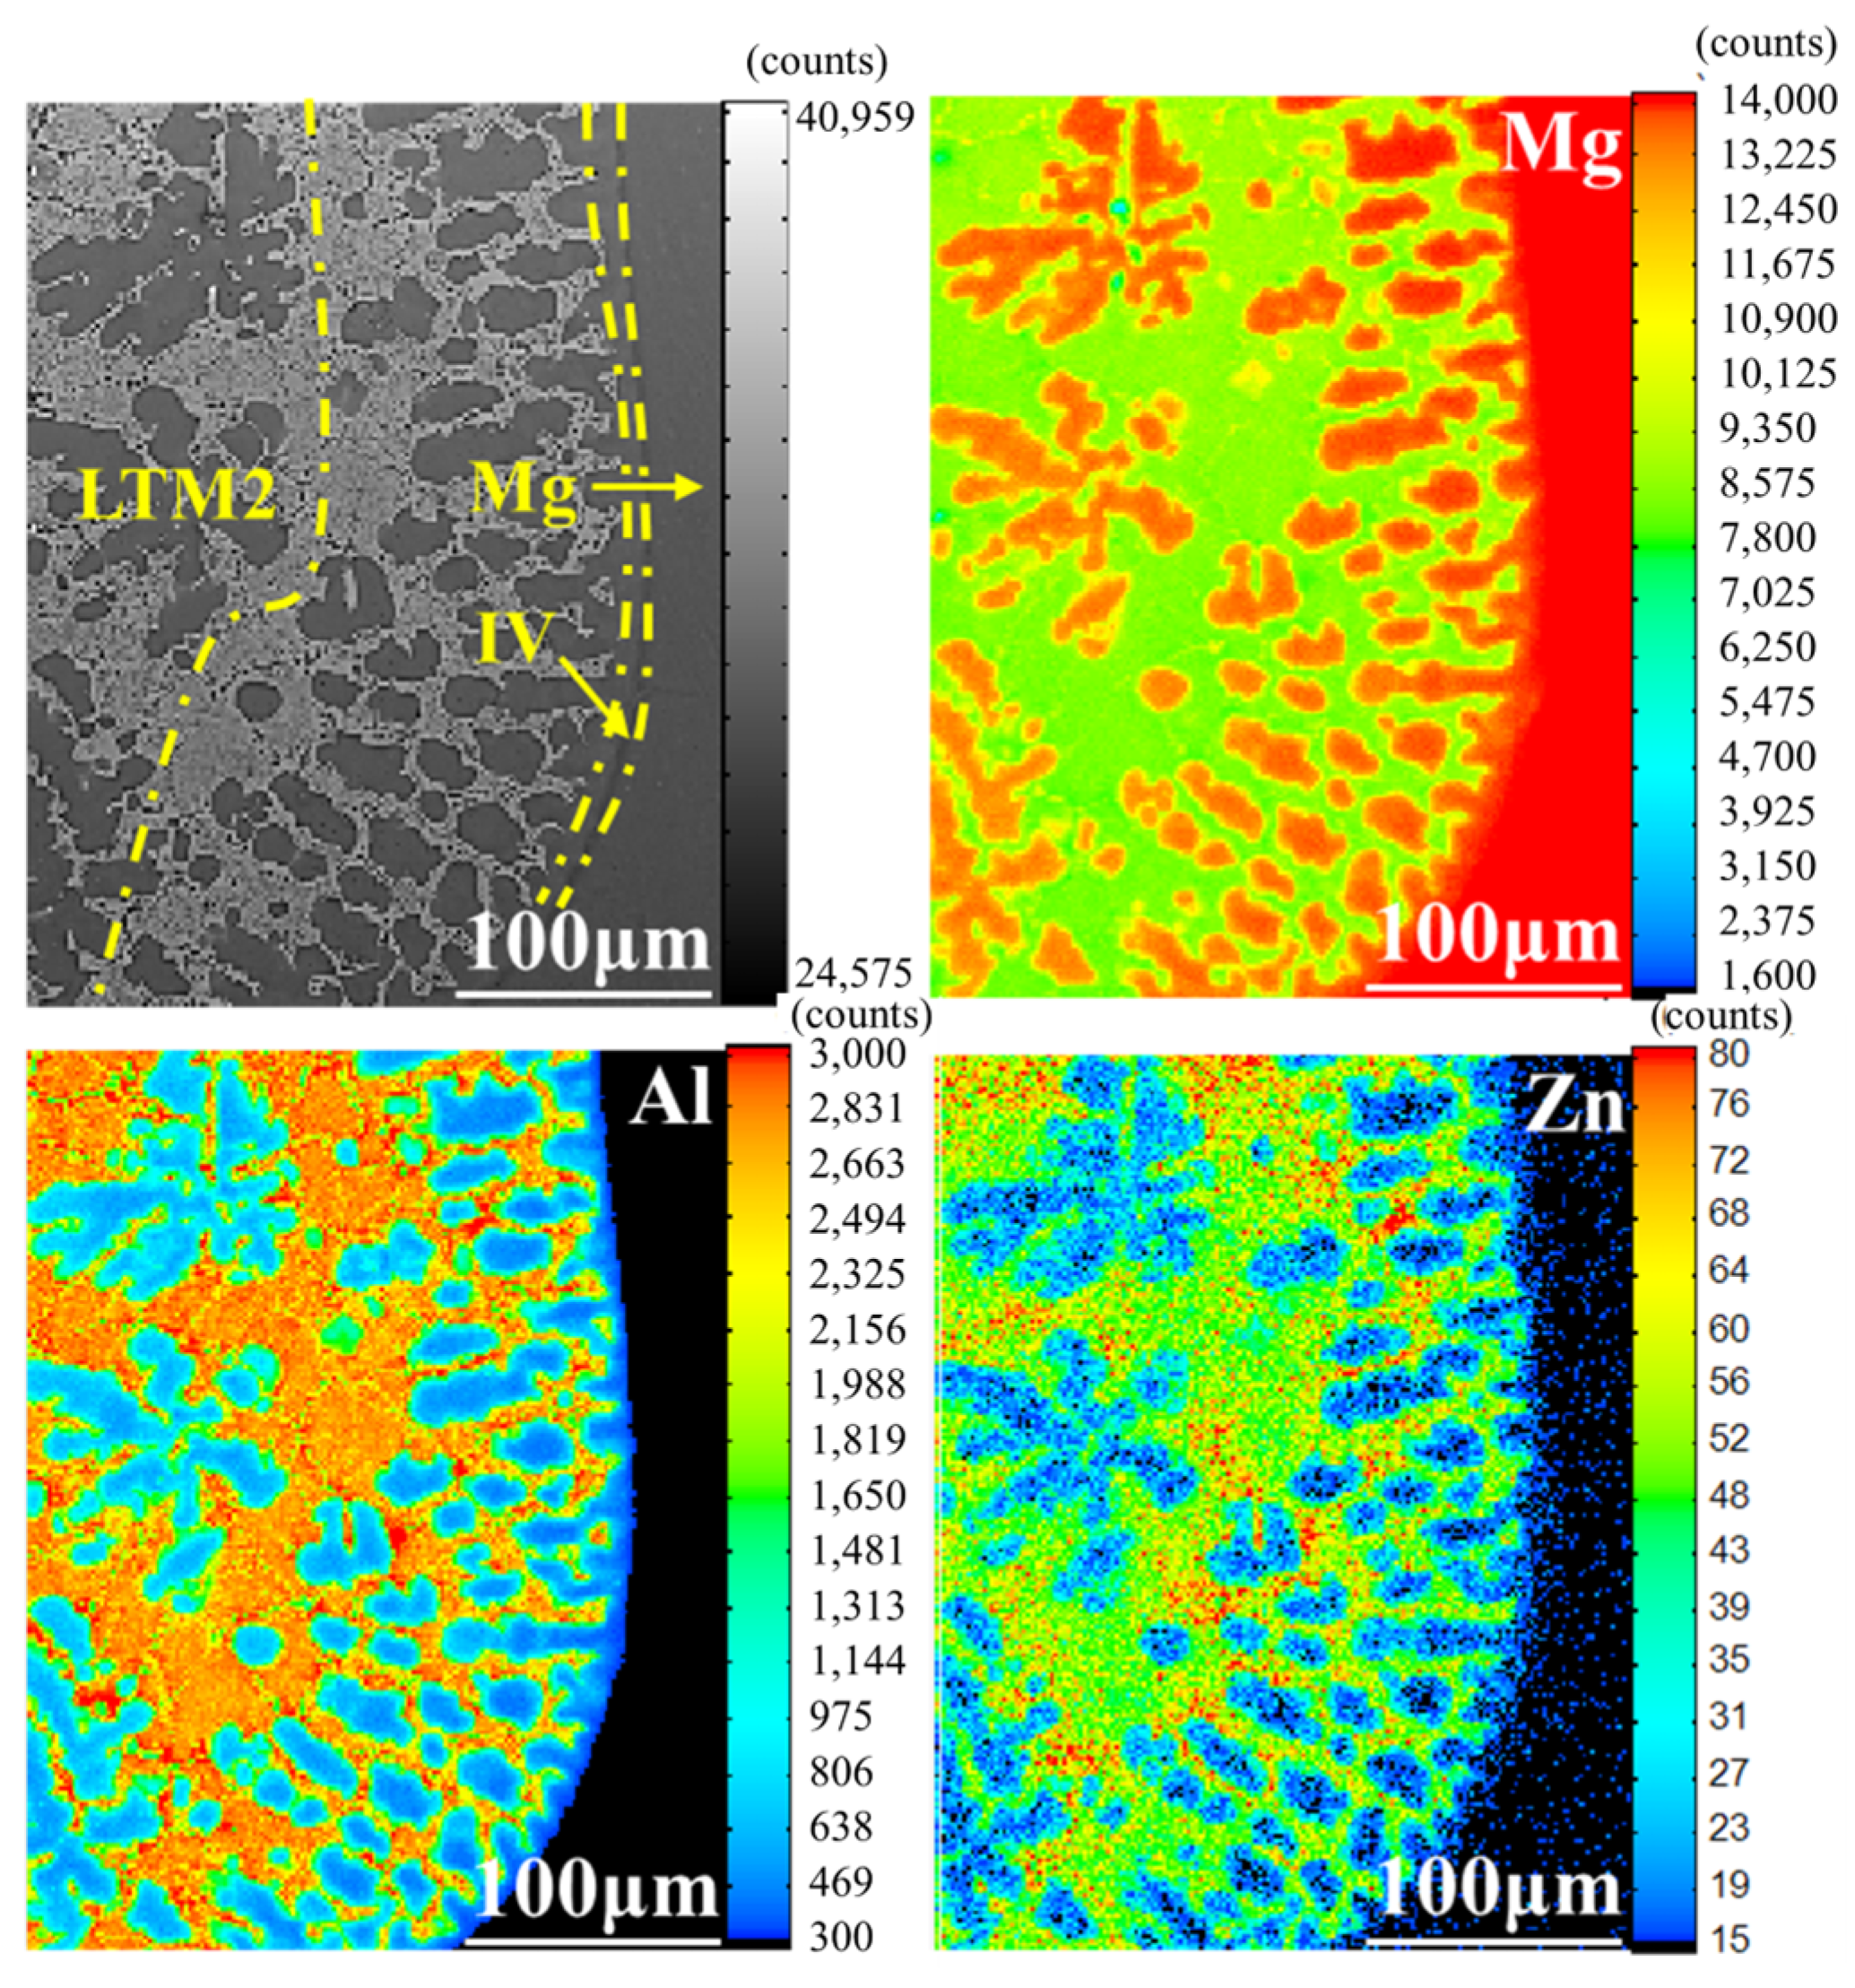
Figure 5 shows the EPMA morphology and elemental mapping of the mixing interface between HTM and LTM2 (Ex2-1). The α-Mg phase appears globular in the mixing region. According to the mapping analysis results, the aluminum content in area IV is extremely low, and the magnesium content approaches that of pure magnesium. Severe solute segregation is observed near the grain boundaries, where aluminum accumulates sharply, while zinc shows little variation. These observations indicate that nucleation occurs preferentially on the pure magnesium side, and the subsequent diffusion of solute atoms toward the magnesium side leads to the formation of the solidification structure. The solidification microstructure of the mixed interface of HTM and LTM3 is similar to that of the LTM2 mixture.
Figure 5.
EPMA morphology and mapping of mixed interface formed by LTM2 (Ex2-1).
Therefore, regardless of the Al content in the LTM alloy, no significant Al concentration gradient forms at the mixed interface. In other words, the Al distribution across the mixed interface is nearly uniform, with an Al content approximately 60% of that in the LTM alloy. EPMA mapping of Al content reveals a distinct boundary between the mixed region and the HTM side.
3.2. Effect of Superheat on the Grain Morphology of CDS Mg-Al Alloys
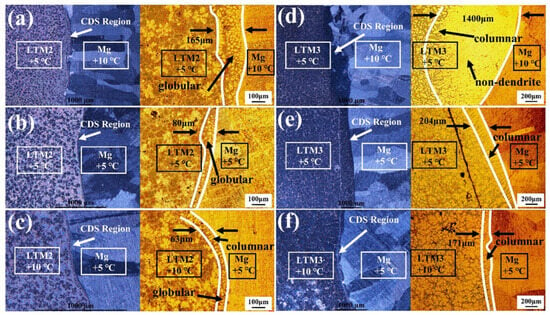
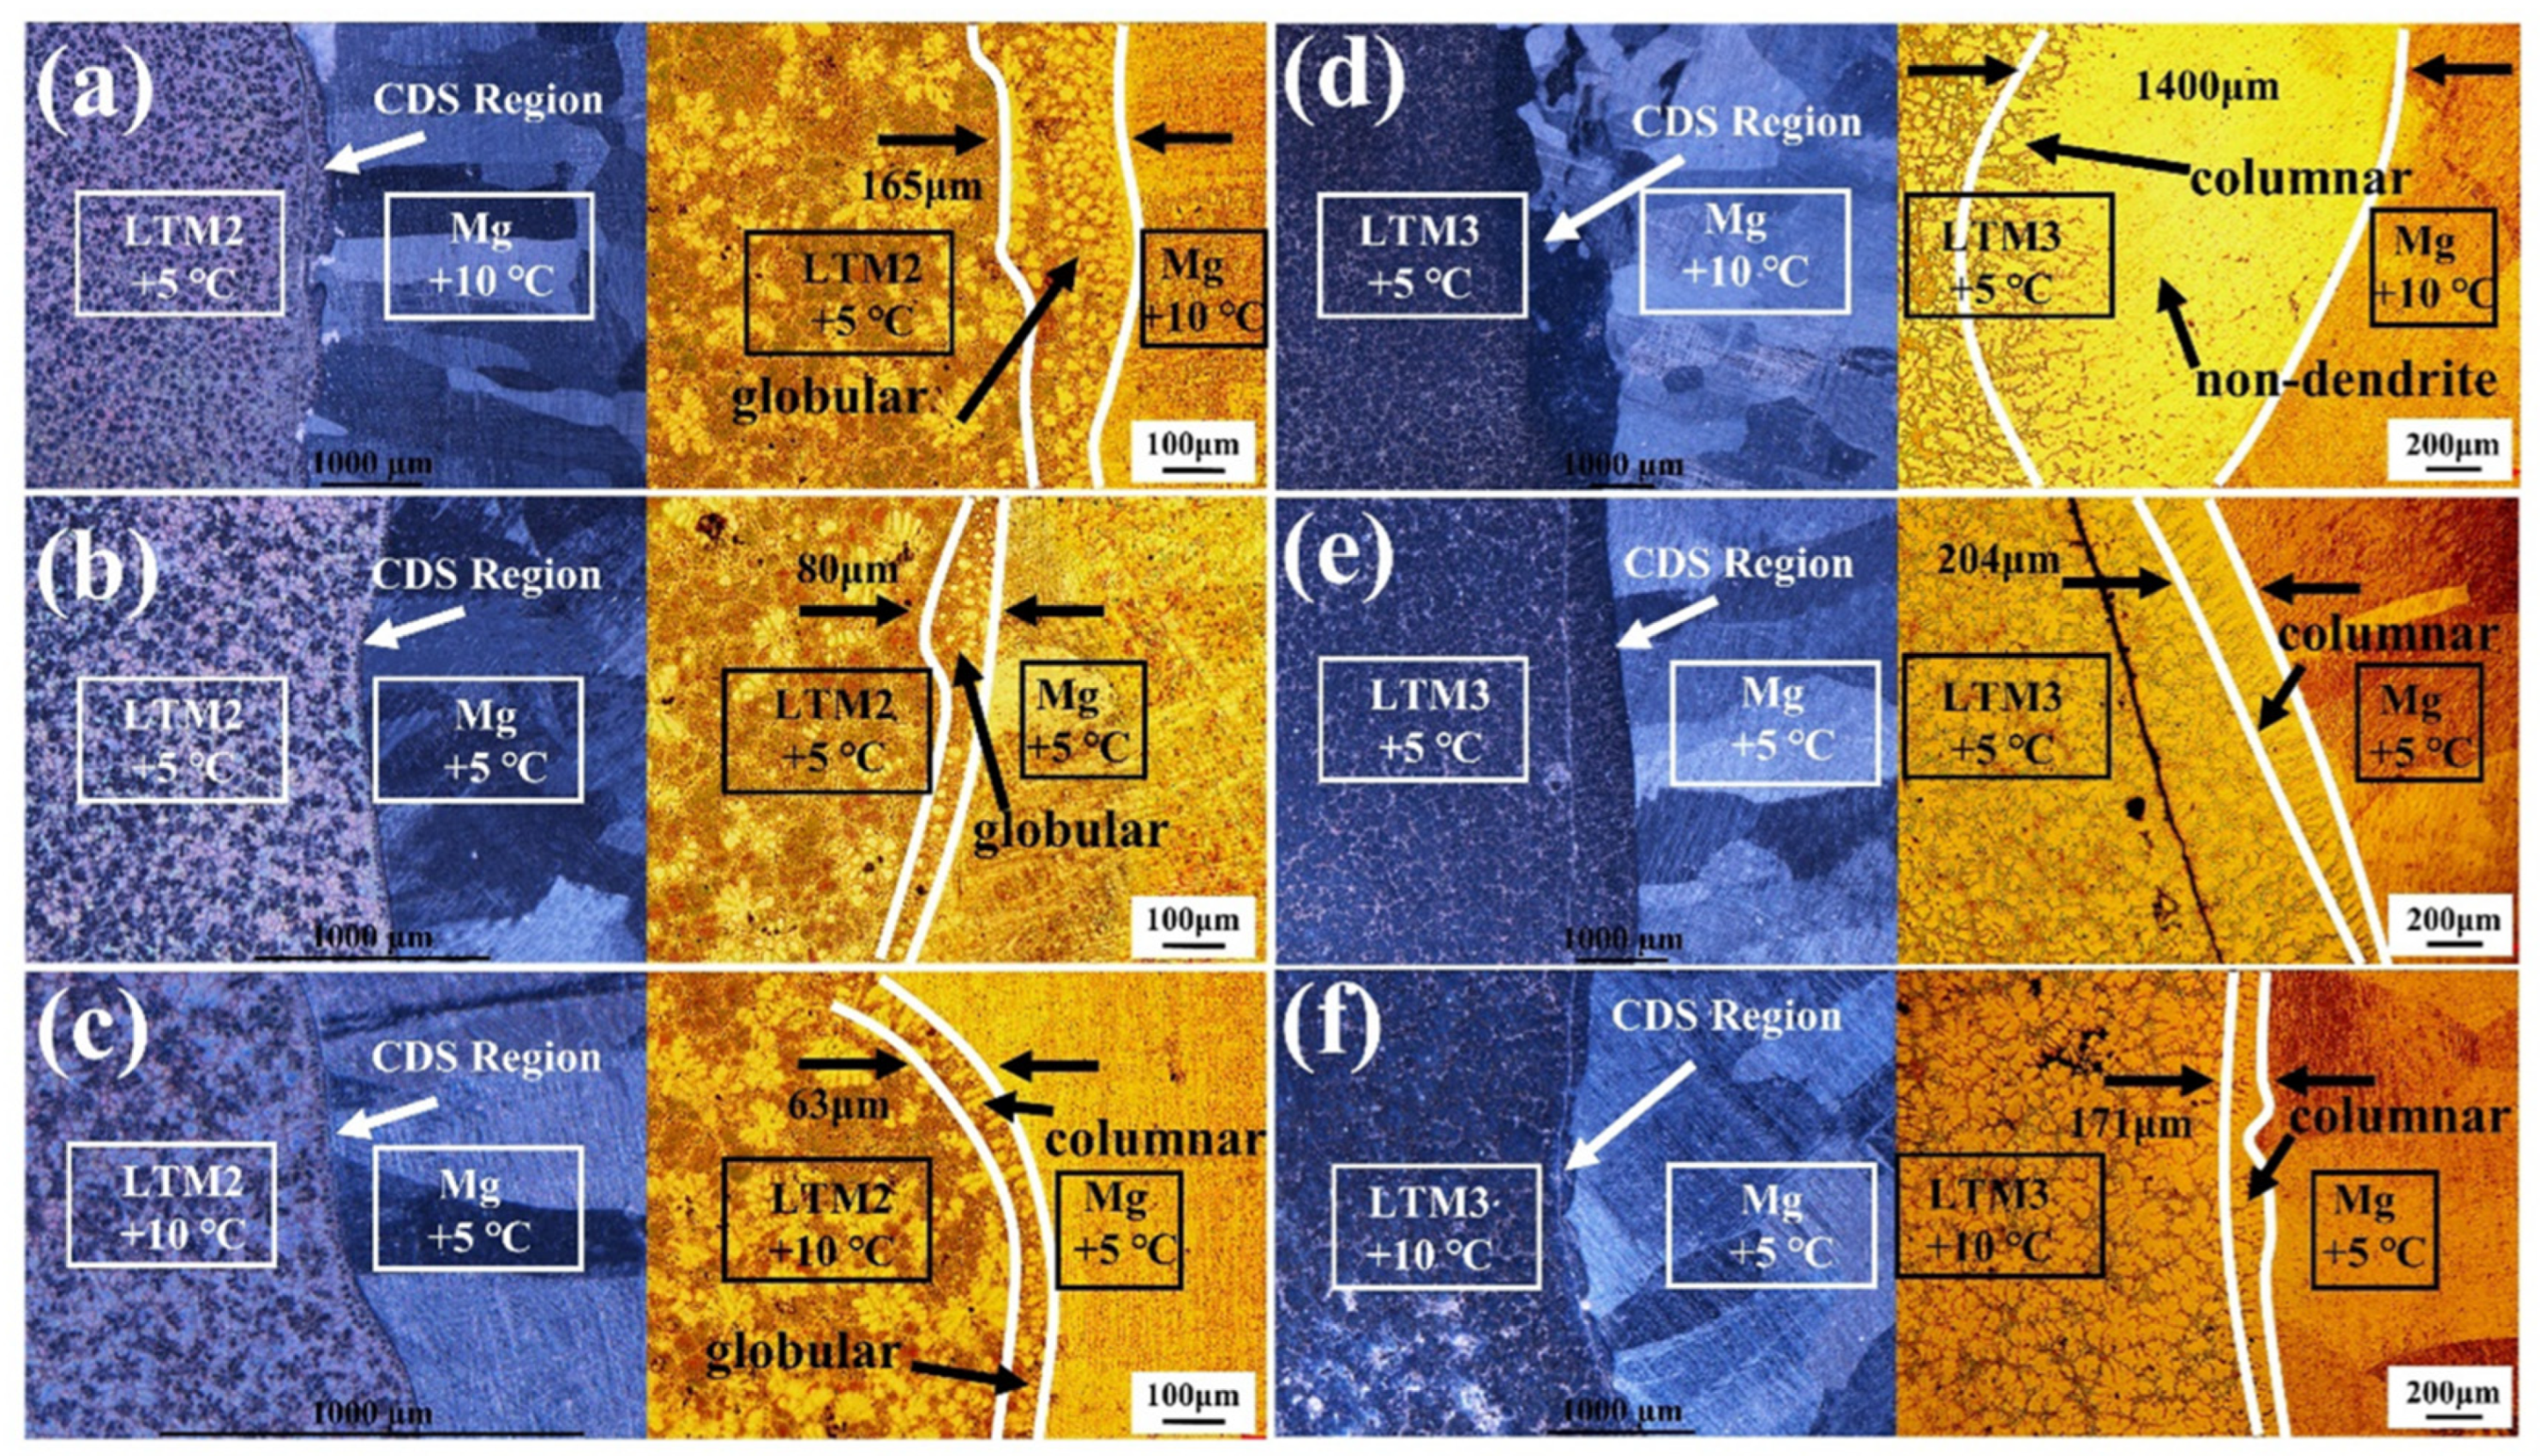
As shown in Figure 6, the interfacial microstructures of different LTM compositions mixed with pure magnesium under various superheats were observed using a stereomicroscope and a metallurgical microscope. The diffusion distance was determined based on the boundary between the intermediate transition zone and the prefabricated alloy matrix or the morphological transformation of the microstructure, and the distance was calculated using Image-Pro Plus 6.0 software.
Figure 6.
Macroscopic and metallographic micrographs of the bonding interfaces between pure Mg and LTM2/LTM3 alloys under various superheat conditions: (a–c) LTM2 with Ex2-1, Ex2-2, and Ex2-3; (d–f) LTM3 with Ex3-1, Ex3-2, and Ex3-3 (see Table 1 for detailed conditions).
When the superheat of HTM is greater than that of LTM2, the transition zone width is 165 μm and the transition zone is mainly composed of spherical α-Mg solid solution and eutectic phase, as shown in Figure 6a. When the superheats of HTM and LTM are equal (Figure 6b), the transition zone width decreases by half to only 80 μm, and the number of spherical α-Mg decreases significantly. When the superheat of HTM is lower than that of LTM2 (Figure 6c), the transition zone width further decreases to 63 μm, and the microstructure begins to change from spherical α-Mg to a mixed structure of spherical and columnar grains.
Three superheat conditions were examined when pure magnesium was mixed with LTM3. A higher superheat of HTM relative to LTM3 produced a transition zone width of 1400 μm, as shown in Figure 6d. In this case, the transition zone consisted of α-Mg solid solution, eutectic Mg, and Mg17Al12, and exhibited a progressive morphological change from non-dendritic to columnar and finally to dendritic. Equal superheats between HTM and LTM3 reduced the transition zone width to 560 μm, as seen in Figure 6e. Under this condition, non-dendritic α-Mg was no longer evident, and the microstructure was dominated by columnar and rose-like structures along with more pronounced equiaxed dendrites. A lower superheat of HTM compared to LTM3 resulted in the smallest transition zone width of 171 μm, with the microstructure consisting exclusively of columnar crystals, as shown in Figure 6f.
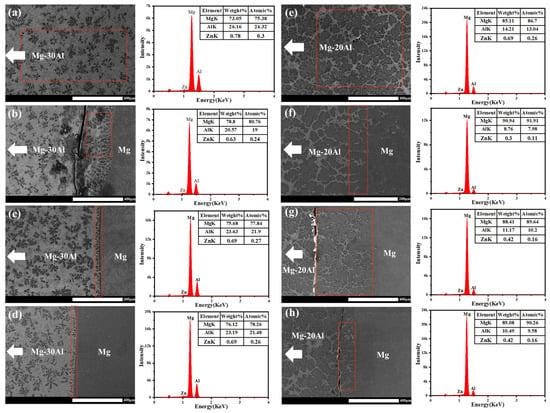
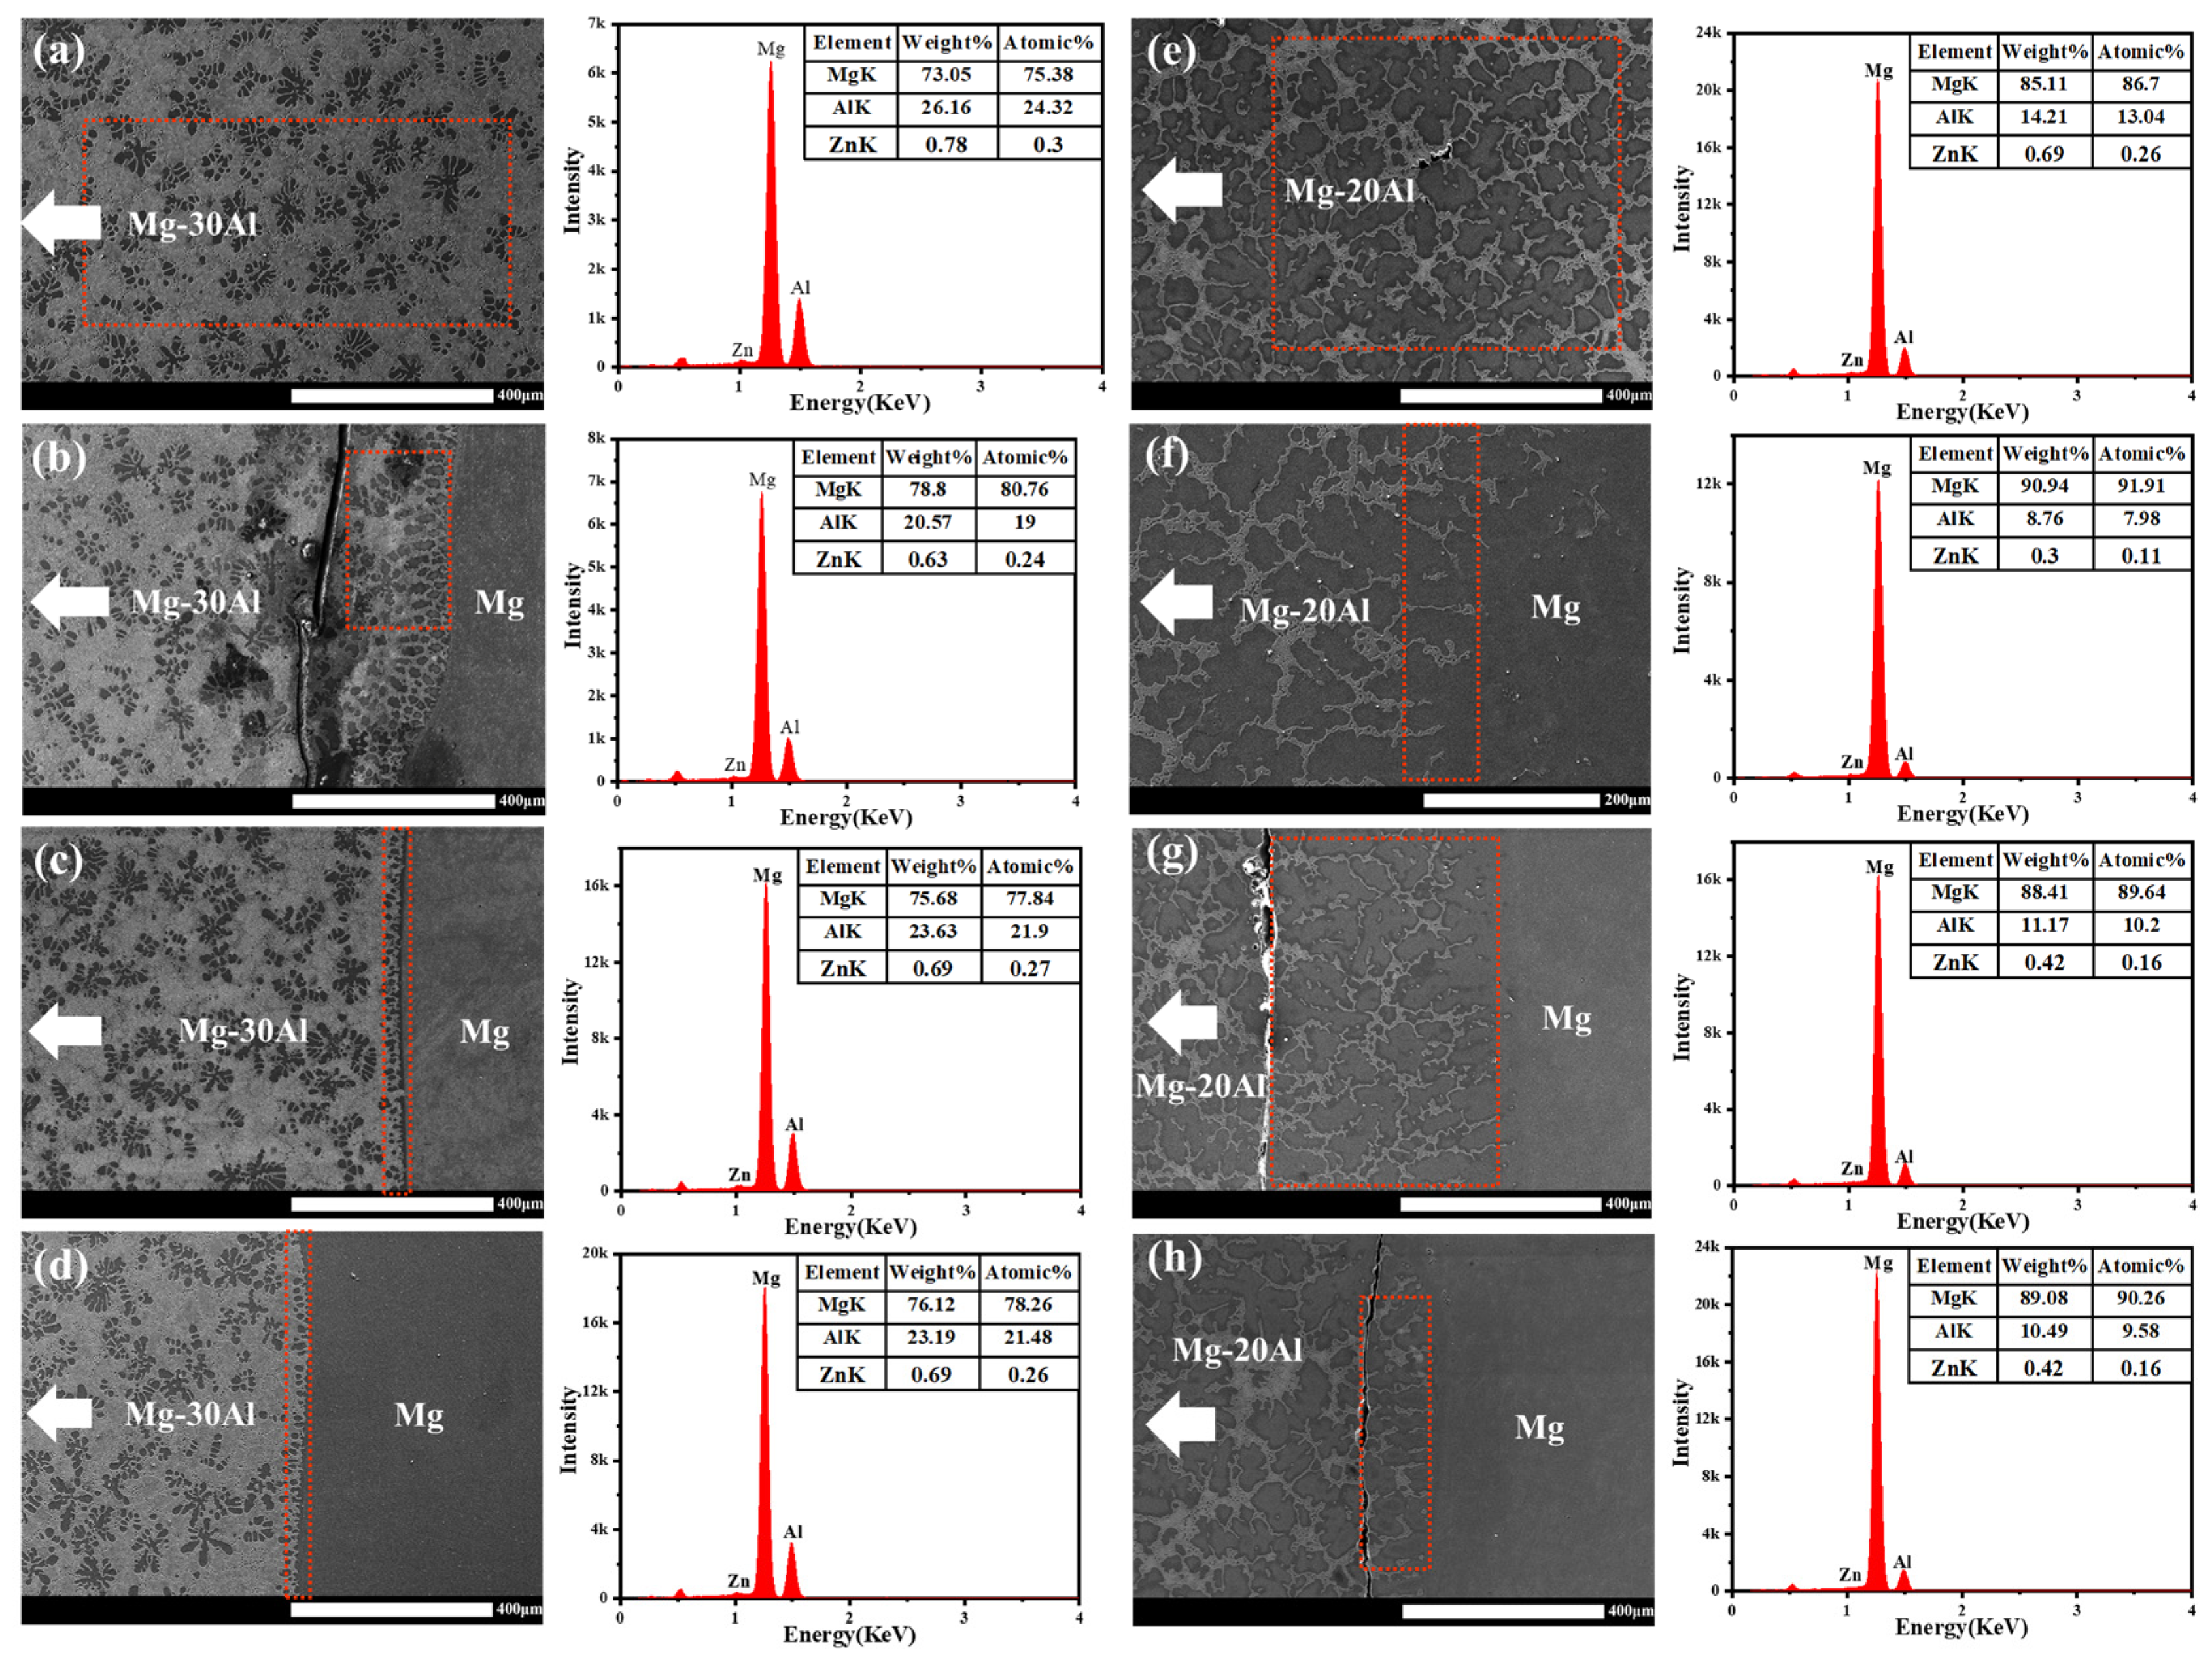
The above results were obtained only by macroscopic analysis of the transition zone width and microstructure using metallographic microscopy. To ensure the accuracy of the results, energy-dispersive X-ray spectroscopy was employed to analyze the transition zone. Figure 7 shows the EDS results of the interface after mixing, illustrating how the elemental composition at the interface front varies with the superheat. When the superheat of HTM is greater than that of LTM, the aluminum content in the transition zone near the Mg-Al side changes from 26 wt.% and 14 wt.% to 20 wt.% and 8 wt.% respectively for the three LTM compositions, representing a decrease of approximately 6 wt.% in each case. When the superheat of HTM is less than or equal to that of LTM, the aluminum content changes to 23 wt.% and 11 wt.% respectively, and the zinc content also shows a decreasing trend. Analysis of the test results from three different LTM2 superheats indicates that when the HTM superheat exceeds the LTM superheat, both the transition zone width or diffusion distance and the microstructure morphology are superior to those under lower HTM superheat conditions.
Figure 7.
SEM images and EDS results of the bonding interfaces between pure Mg and LTM2/LTM3 alloys under various superheat conditions. (a–d) represent the LTM2 series: (a) LTM2, (b) Ex2-1, (c) Ex2-2, (d) Ex2-3; (e–h) represent the LTM3 series: (e) LTM3, (f) Ex3-1, (g) Ex3-2, (h) Ex3-3 (see Table 1 for detailed conditions).
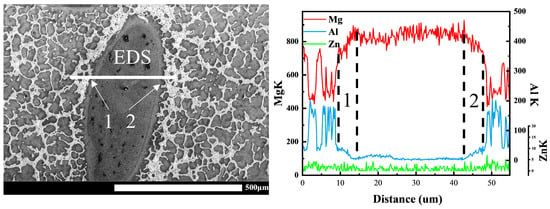
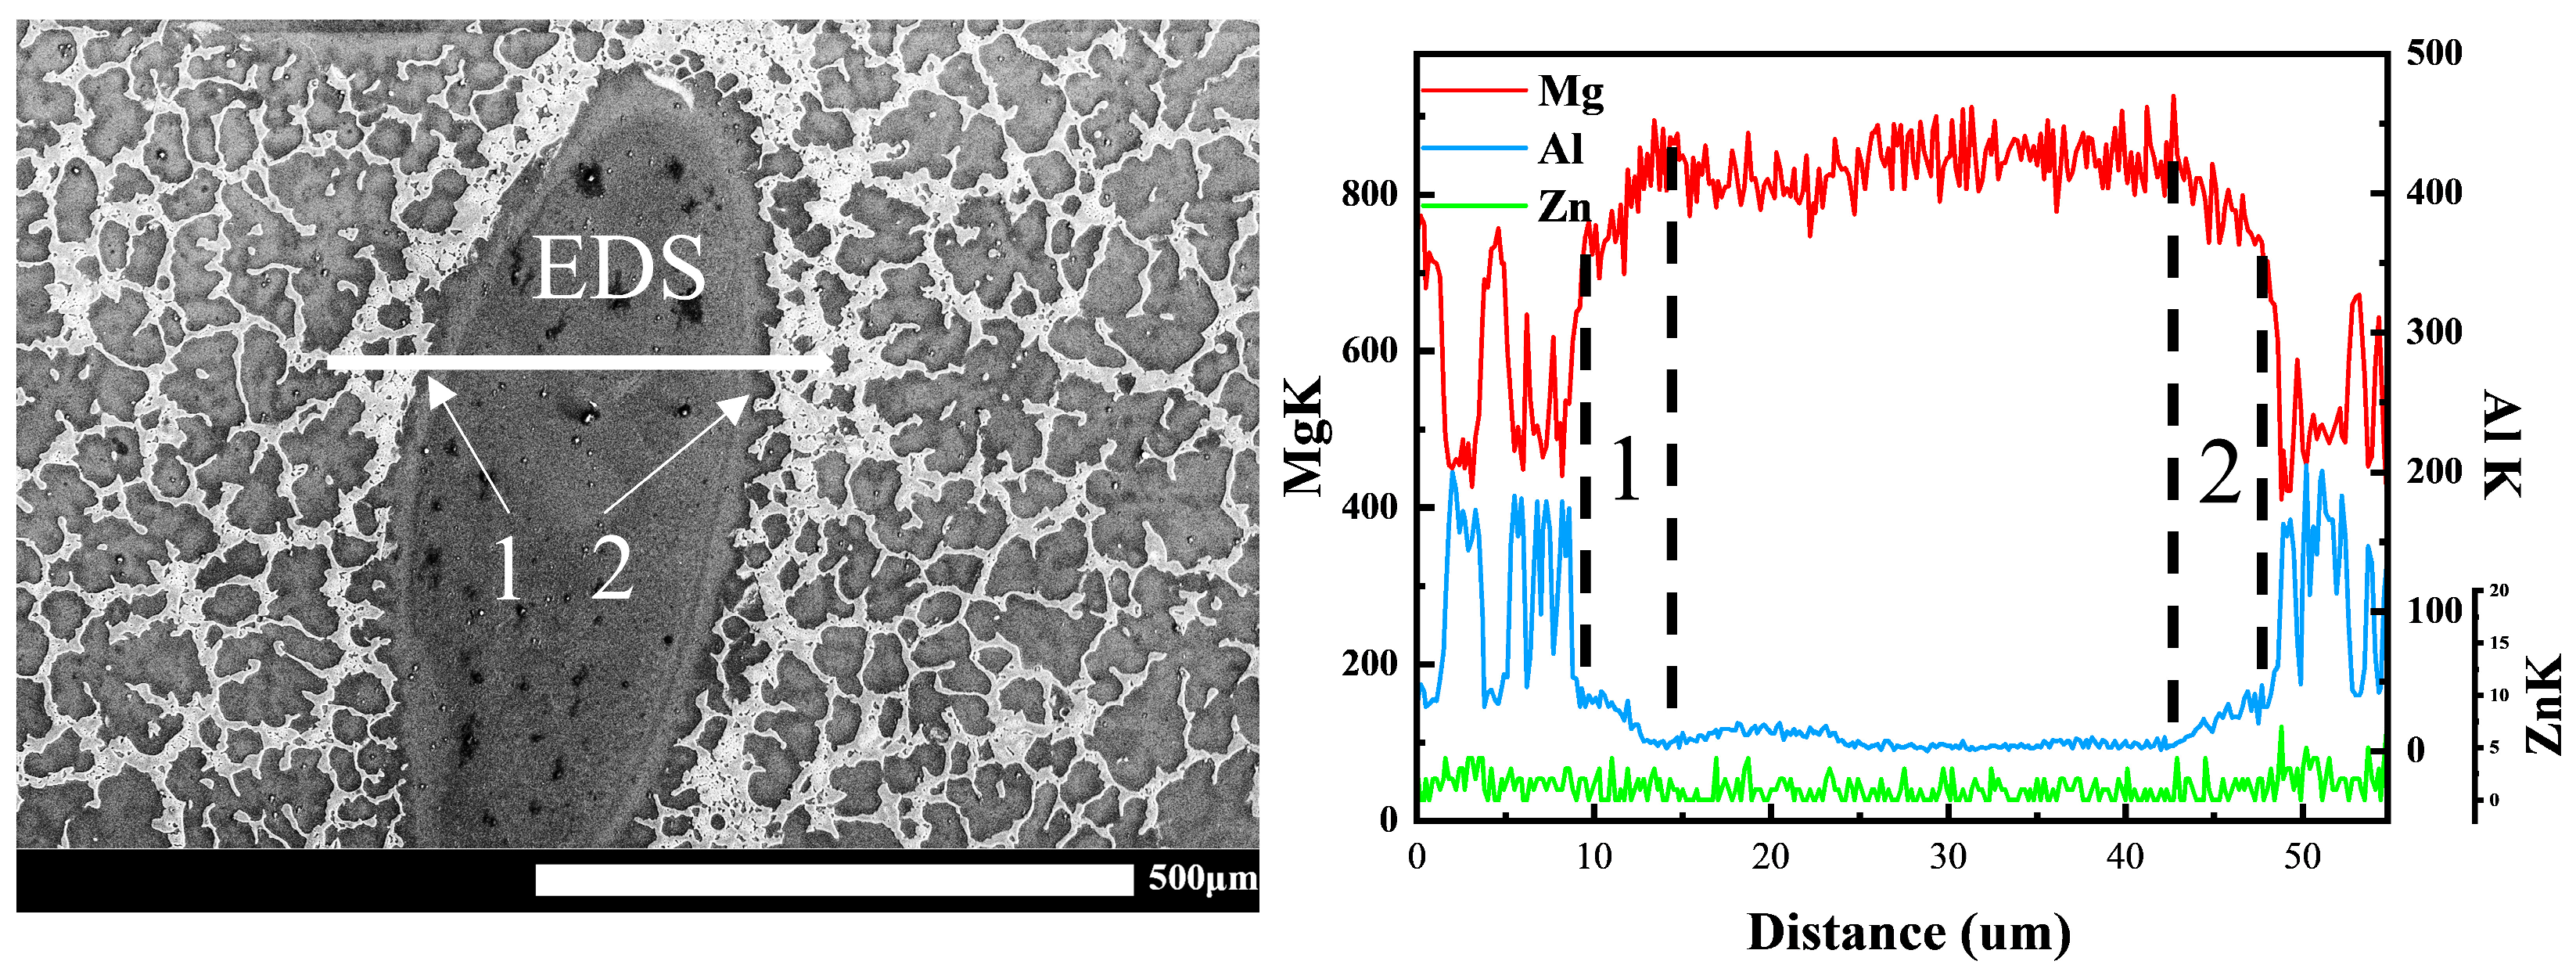
As no convection was present during mixing of the controlled diffusion solidification process in this study, a transition zone formed overall, yet a few isolated liquid droplets were still observed. As shown in Figure 8, pure magnesium was broken into numerous droplets surrounded by the Mg-Al alloy. These droplets were not the pure metal droplets produced by instantaneous quenching as described in the literature. Instead, they originated from interface collision and the single solute diffusion that occurred when a large volume of pure magnesium fell into the Mg-Al melt. EDS line scans revealed that these so-called droplets were not pure magnesium but α-Mg solid solution formed by the diffusion of aluminum into magnesium. A relatively gentle aluminum concentration gradient existed near the α-Mg phase, as seen in regions 1 and 2. This phenomenon likely resulted from the reverse diffusion of solute toward the solid–liquid interface during the preferential nucleation of supercooled magnesium droplets. In this case, constitutional supercooling was almost negligible, which kept the solid–liquid interface relatively stable during conventional solidification. Consequently, as shown in Figure 6, no pronounced dendritic structure was produced in this study. Instead, the microstructure mainly exhibited a transformation trend from non-dendritic to columnar and finally to dendritic.
Figure 8.
The SEM morphology and EDS analysis results of pure magnesium droplets observed in the mixed interface.
It is acknowledged that LTM2 exhibits the shortest solute diffusion distance among the conditions examined. However, under the same superheat, the diffusion distance in LTM2 is comparable to that in LTM3, with only a modest absolute difference. More importantly, the present study focuses on the solidification behavior at the static contact interface, where grain morphology at the interface is the primary evaluation criterion. In actual CDS processes, forced convection promotes macroscopic homogenization through melt fragmentation and droplet formation. The diffusion distances measured under the static condition, therefore, serve primarily as a reference for understanding the subsequent dynamic mixing, rather than as a direct measure of overall compositional uniformity. In this study, the grain refinement achieved at the interface is considered a more meaningful indicator of the solidification mechanism.
By neglecting constitutional supercooling and convection at the HTM and LTM interface, the growth morphology of the interfacial microstructure during mixing mainly depends on the temperature gradient G and the growth rate V. However, these two parameters cannot be directly parameterized through experiments. Therefore, the Fluent software was used to calculate the temperature gradient across the entire two-dimensional interface via finite element analysis.
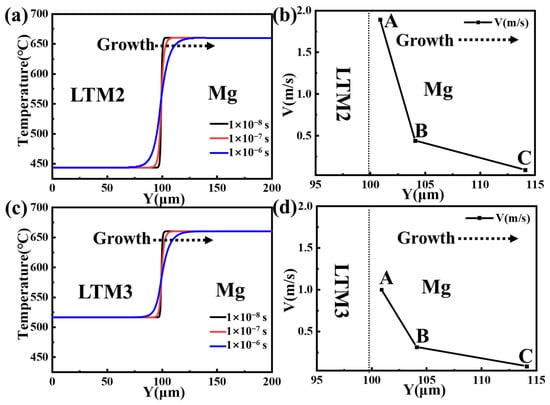
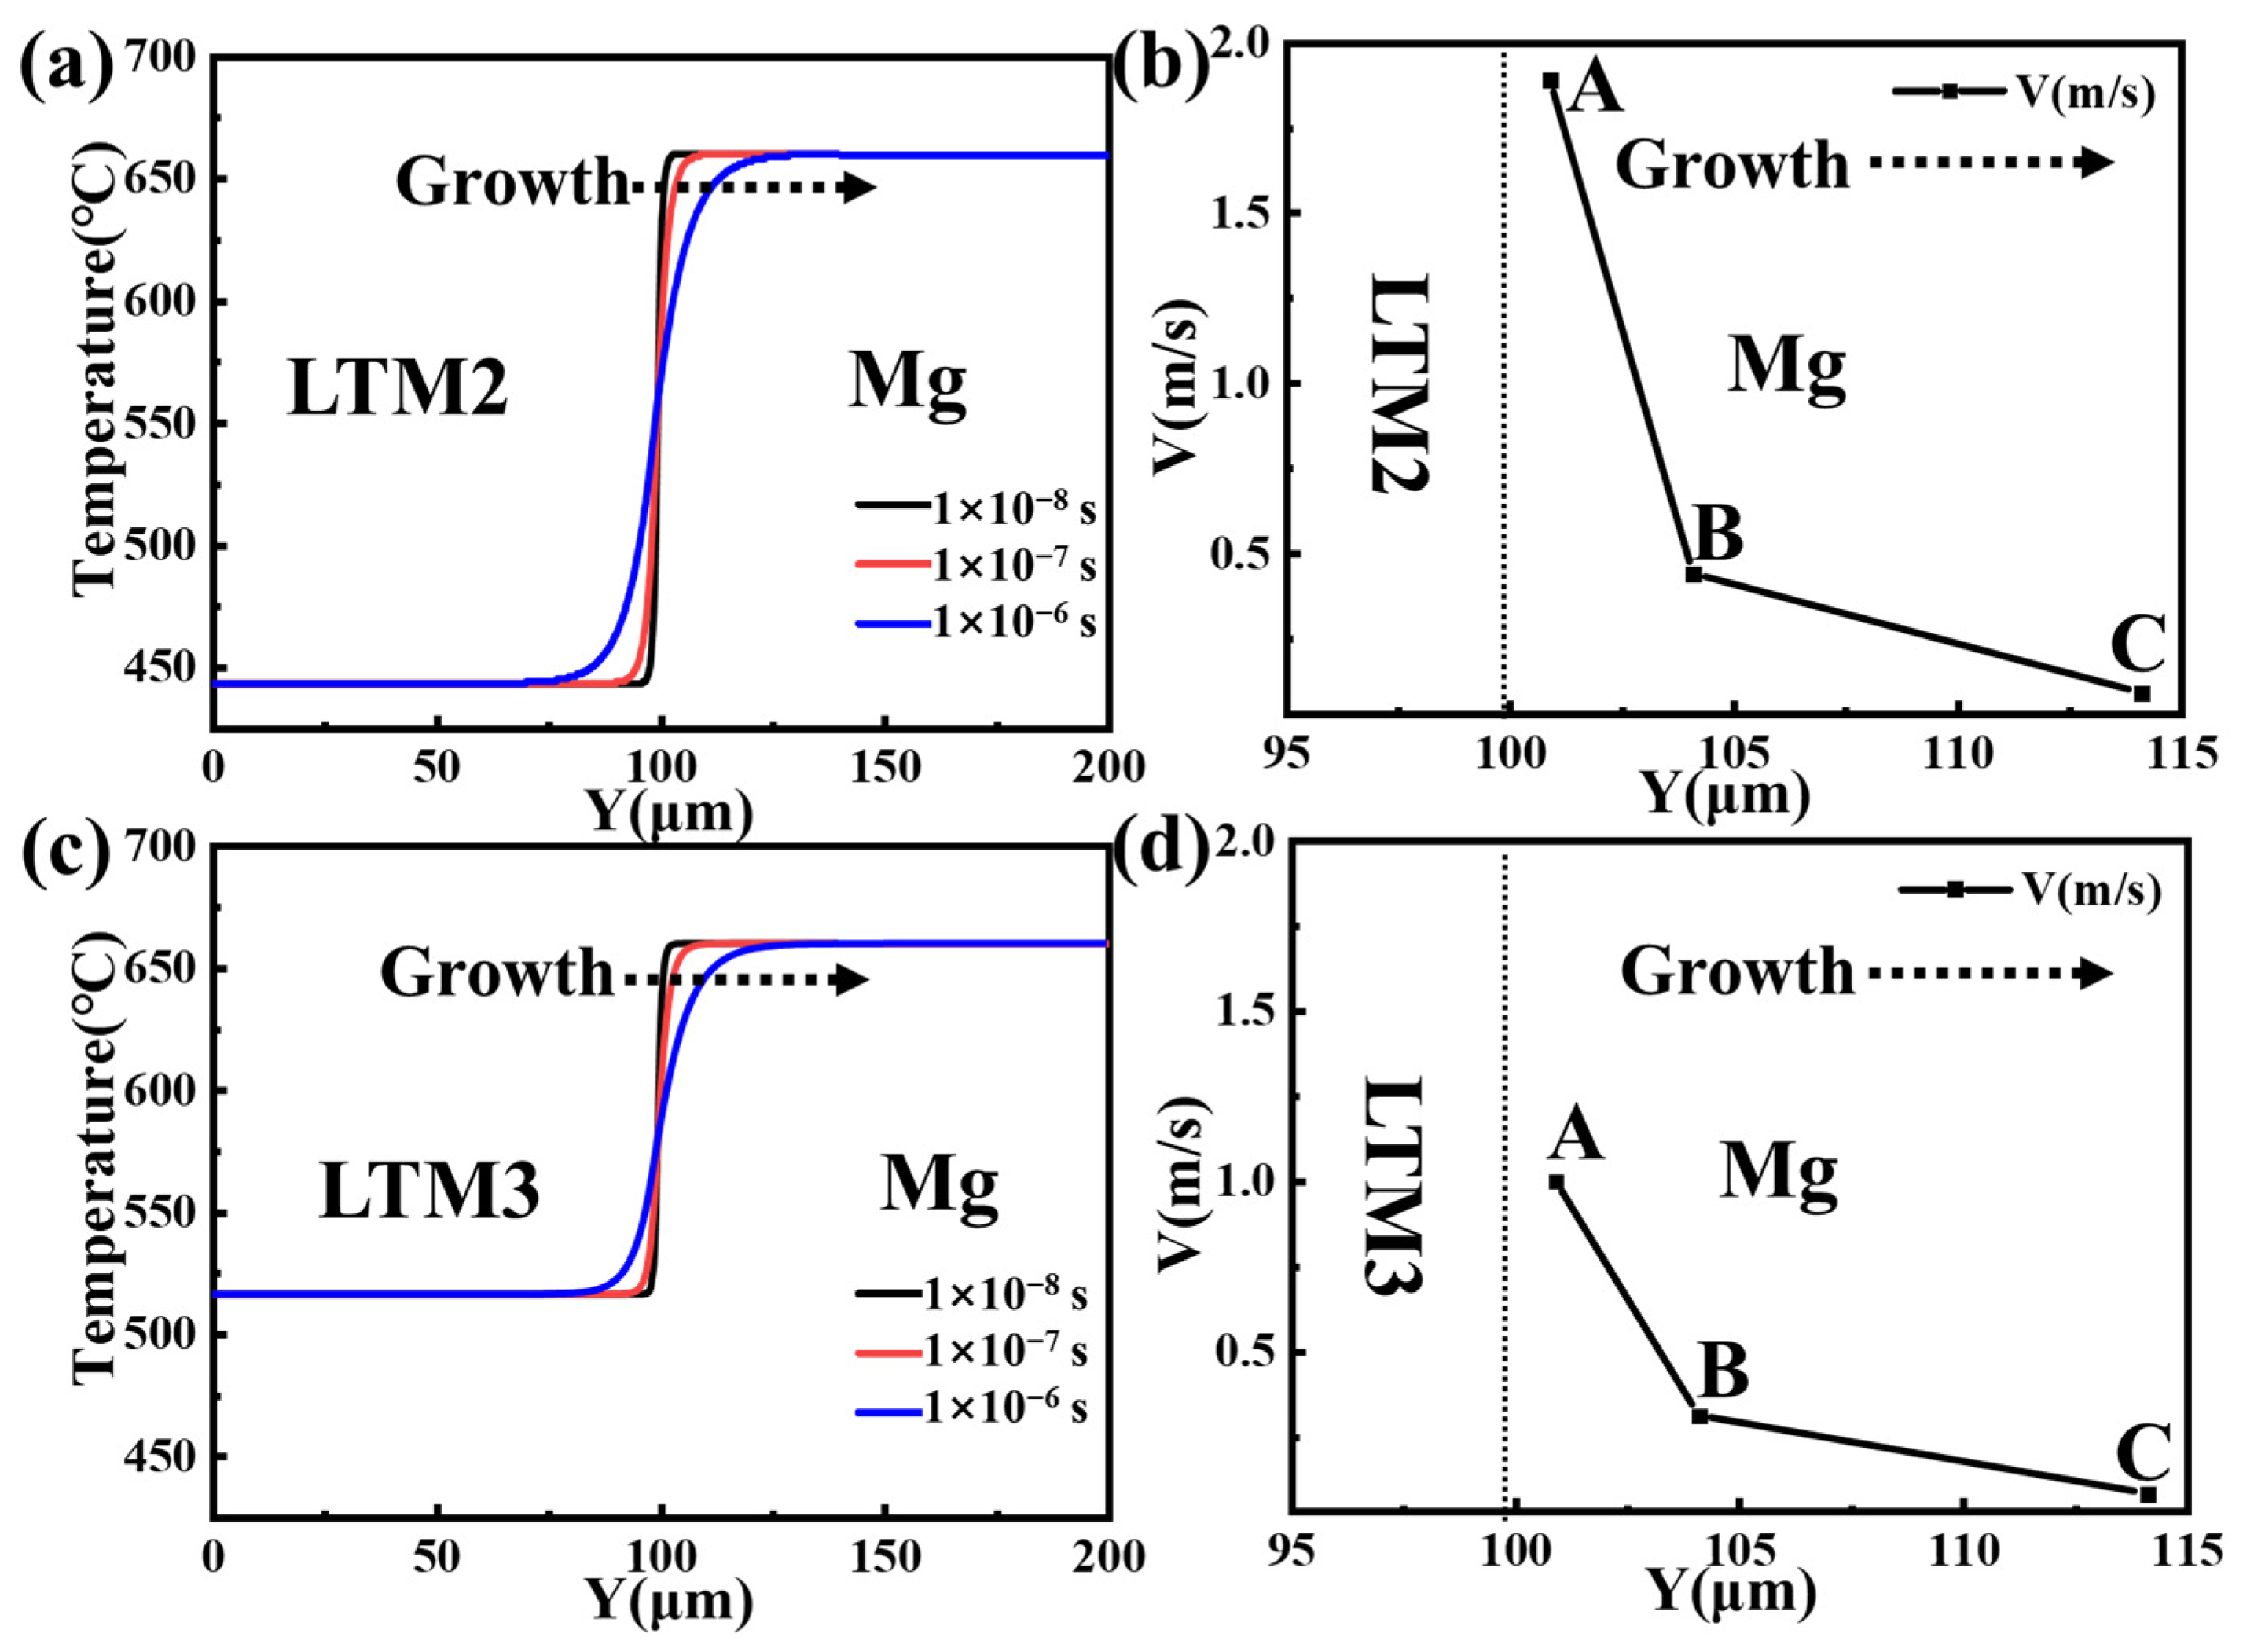
Since the nucleation time for most metals is on the order of 1 × 10⁻⁸ s and stable nucleus growth occurs after nucleation [26], the temperature distribution along the y-axis perpendicular to the mixing interface was simulated using Fluent software based on the two-dimensional physical model established in Figure 2. Temperature distribution curves along the y-axis were extracted at 1 × 10⁻⁸ s, 1 × 10⁻⁷ s, and 1 × 10⁻⁶ s. With pure magnesium superheated by 10 °C and the LTM alloy superheated by 5 °C, the y-axis temperature distributions after mixing of LTM3, LTM2, and pure magnesium are shown in Figure 9. Due to the chilling effect of the LTM alloy on the HTM alloy, extensive nucleation occurs in the HTM alloy near the LTM alloy region. Subsequent growth proceeds in the direction away from the LTM alloy. At the early growth stage of 1 × 10⁻⁸ s, the temperature gradients in the solid and liquid phases exhibit steep positive values. As time advances, the temperature rise of the LTM alloy causes the temperature gradients in the solid and liquid phases to continuously decrease.
Figure 9.
Temperature distribution along y-axis and solid–liquid interface growth velocity at identical superheats of 10 °C (HTM) and 5 °C (LTM). (a) The temperature field and (b) solid–liquid interface growth velocity for mixing of HTM and LTM2; (c) the temperature field and (d) solid–liquid interface growth velocity for mixing of HTM and LTM3.
The solid–liquid interface growth velocity can be calculated using Equation (3) [24].
where KS and KL are the thermal conductivities in the solid and liquid phases, respectively. Gs and GL are temperature gradients in the solid and liquid phases, respectively. ρ is the density of the alloy, and H is the latent heat of solidification.
It should be noted that the growth velocities calculated from Equation (3) are theoretical estimates and have not been quantitatively validated against experimentally measured microstructural features (e.g., dendrite arm spacing). These values are therefore used primarily for qualitative trend analysis rather than precise prediction.
Figure 9b,d show the solid–liquid interface growth velocity at different time intervals when pure magnesium is mixed with different LTM alloys. It can be observed that at the initial stage indicated by point A, the HTM alloy region near the LTM alloy experiences a chilling effect from the LTM alloy. Under this condition, the growth velocity reaches as high as 1 m/s and 1.89 m/s. As the LTM alloy temperature rises, the chilling effect weakens. At point B, the growth velocity drops sharply to 0.31 m/s and 0.44 m/s. At point C, the growth velocity further decreases to only 0.08 m/s and 0.09 m/s. Because the liquidus temperature difference between LTM2 and pure magnesium is greater than that between LTM3 and pure magnesium, the chilling effect of LTM2 on pure magnesium is stronger. Consequently, the solid–liquid interface advances faster with LTM2 than with LTM3, although this gap narrows over time.
Since the primary magnesium phase nucleates and grows in the HTM alloy region near the LTM alloy, the solid fraction increases, which restricts diffusion between the solid and liquid phases and inhibits solute diffusion between the HTM and LTM alloys. As a result, solute atom diffusion toward the pure magnesium side is suppressed, leading to a shorter diffusion distance. Therefore, under the same superheat as in Figure 6a,d, the faster progression of the solid–liquid interface in LTM2 inhibits diffusion, leading to a diffusion distance far shorter than that in LTM3.
It is worth noting that, although the LTM2 condition exhibits the fastest interface advancement velocity and the shortest solute diffusion distance, which, to some extent, restricts sufficient solute redistribution, the entire CDS solidification process is completed within a few seconds. This extremely short time window does not provide sufficient time for grain coarsening or growth engulfment. Therefore, despite the presence of diffusion-limiting effects, the nucleation burst induced by the high undercooling in LTM2 has already locked in an extremely high grain density at the initial stage of solidification. The refining contribution from nucleation far outweighs any potential negative coarsening effects associated with diffusion limitation, ultimately resulting in the finest equiaxed grain structure.
According to classical solidification theory, when the temperature gradient ahead of the solid–liquid interface is greater than the liquidus temperature gradient, the interface is stable and spherical grains tend to form. Conversely, an unstable interface leads to constitutional supercooling. Depending on the degree of constitutional supercooling, rosette or dendritic structures develop. Thus, the stability of the solid–liquid interface plays a crucial role in determining the morphology of the growing crystals.
3.3. Solute Diffusion Behavior and Constitutional Supercooling Zone at the HTM/LTM Interface
Before establishing a causal link between constitutional supercooling and the grain morphology transition, it is necessary to first rule out other competing mechanisms that could potentially account for the observed microstructural evolution. In this study, three common alternative mechanisms can be excluded based on direct experimental evidence. First, if dendrite fragmentation induced by forced convection were the primary cause of grain refinement, the macroscopic interface between the HTM and the LTM would inevitably be disturbed by intense fluid shear. However, as shown in Figure 1, a sharp, straight, and complete macroscopic interface demarcation line is consistently preserved between the two melts, which directly rules out convection-induced fragmentation as the dominant mechanism. Second, oxide films or inclusions at the interface could act as foreign substrates to promote equiaxed grain formation. However, SEM and EDS analyses of the interfacial region (see Figure 7) reveal no continuous oxide interlayer or significant foreign particle enrichment, excluding the possibility that heterogeneous nucleation governs the transition. Third, if the morphology change originated from systematic differences in the overall solute concentration of the melt, the average composition at the interface should vary distinctly across different superheat conditions. Yet, compositional analyses indicate that the macroscopic average composition near the interface remains essentially constant, ruling out bulk composition change as the driving force. In summary, none of these three alternative mechanisms can coherently explain the continuous columnar → rosette → globule transition observed experimentally. The only physical mechanism that simultaneously accounts for both this morphological evolution and the increasing ΔT trend is enhanced constitutional supercooling.
The five-region classification shown in Figure 3 and Figure 4 reflects the spatial distribution of distinct physical mechanisms active at the CDS interface. A key observation is the asymmetric diffusion behavior between Area II and Area IV. This asymmetry originates from the differences in thermophysical properties between the two melts, such as thermal conductivity and liquidus temperature, which drive an asymmetric solute redistribution. This asymmetric redistribution generates a localized peak of constitutional supercooling within the central interface zone, designated as Area III, and it is this peak that triggers the subsequent nucleation burst. Therefore, the presence of these five regions serves as spatial evidence that constitutional supercooling is the primary mechanism governing the morphological evolution.
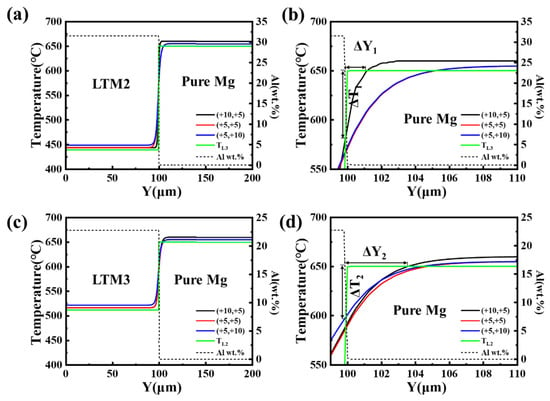
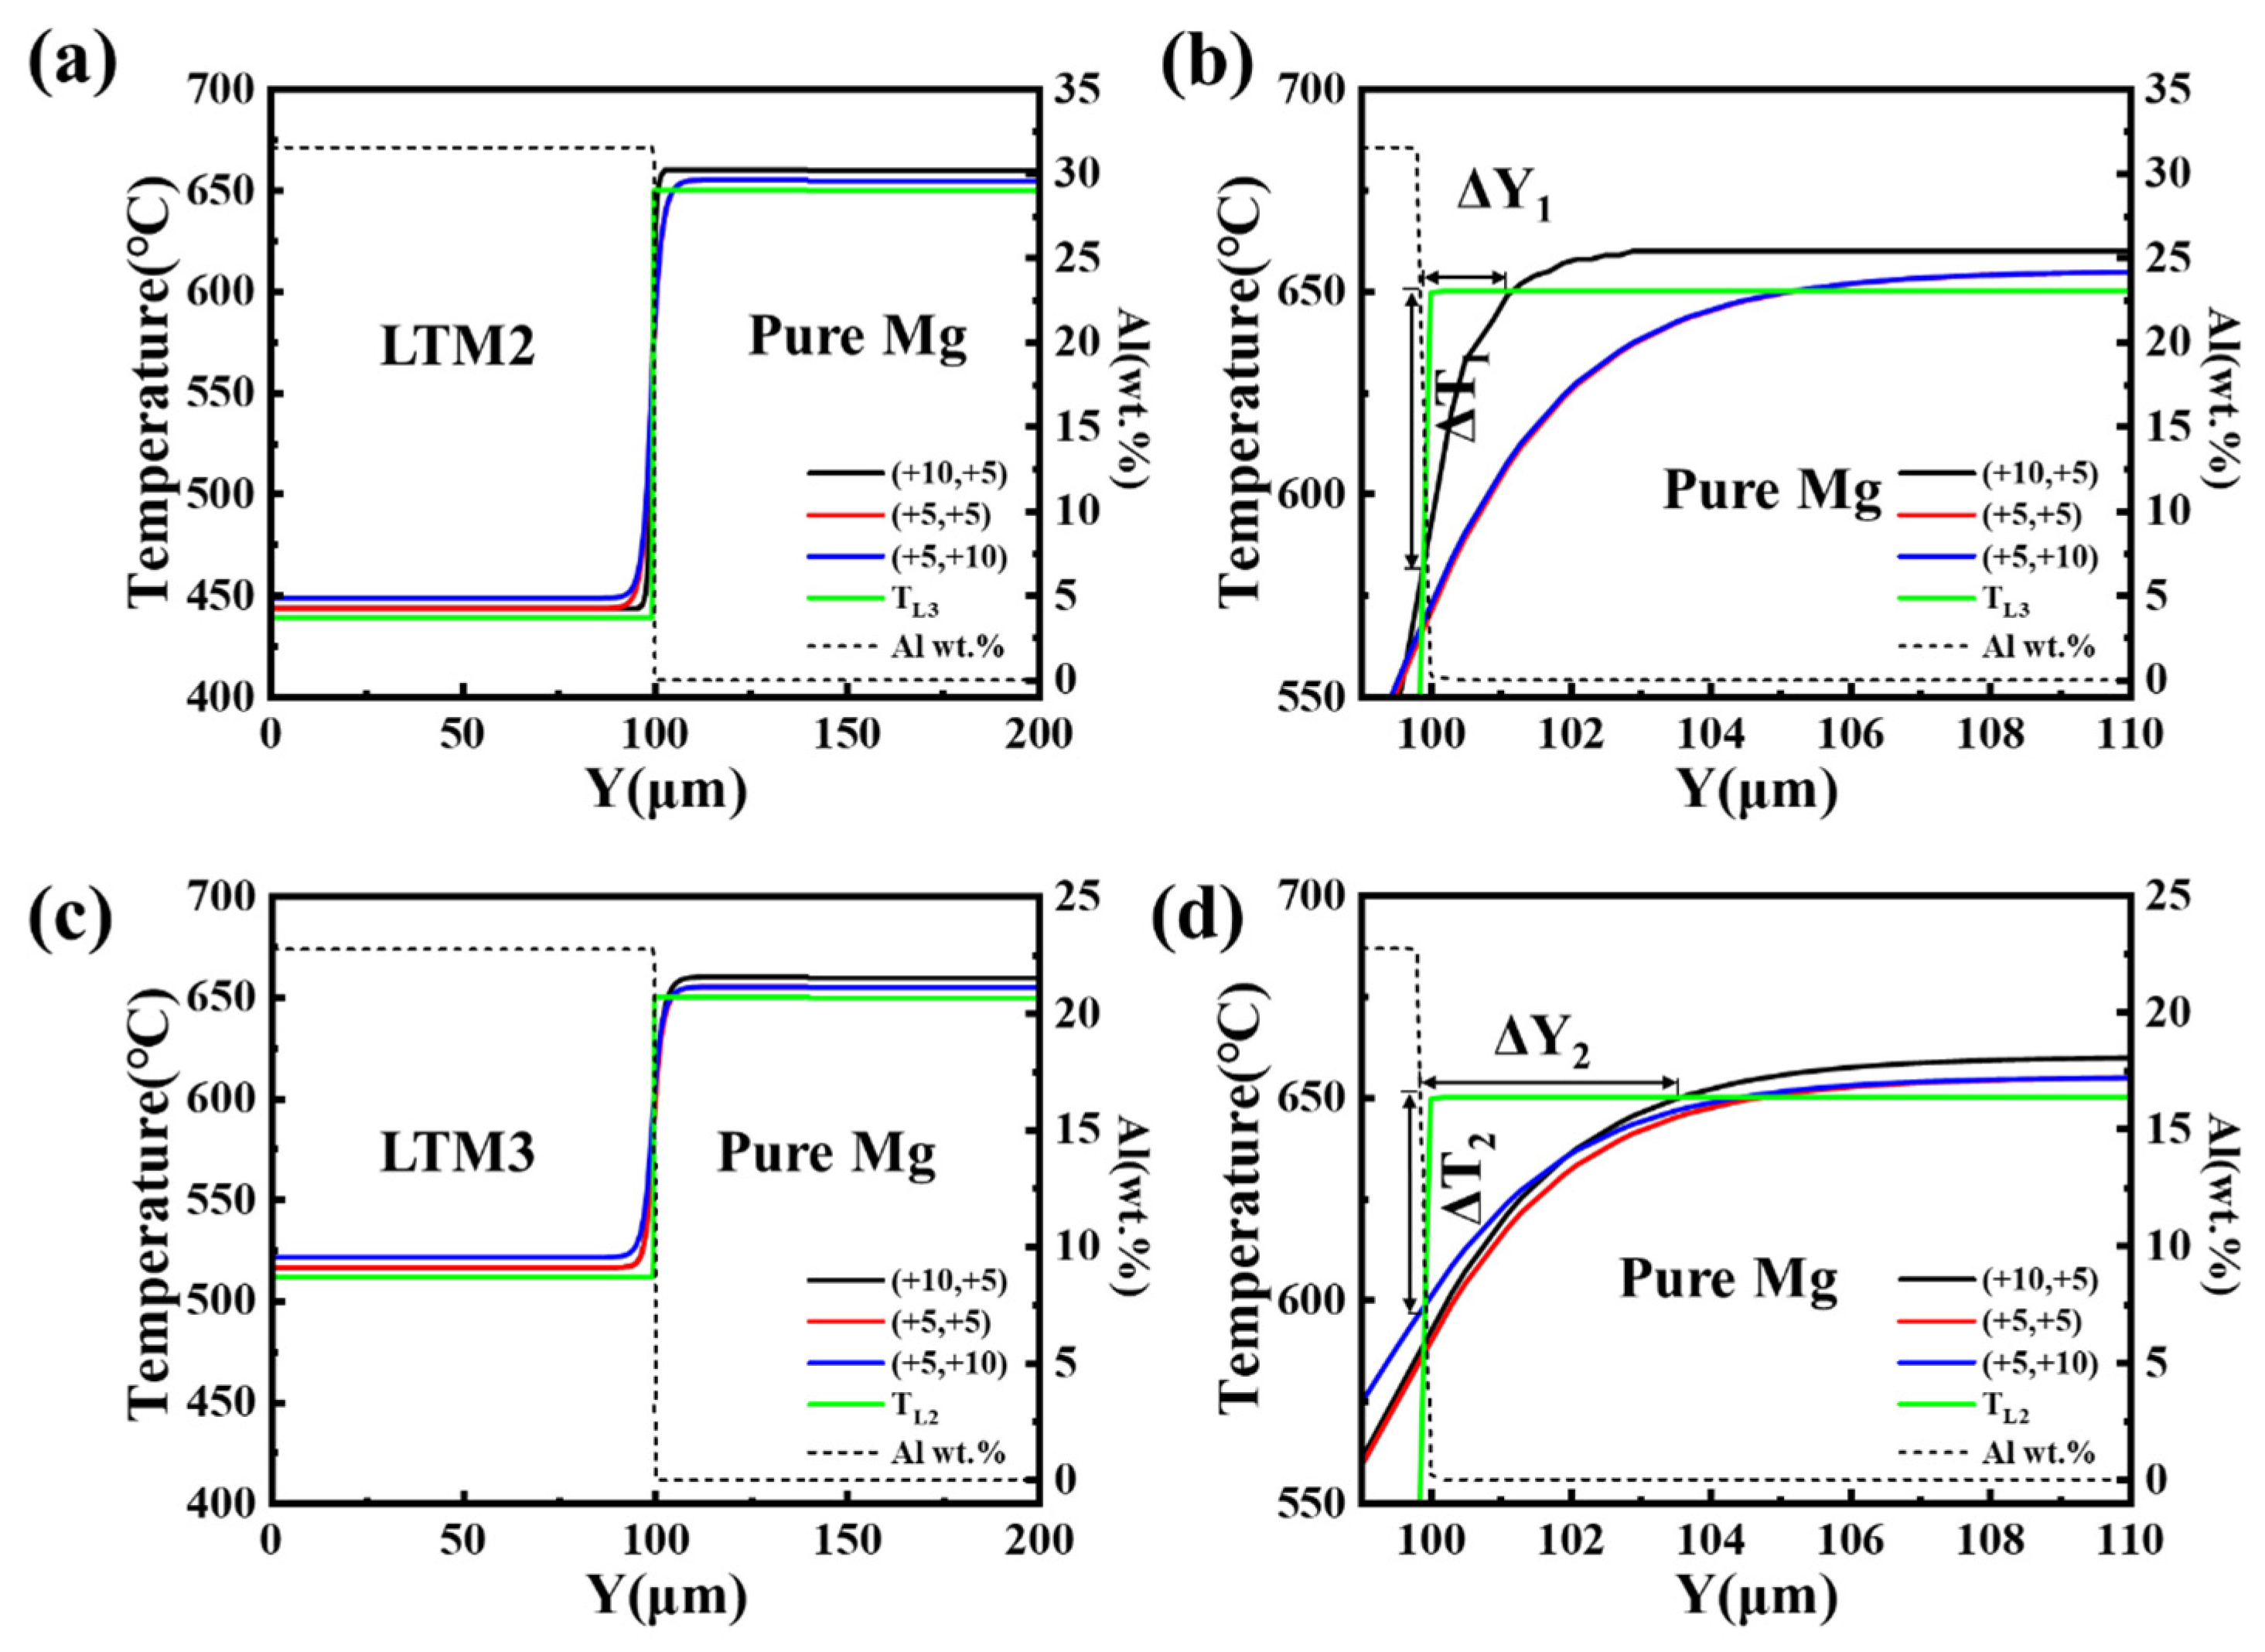
To determine the size of the constitutional supercooling zone, the heat and solute diffusion processes were calculated. Solute diffuses from the LTM toward the HTM, while heat diffuses from the HTM toward the LTM. Figure 10 shows the calculated results of solute diffusion and liquidus temperature at 1 × 10⁻⁷ s after CDS mixing. The constitutional supercooling layer was determined by combining these results with the temperature distribution curve, as indicated in Figure 10b,d. The evaluation criteria include the width of the constitutional supercooling layer, denoted as ΔY1 and ΔY2, and the maximum degree of constitutional supercooling, denoted as ΔTL1 and ΔTL2.
Figure 10.
Temperature distribution along y-axis at 1 × 10⁻⁷ s after mixing under different superheats. (a,b) LTM2 + pure Mg; (c,d) LTM3 + pure Mg.
When pure magnesium is superheated by 10 °C and the LTM alloy is superheated by 5 °C, the width of the constitutional supercooling layer on the magnesium side near LTM3 is 3.5 μm, while that near LTM2 is only 1.1 μm, meaning ΔY2 is greater than ΔY1. Therefore, under the same superheat conditions of 10 °C for pure magnesium and 5 °C for the LTM alloy, the constitutional supercooling zone induced by LTM3 is significantly larger than that induced by LTM2. Meanwhile, the maximum degree of supercooling produced by the chilling effect of LTM2 is 69 °C, which is higher than that of LTM3 at 60 °C. Consequently, the nucleation rate on the magnesium side near LTM2 is higher than that near LTM3. As shown in Figure 6a,d, the mixture of LTM2 with pure magnesium results in fine globular grains, whereas LTM3 produces a mixed microstructure of coarse rosette and columnar grains.
When pure magnesium is superheated by 5 °C and the LTM alloy is superheated by 5 °C, the width of the constitutional supercooling layer begins to increase. On the magnesium side near both LTM2 and LTM3, the constitutional supercooling layer width is approximately 5 μm. However, because the supercooling caused by LTM2 on pure magnesium is 82 °C, which is larger than that caused by LTM3 at 62 °C, LTM2 promotes the development of globular grains, whereas LTM3 leads to columnar grain formation. When pure magnesium is superheated by 5 °C and the LTM alloy is superheated by 10 °C, the combination of a wider constitutional supercooling layer and a lower degree of supercooling makes the interface more unstable, leading to the formation of coarse columnar grains.
The simulation results also indicate that when the superheat of the LTM alloy is fixed at 5 °C, increasing the superheat of the HTM alloy reduces the degree of supercooling and decreases the nucleation rate, leading to coarser grains. This trend is clearly shown in Figure 6. Therefore, the superheat of the HTM alloy should not exceed 10 °C.
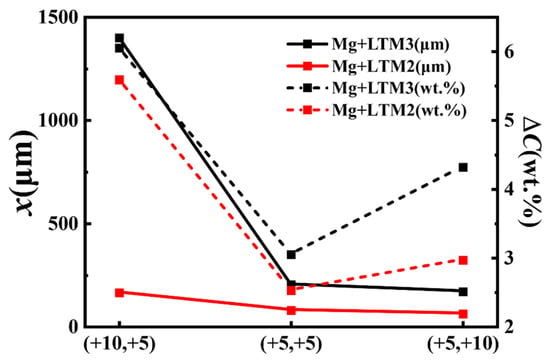
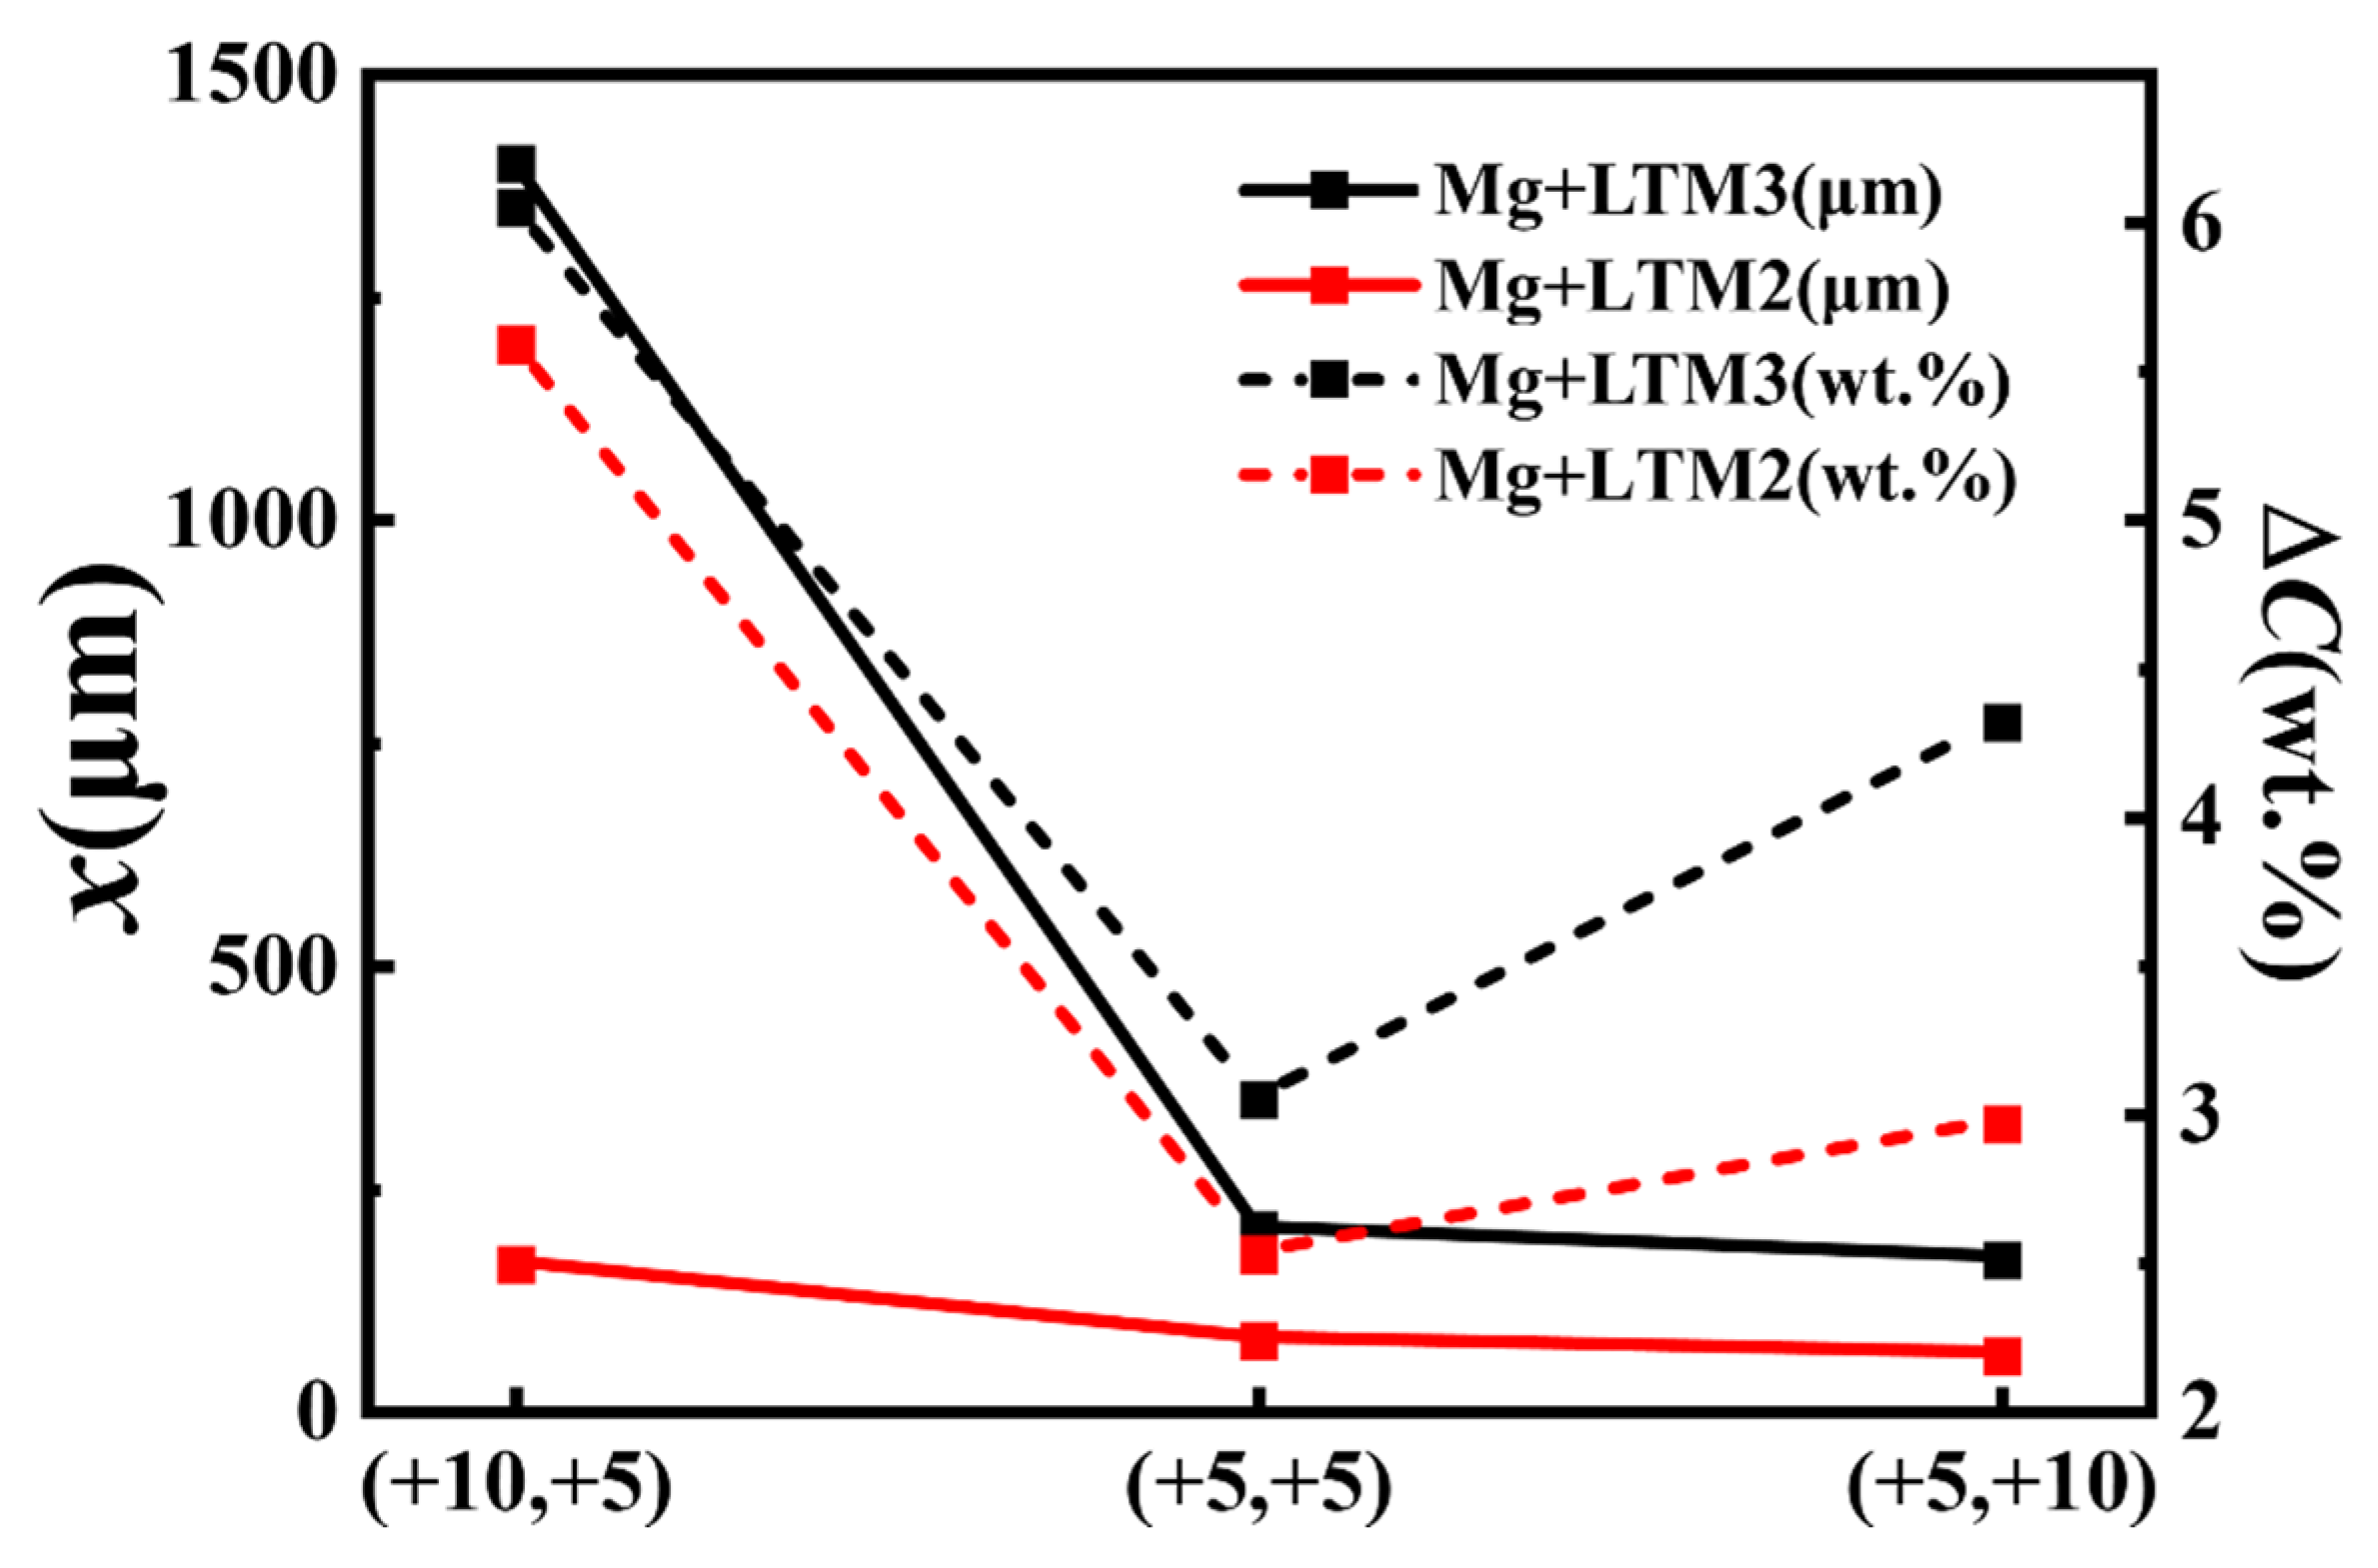
Figure 11 presents the post-solidification diffusion distance and the solute concentration at the mixing interface obtained from the experimental results shown in Figure 6 and Figure 7. The solid line represents the solute diffusion distance, and the dashed line represents the solute concentration difference at the interface. Since a higher temperature leads to a larger diffusion coefficient, and for the same LTM alloy composition, a higher HTM alloy temperature results in a greater diffusion distance. Therefore, under the condition of HTM superheat at 10 °C and LTM superheat at 5 °C, a larger diffusion distance and a larger solute concentration difference can be achieved, which improves melt mixing uniformity and reduces macro segregation. Based on the overall results, mixing LTM2 with pure magnesium under HTM superheat of 10 °C and LTM superheat of 5 °C yields a relatively large diffusion distance and fine globular grains. However, because LTM2 causes excessively rapid advancement of the solid–liquid interface during the early stage of nucleation and growth, the diffusion distance is much shorter than that of LTM3. Therefore, during dynamic mixing, enhancing the fragmentation effect of the pure magnesium melt and reducing the droplet size of pure magnesium are necessary to improve melt uniformity.
Figure 11.
Diffusion distance (x) and solute concentration difference (ΔC) for mixing at different superheating temperatures.
4. Conclusions
- After mixing, the solidified HTM/LTM interface consists of five regions: the base metal on both sides, two transition zones, and the central CDS solidification structure. Pure magnesium nucleates extensively at the contact position with the LTM alloy, and the CDS solidification region is formed through solute diffusion from the LTM alloy.
- Mixing LTM2 alloy with a composition of Mg30Al3.5Zn with pure magnesium produces fine globular grains, whereas Mg20Al2.5Zn forms coarse rosette and columnar grains. The constitutional supercooling layer thickness formed by Mg30Al3.5Zn with pure magnesium is smaller than that formed by Mg20Al2.5Zn, and the degree of supercooling is larger than that of Mg20Al2.5Zn. This suppresses grain growth and increases the nucleation rate. Therefore, Mg30Al3.5Zn is more favorable for the formation of fine globular grains. Due to the excessively rapid growth velocity of the solid–liquid interface, solute diffusion is inhibited. Consequently, the diffusion distance of solutes from the Mg30Al3.5Zn alloy toward the magnesium side and the solute concentration difference between the matrix and the diffusion interface are both smaller than those of Mg20Al2.5Zn.
- Higher superheat reduces constitutional supercooling, decreases nucleation, and coarsens the grains. Within the experimental window of this study, the 10 °C HTM/5 °C LTM condition achieved a favorable balance between preserving nucleation undercooling and promoting interfacial diffusion, thus yielding relatively optimal grain refinement.
Author Contributions
Conceptualization, X.Z., S.L. and P.F.; methodology, S.L. and T.G.; data curation, T.G., Y.S. and H.Q.; visualization, Y.S., H.Q. and D.W.; writing—original draft preparation, T.G. and D.W.; writing—review and editing, X.Z. and S.L.; supervision, X.Z. and P.F. All authors have read and agreed to the published version of the manuscript.
Funding
This work was supported by the National Natural Science Foundation of China (Granted No. 52105349).
Data Availability Statement
The original contributions presented in this study are included in the article. Further inquiries can be directed to the corresponding authors.
Conflicts of Interest
Author Shanguang Liu was employed by the company Aero Engine Corporation of China. The remaining authors declare that the research was conducted in the absence of any commercial or financial relationships that could be construed as a potential conflict of interest.
References
- Tufail, T.; Khan, T.; Ain, H.B.U.; Morya, S.; Shah, M.A. Garden cress seeds: A review on nutritional composition, therapeutic potential, and industrial utilization. Food Sci. Nutr. 2024, 12, 3834–3848. [Google Scholar] [CrossRef] [Scilit] [PubMed]
- Shah, I.U.; Sameen, A.; Manzoor, M.F.; Ahmed, Z.; Gao, J.; Farooq, U.; Siddiqi, S.M.; Siddique, R.; Habib, A.; Sun, C.; et al. Association of dietary calcium, magnesium, and vitamin D with type 2 diabetes among US adults: National health and nutrition examination survey 2007–2014—A cross-sectional study. Food Sci. Nutr. 2021, 9, 1480–1490. [Google Scholar] [PubMed]
- Zhang, J.; Shao, Z.; Zhao, Y.; Xiao, X. Impact of Different Grain Types on Muscle Function and Their Improvement Pathways. Food Biosci. 2025, 72, 107479. [Google Scholar] [CrossRef] [Scilit]
- Tan, Q.; Mo, N.; Lin, C.-L.; Jiang, B.; Pan, F.; Huang, H.; Atrens, A.; Zhang, M.-X. Improved oxidation resistance of Mg-9Al-1Zn alloy microalloyed with 60 wt ppm Be attributed to the formation of a more protective (Mg,Be)O surface oxide. Corros. Sci. 2018, 132, 272–283. [Google Scholar]
- Tan, Q.; Mo, N.; Lin, C.-L.; Zhao, Y.; Yin, Y.; Jiang, B.; Pan, F.; Atrens, A.; Huang, H.; Zhang, M.-X. Generalisation of the oxide reinforcement model for the high oxidation resistance of some Mg alloys micro-alloyed with Be. Corros. Sci. 2019, 147, 357–371. [Google Scholar] [CrossRef] [Scilit]
- Tekumalla, S.; Gupta, M. An insight into ignition factors and mechanisms of magnesium based materials: A review. Mater. Des. 2017, 113, 84–98. [Google Scholar] [CrossRef] [Scilit]
- Mebarki, N.; Kumar, N.V.R.; Blandin, J.J.; Suery, M.; Pelloux, F.; Khelifati, G. Correlation between ignition and oxidation behaviours of AZ91 magnesium alloy. Mater. Sci. Technol. 2013, 21, 1145–1151. [Google Scholar]
- Tan, Q.; Atrens, A.; Mo, N.; Zhang, M.-X. Oxidation of magnesium alloys at elevated temperatures in air: A review. Corros. Sci. 2016, 112, 734–759. [Google Scholar] [CrossRef] [Scilit]
- Saha, D.; Shankar, S.; Apelian, D.; Makhlouf, M.M. Casting of Aluminum Based Wrought Alloys and Aluminum Based Casting Alloys. U.S. Patent 7,201,210, 10 April 2007. [Google Scholar]
- Khalaf, A.A.; Ashtari, P.; Shankar, S. Formation of Nondendritic Primary Aluminum Phase in Hypoeutectic Alloys in Controlled Diffusion Solidification (CDS): A Hypothesis. Met. Mater. Trans. B 2009, 40, 843–849. [Google Scholar] [CrossRef] [Scilit]
- Yang, X.; Li, Y.-D.; Luo, X.-M.; Zhou, H.-W.; Cai, Q.-Y.; Li, M.; Ma, Y. Microstructural evaluation and mechanical properties of 7075 aluminum alloy prepared by controlled diffusion solidification. China Foundry 2019, 16, 238–247. [Google Scholar] [CrossRef] [Scilit]
- Fan, L.; Hao, Q.T.; Liu, L.B.; Shen, R.Q. Solidification Behavior of Aluminum-Copper Based Alloy during Controlled Diffusion Solidification. Mater. Sci. Forum 2016, 879, 1535–1539. [Google Scholar] [CrossRef] [Scilit]
- Ashtari, P.; Birsan, G.; Khalaf, A.; Shankar, S. Controlled diffusion solidification of 2024, 6082 and 7075 Al alloys via tilt-pour casting process. Int. J. Met. 2011, 5, 43–64. [Google Scholar] [CrossRef] [Scilit]
- Pourgharibshahi, M.; Divandari, M.; Larijani, H.S.; Ashtari, P. Controlled diffusion solidification processing: A review. J. Mater. Process. Technol. 2017, 250, 203–219. [Google Scholar] [CrossRef] [Scilit]
- Li, F.; Hao, Q.T.; Shen, R.Q. Casting of aluminum-copper based alloy by controlled diffusion solidification. China Foundry 2015, 7, 92. [Google Scholar]
- Pourgharibshahi, M.; Divandari, M.; Saghafian, H.; Fabrizi, A.; Timelli, G. Increasing the Liquidus Temperature by Employing the Controlled Diffusion Solidification (CDS) Process: A Potential Route to Improved Castings. In IOP Conference Series: Materials Science and Engineering; IOP Publishing: Philadelphia, PA, USA, 2019; Volume 529. [Google Scholar]
- Pourgharibshahi, M.; Saghafian, H.; Divandari, M.; Timelli, G. Controlled Diffusion Solidification Pathway of an AA 7xxx Series Aluminum Alloy. Met. Mater. Trans. A 2018, 50, 326–335. [Google Scholar] [CrossRef] [Scilit]
- Ashtari, P.; Birsan, G.; Shankar, S. Favorable Alloy Compositions and Melt Temperatures to Cast 2XXX and 7XXX Al alloys by Controlled Diffusion Solidification (CDS). In Shape Casting: 3rd International Symposium; TMS: Warrendale, PA, USA, 2009. [Google Scholar]
- Ghiaasiaan, R. The Controlled Diffusion Solidification (CDS) of Al-7xxx Alloys, Heat Treatments, Microstructure, and Mechanical Properties; McMaster University: Hamilton, ON, Canada, 2015. [Google Scholar]
- Birsan, G. Controlled Diffusion Solidification for Tilt Pouring Casting Process; McMaster University: Hamilton, ON, Canada, 2009. [Google Scholar]
- Yang, Z.; Jin, K.; Fang, H.; He, J. Multi-scale simulation of solidification behavior and microstructure evolution during vacuum electron beam welding of Al-Cu alloy. Int. J. Heat Mass Transf. 2021, 172, 121156. [Google Scholar] [CrossRef] [Scilit]
- Symeonidis, K.; Apelian, D.; Makhlouf, M.M. The Controlled Diffusion Solidification Process: Fundamentals and Principles. In Advanced Casting Research Center Project Reports Archive; Worcester Polytechnic Institute: Worcester, MA, USA, 2010. [Google Scholar]
- Masaki, T.; Fukazawa, T.; Matsumoto, S.; Itami, T.; Yoda, S. Measurements of diffusion coefficients of metallic melt under microgravity—Current status of the development of shear cell technique towards JEM on ISS. Meas. Sci. Technol. 2005, 16, 327–335. [Google Scholar] [CrossRef] [Scilit]
- Khalaf, A.A. Mechanism of controlled diffusion solidification: Mixing, nucleation and growth. Acta Mater. 2016, 103, 301–310. [Google Scholar] [CrossRef] [Scilit]
- Apelian, D.; Pan, Q.Y.; Findon, M. Low cost and energy efficient methods for the manufacture of semi-solid (SSM) feedstock. Die Cast. Eng. 2004, 48, 22–24+26. [Google Scholar]
- Keller, D.M.; Massey, R.E.; Hileman, O.E. Studies on Nucleation Phenomena Occurring in Aqueous Solutions Supersaturated with Calcium Sulfate. Can. J. Chem. 1978, 56, 831–838. [Google Scholar] [CrossRef] [Scilit]

Disclaimer/Publisher’s Note: The statements, opinions and data contained in all publications are solely those of the individual author(s) and contributor(s) and not of MDPI and/or the editor(s). MDPI and/or the editor(s) disclaim responsibility for any injury to people or property resulting from any ideas, methods, instructions or products referred to in the content. |
© 2026 by the authors. Licensee MDPI, Basel, Switzerland. This article is an open access article distributed under the terms and conditions of the Creative Commons Attribution (CC BY) license.