


Abstract
Based on the hydrostatic transmission principle, a new method for high-throughput characterization via surface microstrain effects after cold isostatic pressing is proposed. Typical key metallic materials (steels, titanium alloys, and superalloys) were processed under a pressure of 190 MPa with a holding time of 30 min, and surface microstrain effects and characteristics of the specimens were explored via white light interference profilometry, scanning electron microscopy, atomic force microscopy, focused ion beam processing, and transmission electron microscopy. It is shown that all the metallographic polishing specimens exhibit a similar tendency, and two main categories of typical microstrain fields can be detected after CIP processing: (1) slight microstrain and (2) significant microstrain. Significant microstrain with roughening of the surface (roughness increasing) after CIP processing can be detected only in a few microregions. Microregions with weaker micromechanical properties can be characterized and screened in a high-throughput manner through evaluation of the significant microstrains. A new application strategy is proposed for high-throughput characterization of mechanical homogeneity and mechanically weak zones, using the surface microstrain effect during cold isostatic pressing and surface profile analysis. Regions with significant microstrain showed surface roughening (Sq: 6.1 nm→139.7 nm, Sa: 4.8 nm→94.4 nm).
1. Introduction
Metallic materials have been widely used as key structural materials, especially in many fields such as national defense, aerospace, the nuclear industry, transportation, and infrastructure [1,2,3,4,5]. For instance, structural steel finds applications in the manufacturing of ships, submarines, and offshore oil rigs; superalloys in aircraft engines and gas turbines; and titanium alloys in aircraft landing gear parts and submersibles [6,7,8]. There are several common problems in metallic materials that have attracted wide concern, such as fracture failure during service induced by different causes (e.g., brittle fracture, ductile fracture, and fatigue) [9]. In the case of fatigue fracture, it will pose a great potential threat to service safety, such as aircraft engine explosion caused by turbine blade fracture or fatigue-induced fracture of high-speed railway wheels [10,11]. For service safety, the evaluation of materials fabrication and equipment manufacturing is important. Therefore, the characterization of metallic materials is necessary and important for materials evaluation, and developing characterization techniques for material mechanics based on new concepts and principles will be helpful for achieving the corresponding objective [12,13].
In general, the testing and characterizing techniques of material mechanics can be classified into two main categories: (1) testing of macroscopic mechanical properties, and (2) testing of microscopic mechanical properties [14,15,16]. With the rise and rapid development of the Materials Genome Initiative (MGI), high-throughput characterization techniques have become an important research highlight and have attracted attention from countries all over the world [12]. Through the combination of high-throughput characterization and micromechanical properties testing, the development of new high-throughput micromechanical characterization methods has become an important potential breakthrough direction in materials development and materials performance evaluation [12].
Although new methods of high-throughput micromechanical characterization have been explored in recent years, most of them have been developed on the basis of the destructive testing principle and combinatorial techniques with spatially discontinuous test areas (microindentation, nanoindentation, micro-compression, micro-tensile testing, and micro-fatigue testing) [13,15]. For example, micro-indentation and nano-indentation typically use a diamond indenter as the load transfer medium [12]. Since the rigid indenter significantly compresses the region around the indentation within a certain range during loading, a sufficient spacing distance between indentations needs to be ensured [17,18]. In contrast, other micro-mechanical techniques such as micro-compression, which involve compression testing of small-sized samples, also require sampling and testing in different representative regions of the specimen, making it difficult to capture spatially continuous mechanical information. Therefore, the micromechanical properties of only some target planar areas can be tested as representative areas, and the micromechanical properties in any arbitrary microregion cannot be thoroughly tested and reflected through these combinatory spatially discontinuous methods. Based on the principle of hydrostatic transmission, a uniform equivalent continuous force can be applied on the surface of heterogeneous specimens, even those with complex heteromorphic shapes such as turbine blades or structural parts [19,20,21]. Therefore, the microstrain of the heterogeneous specimen surface can reflect some micromechanical information of metallic materials with intrinsic inhomogeneous microstructures and mechanical properties [13]. Compared with these testing methods, the combination of isostatic pressing techniques, surface profile information testing, and the high-throughput characterization idea is a promising new approach for high-throughput characterization of micromechanical properties.
In this work, typical metallic materials (steels: heat resistant steel, bridge steel, and standard hardness block), titanium alloys (Ti-6Al-4V alloy: TC4, as-cast and 3D-printed states), and superalloys (single crystal superalloy and powder superalloy in as-cast and forged state) were selected to explore microstrain characteristics via cold isostatic pressing (CIP) treatment at 190 MPa for a holding time of 30 min. The surface microstrain behaviors and characteristics of the specimens were characterized using a white-light interferometric profilometer (WLI), scanning electron microscope (SEM), atomic force microscope (AFM), focused ion beam (FIB) processer, and transmission electron microscope (TEM). By comparing the surface profile data of samples before and after CIP measured by WLI apparatus and processed via Gaussian filtering, we elucidated the influence of CIP on the surface microstrain of the samples. In combination with scanning electron microscope (SEM) observations, we revealed that the strained regions of the sample serve as mechanically weak regions. The potential application of the hydrostatic transmission-induced surface microstrain in high-throughput micromechanical properties characterization is discussed in detail according to surface microstrain characteristics.
2. Experimental Procedure
Eight kinds of metallic materials including steels, titanium alloys, and superalloys were selected to explore the general behavior of surface microstrain on specimen surfaces with intrinsically inhomogeneous distributions of elements, microstructures and defects after CIP. Table 1 shows the serial numbers of all the specimens. All of the specimens were first cut into cylinders or blocks by wire cutting, and then polished by traditional mechanical polishing methods [13]. First, the samples were rough-polished on a metallographic grinding and polishing machine using sandpapers with grit sizes of 80#, 120#, 200#, 400#, 600#, 1000#,and 1500#, followed by fine polishing with metallographic polishing slurry with a particle size of less than 0.5 μm. The samples were observed under an DM6000M optical microscope (Leica, Wetzlar, Germany) with ×50 or ×100 objective lenses. Samples without obvious scratches on the surface were deemed to meet the requirements for testing and observation. All of the samples were then processed by the CIP technique with a pressure of 190 MPa and a holding time of 30 min. Metallographic etching was performed on the samples using different corrosive solutions: specimens 1–2 (170 mL H3PO4 + 10 mL H2SO4 + 15 g CrO3); specimen 3 (1% HF + 33% HNO3 + 33% CH3COOH + 33% H2O); specimen 4 (3% HNO3 + C2O5OH); specimens 5–6 (10% HF + 30% HNO3 + 70% H2O); specimen 7 (5 g FeCl3 + 15 mL HCl + 80 mL H2O); and specimen 8 (3% HNO3 + C2H5OH). Vicker’s microhardness measurements were performed on each specimen using a Qness Q10A+ microhardness tester (Qness, Wien, Austria) under an applied load of 10 N. Owing to the high microstructural homogeneity of the samples, three indentations were made per specimen, and the averaged hardness values with corresponding standard deviations are summarized in Table 1.
Table 1.
Serial information including numbers, types, and Vicker’s hardness values of eight selected metallic materials.
The elements, microstructures, defects, surface profiles and typical strain fields were characterized and analyzed using energy dispersive spectroscopy (EDS, Oxford, UK), micro X-ray fluorescence spectrometry (μ-XRF, Bruker, Germany), automatic optical microscopy (OM), SEM, high-throughput SEM (FBT-NCS, Shanghai, China), WLI (Bruker, Germany), and AFM. Typical titanium alloy samples were selected and cut using a focused ion beam (FIB), and their deformation or strain characteristics were observed under the bright-field imaging mode of TEM. The surface profile data of the specimens acquired by the white-light interferometric profilometer were processed and analyzed with Vision 64 software. For example, to compare the surface morphology of the samples before and after CIP, given the superposition of macroscopic and microscopic profile information, leveling treatment and Gaussian regression filtering (in short-wavelength pass mode) were performed, respectively, in Vision 64 software so as to more intuitively compare the variations in height information before and after CIP. In general, the short-wavelength cutoff of 25–100 μm is recommended.
3. Results and Discussion
3.1. Hydrostatic Processing and Surface Information Characterization Before and After CIP Processing
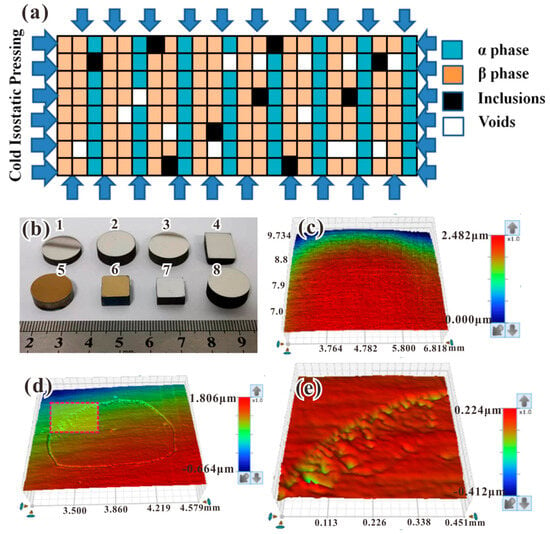
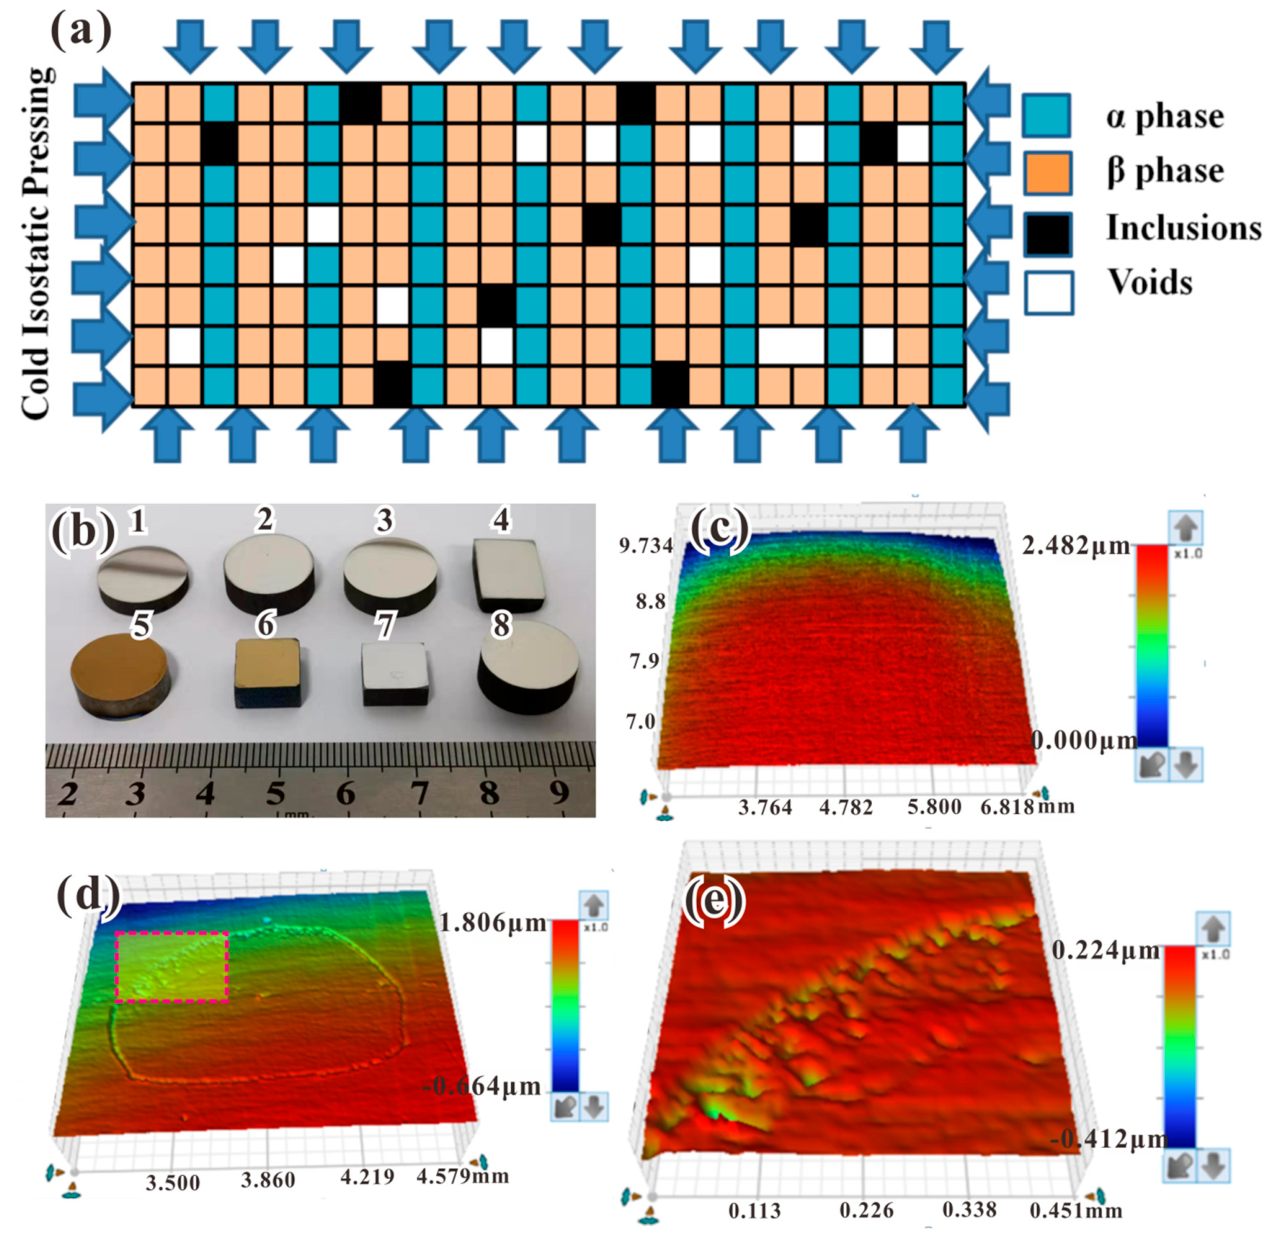
In this study, the influence of hydrostatic transmission on specimen surface strain has been analyzed. The schematic view of the CIP process is shown in Figure 1a. The macroscopic view of the metallographic polished specimens can be seen in Figure 1b. During CIP processing, the surface is subjected to a uniform force from all directions. Then, surface microstrain might happen first in some microregions, especially those with low strength, weak interfaces (such as the interface between nonmetallic inclusions and metal matrices), and regions including voids and microcracks. For example, when uniform force is loaded on specimen surfaces, local tearing preferentially emerges near weak interfaces.
Figure 1.
Schematic view of the method proposed in this work and typical specimen surface profile information obtained before and after CIP processing: (a) Surface microstrain induced by CIP processing; (b) macroscopic view of selected specimens; (c) before CIP processing; (d) after CIP processing; and (e) enlarged view of (d).
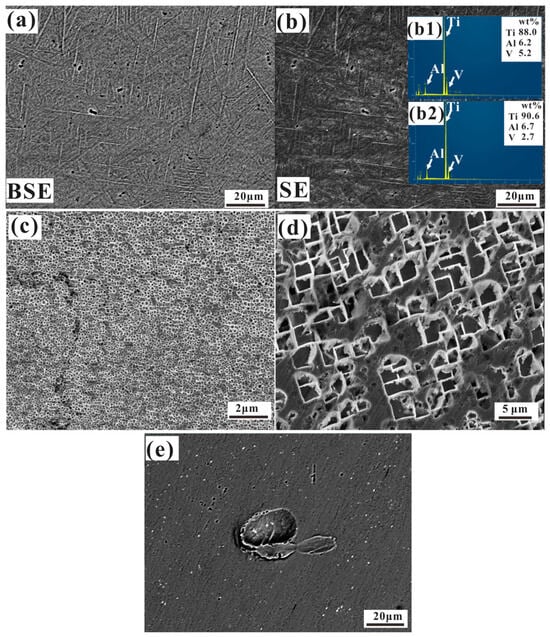
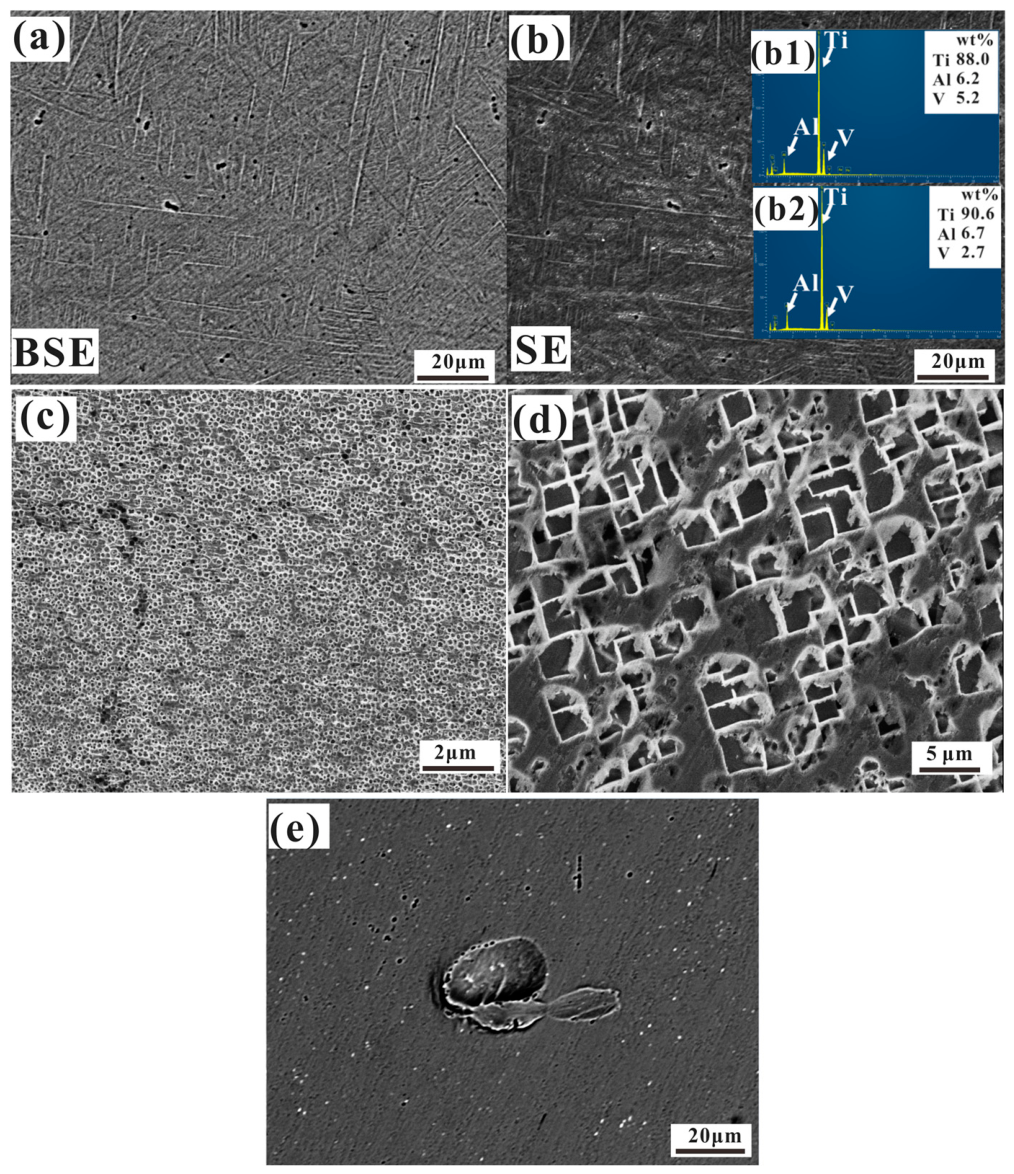
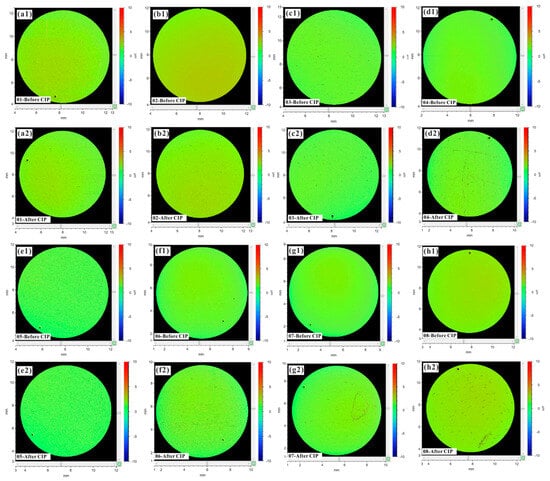
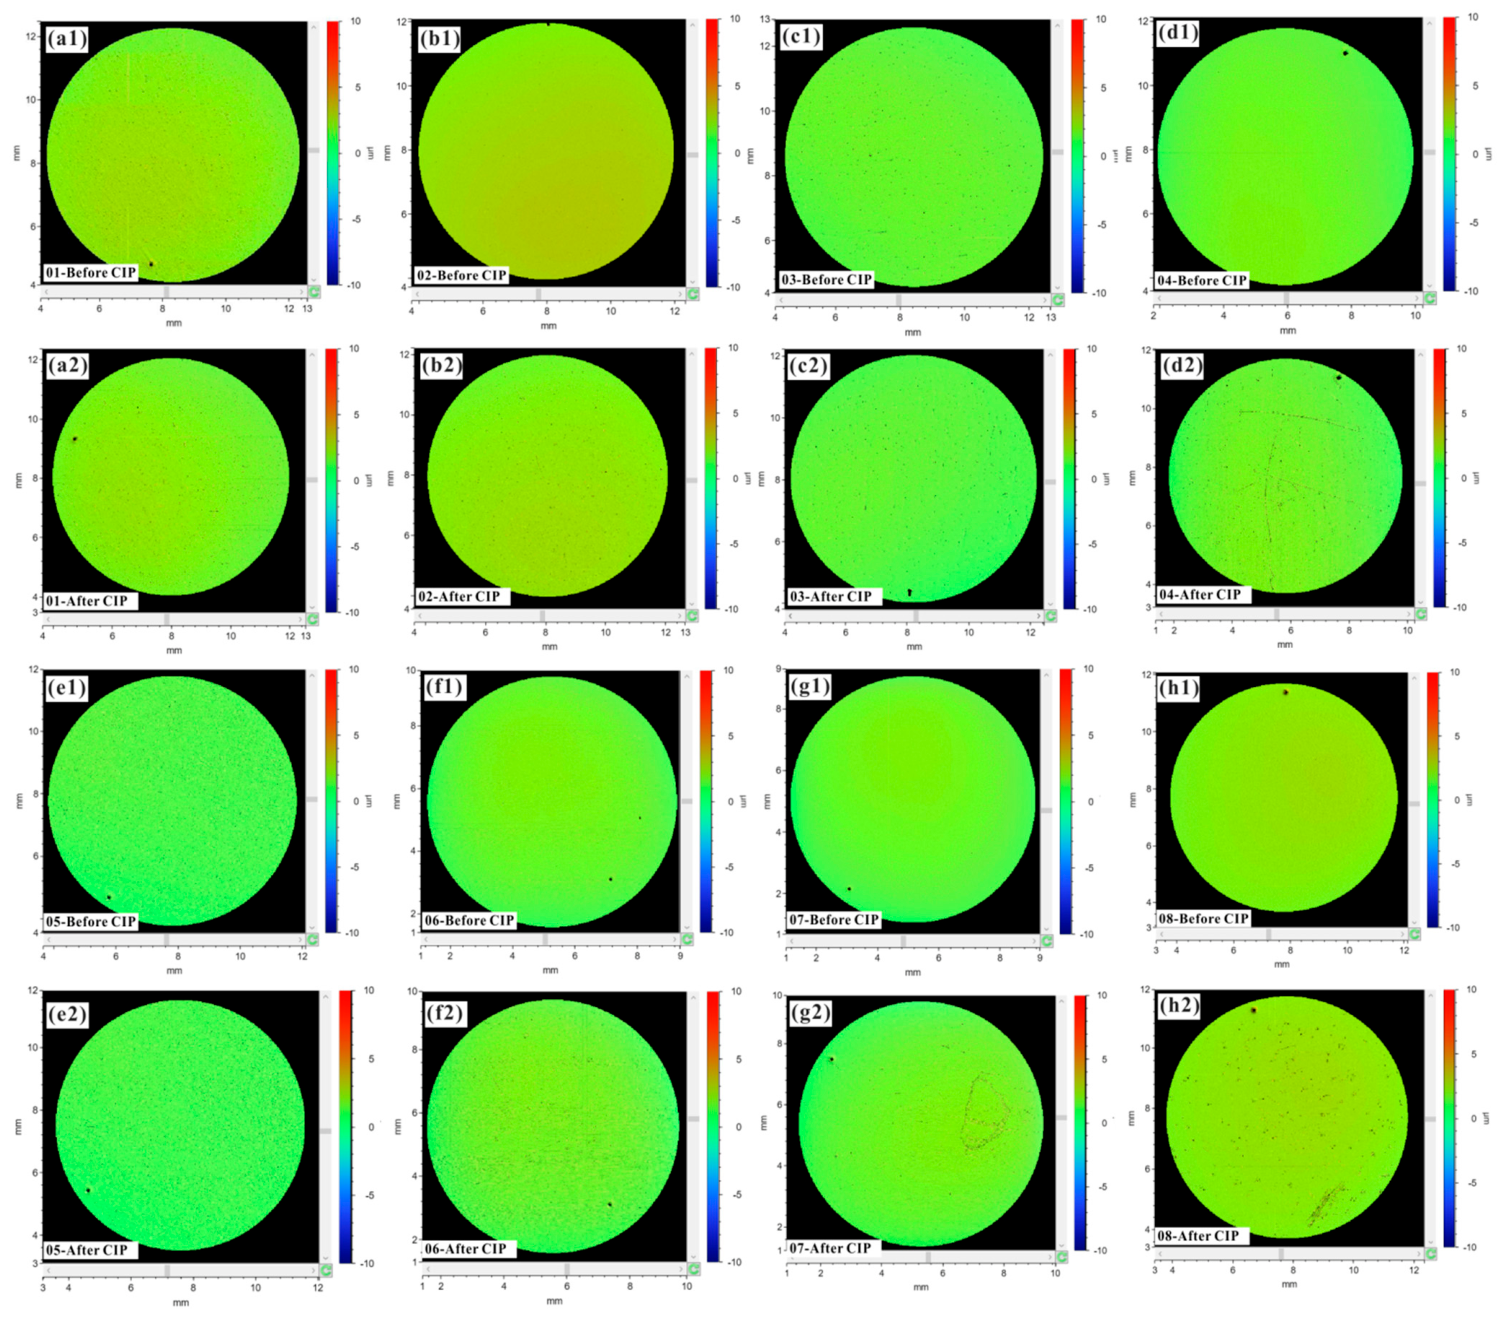
For intuitive observation, typical three-dimensional surface profiles of the TC4 titanium alloy obtained before and after CIP processing are shown in Figure 1c–e. It can be found from the results that significant annular surface deformation is observed by WLI apparatus. This is a universal phenomenon found on as-tested specimen surfaces. Figure 2 shows the microstructures of TC4 titanium alloy, powder superalloy, single-crystal superalloy, and heat-resistant steel. The TC4 titanium alloy is composed of a two-phase microstructure, while the superalloy consists of a matrix phase and a γ′ precipitation-strengthening phase, and heat-resistant steel materials also have a structure of precipitated phases. The microstructures of hardness block materials (GCr15) and bridge steel materials (Q355) have been presented in our previous papers. Surface profile information for specimens before and after CIP processing is shown in Figure 3, including as-cast powder superalloy (Figure 3(a1,a2)), forged powder superalloy (Figure 3(b1,b2)), nickel-based single-crystal superalloy (Figure 3(c1,c2)), bridge steel (Figure 3(d1,d2)), as-cast TC4 titanium alloy (Figure 3(e1,e2)), 3D-printed TC4 titanium alloy (Figure 3(f1,f2)), heat-resistant steel (Figure 3(g1,g2)), and standard-hardness block (Figure 3(h1,h2)). From the WLI results, surface microstrain can be detected on specimen surfaces after CIP processing, which exhibits the general phenomenon and surface microstrain tendency.
Figure 2.
Microstructures and compositions of TC4 titanium alloys, heat-resistant steel and superalloys: (a,b) TC4 titanium alloys; (c) FGH96 powder superalloys; (d) DD4 single-crystal superalloys; and (e) heat-resistant steel. (b1,b2) EDS result of TC4 titanium alloys.
Figure 3.
Surface profile information of specimens before and after CIP processing: (a1–h1) full view of specimens before CIP; (a2–h2) full view of specimens after CIP: (a1,a2) as-cast powder superalloy; (b1,b2) forged powder superalloy; (c1,c2) nickel-based single-crystal superalloy; (d1,d2) bridge steel; (e1,e2) as-cast TC4 titanium alloy; (f1,f2) 3D-printed TC4 titanium alloy; (g1,g2) heat-resistant steel; (h1,h2) Standard-hardness block.
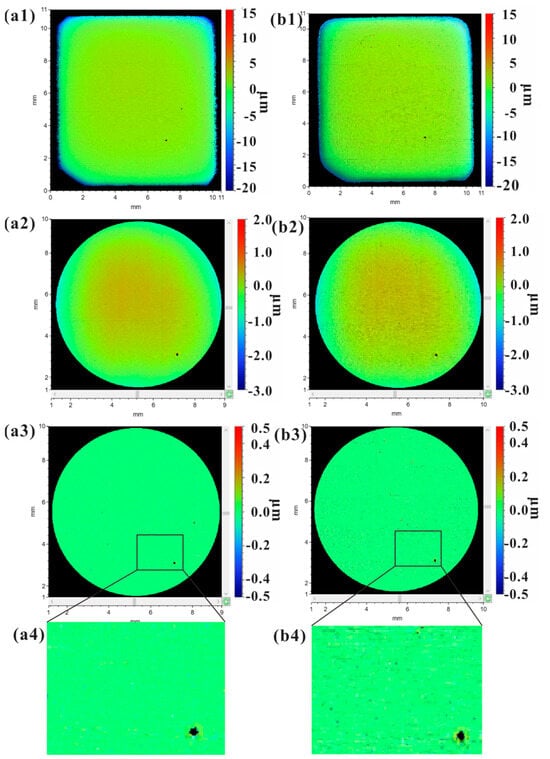
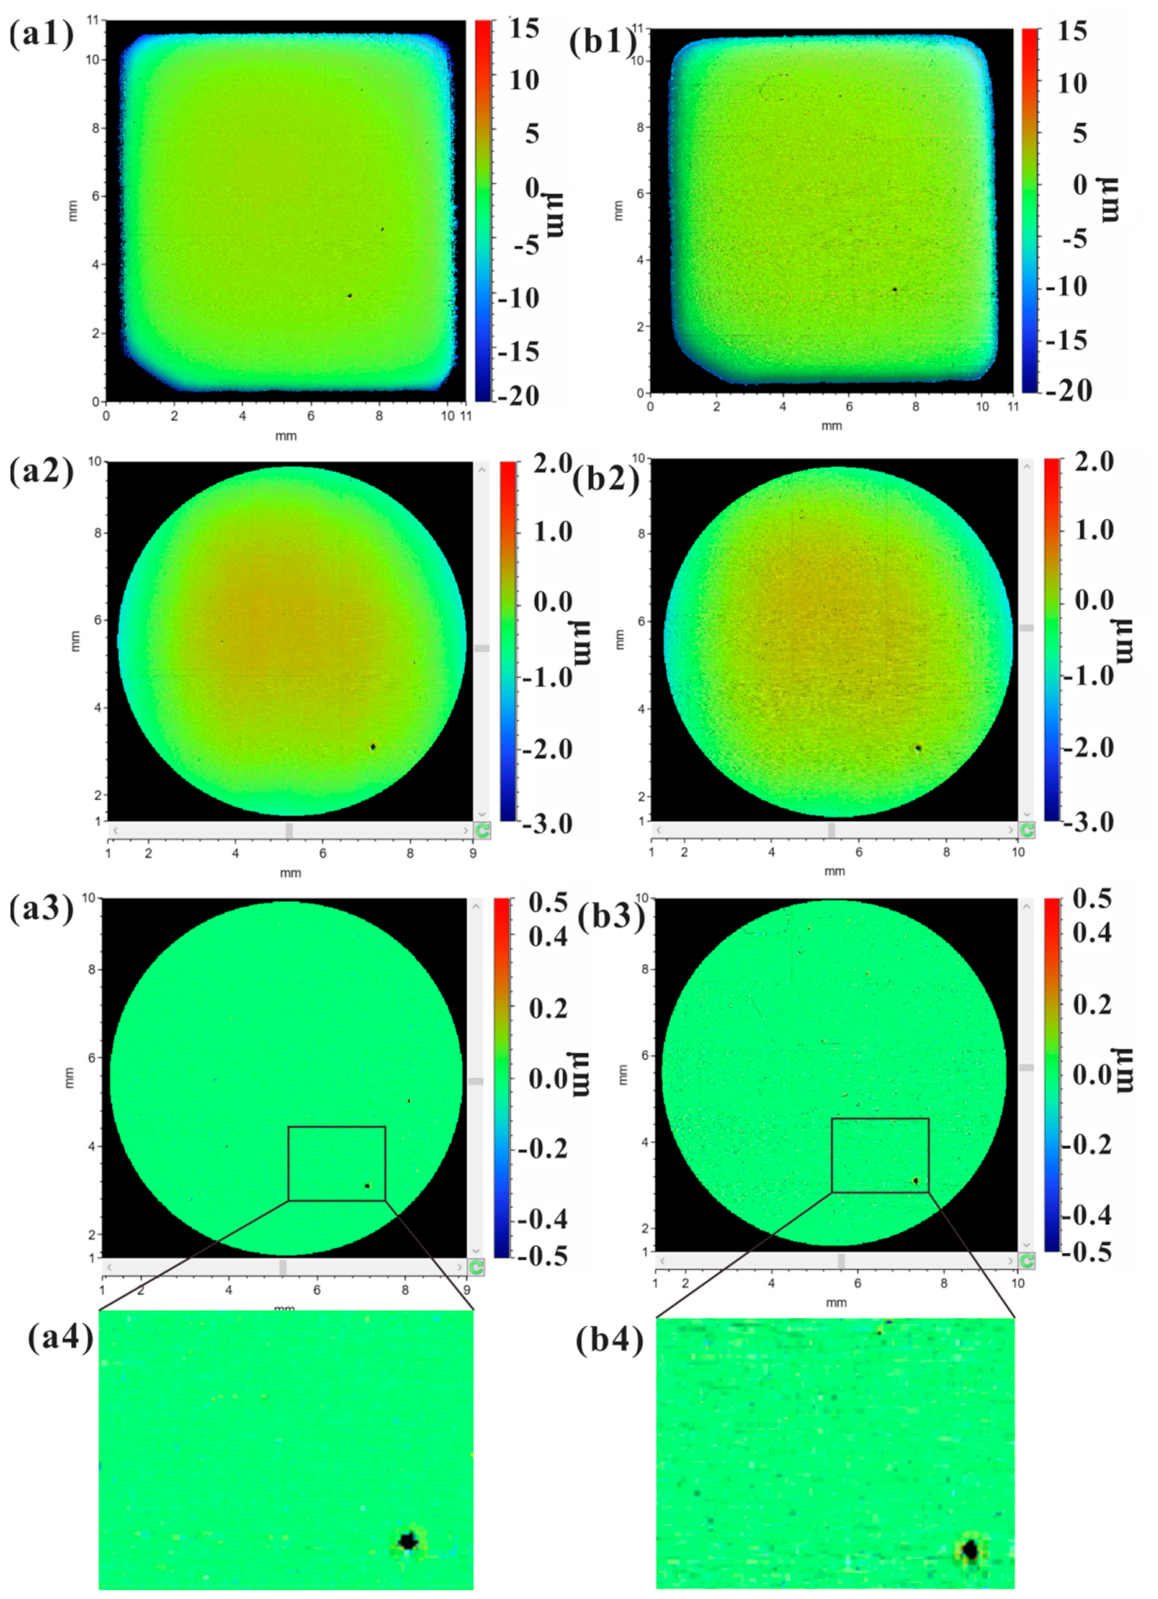
Figure 4 presents the whole areas and enlarged partial areas of the surface profiles (two-dimensional contour maps) of the TC4 titanium alloy specimen obtained before and after CIP via WLI testing. The surface profile of the specimen obtained before CIP processing shows that a nearly flat and smooth surface has been obtained after the polishing process, but significant height changes in local microregions have been produced after CIP processing. The enlarged views exhibit more pronounced visual contrasts. Figure 4(a3,b3) show the relative surface information fluctuation after the filtering process using Vision 64 software with zero-mean processing. The relatively large deviation in surface height information can be illustrated directly. It is easy to see that two different categories of strain modes can be detected, namely slight microstrain and significant microstrain.
Figure 4.
Full and partial surface profiles of the 3D-printed TC4 titanium alloy before and after CIP processing: (a1) original surface profile information (OSPI) of the full specimen area; (b1) OSPI of the full specimen area; (a2) OSPI of the selected circle area; (b2) OSPI of the selected circle area; (a3) filtered surface profile information of the selected circle area; (b3) filtered surface profile information of the selected circle area; (a1–a4) before CIP processing; (b1–b4) after CIP processing; (a4) the microregion enlargement of (a3); and (b4) enlarged microregion of (b3).
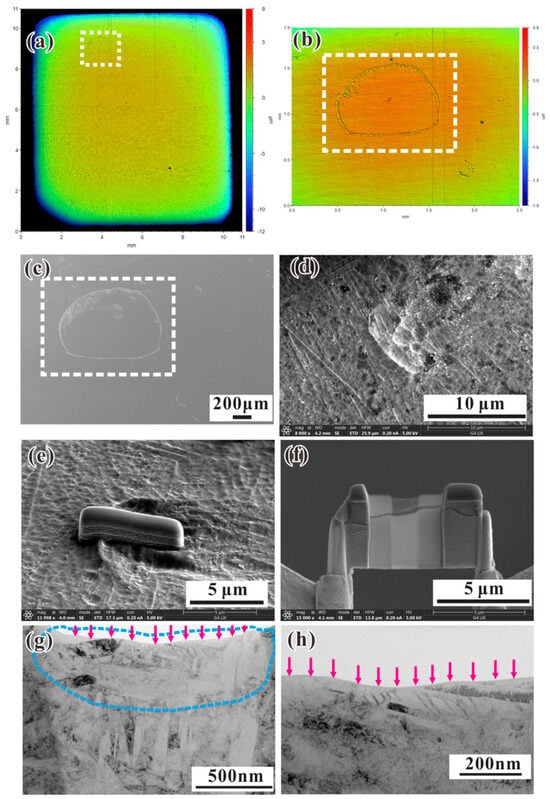
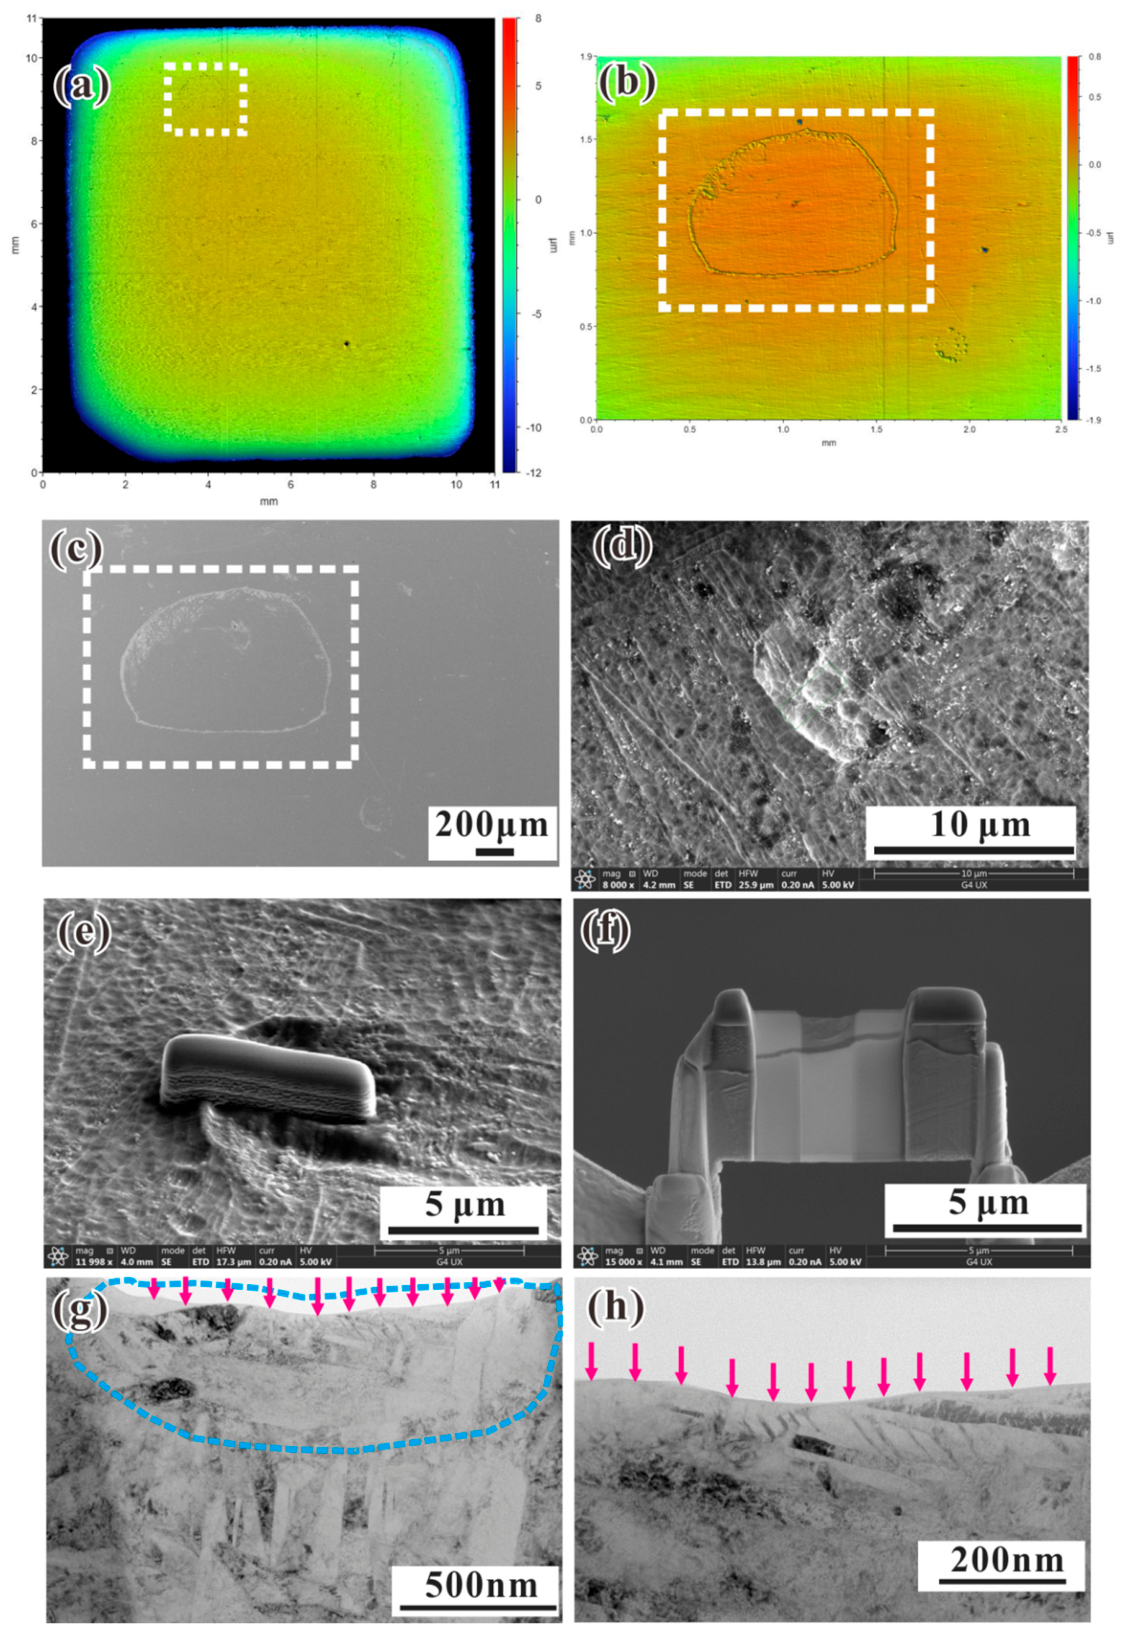
Figure 5 shows the typical surface microstrain of TC4 alloys after CIP processing. Based on the comparison of surface profiles before and after CIP treatment (Figure 4), we observed multiple strain regions generated in the specimens after CIP processing. A representative surface deformation region was selected, as shown in Figure 5, and a cross-sectional specimen was fabricated via FIB milling with platinum deposition for surface protection. The as-prepared specimen was subsequently characterized using TEM in bright-field mode. The results revealed a significant difference in microstructure between the surface deformation region and the bulk of the TC4 titanium alloy. A strain-affected zone with a depth of 200–300 nm was formed in the surface region, where the original lath martensitic structure was completely disrupted, accompanied by significant grain refinement and dislocation multiplication. In addition, multiple inclined alternating bright–dark shear bands were observed within this region, oriented at approximately 45° to the specimen surface. This phenomenon can be attributed to the local shear stress exceeding the critical shear stress during CIP compression, which induces shear slip on the material surface.
Figure 5.
Typical surface microstrain characterization of TC4 alloy specimens after CIP processing: (a) WLI result for the full specimen surface; (b) enlarged view of (a); (c) local surface microstrain observed by SEM; (d) local surface microstrain observed by SEM; (e) local surface microstrain FIB fabrication preparation; (f) FIB fabrication of local surface microstrain; (g,h) surface microstrain observed by TEM bright field mode.
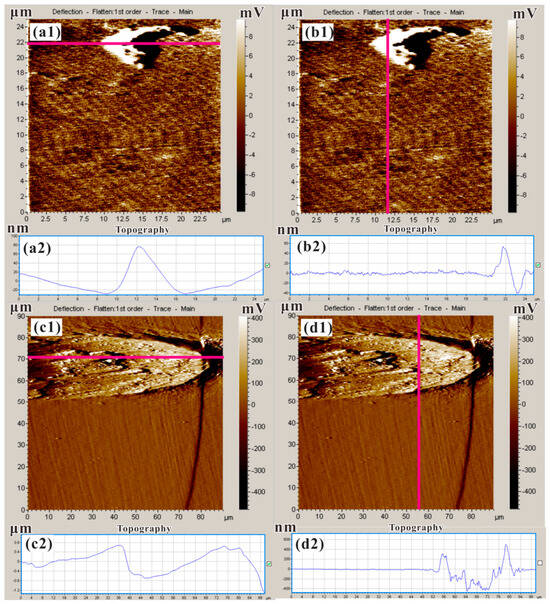
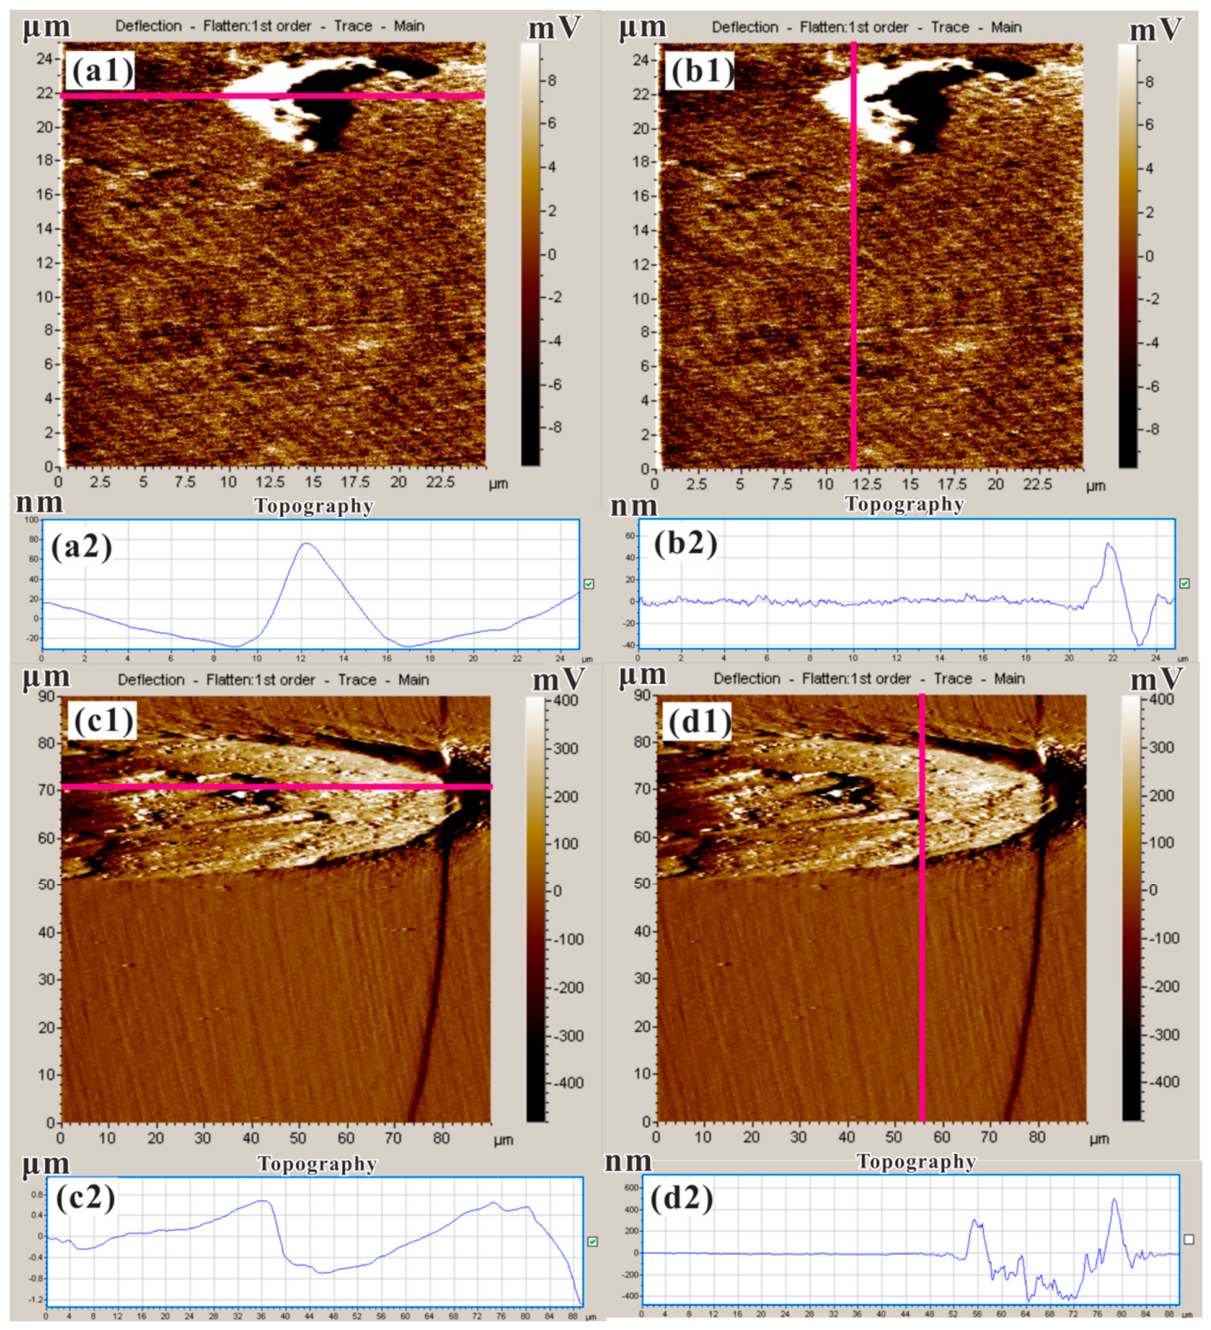
It is easy to distinguish this difference in height information. Microstrain with dimensions in the micron-scale range can be detected by WLI apparatus. In general, due to the limitations of the optical wavelength and the minimum resolvable distance estimated on the basis of the Rayleigh criterion, the lateral resolution of the WLI apparatus is about 500 nm [22,23]. Therefore, it is difficult to distinguish the surface microstrain with sizes on the submicron scale or nanoscale only by WLI apparatus. The surface profile should be analyzed by other techniques with higher lateral resolution. In this work, collaborative application of the AFM technique and WLI apparatus was used for trans-scale characterizing (nm-μm-mm-cm) of surface profile information. The AFM technique combining the stylus profilometer and scanning tunneling microscope has been applied and the lateral resolution of 3 nm can be attained [24]. As indicated in Figure 6, the AFM technique was used to detect microstrains with smaller sizes. Meanwhile, across the measuring lines, height information is also presented.
Figure 6.
Local surface profile information of microregion at the micron scale of 3D-printed TC4 titanium alloy and heat-resistant steel obtained by the AFM technique: (a1,b1) surface characteristic of local microregion of TC4 titanium alloy; (a2,b2) height information along the selected highlight lines as indicated in (a1,b1); (c1,d1) surface characteristic of local microregion of heat-resistant steel; and (c2,d2) height information along the selected highlight lines as indicated in (c1,d1).
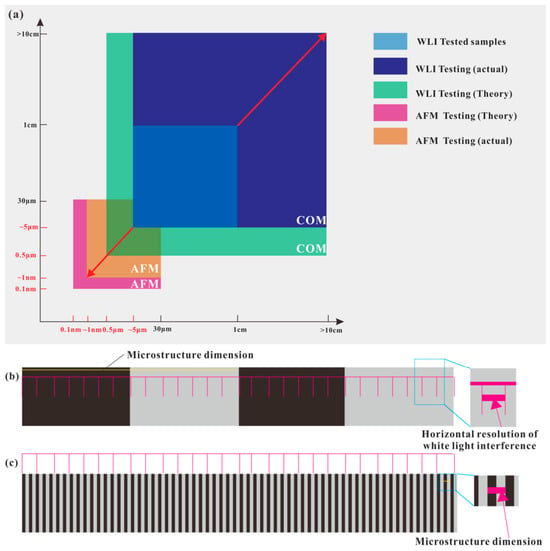
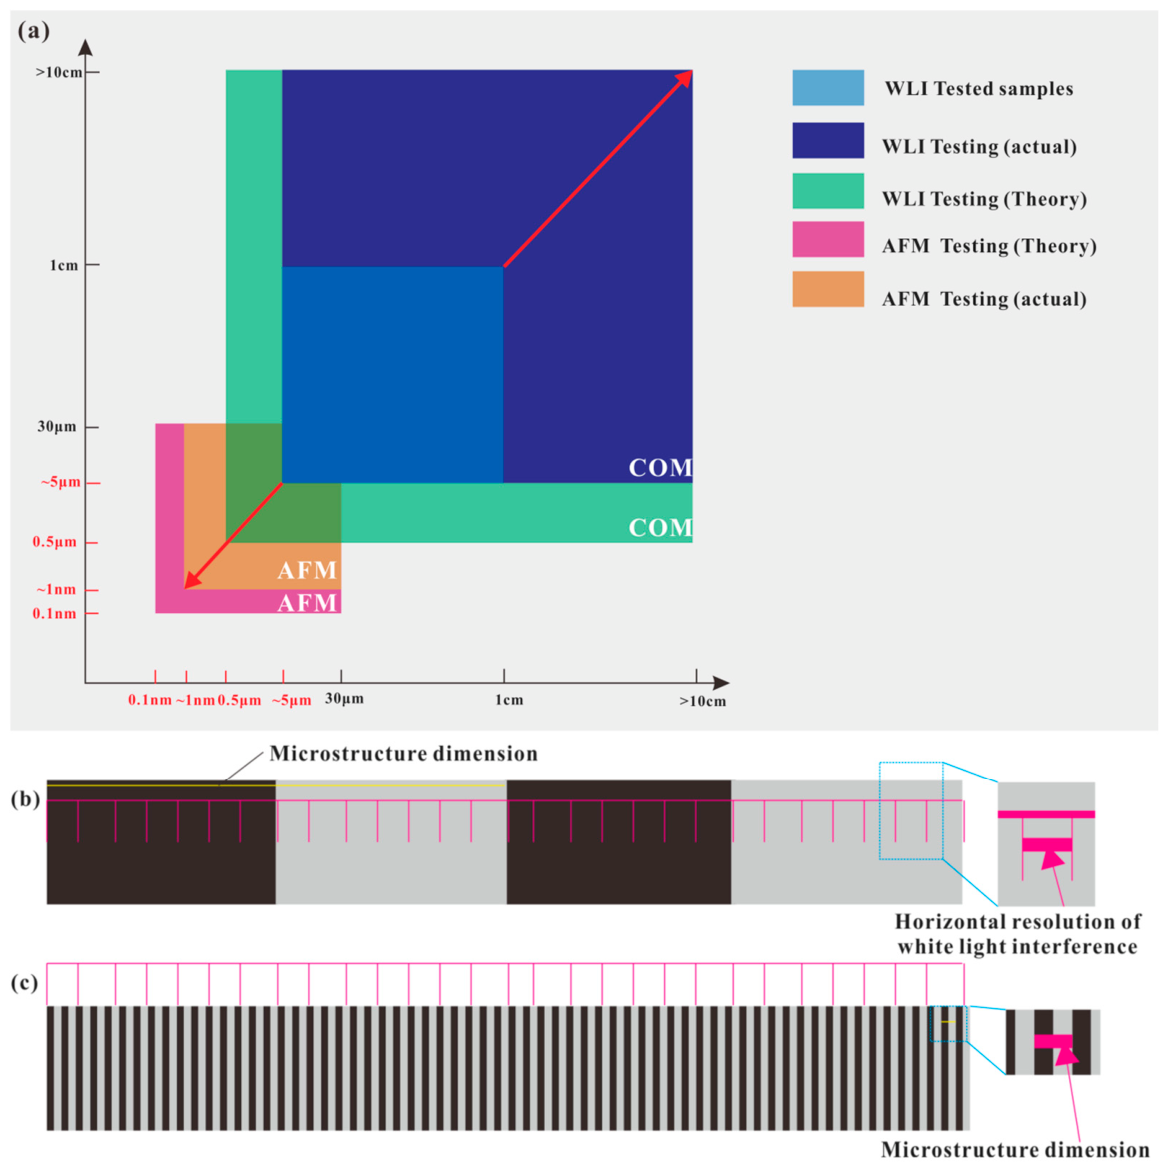
Figure 7 compares the resolution ratio and maximum test size of WLI and AFM apparatus. From the resolution ratio and maximum test size, the theory-testing range can be obtained (light-green area). However, multiple pixels are needed when describing specific shapes. Therefore, the actual testing range is shown in the deep blue rectangular area. When a specimen has macroscopic dimensions in sizes measured in centimeters and microstructures in several microns, its corresponding scale is seen in rectangles with navy-blue color in Figure 7a. The observation size and range are also shown in Figure 7a. The rectangle with a magenta color exhibits the theoretical detection area of AFM apparatus, and the rectangle with dark-yellow color exhibits the actual detection area of AFM apparatus, since multiple pixels are required to describe a shape (Figure 7b). When the lateral resolution size of WLI is smaller than the microstructure dimension, the detailed microstructure morphologies can be mapped (Figure 7b) solely by WLI apparatus. However, the microstructure cannot be described when the horizontal resolution size of WLI is larger than the microstructure dimension, such as the γ’ phase in single-crystal superalloys. Then, AFM apparatus is needed to observe the surface microstructure after CIP processing.
Figure 7.
Characterization range of the current high-throughput cross-scale method: (a) characterization range of WLI and AFM; (b,c) relative relationship between the microstructure dimension and horizontal resolution of WLI during high-throughput characterization.
In our previous research, the probable surface microstrain of heat-resistant steel produced during CIP processing was first reported [25]. Since a uniform fluid load is imposed on the specimen surface, relative significant microstrains can be detected in microregions with weaker micromechanical properties when plastic deformation or tearing occurs due to the differences in mechanical properties. For instance, a tearing phenomenon near the nonmetallic inclusions occurs when the fluid load is larger than a certain critical value due to the weak bonding interface and the elastic modulus difference between the matrix phase and the nonmetallic inclusions. Similar to the phenomenon observed in heat resistant steel [25], significant microstrains were also detected on the surfaces of typical metallic structural materials after CIP processing.
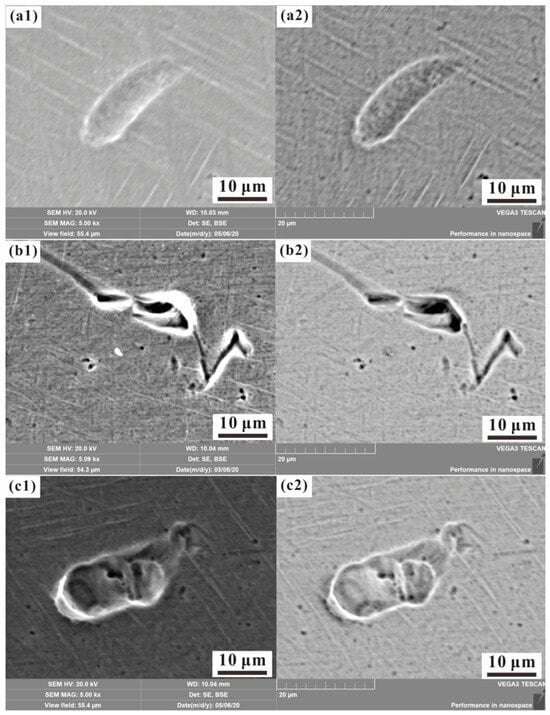
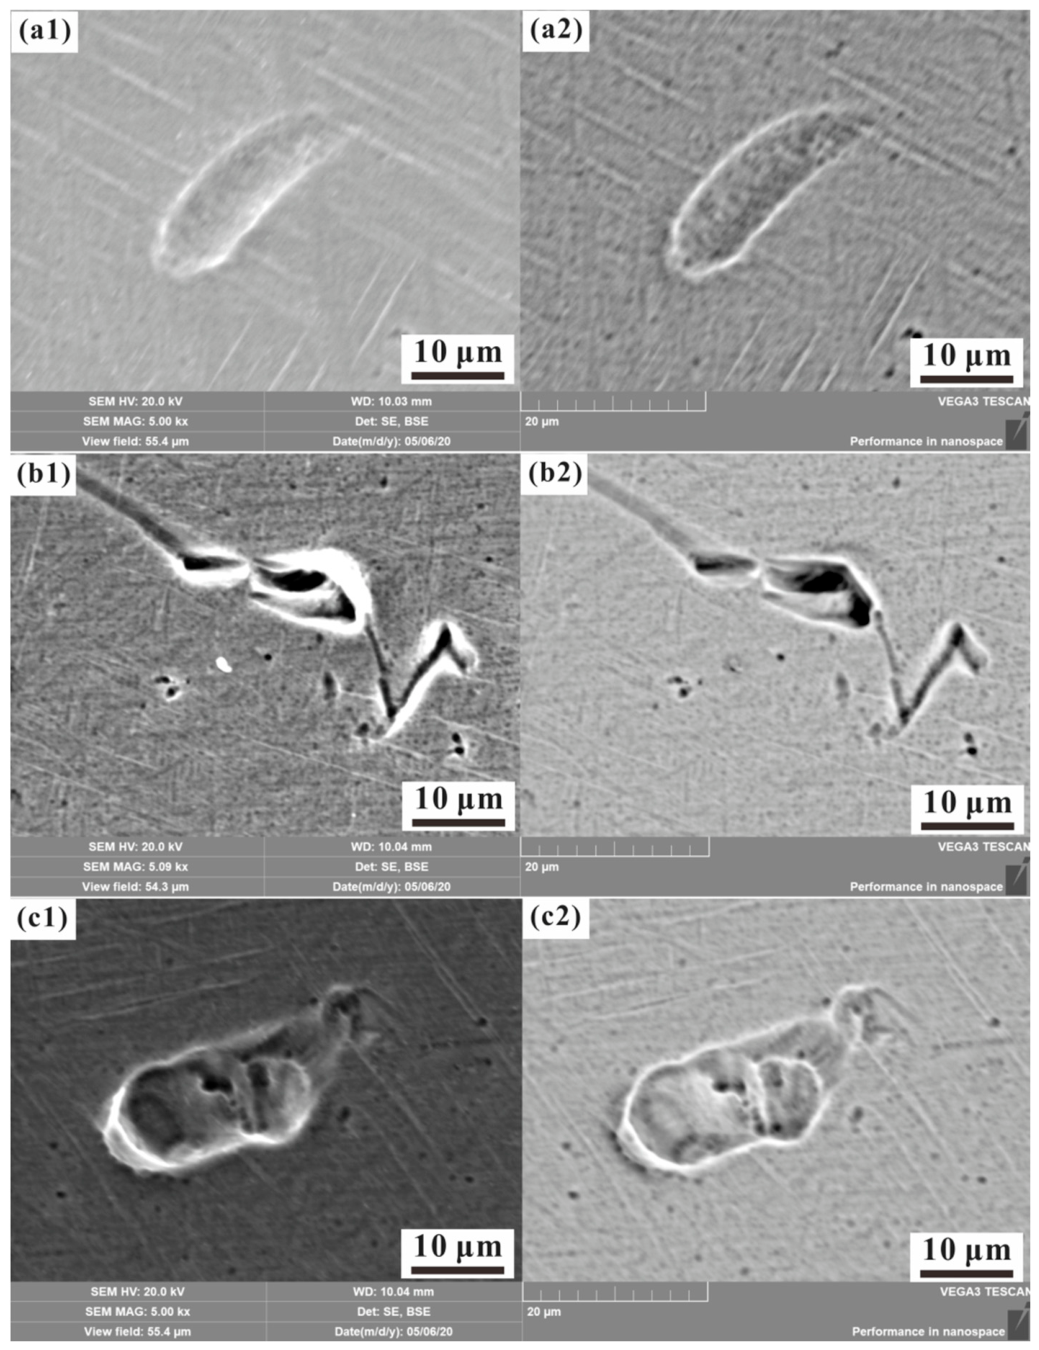
In this work, the general stress-induced strain tendency of different key metallic materials has been analyzed, and a general variation rule was summarized. As a demonstration material, the typical microstrain phenomenon of 3D-printed TC4 titanium alloy is shown in Figure 8. The TC4 titanium alloy is the most popular paradigm in the family of titanium alloys used in the aerospace, shipbuilding, chemical, and biochemical industries owing to the attractive combination of excellent strength and damage-tolerant properties, fatigue endurance, corrosion oxidation resistance, and non-toxic properties [26,27,28,29,30]. The microstructure of TC4 titanium alloy exhibits a classical category of α + β structure. As mentioned above, the surface of the specimen after mechanical grinding and polishing processes exhibits a nearly smooth surface pattern. Therefore, this polished surface can be considered as an ideal baseline surface for comparison in further study and analysis. It can be found that several different kinds of surface strain have been detected on the specimen surface, such as concave pits, tearing cracks, and tire-like indentations. The formation of these phenomena can be attributed to material damage and destruction during fluid loading. Similarly, such similar phenomena also occur during the service-failure process of materials. For example, the decohesion of nonmetallic inclusion interfaces and crack formation near particles are found in metallic materials such as 2124 alloy and HSLA (high-strength low-alloy) steel [31,32]. In addition, other phenomena, such as tongue patterns in cleavage facets [33], previously found in steels have also been detected in the surface deformation of the selected alloy in the present work. The underlying mechanism for the above phenomenon is as follows: during cold isostatic pressing (CIP), specimens are subjected to uniform hydrostatic compression. An appropriately selected CIP pressure ensures the entire bulk specimen remains within the macroscopic elastic deformation regime. However, inherent distributed local weak interfaces and defective microregions (including weak interfacial zones around inclusions, stress concentration zones, and microcrack damage zones) are prone to tearing and localized deformation under uniform extrusion. When observed via WLI or AFM apparatus, such rupture, tearing and deformation phenomena manifest as significant microstrain.
Figure 8.
Some typical microstrains in the specimen surface of 3D-printed TC4 titanium alloy observed after CIP processing: (a1,a2) tongue-shaped surface microstrain; (b1,b2) zigzag-shaped surface microstrain; and (c1,c2) extruded-depression surface microstrain. (Note: In the text, label 1 represents the SE mode and label 2 represents the BSE mode).
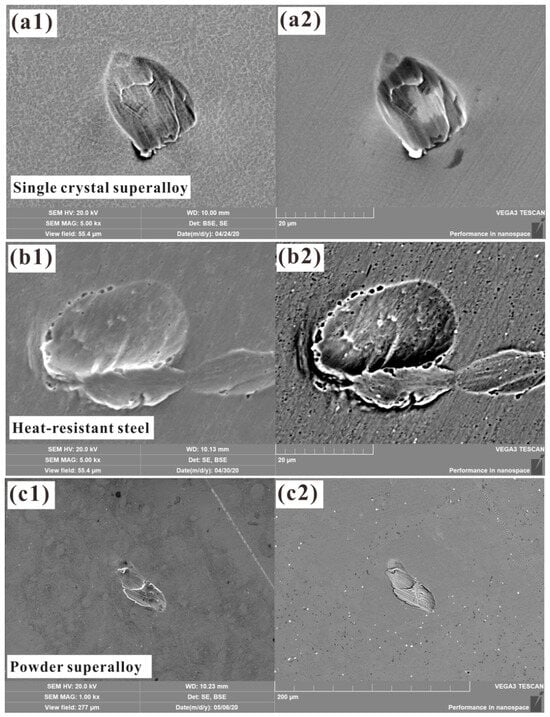
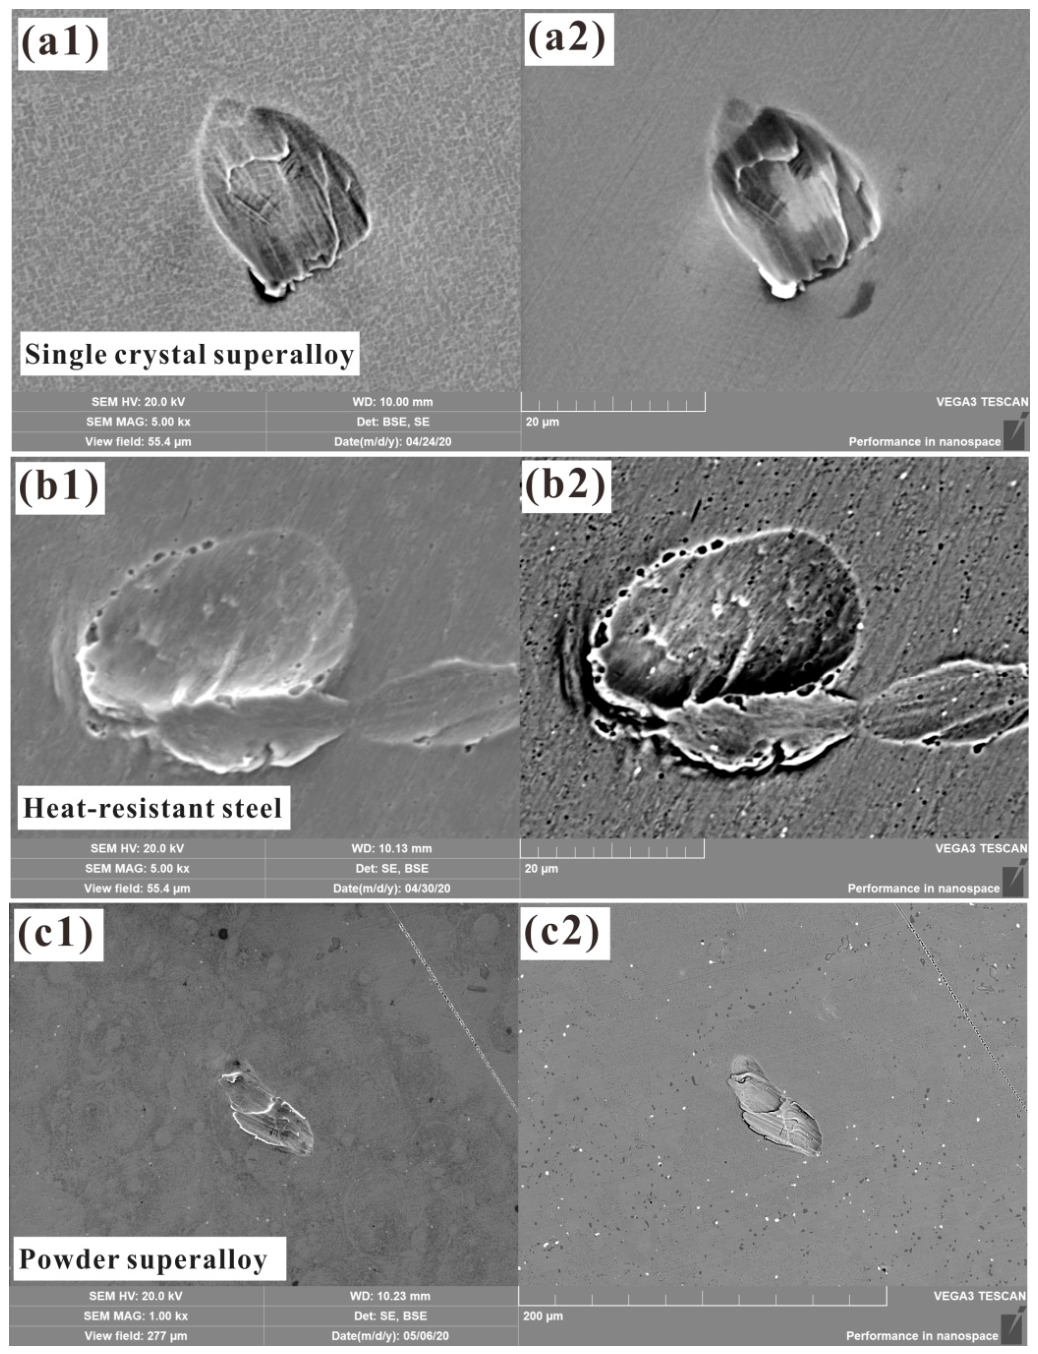
As mentioned above, two main categories of microstrain modes can be classified, namely slight microstrain (smoothing with roughness decreasing) and significant microstrain (roughening with roughness increasing) formed on specimen surface after CIP processing. For most of the surface areas, a smooth mechanical polished surface can be obtained with no obvious significant microstrain detected. This result indicates that elastic deformation might be the main category of strain mode in these areas because no inhomogeneous pattern of significant deformation is formed. Since linear elastic deformation and recovery can happen in these areas during loading and unloading based on Hookes’ law [34], there can be a preliminary judgement that the elastic deformation is the dominant deformation mode in these smooth surface areas. For the areas with significant microstrain, plastic deformation, ductile fracture, or even cleavage fracture are the main types of strain modes. During the service of materials, crack initiation and propagation will happen first in those areas with weaker micromechanical properties and significant microstrain and then lead to further failure of components. The surface microstrain shown in Figure 8 corresponds to the strain mode of significant microstrain. The surface strain effect produced by CIP is universal. The same effect has also been observed in other types of materials. For example, the test results of nickel-based single-crystal superalloys, heat-resistant steels, and powder superalloys are shown in Figure 9. It is shown that different degrees of strain occur on the surfaces of these materials.
Figure 9.
Surface microstrain of different materials: (a1,a2) nickel-based single-crystal superalloy; (b1,b2) heat resistant steel; and (c1,c2) powder superalloy. (Note: In the text, label 1 represents the SE mode and label 2 represents the BSE mode).
3.2. Surface Microstrain Statistical Analysis Before and After CIP Processing
Preliminary judgment of strain mode was evaluated by the combination of the surface profile information, typical strain field, and composition/microstructure characteristic analysis, and the surface microstrain was quantitatively analyzed. In order to evaluate the surface microstrain induced by the fluid load, the surface roughness of each specimen was statistically measured using Vision64 software. For each sample, rectangular microareas were selected across hundreds of typical microregions containing either significant or only slight microstrains. For each specimen, with and without filtering before CIP processing (100 microregions with smooth surface, typical region 1) and after CIP processing (100 microregions with smooth surface of slight microstrain, typical region 1; 100 microregions with significant microstrain, typical region 2), 600 microregions were selected and the roughness of these microregions was statistically measured. Therefore, 4800 microregions were statistical measured and analyzed for all eight specimens. The mean vertical roughness and mean root-mean-square (rms) vertical roughness are defined as Sa and Sq [35,36]:
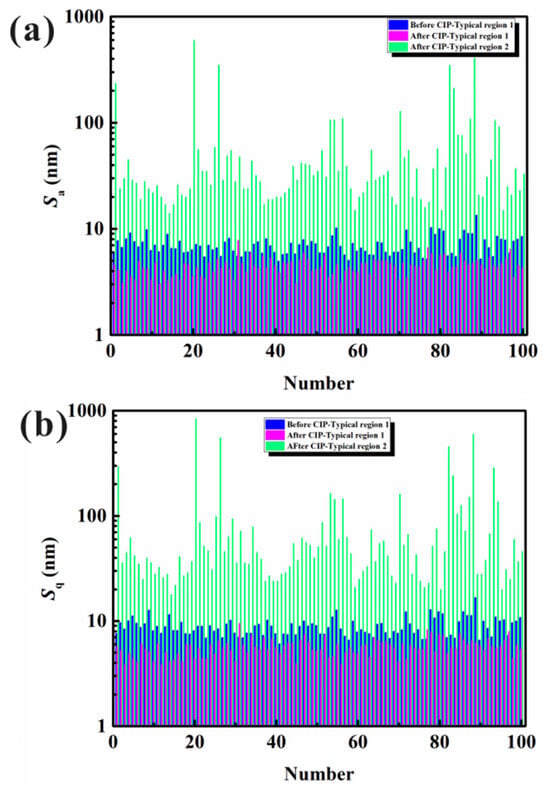
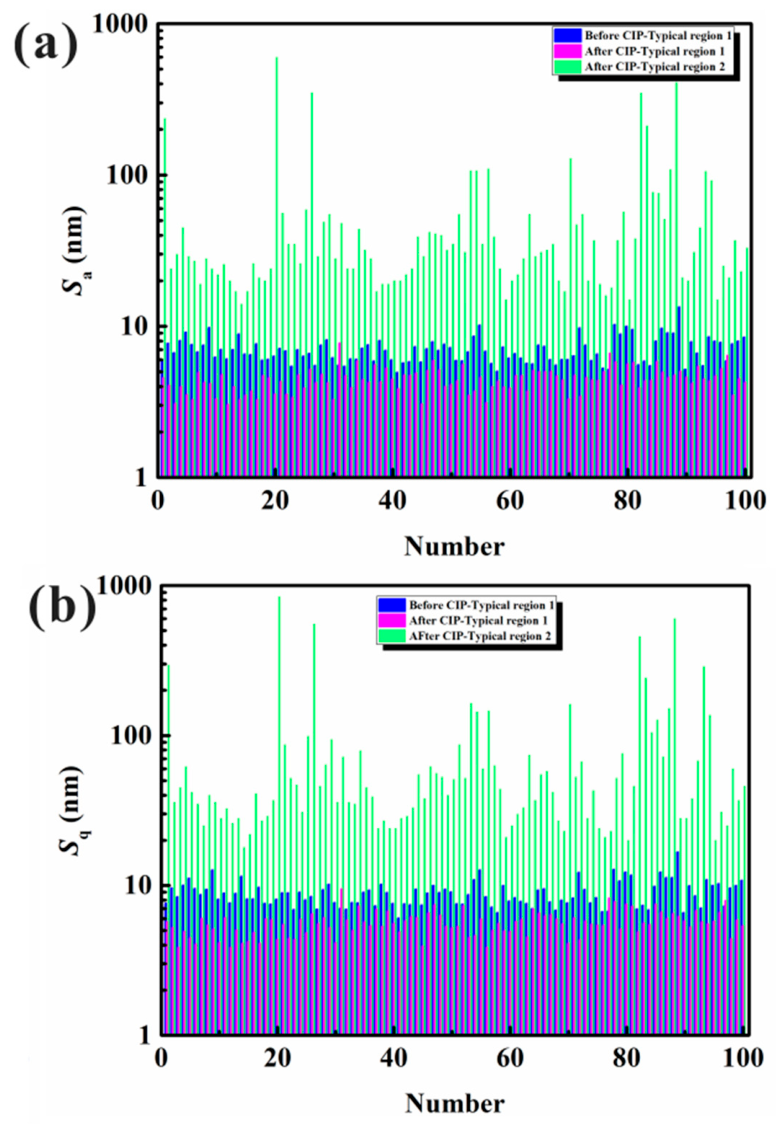
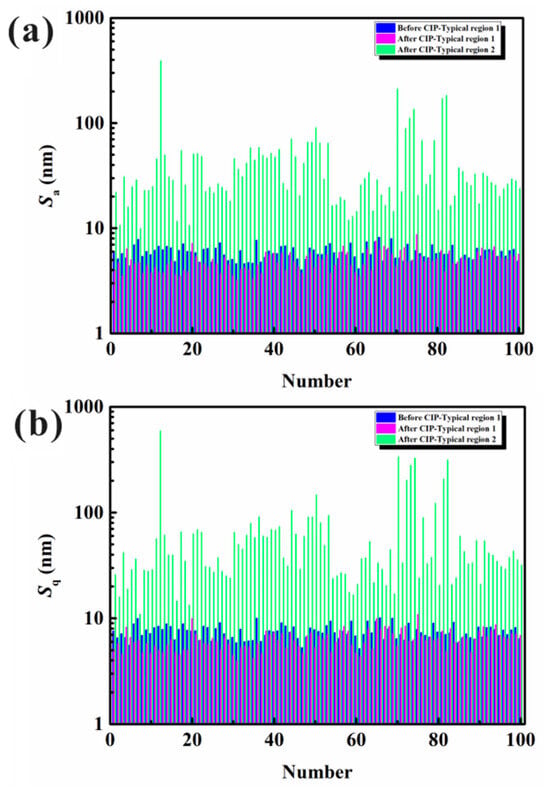
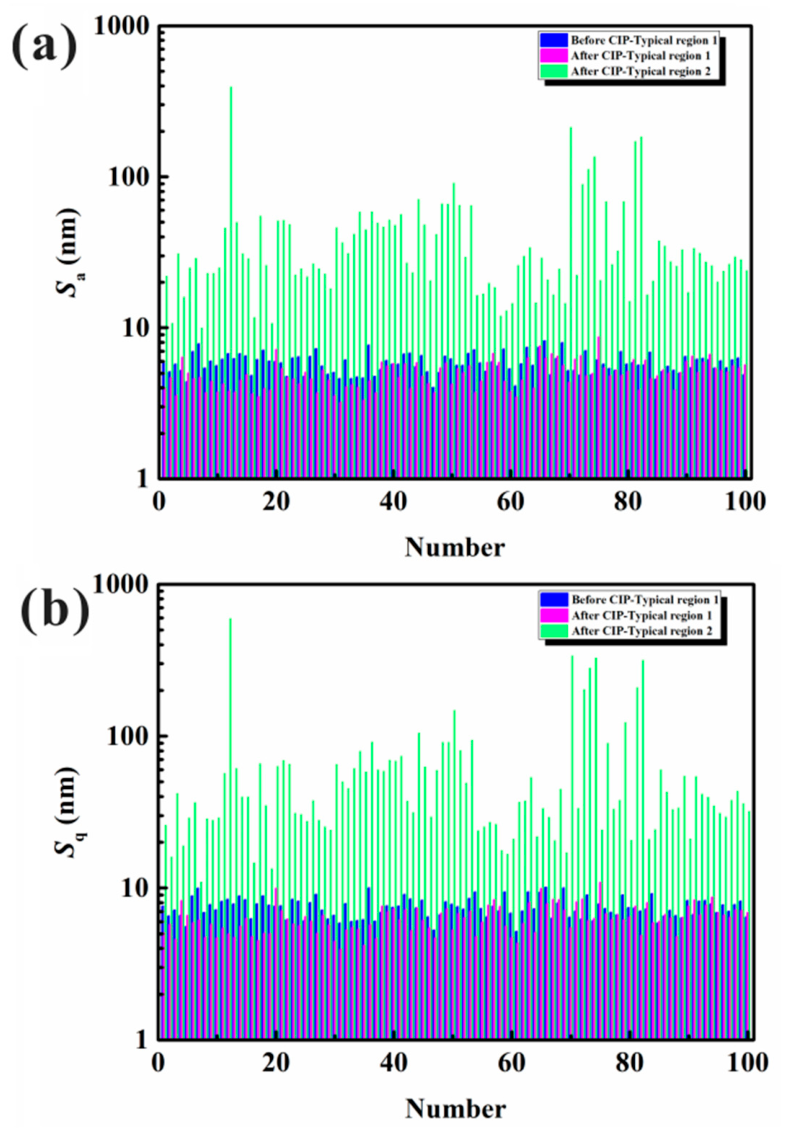
where Z(x, y) represents the height information function of the specimen surface. The surface profile variation range can be reflected by the roughness of the specimen surface obtained before and after CIP processing. Figure 10 exhibits the surface roughness of typical microregions with slight microstrain and significant microstrain of 3D-printed titanium alloy observed before and after CIP processing. The measurements and statistical results (original experimental result) of Sa and Sq are shown in Figure 10a,b without filtering. The relationships between blue columns, magenta columns, and green columns represent the surface roughness fluctuation of typical region 1 before CIP processing (blue columns, smooth surface without significant microstrain), typical region 1 after CIP processing (magenta columns, smooth surface without significant microstrain), and typical region 2 after CIP processing (green columns, rough surface with significant microstrain).
Figure 10.
Statistical surface roughness of typical selected rectangle areas before CIP processing and after CIP processing without filtering process: (a) Sa roughness; (b) Sq roughness.
As mentioned above, the roughness of specimens obtained before CIP processing can be considered as a basic value for further comparison of roughness variation induced by surface microstrain caused by the fluid load effect. Then the surface profile variation can be compared with this basic value obtained before CIP processing. If the roughness values of the measured areas obtained before and after CIP processing are close, small, and of the same order of magnitude, the surface microstrain mode can be considered to be slight microstrain. Otherwise, the microstrain mode can be considered to be significant microstrain when the roughness of the tested regions after CIP processing is far higher than the basic value obtained before CIP processing. It can be clearly seen that the surface roughness exhibits a roughening process in areas with significant microstrain, but a smoothing process at the areas with slight microstrain after CIP processing. The statistical results show that all the specimens follow the same surface variation rule in terms of surface roughness: a certain number of areas exhibit the increased roughness with significant microstrain, such as concave pits, tearing cracks, and tire-like indentations, but most of the areas exhibit decreased roughness with slight microstrain (smooth plane surface).
However, herein it is worth noting that the influence of a specimen’s macroscopic shape on its roughness measurement is included during the comparison of surface roughness variation without any filtering process, although the selected region is small enough and the influence of macroscopic shape can be neglected to a great extent. This will lead to some marginal deviation in statistical results from the ideal condition, since the effect of fluid load on the inhomogeneous material with roughness variation should be evaluated by excluding the influence of specimen macroscopic shape variation on the roughness of the whole. Therefore, although the surface roughness shown in Figure 10 is influenced by the surface specimen shape, this kind of influence can be neglected because each measured area is small enough (rectangle with side length of ~mm) and can be considered to be nearly planar.
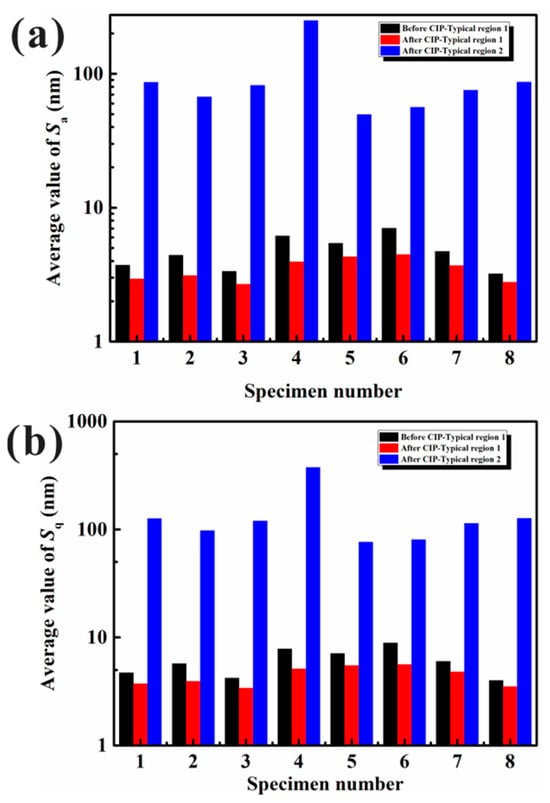
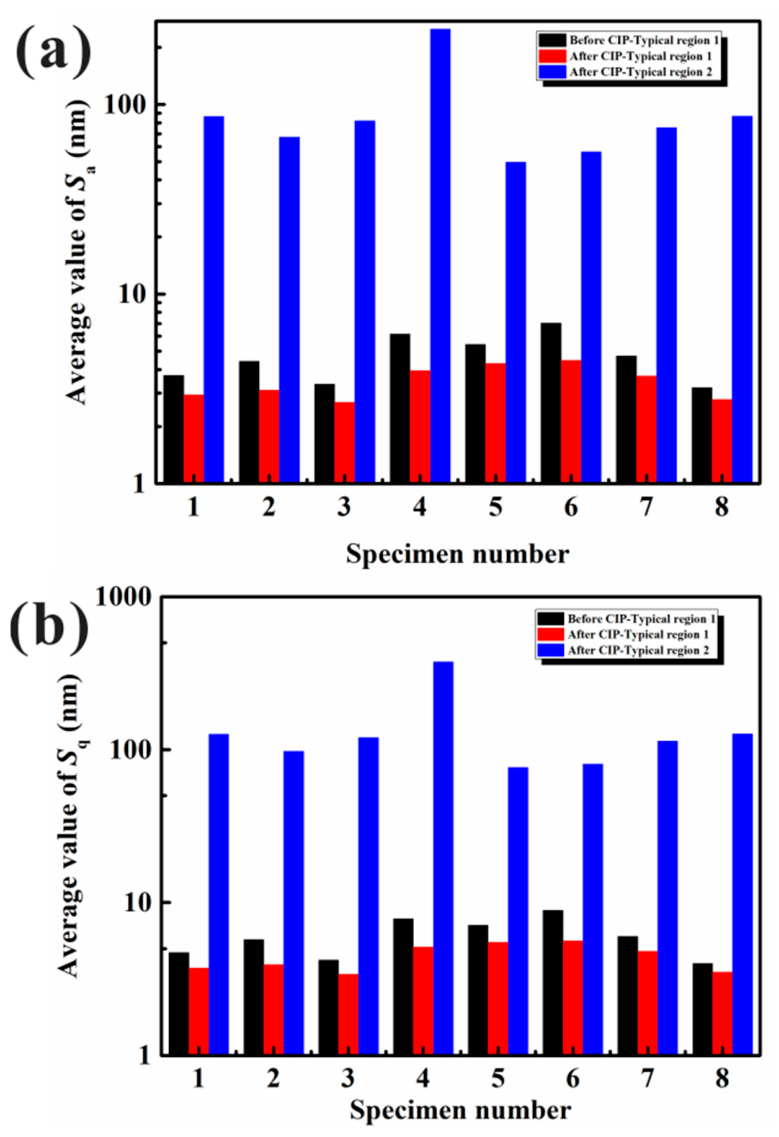
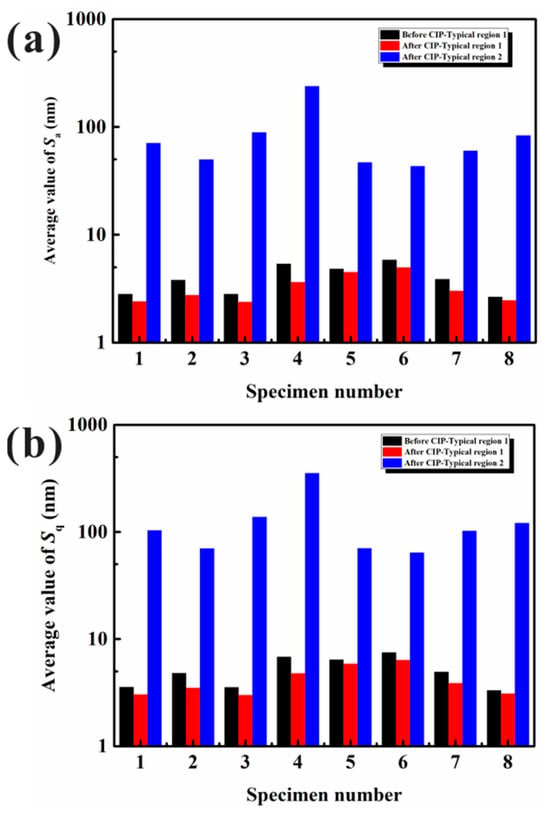
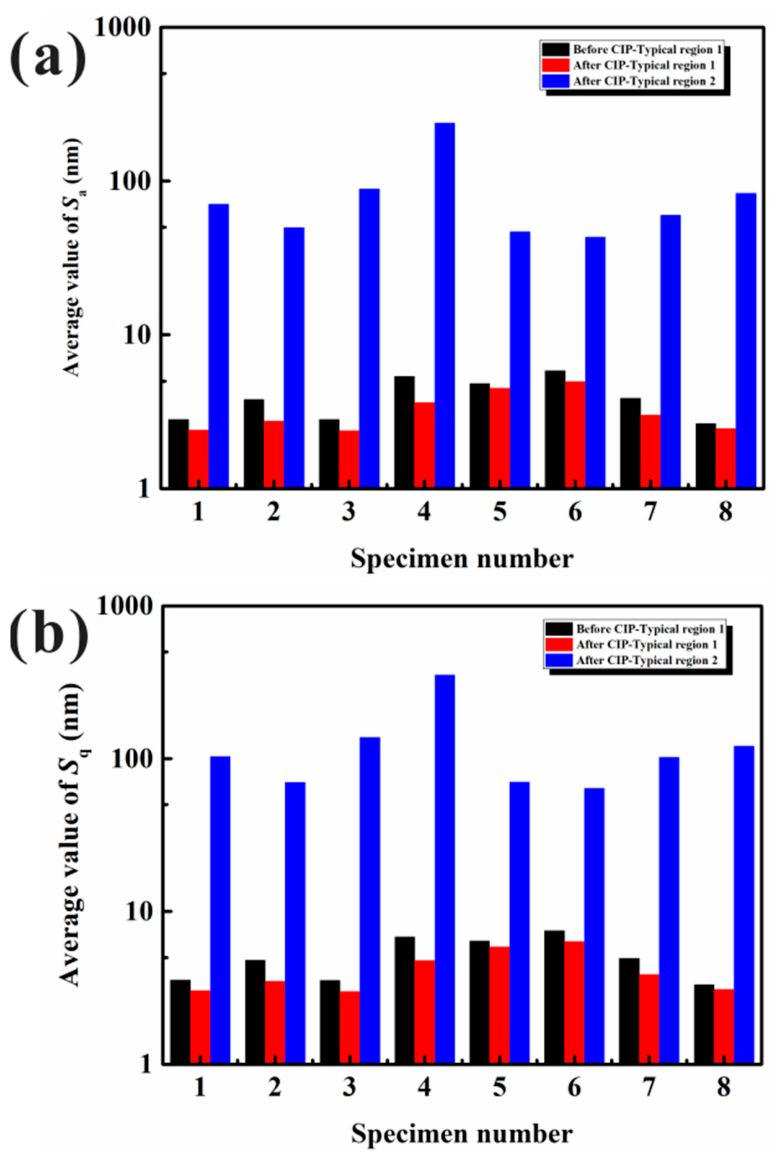
To further clarify and quantitatively analyze surface microstrain, the original surface shape profiles (surface profiles considered in Figure 10) were filtered, with the macroscopic profiles filtered out and local micron-scale height information retained. Figure 11 exhibits the surface roughness variation of the corresponding typical microareas measured before and after CIP processing (after filtering). The results also exhibit the typical microstrain variation, including roughening processing (significant microstrain) and smoothing processing (smooth surface without obvious microstrain; slight microstrain). The average surface roughness values (typical region 1 before CIP processing; typical region 1 after CIP processing; typical region 2 after CIP processing) of all the metallic specimens (specimen 1–8) before and after CIP processing were statistically analyzed for unfiltered original surface profiles, as shown in Figure 12. The black columns represent the average surface roughness of typical region 1 for each specimen before CIP processing (100 typical region 1 areas per specimen), the red columns represent the average surface roughness of typical region 1 for each specimen after CIP processing (100 typical region 1 areas per specimen), and the blue columns represent the average surface roughness of typical region 2 of each specimen after CIP processing (100 typical region 2 areas per specimen). Similarly, the average surface roughness of all the specimens before and after CIP processing for filtered process (only the local microstrain information is retained) was statistically analyzed, as shown in Figure 13. The black, red, and blue columns represent the same meaning as defined in Figure 13. Moreover, Figure 12 and Figure 13 exhibit the same surface roughness variation trend of typical regions after the fluid loading by CIP processing, which indicates that the sizes of the selected regions are suitable. In detail, the roughness of most areas decreased, with almost no obvious microstrain detected in these areas (black columns→red columns) but the roughness increased in some areas with significant microstrain and weak micromechanical properties (black columns→blue columns). Based on statistical analysis of a total of 4800 micro-regions across eight specimens before and after CIP processing, the average value of surface roughness Sa (Sq) is 4.8 nm (6.1 nm) for the specimens before CIP processing, 3.5 nm (4.5 nm) for the slight microstrain region after CIP processing, and 94.4 nm (139.7 nm) for the significant microstrain after CIP processing.
Figure 11.
Statistical surface roughness of typical selected rectangle areas before CIP processing and after CIP processing after the filtering process: (a) Sa roughness; (b) Sq roughness.
Figure 12.
Statistical results comparison of surface roughness before CIP processing and after CIP processing for all the selected key metallic materials (original surface profiles without filtering process): (a) average value of Sa, and (b) average value of Sq.
Figure 13.
Statistical results comparison of surface roughness before CIP processing and after CIP processing for all the selected metallic materials after a filtering process: (a) average value of Sa, and (b) average value of Sq.
As reported by Wang et al. [12], all macroscopic materials are heterogeneous, multi-elementary, and complex. Therefore, compositions, microstructures, and defects of specimens are intrinsically inhomogeneous and can lead to inhomogeneous micromechanical properties, based on the combination of evaluation criteria such as the classical paradigm of strength evaluation criteria “smaller is stronger” of material with different grain size (Hall-Petch relationship) [12,13,37,38]. For example, component damage or even service failure can occur when crack initiation and propagation originate near nonmetallic inclusions, voids, pits, or weak interfaces [39,40,41]. According to the experimental results obtained in our previous work, and the previous theoretical investigations and experimental explorations of damage, fracture, and failure induced by nonmetallic inclusions, brittle phases, weak interfaces, voids, and localized shear instabilities reported by other scholars [42,43,44,45,46,47], it can be summarized that all test samples follow the same simple rule: areas with weak micromechanical properties can be screened in a high-throughput manner using the surface roughness information induced by CIP fluid loading.
In the future, the proposed method would have favorable industrial application potential in the quality control of structural materials, mainly covering the following three aspects: (1) Failure analysis of key components: For load-bearing metallic components in aerospace, energy and other fields, this method can rapidly locate inherent weak sites such as subsurface defects and weak interfaces that induce component failure, providing direct morphological evidence for root cause analysis of failure events and significantly improving diagnosis efficiency compared with traditional point-by-point testing. (2) Batch quality evaluation of metallic materials: It enables high-throughput mechanical uniformity screening for batch-produced materials (e.g., additively manufactured alloys and powder metallurgy products). It can serve as a rapid quality inspection procedure in industrial production to evaluate process stability and screen out batches with excessive mechanical heterogeneity, effectively reducing the cost and time associated with conventional mechanical property testing. (3) Correlation between micro-uniformity and macroscopic mechanical performance: The method can efficiently acquire full-field surface microstrain distribution data, supporting the establishment of a quantitative correlation between micromechanical homogeneity and macroscopic properties (fatigue strength, fracture toughness, etc.). It provides data support for the process optimization of structural materials and service life prediction for engineering components. For future work, further studies will be conducted to extend this method to subsurface performance characterization and validate its reliability in material systems, promoting its practical industrial application.
4. Conclusions
In this work, a new application strategy for high-throughput characterization of mechanical homogeneity and mechanically weak areas is proposed using the CIP-induced surface microstrain effect and surface profile analysis. Eight key metallic materials, including steels (heat resistant steel, bridge steel, and standard-hardness blocks), titanium alloys (Ti-6Al-4V alloy (TC4), as-cast state/3D-printed state), and superalloys (single-crystal superalloy, powder superalloy in as-cast state/forged state), were selected and processed via the CIP technique to explore the effect of CIP on specimen surface microstrain and the potential application of CIP-induced surface microstrain characterization for high-throughput evaluation of micromechanical properties and damage characteristics. The compositions, microstructures, surface profile information, and typical strain fields were characterized. The surface roughness of all specimens before and after CIP processing was statistically analyzed. The main conclusions are as follows:
- (1)
- Metallographically polished metallic samples were subjected to CIP at 190 MPa with a 30 min holding time, achieving uniform hydrostatic loading across all sample surfaces. Obvious surface microstrains can be detected and characterized in a high-throughput, trans-scale (nm-μm-mm-cm) manner for all specimen surfaces after CIP processing using white-light interferometric profilometers and atomic force microscopes.
- (2)
- Two categories of typical microstrains can be classified after CIP processing, including slight microstrain corresponding to smooth-surface microregions and significant microstrain corresponding to rough-surface microregions.
- (3)
- Statistical analysis results of all specimens show that surface roughness decreased for the slight microstrain mode, but surface roughness significantly increased for the significant microstrain mode after CIP processing. Based on statistical analysis of a total of 4800 micro-regions across eight specimens before and after CIP, the average value of surface roughness Sa (Sq) is 4.8 nm (6.1 nm) for the pre-CIP specimens, 3.5 nm (4.5 nm) for the slight microstrain regions after CIP, and 94.4 nm (139.7 nm) for the significant microstrain regions after CIP processing.
- (4)
- Significant microstrain corresponds to the microregions with relative weak micromechanical properties. These microregions with weak micromechanical properties, as well as the material damage evolution/characteristics, can be characterized in a high-throughput, trans-scale (nm-μm-mm-cm) manner using this new method in future work.
Author Contributions
Conceptualization, Q.R.; methodology, Q.R., Y.W., X.Y., Y.H. and H.W.; software, Q.R. and Y.W.; validation, Q.R.; formal analysis, Y.W. and X.Y.; investigation, Q.R., Y.W. and Y.H.; writing—original draft preparation, Q.R.; writing—review and editing, X.Y. and H.W.; supervision, X.Y.; funding acquisition, Q.R. All authors have read and agreed to the published version of the manuscript.
Funding
Thanks are given to the Youth Project of the Sanqin Talents Introduction Program in Shaanxi Province (Z20250487), National Natural Science Foundation of China (52002077).
Data Availability Statement
The data presented in this study are available on request from the corresponding author.
Conflicts of Interest
Author Haizhou Wang is currently employed by Central Iron & Steel Research Institute. Author Qun Ren was employed by Central Iron & Steel Research Institute during part of the study period, and is currently affiliated with Xi’an University of Architecture and Technology. The remaining authors declare that the research was conducted in the absence of any commercial or financial relationships that could be construed as a potential conflict of interest.
References
- Assias, S.L.G.; Kotik, H.G.; Ipiña, J.E.P. Splits in metallic materials: A critical review. Eng. Fail. Anal. 2025, 179, 109747. [Google Scholar] [CrossRef] [Scilit]
- Wang, K.; Yang, H.Q.; Liu, X.F.; Yan, D.D.; Shan, Z.D.; Guo, Z.; Zhang, C.B.; Jang, K.H.; Zou, W.B.; Kong, X.H.; et al. Research progress on directional solidification process of single-crystal turbine blades made of nickel-based superalloys for aero-engines. J. Alloys Compd. 2026, 1066, 188232. [Google Scholar]
- Bhardwaj, A.R.; Purohit, R. Aluminum alloys in sustainable manufacturing: A review. Sustain. Mater. Technol. 2026, 48, 02028. [Google Scholar] [CrossRef] [Scilit]
- Yuan, X.Y.; Zhao, J.B.; Zhao, Y.S.; Long, H.B.; Liu, Y.N.; Mao, S.C.; Wang, L.H.; Zhang, Z.; Han, X.D. Improving creep resistance of a Ni-based single crystal superalloy by interfacial strengthening via heat treatment. Acta Mater. 2026, 304, 121800. [Google Scholar]
- Zhao, Y.P.; Zhao, X.B.; Qi, X.; Cheng, Y.; Zou, J.W.; Wang, Y.; Qu, X.L.; Yu, Q.; Zhang, Z. The origin of the straight propagation of the σ phase in a Ni-based single crystal superalloy at elevated temperature. Acta Mater. 2024, 275, 120056. [Google Scholar] [CrossRef] [Scilit]
- Cottura, M.; Appolaire, B.; Finel, A.; Le Bouar, Y. Microstructure evolution during shear creep loading in Ni-base superalloys. Acta Mater. 2026, 313, 122274. [Google Scholar] [CrossRef] [Scilit]
- Mostafaei, A.; Ghiaasiaan, R.; Zhang, Y.H.; Miner, J.P.; Faegh, M.; Omoodara, O.; Haghighi, A.; Wolff, S.; Narra, S.P.; Sun, T.; et al. Additive manufacturing of titanium alloys: A comprehensive review on “process-structure-defect-property” relationship. Prog. Mater. Sci. 2027, 163, 101752. [Google Scholar]
- Wang, X.; Cheng, L.J.; Zhou, C.X.; Cui, L.; Liaw, P.K. The friction and wear as well as corrosion resistance properties of bearing steel with multi-interface structural coatings: A review. Mater. Today Commun. 2026, 50, 114570. [Google Scholar]
- Pineau, A.G.; Benzerga, A.A.; Pardoen, T. Failure of metals I: Brittle and ductile fracture. Acta Mater. 2016, 107, 424–483. [Google Scholar] [CrossRef] [Scilit]
- Kwon, S.J.; Seo, J.W.; Jun, H.K.; Lee, D.H. Damage evaluation regarding to contact zones of high-speed train wheel subjected to thermal fatigue. Eng. Fail. Anal. 2015, 55, 327–342. [Google Scholar] [CrossRef] [Scilit]
- Bhaumik, S.K.; Rangaraju, R.; Venkataswamy, M.A.; Bhaskaran, T.A.; Parameswara, M.A. Fatigue fracture of crankshaft of an aircraft engine. Eng. Fail. Anal. 2002, 9, 255–263. [Google Scholar] [CrossRef] [Scilit]
- Wang, H.Z.; Zhao, L.; Jia, Y.H.; Li, D.L.; Yang, L.X.; Lu, Y.H.; Feng, G.; Wan, W.H. State-of-the-art review of high-throughput statistical spatial-mapping characterization technology and its applications. Engineering 2020, 6, 621–636. [Google Scholar]
- Feng, G.; Qin, H.L.; Jia, Y.H.; Zhao, L.; Zhao, L.; Zou, Y.M.; Wang, S.B.; Wang, H.Z. Contour map of nano-mechanical-properties using isostatic pressing. Scr. Mater. 2017, 137, 69–72. [Google Scholar]
- Adams, D.F.; Whitney, T.J. Test methods for mechanical properties. Compr. Compos. Mater. II 2018, 7, 4–37. [Google Scholar] [CrossRef] [Scilit]
- Zhang, X.K.; Xiang, Y. Combinatorial approaches for high-throughput characterization of mechanical properties. J. Mater. 2017, 3, 209–220. [Google Scholar] [CrossRef] [Scilit]
- Pantano, M.F.; Espinosa, H.D.; Pagnotta, L. Mechanical characterization of materials at small length scales. J. Mech. Sci. Technol. 2012, 26, 545–561. [Google Scholar] [CrossRef] [Scilit]
- Moradkhani, A.; Panahizadeh, V.; Hoseinpour, M. Indentation fracture resistance of brittle materials using irregular cracks: A review. Heliyon 2023, 9, 19361. [Google Scholar] [CrossRef] [Scilit]
- Li, X.Z.; Wang, M.H.; Xu, L.; Xu, T.L.; Wu, W.Z.; Pan, S.C.; Wang, C.G.; Zhang, W.X.; Cui, X.B. Progression in indentation test for material characterization: A systematic review. Results Surf. Interfaces 2024, 17, 100358. [Google Scholar] [CrossRef] [Scilit]
- Turner, C.D.; Ashby, M.F.A. The cold isostatic pressing of composite powders-I. Experimental investigations using model powders. Acta Mater. 1996, 44, 4521–4530. [Google Scholar]
- Liu, J.H.; Shi, Y.S.; Lu, Z.L.; Huang, S.H. Manufacturing near dense metal parts via indirect selective laser sintering combined with isostatic pressing. Appl. Phys. A 2007, 89, 743–748. [Google Scholar] [CrossRef] [Scilit]
- Wei, Q.S.; Du, Y.Y.; Qu, B.B.; Shi, Y.S. Densification of porous stainless-steel SLS components during cold isostatic pressing. J. Eng. Mater. Technol. 2010, 132, 011015. [Google Scholar]
- Dai, R.; Xie, T.B.; Change, S.P. Scanning white-light interferometric profilometer for smooth and rough surface. K. Eng. Mater. 2008, 364–366, 364–370. [Google Scholar]
- Curtin, A.E.; Skinner, R.; Sanders, A.W. A simple metric for determining resolution in optical, ion, and electron microscope images. Microsc. Microanal. 2015, 21, 771–777. [Google Scholar] [CrossRef] [Scilit] [PubMed]
- Binnig, G.; Quate, C.F.; Gerber, C.G. Atomic force microscope. Phys. Rev. Lett. 1986, 56, 930–933. [Google Scholar] [CrossRef] [Scilit] [PubMed]
- Wang, H.Z.; Ren, Q.; Zhao, L.; Shen, X.J.; Wang, H.; Li, D.L.; Wan, W.H.; Yu, X. High Throughput Statistical Characterization Method of Metal Micromechanical Properties. Chinese Patent CN 112665931 B, 18 April 2023. [Google Scholar]
- Liu, S.Y.; Shin, Y. Additive manufacturing of Ti6Al4V alloy: A review. Mater. Des. 2019, 164, 107552. [Google Scholar]
- Kaur, M.; Singh, K. Review on titanium and titanium based alloys as biomaterials for orthopaedic applications. Mater. Sci. Eng. C 2019, 102, 844–862. [Google Scholar] [CrossRef] [Scilit]
- Boyer, R.R. An overview on the use of titanium in the aerospace industry. Mater. Sci. Eng. A 1996, 213, 103–114. [Google Scholar] [CrossRef] [Scilit]
- Gorynin, I.V. Titanium alloys for marine application. Mater. Sci. Eng. A 1999, 263, 112–116. [Google Scholar] [CrossRef] [Scilit]
- Singh, G.; Ramamurty, U. Boron modified titanium alloys. Prog. Mater. Sci. 2020, 111, 100653. [Google Scholar] [CrossRef] [Scilit]
- Laurent, B.; Brechet, Y.; Maire, É.; Fougeres, R. On the competition between particle fracture and particle decohesion in metal matrix composites. Acta Mater. 2004, 52, 4517–4525. [Google Scholar] [CrossRef] [Scilit]
- Achouri, M.; Germain, G.; Dal, S.P.; Saidane, D. Experimental characterization and numerical modeling of micromechanical damage under different stress states. Mater. Des. 2013, 50, 207–222. [Google Scholar] [CrossRef] [Scilit]
- Demidova, Y.V.; Larionov, V.P. Fractographic analysis of the character of fracture of steel 10G2S1 welds subjected to low-temperature fatigue. Strength Mater. 1979, 11, 999–1002. [Google Scholar] [CrossRef] [Scilit]
- Rychlewski, J. On Hooke’s law. J. Appl. Math. Mech. 1984, 48, 303–314. [Google Scholar] [CrossRef] [Scilit]
- Olayinka, A.; Embolm, W.J.; Wagner, S.W.; Khonsari, M.; Haghshenas, A. Investigation of deformation induced micro to macro scale surface roughness. Procedia Manuf. 2020, 48, 237–243. [Google Scholar] [CrossRef] [Scilit]
- Croll, S.G. Surface roughness profile and its effect on coating adhesion and corrosion protection: A review. Prog. Org. Coat. 2020, 148, 105847. [Google Scholar] [CrossRef] [Scilit]
- Oliete, P.; Peña, J.I.; Larrea, Á.; Orera, V.M.; LLorca, J.; Pastor, J.Y.; Martin, A.; Segurado, J. Ultra-high-strength nanofibrillar Al2O3-YAG-YSZ eutectics. Adv. Mater. 2007, 19, 2313–2318. [Google Scholar] [CrossRef] [Scilit]
- Yip, S. Nanocrystals: The strongest size. Nature 1998, 391, 532–533. [Google Scholar]
- Wei, D.Q.; Dong, X.; Li, S.Q. Failure analysis of stress corrosion crack of 1Cr18Ni9 stainless steel cylinder body. Adv. Mater. Res. 2012, 591–593, 1094–1097. [Google Scholar] [CrossRef] [Scilit]
- Zhao, P.J.; Chen, Z.H.; Dong, C.F. Failure analysis based on microvoids damage model for DP600 steel on in-situ tensile tests. Eng. Fract. Mech. 2016, 154, 152–168. [Google Scholar] [CrossRef] [Scilit]
- Li, X.B.; Yang, Y.; Yu, Y.S.; Zu, G.Y. Deformation behavior and crack propagation on interface of Al/Cu laminated composites in uniaxial tensile test. Rare Met. 2020, 39, 296–303. [Google Scholar]
- Berveiller, M.; Zaoui, A. An extension of the self-consistent scheme to plastically-flowing polycrystals. J. Mech. Phys. Solids 1978, 26, 325–344. [Google Scholar] [CrossRef] [Scilit]
- Johnson, G.; Hoegfeldt, J.M.; Lindholm, U.S.; Nagy, A. Response of various metals to large torsional strains over a large range of strain rates-part 1: Ductile metals. J. Eng. Mater. Technol. 1983, 105, 42–47. [Google Scholar]
- Kondori, B.; Benzerg, A. Fracture strains, damage mechanisms and anisotropy in a magnesium alloy across a range of stress triaxialities. Exp. Mech. 2014, 54, 493–499. [Google Scholar]
- Joly, P.; Cozar, R.; Pineau, A.G. Effect of crystallographic orientation of austenite on the formation of cleavage cracks in ferrite in an aged duplex stainless steel. Scr. Mater. 1990, 24, 2235–2240. [Google Scholar] [CrossRef] [Scilit]
- Rice, J.R.; Tracey, D.M. On the ductile enlargement of voids in triaxial stress fields. J. Mech. Phys. Solids 1969, 17, 201–217. [Google Scholar] [CrossRef] [Scilit]
- Koval, A.Y.; Vasilev, A.D.; Firstov, S.A. Fracture toughness of molybdenum sheet under brittle-ductile transition. Int. J. Refract. Met. Hard Mater. 1997, 15, 223–226. [Google Scholar] [CrossRef] [Scilit]

Disclaimer/Publisher’s Note: The statements, opinions and data contained in all publications are solely those of the individual author(s) and contributor(s) and not of MDPI and/or the editor(s). MDPI and/or the editor(s) disclaim responsibility for any injury to people or property resulting from any ideas, methods, instructions or products referred to in the content. |
© 2026 by the authors. Licensee MDPI, Basel, Switzerland. This article is an open access article distributed under the terms and conditions of the Creative Commons Attribution (CC BY) license.