Article

Tailoring the Microstructure and Enhancing the Properties of Degradable Mg-Y-Zn Alloy with Various Y Contents


1
School of Materials Science and Engineering, Tianjin University of Technology, Tianjin 300384, China
2
China Nonferrous Metals Innovation Institute (Tianjin) Co., Ltd., Tianjin 300393, China
3
National Demonstration Center for Experimental Function Materials Education, Tianjin 300384, China
*
Authors to whom correspondence should be addressed.
Metals 2026, 16(7), 747; https://doi.org/10.3390/met16070747
Submission received: 2 June 2026 / Revised: 26 June 2026 / Accepted: 3 July 2026 / Published: 7 July 2026

Abstract

In this study, the microstructure, mechanical properties, and corrosion behavior of extruded Mg-Y-0.5Zn alloys with varying Y contents (0.5~3.0 wt%) were systematically investigated. The results demonstrate that by increasing the Y content from 0.5% to 3.0%, the grain sizes of four alloys are 11.27 μm, 11.90 μm, 15.26 μm, and 13.65 μm. The secondary phases of all four alloys consist of granular Mg24Y5 and fine Mg12YZn, and the total volume fraction of these precipitates increased. Correspondingly, both microhardness and strength are enhanced, while ductility decreases. The microhardness increases from 57.1 HV to 61.7 HV, the tensile yield strength (TYS) improves from 103.8 MPa to 155.4 MPa, and the ultimate tensile strength (UTS) rises from 211.4 MPa to 235.9 MPa. Regarding corrosion performance, the extruded Mg-1Y-0.5Zn alloy exhibits the best corrosion resistance based on both in vitro immersion tests and electrochemical measurements. A uniform and dense corrosion product layer is observed on the surface of Mg-1Y-0.5Zn alloy, leading to the lowest corrosion rate of 0.36 mm/y, while loose and micro-cracked corrosion product layers are formed on other alloys. In addition, cytotoxicity test shows that the relative cell proliferation rates of the four extruded alloys were 121.41%, 123.7%, 117.96%, and 112.86%, indicating good biocompatibility.

1. Introduction

Magnesium (Mg) alloys offer several advantages, including close density with natural bone, high specific strength, good biocompatibility, and natural degradability in physiological environments [1,2,3,4]. These properties have positioned Mg alloys as candidate materials for biodegradable biomedical implants. Despite these benefits, the clinical application of biomedical Mg alloys faces two primary challenges. First, the corrosion rate of Mg in physiological environments is excessively high, which can lead to premature loss of mechanical integrity before complete tissue healing [5,6,7]. Second, localized corrosion often results in the accumulation of hydrogen bubbles and sudden structural failure, thereby compromising implant safety [8]. Consequently, achieving sufficient mechanical properties along with a controllable and uniform degradation rate has become the primary goal for biomedical Mg alloys [7,9,10].
Mg-Zn-based alloys have garnered considerable attention in the biomedical field due to the essential nutrient nature of their constituent elements [11,12]. Specifically, the Mg-Zn binary alloy exhibits favorable solid solution and precipitate strengthening effects [13,14]. Nevertheless, the mechanical properties and corrosion resistance of binary Mg-Zn alloys remain insufficient to meet the requirements for load-bearing biomedical applications [15,16,17]. The introduction of yttrium (Y) has been shown to significantly enhance the performance of Mg-Zn alloys through the formation of various intermetallic compounds [18,19]. Depending on the Zn/Y ratio and processing conditions, different types of secondary phases can form, such as MgxZny, Mg24Y5, the icosahedral phase (I-phase, Mg3Zn6Y), the cubic W-phase (Mg3Zn3Y2), or long-period stacking ordered (LPSO) phases [20,21,22]. As each phase exhibits distinct electrochemical potential and morphological characteristics, they profoundly influence mechanical strengthening and corrosion behavior [23,24].
Our previous research on as-cast Mg-Y-0.5Zn alloys indicated that a Y content of 2% yielded the best corrosion resistance and adequate mechanical properties [25]. However, the overall mechanical properties of as-cast alloys are generally poor, making them unsuitable for load-bearing repair applications. Therefore, increasing research efforts have focused on wrought Mg alloys [26,27,28]. After deformation, the grain size, secondary phases, and even the texture of the alloy may change, which, in turn, affects both mechanical and corrosion performance [29].
Against this background, the present study aims to systematically investigate the effects of varying yttrium content on the microstructure, mechanical properties, and corrosion resistance of extruded Mg-Y-0.5Zn alloys. This work seeks to establish a rational guideline for the design of biomedical Mg alloys with an optimal balance of performance, thereby enhancing their potential for clinical translation in biodegradable implant applications.

2. Experimental Procedures

2.1. Material Preparation

The raw materials used to prepare Mg-xY-0.5Zn (x = 0.5, 1.0, 2.0, and 3.0 wt%) alloys were high-purity Mg (99.99 wt%), high-purity Zn particles (99.99 wt%), and a Mg-30Y (wt%) master alloy. High-purity Mg was heated and melted in a resistance furnace at 720 °C. A mixed inert gas (N2 and SF6 in a 99:1 ratio) was continuously introduced as a shielding atmosphere during the melting process. After the Mg was completely melted, the remaining raw materials were added. Once all raw materials were fully melted, a mechanical stirring paddle was used to stir the melt at 300 rpm for 3 min to ensure compositional homogeneity. The melt temperature was maintained at 720 °C and held for 20 min. Subsequently, the melt was immediately poured into a steel mold preheated to 200 °C and allowed to cool naturally in air.
For the Mg-Y-0.5Zn alloys with different Y contents, the solution treatment temperature was 500 °C, and the solution treatment time ranged from 2 to 8 h, increasing with higher Y content. To achieve comparable grain sizes among the four alloys, the extrusion temperatures were set to 320 °C, 350 °C, 380 °C, and 410 °C. Prior to hot extrusion, the solution-treated billets were preheated at the corresponding extrusion temperature for 1.5 h. The extrusion speed was 0.2 mm/s, and the extrusion ratio was 29:1. After extrusion, bars with a diameter of 8.5 mm were obtained.

2.2. Microstructure Characterization

Samples were ground with sandpaper in the order of 800, 1500, 3000, and 5000 mesh, followed by mechanical polishing. Etching was performed using a picric acid solution consisting of 3.75 g of trinitrophenol, 45 mL of absolute ethanol, 5 mL of ultrapure water, and 5 mL of glacial acetic acid. After etching, the sample surface was quickly rinsed with absolute ethanol and immediately blow-dried. Metallographic structures were observed using an optical microscope (Olympus GX51, Tokyo, Japan). For unetched samples, microstructures were examined using an ultra-high resolution field emission scanning electron microscope (Verios 460L, Thermo Fisher Scientific, Hillsboro, OR, USA). The type and content of elements present in the second phase were analyzed and determined using an energy-dispersive X-ray spectrometer (EDS, Verios 460L, Thermo Fisher Scientific, Hillsboro, OR, USA). The volume fraction of the second phase in the alloy was quantified using ImageJ software (Version 1.54f, NIH, Bethesda, MD, USA).
Phase composition of the samples was analyzed by X-ray diffraction (XRD, Rigaku, Tokyo, Japan) using a D/Max 2500PC diffractometer equipped with a Cu target. The acceleration voltage was set to 40 kV, and the current was 0.1 A. Diffraction patterns were recorded over a scanning angle (2θ) range of 20° to 80° at a scanning speed of 3°/min. The experimental data were processed using Jade 6.5 software (Materials Data Inc., USA).

2.3. Mechanical Property

Samples for hardness testing were ground with sandpaper in the order of 800, 1500, 3000, and 5000 mesh until the observed surface was flat with fine and uniform scratches. After grinding and polishing (following the same procedure as described in Section 3.2), the microhardness of the samples was measured using a microhardness tester (HMV-2T). The applied load was 490.3 mN, with a dwell time of 10 s. For each sample, 20 points were selected at equal intervals along a straight line, and the average microhardness value was calculated.
The dimensions of the samples used for tensile testing conformed to the GB/T 24176-2009 standard [30]. The samples were dog-bone-shaped tensile bars with a parallel section length of 25 mm and a diameter of 5 mm. Tensile tests were conducted using a universal testing machine at a tensile speed of 0.5 mm/min. To ensure repeatability, three samples were tested for each alloy.

2.4. In Vitro Immersion Test

In vitro immersion experiments were conducted in a water bath containing Hank’s solution at 37 °C [31]. To prevent the degradation of Hank’s solution and maintain stable ion concentrations, fresh Hank’s solution was used throughout the immersion period, replaced every 48 h, and the pH value was recorded every 24 h. Samples for immersion testing were polished to a smooth, flat surface using 5000 mesh abrasive paper to remove the surface oxide layer. After ultrasonic cleaning in anhydrous ethanol for 5 min, the samples were dried and stored for subsequent use. The samples were weighed before and after immersion. As-extruded samples (φ 8 mm × 3 mm) were sampled at four time points: 24 h, 72 h, 168 h, and 336 h. The ratio of solution volume to sample contact area was 20 mL·cm−2. After immersion, the samples with corrosion products were cleaned in an ultrasonic cleaner for 5 min using a chromic acid solution composed of 200 g/L CrO3, 10 g/L AgNO3, and 20 g/L Ba(NO3)2 to remove the corrosion products formed on the sample surface. The weight loss corrosion rate of the alloy was then determined using Equation (1):
C R = K W A T D
where CR is the annual corrosion rate (mm/y), A is the sample surface area (cm2), T is the immersion time (H), W is the mass loss of the sample during immersion (g), and the constant k = 8.76 × 10⁴. Three parallel samples were tested for each material, and the changes of pH value and weight loss corrosion rate were calculated. In order to further study the corrosion mechanism of the alloy, the SEM and optical stereomicroscope (olympus-dsx510) were used to observe the surface and cross-section morphology after corrosion.

2.5. MTT Cytotoxicity Test

The extract for the in vitro cytotoxicity test was prepared in accordance with GB/T 16,886.5 [32]. DMEM medium supplemented with 10% fetal bovine serum, 4 mmol/L glutamine, 100 IU/mL penicillin, and 100 μg/mL streptomycin was used as the extraction vehicle. Prior to testing, the samples were exposed to ultraviolet radiation for 30 min. For the cytotoxicity test, discs measuring φ 8 mm × 3 mm and polished with 3000 mesh sandpaper were used. A sufficient number of discs were taken to achieve a total sample surface area of 10 cm2. The samples were immersed at 37 °C for 24 h, with a ratio of sample surface area to extraction vehicle of 1.25 cm2/mL. A 100% concentration standard extract was thus prepared, and DMEM culture medium was used as the blank control group.
Following trypsin digestion, the cells were diluted to an appropriate concentration of 1 × 10⁵ cells/mL. A volume of 100 μL of the cell suspension was transferred into a 96-well culture plate, resulting in approximately 1 × 10⁴ cells per well. After incubation at 37 °C and confirmation of normal cell growth, the original medium was discarded, and 100 μL of the extract solution was added to each well for 24 h. Subsequently, the medium was removed, and 50 μL of 1 mg/mL MTT solution was added for 4 h. The MTT solution was then removed, and 100 μL of isopropanol solution was added. The culture plate was shaken, and the absorbance (OD) was measured using a microplate reader at a wavelength of 570 nm. The cell viability was then calculated according to the following formula:
R G R % = O D 570 e O D 570 b × 100 %
where RGR% is the relative proliferation rate of cells, O D 570 e is the average absorbance of the sample group, and O D 570 b is the average absorbance of the blank control group.

3. Results and Discussion

3.1. Microstructures

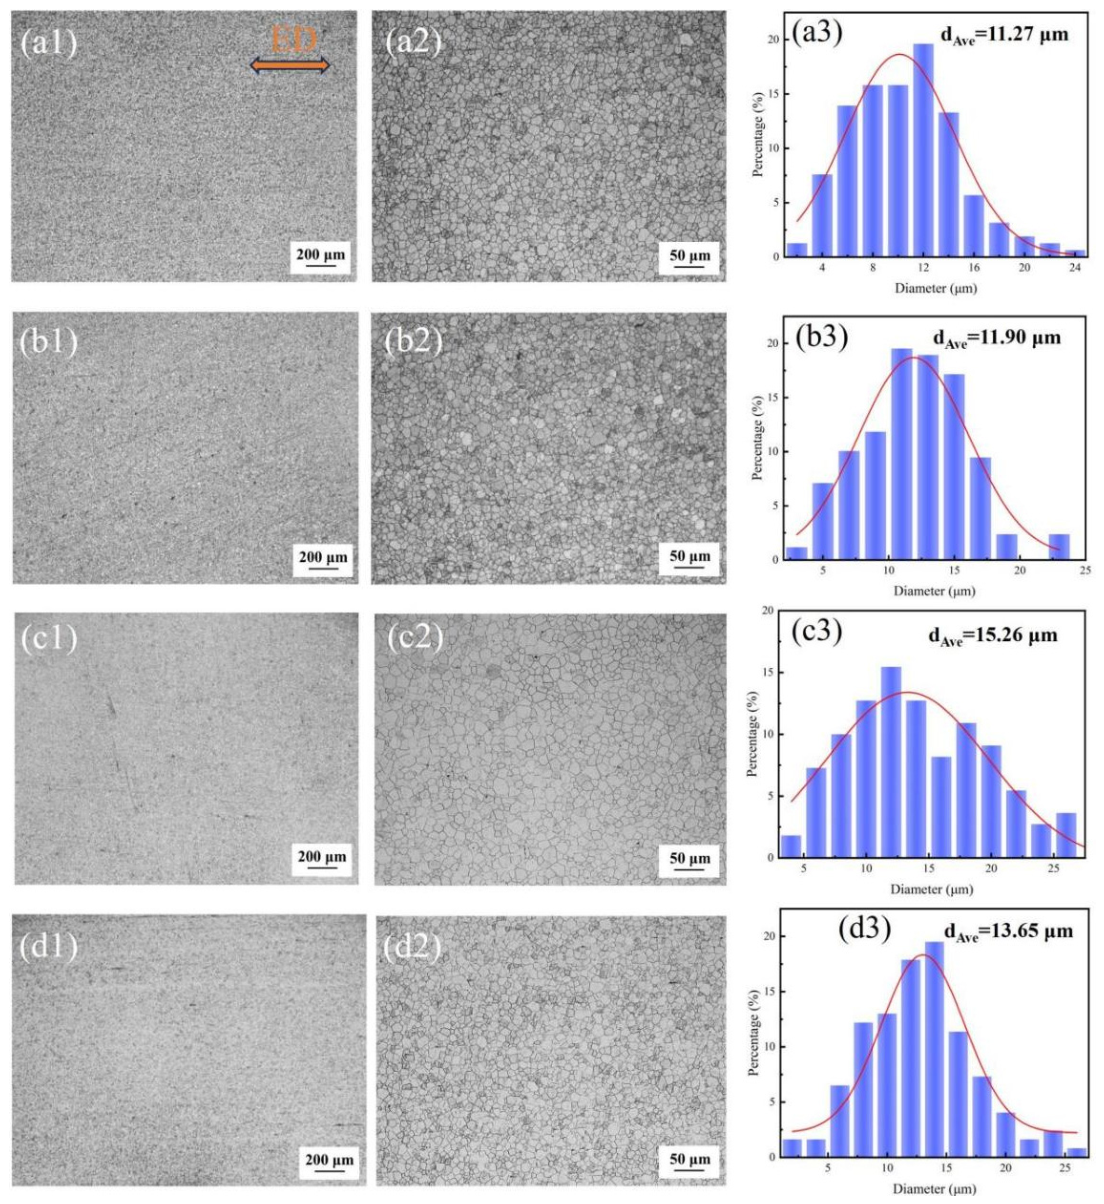
Figure 1 shows the optical microstructures (OM) and grain size distributions of the four extruded Mg-Y-0.5Zn alloys. The extruded alloys exhibit a normal grain distribution. Compared with the as-cast alloys [25], the grains of the four extruded alloys are significantly refined after hot extrusion processing, and all exhibit fine equiaxed grains, which is attributed to dynamic recrystallization occurring during the extrusion process. The OM images indicate that the alloys are almost completely recrystallized. After increasing the Y content from 0.5% to 3.0%, the average grain sizes of the four alloys are 11.27 μm, 11.90 μm, 15.26 μm, and 13.65 μm. In general, higher extrusion temperatures promote more pronounced grain growth. Additionally, the Y element leads to the formation of dispersed nucleation particles, which accelerate nucleation during recrystallization, thereby affecting grain boundary formation and grain growth. Y can form stable fine precipitates in Mg alloys, which limit grain growth either near grain boundaries or within grains. Therefore, the differences in grain size among the four extruded alloys result from the combined influence of extrusion temperature and Y content on the grain refining effect.
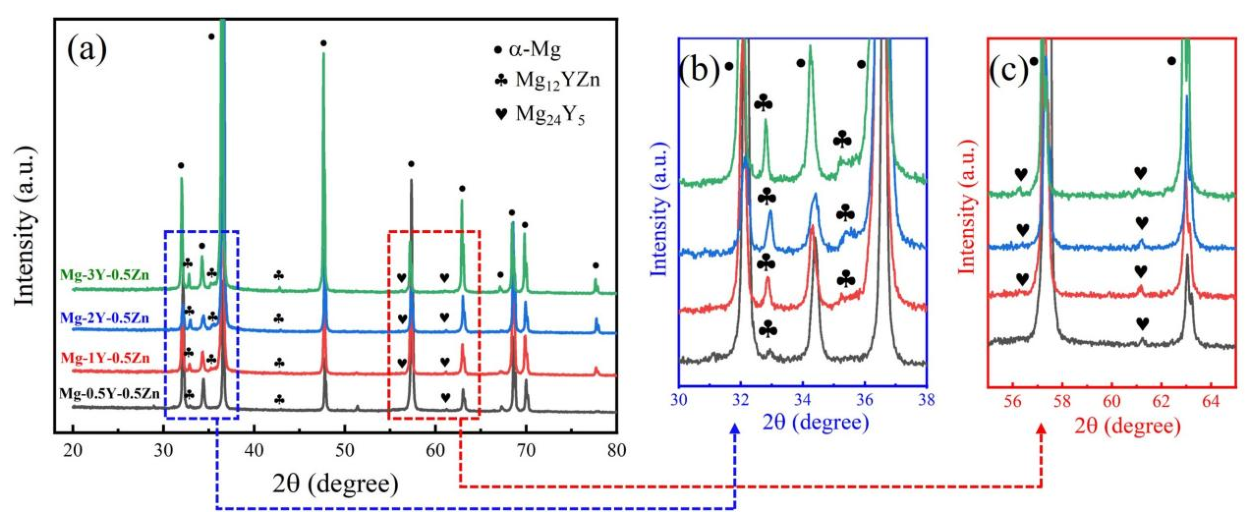
Figure 2 shows the XRD patterns of the extruded alloys. The second phases in the four extruded alloys are both Mg24Y5 and Mg12YZn according to the diffraction peaks. Upon increasing the Y contents, the peaks of these two phases are enhanced. Compared with the as-cast state, the intensity of the second-phase diffraction peak decreases.
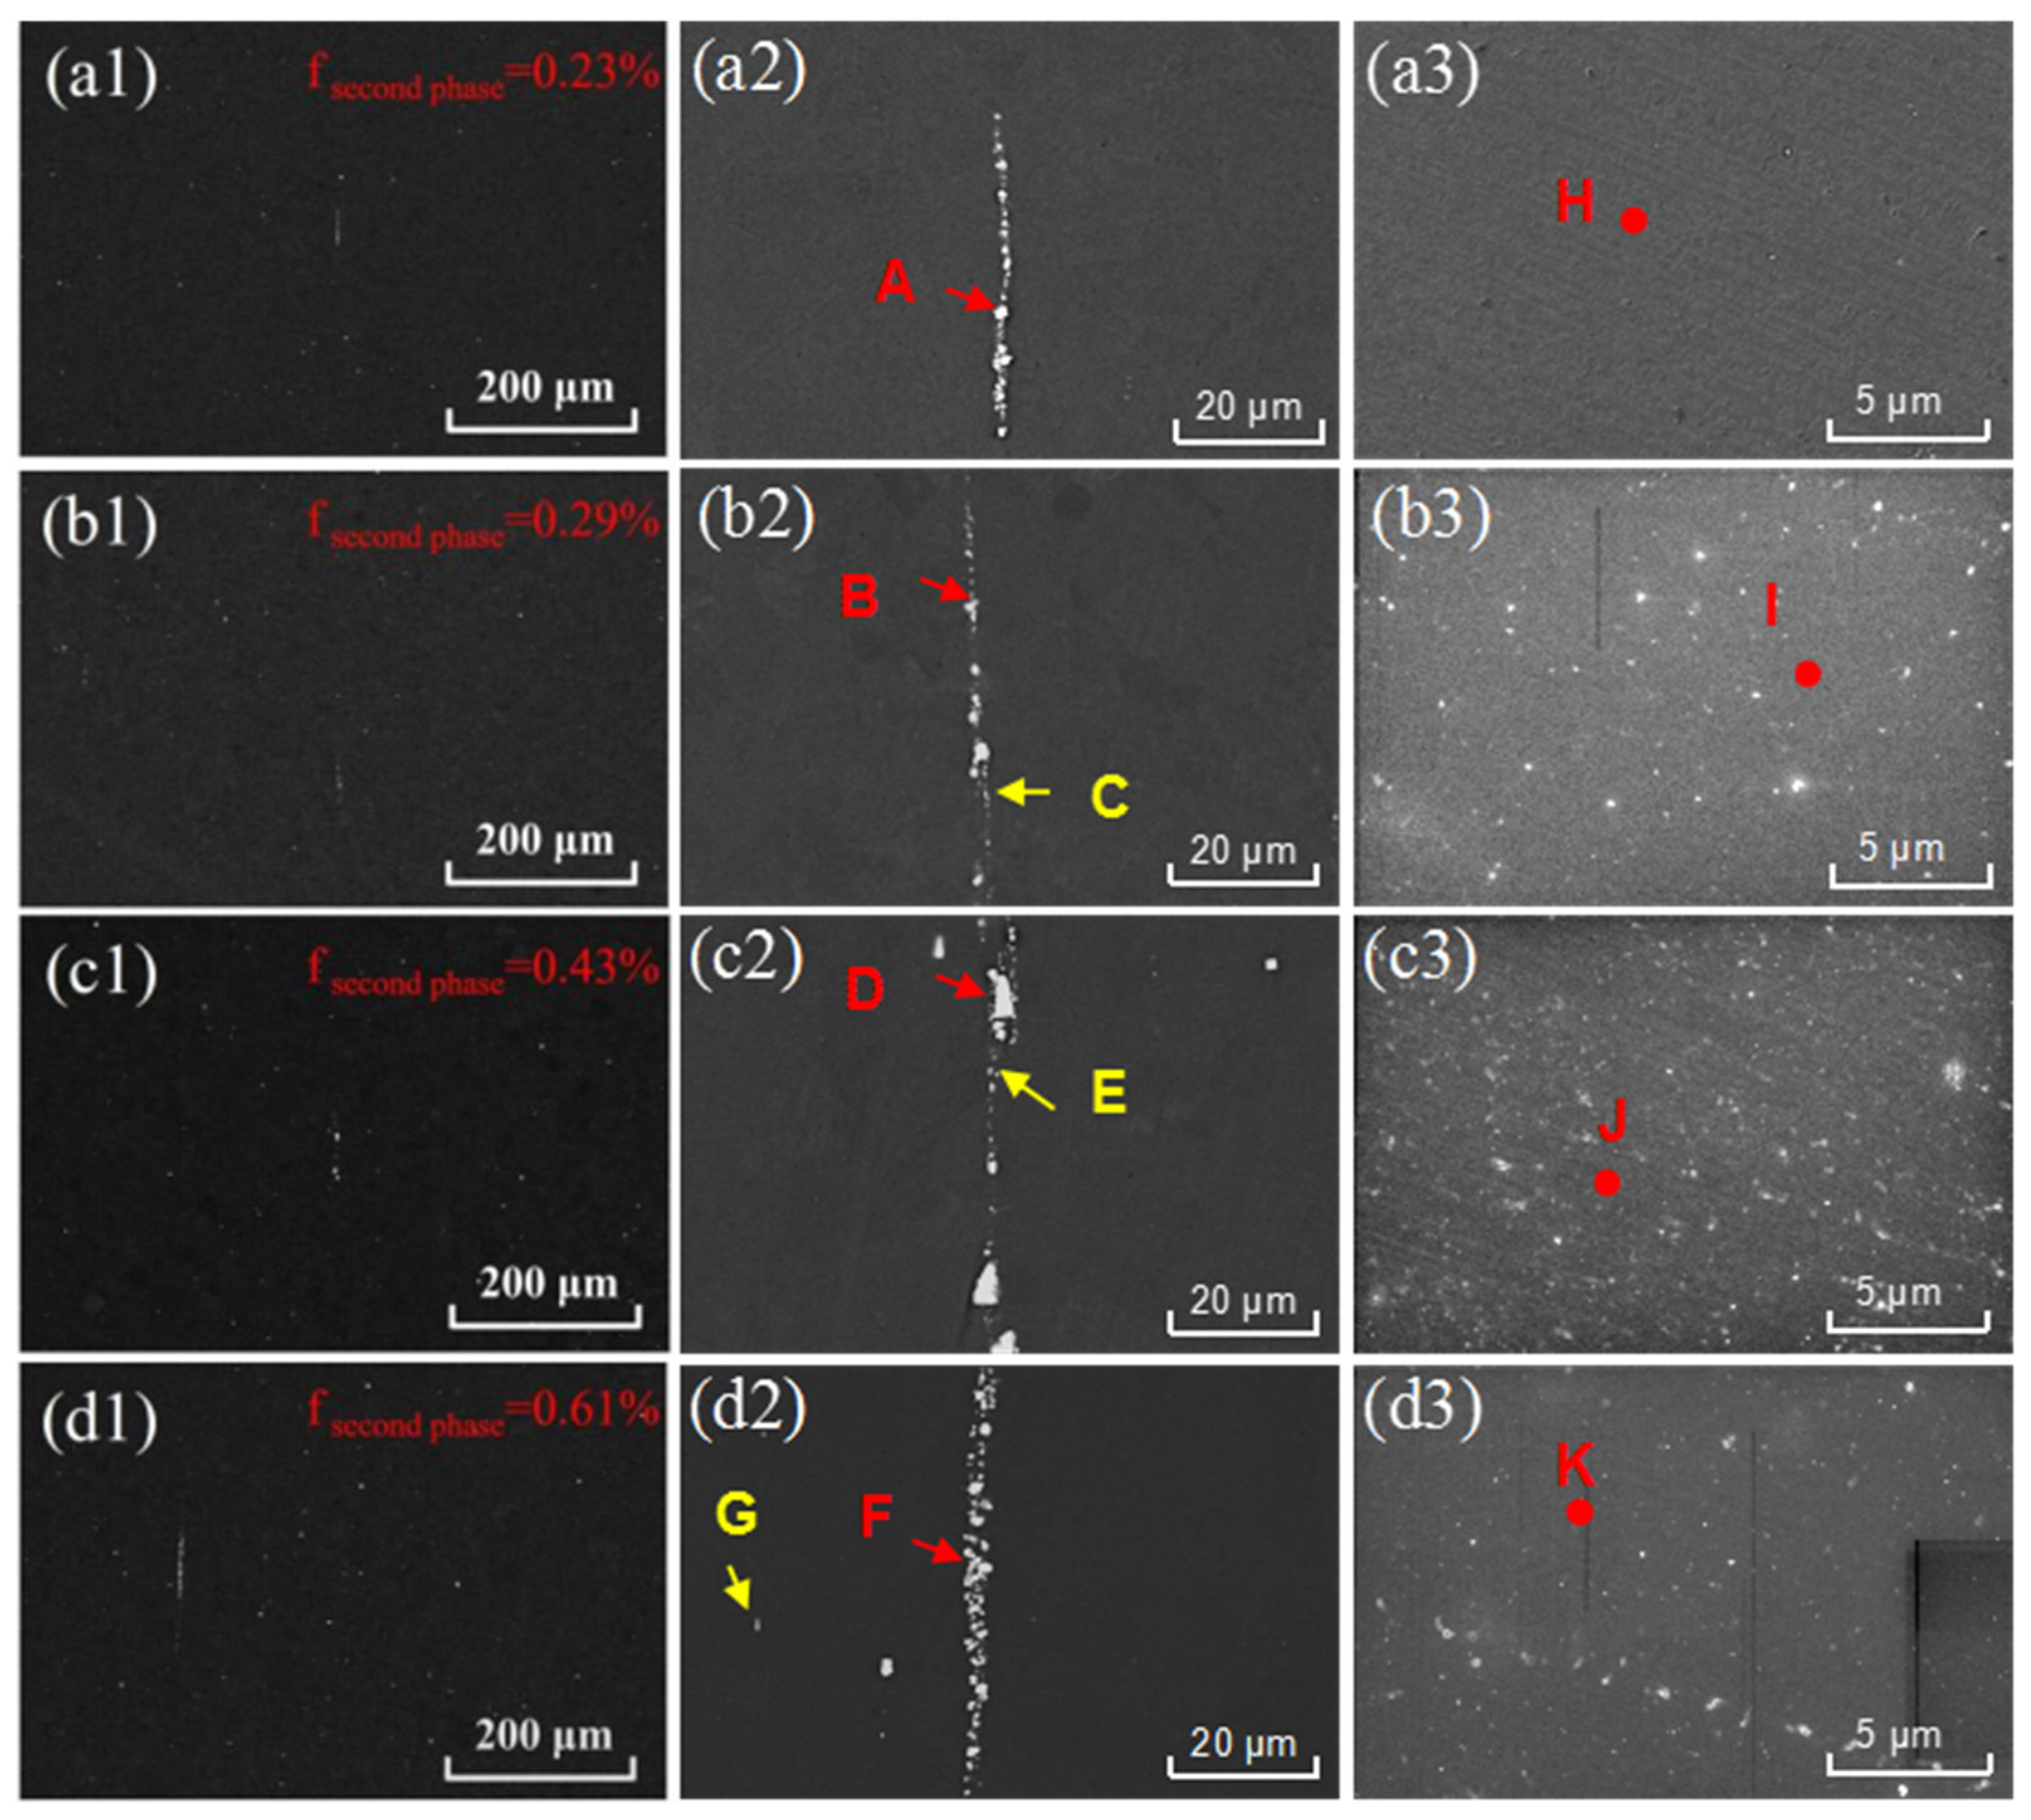
Figure 3 presents SEM images of the extruded Mg-Y-0.5Zn alloys. The low-magnification SEM image reveals that the second phase after extrusion is in a relatively dispersed distribution state, with aggregated ribbons distributed along the extrusion direction (ED) in some regions, as shown in the high-magnification images. According to statistical analysis, the volume fractions of the second phase in the four alloys are 0.23%, 0.29%, 0.43%, and 0.61%. Thus, the volume fraction of the second phase increases with increasing Y content. The high-magnification images show that a nano-sized second phase is extremely rare (Figure 3(a3)), while the content of fine particles in the three other alloys increases after increasing the Y content from 1.0% to 3.0% (Figure 3(b3,c3,d3)). In addition, Table 1 displays that the content of Zn element dissolved in the matrix is reduced, while the Y content in the matrix increases after increasing the Y from 0.5% to 3.0%. This is attributed to the formation of more second phases in high Y-containing alloys, consuming the alloying elements.
Table 1 shows the scanning results of EDS points corresponding to different regions in Figure 3. These bright granular phases can be inferred as the Mg24Y5 phase (points A, B, D, and F). The bright spots with lower Y and Zn contents are considered to be Mg12YZn phases, such as the points C, E, and G.

3.2. Mechanical Properties

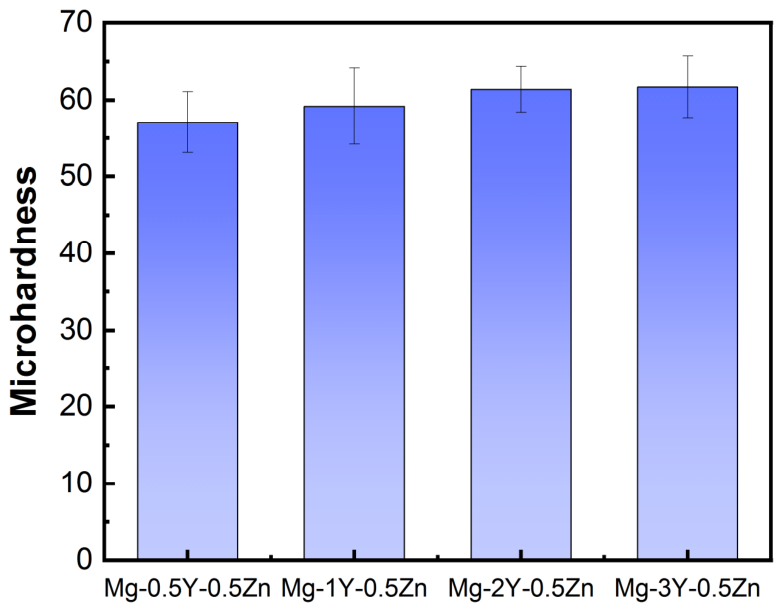
Figure 4 shows the microhardness of extruded Mg-Y-0.5Zn alloy. The microhardness values of the four extruded alloys are 57.1 HV, 59.2 HV, 61.4 HV, and 61.7 HV. Due to the relatively smaller grain size in low-alloyed Mg-Y-0.5Zn alloy (with Y of 0.5 and 1%), in theory, their hardness should be higher, but in fact, the hardness increases with an increase in Y content. Due to the higher volume fraction of second phase and solute solution concentrations in the Mg matrix (Table 1), the Mg-3Y-0.5Zn alloy has the best microhardness, followed by Mg-2Y-0.5Zn, Mg-1Y-0.5Zn, and Mg-0.5Y-0.5Zn [33].
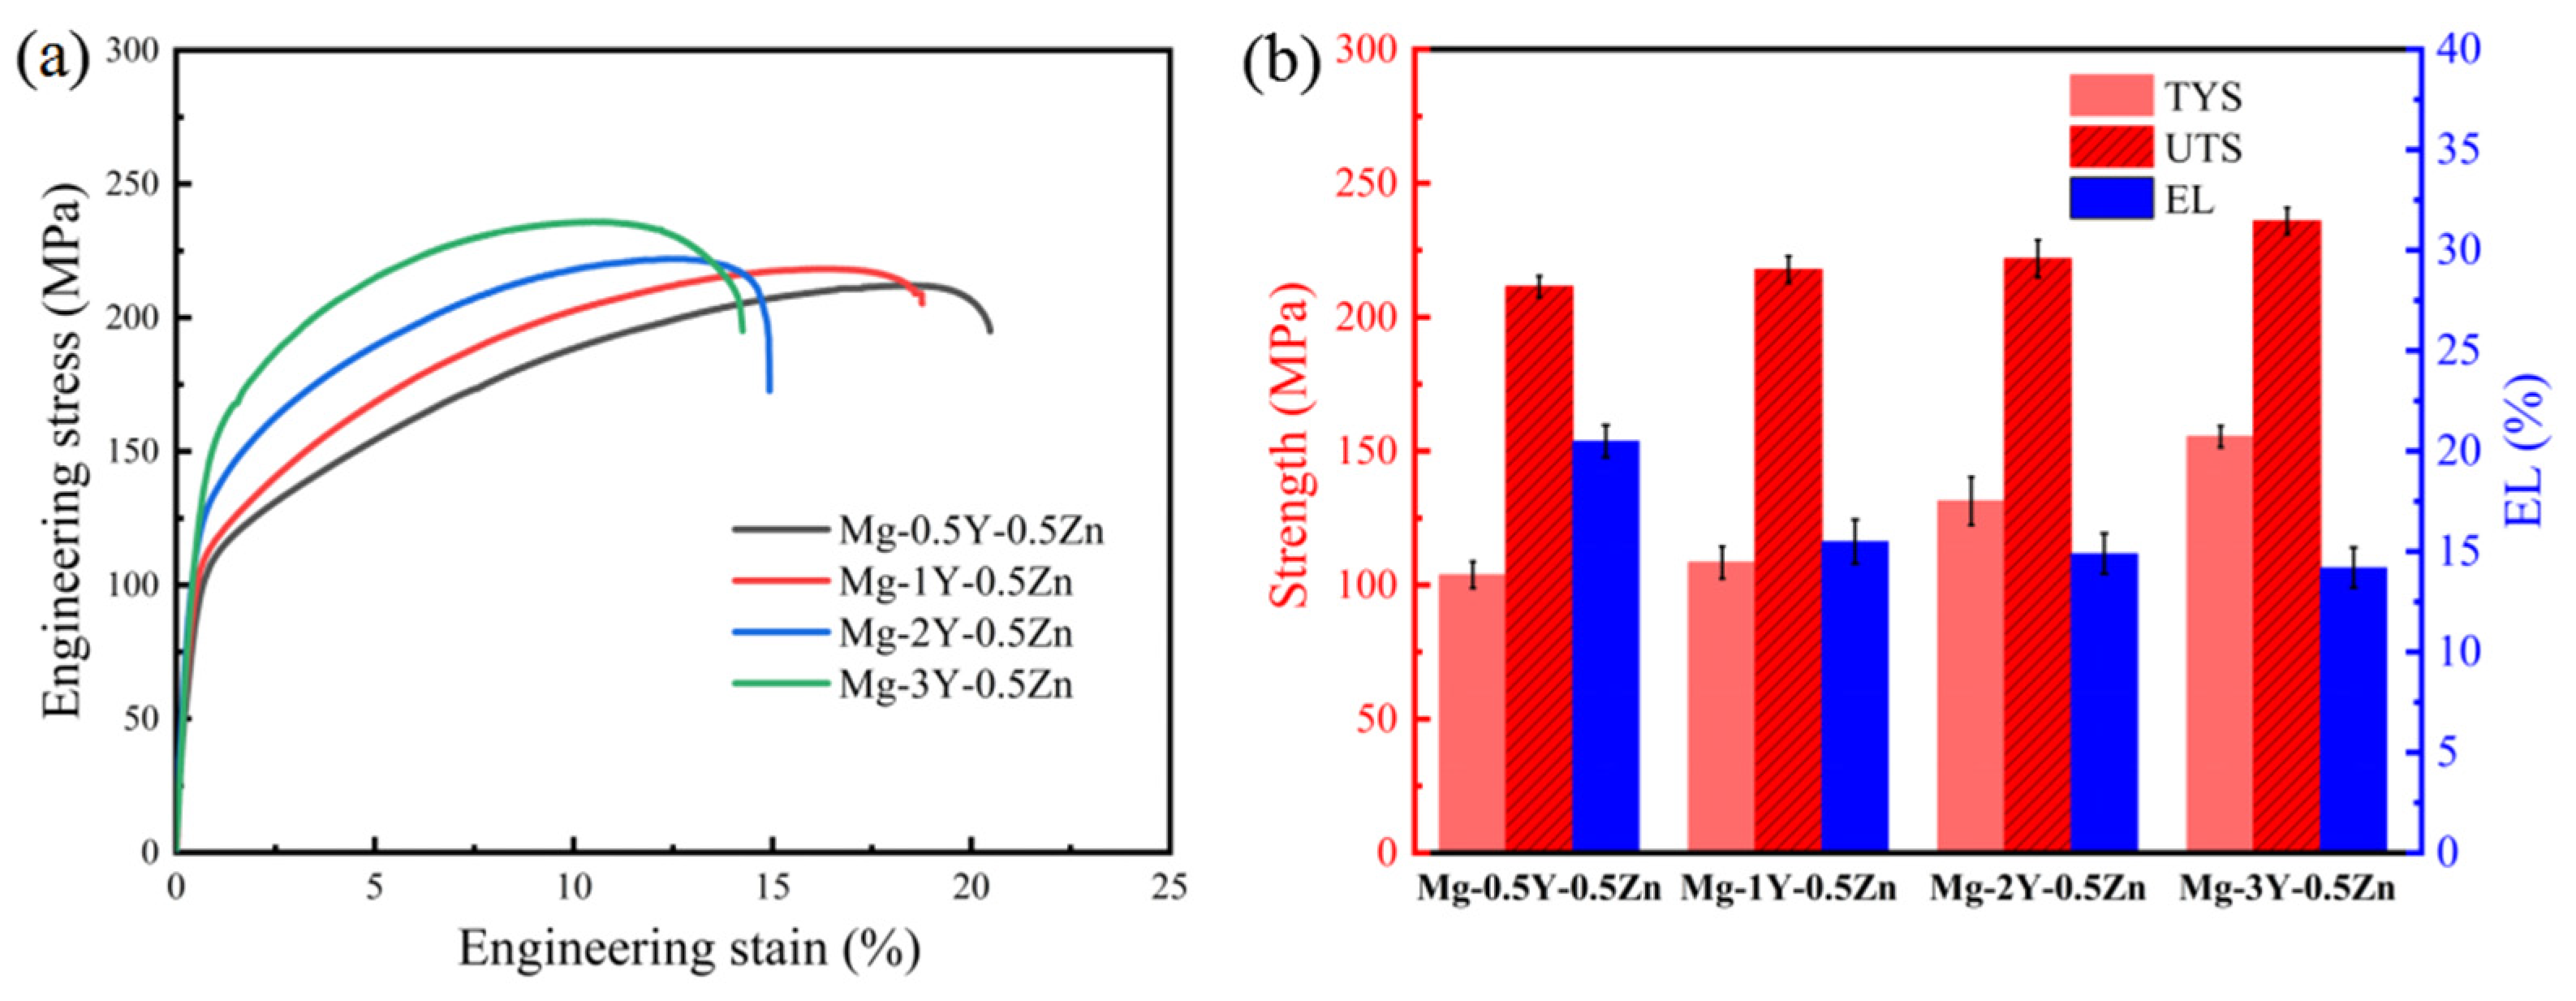
Figure 5 shows the tensile stress–strain curves of the extruded Mg-Y-0.5Zn alloys at room temperature. With increasing Y content, the yield strength (YS) of the alloys increases from 103.8 MPa for Mg-0.5Y-0.5Zn to 155.4 MPa for Mg-3Y-0.5Zn, as shown in Figure 5b. The ultimate tensile strength (UTS) also increases slightly with increasing Y content, from 211.4 MPa to 255.9 MPa. In contrast, the elongation (EL) exhibits an opposite trend; that is, with increasing Y content, the EL decreases from 20.5% for the Mg-0.5Y-0.5Zn alloy to 14.2% for the Mg-3Y-0.5Zn alloy. Notably, when the Y content exceeds 1 wt%, the EL decreases more significantly. After increasing the Y content, the volume fractions of the second phase increase, and thus, the precipitates’ strength is enhanced. The solute concentrations in the matrix are also higher with increasing Y content. Considering the larger atomic radius of Y than that of Zn, the alloy with high Y content has a better solution strengthening effect [34,35,36].

3.3. Electrochemical Analysis

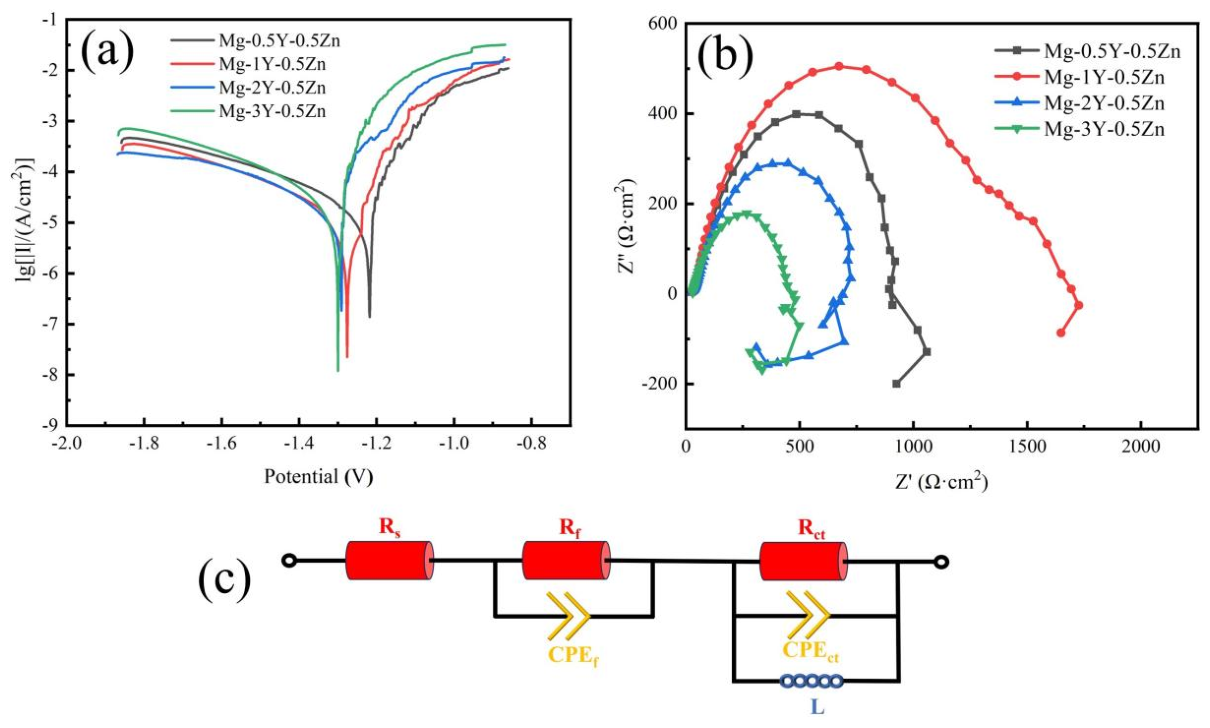
Figure 6a presents the potentiodynamic polarization curves of the extruded four alloys in Hank’s solution. Table 2 lists the polarization potential (Ecorr), corrosion current density (icorr), and the corresponding corrosion rate (Pi) obtained by fitting the potentiodynamic polarization curves of the extruded alloys. It can be observed from the polarization curves that the polarization potential of the extruded alloys shifts in the negative direction with increasing Y content. Regarding the corrosion current density, the alloys follow the order of Mg-1Y-0.5Zn < Mg-0.5Y-0.5Zn < Mg-3Y-0.5Zn < Mg-2Y-0.5Zn, from smallest to largest. Consequently, as the Y content increases, the corrosion rates of the four alloys exhibit a trend of first decreasing and then increasing. The corrosion rates are 0.37 mm/y, 0.28 mm/y, 0.45 mm/y, and 0.41 mm/y when the Y content increases from 0.5% to 3.0%.
Figure 6b shows the electrochemical impedance spectroscopy (EIS) spectra and the corresponding equivalent circuit diagram of the extruded alloys. Based on the EIS spectra, an equivalent circuit model was established, as shown in Figure 6c. It can be observed from the EIS spectra that all four alloys exhibit inductive loops of varying sizes in the low-frequency region. The inductive loop in the low-frequency region is attributed to pitting corrosion caused by localized corrosion of the unstable corrosion product layer during the corrosion process [37]. The minimum inductance (L) of the Mg-1Y-0.5Zn alloy is 439 H·cm2, while the maximum inductance of the Mg-3Y-0.5Zn alloy is 965 H·cm2, indicating that the corrosion product layer of the Mg-1Y-0.5Zn alloy is the most uniform.
In addition, two capacitive loops were observed in the high-frequency and medium-frequency regions of the EIS spectra for all four extruded alloys. This is because the resistance generated at a high frequency is primarily related to the formation of the electric double-layer structure on the alloy surface and the associated charge transfer, which is represented by Rct [38]. With increasing Y content, the Rct values of the four extruded alloys first increased and then decreased, amounting to 708 Ω·cm2, 1048 Ω·cm2, 558 Ω·cm2, and 317 Ω·cm2. The resistance in the medium-frequency region is related to the corrosion products, denoted as Rf [39]. Among the Table 3, the Mg-1Y-0.5Zn alloy shows the largest capacitive arc radius, indicating the best corrosion performance, whereas the Mg-3Y-0.5Zn alloy exhibits the smallest arc radius and, thus, the poorest corrosion resistance.

3.4. In Vitro Immersion Analysis

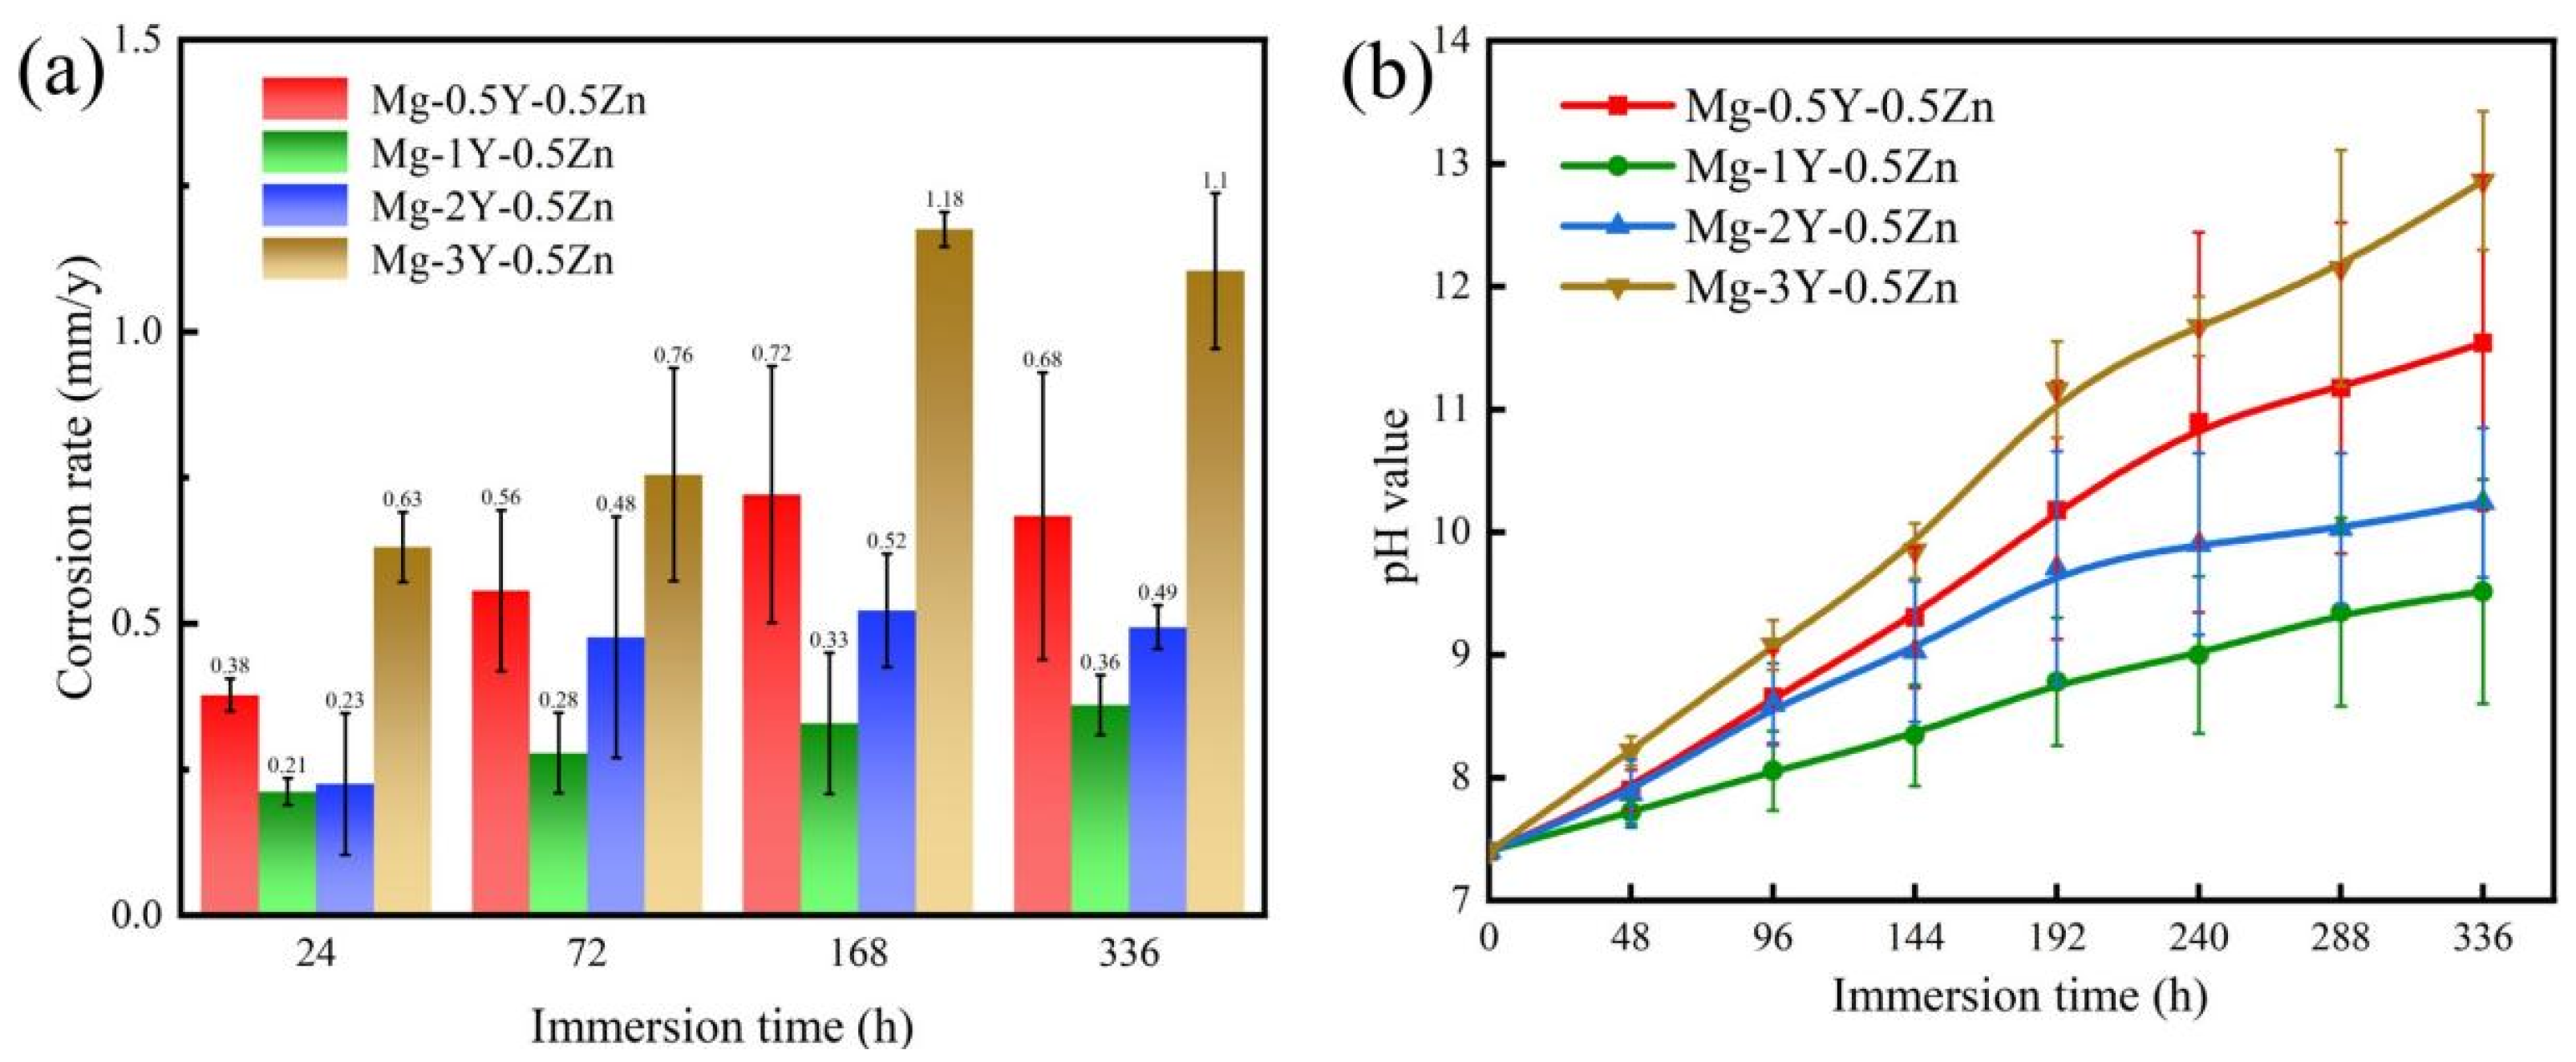
Figure 7a,b show the annual corrosion rate and pH value changes of the extruded alloys immersed in Hank’s solution for 14 days. The annual corrosion rates of the alloys at 24 h, 72 h, 168 h, and 336 h were measured using the weight loss method, as presented in Figure 7a. It can be seen that with increasing immersion time, the corrosion rates of the four extruded alloys first increased and then stabilized; specifically, they increased gradually before 168 h of immersion and tended to stabilize after 336 h. Within the first 168 h, the Mg-1Y-0.5Zn alloy exhibited the lowest corrosion rate. After 336 h of long-term immersion, the Mg-1Y-0.5Zn alloy remained the lowest, followed by Mg-2Y-0.5Zn, Mg-0.5Y-0.5Zn, and Mg-3Y-0.5Zn, with annual corrosion rates of 0.36 mm/y, 0.49 mm/y, 0.68 mm/y, and 1.1 mm/y.
Regarding pH value changes, all extruded alloys exhibited a similar upward trend, characterized by a faster increase rate in the early stage of immersion, followed by a deceleration. This behavior may be attributed to the relatively small amount of second phase in the extruded alloys, resulting in a relatively uniform corrosion product layer and a relatively stable corrosion rate upon contact with the corrosive medium [40,41]. In the later stage of corrosion, the corrosion process gradually slowed down and became stable as the corrosion product layer became denser due to the accumulation of Ca-P compounds [42,43]. Consequently, the slope of the pH curve decreased after an immersion time of 192 h.
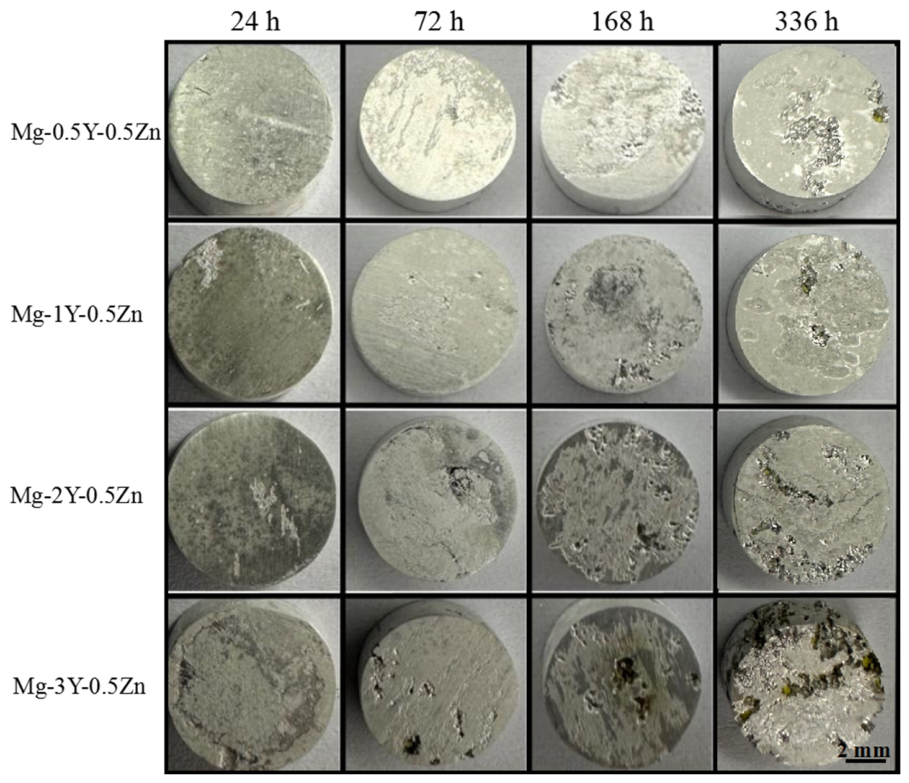
Figure 8 shows the macro-morphology of the extruded Mg-Y-0.5Zn alloys after immersion in Hank’s solution for different times, following the removal of corrosion products. After 24 h of immersion, the Mg-3Y-0.5Zn alloy exhibited clear pitting corrosion, while the other three alloys showed only mild corrosion. As the immersion time increased to 72 h, the surfaces of the Mg-0.5Y-0.5Zn and Mg-1Y-0.5Zn samples remained relatively flat, whereas the Mg-2Y-0.5Zn alloy displayed clear pitting corrosion, and the pitting corrosion on the Mg-3Y-0.5Zn samples became more severe. After 168 h of immersion, local corrosion also appeared on the Mg-0.5Y-0.5Zn and Mg-1Y-0.5Zn samples. After 336 h of immersion, all four alloys exhibited pitting corrosion characteristics to varying degrees. The local corrosion area on the Mg-1Y-0.5Zn alloy was small, while the Mg-3Y-0.5Zn alloy showed extensive and severe pitting corrosion.
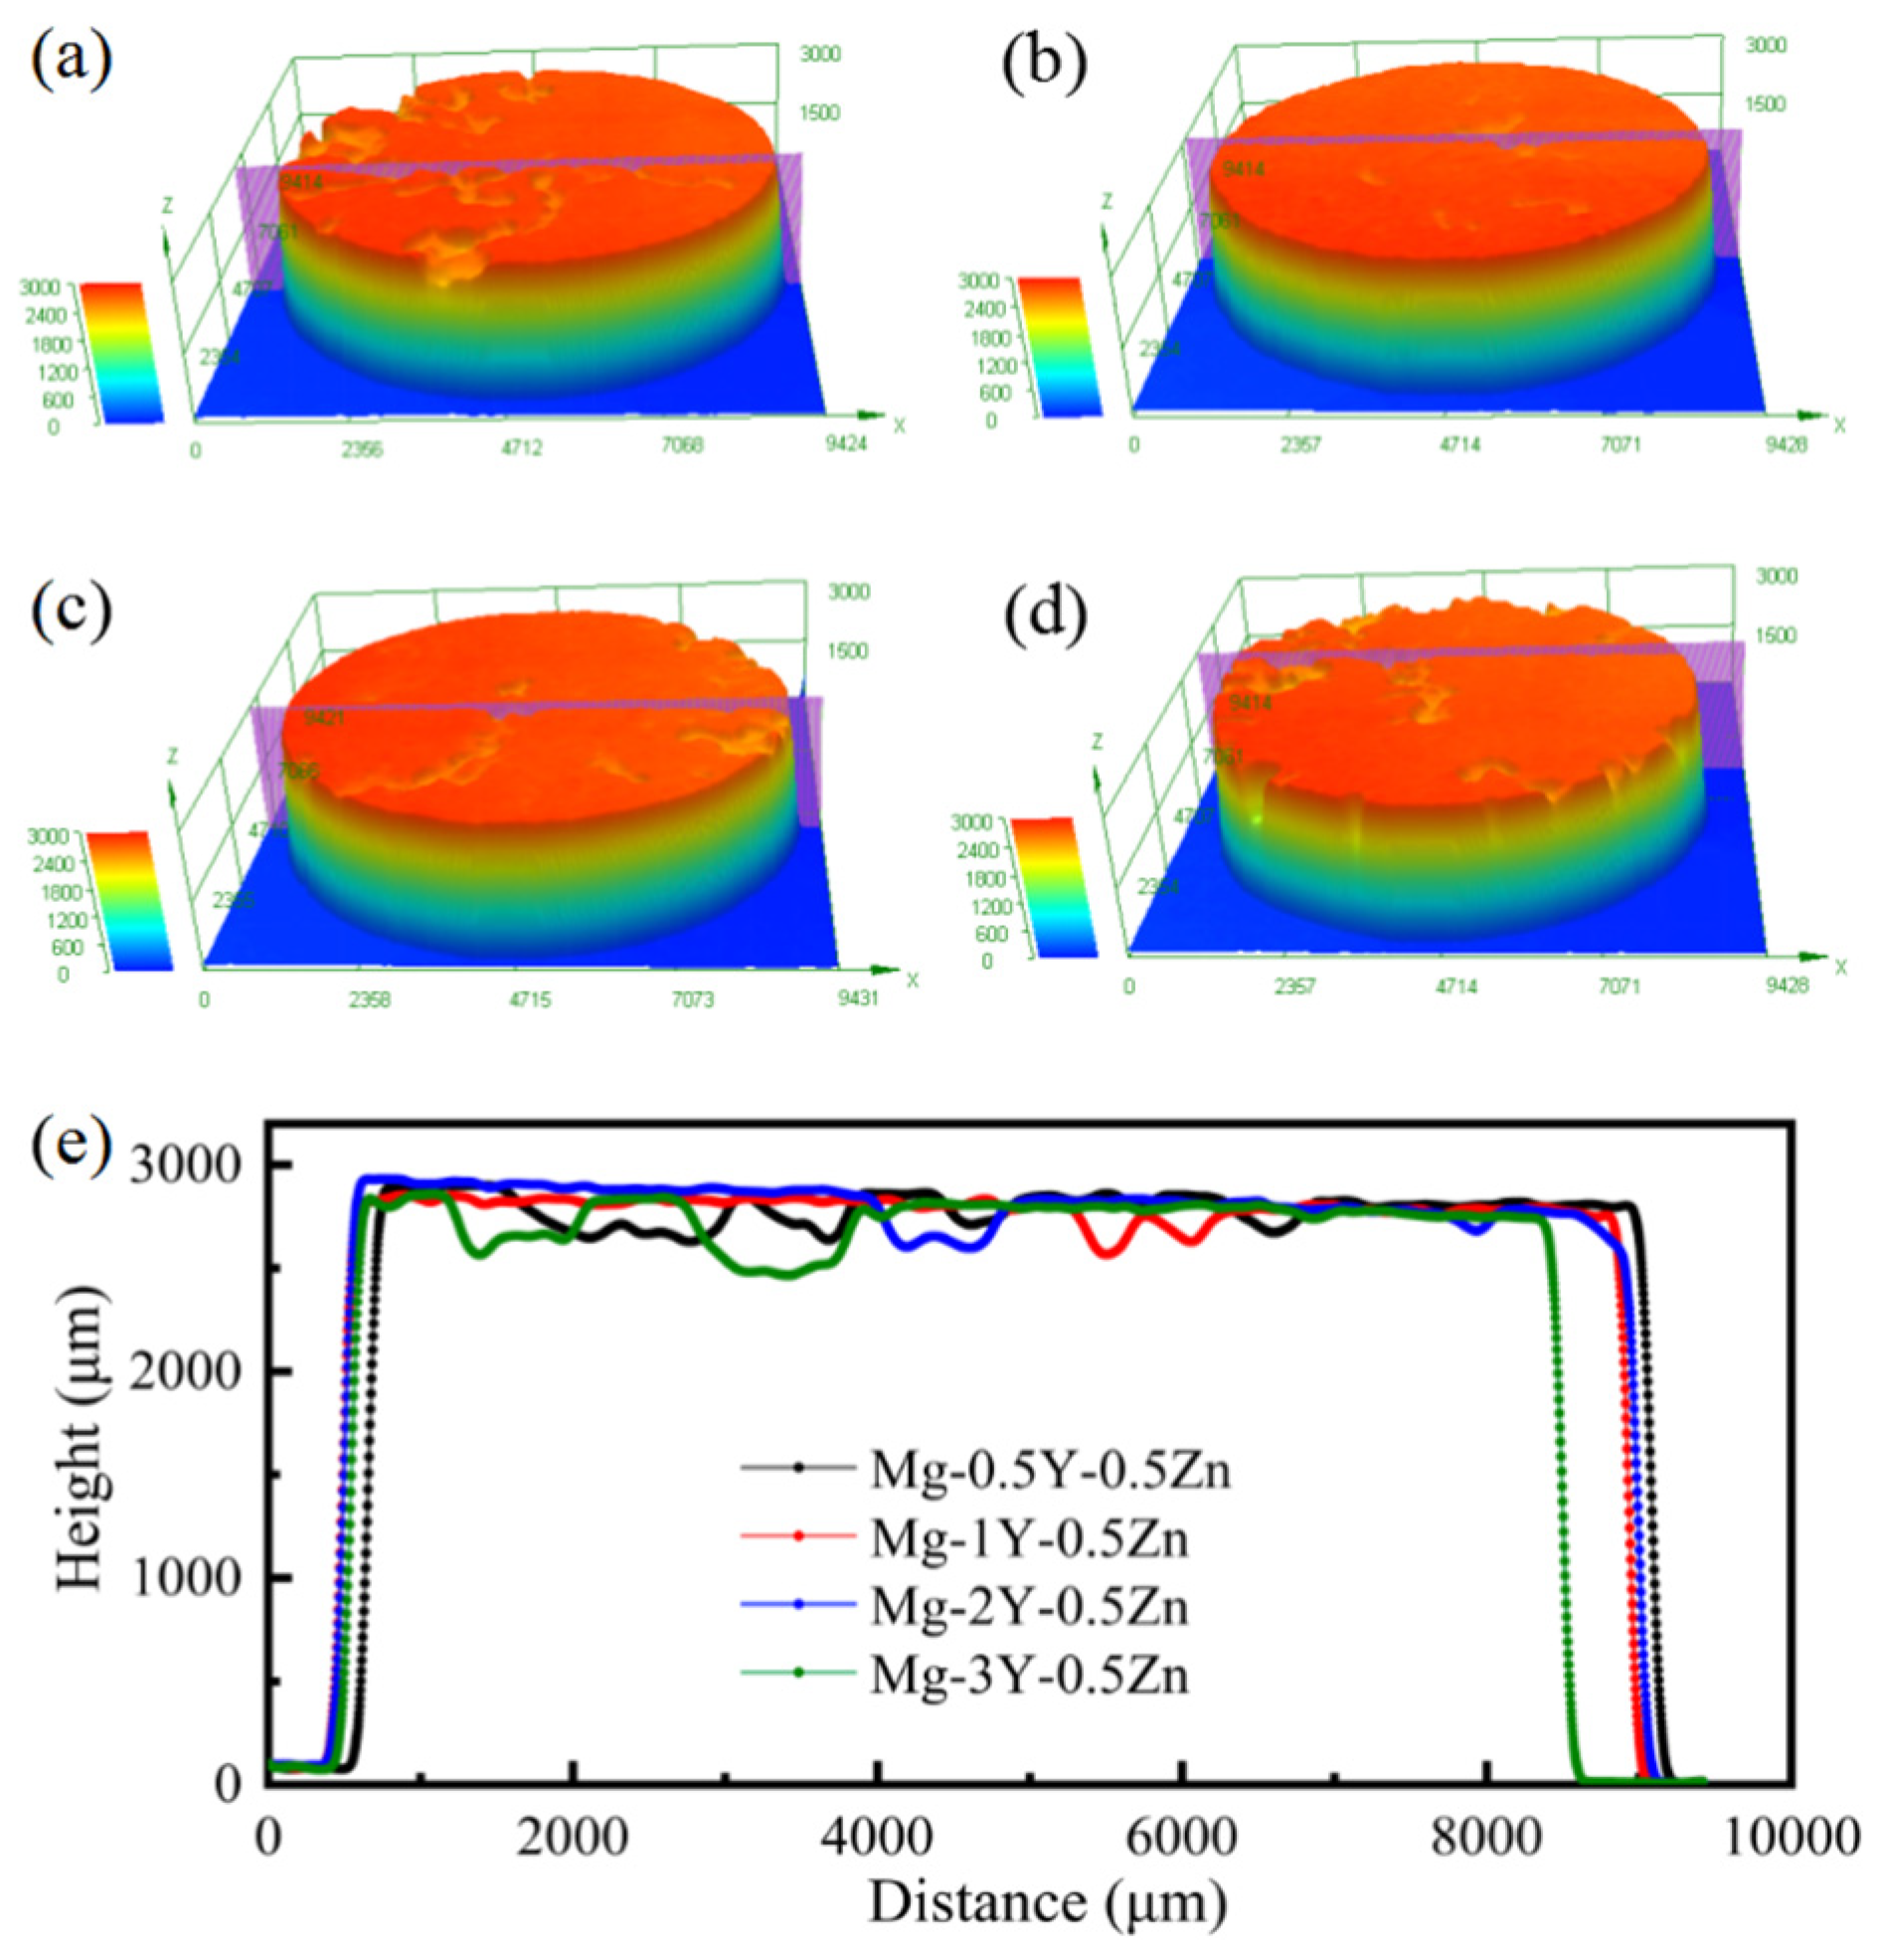
Figure 9 shows the ultra-depth-of-field 3D photos of the four extruded alloys after immersion for 336 h and subsequent removal of corrosion products. Relatively shallow corrosion pits are distributed on the surface of the Mg-1Y-0.5Zn alloy, and the local corrosion area is significantly smaller. In contrast, the other three alloys exhibit larger local corrosion areas, with numerous and deep corrosion grooves.
To further quantify the corrosion degree on the sample surfaces, the depths of the corrosion pits were measured. A rougher alloy surface corresponds to greater fluctuation in the height difference curve, indicating more severe surface corrosion of the alloy sample. As shown in Figure 9b, compared with the other three extruded alloys, the Mg-1Y-0.5Zn alloy exhibits the smallest curve fluctuation, indicating that its surface corrosion is the most uniform and that the corrosion morphology is primarily uniform corrosion. In contrast, the Mg-3Y-0.5Zn alloy shows the most severe pitting corrosion, with a corrosion depth reaching 450 μm.
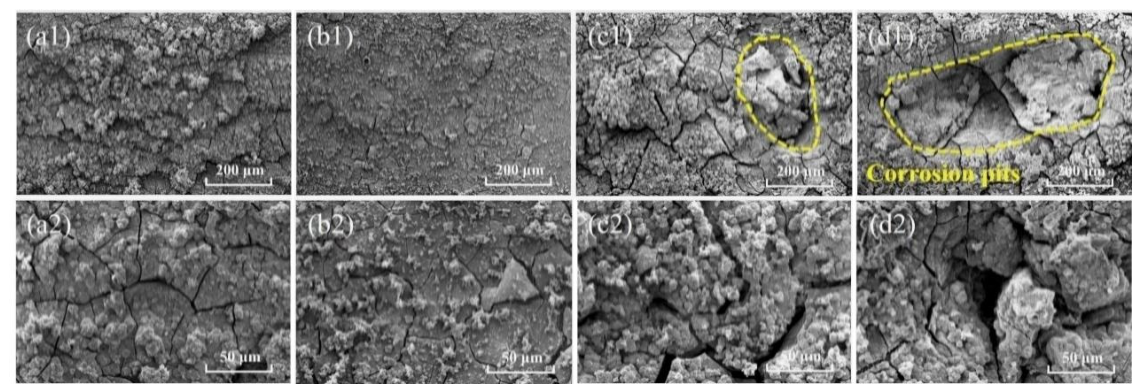
The SEM images of the surface corrosion morphology of the extruded Mg-Y-0.5Zn alloys after immersion for 336 h are shown in Figure 10. It can be observed that the sample surfaces are covered with a layer of corrosion products. At the macroscopic level, granular products accumulate on the surface of the corrosion product layer of the Mg-0.5Y-0.5Zn alloy (Figure 10(a1,a2)), whereas the corrosion products on the Mg-1Y-0.5Zn alloy (Figure 10(b1,b2)) are relatively uniform and flat. Large corrosion pits and deep cracks were observed on the surfaces of the Mg-2Y-0.5Zn and Mg-3Y-0.5Zn alloys, and the corrosion product layers were uneven and loose, as shown in Figure 10(c1,d1).
Further microscopic examination reveals that the corrosion product layer on the surface of the Mg-0.5Y-0.5Zn alloy contains numerous microcracks with small crack widths, thereby providing a relatively good protective effect [44]. The corrosion product layer of the Mg-1Y-0.5Zn alloy exhibits fewer microcracks and even smaller crack widths, demonstrating the best protective ability. In contrast, the Mg-2Y-0.5Zn alloy shows large crack widths, while the surface of the Mg-3Y-0.5Zn alloy exhibits large corrosion pits exceeding 50 μm in size, resulting in poor protection of the matrix.
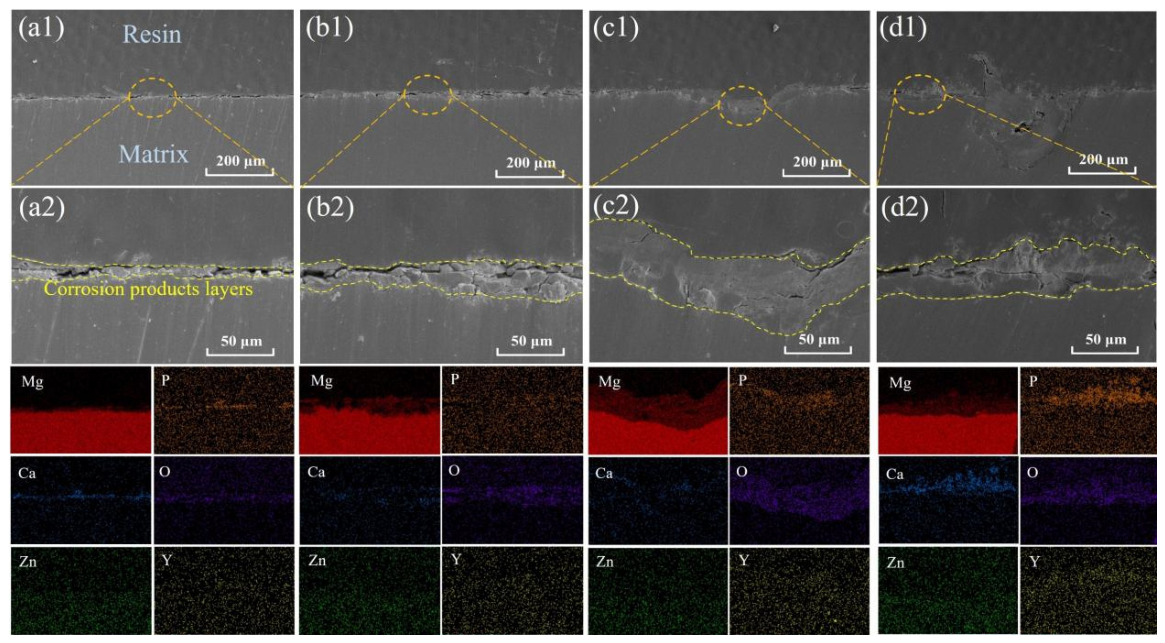
Figure 11 shows the cross-sectional morphology and corresponding EDS surface scans of the alloys after immersion for 336 h. From the low-magnification cross-sectional morphology shown in Figure 11(a1–d1), the corrosion layers of the Mg-0.5Y-0.5Zn and Mg-1Y-0.5Zn alloys are thin and relatively uniform, whereas those of the Mg-2Y-0.5Zn and Mg-3Y-0.5Zn alloys are thick and irregular. In particular, the Mg-3Y-0.5Zn alloy exhibits large pitting corrosion pits with depths exceeding 200 μm. High-magnification observations reveal that the corrosion product layer interface of the Mg-1Y-0.5Zn alloy is flat and uniform, with a product layer thickness of approximately 15~35 μm. With increasing Y content, the thickness of the corrosion product layer on the extruded alloys exhibits a gradual increasing trend. EDS results indicates that the corrosion product layer contains not only Mg but also substantial amounts of Ca, P, and O. Therefore, the corrosion product layer consists not only of MgO and Mg(OH)2 but also of Ca-P corrosion products on the outermost layer. In addition, EDS results also show that a small amount of Y element is present in the corrosion product layer, particularly in the alloy with the highest Y content. Liu et al. [45] suggest that Y addition enhanced the protection for the Mg matrix through forming Y2O3, which increases the compactness of the corrosion product. However, due to the occurrence of severe pitting corrosion in the alloy with high Y content, uneven corrosion leads to a faster corrosion rate. Atrens et al. also demonstrated this in binary Mg-Y alloys with various Y contents in NaCl solution [46].

3.5. Corrosion Mechanism of Mg-Y-0.5Zn Alloys

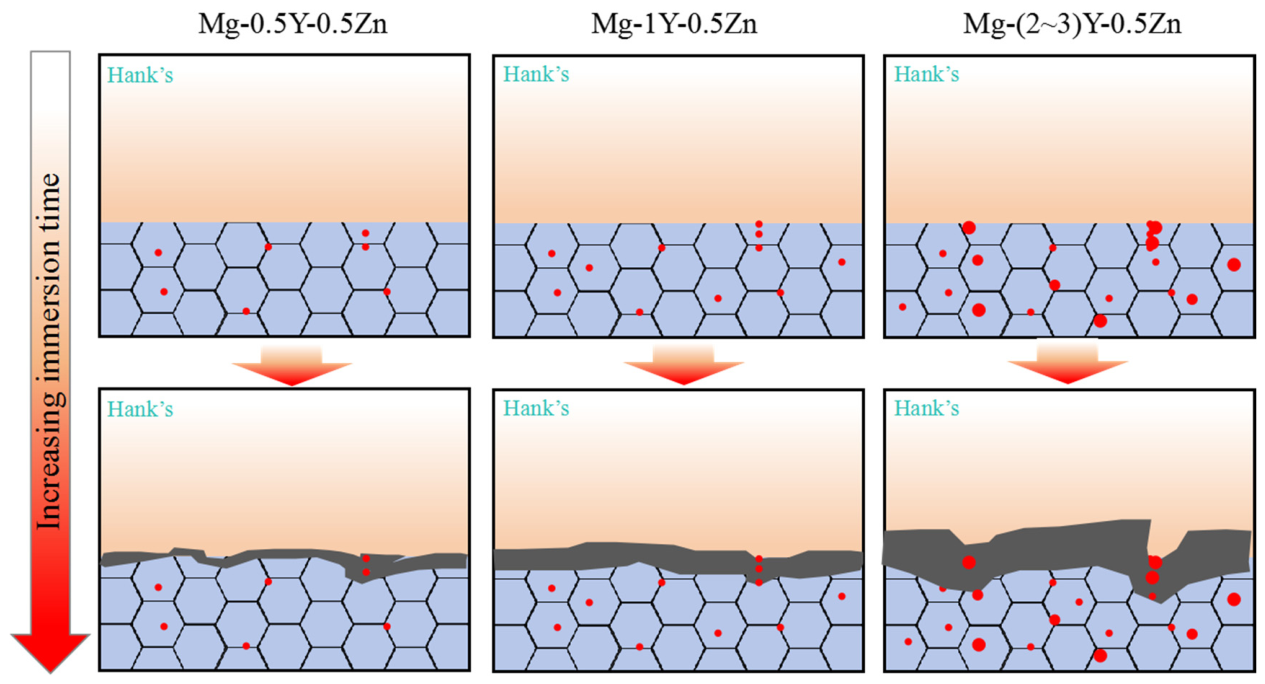
For the Mg-0.5Y-0.5Zn alloy(Figure 12), the low content of the second phase results in fewer galvanic corrosion sites. Although its potential difference is large than the other three alloys, the overall corrosion is relatively weak. Due to the low Y content, the corrosion product layer contains fewer Y-containing products and therefore is not sufficiently dense. For the Mg-1Y-0.5Zn alloy, the second phase content is slightly higher than that of Mg-0.5Y-0.5Zn, and the second phase particles are smaller in size. Moreover, the potential difference between the second phase and the matrix is small, leading to uniform corrosion. After further increasing the Y content, the volume fraction of second phase increases rapidly, leading to a greater number of galvanic corrosion sites. Concurrently, the particle size of the second phase grows, increasing the likelihood of pitting corrosion. Although Y-containing compounds form in alloys with more than 1 wt% Y, which enhances the compactness of the corrosion product layer, the strong galvanic corrosion accelerates local corrosion tendency. Consequently, the overall corrosion behavior is characterized by rapid and uneven corrosion. Additionally, the relatively small grain size of the alloys with low Y content (Y < 1 wt%) may also contribute to the low corrosion rates observed in the Mg-0.5Y-0.5Zn and Mg-1Y-0.5Zn alloys.

3.6. Cytotoxicity Analysis

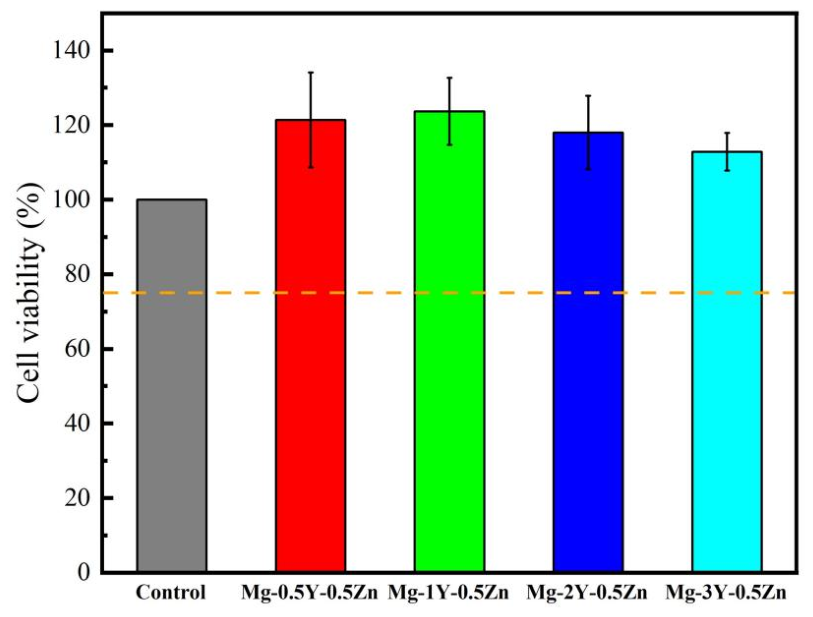
The biocompatibility of rare-earth (RE) elements in biomedical Mg alloys remains an important consideration [47]. Therefore, the safety of the extruded Mg-Y-0.5Zn alloys was verified using an MTT cytotoxicity test (Figure 13). The results presented show that the relative cell proliferation rates (RGRs) of the four extruded alloys were 121.41%, 123.7%, 117.96%, and 112.86%, after 24 h of culture, with DMEM culture medium used as the blank control group. These values indicate that the RGR of all four alloys exceeds 100%, corresponding to a cytotoxicity level of 0. The addition of a small amount of the Y element to the alloys did not exhibit clear cytotoxicity. Therefore, this series of alloys is considered suitable for use as implant materials.

4. Conclusions

The microstructure, mechanical properties, and corrosion behavior of extruded Mg-Y-0.5Zn alloys with different Y contents were studied
(1)
In the extruded Mg-Y-0.5Zn alloys, the change in Y content has little effect on the grain size of the extruded alloy. The second phase of all the four alloys is composed of granular Mg24Y5 phase and a small amount of fine Mg12YZn phase. With the increase in Y content, the volume fraction of the second phase increases from 0.23% to 0.61%.
(2)
With the increase in Y content, the hardness and strength of the alloy increase, while the plasticity decreases. The microhardness of the alloy increased from 57.1 HV to 61.7 HV, the TYS of the extruded alloy increased from 103.8 MPa to 155.4 MPa, and the UTS increased from 211.4 MPa to 235.9 MPa.
(3)
From the results of the in vitro immersion test and electrochemical test, the extruded Mg-1Y-0.5Zn showed a uniform and dense corrosion product layer, leading to the best corrosion resistance. The corrosion product is loose and has large many micro-cracks in other three alloys.
(4)
The cytotoxicity test showed that the relative cell proliferation rates of all the series Mg-Y-0.5Zn alloys exceed 100%, showing no toxicity and good biocompatibility.

Author Contributions

Conceptualization, T.G., S.L. and M.C.; Methodology, T.G. and B.J.; Validation, S.L. and M.C.; Formal analysis, S.L. and B.J.; Investigation, T.G. and B.J.; Resources, M.C.; Data curation, T.G. and B.J.; Writing—review and editing, S.L. and M.C.; Visualization, S.L.; Supervision, M.C.; Project administration, M.C.; Funding acquisition, S.L. All authors have read and agreed to the published version of the manuscript.

Funding

This research was funded by the National Natural Science Foundation of China (grant Nos. 52201301 and 52171241), Tianjin Science and Technology Correspondent Project (24YDTPJC00180). The APC was funded by the National Natural Science Foundation of China.

Data Availability Statement

The original contributions presented in this study are included in the article material. Further inquiries can be directed to the corresponding authors.

Acknowledgments

This work was supported by the National Natural Science Foundation of China (Nos. 52201301 and 52171241), Science and Technology Correspondent Project of Tianjin (24YDTPJC00180), and Open Project Program of National Key Laboratory of Artificial Intelligence for Materials Science (2024B01).

Conflicts of Interest

Authors Shaoyuan Lyu and Bobo Jia was employed by the company China Nonferrous Metals Innovation Institute. The remaining authors declare that the research was conducted in the absence of any commercial or financial relationships that could be construed as a potential conflict of interest.

References

  1. Chen, Y.; Dou, J.; Yu, H.; Chen, C. Degradable magnesium-based alloys for biomedical applications: The role of critical alloying elements. J. Biomater. Appl. 2019, 33, 1348–1372. [Google Scholar] [CrossRef] [PubMed]
  2. Liu, D.; Yang, D.; Li, X.; Hu, S. Mechanical properties, corrosion resistance and biocompatibilities of degradable Mg-RE alloys: A review. J. Mater. Res. Technol. 2019, 8, 1538–1549. [Google Scholar] [CrossRef]
  3. Roche, V.; Koga, G.; Matias, T.; Kiminami, C.; Bolfarini, C.; Botta, W.; Nogueira, R.; Junior, A.J. Degradation of biodegradable implants: The influence of microstructure and composition of Mg-Zn-Ca alloys. J. Alloys Compd. 2019, 774, 168–181. [Google Scholar] [CrossRef]
  4. Li, H.; Zheng, Y.; Qin, L. Progress of biodegradable metals. Prog. Nat. Sci. Mater. Int. 2014, 24, 414–422. [Google Scholar] [CrossRef]
  5. Hou, R.; Victoria-Hernandez, J.; Jiang, P.; Willumeit-Römer, R.; Luthringer-Feyerabend, B.; Yi, S.; Letzig, D.; Feyerabend, F. In vitro evaluation of the ZX11 magnesium alloy as potential bone plate: Degradability and mechanical integrity. Acta Biomater. 2019, 97, 608–622. [Google Scholar] [CrossRef] [PubMed]
  6. González, S.; Pellicer, E.; Suriñach, S.; Baró, M.; Sort, J. Biodegradation and mechanical integrity of magnesium and magnesium alloys suitable for implants. In Biodegradation-Engineering and Technology; IntechOpen: London, UK, 2013; pp. 313–340. [Google Scholar]
  7. Zhang, Y.; Liu, W.; Liu, Y.; Zhang, M.; Tian, Y.; Chen, L. Research progress on corrosion behaviors and improvement methods of medical degradable Mg− Based alloys. Metals 2022, 13, 71. [Google Scholar] [CrossRef]
  8. Han, G.; Lee, J.-Y.; Kim, Y.-C.; Park, J.H.; Kim, D.-I.; Han, H.-S.; Yang, S.-J.; Seok, H.-K. Preferred crystallographic pitting corrosion of pure magnesium in Hanks’ solution. Corros. Sci. 2012, 63, 316–322. [Google Scholar] [CrossRef]
  9. Wang, Q.; Liang, S.; Yuan, F.; Liu, B.; Yu, J.; Wang, W.; Fakhar, N.; Li, H. A high-performance degradable Mg alloy suturing staple for single-arm oral stapling robot. J. Magnes. Alloys 2024, 12, 4096–4118. [Google Scholar] [CrossRef]
  10. Chen, Z.; Liao, Z.; Yu, Z.; Mei, H.; Song, H.; Zhang, X.; Hu, Z. A novel polydopamine/hydroxyapatite composite coating on Mg alloy with excellent corrosion resistance and biocompatibility. Mater. Today Chem. 2026, 52, 103367. [Google Scholar] [CrossRef]
  11. Zhang, S.; Zhang, X.; Zhao, C.; Li, J.; Song, Y.; Xie, C.; Tao, H.; Zhang, Y.; He, Y.; Jiang, Y.; et al. Research on an Mg–Zn alloy as a degradable biomaterial. Acta Biomater. 2010, 6, 626–640. [Google Scholar] [CrossRef] [PubMed]
  12. Zhang, S.; Li, J.; Song, Y.; Zhao, C.; Zhang, X.; Xie, C.; Zhang, Y.; Tao, H.; He, Y.; Jiang, Y. In vitro degradation, hemolysis and MC3T3-E1 cell adhesion of biodegradable Mg–Zn alloy. Mater. Sci. Eng. C 2009, 29, 1907–1912. [Google Scholar] [CrossRef]
  13. Maeng, D.; Kim, T.; Lee, J.; Hong, S.; Seo, S.; Chun, B. Microstructure and strength of rapidly solidified and extruded Mg-Zn alloys. Scr. Mater. 2000, 43, 385–389. [Google Scholar] [CrossRef]
  14. Salleh, E.M.; Ramakrishnan, S.; Hussain, Z. Synthesis of biodegradable Mg-Zn alloy by mechanical alloying: Effect of milling time. Procedia Chem. 2016, 19, 525–530. [Google Scholar] [CrossRef]
  15. Jiang, P.; Blawert, C.; Zheludkevich, M.L. The corrosion performance and mechanical properties of Mg-Zn based alloys—A review. Corros. Mater. Degrad. 2020, 1, 7. [Google Scholar]
  16. Sahu, M.R.; Yamamoto, A. An overview of the recent developments in biodegradable Mg-Zn alloy. J. Magnes. Alloys 2025, 13, 486–509. [Google Scholar] [CrossRef]
  17. Peng, H.; Gong, Z.; Zan, R.; Wang, W.; Yu, H.; Sun, Y.; Ma, C.; Wang, W.; Suo, T.; Zhang, X. Research on the degradation behaviors of biomedical Mg-2 wt% Zn alloy under a biliary environment In Vitro and In Vivo. J. Magnes. Alloys 2025, 13, 1066–1077. [Google Scholar] [CrossRef]
  18. Inoue, A.; Kawamura, Y.; Matsushita, M.; Hayashi, K.; Koike, J. Novel hexagonal structure and ultrahigh strength of magnesium solid solution in the Mg–Zn–Y system. J. Mater. Res. 2001, 16, 1894–1900. [Google Scholar] [CrossRef]
  19. Rosalie, J.M.; Somekawa, H.; Singh, A.; Mukai, T. Effect of precipitation on strength and ductility in a Mg–Zn–Y alloy. J. Alloys Compd. 2013, 550, 114–123. [Google Scholar] [CrossRef]
  20. Lee, J.Y.; Kim, D.H.; Lim, H.K.; Kim, D.H. Effects of Zn/Y ratio on microstructure and mechanical properties of Mg-Zn-Y alloys. Mater. Lett. 2005, 59, 3801–3805. [Google Scholar] [CrossRef]
  21. Tahreen, N.; Chen, D.L. A critical review of Mg–Zn–Y series alloys containing I, W, and LPSO phases. Adv. Eng. Mater. 2016, 18, 1983–2002. [Google Scholar] [CrossRef]
  22. Zhang, E.; He, W.; Du, H.; Yang, K. Microstructure, mechanical properties and corrosion properties of Mg–Zn–Y alloys with low Zn content. Mater. Sci. Eng. A 2008, 488, 102–111. [Google Scholar] [CrossRef]
  23. Li, P.; Sun, Y.; Zhu, S.; Wang, L.; Guan, S.; Wang, J. Microstructure, corrosion and mechanical properties of as-cast Mg-Zn-Y with different Zn-to-Y ratios. Mater. Today Commun. 2023, 37, 107562. [Google Scholar] [CrossRef]
  24. Izumi, S.; Yamasaki, M.; Kawamura, Y. Relation between corrosion behavior and microstructure of Mg–Zn–Y alloys prepared by rapid solidification at various cooling rates. Corros. Sci. 2009, 51, 395–402. [Google Scholar] [CrossRef]
  25. Jia, B.; Lyu, S.; Tian, L.; Chen, M. Effect of Y contents on the microstructure, mechanical properties, and corrosion behavior of biomedical Mg–0.5 Zn alloy. Adv. Eng. Mater. 2024, 26, 2400145. [Google Scholar] [CrossRef]
  26. Sheng, L.; Du, B.; Liu, Z.; Wu, D.; Xu, D.; Zheng, Y.; Xi, T. Optimizing long-term corrosion behavior of the Mg-4Zn-xY-0.5Nd alloy by minor Y regulation and multi-pass hot extrusion. Corros. Commun. 2026, in press. [Google Scholar] [CrossRef]
  27. Tang, C.; Lyu, S.; Zheng, R.; Li, G.; Liu, Z.; Chen, M.; Jiang, B. Realizing ultra-high strength and excellent ductility in a low-alloyed biomedical Mg-Zn-Ca-MgO composite. J. Magnes. Alloys 2024, 12, 5108–5118. [Google Scholar] [CrossRef]
  28. Min, D.-W.; Kim, Y.H.; Kwon, J.; Kim, J.-K.; Choi, C.; Yun, E.; Cha, C.; Choi, S.H.; Park, H.; Lee, J.G.; et al. In vitro and in vivo degradation behavior of a corrosion-resistant Mg alloy with combined addition of rare-earth elements. J. Magnes. Alloys 2025, 13, 3918–3930. [Google Scholar] [CrossRef]
  29. Yin, W.; Briffod, F.; Shiraiwa, T.; Enoki, M. Mechanical properties and failure mechanisms of Mg-Zn-Y alloys with different extrusion ratio and LPSO volume fraction. J. Magnes. Alloys 2022, 10, 2158–2172. [Google Scholar] [CrossRef]
  30. GB/T 24176-2009; Metallic Materials: Test Method for In Vitro Degradation of Magnesium and Magnesium Alloys. Standards Press of China: Beijing, China, 2009.
  31. Lei, L.; Cui, Z.; Pan, H.; Pang, K.; Wang, X.; Cui, H. Effect of extrusion on the microstructure and corrosion behavior of Mg-Zn-Mn-(0, 1.5)Sr alloys in Hank’s solution. Corros. Sci. 2022, 195, 109975. [Google Scholar] [CrossRef]
  32. GB/T 16886.5; Biological Evaluation of Medical Devices-Part 5: Tests for In Vitro Cytotoxicity. Standards Press of China: Beijing, China, 2017.
  33. Wu, B.; Yusof, F.; Li, F.; Miao, H.; Bushroa, A.R.; Muhamad, M.R.B.; Badruddin, I.A.; Ibrahim, M.Z. Effects of friction stir processing and nano-hydroxyapatite on the microstructure, hardness, degradation rate and in-vitro bioactivity of WE43 alloy for biomedical applications. J. Magnes. Alloys 2024, 12, 209–224. [Google Scholar] [CrossRef]
  34. Kocks, U.; Mecking, H. Physics and phenomenology of strain hardening: The FCC case. Prog. Mater. Sci. 2003, 48, 171–273. [Google Scholar] [CrossRef]
  35. Valle, J.A.; Carreño, F.; Ruano, O.A. Influence of texture and grain size on work hardening and ductility in magnesium-based alloys processed by ECAP and rolling. Acta Mater. 2006, 54, 4247–4259. [Google Scholar] [CrossRef]
  36. Singh, A.; Osawa, Y.; Somekawa, H.; Mukai, T. Effect of microstructure on strength and ductility of high strength quasicrystal phase dispersed Mg-Zn-Y alloys. Mater. Sci. Eng. A 2014, 611, 242–251. [Google Scholar] [CrossRef]
  37. Wang, D.; Jiang, X.; Chen, C.; Zhang, X.; Jin, Z.-Z.; Cao, F.; Zhu, J.-N.; Wang, C.; Ma, Y.; Zha, M. Adjustable corrosion and mechanical properties of Mg-Zn-Ca-Ni alloys for fracturing materials. J. Magnes. Alloys 2025, 13, 2618–2635. [Google Scholar] [CrossRef]
  38. Wang, D.; Zhang, Y.; Zhou, P.; Xiao, L.; Yang, L.; Yang, W.; Nie, J.; Zhang, T.; Wang, F. Optimizing the corrosion resistance-strength synergy of Mg-6Gd-3Y-0.5Zr alloy via trace in addition. Corros. Sci. 2025, 254, 113058. [Google Scholar] [CrossRef]
  39. Zhao, W.; Wang, D.; Dong, X.; Jia, H.; Yang, Y.; Xu, J.; Wang, X.; Zha, M.; Wang, H. Exploring the corrosion behavior of bimodal-grained structured Mg-2.5Zn-0.2Ce alloy with a high strength-ductility synergy. Corros. Sci. 2025, 255, 113062. [Google Scholar] [CrossRef]
  40. Song, Y.; Han, E.-H.; Shan, D.; Yim, C.D.; You, B.S. The role of second phases in the corrosion behavior of Mg–5Zn alloy. Corros. Sci. 2012, 60, 238–245. [Google Scholar] [CrossRef]
  41. Abidin, N.I.Z.; Atrens, A.D.; Martin, D.; Atrens, A. Corrosion of high purity Mg, Mg2Zn0. 2Mn, ZE41 and AZ91 in Hank’s solution at 37 °C. Corros. Sci. 2011, 53, 3542–3556. [Google Scholar] [CrossRef]
  42. Zhang, C.-Y.; Zeng, R.-C.; Liu, C.-L.; Gao, J.-C. Comparison of calcium phosphate coatings on Mg–Al and Mg–Ca alloys and their corrosion behavior in Hank’s solution. Surf. Coat. Technol. 2010, 204, 3636–3640. [Google Scholar] [CrossRef]
  43. Mei, D.; Zhang, Q.; Li, Y.; Liu, M.; Li, W.; Jiang, P.; Hou, R.; Zhu, S.; Wang, L.; Guan, S. The misalignment between degradation rate and mechanical integrity of Mg-Zn-Y-Nd alloy during the degradation evaluation in modified Hanks’ solutions. J. Magnes. Alloys 2024, 12, 3661–3674. [Google Scholar] [CrossRef]
  44. Li, Y.-J.; Li, M.-X.; Wang, B.-Y.; Ren, M.-W.; Wang, C.; Zha, M.; Gao, Y.; Wang, H.-Y. Effect of Sn addition on the microstructure and corrosion behavior of dilute wrought Mg-Zn-Ca series alloys. Corros. Sci. 2024, 235, 112180. [Google Scholar] [CrossRef]
  45. Liu, X.; Shan, D.; Song, Y.; Han, E.-H. Influence of yttrium element on the corrosion behaviors of Mg–Y binary magnesium alloy. J. Magnes. Alloys 2017, 5, 26–34. [Google Scholar] [CrossRef]
  46. Liu, M.; Schmutz, P.; Uggowitzer, P.J.; Song, G.; Atrens, A. The influence of yttrium (Y) on the corrosion of Mg–Y binary alloys. Corros. Sci. 2010, 52, 3687–3701. [Google Scholar] [CrossRef]
  47. Hort, N.; Huang, Y.; Fechner, D.; Störmer, M.; Blawert, C.; Witte, F.; Vogt, C.; Drücker, H.; Willumeit, R.; Kainer, K. Magnesium alloys as implant materials–Principles of property design for Mg–RE alloys. Acta Biomater. 2010, 6, 1714–1725. [Google Scholar] [CrossRef]
Figure 1. OM images and grain size statistical distribution of as-extruded Mg-Y-0.5Zn alloys: (a1a3) Mg-0.5Y-0.5Zn, (b1b3) Mg-1Y-0.5Zn, (c1c3) Mg-2Y-0.5Zn, and (d1d3) Mg-3Y-0.5Zn.
Metals 16 00747 g001
Figure 2. (a) XRD pattern of as-extruded Mg-Y-0.5Zn alloys and (b,c) local magnifications of the diffraction peaks in (a).
Metals 16 00747 g002
Figure 3. SEM images of as-extruded Mg-Y-0.5Zn alloys. (a1a3) Mg-0.5Y-0.5Zn, (b1b3) Mg-1Y-0.5Zn, (c1c3) Mg-2Y-0.5Zn, and (d1d3) Mg-3Y-0.5Zn.
Metals 16 00747 g003
Figure 4. Microhardness of as-extruded Mg-Y-0.5Zn alloys.
Metals 16 00747 g004
Figure 5. Mechanical tensile properties of as-extruded Mg-Y-0.5Zn alloys. (a) Stress–strain curves and (b) tensile properties.
Metals 16 00747 g005
Figure 6. Electrochemical properties of as-extruded Mg-Y-0.5Zn alloys. (a) Potentiodynamic polarization curves, (b) EIS spectra, and (c) equivalent circuit models of the EIS spectra.
Metals 16 00747 g006
Figure 7. Corrosion behavior of as-extruded Mg-Y-0.5Zn alloys in Hank’s solution. (a) Annual corrosion rates and (b) the change of the pH value.
Metals 16 00747 g007
Figure 8. Image of Mg-Y-0.5Zn samples without corrosion products after immersion for different times.
Metals 16 00747 g008
Figure 9. (ad) The 3D morphology of Mg-Y-0.5Zn samples without corrosion products and (e) the surface height differences.
Metals 16 00747 g009
Figure 10. SEM photographs of surface corrosion morphology of Mg-Y-0.5Zn alloys after 14 days of immersion. (a1,a2) Mg-0.5Y-0.5Zn, (b1,b2) Mg-1Y-0.5Zn, (c1,c2) Mg-2Y-0.5Zn, and (d1,d2) Mg-3Y-0.5Zn.
Metals 16 00747 g010
Figure 11. Microstructure of the cross-section of Mg-Y-0.5Zn alloys after 14 days immersion: (a1,a2) Mg-0.5Y-0.5Zn, (b1,b2) Mg-1Y-0.5Zn, (c1,c2) Mg-2Y-0.5Zn, and (d1,d2) Mg-3Y-0.5Zn.
Metals 16 00747 g011
Figure 12. Schematic diagram of corrosion mechanism of alloys with different Y contents.
Metals 16 00747 g012
Figure 13. MTT cell toxicity of as-extruded Mg-Y-0.5Zn alloys.
Metals 16 00747 g013
Table 1. EDS results corresponding to different points in Figure 3.
PointsAlloysElements (at.%)
MgZnY
AMg-0.5Y-0.5Zn84.950.1914.86
H99.650.210.14
BMg-1Y-0.5Zn74.360.5125.13
C98.730.450.82
I99.590.200.21
DMg-2Y-0.5Zn96.300.213.49
E88.110.5311.36
J99.590.150.26
FMg-3Y-0.5Zn86.680.2113.11
G98.400.680.92
K99.57 0.130.30
Table 2. Potentiodynamic polarization parameters of as-extruded Mg-Y-0.5Zn alloys.
AlloysEcorr (V)Icorr (μA·cm−2)Pi (mm/y)
Mg-0.5Y-0.5Zn−1.21916.340.37
Mg-1Y-0.5Zn−1.27612.430.28
Mg-2Y-0.5Zn−1.29119.830.45
Mg-3Y-0.5Zn−1.30017.850.41
Table 3. EIS fitting parameters of as-extruded Mg-Y-0.5Zn alloys.
AlloysMg-0.5Y-0.5ZnMg-1Y-0.5ZnMg-2Y-0.5ZnMg-3Y-0.5Zn
Rs (Ω•cm2)20.422.911.728.1
Rf (Ω•cm2)7141037529127
CPEf (μF)9.5 × 10−41.6 × 10−53.6 × 10−44.5 × 10−4
nf0.38250.92090.21610.5554
Rct (Ω•cm2)7081048558317
CPEct (μF)9.4 × 10−48.4 × 10−41.8 × 10−52.5 × 10−5
nct0.37850.38910.91940.9601
L (H•cm2)559439671965
Disclaimer/Publisher’s Note: The statements, opinions and data contained in all publications are solely those of the individual author(s) and contributor(s) and not of MDPI and/or the editor(s). MDPI and/or the editor(s) disclaim responsibility for any injury to people or property resulting from any ideas, methods, instructions or products referred to in the content.