


Abstract
Low-melting-point impurities in powder feedstock can trigger local melting phenomena in laser powder bed fusion (LPBF) parts and may initiate defects in printed components. Here, we combine bulk chemistry with automated, high-throughput particle-by-particle SEM/EDS to identify and quantify Sn-containing impurity particles in two gas-atomized Al–Mg–Zr powder batches with different bulk Sn levels. The aim was not to establish a direct batch-to-batch performance comparison, but to clarify whether Sn was uniformly distributed among the powder particles or concentrated in rare impurity particles. Although ICP analysis indicated only 0.07 ± 0.02 wt.% Sn in the Sn-higher batch and <0.01 wt.% Sn in the Sn-lower batch, automated SEM/EDS screening of 20,001 particles per batch revealed that Sn was present as a very small number of highly enriched particles with Sn > 45 wt.% (eight particles in the Sn-higher batch and three particles in the Sn-lower batch). In the Sn-higher batch, Sn-rich particles were predominantly spherical and fell within the LPBF feedstock size window (Dmax ≈ 25–40 μm), implying that standard sieving would not remove them. BSE imaging and EDS mapping of polished sections and fracture surfaces of LPBF specimens built from the Sn-higher batch revealed spatially localized Sn-rich features associated with pores and Sn-rich phases on the fracture surface, supporting a direct powder-to-part transfer. These results demonstrate that low bulk impurity levels can mask highly localized, particle-scale contamination and highlight the need for particle-level compositional screening to support robust powder qualification and reuse decisions in LPBF.
1. Introduction
Aluminum alloys produced by LPBF are increasingly attractive for aerospace and automotive applications due to their high strength-to-weight ratio and ability to manufacture complex lightweight structures [1,2]. However, their widespread adoption remains limited by process-induced defects that can initiate cracks and reduce component reliability under service conditions [3,4,5]. To address this challenge, self-healing materials offer a promising approach to extend the lifetime of additively manufactured components beyond conventional defect mitigation strategies.
AlMg8 alloys have previously been identified as promising candidates for defect healing but exhibit reduced mechanical properties compared to the high-strength alloys typically used in aeronautical and aerospace applications [6,7]. The Al–Mg–Zr alloy system was selected as a model healable alloy because Mg provides a high healing potential through its high diffusivity, high supersaturation after LPBF processing, and ability to promote localized melting during heat treatment [8,9]. Zr addition improves processability and mechanical properties through grain refinement and precipitation strengthening [10]. This combination makes Al–Mg–Zr a promising candidate for investigating defect healing in high-strength LPBF aluminum alloys, while also providing a suitable platform to assess the influence of powder feedstock quality.
While extensive research has established relationships between LPBF process parameters, microstructure and mechanical properties, the quality of powder feedstock remains a major source of variability and an under-controlled root cause for defects. Powder characteristics such as size distribution, shape and flowability affect layer uniformity and build stability [11,12]. In addition, rare foreign particles introduced during powder production, handling, sieving or machine changeovers may be incorporated into the powder bed and melt pool, where they can remain as discrete inclusions, local chemical heterogeneities or non-fused interfaces acting as stress concentrators [13,14].
Detecting such contaminants is challenging because bulk chemical analyses average the composition over thousands of particles and can therefore miss extremely localized anomalies. Particle-level approaches based on automated SEM/EDS (scanning electron microscope/energy-dispersive X-ray spectroscopy) enable the rapid screening of thousands of particles with both morphology and chemistry, and have been advocated for qualifying AM powders, particularly for fatigue-sensitive applications [13]. This is relevant because powder contamination has been shown to deteriorate fatigue life in additively manufactured steels [15] and to induce scatter in tensile properties when high-density inclusions are present [14].
For aluminum alloys, low-melting-point elements are of particular concern. Phases containing Pb can form low-temperature liquid films and promote intergranular fracture [16,17], and trace low-melting-point impurities have long been recognized as detrimental in Al alloys [18,19,20]. Tin (Sn) has a melting point of 232 °C (far below that of Al) and is sometimes used intentionally as a micro-alloying element to tailor precipitation [21,22]. In the Al–Mg–Zr powder investigated in this study, however, Sn is not part of the target composition and is therefore considered an unintended contaminant. Unlike controlled alloying additions, discrete Sn-rich particles may locally concentrate low-melting-point material within the powder bed and LPBF melt pool, even when the overall Sn content measured by bulk chemistry remains low. However, the particle-scale distribution, morphology, and possible persistence of Sn-rich contaminant particles in LPBF aluminum powders remain insufficiently clarified.
In this work, we combine ICP analysis with automated particle-by-particle SEM/EDS to identify and quantify Sn-rich impurity particles in Al–Mg–Zr powder for LPBF. Two powder batches with different bulk Sn levels are analyzed to determine whether Sn is uniformly distributed across the powder population or concentrated in rare, highly enriched particles, and LPBF specimens produced from the Sn-containing powder are examined to assess whether localized Sn-rich features can still be detected after processing. The novelty of this study lies in documenting the occurrence, morphology and size range of Sn-rich impurity particles at the individual-particle scale, and in connecting these powder-level observations with part-level SEM/EDS evidence of localized Sn-rich features. This approach helps distinguish localized Sn contamination from homogeneous trace alloying and highlights the value of particle-level chemical screening as a complement to bulk powder analysis.
2. Materials and Methods
2.1. Powder Feedstock
Two batches of pre-alloyed Al–Mg–Zr powders were produced by gas atomization, leading to a particle size distribution of nominally 20–63 μm. The elemental compositions were measured by inductively coupled plasma (ICP-OES; Agilent Technologies, Santa Clara, CA, USA) analysis and are summarized in Table 1. The two batches had different bulk Sn levels: 0.07 ± 0.02 wt.% Sn in batch A (Sn-high) and <0.01 wt.% Sn in batch B (Sn-low).
Table 1.
ICP-measured chemical composition of the two Al–Mg–Zr powder batches (wt.%).
2.2. Automated Particle-by-Particle SEM/EDS Analysis
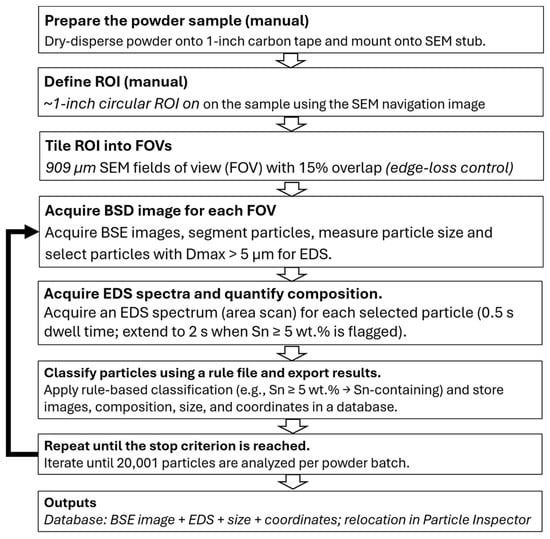
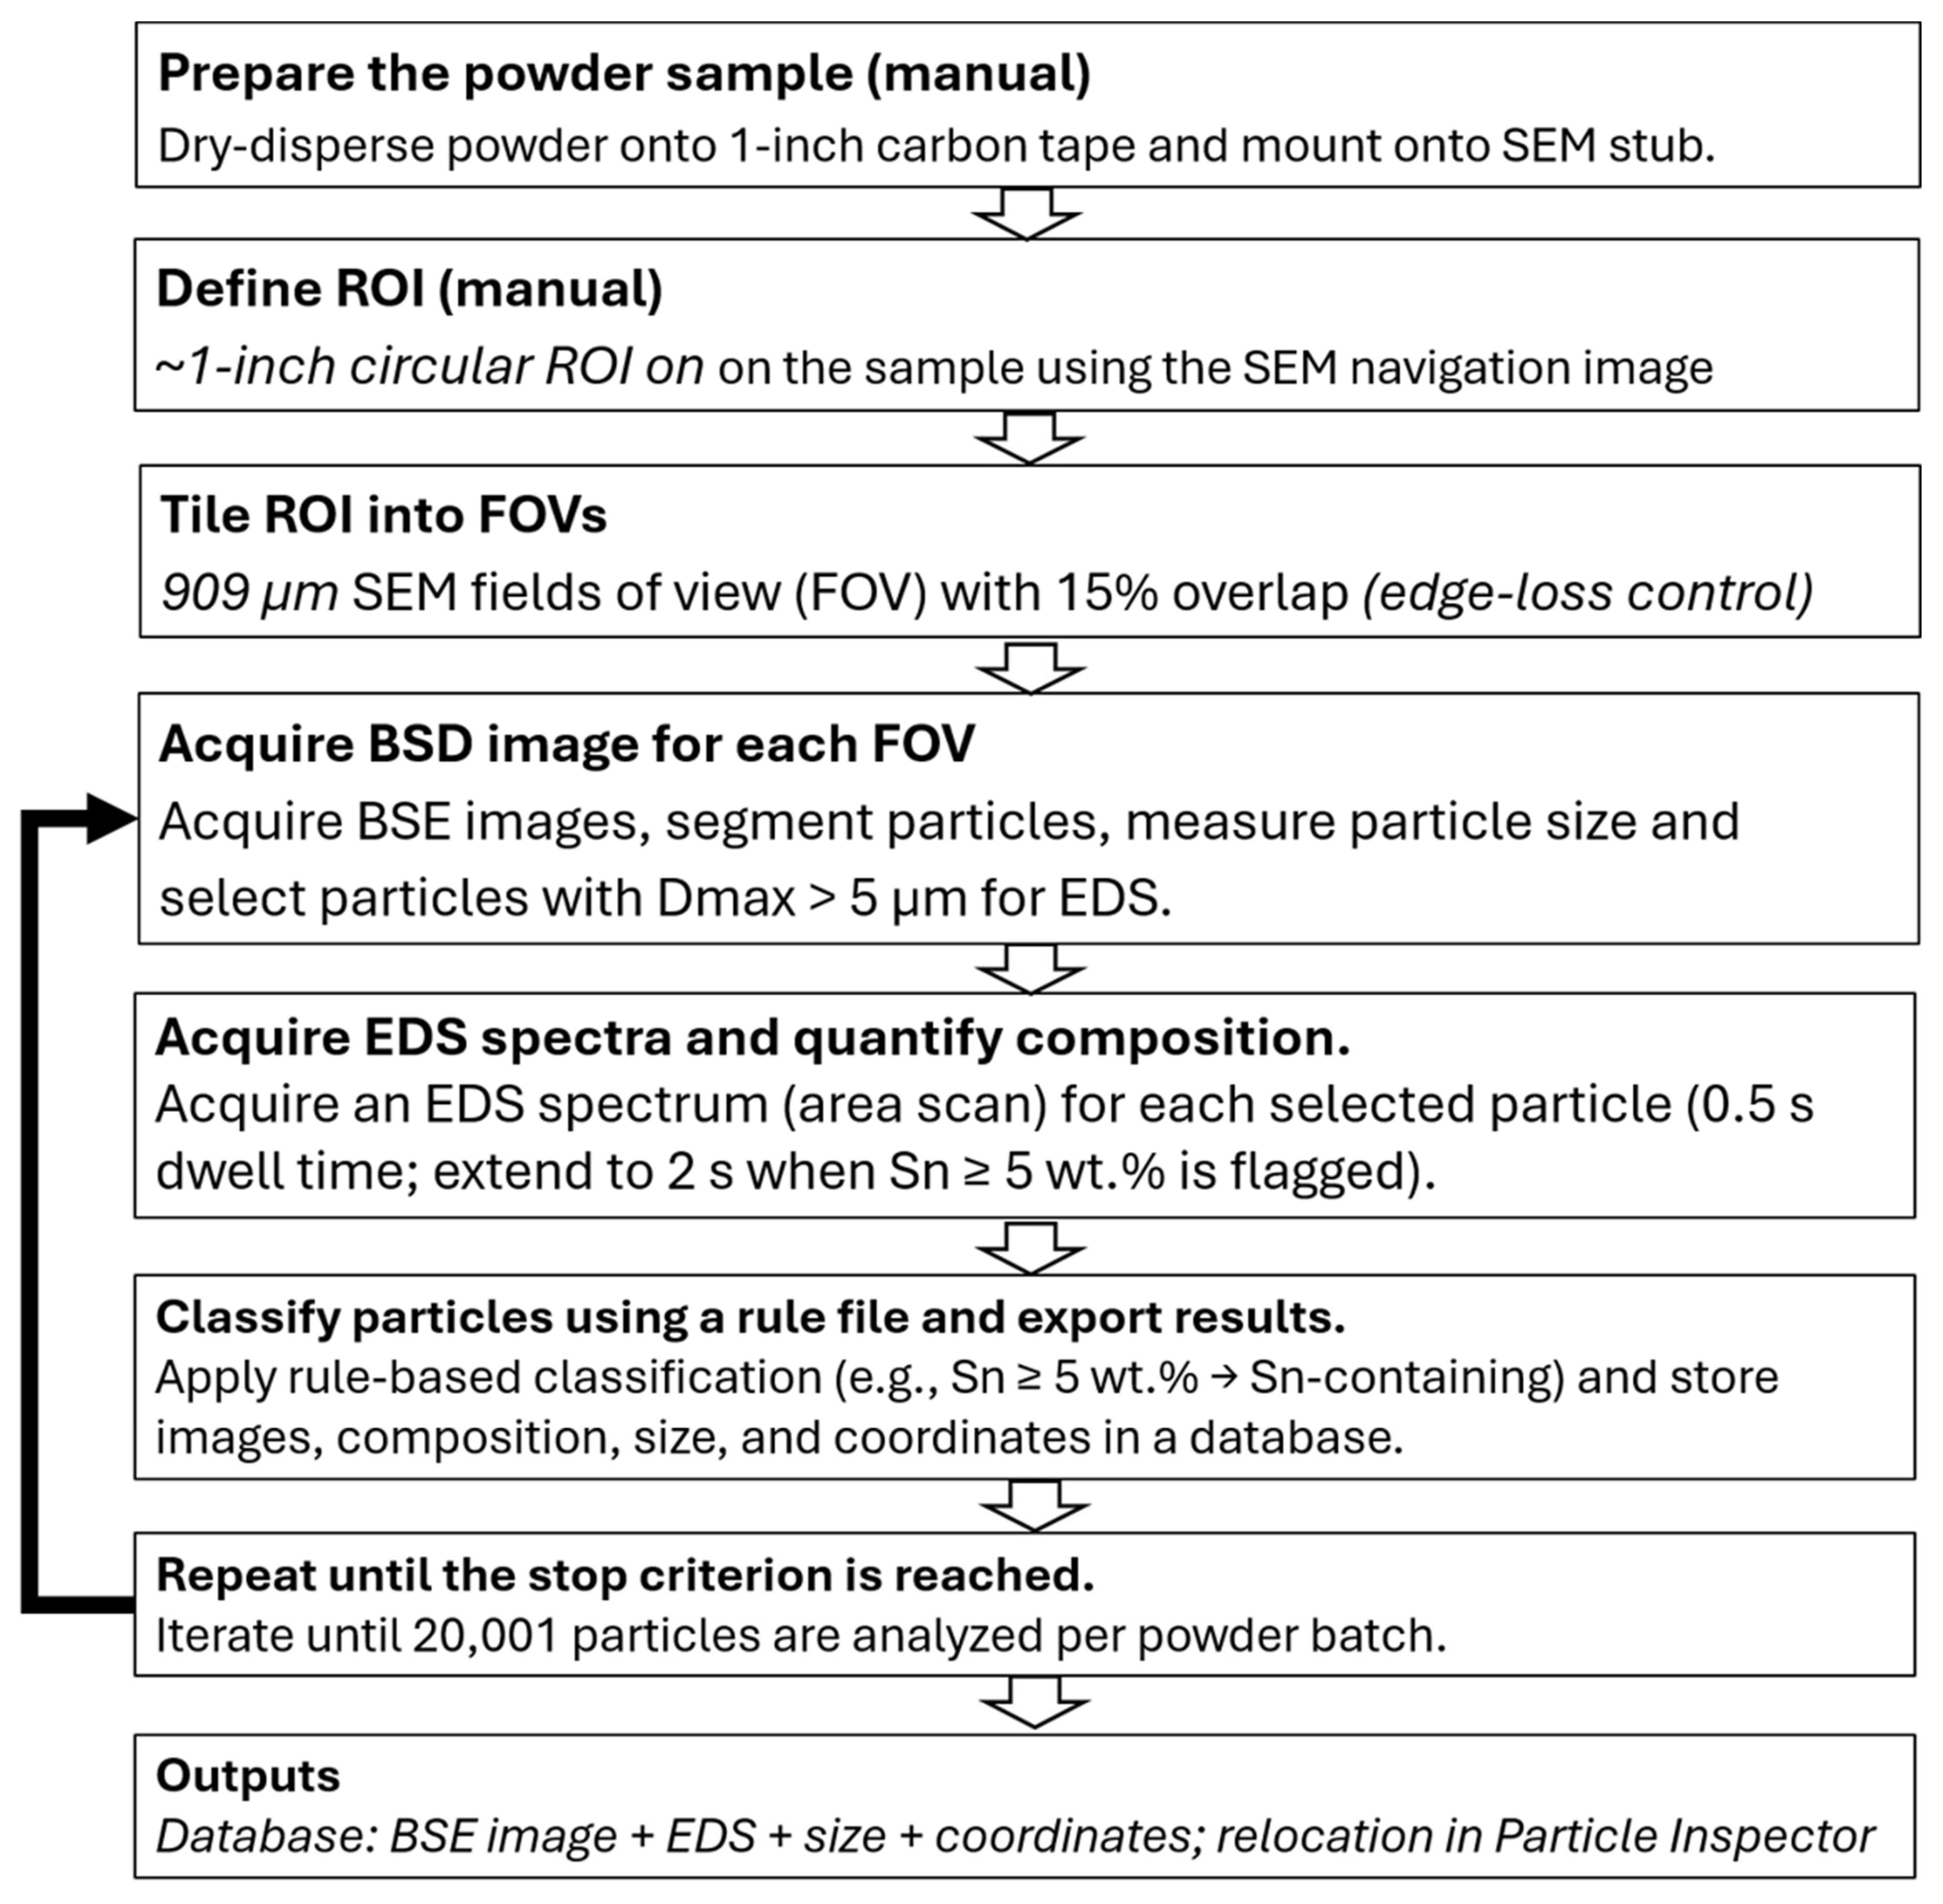
Particle-level screening was performed using a Phenom XL G3 SEM (Thermo Fisher Scientific, Eindhoven, Netherlands) equipped with a backscattered-electron (BSE) detector and energy-dispersive X-ray spectroscopy (EDS), controlled by the Perception automation platform, version 7.2. The workflow comprises two operator-driven setup steps followed by a fully automated Perception run, as summarized in Figure 1. The SEM was operated at 15 kV, 8.5 mm working distance, and 80% spot (~1 nA). Powders were dry-dispersed onto 1-inch carbon adhesive tabs mounted on aluminum stubs to achieve quasi-monolayer coverage, without conductive coating.
Figure 1.
Two-stage workflow for automated particle-by-particle SEM/EDS screening. Manual steps include powder mounting and region of interest (ROI) definition on the SEM navigation image. Perception then performs automated field of view (FOV) tiling with overlap and automatic de-duplication, BSE-based particle detection and sizing, triggered EDS acquisition, rule-based classification, and database export with relocation for verification.
Two manual steps preceded automation: (1) loading the sample stub into the SEM chamber, and (2) defining a ~1-inch diameter circular region of interest (ROI) on the sample using the SEM navigation image. Perception then tiled the ROI into 909 µm width fields of view (FOVs) with 15% overlap (edge-loss control) and automatically de-duplicated particles detected in overlap regions based on particle localization. Particles were detected using atomic-number (Z) contrast in BSE images, with metal particles appearing bright against the low-Z carbon tape background. So, BSE images were acquired for particle segmentation, centroid localization, and sizing. Particle size was reported as the maximum Feret diameter (Dmax); only particles with Dmax > 5 µm were subjected to EDS.
For each selected particle, an EDS spectrum (area scan) was acquired with a dwell time of 0.5 s and automatically extended to 2 s when Sn ≥ 5 wt.% was flagged to improve counting statistics. Particles were classified using a rule file into Sn-containing, Fe-rich, base-alloy classes, or unclassified. Sn-containing particles were defined as Sn ≥ 5 wt.% and Fe-rich particles as Fe ≥ 40 wt.% in the EDS output. These thresholds were chosen to provide robust classification during high-throughput automated analysis: the Sn threshold was set at 5 wt. % to reduce false-positive identification caused by spectral noise at short EDS acquisition times, while the relatively high Fe threshold was used to focus on particles with clearly elevated Fe content, as Fe may also be present in other particle types at lower levels. Base-alloy classes corresponded to the designed alloy composition, whereas particles not matching any predefined rule (e.g., unexpected or mixed compositions, or spectra with insufficient counts) were assigned to the unclassified category for subsequent review and potential reclassification. To ensure comparability between batches, runs were stopped after 20,001 analyzed particles per powder. Images, coordinates, size metrics, and EDS results were stored to enable post-run relocation and verification using Particle Inspector (a Perception software module for particle review and relocation). Compositions are reported as semi-quantitative particle snapshots influenced by surface oxides and particle curvature, but they are suitable for high-throughput impurity detection and classification.
2.3. Complementary SEM/EDS Mapping of LPBF Parts and Fracture Surfaces
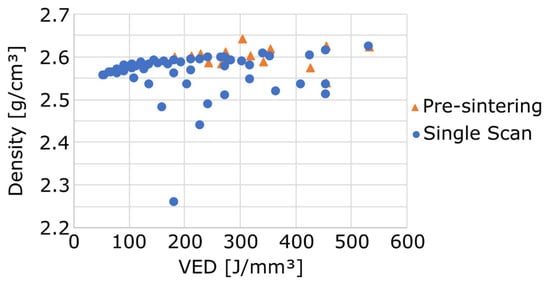
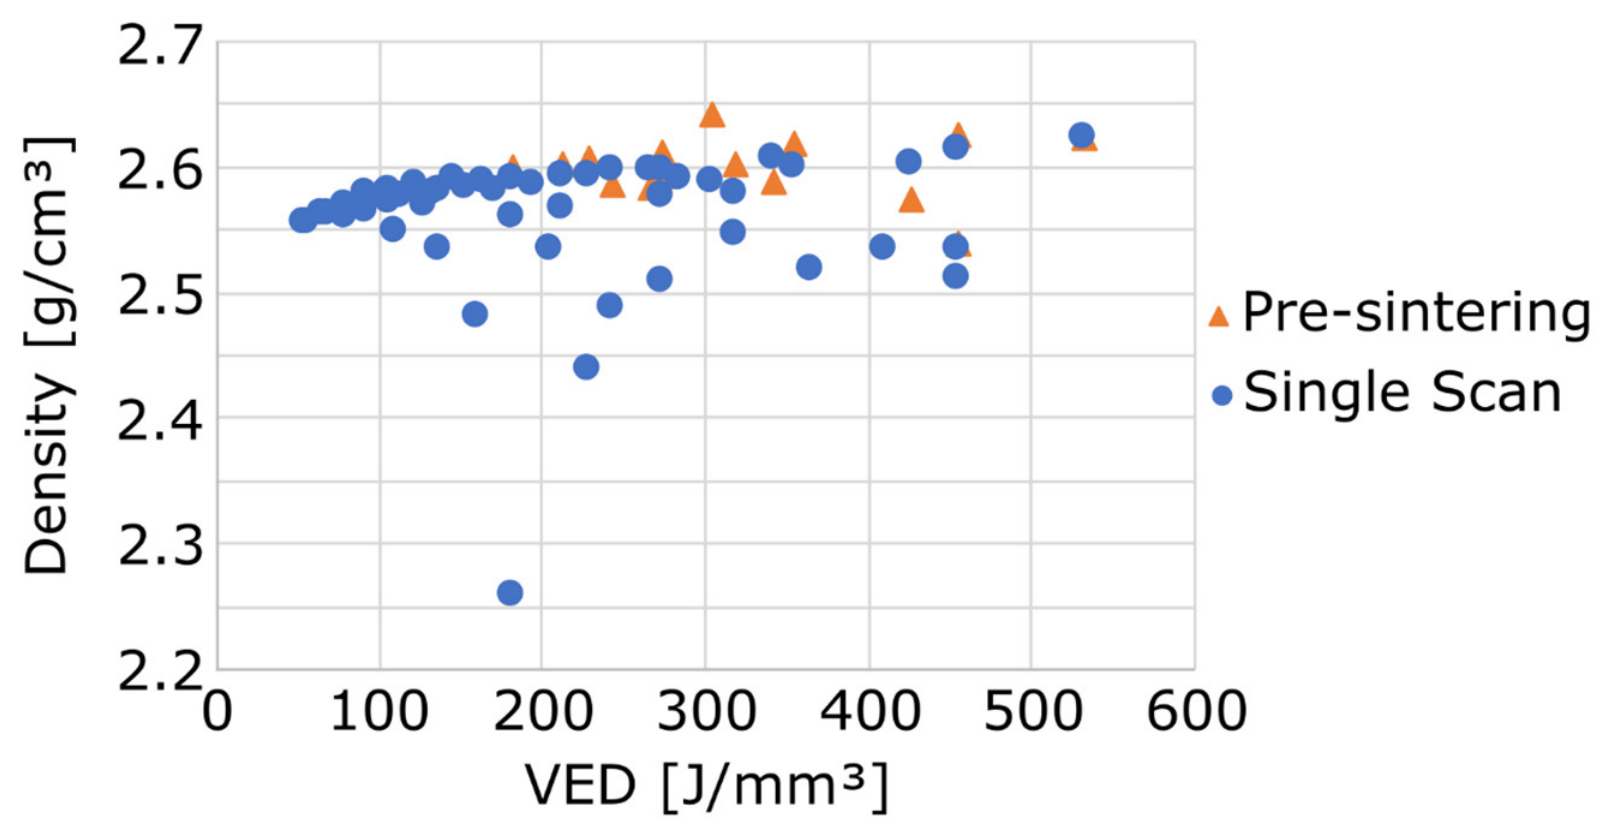
LPBF-built specimens were examined to assess whether Sn-rich features identified at the powder-particle level could still be detected after processing. A ProX DMP 200 LPBF machine (3D Systems, Rock Hill, SC, USA) was used to manufacture plates (100 × 13 × 1.5 mm3) with both powder batches. Process parameters were optimized to achieve maximum density with batch A powder. Parallelepiped specimens (10 × 10 × 5 mm3) were produced using a fixed hexagonal scanning strategy and a constant powder layer thickness t of 30 µm, while the laser power P (164–273 W), scanning speed v (200–1200 mm/s) and hatch spacing HS (50–100 µm) were systematically varied. Two scanning strategies were investigated: a single scan (SS) strategy and a pre-sintering (PS) strategy were used. The PS strategy consists of scanning each powder layer twice, with the first pass performed at half the laser power of the second pass [23,24]. Density was measured using the Archimedes’ method with ethanol as the immersion liquid ( = 0.79105 g/cm3 at 18 °C). Figure 2 presents the measured densities as a function of the volumetric energy density (VED) [J/mm3]. The VED is defined as [25]. For the PS strategy, the VED was calculated based only on the second laser and is therefore underestimated. The highest density was obtained for a laser power of 164 W, a scanning speed of 300 mm/s, a hatch spacing of 60 µm and using the PS strategy. For the batch B powder, similar processing parameters were employed, except that the SS strategy was used instead of the PS strategy 26.
Figure 2.
Density measured by Archimedes’ method as a function of the volumetric energy density (VED) for all parameters sets tested during optimization.
Three tensile specimens were machined from those plates by Electrical Discharge Machining (EDM) for batch A powder while nine tensile samples were machined for batch B powder, perpendicular to the building direction. The tensile specimens followed the ASTM-E8M standard 27 with a thickness of 1.5 mm, a reduced section length of 26 mm and a reduced section width of 6 mm. A Zwick/Roell 50 kN (ZwickRoell, Ulm, Germany) was used to performed tensile tests. The crosshead displacement was fixed at 1 mm/min and the gauge length at 20 mm.
A SEM equipped with EDS was used for manual micro-area analysis of three LPBF-built specimens printed with different processing parameters. As similar results were obtained for the three samples, the only sample discussed here is the one produced with optimal processing parameters. Polished cross-sections were examined by BSE imaging to assess local morphology and potential pits or porosity, followed by EDS elemental mapping analysis for composition. In addition, fractured tensile specimens were examined by SEM fractography, and EDS mapping was used to identify Sn-rich phases on the fracture surface. The purpose of these observations was to provide part-level information on the occurrence and spatial distribution of Sn-rich features after LPBF processing and to assess whether Sn-rich contamination identified in the powder feedstock could be traced in the printed parts.
3. Results and Discussion
3.1. Automated Screening Statistics and Impurity Particle Populations
Table 2 summarizes the automated SEM/EDS classification results. A total of 20,001 particles were analyzed per powder in ~110 min. For both batches, the vast majority of particles matched the base-alloy classes (Al–Mg–Zr and Al–Mg). Sn-containing particles were extremely rare (<0.05% of the population) but exhibited very high Sn concentrations, indicating that the bulk Sn measured by ICP originates from a small number of highly enriched particles rather than from homogeneous micro-alloying.
Table 2.
Summary of automated SEM/EDS particle classification results.
3.2. Sn-Containing Particles: Composition, Morphology and Size
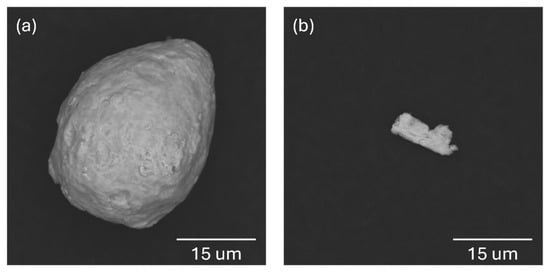
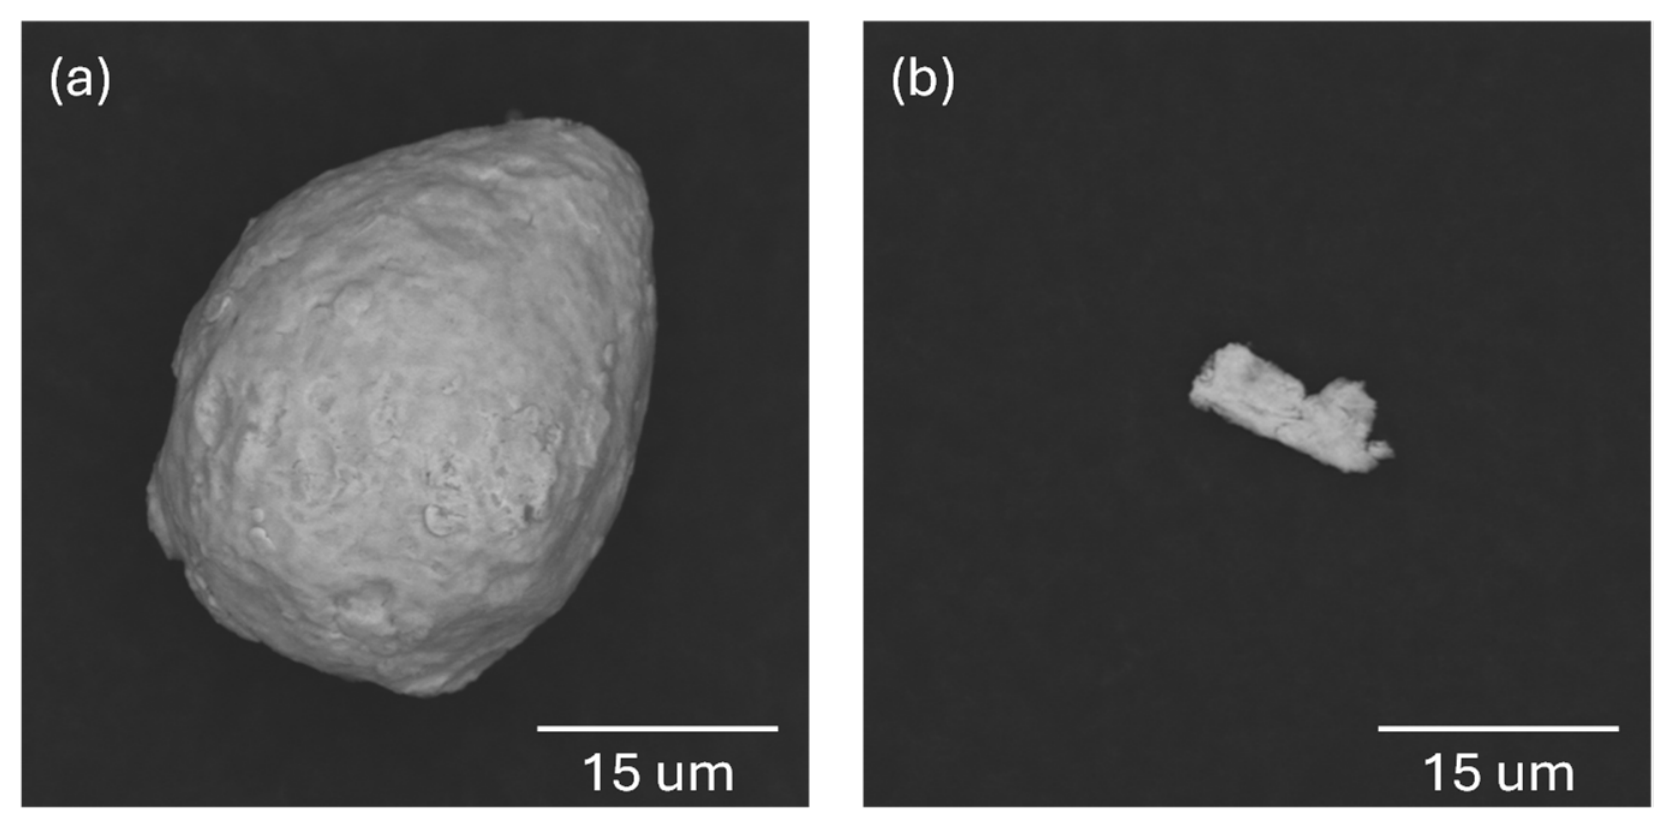
Table 3 lists the composition and size of all Sn-containing particles detected by the automated workflow. Despite their very low number, all detected Sn-containing particles were highly enriched in Sn, with Sn contents above 45 wt.% and up to approximately 88 wt.%, frequently accompanied by Cu. This confirms that Sn was not present as a homogeneous trace element in the powder population but was concentrated in discrete impurity particles. Differences in particle morphology and size were also observed between the two powders, as illustrated by representative BSE images in Figure 3. In batch A, the Sn-rich particles were mostly spherical and had Dmax values of approximately 25–40 μm (Figure 3a), whereas those detected in batch B were smaller (Dmax ≈ 6–14 μm) and more fragment-like (Figure 3b). Since the Sn-rich particles in batch A fall within the nominal 20–63 μm LPBF feedstock size range, they would not be removed by conventional sieving and could therefore be incorporated into the powder bed and melt pool.
Table 3.
Composition (EDS, wt.%) and maximum Dmax of Sn-containing particles.
Figure 3.
Representative BSE images of Sn-containing particles identified by the automated SEM/EDS workflow. (a) Batch A (Sn-high): predominantly spherical Sn-rich particle. (b) Batch B (Sn-low): fragment-like Sn-rich particle.
3.3. Fe-Rich Particles and Possible Sources
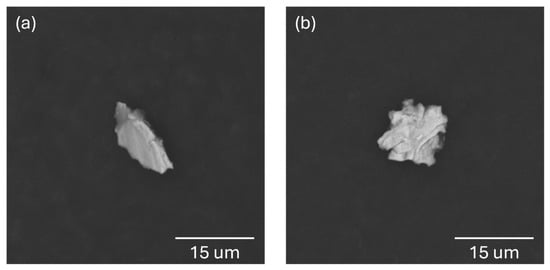
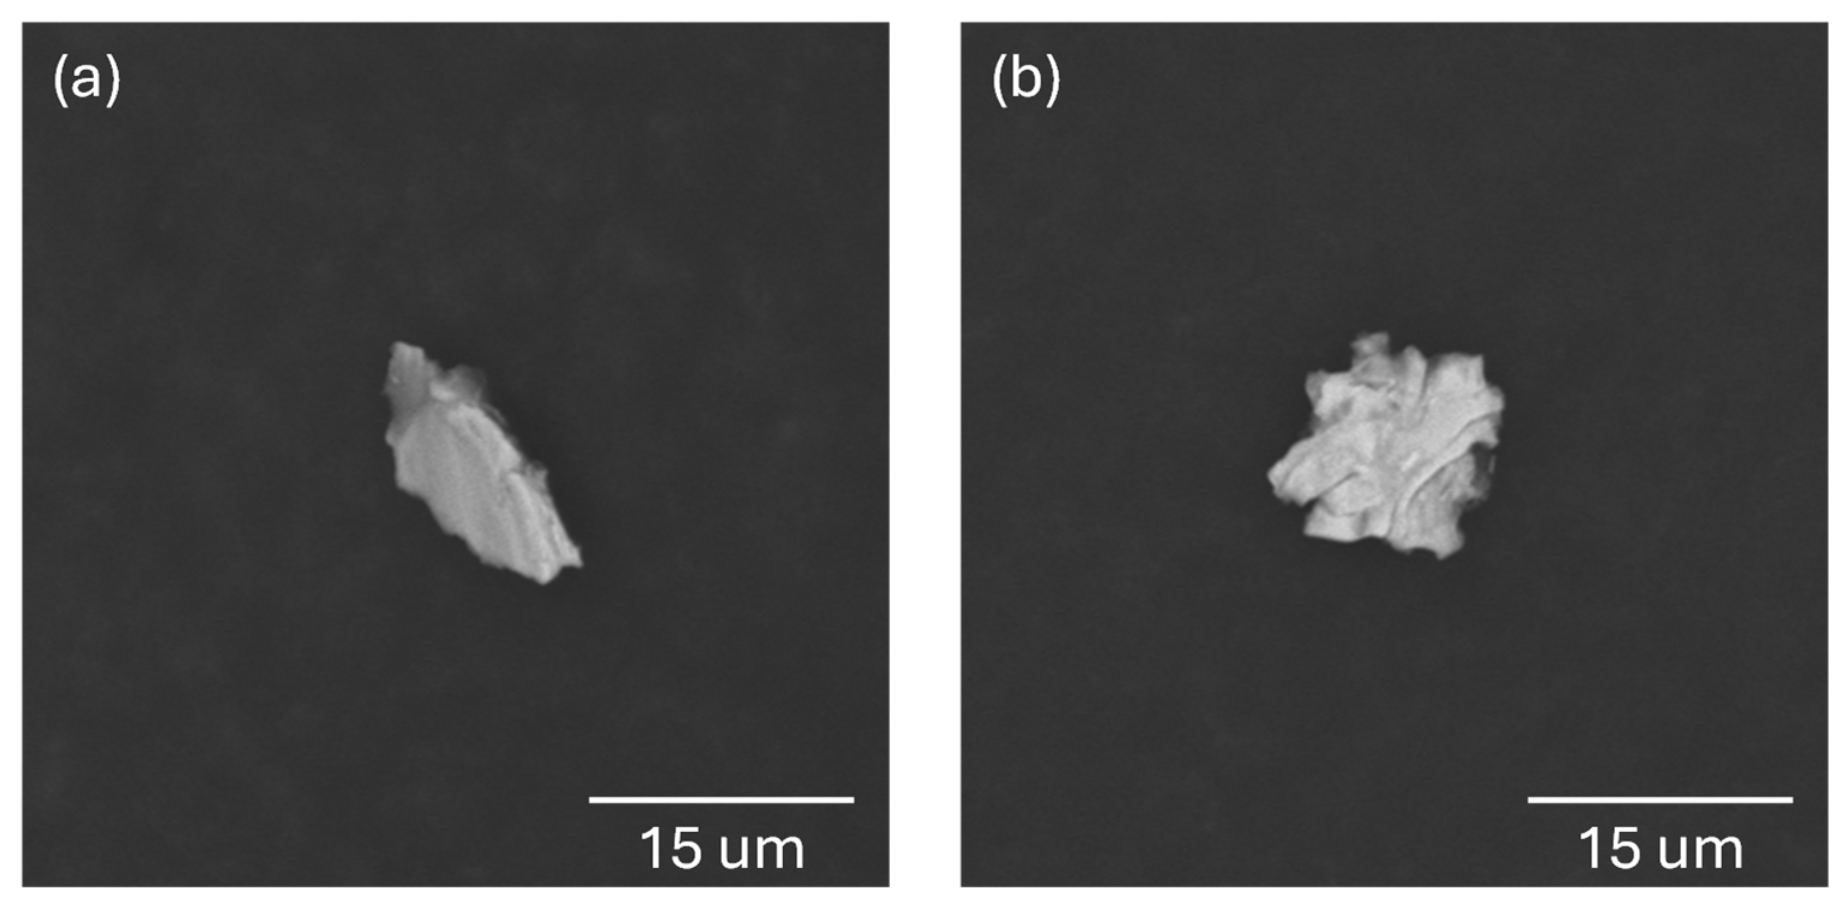
Fe-rich particles (Fe ≥ 40 wt.%) were also detected in both powders at similarly low counts (Table 2). Most Fe-rich particles were irregular and small, typically <15 μm, although particle 6 of batch A reached Dmax ≈ 24 μm, as illustrated by representative BSE images in Figure 4. In many cases, Cr and Ni were co-detected (Table 4), suggesting stainless steel-related debris originating from powder handling, sieving, or equipment wear. Similar metallic and ceramic contaminants have been widely reported in AM powders and may act as potential crack initiation sites depending on their size, morphology, and number density [12].
Figure 4.
Representative BSE images of Fe-rich particles (Fe ≥ 40 wt.%) identified by the automated SEM/EDS workflow in both powder batches. (a) Batch A. (b) Batch B.
Table 4.
Composition (EDS, wt.%) and maximum Feret diameter (Dmax) of Fe-rich particles (Fe ≥ 40 wt.%).
3.4. Persistence of Sn-Rich Features in LPBF Parts
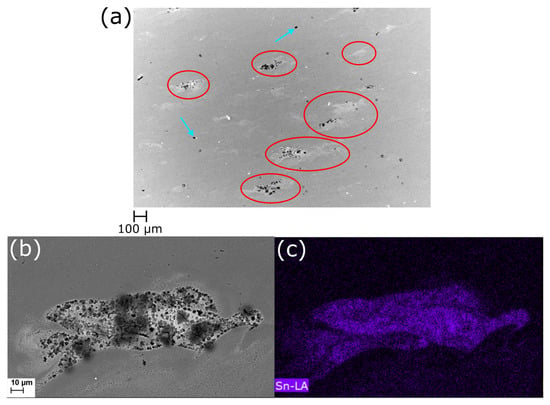
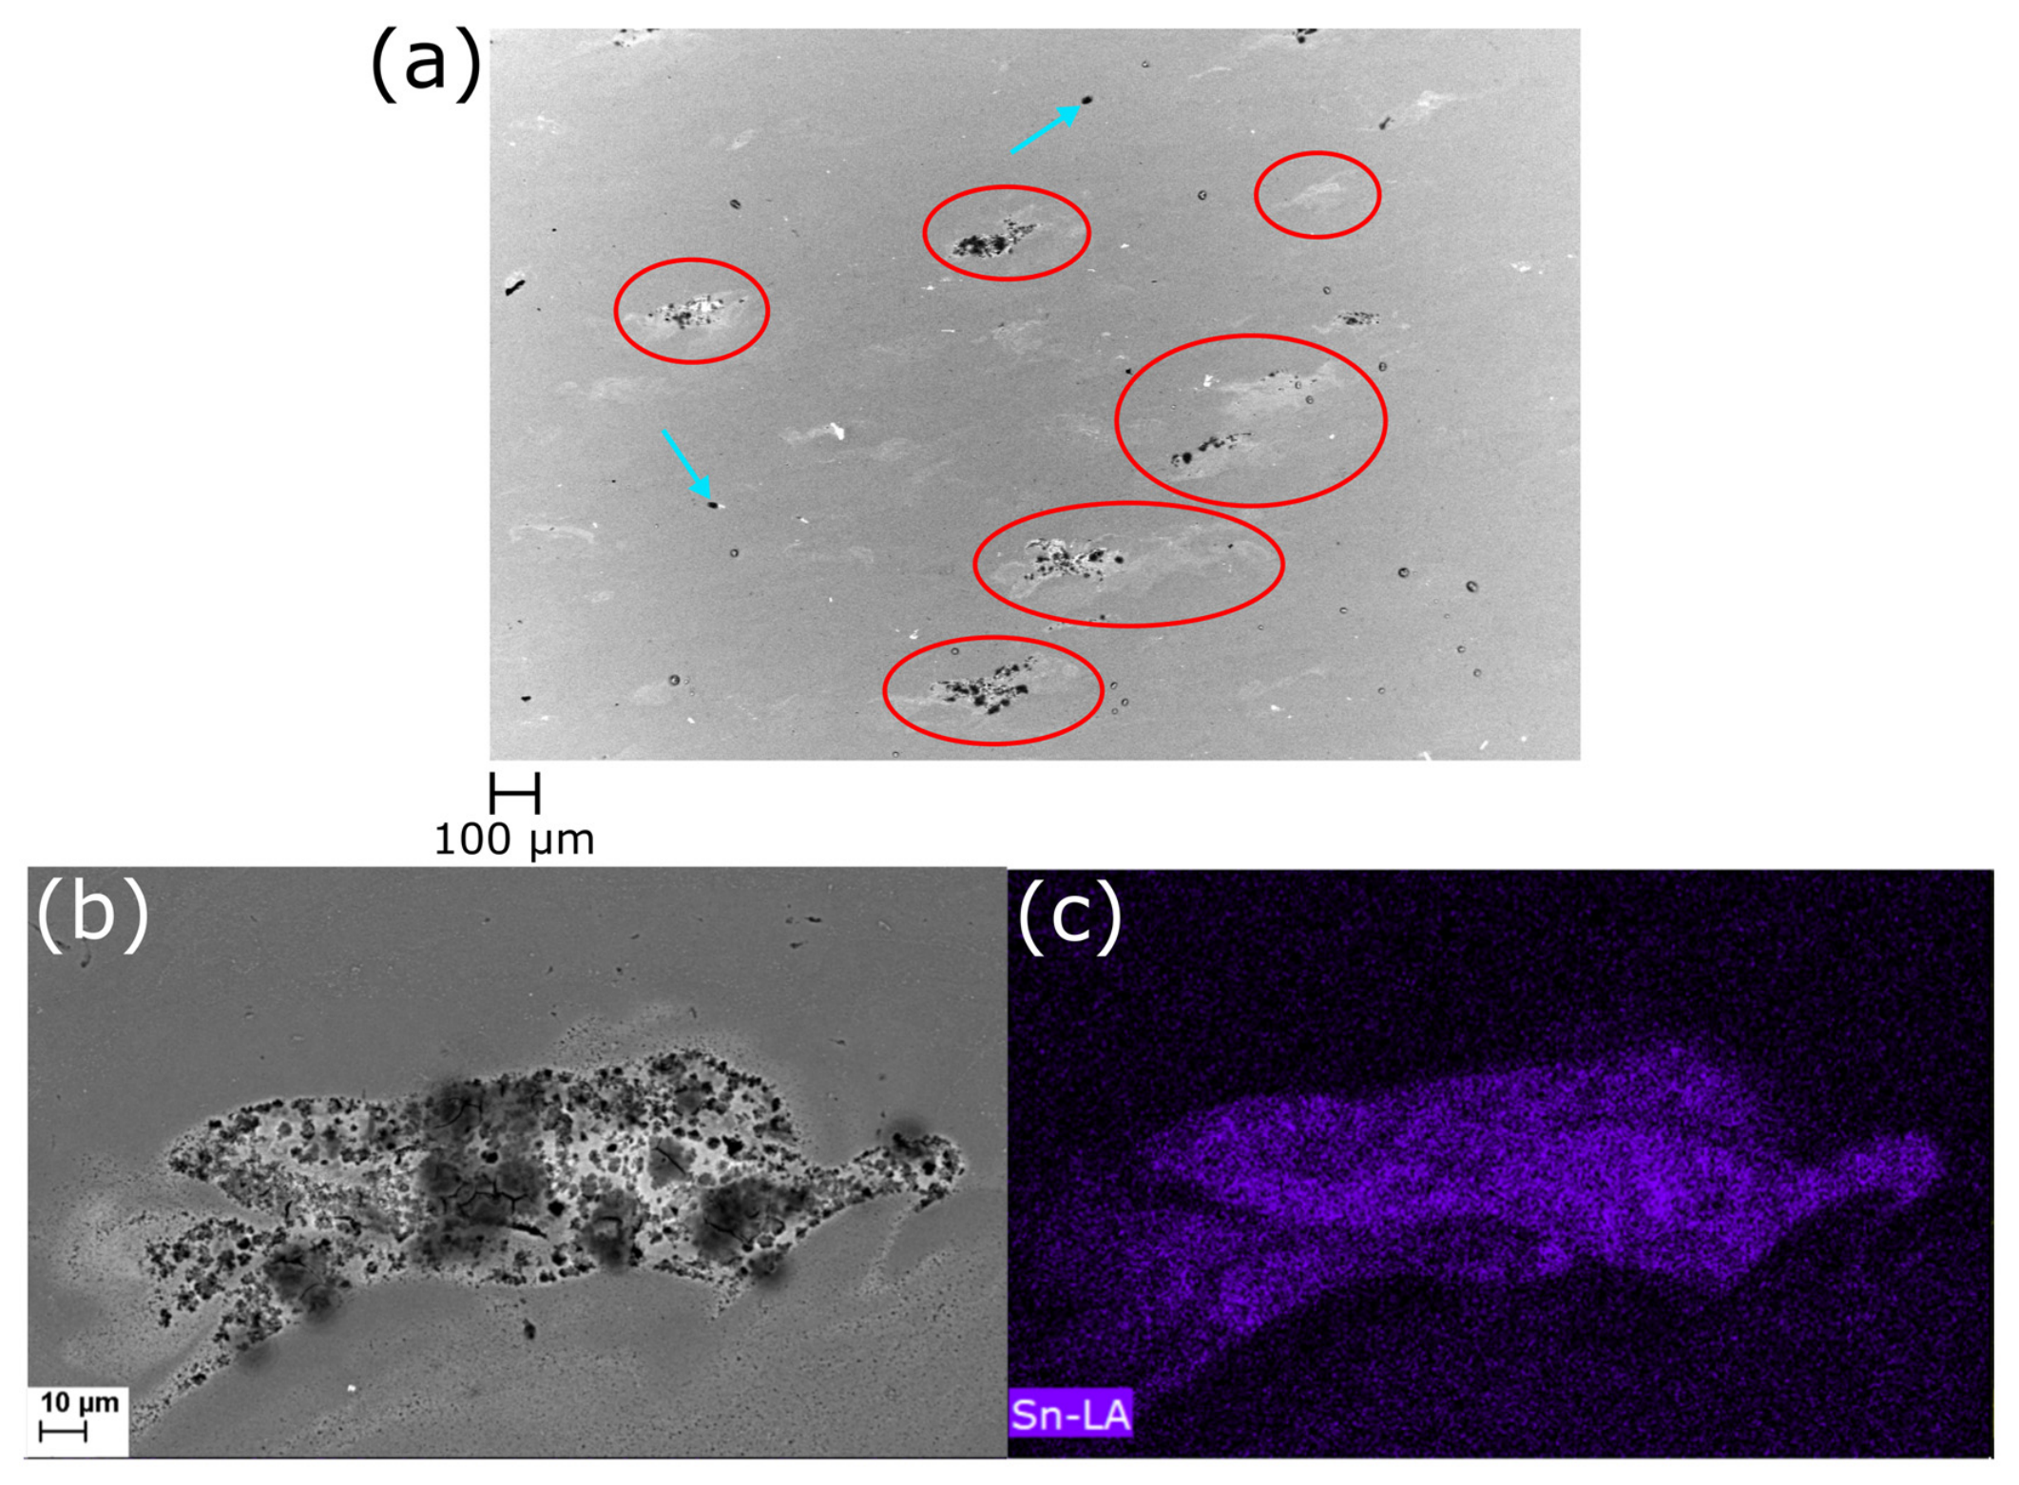
Figure 5a presents the microstructure of a specimen produced from batch A powder using the selected LPBF processing parameters. Localized Sn-rich regions were identified throughout the microstructure and are highlighted by the red circles. A higher-magnification view of one representative region is shown in Figure 5b, while the corresponding EDS Sn map (Figure 5c) confirms the presence of local Sn enrichment. These observations demonstrate that Sn-rich features can still be detected after LPBF processing.
Figure 5.
(a) BSE image of a polished section parallel to the build direction from an LPBF-built specimen produced with batch A, showing process-induced pores (blue arrows) and Sn-rich regions (red circles), (b) higher-magnification view of a Sn-rich region and (c) corresponding EDS Sn map confirming Sn enrichment in the highlighted region.
Some of the identified Sn-rich regions were observed in the vicinity of pores (blue arrows), whereas others occurred independently within the microstructure. However, based on the present observations, it is not possible to establish a direct relationship between Sn enrichment and pore formation, nor to determine whether pores located within or near Sn-rich regions originated from the LPBF process or from sample preparation (e.g., polishing).
EDS measurements of the Sn-enriched region shown in Figure 5 revealed an average composition of 3.6 ± 1.7 at.% Mg and 1.6 ± 1.0 at.% Sn, which is consistent with the possible presence of Mg2Sn precipitates. According to the Al–Sn phase diagram, no Al–Sn intermetallic phases are expected. No Sn was detected in the surrounding matrix by EDS analysis.
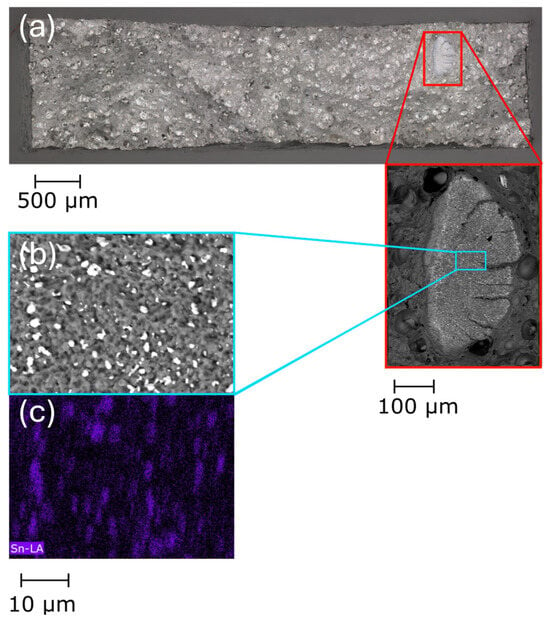
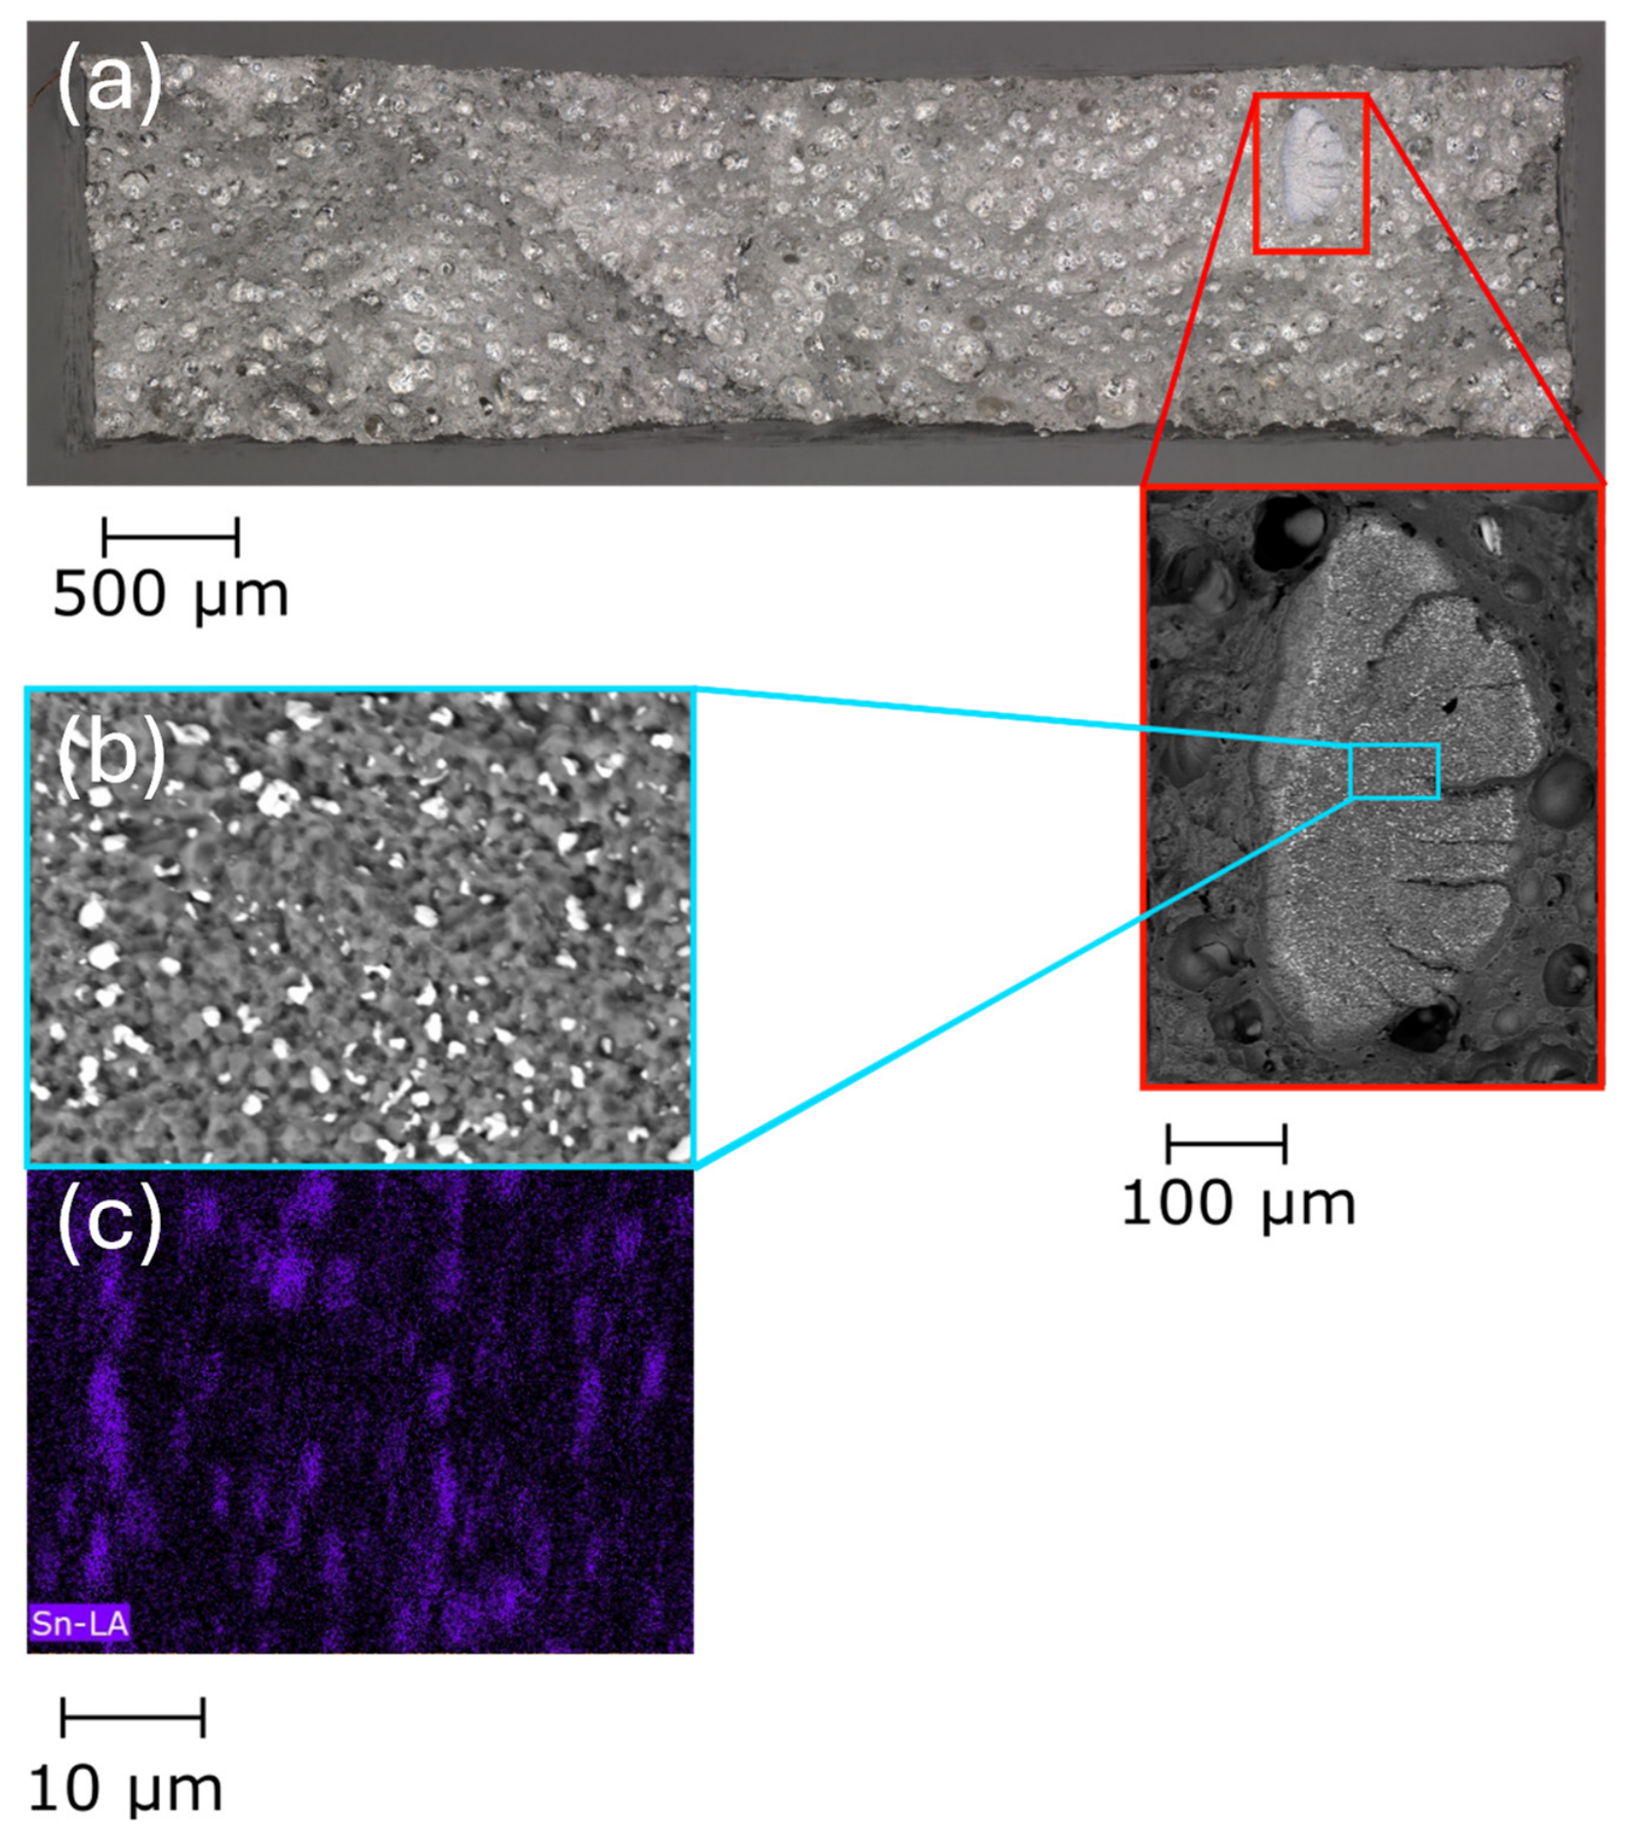
Samples produced from batch A exhibited an average yield strength of 298 ± 2 MPa, an ultimate tensile strength of 381 ± 6 MPa and an elongation at fracture of 13 ± 0.4%. Fractographic analysis of three tensile specimens from batch A revealed, in one specimen, a localized region densely populated with precipitate- or intermetallic-like particles on the fracture surface (Figure 6a). EDS mapping confirmed the presence of Sn-rich phases within this region (Figure 6b). Together with the observations from polished sections, these results demonstrate that localized Sn-rich features can still be detected after LPBF processing. In the same specimen, a microcrack was observed in the vicinity of a Sn-rich region (red rectangle in Figure 6a). However, the present observations do not allow a direct relationship between the microcrack and the Sn-rich feature to be established, as similar defects may also originate from LPBF processing conditions.
Figure 6.
(a) SEM-BSE fractography of a tensile specimen built from batch A and loaded perpendicular to the build direction, showing Sn-enriched regions on the fracture surface. (b) Higher-magnification view and (c) corresponding EDS Sn map confirming Sn-rich phases at the fracture surface.
For batch B, no localized Sn-rich features were identified in the limited part-level SEM/EDS observations. Given the very low number density of Sn-rich particles detected in this powder batch, their incorporation into the analyzed specimens is expected to be probabilistic, and the absence of detected Sn-rich features does not necessarily exclude their presence elsewhere in the built material. The corresponding specimens exhibited a yield strength of 290 ± 23 MPa, an ultimate tensile strength of 373 ± 25 MPa and an elongation at fracture of 11 ± 1.4%. Because the two batches differ slightly in composition, these values are reported for completeness and are not intended for a direct comparison of LPBF performance.
Overall, localized Sn-rich regions were identified in polished cross-sections of LPBF-built specimens, while Sn-rich phases were also detected on tensile fracture surfaces. Together with the particle-level observations in the powder feedstock, these results indicate that Sn-rich particles present in the powder can remain detectable after LPBF processing. The present study does not establish a direct relationship between the observed Sn-rich features and defect formation, fracture behavior or mechanical performance. However, the occurrence of such localized heterogeneities remains relevant from a powder-quality perspective. Previous studies have shown that foreign particles and powder cross-contamination can evade conventional powder acceptance protocols and negatively affect the performance of AM components, including increased scatter in tensile properties and reduced fatigue life [13,14,15]. The results of the present work therefore highlight the importance of particle-level screening methods that complement bulk chemical analysis and enable the detection of localized contamination that would otherwise remain hidden. Such methods may be particularly valuable for powder qualification and contamination monitoring when LPBF components are intended for fatigue-critical applications or operation in demanding service environments.
A possible explanation for the observed Sn-rich features is the incomplete homogenization of unintended Sn-bearing particles during LPBF. Because Sn has a much lower melting point than Al, Sn-rich particles may melt readily during laser exposure [16,17,18,19,20]. However, complete chemical mixing may be limited by the short melt-pool lifetime and rapid solidification during LPBF [23,24,25]. As a result, Sn can remain locally enriched after solidification and may contribute to Mg–Sn-rich features in the Mg-containing alloy. This interpretation is consistent with the local Mg/Sn enrichment measured by EDS and with the absence of detectable Sn in the surrounding matrix. Further work would be required to establish whether such Sn-rich features play a causal role in pore formation, cracking, or fracture behavior.
4. Conclusions
The novelty of this work lies in demonstrating that low bulk Sn levels can mask rare, highly Sn-enriched impurity particles and that such localized contamination can remain detectable after LPBF processing as Sn-rich microstructural or fracture-surface features. This provides a particle-level powder-quality perspective that cannot be obtained from bulk chemical analysis alone. The main findings are the following:
- Bulk Sn levels measured by ICP did not reflect the particle-scale distribution of Sn within the powder population. Automated SEM/EDS analysis showed that Sn-containing particles were extremely rare in both powders but occurred as highly concentrated Sn-rich impurity particles.
- In the analyzed populations of 20,001 particles per batch, eight Sn-rich particles were detected in batch A and three in batch B. All detected Sn-rich particles contained more than 45 wt.% Sn. In batch A, these particles had Dmax values between 27.6 and 39.6 μm, placing them within the nominal LPBF feedstock size range.
- BSE imaging and EDS mapping of polished cross-sections and tensile fracture surfaces of LPBF specimens built from batch A revealed spatially localized Sn-rich features, including Sn-rich regions in the microstructure and Sn-rich phases on the fracture surface. These observations indicate that particle-scale Sn contamination can persist after LPBF processing and is not distributed uniformly throughout the analyzed material volume.
Future studies should focus on the influence of Sn contamination on fatigue performance, with particular attention to its potential role as a stress concentrator and crack initiation site. In addition, the effect of Sn contamination during heat treatment should be examined, considering the low melting point of Sn relative to temperatures commonly used for post-processing treatments in Al-Mg-Zr alloys.
Author Contributions
Conceptualization, X.L. and A.S.; methodology, X.L.; software, X.L. and K.K; validation, S.D.R. and A.S.; formal analysis, X.L. and S.D.R.; investigation, X.L. and S.D.R.; resources, K.K. and A.S.; data curation, X.L.; writing—original draft preparation, X.L.; writing—review and editing, S.D.R., A.S. and K.K.; visualization, X.L.; supervision, A.S. and K.K.; project administration, A.S.; funding acquisition, A.S. All authors have read and agreed to the published version of the manuscript.
Funding
Project HAMAAC was selected in the Joint Transnational Call 2022 of M-ERA.NET 3, which is an EU-funded network of about 49 funding organizations (Horizon 2020 grant agreement No 958174). The project is funded by the Service public de Wallonie SPW—Belgium, Technology Agency of the Czech Republic (TACR) and Région Nouvelle-Aquitaine (RNAQ), France. Sophie De Raedemacker is a FRIA grantee of the Fonds de la Recherche Scientifique de Belgique FNRS and gratefully acknowledges their support.
Data Availability Statement
The original contributions presented in this study are included in the article. Further inquiries can be directed to the corresponding author.
Acknowledgments
The authors would like to thank Gaojie Li at Technische Universiteit Delft for her valuable support with the literature search.
Conflicts of Interest
Xi Liu and Karl Kersten was employed by the company Thermo Fisher Scientific. The remaining authors declare that the research was conducted in the absence of any commercial or financial relationships that could be construed as a potential conflict of interest.
References
- Altıparmak, S.C.; Yardley, V.A.; Shi, Z.; Lin, J. Challenges in Additive Manufacturing of High-Strength Aluminium Alloys and Current Developments in Hybrid Additive Manufacturing. Int. J. Lightweight Mater. Manuf. 2021, 4, 246–261. [Google Scholar] [CrossRef] [Scilit]
- Sing, S.L.; Yeong, W.Y. Laser Powder Bed Fusion for Metal Additive Manufacturing: Perspectives on Recent Developments. Virtual Phys. Prototyp. 2020, 15, 359–370. [Google Scholar] [CrossRef] [Scilit]
- Zitelli, C.; Folgarait, P.; Di Schino, A. Laser Powder Bed Fusion of Stainless Steel Grades: A Review. Metals 2019, 9, 731. [Google Scholar] [CrossRef] [Scilit]
- Santos Macías, J.G.; Zhao, L.; Tingaud, D.; Bacroix, B.; Pyka, G.; van der Rest, C.; Ryelandt, L.; Simar, A. Hot Isostatic Pressing of Laser Powder Bed Fusion AlSi10Mg: Parameter Identification and Mechanical Properties. J. Mater. Sci. 2022, 57, 9726–9740. [Google Scholar]
- Macías, J.G.S.; Elangeswaran, C.; Zhao, L.; Buffière, J.Y.; Van Hooreweder, B.; Simar, A. Fatigue Crack Nucleation and Growth in Laser Powder Bed Fusion AlSi10Mg under as Built and Post-Treated Conditions. Mater. Des. 2021, 210, 110084. [Google Scholar]
- Gheysen, J.; Tingaud, D.; Villanova, J.; Hocini, A.; Simar, A. Exceptional Fatigue Life and Ductility of New Liquid Healing Hot Isostatic Pressing Especially Tailored for Additive Manufactured Aluminum Alloys. Scr. Mater. 2023, 233, 115512. [Google Scholar] [CrossRef] [Scilit]
- Gheysen, J.; Pyka, G.; Winiarski, B.; Villanova, J.; Hannard, F.; De Raedemacker, S.; Donoghue, J.; Smith, A.; Simar, A. Development and Characterisation of a Liquid Phase Assisted Healable Aluminium-Magnesium Alloy Processed by Laser Powder Bed Fusion. Mater. Des. 2025, 258, 114573. [Google Scholar] [CrossRef] [Scilit]
- Van Dijk, N.; Van Der Zwaag, S. Self-Healing Phenomena in Metals. Adv. Mater. Interfaces 2018, 5, 1800226. [Google Scholar]
- Yu, H.; Shao, J.; Shuai, S.; Chen, C.; Wang, L.; San-Martín, D.; Xu, W. The Application of Self-Healing Concept in Ni Superalloys: Theoretical Design and Experimental Validation. Mater. Des. 2023, 237, 112587. [Google Scholar] [CrossRef] [Scilit]
- Croteau, J.R.; Griffiths, S.; Rossell, M.D.; Leinenbach, C.; Kenel, C.; Jansen, V.; Seidman, D.N.; Dunand, D.C.; Vo, N.Q. Microstructure and Mechanical Properties of Al-Mg-Zr Alloys Processed by Selective Laser Melting. Acta Mater. 2018, 153, 35–44. [Google Scholar] [CrossRef] [Scilit]
- Slotwinski, J.A.; Garboczi, E.J.; Stutzman, P.E.; Ferraris, C.F.; Watson, S.S.; Peltz, M.A. Characterization of metal powders used for additive manufacturing. J. Res. Natl. Inst. Stand. Technol. 2014, 119, 460–493. [Google Scholar] [CrossRef] [Scilit] [PubMed]
- Strondl, A.; Lyckfeldt, O.; Brodin, H.; Ackelid, U. Characterization and control of powder properties for additive manufacturing. JOM 2015, 67, 549–554. [Google Scholar] [CrossRef] [Scilit]
- Kennedy, S.K.; Dalley, A.M.; Kotyk, G.J. Additive manufacturing: Assessing metal powder quality through characterizing feedstock and contaminants. J. Mater. Eng. Perform. 2019, 28, 728–740. [Google Scholar] [CrossRef] [Scilit]
- Brandão, A.D.; Gerard, R.; Gumpinger, J.; Beretta, S.; Makaya, A.; Pambaguian, L.; Ghidini, T. Challenges in additive manufacturing of space parts: Powder feedstock cross-contamination and its impact on end products. Materials 2017, 10, 522. [Google Scholar] [CrossRef] [Scilit] [PubMed]
- Adamidis, P.; Tsakiris, A.; Savaidis, G. Fatigue of additively manufactured 18Ni300 maraging steel. Int. J. Fatigue 2026, 208, 109529. [Google Scholar] [CrossRef] [Scilit]
- Wouters, O.; De Hosson, J.T.M. Lead induced intergranular fracture in aluminum alloy AA6262. Mater. Sci. Eng. A 2003, 361, 331–337. [Google Scholar] [CrossRef] [Scilit]
- Lewandowski, J.J.; Kohler, V.; Holroyd, N.J.H. Effects of lead on the sustained-load cracking of Al-Mg-Si at ambient temperatures. Mater. Sci. Eng. 1987, 96, 185–195. [Google Scholar]
- Roth, M.C.; Weatherly, G.C.; Miller, W.A. The temperature dependence of the mechanical properties of aluminum alloys containing low-melting-point inclusions. Acta Metall. 1980, 28, 841–853. [Google Scholar]
- Webster, D. The effect of low melting point impurities on the properties of aluminum-lithium alloys. Metall. Trans. A 1987, 18, 2181–2193. [Google Scholar] [CrossRef] [Scilit]
- Horikawa, K.; Kuramoto, S.; Kanno, M. Intergranular fracture caused by trace impurities in an Al–5.5 mol% Mg alloy. Acta Mater. 2001, 49, 3981–3989. [Google Scholar] [CrossRef] [Scilit]
- Akopyan, T.K.; Belov, N.A.; Lukyanchuk, A.A.; Letyagin, N.V.; Milovich, F.O.; Fortuna, A.S. Characterization of structure and hardness at aging of the A319 type aluminum alloy with Sn trace addition. J. Alloys Compd. 2022, 921, 166109. [Google Scholar] [CrossRef] [Scilit]
- Li, G.; Guo, M.; Du, J.; Zhuang, L. Synergy of Sn micro-alloying and thermomechanical processing on formability and precipitation behavior of Al-Mg-Si-Cu-Zn alloys. Philos. Mag. 2023, 103, 435–464. [Google Scholar]
- Aboulkhair, N.T.; Everitt, N.M.; Ashcroft, I.; Tuck, C. Reducing Porosity in AlSi10Mg Parts Processed by Selective Laser Melting. Addit. Manuf. 2014, 1–4, 77–86. [Google Scholar]
- Nothomb, N.; Rodriguez-Barber, I.; Pérez-Prado, M.T.; Mena, N.J.; Pyka, G.; Simar, A. Understanding the Effect of Pre-Sintering Scanning Strategy on the Relative Density of Zr-modified Al7075 Processed by Laser Powder Bed Fusion. Addit. Manuf. Lett. 2024, 11, 100253. [Google Scholar]
- Yang, K.V.; Rometsch, P.; Jarvis, T.; Rao, J.; Cao, S.; Davies, C.; Wu, X. Porosity Formation Mechanisms and Fatigue Response in Al-Si-Mg Alloys Made by Selective Laser Melting. Mater. Sci. Eng. A 2018, 712, 166–174. [Google Scholar]
- De Raedemacker, S. Design and Characterisation of a New Healable High-Strength Aluminium Alloy Produced by Powder Bed Fusion—Laser Beam for Metals. Ph.D. Thesis, Université Catholique de Louvain, Ottignies-Louvain-la-Neuve, Belgium, 2026. [Google Scholar]
- ASTM E8/E8M; Standard Test Methods for Tension Testing of Metallic Materials. ASTM International: West Conshohocken, PA, USA, 2024.

Disclaimer/Publisher’s Note: The statements, opinions and data contained in all publications are solely those of the individual author(s) and contributor(s) and not of MDPI and/or the editor(s). MDPI and/or the editor(s) disclaim responsibility for any injury to people or property resulting from any ideas, methods, instructions or products referred to in the content. |
© 2026 by the authors. Licensee MDPI, Basel, Switzerland. This article is an open access article distributed under the terms and conditions of the Creative Commons Attribution (CC BY) license.