


Abstract
In this work, the phase field model was developed to understand the redistribution behavior of insoluble particles during metal solidification. This was achieved by modifying the pure solidification model to incorporate the insoluble particle using an interaction term for phase change interactions and the Lagrange multiplier for particle conservation. The novelty of this work involves the use of the phase field model for solidification and the use of the Lagrange multiplier as a simple diffuse interface approach to simulate particle capture or pushing with changes in solidification variables compared to complicated interface tracking approaches where particle capture and pushing are difficult to simulate. The developed model was applied to investigate the influence of materials properties and processing conditions on particle behavior at the solidification interface. The effect of parameters like particle diameter, solidification velocity, particle thermal conductivity, particle–solid interfacial energies and melt viscosities were investigated. The developed model can predict the influence of different parameters on particle behavior during both planar and dendritic solidification. Comparison of results shows that particles are easily engulfed during planar solidification whilst particle engulfment during dendritic solidification is difficult. In both cases, the critical velocities for particle incorporation increase with an increase in particle–solid surface energy and a decrease in particle to melt thermal conductivity ratios and melt viscosities.
1. Introduction
Interactions between moving solidification fronts with insoluble foreign particles are experienced in many processes and affect their redistribution in the solidified material [1,2]. The particles may be in solid (metallic and non-metallic), liquid or gaseous form. Among these interactions, solidification processing of metal matrix composites is of great importance in materials science and metallurgy as an economical route for production of metallic components with enhanced mechanical properties [3]. Metal matrix composites can be fabricated from steel, aluminum, magnesium, nickel and copper alloys reinforced with ceramic particles like SiC, graphite, SiO2, Al2O3 and ZrO2 [4,5]. These foreign particles are first tailored in size, shape and surface property and homogeneously dispersed at a required volume fraction in the melt before casting the slurry. During solidification, the introduced particles interact with the solidification front and the nature of the interaction occurring affects both their final distribution (inside the grain or on grain boundaries) and the microstructure of the cast component. It is important to determine the conditions under which particle incorporation occurs inside the grain during solidification for improved mechanical properties. The physics of incorporation is complex because many phenomena are involved, including thermal and fluid flow. The interactions occurring depend on the processing conditions and material properties of both the particle and the solidifying melt. Parameters of interest are the cooling rate, melt viscosity, shape, size and volume fraction of particles, thermal conductivities, and specific gravities of the particle, melt and solid [6]. To understand this complex interaction, analytical and numerical models are usually developed through employing thermodynamic, thermal, kinetic and dynamic theories [7,8,9,10]. Kinetic and dynamics-based models are more useful since they are capable of predicting critical velocities for particle incorporation inside the grain. The kinetic models employ equilibrium force balance whilst dynamic models consider transient particle acceleration to achieve particle incorporation. The thermodynamic argument is based on that incorporation should occur when the net change of free energy due to particle incorporation is negative. The kinetic theory suggests that the particle will not be incorporated as long as there is at least a finite layer of liquid between the solid and particle. It has been shown that, when the solidification front approaches an insoluble particle, the particle is subject to both pushing (repulsive) and attractive (hydrodynamic drag) forces [11]. If the attractive force is greater than the repulsive force, then the particle will be incorporated inside the grain, whilst pushing occurs when the repulsive force is greater than the attractive force. Thus, depending on the net force, the resultant effect may be that the particle may be continuously pushed, incorporated or pushed for some distance before being incorporated. Catalina et al. [9] derived the critical velocity for particle engulfment as follows:
where is the surface energy difference between the particle and the solidification front, a0 is the average atomic diameter of elements in the melt, is the melt viscosity, k is the interface curvature and R1 is the particle diameter. This equality between pushing and attraction occurs at a specific distance between the particle and the solidification front and particle capture occurs when distances are smaller than this value [9]. It was shown that the critical velocity above which the particle is incorporated decreases with an increase in particle radius. Asthana and Tewari [12,13] extensively reviewed the origins of the attractive and repulsive forces. In case of pure metals (the subject of this study), the pushing force is generated by the differences in interfacial energies between the particle and the engulfing solid. The attractive force (drag force) emanates from liquid viscous flow as the melt flow to fill the space previously occupied by the particle [14].
The ability to uniformly distribute fine particles inside grains during dendritic solidification is desirable for hardening of materials through an Orowan mechanism in which the presence of small particles inside grains impedes dislocation motion [14]. Pushing of particles ahead of the solidification front may be detrimental since they will accumulate at grain boundaries to impair mechanical properties like ductility and fracture toughness [15]. Besides being pushed by the solidification front, particle segregation can also be caused by other processes like fluid flow, particle settling, or casting of the melt with non-uniform particle distribution.
The nature of interactions between the solidification front and insoluble particles can be conveniently studied using directional solidification through either experiments or theoretical approaches. Many steady analytical and numerical models have been developed and have demonstrated potential to study the complex phenomena involved. Aspects like differences in thermal conductivities between the melt and the particle, particle radius, melt viscosity, compositional gradients, interface shapes and morphologies, particle clustering, melt convection, and differences in surface energy among particle, solid and liquid were considered [14]. However, many models do not capture both particle pushing and engulfment in a setup where the influence on the microstructure can be easily studied. Microstructure evolution in pure aluminum during dendritic solidification in the presence of SiC particles was simulated by Li et al. [16] using the 2D cellular automaton approach. However, only particle pushing was considered and it was assumed that particle incorporation inside grains is negligible. However, observations show that some particles are always engulfed during conventional casting [4,15]. Other models [17,18] treat insoluble particles as solutes diffusing by Brownian motion and in that manner the exact physics cannot be properly captured.
The phase field method is a recent powerful modeling approach capable of simulating complex interface movements occurring during solidification in the presence of insoluble particles. It can easily handle the influence of material and process conditions including heat and fluid flow to simulate microstructures with no need for explicitly tracking interface positions. The method considers the interface as a diffuse region where the phase changes from liquid to solid during solidification. Each governing equation is presented as one for both phases without distinguishing interfaces and this approach is efficient in numerical computations. Phase field order parameters are used to distinguish different phases of the system, for example, for the liquid phase, for the solid phase and for the two-phase region. The minimization of system free energy is used to predict microstructural evolution. The phase field evolution equation is used to track the phase field, the heat equation is used to analyze thermal flow, whilst the diffusion equation is used to predict solute redistribution when alloys are considered. The phase field evolves according to phenomenological parameters related to interfacial properties like surface energy, melt viscosity and interface thickness which for a specific material are all determined by the thin interface approach [19,20]. Thus, the phase field method is now widely used to model many processes, including solidification [21,22], solid-state transformations [23] and electrochemistry [24]. For detailed introduction to the method, the reader can follow an extensive review of the phase field theory by Moleans [25]. Thus, the influence of materials and process parameters can be conveniently incorporated and studied using this approach. There are few research papers on phase field modeling of solidification in the presence of insoluble foreign particles. Only recently have a few studies been performed. In particular, the initial step was modeling of the critical velocity for particle incorporation during directional solidification of a binary Fe-C alloy in the presence of SiO2 insoluble ceramic particles by Ode et al. [26,27]. The research demonstrated that it is possible to determine the forces acting on the particle from the calculated interface shapes. However, the model used had a drawback of long simulation times and the approach used for conserving mass as the particle moves during interactions with the solidification front is subject to some errors. In addition, the research did not consider the influence of other important parameters like thermal conductivities of the matrix and particle, particle–solid surface energies, particle size and melt viscosity on critical velocities for engulfment and the probable influence of these interactions on the final microstructure. Many models do not simultaneously consider particle engulfment and pushing, with some considering only pushing [16,28] while others consider only engulfment [8] and those considering both aspects are mostly sharp interface models difficult to implement and extend [17,27].
In this work, the phase field method is developed to study the distribution of particles in the microstructure during solidification as evidenced by either engulfment or pushing depending on the critical velocity of interface–insoluble particle interaction. The problem of particle behavior at the solidification front is easier to understand during directional solidification since particles can only be pushed or incorporated with no entrapment through maintaining a planar interface. However, in most applications, the interface is dendritic and should be considered. Thus, in this research we will first show the conditions for incorporation of a particle by a planar solidification front before considering incorporation when approached by a dendrite from different angles. The influence of process and materials parameters including solidification velocity, melt viscosity, particle–solid surface energy, particle radius, and ratios of particle to melt thermal conductivities on critical velocities for particle incorporation inside grains will be systematically studied using the phase field method to control particle distribution in the microstructure during solidification.
2. Model Formulation and Simulation Method
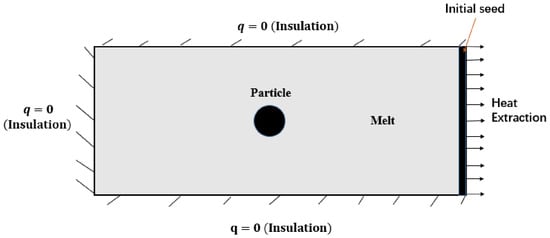
The physical domain used in this work is rectangular with a spherical particle in an undercooled melt and a planar or dendritic solidification interface advancing towards it from the right as shown in Figure 1. All sides of the domain are fixed in zero heat flux conditions and zero mass flux conditions. Solidification is initiated by the introduction of a small fraction of solid in the control volumes at the right boundary and progresses by extraction of the latent heat released during solidification. Then, the interaction of a particle with the solidification front in the domain is studied. The model developed for the solidification in the presence of a particle is presented in the next section and the code was developed in C language before simulations in the high-performance computer.
Figure 1.
The computational domain employed, the particle is placed away from the seed to make sure the interface velocity will be steady when approaching the particle. Heat is extracted perpendicularly from the seed for directional solidification to occur.
2.1. Solidification Model in Presence of a Particle
The phase field model developed by Karma et al. [19] was used for modeling the solidification of a pure metal in the presence of an insoluble particle. Many previous experimental and modeling studies on particle interaction with the solidification front considered pure metals so in this study a pure metal was selected to make it convenient for us to compare our results. The model for pure metal solidification was modified to incorporate the presence of a particle through using the interaction term (related to surface energy) for particle–solidification front interactions and the Lagrange multiplier was used to conserve the particle area during its movement. The free energy of pure metal with interaction effects included is given as:
where the function is the double well potential, is an interpolating function, the term is the particle–interface interaction term where is the interaction strength, is a constant being proportional to the inverse of the nucleation energy, and and are solid and particle phase field parameters. The total free energy is:
Through applying the variational principle, the non-conserving evolution equation for solidification becomes:
where
Thus,
Anisotropy in dendritic solidification is incorporated through:
where and is the anisotropic strength which can be experimentally determined, n is the dendrite orientation angle from the x-axis, is the isotropic value of the gradient coefficient, and is the normal angle between the interface and x-axis defined as . The noise term , where A is the amplitude and r is a random number generated between −0.5 and + 0.5, was added to the right-hand side of Equation (4) to introduce fluctuations at the solidification interface and side branching during dendritic solidification. The evolution of the phase field order parameter occurs with inside the solid, in the liquid and at the interface. To ensure that there is no phase change inside the particle we used zero phase field mobility inside the particle through adjusting the particle–solid interaction term.
The energy conserving parameter is heat, which is characterized by temperature and described by a coupled heat diffusion equation based on the enthalpy balance. The modified heat equation is:
where is the dimensionless temperature field, D is the thermal diffusion coefficient, the term represents latent heat release and is the sink term used to extract latent heat as soon as it is released from the interface during planar solidification i.e., heat extraction from the domain. The amount of heat removed from the domain via this term is equivalent to the amount of heat removed from the domain by imposing a cooling rate over the entire domain. The significance of this heat removal term has been described by Jegatheesan and Bhattacharya [17,18]. The thermal diffusivity inside the particle was controlled through the expression , where D is the diffusion coefficient in the matrix and the value of M can be adjusted to obtain the required diffusivity.
2.2. Particle Evolution Model
The movement of the particle is governed by the insoluble particle–interface interaction. The evolution equation of the particle is based on the following free energy functional which incorporates the interaction term.
The total free energy is:
where is the particle phase field parameter. Using the variational principle, we obtain:
where is the particle kinetic coefficient and is the Lagrange multiplier used to keep the particle either in motion or stationary. The Lagrange multiplier imposes some constraints on the particle by adjusting the model equations (as shown) to force the particle to behave as a rigid body while ensuring that both melt and particle are conserved. Such an approach is simple, more effective and superior to models which only consider particle engulfment without simultaneously considering both pushing and engulfment. is the coupling or tilt function and was derived and is found in [29,30] with the following form:
Therefore, in the particle phase,
Thus,
From Equation (7),
Thus,
where
It should be noted that when either in the bulk solid or liquid and is non-zero at the particle–matrix (solid/liquid) interface, showing that integrals are only evaluated at the interface.
In the variational form of the total free energy:
The expression of the Lagrange multiplier for a spherical particle was developed in [30,31] and was selected for its simplicity and easiness to implement and in this work it is modified to be:
2.3. Numerical Implementation
Assumptions
- The solid and melt have same thermal conductivities whilst that of the particle is varied.
- The insoluble particle is assumed spherical in shape.
- Heat is assumed to flow mainly through conduction.
- The effect of natural convection is not considered and is assumed to be negligible.
The dynamic equations can be made simpler if conveniently considered in dimensionless form by rescaling space as , and time as . Then in Equation (3) we can treat while in Equation (6) we treat . Numerical implementation of Equations (4) and (10) is based on the finite difference algorithm for spatial derivatives and Euler forward method for time integration. Simulation domains of size 500 400 for planar solidification and 600 600 for dendritic solidification with space discretization of are used. The model was tested for convergence using different spatial resolutions to determine solidification velocities under planar solidification and plotting velocities vs. time relationships following our previous work [31] and converged when . Integration time step is . A 2D geometry with a spherical particle and boundary conditions for planar solidification is shown in Figure 1. Particles with different radii in the range of 0.1–0.5 m were used. The particle to melt thermal conductivity ratios (kp/km) were in the range of 0.5–1.5, representing different metal oxide systems since koxides/kmetals of many systems are around 0.4–1.5 [14]. The growth velocities were controlled through adjusting undercoolings and were calculated using , where is the actual diffusion and is the interface thickness. The velocities were found to be in the range of (6.0–8.8) 10−4 m/s and these are the typical values encountered during the solidification process. Particle–solid interfacial energy ratios after incorporation were computed during simulation for each interaction parameter through integration using:
Melt viscosity was determined in a steady state by balancing the drag force exerted by the liquid melt with the interfacial pushing force on the particle. When the particle velocity reaches equilibrium with interfacial velocity :
Thus,
All parameters used are summarized in Table 1. For a particular particle size, the critical velocity for engulfment was approximated by iterating at different solidification velocities to determine the narrow interval it falls under. Then refined calculations within this determined interval were performed to approximate the final critical velocity. The number of meshes in the interface region is four and mesh size is approximately 5.0 10−8 m. Thus, the influence of nanoparticles on the solidification interface is introduced through modifying the diffusion coefficient, nanoparticle radius and the interfacial energy.
Table 1.
Materials and process parameters used in computations.
3. Results and Discussion
3.1. Particle Engulfment During Planar Solidification
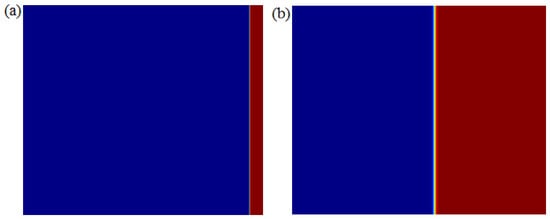
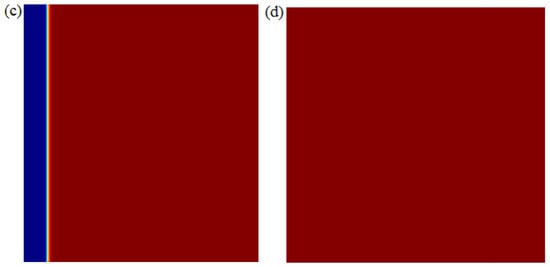
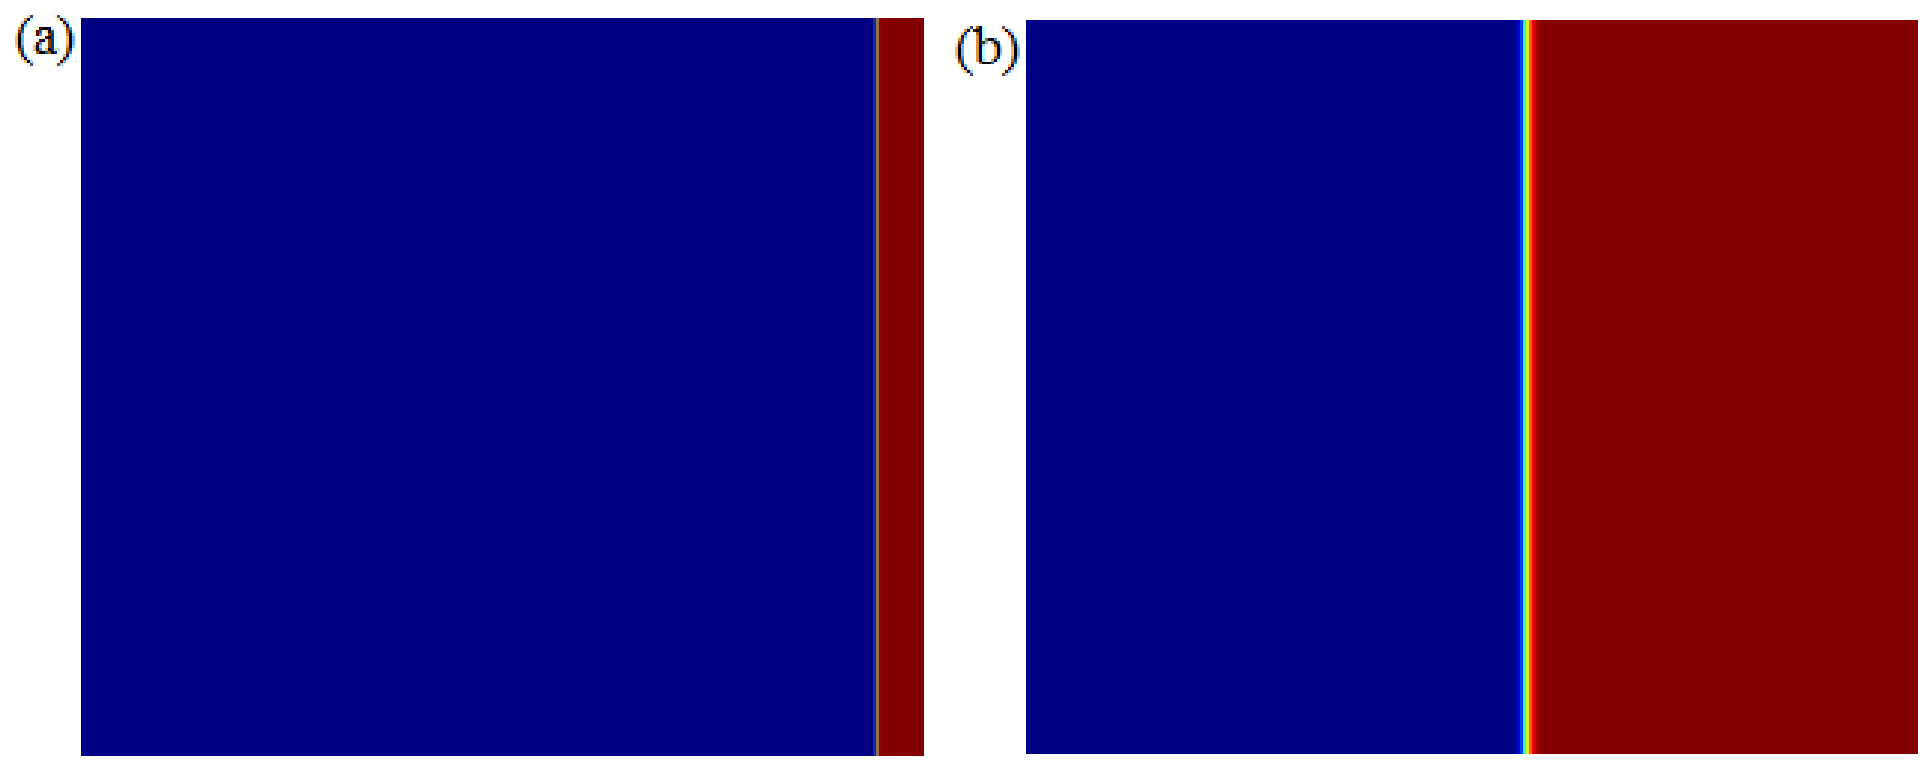
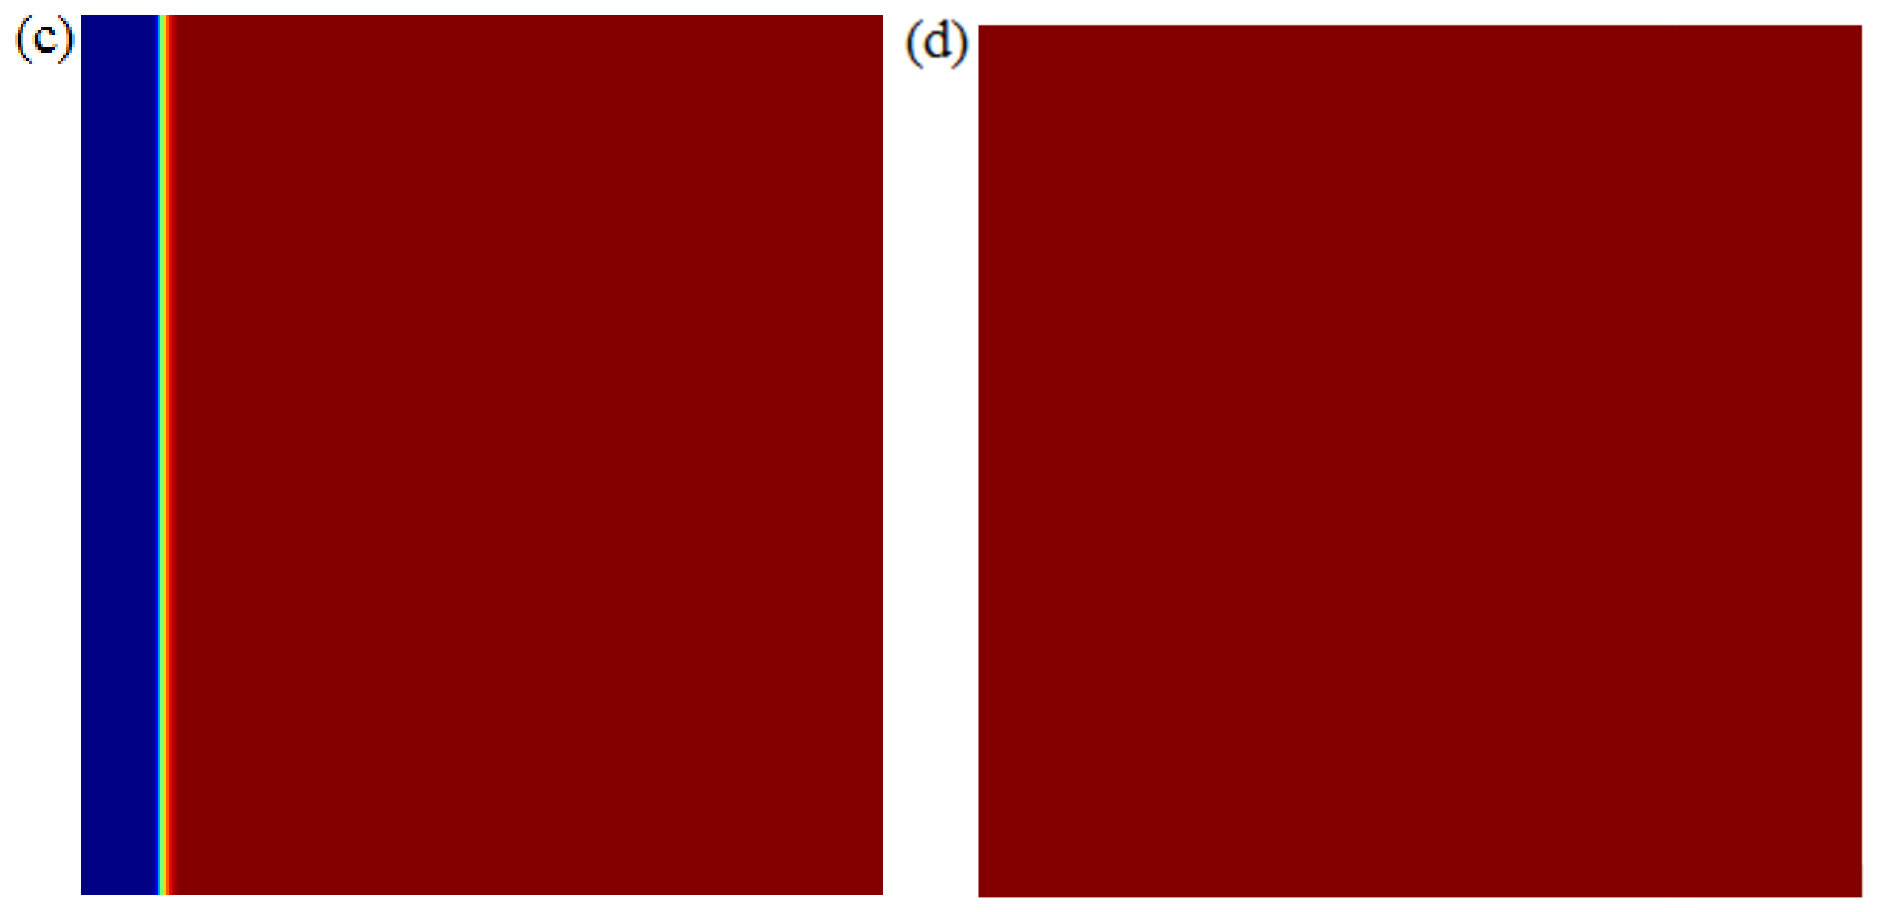
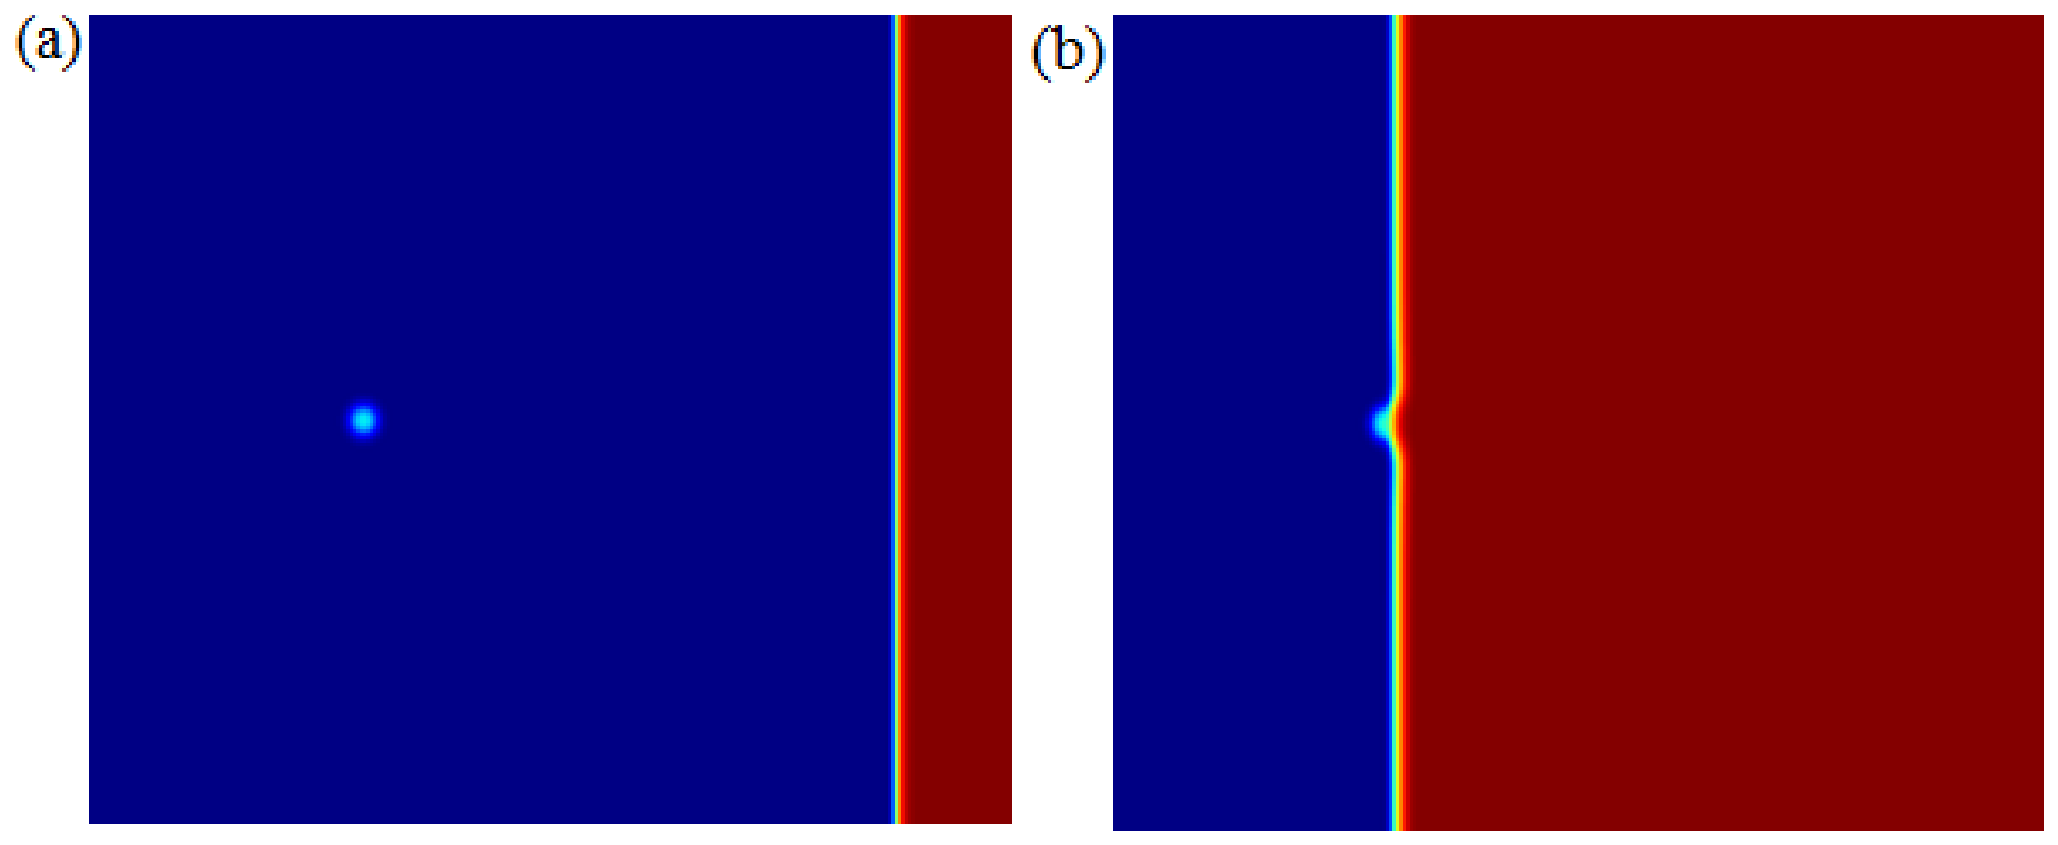
For all of the computations performed in this section, we employ a set of parameters listed in Table 1, which are representative of a ceramic particle in a solidifying metal. We initially demonstrate that, in the absence of a particle, the solidification front will be planar and will move until the whole domain has completely solidified as shown in Figure 2. This shows that there is efficient heat extraction from the domain. The solidification process is fast in the beginning (may exceed critical velocity) and slows down with time due to the increase in melt temperature because of latent heat transfer to the liquid. These results are in agreement with simulation results by M. Jegatheesan and Anirban Bhattacharya [17]. The critical velocities for engulfment were approximated by gradually increasing the solidification velocities in simulations until particle engulfment is established.
Figure 2.
Planar solidification of a pure melt in absence of a particle at an interface velocity of 6.7 10−4 m/s, (a) t* = 0, (b) t* = 30, (c) t* = 110, (d) t* = 130. Red color is for solidified material and blue color is the liquid melt.
3.1.1. Effect of Melt Viscosity
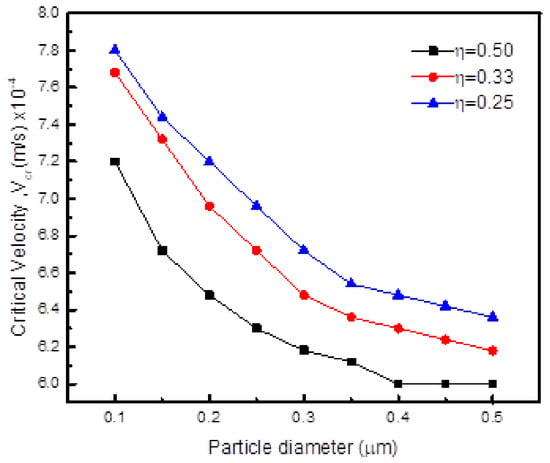
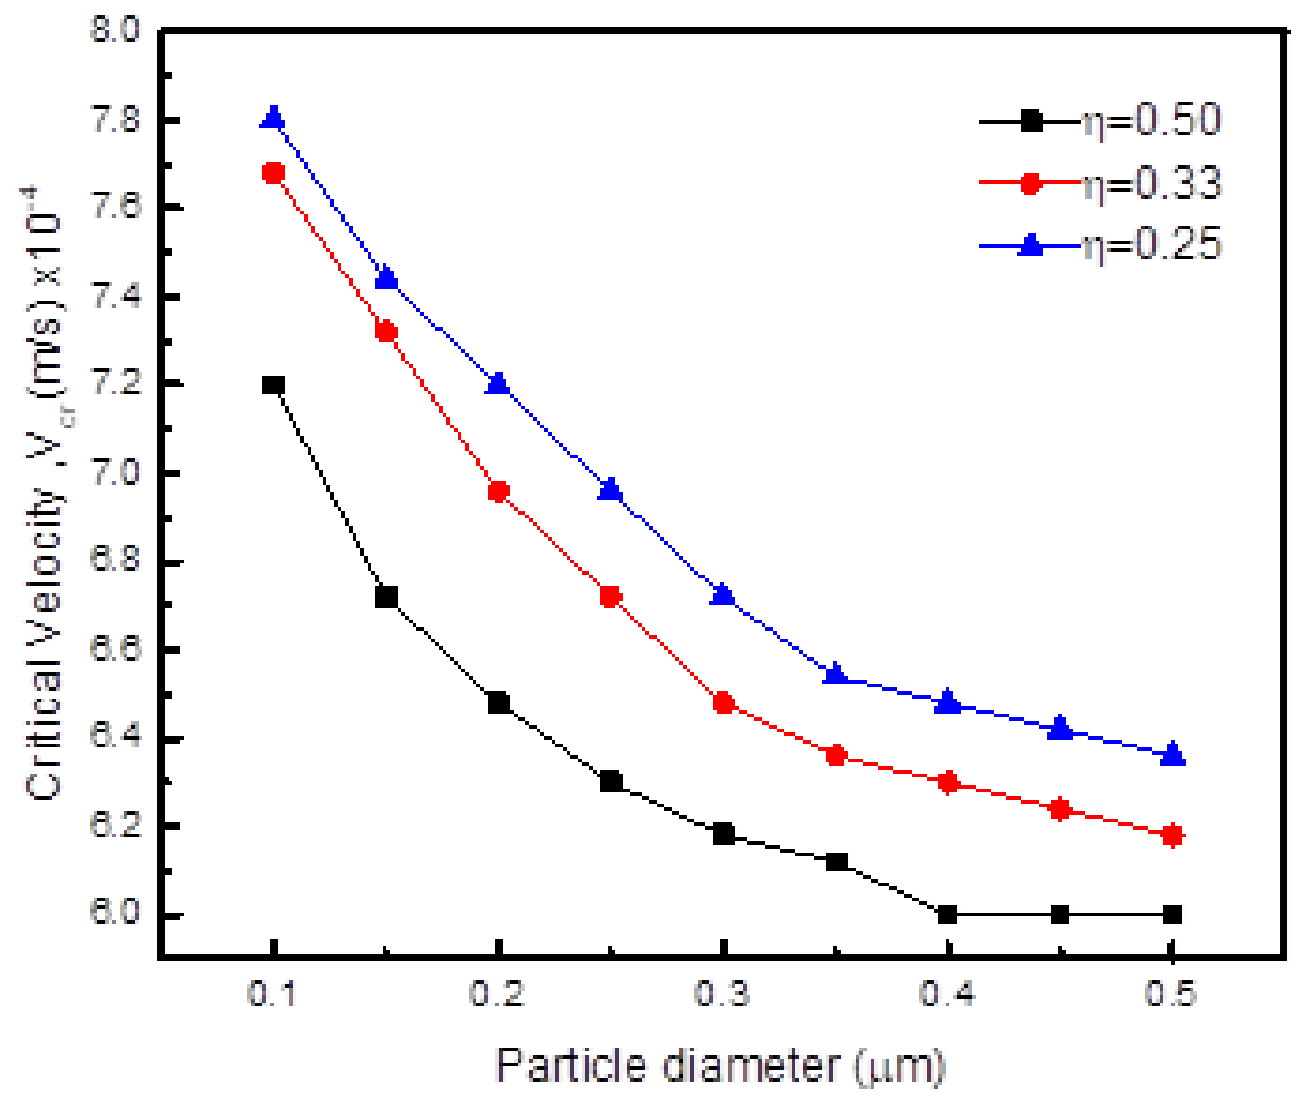
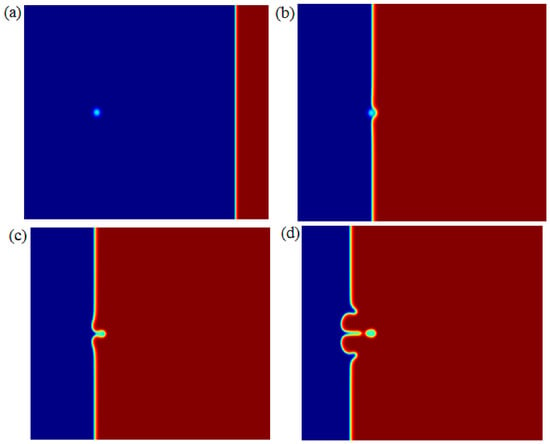
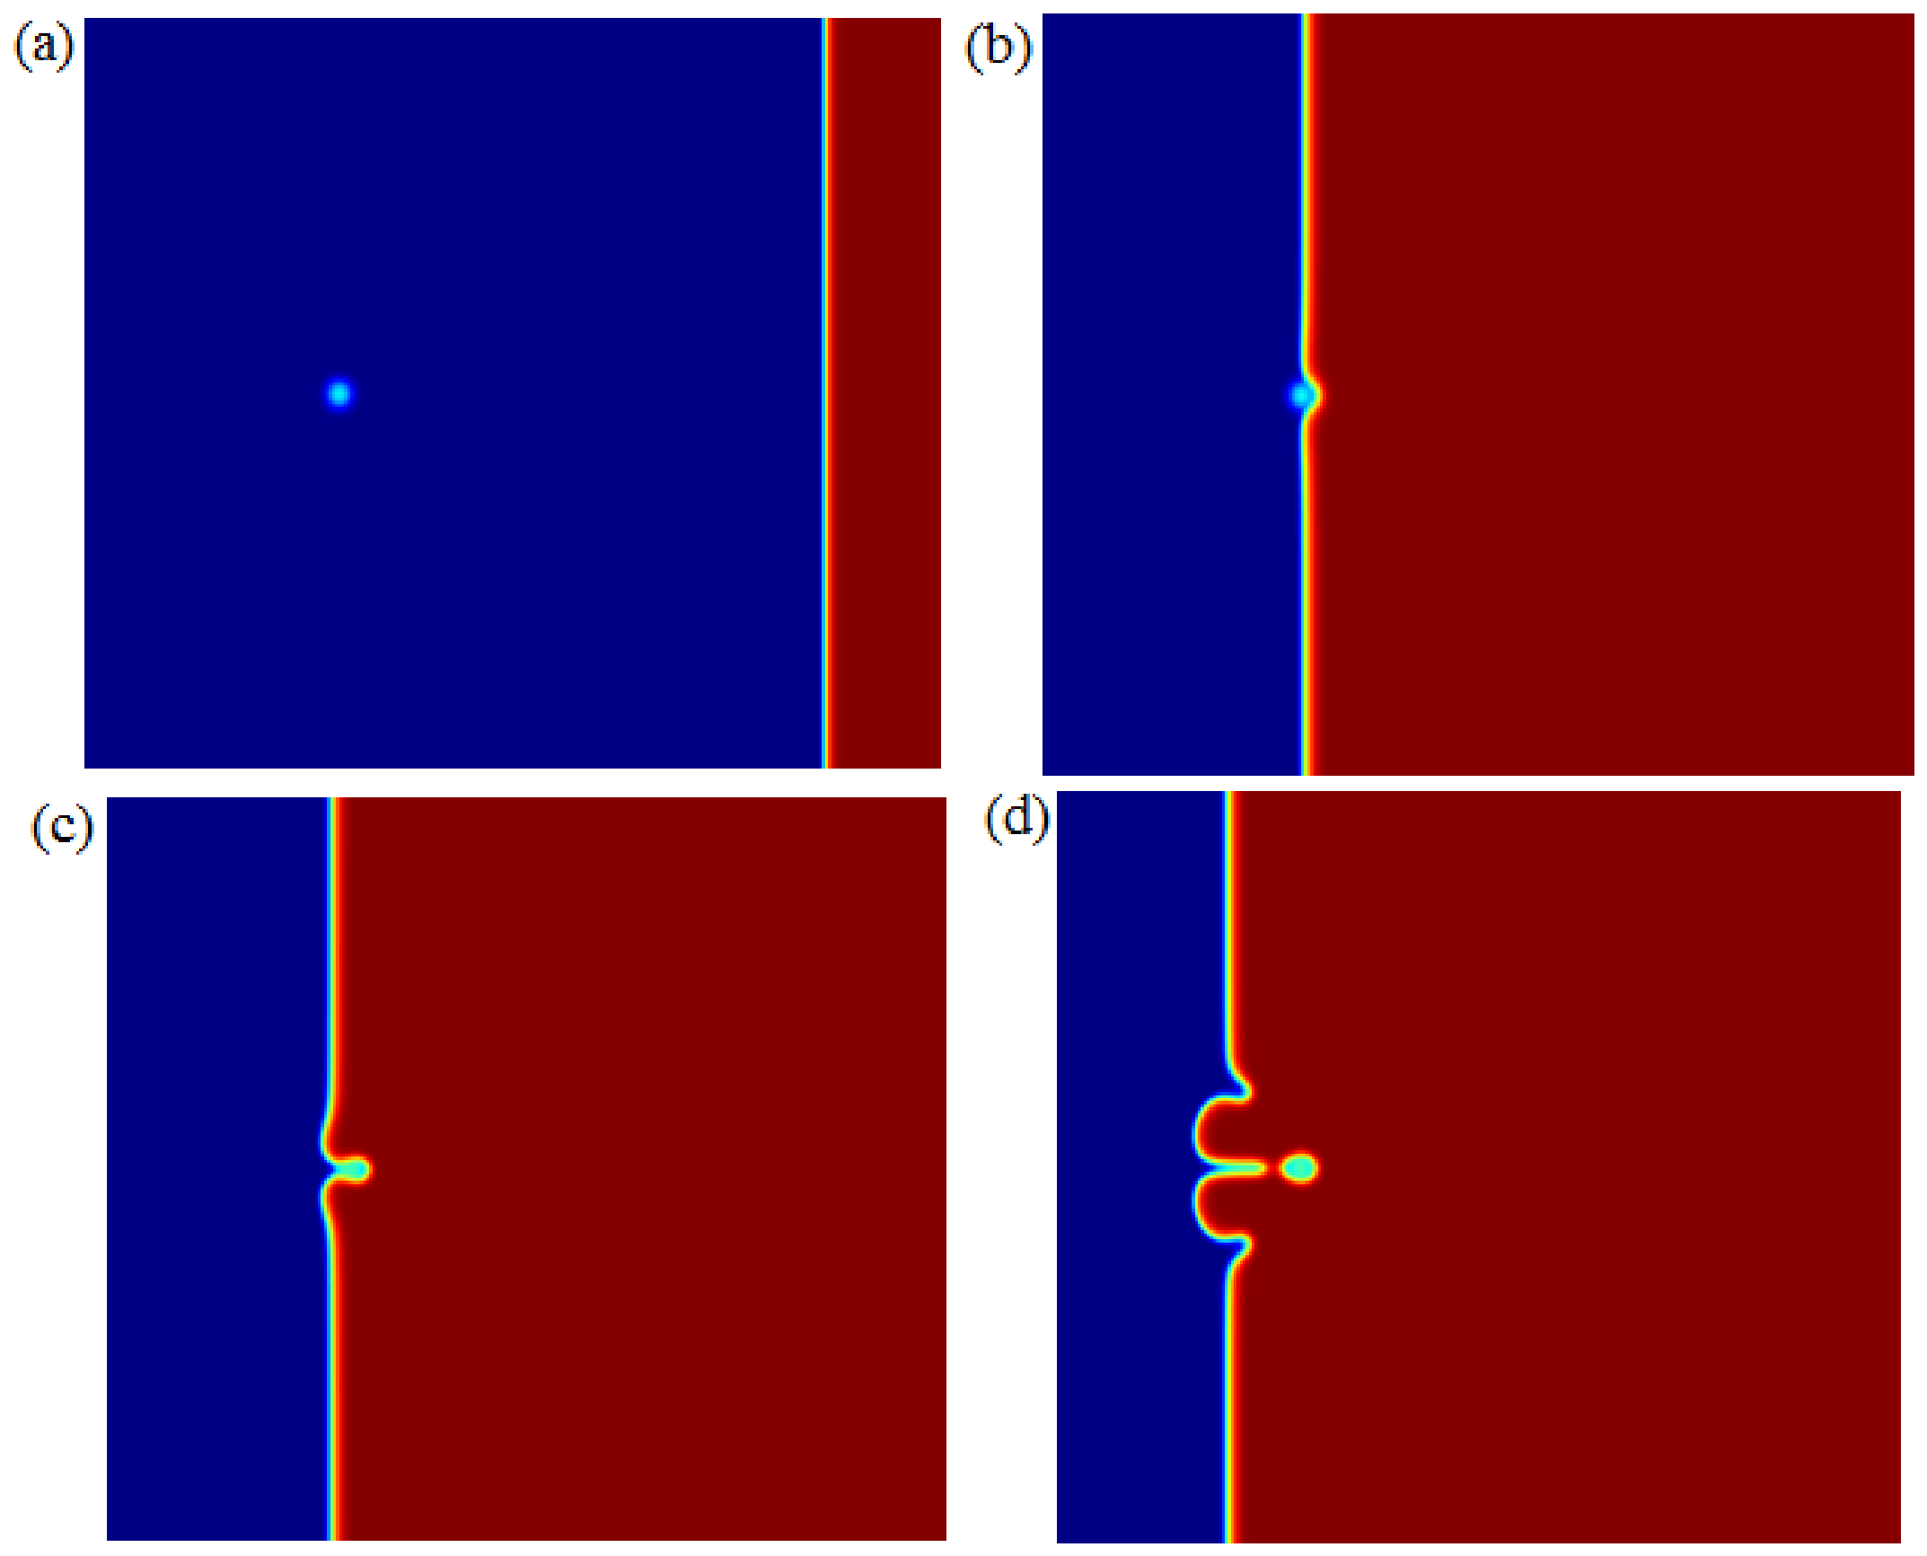
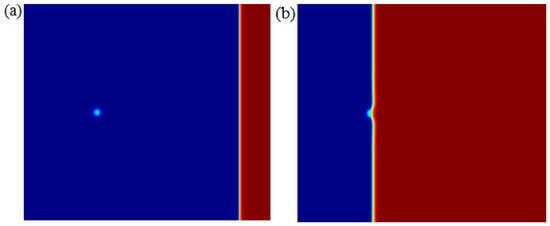
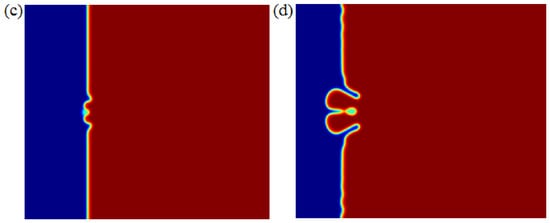
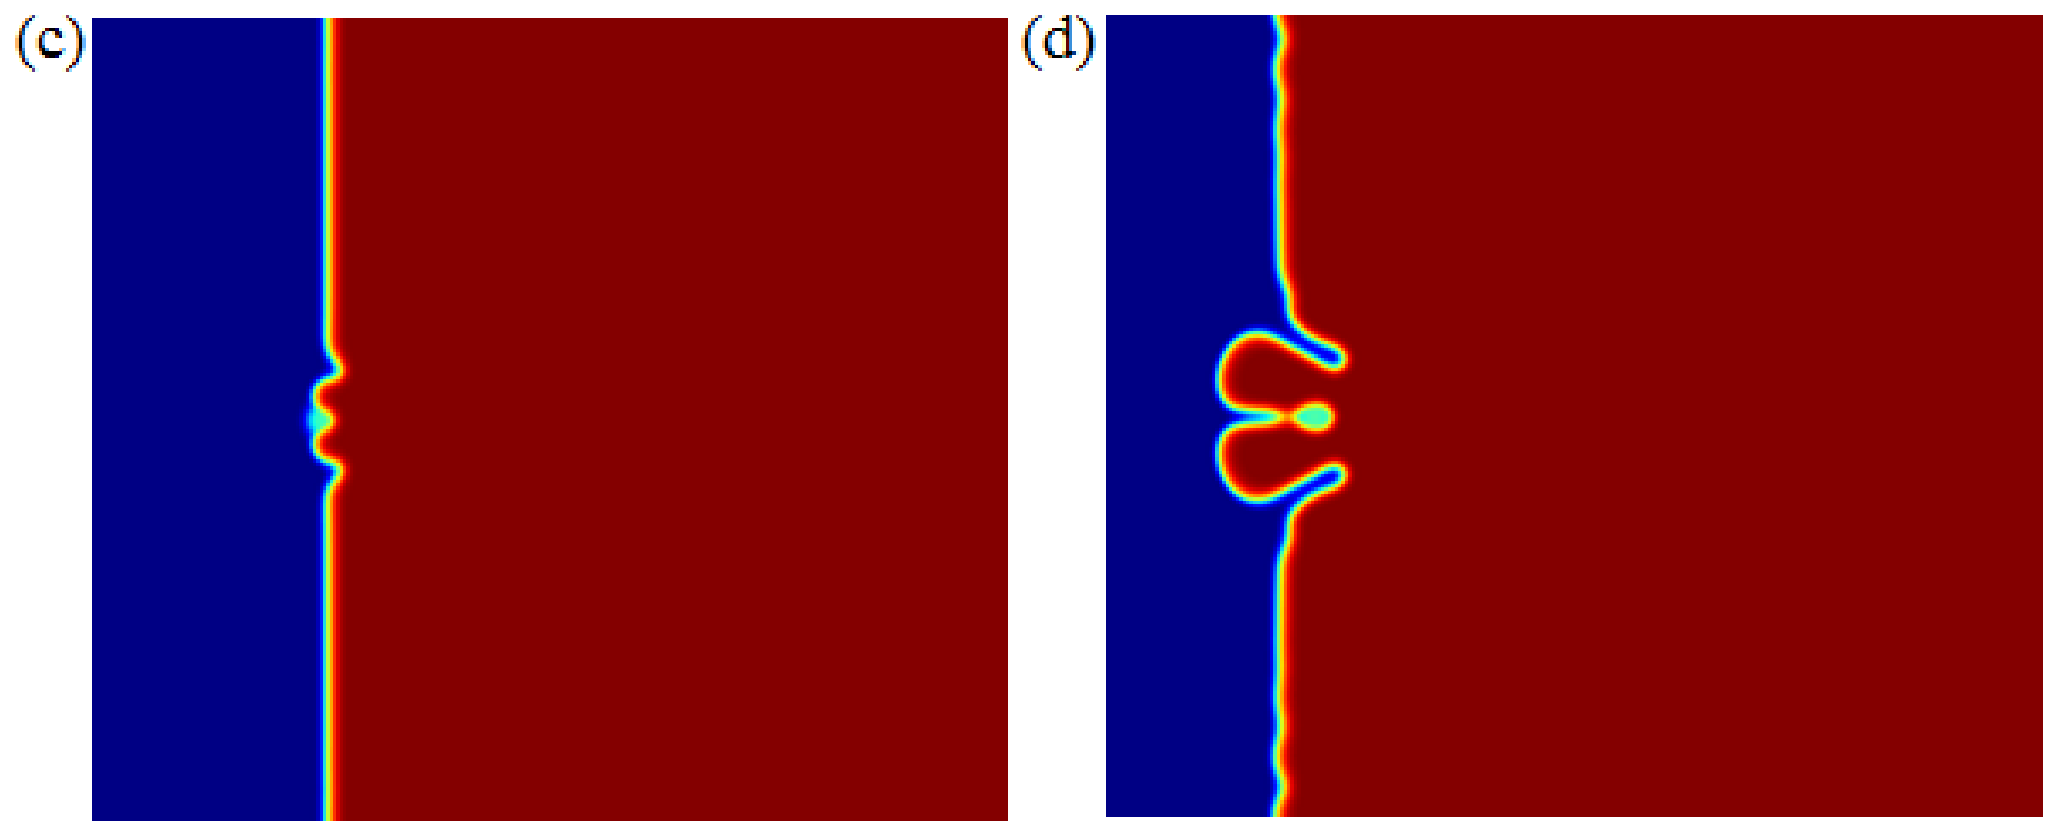
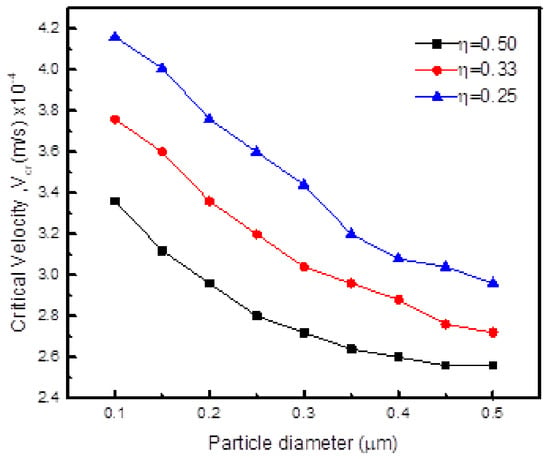
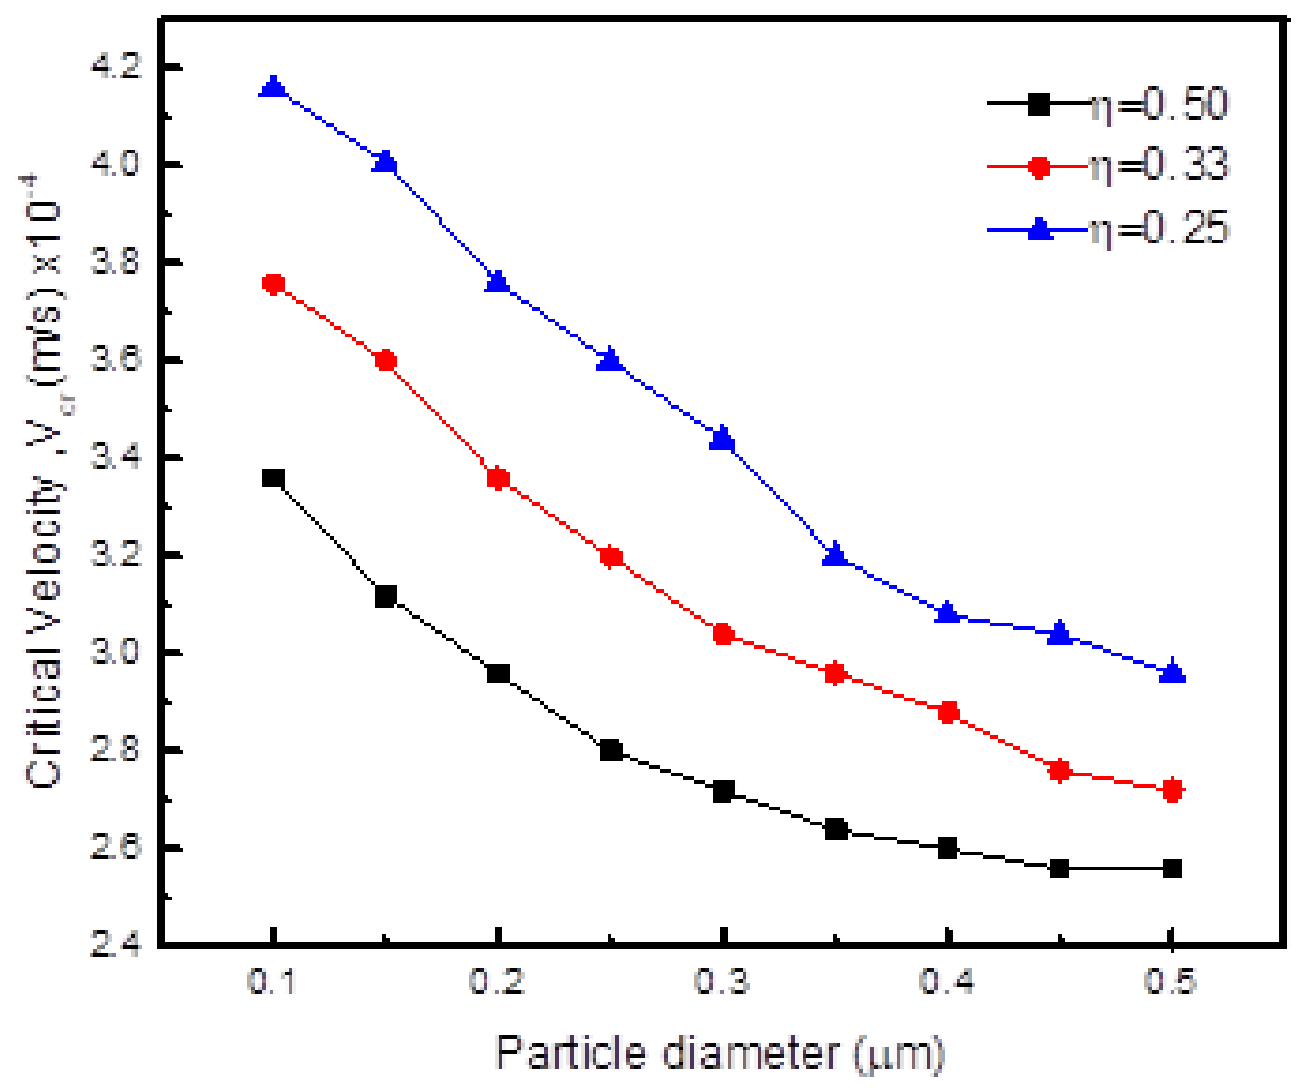
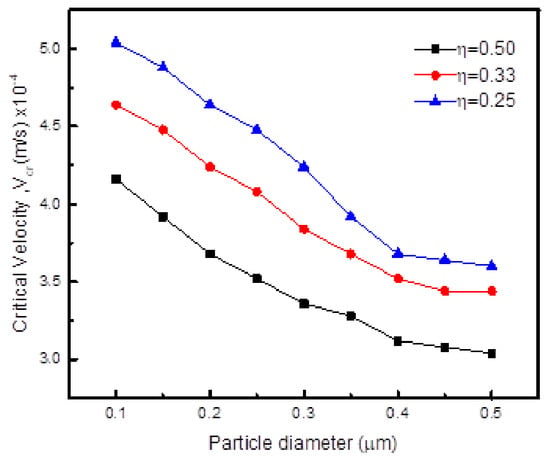
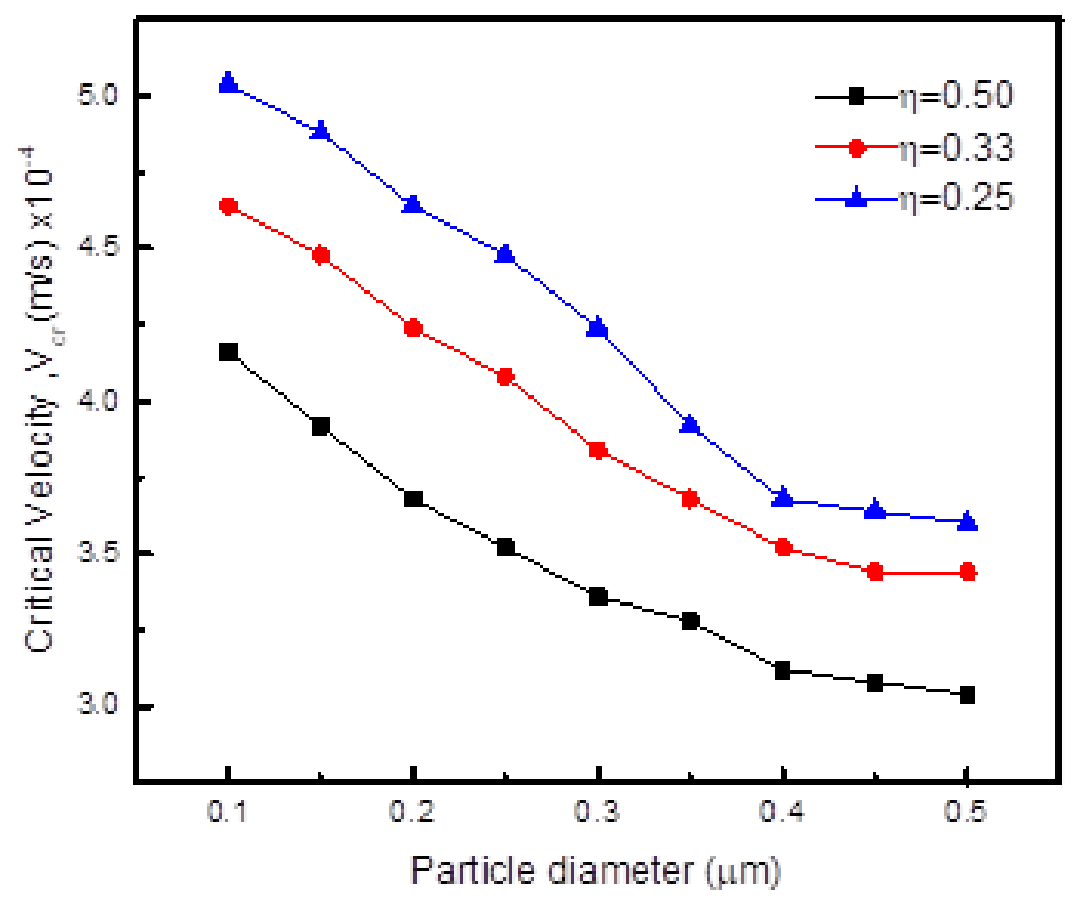
With introduction of the particle in the melt, interactions with the interface cause some changes in interface curvature. In pure metal solidification, interface shape and critical velocity are mainly affected by thermal diffusivity. Figure 3 shows the critical velocities for particle engulfment at different melt viscosities for particles of different sizes. The transition from pushing to engulfment is clearly demonstrated by changing the interface velocity. The well-known relationship between critical velocity and particle radius is reproduced [32,33]. As the critical velocity of engulfment is inversely proportional to the particle radius, smaller nanoparticles have higher critical velocities associated with them. Even though the interface velocity is large initially, it is still less than the critical velocity of small particles resulting in non-engulfment in the solid. The numerical simulation by Ode et al. [27] showed that the critical velocity depends on particle radius according to the relationship with n = 0.28–0.9. Observations show that, at high growth rates, particles are instantaneously engulfed and uniformly distributed in the matrix. At intermediate velocities, they are pushed for a while before being engulfed. At low velocity rates, particles outrun the solidification front and are pushed to the end. Figure 3 shows that, with an increase in melt viscosity, the critical velocity for engulfment decreases. This is because, at high viscosities, particles will be less mobile to move away when approached by the solidification front. The evolution of the interface shape with time when a particle of size 0.4 m is engulfed by the solidification front is shown in Figure 4. As the interface approaches the particle, the drag force exceeds the pushing force and the particle is instantaneously captured. After engulfment, the interface will not remain flat, but two humps will remain and this behavior is similar to previous observations [34]. This shows that the particle is larger and changes the interface profile from planar to non-planar.
Figure 3.
Variation of the critical velocity with melt viscosity for different particle sizes when particle to melt conductivity ratio kp/km = 1.5 and particle/solid interfacial energy ratio = 1.6.
Figure 4.
Engulfment of a particle of diameter 0.4 m when approached by the solidification front with interface velocity of 7.3 10−4 m/s, the particle/solid surface energy ratio = 1.6, particle to melt conductivity ratio Kp/Km = 1.5 and melt viscosity = 0.33. (a) t* = 10, (b) t* = 60, (c) t* = 90 and (d) t* = 100. Red color is for solidified material and blue color is the liquid melt.
3.1.2. Effect of Surface Energy
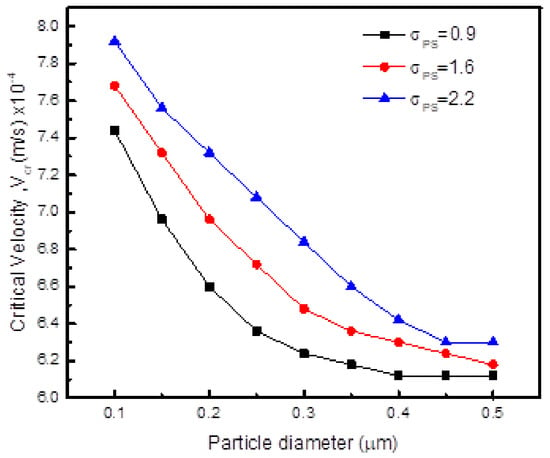
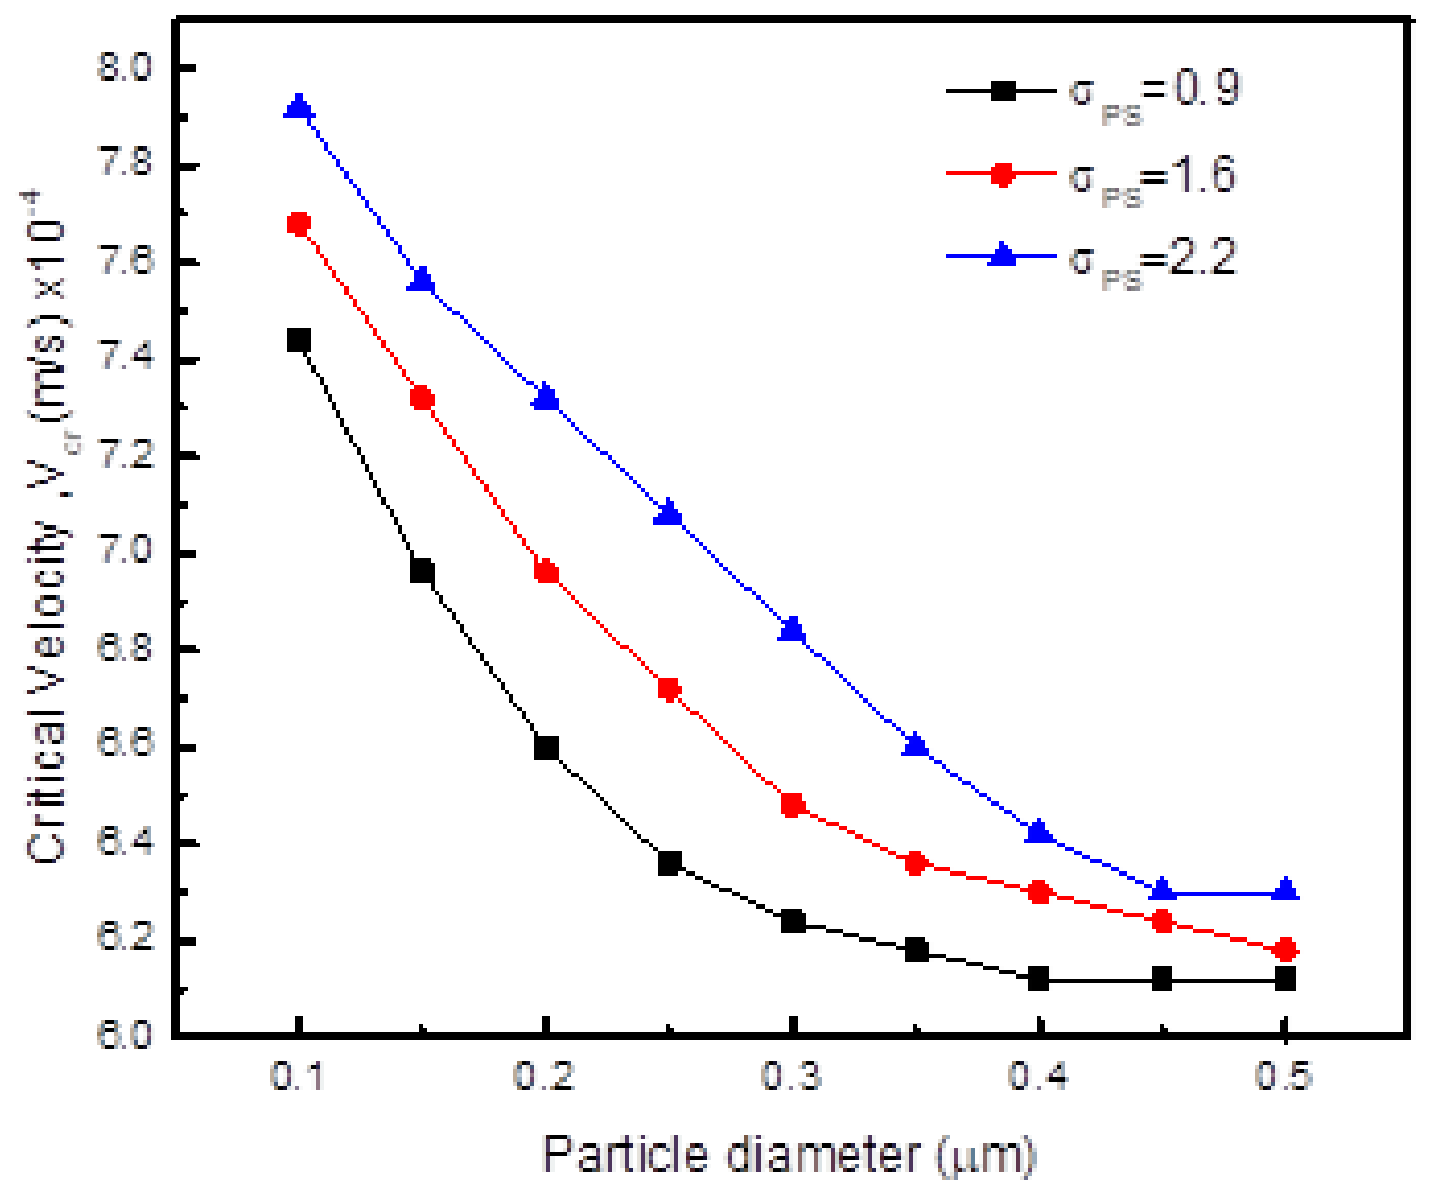
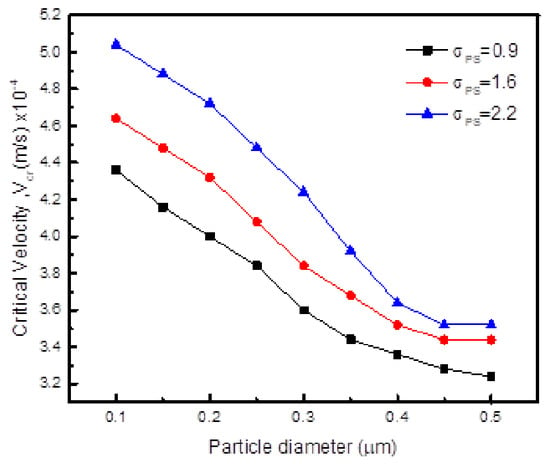
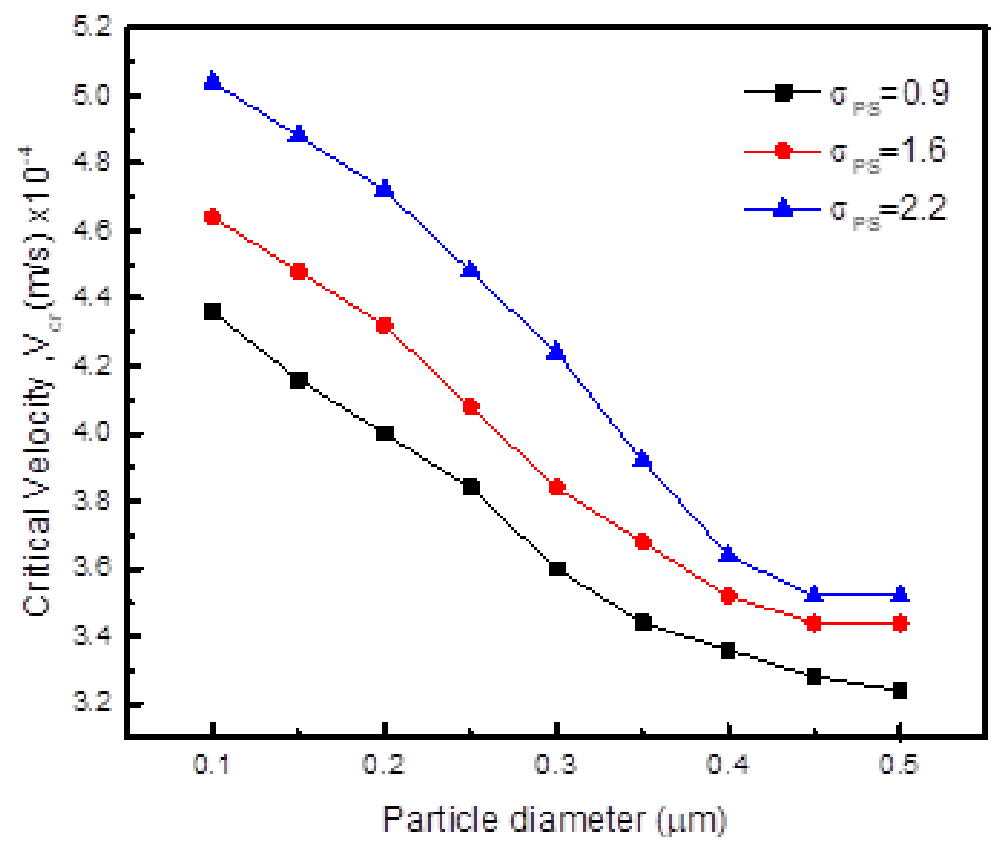
The effect of solid–particle interaction surface energy on critical velocity for particle engulfment is shown in Figure 5. The critical velocity for particle engulfment increases with an increase in surface energy between the particle and the solidification front. This is because, as the surface energy differences between the particle and solid increase, repulsive forces will increase such that it will require higher velocities to capture the particle.
Figure 5.
Variation of the critical velocity for engulfment with particle–solid interfacial energy ratio for different particle sizes when particle to melt conductivity ratio kp/km = 1.5 and melt viscosity = 0.33.
3.1.3. Effect of Particle–Matrix Thermal Conductivity Ratio kp/klm
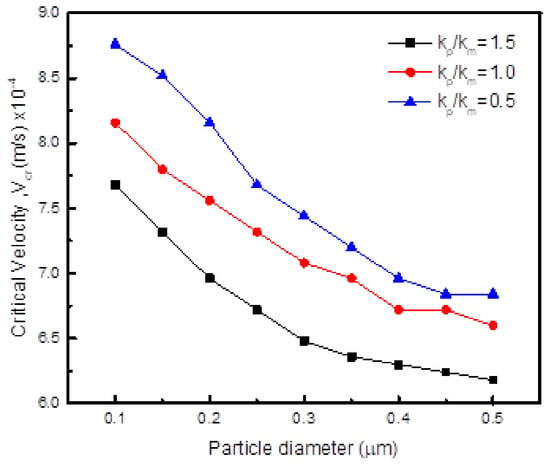
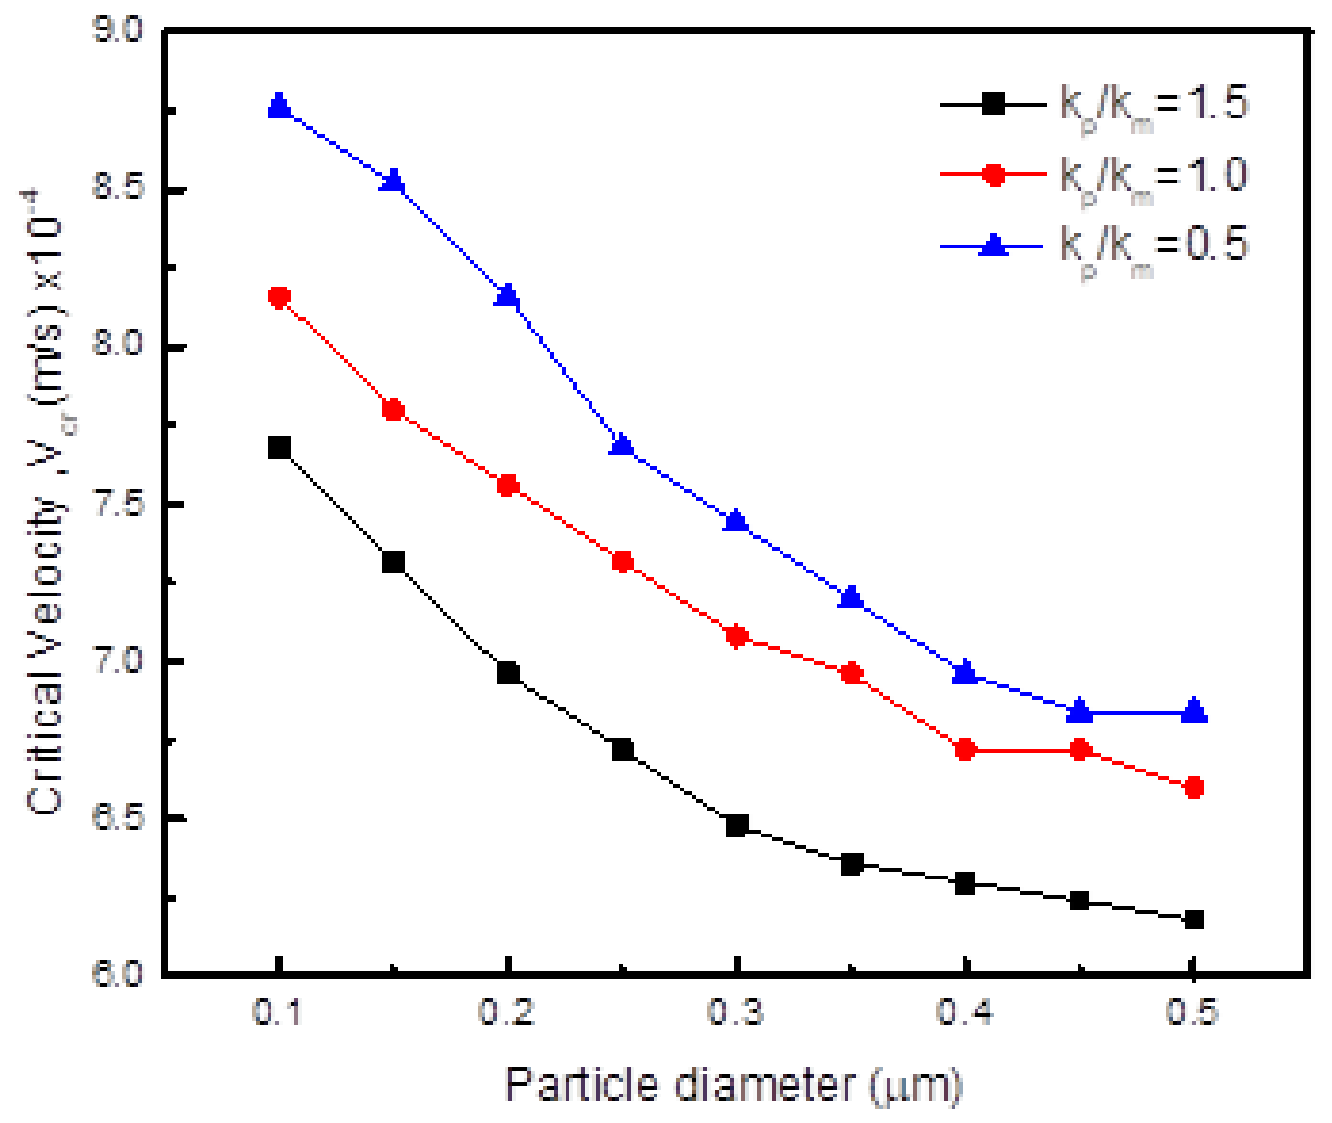
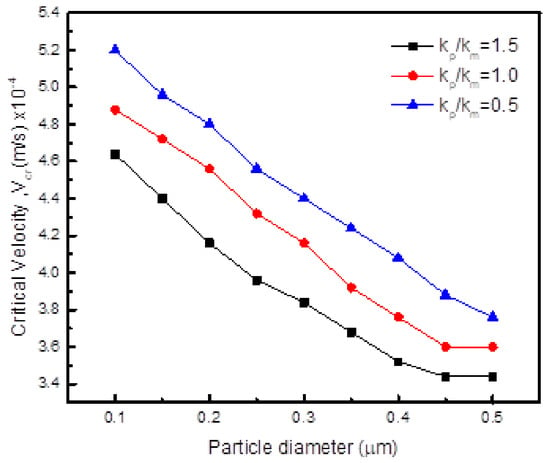
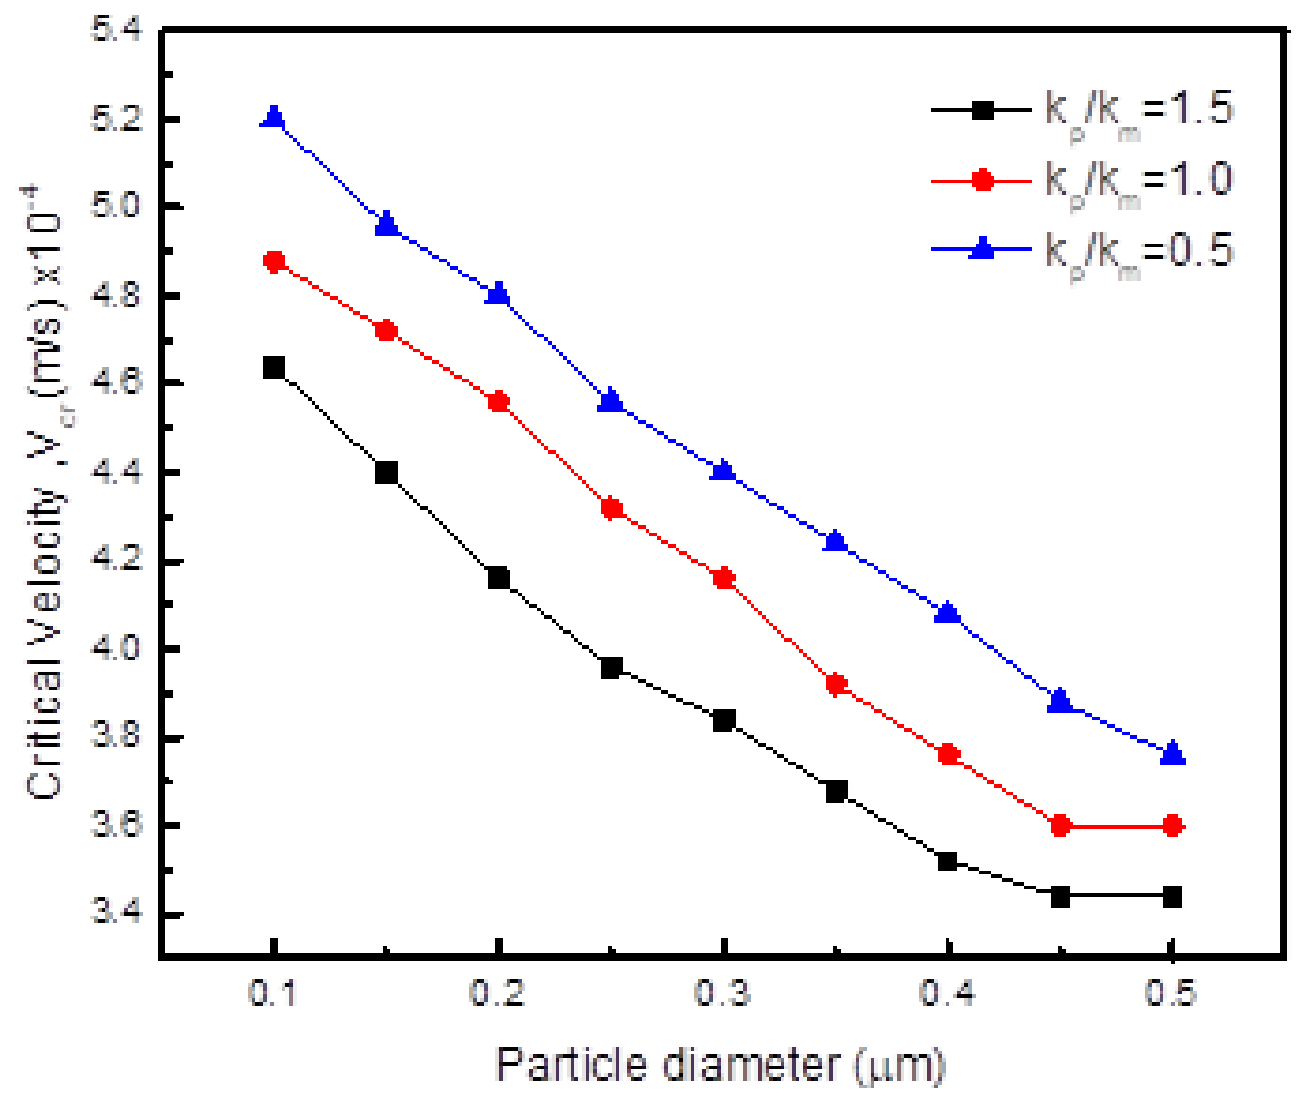
The critical velocities calculated for three thermal conductivity ratios (through adjusting thermal diffusion coefficient) to obtain different interface shapes and engulfment behaviors are shown in Figure 6. The critical velocities for particle engulfment decrease with an increase in kp/km ratio. At a high particle thermal conductivity ratio, heat will easily flow through the particle and a trough will form such that engulfment will easily occur. However, at low thermal conductivity, a particle resists heat flow inside it and a hump develops such that a trough should develop on top of it for engulfment to occur, making engulfment difficult. Figure 7 shows the development of a hump and a trough on top of it for particle engulfment when thermal conductivity of the particle is less than melt conductivity. It should be noted that the interface shape in pure substances is not determined solely by thermal conductivity ratios but also by the local pressure related to viscosity [34].
Figure 6.
Variation of the critical velocity with particle/melt conductivity ratios when particle/solid interfacial energy ratio = 1.6 and melt viscosity = 0.33.
Figure 7.
Engulfment of a particle of diameter 0.4 m at interface velocity of 8.0 10−4 m/s, particle/solid interfacial energy ratio = 1.6, Kp/Km = 0.5 and melt viscosity = 0.33. (a) t* = 20, (b) t* = 80, (c) t* = 100 and (d) t* = 120. Red color is for solidified material and blue color is the liquid melt.
Thermal conductivity plays an important role in particle engulfment as shown by the equations of particle pushing and drag obtained by Shangguan [35] as follows:
where RI and Rp denote the radius of curvature of the interface and the particle radius, respectively. The expression that relates curvature of interface and particle to thermal conductivities was obtained as:
Such that the pushing force becomes:
where kp and kL denote the thermal conductivities of the particle and the melt, respectively. The drag force can be modified using a similar approach from:
To take the following form:
3.2. Particle Engulfment During Dendritic Solidification
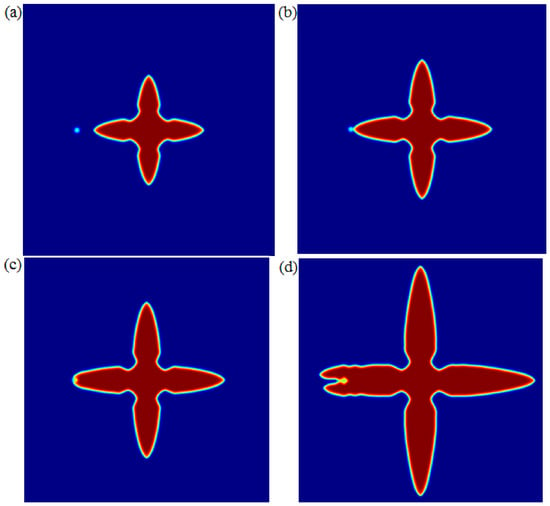
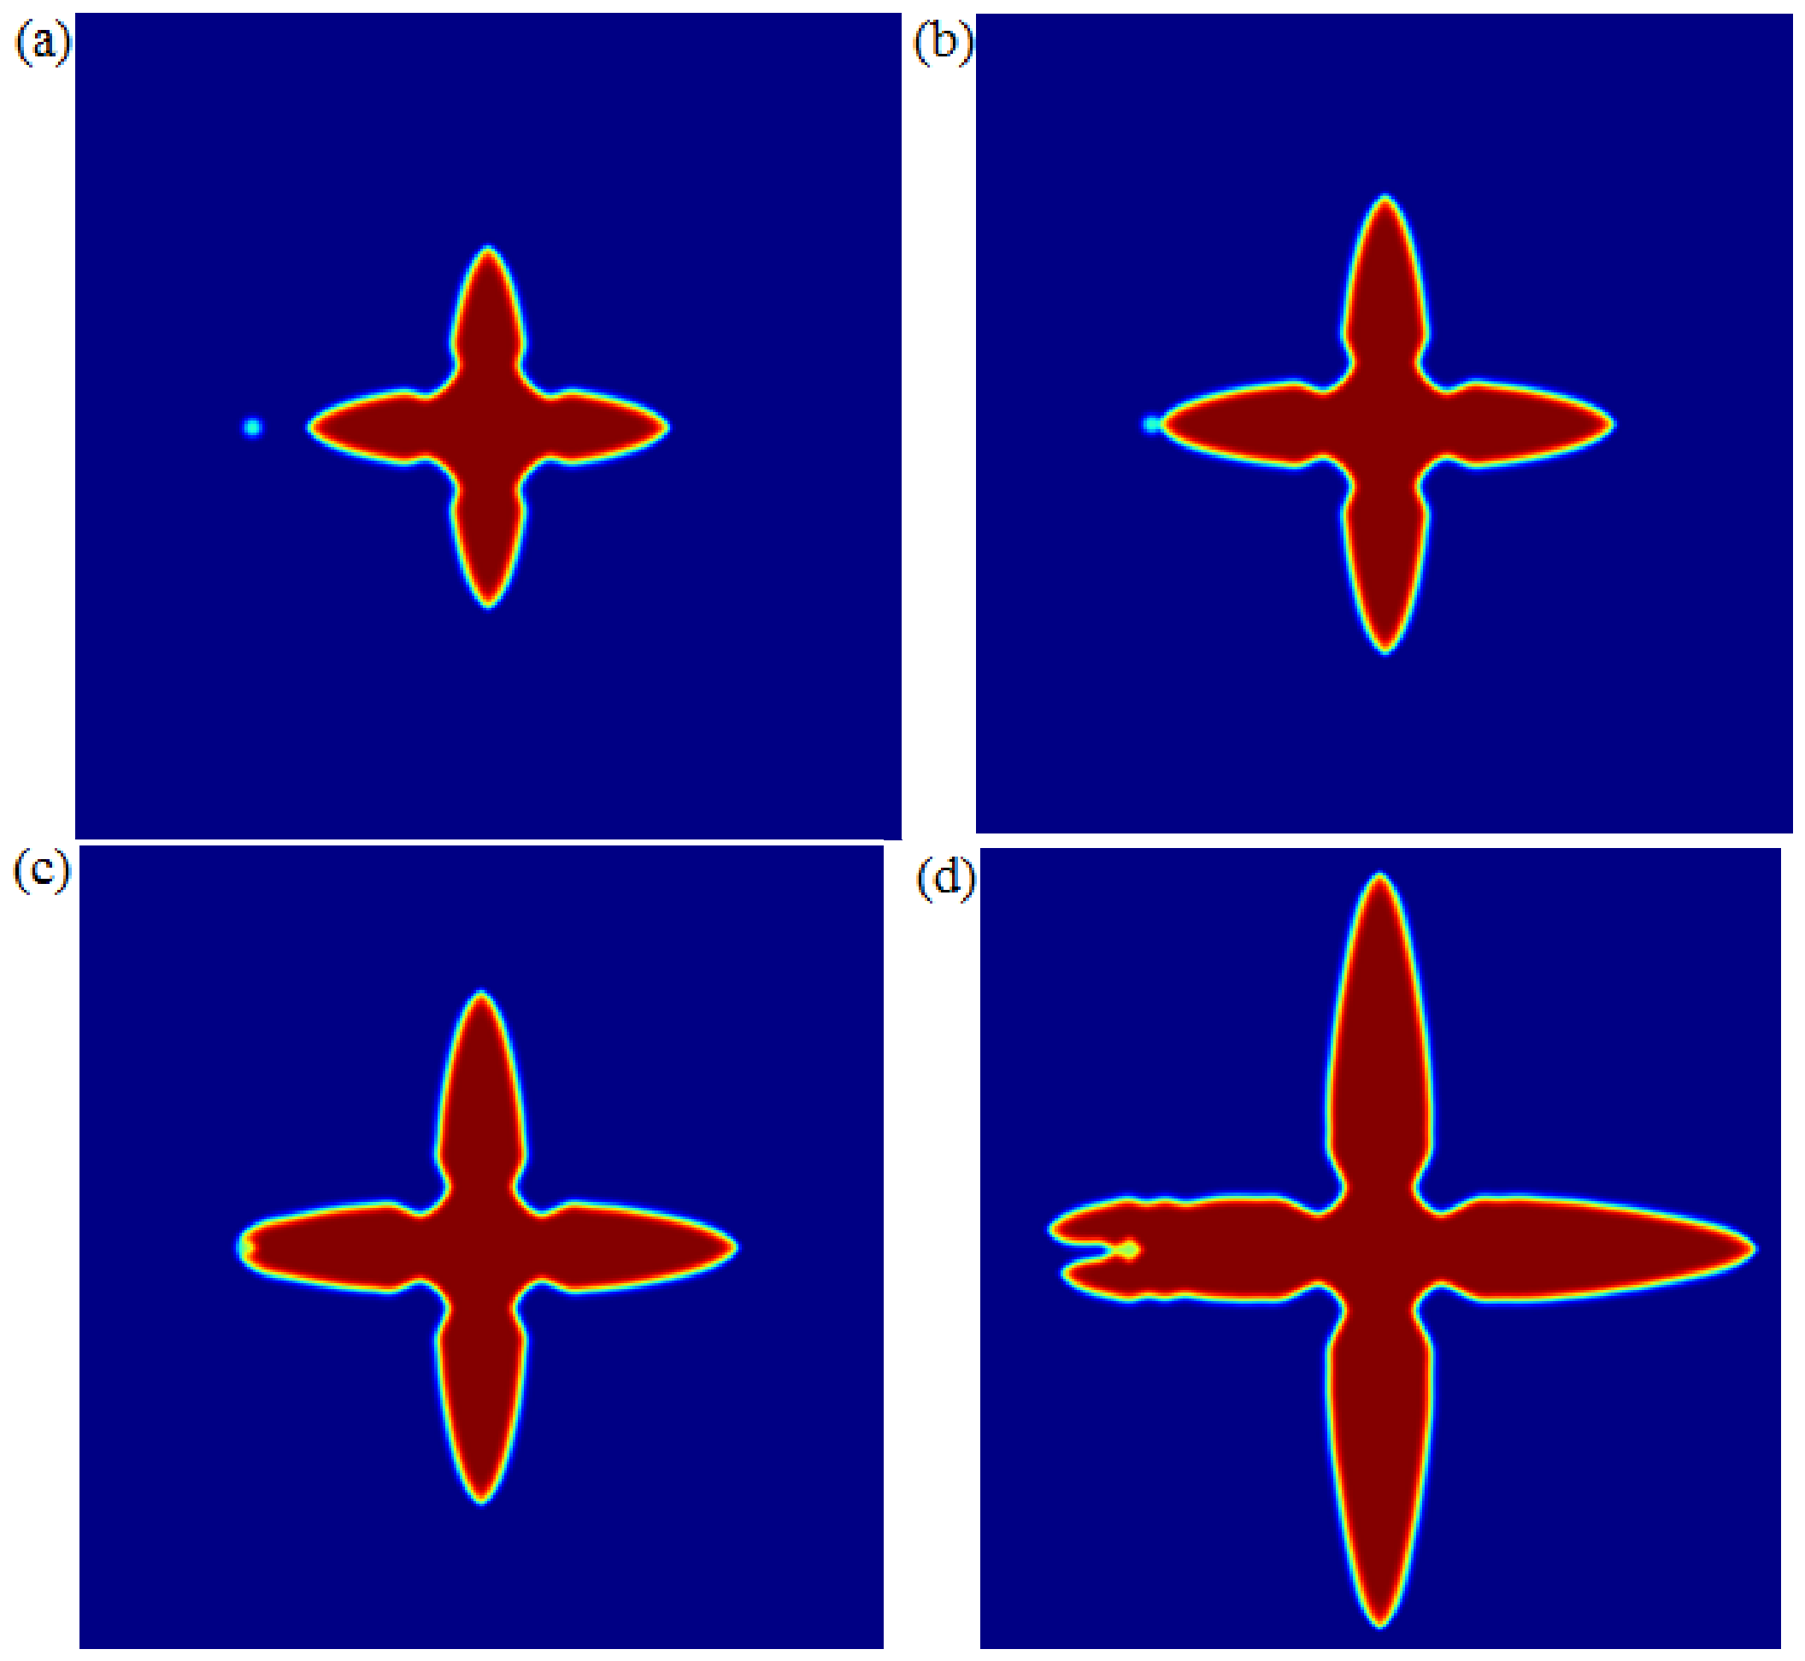
In this section, the effect of different positions of the particle when placed next to the growing dendrite on engulfment is studied. As the dendrite evolves, different regions will grow at different speeds such that, depending on positions, different particle engulfment behaviors are expected. Since interfaces are not planar, particle sliding especially from dendritic tips will be expected. Therefore, we studied engulfment of particles positioned at dendritic tips and dendrite sides.
3.2.1. Particle at the Dendrite Tip
Effect of Melt Viscosity
Figure 8 shows the effect of melt viscosity on particle engulfment. With an increase in melt viscosity, particle engulfment becomes easier as shown by the reduction in critical velocities for engulfment. The interactions of a particle with an advancing dendrite tip are shown in Figure 9. As the dendrite approaches the particle, the velocity of the tip is reduced as it attempts to engulf the particle. This effect will likely refine the morphology due to the pinning effect on grain growth enhancing nucleation of many grains.
Figure 8.
Variation of the critical velocity for particle engulfment with melt viscosity at different particle sizes when kp/km =1.5 and particle/solid interfacial energy ratio = 1.6 for a particle placed at the dendrite tip.
Figure 9.
Engulfment of a particle of diameter 0.4 m at an interface velocity of 7.0 10−4 m/s, particle/solid surface energy ratio = 1.6, Kp/Km = 1.5 and melt viscosity = 0.33. (a) t* = 10, (b) t* = 30, (c) t*= 60 and (d) t* = 90. Red color is for solidified material and blue color is the liquid melt.
Effect of Surface Energy
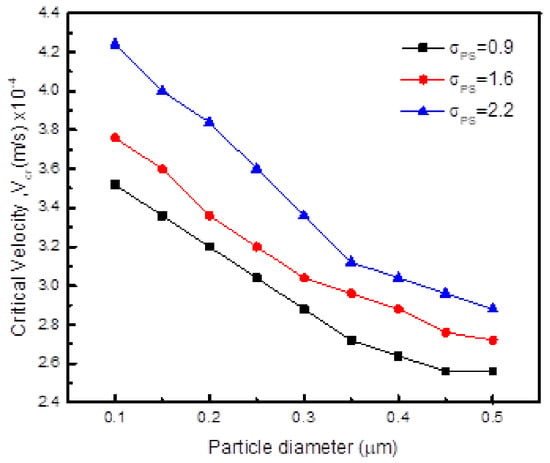
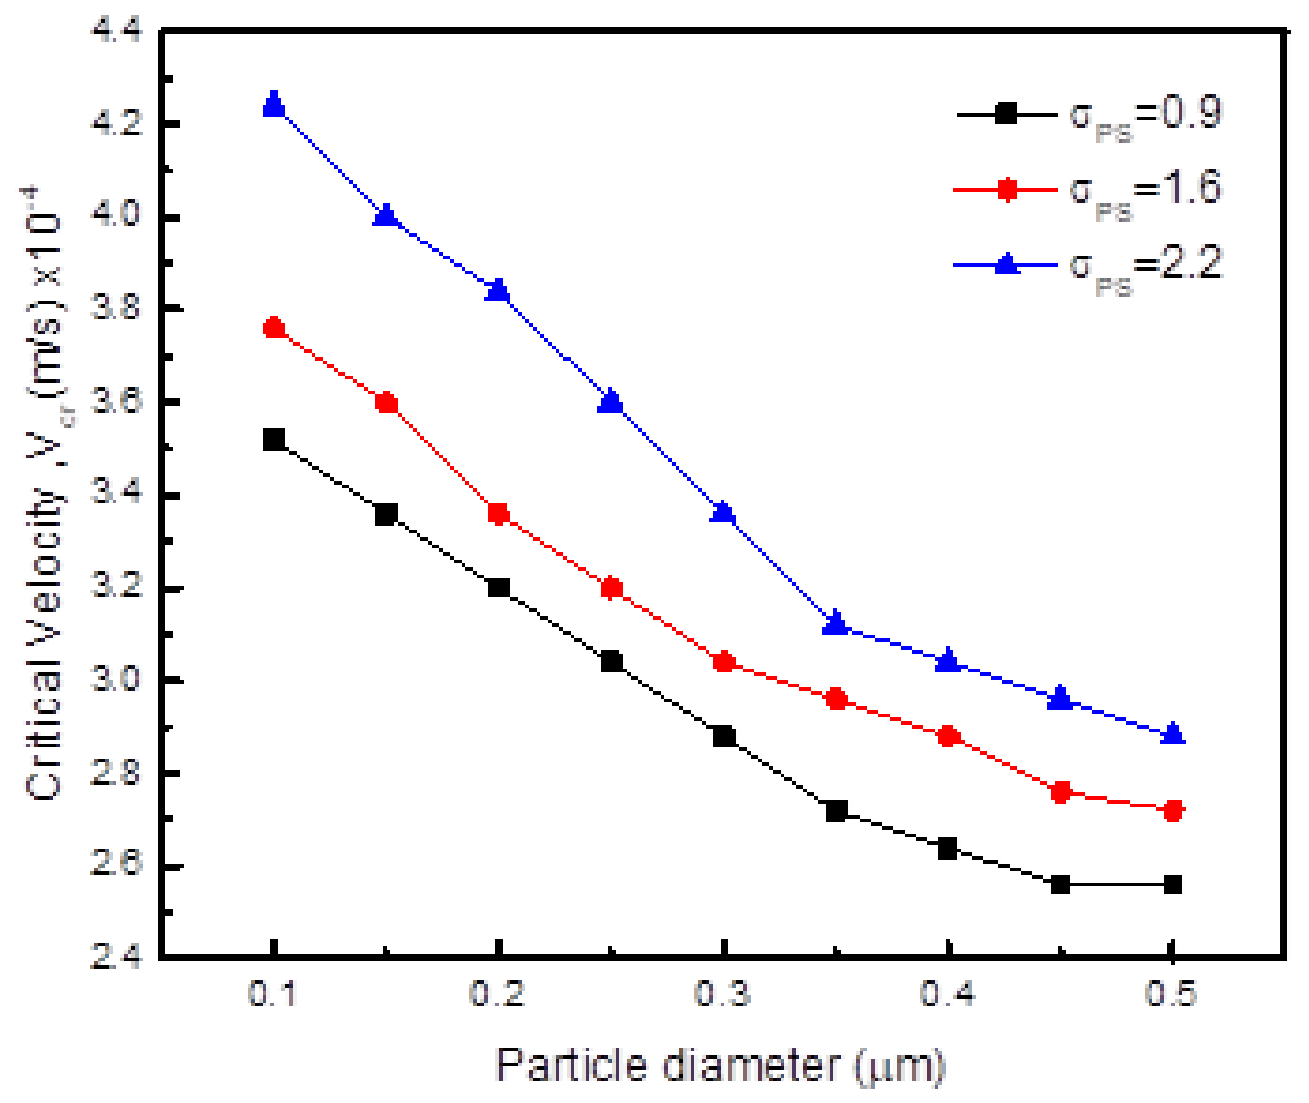
The effect of surface energy on particle engulfment is shown in Figure 10. With an increase in particle–interface surface energy, the velocities for particle engulfment increase. This is expected because high interfacial energies are associated with low wettability of the particle by the approaching interface.
Figure 10.
Variation of the critical velocity for engulfment with particle–solid interfacial energy ratio for different particle sizes when kp/km = 1.5 and melt viscosity = 0.33.
Effect of Particle–Matrix Thermal Conductivity Ratio kp/km
The effect of thermal conductivity on particle engulfment is shown in Figure 11. It is shown that, as the particle thermal conductivity decreases, because of the hump development, the particle slides from the dendrite tip onto the side branch where velocity is low such that engulfment will be difficult. In practical metal casting, the complex, branched morphology of dendrites creates geometrical trapping (entrapment) and induces fluid flow (e.g., shrinkage-driven convection) that pushes particles away [36]. Figure 12 shows the engulfment of a particle which was originally positioned at the dendrite tip.
Figure 11.
Variation of the critical velocity with particle to melt thermal conductivity ratios at different particle sizes when particle/solid interfacial energy ratio = 1.6 and melt viscosity = 0.33.
Figure 12.
Engulfment of a particle of diameter 0.4 m at an interface velocity of 8.0 10−4 m/s, particle/solid interfacial energy ratio = 1.6, Kp/Km = 1.5 and melt viscosity = 0.33. (a) t* = 10, (b) t* = 50, (c) t*= 80 and (d) t* = 100. Red color is for solidified material and blue color is the liquid melt.
3.2.2. Particle Positioned Beside the Dendrite Tip
Effect of Melt Viscosity
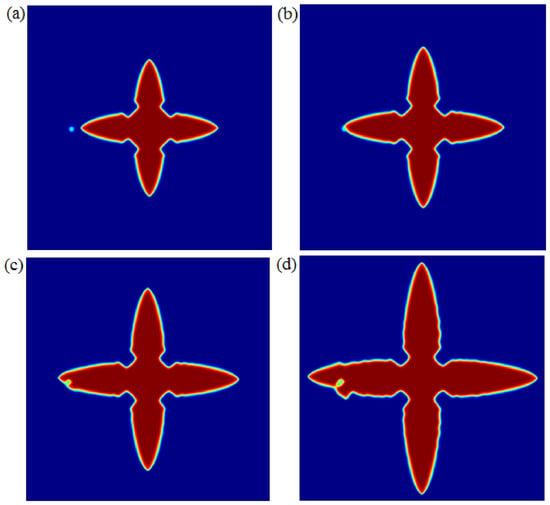
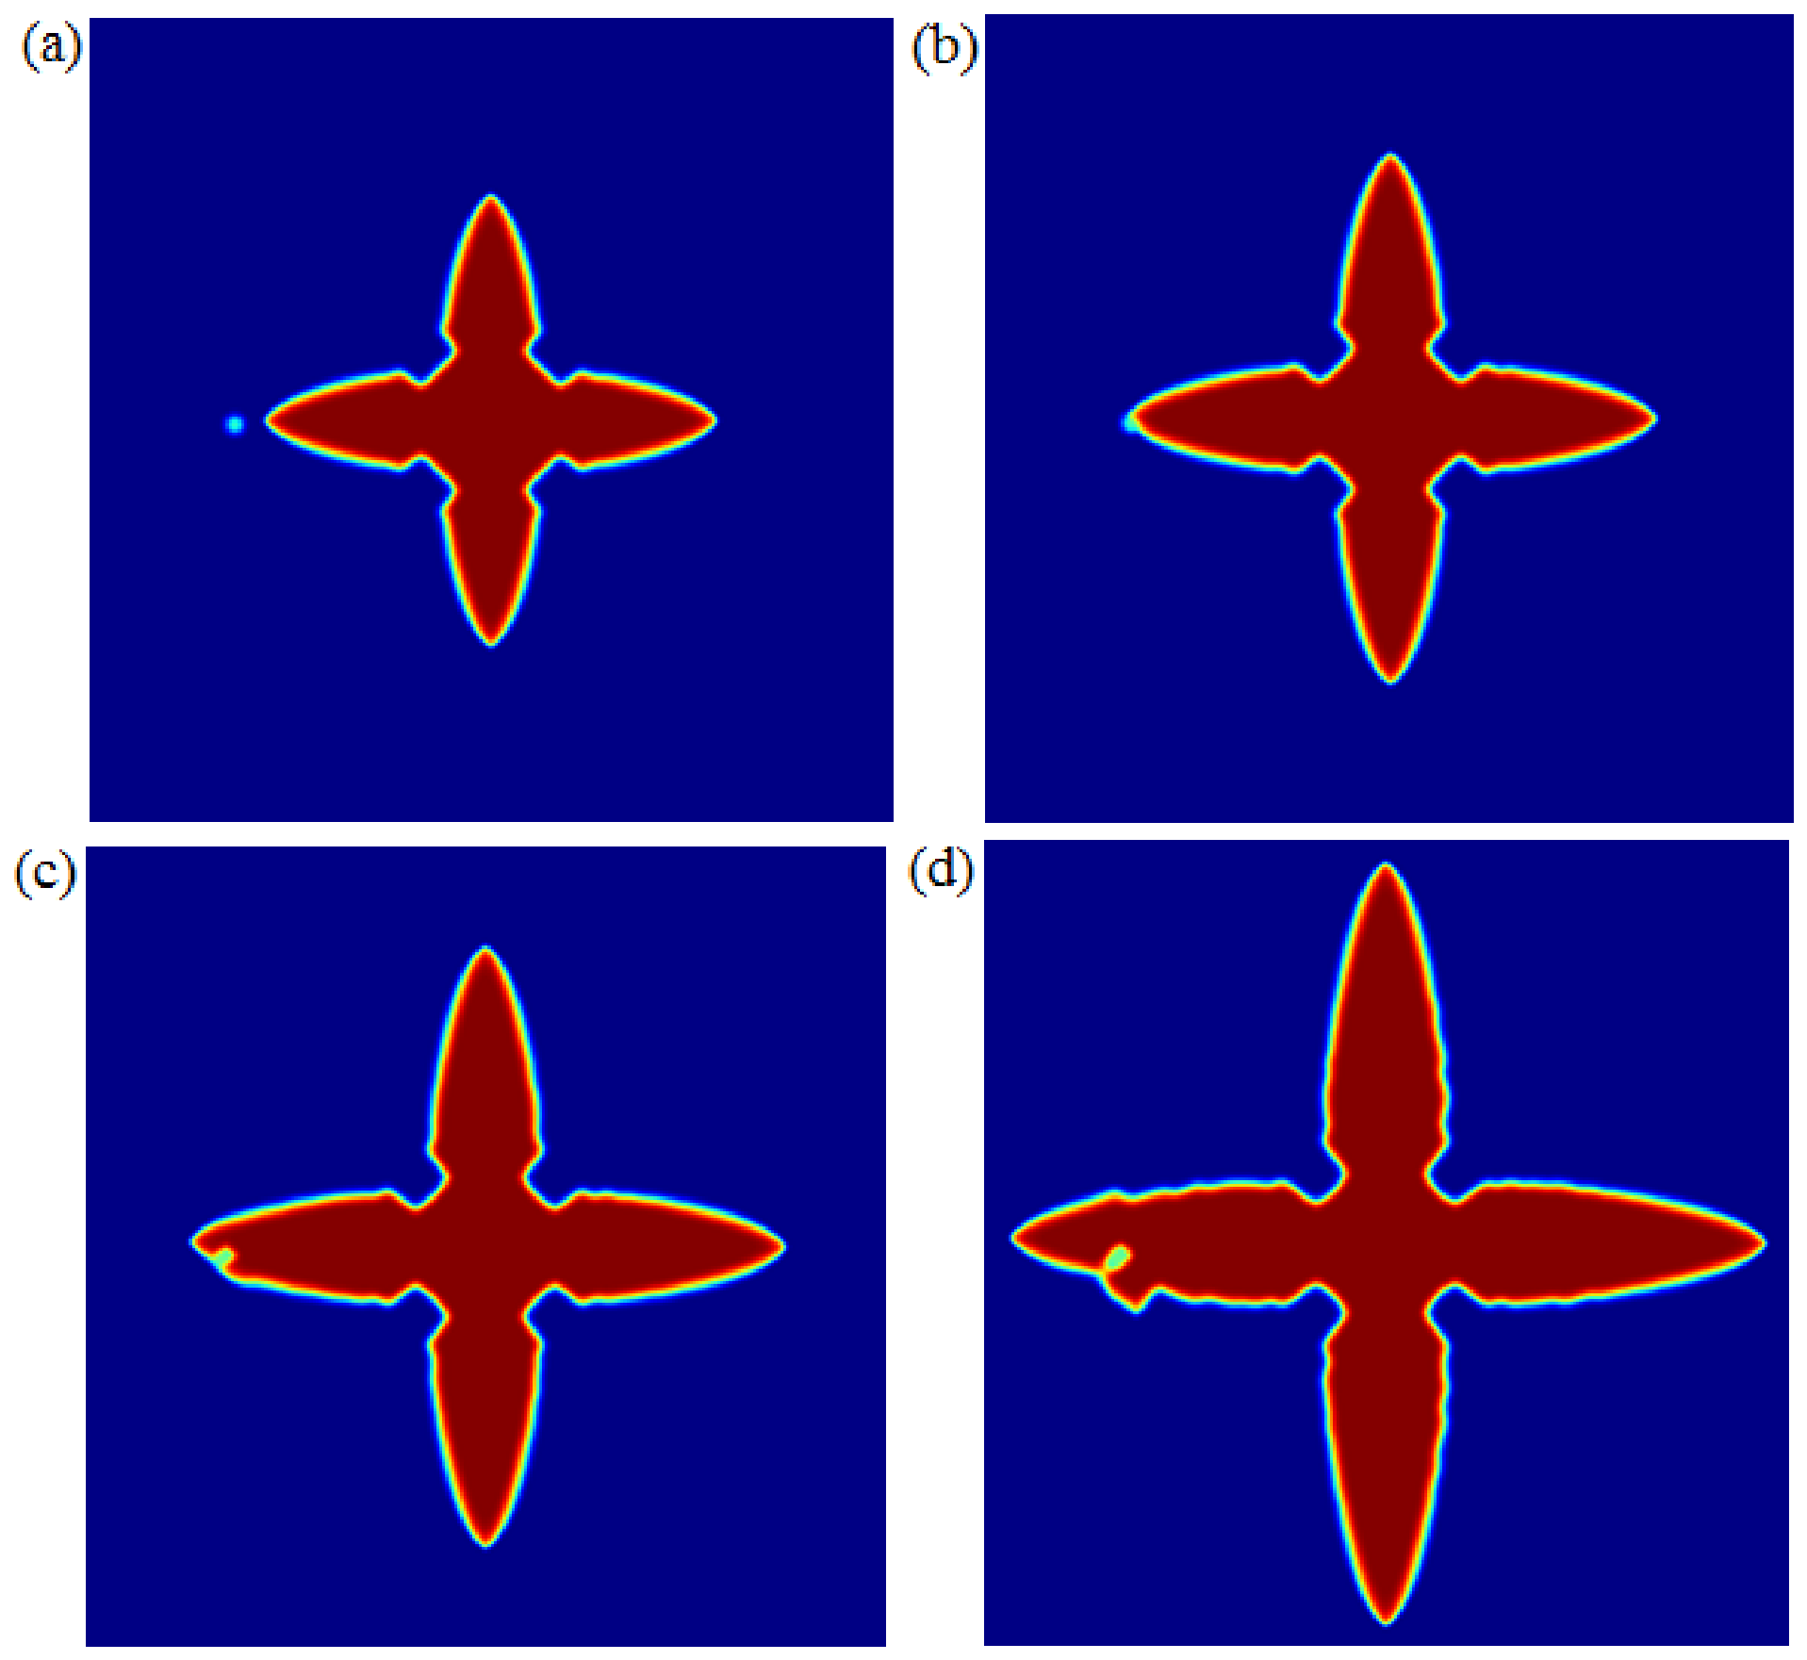
Figure 13 shows the effect of melt viscosity on engulfment when a particle is positioned at the dendrite side. As expected, engulfment occurs at higher undercoolings (tip velocities) compared to velocities for particles positioned at tip positions. The engulfment velocity decreases with an increase in melt viscosity. Figure 14 shows the particle being approached by the front and being engulfed. Here, the tip velocity is larger than the velocity when a particle is positioned at the tip.
Figure 13.
Variation of the critical velocity for particle engulfment with melt viscosity at different particle sizes when kp/km =1.5 and particle/solid interfacial energy ratio = 1.6 for a particle placed besides the dendrite tip.
Figure 14.
Engulfment of a particle of diameter 0.4 m at interface velocity of 7.4 10−4 m/s, particle/solid surface energy ratio = 1.6, Kp/Km = 1.5 and melt viscosity = 0.33. (a) t* = 10, (b) t* = 40, (c) t*= 70 and (d) t* = 100. Red color is for solidified material and blue color is the liquid melt.
Effect of Surface Energy
The effect of surface energy is shown in Figure 15. With an increase in surface energy, engulfment of particles becomes difficult. As the nanoparticles move away from dendritic arm tips, they are pushed and will accumulate between dendrite arms. This result agrees with the findings from the numerical study by Wang and Shi [11].
Figure 15.
Variation of the critical velocity for engulfment with particle–solid interfacial energy ratio for different particle sizes when kp/km = 1.5 and melt viscosity = 0.33.
Effect of Particle–Matrix Thermal Conductivity Ratio kp/km
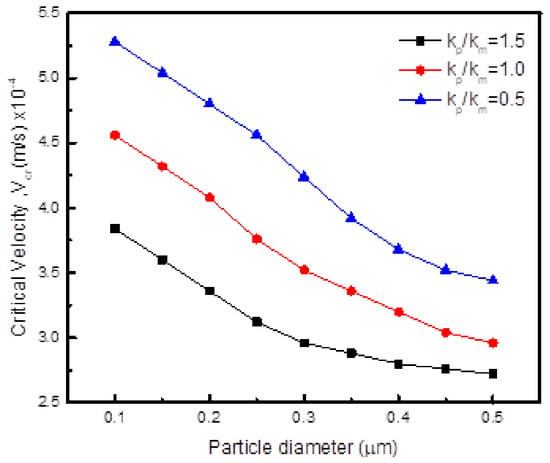
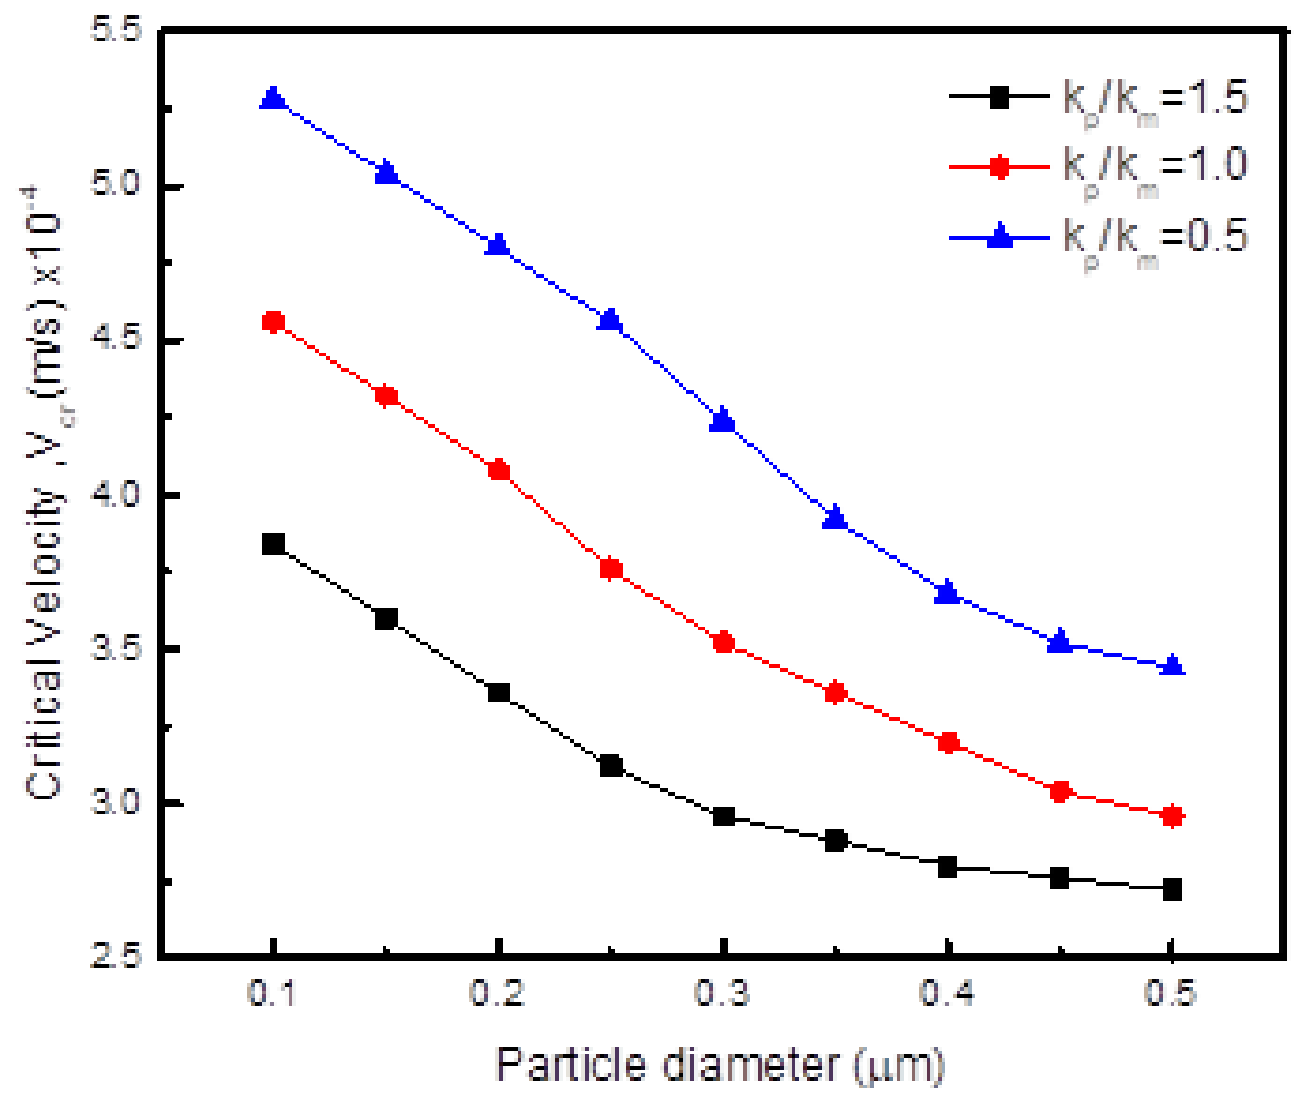
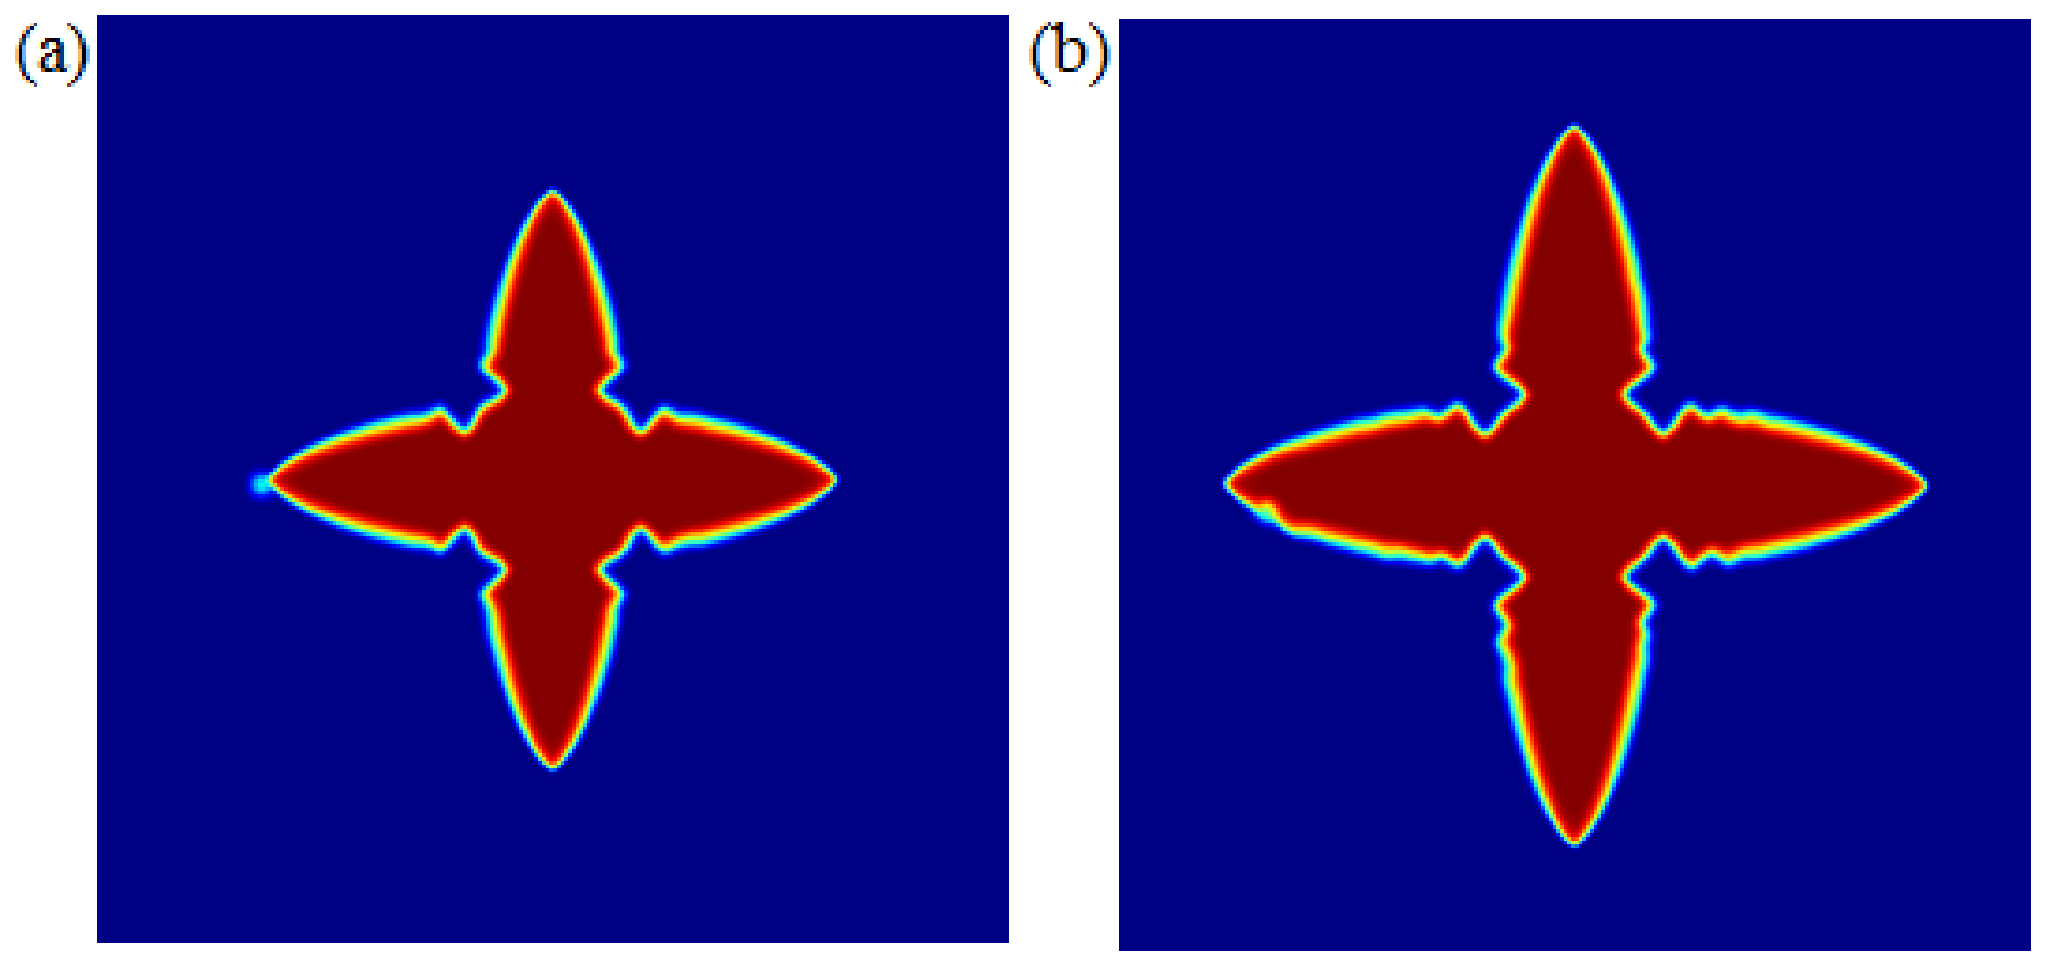
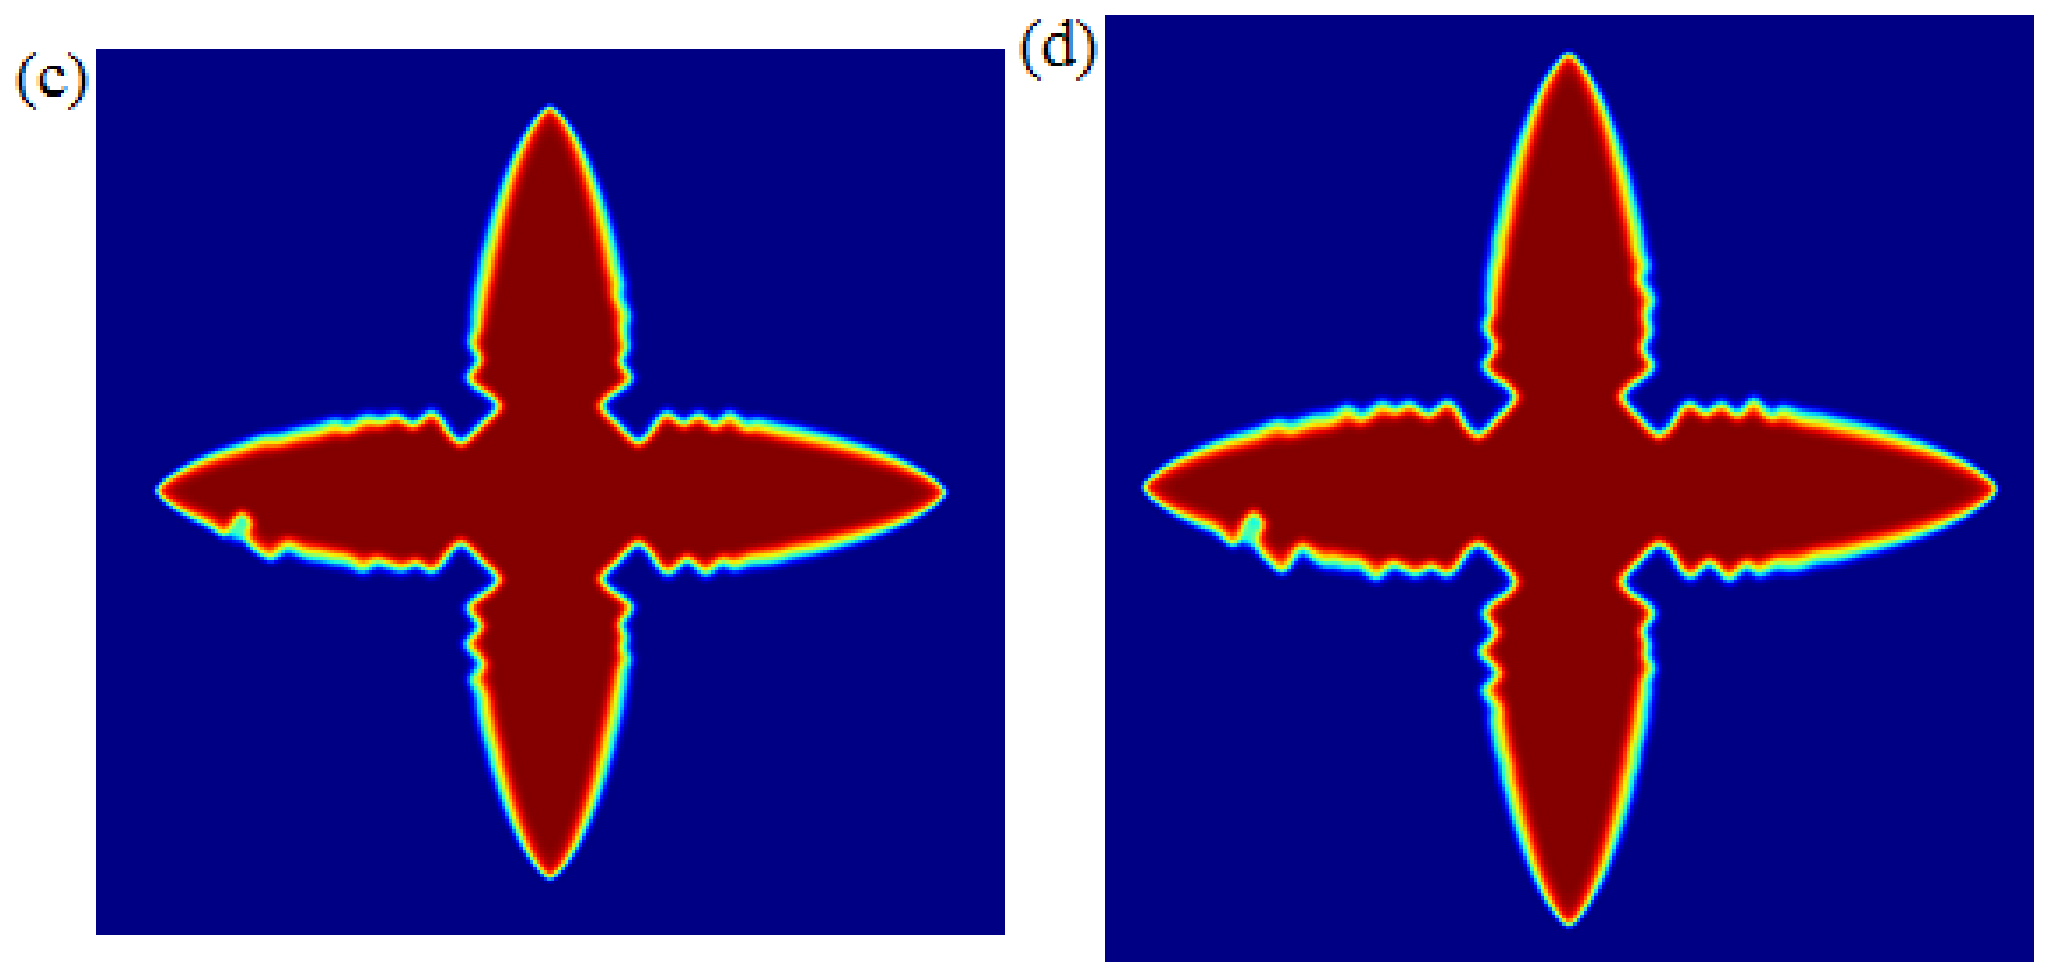
The effect of thermal conductivity is shown in Figure 16 and Figure 17. With a decrease in particle thermal conductivity, engulfment becomes difficult such that very high velocities are required for engulfment to occur. The particle will continuously slide from the surface towards regions of low velocity, such that, to reduce this sliding, high particle surface roughness is necessary.
Figure 16.
Variation of the critical velocity with particle to melt thermal conductivity ratios at different particle sizes when particle/solid interfacial energy ratio = 1.6 and melt viscosity = 0.33.
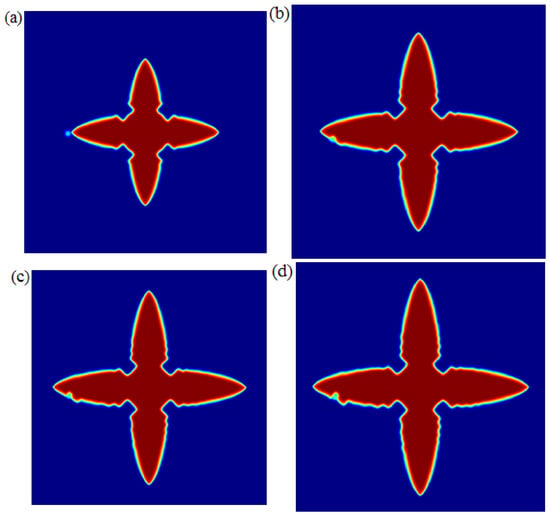
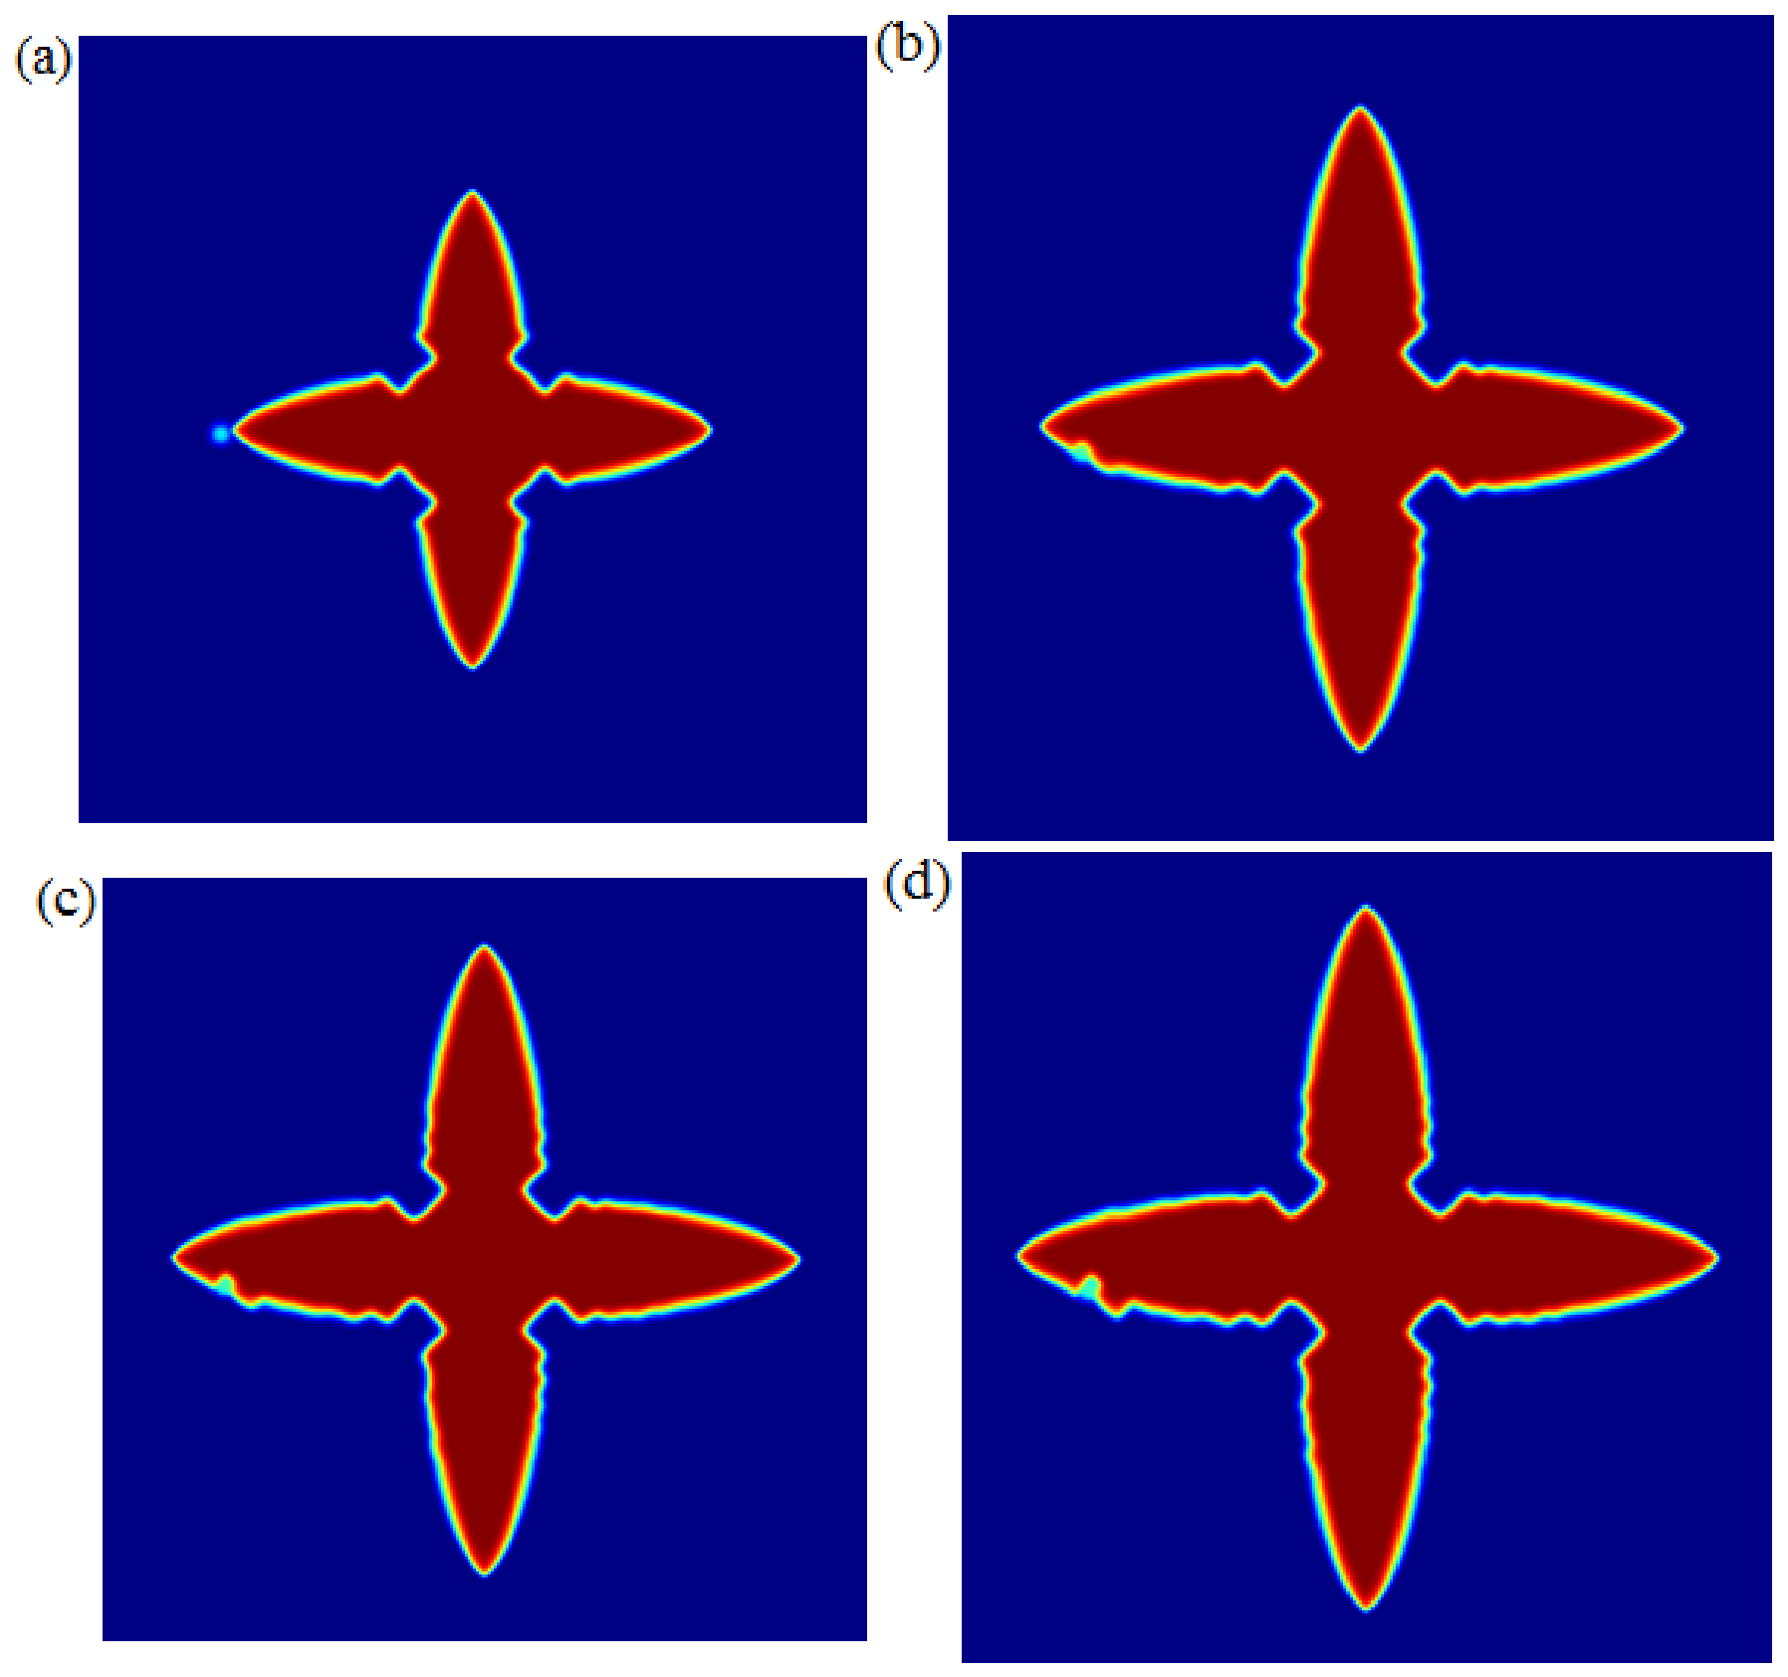
Figure 17.
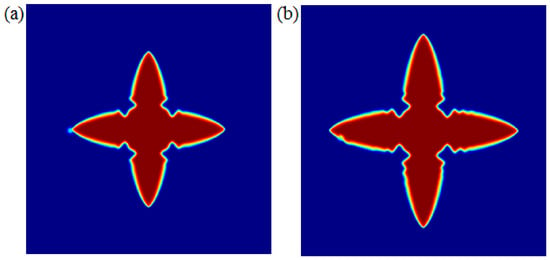
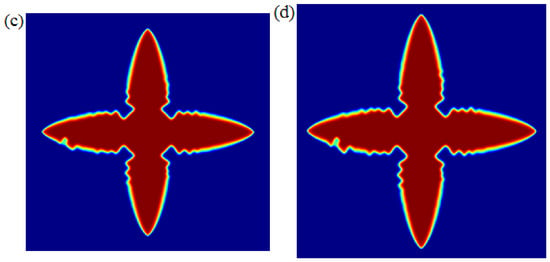
Engulfment of a particle of diameter 0.4 m at an interface velocity of 8.6 10−4 m/s, particle/solid surface energy ratio = 1.6, Kp/Km = 1.5 and melt viscosity = 0.33. (a) t* = 15, (b) t* = 70, (c) t*= 100 and (d) t* = 110. Red color is for solidified material and blue color is the liquid melt.
4. Conclusions
The phase field model for insoluble particle–interface interactions during solidification has been developed by modifying the pure solidification model to incorporate an insoluble particle. The interaction of the particle with the solid–liquid interface was modeled through the interaction term; and the mobility of the particle during solidification was conserved using the modified Lagrange multiplier method. The model was then used to determine critical velocities for particle engulfment for different material parameters and processing conditions in both planar and dendritic solidification of a pure metal. The presence of particles in front of the interface changes both its shape and final distribution of particles in the microstructure because of interactions occurring. The critical velocity maps for different materials and growth conditions were developed. The model was tested for solidification in presence of an insoluble particle and demonstrated the following aspects which agree with previous models and practical observations:
(1) Critical velocity: critical velocities for particle engulfment increase with an increase in surface energy but decrease with an increase in melt viscosity and particle to melt thermal conductivity ratios.
(2) Interface type: humps develop at the solidification front with an increase in thermal conductivity and particles easily slide to regions of low velocity, making it difficult for engulfment to occur. This is common during dendritic solidification and is contrary to planar front solidification where particle engulfment is easy.
(3) Microstructure: the presence of particles at the dendritic tip retards the tip growth velocity and this will facilitate nucleation of more grains and refine the microstructure.
The model is useful through the knowledge and ability to determine material parameters like interfacial energies, viscosities, conductivities for a particular system and cooling rates. To be of practical use in industrial applications, the model will be improved in future to include important aspects occurring during solidification of metal matrix composites. These include convection because of melt stirring, the use of multicomponent alloys rather than a pure metal, irregular particle shapes, and microstructure evolution rather than considering the interaction of a single ceramic particle with a dendritic grain. For high throughput in researching materials, the model can be integrated with machine learning to find suitable parameters and develop a database for processing high-strength ceramics strengthened with nanoparticles.
Author Contributions
Conceptualization, S.F.; methodology, S.F.; software, S.F.; validation, S.F.; formal analysis, A.M.; investigation, Q.K.; writing—original draft preparation, S.F.; writing—review and editing, A.M.; visualization, Q.K.; supervision, Q.K. All authors have read and agreed to the published version of the manuscript.
Funding
The authors would like to thank Harare Institute of Technology for the funding to publish this work.
Data Availability Statement
The original contributions presented in this study are included in the article. Further inquiries can be directed to the corresponding author.
Acknowledgments
The authors would like to thank Guangdong Technion Institute of Technology (GTIIT) for providing supercomputing facilities to carry out our simulations. Simbarashe Fashu would like to thank Nan Wang from Guangdong Technion Institute of Technology (GTIIT), China for introducing him to phase field simulation and the use of the Lagrange multiplier to conserve the moving ceramic nanoparticle during solidification.
Conflicts of Interest
The authors declare no conflicts of interest.
References
- Chen, L.-Y.; Xu, J.-Q.; Li, X.-C. Controlling phase growth during solidification by nanoparticles. Mater. Res. Lett. 2015, 3, 43–49. [Google Scholar]
- Chen, L.-Y.; Xu, J.-Q.; Choi, H.; Konishi, H.; Jin, S.; Li, X.-C. Rapid control of phase growth by nanoparticles. Nat. Commun. 2014, 5, 3879. [Google Scholar] [CrossRef] [Scilit] [PubMed]
- Jiang, D.; Yu, J. Simultaneous refinement and modification of the eutectic Si in hypoeutectic Al–Si alloys achieved via the addition of SiC nanoparticles. J. Mater. Res. Technol. 2019, 8, 2930–2943. [Google Scholar]
- Wang, K.; Jiang, H.Y.; Jia, Y.W.; Zhou, H.; Wang, Q.D.; Ye, B.; Ding, W.J. Nanoparticle-inhibited growth of primary aluminum in Al–10Si alloys. Acta Mater. 2016, 103, 252–263. [Google Scholar]
- Guo, E.; Shuai, S.; Kazantsev, D.; Karagadde, S.; Phillion, A.B.; Jing, T.; Li, W.; Lee, P.D. The influence of nanoparticles on dendritic grain growth in Mg alloys. Acta Mater. 2018, 152, 127–137. [Google Scholar] [CrossRef] [Scilit]
- Rohatgi, P.; Schultz, B.; Gupta, N.; Daoud, A. Solidification During Casting of Metal-Matrix Composites; ASM International: Almere, The Netherlands, 2008. [Google Scholar]
- Tao, Y.; Yeckel, A.; Derby, J.J. Steady-state and dynamic models for particle engulfment during solidification. J. Comput. Phys. 2016, 315, 238–263. [Google Scholar] [CrossRef] [Scilit]
- Kundin, J.; Aufgebauer, H.; Reimann, C.; Seebeck, J.; Friedrich, J.; Jauss, T.; Sorgenfrei, T.; Croell, A. Dynamic modeling of critical velocities for the pushing/engulfment transition in the Si-SiC system under gravity conditions. Metall. Mater. Trans. A 2017, 48, 342–353. [Google Scholar]
- Catalina, A.V.; Mukherjee, S.; Stefanescu, D. A dynamic model for the interaction between a solid particle and an advancing solid/liquid interface. Metall. Mater. Trans. A 2000, 31, 2559–2568. [Google Scholar] [CrossRef] [Scilit]
- Chen, X.-H.; Yan, H. Solid–liquid interface dynamics during solidification of Al 7075–Al2O3np based metal matrix composites. Mater. Des. 2016, 94, 148–158. [Google Scholar]
- Wang, Y.; Shi, J. Engulfment and distribution of second-phase nanoparticle during dendrite solidification of an Al–Si binary alloy: A simulation study. Appl. Phys. A 2019, 125, 449. [Google Scholar]
- Asthana, R.; Tewari, S.N. Second phase particle-solidification front interactions: An evaluation of theoretical models. Process. Adv. Mater. 1993, 3, 163–180. [Google Scholar]
- Asthana, R.; Tewari, S.N. The engulfment of foreign particles by a freezing interface. J. Mater. Sci. 1993, 28, 5414–5425. [Google Scholar] [CrossRef] [Scilit]
- Garvin, J.W.; Udaykumar, H.S. Particle–solidification front dynamics using a fully coupled approach. Part I Methodol. J. Cryst. Growth 2003, 252, 451–466. [Google Scholar]
- Li, H.; Wang, K.; Xu, G.; Jiang, H.; Wang, Q.; Ding, W. Nanoparticle-induced growth behavior of primary α-Mg in AZ91 alloys. Mater. Des. 2020, 196, 109146. [Google Scholar]
- Li, B.; Xu, Q.; Li, X.; Liu, B. Numerical Simulation of Microstructure of Al–Si/SiCp Composites during Stir Casting Process with Particle Pushing Model. ISIJ Int. 2006, 46, 241–249. [Google Scholar]
- Jegatheesan, M.; Bhattacharya, A. Model for particle capture by the solid-liquid interface during solidification of metal matrix nanocomposites. Therm. Sci. Eng. Prog. 2023, 45, 102109. [Google Scholar] [CrossRef] [Scilit]
- Jegatheesan, M.; Bhattacharya, A. A model for nanoparticle transport and distribution with particle-interface interaction during binary alloy solidification. J. Cryst. Growth 2023, 610, 127173. [Google Scholar] [CrossRef] [Scilit]
- Karma, A.; Rappel, W.-J. Phase-field method for computationally efficient modeling of solidification with arbitrary interface kinetics. Phys. Rev. E 1996, 53, R3017. [Google Scholar] [CrossRef] [Scilit]
- Ji, K.; Zhong, M.; Karma, A. Phase-field model of alloy solidification far from chemical equilibrium at the solid-liquid interface. Phys. Rev. Res. 2025, 7, 33128. [Google Scholar]
- Boettinger, W.J.; Warren, J.A.; Beckermann, C.; Karma, A. Phase-field simulation of solidification. Annu. Rev. Mater. Res. 2002, 32, 163–194. [Google Scholar] [CrossRef] [Scilit]
- Gu, Y.; He, X.; Han, D. On the phase-field modeling of rapid solidification. Comput. Mater. Sci. 2021, 199, 110812. [Google Scholar] [CrossRef] [Scilit]
- Bellemans, I.; Moelans, N.; Verbeken, K. Phase-field modelling in extractive metallurgy. Crit. Rev. Solid State Mater. Sci. 2018, 43, 417–454. [Google Scholar]
- DeWitt, S.; Thornton, K. Phase field modeling of microstructural evolution. In Computational Materials System Design; Springer: Berlin/Heidelberg, Germany, 2018; pp. 67–87. [Google Scholar]
- Moelans, N.; Blanpain, B.; Wollants, P. An introduction to phase-field modeling of microstructure evolution. Calphad 2008, 32, 268–294. [Google Scholar] [CrossRef] [Scilit]
- Ode, M.; Lee, J.S.; Suzuki, T.; Kim, S.G.; Kim, W.T. Numerical simulation of interface shape around an insoluble particle for Fe-C alloys using a phase-field model. ISIJ Int. 1999, 39, 149–153. [Google Scholar] [CrossRef] [Scilit]
- Ode, M.; Lee, J.S.; Kim, S.G.; Kim, W.T.; Suzuki, T. Numerical simulation of the critical velocity for particle pushing/engulfment transition in Fe–C alloys using a phase-field model. ISIJ Int. 2000, 40, 153–160. [Google Scholar]
- Ma, X.; Zheng, L.L.; Zhang, H. Silicon carbide particle formation/engulfment during directional solidification of silicon. Int. J. Heat Mass Transf. 2016, 99, 76–85. [Google Scholar] [CrossRef] [Scilit]
- Wang, N.; Upmanyu, M.; Karma, A. Phase-field model of vapor-liquid-solid nanowire growth. Phys. Rev. Mater. 2018, 2, 33402. [Google Scholar]
- Bollada, P.C.; Jimack, P.K.; Mullis, A.M. Multiphase field modelling of alloy solidification. Comput. Mater. Sci. 2020, 171, 109085. [Google Scholar] [CrossRef] [Scilit]
- Fashu, S.; Yang, J.; Yang, L.; Wang, N. Phase-field modelling of 2D island growth morphology in chemical vapor deposition. Eur. Phys. J. E 2020, 43, 57. [Google Scholar] [CrossRef] [Scilit] [PubMed]
- Shen, X.; Zhao, H.; Guo, E.; Xu, Q. Modeling of dendritic growth and particle pushing/engulfment in the solidification of aluminum matrix composites with the CA-LBM-IMB method. Int. J. Therm. Sci. 2024, 199, 108925. [Google Scholar]
- Long, Q.; Wang, W.; Gao, X. Effect of oxygen and sulfur on alumina particle behavior in front of solid–liquid interface of steel liquid. J. Mater. Res. Technol. 2023, 27, 1381–1394. [Google Scholar] [CrossRef] [Scilit]
- Garvin, J.W.; Udaykumar, H.S. Particle-solidification front dynamics using a fully coupled approach, part II: Comparison of drag expressions. J. Cryst. Growth 2003, 252, 467–479. [Google Scholar] [CrossRef] [Scilit]
- Shangguan, D.; Ahuja, S.; Stefanescu, D.M. An analytical model for the interaction between an insoluble particle and an advancing solid/liquid interface. Metall. Trans. A 1992, 23, 669–680. [Google Scholar] [CrossRef] [Scilit]
- Wilde, G.; Perepezko, J.H. Experimental study of particle incorporation during dendritic solidification. Mater. Sci. Eng. A 2000, 283, 25–37. [Google Scholar] [CrossRef] [Scilit]

Disclaimer/Publisher’s Note: The statements, opinions and data contained in all publications are solely those of the individual author(s) and contributor(s) and not of MDPI and/or the editor(s). MDPI and/or the editor(s) disclaim responsibility for any injury to people or property resulting from any ideas, methods, instructions or products referred to in the content. |
© 2026 by the authors. Licensee MDPI, Basel, Switzerland. This article is an open access article distributed under the terms and conditions of the Creative Commons Attribution (CC BY) license.