


Abstract
Acoustic emission (AE) technology was used to monitor the fatigue crack growth process of superalloy. The analysis results show that both the cumulative values and the K-entropy values of AE parameters have good correspondences with the three stages described by fracture mechanics, which makes it possible to characterize the process of fatigue crack growth. Since K-entropy is more sensitive to changes in fatigue state, the turning points between the second stage and the third stage are earlier than those defined by fracture mechanics, indicating that it has an early warning capability. The K-entropy of AE parameter was first proposed to represent the growth rate of fatigue crack. This method not only effectively decreased the large dispersion of change rate of AE parameters but also ensured the similarity with the fatigue crack growth rate, thereby optimizing the characterization of fatigue crack growth.
1. Introduction
Ni-based superalloys have emerged as the preferred material for critical structural components especially hot-end parts due to their excellent mechanical properties at elevated temperatures and superior oxidation and corrosion resistance subjected to extreme service environments [1,2,3]. During service, they are prone to fatigue failure [4]. Low-cycle fatigue of metals is defined as a kind of failure that occurs after a limited number of cycles at a high stress level characterized by large plastic deformation, high stress levels, rapid crack growth and short lifetimes [5]. Metal fatigue is a progressive and complex damage phenomenon closely related to material properties and load conditions [6]. The evolution of fatigue damage typically consists of three stages: initiation, stable growth and rapid growth of fatigue cracks, where the growth of cracks collectively accounts for over 90% of fatigue life [7] and fatigue failure accounts for more than 40% of the practical failures [8]. Therefore, early detection of low-cycle fatigue cracks is of great significance for ensuring the safety of engineering structures [9].
The initiation and progression of damage in a structure under cyclic loading are known as fatigue crack growth [10] that plays a significant role in structural integrity and safety assessments of components across various engineering applications [11,12,13,14]. Cracks caused by fatigue are the most common kind of damage in metal and alloy structures. Under the elastic load limit, as the number of load cycles increases, the cracks gradually grow until they reach the critical limit and fail. Therefore, the accurate assessment of crack growth is of vital importance for ensuring the safe and reliable operation of structures under cyclic loads [15].
Compared with other sensing technologies, such as guide wave [16], Lamb wave [17], full spectral response [18], compliance method [19] and non-destructive testing methods, such as thermography [20], electrical resistance and digital image correlation [21], acoustic emission (AE) technology, as a passive and non-destructive testing method, stands out due to its high sensitivity, wide-range monitoring capability, as well as the ability to detect micro-energy release events occurring within materials in real-time during the process of crack growth [22,23]. AE technology has been widely applied to damage monitoring in materials [24,25,26,27] and structures [28,29,30,31], which is defined as the transient elastic stress waves within materials originated from the rapid release of energy from an internal damage source such as crack growth and plastic deformation when a component is stressed mechanically, thermally or chemically [32]. Highly sensitive sensors, amplifiers and advanced data acquisition systems are used by AE technology to capture, amplify and analyze the stress waves in real-time [33]. Then, the stress waves are converted and recorded as digital signals [34], from which AE parameters are further extracted, such as count, amplitude, risetime, duration and energy.
Linear elastic fracture mechanics-related parameters such as crack length, crack growth rate and stress intensity are commonly used as indicators of fatigue damage [35]. Currently, most models of fatigue crack growth are based on the Paris-Erdogan model [36] which represents the development of crack before the rapid rupture and uses linear data graphs to establish the relationship between the fatigue crack growth rate with the stress intensity factor range of the material structure [37]. The most used AE parameter for fatigue is AE count and AE count rate was calculated to set up the theoretical relationship between AE data characteristics and crack growth behavior [38,39,40,41,42,43,44]. Harris and Dunegan [45] presented a model by relating AE count to the energy released during crack growth to describe the relationship between AE count rate and the stress intensity range. It was improved subsequently by Lindley et al. [38] considering that the contributions to AE count also originated from plastic deformation and fracture events in the plastic zone ahead of the crack tip. Han et al. [39] and Li et al. [40,41] discriminated the entire process of AE into three damage stages by evolution characteristics of cumulative AE count, which corresponded to crack initiation, stable crack growth and rapid crack growth until final fracture respectively. Whereas Chai et al. [42] focused their attention on the Paris region of fatigue crack growth and two sub-stages in Paris region were identified through an obvious change in cumulative AE count corresponding to a sharp change in the crack growth rate. In addition, some studies have established relations between other AE parameters such as amplitude [46,47,48,49], energy [50,51,52,53] and duration [54] to crack growth. The effect factors to AE behaviors have also been investigated, including equipment settings such as peak load, cyclic frequency and load ratio; sensor selection such as threshold, frequency response, coupling.
Compared to the commonly used AE count which is highly dependent on the electronic settings, such as trigger level of AE sensors and the gain of electronic devices, AE absolute energy has almost no dependence on the threshold [35,55,56]. From the definition, AE energy is the area under the envelope of the signal amplitude, while AE absolute energy has a quadratic relationship with AE energy numerically and is independent of the threshold. AE count, on the other hand, is the number of times the signal amplitude exceeds the threshold, which is clearly highly dependent on the threshold. Yu et al. [35,55,56] established the relationship between AE absolute energy rate and the stress intensity range and found that AE absolute energy rate is more suitable for the characterization and prediction of fatigue crack growth. More and more evidence indicates that the distribution of data points on the curve of AE count rate varying with stress intensity is more dispersed than that on the curve of crack growth rate [34,35,44,54,55,56]. In fact, although the dispersion of AE absolute energy rate is not as severe as that of AE count rate, in Yu et al.’s research they found that AE absolute energy rate also has the problem of dispersion [35,55,56]. This might be caused by some uncertain influencing factors. The scattered distribution of data points will inevitably indicate a relatively large errors in the characterization of real crack growth process.
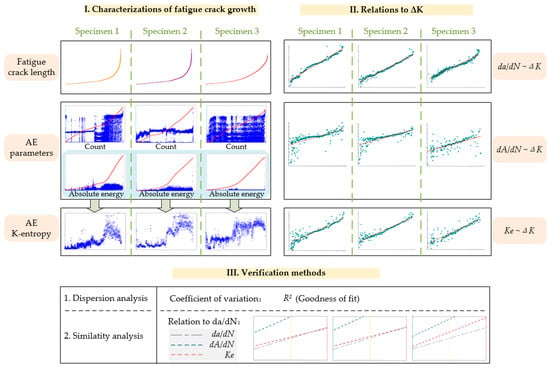
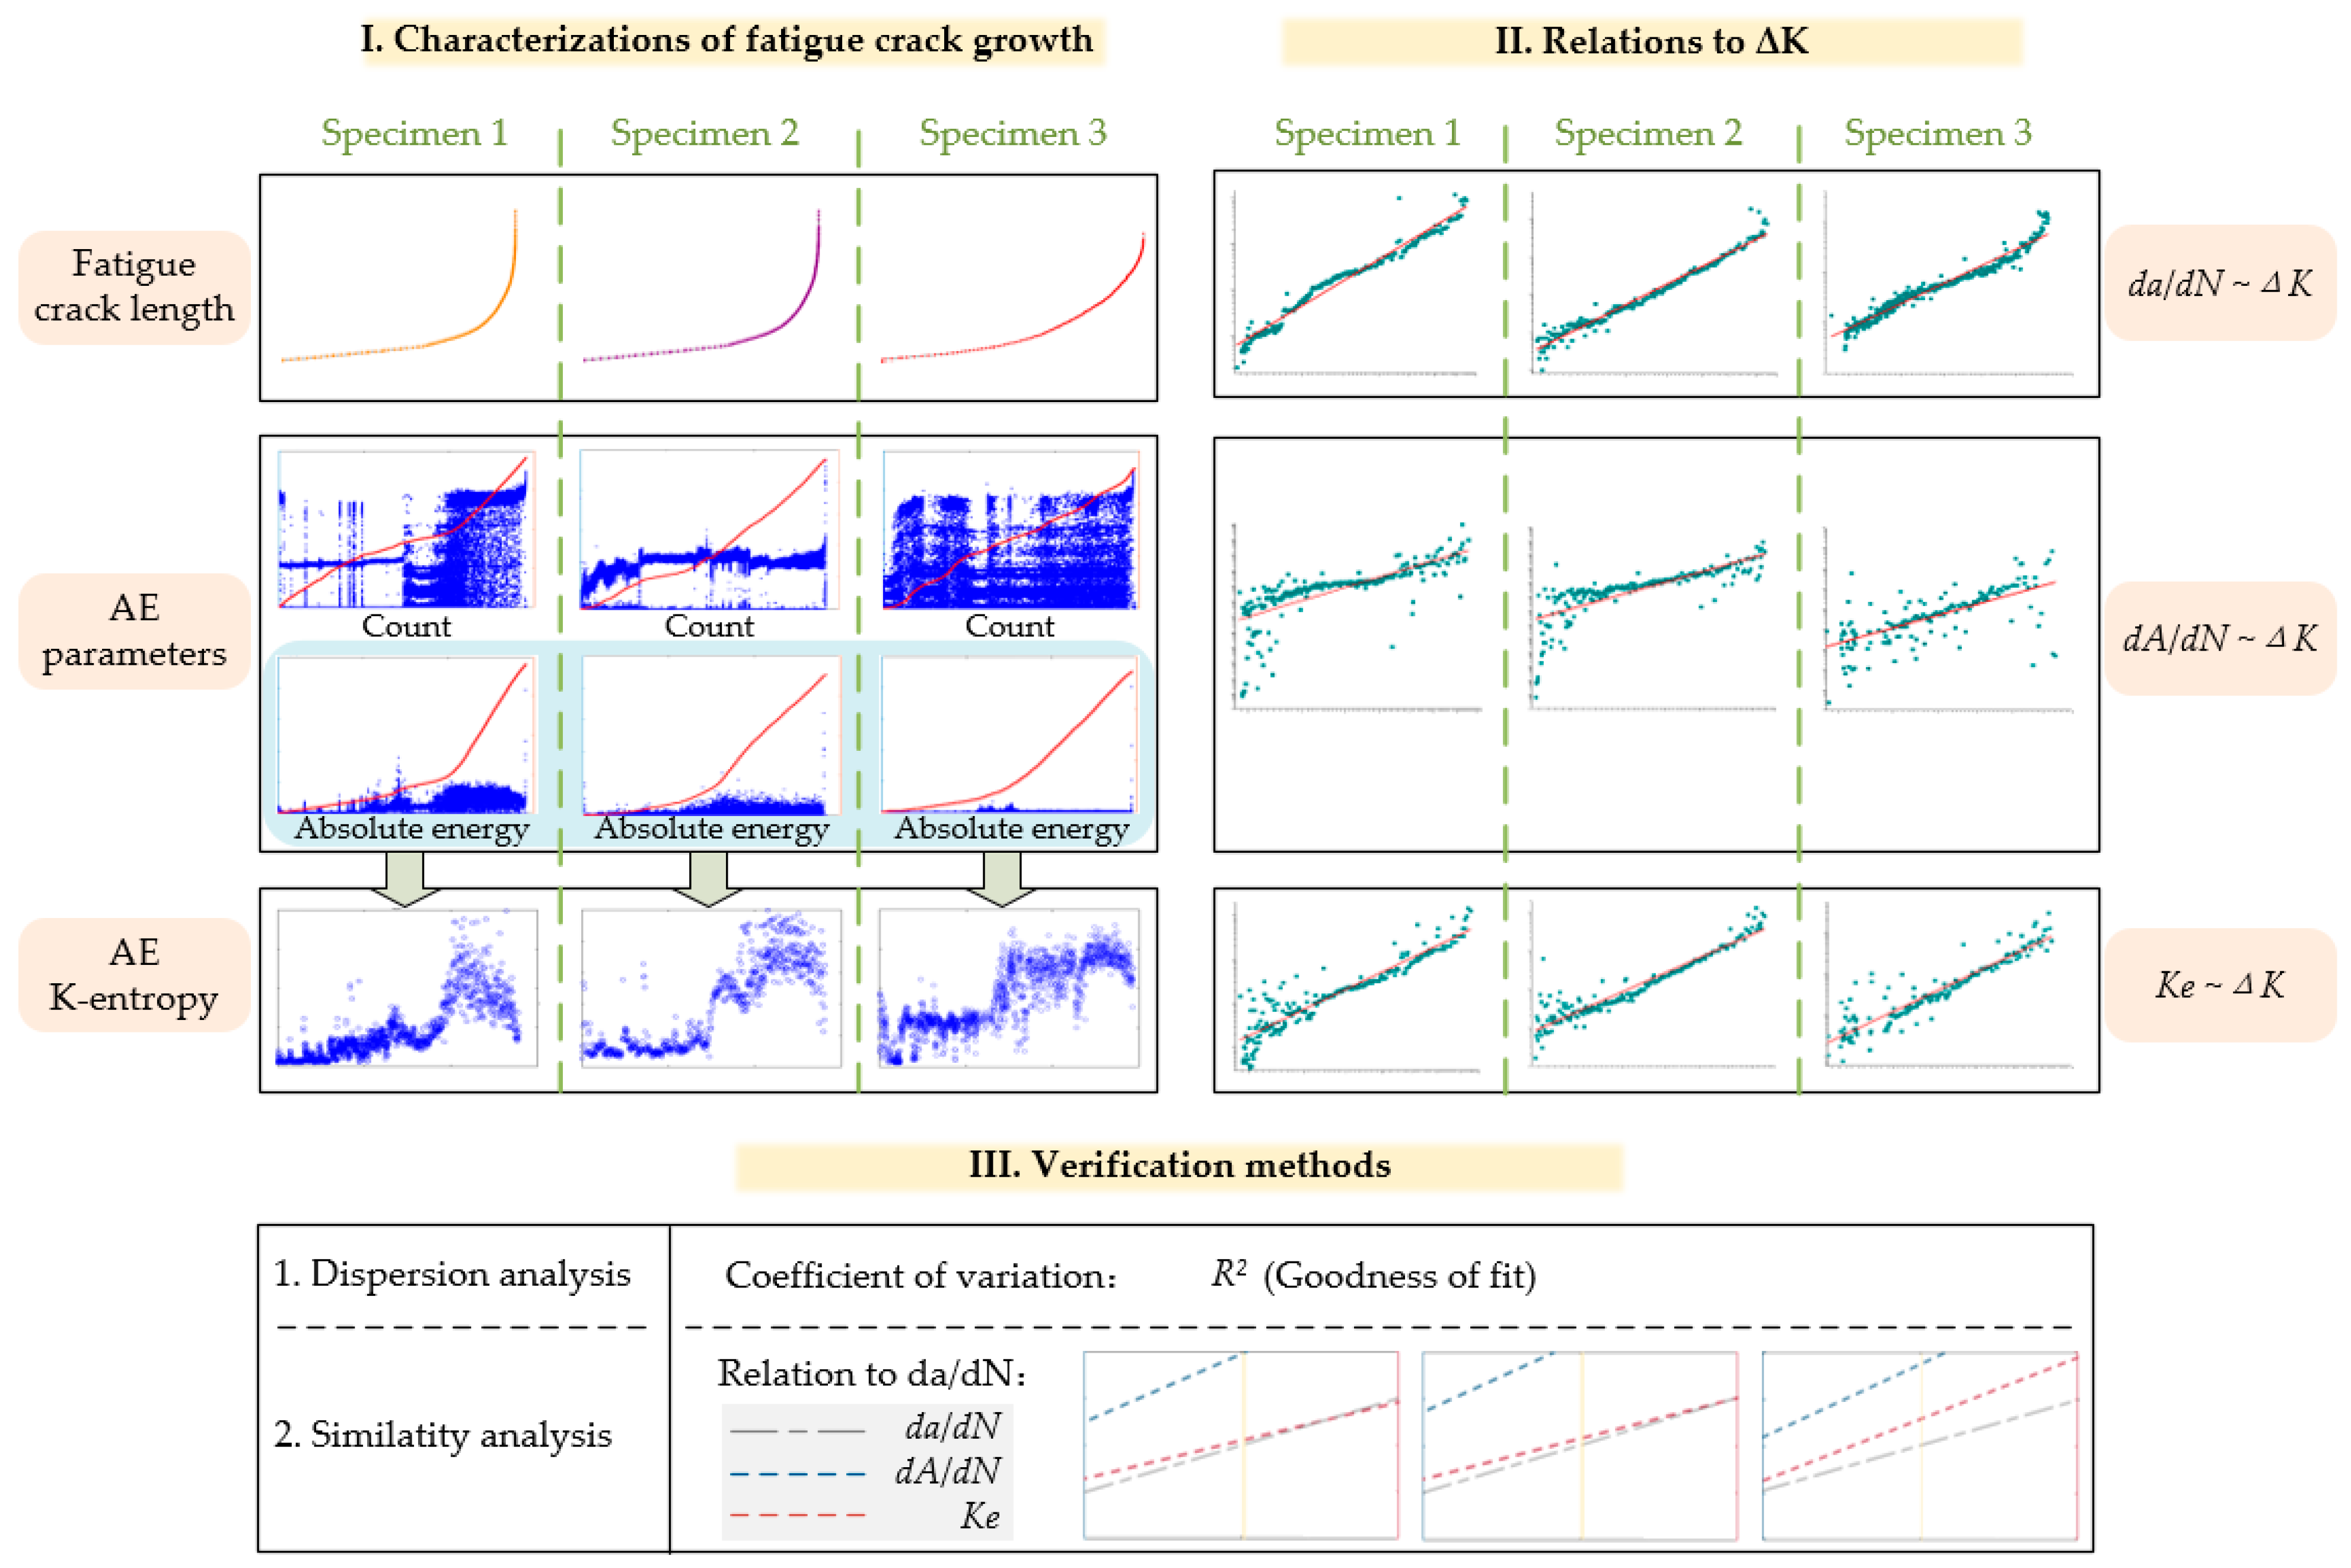
In this paper, due to the sensitivity to information changes and insensitivity to uncertain influencing factors, K-entropy was used to further process AE parameters in attempt to reduce dispersion. Compared with other chaotic theory parameters, such as Lyapunov exponent and correlation dimension, K-entropy cannot only determine whether AE parameters have chaotic characteristics but also characterize them well. The experimental results show that this new parameter cannot only characterize the fatigue crack growth process more accurately and clearly, but it also has a good corresponding relationship with the three stages of fracture mechanics. Due to the high sensitivity of this new parameter to changes, it is possible to conduct more effective online monitoring of fatigue process and issue earlier warnings for fatigue changes. Moreover, through the analysis, it can be known that the dispersion of its relationship with the stress intensity factor range has been greatly reduced, and the deviation from the crack growth rate has also been decreased, which verified the theoretical feasibility of this method. The proposed method made it possible to more accurately characterize the fatigue crack growth process, thereby providing a better basis for real-time monitoring and early warning of fatigue. The overall research scheme is shown in Figure 1.
Figure 1.
Research scheme of characterization and analysis of fatigue crack growth.
2. Experiment
2.1. Material and Specimen
The material used in this study was a directionally solidified CM247LC Ni-based superalloy prepared by the High-Rate Solidification (HRS) process. The nominal chemical composition of the alloy is shown in Table 1. The specimens were heat-treated according to the following schedule: 1245 °C/2 h+ 1260 °C/2 h/AC + 1080 °C/4 h/AC + 870 °C/24 h/AC. Owing to the directional solidification route, the alloy exhibited a columnar grain structure along the growth direction. After heat treatment, the alloy exhibited a typical γ/γ′ microstructure, with an average γ′ precipitate size of approximately 530 nm and a γ′ volume fraction of about 57%.
Table 1.
Chemical composition of CM 247 LC alloy (Wt.%).
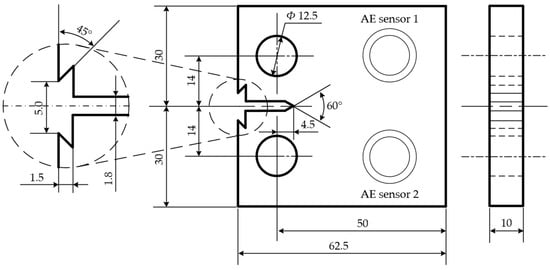
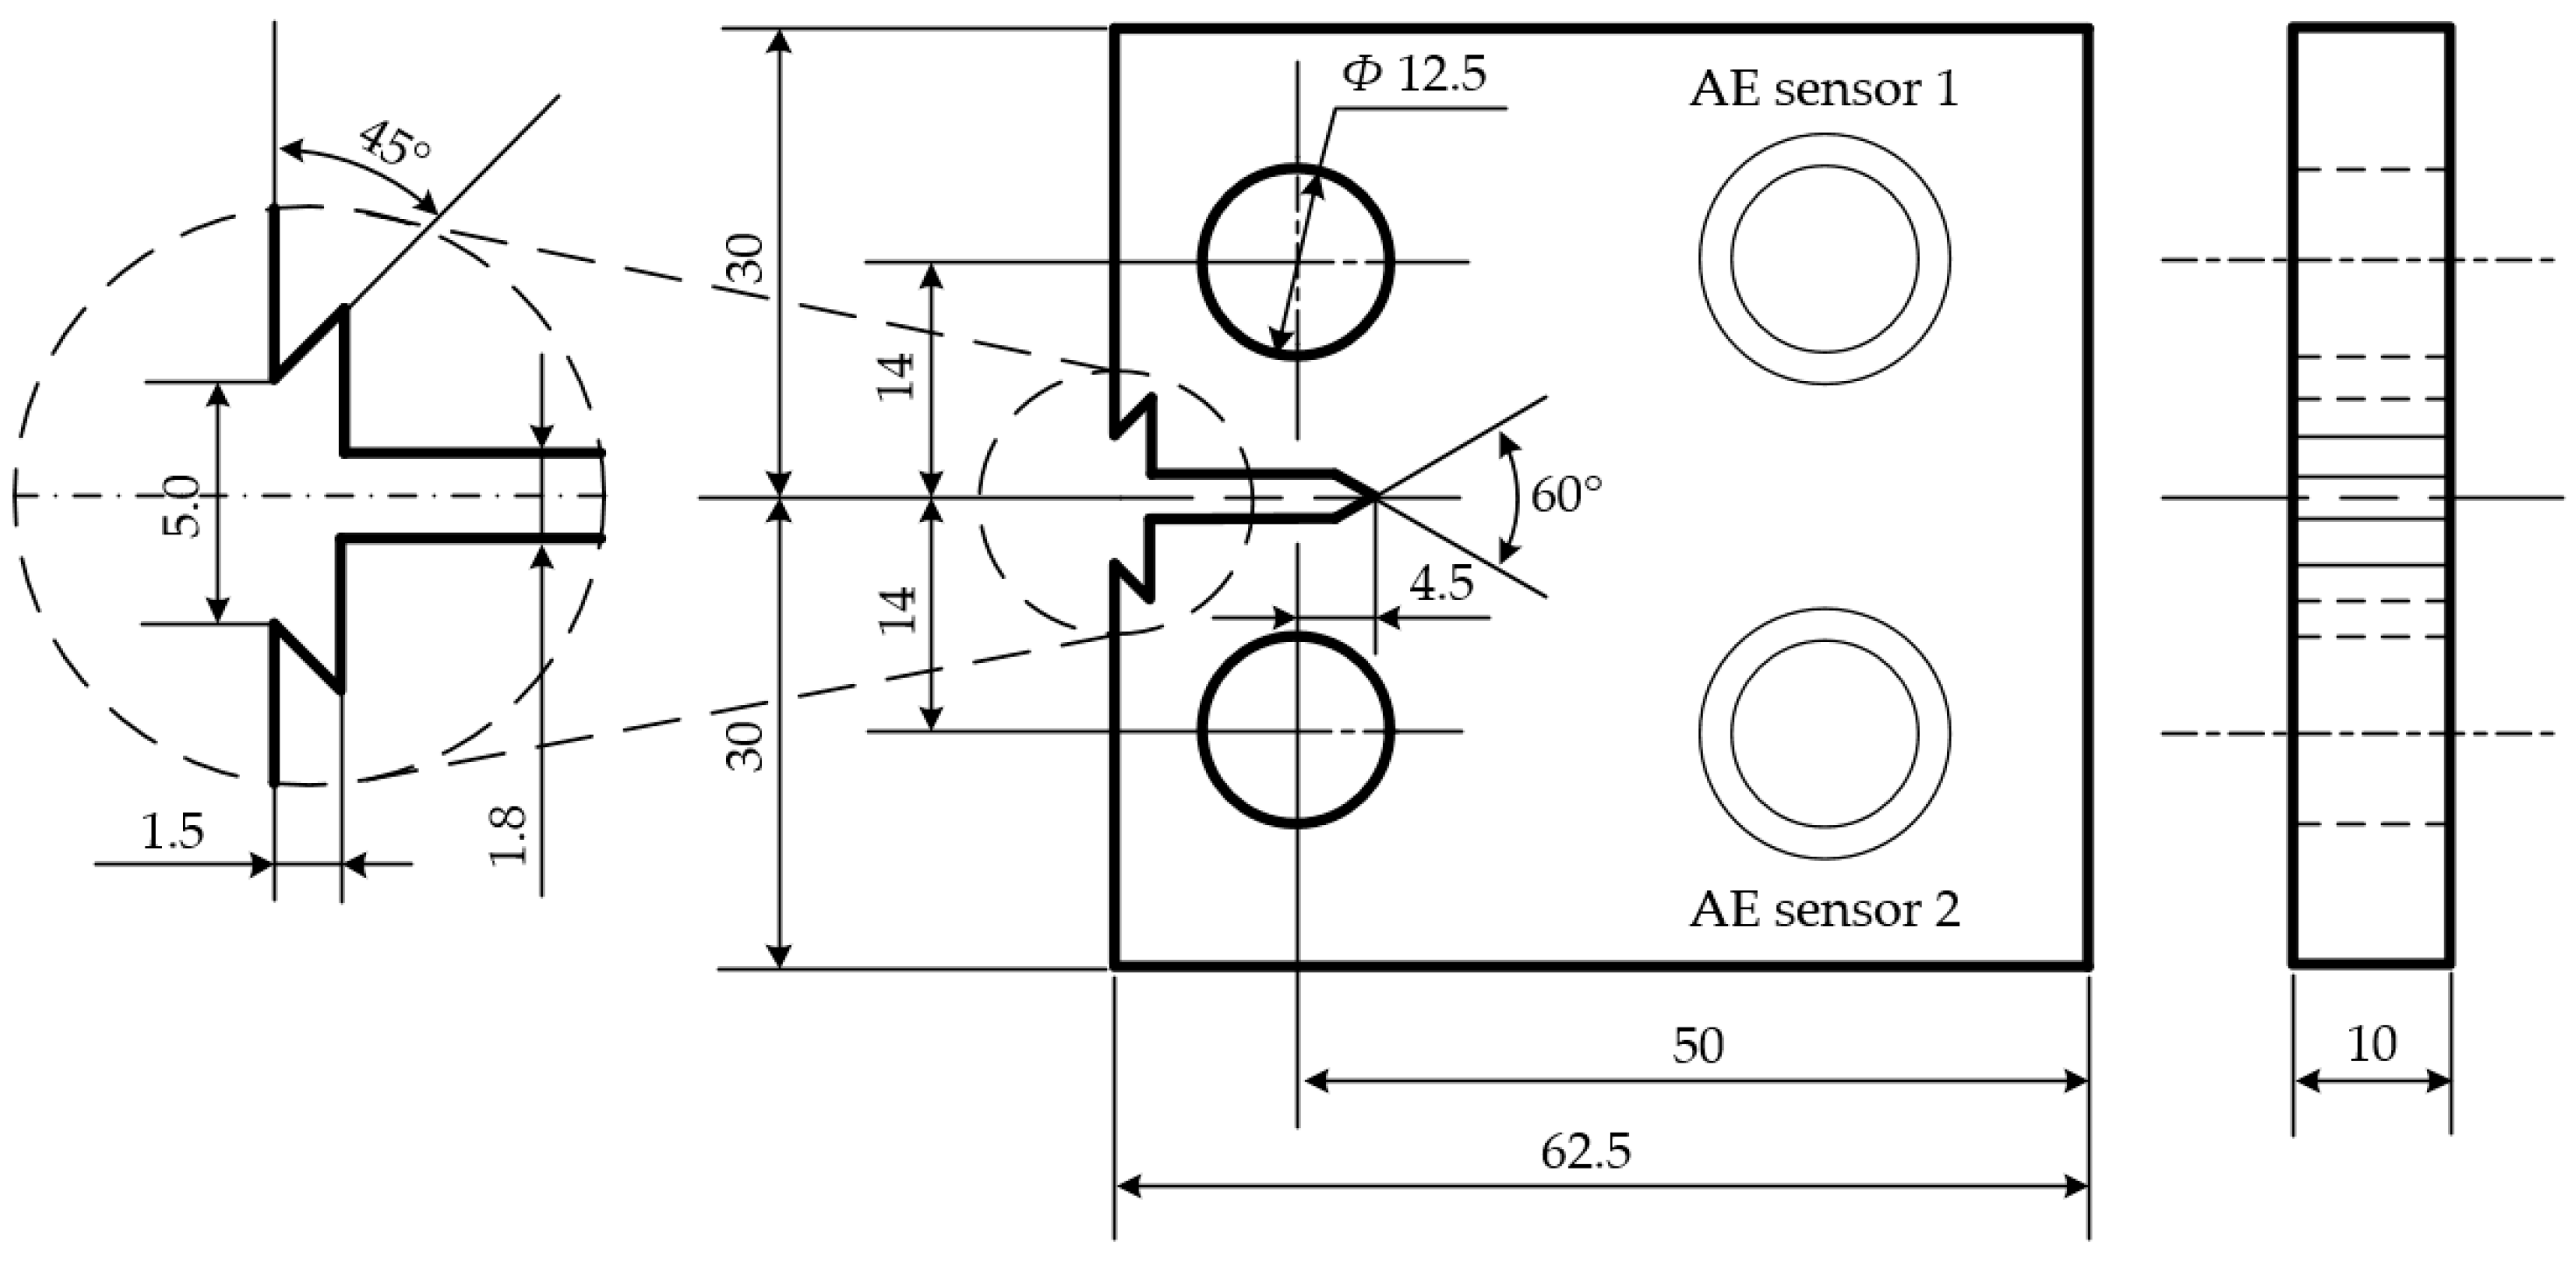
According to GB/T6398-2000 [57] “Test Method for Fatigue Crack Growth Rate of Metallic Materials”, compact tensile (C(T)) standard specimens were used, and the sizes of the test specimens are shown in Figure 2.
Figure 2.
Compact tension specimen and position of the AE sensors. (unit: mm).
2.2. Equipment and Procedure
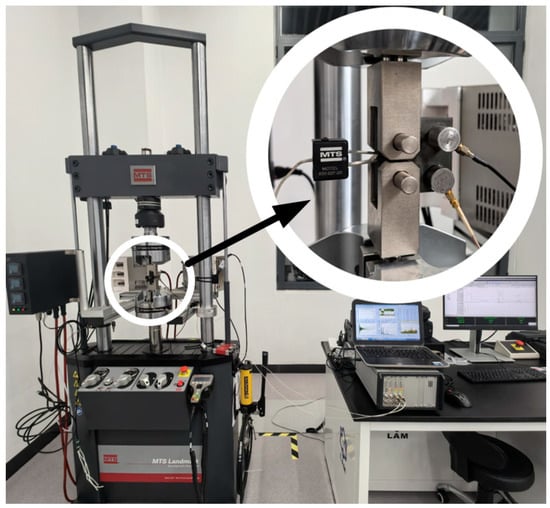
The Landmark servohydraulic test systems produced by MTS Company in Eden Prairie, MN, USA was adopted in the test. According to the requirements of standard test methods such as GB/T 6398 [57] and ASTM E647 [58], we adopt the constant amplitude loading method. The purpose of choosing constant amplitude loading is to obtain the intrinsic crack growth behavior of the material—that is, the constitutive relationship (Paris-Erdogan [53] relationship) between the crack growth rate and the driving force at the crack tip. Although applied load range remains unchanged, as the crack length increases, the stress intensity factor range increases as well. This enables us to obtain complete data of crack growth related to driving force in a single experiment. As a result, the load range applied to the specimens remains constant and is lower than the yield strength of the material, with a maximum load of 25 kN and a stress ratio of 0.1. Fatigue crack growth tests were conducted on three specimens. The load frequency of the first two specimens is 15 Hz and that of the third specimen is 25 Hz. The length of the cracks was calculated and recorded in real-time by the flexibility method [59] using the clamping extensometer (COD gauge) of MODEL 632.02F-20 produced by MTS Company, the accuracy of measuring the crack length by this method is usually within ± 0.05 mm. The data acquisition system records the crack length and the corresponding number of cycles N at fixed cycle intervals of 500 (the second stage) and 100 (the first stage and the third stage). Before the fatigue tests, cracks with length of 1 mm were prefabricated as defects on the surfaces of the specimens. The initial maximum load was 2.5 kN and the final load was approximately 1.8 kN. The crack length was calculated online by the flexibility method. After cycles of 23,841, 25,331 and 35,761 respectively, the crack length corresponding to the flexibility reached 1.0 ± 0.05 mm and the procedure was stopped.
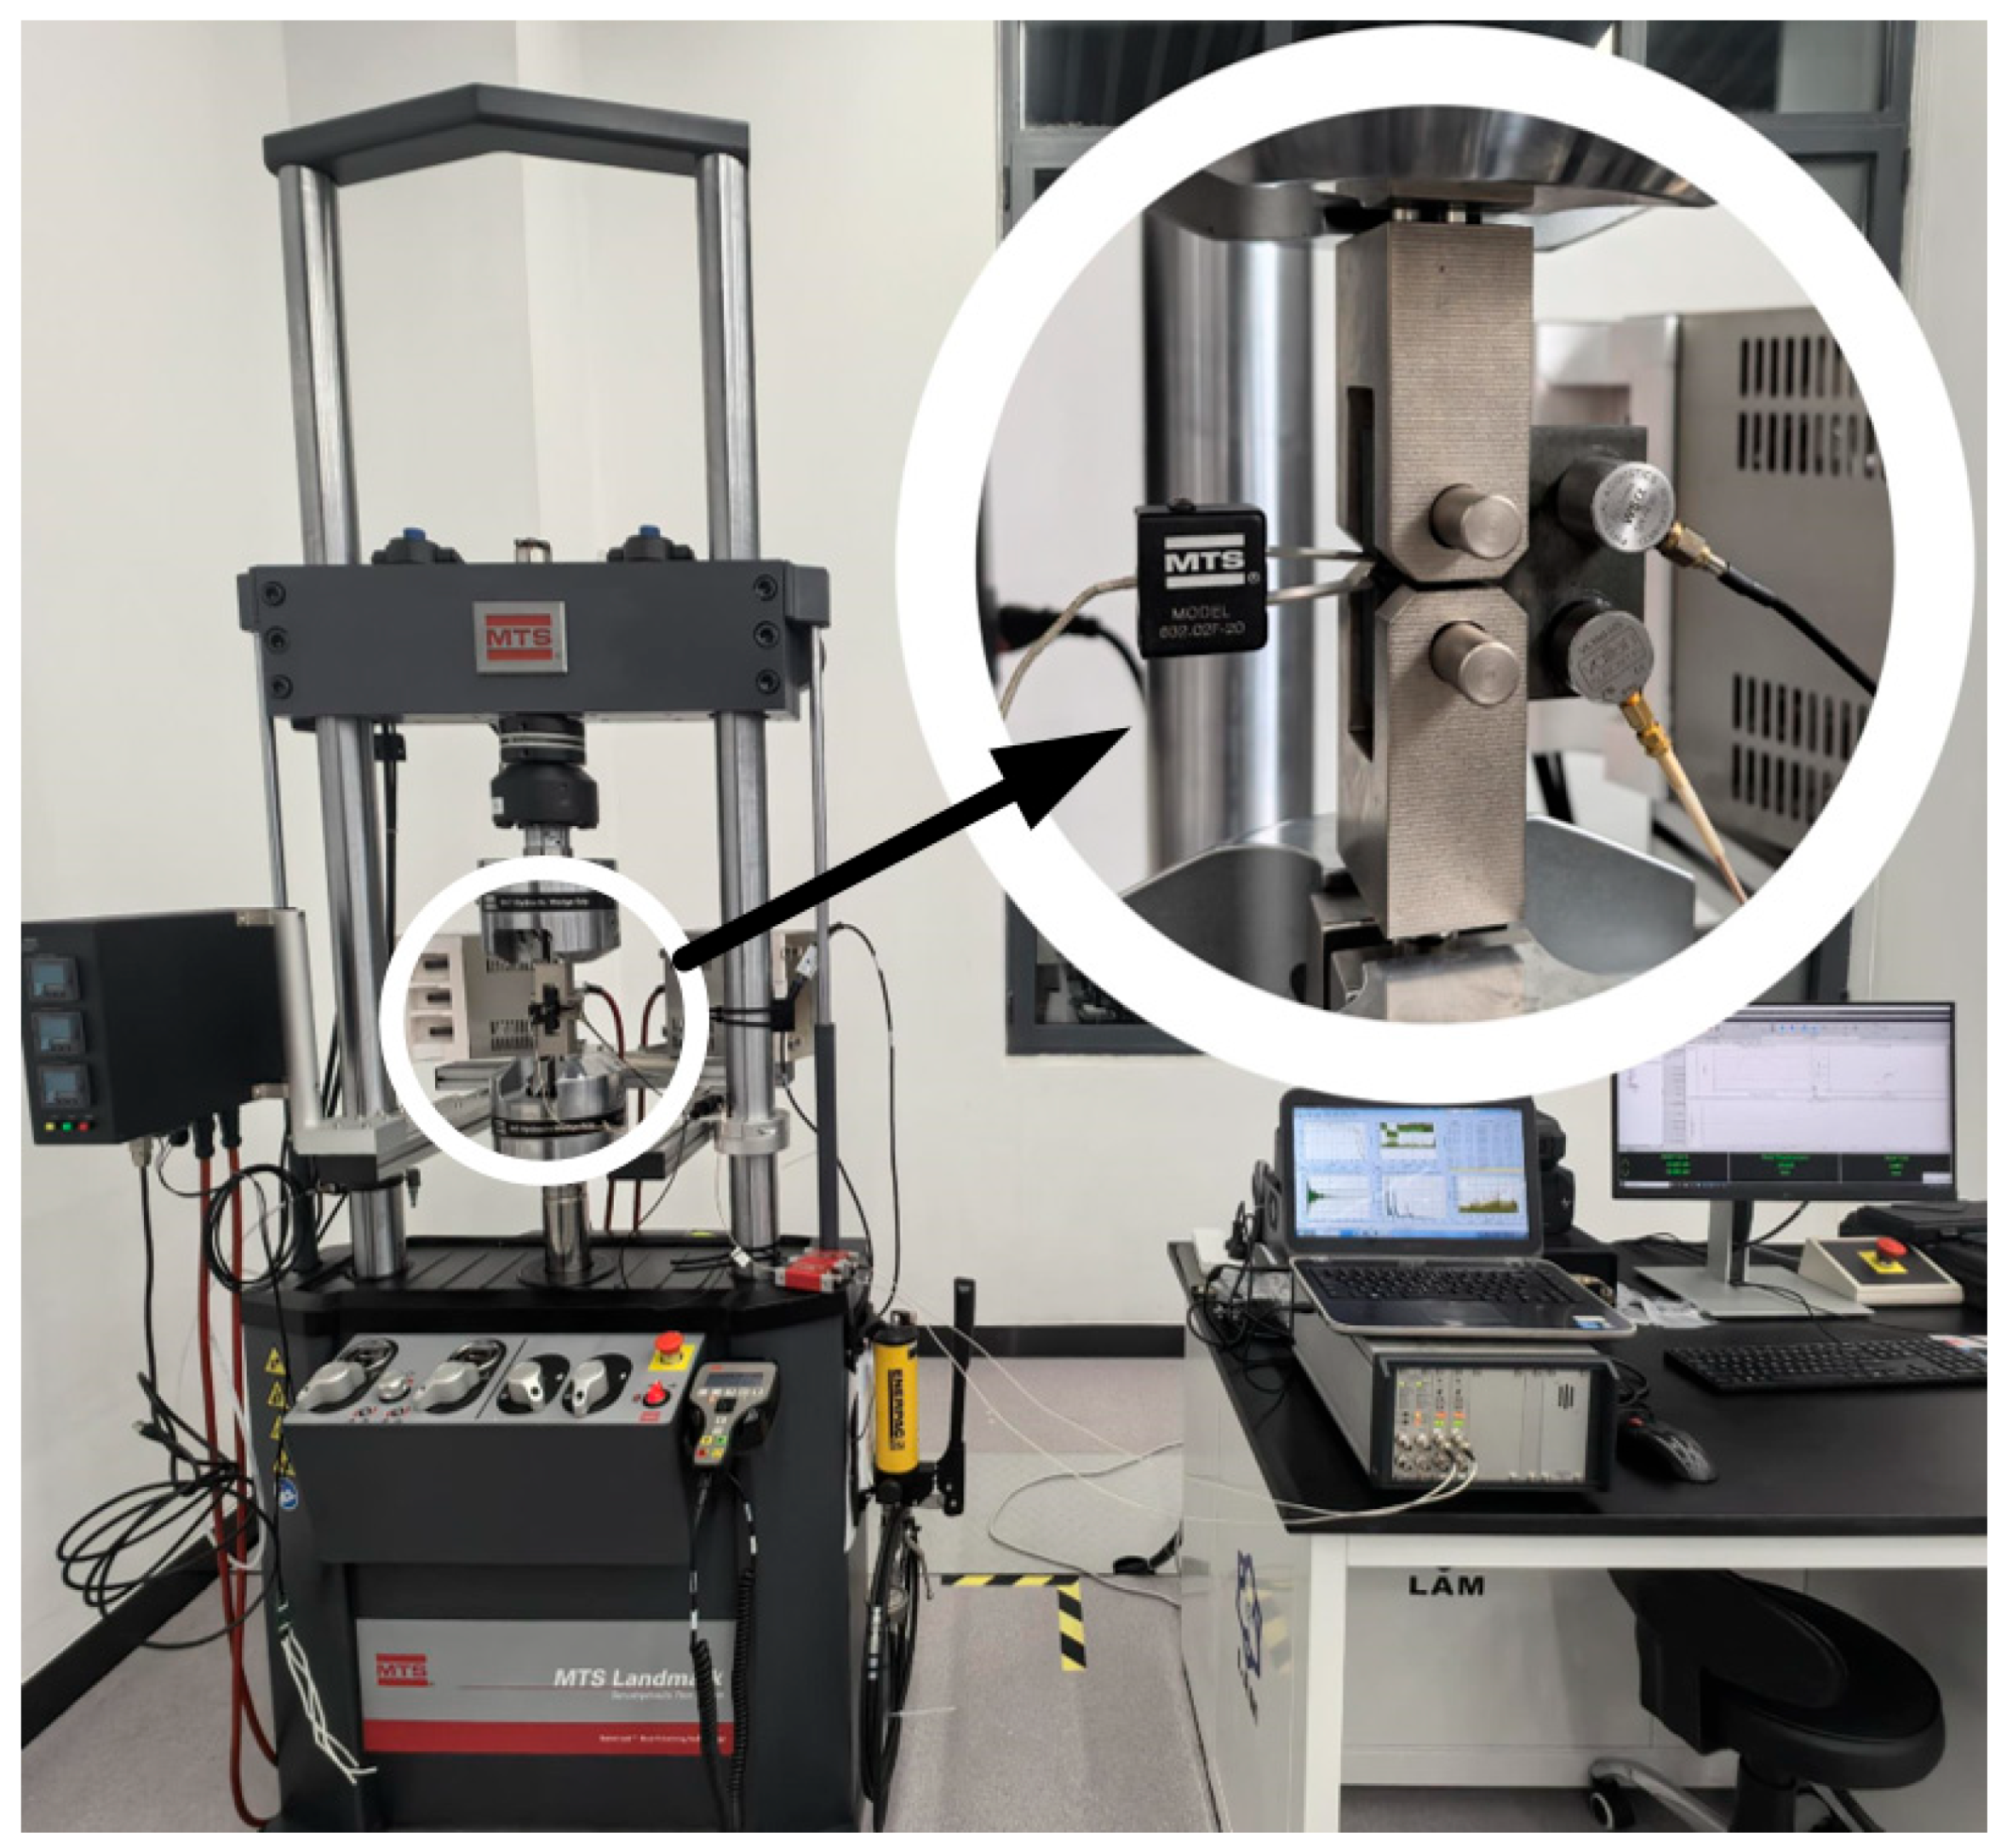
The third generation fully digital system SAMOS (PCI-8) acoustic emission detection system produced by Physical Acoustics Corporation (PAC) in Princeton Jct, NJ, USA was adopted to monitor the AE signals during the whole process of fatigue crack growth. The threshold value was 40 dB, the preamplifier gain was 40 dB, the bandwidth was 100 kHz to 400 kHz, and the sampling rate was 1 MHz. This system collects a variety of basic characteristic parameters, such as duration, rise time, amplitude, count, energy and RMS. Two AE sensors were both connected to the specimen on the same side using vaseline coupling agent at the positions shown in Figure 2 and AE signals were received through two channels connected to the two sensors respectively. The WSα wideband sensor of the American PAC Company (in channel 1) and the VS160-NS high/low temperature sensor of the German Vallen Systeme Company, Wolfratshausen, Germany (in channel 2) were adopted in the tests; the frequency ranges of the two sensors are 100–1000 kHz and 100–450 kHz respectively. Since the WSα sensor has a wider frequency range and better detection effect, the data detected by this sensor was adopted in this paper. In order to calibrate the AE sensors, the pencil-lead-break test was repeated three times between the two AE sensors. The detected AE signals were close and met the standard. The equipment described above is shown in Figure 3, and in the white circle, the positions of the specimen, the sensors and the clamping extensometer are magnified for better viewing.
Figure 3.
Test equipment.
3. Results and Discussion
3.1. Fatigue Crack Growth
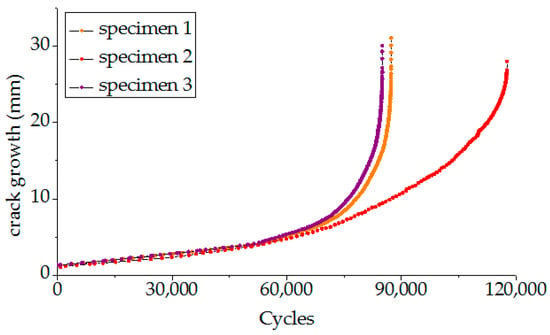
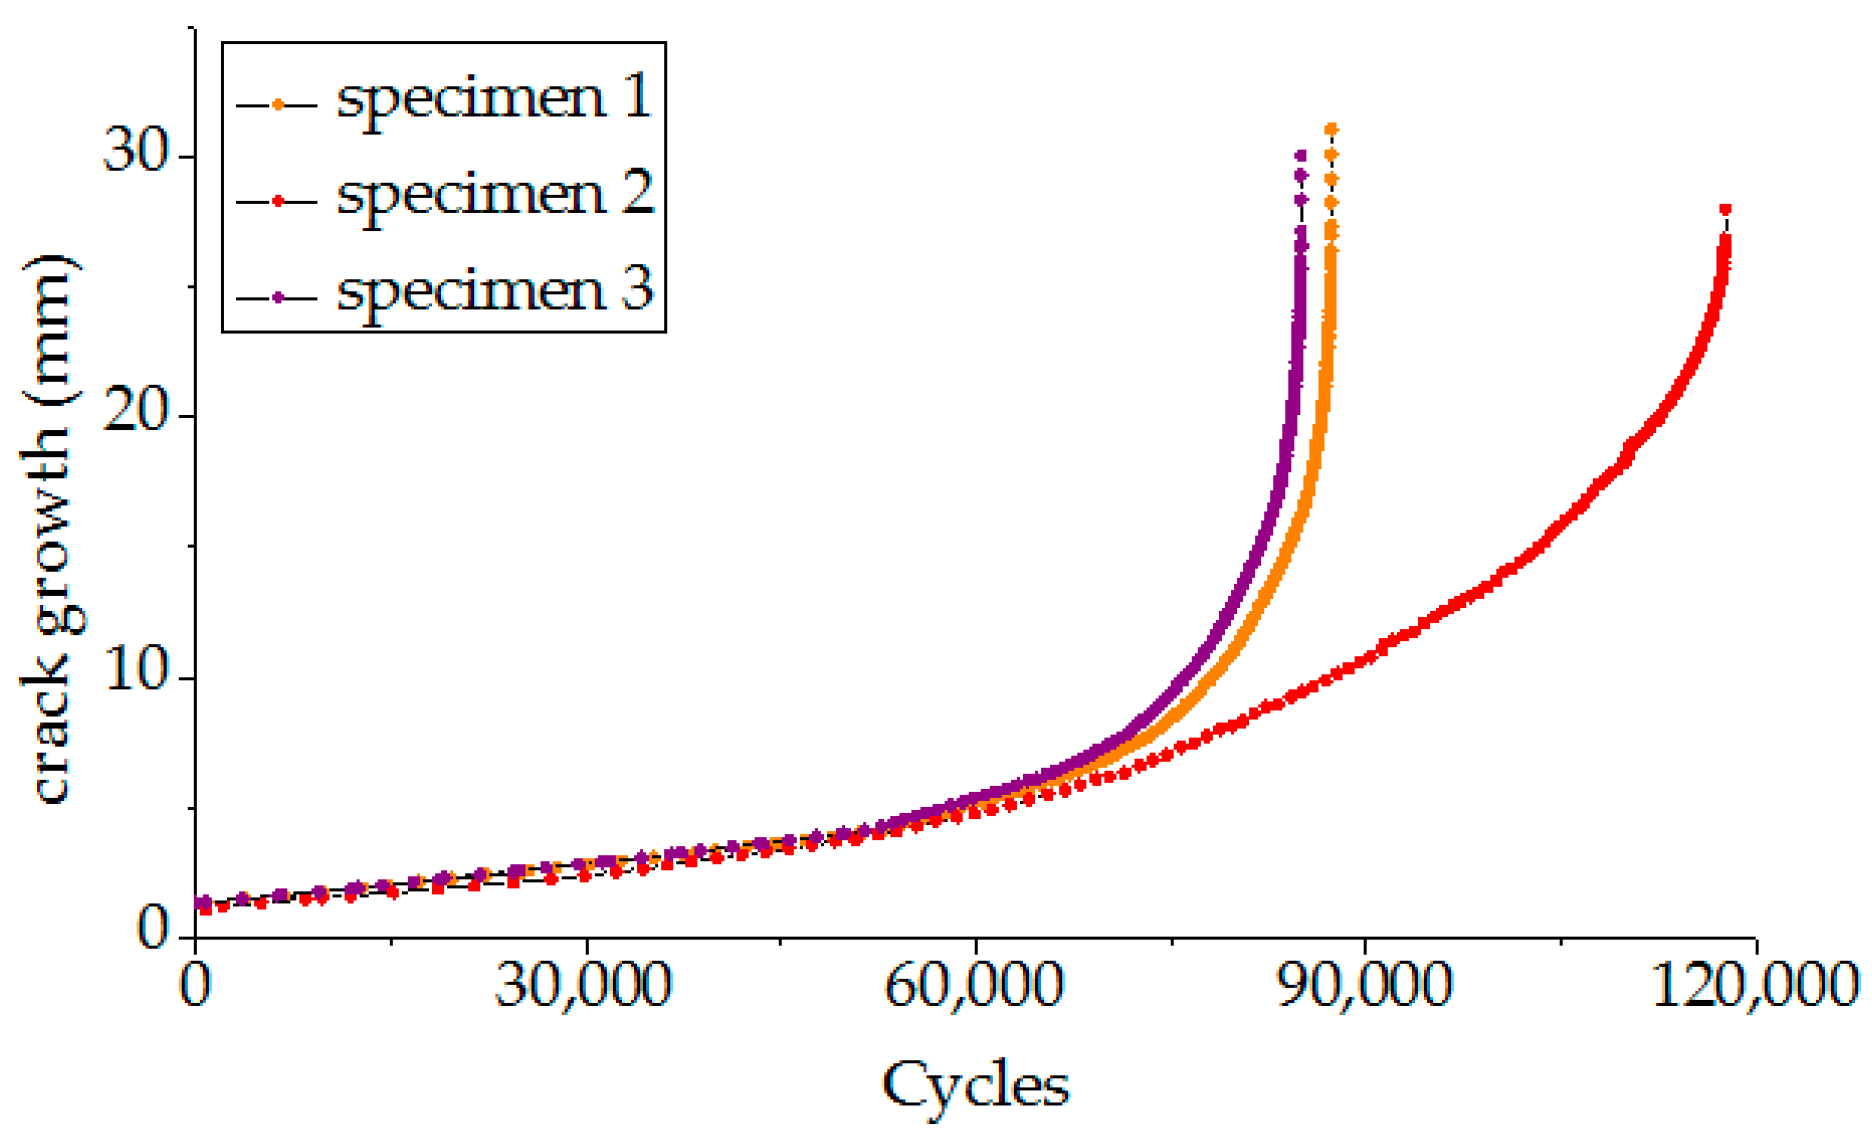
The crack growth curves of the three specimens obtained through the tests are shown in Figure 4. The crack growth process of specimen one underwent 87,318 cycles and after about 70,000 cycles, the length of crack growth accelerated, indicating that it entered a stage of rapid crack growth at this point. The crack growth process of specimen two underwent 84,996 cycles and after about 68,000 cycles, the length of crack growth accelerated, indicating that it entered a stage of rapid crack growth at this point. The crack growth process of specimen three underwent 117,637 cycles and after about 60,000 cycles, the length of crack growth accelerated, indicating that it entered a stage of rapid crack growth at this point.
Figure 4.
Fatigue crack growth curves.
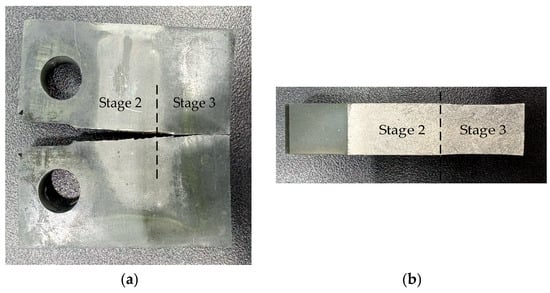
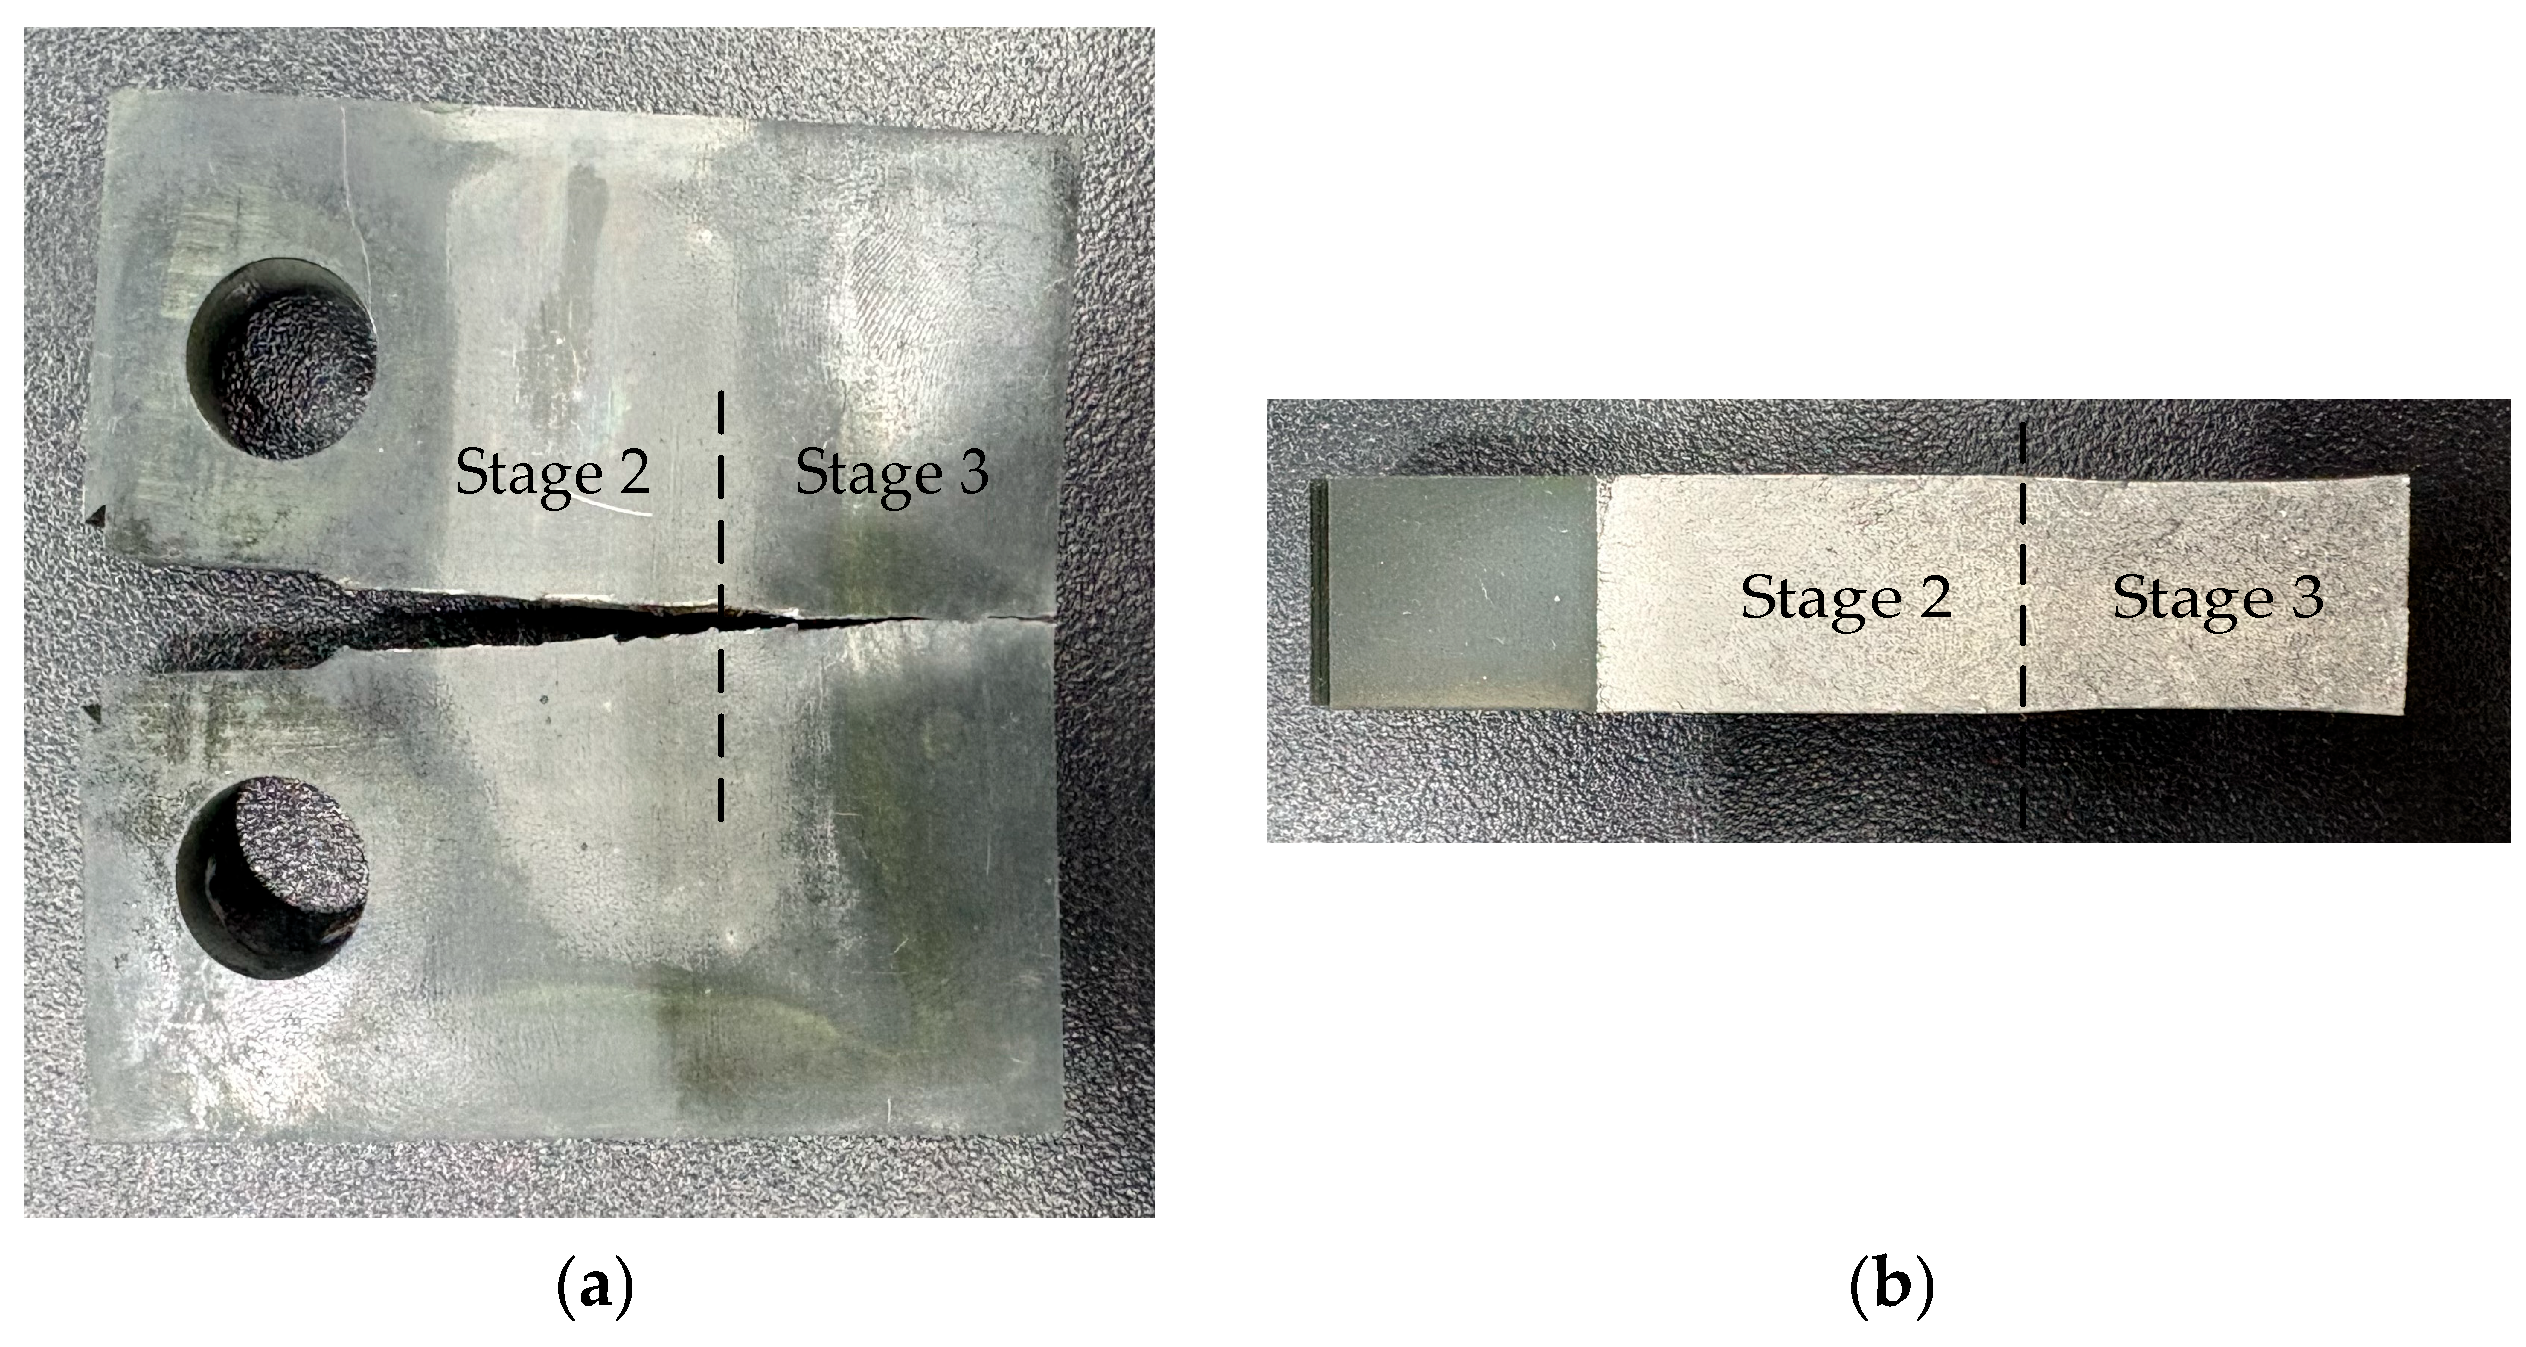
The crack growth process and fracture cross-section of the specimen are shown in Figure 5 (taking specimen two as an example). The two stages of slow crack growth and rapid crack growth can be clearly distinguished, especially from the cross-section. Specifically, as the range of the stress intensity factor increases, the deformation of the specimen also increases, thereby causing the fracture cross-section to narrow and the color to deepen.
Figure 5.
The (a) crack growth process and (b) fracture cross-section of the specimen.
According to the description of the fatigue crack growth process in fracture mechanics, the fatigue damage process can be divided into three stages: the initiation stage, the stable growth stage and the rapid growth stage. Among them, the stable growth stage is the main part and also the most studied subject, in which the crack growth rate and the stress intensity factor range show a linear relationship in the double logarithmic coordinate system. The crack growth rate is expressed as:
where and are the fatigue crack length and the number of cycles for the ith time, is the crack growth rate which is the ratio of crack length increment () and fatigue cycles increment (). According to Paris-Erdogan equation [17], the relation of to the stress intensity factor range can be described as:
where C and m are material constants. Take the logarithm of both sides of Equation (2), the result is:
The stress intensity factor range of the compact tensile (CT) standard specimen can be expressed by the following formula [57]:
where is applied load range, t and W are the thickness and width of the specimens and .
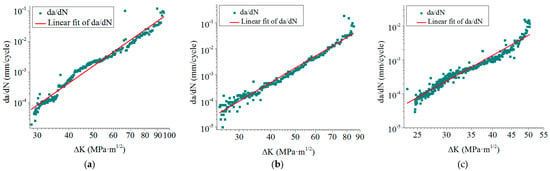
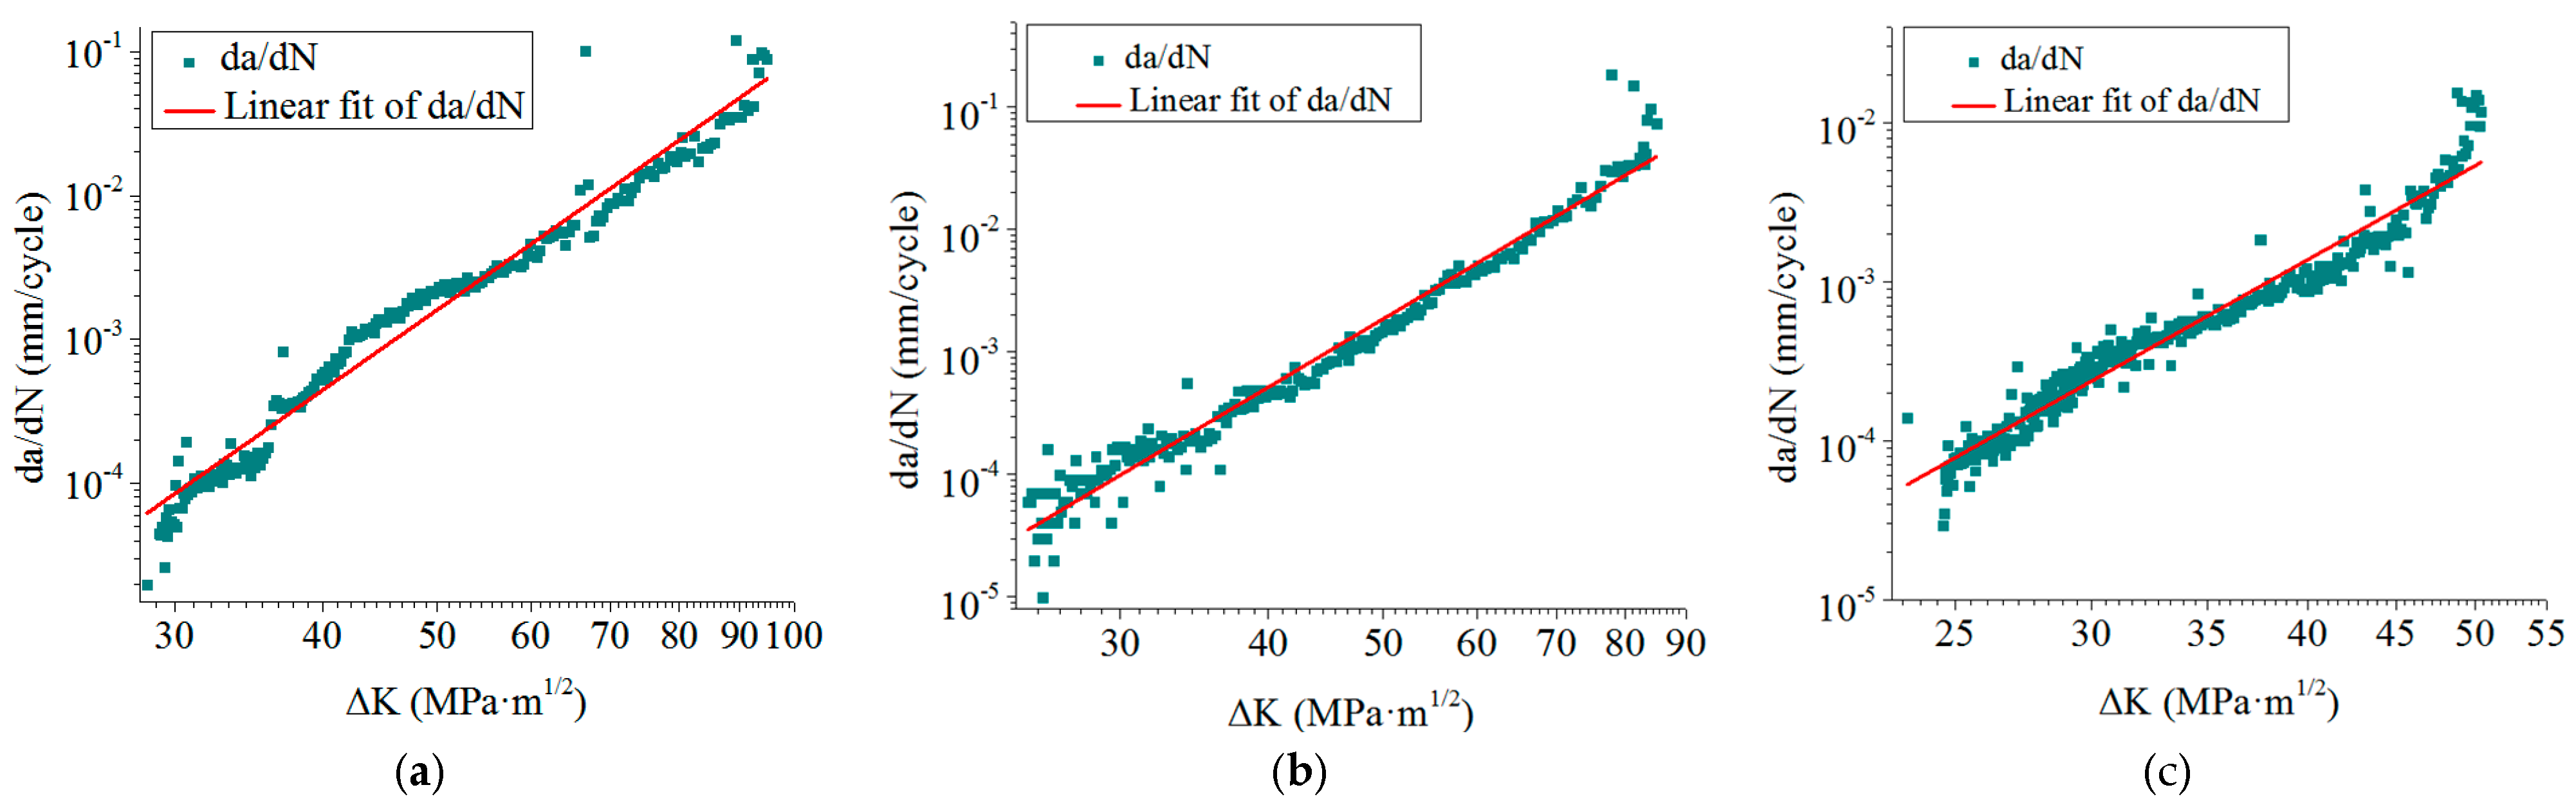
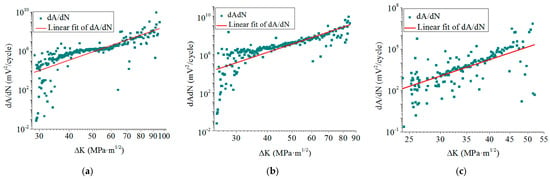
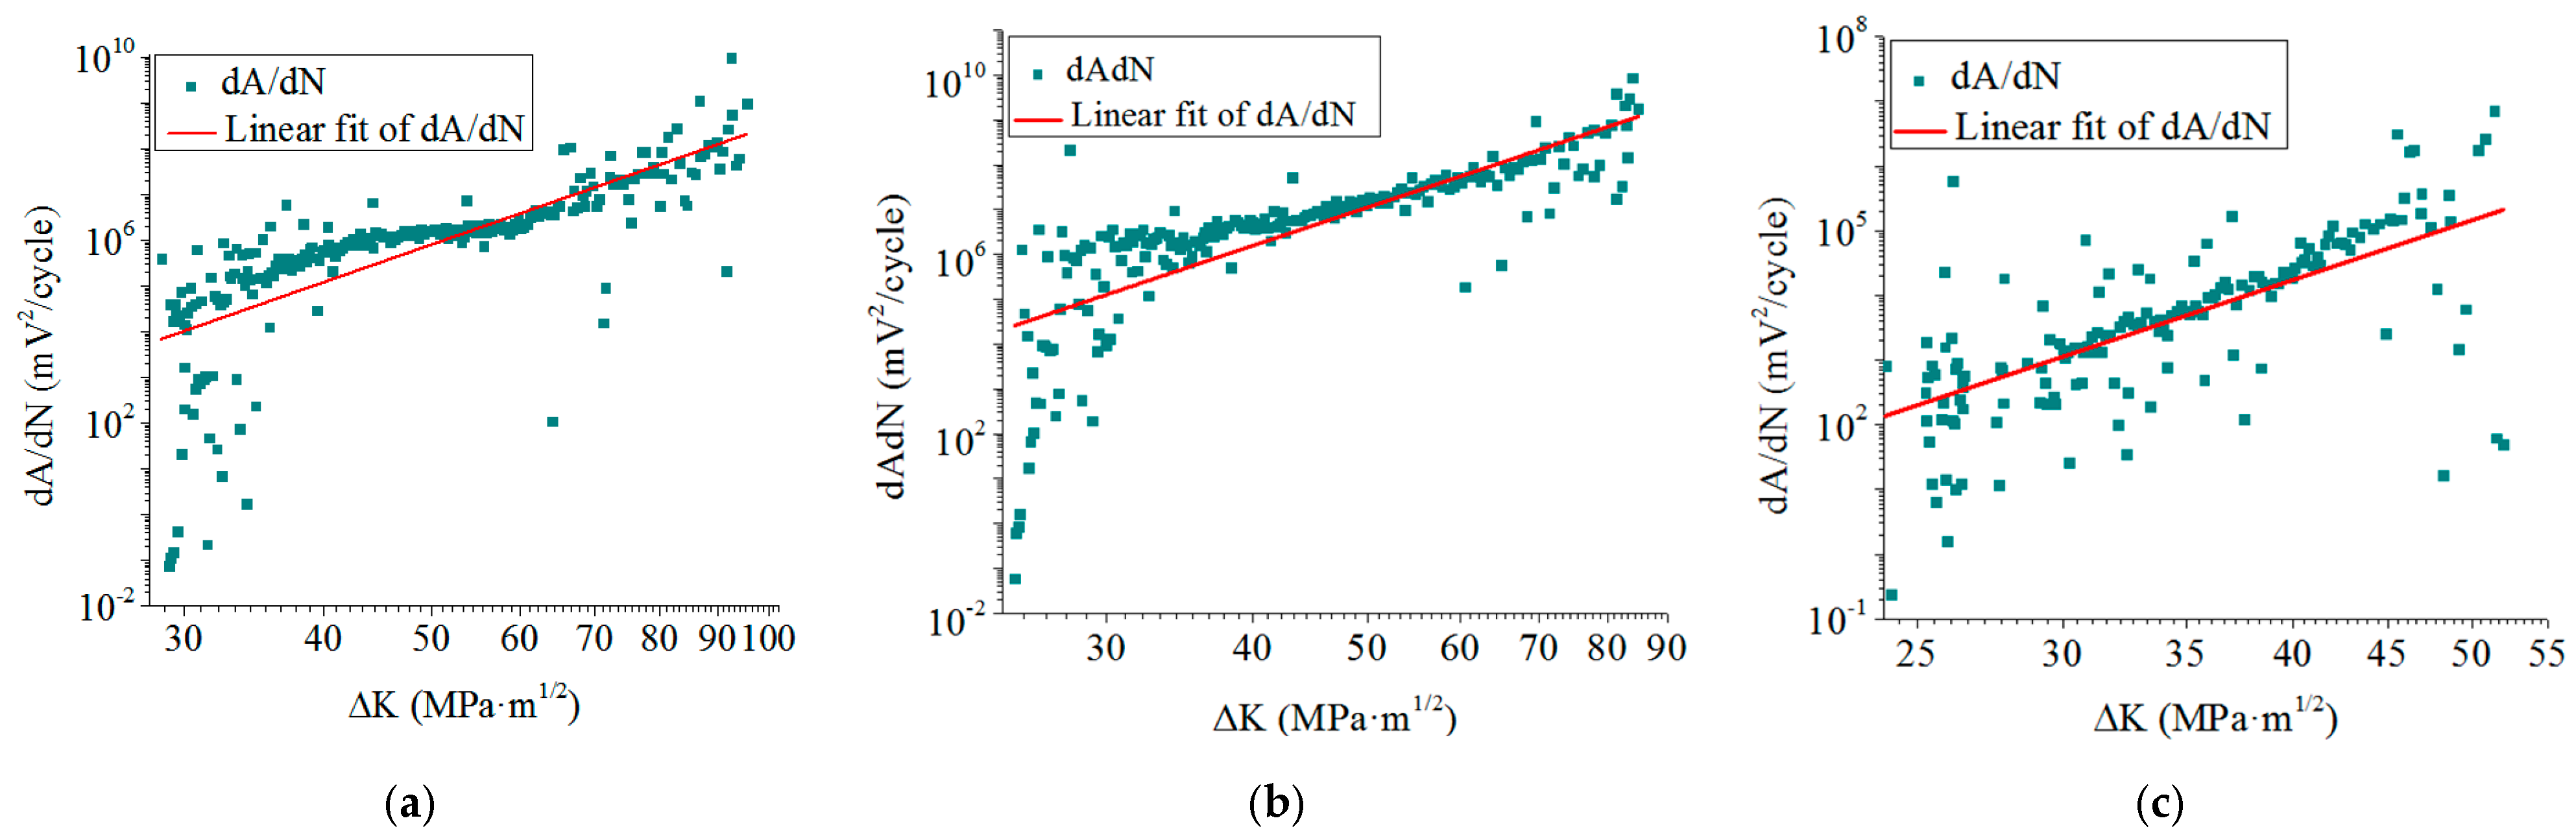
Through calculation, the relations of fatigue crack growth rate to the stress intensity factor range of the three specimens are shown in Figure 6. It can be seen that increases linearly with in each double logarithmic coordinate system, conforming to the Paris-Erdogan equation.
Figure 6.
Relations of fatigue crack growth rate to the stress intensity range for (a) specimen one, (b) specimen two and (c) specimen three.
After linear fitting, the slopes and intercepts of the fitted lines and the calculated material constants of the three specimens are shown in Table 2. represents the coefficient of determination, which is an important indicator for evaluating the goodness of fit of a straight line. The closer it is to one, the better the fitting.
Table 2.
Fitting parameters and material constants.
3.2. Fatigue Crack Growth Characterized by AE Parameters
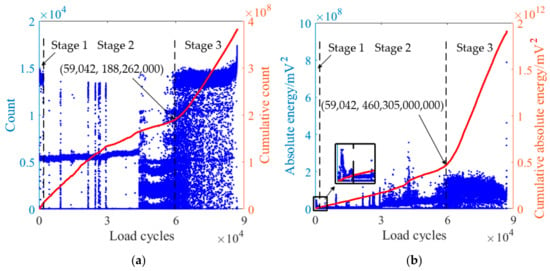
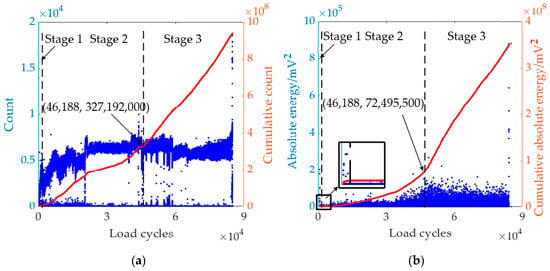
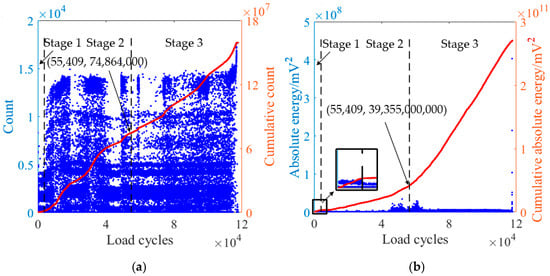
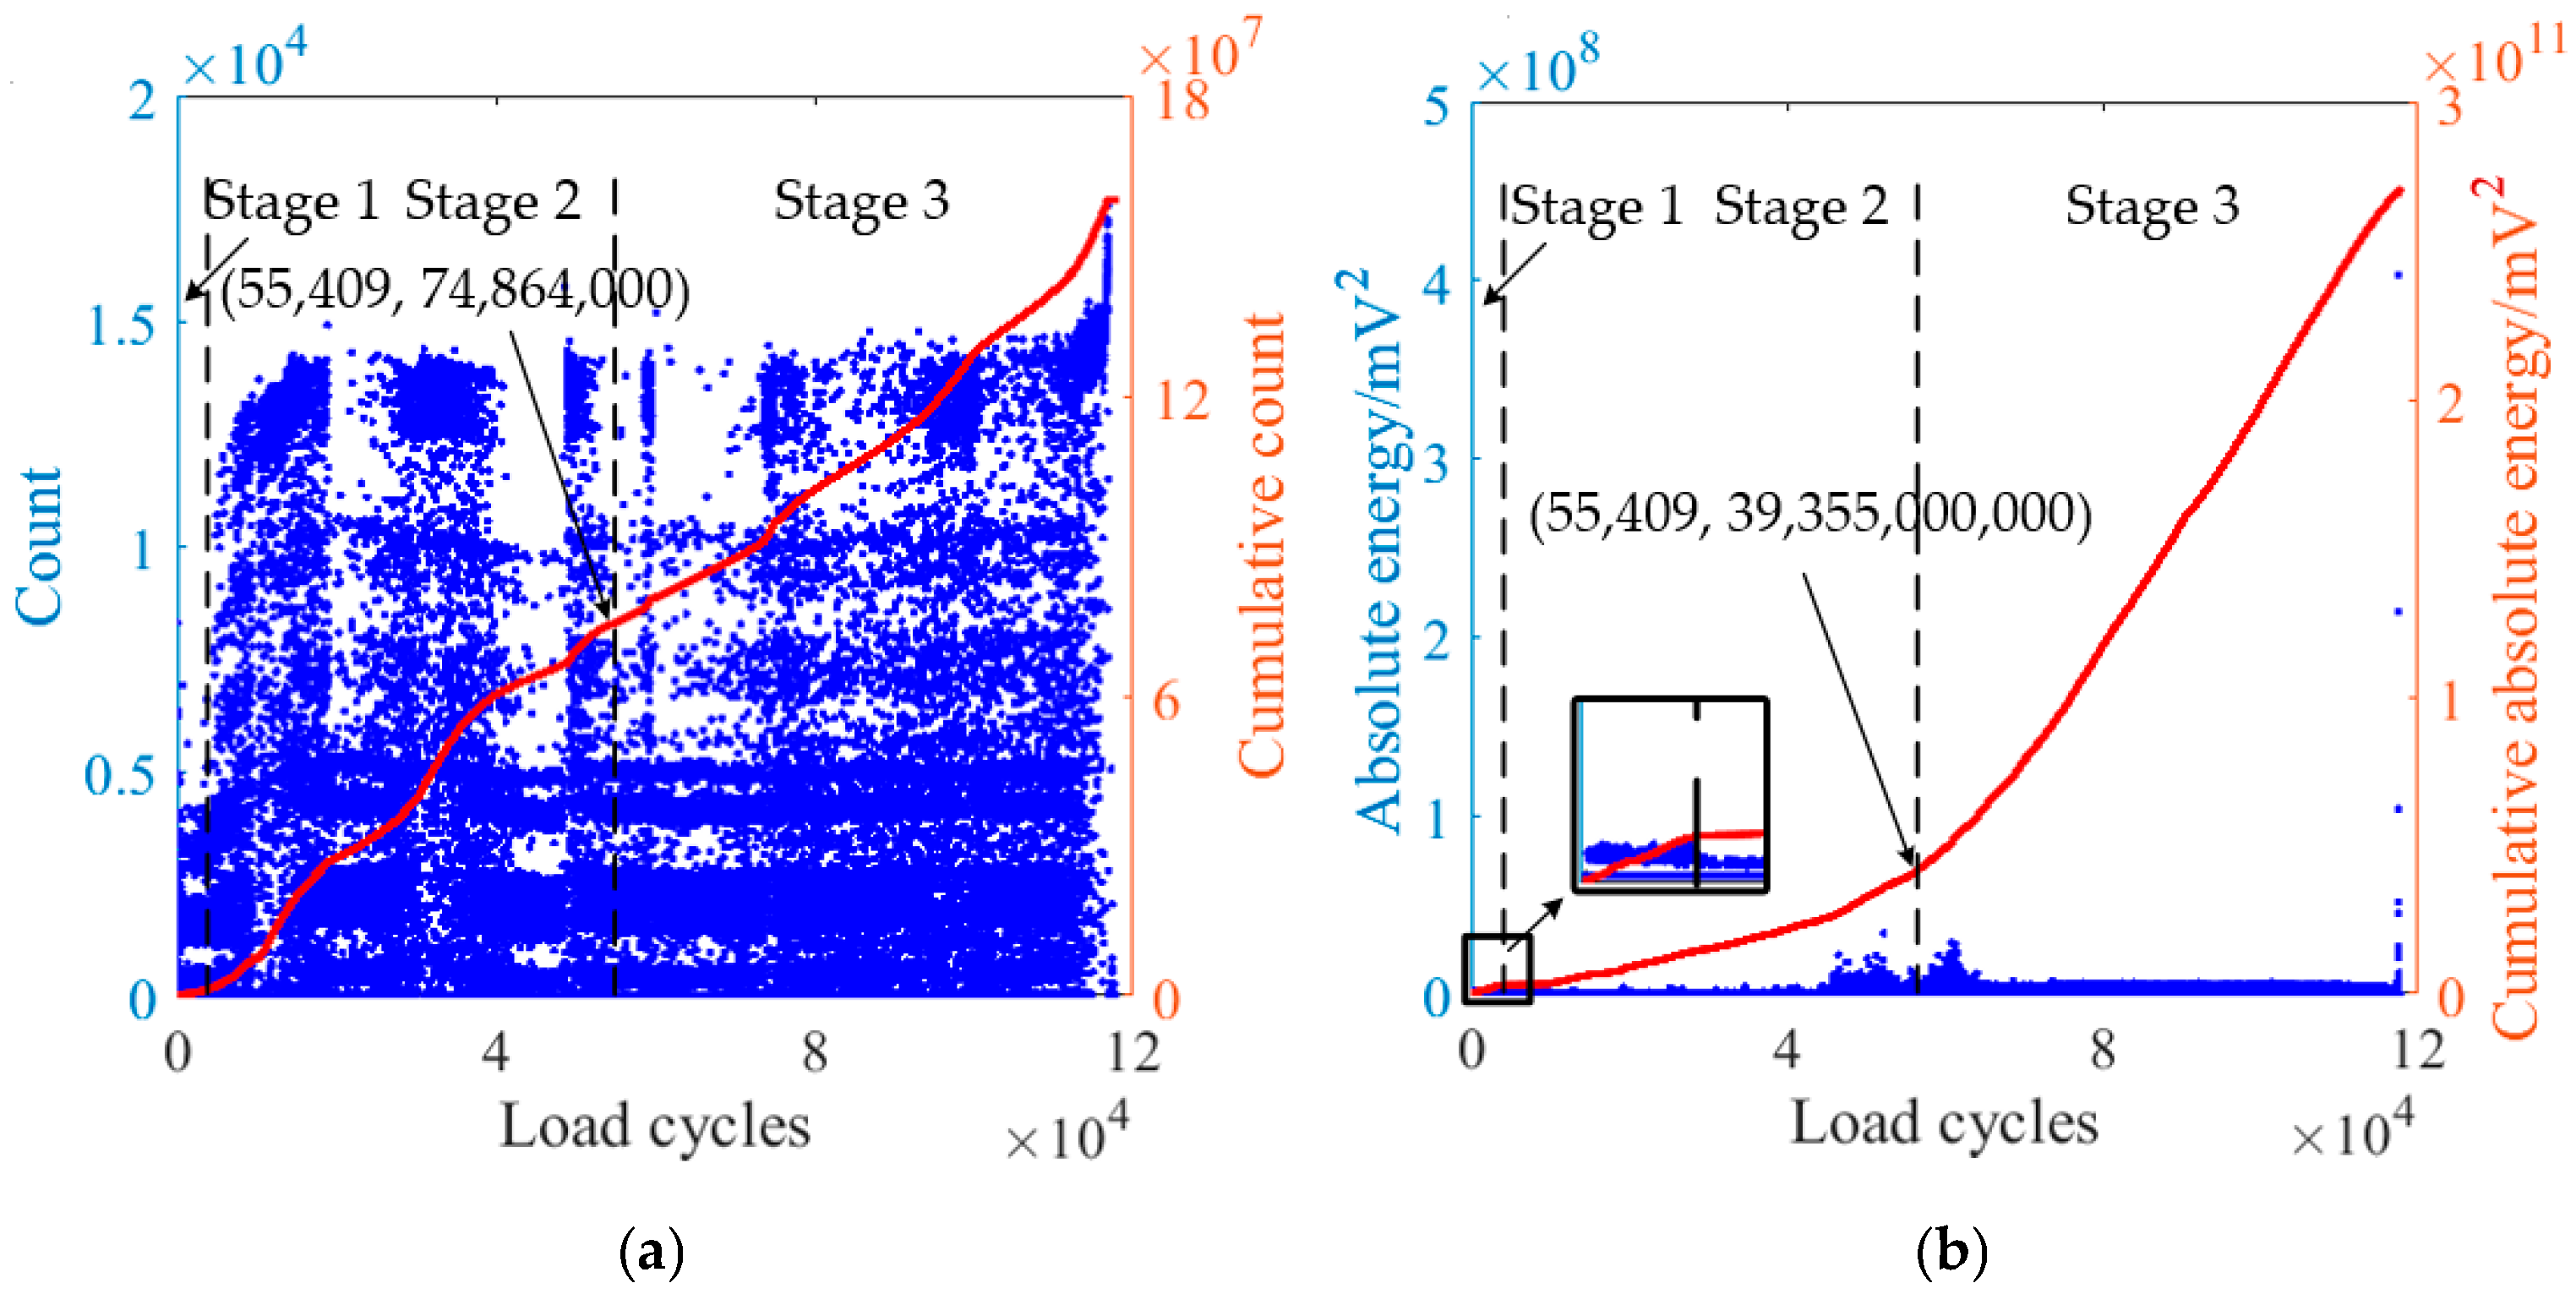
In this paper, the cumulative AE parameters were adopted to characterize the process of fatigue crack growth. As shown in Figure 7, Figure 8 and Figure 9, the cumulative AE parameters of the three specimens are presented. The overall trends basically showed three stages.
Figure 7.
(a) AE count and (b) AE absolute energy (blue dots) and the cumulative values (red lines) for specimen one.
Figure 8.
(a) AE count and (b) AE absolute energy (blue dots) and the cumulative values (red lines) for specimen two.
Figure 9.
(a) AE count and (b) AE absolute energy (blue dots) and the cumulative values (red lines) for specimen three.
The AE source in the first stage is the initiation of microcracks. At this stage, the material is continuously subjected to external loads, forming surface or internal defects (in the test, we pre-fabricated crack as material defect). The stress concentration at the defects causes local stress to exceed the tensile strength of the material, and in a short period of time, leads a large number of microcracks to emerge and extend along the maximum shear stress surface (45°) and the slip zone. Correspondingly, a large number of AE signals were produced along with this process, causing the cumulative AE parameters to show a significant upward trend in a short period of time. The AE sources in the second stage are the collective dislocation slip of the plastic zone at the crack tip and the nucleation and growth of micropores. At this stage, under the continuous stress, the crack will concentrate and stably grow in a single direction perpendicular to the load direction (90°). Correspondingly, the activity of the AE signal decreases and tends to stabilize, resulting in a slower growth speed of the cumulative AE parameters, which basically shows a linear growth trend. The AE source in the third stage is the ductile shear between the micropores and the crack. At this stage, due to the concentration of stress, the load-bearing capacity of the material at the crack tip drops sharply, causing the crack to grow at an accelerated speed and eventually leading to material fracture. Correspondingly, the activity of the AE signal significantly increases, and the growth speed of the cumulative AE parameters rises again until it eventually breaks. The three stages of the cumulative AE parameters have a strong corresponding relation with the crack initiation stage, stable growth stage and rapid growth stage of fatigue crack growth respectively. Overall, the cumulative AE parameters correspond to the fracture mechanism, which provides a theoretical basis for characterizing the crack growth process with AE parameters.
Figure 7 shows the recorded AE count, AE absolute energy and their cumulative values for specimen one at load frequencies of 15 Hz. Compared with AE count, AE absolute energy has better correspondence with the three stages of fatigue crack growth, and the cumulative values in the second stages are more linear. The turning point between the second and third stages can be clearly distinguished from the cumulative AE absolute energy at the 59,042nd cycle. In contrast, for AE count that sensitive to the threshold, though it shows three stages of fatigue crack growth i, the linear performance in the second stage was poor.
The above conclusions also exist in the test results of specimen two in Figure 8. The turning point between the second and third stages can be clearly distinguished from the cumulative AE absolute energy at the 46,188th cycle.
However, for specimen three in Figure 9, under a higher loading frequency of 25 Hz, the three stages of fatigue crack growth can be distinguished from the cumulative absolute energy, and the linearity of the second stage is relatively ideal. However, compared with specimen one and specimen two, the performance of the cumulative AE count value of specimen three is poor, making it difficult to distinguish the crack growth stages.
From the above analysis, it can be concluded that, affected by the threshold, AE absolute energy can more stably and accurately characterize the fatigue crack growth process compared with AE count. As a result, the further research is only conducted on AE absolute energy.
3.3. AE Parameter and Fatigue Crack Growth Rate
Since the cumulative AE absolute energy characterizes the fatigue crack growth process as well, the relation between its change rate and the stress intensity factor range can also be expressed by a formula similar to the Paris-Erdogan [36] equation as follows:
where is AE absolute energy rate, B and n are material constants. Take the logarithm of both sides of Equation (5) is:
In the double logarithmic coordinate system, the relations between AE absolute energy rate and the stress intensity factor range of the three specimens are shown in Figure 10. Compared with the fatigue crack growth rate, AE absolute energy rate is more dispersed and has a poorer linear relation with the stress intensity factor range, the possible reasons of which are as follows: there exist subjective human influencing factors during the process of fatigue crack growth, such as the selection of sensor model, position and coupling method, as well as unavoidable objective interference, such as environmental noise. In addition, since the AE parameters are recorded in real-time with the energy released as the crack grows, the recording interval density does not fully correspond to the stress intensity factor range. That is, in most cases, one stress intensity factor range corresponds to a certain cycle, but at the same time, there is more than one AE parameter recorded. If only one of the AE parameters corresponding to a certain cycle is selected for accumulation, the rich information contained in AE absolute energy [59] would be wasted. Not only would the cumulative AE parameters lack representativeness in characterizing the real crack growth process, but the accuracy of the change rate would also be reduced, thus performing poorly in the relationship with the stress intensity factor range in the double logarithmic coordinate system.
Figure 10.
Relations of AE absolute energy rate to the stress intensity range for (a) specimen one, (b) specimen one and (c) specimen one.
After linear fitting, the slopes and intercepts of the fitted lines and the calculated AE constants of the three specimens are shown in Table 3.
Table 3.
Fitting parameters and AE constants.
AE absolute energy rate is essentially the change rate of the cumulative AE absolute energy. In order to overcome the problems of large dispersion and weak similarity in previous methods, in view of the rich information contained in AE absolute energy, this paper attempts to take K-entropy (one of chaotic parameters) as new representative of the change in AE absolute energy to better characterize the fatigue crack growth process.
4. Enhanced Characterization of Fatigue Crack Growth Process by Introducing K-Entropy
4.1. Calculation of K-Entropy
Aiming at the problems of large dispersion of the AE absolute energy rate in the double logarithmic coordinate and low similarity to the crack growth rate, this paper introduced chaotic theory and used one of the chaotic parameters, K-entropy, to characterize the change of AE parameter in order to obtain more accurate results. The signals generated during the process of metal fatigue damage are usually nonlinear, random and dissipative. The traditional linear theoretical analysis methods cannot well reveal the process of metal fatigue damage. Huang et al. analyzed AE signals using K-entropy and found that there was a chaotic phenomenon in AE signals during the metal fatigue damage process, and the changes in chaotic characteristics had a strong correlation with the fatigue damage process [60]. That is to say, the K-entropy of AE signals reveals the dynamic characteristics of the metal fatigue damage process better and can be used as a characteristic quantity to characterize the degree of metal fatigue damage. In this paper, K-entropy is calculated by using the maximum likelihood estimation method proposed by Schouten [61]. Suppose the time required for the initial adjacent points on a pair of different trajectory to separate from a sufficiently small distance to a distance greater than the restricted separation distance is exponentially distributed, that is
where k is K-entropy (unit: nats/s), b is the number of evolution steps when the distance between the initial adjacent points exceeds for the first time. When applied to AE parameters, the calculation process is as follows:
- Suppose AE parameter is a time series {} with length L;
- Select appropriate embedding dimension d and delay time τ to reconstruct the phase space, obtaining a D-dimensional phase space with D phase points;
- When a pair of phase points in the aforementioned D-dimensional phase space
- 4.
- The probability of finding a distance greater than after the evolution of b steps is
- 5.
- Find T pairs of points that meet the requirements in the D-dimensional phase space and calculate the corresponding b value for each pair of points as sample, then the probability of the sample depends on k, which is expressed as
- 6.
- Apply maximum likelihood estimation to k using Equation (10), the maximum likelihood estimation value of K-entropy of the AE parameter can be obtained as
- 7.
- The determination of the embedding dimension d and the delay time τ depends on the selection of the distance scale . Based on the method adopted by Daw et al. [62], this paper takes the average absolute deviation of the time series as , that is
The dynamic type of a system can be distinguished by the value of k: a system with k = 0 shows regular motion, a system with k > 0 shows chaotic motion, and a system with k = ∞ shows random motion. The larger the k value of the system is, the greater the corresponding information loss rate and the higher the degree of chaos, that is, the greater the system changes.
4.2. K-Entropy of AE Absolute Energy
The K-entropy values are calculated by using the maximum likelihood estimation method introduced in Section 4.1. The relevant calculation parameters of K-entropy are determined as follows.
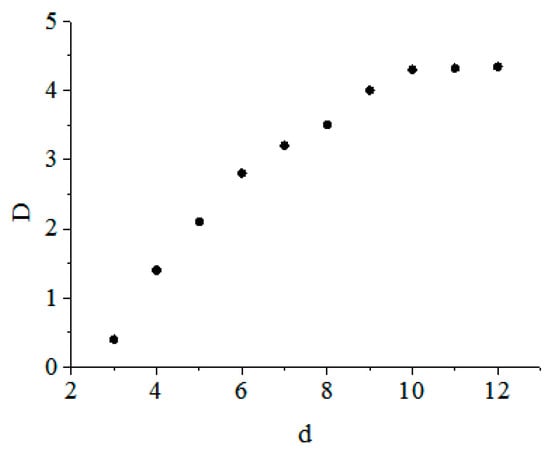
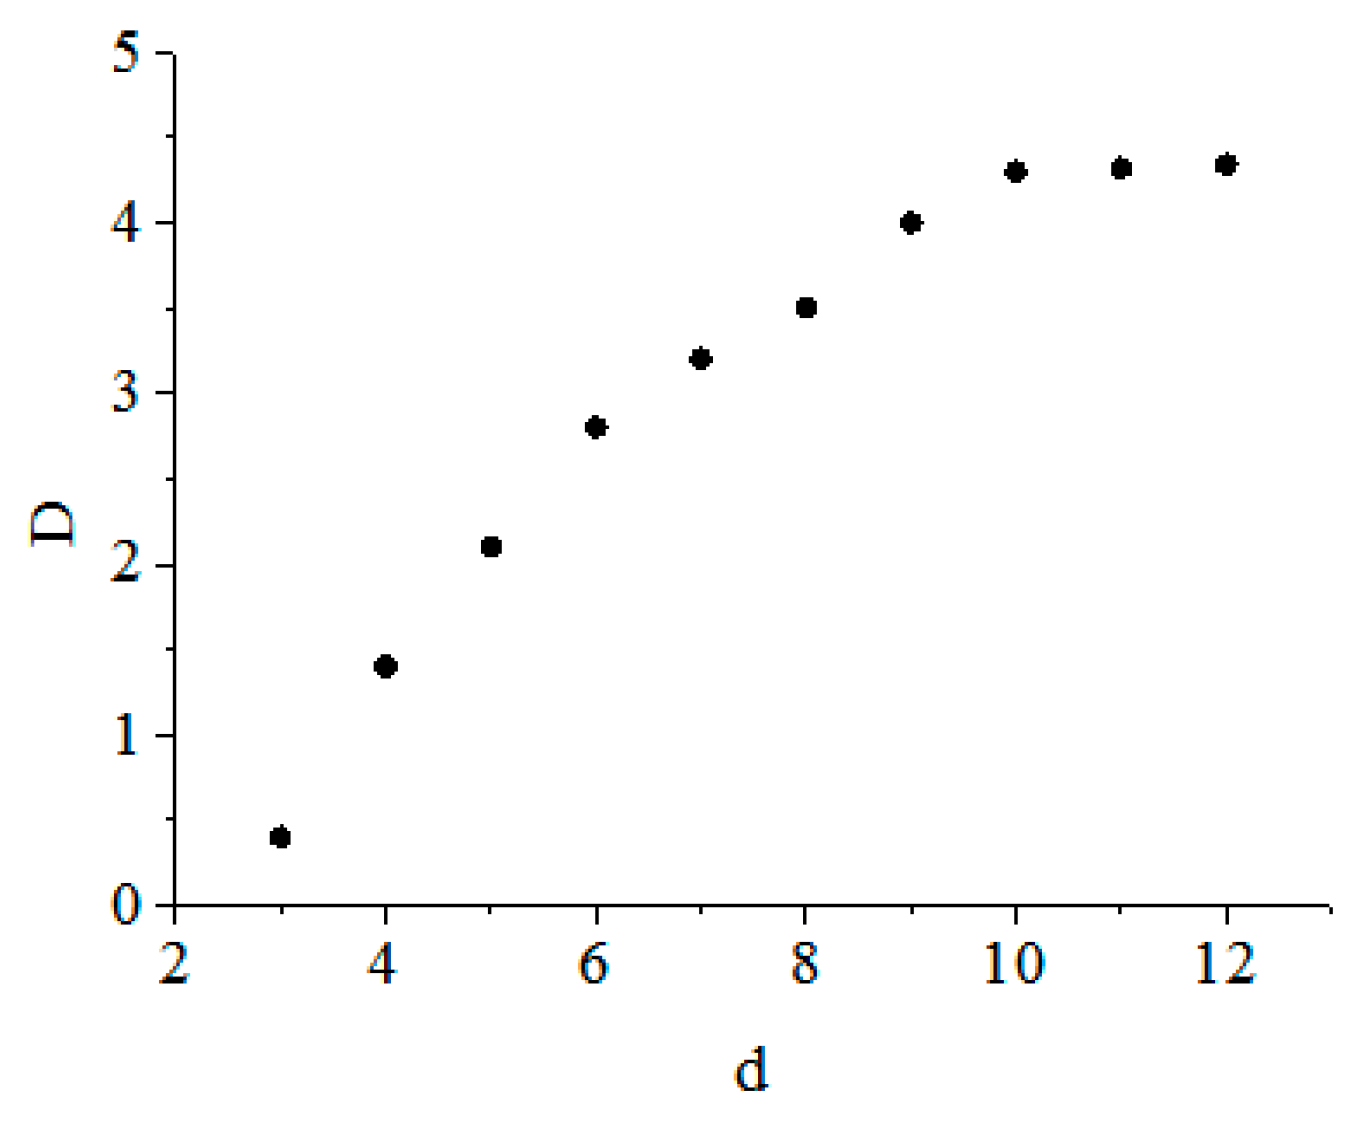
- According to the embedding theorem proved by Takens, d ≥ 2D + 1 (where D is the dimension of the chaotic signal). However, the dimension of chaotic signals is generally difficult to determine. Therefore, in practical applications, the trial-and-error method is commonly chosen to determine the embedding dimension d. Generally, d is increased successively starting from three. As d increases, the slopes of the scale-free regions in each curve become closer and closer, approaching saturation. This saturation value is correlation dimension D, and at this time, d is a reasonable embedding dimension. As a result, the embedding dimension d is determined to be 10. The convergence analysis graph used to determine the embedding dimension d is shown in Figure 11.Figure 11. Convergence analysis graph used to determine the embedding dimension d.
- 2.
- The autocorrelation function method is used to calculate the delay time. When choosing the delay time τ, the autocorrelation function C can be used as a specific threshold. In this paper, the delay time τ is selected when C is 0 for the first time. After approximate calculation, the value of τ is taken as eight.
- 3.
- Based on experience, the restricted separation distances for the three specimens were selected as 650,000, 600,000 and 50,000 according to the scales of their data.
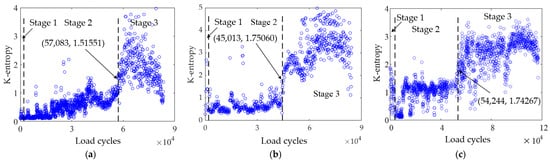
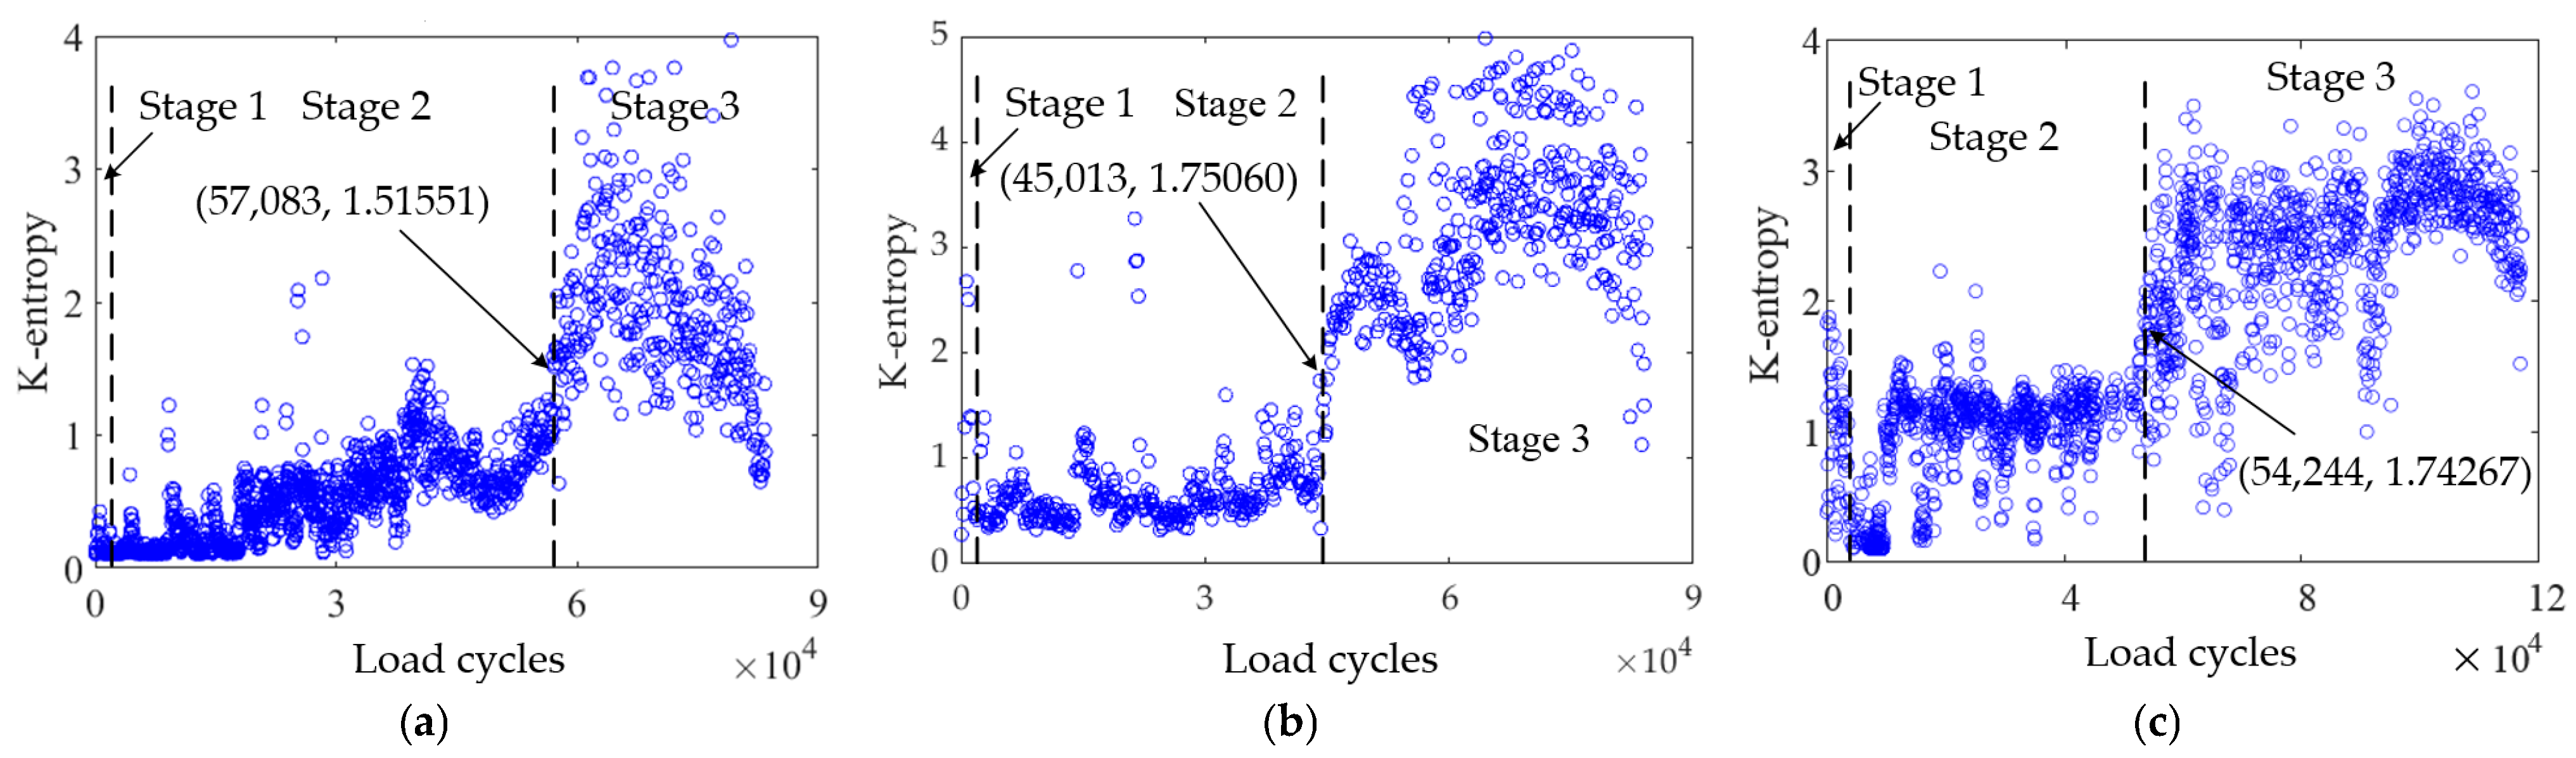
Using the parameters determined above, for the AE absolute energy values collected in the tests, a K-entropy value is calculated every 100 cycles. The obtained calculation results are shown in Figure 12. It can be seen that all values of K-entropy are greater than 0, means that the AE absolute energy recorded during the fatigue damage process have chaotic characteristics and can be represented by K-entropy.
Figure 12.
K-entropy of AE absolute energy for (a) specimen one, (b) specimen two and (c) specimen three.
By comparing Figure 12 with Figure 7, Figure 8 and Figure 9b, it is concluded that the characteristics of K-entropy in characterizing the fatigue crack growth process are as follows:
- K-entropy has a good correspondence with the three stages of fracture mechanics and its trend is consistent with the activity level of AE parameter corresponding to the mechanical mechanism;
- K-entropy represents the degree of change itself, and its characterization of fatigue crack growth process is already very obvious. As a result, there is no need for further accumulation processing to enhance the visual change at different load frequencies;
- In the fatigue crack growth process characterized by K-entropy, the turning points of the second stage and the third stage are earlier than those of the AE parameters, the reason of which is that the chaotic parameters are more sensitive to system changes and less affected by noise. Therefore, in the real-time monitoring of fatigue crack growth, K-entropy of the AE parameter can provide an early warning for changes in the fatigue stages.
When the fatigue crack growth process is characterized by K-entropy, the relation between its change rate and the stress intensity factor range can be expressed as
where is K-entropy of AE absolute energy, P and q are chaotic constants. Take the logarithm of both sides of Equation (15) is
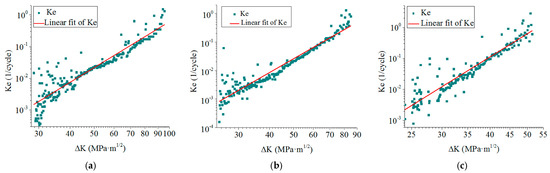
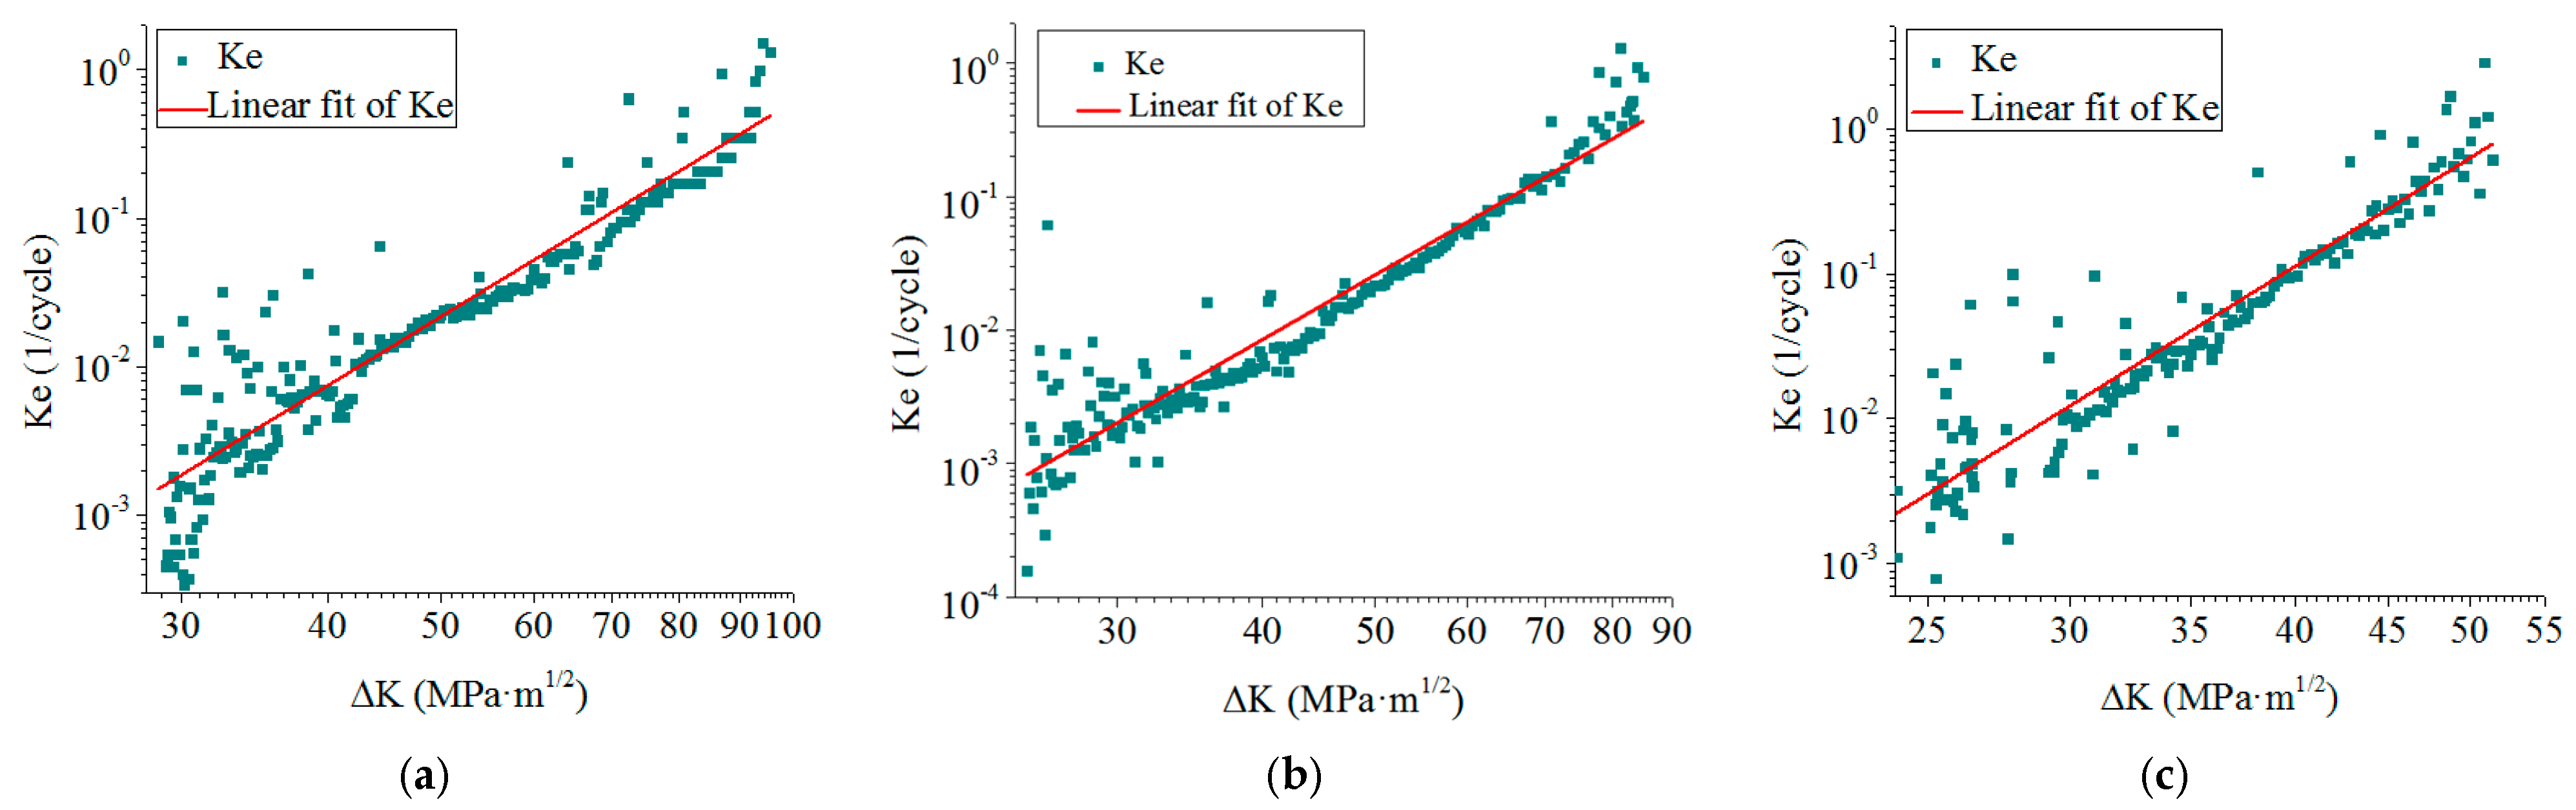
The relations of K-entropy to the stress intensity factor range in double logarithmic coordinate system of the three specimens are shown in Figure 13.
Figure 13.
Relations of K-entropy rate to the stress intensity range for (a) specimen one, (b) specimen two and (c) specimen three.
After linear fitting, the slopes and intercepts of the fitted lines and the calculated chaotic constants of the three specimens are shown in Table 4.
Table 4.
Fitting parameters and chaotic constants.
It can be seen that compared with AE absolute energy rate, the dispersion of K-entropy rate is significantly weakened, and its similarity to fatigue crack growth rate is enhanced. Some analyses can be conducted to prove the above conclusions.
4.3. Analysis of Fatigue Crack Growth Characterized by K-Entropy
4.3.1. Dispersion Analysis
The goodness of fitting R2 value is used as the evaluation coefficient for dispersion and is summarized in Table 5. The smaller its value is, the greater the dispersion. It can be concluded that in the relation with the stress intensity factor range ΔK, the R2 values of the K-entropy of AE absolute energy Ke are closer to that of the fatigue crack growth rate da/dN than that of the AE absolute energy rate dAdN, indicating that the dispersion degree of K-entropy has decreased, and its characterization of the fatigue crack growth process is more accurate.
Table 5.
Dispersion of the relations of , and to the stress intensity factor range .
4.3.2. Similarity Analysis
Substituting Equations (6) and (16) into Equation (3), the relation of and to respectively can be obtained as follows:
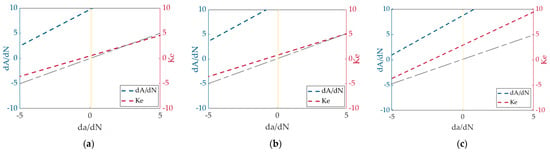
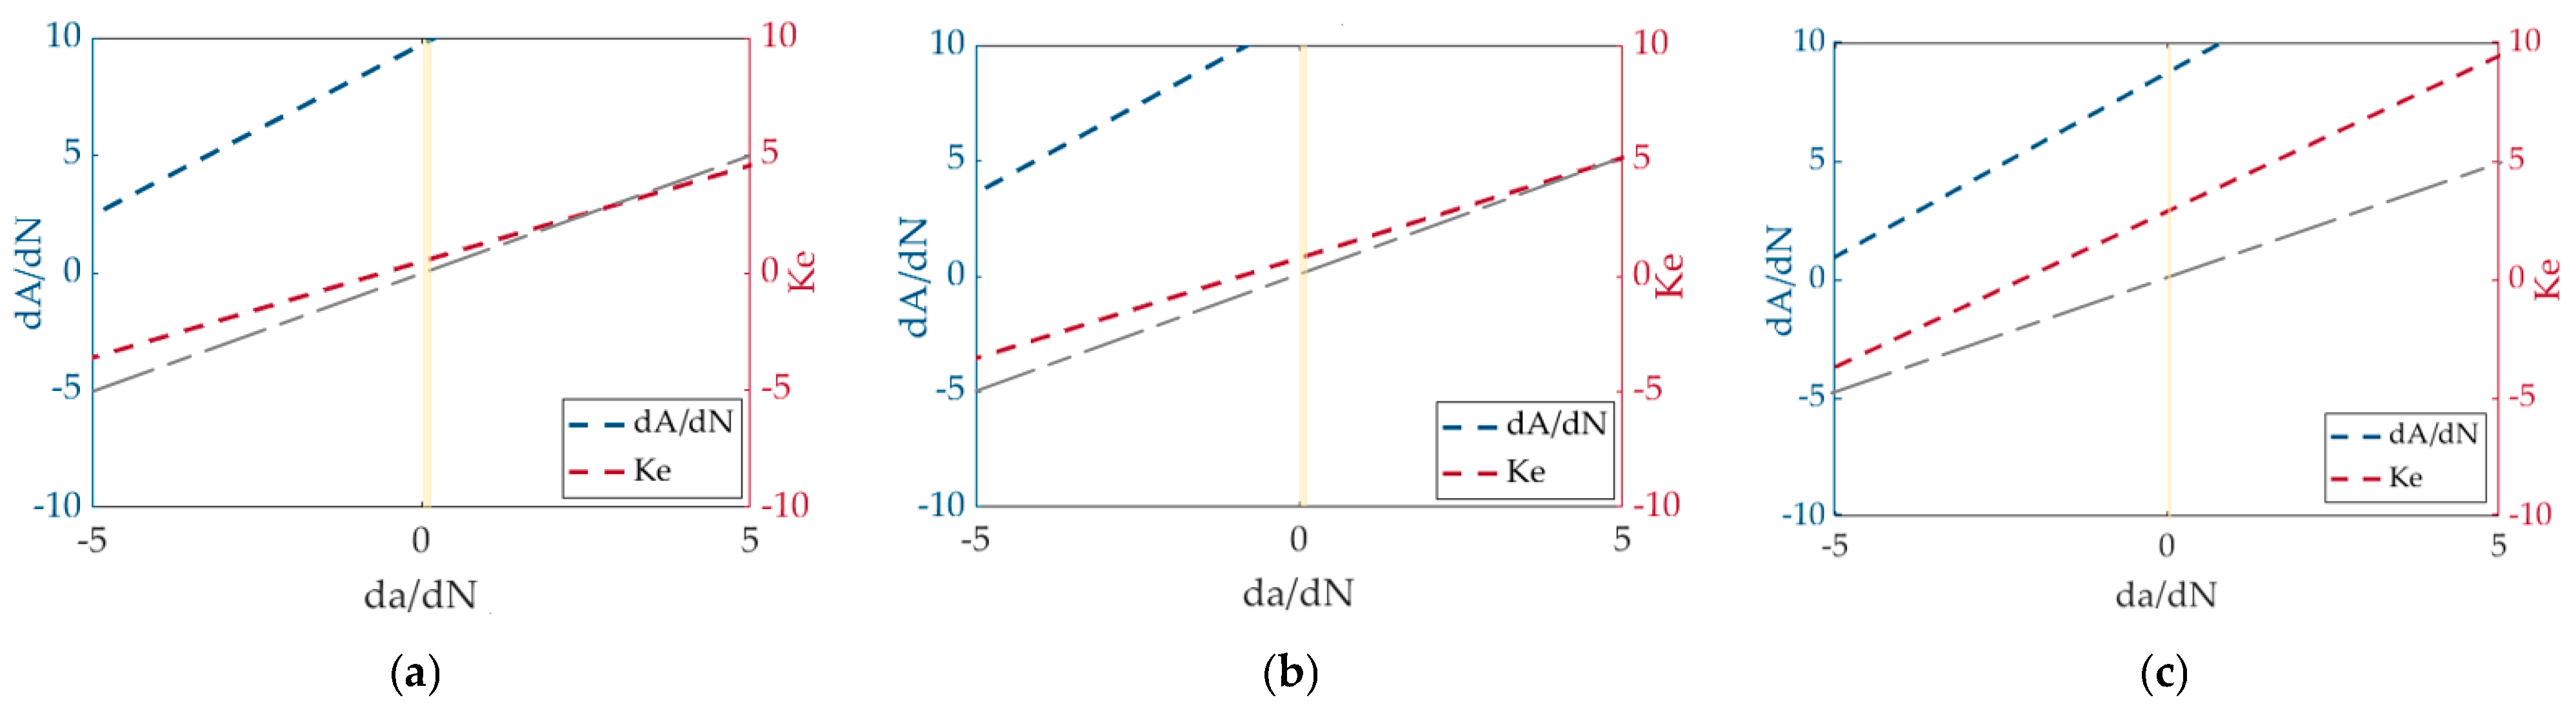
The relations above are shown in Figure 14, in which the gray dashdotted lines represent , the red dashed lines represent , the blue dashed lines represent and the yellow regions are the ranges of corresponded with the stress intensity factor range . As can be seen from Figure 14, the K-entropy rates of the three specimens corresponding to different load frequencies are both closer to fatigue crack growth rate, indicating that they have stronger similarities, and K-entropy is more accurate in characterizing the fatigue crack growth process.
Figure 14.
Relations of and to for (a) specimen one, (b) specimen two and (c) specimen three.
4.3.3. Early Warning Capability Analysis
To verify the early warning capability of the proposed method, the trends of actual crack length, the cumulative AE parameter and the K-entropy values were compared. The numbers of cycles corresponding to the boundary points between the second stage and the third stage of the crack growth process are recorded in Table 6.
Table 6.
The numbers of cycles corresponding to the boundary points.
As can be seen from Table 6, due to the sensitivity of AE to internal changes in materials, the boundary points in its cumulative trend are earlier than those in the growth trend of crack length. However, because K-entropy is sensitive to the rich dynamic information contained in AE parameters, the boundary points are even earlier. Relative to the boundary point in the trend of crack length, the advance rates are summarized in Table 7.
Table 7.
The advance rates relative to the boundary points in the trends of crack length (%).
From the above statistical results, it can be concluded that both AE parameters and K-entropy have certain real-time early warning capabilities when characterizing the fatigue crack growth process. Especially the K-entropy, compared with the AE parameters, the boundary points between the second stage and the third stage of the fatigue crack growth process have been further advanced. The increase in the advance rate corresponding to the three specimens are 2.24%, 1.38% and 0.99% respectively.
5. Conclusions
The AE parameters recorded in real-time with the process of fatigue crack growth present three stages in time series, corresponding respectively to the crack initiation stage, stable growth stage and rapid growth stage of fatigue crack growth under the definition of linear elastic fracture mechanics. By comparing the results of AE detection, it can be concluded that the cumulative AE absolute energy, due to its less influence by the threshold and rich internal information, can better characterize the fatigue crack growth process at different load frequencies; thus it is qualified to replace the commonly used cumulative AE count.
Since AE technology is more sensitive to internal changes in materials, when fatigue progresses to the unstable growth state, the turning point from the second stage to the third stage is earlier than that defined by linear elastic fracture mechanics, which not only has characterizing significance but also warning significance.
To address the issues of large dispersion and poor similarity in relation between AE absolute energy rate and the stress intensity factor range in the second stage, K-entropy was introduced to represent the change in AE absolute energy. Under different load frequencies, the method was analyzed and the results show that:
- K-entropy can well characterize the fatigue crack growth process, clearly corresponding to the three stages of elasticity fracture mechanics. Moreover, due to its sensitivity to the dynamic information contained in AE parameters, the boundary points between the second stage and the third stage are further advanced, providing effective early warnings for fatigue crack entering rapid growth stage or even about to fracture.
- The relations between K-entropy rate and AE absolute energy rate with the stress intensity factor range were analyzed by calculating the goodness of fitting R2 value. The results show that the dispersion of K-entropy rate is lower than that of the AE absolute energy rate in the double logarithmic coordinate system.
- The relations between K-entropy and AE absolute energy rate with crack growth rate were analyzed by establishing equations with fatigue crack growth rate respectively; the comparison results show that the similarity between K-entropy and the crack growth process is higher.
Therefore, K-entropy cannot only well characterize the fatigue crack growth process, but also provide early warnings for its main change, offering ideas for the prediction of fatigue crack growth. In the future, it is worthy to attempt to study the influence of different loading frequencies on the performance of crack growth characterization.
Author Contributions
Conceptualization, T.J. and Y.Y.; Methodology, T.J. and Y.Y.; Software, T.J. and Q.L.; Validation, T.J. and Q.L.; Formal analysis, T.J., Y.Y. and Q.L.; Investigation, T.J., Y.Y. and Q.L.; Resources, T.J. and Y.Y.; Data curation, T.J., Y.Y. and Q.L.; Writing—original draft, T.J.; Writing—review & editing, T.J., Y.Y. and Q.L.; Visualization, T.J. and Q.L.; Supervision, Y.Y.; Project administration, Y.Y.; Funding acquisition, Y.Y. All authors have read and agreed to the published version of the manuscript.
Funding
This research received no external funding.
Data Availability Statement
The data presented in this study are available on request from the corresponding author because the data are not publicly available due to privacy restrictions.
Conflicts of Interest
The authors declare no conflict of interest.
References
- Pei, H.Q.; Wang, S.S.; Lu, L.Z.; He, X.H.; Wen, Z.X.; Wang, D.L.; Yue, Z.F. Deformation failure mechanism and damage characterization of hot corrosion on fatigue of Ni-based superalloy. Int. J. Fatigue 2026, 205, 109402. [Google Scholar] [CrossRef] [Scilit]
- Zhang, X.; Liu, X.; Deng, C.; Gong, B.; Li, X.; Liu, Y. Fatigue life prediction of additively manufactured nickel-based superalloy by integrating crystal plasticity and Tanaka-Mura model. Int. J. Fatigue 2026, 204, 109364. [Google Scholar] [CrossRef] [Scilit]
- Wang, J.; Wu, W.; Xu, X.; Wen, Z.; Yue, Z. Effect of thickness on fatigue crack initiation of nickel-based single crystal superalloy micro notched specimens at 850 °C. Eng. Fract. Mech. 2025, 320, 111054. [Google Scholar] [CrossRef] [Scilit]
- Zhong, M.; Yu, H.; Wang, Z.; Xue, H.; Zhang, F.; Wang, G.; Zhang, X.; Qu, J. Effect of solution temperature on low-cycle fatigue behavior and microstructural evolution of GH4738 Ni-based superalloy. Intermetallics 2025, 186, 108970. [Google Scholar] [CrossRef] [Scilit]
- Deng, J.L.; Tu, W.L.; Xiong, K.; Yang, P.; Dong, Q. Analysis of biaxial proportional low-cycle fatigue and biaxial accumulative plasticity of hull inclined-crack plate. Int. J. Nav. Archit. Ocean Eng. 2022, 14, 100423. [Google Scholar] [CrossRef] [Scilit]
- Lavenstein, S.; El-Awady, J.A. Micro-scale fatigue mechanisms in metals: Insights gained from small-scale experiments and discrete dislocation dynamics simulations. Curr. Opin. Solid State Mater. Sci. 2019, 23, 100765. [Google Scholar] [CrossRef] [Scilit]
- Sangid, M.D. The physics of fatigue crack propagation. Int. J. Fatigue 2025, 197, 108928. [Google Scholar] [CrossRef] [Scilit]
- Li, Y.M.; Tan, H.B.; Tan, Z.H.; Wang, X.G.; Li, H.; Zhou, Y.Z.; Sun, X.F. Deep insights into damage mechanisms and fatigue life prediction models for a Ni-based single crystal superalloy at different temperatures. Eng. Fail. Anal. 2026, 184, 110330. [Google Scholar] [CrossRef] [Scilit]
- Hu, Z.; Ding, K.; Zhou, J.; Wu, G. Early fatigue damage evolution and crack recognition in low-cycle metal fatigue testing based on acoustic emission monitoring. Int. J. Fatigue 2025, 201, 109182. [Google Scholar] [CrossRef] [Scilit]
- Akramin, M.R.M.; Husnain, M.N.M.; Hasif, M.; Shaari, M.S.; Takahashi, A. Analysis and Prediction of Surface Crack Growth Under Fatigue Loading. J. Phys. Conf. Ser. 2025, 2933, 012008. [Google Scholar] [CrossRef] [Scilit]
- Alshoaibi, A.M.; Fageehi, Y.A. A Comparative Analysis of 3D Software for Modeling Fatigue Crack Growth: A Review. Appl. Sci. 2024, 14, 1848. [Google Scholar] [CrossRef] [Scilit]
- Perez, N. Linear-elastic Fracture Mechanics. In Fracture Mechanics; Springer: Cham, Switzerland, 2017; pp. 79–130. [Google Scholar]
- Klyatis, L.M. Developments in studying real world conditions for accurate simulation and successful accelerated testing. In Trends in Development of Accelerated Testing for Automotive and Aerospace Engineering; Academic Press: Cambridge, MA, USA, 2020; pp. 85–120. [Google Scholar]
- Saxena, A. Fatigue Crack Growth. In Basic Fracture Mechanics and Its Applications; CRC Press: Boca Raton, FL, USA, 2022; pp. 123–172. [Google Scholar]
- Jones, R. Fatigue crack growth and damage tolerance. Fatigue Fract. Eng. Mater. Struct. 2014, 37, 463–483. [Google Scholar] [CrossRef] [Scilit]
- Zheng, F.; Chen, J.; Yuan, S.; Xu, S.; Qiu, L. Guided wave-MUSIC based damage monitoring method for complex composite structures. Int. J. Mech. Sci. 2024, 277, 109450. [Google Scholar] [CrossRef] [Scilit]
- Wang, Y.; Cui, X.; Liu, Q.; Zhao, B.; Liao, Y.; Qing, X. An adaptive damage monitoring method based on transfer features mapped for advanced composite structures. Compos. Struct. 2024, 329, 117742. [Google Scholar] [CrossRef] [Scilit]
- Shin, C.S.; Lin, T.C. Hygrothermal damage monitoring of Composite Adhesive Joint using the Full Spectral Response of Fiber Bragg Grating Sensors. Polymers. 2022, 14, 368. [Google Scholar] [CrossRef] [Scilit]
- Grassia, L.; Iannone, M.; Califano, A.; D’Amore, A. Strain based method for monitoring the health state of composite structures. Compos. B Eng. 2019, 176, 107253. [Google Scholar] [CrossRef] [Scilit]
- Thatcher, J.E.; Crump, D.A.; Devivier, C.; Bailey, P.B.S.; Dulieu-Barton, J.M. Low cost infrared thermography for automated crack monitoring in fatigue testing. Opt. Lasers Eng. 2020, 126, 105914. [Google Scholar] [CrossRef] [Scilit]
- Morscher, G.N.; Maxwell, R. Monitoring tensile fatigue crack growth and fiber failure around a notch in laminate SIC/SIC composites utilizing acoustic emission, electrical resistance, and digital image correlation. J. Eur. Ceram. Soc. 2019, 39, 229–239. [Google Scholar] [CrossRef] [Scilit]
- Cui, J.; Qu, X.; Lv, C.; Du, J.; Wang, H. Multi-parameter acoustic emission analysis for fatigue crack evaluation in structural health monitoring. Measurement 2025, 256, 118529. [Google Scholar] [CrossRef] [Scilit]
- Benzon, H.; Mielke, A.; Skovborg, T.; Mcgugan, M.; Branner, K. Acoustic emission data analytics on delamination growth in a wind turbine blade under full-scale cyclic testing. Measurement 2025, 242, 115822. [Google Scholar] [CrossRef] [Scilit]
- Aggelis, D.G.; Kordatos, E.Z.; Matikas, T.E. Acoustic emission for fatigue damage characterization in metal plates. Mech. Res. Commun. 2011, 38, 106–110. [Google Scholar] [CrossRef] [Scilit]
- Noorsuhada, M.N. An overview on fatigue damage assessment of reinforced concrete structures with the aid of acoustic emission technique. Constr. Build. Mater. 2016, 112, 424–439. [Google Scholar] [CrossRef] [Scilit]
- Saeedifar, M.; Zarouchas, D. Damage characterization of laminated composites using acoustic emission: A review. Compos. B Eng. 2020, 195, 108039. [Google Scholar] [CrossRef] [Scilit]
- Zhang, Y.; Shi, J.; Zheng, J. A method of fracture toughness JIC measurement based on digital image correlation and acoustic emission technique. Mater. Des. 2021, 197, 109258. [Google Scholar] [CrossRef] [Scilit]
- Liao, B.B.; Wang, D.L.; Hamdi, M.; Zheng, J.Y.; Jiang, P.; Gu, C.H.; Hong, W.R. Acoustic emission-based damage characterization of 70 MPa type IV hydrogen composite pressure vessels during hydraulic tests. Int. J. Hydrog. Energy 2019, 44, 22494–22506. [Google Scholar] [CrossRef] [Scilit]
- He, Y.; Li, M.; Meng, Z.; Chen, S.; Huang, S.; Hu, Y.; Zou, X. An overview of acoustic emission inspection and monitoring technology in the key components of renewable energy systems. Mech. Syst. Signal Process. 2021, 148, 107146. [Google Scholar] [CrossRef] [Scilit]
- Grigg, S.; Pullin, R.; Featherston, C.A. Acoustic emission source location in complex aircraft structures using three closely spaced sensors. Mech. Syst. Signal Process. 2022, 164, 108256. [Google Scholar] [CrossRef] [Scilit]
- Sun, S.; Wang, J.; Zhang, X.; Zhang, L. A Damage Identification Method for Wind Turbine Blade Fatigue Testing Based on Acoustic Emission Signals. J. Nondestruct. Eval. 2026, 45, 33. [Google Scholar] [CrossRef] [Scilit]
- Abeln, B.; Bartsch, H.; Sanchez, P.M.; Kianfar, A.; Geers, T.; Feldmann, M.; Clausen, E. Prediction of Micro-Cracks in Steel Structures Subjected to Fatigue by Means of Acoustic Emission. J. Nondestruct. Eval. 2025, 44, 118. [Google Scholar] [CrossRef] [Scilit]
- Ma, C.N.; Cui, Z.W.; Liu, J.; Kundu, T. A signal energy approach of acoustic source localization in plate structures using a discrete sensor array. Ultrasonics 2025, 148, 107555. [Google Scholar] [CrossRef] [Scilit]
- Chai, M.; Lai, C.; Xu, W.; Duan, Q.; Zhang, Z.; Song, Y. Characterization of Fatigue Crack Growth Based on Acoustic Emission Multi-Parameter Analysis. Materials 2022, 15, 6665. [Google Scholar] [CrossRef] [Scilit] [PubMed]
- Yu, J.; Ziehl, P.; Zárate, B.; Caicedo, J. Prediction of fatigue crack growth in steel bridge components using acoustic emission. J. Constr. Steel Res. 2011, 67, 1254–1260. [Google Scholar] [CrossRef] [Scilit]
- Paris, P.; Erdogan, F. A critical analysis of crack propagation laws. J. Basic Eng. 1963, 85, 528–533. [Google Scholar] [CrossRef] [Scilit]
- Wang, T.; Bahrami, Z.; Renaud, G.; Yang, C.; Liao, M.; Liu, Z. A probabilistic model for fatigue crack growth prediction based on closed-form solution. Structures 2022, 44, 1583–1596. [Google Scholar] [CrossRef] [Scilit]
- Lindley, T.C.; Palmer, I.G.; Richards, C.E. Acoustic emission monitoring of fatigue crack growth. Mater. Sci. Eng. 1978, 32, 1–15. [Google Scholar] [CrossRef] [Scilit]
- Han, Z.; Luo, H.; Cao, J.; Wang, H. Acoustic emission during fatigue crack propagation in a micro-alloyed steel welds. Mater. Sci. Eng. A 2011, 528, 7751–7756. [Google Scholar] [CrossRef] [Scilit]
- Han, Z.Y.; Luo, H.Y.; Zhang, Y.B.; Cao, J.W. Effects of micro-structure on fatigue crack propagation and acoustic emission behaviors in a micro-alloyed steel. Mater. Sci. Eng. A 2013, 559, 534–542. [Google Scholar] [CrossRef] [Scilit]
- Li, L.; Zhang, Z.; Shen, G. Influence of grain size on fatigue crack propagation and acoustic emission features in commercial-purity zirconium. Mater. Sci. Eng. A 2015, 636, 35–42. [Google Scholar] [CrossRef] [Scilit]
- Chai, M.Y.; Zhang, J.; Zhang, Z.X.; Duan, Q.; Cheng, G.X. Acoustic emission studies for characterization of fatigue crack growth in 316LN stainless steel and welds. Appl. Acoust. 2017, 126, 101–113. [Google Scholar] [CrossRef] [Scilit]
- Morton, T.M.; Smith, S.; Harrington, R.M. Effect of loading variables on the acoustic emissions of fatigue-crack growth. Exp. Mech. 1974, 14, 208–213. [Google Scholar] [CrossRef] [Scilit]
- Roberts, T.M.; Talebzadeh, M. Fatigue life prediction based on crack propagation and acoustic emission count rates. J. Constr. Steel Res. 2003, 59, 679–694. [Google Scholar] [CrossRef] [Scilit]
- Harris, D.Q.; Dunegan, H.L. Continuous monitoring of fatigue-crack growth by acoustic-emission techniques. Exp. Mech. 1974, 14, 71–81. [Google Scholar] [CrossRef] [Scilit]
- Baram, J.; Rosen, M. Fatigue life prediction by distribution analysis of acoustic emission signals. Mater. Sci. Eng. 1979, 41, 25–30. [Google Scholar] [CrossRef] [Scilit]
- Baram, J. Fatigue-life prediction by an order statistics treatment of acoustic-emission signals. Exp. Mech. 1993, 33, 189–194. [Google Scholar] [CrossRef] [Scilit]
- Gong, Y.H.; Liu, W.; Zeng, K.; Yan, Y.; Zhang, X.H.; Wang, G.; Wang, Y. Predication of Fatigue Crack Propagation in Girth Welds of Long-distance Gas Pipeline using Acoustic Emission. In Proceedings of the 2024 IEEE Far East NDT New Technology & Application Forum (FENDT), Zhongshan City, China, 24–27 June 2024; pp. 96–100. [Google Scholar]
- Yan, Y.; Liu, W.; Gong, Y.H.; Zhang, X.H.; Shang, T.; Pei, J.Q.; Gao, B.; Li, X. Prediction of Fatigue Crack Propagation in X80 Pipeline Steel Using Acoustic Emission Sensing. IEEE Sens. J. 2024, 25, 6414–6424. [Google Scholar] [CrossRef] [Scilit]
- Bourchak, M.; Farrow, I.R.; Bond, I.P.; Rowland, C.W.; Menan, F. Acoustic emission energy as a fatigue damage parameter for CFRP composites. Int. J. Fatigue 2007, 29, 457–470. [Google Scholar] [CrossRef] [Scilit]
- Kordatos, E.Z.; Dassios, K.G.; Aggelis, D.G.; Matika, T.E. Rapid evaluation of the fatigue limit in composites using infrared lock-in thermography and acoustic emission. Mech. Res. Commun. 2013, 54, 14–20. [Google Scholar] [CrossRef] [Scilit]
- Li, D.; Kuang, K.; Koh, C.G. Fatigue crack sizing in rail steel using crack closure-induced acoustic emission waves. Meas. Sci. Technol. 2017, 28, 065601. [Google Scholar] [CrossRef] [Scilit]
- Shrestha, S.; Kannan, M.; Morscher, G.N.; Presby, M.J.; Razavi, S.M. In-situ fatigue life analysis by modal acoustic emission, direct current potential drop and digital image correlation for steel. Int. J. Fatigue 2021, 142, 105924. [Google Scholar] [CrossRef] [Scilit]
- Shi, S.; Han, Z.; Liu, Z.; Vallely, P.; Soua, S. Quantitative monitoring of brittle fatigue crack growth in railway steel using acoustic emission. Proc. Inst. Mech. Eng. Part F J. Rail Rapid Transit 2018, 232, 1211–1224. [Google Scholar] [CrossRef] [Scilit]
- Yu, J.; Ziehl, P. Stable and unstable fatigue prediction for A572 structural steel using acoustic emission. J. Constr. Steel Res. 2012, 77, 173–179. [Google Scholar] [CrossRef] [Scilit]
- Yu, J.; Ziehl, P.; Matta, F.; Pollock, A. Acoustic emission detection of fatigue damage in cruciform welded joints. J. Constr. Steel Res. 2013, 86, 85–91. [Google Scholar] [CrossRef] [Scilit]
- GB/T6398-2000; Standard Test Method for Fatigue Crack Growth Rates of Metallic Materials. General Administration of Quality Supervision of the People’s Republic of China, Standard Press of China: Beijing, China, 2001.
- ASTM E647-23; Standard Test Method for Measurement of Fatigue Crack Growth Rates. ASTM: West Conshohocken, PA, USA, 2023.
- Jing, T.; Yu, Y. Fatigue Prediction Method of Superalloy Based on the Improved Largest Lyapunov Exponent. Metals 2025, 15, 945. [Google Scholar] [CrossRef] [Scilit]
- Huang, Z.; Liu, Y.; Mao, H.; Wang, X.; Li, X.; Mao, H. Feature analysis for acoustic emission signals during metal fatigue damage based on Kolmogorov entropy and correlation dimension. J. Vib. Shock 2017, 36, 210–214. [Google Scholar]
- Schouten, J.C.; Takens, F.; Van Den Bleek, C.M. Maximum-likelihood estimation of the entropy of an attractor. Phys. Rev. E 1994, 49, 126. [Google Scholar] [CrossRef] [Scilit]
- Daw, C.S.; Thomas, J.F.; Richards, G.A.; Narayanaswami, L.L. Chaos in thermal pulse combustion. Chaos 1995, 5, 662–670. [Google Scholar] [CrossRef] [Scilit]

Disclaimer/Publisher’s Note: The statements, opinions and data contained in all publications are solely those of the individual author(s) and contributor(s) and not of MDPI and/or the editor(s). MDPI and/or the editor(s) disclaim responsibility for any injury to people or property resulting from any ideas, methods, instructions or products referred to in the content. |
© 2026 by the authors. Licensee MDPI, Basel, Switzerland. This article is an open access article distributed under the terms and conditions of the Creative Commons Attribution (CC BY) license.