


Abstract
To achieve carbon emission reduction in the long ironmaking process with blast furnace-basic oxygen furnace (BF-BOF), the Hebei Iron & Steel Group and Northeastern University have jointly developed the Reduction Smelting Furnace with Carbon-Cycling, Hydrogen-Rich, and Pure-Oxygen (CHORSF) ironmaking process. This new process employs advanced technology to overcome the hydrogen enrichment limitation of traditional BFs and the problems of “hot at the lower part and cold at the upper part” in all-oxygen BFs. This paper establishes an operating line for the CHORSF ironmaking process, systematically analyzes the influence mechanisms of key smelting parameters on CHORSF, and provides guidance for optimizing the process. The results show that the slopes of the operating lines in the indirect reduction zone can characterize the reducing gas consumption under actual conditions; under the smelting conditions of this study, the reducing gas consumption falls within a specific range. The slope of the operating line in the softening–melting–dripping zone can be used to quantify the coke ratio. Furthermore, increasing the metallization ratio at the bottom of the indirect reduction zone leads to a slight increase in reducing gas consumption, while a 1% increase in the same metallization ratio results in a notable decrease in the coke ratio.
1. Introduction
Under the guidance of the dual-carbon goals, metallurgy, as a high energy-consuming and high-emission industry [1], urgently requires green transformation. At present, the blast furnace–basic oxygen furnace (BF-BOF) long process remains the main process for steel production in China and even the world. There are mainly two kinds of low-carbon technologies for BF production: one is hydrogen-rich injection into the BF [2,3] and the other is to achieve the recycling of top gas by using a pure oxygen blast [4,5]. However, both of these technological paths face their own challenges in industrial application. Due to the small molecular size and high diffusion coefficient of H2, it exhibits superior gas–solid mass transfer capabilities compared to CO, resulting in a higher reaction rate with iron oxides [6]. However, the reduction reaction of H2 with iron oxides Fe3O4 and FeO is an endothermic reaction [6], which limits the proportion of hydrogen-rich injection in traditional BFs [7,8]. As for the pure-oxygen blast furnace using the top gas cycling technology, it will cause the problem of “hot at the lower part and cold at the upper part” [9,10,11].
In order to overcome the aforementioned problems, Northeastern University and the Hebei Iron & Steel Group have comprehensively adopted carbon reduction methods such as “Hydrogen-rich injection” and “Top gas cycling + CCUS” and proposed the Reduction Smelting Furnace with Carbon-Cycling, Hydrogen-Rich, and Pure-Oxygen (CHORSF) ironmaking process in this paper. The core equipment of this process is the reduction melting furnace, which has a clearly defined Indirect Reduction Zone (IRZ) and Softening Melting Dripping Zone (SMDZ). However, the industrial entity of the CHORSF ironmaking process is not yet in operation and still faces challenges in its promotion and industrialization. Therefore, a tool is needed that can visually characterize the intrinsic relationship between CHORSF’s raw materials and reducing gas consumption. This tool can study the impact of different smelting parameters on the coke ratio and reducing gas consumption, providing a theoretical basis for operational optimization of CHORSF.
The Rist operating line, based on the three elements Fe–O–C, is a tool that can intuitively reflect the intrinsic relationships among ore reduction, carbon consumption, and gas utilization, and it has been widely applied in the analysis and optimization of the BF ironmaking process. With the development of hydrogen metallurgy, researchers have incorporated hydrogen into the operating line system by establishing the Fe–O–C–H system [12,13,14]. The following is the previous application of the traditional Fe–O–C–H system operating line: Ono [15] and Ujisawa [16] studied the carbon reduction effect of injecting CH4 in BF based on the operating line and Manuel [17] modified the traditional Rist operating line to characterize the oxygen BF using “top gas cycling” technology and analyzed its energy-saving and carbon-reduction potential using the modified operating line. The Rist operating line plays a significant role in modern ironmaking theory and engineering practice; Zhang [18] analyzed the potential of saving coke through pulverized coal and natural gas injection into the BFs using the hydrogen-rich operating line. Sun [19] established a Rist operating line for hydrogen-rich BFs, and the results indicated that hydrogen had a significant impact on the slope of the operating line. However, the traditional Rist operation line is mainly used to characterize the traditional BF ironmaking process, and lacks applicability to new smelting reduction processes with a high hydrogen injection ratio and distinct functional zones (e.g., COREX). Therefore, it is necessary to refine the traditional Rist operating line.
The COREX process consisting of a pre-reduction shaft furnace and a melting gasifier, can provide a reference for the CHORSF process. Previous researchers used the method of establishing the operating line in different zones to study and optimize it. Srishilan et al. [20] established a Rist operating line suitable for the COREX process and analyzed the influence of different metallization rates on the slope of the operating line. Du et al. [21] used the Rist operating line established by zone to study the influence of the metallization rate and gas composition entering the furnace on the COREX shaft furnace. Zhan et al. [22,23] proposed the measures of increasing the DRI metallization rate by using the Rist operating line established by zone.
In this paper, an operating line suitable for the CHORSF is established by zone. This operating line can characterize CHORSF’s key smelting parameters (such as the coke ratio, reducing gas consumption). Furthermore, this paper analyzed the impact of different metallization ratios at the bottom of the IRZ on coke ratio and reducing gas consumption, providing a theoretical basis for process operation optimization and carbon emission reduction potential assessment.
2. The CHORSF Ironmaking Process and Its Mass–Energy Balance Model
2.1. The CHORSF Ironmaking Process
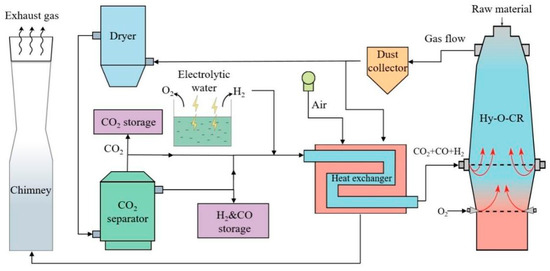
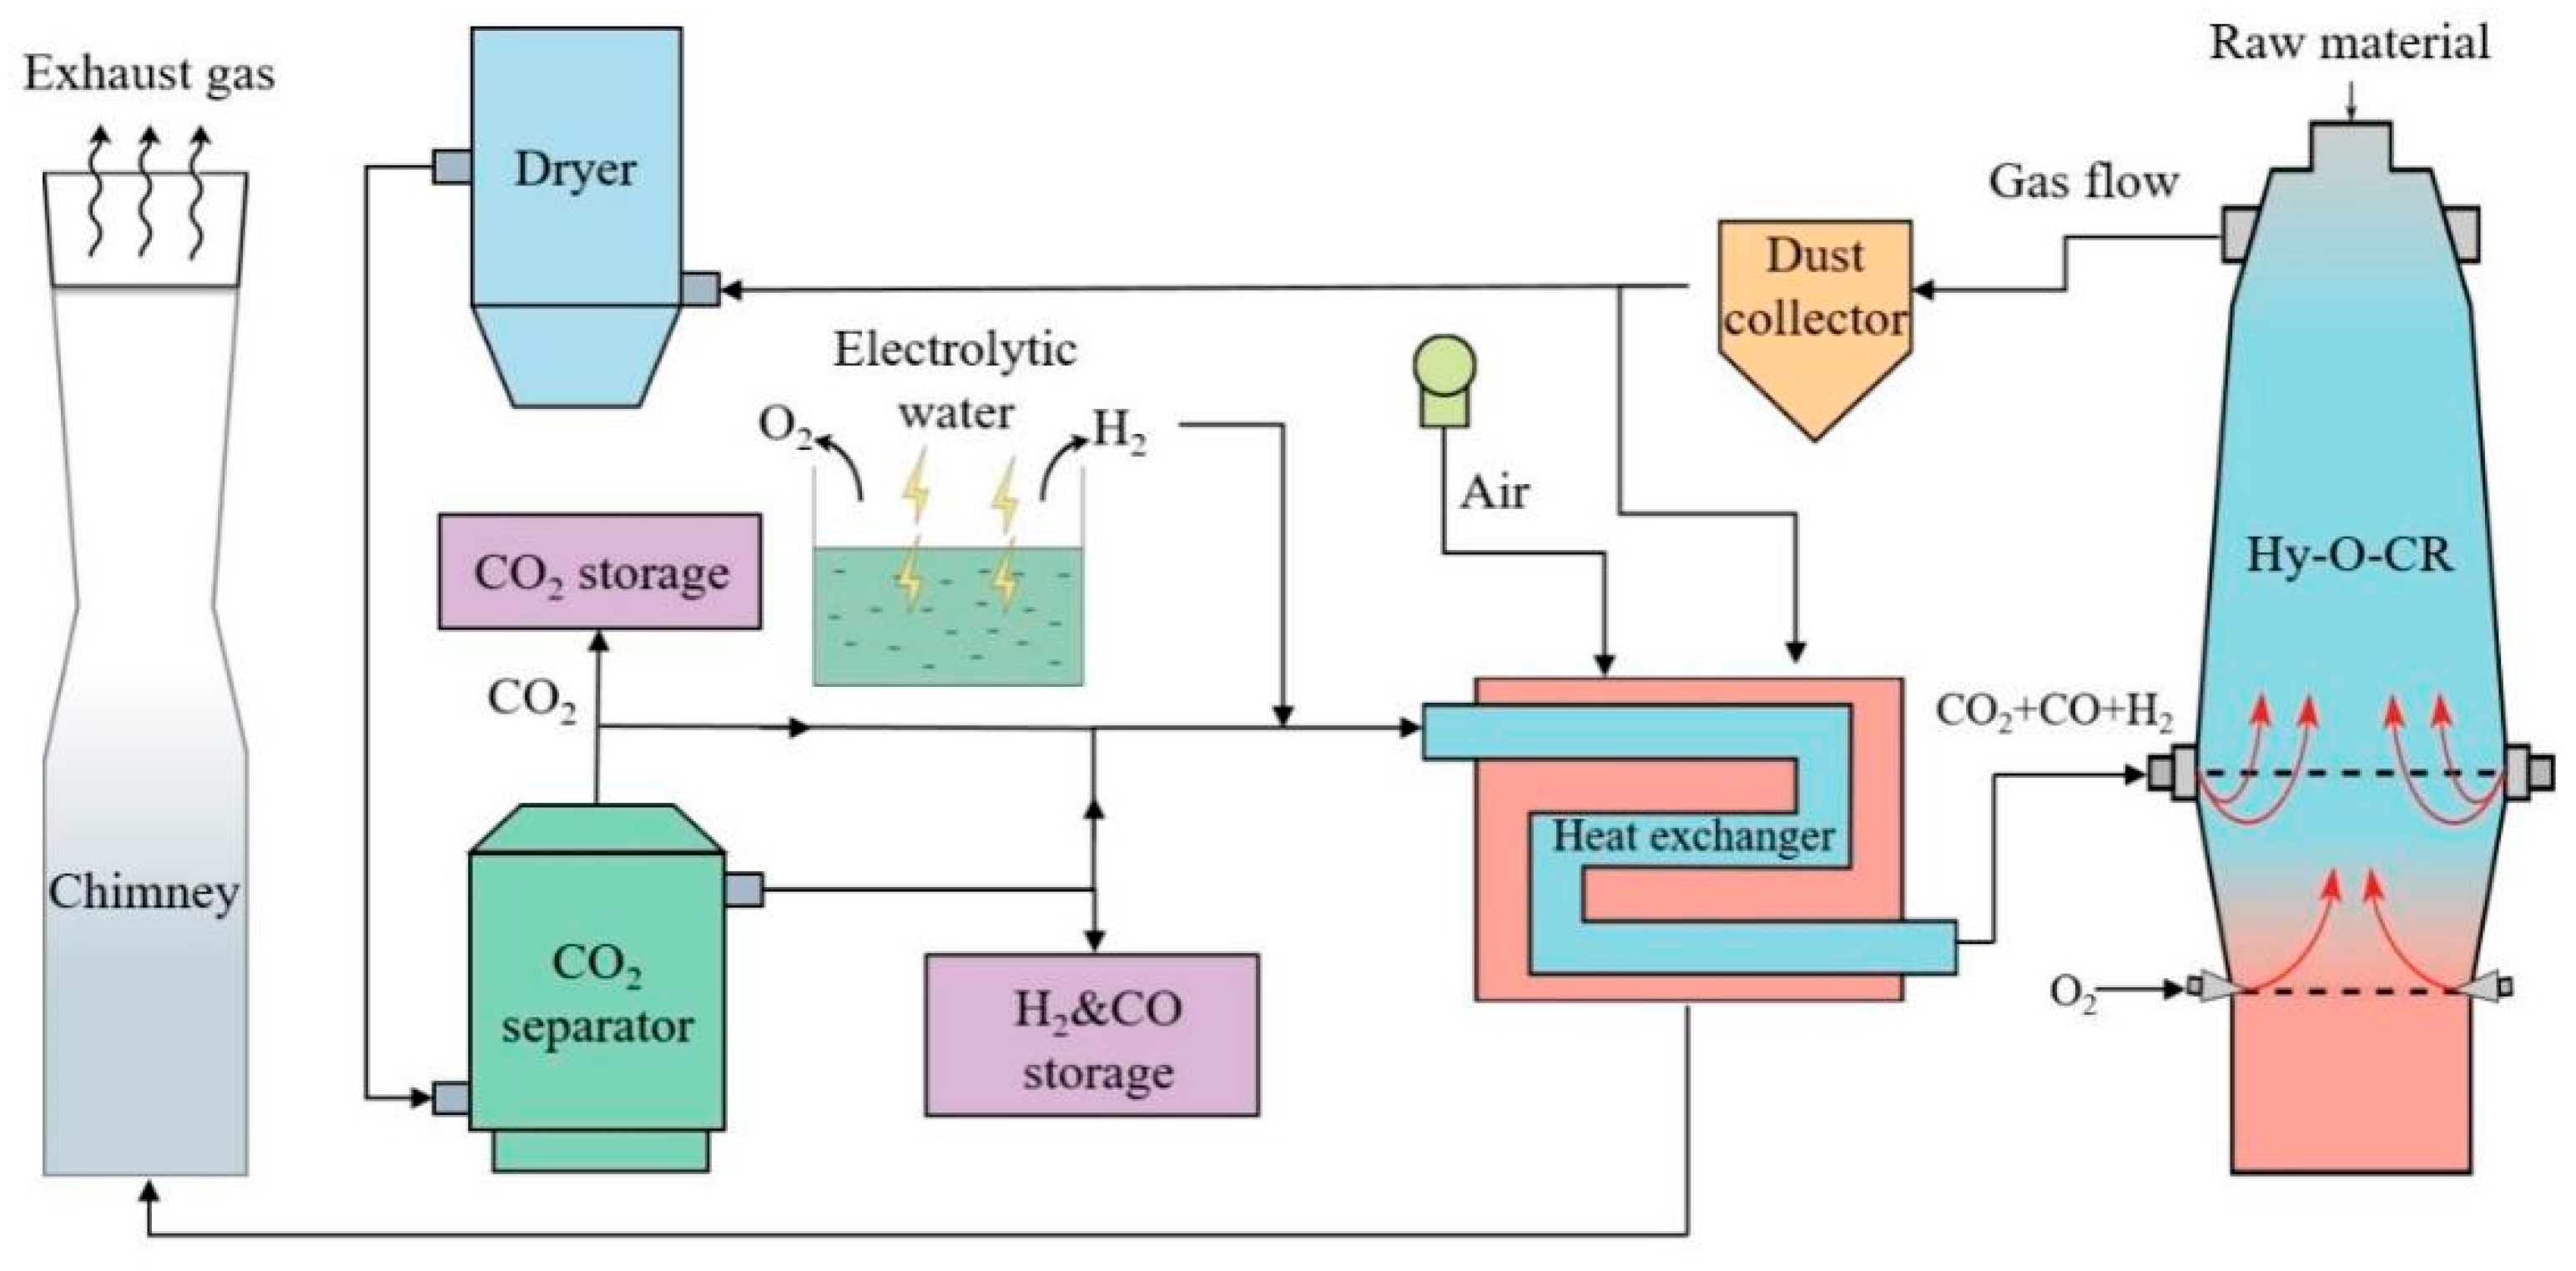
The all-oxygen hydrogen-rich low-carbon reduction melting furnace ironmaking process [24] is shown in Figure 1. This process employs technologies such as hydrogen-rich reducing gas injection into the upper furnace, significantly increasing the metallization rate of iron-bearing materials in the IRZ to 85–90% while reducing direct reduction and consumption of coke. The use of pure oxygen not only greatly enhances the smelting intensity of the furnace but also enables carbon recycling through top gas circulation, ultimately achieving over 40% CO2 emission reduction.
Figure 1.
Schematic of CHORSF ironmaking process.
The COURSE50 ironmaking process, proposed by Japan in 2008 [25] has a carbon reduction pathway that focuses on two core strategies: first, internal decarbonization within the BF, primarily by injecting hydrogen to replace part of the coke, thereby reducing coke consumption; second, CO2 capture from the top gas, which can subsequently be utilized for storage (CCS, Carbon Capture and Storage) or resource recovery (CCU, Carbon Capture and Utilization). The process aims to ultimately achieve a 30% reduction in total CO2 emissions across the entire production chain.
Compared with this process, the CHORSF ironmaking process proposed in this study not only integrates “hydrogen-rich” and “top gas recycling” technologies but also features a unique reactor design that allows higher hydrogen injection ratios and more flexible control of gas composition. This design is expected to enable deeper carbon reduction beyond the levels achievable with COURSE50.
2.2. The Mass–Energy Balance Model of CHORSF Ironmaking Process [24]
The mass–energy balance model of the ironmaking process is developed based on the constraints of the mass–energy balance equations. This model includes: the mass balance and heat balance model of the CHORSF, the mass balance and heat balance model of the CHORSF by zone, and the parameter matching model of the entire process. This mass–energy balance model is suitable for operating conditions with a high proportion of hydrogen. The operating conditions corresponding to the cases mentioned in the following article are all greater than 40%, which meets the requirements of the process model. The following cases are completed under the conditions that the corresponding metallization rate can be achieved. The limitations include raw material conditions, injection position, furnace body height, operating conditions, etc., and further design optimization can be carried out through kinetic research in the future.
According to the constraint conditions of the model, the results satisfying the process balance of the whole process under different operation parameters are calculated, and through iterative calculations, the results of the mass and heat balance for the IRZ and SMDZ inside the CHORSF are obtained. This model can output data such as fuel consumption, furnace body reducing gas injection volume, and furnace top gas composition, providing the foundation for plotting the operating line of the CHORSF.
Our team previously conducted sensitivity analyses on the MRIRZ, the volume of reducing gas injected into the shaft, and the gas temperature, and published the relevant findings in 2023 [24]. The results show that with every 1% increase in MRIRZ, coke consumption decreases by 5.95 kg/tHM, while the volume of reducing gas injected into the shaft increases by 7.13 Nm3. With every 1% increase in the CO proportion of the shaft reducing gas, CO2 emissions increase by approximately 7.53 kg/tHM, and energy consumption increases by 2.68 MJ/tHM. Regarding gas temperature, the temperature of the injected reducing gas has a certain impact on CO2 emissions at low CO concentrations, but this effect diminishes as the CO concentration increases. In view of the CHORSF industrial entity that is not yet in operation, this process draws on industrial data from mature processes for segmented verification.
2.3. Data Required for Model Calculation
The compositions of the raw materials in this paper are listed in Table 1, Table 2, Table 3 and Table 4.
Table 1.
Composition of ore (mass fraction), %.
Table 2.
Fe oxides in minerals (mass fraction), %.
Table 3.
Composition of flux (mass fraction), %.
Table 4.
Composition of coke (mass fraction), %.
The following assumptions are based on similar process models (e.g., COREX) and can be applied to all operating conditions:
- (1)
- The volume utilization coefficient of CHORSF is set as 2.5 t/(m3·d) [26];
- (2)
- Sulfur in the CHORSF goes into the top gas, hot metal, and slag. The distribution ratio of sulfur in the top gas () is 5%, the content of sulfur in the hot metal is 0.025%, and the others enter the slag [27];
- (3)
- The methane production ratio () is 1% of the total carbon consumption in the SMDZ;
- (4)
- The temperature of the hot metal and slag are set to 1500 °C and 1550 °C, respectively;
- (5)
- In order to ensure the fluidity of the slag, the binary basicity (R2) of the slag is set to 1.15 [28];
- (6)
- According to the operation experience of the shaft furnace, the reduction potential (E) of the top gas is not less than 1.22 [29].
2.4. Calculation Results of the Mass–Energy Balance Model
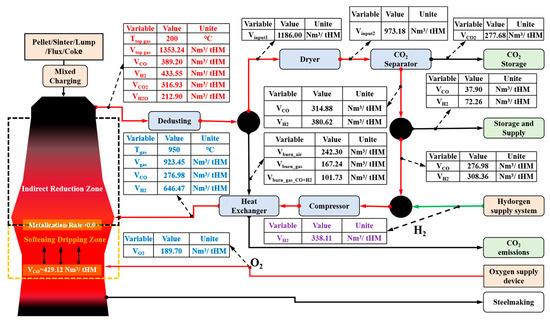
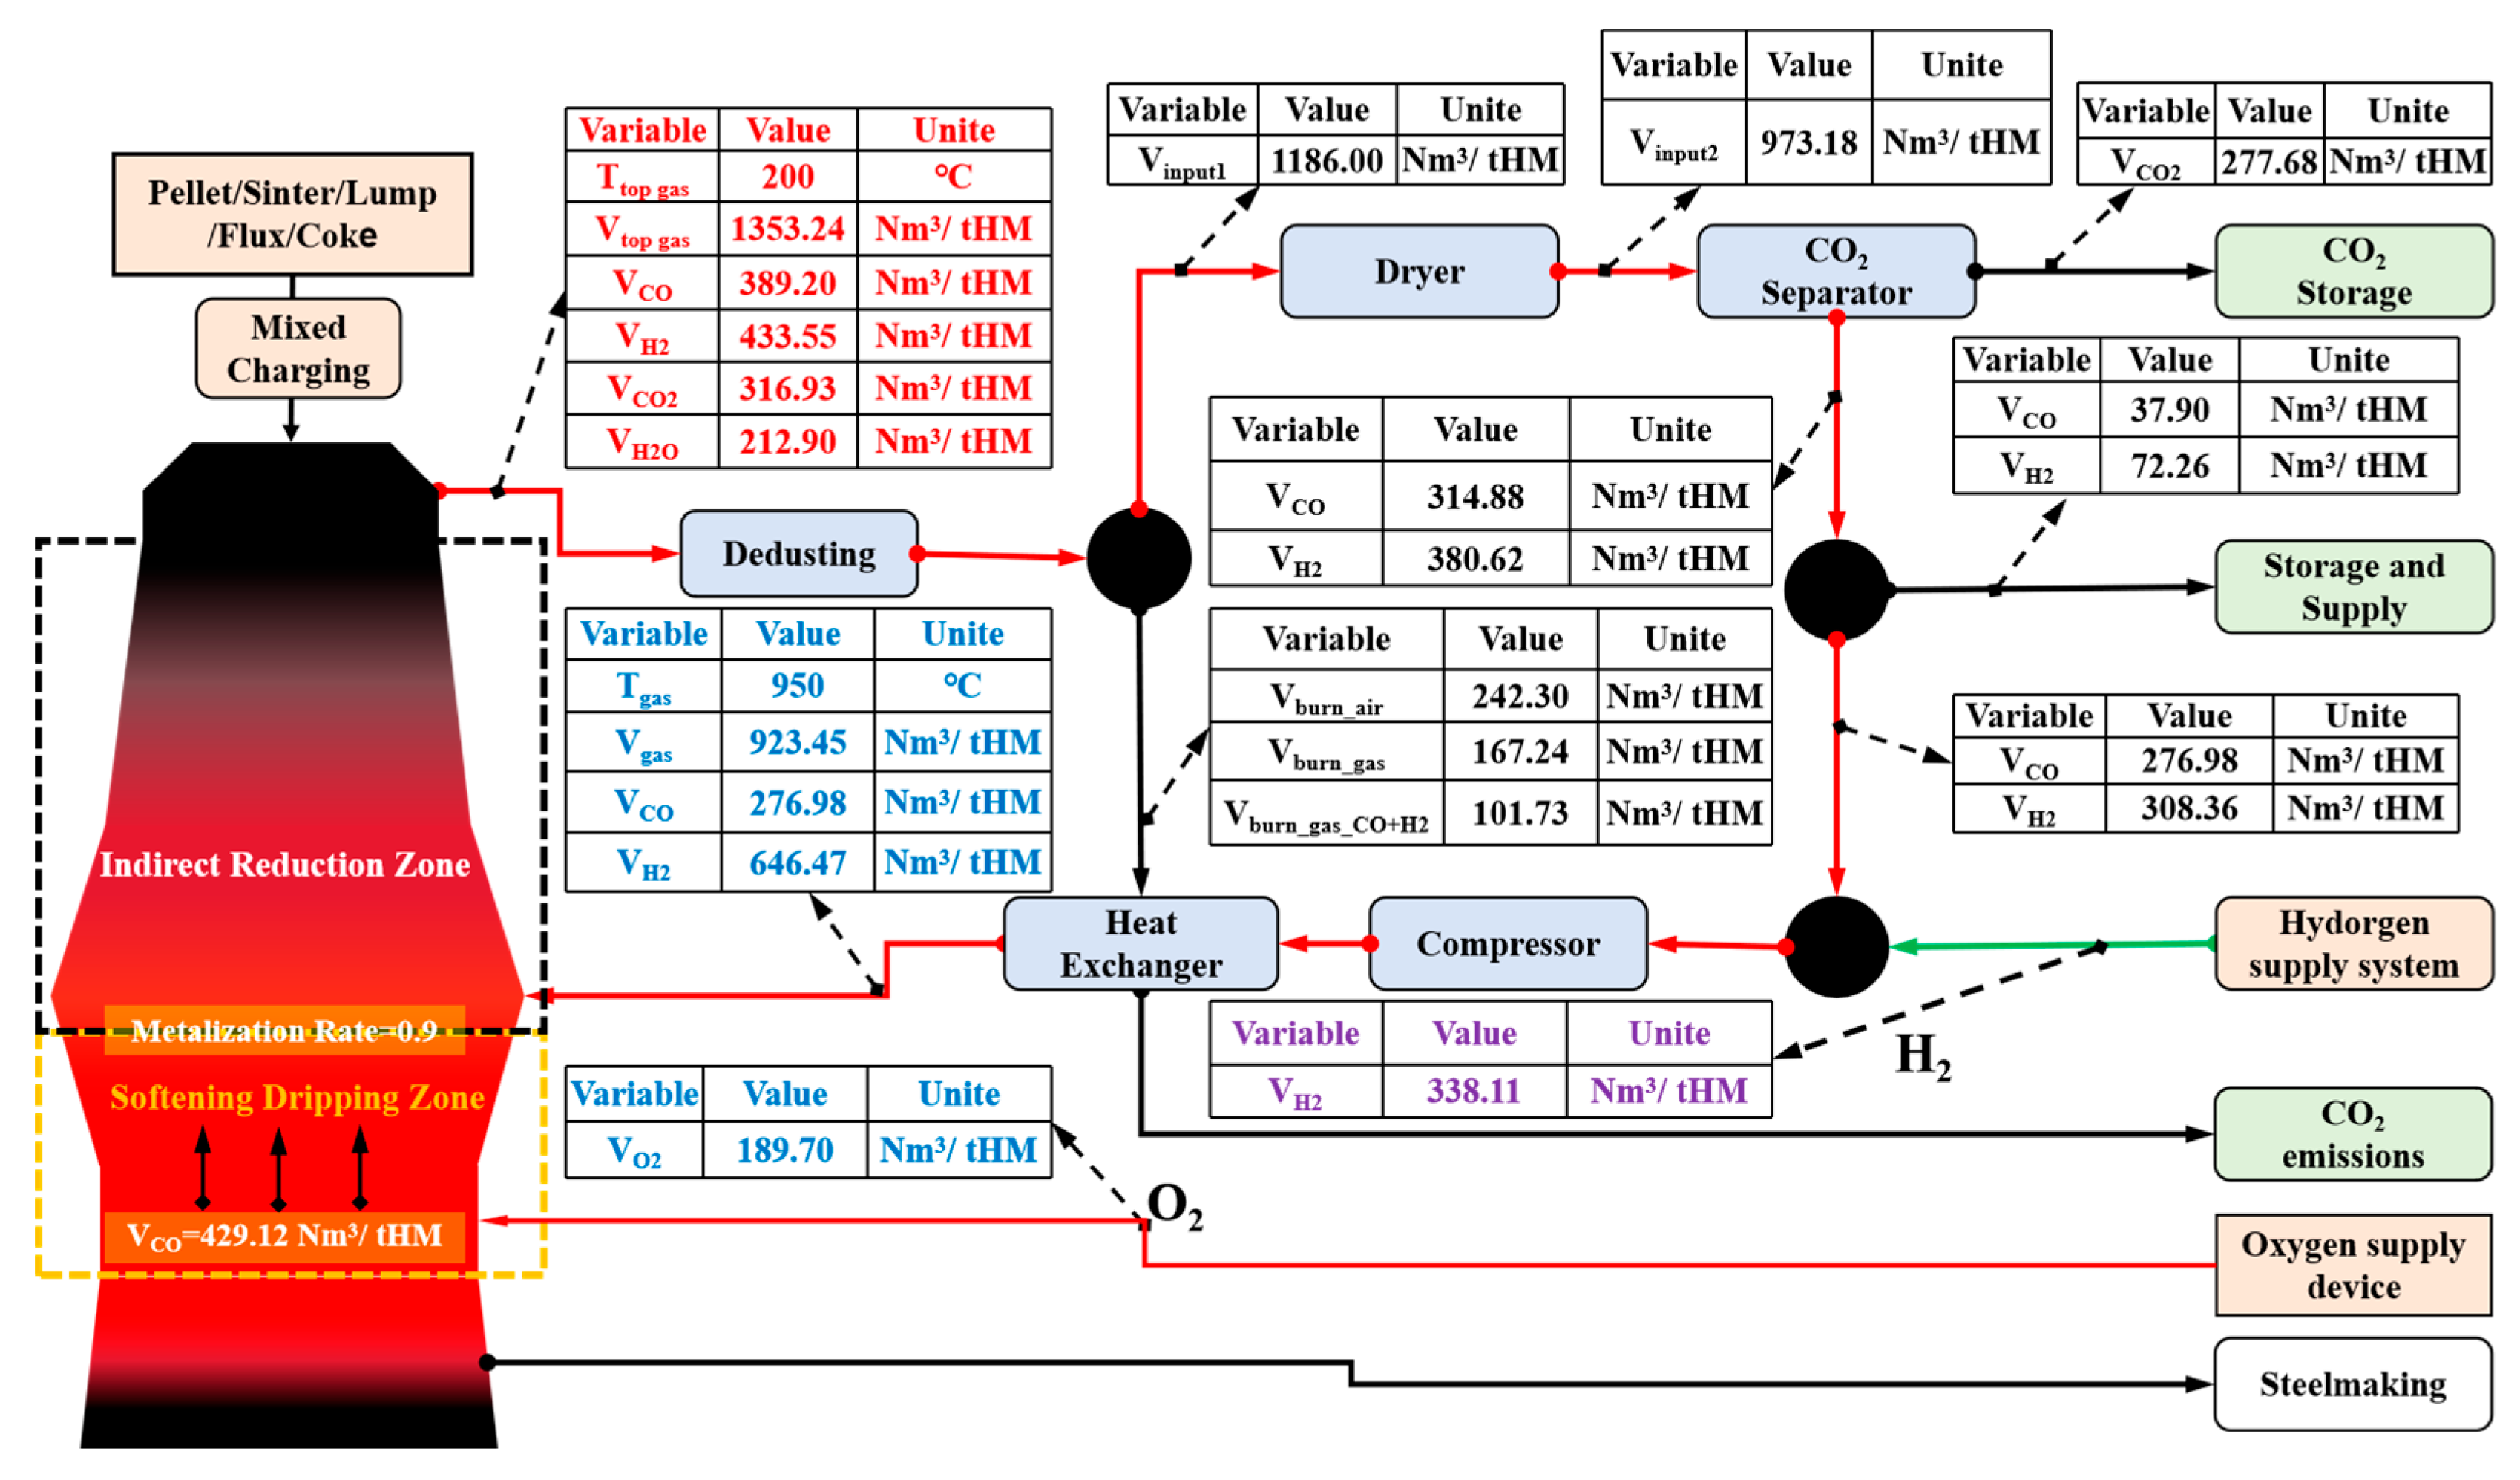
The smelting parameters required for plotting the operating line of CHORSF, generated by the mass–energy balance model of CHORSF under specific process conditions, are listed in Figure 2 and Table 5, Table 6, Table 7 and Table 8.
Figure 2.
CHROSF ironmaking process mass and energy data.
Table 5.
Composition of hot metal (mass fraction), %.
Table 6.
Composition of top gas (volume fraction), %.
Table 7.
Composition of the reducing gas into the IRZ (volume fraction), %.
Table 8.
Additional parameters required for plotting the CHORSF operating line.
3. Establishment the Operating Line of the CHORSF
The reduction smelting furnace of this process has a clearly defined IRZ and SMDZ. First, the operating line for IRZ and SMDZ are established respectively, and finally the two models are connected to construct the operating line for the CHORSF.
3.1. Operating Line for the IRZ
- (1)
- Determine the coordinates of key characteristic points.
According to the results of the mass and heat balance for the IRZ, the coordinates of key characteristic points are determined via the following steps to establish the operating line for the IRZ:
- a.
- Point T
According to the composition of the reducing gas () and the MRIRZ, the coordinates of point T are as follows:
where denotes the volume fraction of CO2 content (%) and denotes the volume fraction of H2O (%) at the bottom of IRZ.
where denotes the mass fraction of FexO in ore at the bottom of the IRZ and MRIRZ denotes metallization rate of the ore at the bottom of the IRZ.
- b.
- Point A
According to the top gas composition of the furnace () and the content of charged minerals, the coordinates of point A are as follows:
where 2. is the furnace top gas (%) and denotes the volume fraction of H2O in the furnace top gas (%).
where , , , and denote the mass fraction of Fe2O3, Fe3O4, FeO, and Fe in the total feed ore (%), respectively.
- c.
- Chemical Equilibrium Limit Point W
In CHORSF, the two chemical reactions for the reduction of wüstite in the IRZ are as follows:
where and denote the equilibrium constants of the above two reactions at temperature T. Wüstite is a non-stoichiometric crystal with cation Fe2+ vacancies, denoted as FexO, where x ranges from 0.88 to 0.95. The boundary between the wüstite reduction and indirect reduction lies within the range of 900–1000 °C, at which temperature x ≈ 0.95.
For point W, the ordinate is determined by the oxygen content of wüstite at the corresponding temperature, yielding (). Based on the above conclusion, the coordinates of the chemical equilibrium limit point W [23,30] can be determined as follows:
where and denote the moles of CO2 and H2O in the furnace top gas under ideal conditions (mol); and denote the moles of CO and H2 consumed in the direct reduction reaction under ideal conditions (mol); and denote the total moles of C and H2 participating in the direct reduction reaction (mol); and and denote the equilibrium constants of the direct reduction reactions of CO and H2 at temperature T.
- d.
- Point
Based on the coordinates of points W and T, the coordinates of point can be determined using the following formulas:
where denotes the ordinate of point A; denotes the slope of the linear equation for WT; and b denotes intercept of the linear equation for WT.
- (2)
- Plotting of the Operating Line for IRZ.
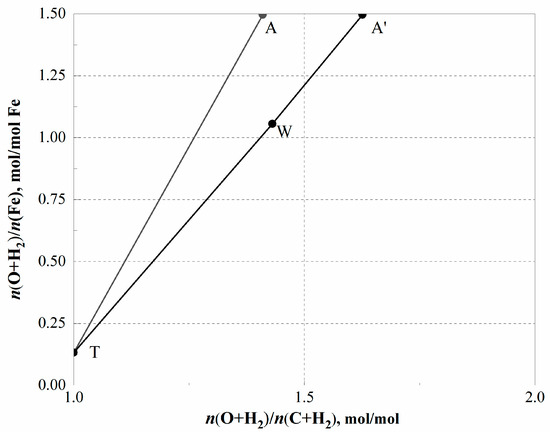
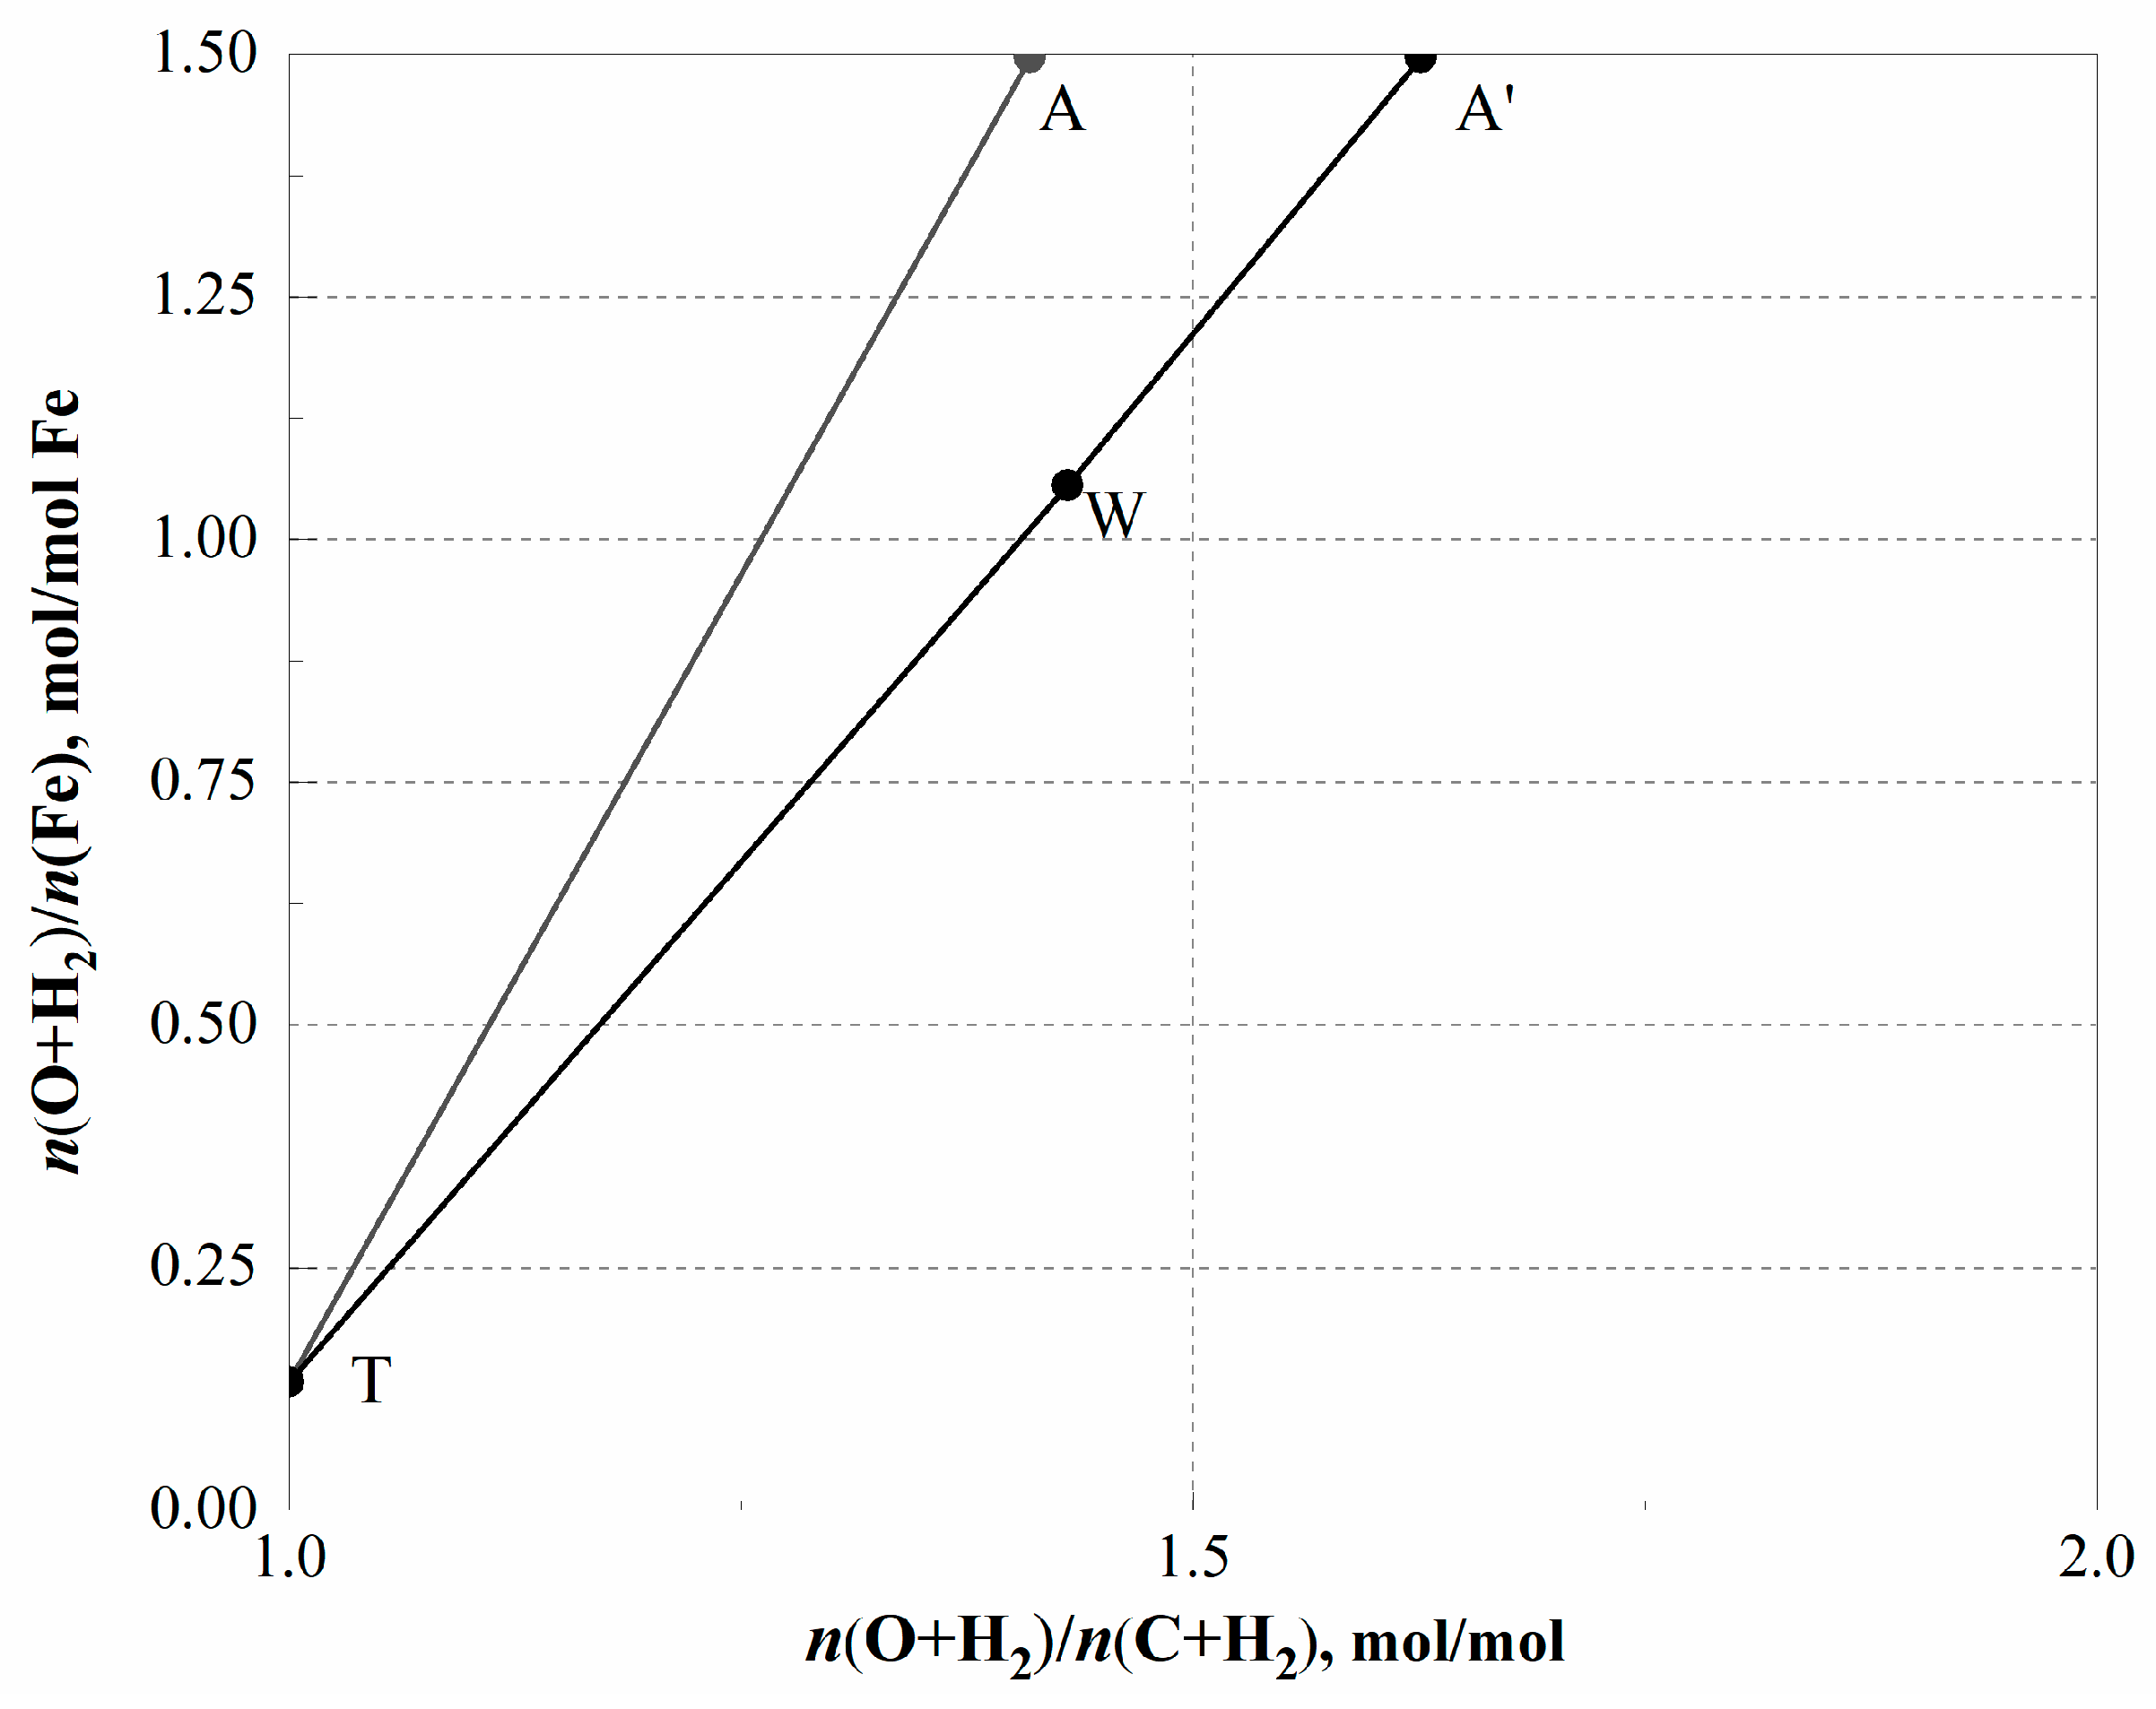
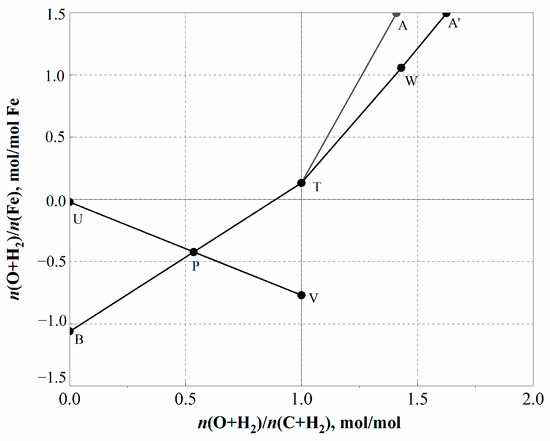
Based on the results in Section 2.4, the coordinates of the characteristic points A, T, W, and on the operating line of IRZ have all been determined. Connecting AT and , the operating line diagram for the IRZ of CHORSF is plotted in Figure 3.
Figure 3.
Operating line diagram for IRZ.
In Figure 3, the slope of line AT () represents the actual consumption of reducing gas required for reducing iron oxides per mole of Fe and the slope of line A′T () represents the theoretical minimum consumption required for reducing iron oxides per mole of Fe. The corresponding required volume of furnace shaft reducing gas can be calculated based on the AT slope. Under the smelting conditions described in Section 2.3, the reducing gas volume calculated by the slope of the actual operating line in the IRZ is 1372.1 Nm3/tHM, with a relative error of approximately 1.5% compared to the calculated value of 1351.3 Nm3/tHM from the mass–energy balance model, verifying the accuracy of the operating line for the IRZ.
The mechanism of the IRZ in the CHORSF process is basically consistent with the shaft furnace process, utilizing both CO and H2 as reducing agents for gas–solid reduction reactions, which can achieve over 90% MRIRZ [31]. Among them, the gas volume of the COREX process shaft furnace is approximately 1400 Nm3/tHM [32]. The gas volume of the MIDREX process is about 1400 Nm3/tDRI [33], while that of the HYL-III [34] process ranges from 1300 to 1400 Nm3/tDRI. The HYBRIT process [35], which uses pure hydrogen, requires a higher gas volume of approximately 1700 Nm3/tDRI. The gas volume of the CHORSF process also falls within the range of about 1300–1400 Nm3/tHM.
3.2. Operating Line for the SMDZ
The steps for establishing the operating line for the SMDZ are as follows:
- (1)
- Determine the coordinates of key characteristic points
- a.
- Point U
can be determined from the reaction equation . Other elements can also be determined using the direct reduction reaction formula with C, where the calculation equation for is as follows:
where [Fe] and [Si] denote the mass fraction of Fe and Si in the target hot metal (%). can be calculated using the following equation:
where u denotes the slag ratio (kg/t HM) and denotes the S content in the slag (%).
- b.
- Point B
The x-coordinate of point B is 0, and the y-coordinate is , where
where denotes the oxygen input from the blast (mol/mol Fe); denotes the mass of carbon combusted in the tuyere (kg/t HM); and denotes the mass fraction of Fe in the target hot metal (%).
- c.
- Point V
The x-coordinate of point V is 1, and the y-coordinate must be determined by calculating the effective heat per kilomole. The effective heat per kilomole () is calculated as . Where denotes heat input in SMDZ, denotes heat carried away by the CO. The specific calculations are as follows:
where QC denotes the combustion heat of carbon, with a value of 9800 kJ/kg; vb denotes the blast volume required for burning per kilogram of carbon in the tuyere (Nm3/kg); and denotes the amount of CO produced per kilogram of carbon during combustion in the SMDZ. (Nm3/kg); denotes specific heat capacities for oxygen, (kJ/( Nm3·°C)); CO denotes the specific heat capacities for CO, (kJ/(Nm3·°C)); and and denote the temperature of the oxygen entering the furnace and the temperature of the CO produced by combustion in SMDZ, (°C). The formula for calculating is as follows:
where denotes the blast volume in the tuyere (Nm3/tHM) and denotes the mass of carbon combusted in the tuyere (kg/tHM).
The heat expenditure in the SMDZ is divided into two parts: the heat for direct reduction of wüstite (), and other heat consumption (). Where 152,190 kJ/kmol Fe, represents the sum of the heat carried away by the CO, the heat carried away by the hot metal, the heat carried away by the slag, and the system heat losses.
Based on the thermal equilibrium of the SMDZ, the following equation can be determined:
Since
Which is equivalent to the following:
The equation is transformed to the following:
From the above equation, the ordinate of point V is determined as . YV denotes the fraction of other effective heat consumption in the SMDZ of CHORSF, relative to the heat consumption of direct reduction.
- (2)
- Plotting of the operating line for the SMDZ.
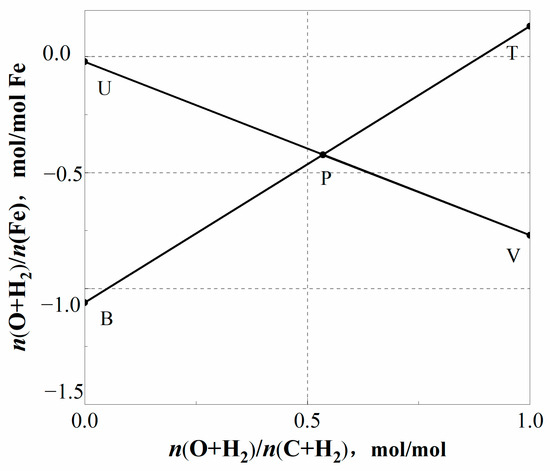
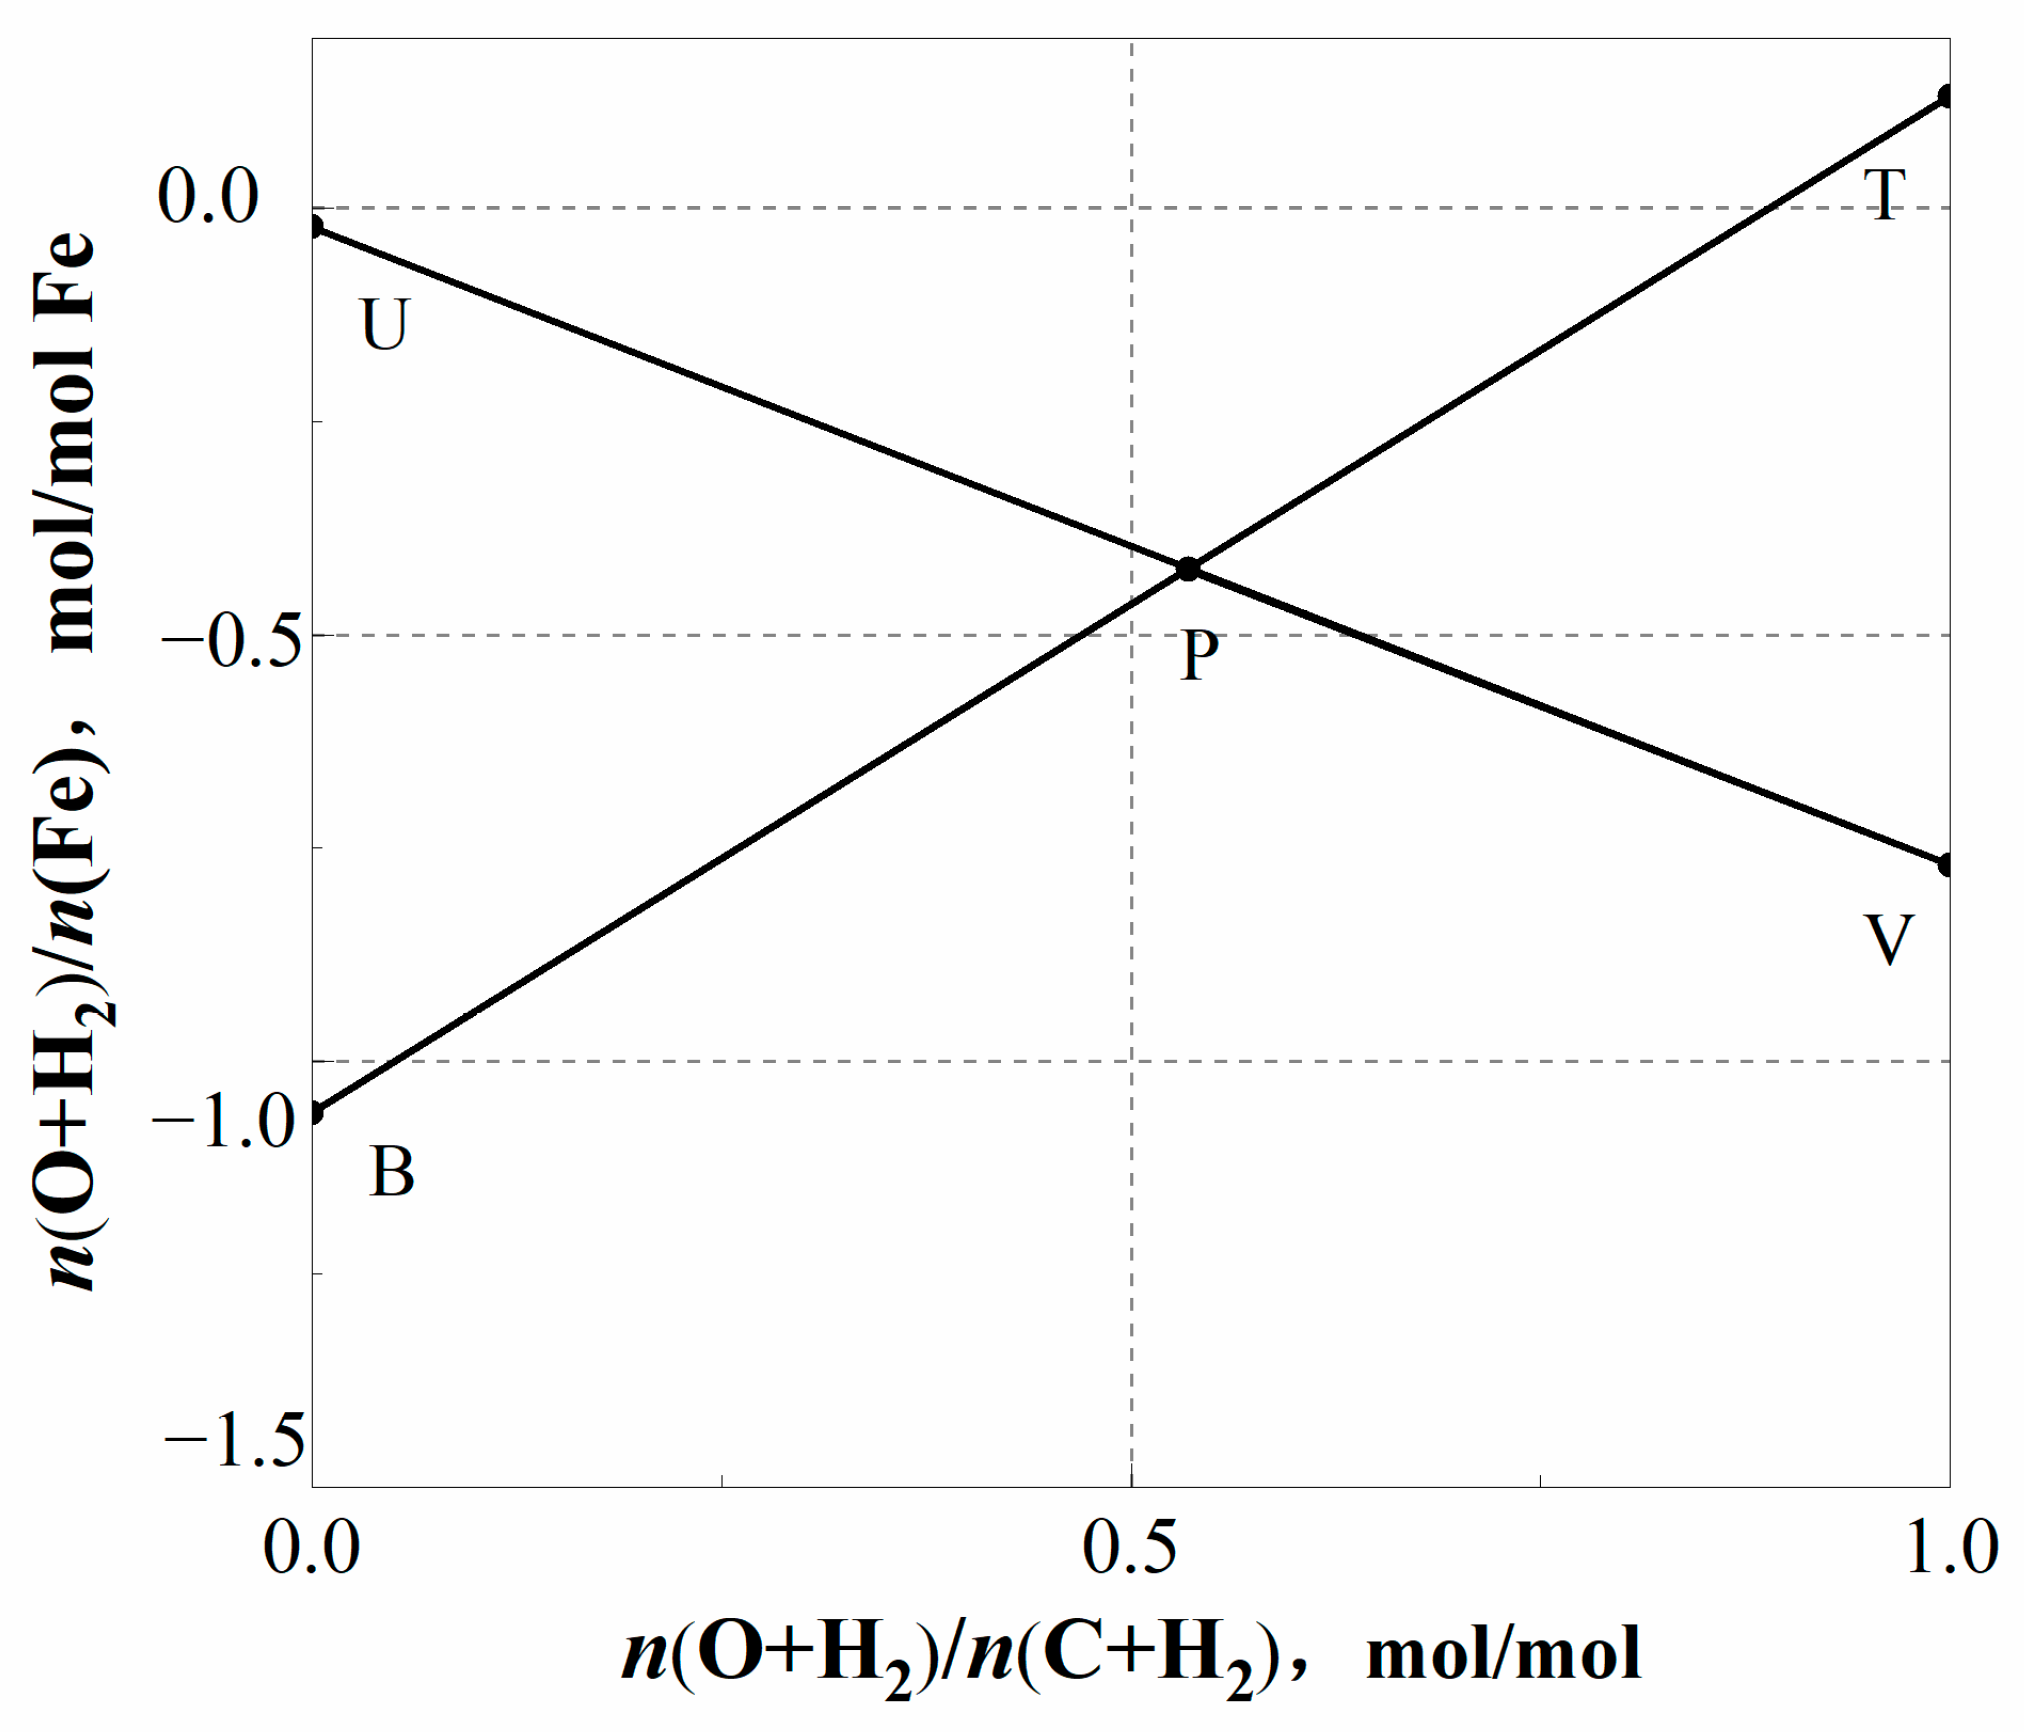
Based on the data in Section 2.4, the coordinates of characteristic points T, B, U, and V on the operating line of the SMDZ have all been determined. Connecting TB and UV, the operating line diagram for the SMDZ of CHORSF is plotted as shown in Figure 4.
Figure 4.
Operating line diagram for the SMDZ of CHORSF.
This paper is an Fe–O–C–H system and the slope of the TB line is given by . According to the operating characteristics of CHORSF, the circulating gas injection position is located in the furnace shaft, the lower part is coke combustion, and the product is CO. The difference between CHORSF and traditional BFs is that there is no pulverized coal burning in the lower part, so the main source of hydrogen in the furnace is above the SMDZ. Since no H2 enters or is generated in the SMDZ of CHORSF, the slope of the TB line () in Figure 4 can be regarded as the carbon consumption per 1 mol of Fe produced (mol/mol Fe). After accounting for the carburization of molten iron and the percentage of fixed carbon in coke, the calculated coke ratio is 317.66 kg/t HM. Compared with the result of 317.25 kg/tHM obtained from the mass–energy balance model, the relative error is 0.13%. This indicates that the in the SMDZ can accurately reflect the consumption of coke.
The fuel consumption of the COREX process is approximately 950–1050 kg/tHM [36]. Among them, coal consumption accounts for about 80–85% for comparison, and coke consumption is about 20–15%. Under the smelting conditions described in Section 2.3, the solid fuel of the CHORSF process is entirely coke, and the fuel consumption is only 317.25 kg/tHM, which is significantly lower than the fuel consumption of the COREX process.
The intersection point of UV and TB in the diagram represents the thermal pitch point P of CHORSF. According to the principle of the Rist operating line, the following can be determined:
= 152,190 kJ/kmol Fe denotes the theoretical heat consumption for direct reduction per kilomole of Fe and denotes the effective heat released by the combustion of per mole of C in the tuyere (kJ/kmol). The coordinates of point P characterize the relationship between the effective heat from tuyere carbon combustion and the total heat demand in the SMDZ. The higher the PU to PV ratio, the steeper the slope of the TB line, indicating higher coke consumption in the process [22]. Given that is a constant, increasing can reduce , as shown in the following formula:
Therefore, the coke consumption of the CHORSF process can be reduced through measures such as pulverized coal injection and increasing the temperature of the gas fed into the furnace.
3.3. Operating Line for CHORSF
The core equipment of this process is the reduction melting furnace, which has clearly defined IRZ and SMDZ. Connecting the operating line of IRZ and SMDZ at point T yields the complete operating line for CHORSF. Point T is determined by the reducing gas composition and MRIRZ. It marks the endpoint of indirect reduction and the starting point of direct reduction. By investigating the effects of factors such as the MRIRZ and the composition of reducing gas injected into the furnace on point T, a theoretical basis can be provided for optimizing the CHORSF ironmaking process parameters. The operating line diagram of CHORSF plotted according to the corresponding parameters is shown in Figure 5.
Figure 5.
Operating line diagram of CHORSF.
4. Application Analysis of the Operating Line for the CHORSF
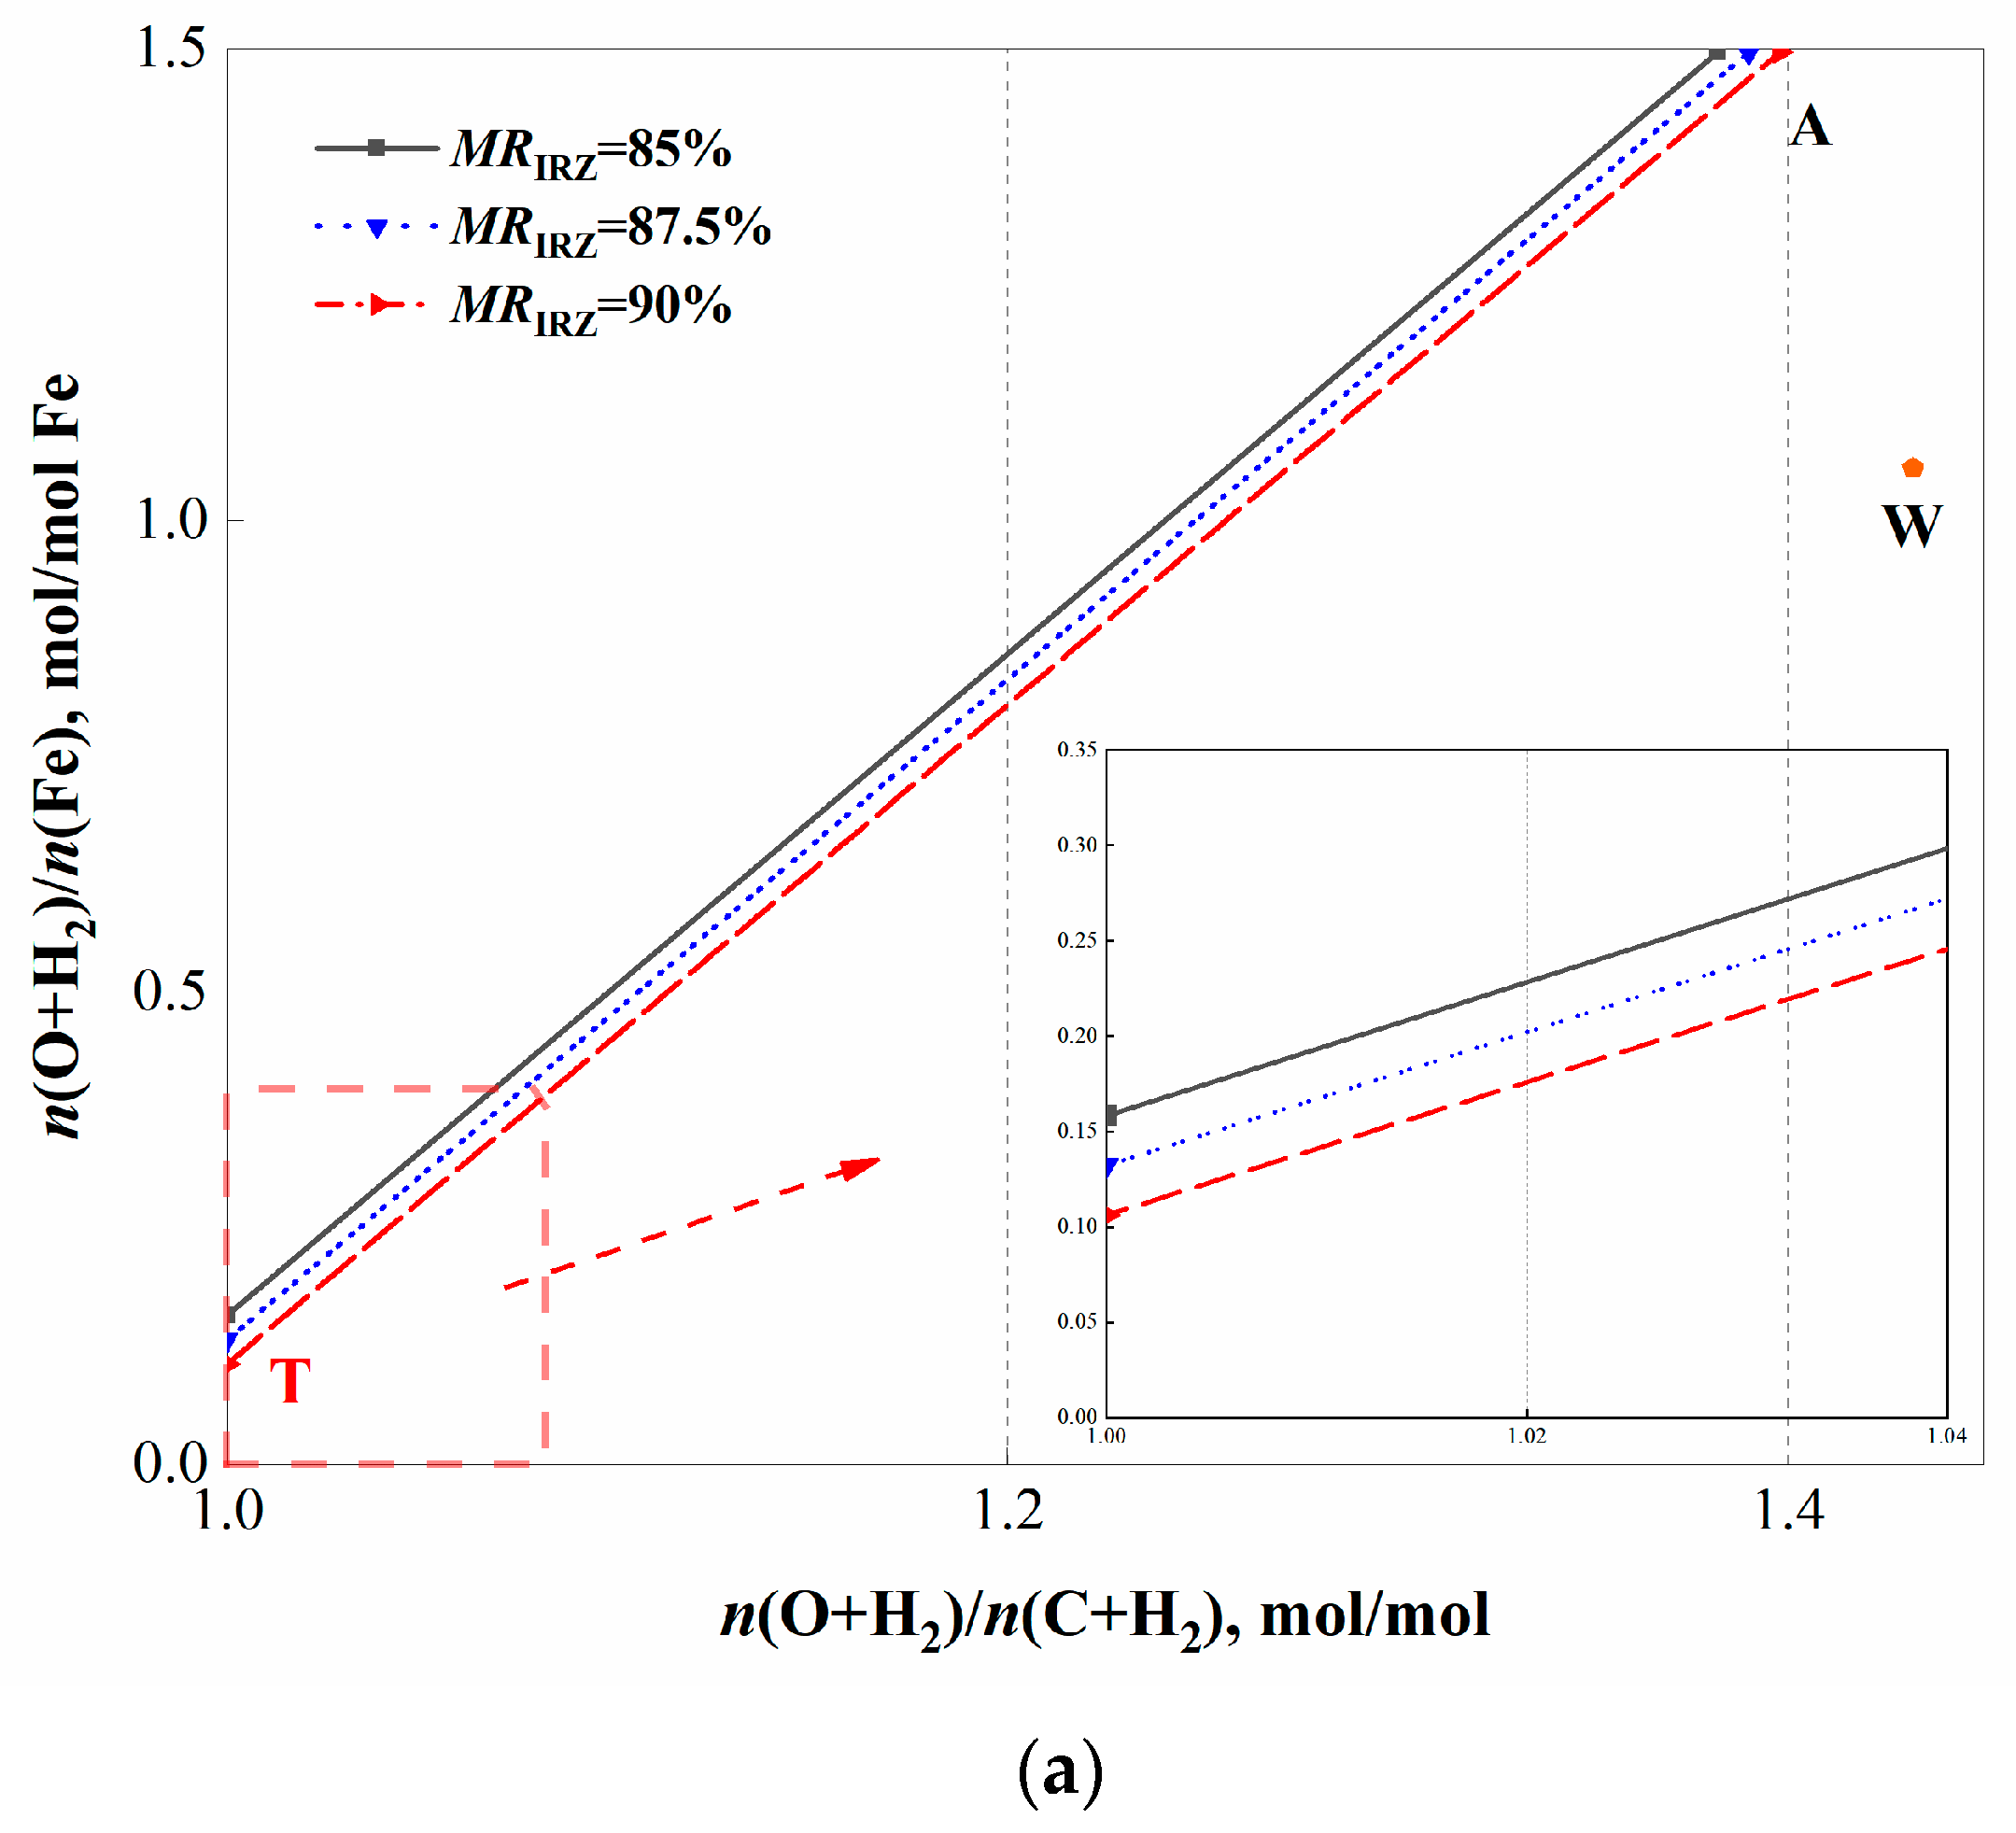
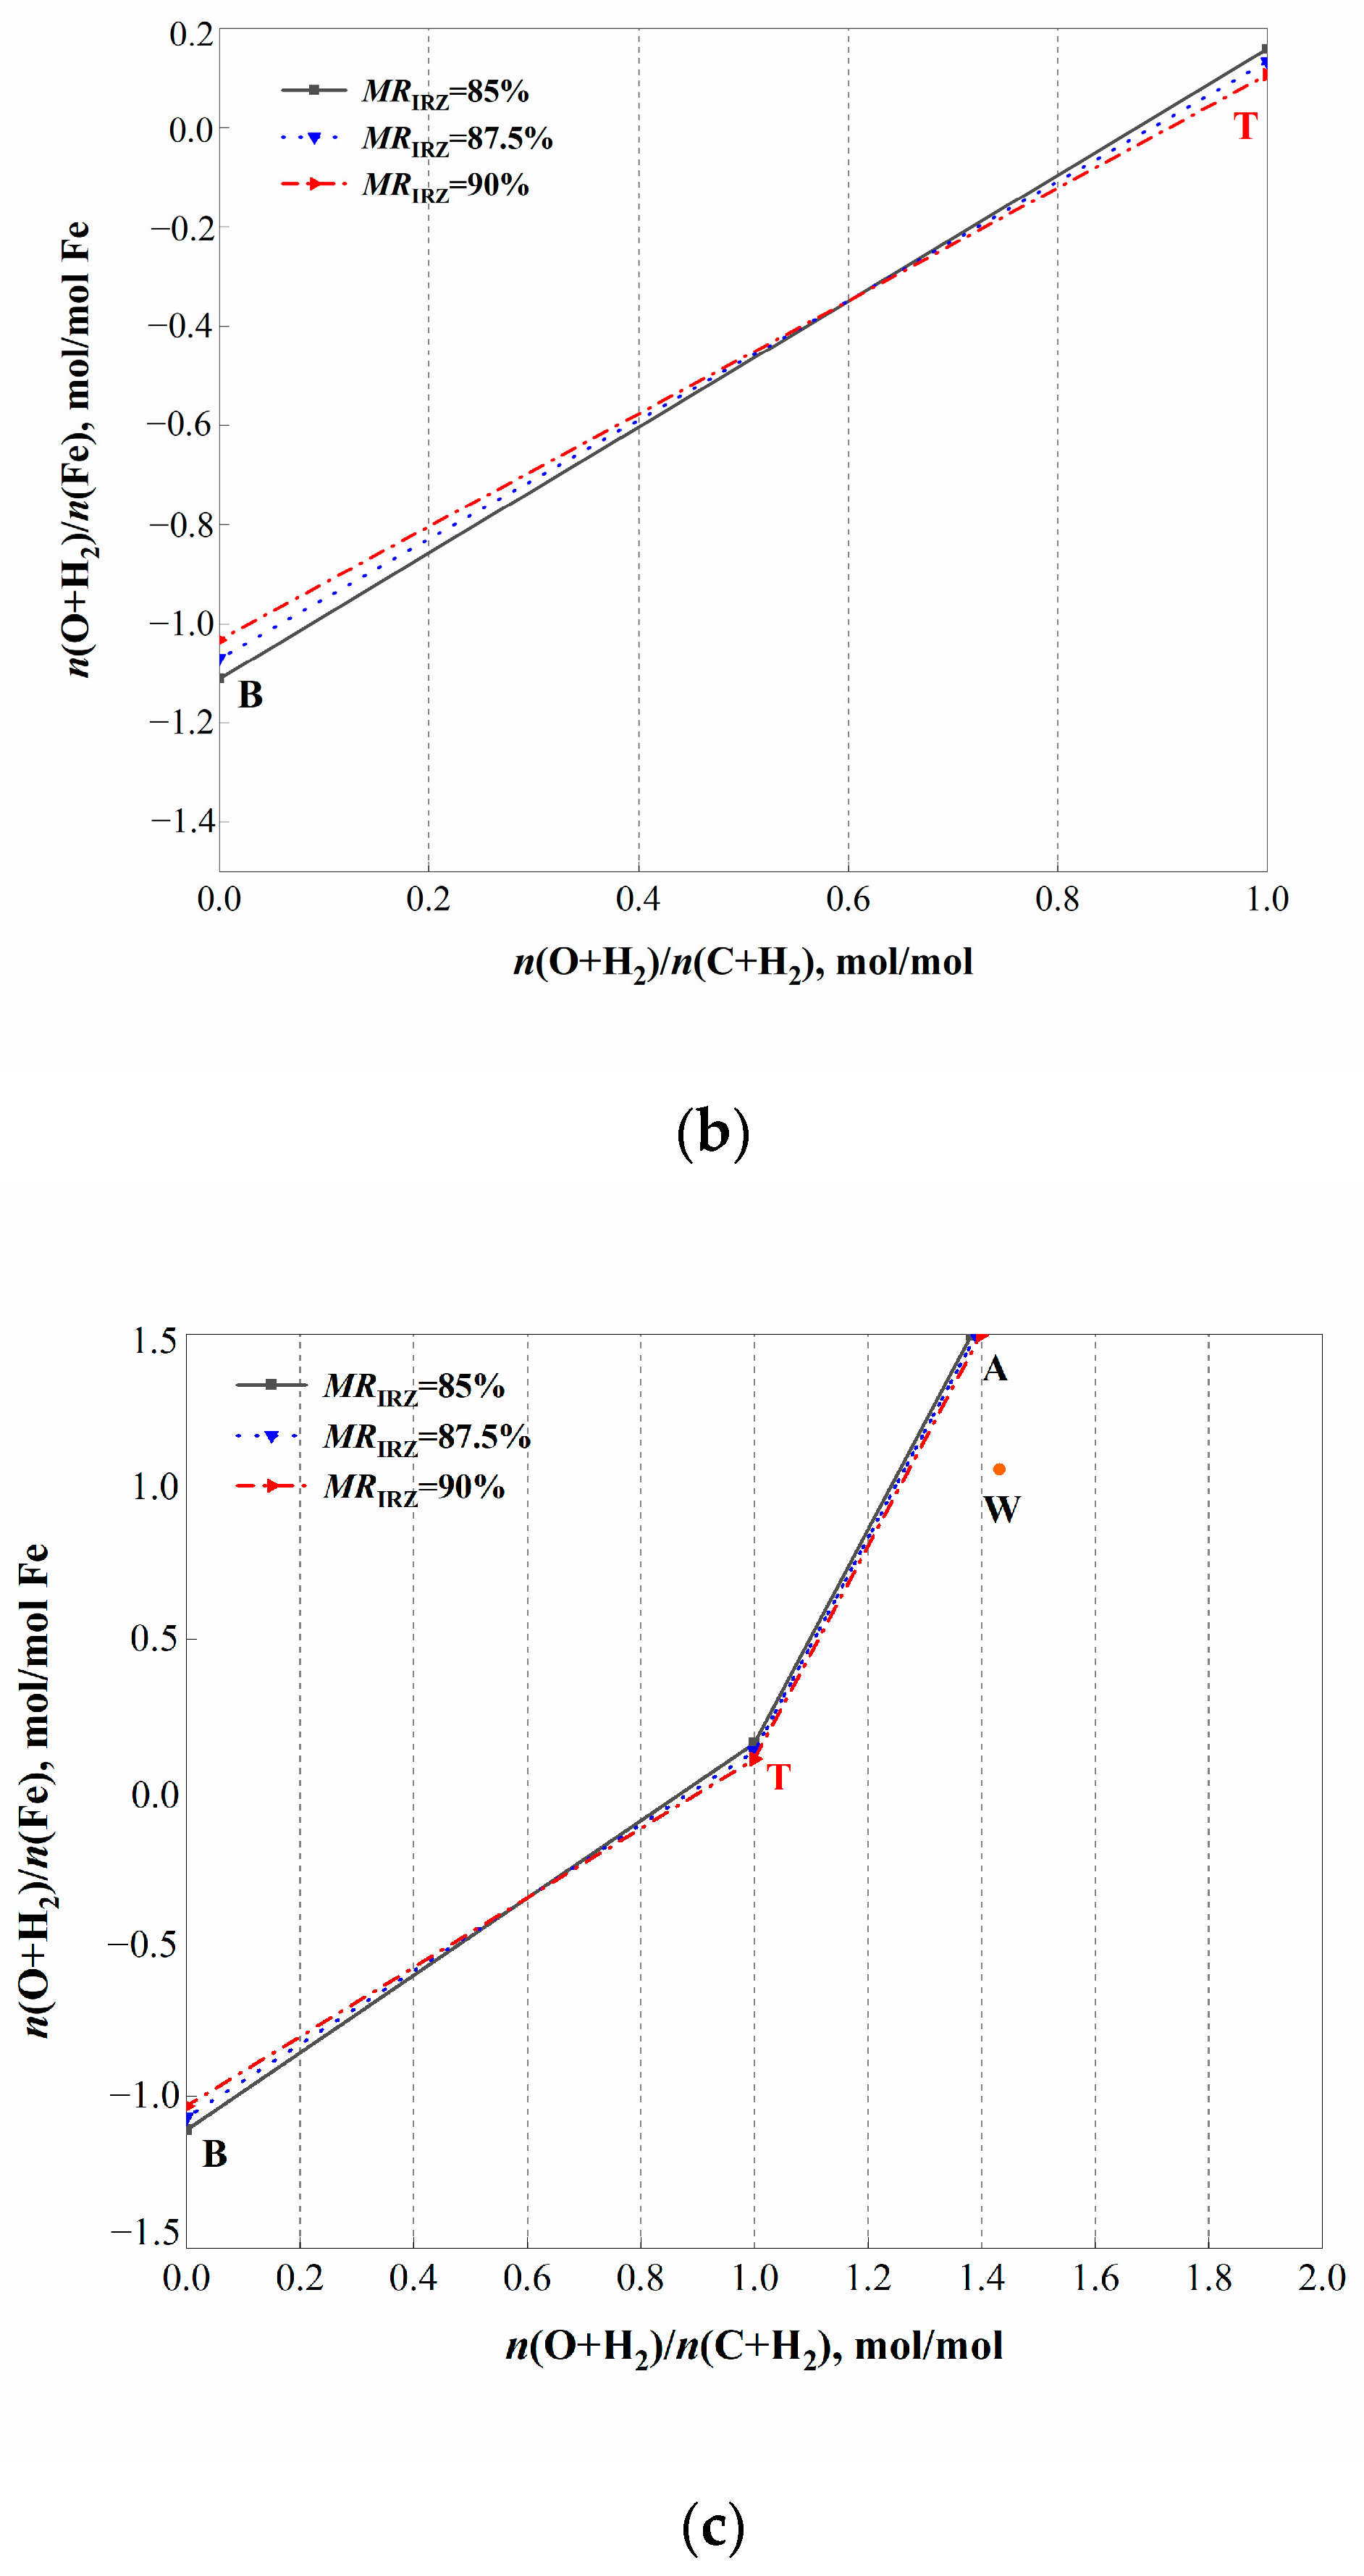
The metallization rate is a critical indicator for evaluating reduction efficiency. The increase in MR in IRZ can reduce the direct reduction of Fe in the SMDZ, thereby reducing the consumption of coke [37]. Studies have demonstrated that when the H2 content in the reducing gas falls below 80%, the reduction rate and efficiency of Fe are constrained, resulting in an MR below 93% [38]. Our team has established one-dimensional [39] and two-dimensional kinetic models [40] for CHORSF, based on the kinetic parameters of ore under a hydrogen-rich reducing gas atmosphere [41]; these studies show that the MRIRZ of CHORSF can reach over 90%. Thus, the MRIRZ were set at 85%, 87.5%, and 90% to investigate the specific effects of the MRIRZ in CHORSF.
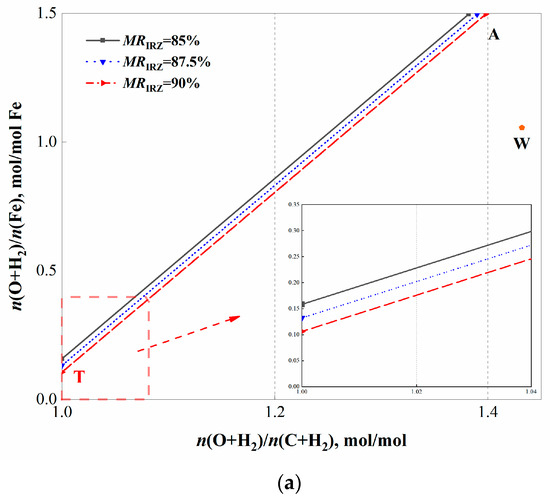
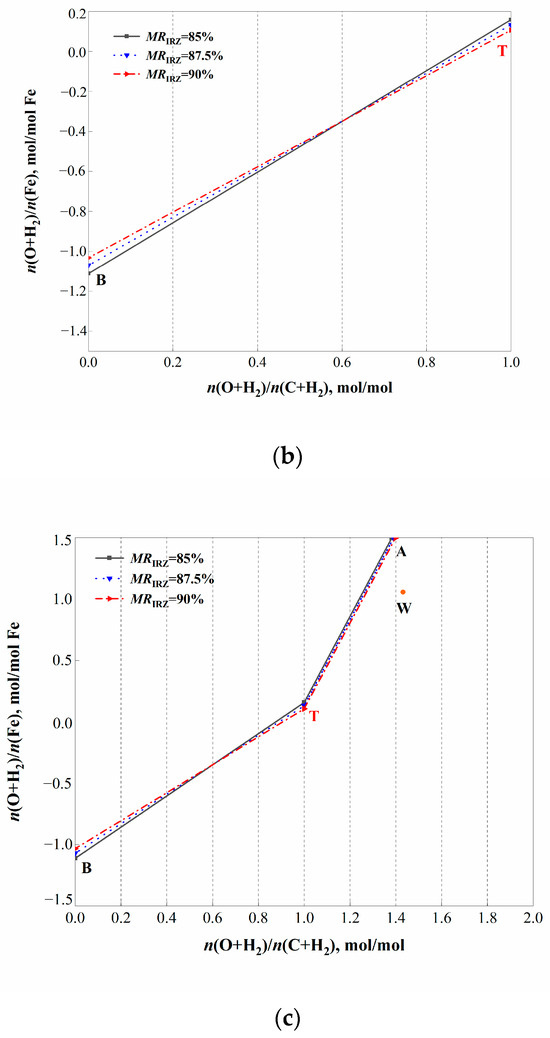
The operating line diagrams under three different MRIRZ are compared in Figure 6.
Figure 6.
Comparison of operating lines for CHORSF under different MRIRZ. (a,b) comparisons between the operating line in the IRZ and the SMDZ of CHORSF under different MRIRZ conditions. (c) comparison of the whole CHORSF operating line under different MRIRZ condition.
Figure 6a,b respectively show comparisons between the operating line in the IRZ and the SMDZ of CHORSF under different MRIRZ conditions, and Figure 6c presents the comparison of the whole CHORSF operating line under different MRIRZ conditions. The key parameters under different MRIRZ conditions are shown in Table 9.
Table 9.
Comparison of key parameters under different MRIRZ.
As shown in Table 9, when the MRIRZ increases from 85% to 90%, the slope of the actual operating line in the CHORSF IRZ () increases by 0.018 mol/mol Fe, corresponding to an increase of 7.2 Nm3 of reducing gas consumption per ton of hot metal. This indicates that a higher MRIRZ requires more reducing gas to achieve a higher FeO conversion rate in the IRZ. In addition, for every 1% increase in the MRIRZ, the slope of the TB operating line in the SMDZ decreases by 0.0256 mol/mol Fe, corresponding to a reduction of 5.94 kg/t HM in the coke ratio. With the increase in MRIRZ, the amount of FeO entering the SMDZ decreases, resulting in reduced coke consumption in the SMDZ. This result indicates that the coke ratio of CHORSF can be reduced by increasing the MRIRZ appropriately. From an industrial perspective, the MRIRZ is typically in the range of 80% to 90%, so its influence is relatively significant.
As for the trade-off between reducing gas consumption and coke rate, it should be determined according to the carbon emission regulations of different countries, while also seeking optimization and balance between the economy and the environment by considering the costs of hydrogen production and coke.
Under MRIRZ conditions of 85–90%, the CO2 emissions per ton of iron from the CHORSF process and the CO2 captured and stored by CCUS are summarized in Table 9. The CO2 emissions per ton of iron from BFs are approximately 1.4–2.08 t CO2/tHM [24]. Compared with BFs, the CHORSF process can reduce CO2 emissions by 34–60% without CCUS; with CCUS, the reduction increases to approximately 40–70%.
5. Conclusions
In this paper, an operating line suitable for the CHORSF is established by the zone. Through analyzing its process characteristics, the purpose of optimizing and evaluating the carbon-saving potential of the process is achieved. The main conclusions are as follows:
- (1)
- The slope of the AT line in the IRZ of CHORSF () represents the actual consumption of reducing gas required for reducing iron oxides per mole of Fe. The slope of the A′T line of IRZ in the CHORSF () represents the theoretical minimum reducing gas required for reducing iron oxides per mole of Fe. Under the smelting conditions in this study, the reducing gas consumption of CHORSF is 1200–1400 Nm3/tHM.
- (2)
- The slope of the TB operating line in the SMDZ of CHORSF () can be used to quantify the coke ratio; the coke consumption of CHORSF can be reduced through measures such as pulverized coal injection and increasing the temperature of the gas entering the furnace (CO+H2).
Under the smelting conditions described in this study, when the MRIRZ increases from 85% to 90%, the in the CHORSF IRZ increases by 0.018 mol/mol Fe, corresponding to an increase of 7.2 Nm3/t HM in reducing gas consumption per ton of hot metal. In addition, for every 1% increase in the MRIRZ, the coke ratio decreases by 5.94 kg/t HM. Thus, increasing the MRIRZ enables the simultaneous reduction in the coke ratio.
Author Contributions
Conceptualization, J.L. (Jiangzilin Liu) and Z.L.; methodology, Z.L.; software, Z.L. and J.L. (Jiayu Luo); validation, J.L. (Jiangzilin Liu) and Z.L.; formal analysis, J.L. (Jiangzilin Liu) and Z.L.; investigation, J.L. (Jiangzilin Liu), J.L. (Jiayu Luo) and X.L.; data curation, J.L. (Jiangzilin Liu), Z.L., J.L. (Jiayu Luo) and X.L.; writing—original draft preparation, J.L. (Jiangzilin Liu) and Z.L.; writing—review and editing, J.L. (Jiangzilin Liu) and Z.L.; visualization, J.L. (Jiangzilin Liu), J.L. (Jiayu Luo) and X.L.; supervision, Z.L. All authors have read and agreed to the published version of the manuscript.
Funding
This research was funded by [National Key R&D Program of China] grant number [No.2023YFB4204000] And The APC was funded by [No.2023YFB4204000].
Data Availability Statement
The original contributions presented in this study are included in the article. Further inquiries can be directed to the corresponding author(s).
Conflicts of Interest
The authors declare no conflict of interest.
Nomenclature
| CHORSF | Reduction smelting furnace with carbon-cycling, hydrogen-rich, pure-oxygen |
| BF | Blast furnace |
| CCUS | Carbon capture, utilization, and storage |
| IRZ | Indirect reduction zone |
| SMDZ | Softening–melting–dripping zone |
| DRI | Direct reduced iron |
| Distribution ratio of sulfur in the top gas, 5% | |
| Methane production ratio, 1% | |
| R2 | Binary basicity, R2 = 1.15 |
| E | Top-gas reduction potential, E ≥ 1.22 |
| tHM | Tonne of hot metal |
| MRIRZ | Metallization rate of the ore at the bottom of IRZ |
| Composition of the reducing gas, % | |
| Mass fraction of FexO in ore at the bottom of the IRZ | |
| Top gas composition of the furnace, % | |
| Slope of line AT | |
| Slope of line A′T | |
| Slope of TB |
References
- Zhong, Z.; Wang, X.; Zhang, Q.; Ji, Y. Analysis of Energy Consumption and Carbon Emissions in Blast Furnaces: Formation Mechanisms and Optimization Strategies. Metall. Mater. Trans. B 2026, 57, 2592–2608. [Google Scholar] [CrossRef] [Scilit]
- Nishioka, K.; Ujisawa, Y.; Tonomura, S. Sustainable Aspects of CO2 Ultimate Reduction in the Steelmaking Process (COURSE50 Project), Part 1: Hydrogen Reduction in the Blast Furnace. Sustain. Metall. 2016, 2, 200–208. [Google Scholar] [CrossRef] [Scilit]
- Schleicher, S.; Kettner-Marx, C.; Köppl, A. Analysis of Options to Move Beyond 20 Percent Greenhouse Gas Emission Reductions. Policy Brief Addressing the EC Communication on More Ambitious Greenhouse Gas Reductions; Österreichisches Institut für Wirtschaftsforschung: Vienna, Austria, 2011. [Google Scholar]
- Watakabe, S.; Miyagawa, K.; Matsuzaki, S. Operation Trial of Hydrogenous Gas Injection of COURSE50 Project at an Experimental Blast Furnace. ISIJ Int. 2013, 53, 2065–2071. [Google Scholar] [CrossRef] [Scilit]
- Li, H.; Xia, Y.H.; Meng, Q.Y.; Bai, H.; Xia, Y.J. Effect of Applying a Full Oxygen Blast Furnace on Carbon Emissions Based on a Carbon Metabolism Calculation Model. High Temp. Mater. Process. 2024, 14, 1230. [Google Scholar] [CrossRef] [Scilit]
- Miškovičová, Z.; Legemza, J.; Demeter, P.; Buľko, B.; Hubatka, S.; Hrubovčáková, M.; Futáš, P.; Findorák, R. An Overview Analysis of Current Research Status in Iron Oxides Reduction by Hydrogen. Metals 2024, 14, 589. [Google Scholar] [CrossRef] [Scilit]
- Liu, W.G.; Zuo, H.B.; Wang, J.S.; Xue, Q.G.; Ren, B.L.; Yang, F. The Production and Application of Hydrogen in Steel Industry. Int. J. Hydrogen Energy 2021, 46, 10548–10569. [Google Scholar] [CrossRef] [Scilit]
- Li, J.; Kuang, S.B.; Evans, T.; Song, S.; Yu, A.B. Hydrogen Injection in Blast Furnaces: Effects of Hydrogen Injection Temperature under Various Injection Conditions. Fuel 2026, 40, 136667. [Google Scholar] [CrossRef] [Scilit]
- Barrett, N.; Mitra, S.; Doostmohammadi, H.; O’Dea, D.; Zulli, P.; Chew, S.; Honeyands, T. Assessment of Blast Furnace Operational Constraints in the Presence of Hydrogen Injection. ISIJ Int. 2022, 62, 1168–1177. [Google Scholar] [CrossRef] [Scilit]
- Liu, J.Z. Basic Research on Shaft Gas and Recycled Gas Behavior in Oxygen Blast Furnace. Ph.D. Thesis, University of Science and Technology Beijing, Beijing, China, 2015. (In Chinese) [Google Scholar]
- Zhang, Z.D.; Tang, J.; Chu, M.S. Smelting Behavior and Carbon Reduction Potential of Blast Furnace with the Operation of Top Gas Recycling in China: Effect of Theoretical Combustion Temperature. ISIJ Int. 2025, 65, 2135–2147. [Google Scholar] [CrossRef] [Scilit]
- Yu, Y.; Wang, X.D.; Luo, Z.G. Low-Carbon Ironmaking System and Method in Reduction and Smelting Furnace with Pure Oxygen and Hydrogen-Rich. China Patent ZL 200210084753.X, 31 January 2023. (In Chinese) [Google Scholar]
- Rist, A.; Meysson, N. A Dual Graphic Representation of the Blast-Furnace Mass and Heat Balances. JOM 1967, 19, 50–59. [Google Scholar] [CrossRef] [Scilit]
- Du, R.S. A Study on the Appropriate Method for Incorporating H2 Effects into the Blast Furnace Operating Line Diagram. In Proceedings of the Chinese Academic Annual Conference on Ironmaking, Wuhan, China, 14–17 April 1986. [Google Scholar]
- Ono, Y. Rist Operating Diagram (II). Tetsu-to-Hagané 1993, 79, N711–N715. [Google Scholar] [CrossRef] [Scilit]
- Ujisawa, Y.; Nakano, K.; Matsukura, Y. Subjects for Achievement of Blast Furnace Operation with Low Reducing Agent Rate. ISIJ Int. 2005, 45, 10. [Google Scholar] [CrossRef] [Scilit]
- Manuel, B. Comparing different syngas for blast furnace ironmaking by using the extended operating line methodology. Fuel 2023, 333, 126533. [Google Scholar]
- Zhang, X.H.; Wang, N.; Li, H.F. Operation Window and Carbon Emission of the Blast Furnace with Natural Gas and Pulverized Coal Co-injection. ISIJ Int. 2025, 65, 202–213. [Google Scholar] [CrossRef] [Scilit]
- Sun, M.M.; Pang, K.L.; Gu, Z.Y.; Shao, S.W. Analysis of the Theory and Practice of Hydrogen-Enriched Blast Furnace Ironmaking. Int. J. Hydrogen Energy 2025, 127, 702–716. [Google Scholar] [CrossRef] [Scilit]
- Srishilan, C.; Vivek, A.; Shukla, A.K. Operating Line Prediction of COREX Iron-making Process Using RIST Diagram. ISIJ Int. 2020, 60, 656–661. [Google Scholar] [CrossRef] [Scilit]
- Du, R.L.; Wu, K.; Zhan, W.L. Application of the Rist Operating Line in Analyzing Energy Consumption of the COREX Shaft Furnace. J. Process Eng. 2013, 13, 94–98. (In Chinese) [Google Scholar]
- Zhan, W.L.; Wu, K.; He, Z.J. Estimation of Energy Consumption in COREX Process Using a Modified Rist Operating Diagram. ISIJ Int. 2015, 22, 1078–1084. [Google Scholar] [CrossRef] [Scilit]
- Zhan, W.L.; Wu, K.; Fu, P. Establishment and Application of the Rist Operating Line for the COREX Molten Gasification Furnace. Univ. Sci. Technol. Beijing 2013, 35, 448–453. (In Chinese) [Google Scholar]
- Li, H.F.; Chen, J.R.; Luo, Z.G. Development of Mass–Energy Balance Model Based on a New Process of RSF with Hy-O-CR. Metals 2024, 14, 127. [Google Scholar] [CrossRef] [Scilit]
- Seiji, N. “COURSE50”—CO2 Ultimate Reduction System for Cool Earth 50: CO2 Ultimate Reduction in Steelmaking Process by Innovative Technology in Japan. In Treatise on Process Metallurgy; Elsevier: Amsterdam, The Netherlands, 2025; pp. 231–244. [Google Scholar]
- Li, M.; Li, Z.; Li, C. CFD-DEM study on the raceway transport phenomena and thermo-chemical behaviors in a three-dimensional blast furnace: Effects of process parameters. Fuel 2024, 377, 132778. [Google Scholar] [CrossRef] [Scilit]
- Zhang, S.; Jiang, D.W.; Wang, Z.Y. Predictive Modeling of the Hot Metal Sulfur Content in a Blast Furnace Based on Machine Learning. Metals 2023, 13, 288. [Google Scholar] [CrossRef] [Scilit]
- Zhang, S.; Liu, X.H.; Hou, Y. Fluidity and structure of aluminate slags for smelting high-alumina iron ores: Effect of CaO/SiO2 mass ratio. J. Non-Cryst. Solids 2024, 646, 123264. [Google Scholar] [CrossRef] [Scilit]
- Tian, X.; Zhou, H.; Huang, J. Numerical simulation of the effect of φ(CO):φ(H2) on the reaction process in a direct reduction shaft furnace. Steel Res. Int. 2024, 59, 34–40. [Google Scholar]
- Manuel, B.; Takao, N.; Ryoma, K. Revisiting the Rist diagram for predicting. Open Res. Eur. 2021, 1, 141. [Google Scholar] [CrossRef] [Scilit]
- Li, H.F.; Chen, J.R. An Analysis of Long-Process Ironmaking in a Reduction Smelting Furnace with Hydrogen-Enriched Conditions. Metals 2023, 13, 1756. [Google Scholar] [CrossRef] [Scilit]
- Zhang, X.S.; Luo, Z.G.; Zou, Z.S. Numerical Analysis on Performance of COREX CGD Shaft Furnace with Top Gas Recycling. ISIJ Int. 2019, 59, 1972–1981. [Google Scholar] [CrossRef] [Scilit]
- Shahabuddin, M.; Rahbari, A.; Sabah, S. Process Modelling for the Production of Hydrogen-Based Direct Reduced Iron in Shaft Furnaces Using Different Ore Grades. Ironmak. Steelmak. 2025, 52, 36. [Google Scholar] [CrossRef] [Scilit]
- Ji, Y.Z.; Chi, Z.Y.; Yuan, S.F.; Chen, Y.X.; Li, Y.J.; Jiang, T.C.; Liu, X.; Zhang, W.J. Development and Application of Hydrogen-Based Direct Reduction Iron Process. Processes 2024, 12, 1829. [Google Scholar] [CrossRef] [Scilit]
- Yu, Y.; Wang, F.; Hao, X.D.; Liu, H.P.; Wang, B.; Gao, J.J.; Qi, Y.H. Multiphysics Modelling and Optimization of Hydrogen-Based Shaft Furnaces: A Review. Processes 2025, 14, 138. [Google Scholar] [CrossRef] [Scilit]
- Kumar, P.P.; Gupta, D.; Naha, T.K.; Gupta, S.S. Factors Affecting Fuel Rate in Corex Process. Ironmak. Steelmak. 2006, 33, 293–298. [Google Scholar] [CrossRef] [Scilit]
- Dong, K.; Wang, H.; Jiang, Z. Direct Reduction Iron Process; Springer: Singapore, 2023. [Google Scholar]
- Zhou, H.M.; Hao, X.D.; Zhang, S.M. Development and Practical Application of Pure Hydrogen Metallurgy Technology by China Iron & Steel Research Institute Group. China Metal. 2025, 35, 65–76. (In Chinese) [Google Scholar]
- Xing, R.F.; Luo, Z.G.; Wang, X.; Li, H.F.; Zou, Z.S. Numerical simulation of gas-solid heat and mass transfer behavior in the full oxygen hydrogen-rich reduction melting furnace. Metall. Res. Technol. 2025, 122, 507. [Google Scholar] [CrossRef] [Scilit]
- Tian, X.; Luo, Z.G.; Zhou, H.; Li, H.F.; Wang, X.A.; Kou, M.Y.; Wu, S.L.; Zou, Z.S. Numerical Simulation of the Inner Characteristics in a Hydrogen-Rich Low-Carbon Reduction Smelting Furnace. J. Sustain. Metall. 2024, 10, 2032–2046. [Google Scholar] [CrossRef] [Scilit]
- Xu, H. COREX Pre-Reduction Shaft Furnace and Carbon-Based Packed Bed: Numerical Simulation. Ph.D. Thesis, Northeastern University, Shenyang, China, 2008. [Google Scholar]

Disclaimer/Publisher’s Note: The statements, opinions and data contained in all publications are solely those of the individual author(s) and contributor(s) and not of MDPI and/or the editor(s). MDPI and/or the editor(s) disclaim responsibility for any injury to people or property resulting from any ideas, methods, instructions or products referred to in the content. |
© 2026 by the authors. Licensee MDPI, Basel, Switzerland. This article is an open access article distributed under the terms and conditions of the Creative Commons Attribution (CC BY) license.