


Abstract
The microstructure of Ti-Al-Si coatings prepared by direct laser deposition (DLD) requires further refinement and homogenization to enhance coating performance. In this study, an electrostatic field (EF) was introduced to assist the DLD process, and a thermal-flow-electrical multiphysics coupling model was established using COMSOL Multiphysics 6.3 software. The solidification behavior of the molten pool under the EF was investigated, focusing on the mechanism by which the EF influences the nucleation and growth of grains and reinforcing phases. Experimental results revealed that the external EF disrupted the molten pool flow, thereby altering the internal heat dissipation mechanism and affecting the morphology and size of the solidified grains. Under an external EF of 150 V/cm, the coating exhibited the most refined grains, with an average size of 0.417 μm (a 46% reduction non-EF). Concomitantly, the application of the EF increased the concentration of Ti4+ and Si4+ ions at the solid–liquid interface, promoting the formation of a substantial quantity of Ti5Si3 reinforcing phases. The average microhardness of the coating reached 1393 HV0.2, which is 21% higher than that of the coating without an EF. The surface roughness decreased to 0.551 μm, with a minimum wear percentage of 1.4%. Moreover, the EF modified the wear mechanism of the DLD Ti-Al-Si coating. The findings of this study hold scientific significance and practical value for advancing DLD-fabricated high-performance titanium alloy components, offering critical insights into microstructure optimization and process control strategies.
1. Introduction
Direct laser deposition (DLD) has emerged as a novel manufacturing technique for titanium alloy components, finding extensive application in aerospace engineering [1,2]. Driven by the rapid evolution of aerospace technology, the operational performance demands for high-hardness and wear-resistant components have significantly intensified, particularly in critical applications such as next-generation aircraft engines and spacecraft structural systems. In our previous work, a novel composition for high-hardness, wear-resistant Ti-Al-Si coatings was designed, achieving a microhardness exceeding 800 HV0.2 [3], where the Ti5Si3 phase played a significant strengthening role. Gao [4] significantly enhanced the hardness and wear resistance of the coating by incorporating TiC. However, an excess of this reinforcing phase tends to induce coating cracking. Additionally, issues regarding non-uniform microstructures and the need for further grain refinement remain. Addressing these issues would further enhance the performance of this novel DLD titanium alloy coating. Therefore, optimizing the preparation methods for DLD-fabricated high-performance titanium alloy coatings remains imperative [5,6,7].
Recent studies have demonstrated that DLD assisted by coupled physical fields (e.g., magnetic [8,9] and electrostatic [10,11,12]) can effectively refine grains and homogenize microstructures. Bao [13] fabricated thin-walled TC4 titanium alloy components by applying an external magnetic field, showing that the deposition height with the magnetic field was lower than that without it. Moreover, when a magnetic excitation current of 3 A was applied, the maximum grain size of the β phase was reduced by 100 μm. Chen [14] investigated the microstructure and mechanical properties, such as microhardness and tensile properties, of TC4 titanium alloy with and without the assistance of an external magnetic field (EMF). The results indicated that the laser-arc interaction zone (LAIZ) and heat-affected zone (HAZ) expanded, while the laser fusion zone (LFZ) and fusion zone (FZ) changed under the action of the electromagnetic field, leading to an alteration in the microhardness distribution. Ou Yang [15] implemented defect control in DLD 316L stainless steel via electrostatic fields, reducing the proportion of columnar grains by 40% and microhardness fluctuations by 65%. However, studies on introducing an electrostatic field during the DLD preparation of TC4 coatings remain rare, and the evolution of grains and microstructures of DLD coatings under an auxiliary field is still insufficiently understood. This is attributed to the difficulty of completely revealing the mechanisms of multi-physics field interaction processes using conventional experimental methods.
Finite element-based numerical simulations (e.g., ANSYS [16], ABAQUS [17], and COMSOL [18]) are recognized as effective methods for investigating the evolutionary mechanisms of multi-physics fields in DLD. Ma [19] established a coaxial laser-electromagnetic coupling model, showing that electromagnetic field-assisted directed energy deposition (DED) reduces temperature gradients in the TC4 molten pool trailing zone while enhancing tensile properties. Gan [20] developed a 3D thermal-fluid-mass transfer model for DLD, obtaining solidification characteristics through transient thermal distribution to predict the microstructural morphology after solidification. Zhang [21] investigated ultrasonic-assisted laser polishing of TC4 via finite element simulations, elucidating the evolution rules of molten pool depth under ultrasonic excitation through thermal cycling and convective analysis. Liu [22] developed a finite element model to simulate and analyze stress distributions, revealing the mechanism underlying microstructure formation at the interface.
Electrostatic field-assisted DLD significantly alters the thermal behavior of the molten pool by modifying surface tension gradients and fluid dynamics. Existing research confirms that analyzing the electric-thermal-fluid multiphysics mechanism in the DLD process has become an effective technical means to reveal the dynamic evolution laws of the molten pool. A review of the literature reveals that most current studies focus on improving the physical properties of materials primarily by adding different strengthening elements to cast steel or adjusting process parameters. However, research on introducing an electric field during the DLD preparation of TC4 coatings remains relatively limited. To clarify the regulation mechanism of electrostatic fields on the solidification process of DLD coatings, relevant experimental studies were carried out in this work. In this study, Ti-Al-Si coatings were fabricated using electrostatic field-assisted DLD technology, employing COMSOL Multiphysics to simulate the electrostatic field-assisted temperature field and molten pool flow dynamics. Subsequently, the molten pool flow trajectories, solidification behavior, and the regulatory mechanisms of electric field parameters on the microstructures of the fabricated coatings were investigated. The results demonstrate that the synergistic control of physical fields facilitates microstructural homogenization and enhances the strengthening effect of the reinforcing phase, thereby leading to excellent microhardness and wear resistance of the Ti-Al-Si coatings. Furthermore, these findings offer valuable insights into the synergistic control strategies of physical fields governing microstructure evolution during laser additive manufacturing.
2. Experimental Materials and Methods
2.1. Coating Preparation Method
TC4 titanium alloy was utilized as the substrate material for direct laser deposition (DLD) and machined into standard specimens (150 mm × 30 mm × 20 mm). The deposited powder was a Ti-Al-Si alloy (TC4 + 15 wt.% Si) with a particle size distribution of 70–100 μm.
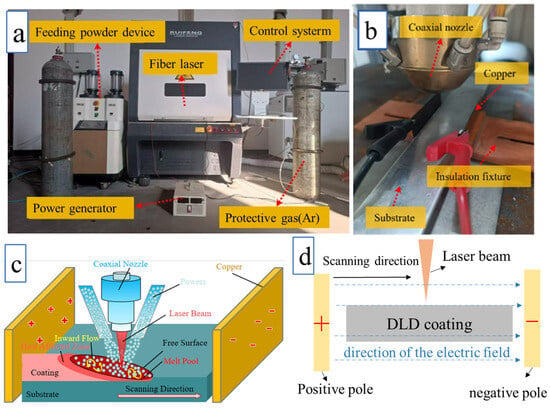
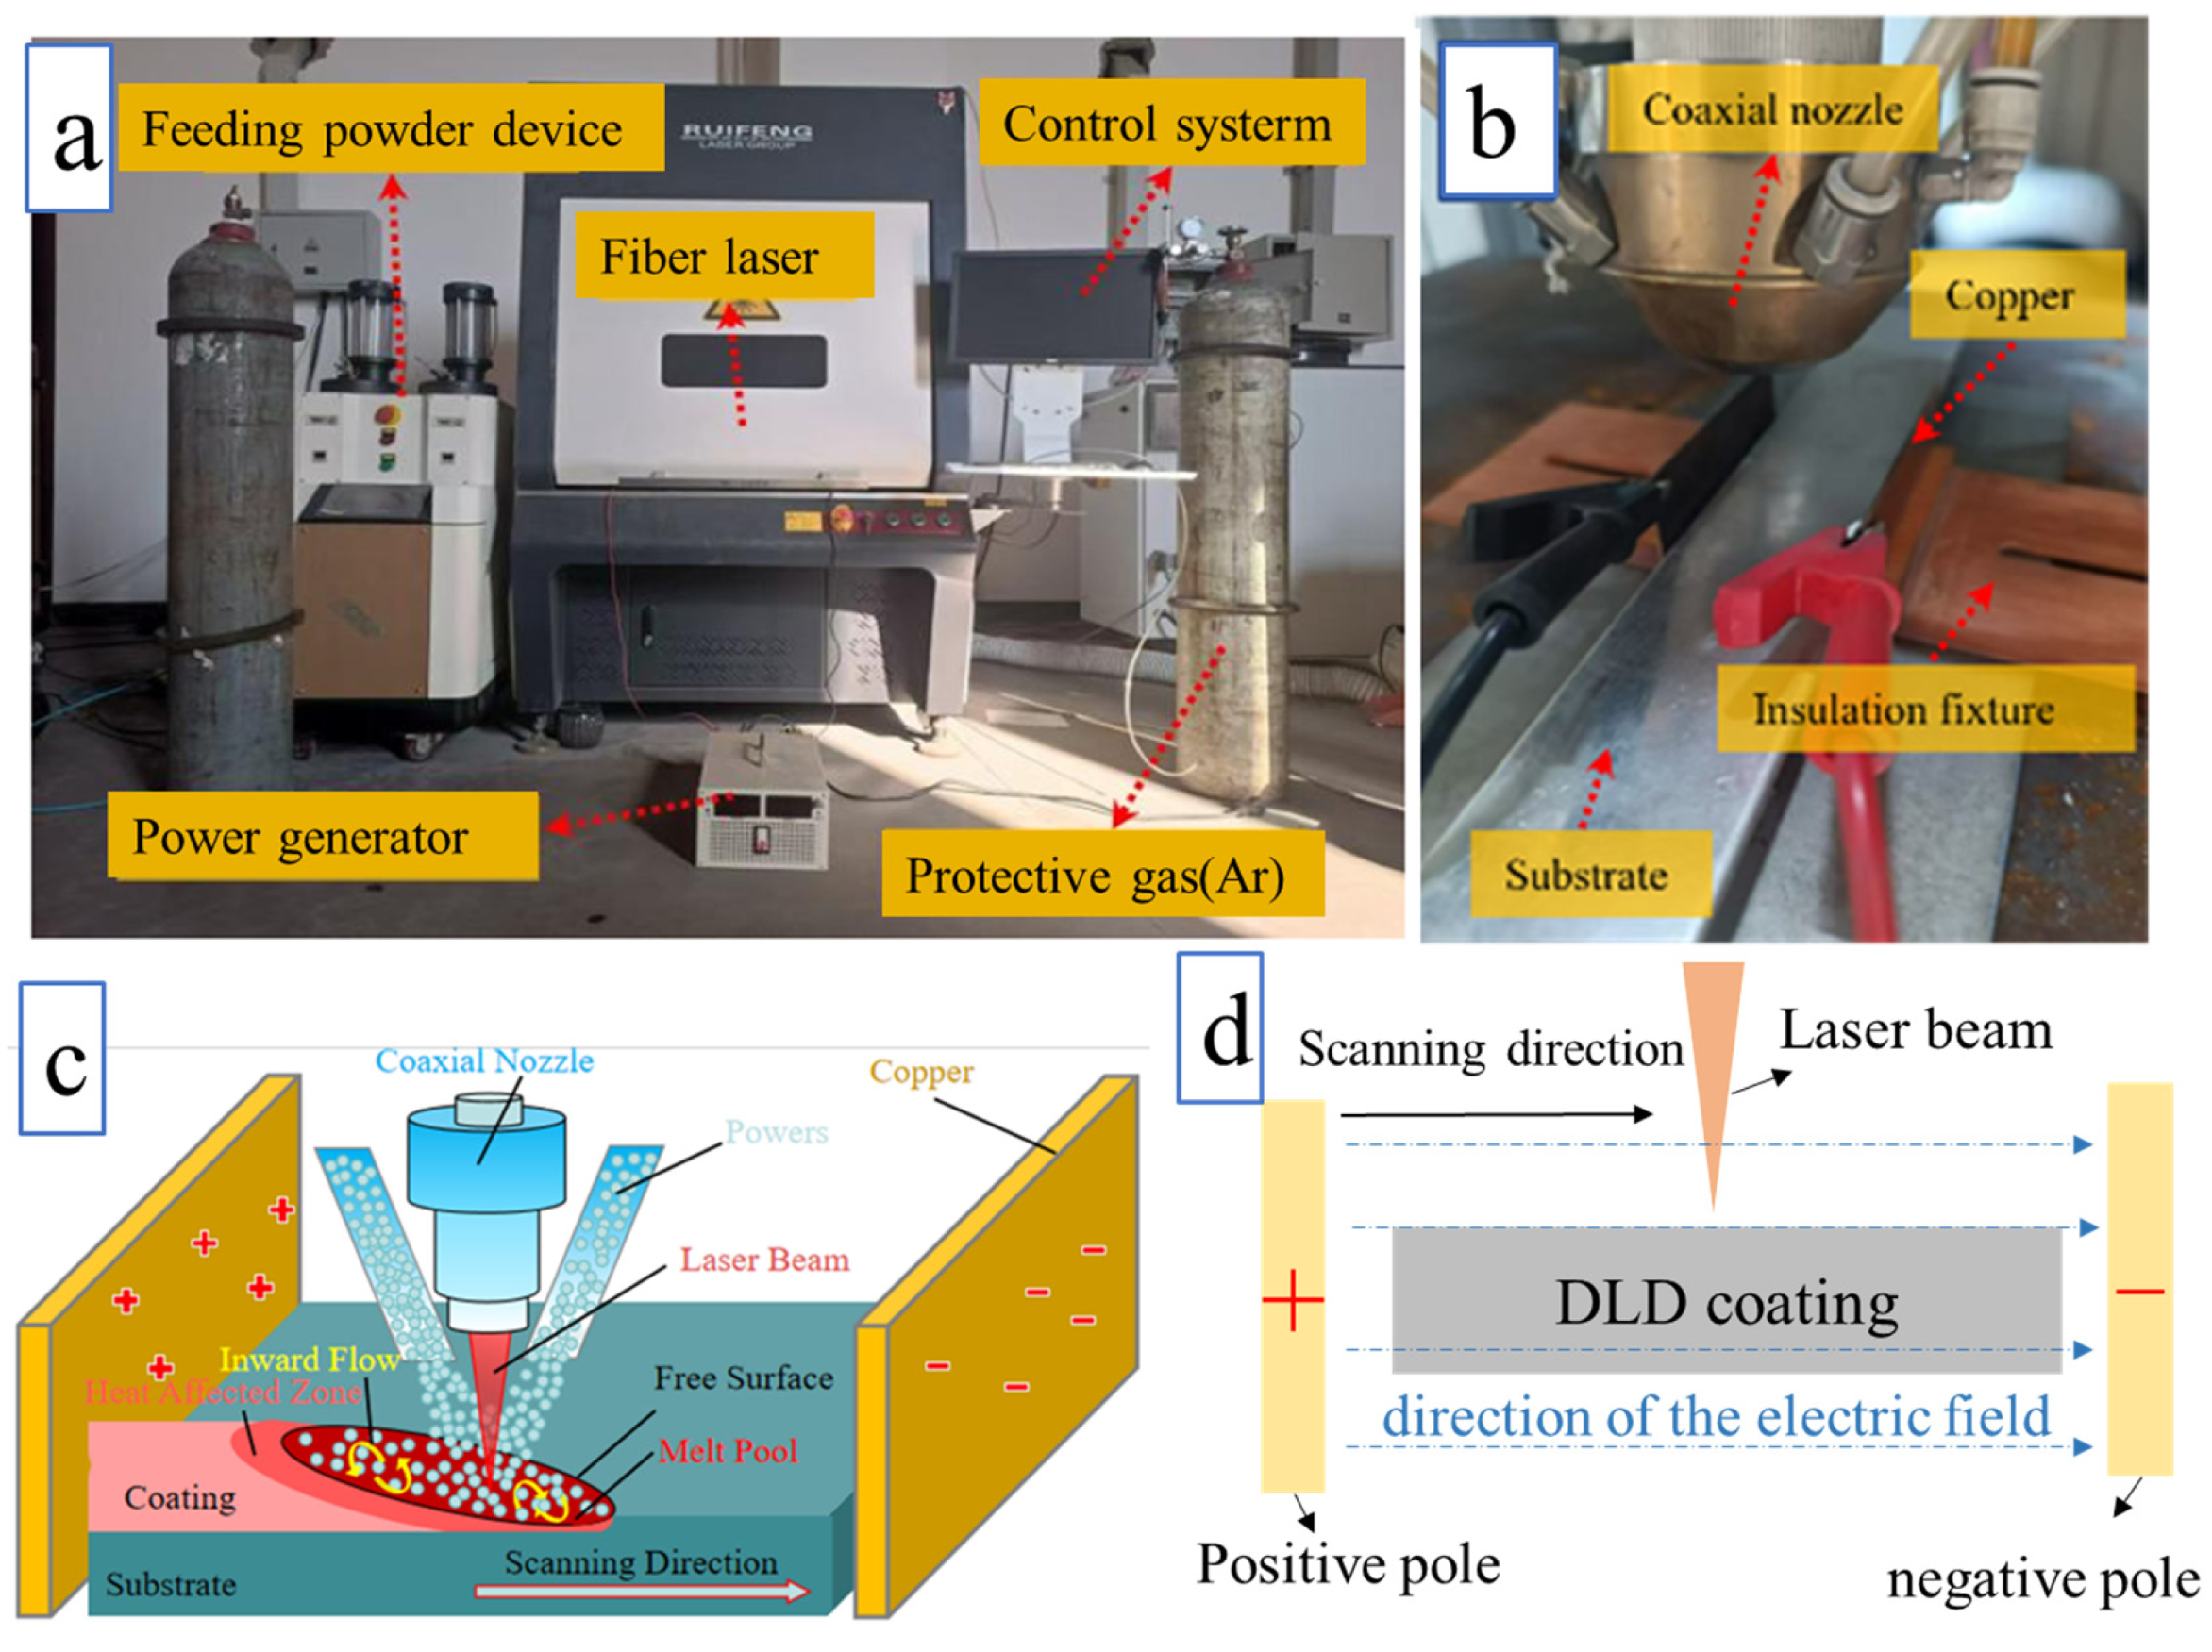
The DLD system employed an IPG YLS-1000 fiber laser (wavelength: 1070 nm; spot diameter: 2 mm), while electrostatic field assistance was implemented using a Zongjie ZJ-3000–1000 power supply (Greenery Tools Co., Ltd., Yan Tai, China) (output: 3000 W, 1000 V), as illustrated in Figure 1a. The electrostatic setup comprised a power supply, wiring, and copper electrode plates. Copper electrodes (75 mm × 25 mm × 1 mm) were installed on both sides of the substrate using insulated fixtures (Figure 1b) and connected to the positive and negative terminals of the power supply. The DLD processing parameters were optimized using the controlled variable method to determine the optimal conditions; the detailed parameters are listed in Table 1. Figure 1c illustrates the electrostatic field-assisted DLD process. Figure 1d Schematic of DLD process with electrostatic field assistance, the yellow squares represent the positive and negative electrodes, and the applied direction of the electric field is parallel to the laser scanning direction. Six groups of Ti-Al-Si coatings were fabricated under varying electrostatic field intensities (0, 50, 100, 150, 200, and 250 V/cm).
Figure 1.
The electrostatic field-assisted DLD: (a) equipment, (b) application of electrostatic field, (c) electrostatic field-assisted DLD process, (d) schematic of DLD process with electrostatic field assistance.
Table 1.
DLD processing parameters.
2.2. Characterization Method
Phase analysis of the six sample groups was conducted using an Empyrean X-ray diffractometer (XRD) with Cu-Kα radiation (λ = 0.15406 nm), a scanning rate of 5°/min, and a diffraction angle range of 20–90°. After etching with an HF:HNO3:H2O = 1:1:18 (vol.%) solution for approximately 8 s, the samples were ultrasonically cleaned. Low-magnification microstructure observations were performed using a Leica DM2700M (Zeiss, Germany) inverted metallurgical microscope. Microstructural analysis and EDS mapping of elemental distributions across the coating regions were carried out using a Sigma 500 field-emission scanning electron microscope (FE-SEM) (Rigaku Corporation, Tokyo, Japan). Electron backscatter diffraction (EBSD) was employed to characterize the coating textures, crystallographic phases, and preferred orientations.
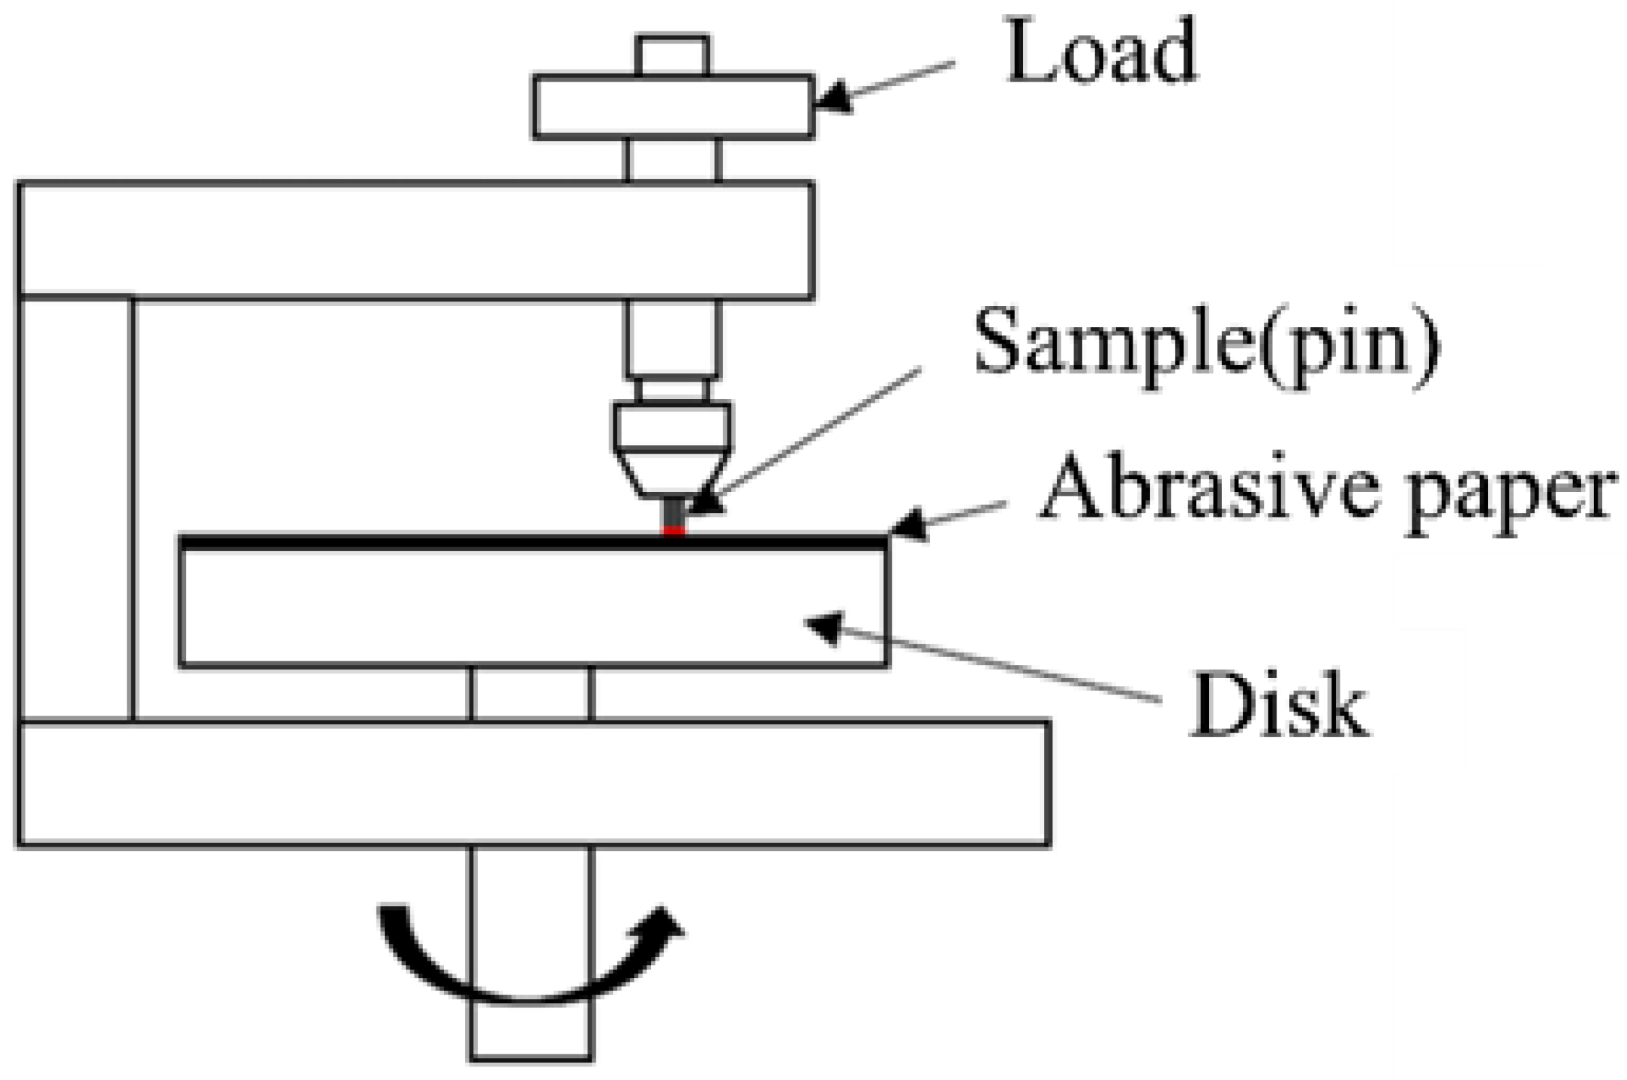
Microhardness testing was performed using a DHV-1000AV tester (Zeiss, Germany) under a 2 N load (10 s dwell time), complying with ISO 6507 [23] by taking three indentations along the deposition direction. The wear resistance of the Ti-Al-Si coatings was evaluated using a pin-on-disk abrasive wear tester (Figure 2), with the detailed parameters listed in Table 2. Volume wear percentages were calculated based on mass loss using Equation (1):
where M and m are the sample masses before and after wear testing, respectively. Three-dimensional surface topography was reconstructed using a HYBRID C 3 triple-laser confocal microscope (Ogawa Seiki (Beijing) Trading Co., Ltd., Beijing, China). All experiments in this study were performed in triplicate, and the reported hardness and wear percentage values represent the average of the three tests. This approach was adopted to minimize random error.
Figure 2.
Pin disk two-body abrasive wear testing machine.
Table 2.
Wear test parameters.
3. Mathematical Model
A mathematical model integrating heat transfer, fluid flow, electrostatic field, and dynamic mesh was developed for the DLD process, with the following assumptions adopted [24,25,26,27,28,29,30]:
- (1)
- A uniform electric field distribution within the computational domain, neglecting edge effects and nonuniformity induced by charge redistribution;
- (2)
- A Gaussian-distributed laser heat input applied to the molten pool surface;
- (3)
- Full participation of injected powder in coating formation, disregarding the thermal flux of incoming powder and evaporation losses;
- (4)
- Incompressible fluid flow within the molten pool, with the influence of shielding gas on the molten pool neglected.
3.1. Governing Equation
Mass-conservation equation:
Momentum conservation equation:
where is the density (g/cm3), is the velocity vector; is the fluid pressure (Pa), is the representative matrix, is the dynamic viscosity of liquid metal (Pa⋅s), is the buoyancy force (N), and is the temperature (K), calculated as (4):
where is the volumetric expansion coefficient (1/K), is the molten pool temperature (K), is the melting temperature (K), is the gravitational acceleration (m/s2), and is the viscous resistance force (N), calculated as (5):
where is the mushy zone coefficient, is the Liquid fraction in the mushy zone, and is the small constant (τ = 0.001) to avoid division by zero. The liquid fraction θ is defined as (6):
where is the solidus temperature (K), and is the liquidus temperature (K). In the process of electrostatic field assistance, the electromigration force is considered the volumetric force that can cause charged particles (free electrons or ions) to migrate in a directional manner. is the electromigration force (N):
where is the effective charge number of ion I, is the elementary charge (1.6 × 10⁻¹⁹ C), is the Ion concentration (mol/m3), and is the internal electric field intensity (V/cm).
Energy conservation equation:
where is the radiative heat loss (J/m3), is the specific heat capacity (J/(kg/K)), is the laser heat absorption (J/m3), is the velocity vector (m/s); L is the enthalpy (J/m3), and is the thermal conductivity (W/(m·K)).
3.2. Boundary Conditions
The DLD process employs a Gaussian heat source model to characterize the laser thermal density distribution. The Gaussian laser heat source expression is formulated as follows:
where is the output heat flux (W/m2). is the laser absorption coefficient of the material, is the laser power (W), is the laser beam radius (m), is the scanning speed of the laser heat source (m/s), is the time (s), () is the initial position of the heat source center, and () corresponds to the position of the laser heat source after time t. The governing heat transfer equation for the electrostatic field-assisted DLD process is expressed as follows:
where is the thermal conductivity (W/m·K), is the convective heat transfer coefficient (W/m2·K), is the external temperature (K), is the surface emissivity, and is the Stefen-Boltzmann constant (5.67 × 10⁻⁸ W/m2·K4). The right-hand terms account for the Gaussian heat source, thermal convection, and thermal radiation, respectively. The initial conditions of the model include a uniform temperature of 293.15 K and zero initial velocity at the outlet, defined as follows:
Capillary forces and thermocapillary effects are considered at the liquid/gas (L/G) interface. Capillary forces act normal to the interface due to curvature and surface tension, while thermocapillary forces act tangentially along the free surface, driven by surface temperature gradients. The momentum boundary condition at the L/G interface is formulated as follows:
where denotes the interface normal vector; represents the interface curvature; is the surface tension coefficient (J/m2); is the surface temperature gradient (K/m). A moving mesh method combining Lagrangian–Eulerian approaches tracks free surface evolution, explicitly resolving the dynamic molten pool morphology. Two velocity components are considered at the L/G interface: fluid flow velocity and boundary motion velocity, expressed as follows:
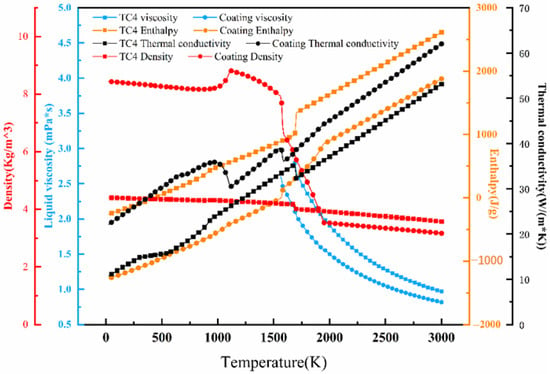
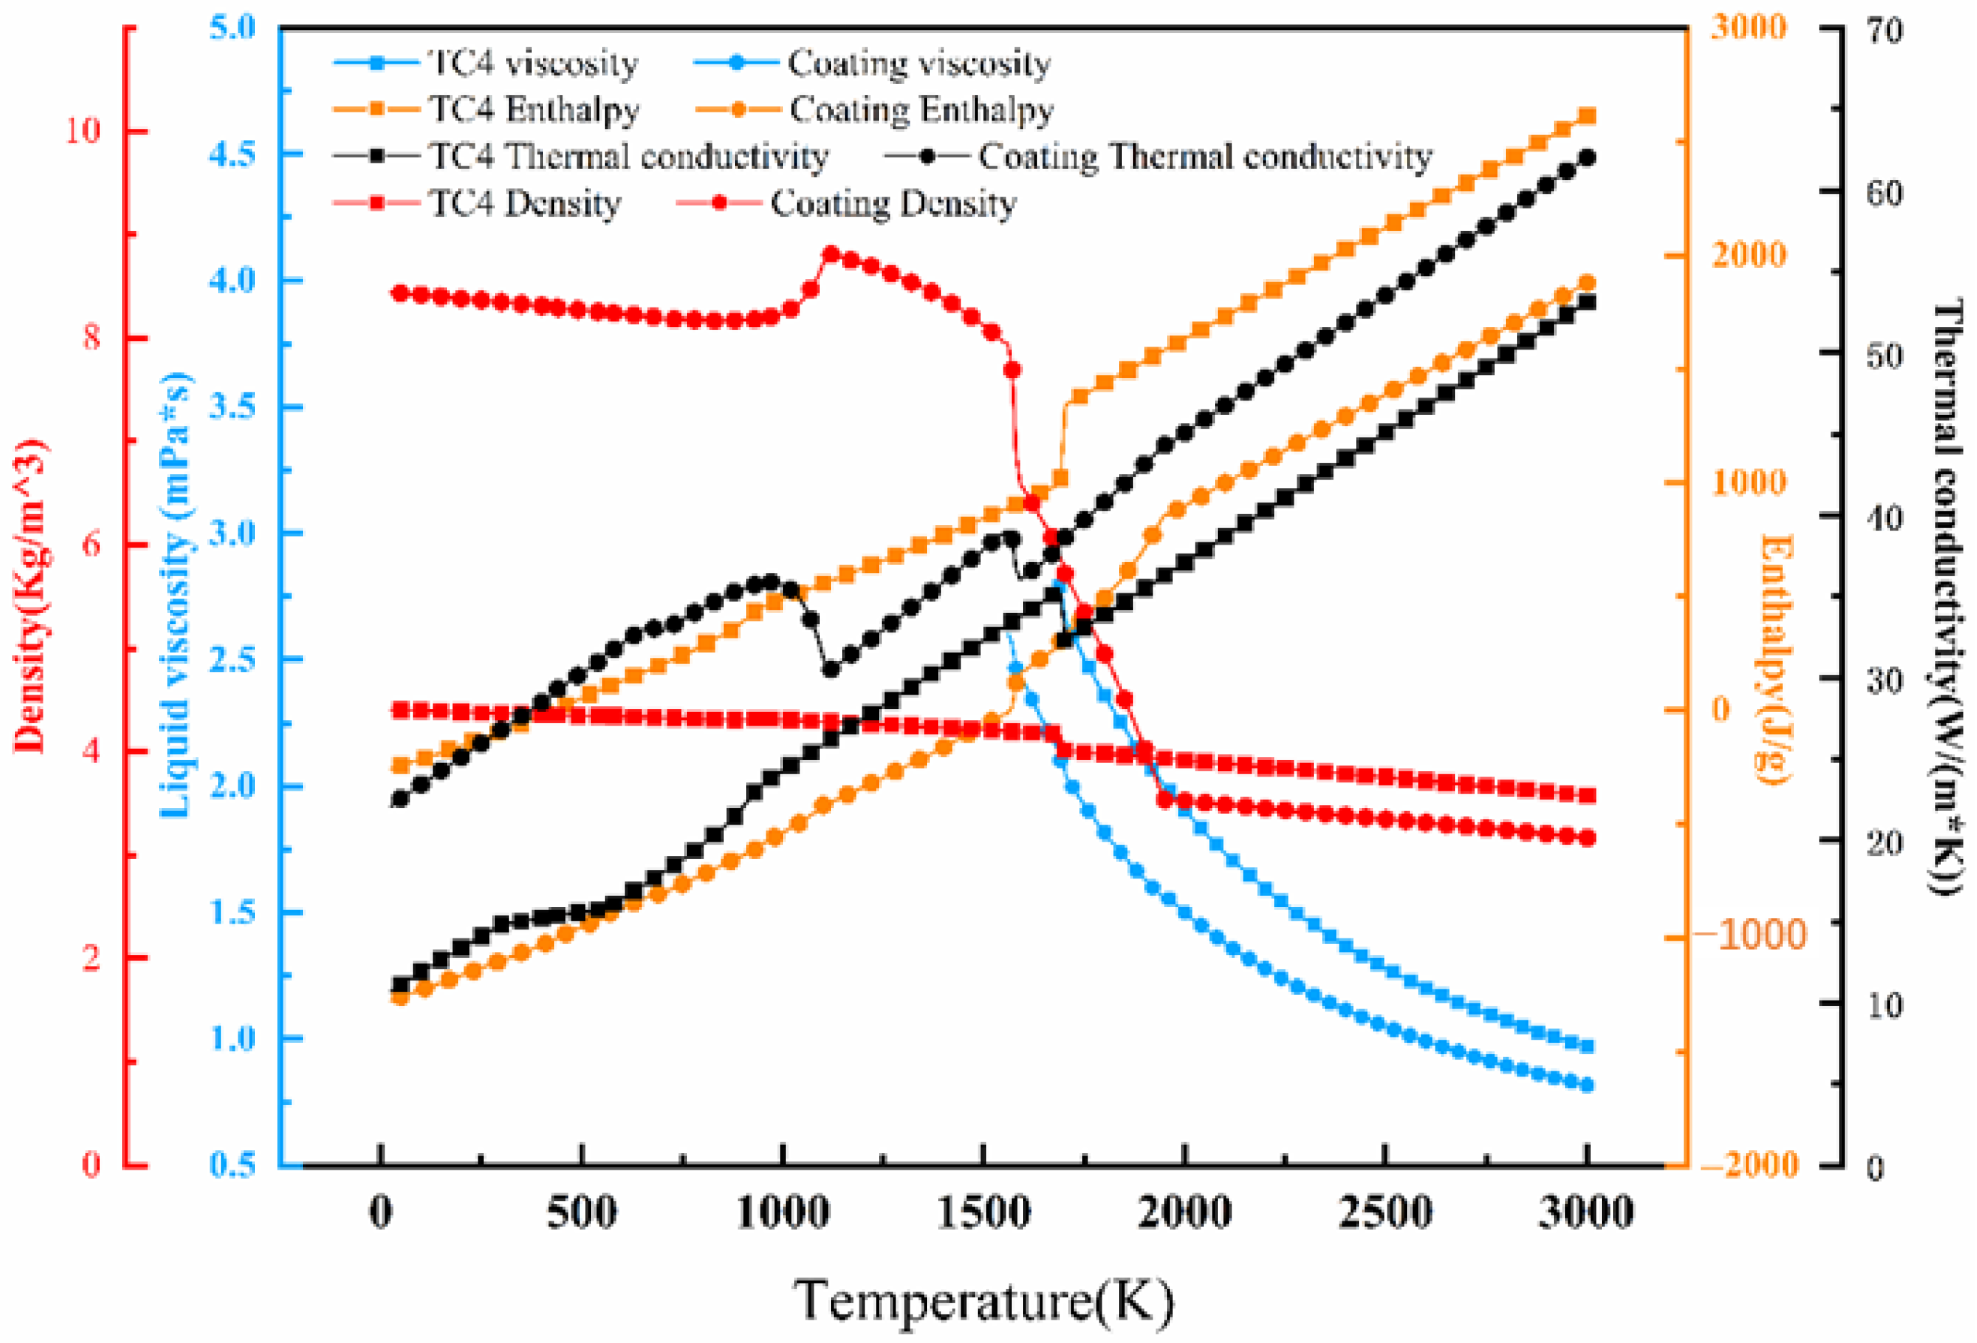
where is the boundary motion velocity vector induced by powder feeding, is the laser scanning speed (m/s); is the mass flow rate (g/min), is the powder efficiency, is the powder density (g/cm3), is the mass flow radius (m), and is the unit vector in the z-direction. The temperature-dependent changes in material properties during the DLD process cannot be ignored. Thermophysical properties of the investigated material, calculated via JMatPro 7.0 software based on elemental composition, are presented in Figure 3. Solid–liquid transition parameters for the coating material are listed in Table 3. Liquid metal properties in the molten pool are modeled as linear combinations of the substrate and deposited powder properties.
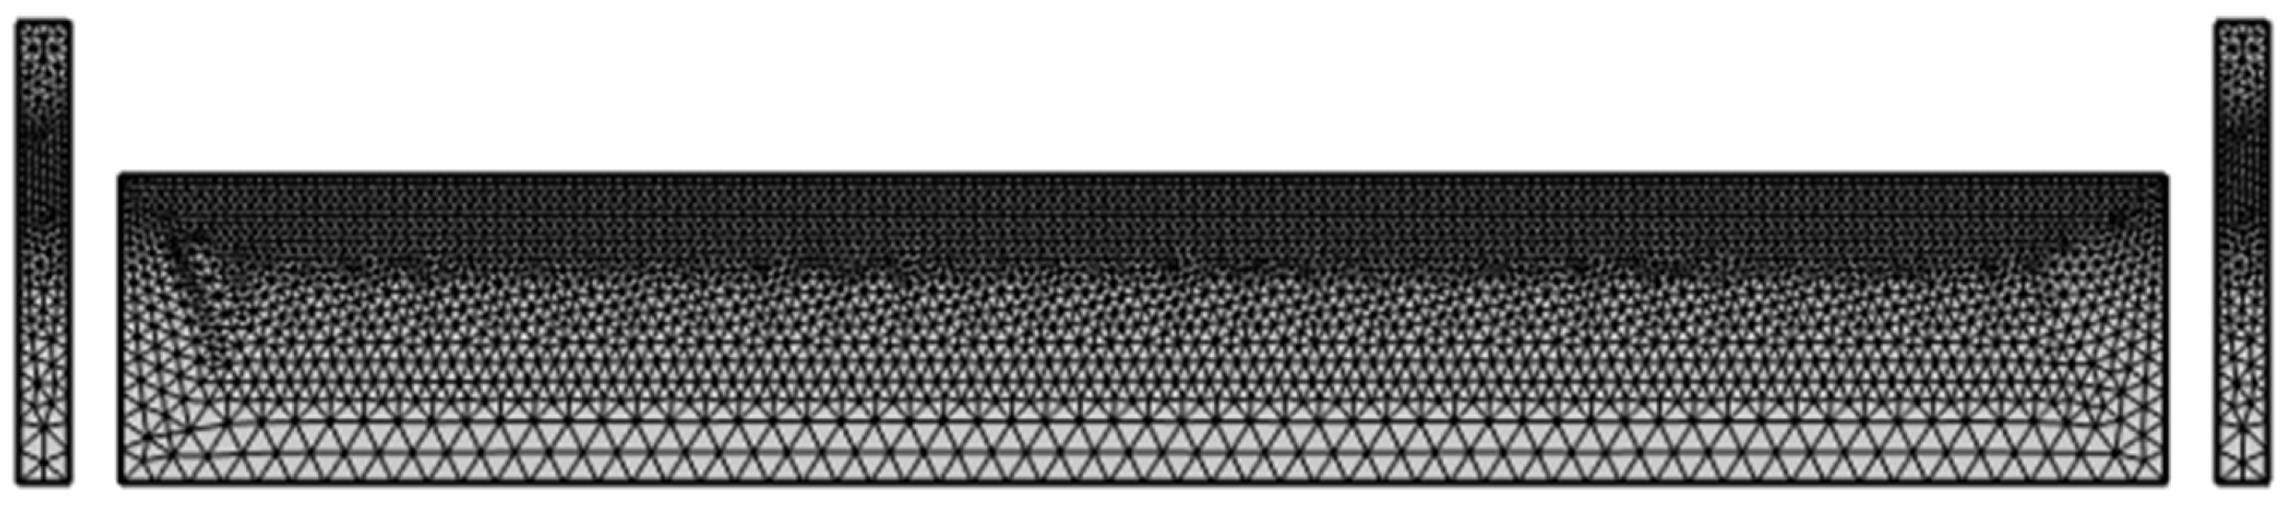
where represent the thermophysical properties (density, specific heat, thermal conductivity, and surface tension) of the liquid metal, substrate (TC4), and deposited powder (Ti-Al-Si), respectively; denotes the powder mass fraction. For computational efficiency, the substrate dimensions are set to 40 mm × 5 mm. A tetrahedral mesh with localized refinement (Figure 4) is implemented, featuring minimum and maximum cell sizes of 0.12 μm and 26.8 μm, respectively, in critical regions.
Figure 3.
Thermophysical coefficients of powder and matrix as a function of temperature.
Table 3.
Liquid phase line parameters of coatings.
Figure 4.
Grid division diagram.
4. Results and Discussion
4.1. Thermal Behavior of DLD Melt Pool Assisted by Electrostatic Field
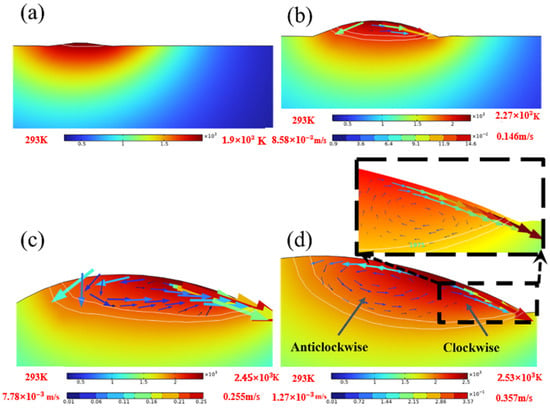
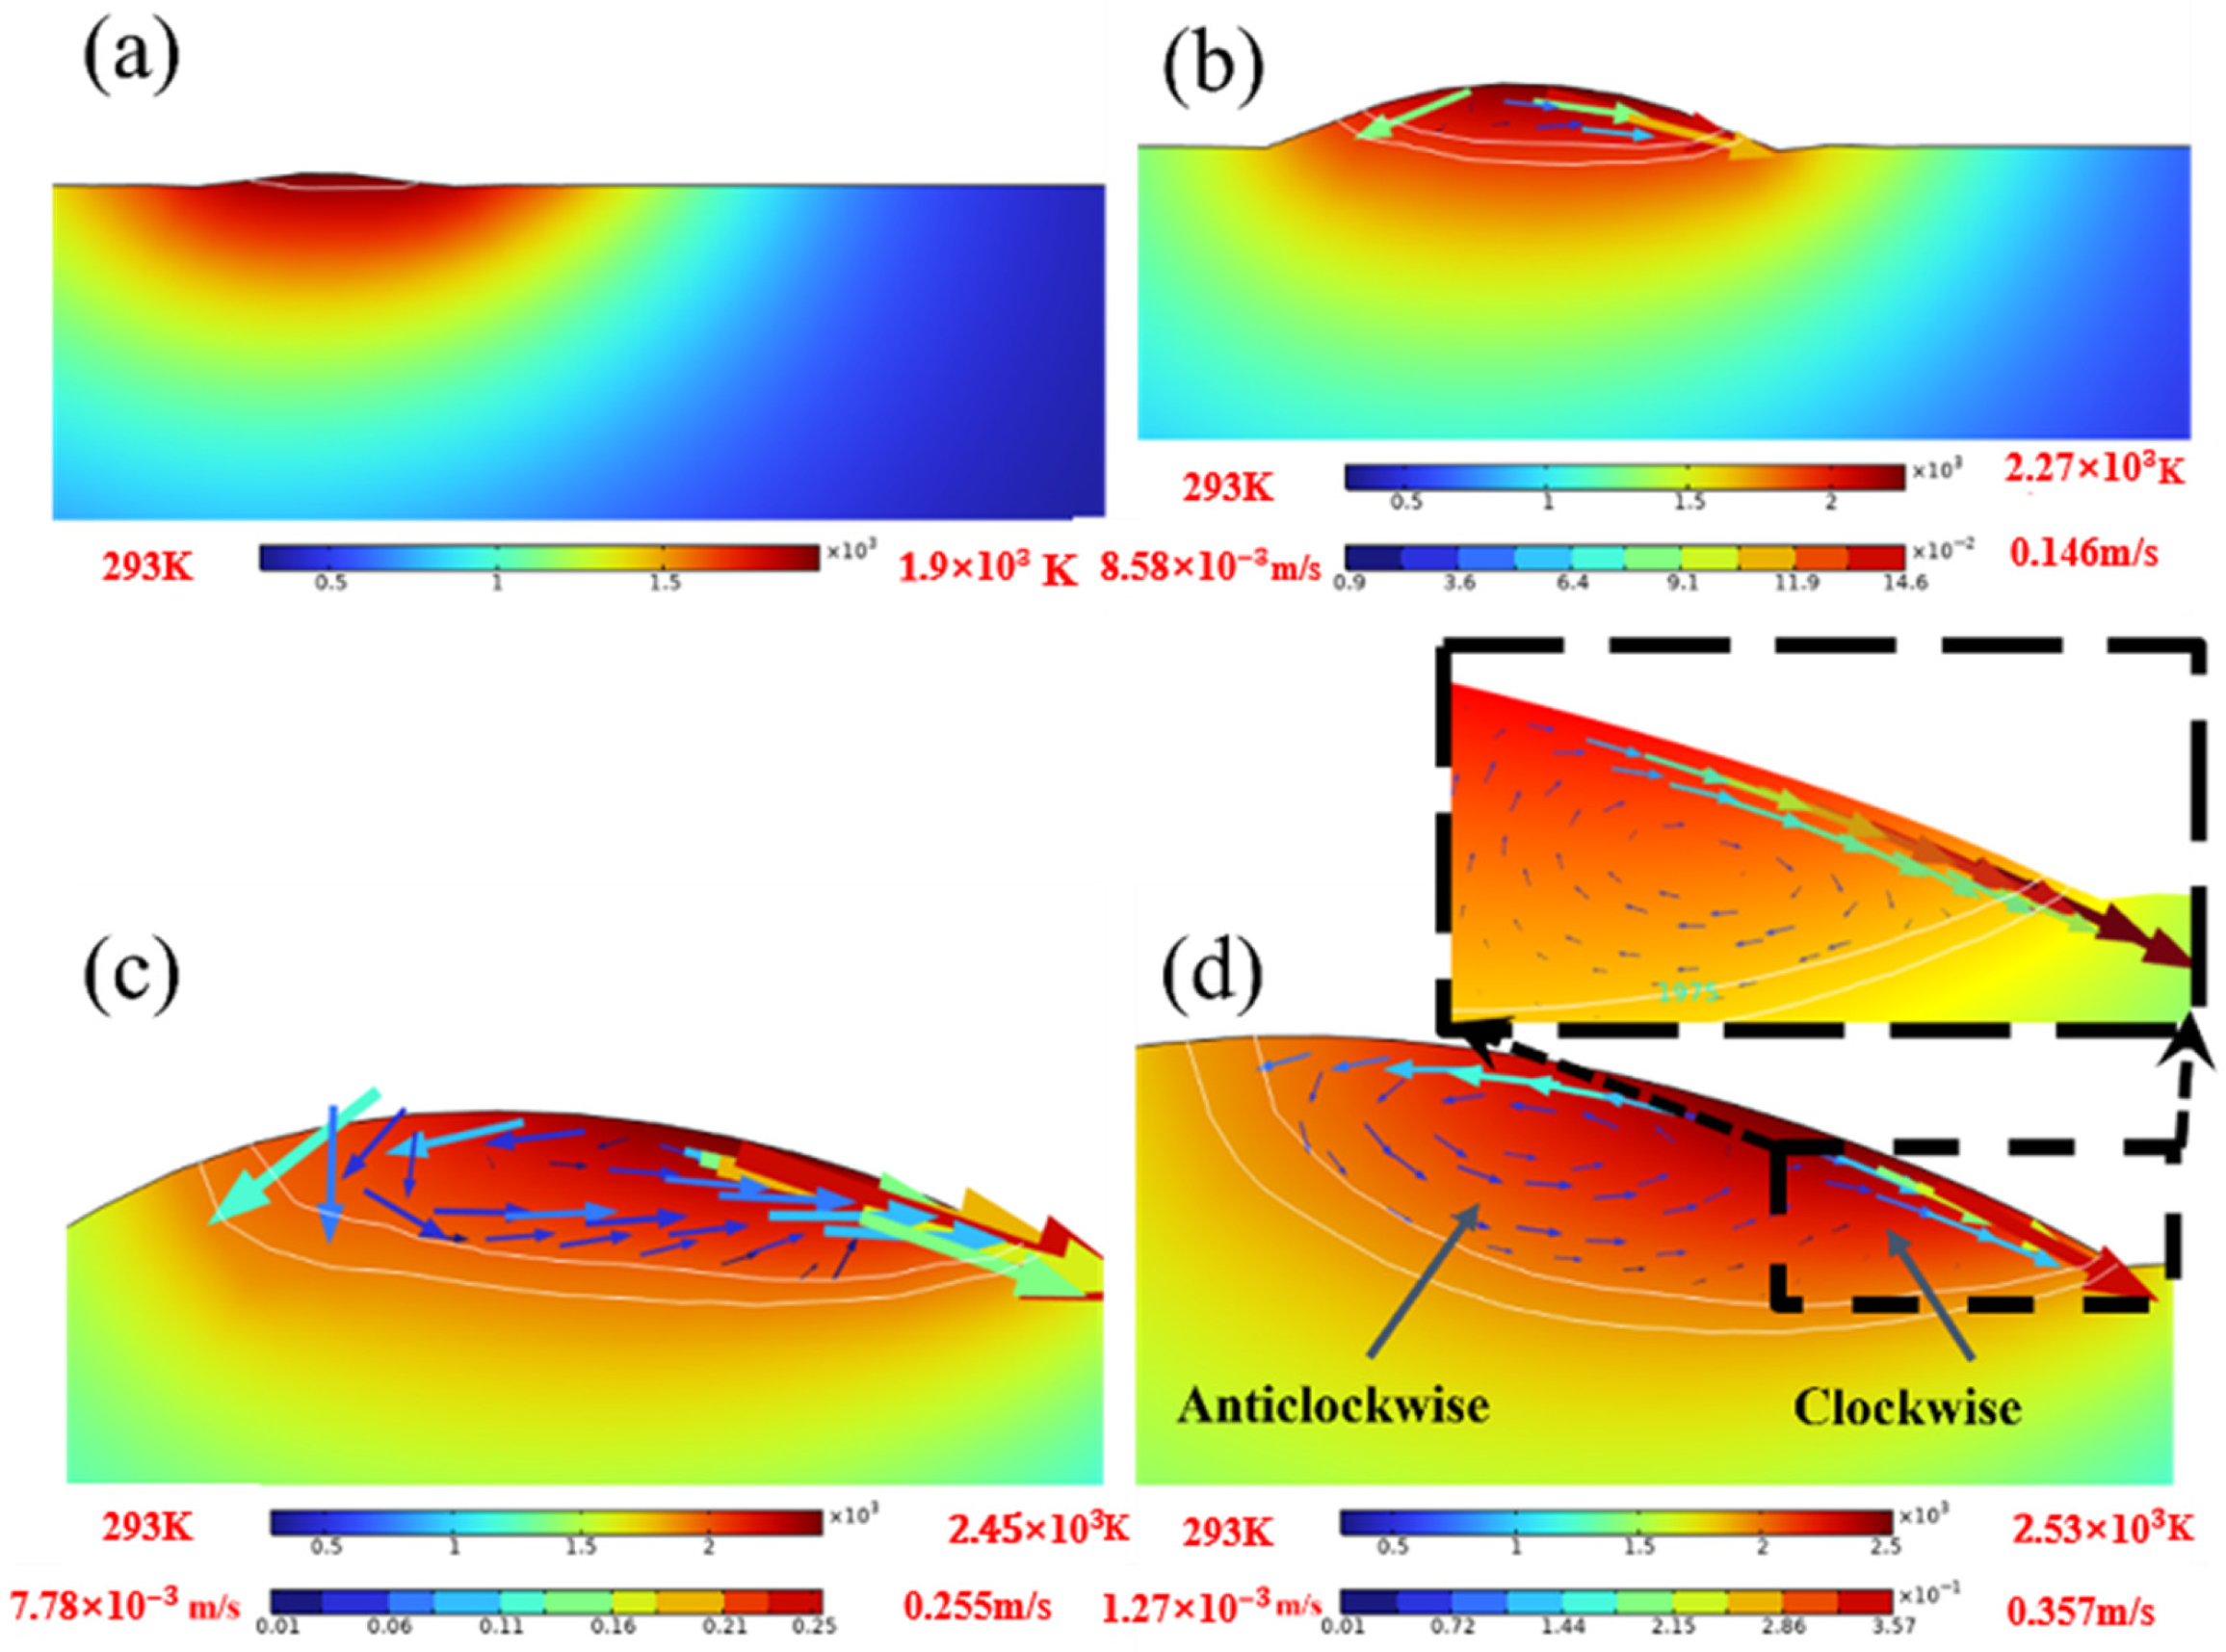
Figure 5 illustrates the dynamic evolution of the laser molten pool under electric field-free conditions. Figure 5a shows the thermal-fluid temperature distribution during initial laser irradiation (t = 200 ms), where no molten pool is formed due to insufficient temperature. As laser irradiation continues, the peak temperature exceeds the melting point, triggering solid–liquid phase transformation and leading to the formation of an incipient molten pool at t = 300 ms (Figure 5b). At t = 500 ms, surface tension driven by the Marangoni effect dominates the flow within the molten pool [30], inducing directional flow from high-temperature to low-temperature regions (velocity vectors are indicated by arrow size and direction, as shown in Figure 5c). Upon reaching dynamic equilibrium between heat input and dissipation, the system achieves a quasi-steady state at t = 800 ms. The typical dual-vortex structure under Marangoni convection is presented in Figure 5d: a clockwise vortex at the front of the molten pool and a counterclockwise vortex at the trailing edge.
Figure 5.
Dynamic evolution of the laser molten pool under electric field-free conditions: (a) 200 ms, (b) 300 ms, (c) 500 ms, (d) 800 ms.
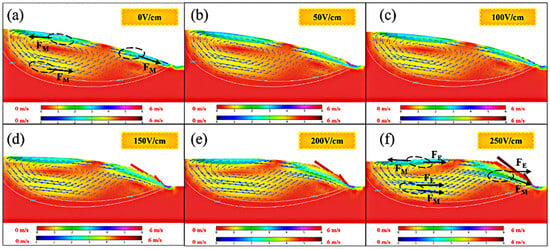
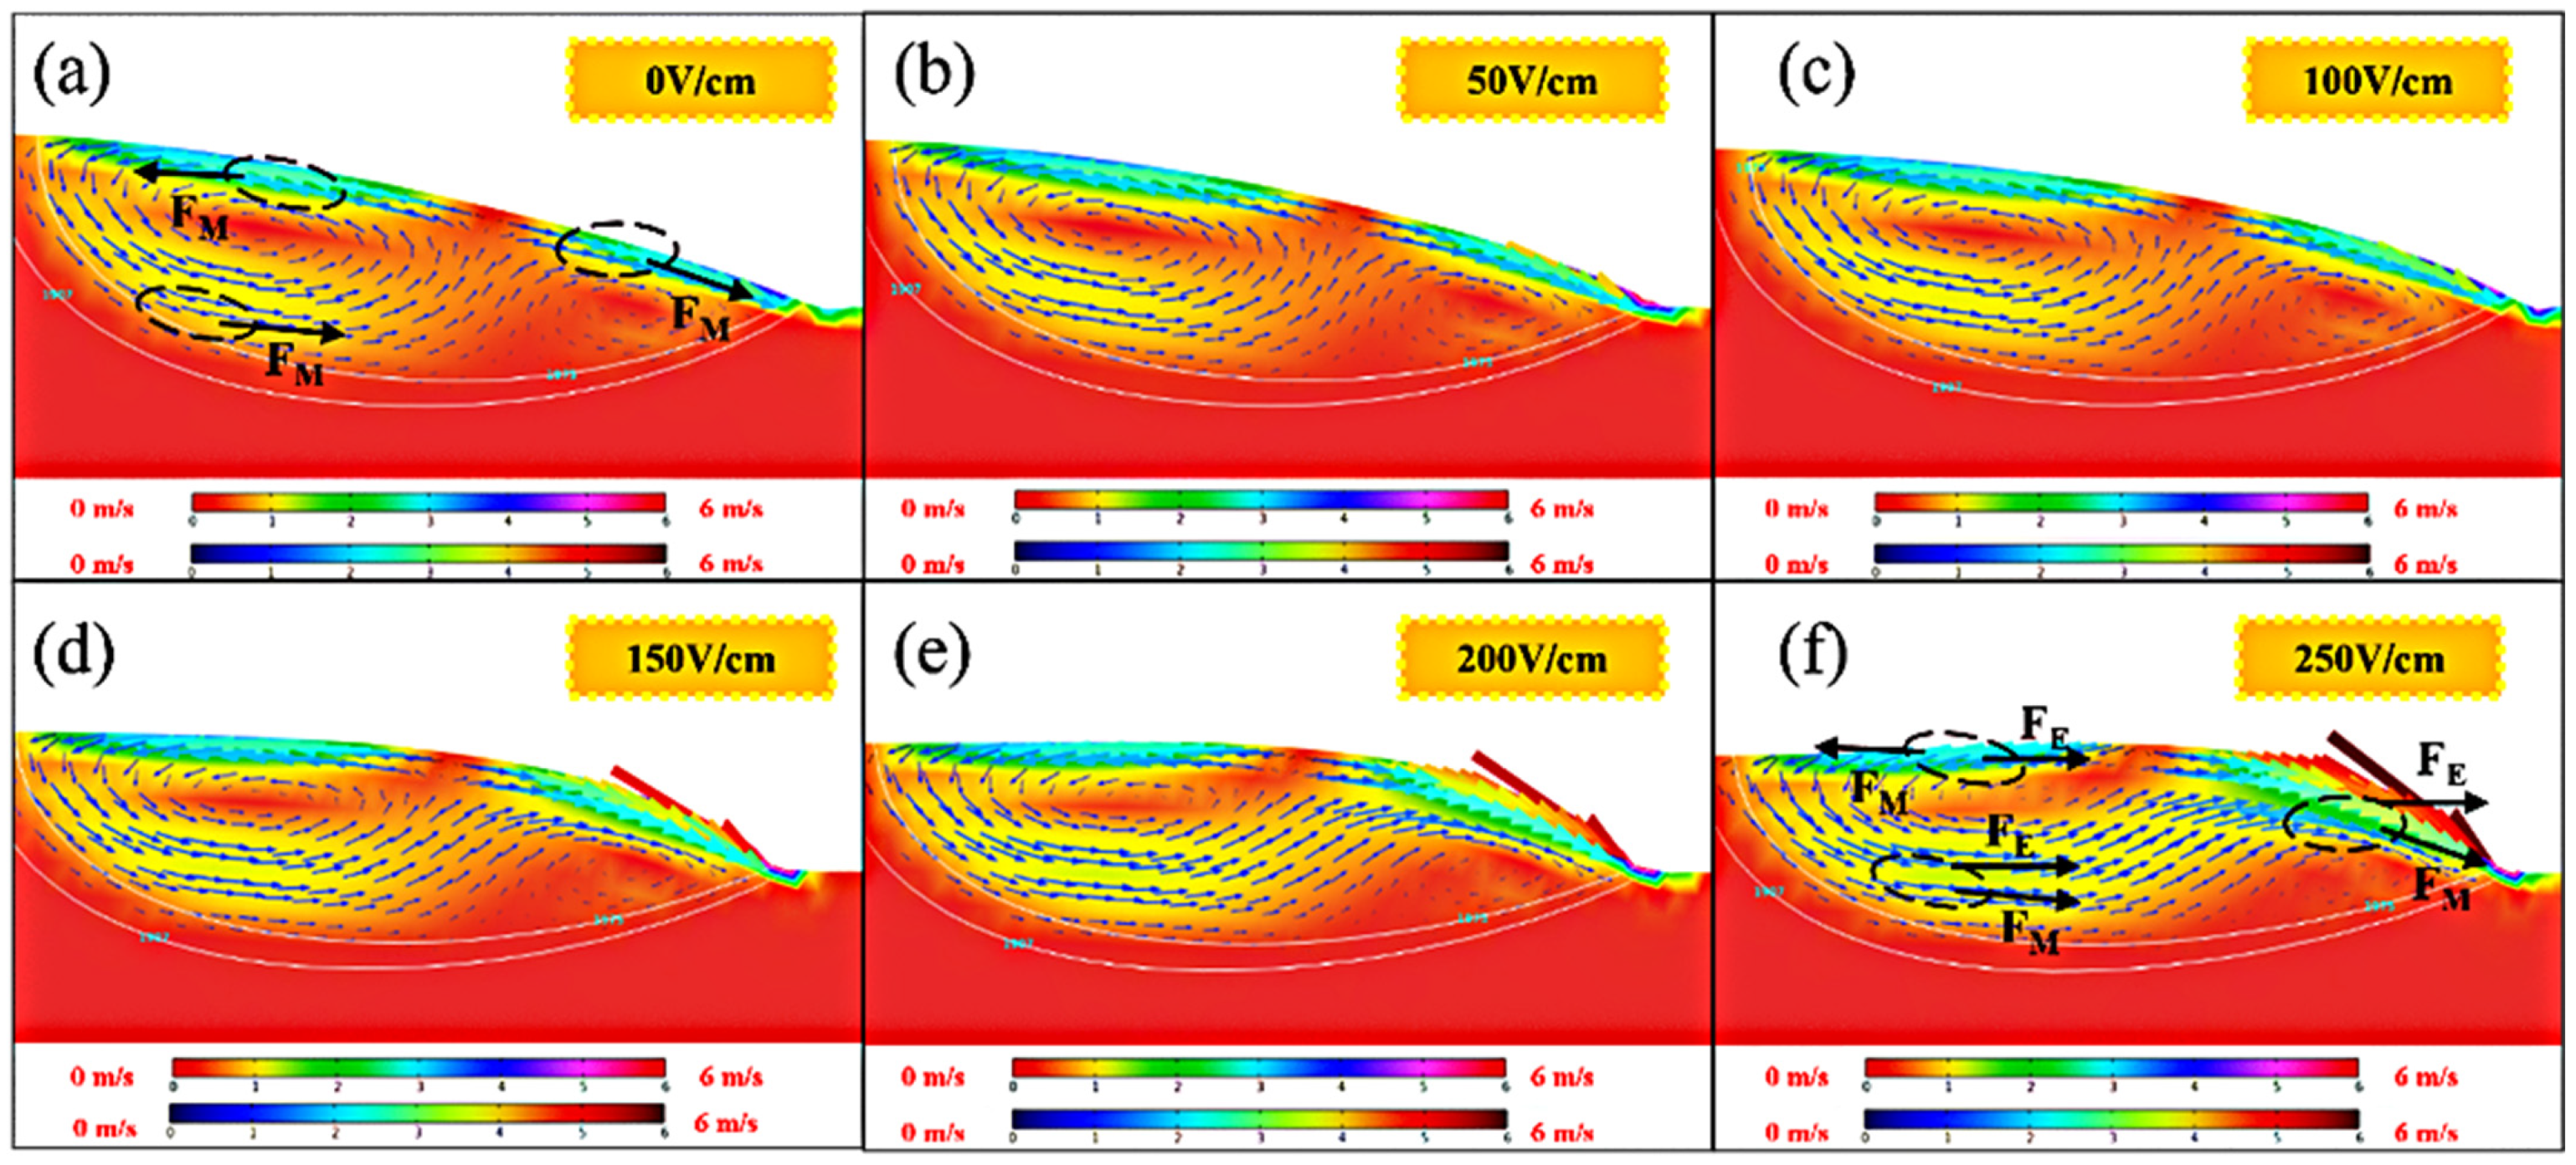
Figure 6 presents the thermal-fluid coupling behavior of the molten pool at a quasi-steady state (t = 800 ms) during the electrostatic field-assisted DLD process. Figure 6a–f present thermal-fluid contour maps in which a graduated arrow color scheme characterizes flow velocity: arrows transitioning from blue to red correspond to a progressive increase in liquid metal flow velocity from low to high. The molten pool flow pattern undergoes significant modification as the electrostatic field intensity (EF) increases from 0 to 250 V/cm. At EF = 0 V/cm (Figure 6a) the melt flow is dominated by the Marangoni force (FM), exhibiting a typical dual-vortex structure (maximum velocity of 0.42 m/s). As the electric field strengthens (Figure 6b,c), not only does the velocity vector deflect, but the flow velocity in the front turbine region also gradually increases. At EF = 150 V/cm (Figure 6d), the flow velocity in the front vortex region increases to 0.6 m/s. As the electric field continues to strengthen (Figure 6e,f), the flow velocity in the front turbine region paradoxically decreases. This originates from the dynamic charge redistribution and non-equilibrium electrodynamics induced by the electrostatic field. Despite the electrostatic equilibrium tendency of the molten pool, periodic charge density oscillations during the solid–liquid transition trigger interfacial charge accumulation, generating transient built-in electric fields. These transient electric fields drive the directional migration of metal ions in localized molten zones [31]. When the angle θ between the electromigration force (FE) and FM is less than 90°, the synergistic effect of FE and FM accelerates the flow (increasing the velocity by up to 42% in cooperative regions). Conversely, in the region where θ > 90° at the rear of the molten pool, FE suppresses the velocity field. This asymmetric flow markedly modifies solute (Si) transport, while flow-induced thermal perturbations alter the temperature gradient (G) and solidification rate (R) at the solid–liquid interface [32].
Figure 6.
Thermal-fluid coupling behavior of the molten pool: (a) 0 V/cm, (b) 50 V/cm, (c) 100 V/cm, (d) 150 V/cm, (e) 200 V/cm, (f) 250 V/cm.
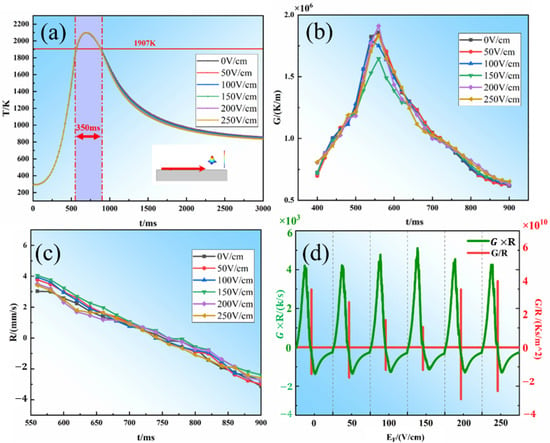
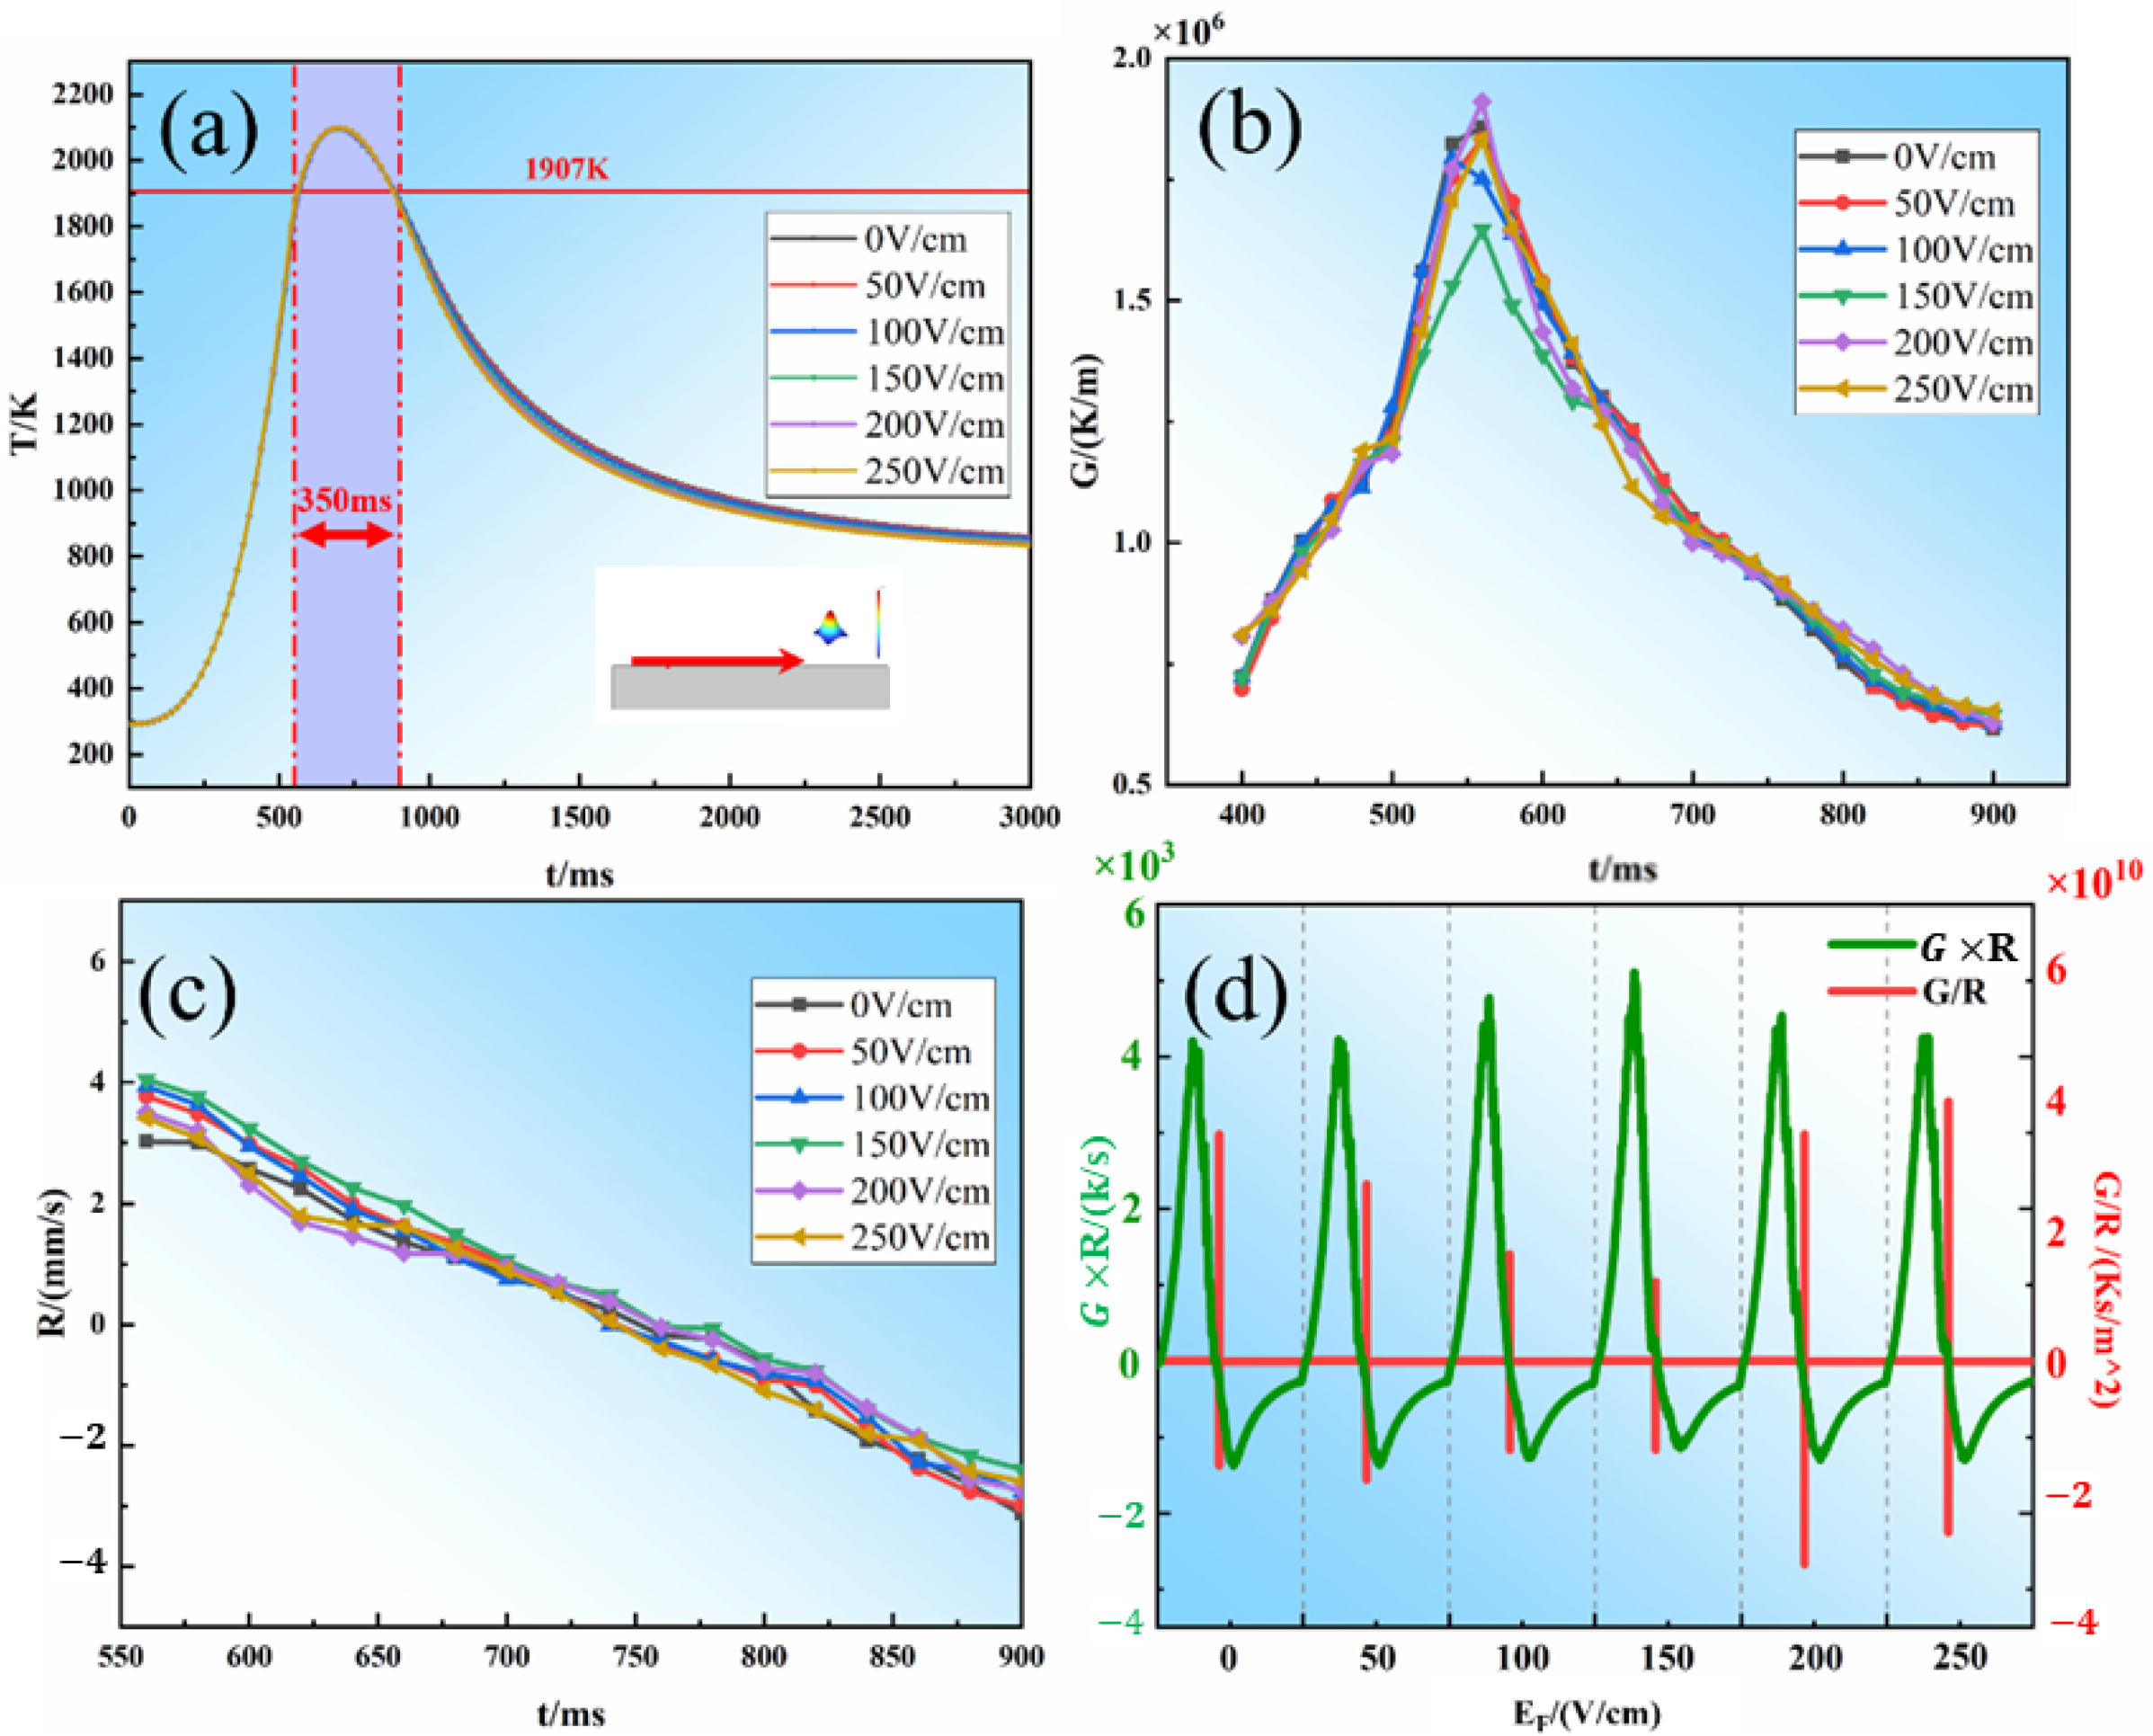
The evolution of the solidification microstructure is primarily governed by localized solidification conditions, namely the temperature gradient (G) and solidification rate (R) at the liquid/solid interface of the molten pool. To elucidate the solidification thermal characteristics, COMSOL Multiphysics simulations were used to analyze the temporal relationships of temperature, G, and R under varying EF intensities (Figure 7). Figure 7a reveals constant peak temperatures under contactless uniform electrostatic fields due to the absence of Joule heating. Significant variations in G and R emerge in Figure 7b,c. The electrostatic field alters heat dissipation mechanisms by interfering with molten pool flow. As the EF increases from 0 to 150 V/cm, accelerated fluid flow at the solid–liquid interface homogenizes the temperature distribution. Reduced temperature fluctuations in the bottom region decrease G while progressively increasing R.
Figure 7.
Evolution curve of solidification parameters with different EF: (a) constant peak temperatures, (b) G, (c) R, (d) G × R and G/R.
According to the Kurz-Fisher solidification criterion, the synergistic interplay between G and R critically determines microstructural evolution: the product (G × R) dictates the grain refinement degree, while the ratio (G/R) controls the evolution of grain morphology [33]. As shown in Figure 7d, G × R rise from 4.2 × 10³ K/s to 5.2 × 10³ K/s within the 0–150 V/cm range, then decreases to 4.3 × 10³ K/s at an EF of 250 V/cm. Concurrently, G/R reaches a minimum of 1.2 × 10¹⁰ K·s/m2 at 150 V/cm, marking a 57% reduction compared to electric field-free conditions. This indicates a solidification mode transition from columnar to equiaxed crystals and an increased nucleation density of equiaxed crystals. The forced convection induced by the electrostatic field further suppresses the growth of dendrites at the solidification front and promotes the formation of uniform, fine equiaxed grains. The simulation results demonstrate that as the electric field intensity increases, the product G × R initially increases and then decreases, while the ratio G/R initially decreases and then increases. This predicts a trend where the grain size first decreases and then increases.
4.2. Microstructure Evolution of the Fabricated Ti-Al-Si Coatings
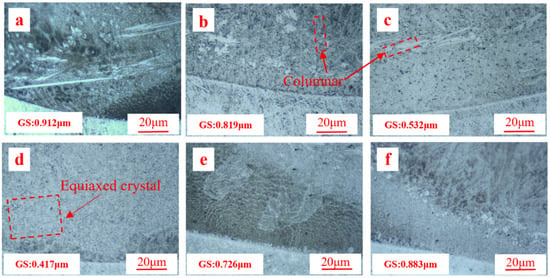
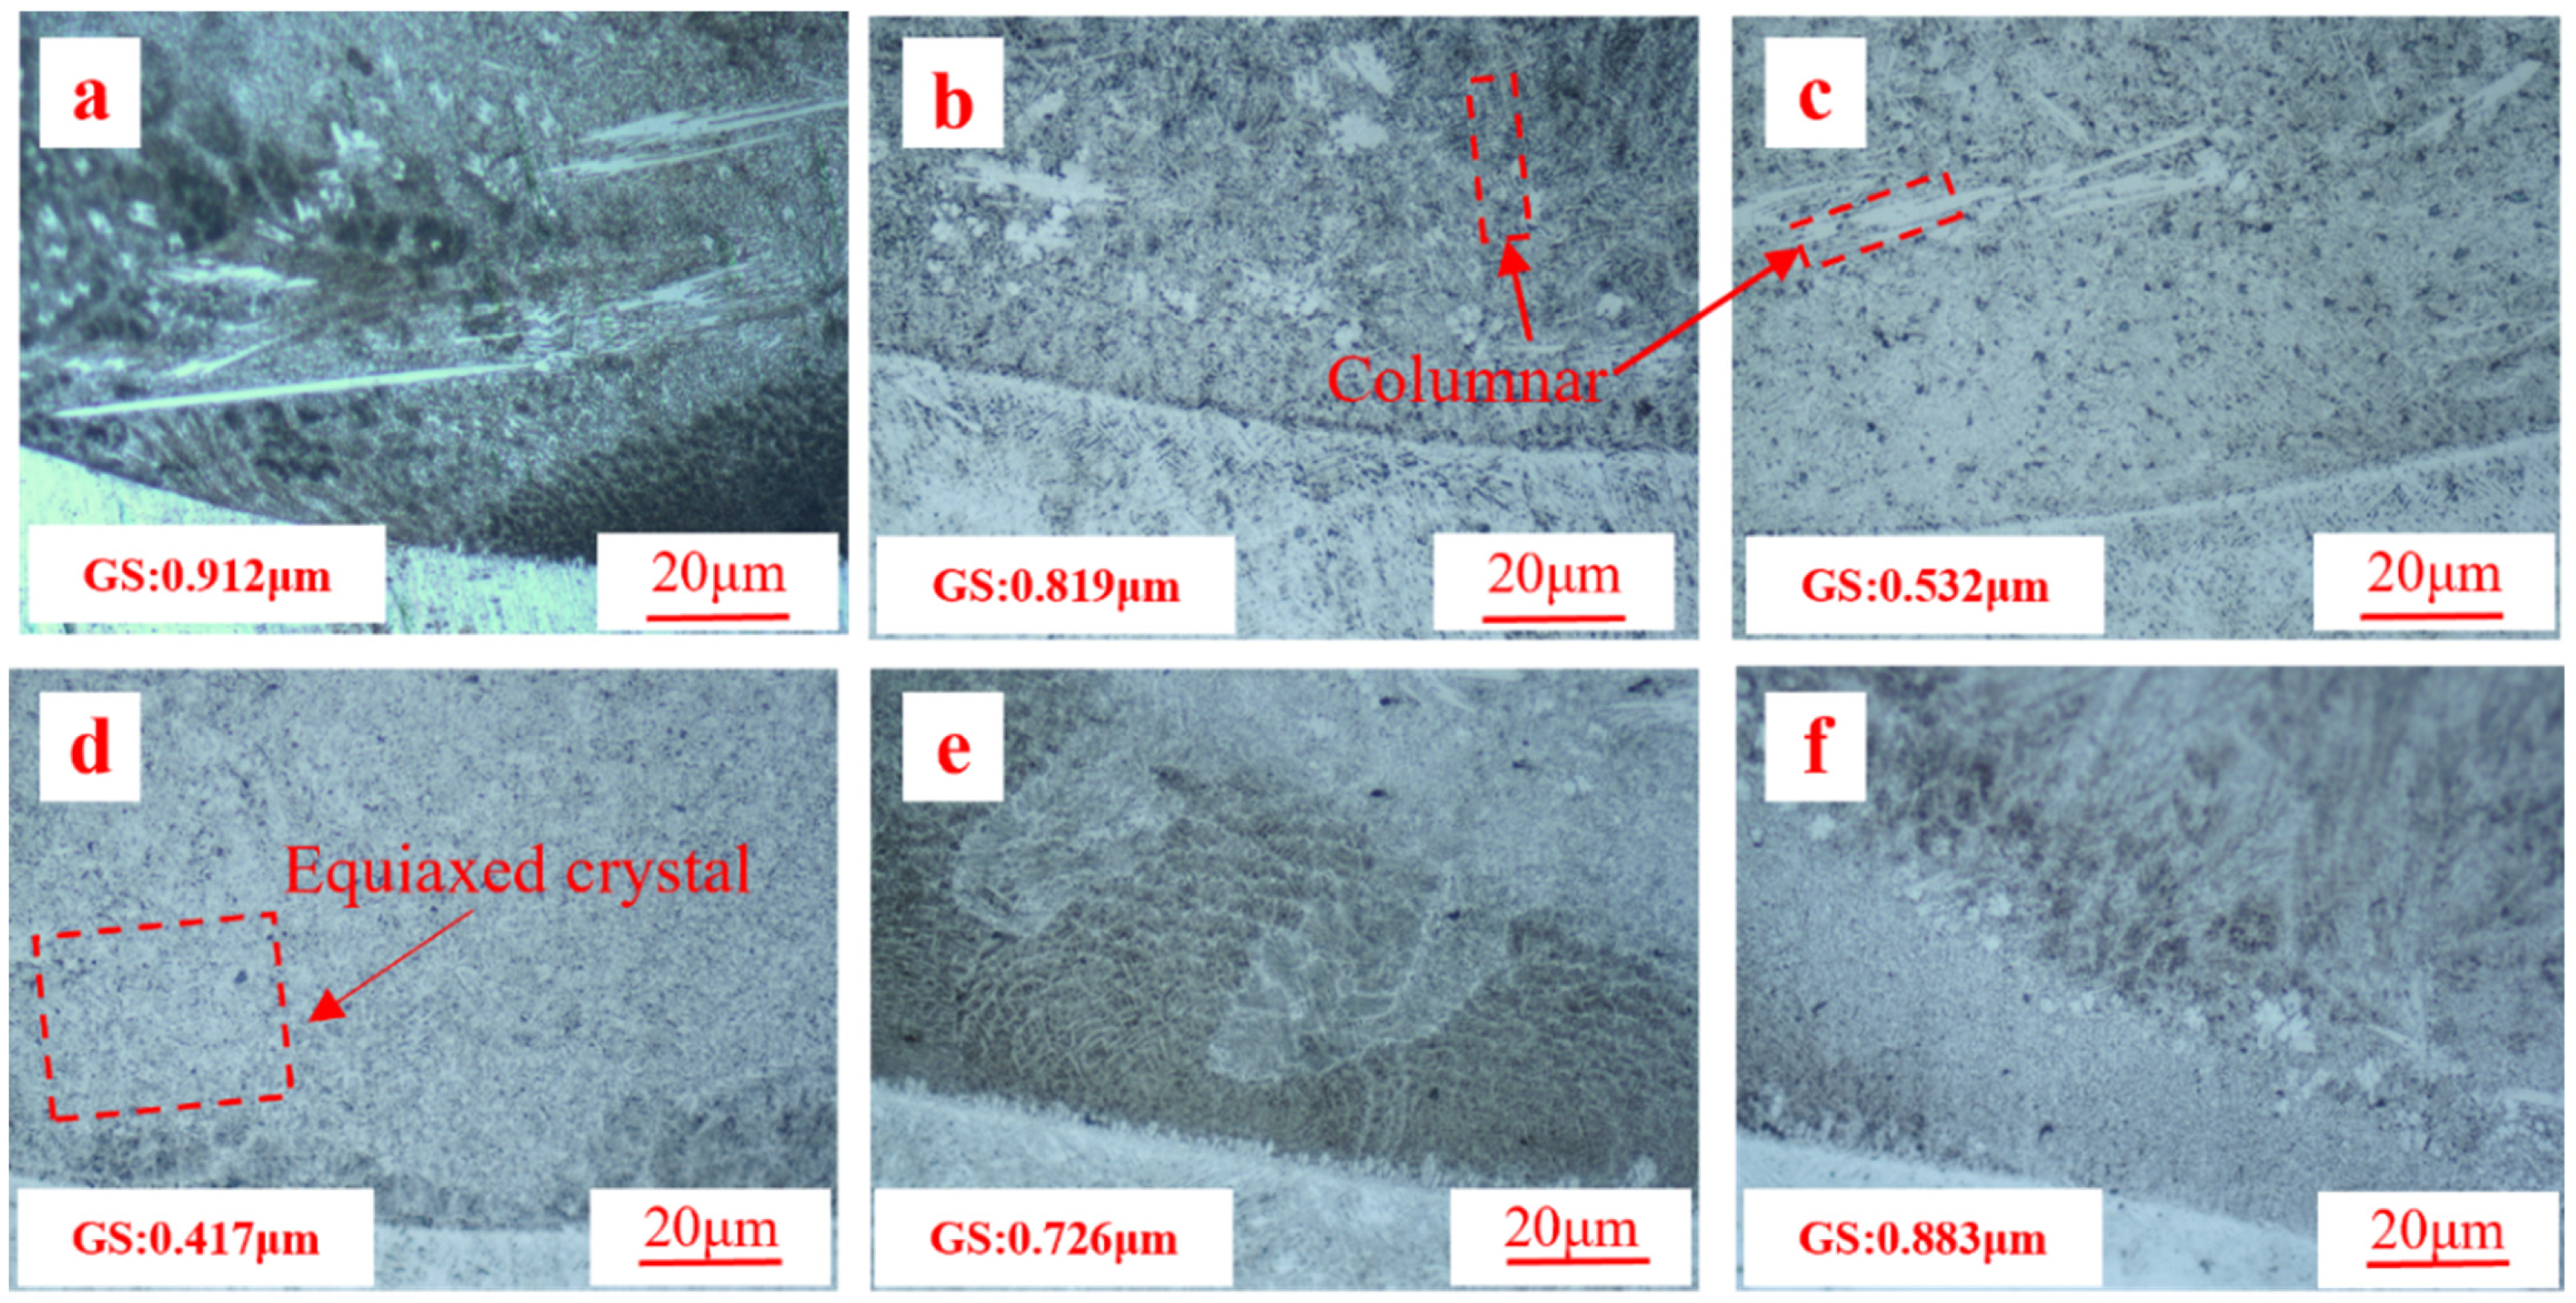
Figure 8 shows metallographic images of the electrostatic field-assisted DLD coatings, with all samples exhibiting defect-free microstructures. As the electric field intensity increases, the metallographic grain size initially decreases and then increases, which is consistent with the simulation results in Figure 7d, further verifying the reliability of the numerical simulation. At low EF intensities (Figure 8a–c), with the melt flow dominated by Marangoni convection, epitaxial columnar grains are observed. Here, G at the solid–liquid interface exceeds the constitutional undercooling threshold, inhibiting the nucleation of equiaxed grains and promoting directional solidification. Increasing the EF triggers a columnar-to-equiaxed transition (Figure 8d), while an excessive EF leads to the reappearance of tilted columnar grains (Figure 8f). At EF = 150 V/cm, the dragging effect induced by electromigration achieves an optimal coupling state with Marangoni convection, resulting in solute homogeneity. A higher EF (>150 V/cm) generates turbulent disturbances at the solidification front, destabilizing the interface and causing grain coarsening. Dynamic changes in the electrostatic field vector induce the growth of tilted columnar grains. Table 4 presents the variation in GS, G × R, and G/R under different electric field intensities. The grain size is directly related to the values of G × R and G/R, which are consistent with the trends observed in our previous simulations. When EF = 150 V/cm, G × R reaches its maximum value while G/R reaches its minimum, resulting in the smallest grain size of 0.417 μm.
Figure 8.
Metallographic images of electrostatic field-assisted DLD coatings: (a) 0 V/cm, (b) 50 V/cm, (c) 100 V/cm, (d) 150 V/cm, (e) 200 V/cm, (f) 250 V/cm.
Table 4.
Variation in GS, G × R and G/R, under different electric field strengths.
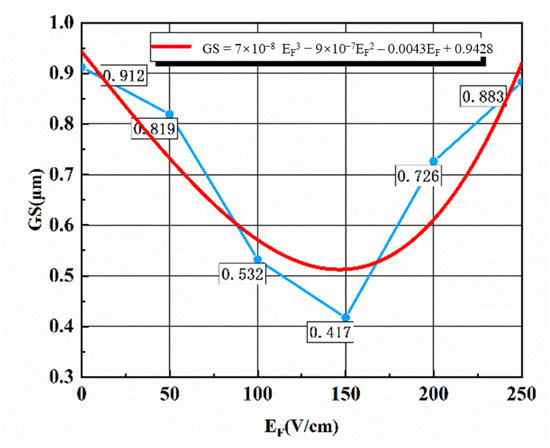
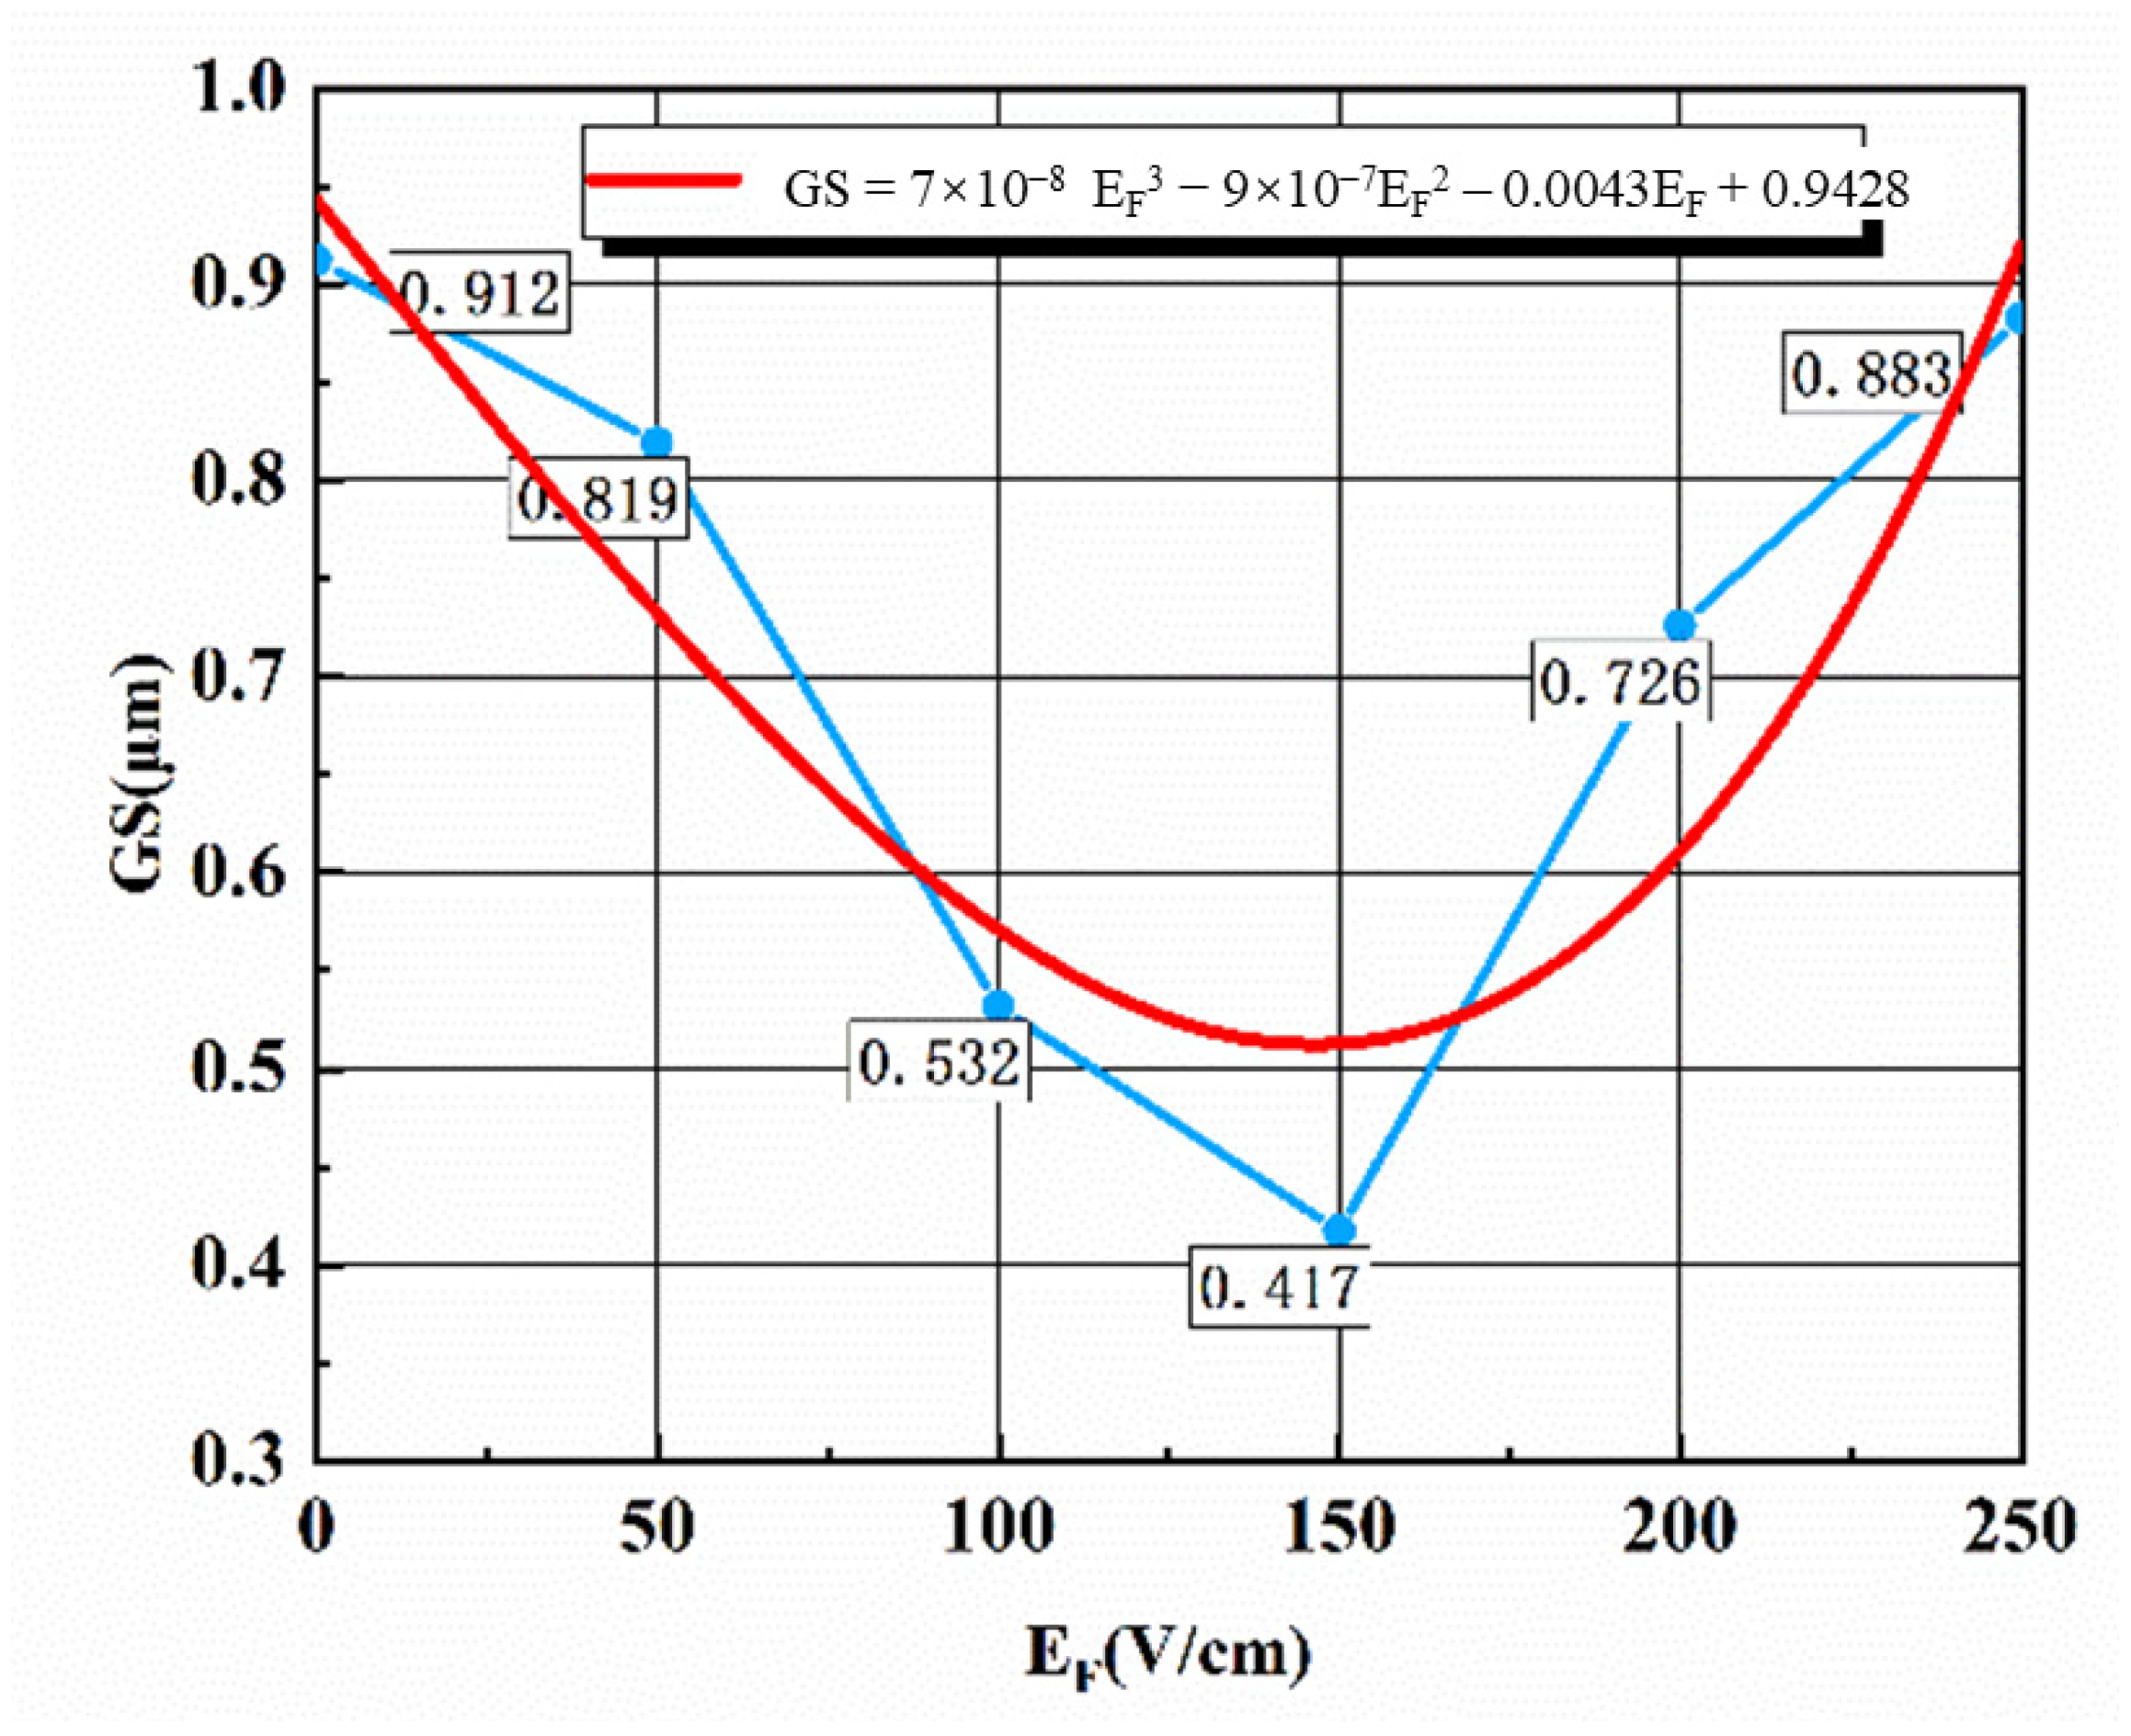
Grain size statistics obtained via Image-Pro analysis reveal a minimum average size of 0.417 μm at 150 V/cm, representing a 55% reduction compared to electric field-free conditions. Electromigration-driven solute homogenization synergizes with Marangoni convection to enhance the equiaxed nucleation rate. To establish the relationship between electrostatic field parameters and grain size, Figure 9 presents the average grain size (GS) and the corresponding cubic fitting curve of GS versus EF for DLD Ti-Al-Si coatings. The relationship between GS and EF can be expressed as:
GS = 7 × 10⁻⁸EF3 – 9 × 10⁻⁷EF2 − 0.0043EF + 0.9428
Figure 9.
GS and EF corresponding cubic fitting curve.
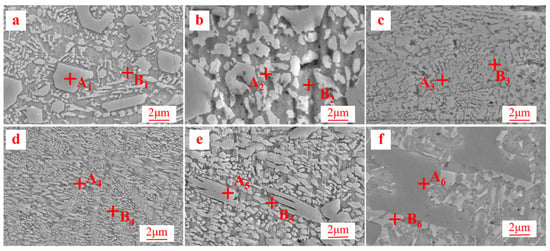
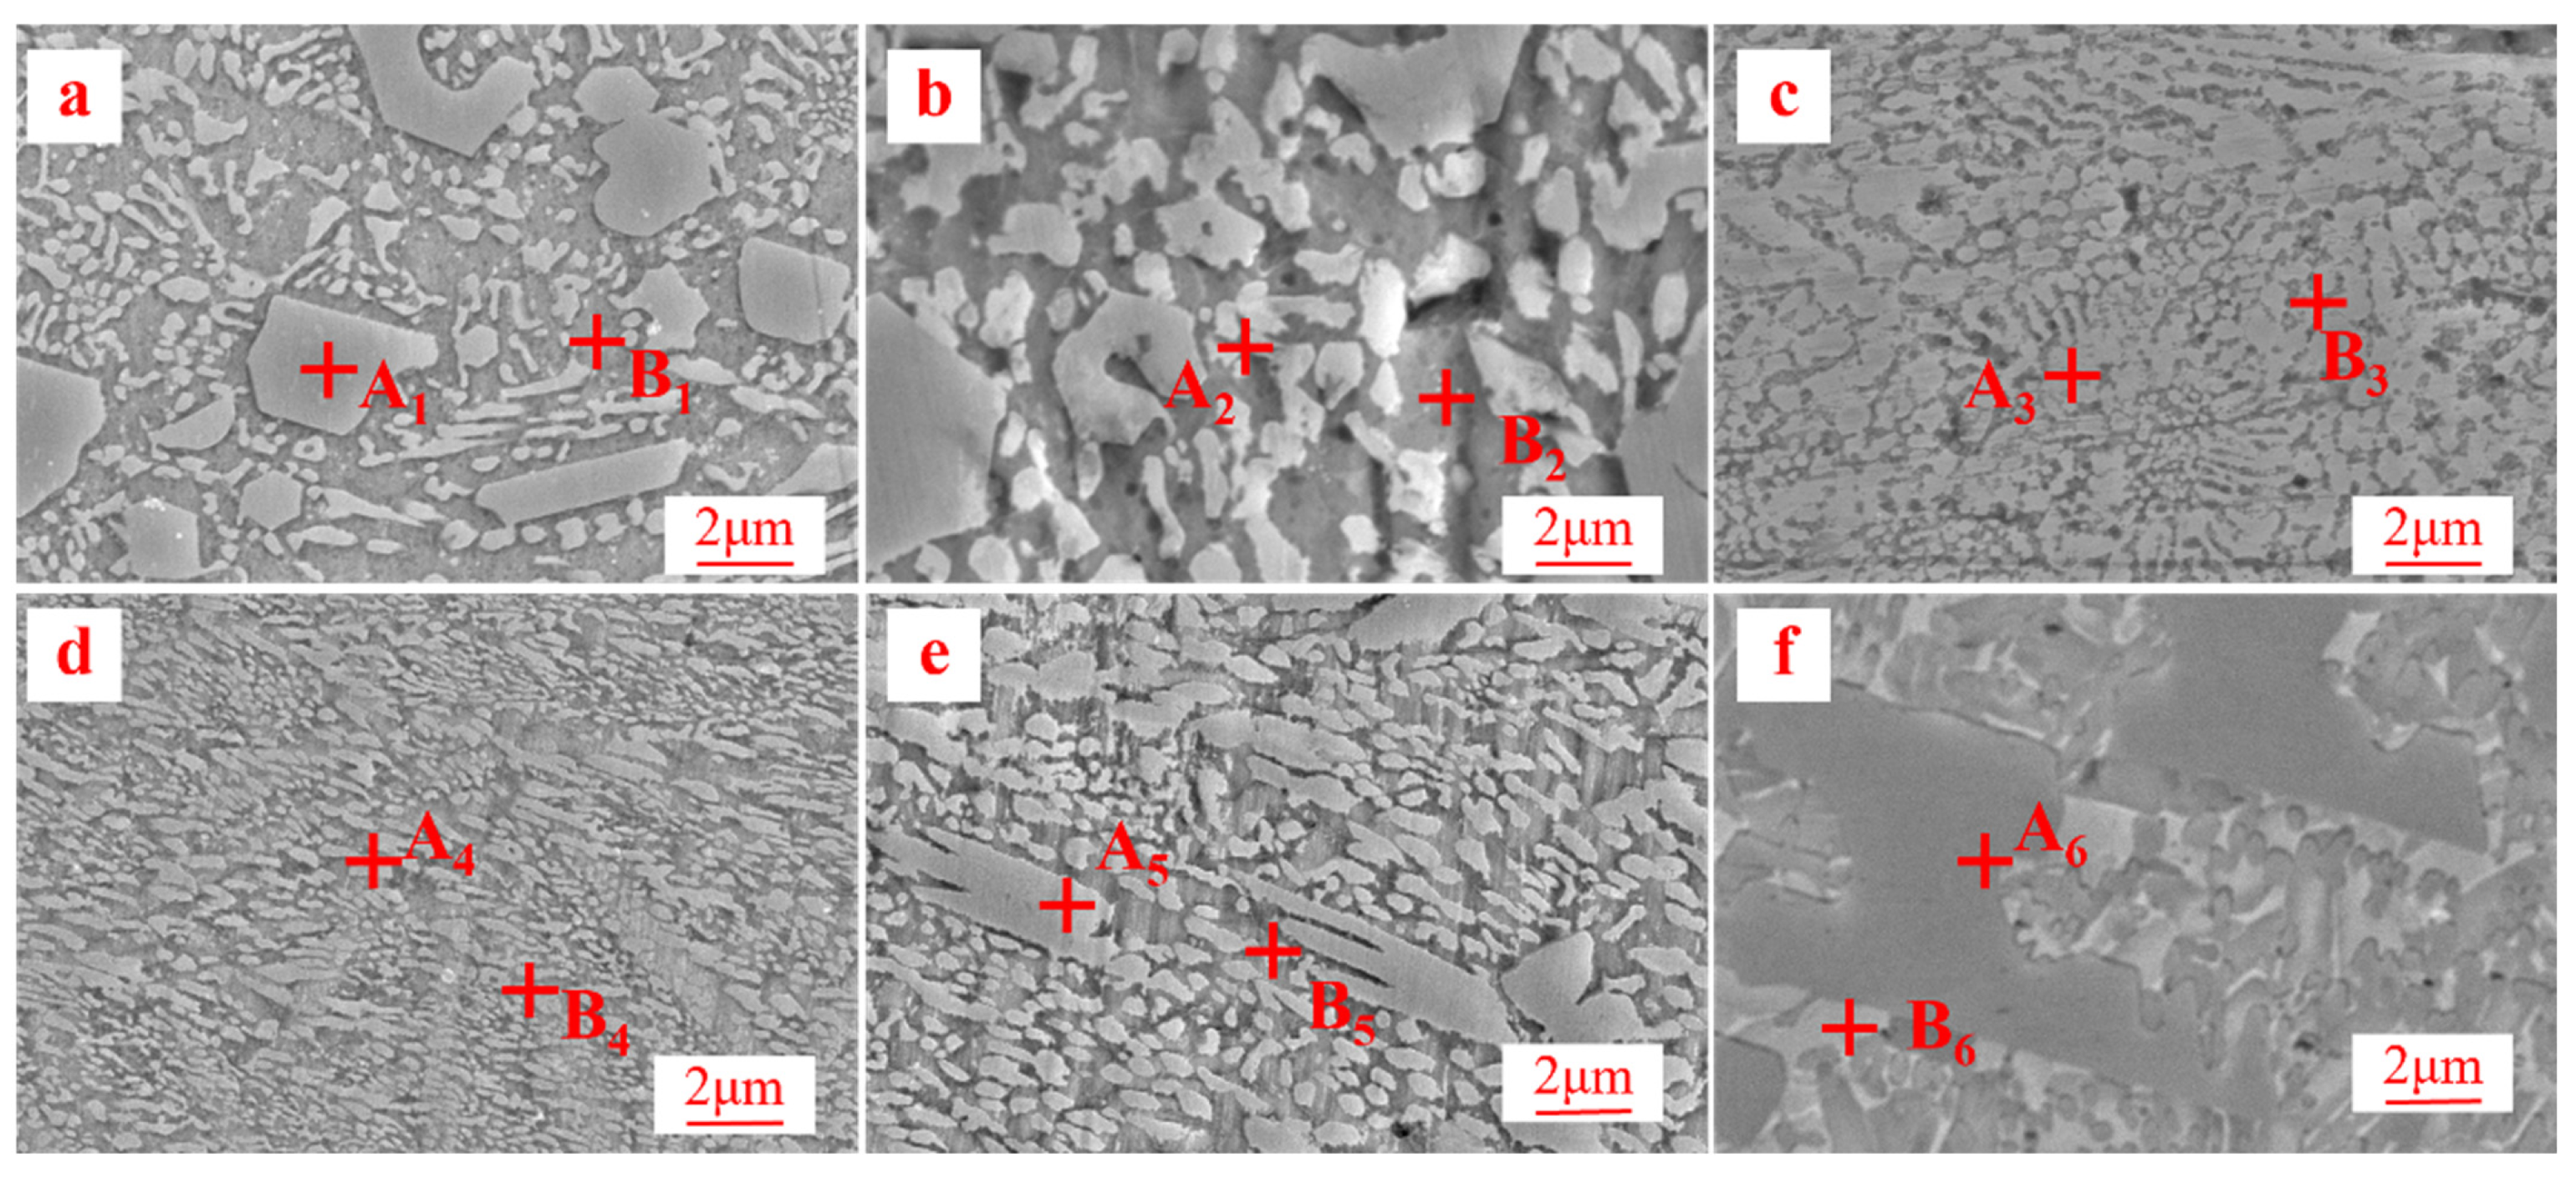
Figure 10 presents SEM images of electrostatic field-assisted DLD Ti-Al-Si coatings under varying EF intensities. The microstructure of the coatings primarily consists of a light gray blocky phase and a gray matrix. Based on the EDS analysis results (Table 5) for the marked points in Figure 10 and previous research, the light gray blocky phase is identified as the Ti5Si3 enhanced phase, while the gray matrix comprises α-Ti and β-Ti. The Ti5Si3 enhances the overall performance of the coating as a reinforcing phase. The proportion of the Ti5Si3 enhanced phase in each coating sample was calculated using Image-Pro software plus 6.0 (Table 6). As the EF increases from 0 to 150 V/cm, the proportion of the Ti5Si3 enhanced phase rises from 41.66% to 85.92%. The microstructure exhibits the densest and most homogeneous distribution, with the smallest average size of 0.45 μm, at 150 V/cm. As the EF further increases, the enhanced phase coarsens and its proportion decreases. At EF = 250 V/cm, the Ti5Si3 enhanced phase fraction decreases to 62.28% with an average size of 1.97 μm. The distribution of the Ti5Si3 enhanced phase exhibits a transition from non- uniform to uniform, and subsequently back to non- uniform. Furthermore, at EF = 150 V/cm, the distribution of the Ti5Si3 enhanced phase is the most uniform. Since a more uniform distribution of the Ti5Si3 phase corresponds to a higher coating hardness, it can be predicted that the microhardness of the TC4 coating should reach its maximum value at EF = 150 V/cm.
Figure 10.
SEM images of electrostatic field-assisted DLD Ti-Al-Si coatings: (a) 0 V/cm, (b) 50 V/cm, (c) 100 V/cm, (d) 150 V/cm, (e) 200 V/cm, (f) 250 V/cm.
Table 5.
EDS analysis results of points in Figure 10 (at.%).
Table 6.
Distribution of Ti5Si3 enhanced phase under different electric field intensities.
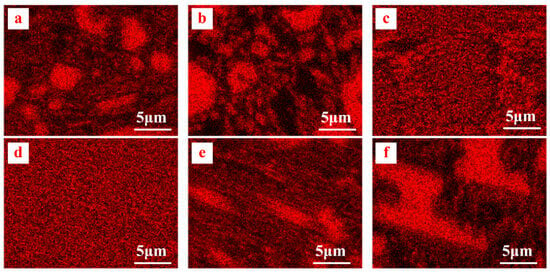
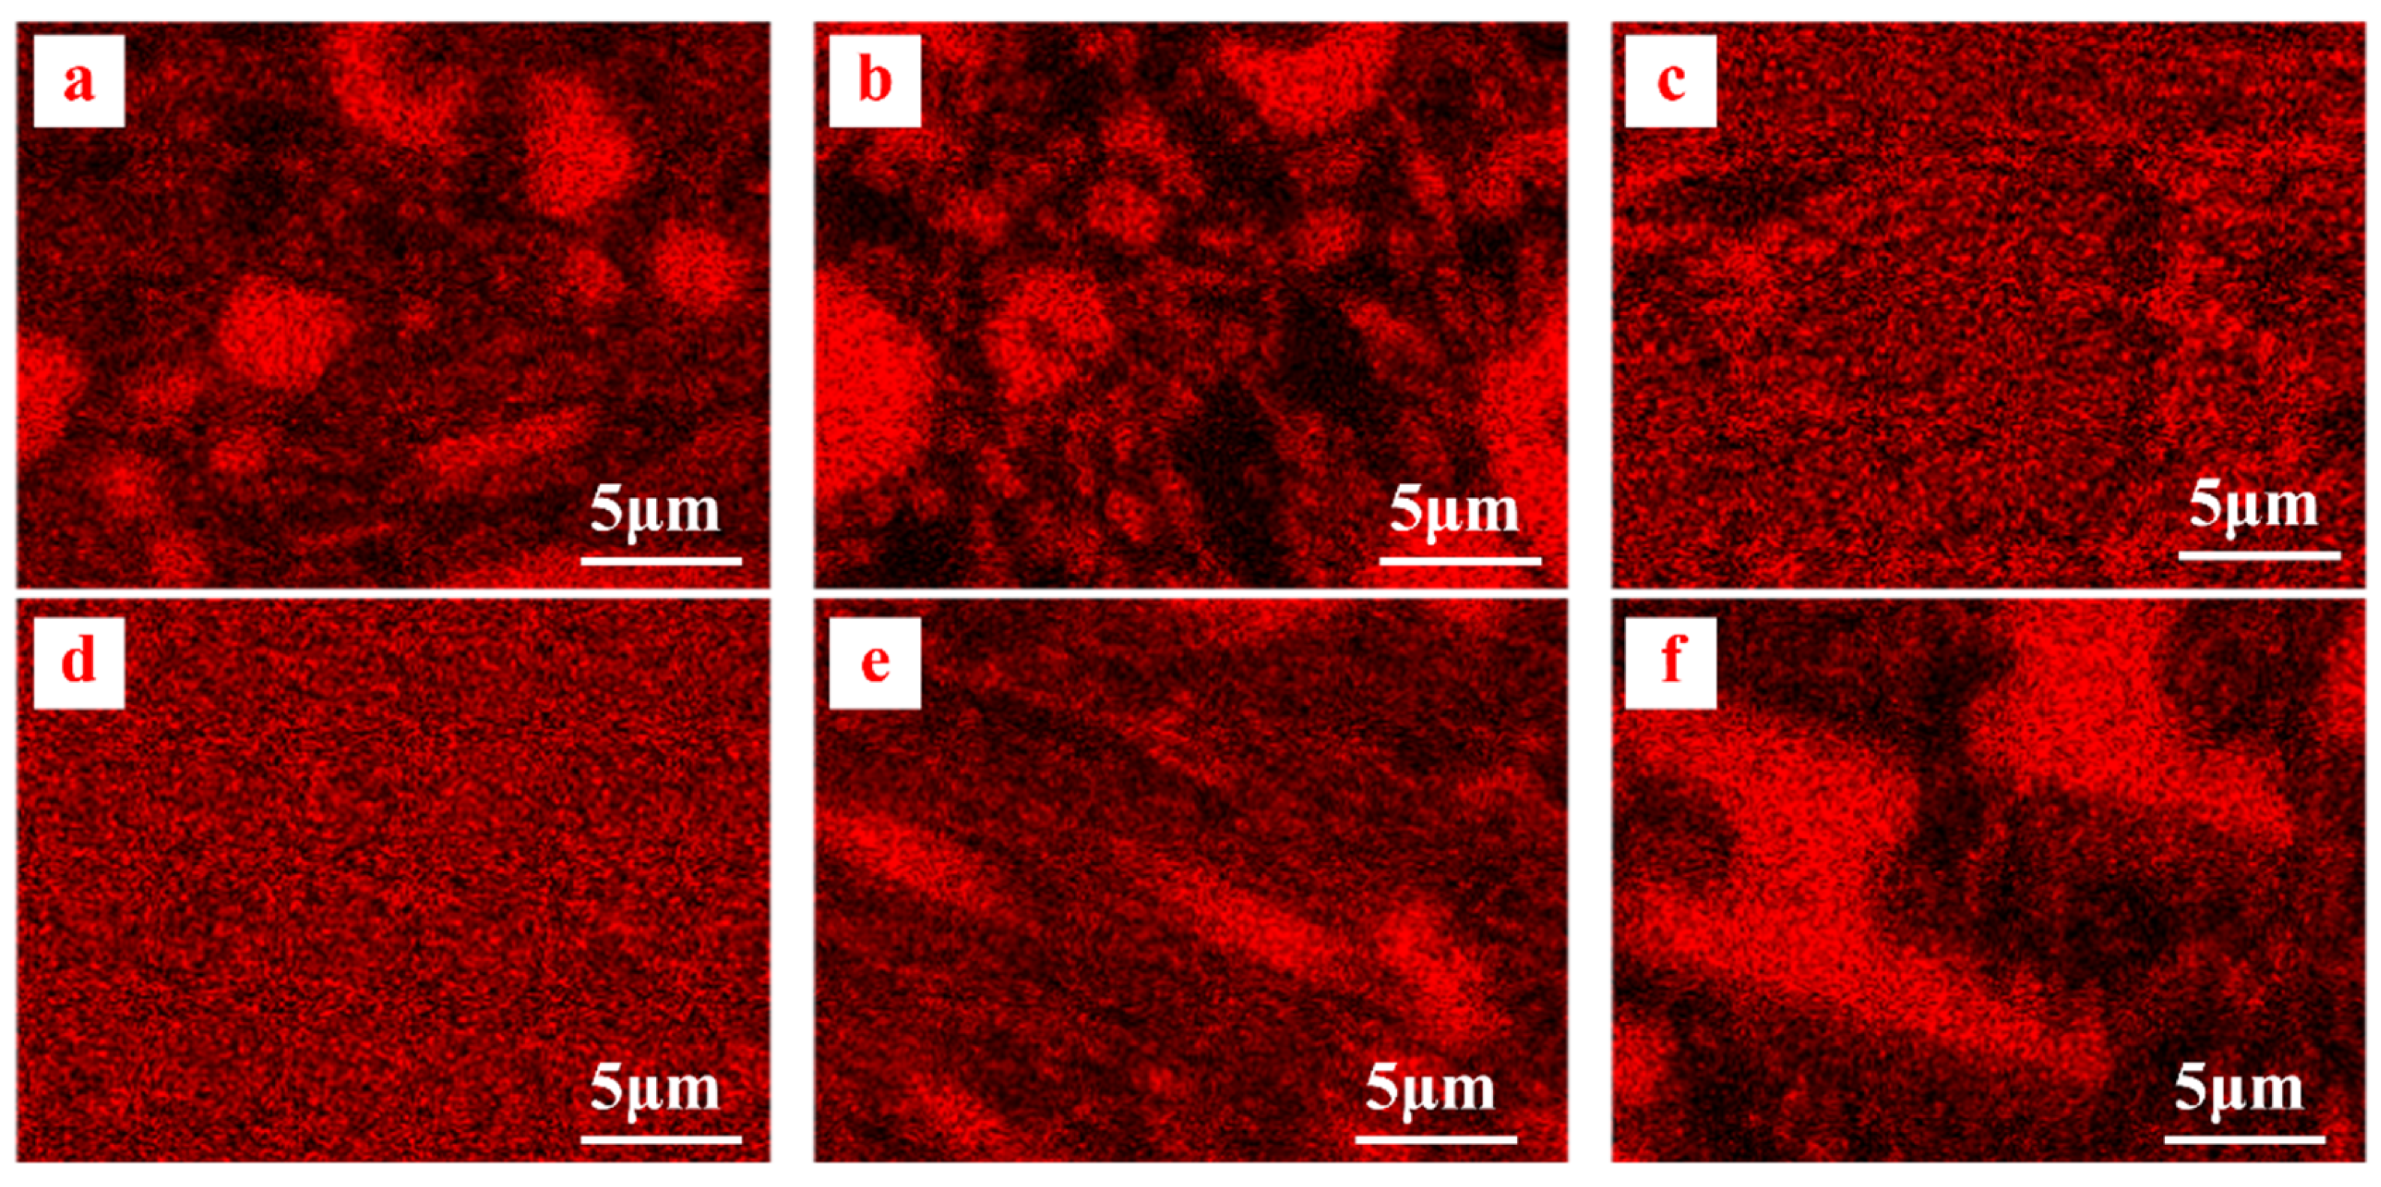
Figure 11 shows the surface scanning maps of the Si element distribution for the fabricated coatings under varying EF conditions, corresponding to Figure 10. At EF = 150 V/cm, the Si element exhibits a diffuse distribution, further confirming that appropriate EF conditions significantly influence the distribution, morphology, size, and quantity of the Ti5Si3 enhanced phase. The refinement and homogenization of the Ti5Si3 enhanced phase can enhance the microhardness and wear resistance of the coating while mitigating the risk of localized cracking caused by the local enrichment of the enhanced phase.
Figure 11.
Surface scanning Si element distribution of DLD coatings: (a) 0 V/cm, (b) 50 V/cm, (c) 100 V/cm, (d) 150 V/cm, (e) 200 V/cm, (f) 250 V/cm.
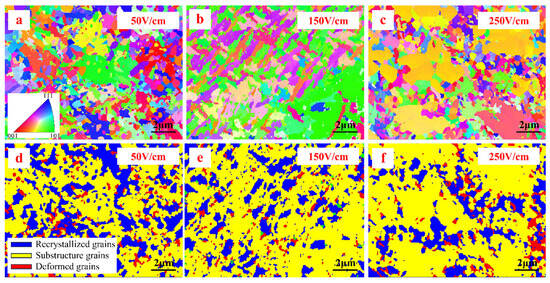
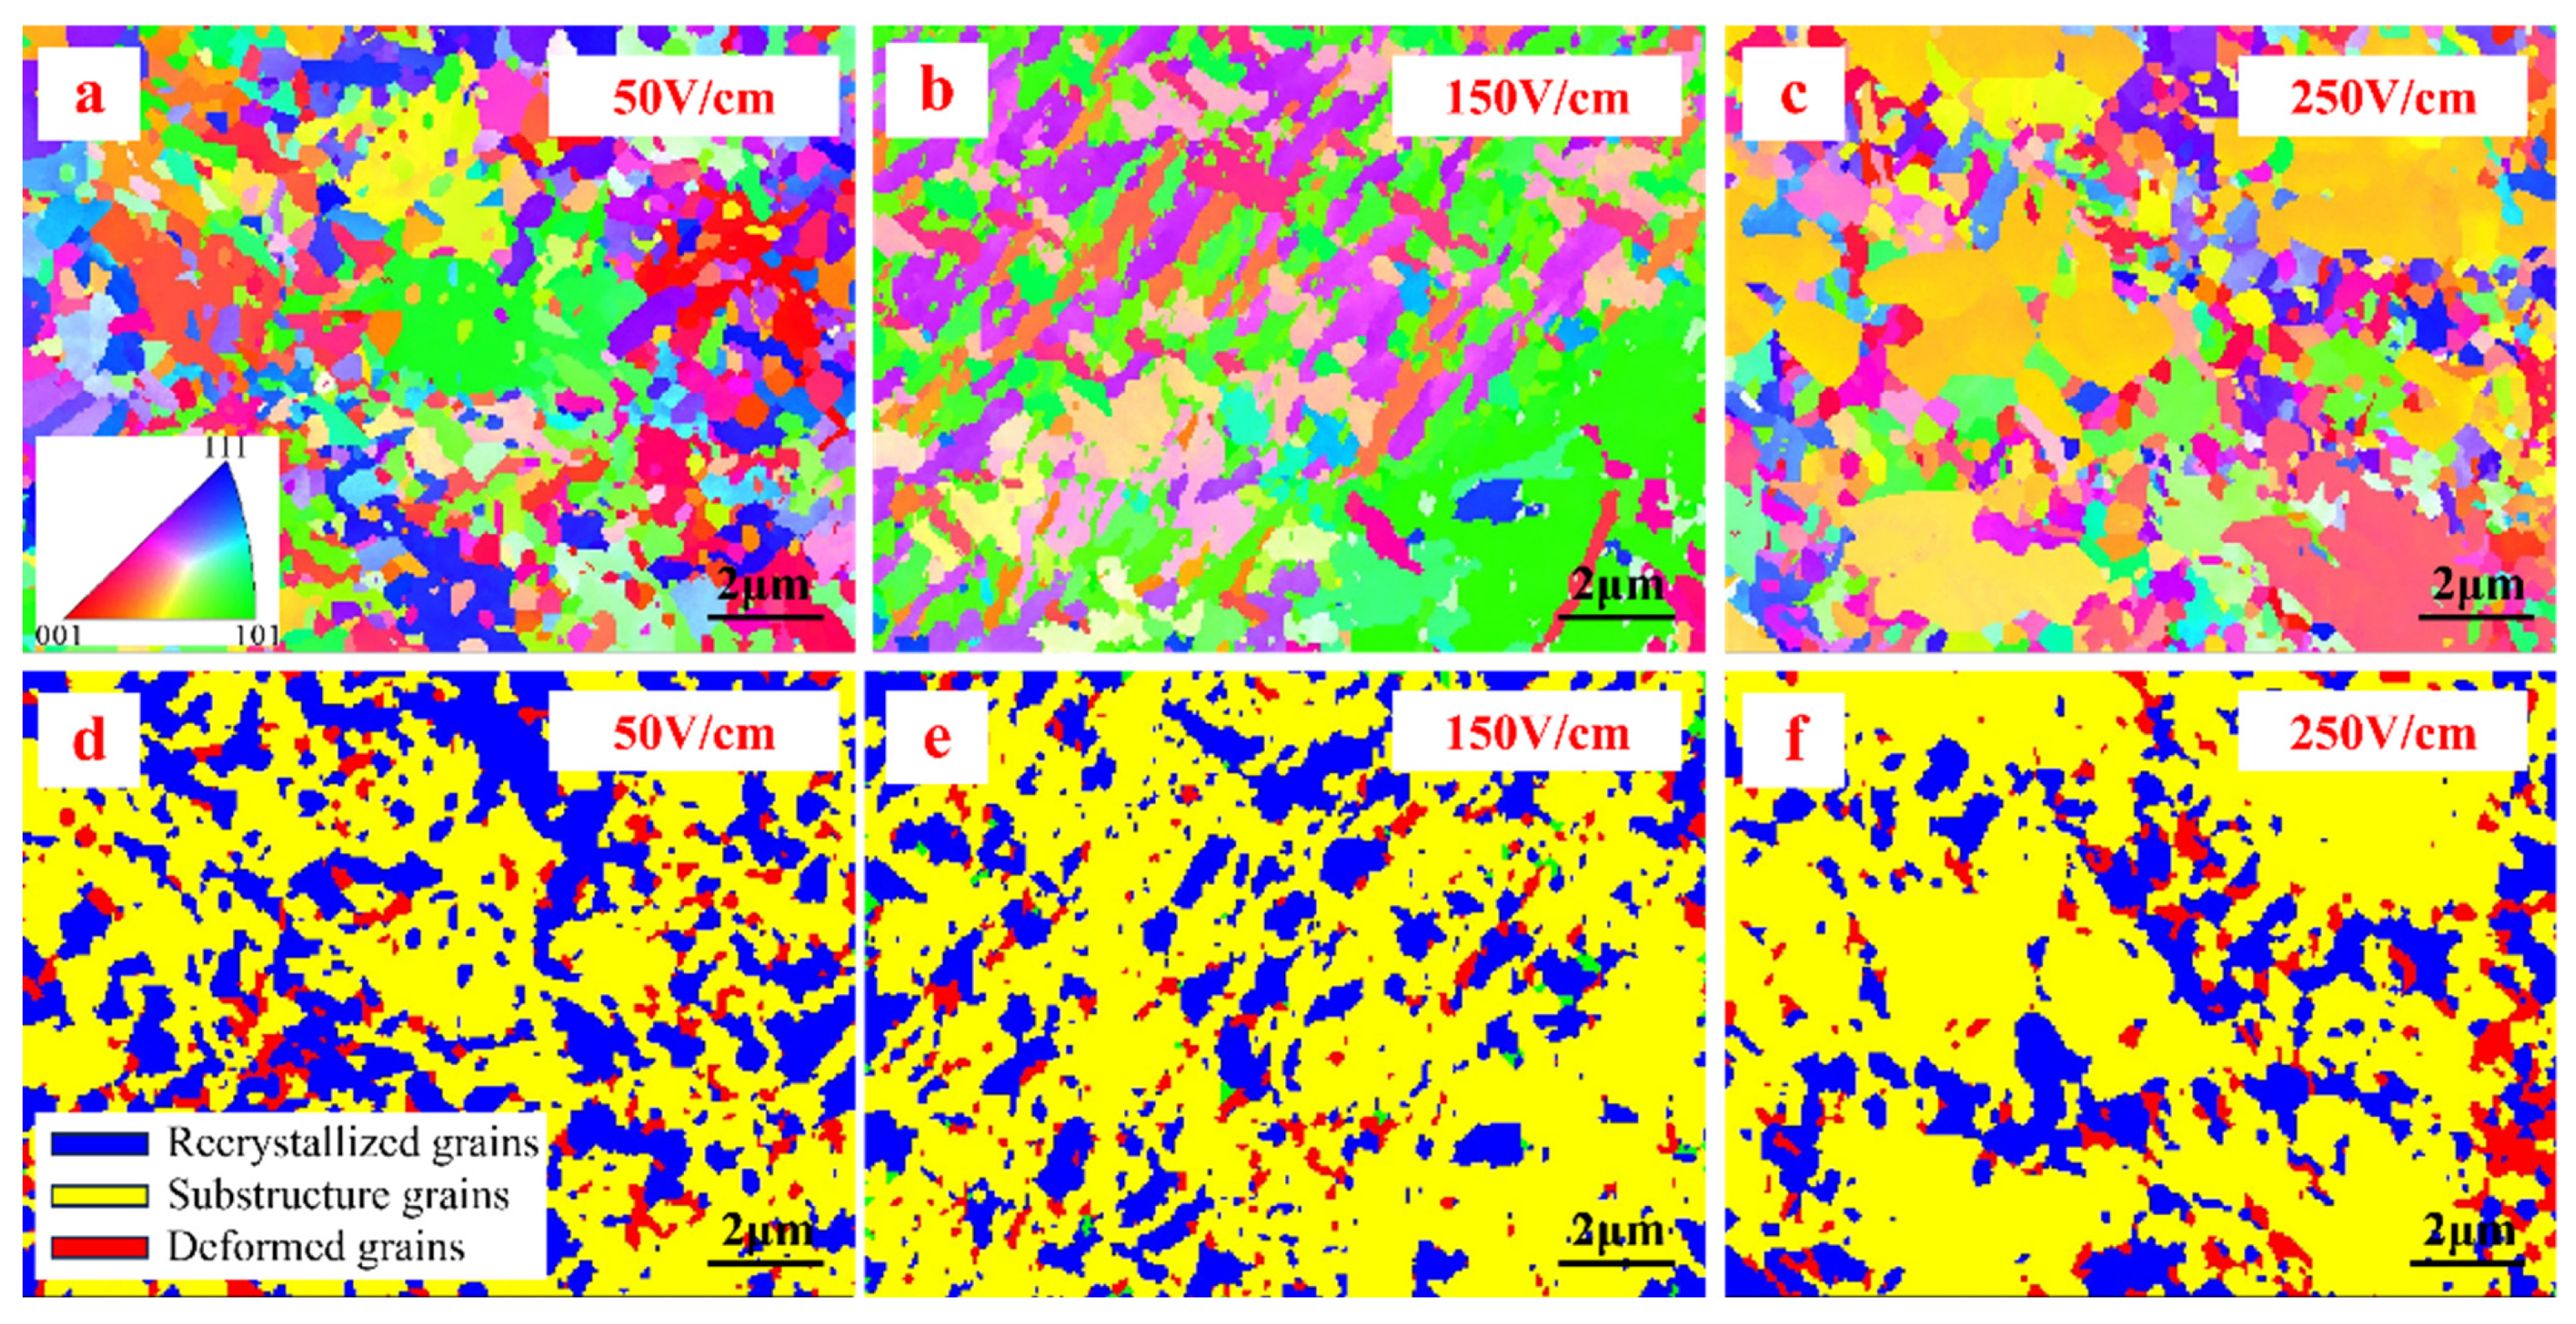
The above phenomenon indicates that distinct electrostatic fields affect solidification behavior. Further microstructure evolution analysis under different EF intensities was performed using EBSD. Crystal orientations are shown in Figure 12a–c. An increase in EF causes the crystals to transition from a non-oriented state to a {101} orientation. This occurs because higher solidification rates reduce thermal diffusion during solidification, suppressing the formation of recrystallized grains (Figure 12d–f) and promoting the growth of similarly oriented grains. As solidification progresses, the continuous growth of grains accompanied by the nucleation of new grains induces intergranular compressive deformation, significantly increasing the proportions of substructures and deformed grains, thereby facilitating the formation of finer grains. Excessive EF (>150 V/cm) promotes the agglomeration and recrystallization of substructured grains, resulting in a weakened crystal orientation.
Figure 12.
EBSD analysis of different EF-assisted DLD coating cross-sections: (a–c) Crystal orientation diagram, (d–f) Grain classification diagram.
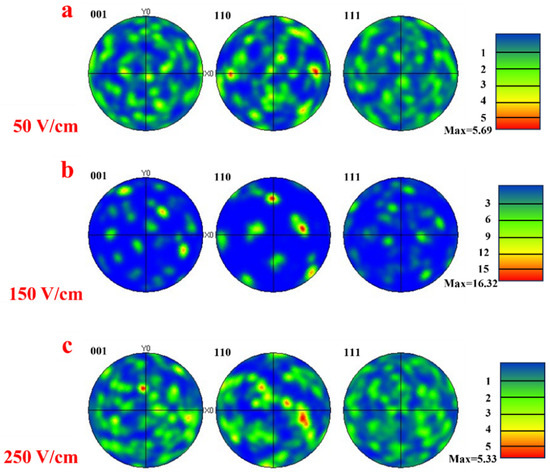
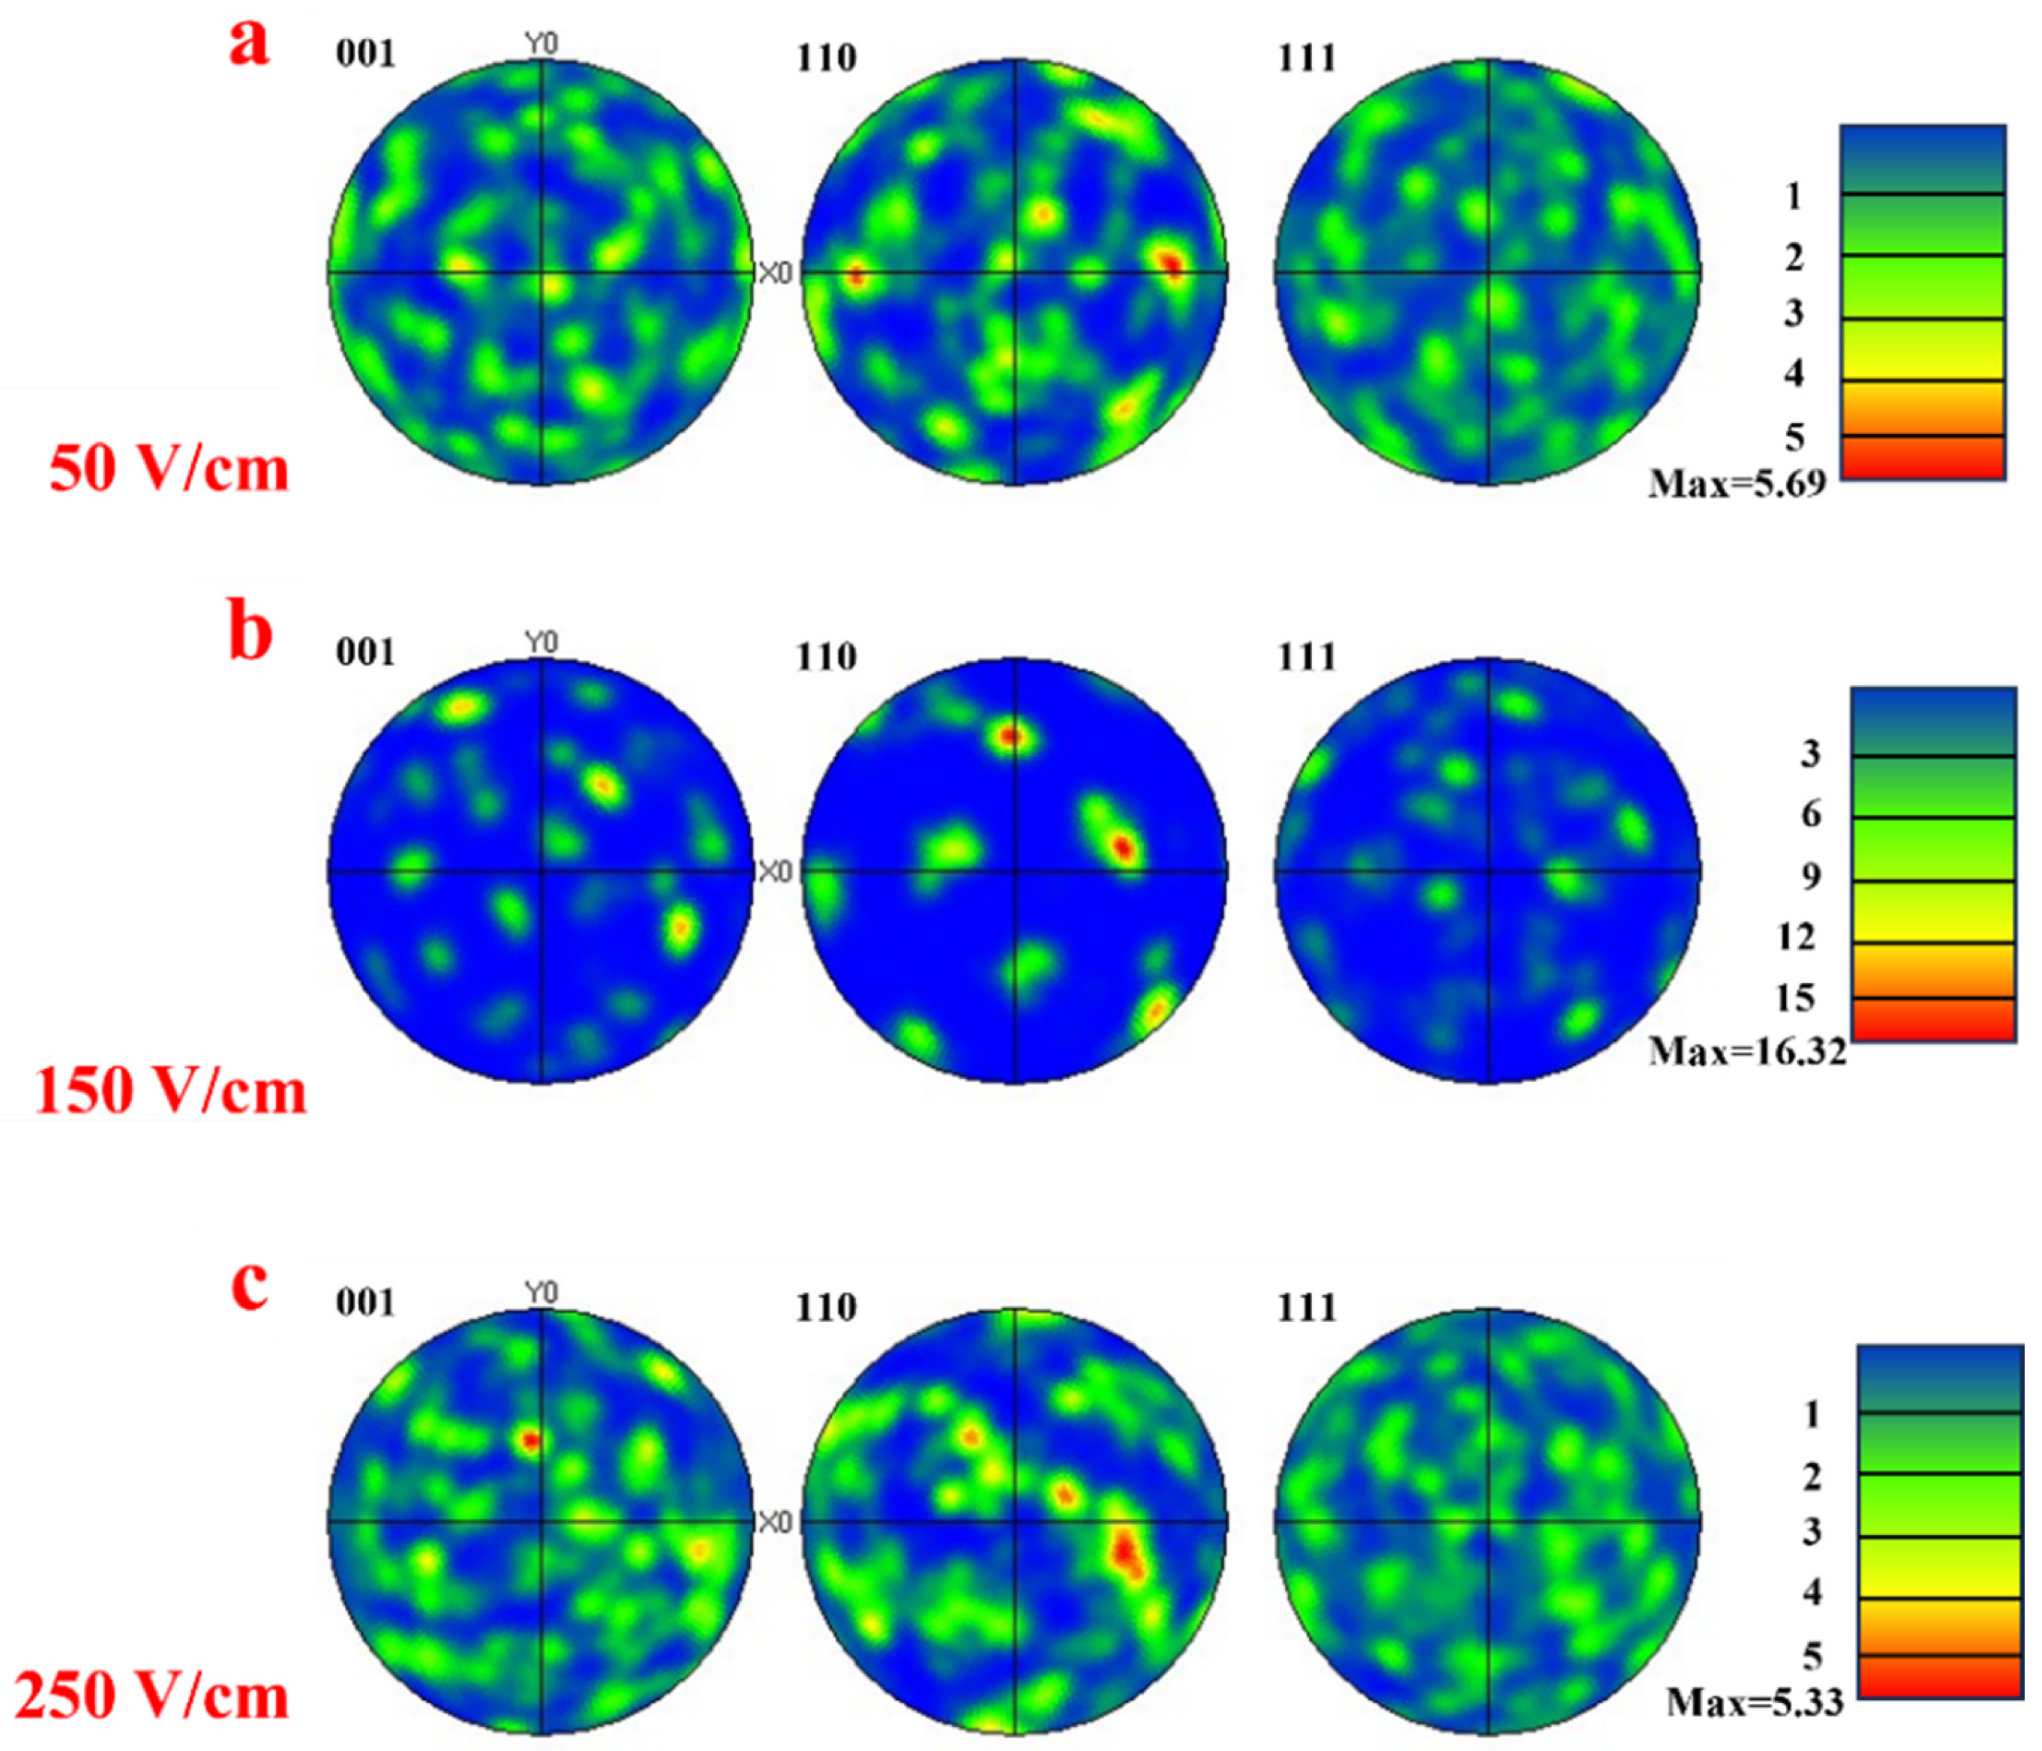
Figure 13 shows the pole figures of the electrostatic field-assisted DLD coatings under different EF conditions. At low EF, the crystals preferentially grow along the {100} crystal plane family, exhibiting no strong texture characteristics. However, when the EF increases to 150 V/cm (as shown in Figure 13b), the coating develops a preferred orientation along the {101} crystal plane family due to the formation of more substructured grains and deformed grains. This texture feature will hinder the movement of grain boundary dislocations during friction.
Figure 13.
Polar diagram of different EF-assisted DLD coatings: (a) 50 V/cm, (b) 150 V/cm, (c) 250 V/cm.
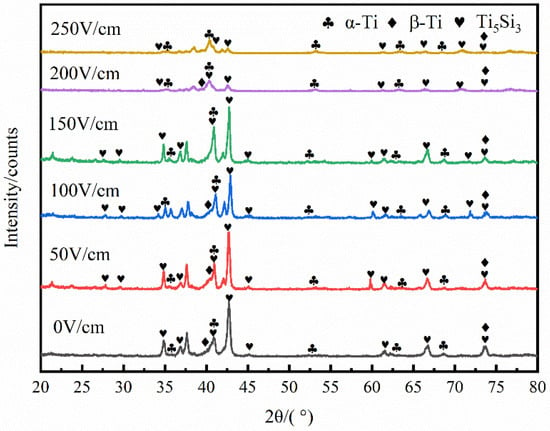
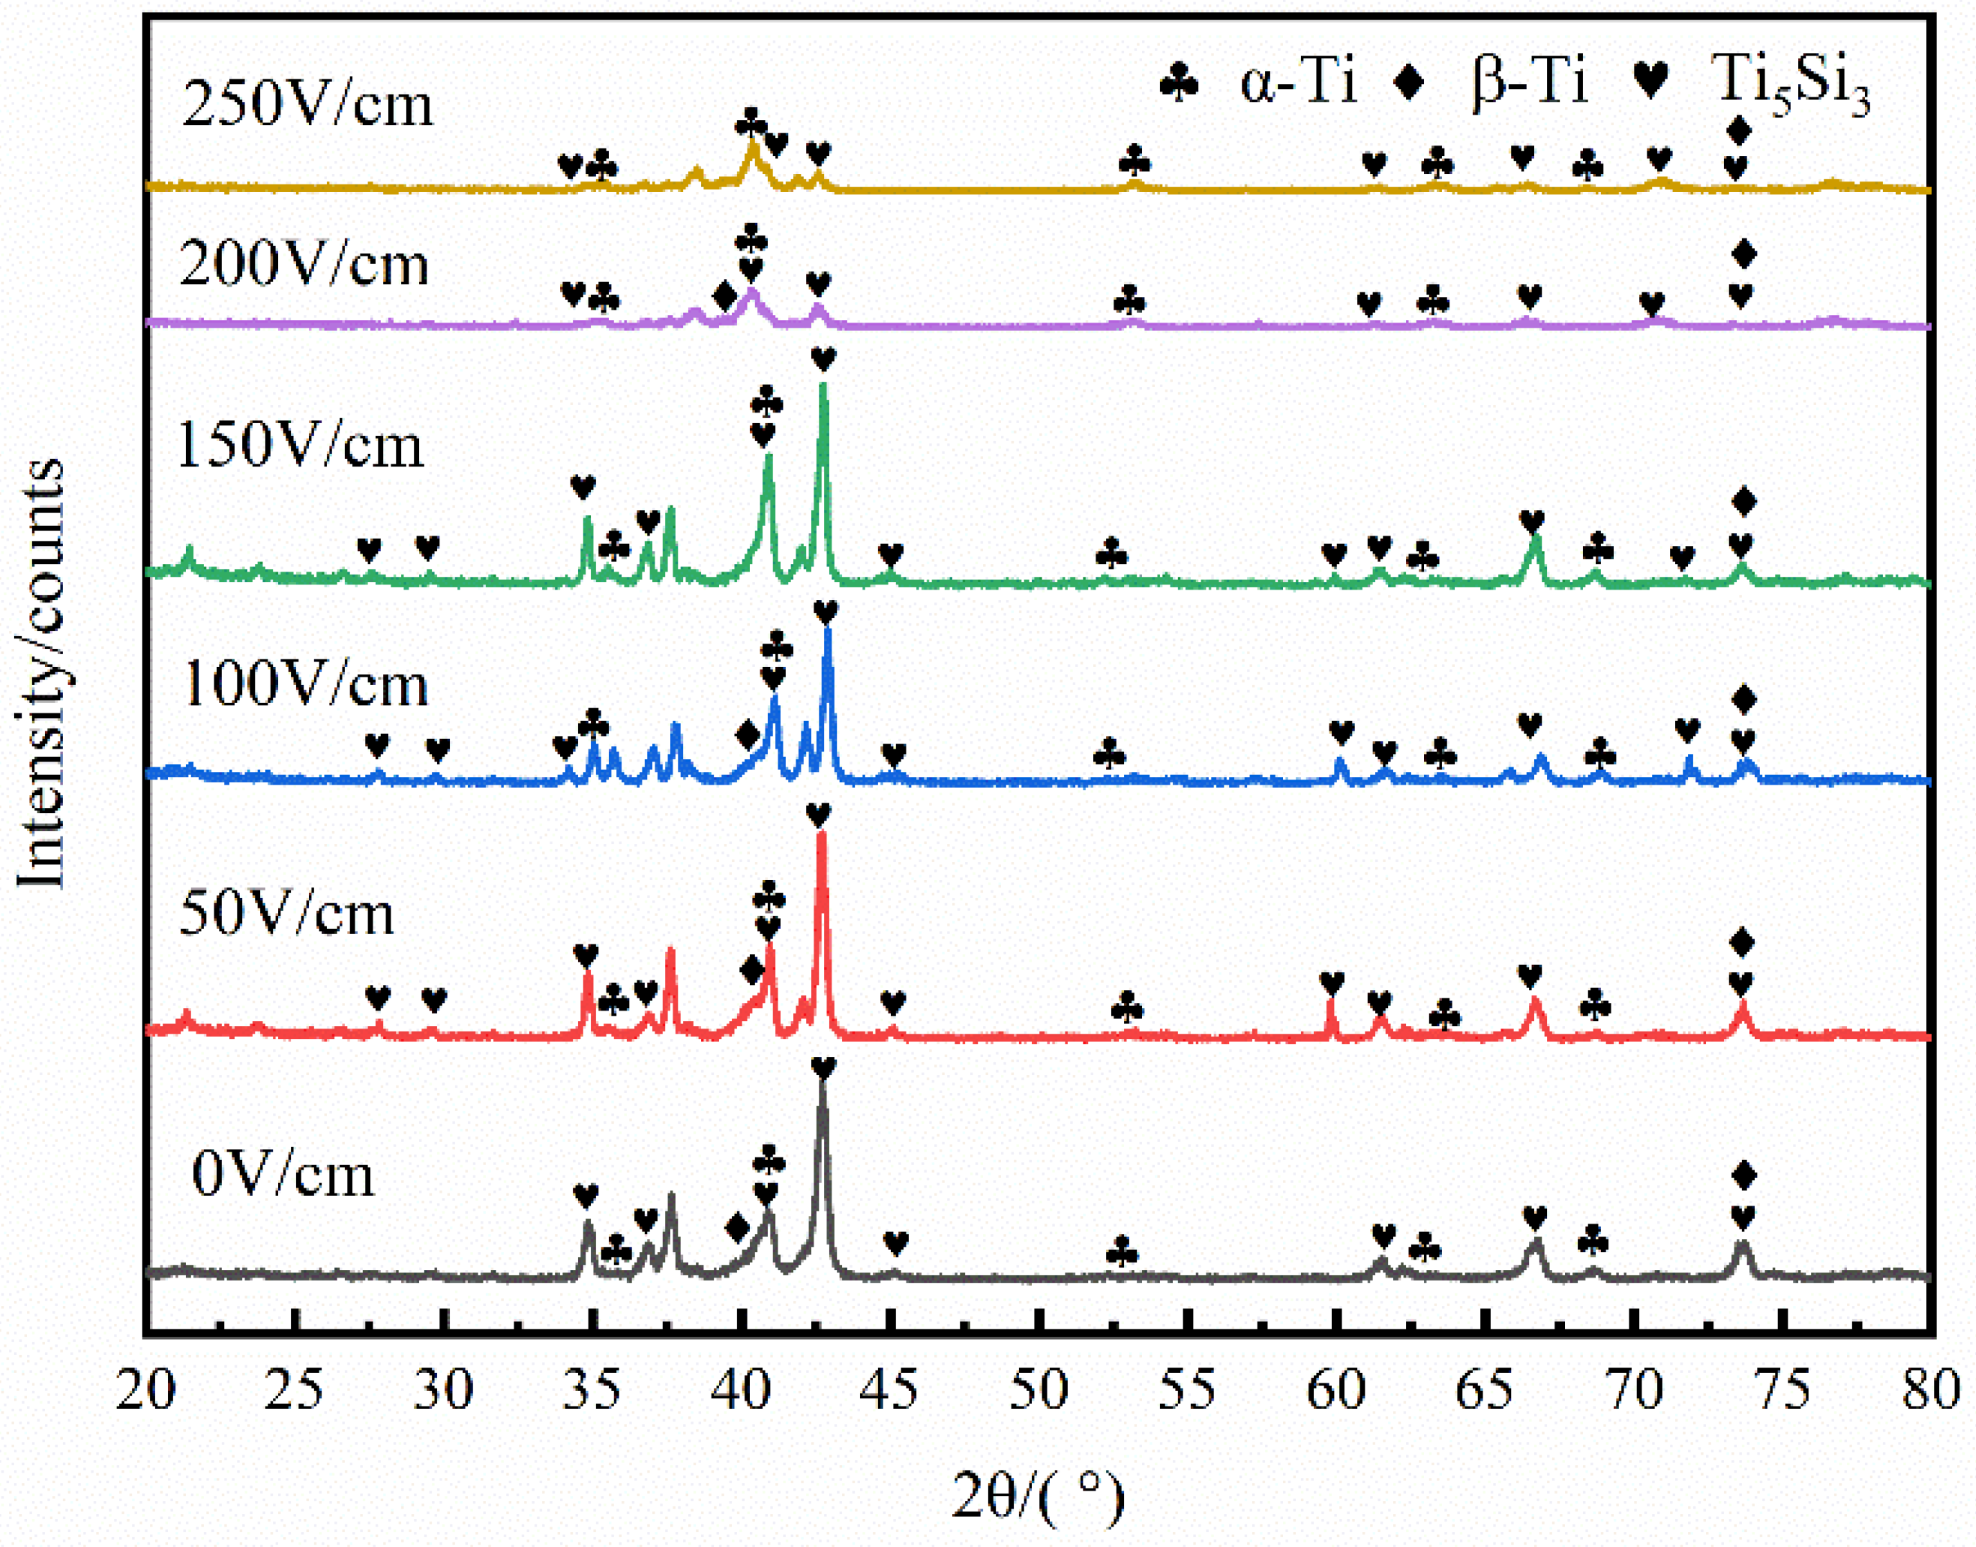
Figure 14 presents XRD patterns of the electrostatic field-assisted DLD Ti-Al-Si coatings under varying EF conditions, confirming the presence of α-Ti, β-Ti, and Ti5Si3 enhanced phases. This indicates that variations in EF do not alter the phase composition of the coatings. The average grain size of the DLD coatings can be estimated using the Scherrer formula [34]:
where B is the full width at half maximum (FWHM) of the diffraction peak, θ is the diffraction angle, λ is the X-ray wavelength, and Dc is the average grain size. The FWHM value (B) of the Ti5Si3 primary peak reaches a maximum of 0.5247° at EF = 150 V/cm. This indicates that the size of the Ti5Si3 enhanced phase is the smallest at an EF of 150 V/cm, which is consistent with the SEM and EBSD observations mentioned above.
Figure 14.
XRD pattern of DLD Ti-Al-Si coating assisted by an electrostatic field.
4.3. Solidification Behavior and Grain Refinement Process
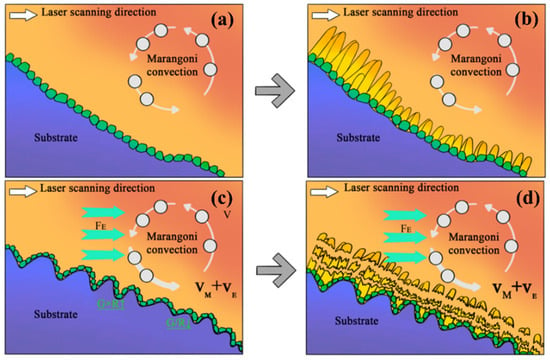
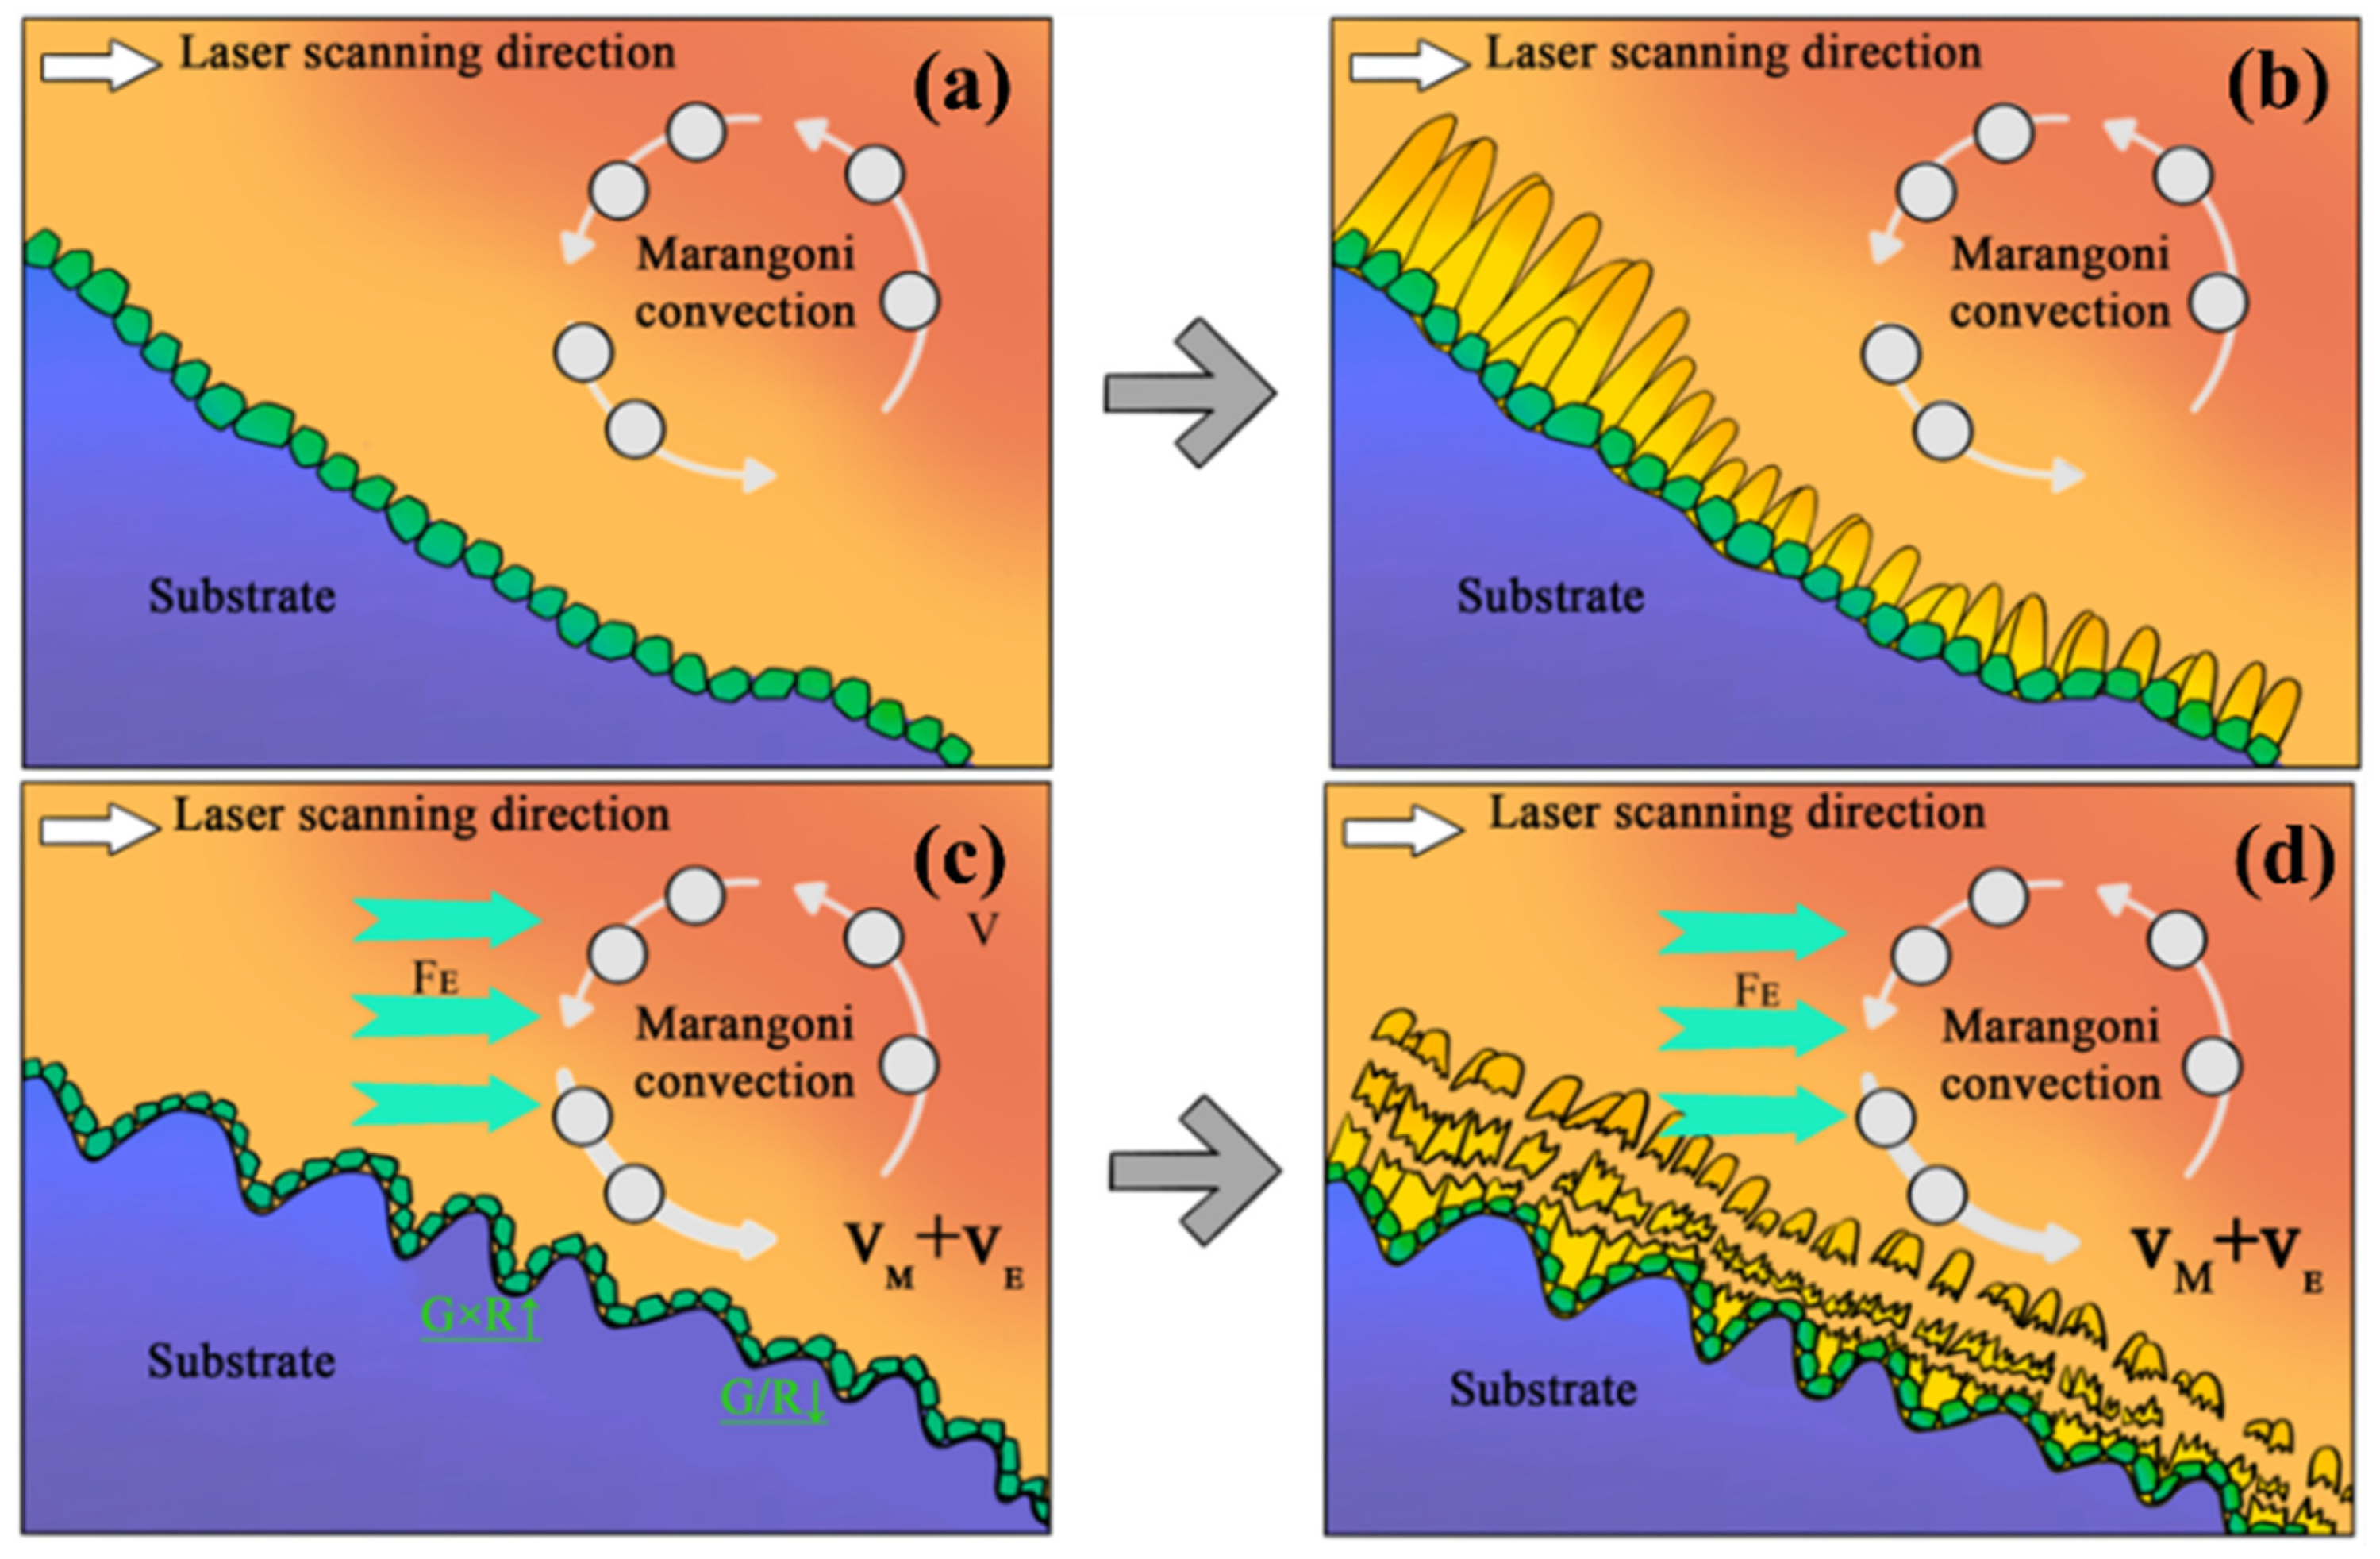
Figure 15 illustrates the solidification mechanism of electrostatic field-assisted DLD Ti-Al-Si coatings. As indicated by the circular arrows in Figure 15a, molten pool flow is primarily driven by the surface tension gradient-induced Marangoni convection (vM), where the front primary vortex and the rear secondary vortex collectively propel high-speed melt flow. In the initial stage of solidification, the product of G and the solidification rate (R = 0.8 m/s) at the solid–liquid interface far exceeds the critical constitutional undercooling threshold, promoting epitaxial grain growth along the thermal gradient direction and forming coarse columnar grains (Figure 15b). Under electrostatic field-assisted DLD conditions, electromigration forces (FE) induce localized melt flow (vE) near the solid–liquid interface, which increases G × R while decreasing G/R, thereby forming finer equiaxed grains (Figure 15c). During the continuous grain growth process shown in Figure 15d, the increased flow velocity (vM + vE) weakens the preferential growth direction of columnar grains, triggering dendrite fragmentation and promoting grain nucleation and refinement.
Figure 15.
Mechanism diagram of solidification behavior: (a,b) non-EF process, (c,d) electrostatic field-assisted.
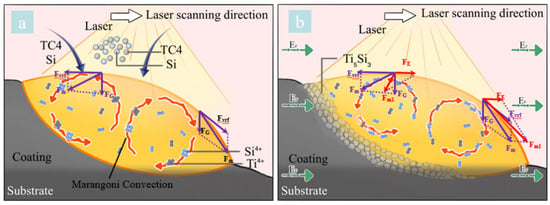
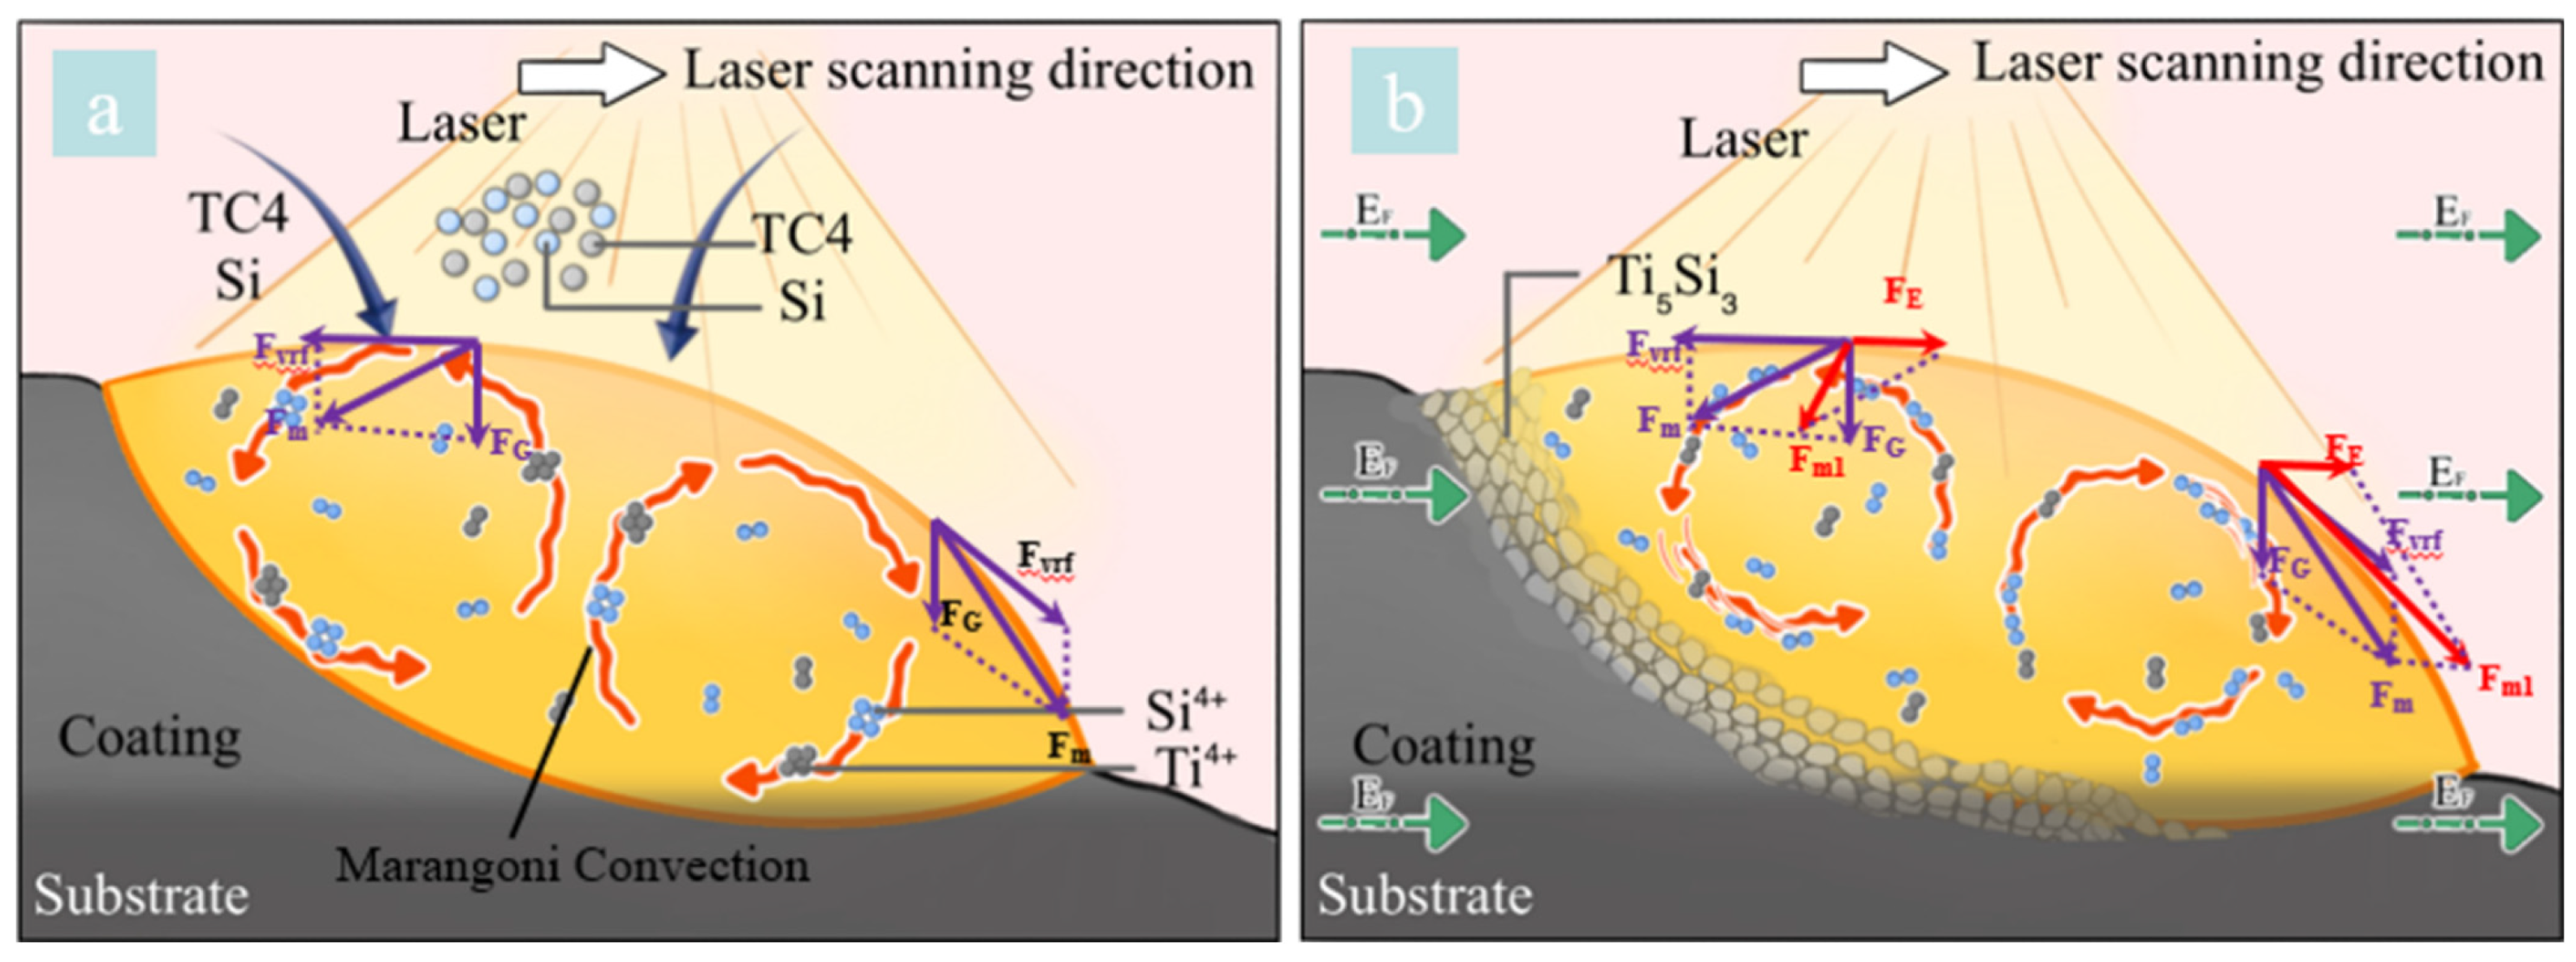
Figure 16 illustrates the nucleation and growth mechanisms of the Ti5Si3 enhanced phase under an electrostatic field. Under high-energy-density irradiation, powder melting generates ionized Ti4+ and Si4+. As depicted in Figure 16a, without an electrostatic field, Ti4+ and Si4+ are subjected to gravitational force (FG) and surface tension (Fσ), driving Marangoni convection flow (FM). When an electrostatic field is applied, dual regulation is triggered through non-equilibrium electrodynamic effects: FE accelerates the movement of free electrons in the melt pool, enhancing collision ionization and increasing ion concentration. During rapid solidification, the diffusion of Si atoms into the Ti lattice facilitates the increased formation of the Ti5Si3 enhanced phase. The electrostatic field modifies Marangoni convection by altering the temperature gradient (G) and solidification rate (R), stabilizing the solid–liquid interface to refine the Ti5Si3 enhanced phase. However, an exGGcessive electrostatic field elevates the Reynolds number (Re), triggering turbulent flow. This turbulence causes heterogeneous temperature fields and compositional segregation, ultimately coarsening the Ti5Si3 enhanced phase.
Figure 16.
The schematic illustrating nucleation and growth mechanisms of Ti5Si3 enhanced phases: (a) non-EF process, (b) electrostatic field-assisted.
4.4. Performance of Electrostatic Field Assisted DLD Coatings
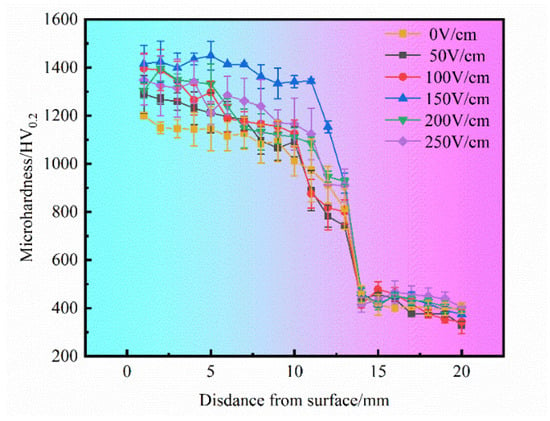
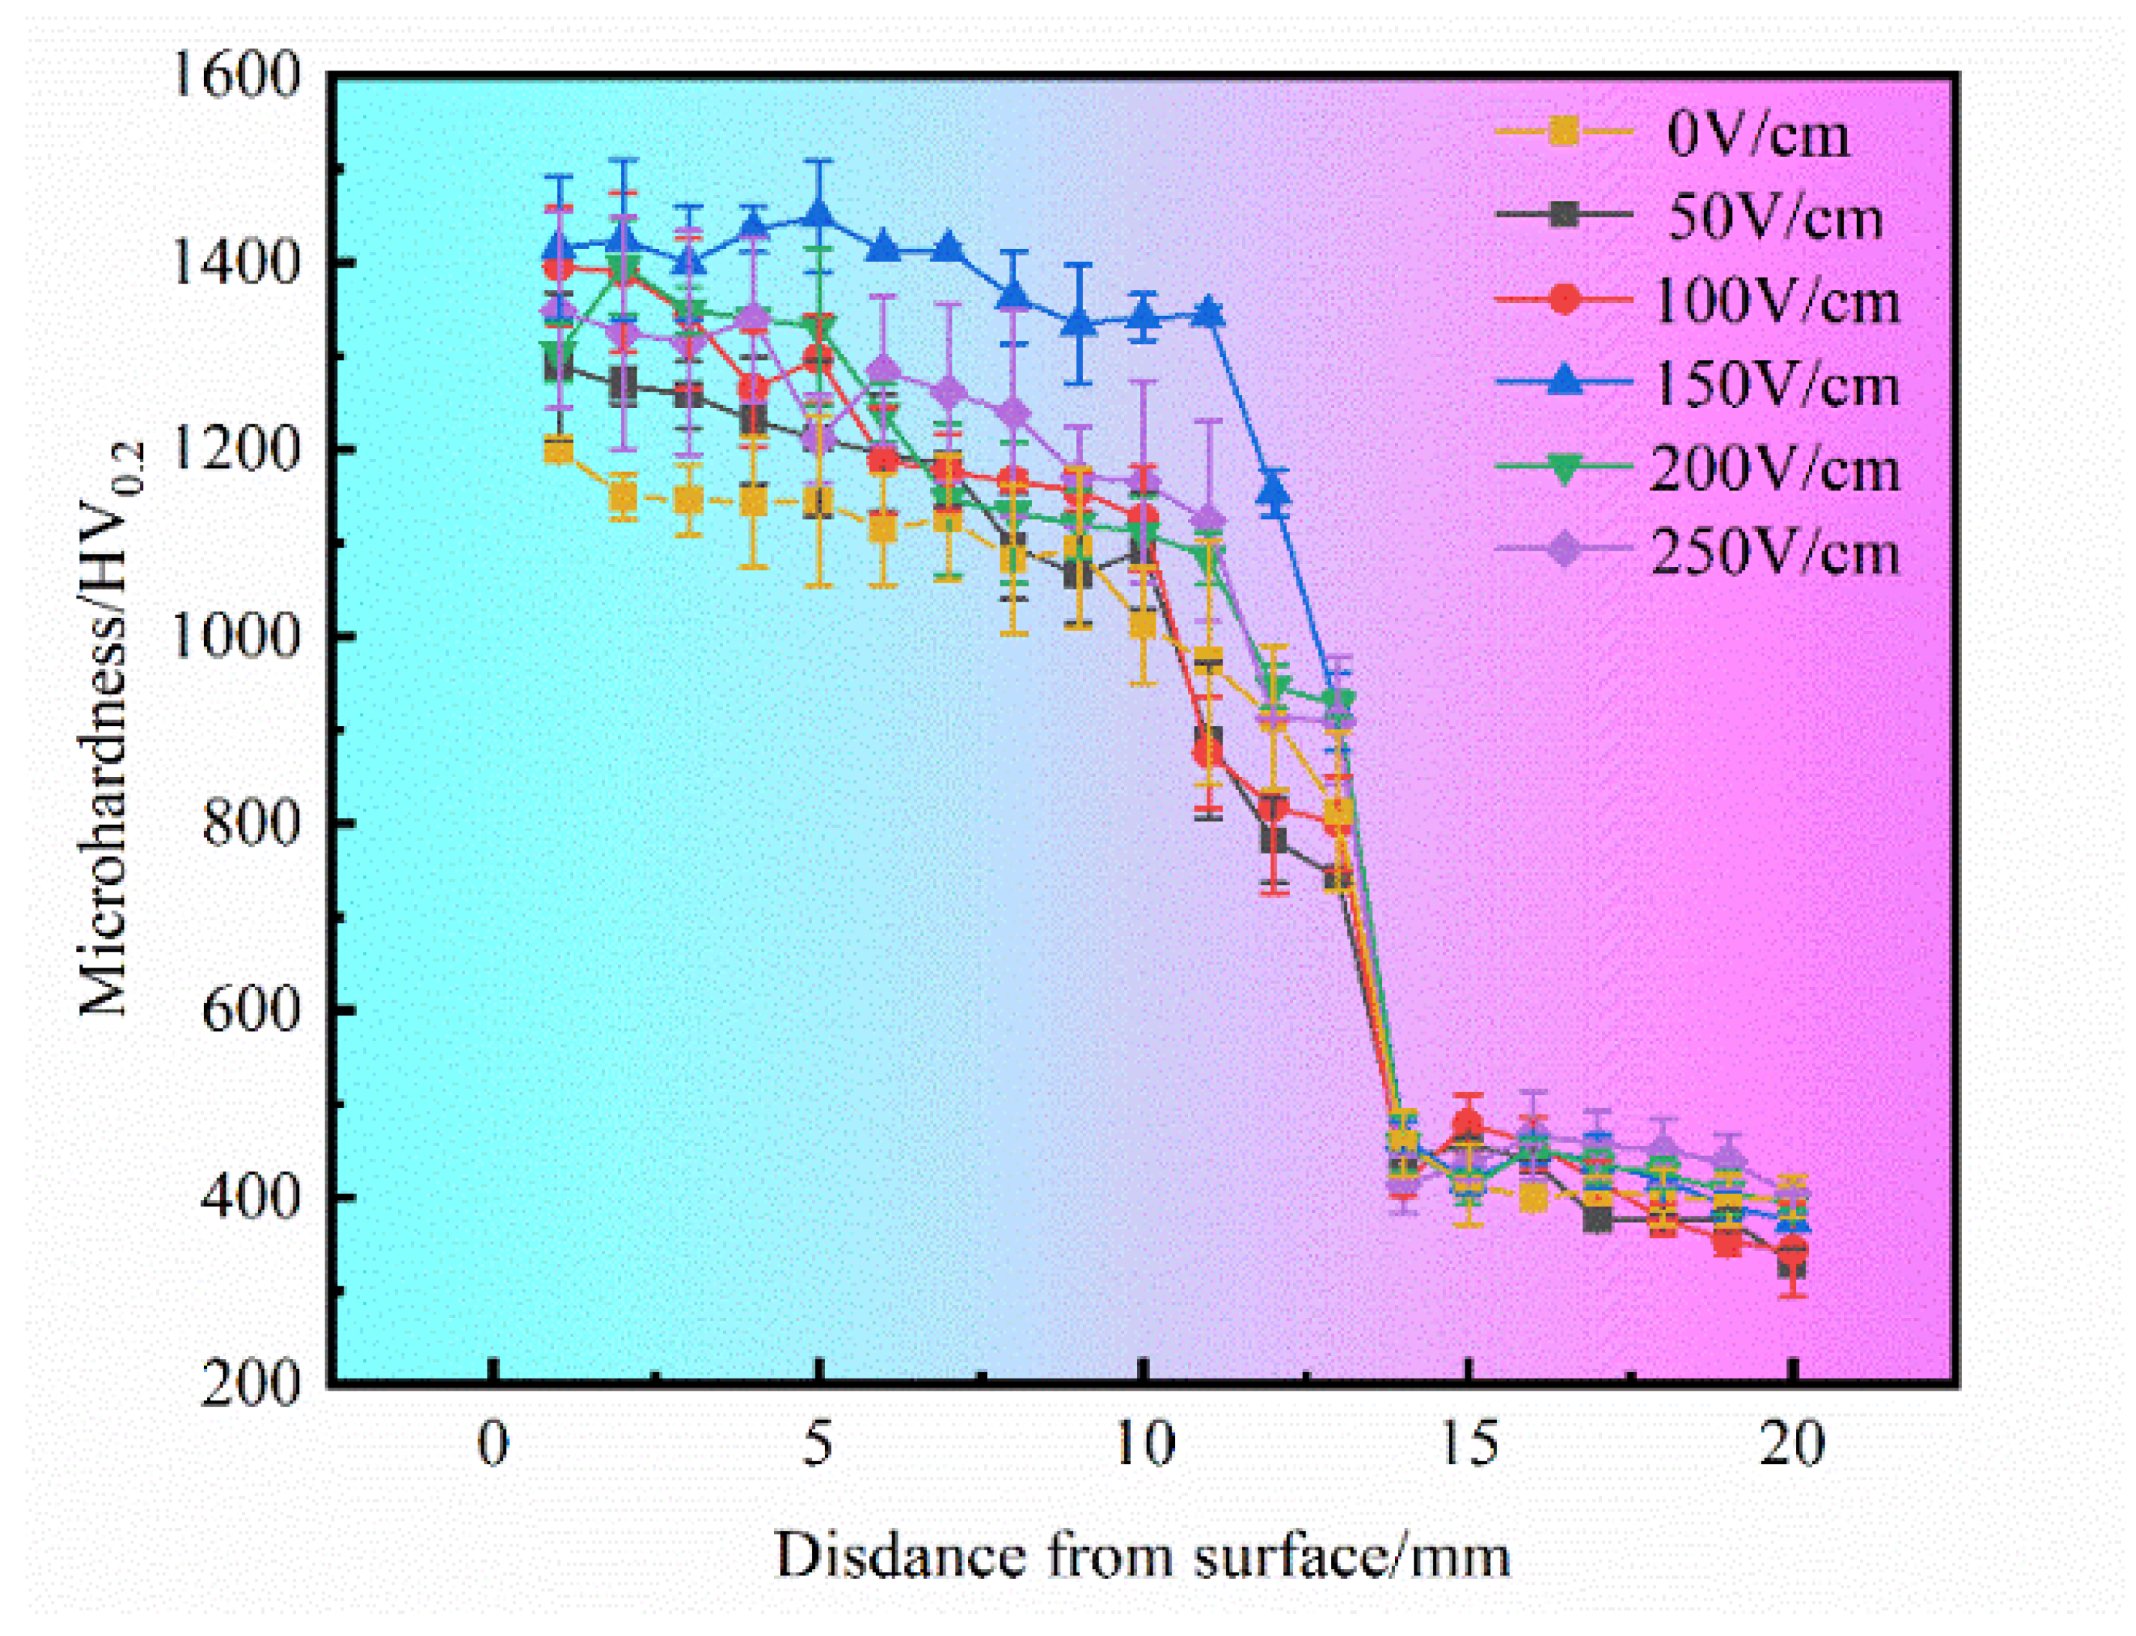
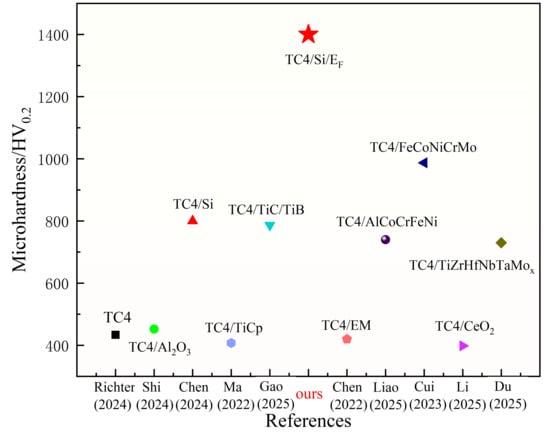
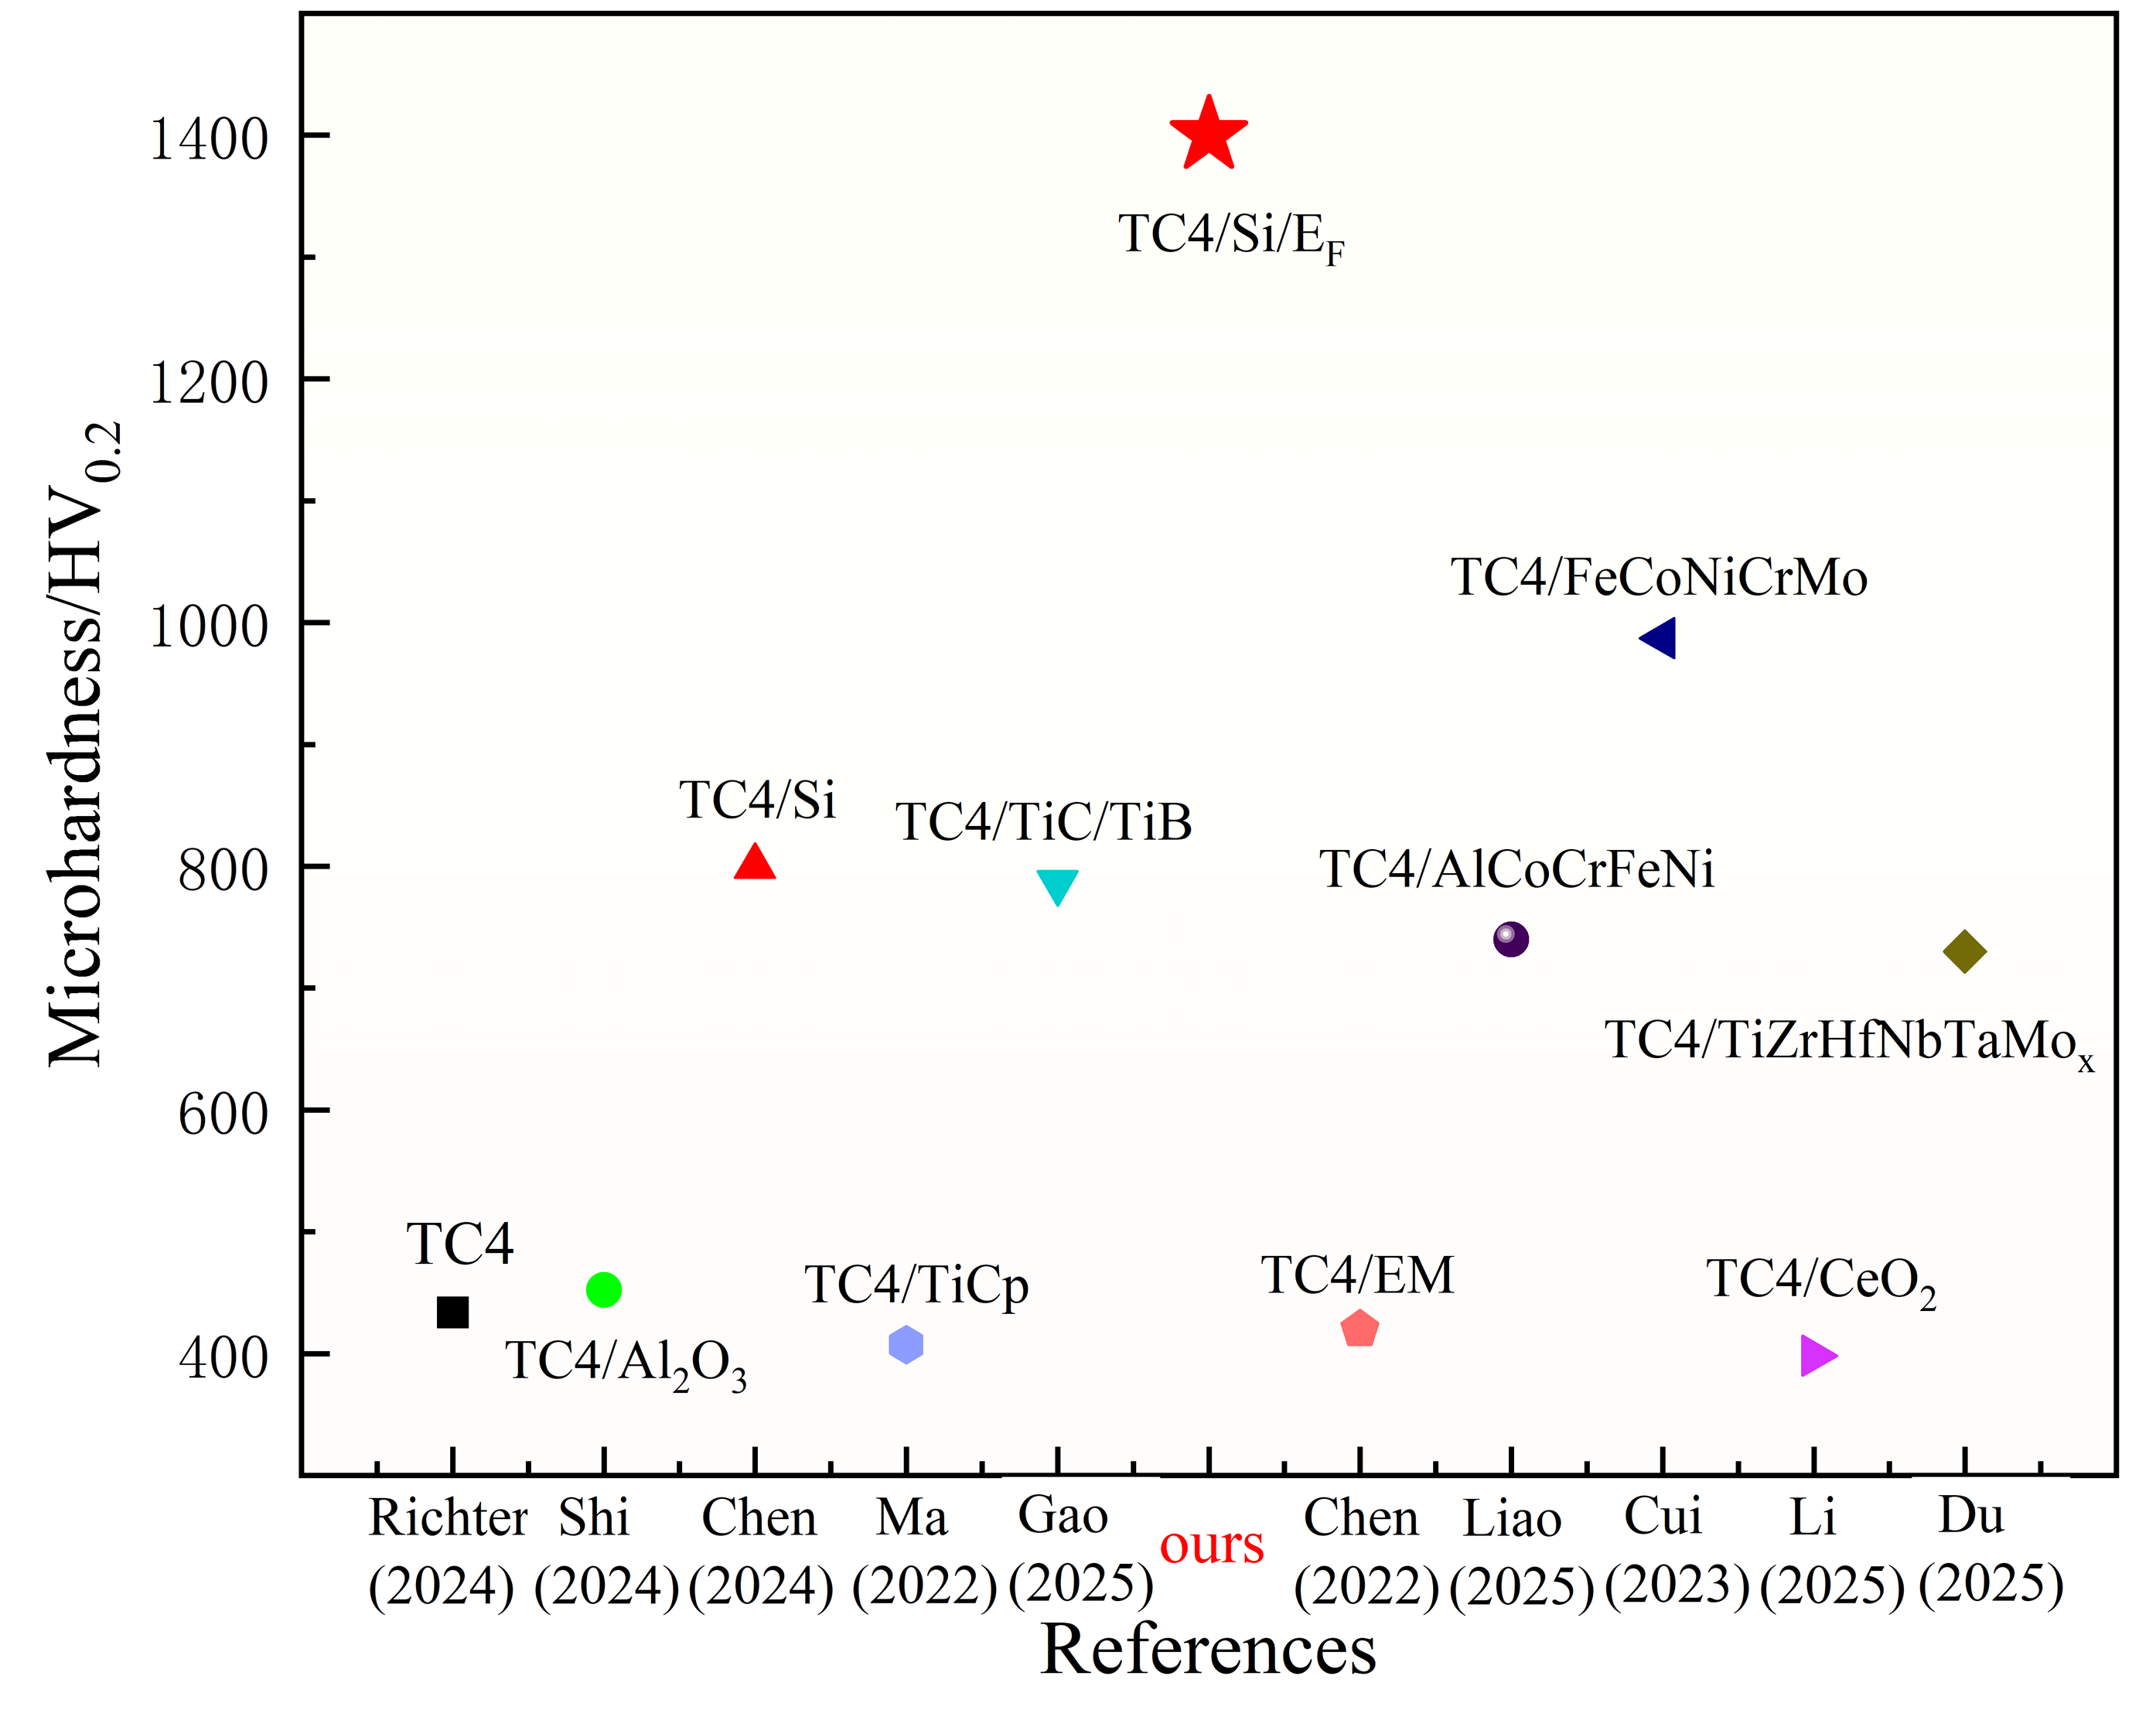
Figure 17 shows the microhardness curves of the coatings under different EF intensities. As the EF increases to 150 V/cm, the average microhardness rises from 1108 ± 53 HV0.2 to 1393 ± 32 HV0.2. However, further increasing the EF from 150 V/cm to 250 V/cm reduces the average microhardness to 1265 ± 45 HV0.2. Notably, the electrostatic field-assisted DLD coatings exhibit significantly higher microhardness than the coating without an EF. This is primarily attributed to the uniform and dense distribution of the Ti5Si3 enhanced phase under the action of the electrostatic field. At EF = 150 V/cm, the Ti5Si3 enhanced phase shows both the highest proportion and the most uniform distribution in the coating, consequently yielding the highest average microhardness, which is 21% higher than that of the coating without an EF. Figure 18 further summarizes the effects of different strengthening elements and applied external fields on the microhardness of TC4 coatings in existing studies, thereby highlighting the performance advantages of this study [35,36,37,38,39].
Figure 17.
Microhardness curve of DLD coatings under different EF conditions.
Figure 18.
Comparison of existing studies on the microhardness of TC4 coatings with different strengthening elements and applied external fields.
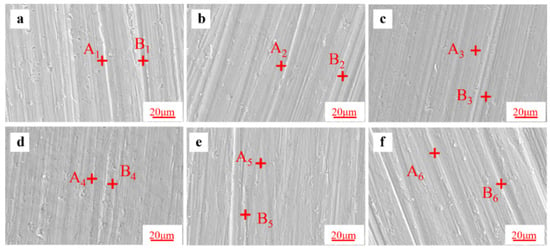
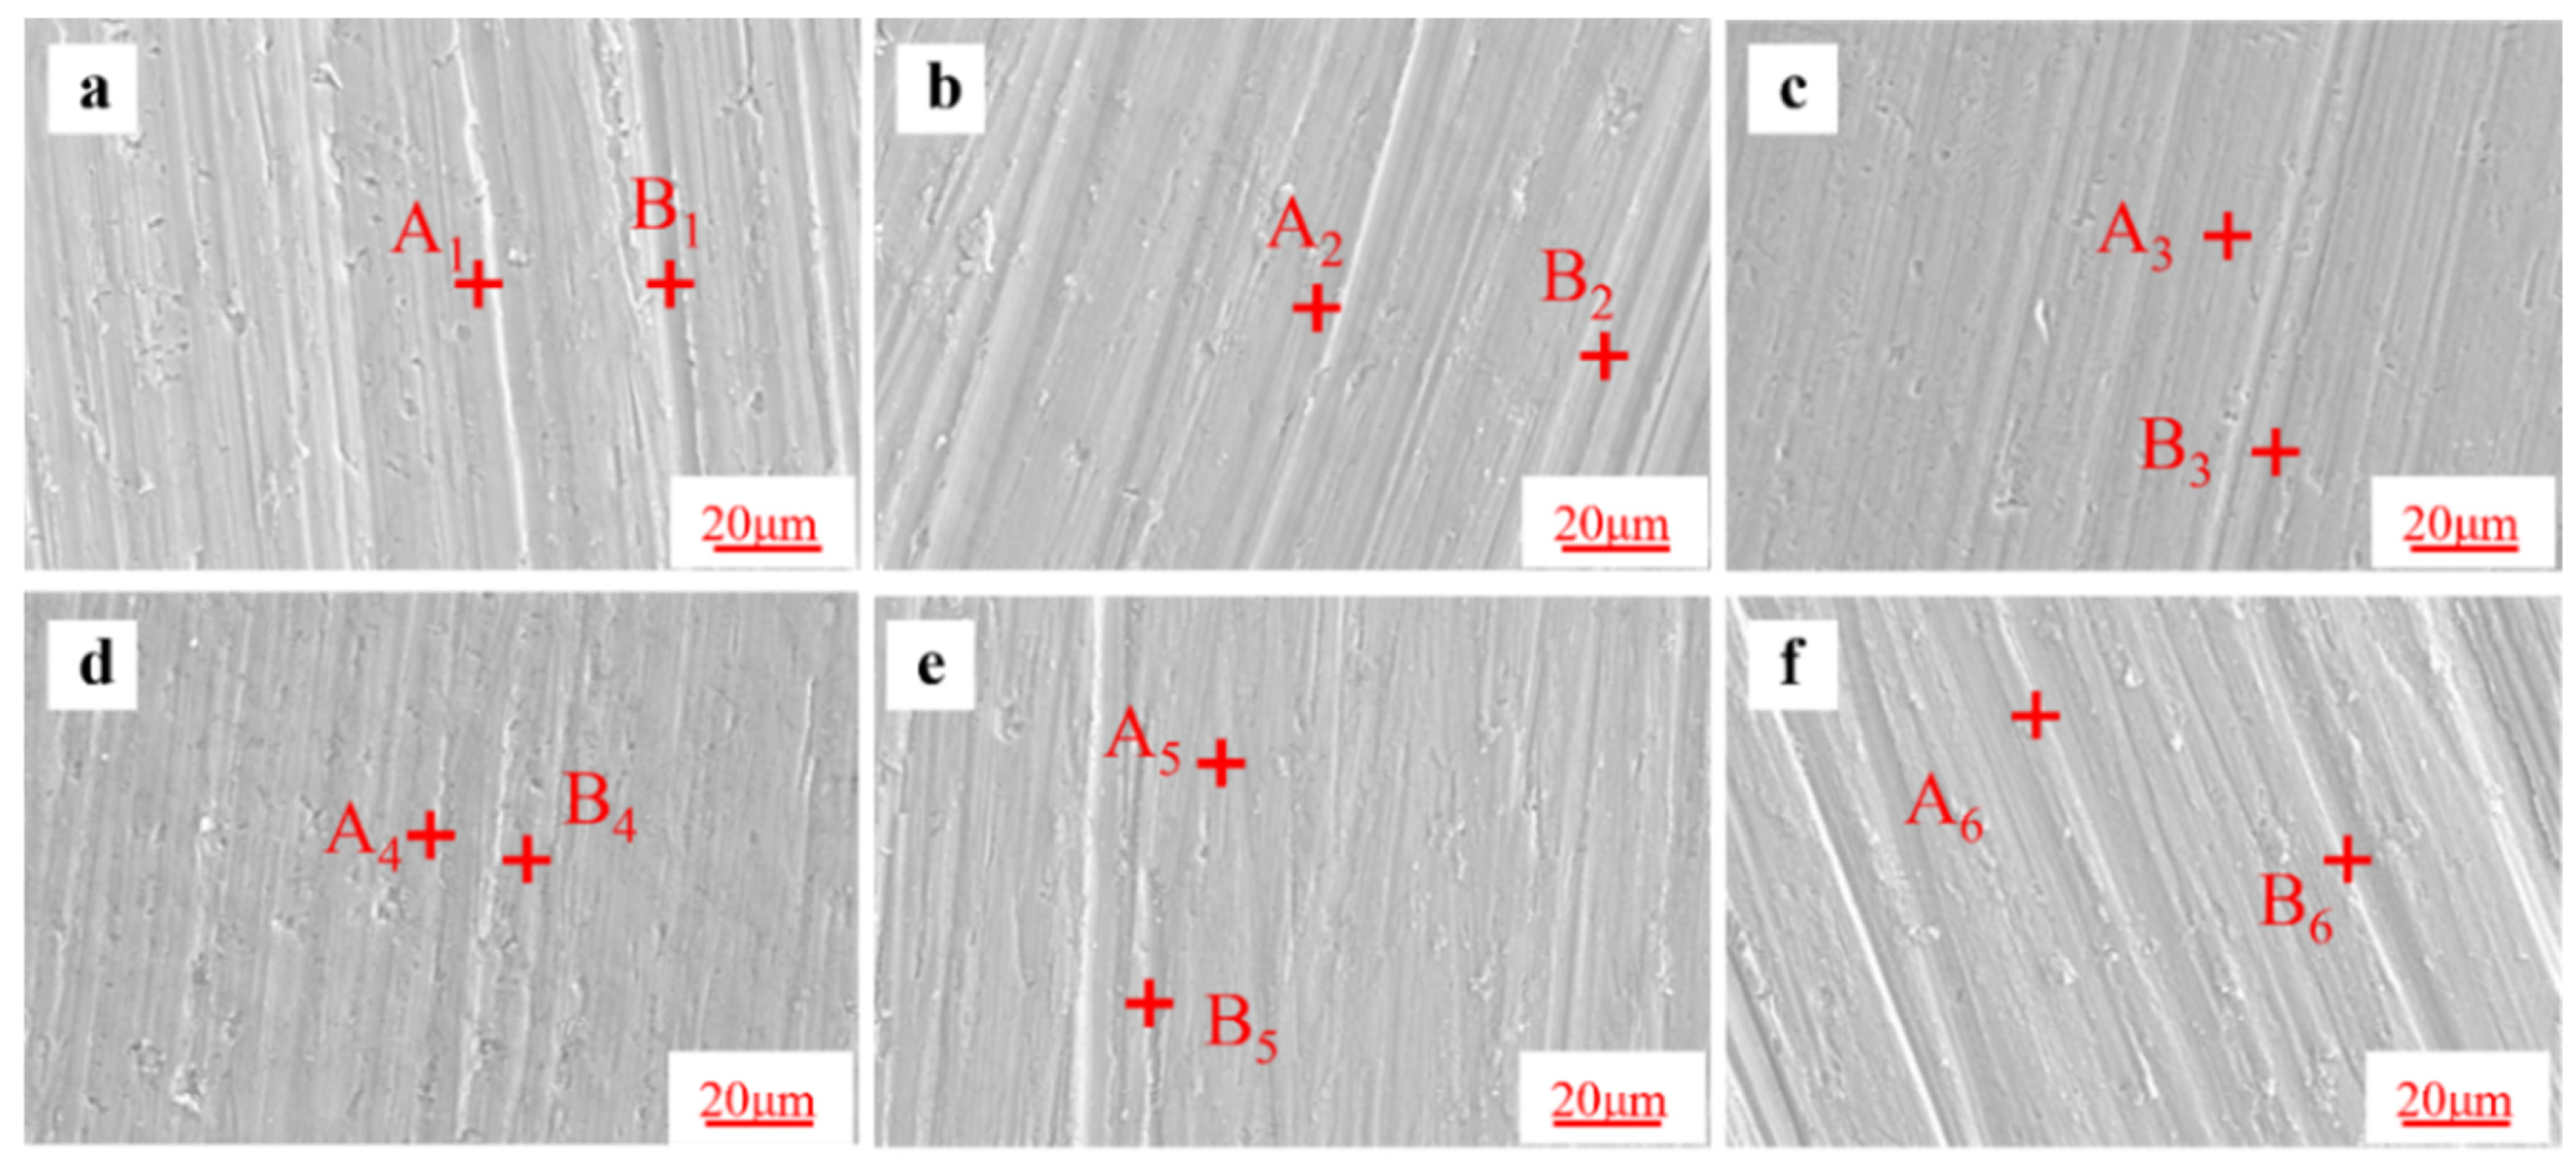
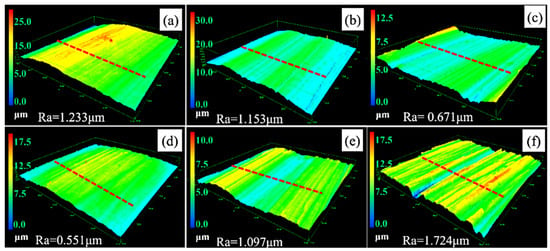
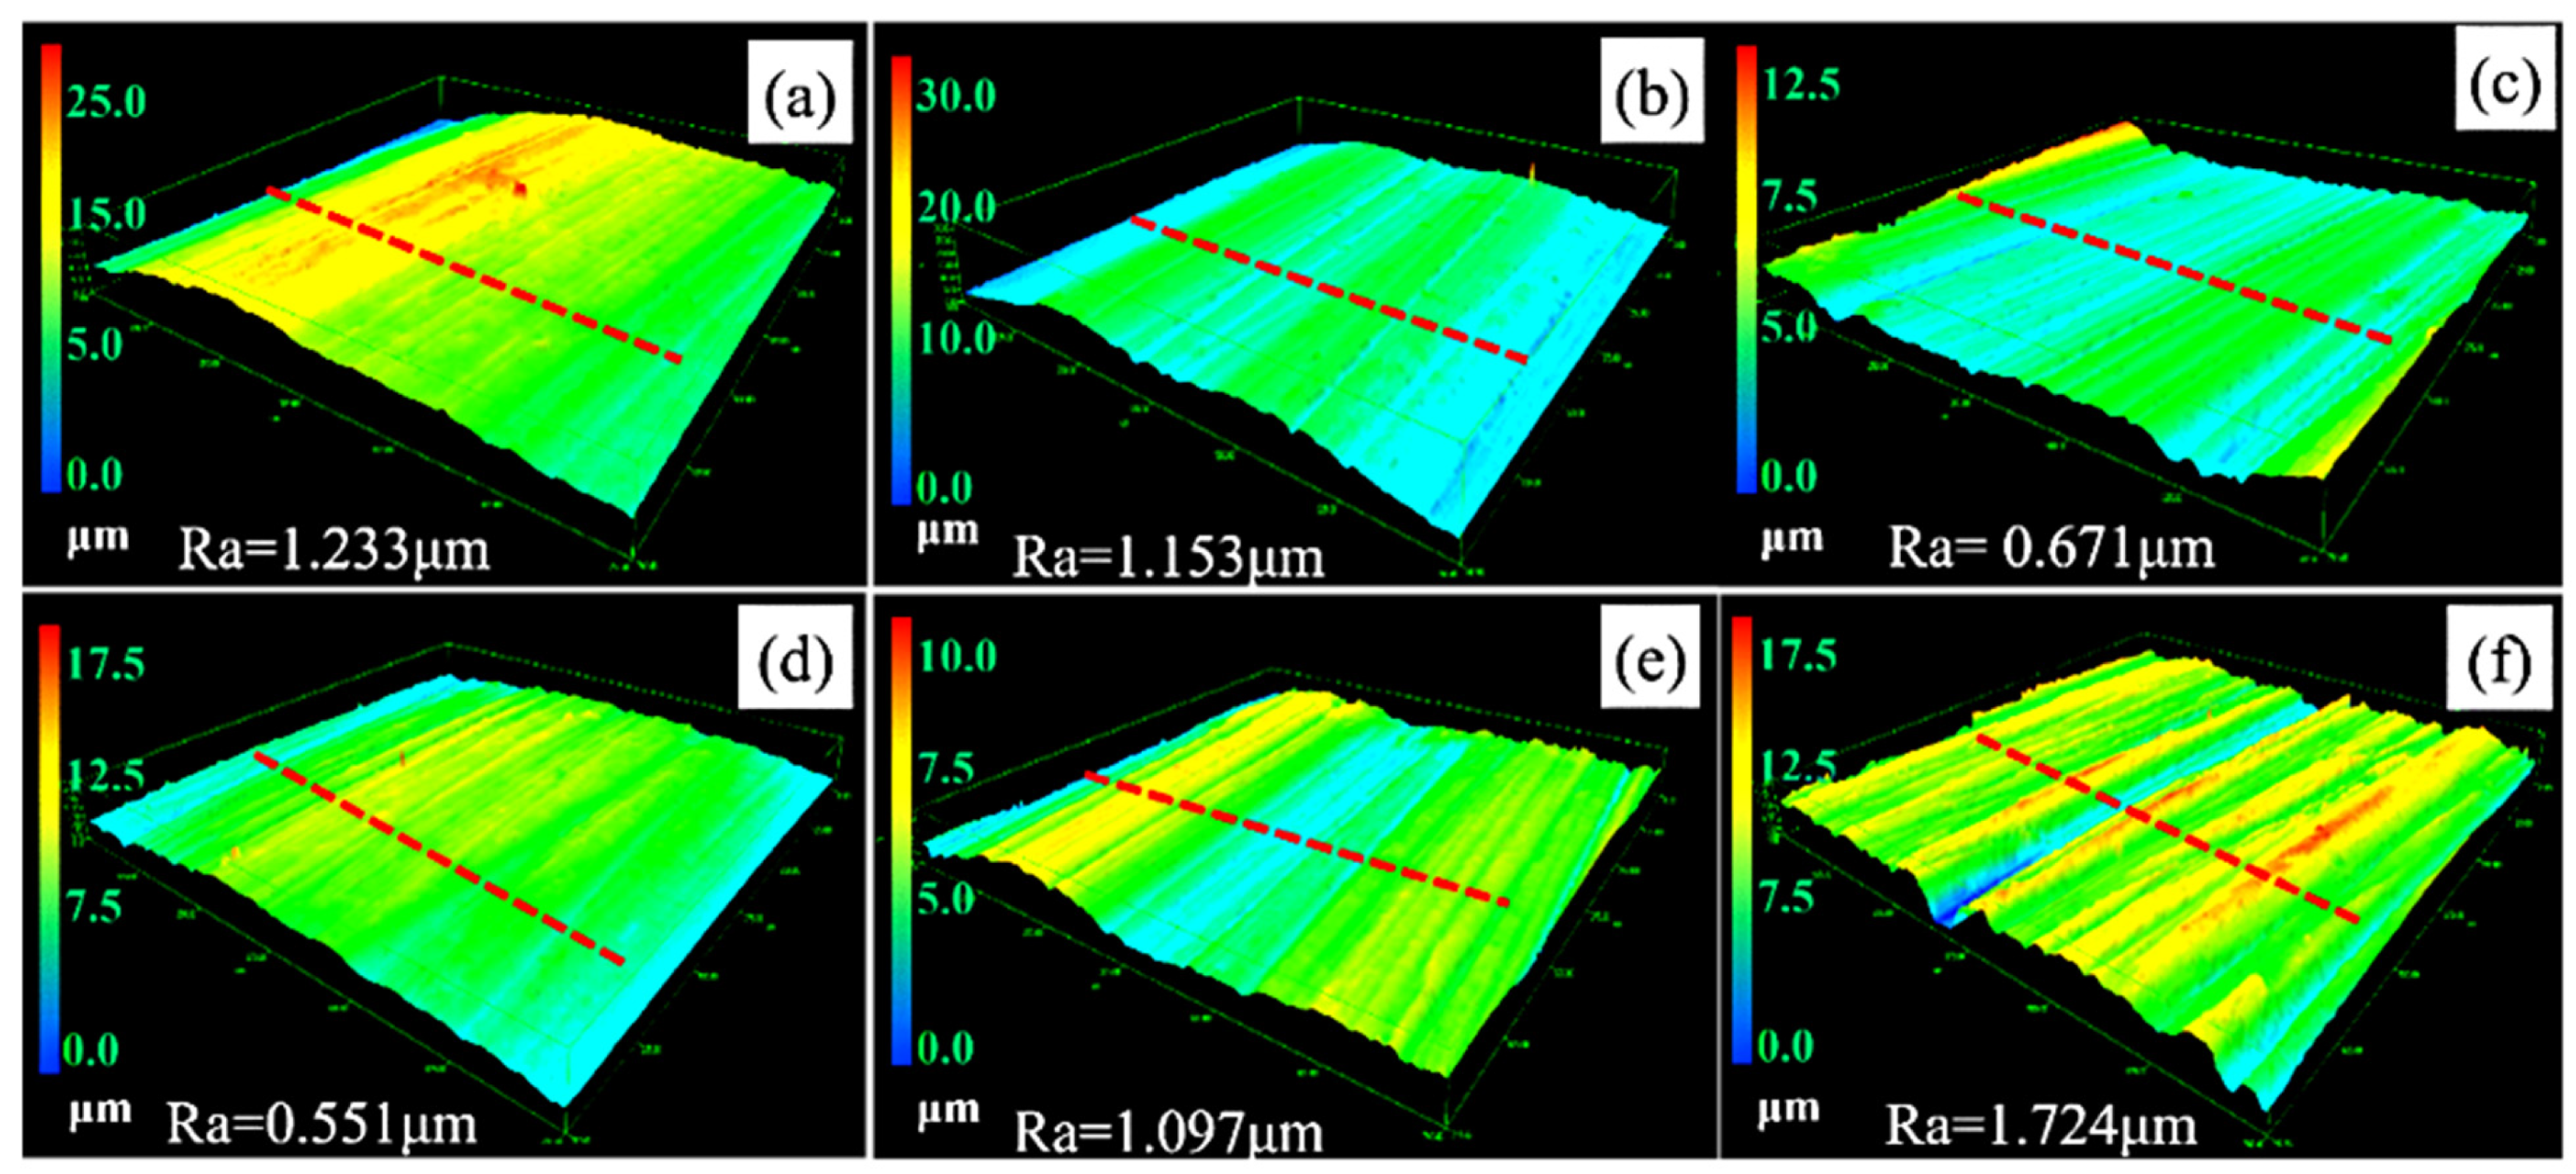
Figure 19 presents the wear surface morphologies of DLD coatings fabricated under different EF intensities. All coatings exhibit distinct plowing grooves and wear debris, characteristic of typical abrasive wear. The EDS analysis results for the marked points in Figure 19 are summarized in Table 7. Compared to the depressed areas (B1, B2, B3), the protruding areas (A1, A2, A3) are rich in Si, indicating that the Ti5Si3 enhanced phase is preferentially exposed at the contact interface during friction. Combined with the 3D surface morphologies shown in Figure 20, the surface roughness decreases from 1.233 μm to 0.551 μm and then increases to 1.724 μm with increasing EF. Calculated using Equation (1), the average wear percentages for the DLD coatings under different EF intensities are 2.0%, 1.8%, 1.5%, 1.4%, 1.9%, and 1.9%. At EF = 150 V/cm, the coating shows the lowest surface roughness (a 55.3% reduction non-EF) and the lowest average wear percentage, indicating optimal wear resistance. This is closely related to the microstructure of the coating under the DLD processing conditions.
Figure 19.
Wear surface morphologies of DLD coatings fabricated under different EF: (a) 0 V/cm, (b) 50 V/cm, (c) 100 V/cm, (d) 150 V/cm, (e) 200 V/cm, (f) 250 V/cm.
Table 7.
EDS analysis results for marked points in Figure 19.
Figure 20.
3D surface topography under different EF conditions: (a) 0 V/cm, (b) 50 V/cm, (c) 100 V/cm, (d) 150 V/cm, (e) 200 V/cm, (f) 250 V/cm.
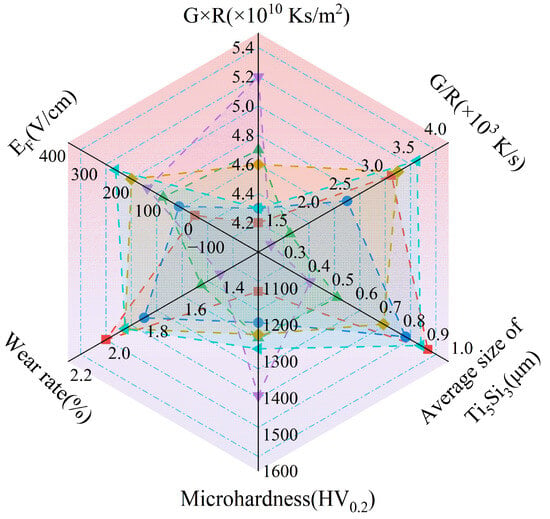
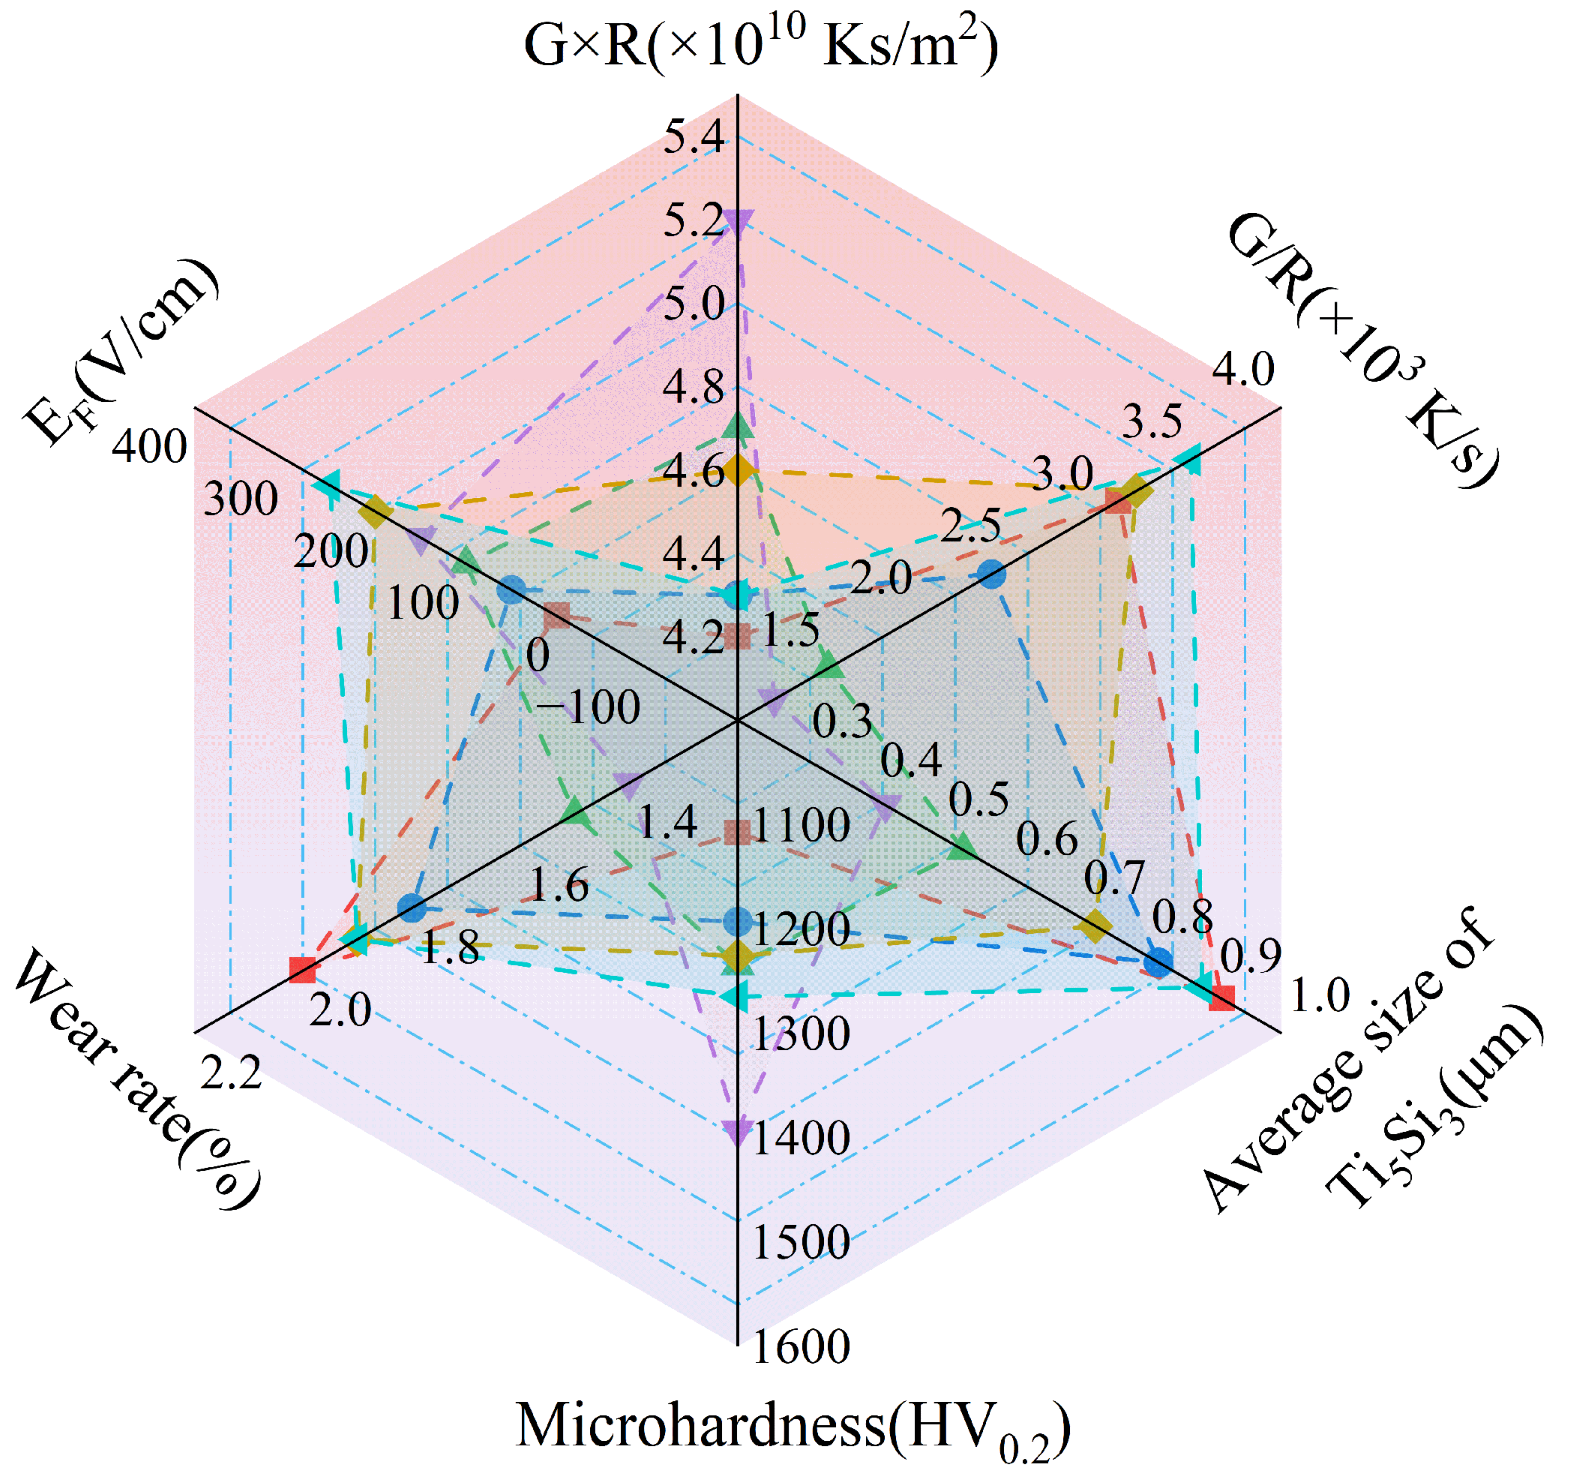
Figure 21 presents a spider web model illustrating the synergistic effects of EF and size evolution on grain types and properties. This model demonstrates the correlation among electrostatic field parameters, solidification parameters, grain size, and properties in electrostatic field-assisted DLD coatings. By modulating the EF intensity, the microstructural homogenization evolution and grain refinement mechanisms can be effectively understood. At EF = 150 V/cm, the coating exhibits a predominance of equiaxed grains with the finest average grain size, achieving a maximum microhardness of 1393 ± 32 HV0.2 and the lowest wear percentage of 1.4%. Therefore, based on the established spider web model, the solidification parameters and the flow field dynamics within the molten pool can be further regulated to control the grain size and the distribution evolution of the enhanced phase during the DLD process.
Figure 21.
Spider web model diagram of the synergistic effect of EF and size evolution on the grain type and properties.
5. Conclusions
- (1)
- The electrostatic field modifies molten pool convection patterns, affecting heat transfer mechanisms. At EF = 150 V/cm, the G × R product peaks at 5.2 × 10³ K/s, while the G/R ratio reaches a minimum of 1.2 × 10¹⁰ K·s/m2 (a 57% reduction compared to the condition without an EF). This suppresses the preferential growth of columnar grains, triggering dendrite fragmentation and promoting increased grain nucleation, thereby influencing grain evolution and dimensions.
- (2)
- An appropriate EF is conducive to obtaining uniform, dense, and fine microstructures. At EF = 150 V/cm, the equiaxed grain size is the smallest, with an average of 0.417 μm, and the grains develop a preferred orientation towards the {101} crystallographic plane family, exhibiting intensified texture characteristics. The proportion of the Ti5Si3 enhanced phase is the highest, at 85.92%, and its average particle size is the smallest, at 0.45 μm.
- (3)
- At EF = 150 V/cm, the coating achieves peak hardness (1393 ± 32 HV0.2; a 21% increase non-EF), coupled with minimized surface roughness (0.551 μm) and wear percentage (1.4%). The abundant and fine enhanced phases in the coating effectively hinder the accumulation and proliferation of wear debris, thereby reducing the probability of secondary abrasive wear.
- (4)
- The electrostatic field accelerates free electron movement in the melt pool, which facilitates the diffusion of Si atoms into the Ti lattice, thereby increasing the formation of the Ti5Si3 enhanced phase. Furthermore, the electrostatic field modifies Marangoni convection by altering the temperature gradient (G) and solidification rate (R), stabilizing the solid–liquid interface to refine the Ti5Si3 enhanced phase.
Author Contributions
Conceptualization, Y.L. (Yu Li) and X.C.; methodology, Y.L. (Yu Li), X.C. and G.Y.; software, Y.L. (Yu Li), X.C. and S.Z.; validation, Y.L. (Yu Li), X.C., Y.L. (Yinglong Liang) and G.Y.; formal analysis, Y.L. (Yu Li) and X.C.; investigation, Y.L. (Yu Li), X.C., S.Z. and G.Y.; resources, X.C. and G.Y.; data curation, X.C. and G.Y.; writing—original draft preparation, Y.L. (Yu Li), X.C., Y.L. (Yinglong Liang) and S.Z.; writing—review and editing, Y.L. (Yu Li), X.C., Y.L. (Yinglong Liang) and S.Z.; visualization, Y.L. (Yu Li), X.C., Y.L. (Yinglong Liang), S.Z. and G.Y.; supervision, X.C. and G.Y.; project administration, X.C. and G.Y.; funding acquisition, X.C. All authors have read and agreed to the published version of the manuscript.
Funding
This research was funded by the Basic Scientific Research Project of Liaoning Provincial Department of Education (grant number JYTMS20230846 and LJ212510154007), Natural Science Foundation Doctoral Research Launch Project (grant number 2024-BSLH-122), and the Ph.D. research startup foundation of Liaoning University of Technology (grant number XB2022002).
Data Availability Statement
The original contributions presented in this study are included in the article. Further inquiries can be directed to the corresponding author.
Acknowledgments
The authors are grateful for the support of the Science and Technology Program of Liaoning-Joint Program (Natural Science Foundation Doctoral Research Launch Project, the Basic Scientific Research Project of Liaoning Provincial Department of Education, the Ph.d. research startup foundation of Liaoning University of Technology.
Conflicts of Interest
The authors declare no conflicts of interest.
References
- Wang, C.; Li, J.; Wang, T.; Chai, L.; Deng, C.; Wang, Y.; Huang, Y. Microstructure and properties of pure titanium coating on Ti-6Al-4V alloy by laser cladding. Surf. Coat. Technol. 2021, 416, 127137. [Google Scholar] [CrossRef] [Scilit]
- Li, X.; Wang, K.; Jiang, B.; Chen, Y.; Zhang, Z.; Lu, K.; Liang, X. Enhancing corrosion and wear resistance of a 7075 aluminum alloy via depositing TC4 coating. J. Mater. Res. Technol. 2024, 32, 1736–1748. [Google Scholar] [CrossRef] [Scilit]
- Chen, X.; Li, Y.; Wei, W.; Yin, G.; Yang, L.; Su, H. On the influence of microstructure evolution and wear mechanism of direct laser deposited Ti-Al-Si coatings with different Si contents. J. Laser Appl. 2024, 36, 042009. [Google Scholar] [CrossRef] [Scilit]
- Jiang, X.; Gao, S.; Zhao, X.; Zheng, H.; Wu, Y.; Cui, X.; Wang, Z. Microstructure Evolution and Wear Resistance of TiC-Reinforced H13 Alloy Coatings Fabricated by Laser Cladding on H13 Steel. Metals 2026, 16, 258. [Google Scholar] [CrossRef] [Scilit]
- Qiao, Q.; Cristino, V.A.M.; Tam, L.M.; Kwok, C.T. Tribo-corrosion behavior of hypoeutectoid and hypereutectoid TC4-Cu coatings fabricated by laser surface alloying. Surf. Coat. Technol. 2025, 496, 131660. [Google Scholar] [CrossRef] [Scilit]
- Shi, L.; Jiang, C.; Zhao, R.; Si, T.; Li, Y.; Qian, W.; Gao, G.; Chen, Y. Effect of Al2O3 nanoparticles additions on wear resistance of plasma electrolytic oxidation coatings on TC4 alloys. Ceram. Int. 2024, 50, 18484–18496. [Google Scholar] [CrossRef] [Scilit]
- Wei, M.; Zheng, S.; Wang, S.; Chen, Y.; Wang, S.; Zhang, T.; Xie, J.; Wei, K. Microstructure, mechanical properties and magnetic properties of Hymu80 permalloy fabricated by selective laser melting. Mater. Lett. 2025, 383, 138049. [Google Scholar] [CrossRef] [Scilit]
- Fan, X.; Fleming, T.G.; Rees, D.T.; Huang, Y.; Marussi, S.; Leung, C.L.A.; Atwood, R.C.; Kao, A.; Lee, P.D. Thermoelectric magnetohydrodynamic control of melt pool flow during laser directed energy deposition additive manufacturing. Addit. Manuf. 2023, 71, 103587. [Google Scholar] [CrossRef] [Scilit]
- Shi, Z.; Xu, P.; Bi, J.; Yao, Z.; Li, R.; Wang, B.; Zheng, H. Static transverse magnetic field assisted laser cladding of nickel alloy GH3625 for enhancing its microstructure. microhardness, friction and wear properties on 304 stainless steel substrate. Opt. Laser Technol. 2025, 190, 113203. [Google Scholar] [CrossRef] [Scilit]
- Li, G.; Wang, Z.; Yao, L.; Xie, D.; Chen, G. Concentration mixing and melt pool solidification behavior during the magnetic field assisted laser cladding of Fe-Cr-based alloy on 45 steel surface. Surf. Coat. Technol. 2022, 445, 128732. [Google Scholar] [CrossRef] [Scilit]
- Richter, B.; Hocker, S.J.A.; Frankforter, E.L.; Tayon, W.A.; Glaessgen, E.H. Influence of ultrasonic excitation on the melt pool and microstructure characteristics of Ti-6Al-4V at powder bed fusion additive manufacturing solidification velocities. Addit. Manuf. 2024, 89, 104228. [Google Scholar] [CrossRef] [Scilit]
- Hu, Y.; Cao, L.; Wang, L.; Zhang, Q.; Liu, Y.; Zheng, Y.; Du, Y.; Yao, J. Effects of electromagnetic compound field on the macroscopic morphology of laser cladding. Opt. Laser Technol. 2024, 174, 110555. [Google Scholar] [CrossRef] [Scilit]
- Bao, Y.; Sun, H.; Cai, X.; Lin, S.; Chen, C. Effect of External Magnetic Field on the Forming, Microstructure and Property of TC4 Titanium Alloy during the Directed Energy Deposition Arc Additive Manufacturing. Crystals 2023, 13, 235. [Google Scholar] [CrossRef] [Scilit]
- Yue, C.; Yin, A. Effect of transverse magnetic field on microstructure and mechanical properties of Ti-6Al-4 V manufactured by Laser-MIG hybrid welding. Int. J. Adv. Manuf. Technol. 2022, 121, 5283–5296. [Google Scholar] [CrossRef] [Scilit]
- Ouyang, W.; Xu, Z.; Chao, Y.; Liu, Y.; Luo, W.; Jiao, J.; Sheng, L.; Zhang, W. Effect of electrostatic field on microstructure and mechanical properties of the 316L stainless steel modified layer fabricated by laser cladding. Mater. Charact. 2022, 191, 112123. [Google Scholar] [CrossRef] [Scilit]
- Zhu, X.; Xieeryazidan, A.; Chen, C. Numerical Simulation of Laser Quenching on 45 Steel Surface Based on ANSYS. Hot Work. Technol. 2024, 22, 51–55. [Google Scholar]
- Wang, Z.; Jiang, S.; Chen, Y.; Xiong, Z.; Hu, D.; Cheng, D. Numerical simulation of laser welding of Mg/steel dissimilar metals based on ABAQUS. J. Mater. Heat Treat. 2021, 42, 134–141. [Google Scholar]
- Zhan, X.; Liu, X.; Li, Y.; Zhao, Y.; Wang, J. Molten pool behavior and solidification characterization in steady magnetic field assisted laser-MIG hybrid welding of aluminum alloy. J. Manuf. Process. 2022, 84, 622–638. [Google Scholar] [CrossRef] [Scilit]
- Ma, G.; Liu, X.; Song, C.; Niu, F.; Wu, D. TiCp reinforced Ti6Al4V of follow-up synchronous electromagnetic induction-laser hybrid directed energy deposition: Microstructure evolution and mechanical properties. Addit. Manuf. 2022, 59, 103087. [Google Scholar] [CrossRef] [Scilit]
- Gan, Z.; Yu, G.; He, X.; Li, S. Numerical simulation of thermal behavior and multicomponent mass transfer in direct laser deposition of Co-base alloy on steel. Int. J. Heat Mass Transf. 2017, 104, 28–38. [Google Scholar] [CrossRef] [Scilit]
- Zhang, J.; Liu, Y.; Liu, J.; Zhang, Z.; Ma, J.; Han, J.; Zhao, X. Numerical simulation and experimental study of ultrasonic vibration-assisted laser polishing of Ti-6Al-4V alloy. Opt. Lasers Eng. 2025, 186, 108814. [Google Scholar] [CrossRef] [Scilit]
- Liu, Z.; Ji, J.; Wang, Q.; Guan, X.; Wang, L.; Zhan, X. Effect of Scanning Strategy on Microstructure Evolution and Stress Control in Laser Cladding Repair of Ti6Al4V Alloy. Metals 2024, 14, 805. [Google Scholar] [CrossRef] [Scilit]
- Hou, X. Revision process and technical improvements of ISO 4545-1:2023 and ISO 6507-1:2023 standards. Phys. Test. Chem. Anal. Part A Phys. Test. 2024, 60, 1–4. [Google Scholar]
- Qi, H.; Mazumder, J.; Ki, H. Numerical simulation of heat transfer and fluid flow in coaxial laser cladding process for direct metal deposition. J. Appl. Phys. 2006, 100, 024903. [Google Scholar] [CrossRef] [Scilit]
- Morville, S.; Carin, M.; Peyre, P.; Gharbi, M.; Carron, D.; Le Masson, P.; Fabbro, R. 2D longitudinal modeling of heat transfer and fluid flow during multilayered direct laser metal deposition process. J. Laser Appl. 2013, 24, 032008. [Google Scholar] [CrossRef] [Scilit]
- Li, C.; Yu, Z.; Gao, J.; Zhao, J.; Han, X. Numerical simulation and experimental study of cladding Fe60 on an ASTM 1045 substrate by laser cladding. Surf. Coat. Technol. 2019, 357, 965–977. [Google Scholar] [CrossRef] [Scilit]
- Hu, Y.; Wang, L.; Yao, J.; Xia, H.; Li, J.; Liu, R. Effects of electromagnetic compound field on the escape behavior of pores in molten pool during laser cladding. Surf. Coat. Technol. 2020, 383, 125198. [Google Scholar] [CrossRef] [Scilit]
- Khamidullin, B.A.; Tsivilskiy, I.V.; Gorunov, A.I.; Gilmutdinov, A.K. Modeling of the effect of powder parameters on laser cladding using coaxial nozzle. Surf. Coat. Technol. 2019, 364, 430–443. [Google Scholar] [CrossRef] [Scilit]
- Yang, P.; Su, H.; Hu, Q.; Guo, Y.; Shen, Z.; Li, X.; Jiang, H.; Yu, M.; Ji, X.; Zhang, Z.; et al. Laser additive manufacturing of CrFeNb particles reinforced Ni-based superalloy composites with grain refinement and superior performance. J. Mater. Res. Technol. 2024, 33, 9630–9640. [Google Scholar] [CrossRef] [Scilit]
- Guan, H.; Chai, L.; Wu, J.; Gong, X.; Xiang, K.; Wu, L.; Pan, H.; Li, Y.; Wang, Q. Laser-clad Nb(Ta)TiZr medium-entropy alloy coatings on pure Zr sheet: Microstructural characteristics, hardness and wear resistance. Intermetallics 2022, 143, 107498. [Google Scholar] [CrossRef] [Scilit]
- Bennon, W.D.; Incropera, F.P. A continuum model for momentum, heat and species transport in binary solid-liquid phase change systems-I. Model formulation. Int. J. Heat Mass Transf. 1987, 30, 2161–2170. [Google Scholar] [CrossRef] [Scilit]
- Li, C.; Yu, Z.B.; Gao, J.X.; Zhao, J.Y.; Han, X. Numerical simulation and experimental study on the evolution of multi-field coupling in laser cladding process by disk lasers. Weld. World 2019, 63, 925–945. [Google Scholar] [CrossRef] [Scilit]
- Liang, Y.; Han, Q.; Sui, Z.; Zhang, Z.; Zhang, H.; Gu, H.; Wu, D.; Wang, L.; Liu, H.; Setchi, R. Laser powder bed fusion of high-strength crack-free Al7075 alloy with the in-situ formation of TiB2/Al3Ti-reinforced phases and nucleation agents. Compos. Part B Eng. 2025, 289, 111940. [Google Scholar] [CrossRef] [Scilit]
- Shi, L.; Huang, W.; Song, S.; Li, Z.; Liu, S. Effect of the fluorine addition method on the hydrodesulfurization performance of NiMo catalysts over slurry bed. Acta Phys. Chim. Sin. 2015, 31, 1559–1566. [Google Scholar] [CrossRef] [Scilit]
- Liao, L.; Zhou, S.; Cheng, Y.; Li, F.; Dai, S.; Khan, M.A.; Zhang, H. Microstructure characteristics and high-temperature properties of AlCoCrFeNi high entropy alloy coating on TC4 alloy prepared by laser cladding. Surf. Interfaces 2025, 74, 107717. [Google Scholar] [CrossRef] [Scilit]
- Cui, C.; Wu, M.; He, R.; Jie, D.; Gong, Y.; Miao, X. Effect of LaB6 doping on the microstructure, microhardness and corrosion behavior of laser cladded FeCoNiCrMo coating on Ti6Al4V. Surf. Coat. Technol. 2023, 466, 129592. [Google Scholar] [CrossRef] [Scilit]
- Gao, H.; Zhu, W.; Guo, C.; Chen, W.; Jiang, F. Microstructure and Dry Wear Property of the 65 wt% TiC-10wt% B4C-Ti Coating Prepared by Laser Directed Energy Deposition. Tribol. Int. 2025, 214, 111189. [Google Scholar] [CrossRef] [Scilit]
- Du, Z.; Su, Y.; Li, J.; Lee, S.; Tang, J.; Fan, H. Microstructure and properties of laser-cladded TiZrHfNbTaMox RHEA coating on TC4. Surf. Coat. Technol. 2025, 513, 132454. [Google Scholar] [CrossRef] [Scilit]
- Li, Z.; Zhang, Y.; Yin, B.; Song, D. Effect of CeO2 Addition on Microstructure, Hardness, and Tensile Properties of Selected Laser-Melted TC4 Alloys. J. Mater. Eng. Perform. 2025, 34, 556–565. [Google Scholar] [CrossRef] [Scilit]

Disclaimer/Publisher’s Note: The statements, opinions and data contained in all publications are solely those of the individual author(s) and contributor(s) and not of MDPI and/or the editor(s). MDPI and/or the editor(s) disclaim responsibility for any injury to people or property resulting from any ideas, methods, instructions or products referred to in the content. |
© 2026 by the authors. Licensee MDPI, Basel, Switzerland. This article is an open access article distributed under the terms and conditions of the Creative Commons Attribution (CC BY) license.