


Abstract
Carryover slag (COS) entrained from the basic oxygen furnace (BOF) during tapping is highly oxidizing and affects secondary steelmaking by increasing deoxidizer consumption, refractory wear, P reversion, and decreasing steel cleanliness. A kinetic COS amount estimation model was developed by using the effective equilibrium reaction zone (EERZ) method. The amount of COS was determined by iteratively adjusting the carryover slag coefficient (CSC) until predicted steel and slag compositions approached industrial measurements. Validation with four industrial heats confirmed that the model effectively predicts COS under both complete and incomplete deoxidation conditions. Further simulation results show that increasing the CSC from 2 to 4 kg per tonne of steel leads to 9.3 ppm P reversion. The calculations also confirmed that larger COS amounts accelerate refractory wear due to the higher input of readily reducible components, particularly FeO and MnO.
1. Introduction
Carryover slag (COS) refers to the portion of the primary slag that is entrained from the basic oxygen furnace (BOF) or electric arc furnace (EAF) into the steelmaking ladle during tapping. Due to its highly oxidizing nature [1], steel quality is affected by promoting oxidation losses of alloying elements and deoxidizers, thereby increasing the potential for late inclusion formation during the subsequent processes. Furthermore, COS adversely affects subsequent refining operations by impairing desulfurization efficiency and accelerating refractory wear in the secondary refining process [2,3,4]. Elevated P2O5 contents in the slag can lead to enhanced P reversion to the molten steel. Therefore, quantifying COS not only enables an accurate assessment of the slag detection system’s effectiveness, but also assists operators in making informed decisions during downstream steelmaking processes. Quantifying, controlling, and minimizing COS are essential for clean steel production and have been investigated extensively. To reduce COS, several slag detection technologies have been proposed and implemented [5,6,7]. In addition, precise COS estimation is required to develop accurate kinetic models, thereby supporting robust process analysis and optimization.
To achieve accurate quantification, several researchers have proposed different approaches based on mass balance methods. Doostmohammadi et al. [3] and Alexis et al. [8] applied a CaO mass balance to estimate the amount of COS, since CaO is a thermodynamically stable oxide that can originate either from added slag formers or from entrained COS, allowing the different CaO sources in the system to be clearly distinguished. Conejo et al. [9] applied the Al2O3 mass balance, incorporating residual slag from the previous heat and dissolved Al2O3 from the refractory lining. Similarly, Hassel et al. [10] employed the MgO mass balance, citing its thermodynamic stability as the rationale, similar to CaO. Ashok et al. [11] developed a thermodynamic-based model to estimate the amount of COS by utilizing FactSage to calculate the equilibrium between a certain amount of slag, crude steel, materials added, and oxygen absorbed during tapping. The COS amount was then determined by comparing the predicted and measured Si content in the steel, leading to an estimated value of 2.41 kg per tonne of steel.
Although these methods can estimate COS levels, they have certain limitations. The mass balance method relies heavily on accurately achieving specified alloy compositions, assuming that these materials are fully dissolved and uniformly distributed within the steel melt, and, ultimately, on the accuracy of the chemical analyses of the sample measurements. Even small deviations in those aspects can significantly magnify differences in COS estimates. However, utilizing multiple components to estimate the COS amount can effectively mitigate the impact of such deviations. Additionally, as the tapping process does not reach full thermodynamic equilibrium, directly determining the amount of COS based on equilibrium composition can introduce inaccuracies. A more reliable approach is to develop a model that combines kinetically controlled reaction amounts with thermodynamic equilibrium and multicomponent comparisons.
Therefore, in the present study, a comprehensive kinetic model for estimating the COS amount was developed based on the previously established thermodynamic–kinetic tapping process model by Cheng et al. [12]. The earlier model, formulated using the effective equilibrium reaction zone (EERZ) approach [13,14,15,16], demonstrated good predictive accuracy for steel and slag compositions throughout tapping. This model accounted for various interactions in the BOF and steelmaking ladle (steel–slag-inclusions). Furthermore, it considered the dissolution of refractory materials, the addition of alloys and slag formers, and air absorption. Based on this established framework, the present COS estimation model was applied to simulate four industrial heats for both fully (complete) and partially (incomplete) deoxidized initial conditions. The COS amount in each heat was determined by comparing predicted and measured compositions of multiple steel and slag components. These values were subsequently validated to ensure the reliability of the estimation. The influence of varying amounts of entrained COS on downstream steelmaking processes was then analyzed based on the simulation results. It should be noted that the proposed model is not restricted to specific process conditions or steel grades. As long as the necessary input data (e.g., steel and slag compositions, alloy additions, and temperatures before and after tapping) are available, the model can be used for the quantitative evaluation of carryover slag amount.
2. Conducted Experiments and Applied Methods
2.1. Conducted Plant Experiments
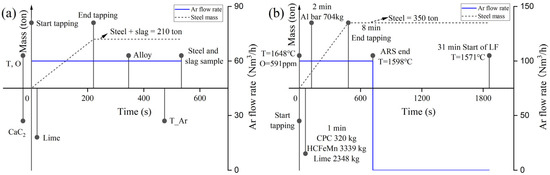
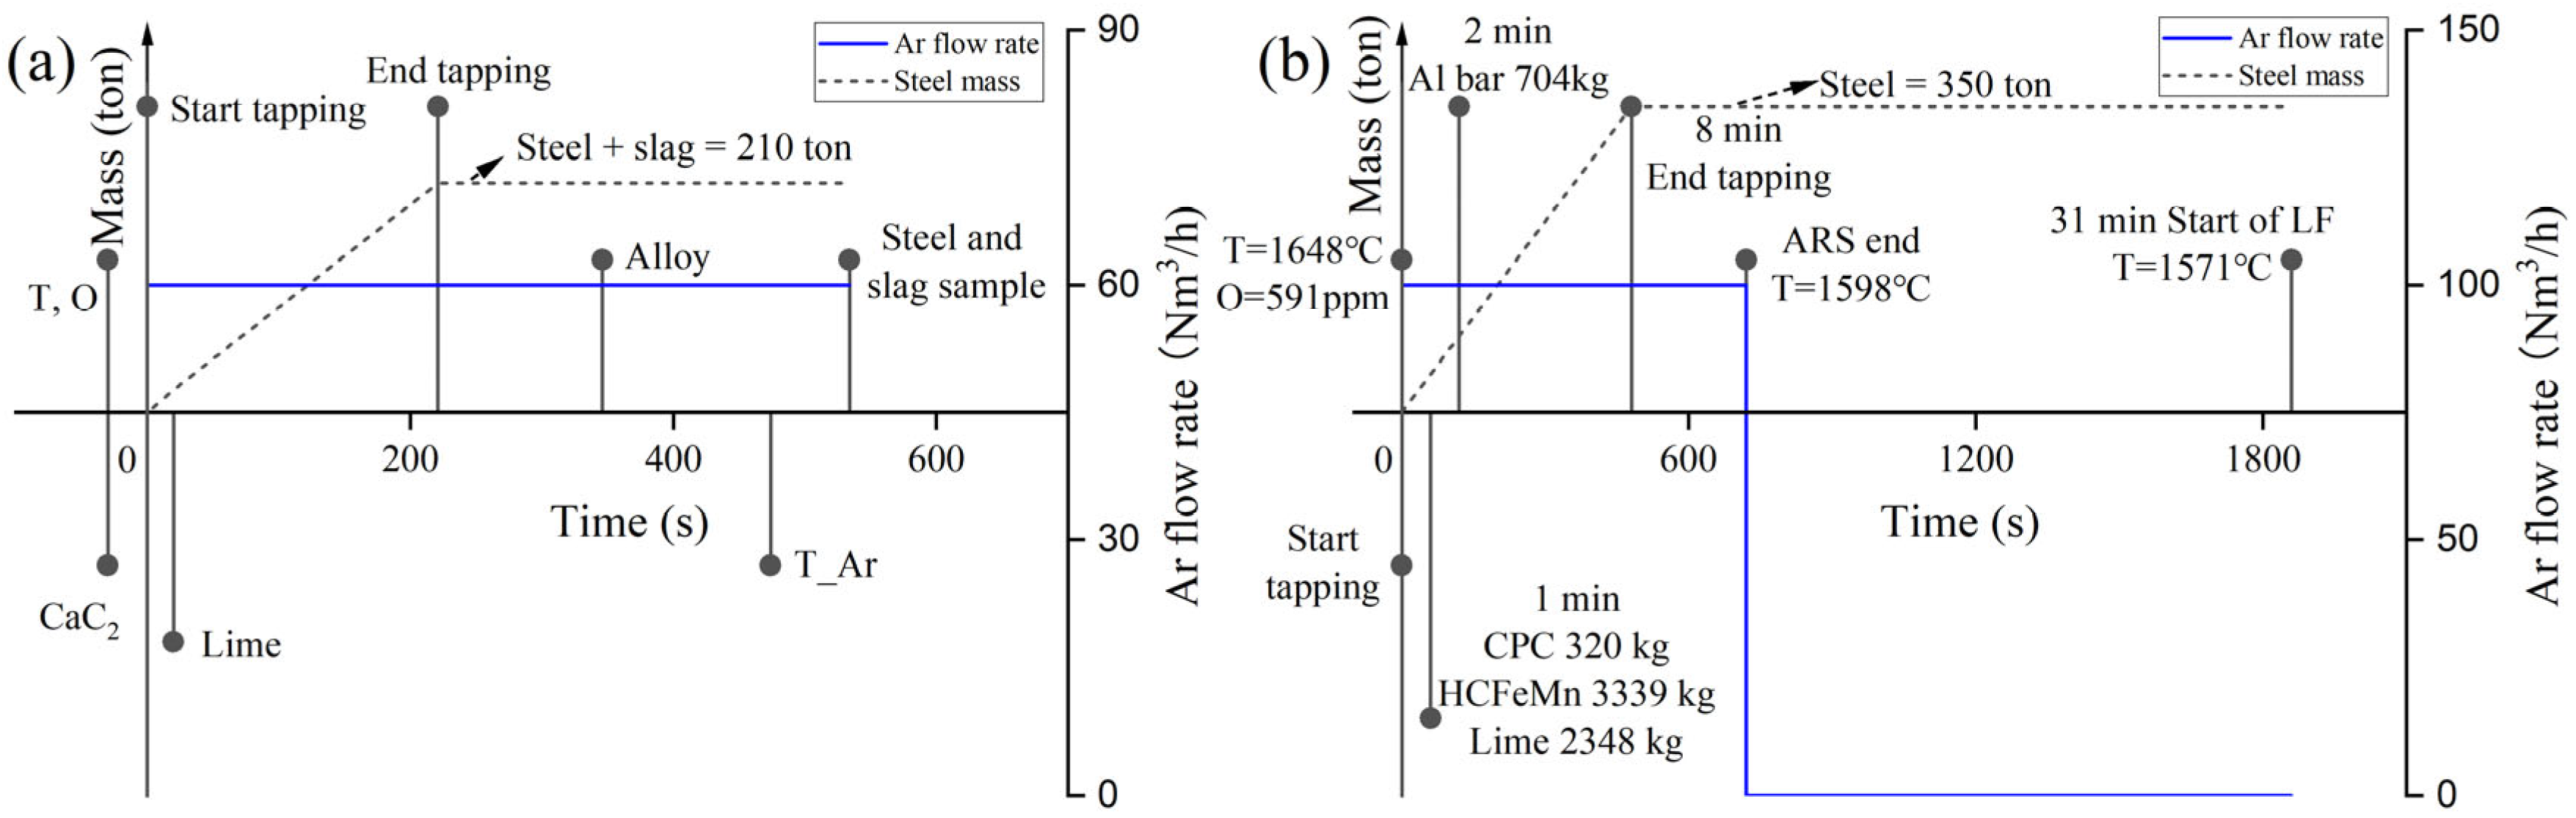
Production data of four heats with two different process schedules were investigated in greater detail. The first three heats (Heats 1–3) were produced under similar operating conditions at the Hunan Valin Lianyuan steel plant. The steel capacity used in the secondary steelmaking process was 210 tons. Process data were recorded from the start of tapping until the end of the Argon Blowing Station (ABS). One of the production schedules is illustrated in Figure 1a. The alloy additions were relatively limited, and the heats corresponded to incomplete deoxidation, with only a short time interval between alloy addition and sampling.
Figure 1.
Production schedule during the tapping and transportation for (a) incomplete deoxidation, and (b) complete deoxidation.
Production data from a complete deoxidized heat (Heat 4), as reported in reference [17], were also applied. This heat consisted of 350-ton steel, with data covering the tapping process till the start of LF treatment. The processing schedule for Heat 4 is shown in Figure 1b. In contrast to Heats 1–3, Heat 4 involved a larger amount of alloy additions and corresponded to a fully deoxidized condition, with a longer time interval between alloy addition and sampling.
All steel compositions were analyzed using optical emission spectrometry, while the slag composition was measured using X-ray fluorescence spectroscopy.
The initial steel and slag compositions before tapping, as well as their compositions at the ABS or before the start of the LF treatment, are presented in Table 1 and Table 2. The masses of various additions made during the process are listed in Table 3.
Table 1.
Steel composition before tapping (Steel_BOF) and at the ABS or the beginning of LF treatment (Steel_end) (Wt.-%).
Table 2.
Slag composition before tapping (Slag_BOF) and at the ABS or the beginning of LF treatment (Slag_end) (Wt.-%).
Table 3.
Amounts of added materials during the process (kg).
2.2. Modeling Approach
All thermodynamic equilibrium calculations in the present model were performed using the FactSageTM 8.2 databases in ChemAppTM Python 8.1.6. ChemApp provides a programming interface that enables the integration of metallurgical process models with thermodynamic databases, enabling equilibrium calculations to be performed within customized computational frameworks. The FSstel database was used to describe liquid steel and CaS [18], the FToxid database was used to describe the oxide solution [19,20], and the FactPS database was used to describe FeO and the gas phase [14].
The present model mainly applied the EERZ method to simplify the ongoing interfacial reactions between steel, slag, refractory and the surrounding atmosphere. Following the concept proposed by Van Ende et al. [21], the amount of solution participating in the equilibrium reaction at the interface per time step is calculated using Equation (1) [21]. Taking the reaction of steel and slag at the interface as an example, the amount entering the interface per time step can be calculated according to the equation. At the interface, it is assumed that the steel and slag participating in the reaction reach equilibrium. The steel and slag products from the equilibrium reaction are returned to the corresponding bulk zone, and the compositions of the steel and slag in the bulk zone are updated by applying an additional equilibrium calculation, respectively. The changed steel and slag bulks continue to participate in the next step reactions.
where represents the mass of the solution reacting per time step, g; k denotes the overall mass transfer coefficient of the solution, m s−1; is the density of the solution, g m−3; A represents the contact area between the two reaction solutions, m2; and is the time step, s, which was assumed to be 5 s in the present model, as adopted by You et al. [14].
The proposed COS estimation model was developed on the basis of the tapping process model established by Cheng et al. [12]. The model parameters and accuracy have been previously verified. To avoid repetition, the parameter estimation procedures and values introduced in the tapping process model are not explained again here. This includes approaches for determining the amounts of steel and slag in the BOF, the flow rates of steel during tapping, and the calculation of steel-lining, steel-inclusion, and slag-lining reaction amounts in the ladle. In the current simulations, the generated gas phase was assumed to escape and was excluded from the system at each time step.
The carryover slag coefficient (CSC) was defined as the average mass of COS entrained per ton of tapped steel, expressed in kg per tonne of steel, and increased from 2 to 8 kg per tonne of steel, and in each cycle, it increased by 2 kg per tonne of steel. It should be noted that the CSC in this study is mainly used to determine the total amount of carryover slag. During the tapping simulation, the proportion of carryover slag entrainment varies at different stages of tapping. The mass distribution of the carryover slag was assumed, based on previous studies [12,14], to be 5% pre-slag, 15% vortex slag, and 80% post-slag. The CSC was determined by repeatedly executing the tapping process model with gradually increased CSC values. For each CSC, the tapping process model predicted the final steel and slag compositions. The CSC corresponding to the minimum deviation between the predicted and measured compositions was selected. The total amount of COS was calculated using Equation (2).
where msteel is the tapped steel mass (t).
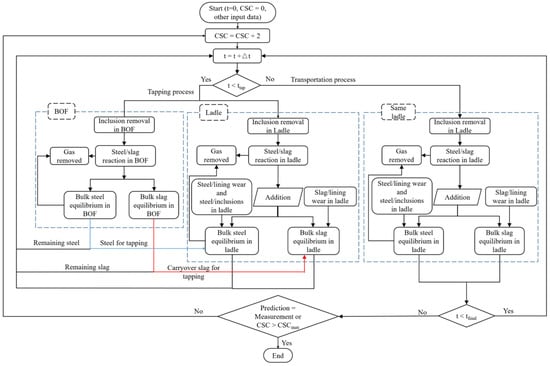
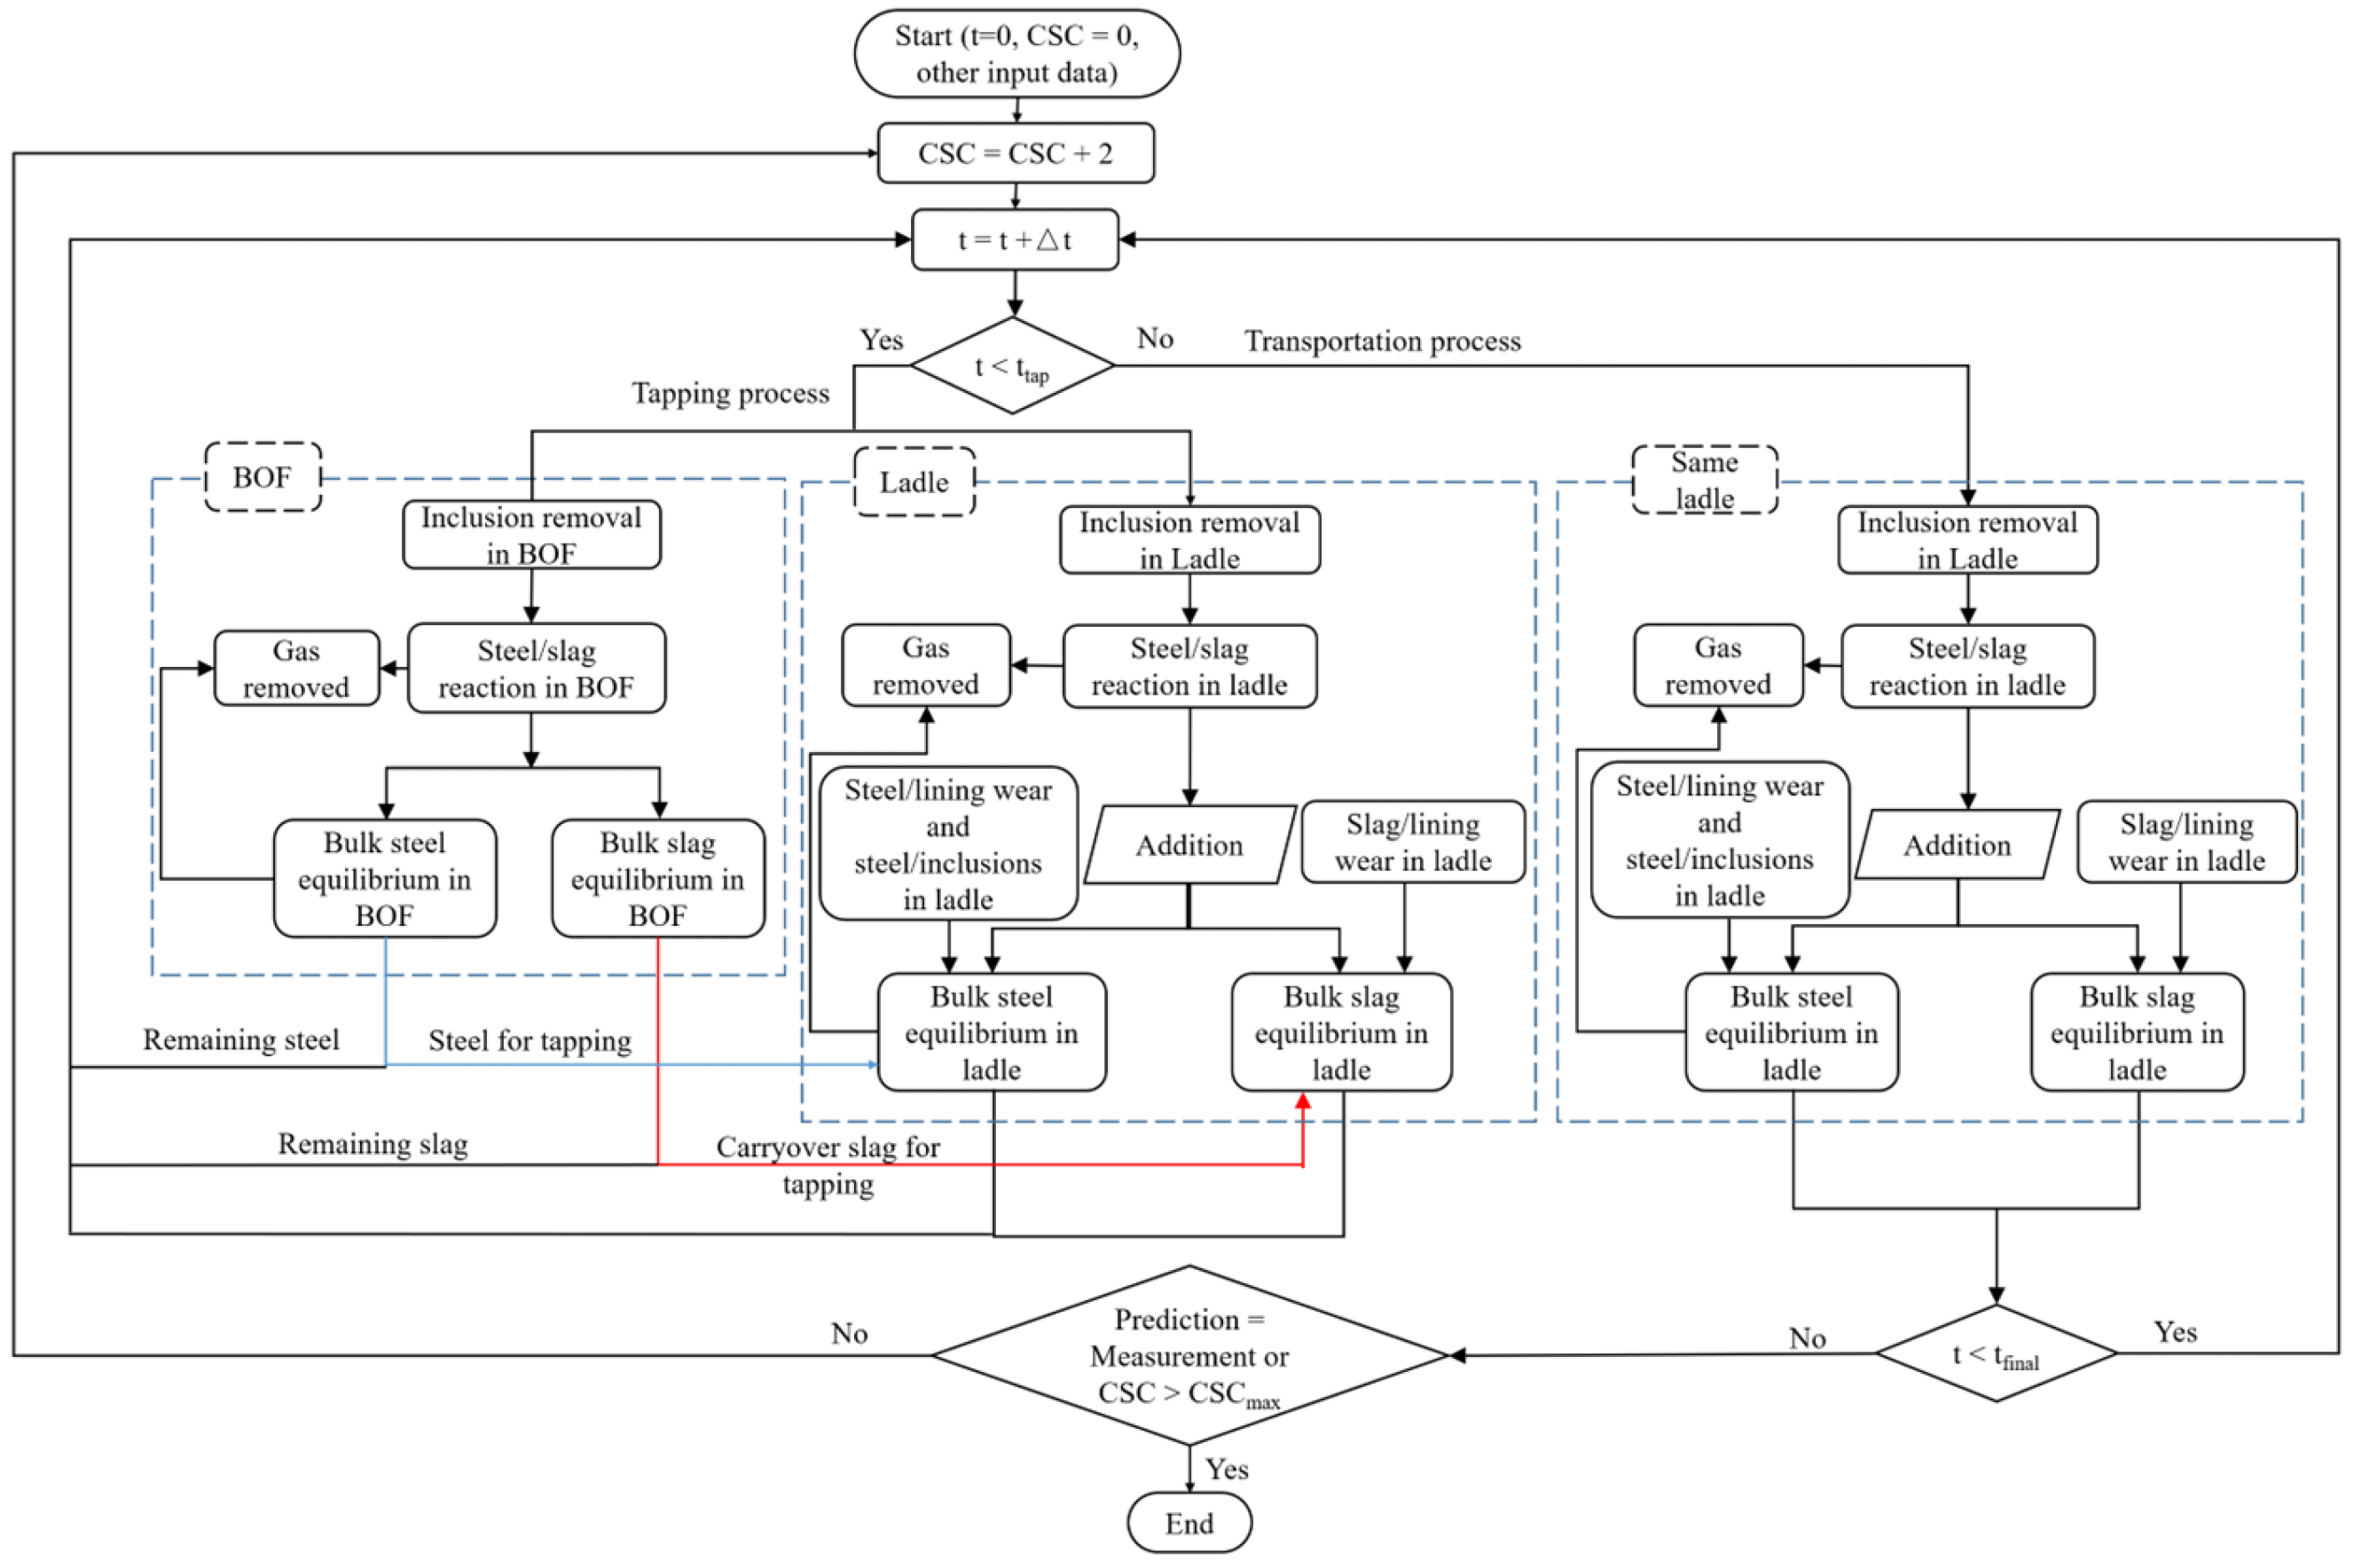
The flow chart of the COS estimation model is shown in Figure 2. At the beginning of each time step, the simulation checks whether the tapping process and the transportation process model should be executed. During the tapping period, thermodynamic reactions between steel and slag were considered in both the BOF and the steelmaking ladle. If the transportation process was simulated, only the thermodynamic reactions in the ladle were applied.
Figure 2.
Flow chart of the COS amount estimation model.
At each time step in the BOF, the steel–slag interfacial area was first calculated following Cheng et al. [12]. The amount of steel and slag participating in the interface reaction is determined. After updating the steel and slag composition in the bulk zone via equilibrium calculation. At the end of each time step, a part of the updated steel and slag bulk materials was tapped into the steelmaking ladle.
Within the ladle, the steel–slag interfacial reactions were treated analogously to those in the BOF. Subsequently, the equilibrium reactions between the steel-lining and steel-inclusion were calculated, and all the reaction products were returned to the steel bulk zone. Simultaneously, the slag-lining reactions were calculated, and all the reaction products were added to the slag bulk. Furthermore, the addition of alloys and slag formers into the steelmaking ladle was considered. The melting rate of these added materials will be explained in detail in the following Section 2.3. All products and materials entering the steel bulk zone, together with the tapped steel (including absorbed air) transferred into the ladle, were added to perform a final equilibrium calculation, that updated the steel composition. Similarly, all products and materials entering the slag bulk, along with the COS, were used in an equilibrium calculation to update the slag composition.
Once tapping ended, no more steel and COS entered the ladle. During the transportation period of the ladle, all the ongoing reaction sites within the steelmaking ladle stayed the same, except that the absorbed air was no longer considered. Following the simulation reaching its final time step, the compositions of steel and slag were obtained at the ABS or the beginning of the LF treatment. If the predicted composition matched the measured composition, or if the CSC reached its maximum value, the simulation was terminated. Otherwise, the CSC was increased by 2 kg per tonne of steel, and the next iteration of the whole process sequence was performed.
After the model completed the calculations, the CSC for each heat was determined based on the minimum error index (). The deviation between the predicted and measured compositions under different CSC values was quantified using the error index defined in Equations (3) and (4). The selected components corresponded to the compositions of the added materials and the major elements present in the steel.
where and represent the predicted and measured compositions in steel and slag in wt.-% and denotes the sum of squared differences in the composition of component i.
2.3. Determination of Model Parameters
In our previous work [12], the melting rates of all materials were assumed to be predefined. Presuming that two identical alloy particles, added to the steel melt at the same time step, do not interact with each other, they have the same melting time, behaving as one single alloy particle regarding the melting rate. This means that even if the amount of alloy is increased, the melting time may remain the same.
To reasonably estimate the melting rate of each material, the following method was used to calculate the melting rate. Existing research [22,23] has shown that when a single alloy particle is added to steel at room temperature, it undergoes the following stages:
- An iron shell growing around the alloy particle.
- The alloy melts behind the iron shell.
- The solid alloy core is gradually heated and melted, and the iron shell gradually melts.
Zhang et al. [22,24] calculated the existence time of the iron shell of a single alloy particle and validated the results through experiments. Different alloys have different physical properties such as thermal conductivity, heat capacity and density, influencing the thickness of the iron shell, and therefore, leading to various existence times. The existence time of the iron shell in their research is calculated by Equations (5)–(7) [22,24].
where R represents the particle radius, m; is temperature diffusivity, m2 s−1; represents particle relative melt velocity, m s−1; and all subscript M means Melt, and no subscript represents the physical properties of the alloy particle. denotes kinematic viscosity, m2 s−1; is the heat conductivity, W (m∙K)−1; and represent the melt temperature and melt solidification temperature, respectively, °C; denotes initial particle temperature, °C; is density, kg m−3; C represents heat capacity, J (kg∙K)−1; and t is the one particle melting time, s.
Taking FeMn alloying as an example, the existence time of the iron shell surrounding, the heat transferred from the steel is sufficient to melt the whole particle, which means the alloy melting time is equal to the existence time of the iron shell. To unify the calculation method for melting time for all materials, it is equal to the existence time of the iron shell in the presented model. Although this assumption may not hold for all materials, the proposed approach is more physically grounded than using a fixed melting rate. The melting time data of all materials used in the simulations are listed in Table 4.
Table 4.
Material properties and melting time values for single-particle calculations adapted from [22,25,26,27].
Given the substantial differences in production conditions between Heat 4 and Heats 1–3, the following section focuses on the determination of several key model parameters for Heat 4.
Heat 4 contained 350 tons of liquid steel. The used steelmaking ladle was equipped with two bottom plugs, and the purging gas flow rate was 100 Nm3 h−1 per plug. The plant experiments within this work were conducted on a 210-ton steelmaking ladle, also equipped with two plugs, and a flow rate of 60 Nm3 h−1 per plug. Since the bottom-blowing flow rates of the two heats are different, the alloy recovery rate and steel mass transfer coefficient should be different.
It is known that C alloy floats on the surface of steel due to its low density. With an increasing gas stirring rate, the C alloy recovery rate also increased due to an easier entrapment into the molten steel. As the bottom blowing flow rate in Heat 4 is larger, part of the incompletely melted Al alloy reaches the steel surface due to the flow of the molten steel and contact with air, where it is easily oxidized, resulting in a low recovery rate. According to the research results of Berg et al. [28], the recovery rate of FeMn alloy is higher than SiMn alloy for the same particle size during the tapping process. Meanwhile, the mass transfer coefficient is strongly affected by the stirring conditions in the steel. Many studies [21,29,30,31] have shown that a higher bottom blowing flow rate increases stirring energy and thus enhances the mass transfer coefficient. In our previous work (Cheng et al. [12]), parameter consistency across all heats was assumed; the recovery rate and mass transfer coefficient of steel in Heat 4 were not considered separately. However, the two bottom blowing flow rates are different, and the difference in these two parameters should be considered. Using the same method as in our previous study by Cheng et al. [12], the alloy recovery rate and the mass transfer coefficient of Heat 4 were recalculated. The unchanged parameters of the experimental heats (Heat 1–3) and the recalculated values of Heat 4 are listed in Table 5.
Table 5.
Recovery rates of alloys and mass transfer coefficients of steel for the four heats.
3. Results and Discussion
3.1. Determination of the Carryover Slag Coefficient
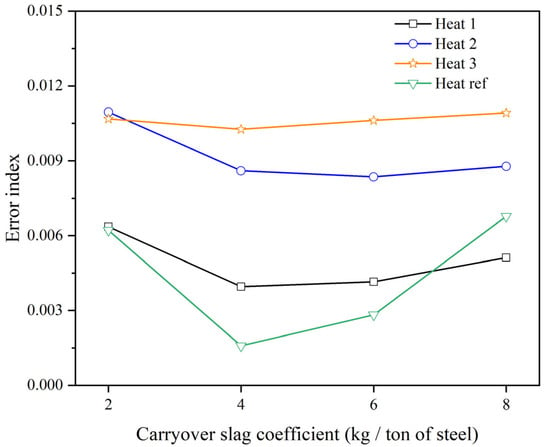
Figure 3 shows the variation in the error index with the CSC. An initial CSC of 2 kg per tonne of steel was assumed and then increased iteratively (in fixed 2 kg per tonne of steel increments). For CSC values below or above the optimum, the predicted compositions increasingly diverge from the measurements, which is reflected by a higher error index and indicates clear underestimation or overestimation. For Heats 1, 3, and 4, the minimum error index occurs at a CSC of 4 kg per tonne of steel, which closely aligns with reported values of 3.58 kg per tonne of steel [17,32]. For Heat 2, the minimum error index is observed at 6 kg per tonne of steel, consistent with the results reported by other researchers [33]. The different estimated minimum values may be caused by the fact that the tapping is manually controlled. Therefore, the amount of carryover slag entrained varies from heat to heat.
Figure 3.
Relationship between CSC and error index [17].
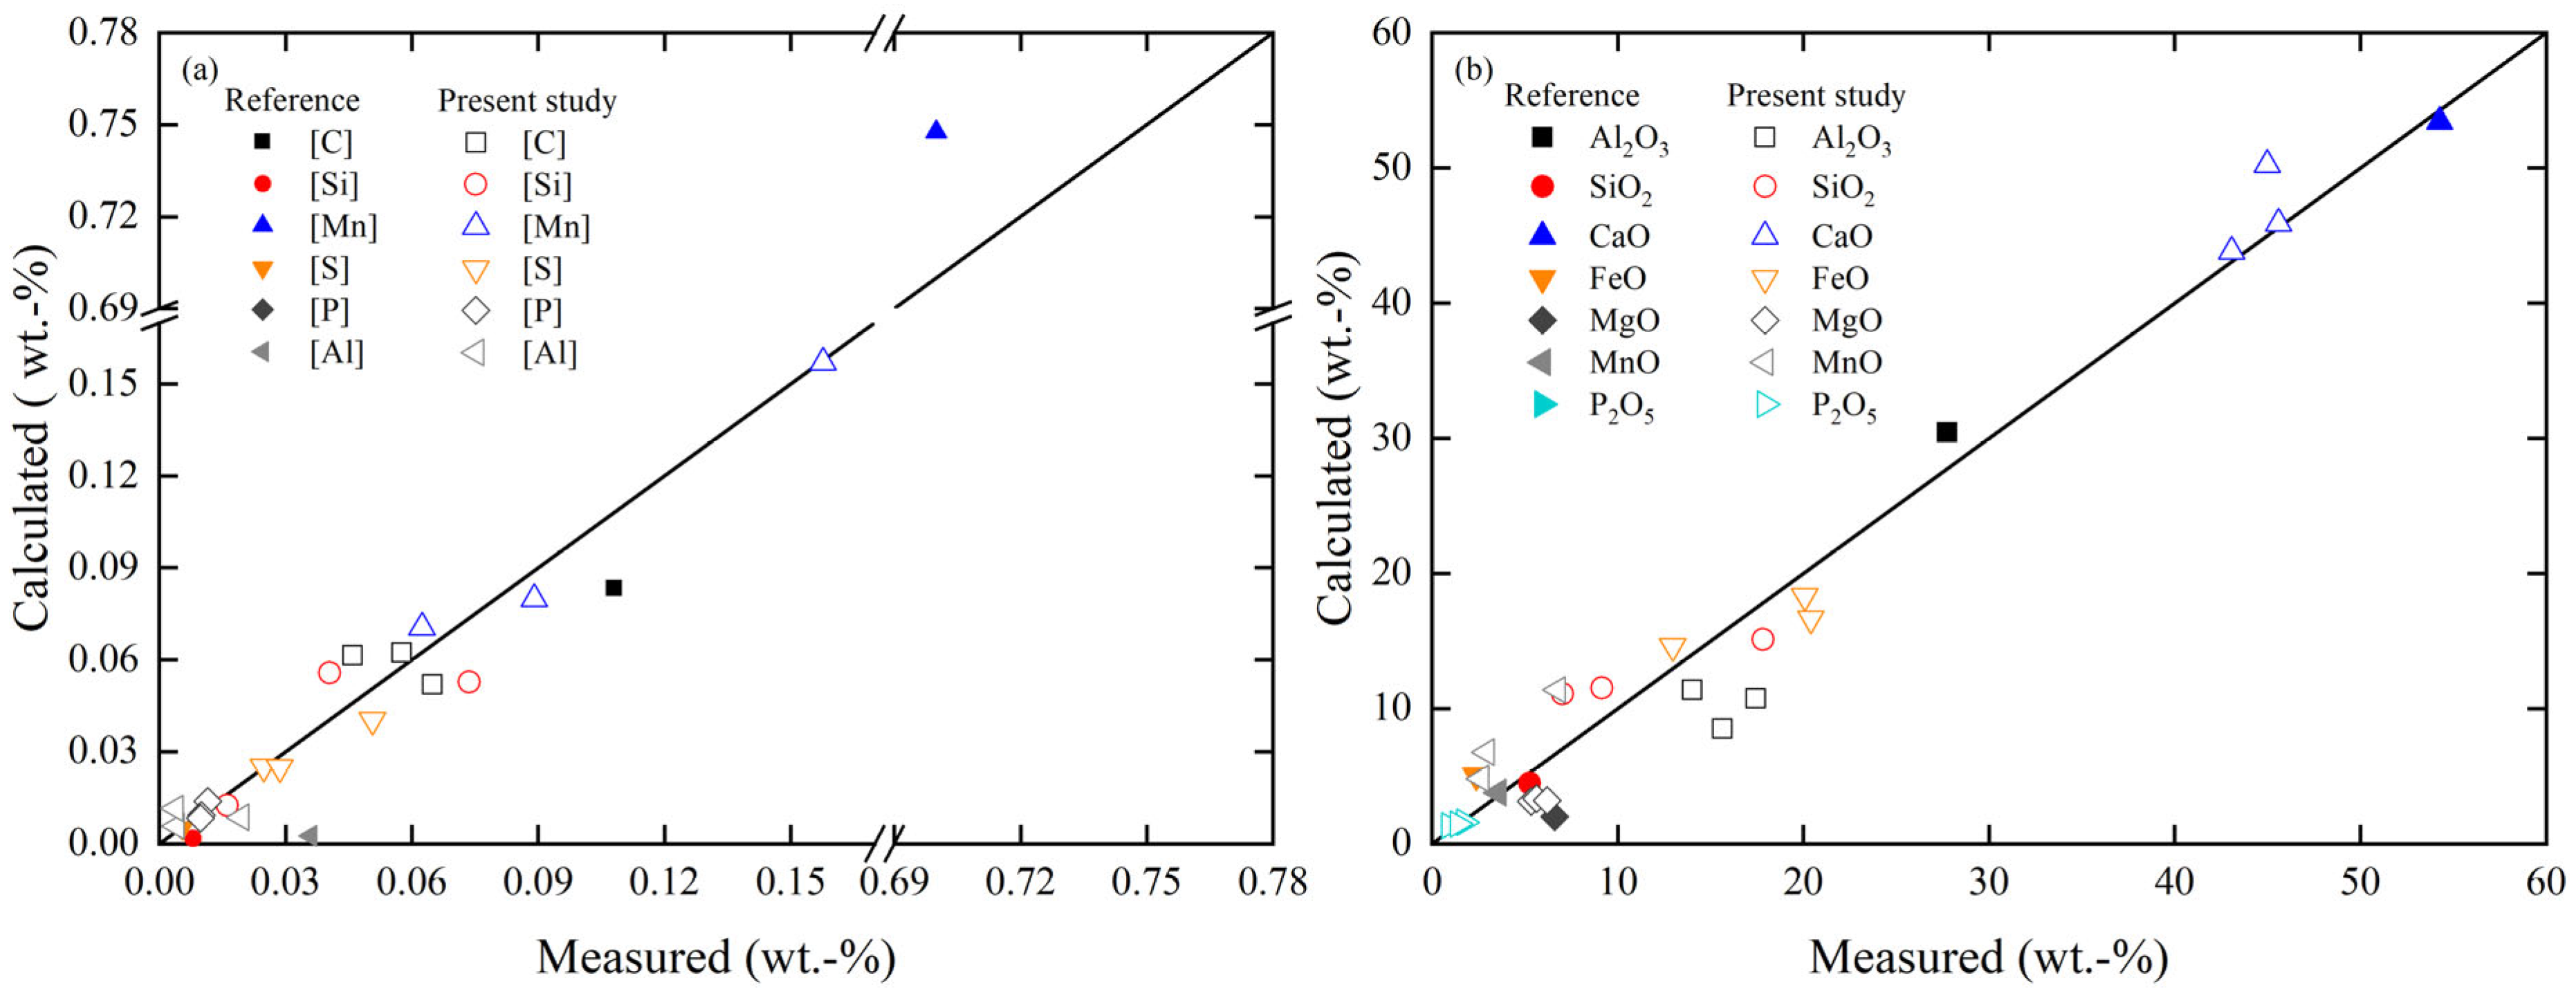
Once the CSC was estimated, the tapping process was simulated using the obtained CSC value, and the predicted final steel and slag compositions were compared with the measured data to validate its accuracy. As shown in Figure 4a,b, the predicted compositions of the final steel and slag are in good agreement with the measured compositions among the four heats, further confirming that the model can accurately estimate the amount of carryover slag.
Figure 4.
Comparison between predicted and measured compositions for (a) steel and (b) slag [17].
Heats 1–3 features incomplete deoxidation due to the relatively small amounts of alloy additions, whereas Heat 4 features complete deoxidation because sufficient alloys are added. Therefore, Heat 2 (case 1) and Heat 4 (case 2) were selected to illustrate the relationship between the CSC and the main components in steel and slag under different deoxidation conditions.
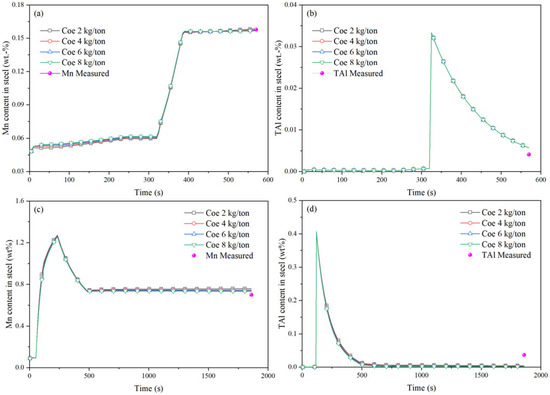
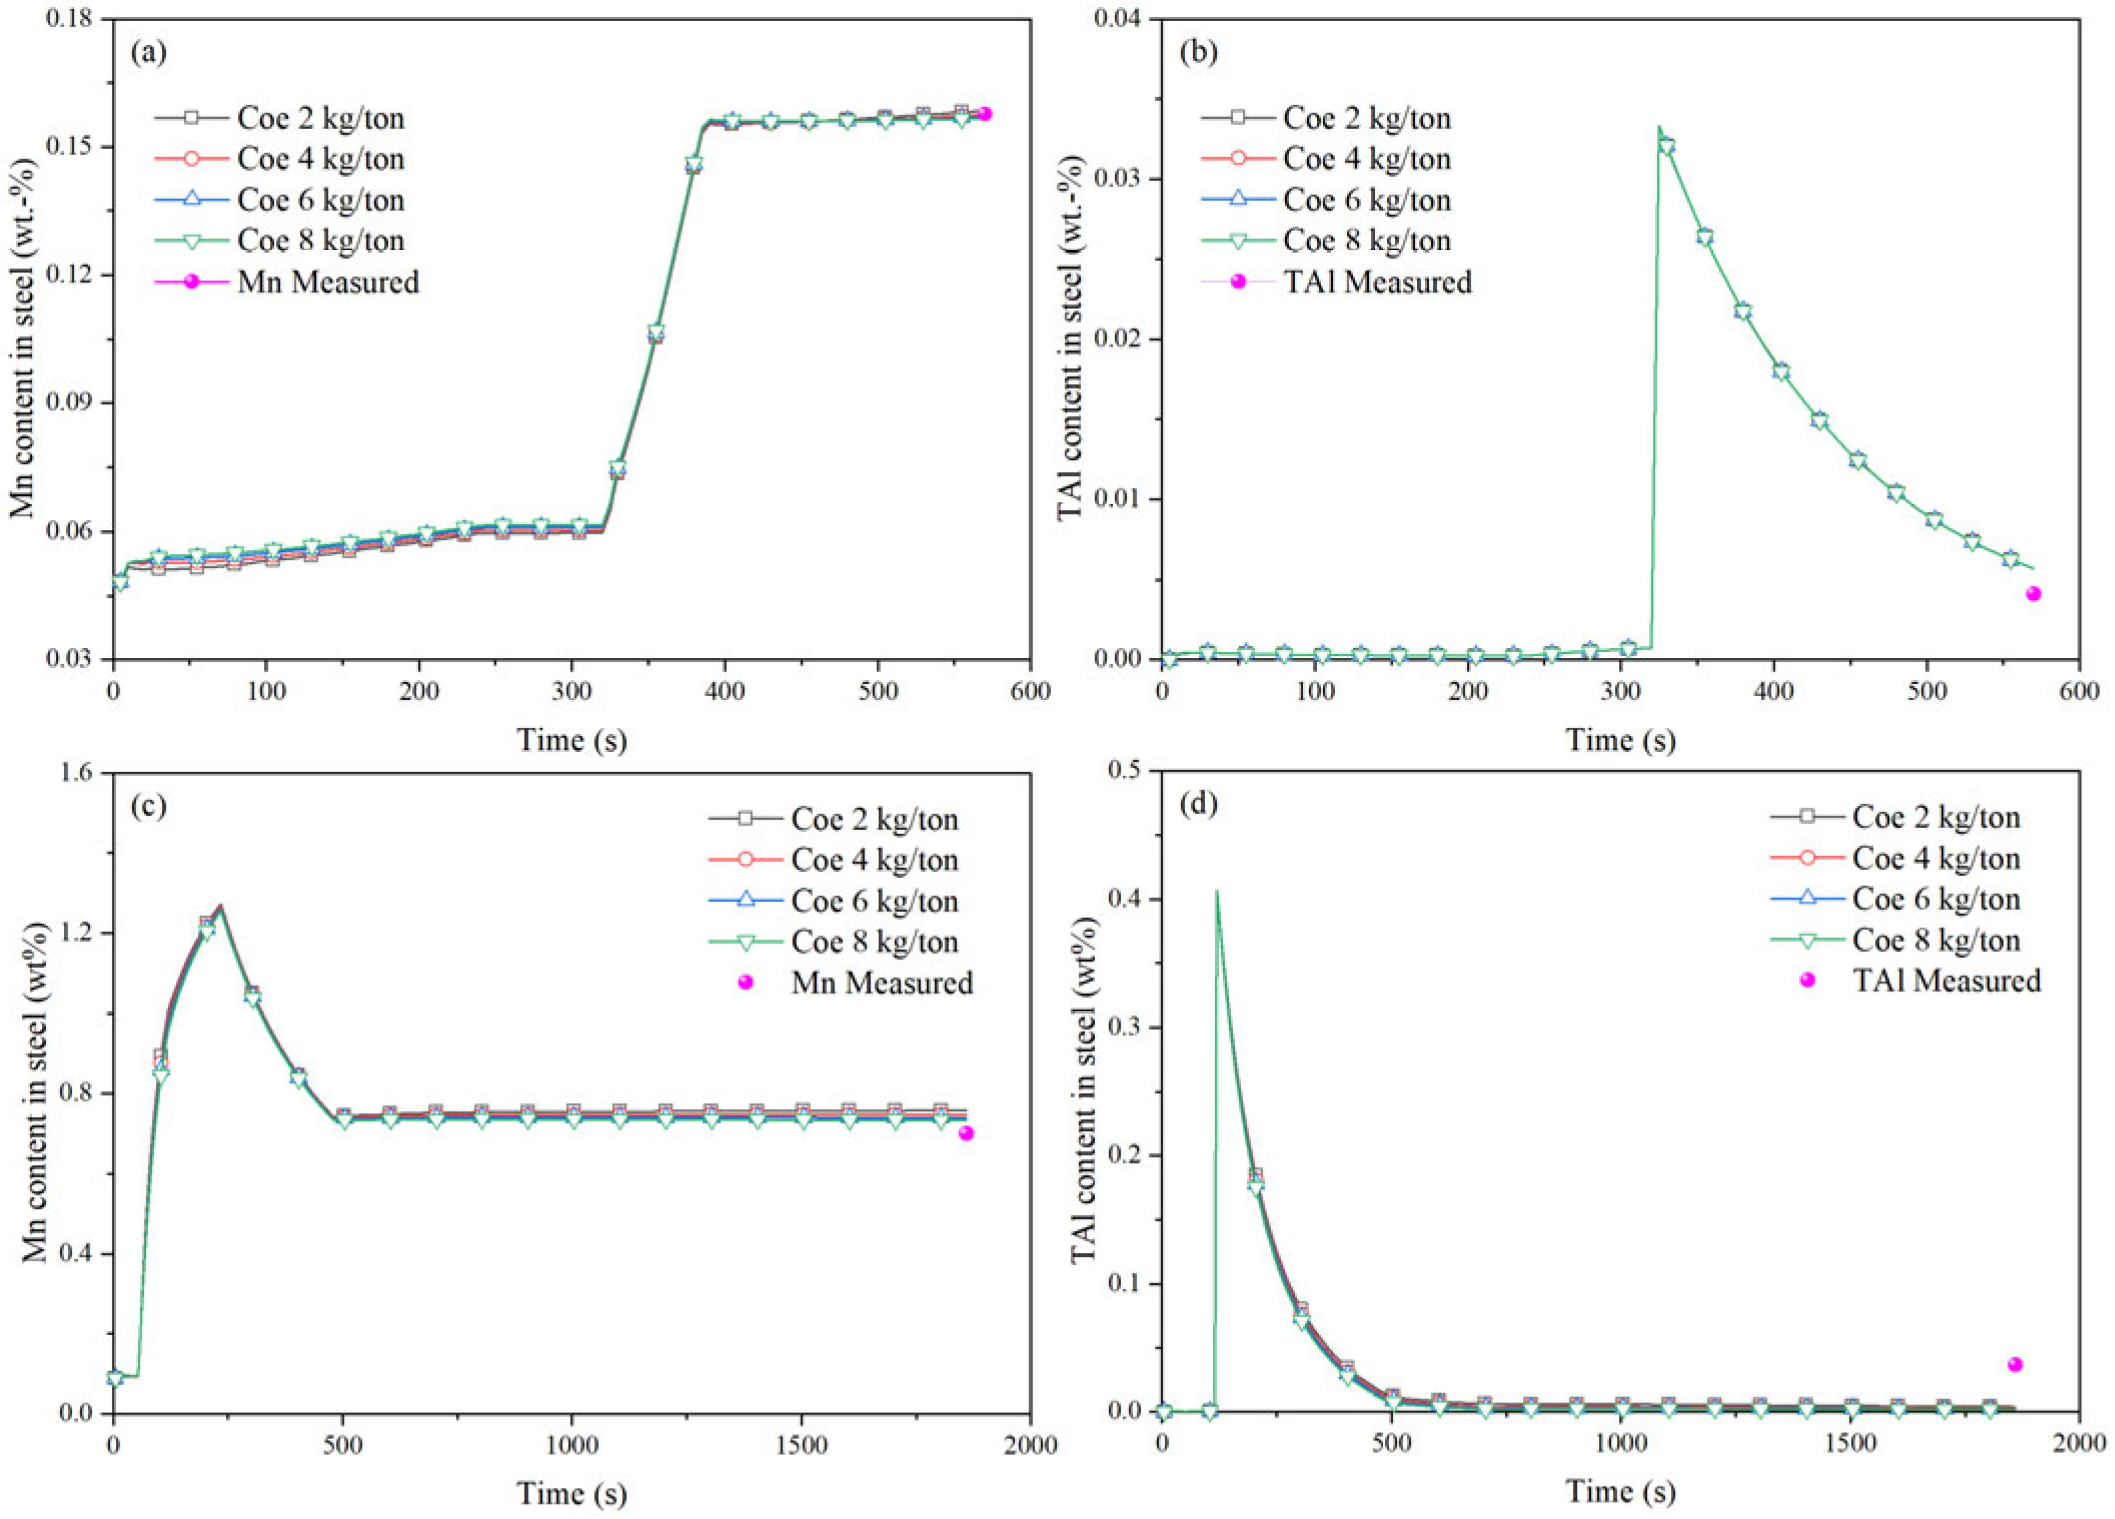
In both cases, the main alloying elements added to the steel are Mn and Al. Their concentration evolution under different CSC values is therefore presented in Figure 5, since any CSC-related differences in their contents would be more clearly revealed by Mn and total aluminum (TAl) behavior. The results show that the predicted Mn and TAl contents in the steel vary only slightly across different CSC values, indicating that CSC cannot be determined only from a single element in the steel. As shown in Figure 5a, the Mn content changes slightly during the tapping period because the reaction between steel and slag has not reached equilibrium. With the addition of Mn alloy, the Mn content increases gradually and continues to rise slightly after alloy addition is completed. In case 2, Mn alloy is added during the tapping period; the overall evolution of Mn content resembles that in case 1 (Figure 5c). However, during alloy addition, the Mn content first increases and subsequently decreases once it reaches a sufficiently high concentration. Figure 5b and Figure 5d show similar trends in TAl content. It is close to 0 before alloying, increases rapidly after alloying, and gradually decreases once alloying is completed.
Figure 5.
Evolution of the main steel components under different CSCs during the tapping process: (a) Mn in case 1, (b) TAl in case 1, (c) Mn in case 2, (d) TAl in case 2.
In case 1, as only a small amount of Mn alloy is added during the treatment, Mn concentration remains low, and the steel remains incompletely deoxidatized. Although Al alloy is added during the process, less MnO is reduced. In case 2, the decrease in Mn content observed during the latter stage of Mn alloy addition is caused by the complete deoxidation. Both FeO and MnO are reduced from the slag. Once the Mn content becomes sufficiently high, FeO is more easily reduced than MnO and the total mass of the molten steel increases faster than the Mn mass. Consequently, although the total amount of Mn in the steel increases during the tapping, its concentration decreases instead and tends to be stable. The addition of Al alloy causes the TAl to rise sharply. As steel–slag interactions continue and Al2O3-type inclusions gradually float to the surface, the TAl content gradually decreases.
Overall, the amount of COS is extremely small compared to the mass of steel in the ladle. Therefore, the elements reduced from the slag do not cause significant compositional changes in the steel. Moreover, when the amount of CSC is doubled, due to the equilibrium reactions between steel and slag, the amount of reduced components in the slag does not double. The reduced amount depends on the concentration of the components. The mass increase is only moderate, leading to minimal changes in element concentrations within the steel. In addition, these slight composition variations are not enough to compensate for the composition changes caused by the uneven mixing of steel composition in the ladle and sample measurement deviation. Therefore, the COS amount cannot be determined based on the concentration of a single element in the steel.
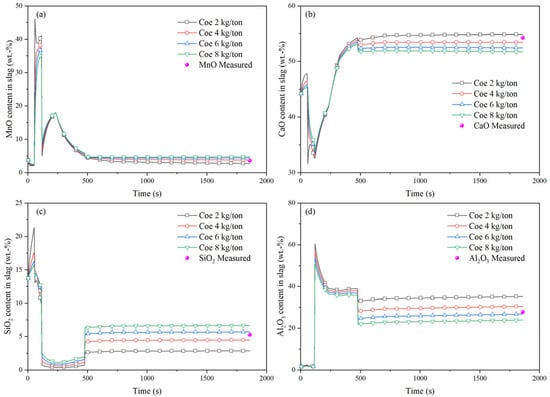
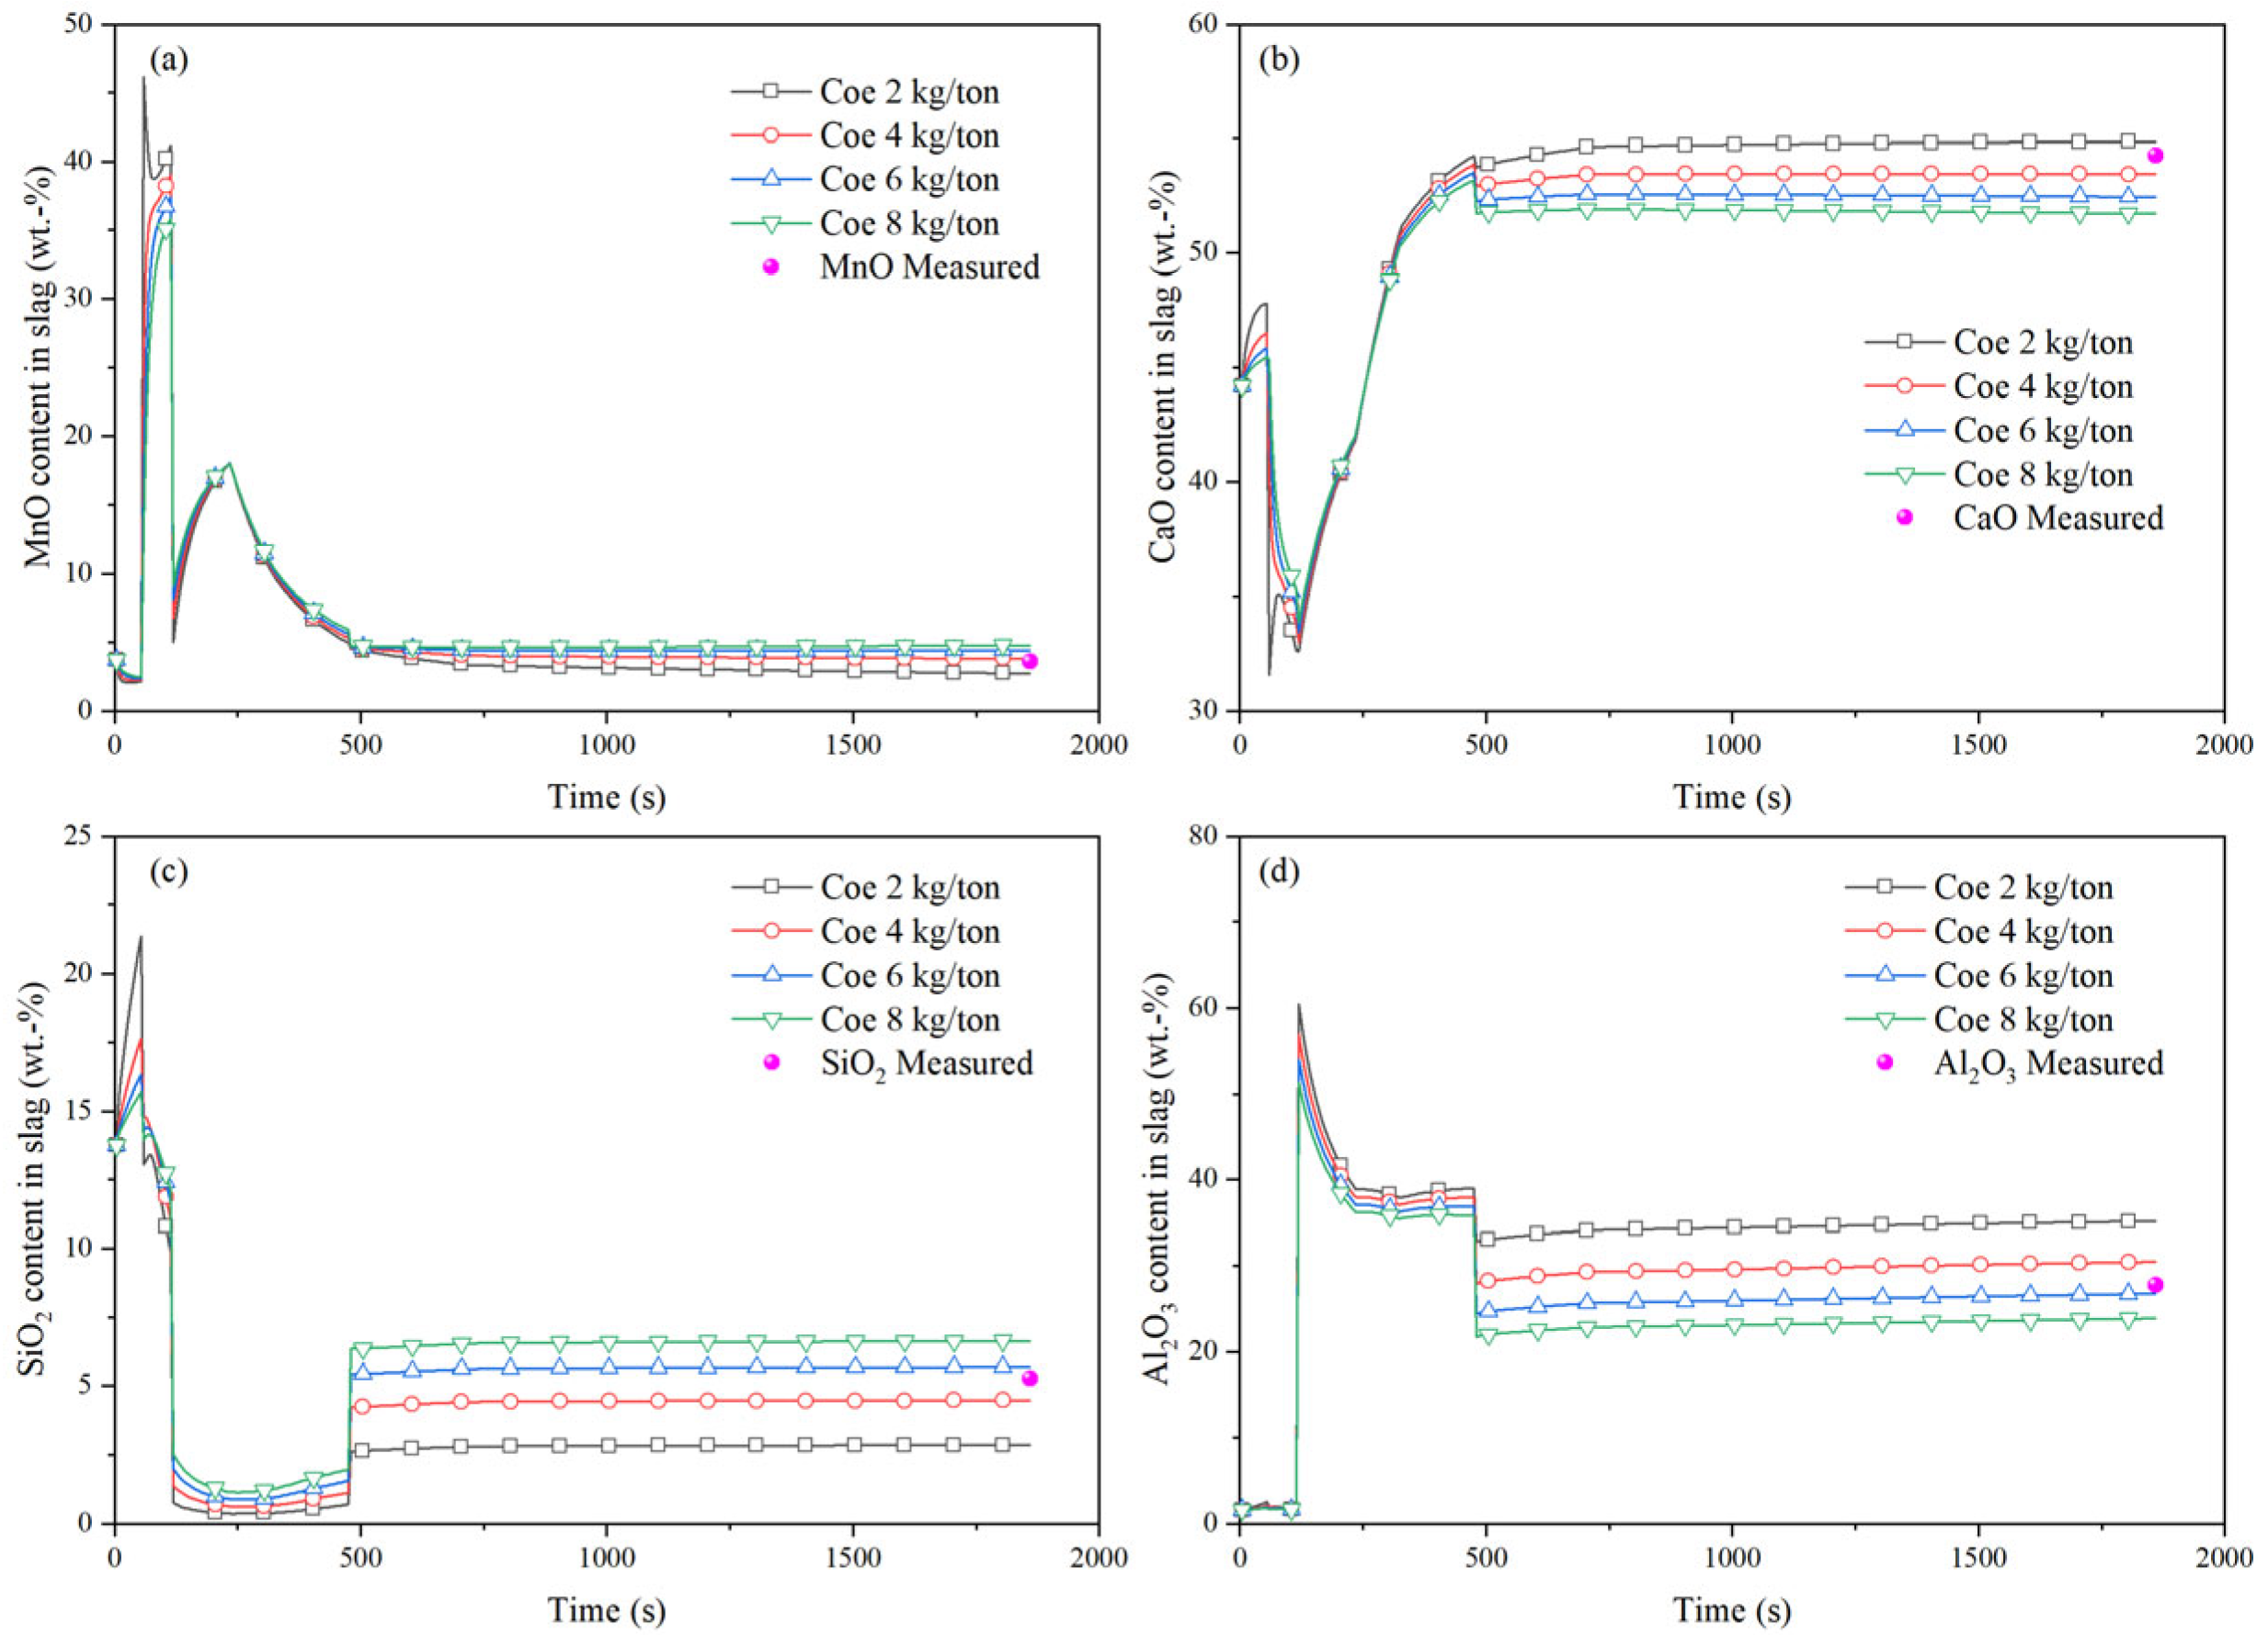
Since the changes in slag composition for both heats follow similar trends, and case 2 is simulated up to the beginning of LF, allowing adequate time for steel–slag reactions, only the evolution of the main slag components in case 2 is presented. Figure 6 presents the evolution of the main slag components under different CSC values during the tapping process for case 2. As shown in Figure 6a, the MnO content in the slag increases at 60 s, and then drops sharply at 120 s. Subsequently, the MnO content gradually increases until the completion of alloy addition, after which it gradually decreases to a stable state. Figure 6b shows the evolution of CaO. Its content first decreases at 60 s, then starts to rise at 120 s and continues increasing as the lime dissolves. After tapping is complete, the content drops sharply before increasing again until the lime is fully dissolved, eventually reaching a stable level. Figure 6c presents the evolution of SiO2. The SiO2 content decreases at 60 s and then drops rapidly at 120 s. After the addition of Al alloy, it remains at a low level. At the end of tapping, the SiO2 content rises sharply and then tends to be stable. In Figure 6d, the Al2O3 content increases rapidly at 120 s; following the completion of Al alloy dissolution, the content in the slag gradually decreases. A rapid decline can be observed at the end of tapping, and then it approaches a steady state. As the CSC increases, the final MnO and SiO2 contents increase, whereas the CaO and Al2O3 contents decrease.
Figure 6.
Evolution of the main slag compositions under different CSCs during the process in case 2: (a) MnO, (b) CaO, (c) SiO2, (d) Al2O3.
Regarding the evolution of MnO in the slag, at 60 s, Mn alloy and lime are added and the oxidation of Mn leads to an increase in MnO content within the slag. At 120 s, the addition of Al alloy results in a rapid decrease in MnO to a low content. As the Mn alloy continues dissolving, the MnO concentration rises again. Once Mn alloy dissolution is complete, the MnO content gradually decreases due to the reduction by Al and Si, eventually reaching a stable level. Since there is excess Al in the steel to reduce MnO in the slag, for an equivalent amount of MnO reduction, a smaller COS amount results in a greater decrease in MnO content.
With respect to the evolution of CaO content in the slag, although Mn alloy and lime are added at the same time, the Mn alloy dissolves faster than the lime. The MnO formed by deoxidation enters the slag, leading to a decrease in lime content. When the Al alloy is added, it dissolves rapidly and reacts with oxygen in the steel, reducing the oxygen concentration to a very low level. Consequently, the oxidation of Mn decreases, and the CaO content begins to rise. At the end of tapping, a large amount of COS enters the ladle. Because the CaO content in the COS is relatively low, it dilutes the CaO content in the ladle. Although the added lime increases the CaO content, a larger COS amount results in a lower final CaO content.
In the evolution of SiO2 in the slag, an interesting phenomenon can be observed after the addition of Mn alloy at 60 s: as the Mn concentration increases rapidly, the reversible reaction described by Equation (8) occurs. The high Mn concentration reacts with the high concentration of SiO2, driving the reaction toward the left and causing a decrease in SiO2 content during the early stage. Following the addition of Al alloy, SiO2 is reduced to a very low content. Upon tapping, a large amount of COS enters the ladle, increasing the SiO2 concentration. Since SiO2 is mainly reduced by Al, as in the case of MnO reduction, it will not be explained here. Overall, a greater amount of COS results in a higher final SiO2 content.
After the dissolution of the Al alloy, the Al2O3 content in the slag gradually decreases as the Mn alloy and lime continue to dissolve. With the completion of the tapping, a large amount of COS with low Al2O3 content enters the ladle, further diluting the overall Al2O3 content in the slag. Therefore, heats with a smaller amount of COS result in higher final Al2O3 content.
3.2. Effects of Model Parameters on the Calculation Results
In industrial practice, several operational factors may influence the model parameters. For instance, incomplete dissolution of alloys may occur due to relatively low temperatures, some alloy particles remaining on the slag surface, or insufficient time between alloy addition and sampling. In addition, fluctuations of the molten steel surface may affect the steel–slag interfacial area, and variations in bottom stirring intensity may lead to changes in the mass transfer coefficient. Furthermore, the physical properties of lime differ from those of alloys, which may influence its melting time. These variations in production conditions may introduce uncertainties in the model parameters and consequently affect the predicted results. Therefore, based on case 1, additional comparative analyses were carried out by considering scenarios with a certain fraction of undissolved alloys, an increased steel–slag interfacial area, and variations in the mass transfer coefficient.
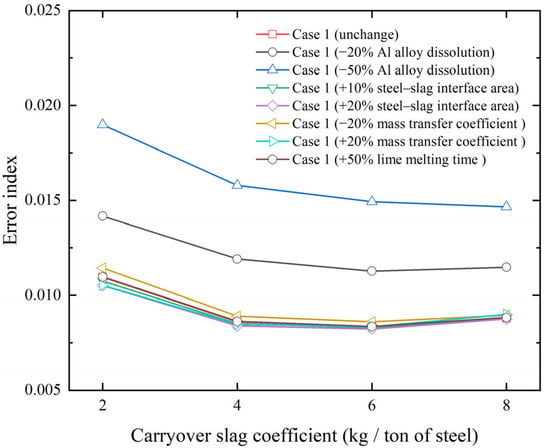
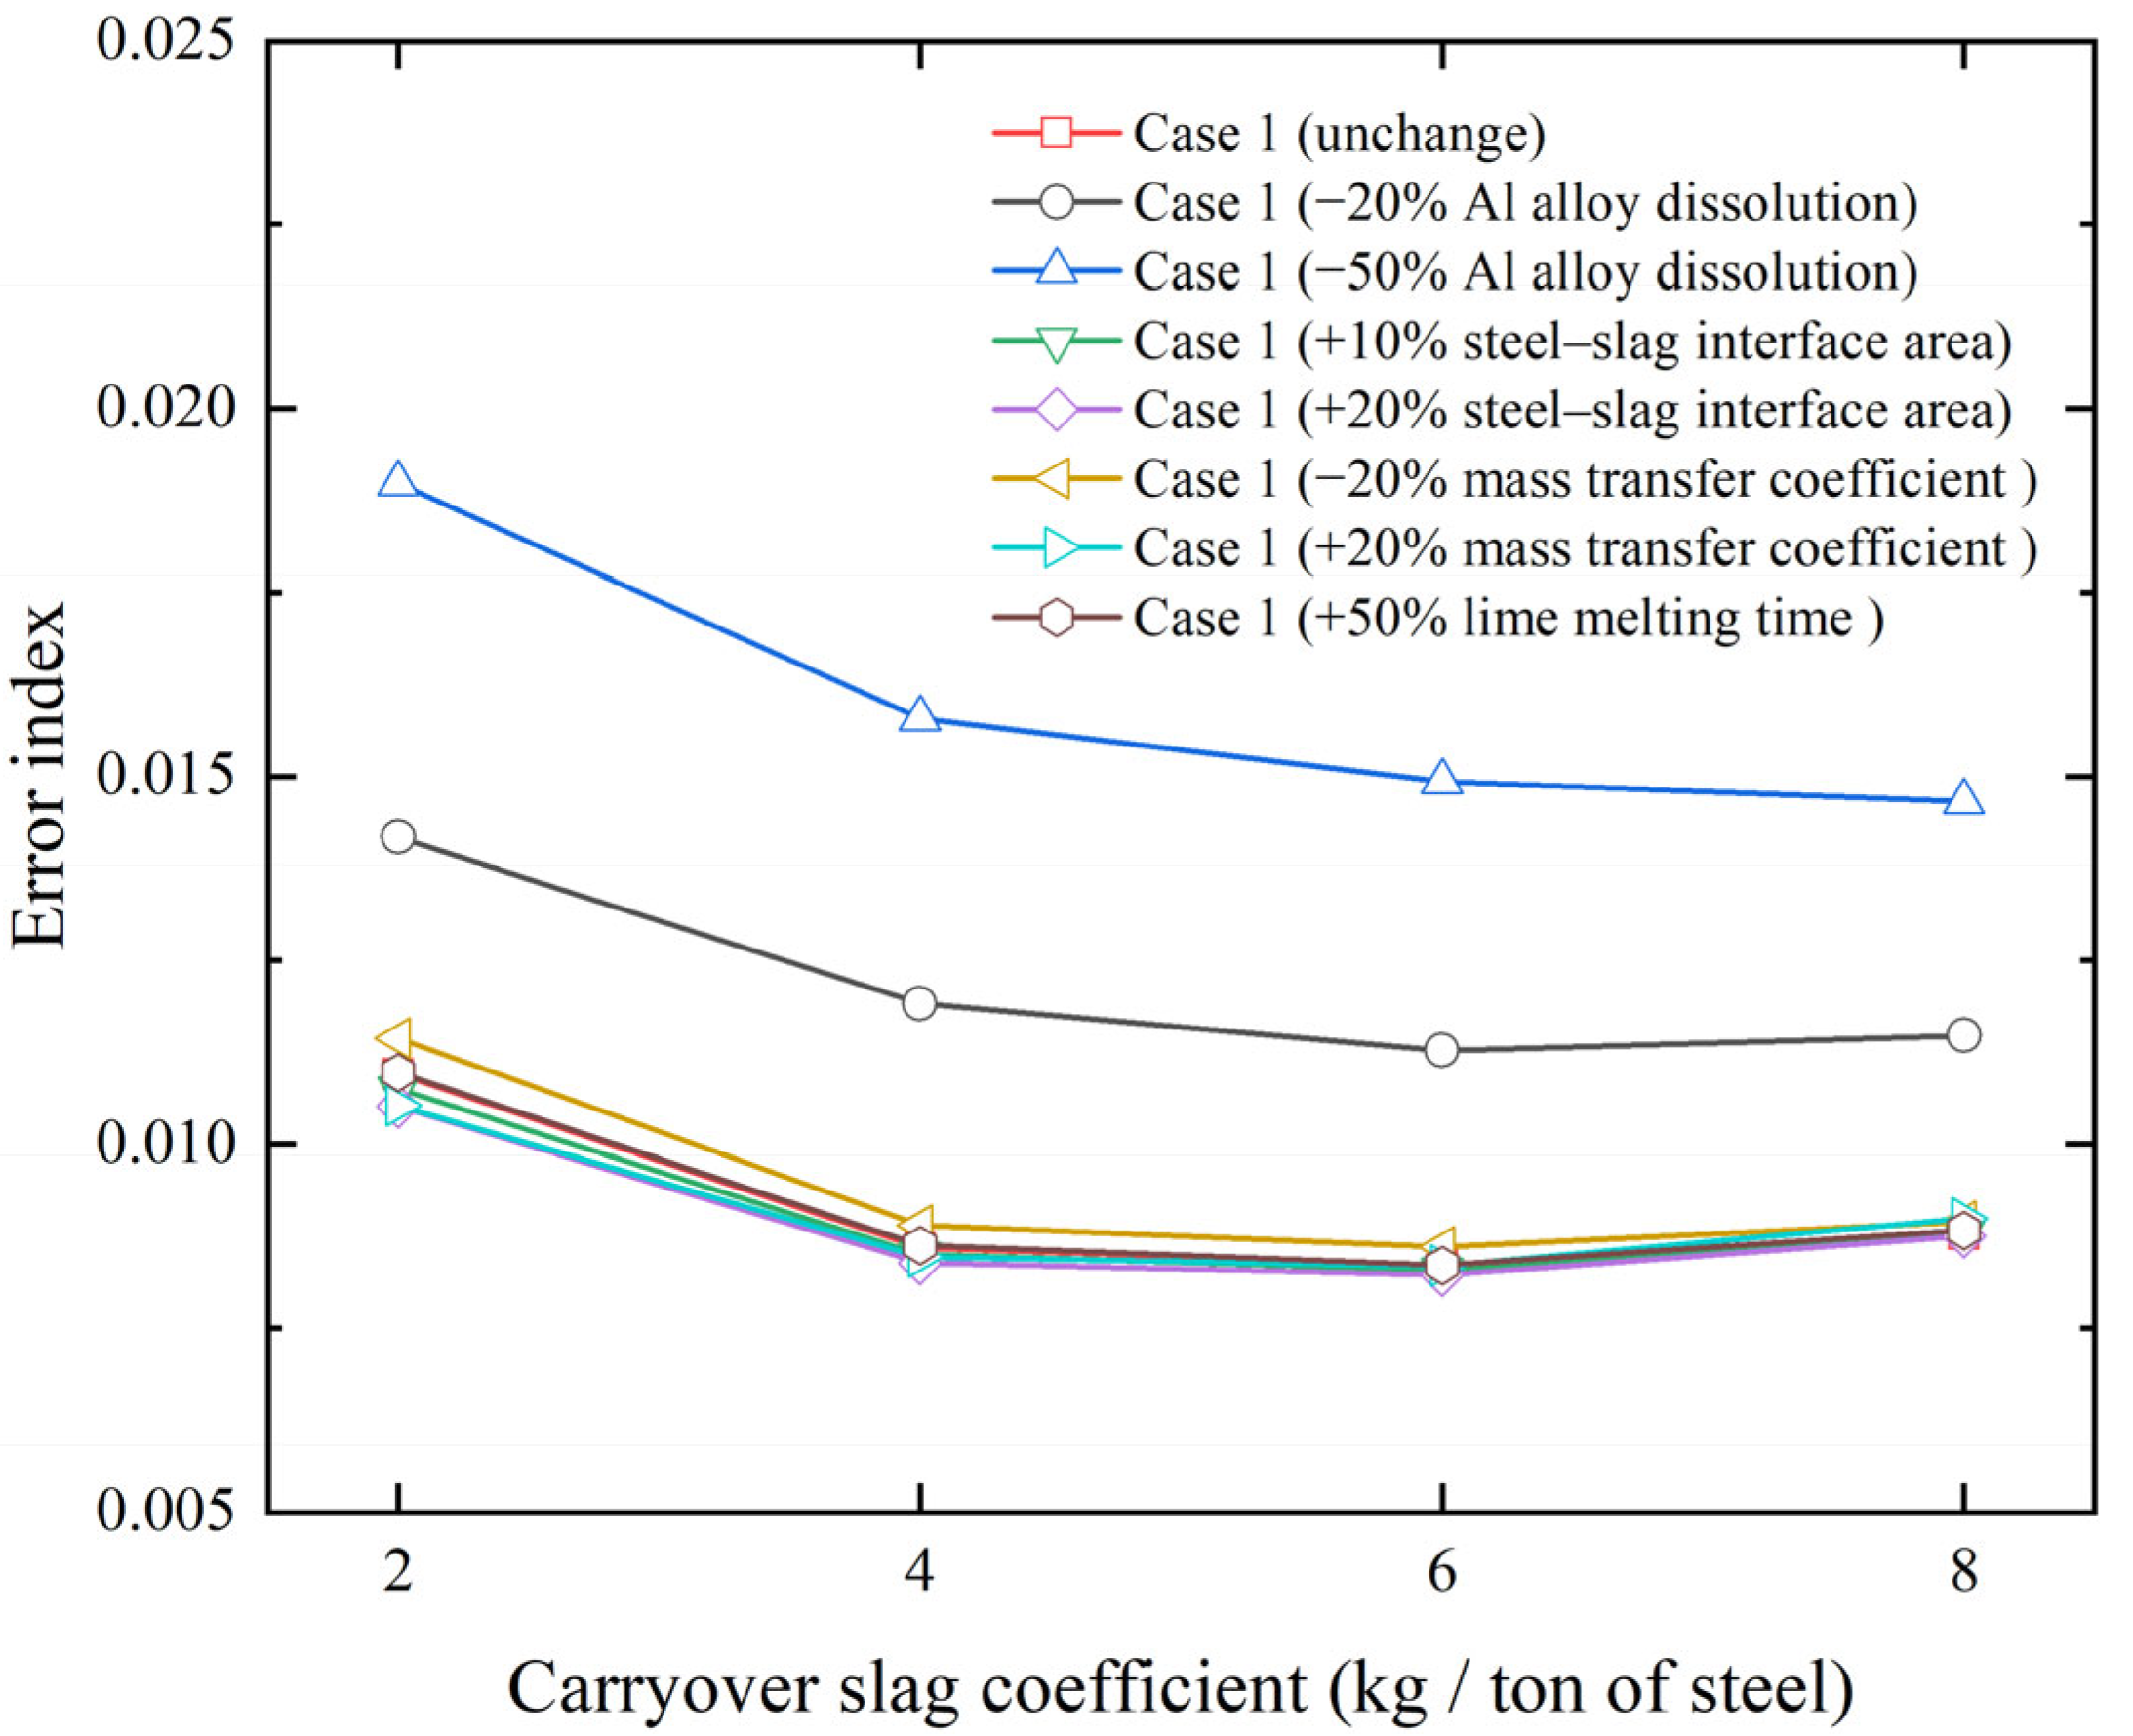
Figure 7 shows the influence of different parameters on the predicted results. Among the examined factors, the fraction of undissolved alloys has the most significant effect on the error index, whereas variations in the steel–slag interfacial area, lime melting time and the mass transfer coefficient have relatively minor impacts. Under the base conditions without any parameter modifications, the estimated CSC is 6 kg per tonne of steel. When 50% of the added Al alloy is assumed to remain undissolved, the minimum error index is obtained at a CSC of 8 kg per tonne of steel. The estimated CSC value has increased relative to the base condition. When 25% of the Al alloy remains undissolved, the estimated CSC remains 6 kg per tonne of steel; however, the corresponding error index increases by 0.0029. Increasing the steel–slag interfacial area by 10% or 20% does not change the estimated CSC, which remains 6 kg per tonne of steel, and only a slight influence on the error index is observed. Similarly, increasing or decreasing the mass transfer coefficient by 20%, or increasing the lime melting time by 50%, has only minor impacts on both the estimated CSC and the error index.
Figure 7.
Comparison of the influence of different parameters on the calculation results.
Generally speaking, it can be stated that an increase in undissolved Al alloy leads to a lower Al concentration in the molten steel, which in turn reduces the reduction of MnO and SiO2 in the slag. During tapping, the addition of MnSi alloy together with the relatively high oxygen content in the steel causes partial oxidation of Mn and Si, resulting in MnO and SiO2 concentrations in the slag that are higher than those in the COS. When a fraction of Al alloy remains undissolved, the reduced reduction of MnO and SiO2 further increases their concentrations in the slag, while the corresponding Mn and Si concentrations in the steel decrease, leading to a higher error index. To decrease the error index, the amount of COS needs to be increased, which dilutes the MnO and SiO2 concentrations in the slag toward the measured values. Meanwhile, due to the increased amount of COS, a larger amount of Mn and Si is reduced for the same decrease in MnO and SiO2 concentrations. This results in increases in the concentration of Mn and Si in the molten steel and brings them closer to the measured values. The combined effects of these two factors contribute to the reduction in the error index. This explains why the CSC value increases when 50% of the Al alloy is undissolved. To minimize potential deviations in the predicted COS amount, alloy additions should be dissolved completely before sampling.
Variations in the steel–slag interfacial area and the mass transfer coefficient essentially affect the transport rate of species between the bulk phases and the steel–slag interface. Consequently, these parameters mainly influence the degree to which the reactions between steel and slag approach equilibrium during the process. As a result, changes in the interfacial area or the mass transfer coefficient have only a limited effect on the calculated error index and lead to negligible variations in the predicted CSC values. Similarly, the melting time of lime primarily affects its transient concentration in the slag phase. Once the lime is completely dissolved into the slag, its influence on the final near-equilibrium concentrations becomes limited. Therefore, variations in the lime melting time also have only a minor influence on both the error index and the predicted CSC.
3.3. Effects of Different Carryover Slag Amounts
A larger amount of COS influences several aspects of steelmaking, including P reversion [32], deoxidizer consumption [33], steel cleanliness [34], and refractory wear [35]. To clearly examine these effects, case 2 was selected because the molten steel is fully deoxidized. This leads to a more reasonable visualization of the dependence on the COS amount. The following discussion analyzes the effect of the CSC based on the simulation results of case 2.
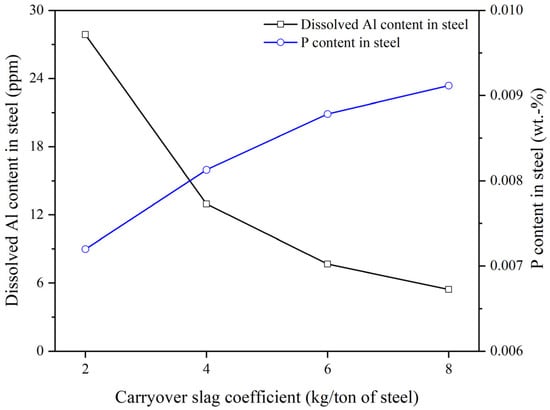
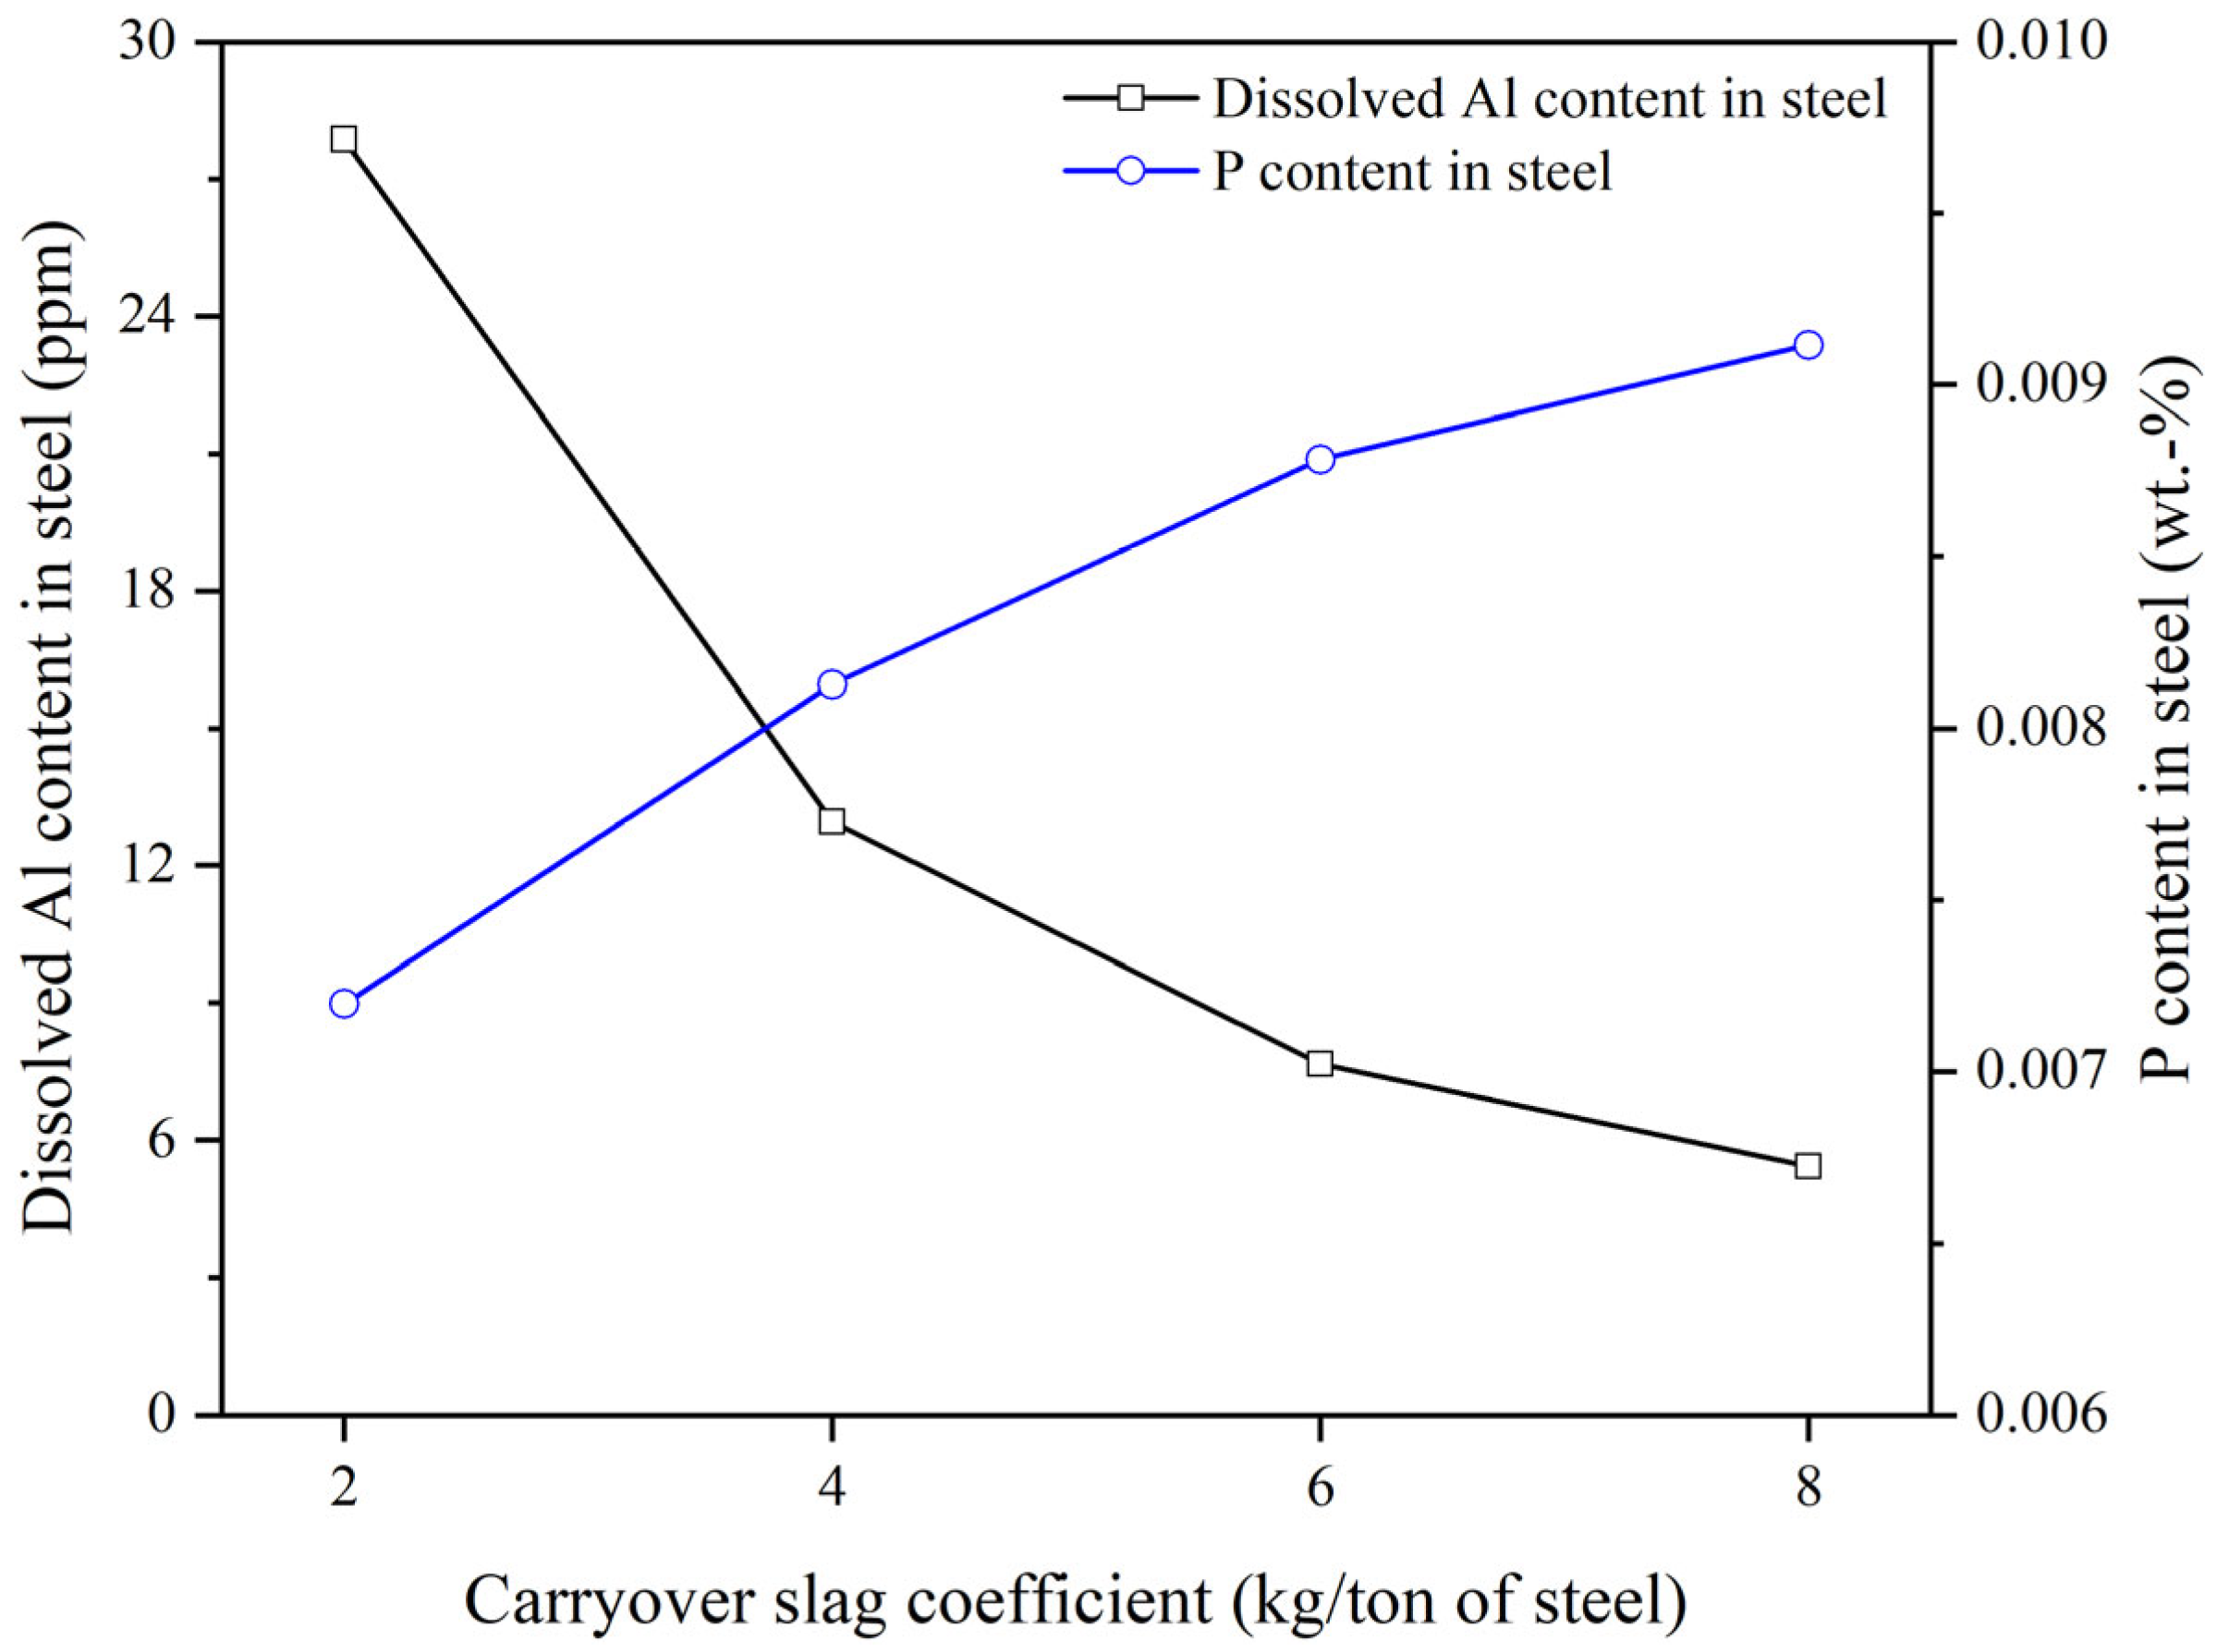
As shown in Figure 8, increasing the CSC leads to higher P content and lower dissolved aluminum in the steel. A greater amount of COS introduces more oxidizing slag into the ladle, resulting in increased P reversion from slag to steel, consistent with previous studies [14,32]. When CSC increases from 2 to 4 kg per tonne of steel, approximately 9.3 ppm of P is returned to the molten steel, which is consistent with the value reported by Di Napoli Guzela et al. [36] It was reported that with a stopper, the COS is reduced to 3–5 kg per tonne of steel and the P return is about 10 ppm. As the COS amount increases, the (FeO + MnO) amount in the slag also rises. During refining, more Al is required to reduce (FeO + MnO) and to meet deoxidation and desulfurization requirements, leading to increased deoxidizer consumption. The oxidized Al forms primary inclusions; although some of these inclusions float into the slag, a portion remains in the steel, decreasing steel cleanness. This is consistent with previous findings [14,32,37,38].
Figure 8.
Effect of the CSC on the dissolved Al and P content in steel.
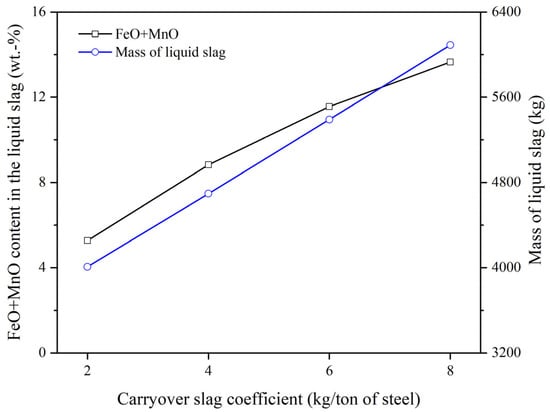
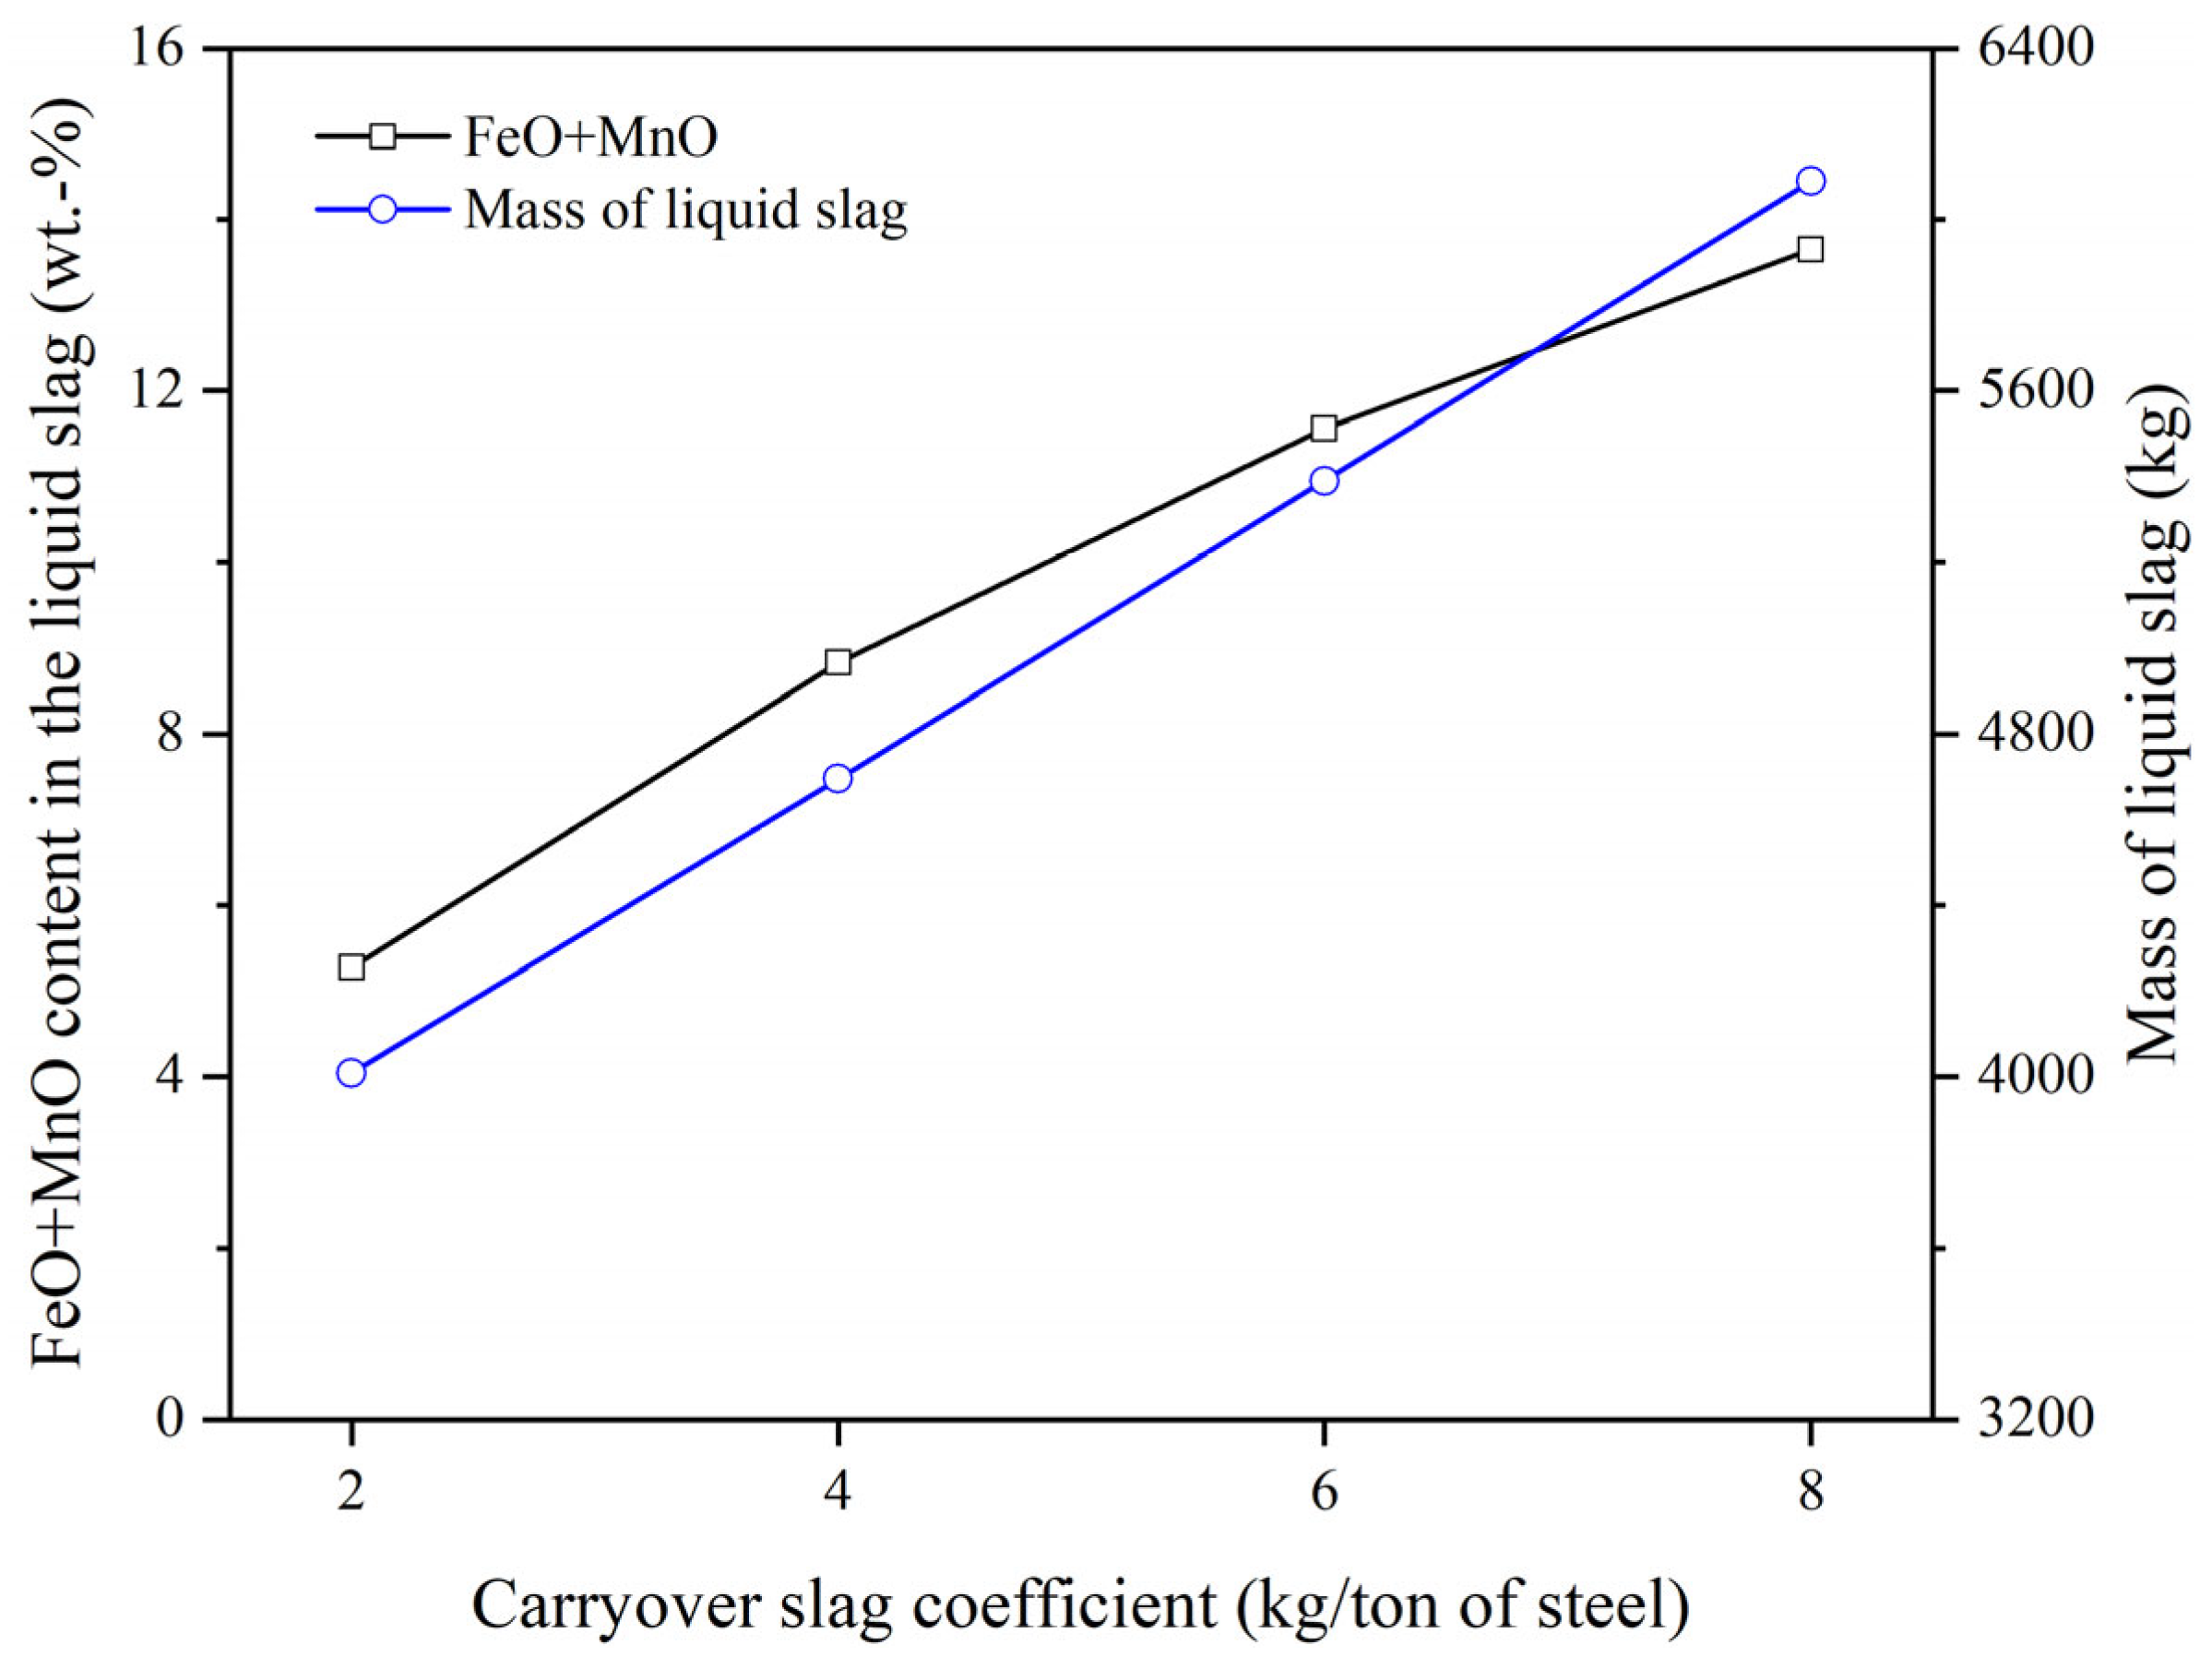
Figure 9 shows the effect of the CSC on the liquid slag composition and liquid slag mass during tapping. A higher CSC results in a greater amount of liquid slag and increased (FeO + MnO) content. The FeO and MnO in the slag are easily reduced by Al in the steel, promoting inclusion formation during the secondary metallurgy [38,39]. An increase in (FeO + MnO) content decreases the slag viscosity, enhances component diffusivity [40,41], and increases the MgO saturation level. The presence of unsaturated MgO in the liquid slag promotes the dissolution of MgO from the refractory. Furthermore, a larger liquid slag amount leads to a thicker liquid slag layer, and increases the interface area between the liquid slag and the ladle refractory, thereby accelerating the wear of the refractory in the ladle [14,42].
Figure 9.
Effect of the CSC on the (FeO + MnO) content in liquid slag and the liquid slag amount.
4. Conclusions and Outlook
The kinetic COS amount estimation model was developed using the EERZ approach. The CSC was determined by comparing the predicted and measured steel and slag compositions from four different heats. Moreover, the effects of COS on steelmaking were examined. The main conclusions of the work are as follows:
- (1)
- The proposed model can effectively estimate the COS amount under both complete and incomplete deoxidation conditions. Deviations from the optimized CSC result in larger discrepancies in the predicted steel and slag compositions.
- (2)
- A higher amount of COS increases P reversion. Under fully deoxidized conditions, the increase in CSC from 2 to 4 kg per tonne of steel increases P pickup by approximately 9 ppm.
- (3)
- Increased COS entrainment results in a higher liquid slag amount and raises the (FeO + MnO) content in the liquid slag, accelerates ladle refractory wear, increases deoxidizer consumption, and reduces steel cleanliness.
Validation of the model input parameters has been based on limited plant data. Future work should further validate these parameters under different production conditions and for different steel grades to improve the model generalization. Ultimately, the model could be further developed for online and real-time prediction of carryover slag amount.
Author Contributions
Conceptualization and methodology, P.C.; software and validation, P.C.; formal analysis, P.C., C.B. and D.K.; investigation and resources, P.C. and Q.Z.; data curation, P.C.; writing—original draft preparation, P.C.; writing—review and editing, P.C., C.B., D.K. and Q.Z.; visualization, P.C.; supervision, C.B.; project administration and funding acquisition, P.C. and C.B.; All authors have read and agreed to the published version of the manuscript.
Funding
This work was funded by the China Scholarship Council.
Data Availability Statement
The original contributions presented in this study are included in the article. Further inquiries can be directed to the corresponding author.
Acknowledgments
D.K. gratefully acknowledges the funding support of K1-MET GmbH, metallurgical competence center. The research program of the K1-MET competence center is supported by COMET (Competence Center for Excellent Technologies), the Austrian program for competence centers. COMET is funded by the Federal Ministry for Climate Action, Environment, Energy, Mobility, Innovation and Technology, the Federal Ministry for Labor and Economy, the Federal States of Upper Austria, Tyrol and Styria as well as the Styrian Business Promotion Agency (SFG) and the Standortagentur Tyrol. Furthermore, Upper Austrian Research GmbH continuously supports K1-MET. Besides the public funding from COMET, this research project is partially financed by the Technical University of Leoben and the industrial partners Primetals Technologies Austria, RHI Magnesita, voestalpine Stahl, and voestalpine Stahl Donawitz.
Conflicts of Interest
Authors Puhong Cheng and Qing Zheng were employed by the company Hunan Valin Lianyuan Iron and Steel Co., Ltd. Author Daniel Kavić was employed by the company K1-MET GmbH. The remaining authors declare that the research was conducted in the absence of any commercial or financial relationships that could be construed as a potential conflict of interest.
References
- Zhou, C.; Chen, Q.; Ji, Y.; Ai, L.; Wang, S.; Chen, Q.; Yuan, T. Effect of Highly Oxidizing Converter Dephosphorization Slag on Dephosphorization Behaviour of Molten Steel. Ironmak. Steelmak. 2023, 50, 958–968. [Google Scholar] [CrossRef] [Scilit]
- Liu, C.; Jia, Y.; Hao, L.; Han, S.; Huang, F.; Yu, H.; Gao, X.; Ueda, S.; Kitamura, S. Effects of Slag Composition and Impurities of Alloys on the Inclusion Transformation during Industrial Ladle Furnace Refining. Metals 2021, 11, 763. [Google Scholar] [CrossRef] [Scilit]
- Doostmohammadi, H.; Andersson, M.; Steneholm, K. Effect of EAF Slag Carryover on Slag-Metal Equilibrium Calculations for Ladle Degassing Process. In TMS Annual Meetings; TMS: San Francisco, CA, USA, 2009; pp. 695–702. [Google Scholar]
- Steneholm, K.; Andersson, N.A.I.; Tilliander, A.; Jönsson, P.G. The Role of Process Control on the Steel Cleanliness. Ironmak. Steelmak. 2018, 45, 114–124. [Google Scholar] [CrossRef] [Scilit]
- Patra, P.; Sarkar, A.; Tiwari, A. Infrared-Based Slag Monitoring and Detection System Based on Computer Vision for Basic Oxygen Furnace. Ironmak. Steelmak. 2019, 46, 692–697. [Google Scholar] [CrossRef] [Scilit]
- Aydemir, O. Use of Aluminium Dross for Slag Treatment in Secondary Steelmaking to Decrease Amount of Reducible Oxides in Ladle Furnace. Master’s Thesis, Middle East Technical University, Ankara, Turkey, 2007. [Google Scholar]
- Viale, M.; Martin, O.; Muratori, F.; Bertezzolo, U.; Perez, J.; Usart, J. Application of On-Line Infrared Thermography in Steel Making Industry. In Proceedings of the Defense and Security Symposium, Orlando, FL, USA, 9–13 April 2007; SPIE: Bellingham, WA, USA, 2007; Volume 6541, pp. 129–139. [Google Scholar]
- Alexis, J.; Andersson, M.; Björkvall, J. Optimization of Secondary Metallurgy with Respect to Non: Metallic Inclusions; Jernkontorets forskning: Stockholm, Sweden, 2011; p. 23045. [Google Scholar]
- Conejo, A.N.; Hernández, D.E. Optimization of Aluminum Deoxidation Practice in the Ladle Furnace. Mater. Manuf. Process. 2006, 21, 796–803. [Google Scholar] [CrossRef] [Scilit]
- Hassall, G.J. Report No. 7210-CB/805; British Steel Corporation, European Commission: London, UK, 1948. [Google Scholar]
- Kamaraj, A.; Mandal, G.K.; Shanmugam, S.P.; Roy, G.G. Quantification and Analysis of Slag Carryover during Liquid Steel Tapping from BOF Vessel. Can. Metall. Q. 2022, 61, 202–215. [Google Scholar] [CrossRef] [Scilit]
- Cheng, P.; Bernhard, C.; Bernhard, M.; Kavić, D.; Qi, J. A Thermodynamic-Kinetic Model for BOF Tapping: Improved Phosphorus Prediction under Non-Equilibrium Conditions. Steel Res. Int. 2026. [Google Scholar] [CrossRef] [Scilit]
- You, D.; Michelic, S.K.; Bernhard, C. Modeling of Ladle Refining Process Considering Mixing and Chemical Reaction. Steel Res. Int. 2020, 91, 2000045. [Google Scholar] [CrossRef] [Scilit]
- You, D.; Bernhard, C.; Mayer, P.; Fasching, J.; Kloesch, G.; Rössler, R.; Ammer, R. Modeling of the BOF Tapping Process: The Reactions in the Ladle. Metall. Mater. Trans. B 2021, 52, 1854–1865. [Google Scholar] [CrossRef] [Scilit]
- You, D.; Michelic, S.K.; Bernhard, C. Modeling of the Secondary Refining Process of Steel. In Proceedings of the METEC & 4th ESTAD, Dusseldorf, Germany, 24–28 June 2019. [Google Scholar]
- You, D.; Bernhard, C.; Viertauer, A.; Linzer, B. Simulation of the Refining Process of Ultra-Low Carbon (ULC) Steel. Crystals 2021, 11, 893. [Google Scholar] [CrossRef] [Scilit]
- Haidar, S.W.; Rozario, A.; Kumar, D. Thermodynamic Modelling of Liquid Steel Tapping Process to Predict Carryover Slag Amount. Ironmak. Steelmak. 2024, 52, 03019233241273476. [Google Scholar] [CrossRef] [Scilit]
- You, D.; Bernhard, C.; Mayerhofer, A.; Michelic, S.K. Influence of Slag Viscosity and Composition on the Inclusion Content in Steel. ISIJ Int. 2021, 61, 2991–2997. [Google Scholar] [CrossRef] [Scilit]
- Shin, J.H.; Park, J.H. Prediction of Inclusion Evolution During Refining and Solidification of Steel: Computational Simulation and Experimental Confirmation. Metall. Mater. Trans. B 2020, 51, 1211–1224. [Google Scholar] [CrossRef] [Scilit]
- Ren, Y.; Zhang, L.; Ling, H.; Wang, Y.; Pan, D.; Ren, Q.; Wang, X. A Reaction Model for Prediction of Inclusion Evolution During Reoxidation of Ca-Treated Al-Killed Steels in Tundish. Metall. Mater. Trans. B 2017, 48, 1433–1438. [Google Scholar] [CrossRef] [Scilit]
- Van Ende, M.A.; Jung, I.H. A Kinetic Ladle Furnace Process Simulation Model: Effective Equilibrium Reaction Zone Model Using FactSage Macro Processing. Metall. Mater. Trans. B 2017, 48, 28–36. [Google Scholar] [CrossRef] [Scilit]
- Zhang, L.; Oeters, F. Mathematical Modelling of Alloy Melting in Steel Melts. Steel Res. 1999, 70, 128–134. [Google Scholar] [CrossRef] [Scilit]
- Pandelaers, L.; Barrier, D.; Gardin, P.; Wollants, P.; Blanpain, B. Experimental Evaluation of the Dissolution Rates of Ti and FeTi70 in Liquid Fe. Metall. Mater. Trans. B 2013, 44, 561–570. [Google Scholar] [CrossRef] [Scilit]
- Zhang, L. Modelling on Melting of Sponge Iron Particles in Iron-bath. Steel Res. 1996, 67, 466–474. [Google Scholar] [CrossRef] [Scilit]
- Sandaka, G.; Specht, E. Thermogravimetric Determination of Thermal Conductivity of Lumpy Limestones. In Proceedings of the 13th International Conference on Heat Transfer, Fluid Mechanics and Thermodynamics, Portorož, Slovenia, 17–19 July 2017; Available online: https://repository.up.ac.za/server/api/core/bitstreams/a9e64dd5-5e9c-4dd3-beea-b36f7c2d0f54/content (accessed on 11 March 2026).
- He, W.; Lv, X.; Yan, Z.; Fan, G. Ferrosilicon Alloy Granules Prepared through Centrifugal Granulation Process. J. Iron Steel Res. Int. 2020, 27, 1247–1258. [Google Scholar] [CrossRef] [Scilit]
- Chevalier, P.-Y.; Fischer, E.; Rivet, A. A Thermodynamic Evaluation of the Mn-Si System. Calphad 1995, 19, 57–68. [Google Scholar] [CrossRef] [Scilit]
- Berg, H.; Laux, H.; Johansen, S.T.; Klevan, S.O. Flow Pattern and Alloy Dissolution during Tapping of Steel Furnaces. Ironmak. Steelmak. 1999, 26, 127–139. [Google Scholar] [CrossRef] [Scilit]
- Kavić, D.; Bernhard, M.; Rössler, R.; Schalk, L.; Bernhard, C. Enhanced Temperature Prediction in Ladle Furnace Steel Refining: Hybrid Process Modeling Based on Computational Thermodynamics and Statistical Learning Methods. Metall. Mater. Trans. B 2025, 56, 5682–5699. [Google Scholar] [CrossRef] [Scilit]
- Kavić, D.; Bernhard, M.; Rössler, R.; Bernhard, C. Simulation of Secondary Metallurgical Processes Using Computational Thermodynamics and Comprehensive Statistical Learning Methods. In Proceedings of the AISTech 2024—The Iron & Steel Technology Conference and Exposition, Columbus, OH, USA, 9 May 2024; pp. 34–46. [Google Scholar]
- Zhang, Y.; Ren, Y.; Zhang, L. Kinetic Study on Compositional Variations of Inclusions, Steel and Slag during Refining Process. Metall. Res. Technol. 2018, 115, 415. [Google Scholar] [CrossRef] [Scilit]
- Pistorius, P.C. Slag Carry-over and the Production of Clean Steel. J. South. Afr. Inst. Min. Metall. 2019, 119, 557–561. [Google Scholar] [CrossRef] [Scilit]
- Chris Pistorius, P. Data Analysis to Assess Carry-Over Slag. In Proceedings of the Furnace Tapping 2022; Springer International Publishing: Cham, Switzerland, 2022; pp. 51–58. [Google Scholar]
- Kamaraj, A.; Murugaiyan, P.; Mandal, G.K.; Roy, G.G. The Role of Slag Carryover on the Non-Metallic Inclusion Evolution and Magnetic Behavior in Electrical Steel. Metall. Mater. Trans. B 2022, 53, 1989–2003. [Google Scholar] [CrossRef] [Scilit]
- Song, S.; Li, J.; Yan, W. Reaction between Molten Steel and CaO–SiO2–MgO–Al2O3-FetO Slag under Varying Amounts of Converter Carryover Slag. J. Mater. Res. Technol. 2022, 17, 1964–1975. [Google Scholar] [CrossRef] [Scilit]
- Guzela, D.D.N.; De Oliveira, J.G.; Staudinger, G.; Müller, J. The Ultimate LD Steelmaking Converter. Steel Times Int. 2003, 27, 20. [Google Scholar]
- Fuhr, F.; Torga, G.; Medina, F.; Cicutti, C. Application of Slag Tracers to Investigate Source of Non-Metallic Inclusions. Ironmak. Steelmak. 2007, 34, 463–470. [Google Scholar] [CrossRef] [Scilit]
- Zhang, L.; Thomas, B.G. State of the Art in Evaluation and Control of Steel Cleanliness. ISIJ Int. 2003, 43, 271–291. [Google Scholar] [CrossRef] [Scilit]
- Chen, G.; Guo, Y.; He, S. Effect of FeO Content in Slag on Formation of MgOfflAl2O3 Inclusion for Al-Killed Steel. Metall. Res. Technol. 2016, 113, 204. [Google Scholar] [CrossRef] [Scilit]
- Lee, M.; Sun, S.; Wright, S.; Jahanshahi, S. Effects of Transition Metals on the Kinetics of Slag-Refractory Reactions. Metall. Mater. Trans. B 2001, 32, 25–29. [Google Scholar] [CrossRef] [Scilit]
- Lee, S.; Min, D.J. Viscous Behavior of FeO-Bearing Slag Melts Considering Structure of Slag. Steel Res. Int. 2018, 89, 1800055. [Google Scholar] [CrossRef] [Scilit]
- Jansson, S.; Brabie, V.; Jönsson, P. Corrosion Mechanism and Kinetic Behaviour of MgO–C Refractory Material in Contact with CaO–Al2O3–SiO2–MgO Slag. Scand. J. Metall. 2005, 34, 283–292. [Google Scholar] [CrossRef] [Scilit]

Disclaimer/Publisher’s Note: The statements, opinions and data contained in all publications are solely those of the individual author(s) and contributor(s) and not of MDPI and/or the editor(s). MDPI and/or the editor(s) disclaim responsibility for any injury to people or property resulting from any ideas, methods, instructions or products referred to in the content. |
© 2026 by the authors. Licensee MDPI, Basel, Switzerland. This article is an open access article distributed under the terms and conditions of the Creative Commons Attribution (CC BY) license.