


Abstract
In situ stope leaching is an economically and environmentally friendly metal recovery method suitable for low-grade copper ores, with the internal temperature of the deposit typically ranging from 30 to 45 °C. The fragmented ore with a specific particle size distribution formed after blasting constitutes a complex pore structure, which provides channels for acid solution infiltration and chemical reactions, directly affecting leaching efficiency. To reveal the spatiotemporal heterogeneity of pore structure evolution during leaching at the microscopic level and its fundamental impact on macroscopic permeability and leaching rate, leaching experiments were conducted using acid leaching methods based on ore particle models with different size distributions. Computed Tomography (CT) scanning technology and Avizo 2023 software were employed to scan and reconstruct three-dimensional physical models, enabling quantitative calculation and analysis of the evolutionary patterns of pore structure parameters. These results were then correlated with the measured leaching rate evolution. The findings indicate that both the connectivity and overall volumetric porosity of the stope models for Sample 1 (2–20 mm, uniformly graded) and Sample 2 (0–20 mm, high fine particle content) continuously decreased during leaching, with a more pronounced decline in the lower regions, particularly for Sample 2. The pore-throat sizes of both models increased with leaching time, and after 45 days of leaching, the average pore radius of the two granular ore samples increased by 16.75% and 9.21%, respectively. The leaching rate showed a high correlation with the effective reaction area (R2 = 0.93). During the 0–15-day period, a sharp decline in the effective reaction area led to a rapid decrease in leaching efficiency. Sample 1 exhibited a longer effective leaching duration, achieving a leaching rate of 61%, significantly higher than that of Sample 2.
1. Introduction
With the increasing depletion of high-grade, easily treatable mineral resources worldwide, the efficient development of low-grade and complex refractory ores has become a central issue in the field of mineral resource utilization [1,2,3]. As a green mining technology integrating “blasting fragmentation” and “in situ leaching,” stope leaching involves breaking ore bodies into fragmented granular materials with certain porosity through blasting. This provides pathways for the penetration, mass transfer, and mineral reactions of leaching agents, significantly reducing both the mining cost and environmental impact of low-grade ores. It has been widely applied in the extraction of polymetallic minerals such as copper, uranium, and gold [4,5,6,7,8,9]. The pore structure of the fragmented ore serves as the core medium for leaching agent penetration, target mineral dissolution, and reaction product migration. The dynamic evolution of its porosity, pore size distribution, connectivity, and spatial morphology directly determines the specific surface area of ore particles available for reaction, the utilization rate of leaching solutions, and mass transfer efficiency during leaching, making it a critical factor constraining leaching rates and resource recovery [10,11,12,13]. Therefore, systematically revealing the evolution mechanism of the pore structure of fragmented ore during stope leaching and establishing its quantitative relationship with leaching effectiveness constitute the core scientific challenge for optimizing leaching process parameters and enhancing the recovery efficiency of low-grade ores.
During stope leaching, the evolution of the pore structure in fragmented ore results from the coupled effects of seepage mechanics, fine particle migration, chemical reactions, and changes in mineral physical properties [14,15,16,17]. On the one hand, the seepage and scouring effects of leaching solutions can lead to the migration of fine ore particles, causing pore clogging or the restructuring of connected pathways. On the other hand, the chemical dissolution of target minerals (e.g., carbonate-type copper minerals, sulfide minerals) can create new pores, while the precipitation of reaction products may fill existing ones. These dual processes collectively drive dynamic changes in porosity, pore size distribution, and connectivity [18,19,20,21]. For stope leaching, although existing studies have preliminarily revealed the correlation between pore structure and leaching effectiveness, the following key research gaps still exist. First, most studies focus on the analysis of macroscopic effects, lacking an in-depth analysis of the microscopic pore evolution mechanism. Researchers such as Faraji [22], Prasetya [23], Yan [24], and Luo [25] have investigated the influence of leaching parameters (e.g., lixiviant concentration, temperature, particle size, agitation, and liquid-to-solid ratio) on the dissolution rate through laboratory experiments and simulations. However, their findings have not been correlated with actual stope leaching models. Moreover, these studies only analyze the individual effects of various leaching parameters on macroscopic leaching outcomes, without fundamentally considering the influence of the pore structure evolution of ore granular media on the leaching process. Similarly, Ilankoon [26], Prasomsri [27], Song [28], Liu [29], and Loizeau [30] conducted laboratory column leaching experiments to analyze the impact of pore structure differences—resulting from various particle size distributions, flow rates, and temperature conditions—on solution permeation behavior. However, their research was confined to permeability analysis, without further investigation into how pore evolution controls the final leaching rate. Second, current research is largely limited to static comparisons between the pre- and post-leaching states, lacking continuous monitoring of the dynamic evolution during the leaching process. Non-destructive testing techniques have been employed by researchers like Ghadiri [31], Fagan-Endres [32], and He [33] to characterize changes in pore distribution before and after leaching, confirming the transformative effect of leaching on pore structure. However, while this “before-and-after” comparative approach confirms the occurrence of changes, it falls short of revealing the underlying processes and mechanisms. Current research has failed to pinpoint the critical moments of dramatic pore structure reorganization, nor has it distinguished whether throat clogging is a gradual process or a sudden event. Additionally, whether ores with varying fine particle contents exhibit fundamentally different evolutionary pathways remains an unresolved scientific question, and these issues have yet to be adequately addressed.
To address these research gaps, this paper proposes the following core scientific hypothesis: Ore granular materials with different initial particle size distributions will follow distinct pore evolution paths during the leaching process, and these differences in evolutionary pathways will ultimately lead to significant divergence in leaching outcomes. To validate this hypothesis, this study focuses on the stope leaching process, advancing the analysis from traditional static descriptions of pore parameters to a dynamic, multi-parameter coupled investigation of pore structure evolution. By integrating indoor dynamic acid leaching tests, high-resolution CT scanning, and 3D reconstruction techniques, this research systematically tracks the continuous evolution of porosity, pore size distribution, throat dimensions, and connectivity throughout the leaching process. It establishes a quantitative relationship between different initial particle size distributions and pore evolution patterns, revealing the controlling role of particle size distribution on the stability of the leaching process.
The main innovations of this paper are as follows: (1) It achieves continuous tracking of pore structure evolution during the leaching process. For the distinct pore structure evolution patterns caused by two typical particle size distributions, it quantitatively elucidates the fundamental differences in permeability decay and leaching rate variation between them. (2) It proposes using the effective reaction area (integrating porosity, connectivity, and throat size) as a coupled indicator for evaluating the leaching rate, revealing the intrinsic control mechanism of pore evolution on leaching effectiveness. The research findings provide theoretical support for the efficient and green development of low-grade, complex, and refractory ores, offering significant theoretical significance and engineering application value for improving the utilization rate of mineral resources.
2. Materials and Methods
2.1. Ore Materials
The ore samples used in the experiment were collected from a low-grade copper mine in Huangshi City, Hubei Province, China, with an average ore grade of 0.582%. The samples were crushed to the required particle size using a jaw crusher. Subsequently, the chemical composition was determined by X-ray fluorescence (XRF, PANalytical Axios, PANalytical B.V., Almelo, The Netherlands) spectrometry, and the mineral phases were identified by X-ray diffraction (XRD, X’Pert PRO MPD, Malvern Panalytical B.V., Almelo, The Netherlands) in conjunction with a Mineral Liberation Analyzer (MLA, QEMSCAF, FEI Company, Hillsboro, OR, USA). The results of chemical element analysis and mineral phase analysis are presented in Table 1 and Table 2, respectively.
Table 1.
Main chemical element composition of ore sample.
Table 2.
Chemical phase analysis of copper in ore sample.
Table 1 indicates that the gangue minerals are primarily composed of quartz (SiO2, 60.49%). Among the alkaline oxides (Al2O3 + CaO + MgO, 20.72%), Al2O3 (15.16%) contributes to increased acid consumption, while CaO (4.88%) is prone to forming precipitates. The main metallic elements are Cu and Fe (Fe/Cu = 11.29, where Fe can be recovered simultaneously), whereas trace elements such as Mn and Cl have negligible effects on the leaching process.
Table 2 shows that oxidized copper accounts for 75.26% of the copper compounds, representing the primary occurrence form of copper. In copper ores, copper can exist in two forms: (1) carbonate-type minerals such as malachite (Cu2(OH)2CO3), chrysocolla (CuSiO3·2H2O), and azurite (Cu3(CO3)2(OH)2), which can directly react with dilute sulfuric acid to form copper sulfate, and (2) acid-resistant minerals such as cuprite and copper sulfides. To achieve effective dissolution of refractory copper components and enhance the utilization efficiency of the leaching agent, hydrogen peroxide (mixed with sulfuric acid at a 1:4 ratio) was added as an oxidant during the leaching process. This not only promotes the conversion of refractory copper into soluble copper sulfate but also oxidizes sulfite back to sulfuric acid, thereby reducing acid consumption costs. In this experiment, a mixed solution of dilute sulfuric acid and hydrogen peroxide was used under constant temperature conditions at 40 °C. The copper in the ore was converted into copper ions and carried out with the leaching solution. The leaching efficiency was determined by measuring copper ion concentration using atomic absorption spectroscopy (AAS).
2.2. Experimental Scheme
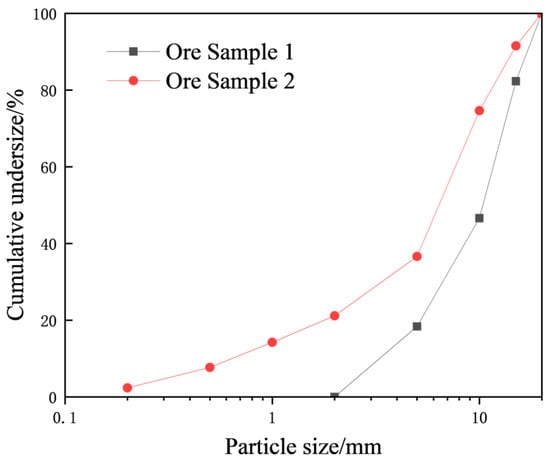
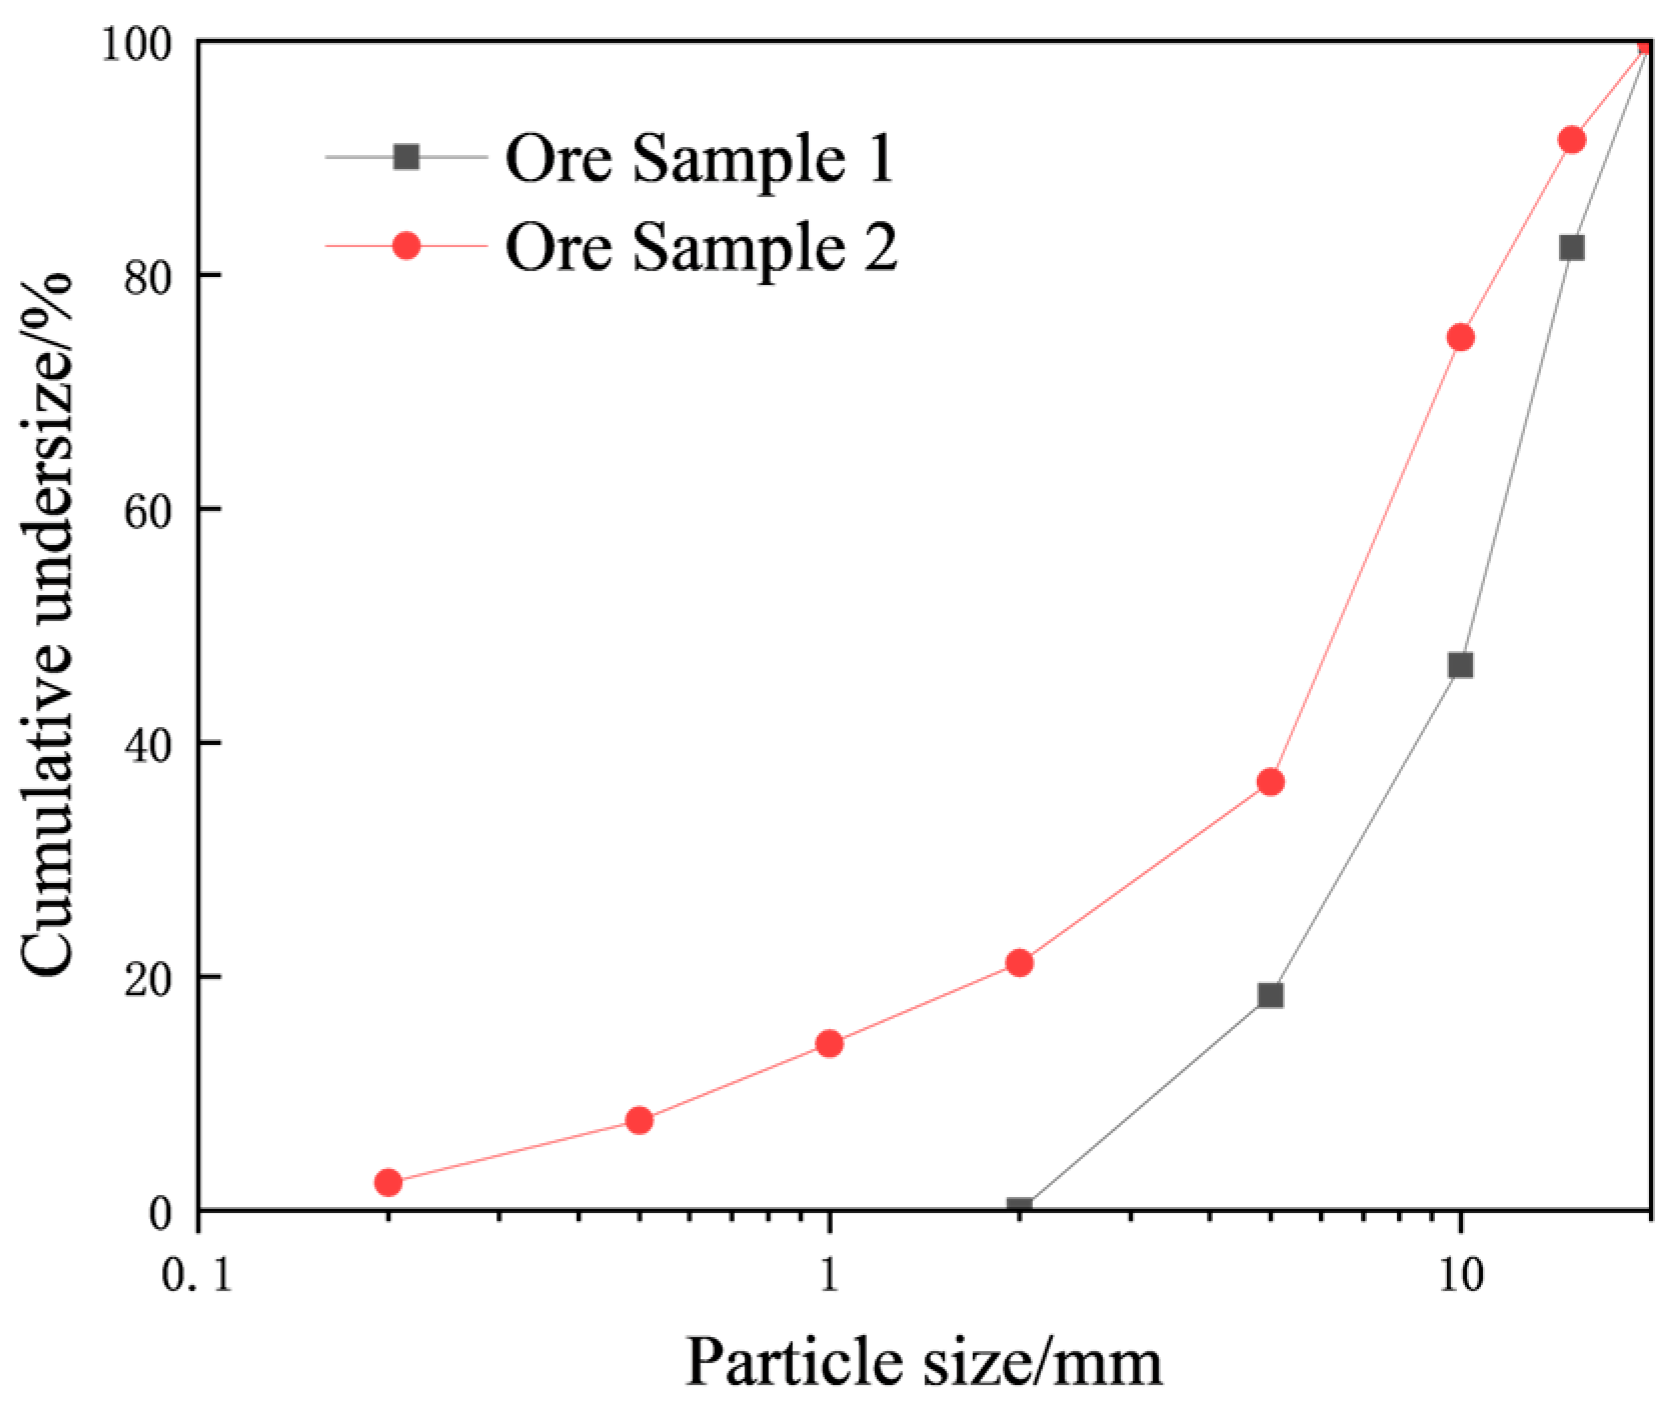
After crushing with a jaw crusher, the material was sieved using a screening machine and grouped by particle size into the following ranges: 0–0.5 mm, 0.5–1 mm, 1–2 mm, 2–5 mm, 5–10 mm, 10–15 mm, and 15–20 mm. Based on the particle size distribution characteristics observed after blasting and ore drawing, the samples were proportionally configured according to the grading ratios and placed into an acrylic model for leaching experiments. The particle size distributions of the experimental ore samples are shown in Figure 1. Sample 1 consisted of ore particles in the 2–20 mm range, exhibiting continuous grading with a well-graded composition. Sample 2 included ore particles in the 0–20 mm range, also continuously graded but with a higher content of fine particles (<2 mm). First, each ore sample was thoroughly mixed according to its grading ratio, and equal volumes of the samples were loaded into acrylic devices for the experiments. A layer of cotton gauze was placed at the bottom of each model, and small glass beads were arranged at the top to prevent localized ore particles from being subjected to high-impact leaching solution flow, thereby ensuring uniform liquid distribution. Inlet and outlet ports were reserved at the top and bottom of the acrylic models for solution inflow and outflow, respectively. The discharged liquid was collected in graduated cylinders for recycling.
Figure 1.
Particle size distribution curves of ore particles in the stope leaching model.
After the acrylic leaching columns were prepared, CT scanning was performed to obtain the initial pore structure. The models were then subjected to leaching experiments with a spray intensity of 1 mL/min. The sulfuric acid solution used in the experiments had a pH of 1. A pH meter was used daily to monitor and adjust the pH of the sulfuric acid solution to maintain it at a constant value. Copper ion concentration was measured every three days to calculate the leaching rate and monitor leaching progress. After 15 days, the leaching solution was completely drained, and a second CT scan was conducted. After scanning, acid leaching was resumed, repeating the previous procedures. Based on the copper ion concentration measurements, each sample model underwent a total of four CT scans at 0, 15, 30, and 45 days. To ensure reproducibility, the leaching columns were packed with ore particles (all sourced from the same ore block) using an identical particle size distribution and packing procedure. Replicate experiments were performed until consistent results were achieved.
2.3. Experimental Setup
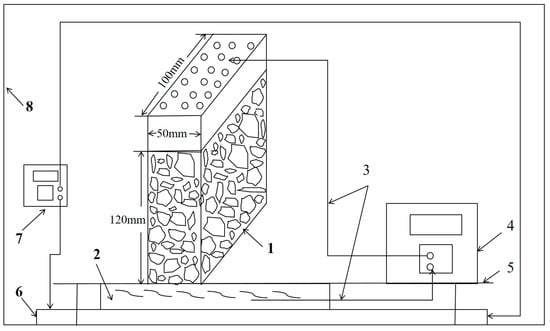
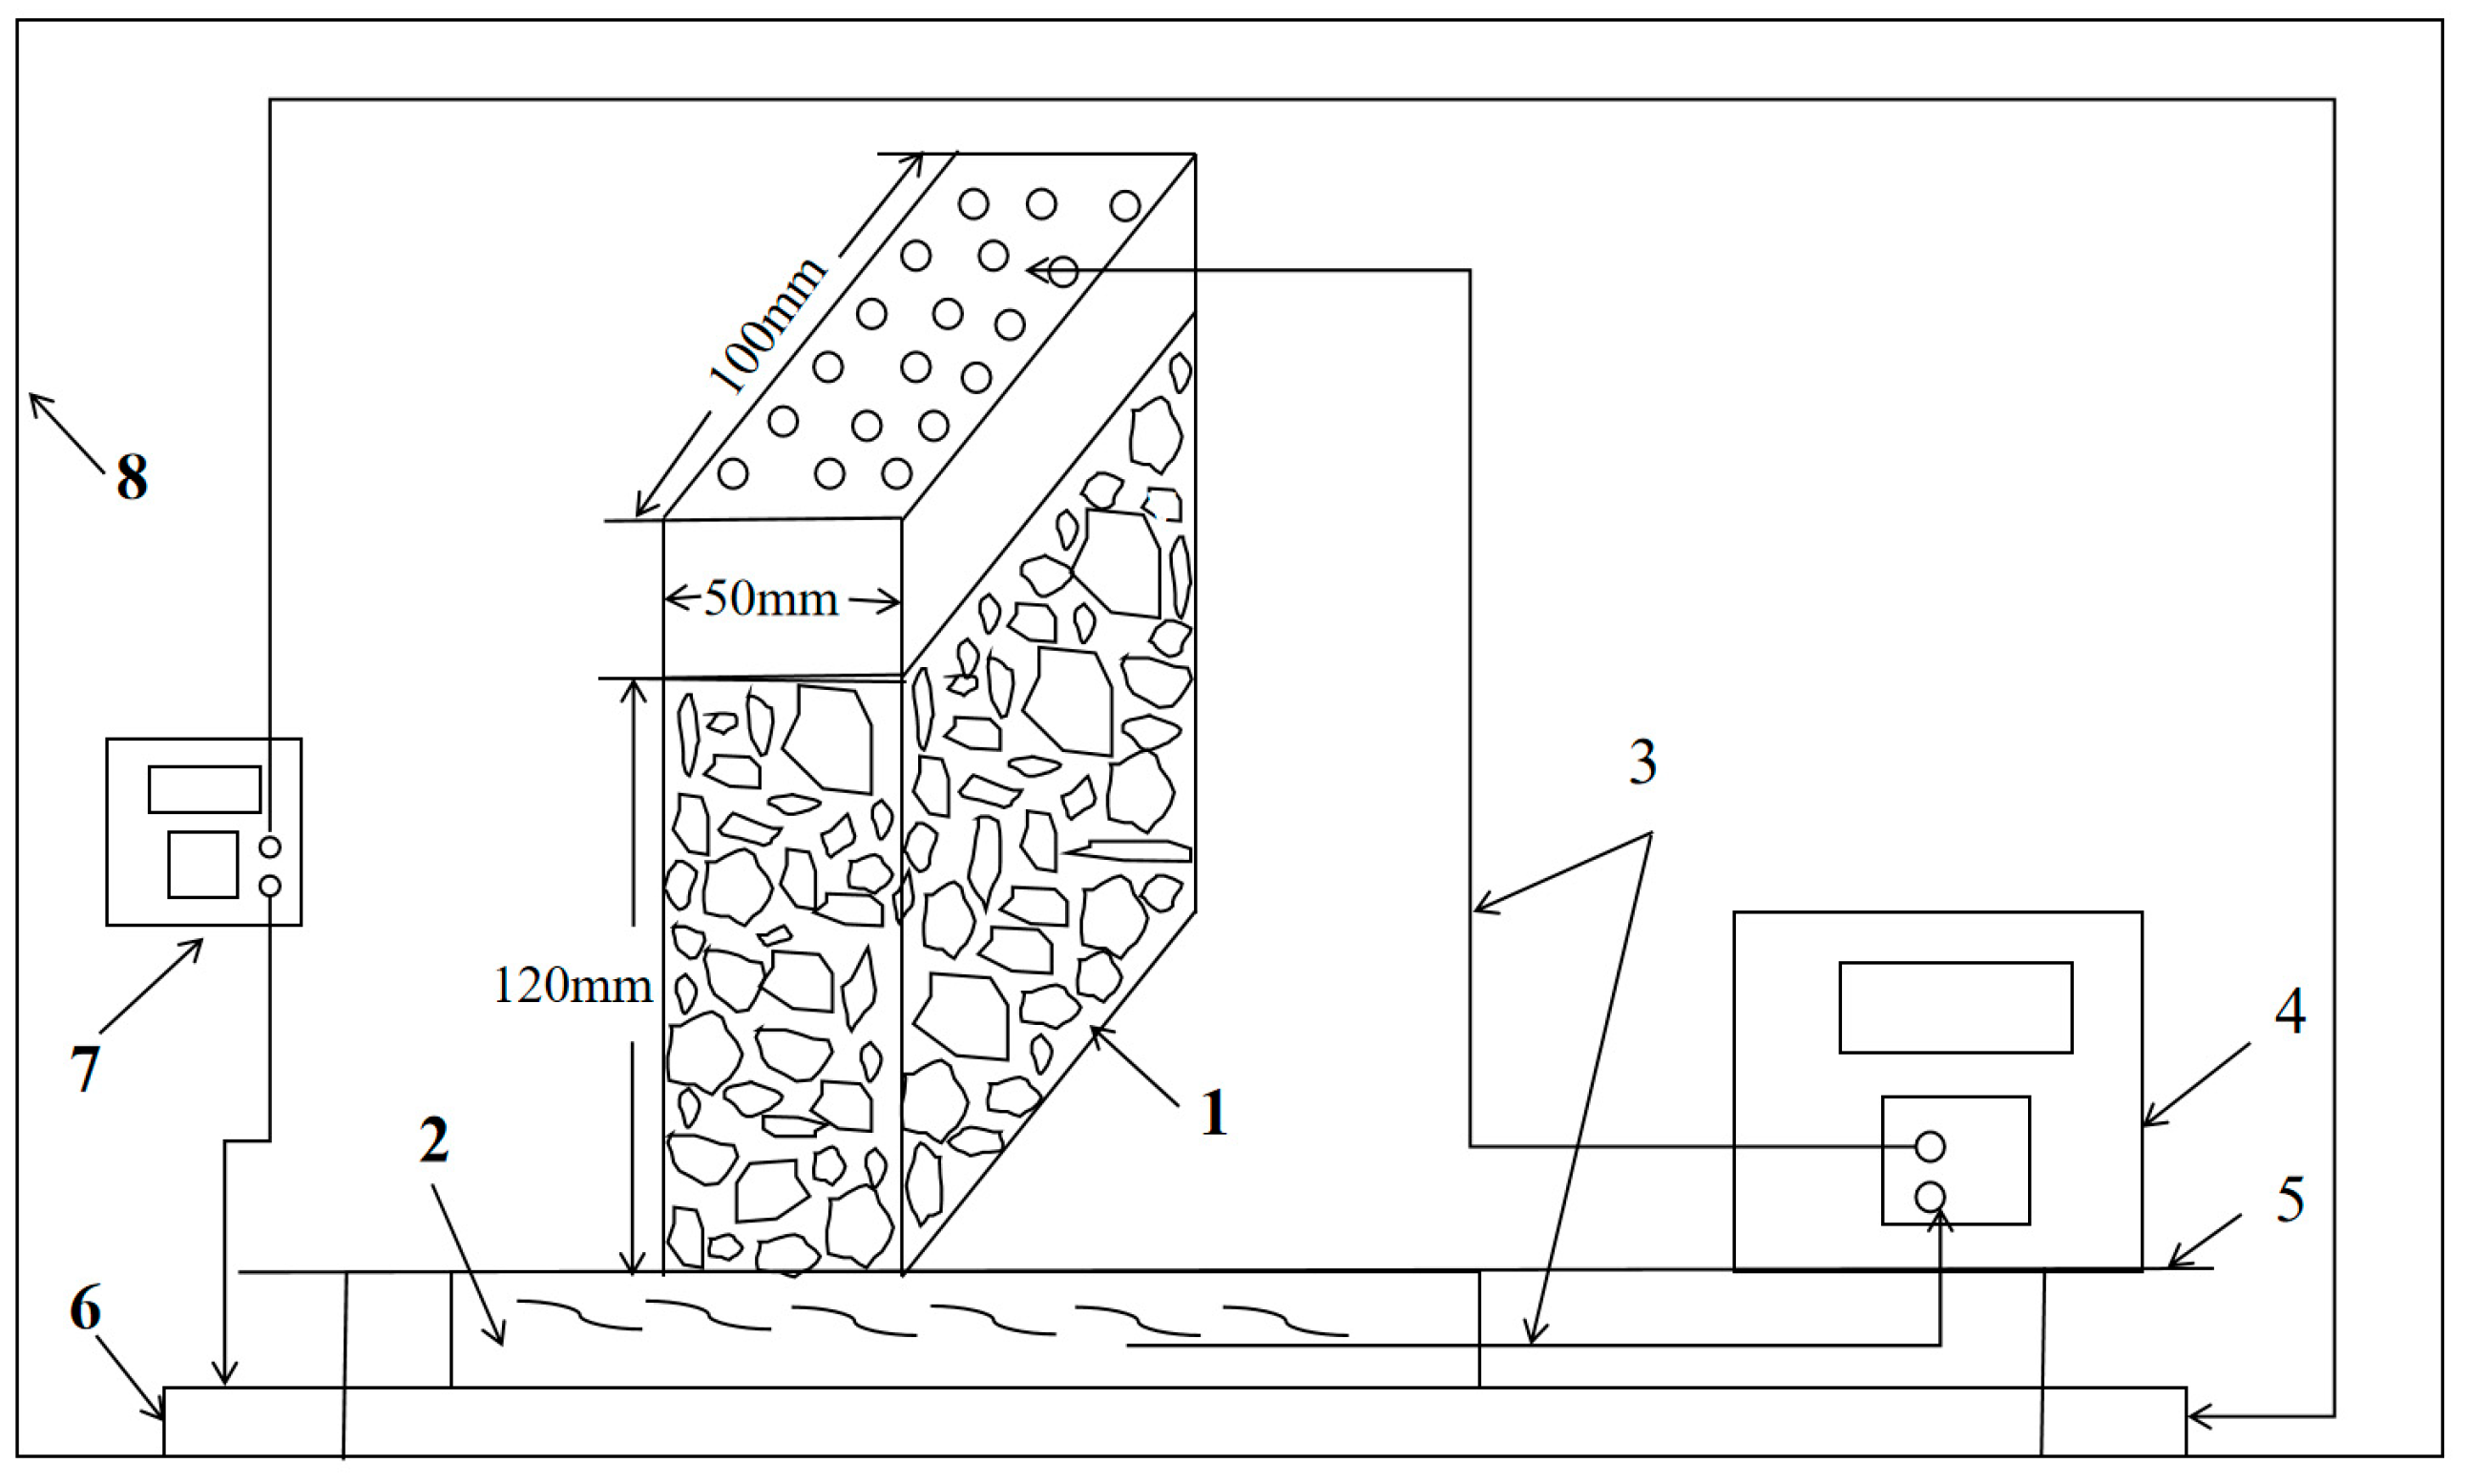
This experiment primarily utilized a high-precision CT scanner (Phoenix v|tome|x m, GE Sensing & Inspection Technologies GmbH, Wunstorf, Germany) to capture the internal pore structure of the granular ore experimental model during the leaching process. A self-constructed leaching system is illustrated in Figure 2, which includes an acrylic model, a TA5000 electronic balance, a peristaltic pump (Jieheng KY-300EA, Chongqing Jieheng Peristaltic Pumps Co., Ltd, Chongqing, China), graduated cylinders, a pH meter (Leici PHS-25, Shanghai INESA Scientific Instrument Co., Ltd, Shanghai, China), droppers, and other components. The physical model simulating the stope leaching environment was constructed from acrylic sheets, with its dimensions appropriately scaled to meet the chamber size and scanning resolution requirements of the CT equipment. The internal dimensions of the stope leaching model were set as follows: base length × base width × vertical height = 100 mm × 50 mm × 120 mm. During CT scanning, a layer of foam board was placed on top of the ore particles inside the model to compact them, thereby minimizing external disturbances caused by particle movement during the rotation of the model in the scanner.
Figure 2.
Schematic diagram of the custom-built leaching test system: 1—Stope model; 2—Liquid collection reservoir; 3—Closed-loop circulation pipeline; 4—Constant-flow peristaltic pump; 5—Operation platform; 6—Electric heating plate; 7—Digital temperature controller; 8—Thermally insulated enclosure.
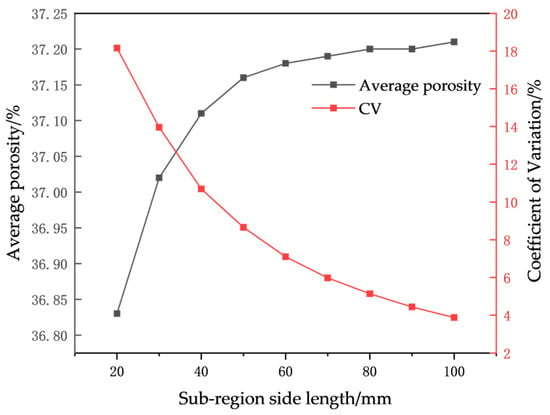
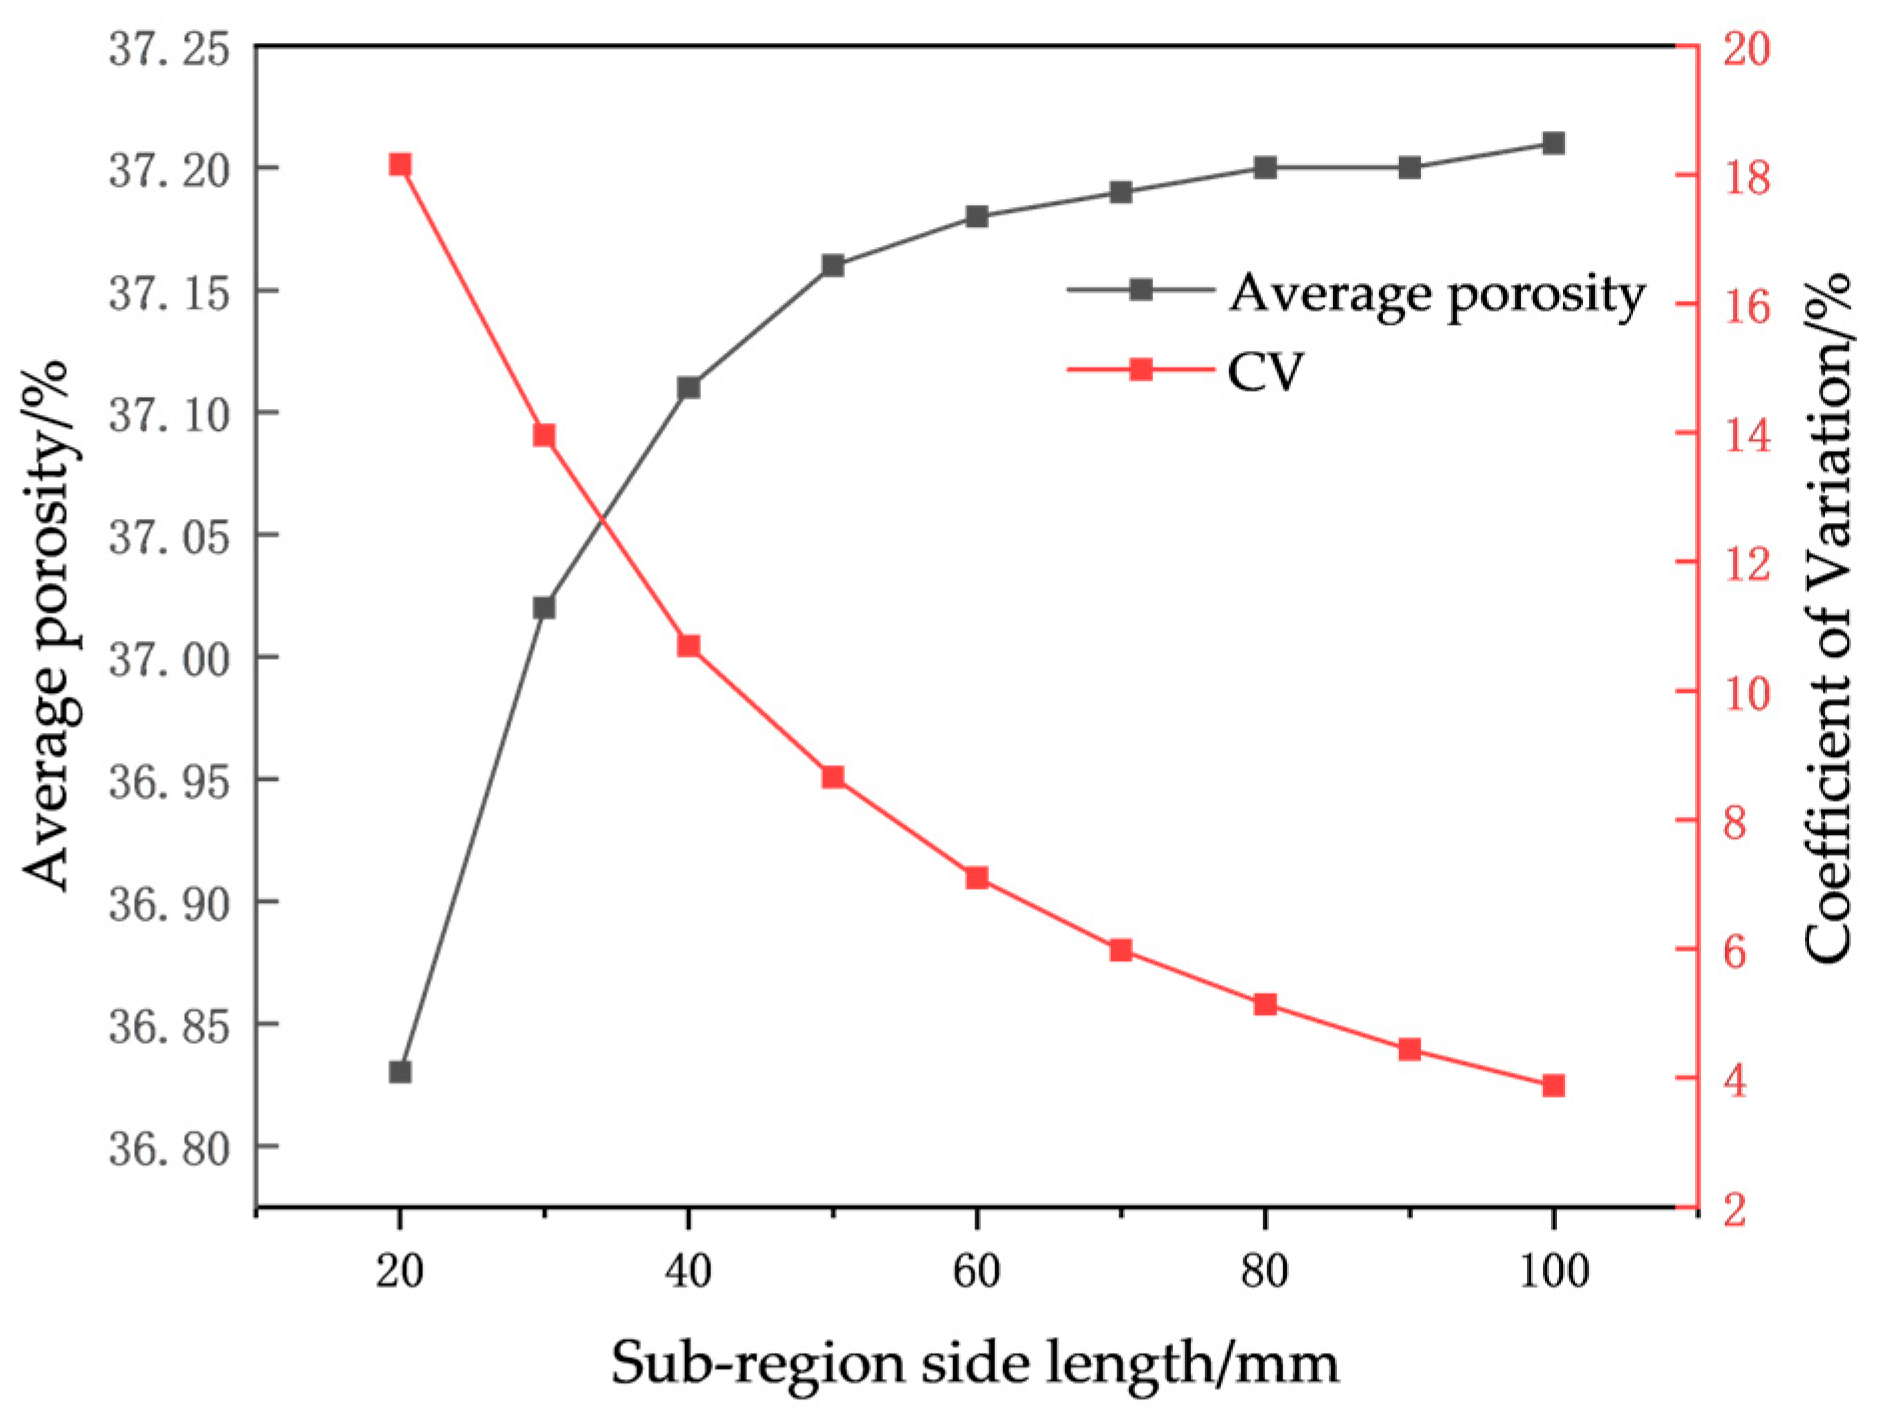
To verify that the selected model volume is statistically representative of the ore particles (maximum particle size: 20 mm), a Representative Elementary Volume (REV) analysis was performed, as illustrated in Figure 3. The results indicate that as the sub-region side length increased from 20 mm to 50 mm, the average porosity exhibited a notable increase from 36.83% to 37.16%. Beyond 50 mm, the porosity stabilized within a narrow range of 37.18% to 37.21%, with a variation of less than 0.05 percentage points. At a side length of 20 mm, the coefficient of variation (CV) was as high as 18.16%, highlighting the significant influence of heterogeneous local pore distribution at smaller scales. In contrast, at a side length of 50 mm, the CV decreased to 8.66%, falling below the commonly accepted threshold of 10% for the first time. Based on the criterion of CV < 10%, the porosity-based REV side length for the granular ore in this study is determined to be approximately 50 mm, which corresponds to 2.5 times the maximum particle diameter. Although this value is lower than the typical range of 5 to 11 times the particle diameter reported in some literature, it aligns well with the empirical criterion proposed by Xie [34], which suggests a REV size of “5 times the maximum pore diameter.” This is because, in this study, the pore diameter is considerably smaller than the particle diameter, making a 50 mm side length sufficient to encompass an adequate number of pores for statistical representativeness.
Figure 3.
Porosity and coefficient of variation as functions of sub-region side length.
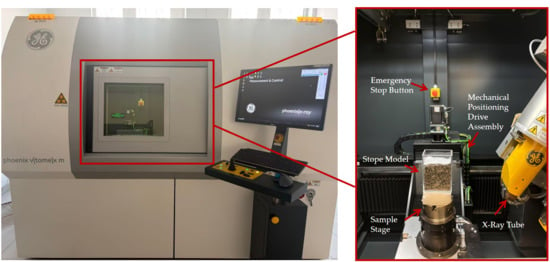
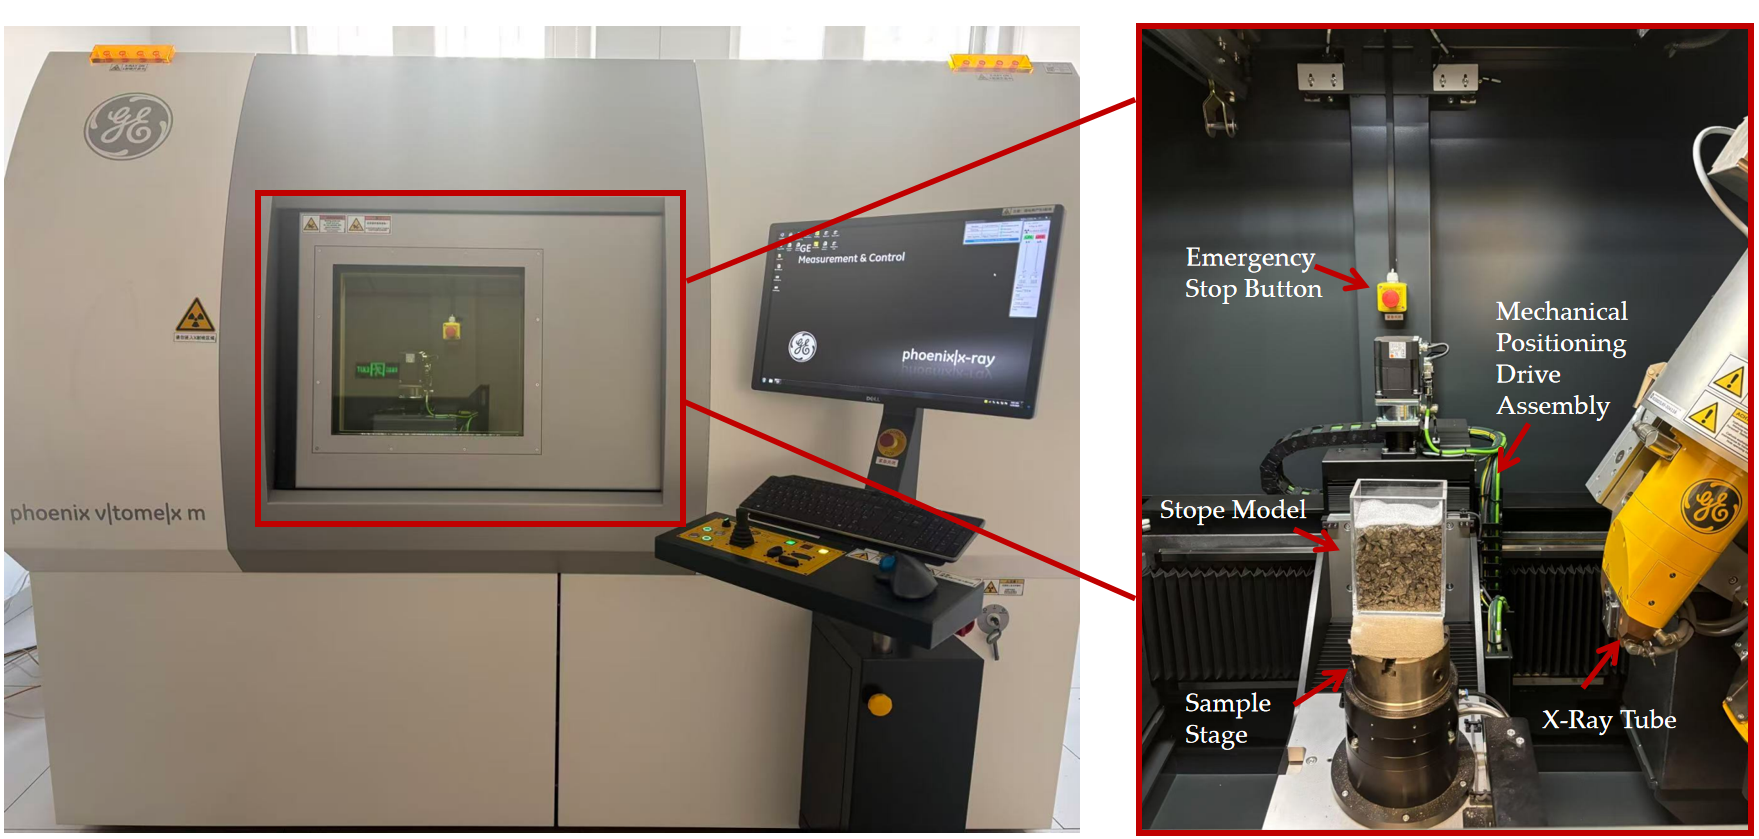
The CT scanner used for imaging is the high-precision industrial CT scanning system Phoenix v|tome|x m from GE Sensing & Inspection Technologies GmbH, Wunstorf, Germany, as shown in Figure 4. This CT system is equipped with a nanofocus X-ray tube with a focal spot size smaller than 1 micrometer, supported by powerful analysis software that provides a complete workflow from scan planning, data reconstruction, and visualization to comprehensive three-dimensional analysis. The maximum sample dimensions (height × diameter) allowed by the device are 400 mm × 290 mm, which meets the scanning requirements for the experimental model samples in this study. The CT scanner was preheated first, and after system stabilization, model scanning was conducted. In this experiment, the CT system acquired 2 image layers per second, with a voxel size of 76 μm and a slice thickness of 76 μm. The resolution was set to 1814 × 1469 pixels, with the scanning parameters configured at 80 kV voltage and 80 μA current. The model images were saved along the horizontal cross-sectional direction, resulting in 1600 grayscale images with a resolution of 1814 × 1469 pixels per sample. The scanning process was repeated until reproducible and valid results were obtained. Upon completion of scanning for one set of models, the procedure was repeated for the next set until valid results were achieved and the data were saved.
Figure 4.
Appearance and internal structure of the CT scanning experimental setup.
While the Pore Network Model (PNM) has been extensively used as a mainstream approach for investigating micro-scale seepage in porous media, particularly in simulating reservoir flow behaviors, it suffers from inherent limitations in characterizing the evolution of complex pore structures. To overcome these constraints, the present study integrates high-resolution CT scanning with 3D reconstruction and adopts a direct pore-space analysis method. This approach strikes a novel balance between tracking dynamic evolution, preserving geometric fidelity, and maintaining computational efficiency. A comparison of the differences and advantages between the proposed method and existing PNMs is presented in Table 3.
Table 3.
The differences and advantages of this method against existing pore network models.
3. Analysis of Pore Structure Evolution During Leaching Process
During the leaching process, chemical reactions occur between the copper ore and sulfuric acid, leading to changes in ore particle size and the formation of some chemical precipitates. Furthermore, due to the scouring effect of the leaching solution, fine particles may migrate (below 0.5 mm in this experiment), causing pore blockage or the formation of preferential flow paths. The CT scan cross-sectional images were processed using Avizo software for three-dimensional reconstruction, and parameters such as connectivity, porosity, pore-throat size distribution, and throat length were calculated to analyze the evolution characteristics of the pore structure during leaching.
First, the raw grayscale images acquired from CT scanning were imported into Avizo software for preprocessing, including filtering, to reduce noise. Phase segmentation—a critical step for converting grayscale images into binary images, distinguishing the pore phase from the mineral phase—was then performed using the Otsu thresholding method. To assess the sensitivity of the threshold selection, a series of comparative thresholds were established by applying offsets of ±5, ±10, ±15, and ±20 relative to the optimal threshold T* determined by the Otsu method. A monotonic slight increase in porosity was observed as the threshold value increased from T* − 20 to T* + 20. This monotonic increase can be attributed to the fact that lower thresholds tend to classify more low-gray value voxels as part of the mineral phase, resulting in a more conservative porosity estimation; conversely, higher thresholds classify more voxels as the pore phase, which may lead to the mis-segmentation of mineral boundaries as pores.
3.1. Pore Connectivity Index
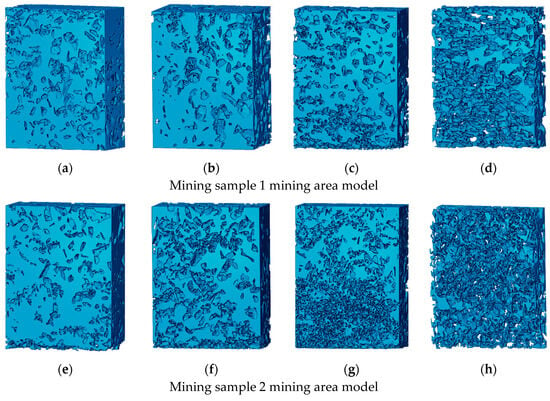
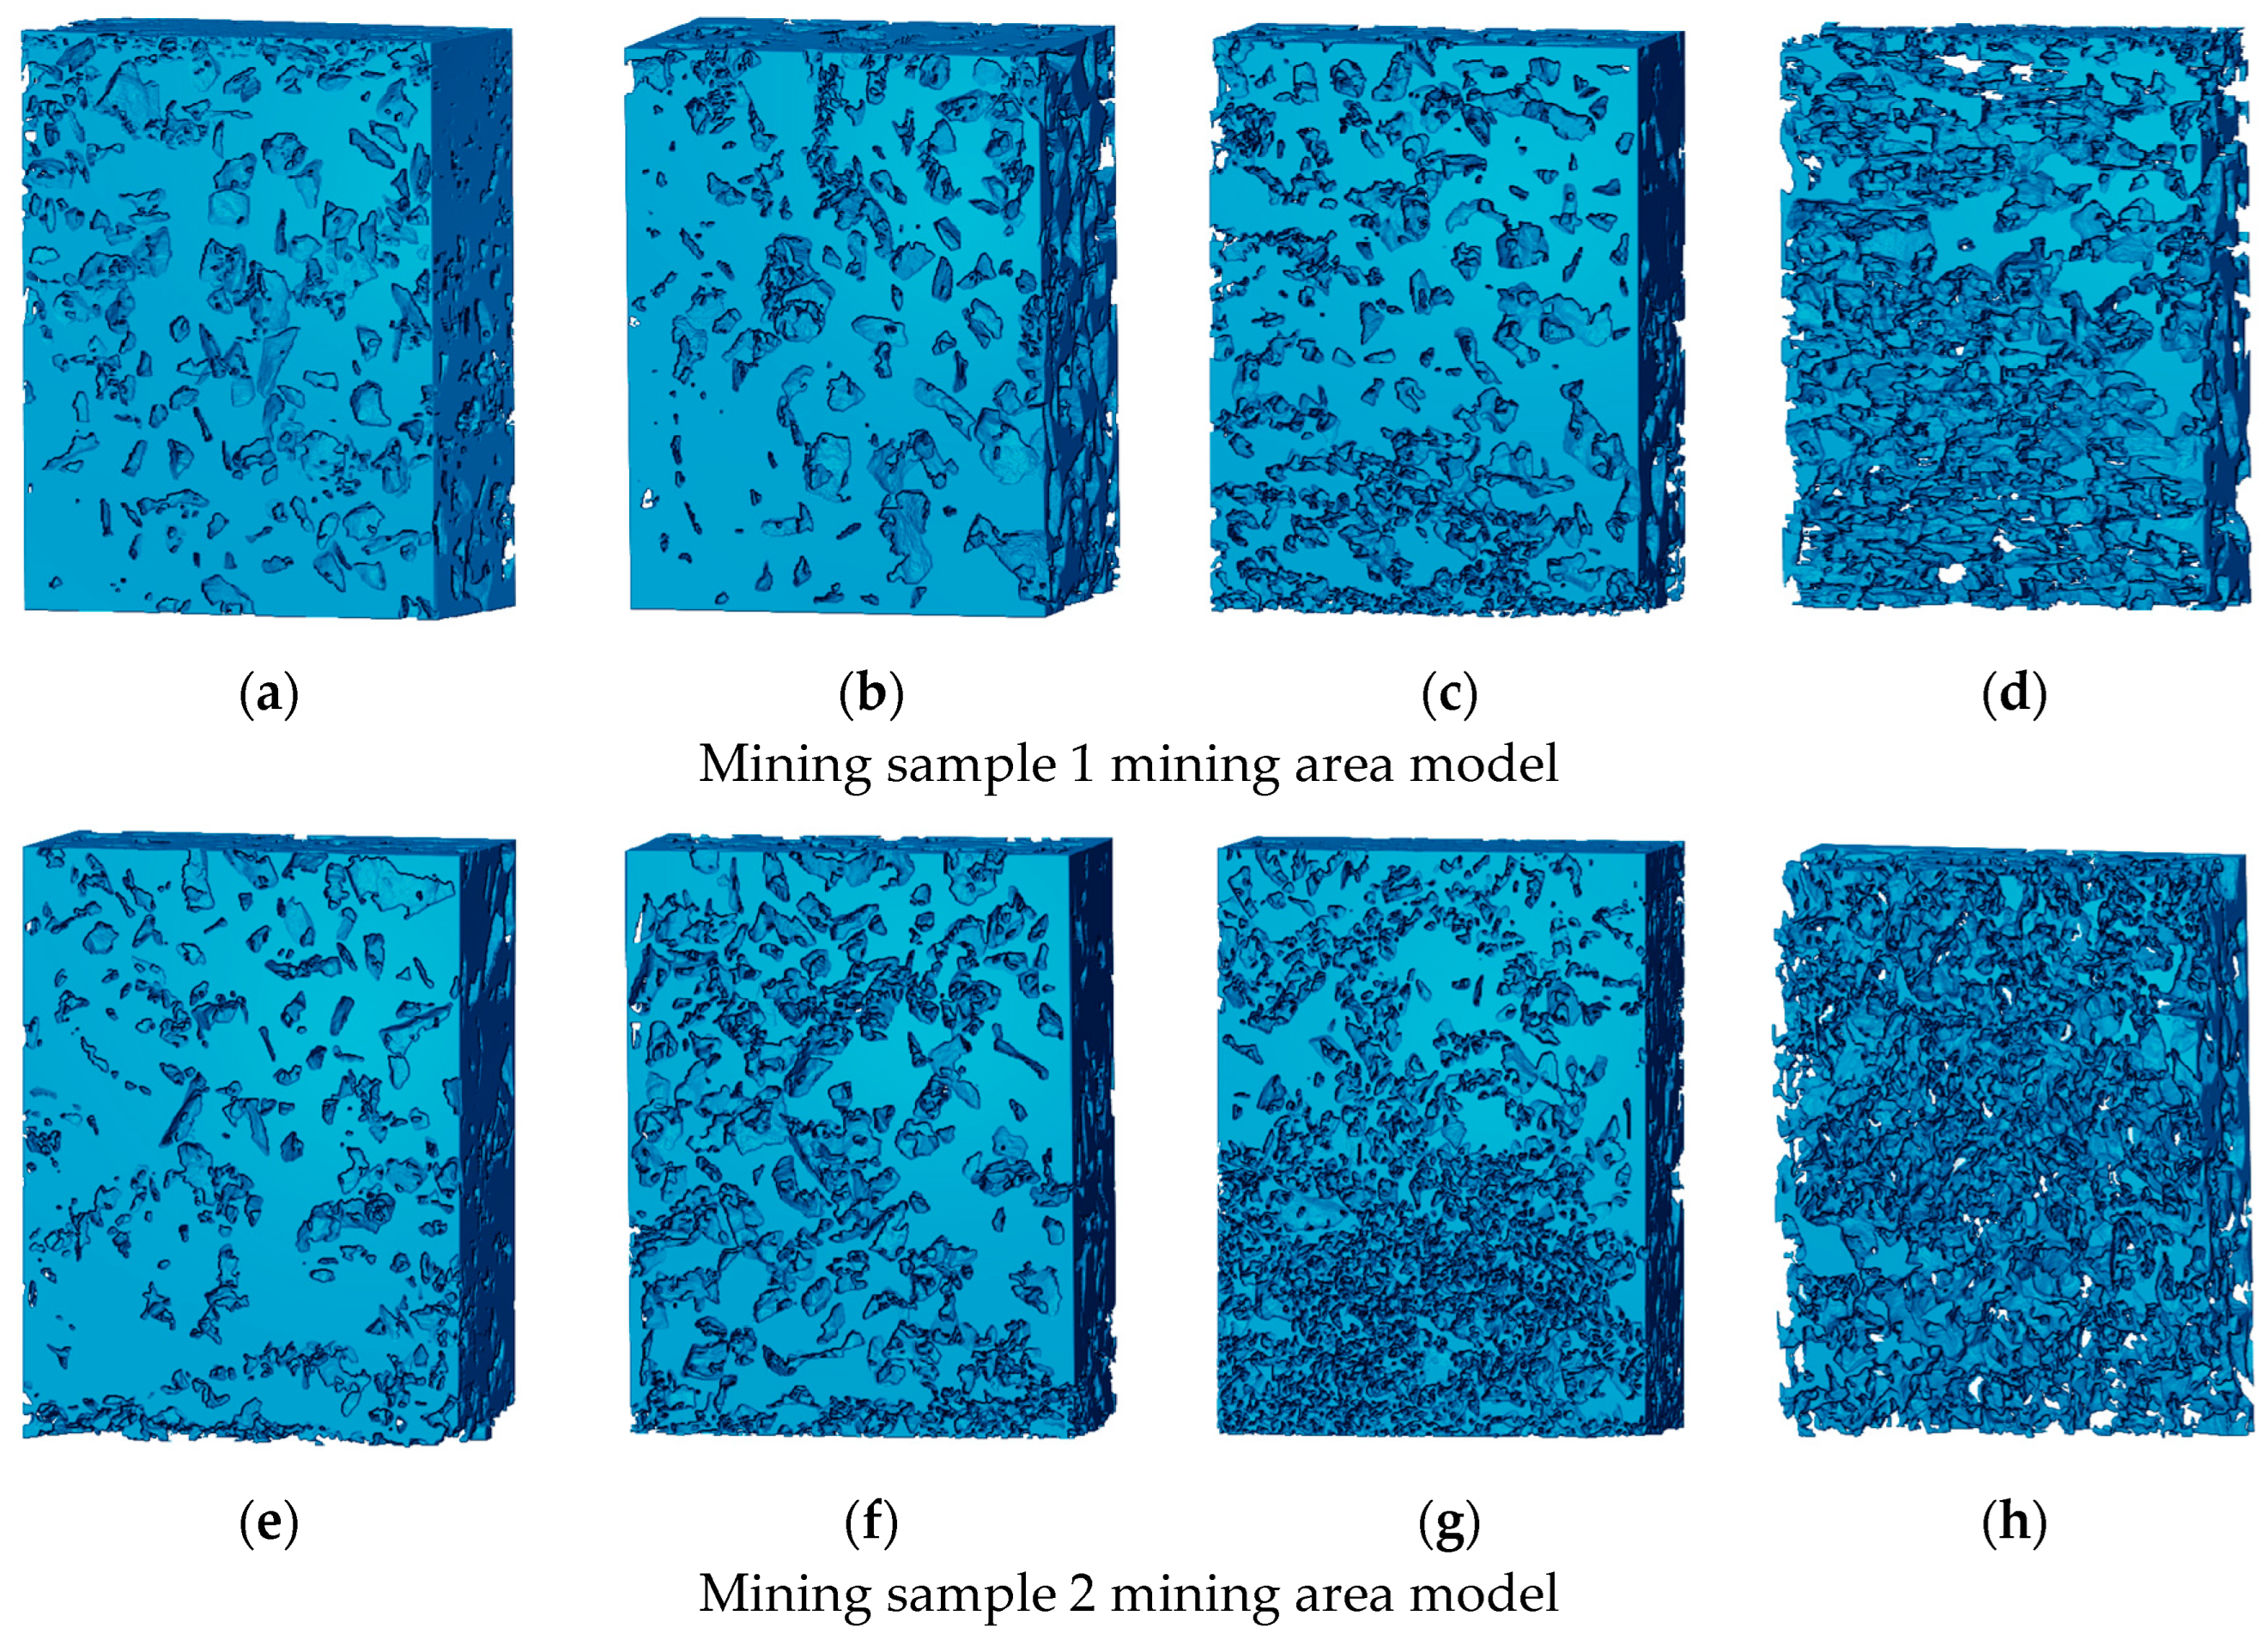
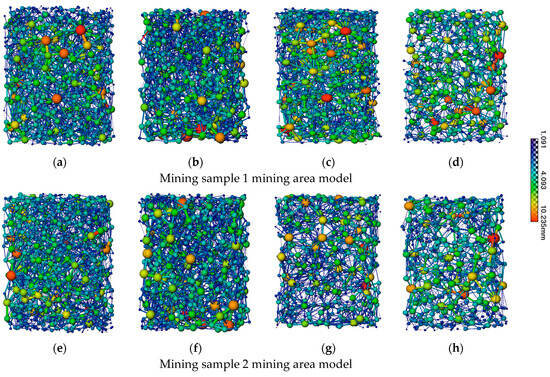
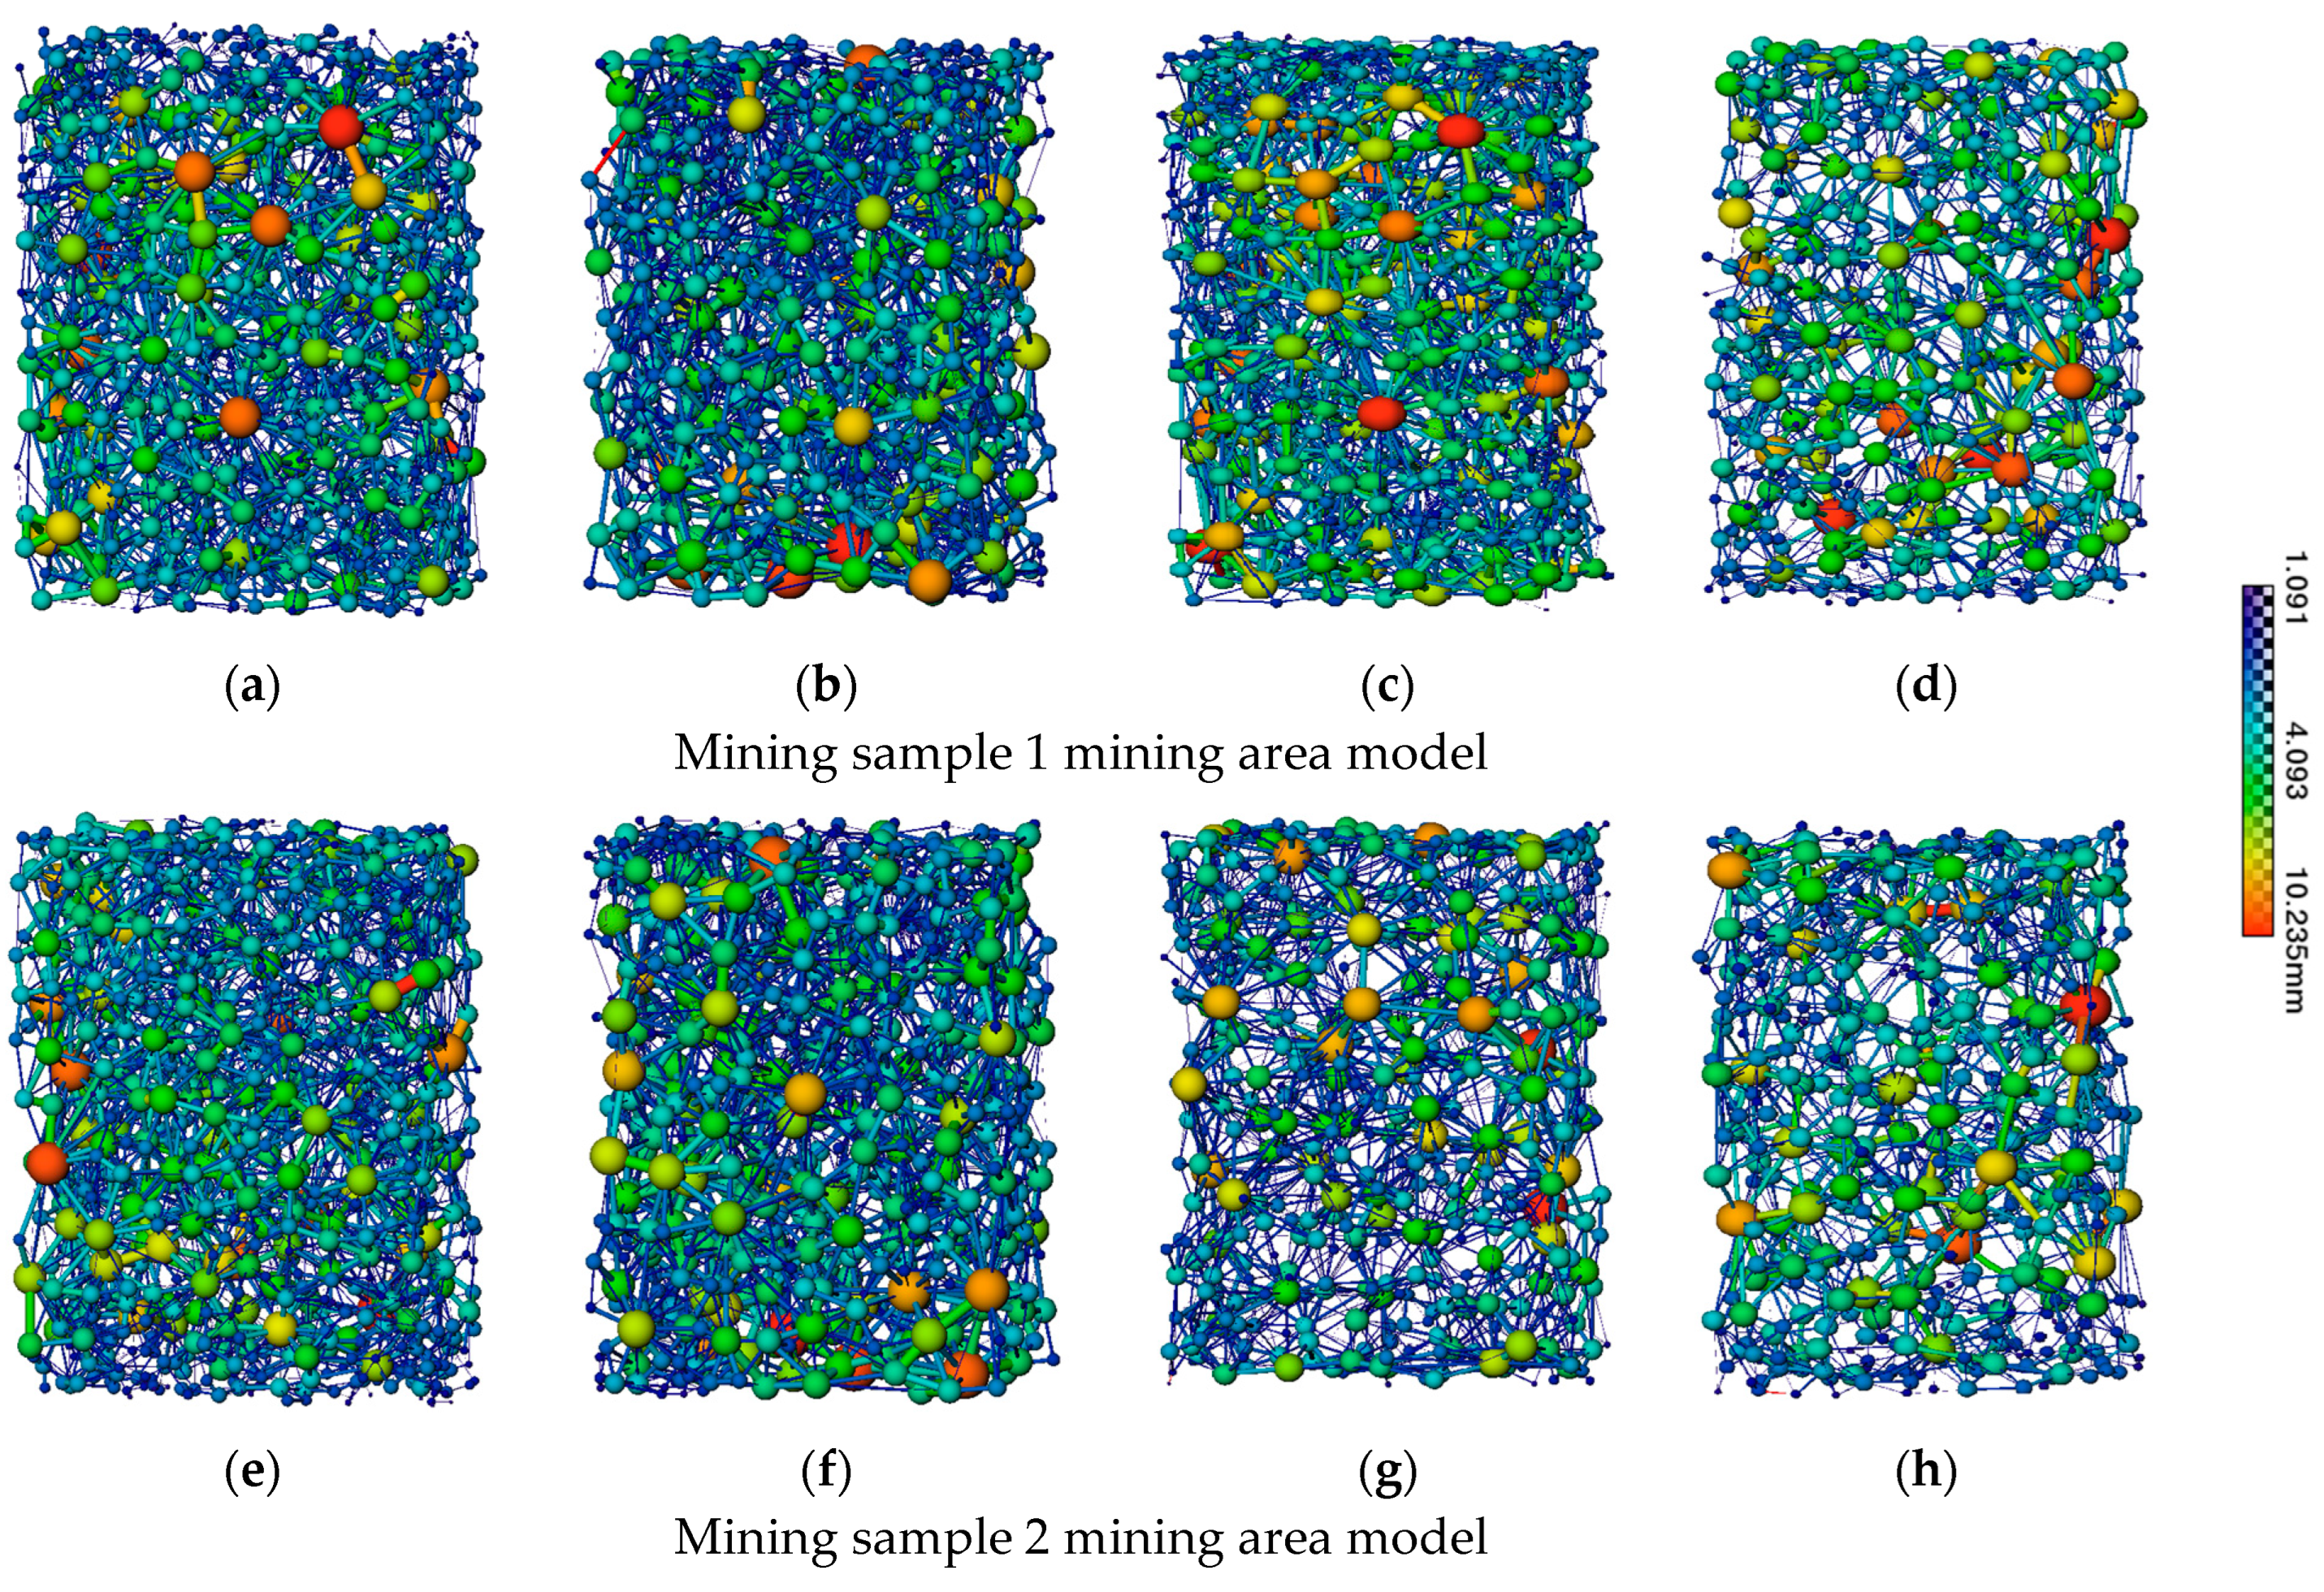
A total of 1500 CT scan images (excluding the large pores near the top boundary) were used for three-dimensional reconstruction of the sample. Figure 5 presents the three-dimensional reconstruction of the pore structure. Based on computational analysis, the changes in pore connectivity during the leaching process are shown in Table 4. Figure 6 illustrates the pore network model after removing isolated pores, where spheres represent pores (larger spheres indicate larger pores), and rods between spheres represent connecting channels between pores. Longer and thinner rods indicate longer and narrower channels between two pores.
Figure 5.
Three-dimensional reconstruction of pore structure in the stope model at different stages during leaching: (a) Sample 1, 0 d (b) Sample 1, 15 d; (c) Sample 1, 30 d; (d) Sample 1, 45 d; (e) Sample 2, 0 d; (f) Sample 2, 15 d; (g) Sample 2, 30 d; (h) Sample 2, 45 d.
Table 4.
Pore connectivity rates for models with different particle size distributions during the leaching process.
Figure 6.
Stick-and-ball representations of connected pores in the stope model at different stages during leaching, showing only percolating (connected) pores: (a) Sample 1, 0 d (b) Sample 1, 15 d; (c) Sample 1, 30 d; (d) Sample 1, 45 d; (e) Sample 2, 0 d; (f) Sample 2, 15 d; (g) Sample 2, 30 d; (h) Sample 2, 45 d.
Figure 5 and Table 4 collectively indicate that in the original samples of Model 1 and Model 2, most pores are interconnected, with connectivity rates of 94.93% and 90.32%, respectively. This suggests that the majority of pores are linked through throat structures, forming continuous pathways for fluid transport. As the leaching reaction progresses, the pore connectivity rates in both the Sample 1 and Sample 2 stope models show a continuous declining trend, though the extent of decline varies significantly across different stages. At 15 days of leaching, the decrease in pore connectivity is relatively small, accounting for 19.07% and 28.15% of the total reduction in Sample 1 and Sample 2, respectively, with a more pronounced decline observed in the Sample 2 model. By 30 days of leaching, the pore connectivity drops rapidly, accounting for 43.70% and 50.74% of the total reduction in Sample 1 and Sample 2, respectively. This sharp decline is primarily attributed to the formation of insoluble precipitates during the acid leaching reaction and the migration and accumulation of fine particles generated by the reaction, both of which contribute to pore filling and the disruption of connected pathways, leading to a significant reduction in connectivity. At 45 days of leaching, the rate of connectivity decline slows, accounting for 37.22% and 21.10% of the total reduction in Sample 1 and Sample 2, respectively. This slowdown is due to reduced solution transport efficiency and slower acid leaching reactions at this stage. Overall, at the end of leaching, the Sample 2 model exhibits a greater reduction in connectivity compared to Sample 1, indicating that a higher fine particle content increases the risk of pore blockage.
Figure 6 shows that at 15 days of leaching, despite the decrease in connectivity, the number of pores and throats increases in both models, with a slight rise in the number of large pores. This is attributed to the rapid dissolution of fine mineral particles, leading to their continuous shrinkage or complete disintegration, which releases the interstitial spaces previously occupied by these fine particles. Additionally, localized dissolution on the surfaces of coarse particles causes some small pores to expand and merge, ultimately resulting in an increase in the number of large pores (represented by larger spheres). Subsequently, the trend in pore structure evolution reverses, with a significant decrease in the number of pores and throats, corresponding precisely to the notable decline in connectivity observed during this period.
3.2. Evolution of Porosity
To quantitatively characterize the evolution of pore-structure properties in the stope-scale leaching model—and thereby elucidate the spatial heterogeneity and temporal dynamics of porosity in low-grade oxidized copper ore during acid leaching—the surface porosity (Φ) was computed for each 2D X-ray CT scan slice. Surface porosity is defined as the ratio of the total pore area to the total cross-sectional area within a given slice:
In Equation (1), Φ denotes the surface porosity, Sₛ represents the total cross-sectional area (i.e., the area of the scanned field of view), and Sz denotes the total projected area of the solid phase—including ore minerals, gangue, and secondary precipitates.
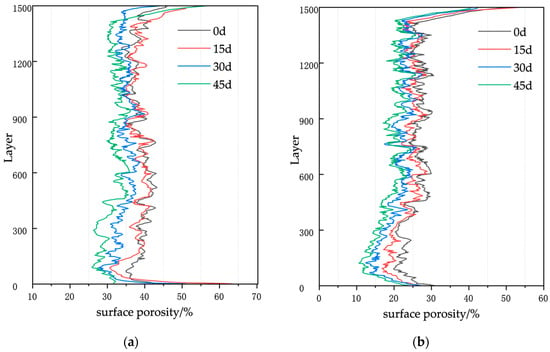
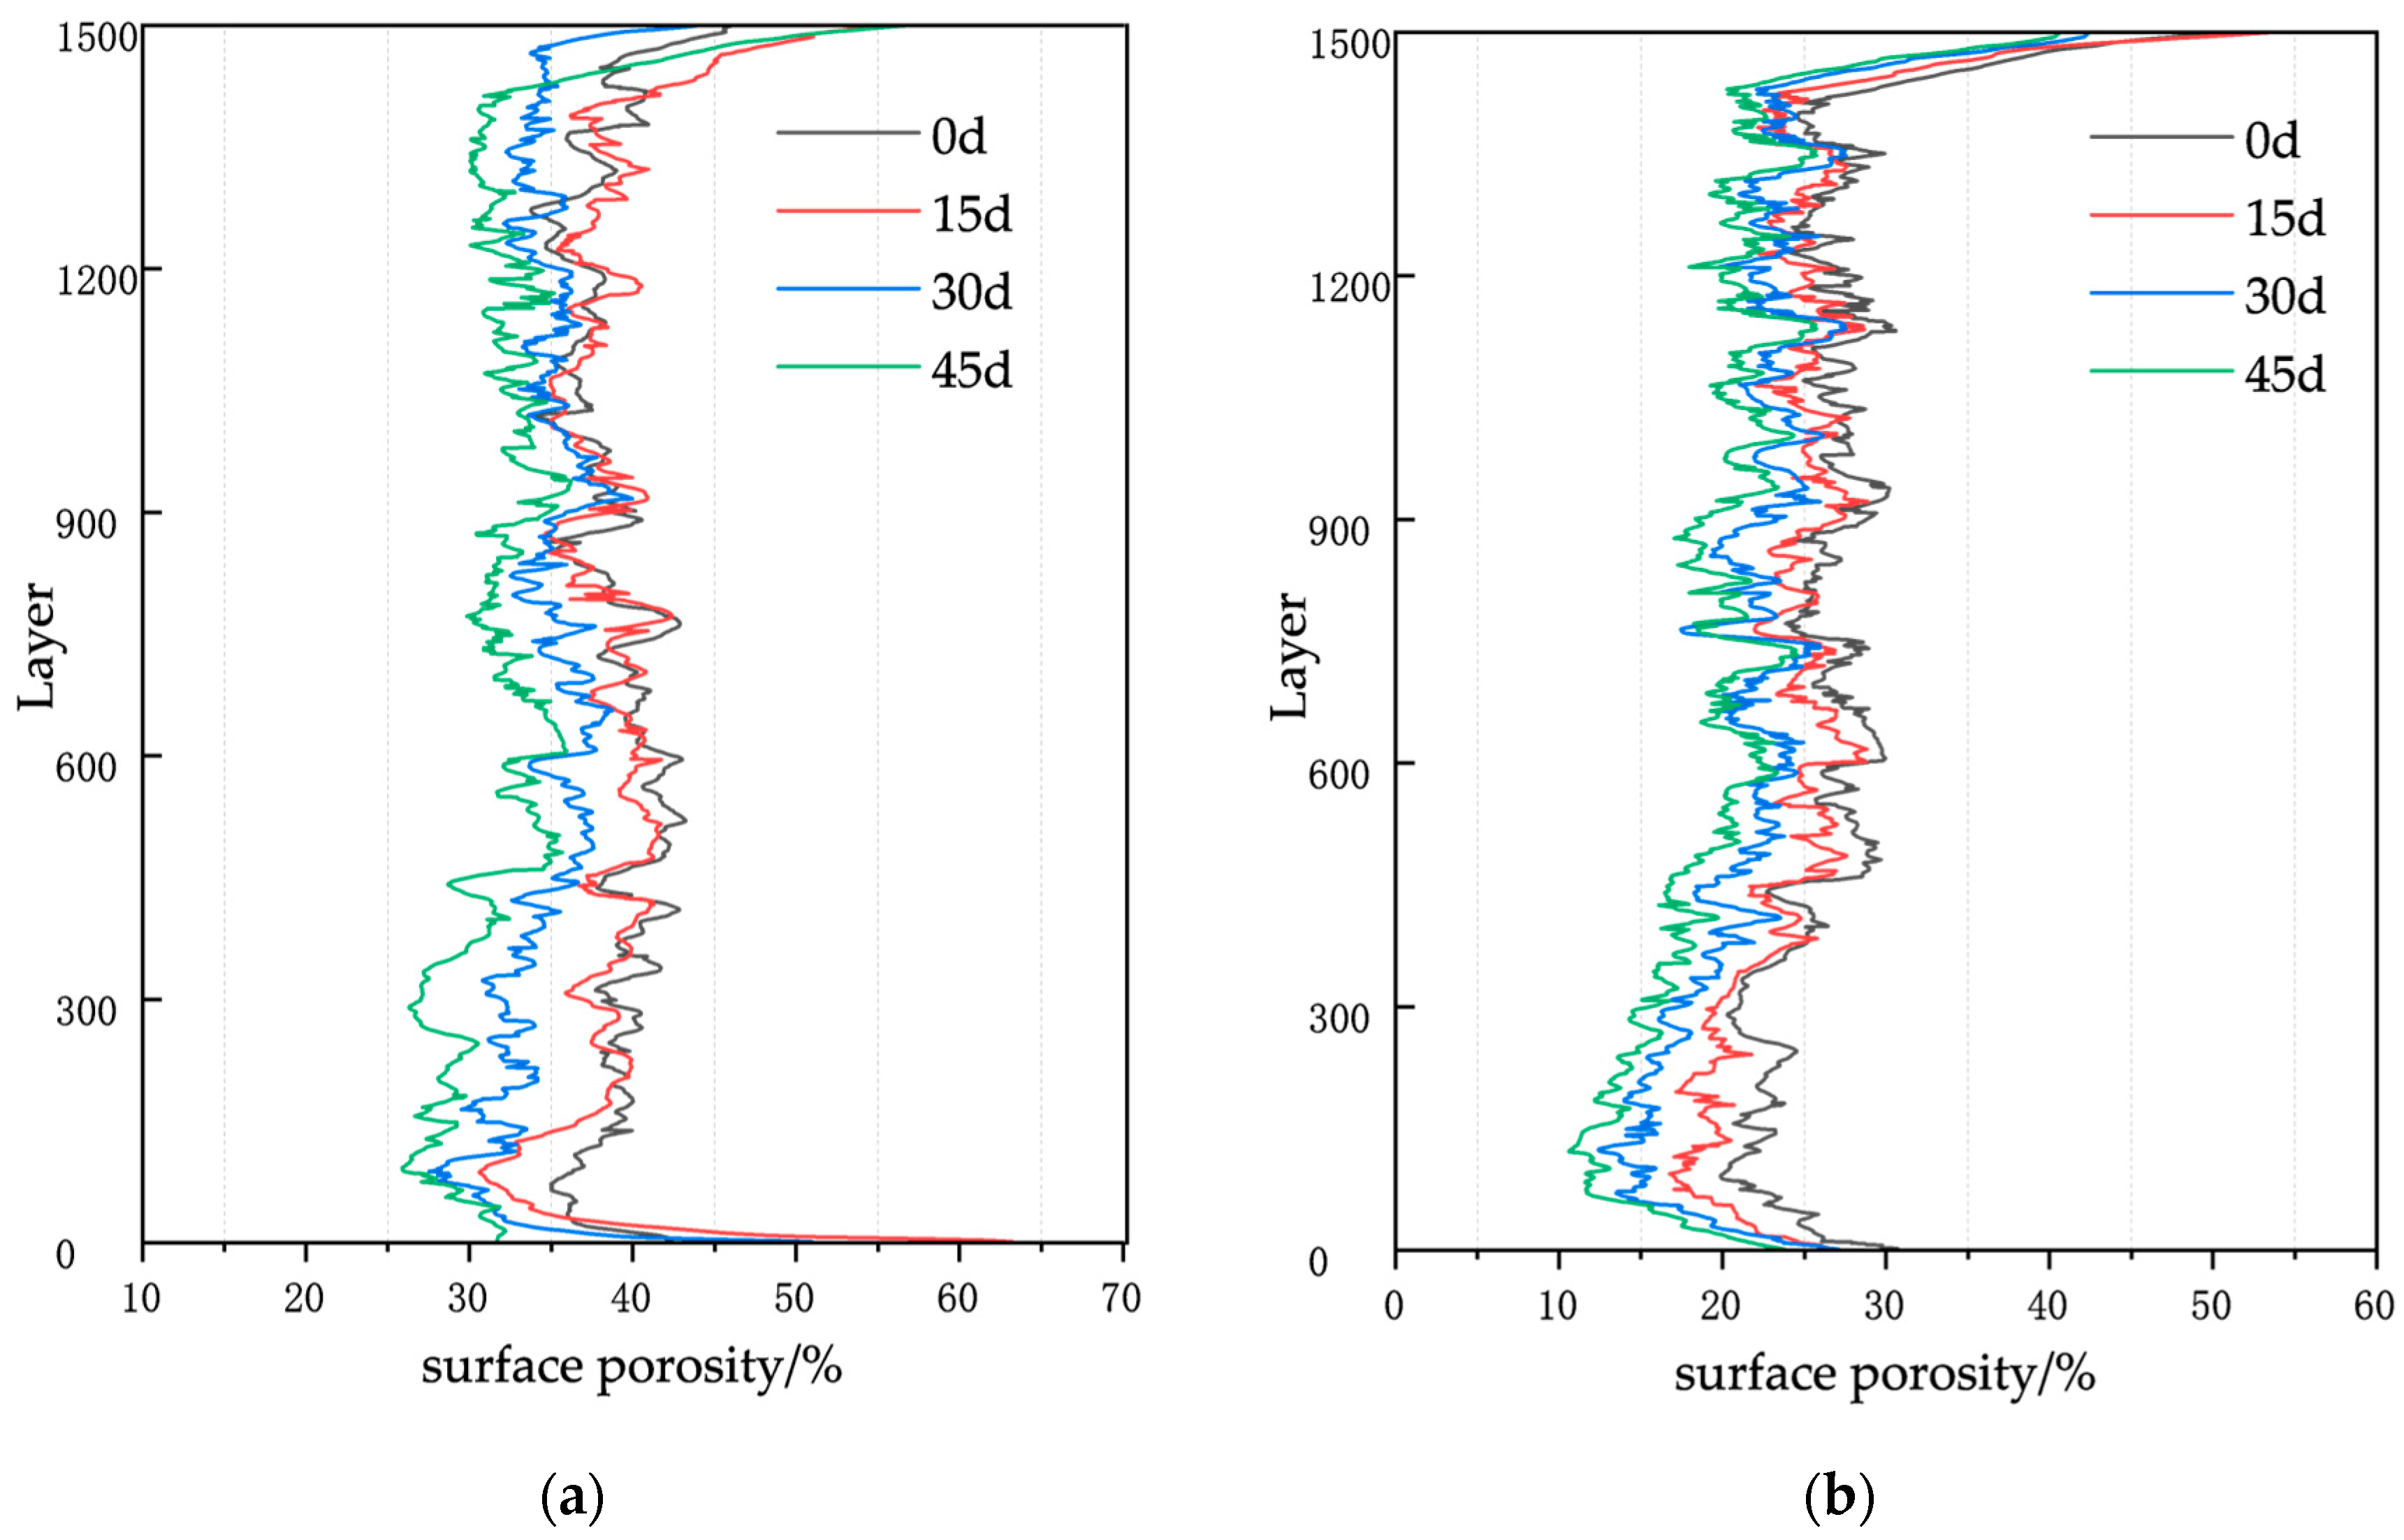
All 1500 axial scan slices spanning the full height of the stope model were processed sequentially. The resulting vertical porosity profile—i.e., surface porosity as a function of elevation—is presented in Figure 7.
Figure 7.
Variation in surface porosity distribution within the stope model at various leaching times: (a) For Ore Sample 1; (b) For Ore Sample 2.
As shown in Figure 7, the surface porosity of both Sample 1 and Sample 2 in the stope leaching model exhibits significant spatial heterogeneity. The porosity in the top and bottom regions is notably higher, while the main central area shows minor fluctuations within a relatively stable range. The primary cause of this phenomenon is the pronounced wall effect. The porosity variation in the central region (excluding the top and bottom) is relatively small, and this stable fluctuation holds important statistical significance. It eliminates interference from external environmental factors such as the wall effect, thereby genuinely reflecting the direct impact of the leaching reaction on the pore structure. Moreover, as the leaching reaction proceeds, the porosity of both samples gradually decreases, particularly in the lower part of the column, where a significant number of dead-end pores appear. However, the porosity variation range of Sample 1 is larger, especially at the bottom, where the change is more pronounced.
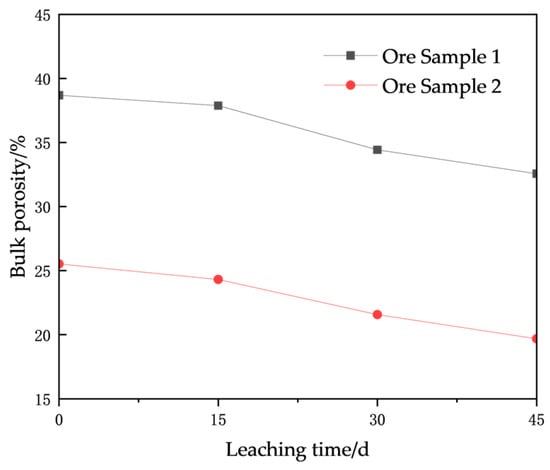
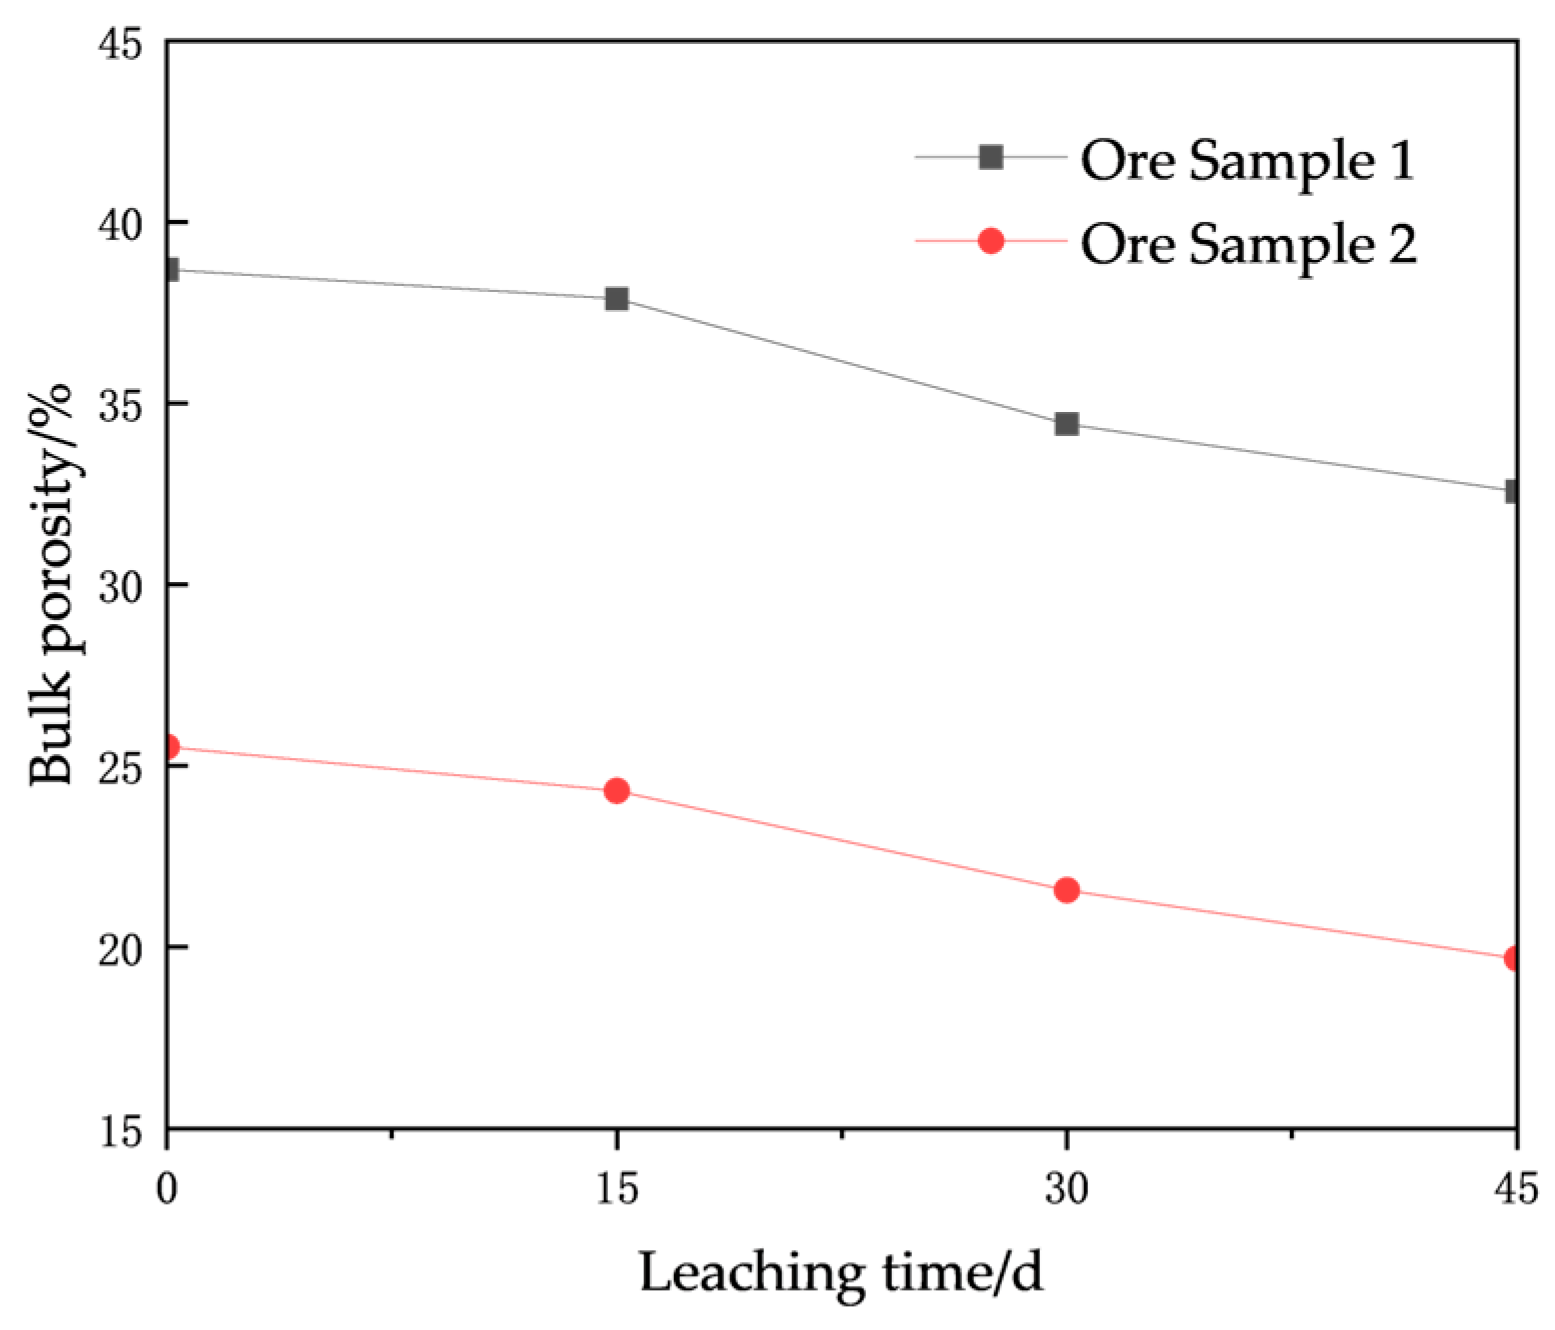
To systematically analyze the evolution of porosity over leaching time, the influence of the top and bottom regions with obviously large pores was excluded. The average surface porosity was calculated from the middle 1420 scanned images to represent the overall condition. The evolution of overall volumetric porosity at different reaction stages (0 d, 15 d, 30 d, 45 d) is shown in Figure 8. The overall porosity variation range of the Sample 1 stope model is larger, but its rate of change is lower than that of the Sample 2 model. The total porosity reductions for the two samples are 15.81% and 22.87%, respectively. The overall volumetric porosity shows a continuous decreasing trend as the leaching reaction progresses: At 15 days of leaching, the porosity reductions for the Sample 1 and Sample 2 stope models account for 13.07% and 20.89% of their respective total reductions. The reduction is relatively small at this stage, with Sample 2 showing a greater decrease than Sample 1, primarily because the finer particles, which are more abundant in Sample 2, cause significant migration and blockage early on. At 30 days, the porosity reductions account for 56.54% and 46.92% of the total reductions, respectively, representing the most substantial decrease. This stage is mainly attributed to pore blockage caused by both precipitate formation and fine particle migration, leading to a significant porosity decline. The decrease in the Sample 1 model is more pronounced, primarily due to its initially larger porosity providing greater potential for reduction through pore blockage. At 45 days, the porosity reductions account for 30.39% and 32.19% of the total reductions, respectively, indicating a slowing rate of decrease. In this stage, the reduced porosity from the previous phase leads to decreased permeability and slower chemical reactions, which in turn results in a decelerated porosity decline, consistent with the previously analyzed evolution of connectivity.
Figure 8.
Evolution of volumetric porosity with leaching time.
3.3. Evolution of Pore-Throat Size Distribution
Pore throats, serving as the critical pathways for the flow of leaching agents and solute migration, have their size distribution evolution directly determining subsequent changes in permeability and leaching efficiency. The spatiotemporal evolution of pore-throat size distribution during stope leaching is key to understanding and controlling the physicochemical essence of the entire leaching process. Based on calculations and statistics, the pore-throat parameters are presented in Table 5 and Table 6, while the evolution of pore-throat size distribution with leaching time is illustrated in Figure 9 and Figure 10.
Table 5.
Temporal variation in pore-throat parameters in the stope model of ore sample 1.
Table 6.
Temporal variation in pore-throat parameters in the stope model of ore sample 2.
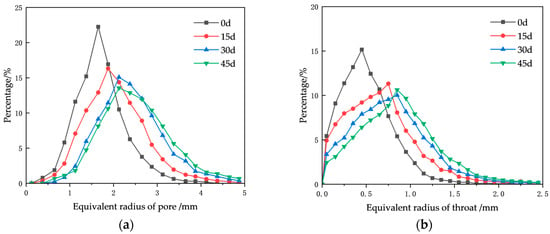
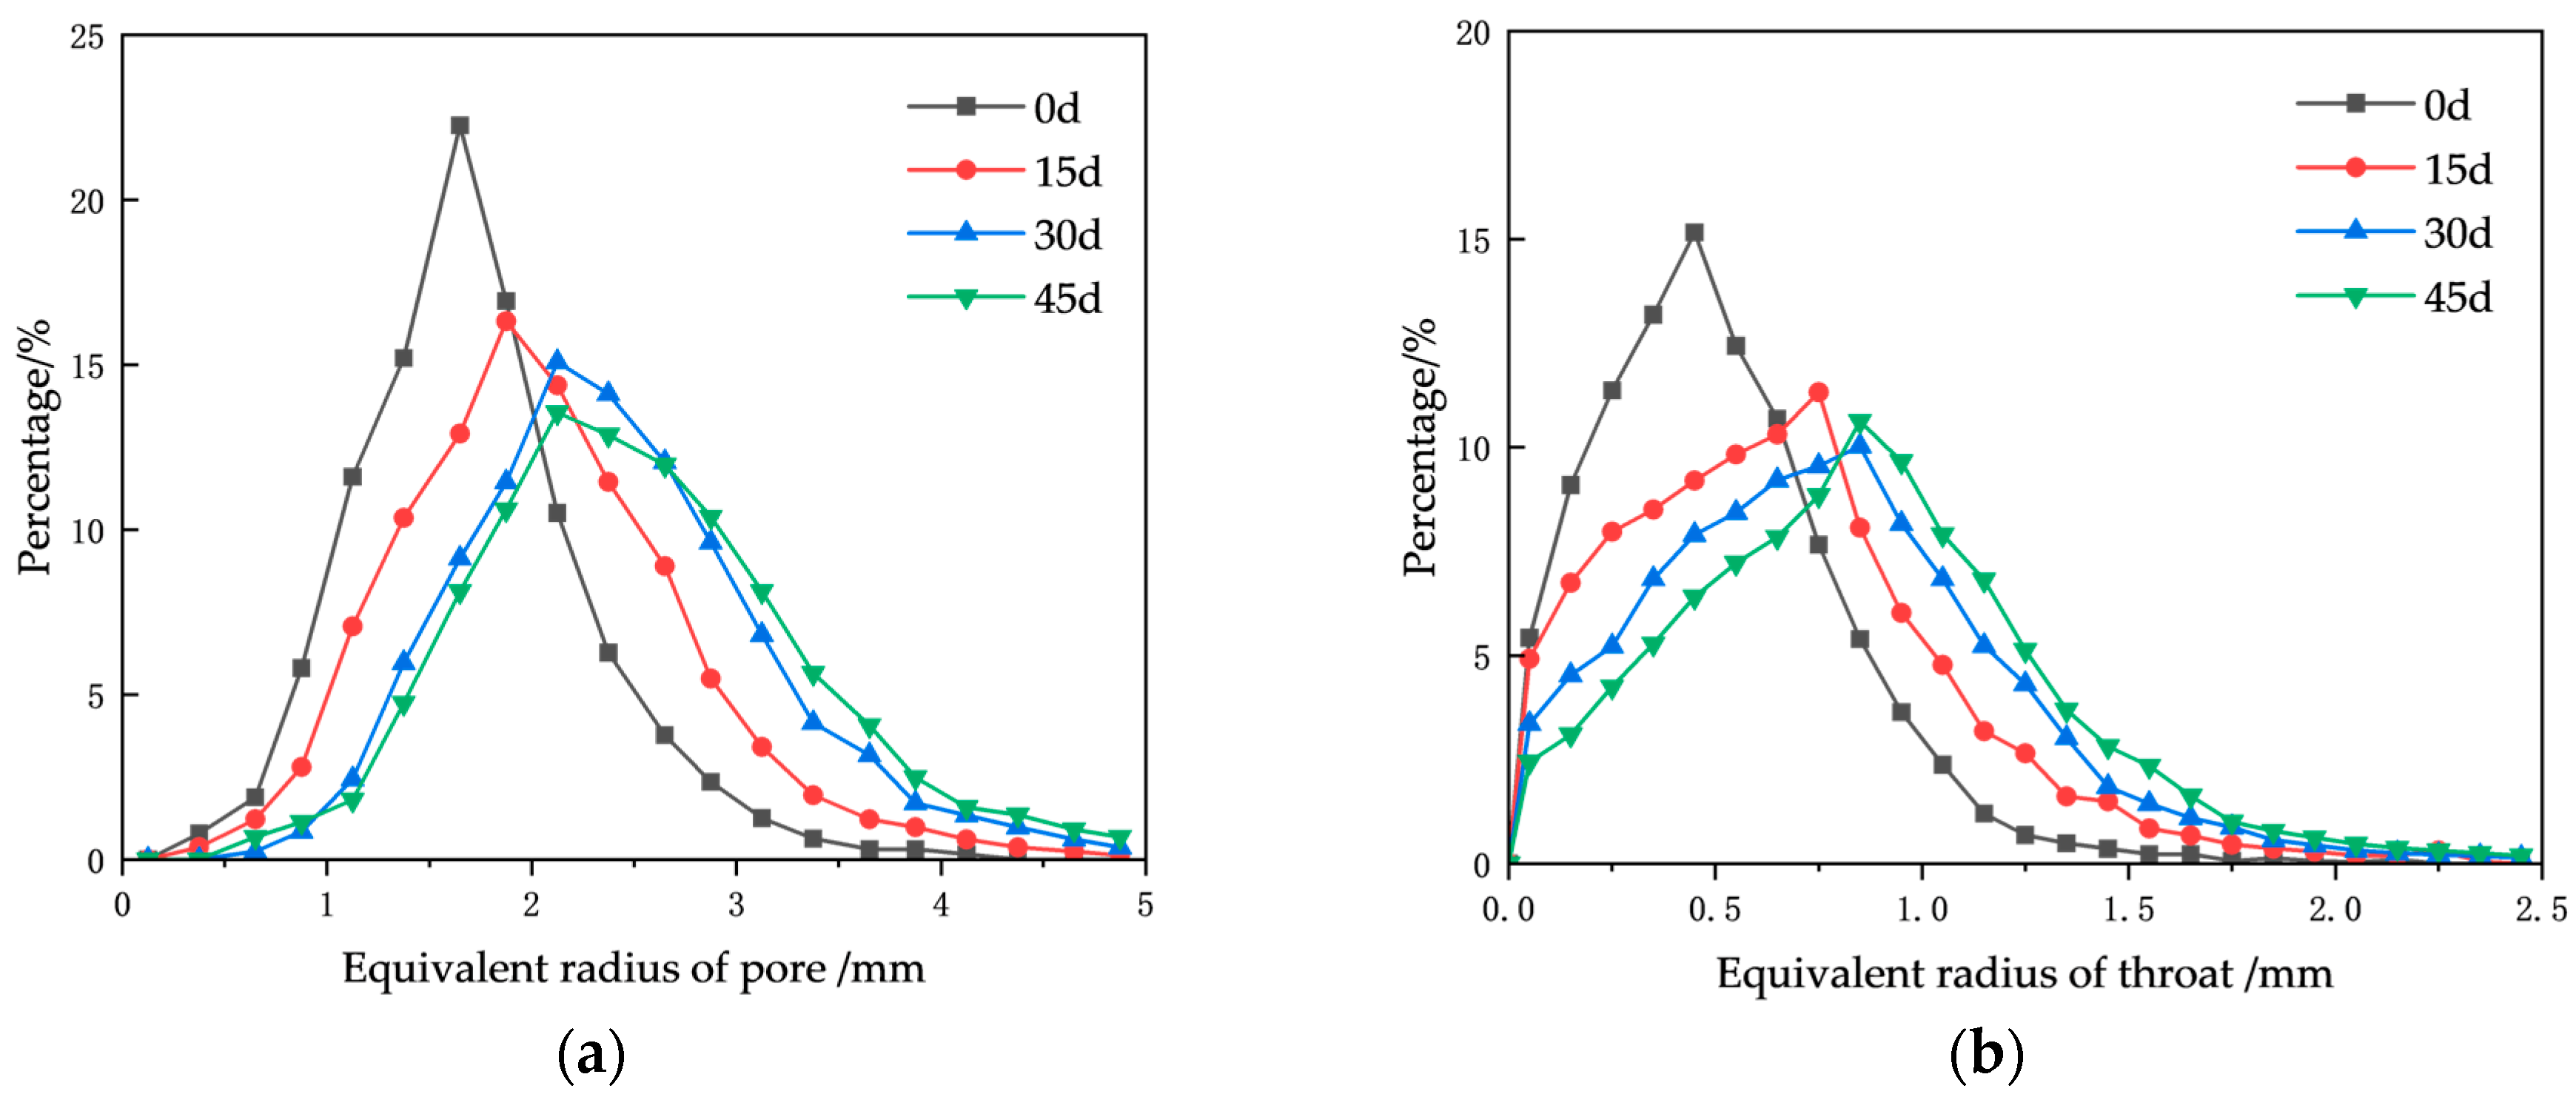
Figure 9.
Evolution of pore-throat size distribution with leaching time in the model of Ore Sample 1: (a) pores, (b) throats.
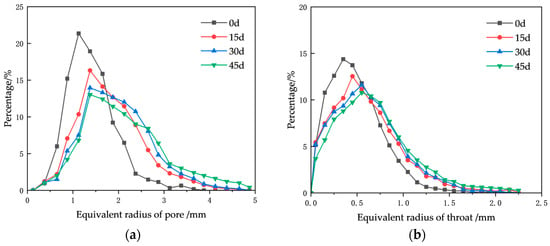
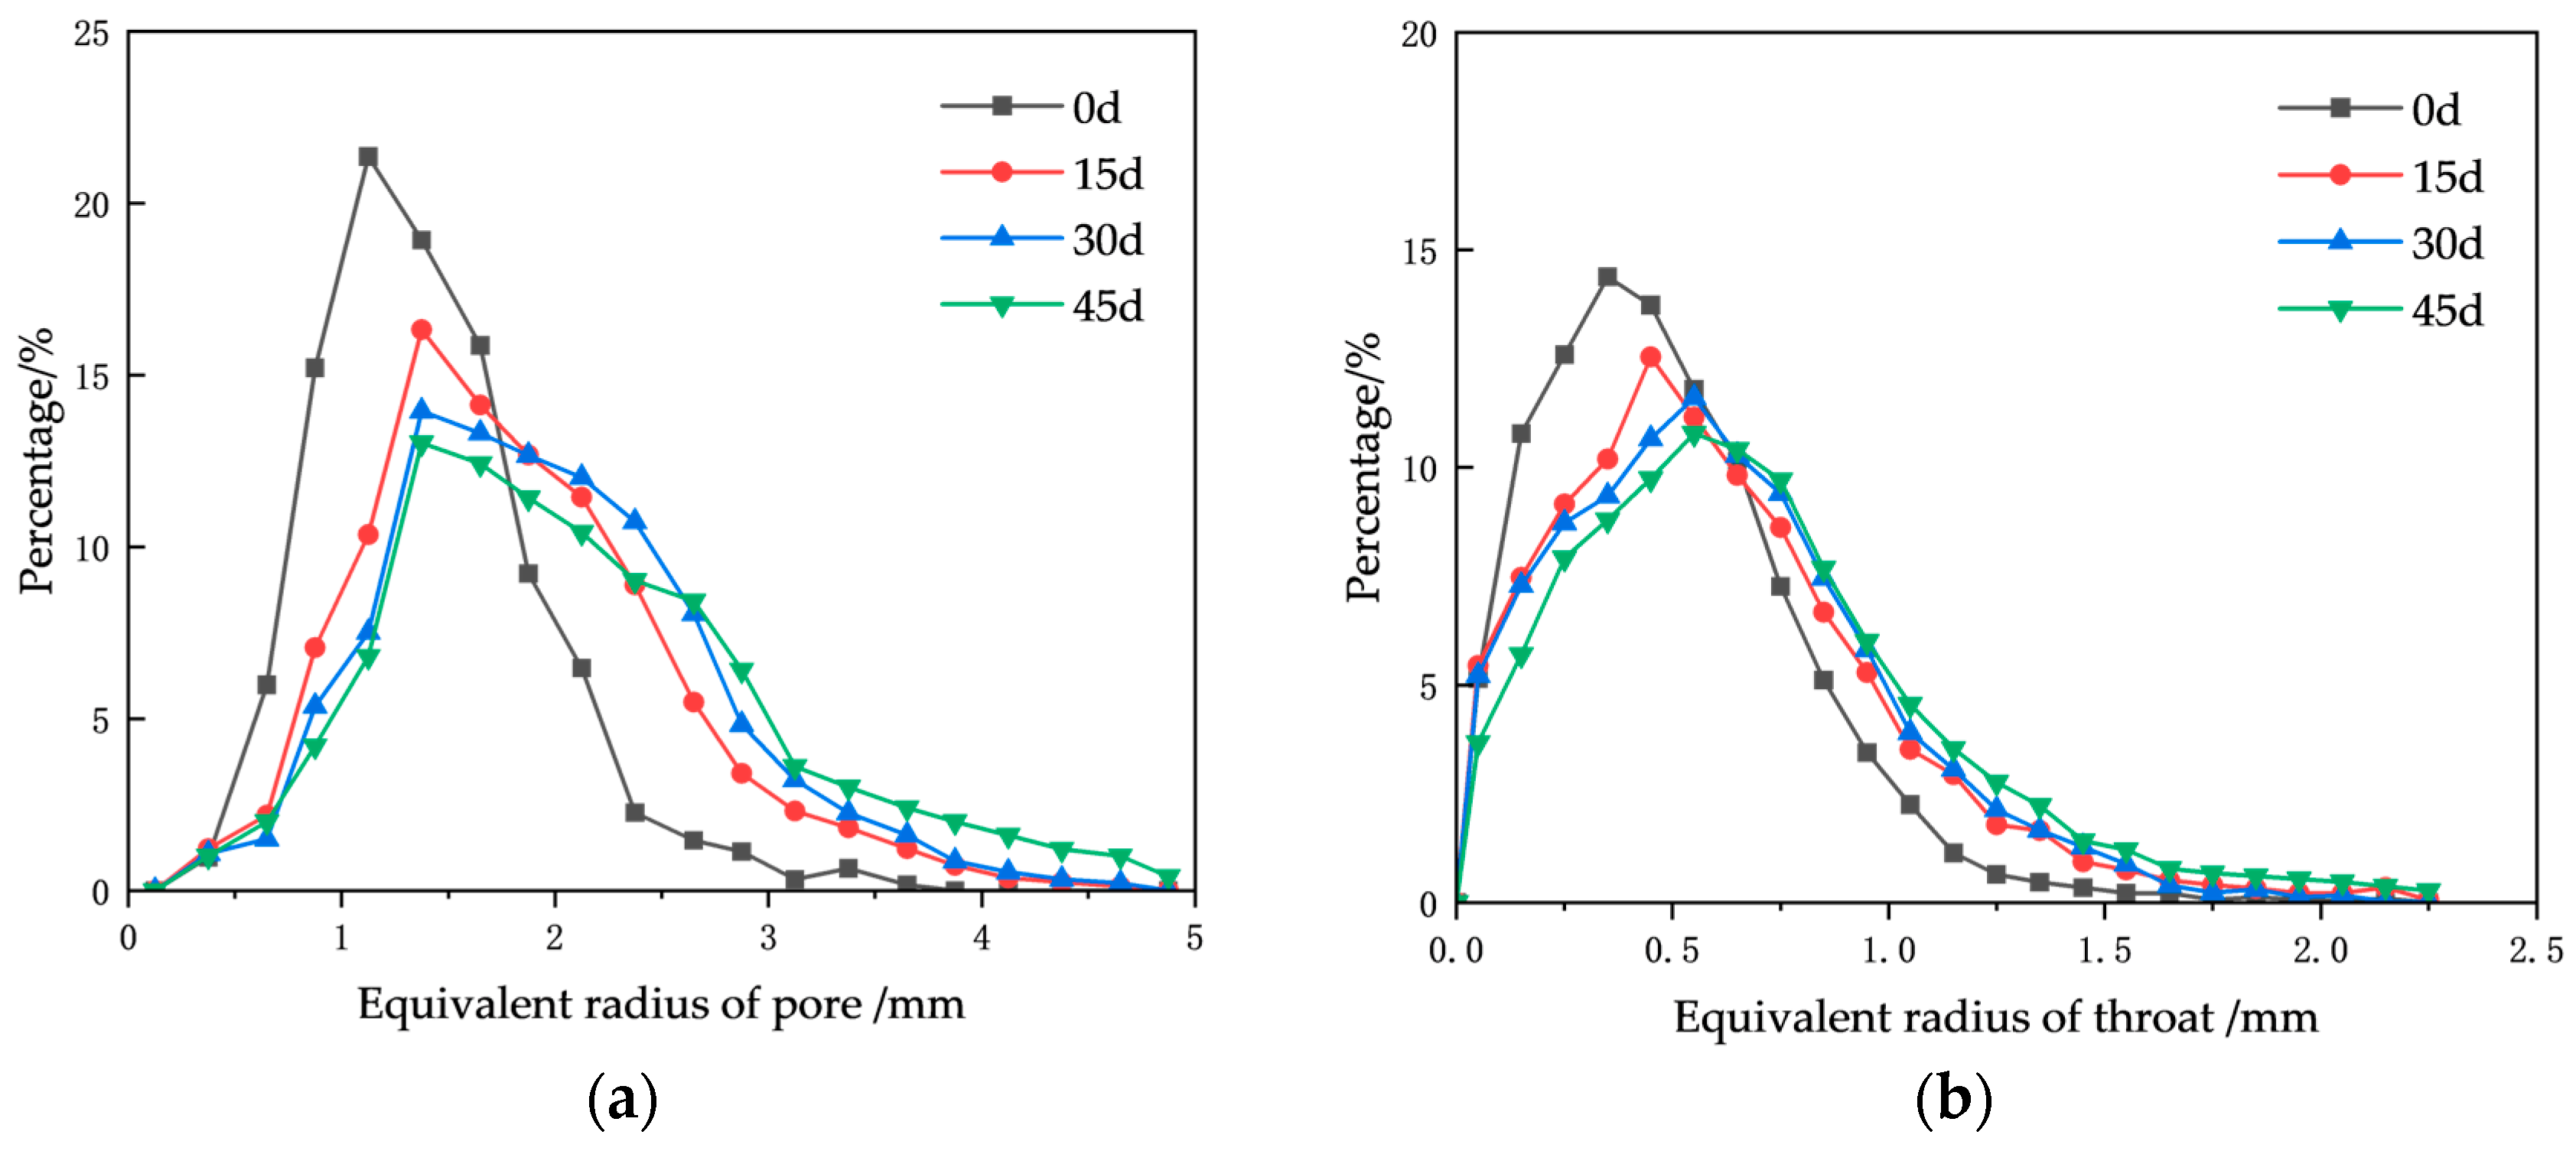
Figure 10.
Evolution of pore-throat size distribution with leaching time in the model of Ore Sample 2: (a) pores, (b) throats.
As shown in Figure 9 and Figure 10, with the progression of the leaching reaction, the pore and throat size distributions in the stope models of both ore samples shift toward larger sizes over time. Specifically, the percentage of small pores and throats continuously decreases, while the proportion of large ones increases, resulting in a rightward shift in the distribution curves.
Regarding the equivalent pore radius, both samples exhibited a relatively narrow distribution range at 0 days. For Sample 1, pores were mainly distributed between 1 and 2.5 mm, while for Sample 2, they were concentrated in the 0.8–1.8 mm range. As the reaction proceeded, the pore size distribution curve for Sample 1 shifted progressively rightward, and the distribution range broadened. The most significant change occurred at 15 days, where the cumulative content of pores larger than 2 mm increased from an initial 25.54% to 50.09%, after which the rate of change slowed. For Sample 2, the pore distribution curve also shifted noticeably rightward by 15 days. In subsequent periods, the proportion of large pores continued to increase slightly, although the peak proportion consistently remained at 1.4 mm. The cumulative content of pores larger than 1.4 mm evolved with leaching time as follows: 56.47%, 79.17%, 84.55%, and 86.37%.
The distribution curves for the equivalent throat radius in both models also showed a continuous rightward shift. However, the change was more pronounced in the Sample 1 model. The cumulative content of throats larger than 0.8 mm evolved over leaching time as follows: 22.64%, 42.51%, 54.52%, and 63.46%. In contrast, for the Sample 2 model, the total change in the content of throats larger than 0.8 mm throughout the entire process was only 19.05%.
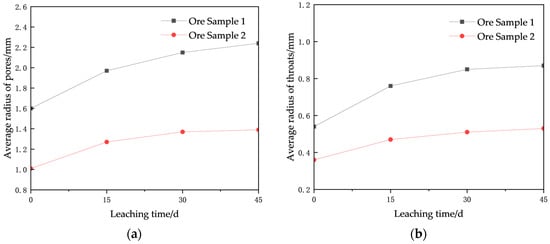
Using the data from Table 5 and Table 6, the evolution curves of the average pore diameter with leaching time were plotted, as shown in Figure 11. The overall trend for both Sample 1 and Sample 2 is an increasing average pore diameter with leaching time, with Sample 1 showing a greater absolute increase and rate of change than Sample 2. At 15 days of leaching, the average pore radius for both samples increased sharply. During the period from 15 to 45 days, the average pore and throat radii increased only slightly. By 45 days of leaching, the average pore radius of the two granular ore samples had increased by 40.63% and 37.62%, respectively.
Figure 11.
Variation in average pore-throat radius with leaching time: (a) pores, (b) throats.
The preceding analysis reveals a key phenomenon during leaching: despite a continuous decline in porosity and connectivity, the average pore throat size increases. This increase in average pore radius results from the interplay between two mechanisms: pore coalescence and selective blockage. Coalescence directly creates larger pores, while selective blockage indirectly elevates the statistical average by eliminating smaller pores. Notably, the dominant mechanism differs between the two ore samples. For Sample 1, pore coalescence prevails, leading to a substantial increase in average pore size and relatively well-preserved permeability. In contrast, Sample 2 is dominated by selective blockage, where the average pore size increases while the peak position of the pore size distribution remains unchanged, accompanied by nearly depleted permeability. This divergence implies different redistribution patterns of dissolution products: Sample 1 primarily facilitates ionic transport out of the system, whereas Sample 2 retains particles, resulting in fundamentally different pore evolution pathways and ultimately, distinct leaching efficiencies.
During leaching, the ore granular medium undergoes coupled chemical (dissolution-precipitation) and physical (abrasion and structural weakening) processes, creating a bidirectional interaction between pore structure evolution and inter-particle contact conditions. Specifically, chemical dissolution initially modifies pore geometry (e.g., pore quantity and size distribution). This pore-scale evolution subsequently undermines the mechanical integrity of particle contacts, which in turn accelerates particle abrasion and macroscopic structural destabilization. These three stages form a self-reinforcing feedback loop that drives system evolution. Integrating these observations with the dynamic evolution patterns—specifically, a unimodal trend in pore quantity (initially increasing, then decreasing) alongside a continuous increase in average pore size—suggests the following mechanism: In the early leaching stage, the lixiviant preferentially attacks reactive minerals near particle contacts. These regions, characterized by stress concentration, exhibit enhanced surface energy and reactivity, making them favorable sites for dissolution. As leaching advances, the evolutionary path of the ore granular structure diverges, governed primarily by the ore’s gradation characteristics: (1) For the uniformly graded Sample 1, structural evolution is characterized by particle rearrangement and configurational adjustment. Upon the failure of localized contact points, particles undergo rotation and translation to achieve mechanical re-equilibration, ultimately forming a new stable packing configuration. (2) In contrast, for Sample 2 with a higher fines content, evolution tends toward densification and pore clogging. The weakening of contact points facilitates the migration of fine particles, which infill the pore channels between coarser grains, thereby suppressing connectivity and reversing the overall trend of pore evolution.
3.4. Evolution of Throat Length Distribution
Throats are the relatively narrow channels connecting two pores within a pore network, serving as the key structures controlling fluid throughput and particle transport. The distribution of throat lengths determines the transport efficiency, path selection, and macroscopic flow behavior of fluids in porous media. The longer the throat, the greater the frictional path the fluid must overcome, resulting in higher flow resistance. Throat length is jointly constrained by two opposing processes: chemical dissolution, which shortens and enlarges throats, and clogging or plugging, which extends or completely blocks them.
The leaching process is inherently heterogeneous, with the solution always seeking the path of least resistance and highest permeability, forming preferential flow channels. The distribution of throat lengths is a direct quantification of this heterogeneity. From a chemical reaction perspective, long throats significantly slow down mass exchange rates and are prone to forming diffusion boundary layers, whereas short throats facilitate rapid mass exchange and higher reaction rates. Based on calculation and statistical analysis, the evolution of throat length distribution with leaching time is shown in Figure 12.
Figure 12.
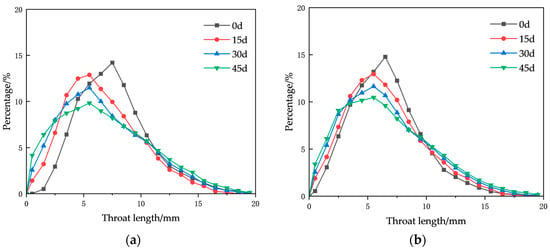
Pore-throat length distribution under different leaching times: (a) Ore Sample 1, (b) Ore Sample 2.
As shown in Figure 12, after 15 days of leaching, the throat length distribution curves for both ore sample models exhibit a noticeable leftward shift, with the change being more pronounced in Sample 1. The percentage of short throats increased sharply. Specifically, the cumulative content of throats shorter than 5 mm in the Sample 1 model increased from an initial 20.15% to 34.39%, while in the Sample 2 model, the cumulative content of throats shorter than 5 mm also increased but at a slower rate, rising from 31.38% to 36.84%.
By 30 days, both models showed a slight further increase in the percentage of short throats, along with an increase in the percentage of long throats. The increase in long throats was particularly significant in the Sample 1 model, indicating that during this stage, the two competing mechanisms—chemical dissolution shortening throats and clogging lengthening them—were acting simultaneously. At 30 days, both models primarily exhibited a slight increase in long throats, and the percentage of short throats in the Sample 1 model decreased, suggesting that clogging played a dominant role during this phase.
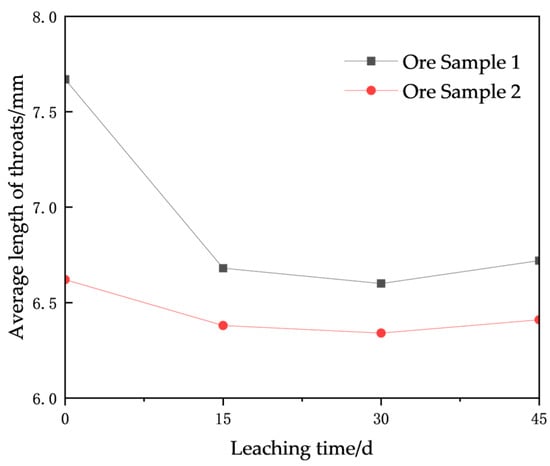
Figure 13 presents the evolution curves of average throat length with leaching time. The overall trend for both Sample 1 and Sample 2 is an initial decrease followed by an increase as leaching progresses. The magnitude of the decrease and the rate of change are greater for Sample 1 than for Sample 2. At 15 days of leaching, the average throat length for both samples decreased, with Sample 1 showing a sharp decline. The average lengths were reduced to 87.09% and 96.37% of their initial values for Sample 1 and Sample 2, respectively. During this stage, chemical dissolution dominated. Chemical dissolution erodes the throat walls, making them shorter and wider. Additionally, when a throat is widened to the point where it becomes indistinguishable from a pore, the two adjacent pores may be merged into one during CT image analysis and network extraction, leading to a significant reduction in the average throat length.
Figure 13.
Variation in average throat length with leaching time.
During the period from 15 to 45 days, the average throat length increased slightly. In this stage, both chemical dissolution and clogging were significant, with the clogging effect becoming more pronounced over time.
4. Analysis of Permeability and Leaching Rate Based on Pore Structure
4.1. Evolution of Permeability During Leaching
Permeability variation is a macroscopic manifestation of pore structure evolution in fluid flow behavior, while changes in pore structure are the underlying mechanism driving permeability alterations. The relationship between them is not a simple one-way causal chain but involves a dynamic bidirectional feedback mechanism. Permeability (k) is a fundamental physical property independent of the fluid, determined entirely by the packing state of the granular medium, and can be derived from three-dimensional reconstruction data analysis using Avizo. By setting simulated fluid inlet and outlet ports in the x, y, and z directions (where z is the direction of gravity), fluid flow simulations were conducted. Numerical solutions to the fluid flow equations were computed within the pore space of the three-dimensional model, and upon convergence of the simulation, the absolute permeability values were output. The calculated absolute permeability tensors for different stope models after leaching are presented in Table 7.
Table 7.
Permeability parameters of different stope models during the leaching process.
As shown in Table 7, both stope models exhibit dominant permeability along the z-axis, while the permeability in the x- and y-axis directions is relatively low. This indicates that fluid flow within the models primarily follows the gravity-driven direction of the leaching solution. Therefore, the analysis focuses on the variation in vertical permeability over leaching time.
The data reveal that as the leaching reaction progresses, the permeability of both models continuously decreases. In both cases, the most significant decline occurs during the initial 15 days of leaching, accounting for 64.89% and 74.36% of the total reduction for the Sample 1 and Sample 2 models, respectively. After this period, the rate of decline becomes more gradual. By day 45, the permeability values are reduced to 61.17% and 30.36% of their initial values for Sample 1 and Sample 2, respectively, indicating a more pronounced decline in the Sample 2 model.
At the end of the experiment, the flow capacity of Sample 2 had significantly deteriorated, approaching a semi-clogged state where most internal pore channels are obstructed, leaving only a few isolated flow paths. In contrast, although the permeability of Sample 1 has also decreased to some extent, its overall flow condition remains relatively unimpeded, with no significant hindrance to the movement of the leaching solution.
4.2. Evolution of Leaching Rate During the Leaching Process
The primary objective of in situ leaching in low-grade copper ore stopes is to recover metallic copper, making the leaching rate and flow rate of the leaching agent the most critical technical and economic indicators for evaluating the success of the entire process. Studying the evolution of pore structure parameters and permeability in the stope ultimately aims to analyze their impact on leaching efficiency. Conversely, adjustments to operational parameters, such as spray rate and solution concentration, can be made in a timely manner based on changes in the leaching rate. For the in situ leaching model of low-grade copper ore, the copper ion concentration in the leaching solution was tested every three days during the leaching period. The copper ore leaching rate was calculated using Equation (2).
where Rt is the leaching rate at time t (%), Ct is the copper ion concentration in the leaching solution at time t (g/mL), Vt is the volume of the leaching solution at time t (ml), m is the total mass of the granular ore sample (g), and w is the grade of the copper ore (%).
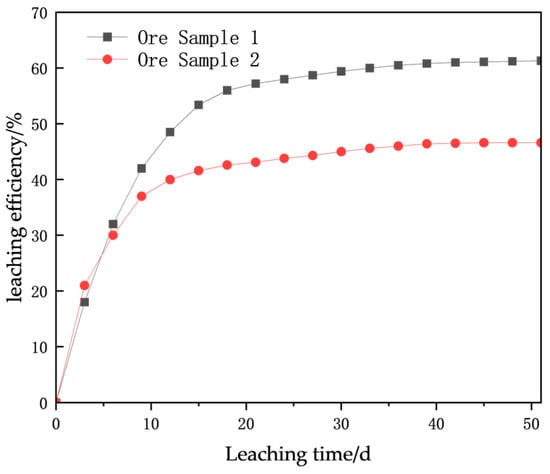
The variation in leaching rate over time for models with different particle size distributions is shown in Figure 14.
Figure 14.
Comparison of leaching rates over time for models with different particle size distributions.
As shown in Figure 14, for the leaching process of the Sample 1 model, the good permeability allows the leaching solution to propagate downward uniformly, maximizing the wetting of all ore particles and resulting in high mass transfer efficiency. In the Sample 2 model, due to the higher content of fine particles, the initial leaching benefits from the large specific surface area of the fines, which facilitates rapid chemical reactions with the solution, leading to a higher leaching rate initially. However, these fine particles are prone to migrate with the leaching solution, clogging the pore throats between larger particles and promoting the formation of preferential flow paths. This results in highly uneven distribution of the leaching solution, reducing the effective reaction area. Even within wetted regions, the fine and tortuous pores create high mass transfer resistance and slow diffusion rates.
From the figure, it can be observed that during the initial leaching stage (0–15 days), the leaching rate of the Sample 1 stope model increases rapidly and almost linearly. In the first 15 days, the leaching rate reaches 53.4%, accounting for 87.11% of the total leaching rate. At the very beginning of leaching, the Sample 2 model exhibits a slightly higher leaching rate than the Sample 1 model due to the larger specific surface area and faster reaction kinetics of its fine particles. However, as the reaction progresses, severe channeling dominates, causing the leaching rate increase to slow down significantly, and the initial leaching rate falls far below that of Sample 1.
During the 15–45 day period, the growth rate of the Sample 1 model slows, entering a stable growth phase where it begins to leach encapsulated or less reactive minerals. Due to favorable mass transfer conditions, it still maintains a relatively high leaching rate. In contrast, the curve for the Sample 2 model becomes exceptionally flat, with clogging issues continuing to worsen and the leaching rate increasing only minimally.
After 45 days, the leaching rate of the Sample 1 model reaches approximately 61% and enters a tailing stage, as the most refractory minerals are slowly leached. Sample 2, however, enters a pseudo-tailing stage much earlier. This is not due to a lack of leachable copper but because the leaching solution can no longer effectively access it. Ultimately, the leaching rate stagnates at around 45%.
4.3. Evaluation of Leaching Rate Based on Pore Structure
The objective of this study is to analyze, through leaching experiments, the impact of pore structure evolution on leaching effectiveness during the process, bridging the analysis from microscopic mechanisms to macroscopic phenomena. This aims to enhance metal recovery rates and reduce production costs. The microscopic characteristics of the pore structure govern macroscopic seepage and mass transfer behaviors, which manifest as changes in permeability and leaching rates. Key intrinsic factors include porosity, pore size distribution, and pore connectivity. Variations in these pore structural properties drive the evolution of macroscopic permeability and leaching rates. Permeability is primarily controlled by connectivity and pore size (especially throat size). The leaching rate, on the other hand, is a physical quantity reflecting the rate at which solutes migrate from the interior of the porous medium to the exterior under fluid action. It is governed by two mechanisms: first, by seepage control—if fluid flow is fast (high permeability), solutes are carried away more quickly; second, by diffusion control—in regions where fluid flow is stagnant or very slow, solutes rely on concentration gradients to diffuse through micropores and dead-end pores to the main flow pathways. Therefore, the root cause of the macroscopically measurable leaching rate lies in the microstructure. To alter macroscopic properties, changes must start at the microscopic structural level.
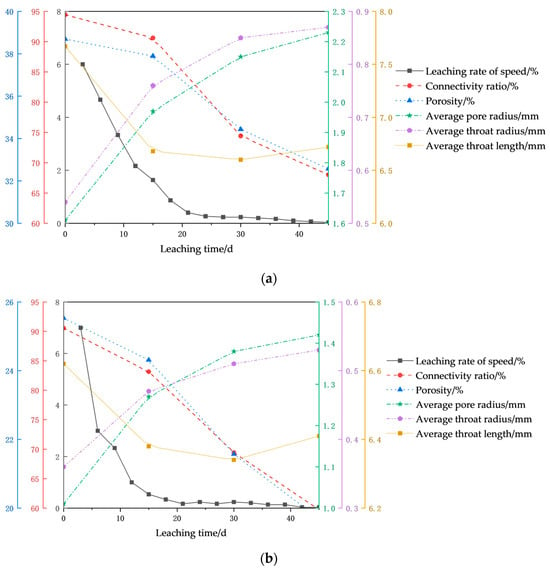
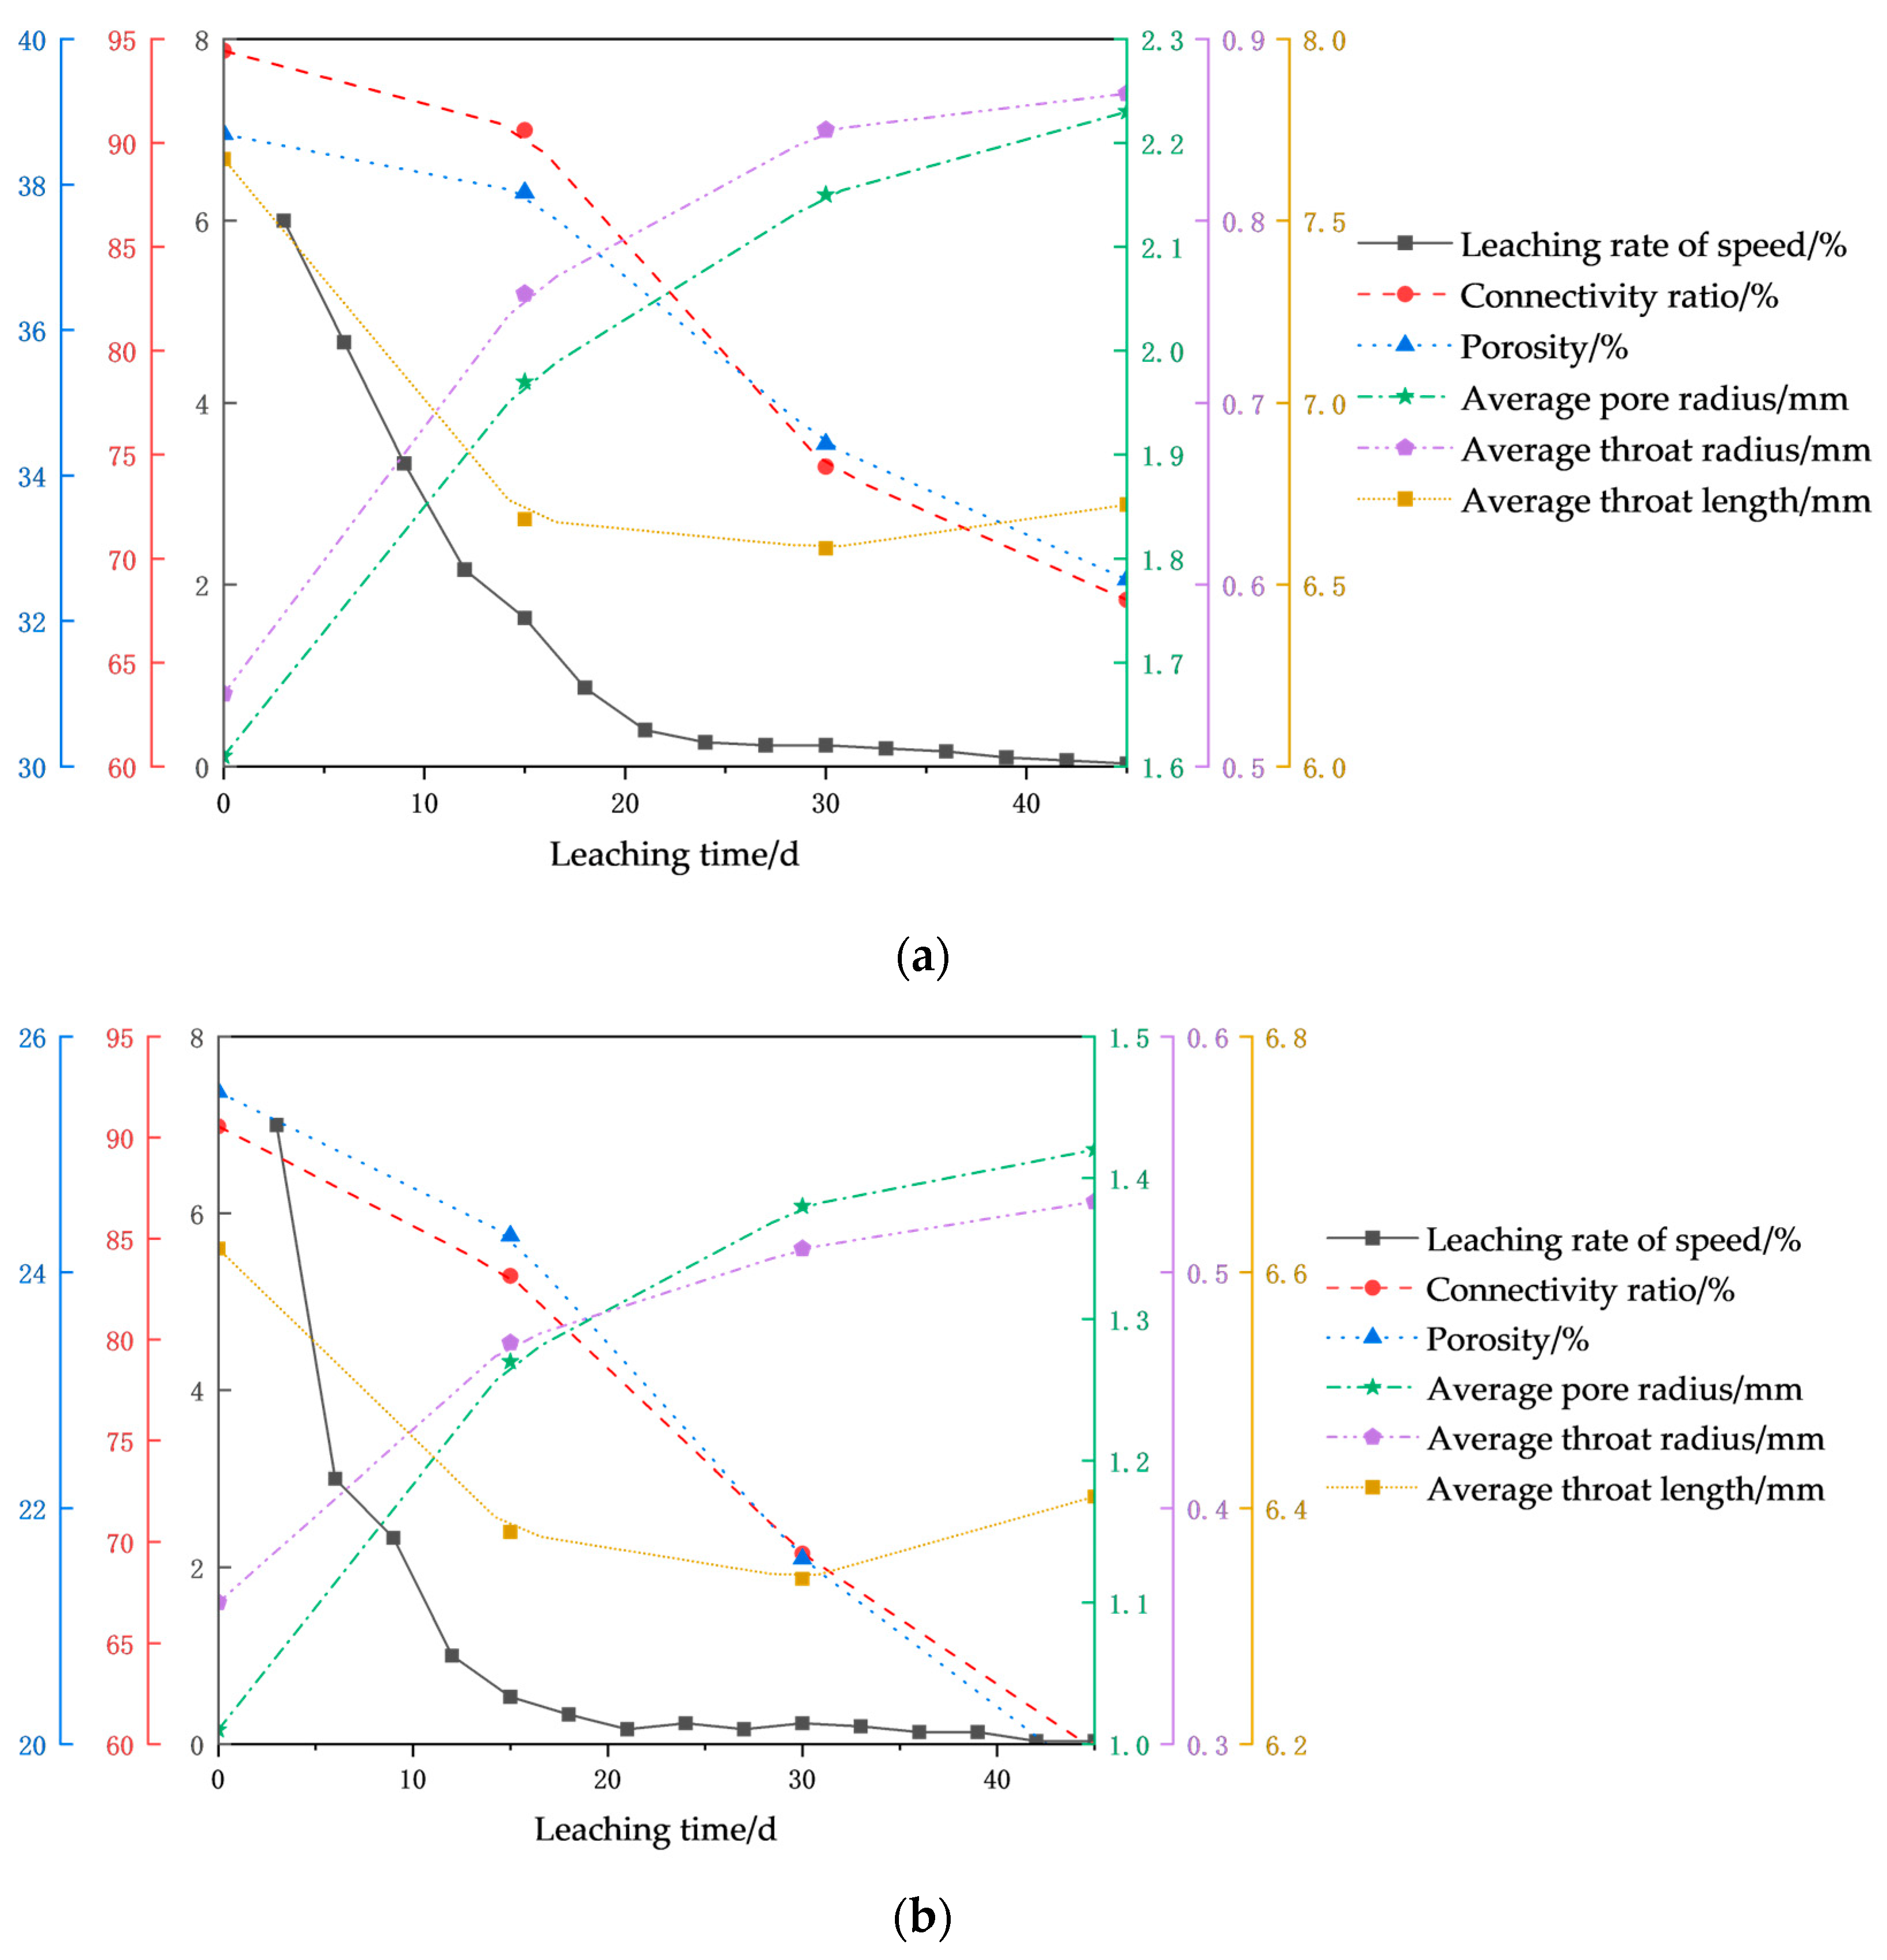
In this study, the pore structure parameters include pore connectivity, porosity, equivalent pore diameter, equivalent throat diameter, and throat length. Based on the leaching rate measured every three days, the corresponding leaching rate was calculated using the central difference method. The relationships between the evolution of the aforementioned five pore parameters and the leaching rate over time are shown in Figure 15.
Figure 15.
Relationship between pore structure parameters and leaching rate over time: (a) Ore Sample 1, (b) Ore Sample 2.
As shown in the figure, as leaching progresses, the pore structure of both models is altered. The average pore radius and average throat radius increase, while both the connectivity rate and porosity decrease. The leaching rate also declines continuously. This indicates that the enlargement of pore and throat sizes does not maintain a proportional relationship with the leaching rate. This paradoxical phenomenon results from the intense competition between chemical dissolution and physical/chemical clogging processes. Specifically, pore and throat sizes reflect the dimensions of the interconnected flow pathways, whereas porosity and connectivity rate reflect the total pore space within the entire ore sample and its overall interconnectivity, respectively.
While pore throat size characterizes the dimensions of connected flow channels, porosity (ϕ) and connectivity (C) reflect the global pore space and its interconnectivity within the entire ore sample. Together, they define the truly effective seepage space. In multiphase reactions, the reaction rate is proportional to the interfacial area available for reaction—a fundamental principle of chemical reaction engineering. According to the shrinking core model, the leaching reaction occurs primarily at the interface between the unreacted core and the lixiviant. The extent of this interface directly governs the reaction progress, rather than pore throat size or total porosity alone. Therefore, pore structure parameters alone are insufficient to quantitatively describe differences in leaching kinetics. There is a critical need for a parameter that can characterize the true reactive interface. To address this, we introduce the concept of effective reaction area (Aeff)—the interfacial region that genuinely participates in the chemical reaction during leaching. In porous media, a higher porosity generally implies more exposed mineral surface, i.e., . Furthermore, for a given porosity, a finer pore network provides a greater specific surface area. However, in the context of leaching reactions, the accessibility of the lixiviant to these surfaces is governed by the pore throats. If the throats become blocked, even large pores are rendered inaccessible, and their internal surfaces remain unreacted, . Moreover, porous media inherently contain “dead-end pores” whose internal surfaces are inaccessible to the lixiviant and therefore do not participate in the reaction. To account for this, the connectivity (C) is incorporated to correct the effective reaction area, denoted as , leading to the formulation of Equation (3). This equation is then used to estimate the effective reaction area index at each CT scanning time point.
where ϕc is the connected porosity (%), rt is the throat radius (mm), ϕv is the volumetric porosity (%), C is the connectivity rate (%), and k is a comprehensive correction coefficient. Among these, the geometric shape factor (kg) exerts the greatest influence on k. Therefore, we simplify k to kg in the equation. By combining it with the Kozeny-Carman equation [Equation (4)], kg is then derived.
where k is the permeability (%), ϕv is the volumetric porosity (%), kc is the Kozeny constant (typically taken as 5.0), τ is the tortuosity (generally between 1.5 and 2.0; here, 1.6 is used for Ore Sample 1 and 1.8 for Ore Sample 2), Aeff is the effective reaction area (mm2), and kg is the shape factor. During the leaching process, the value of the shape factor kg continuously changes. In this study, the value at t = 0 days is used for calculation, resulting in shape factors of 2.22 for Ore Sample 1 and 2.01 for Ore Sample 2. The variations in effective reaction area with leaching time for models with different particle size distributions are presented in Table 8 and Figure 16.
Table 8.
Effective reaction area and leaching efficiency over time for models with different particle size distributions.
Figure 16.
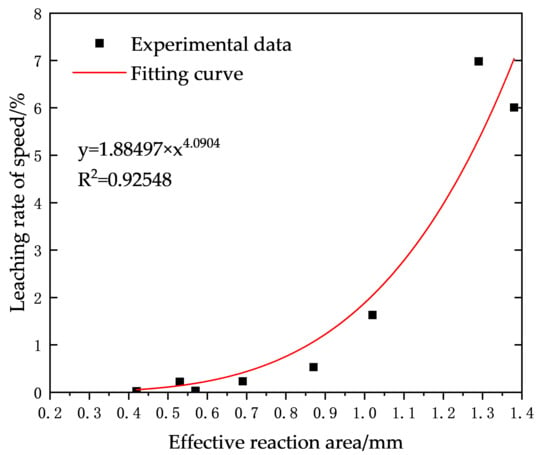
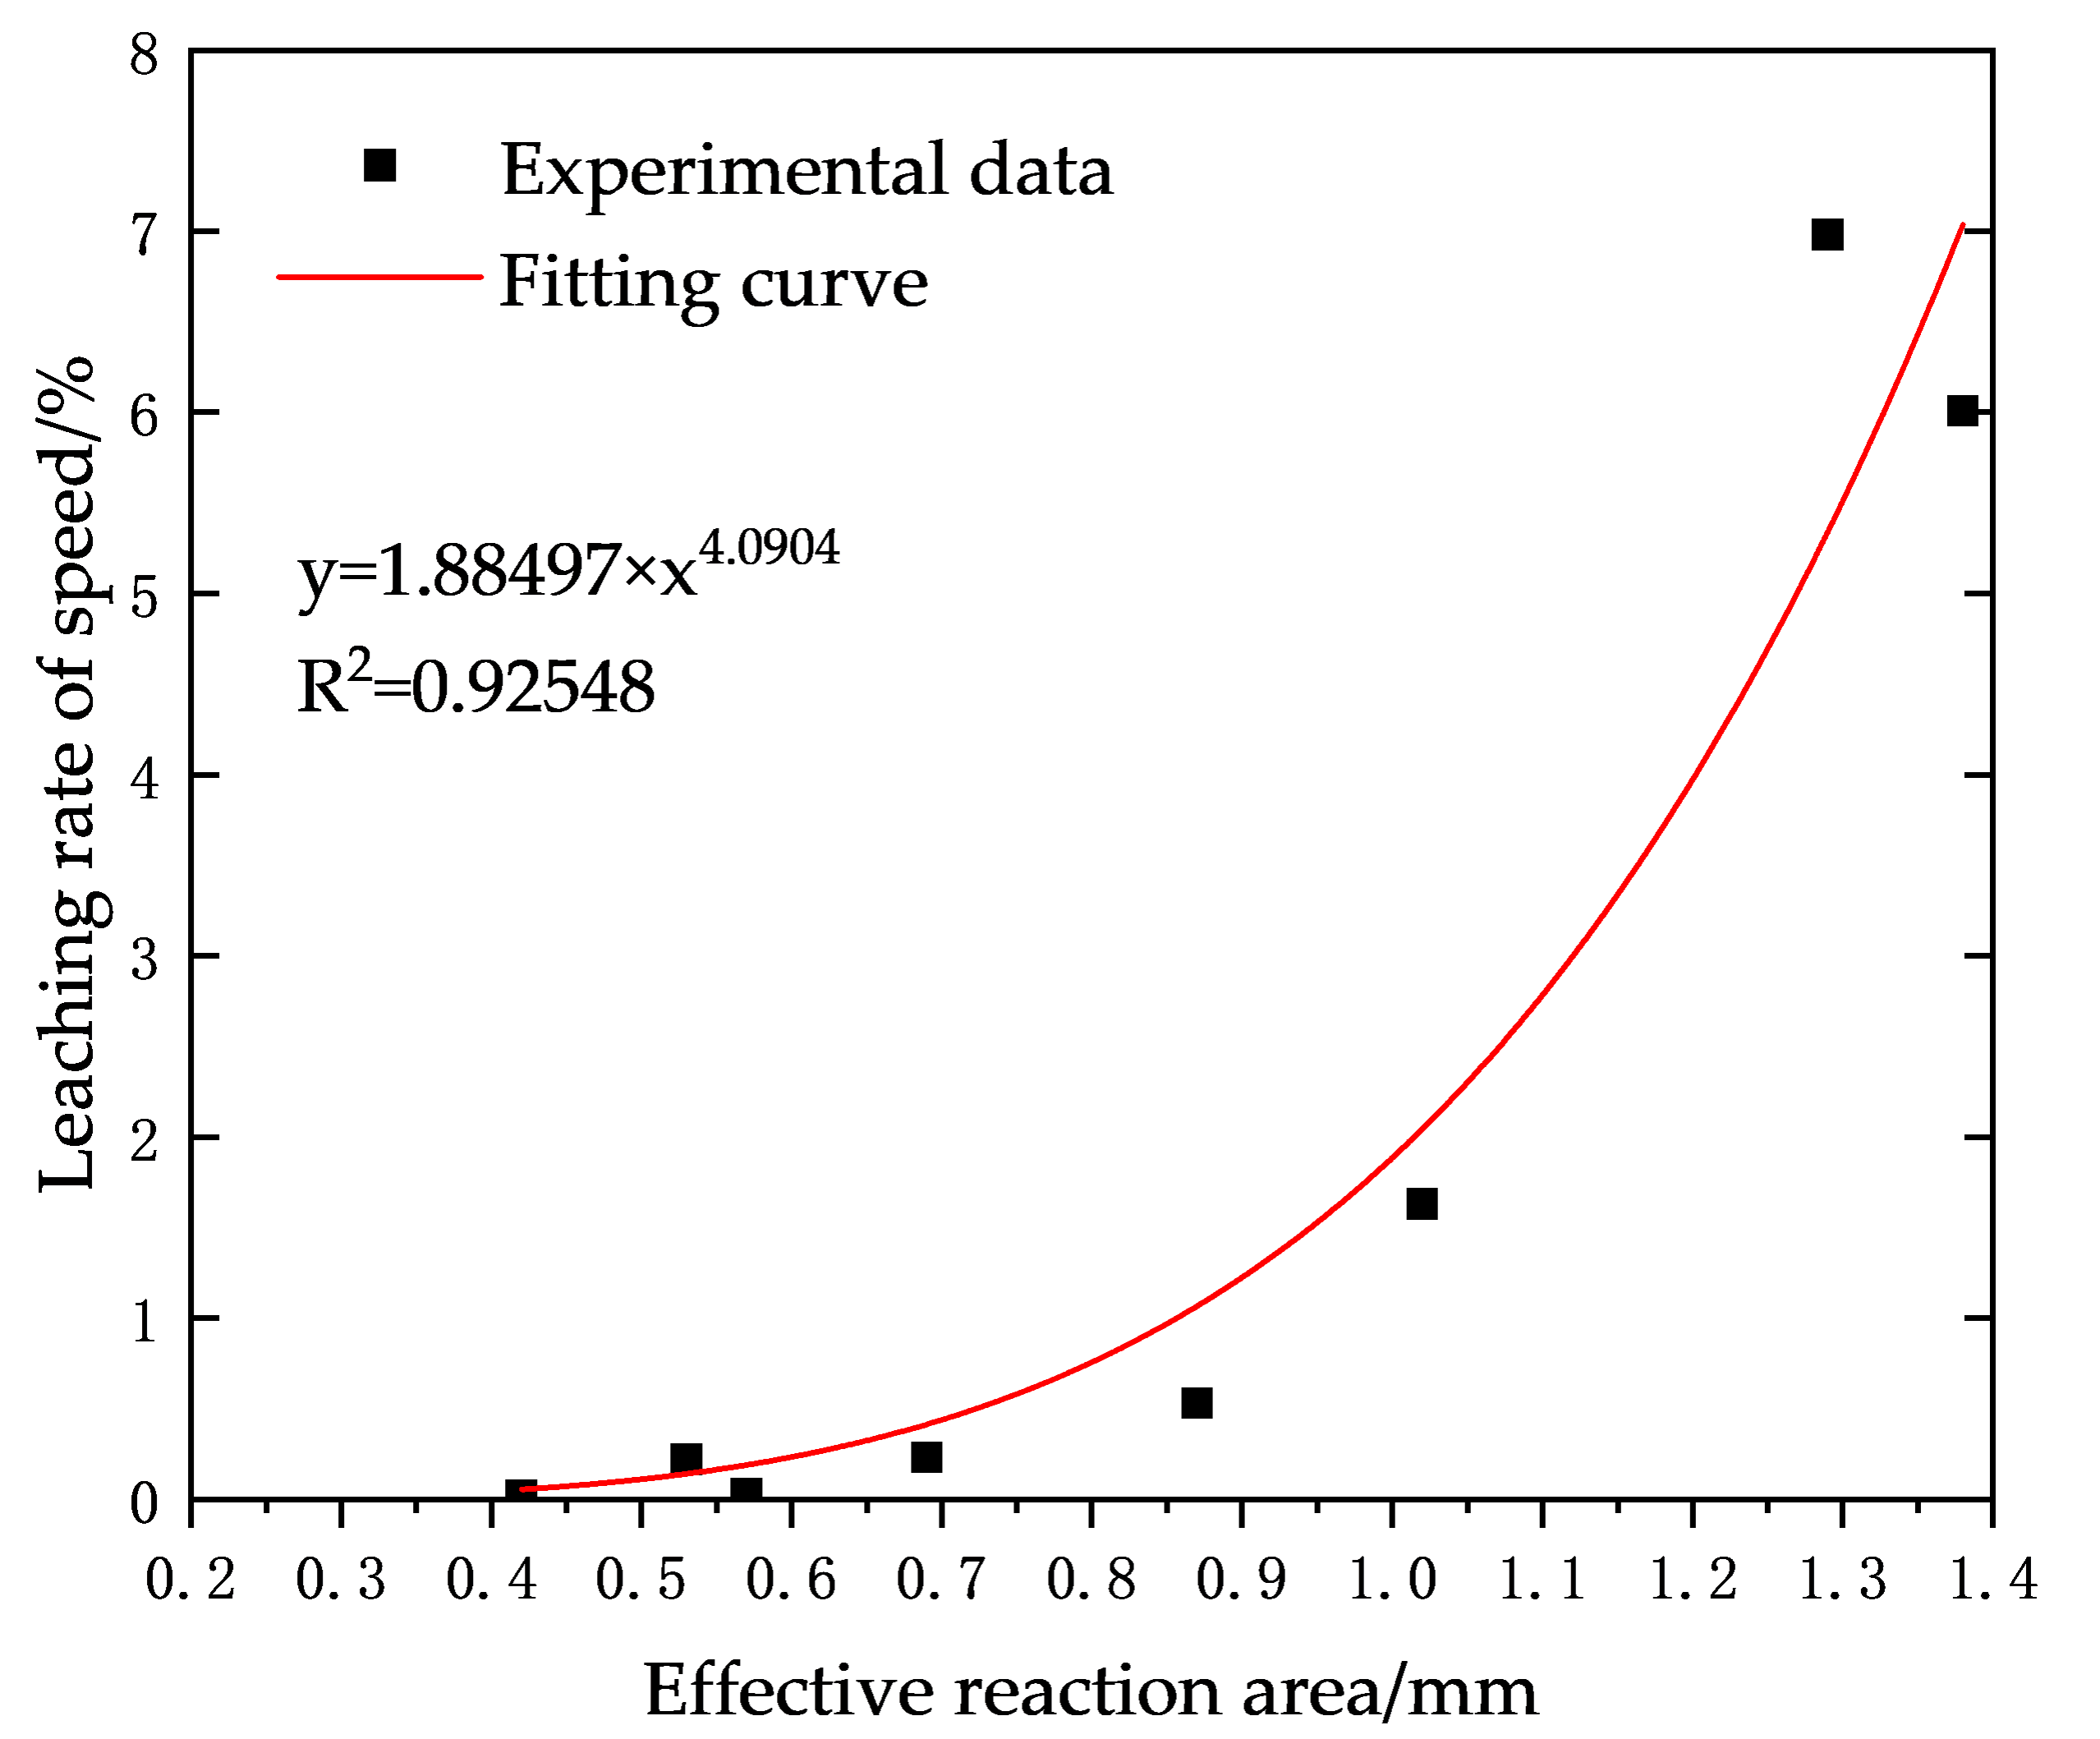
Fitting curves of effective reaction area and leaching efficiency for models with different particle size distributions.
As shown in Table 8, Aeff and the leaching rate declined in synchrony over time, exhibiting a strong correlation (R2 = 0.93). Consistent with the fundamental principle of multiphase reaction kinetics—that the reaction rate is proportional to the reactive interface area—this strong correlation confirms that Aeff governs the leaching rate. The decay of Aeff is thus identified as the primary contributor to the observed decline in leaching kinetics. For Sample 1, Aeff decreased from 1.38 mm−1 to 0.57 mm−1, a loss of 58.70%. For Sample 2, it decreased from 1.29 mm−1 to 0.42 mm−1, a loss of 67.44%, indicating a faster and more severe reduction in effective area for Sample 2. During the 0–15-day period, both models exhibited the fastest decline in Aeff, which coincides with the period of the most drastic drop in their leaching rates. For Sample 1, Aeff decreased from 1.38 mm−1 to 1.02 mm−1 (a 44.45% reduction), corresponding to a 73.24% drop in leaching rate. For Sample 2, Aeff decreased from 1.29 mm−1 to 0.87 mm−1 (a 48.28% reduction), corresponding to a 92.67% drop in leaching rate, reflecting a more pronounced decline in Aeff for the Sample 2 model.
The leaching process can be divided into three distinct stages:
Stage 1: Rapid Dissolution Period (0–15 days)
During this stage, the throat radius increased rapidly, but connectivity decreased significantly, leading to a notable decline in the effective reaction area, where the concentration of leached copper ions attains a maximum value of 2.98 mg/L. This resulted in a sharp drop in the leaching rate (from 6.01% to 1.63% for Sample 1, and from 6.98% to 0.53% for Sample 2). Although flow channels widened during this phase, connectivity began to deteriorate, particularly for Sample 2, which had a higher content of fine particles, causing a more pronounced decline in leaching rate.
Stage 2: Clogging-Dominated Period (15–30 days)
In this stage, connectivity declined dramatically, and the leaching rate continued to decrease (from 1.63% to 0.23% for Sample 1, and from 0.53% to 0.22% for Sample 2). Clogging effects due to fine particle migration became fully pronounced. For Sample 2, the sharp decline in the previous stage limited the room for further reduction.
Stage 3: Dynamic Equilibrium Period (30–45 days)
Changes in pore parameters slowed, and the leaching rate approached zero. During this phase, the system reached a state controlled by diffusion-limited “islands,” where mass transfer became the dominant limiting factor.
The ore samples utilized in this study are low-grade copper ores characterized by significant contents of iron (Fe 5.993%), calcium (CaO 4.877%), and aluminum (Al2O3 15.162%), which drive the formation of jarosite, gypsum, and aluminum-based precipitates, respectively. The synergistic effect of these multiple precipitates constitutes the fundamental cause of the leaching rate decline. Furthermore, the precipitation process exhibits distinct temporal stages, which significantly contributes to the sharp drop in leaching rate observed during the initial 0–15 d period. Notably, Ore Sample 2 demonstrates a higher sensitivity to chemical passivation. Its elevated fine particle content results in a larger exposed surface area of iron-bearing minerals, accelerating the release of Fe3+ and promoting earlier and more abundant jarosite precipitation. This explains why Ore Sample 2 experienced a more severe drop in permeability and achieved a lower final permeability by day 15. During leaching, fine particle migration (physical clogging) and chemical precipitation (chemical clogging) are not independent but rather synergistic processes: the dissolution of fine particles releases Fe3+, which subsequently precipitates as jarosite; conversely, jarosite coatings on fine particles exacerbate clogging. This coupled chemo-physical mechanism is essential for understanding pore structure evolution during leaching. For low-grade copper ores with high iron, calcium, and aluminum contents—such as those examined in this study—special attention must be given to the risks of passivation and pore clogging induced by chemical precipitation.
5. Conclusions
This study employs irregular ore particles as samples to conduct comparative experiments on stope models with different particle size distributions. The evolutionary patterns of pore structure parameters, permeability, and leaching rate of copper during the leaching process are analyzed and discussed. The main conclusions are summarized as follows:
(1) Quantitative analysis of the evolution of connectivity rate and porosity during leaching was performed based on models with different particle size distributions (Sample 1 (2–20 mm, uniformly graded) and Sample 2 (0–20 mm, high fine particle content)). Both stope models exhibited continuous declines in connectivity rate and volumetric porosity throughout the leaching process. Regarding the connectivity rate, the decrease was relatively small at 15 days of leaching, accounting for 15.98% and 24.04% of the total reduction for Sample 1 and Sample 2, respectively. By 30 days, the connectivity rate declined rapidly due to the combined effects of chemical precipitation and particle migration. After 45 days, the rates dropped to 72.03% and 65.95% of their initial values for Sample 1 and Sample 2, respectively, with a more pronounced reduction observed for Sample 2. As for porosity, the Sample 1 stope model showed a larger overall variation range (a decrease of 6 percentage points) but a lower rate of change compared to the Sample 2 model. The total porosity reductions for the two samples were 15.81% and 22.87%, respectively, with the most significant decrease occurring in the lower region of the models.
(2) Quantitative analysis of the evolution of pore and throat sizes during leaching was conducted based on models with different particle size distributions. The number of pores and throats in both stope models initially increased and then decreased during leaching. The average pore and throat radii continuously increased, while the average throat length first increased and then decreased. Notably, the rate of change was significantly greater for the Sample 1 model than for the Sample 2 model. In terms of pore and throat sizes, the percentage of large pores and throats increased over leaching time, causing a rightward shift in the pore-throat size distribution curves. This shift was more pronounced for Sample 1. At 15 days of leaching, the average equivalent pore radius of both models increased sharply, accounting for 58.06% and 63.41% of the total increase for Sample 1 and Sample 2, respectively. Regarding throat length, both models showed a sharp decline at 15 days of leaching, decreasing to 87.09% and 96.37% of their initial lengths for Sample 1 and Sample 2, respectively, followed by a slight increase thereafter. Initially, the lixiviant preferentially dissolves soluble minerals lining the pore walls and throats. This process enlarges constricted throats and pore spaces, leading to an increase in the average pore radius. Concurrently, dead-end pores and sealed throats—previously occluded by cements—are reopened, converting ineffective pores into effective ones and resulting in a marked increase in pore and throat counts. As leaching proceeds, the soluble mineral partitions between adjacent pores become completely dissolved, causing small pores to coalesce into larger ones. This coalescence, combined with the progressive blockage of some pores, accounts for the observed decline in pore number, despite the continued increase in average pore radius. Furthermore, a higher fine particle content dampens the extent of pore-throat structure evolution.
(3) Quantitative analysis of the evolution of permeability during leaching was performed based on models with different particle size distributions. Permeability in all directions continuously decreased for both stope models during leaching, with the dominant flow occurring along the z-axis, driven by gravity. The most significant permeability reduction occurred at 15 days of leaching, accounting for 64.89% and 74.36% of the total reduction for the Sample 1 and Sample 2 models, respectively. After this period, the rate of decline became more gradual. By 45 days, permeability decreased to 61.17% and 30.36% of the initial values for Sample 1 and Sample 2, respectively, indicating a more severe reduction for Sample 2. Therefore, an increase in pore throat radius does not necessarily imply an enhancement in permeability. This is because if pore enlargement results from collapse and coalescence, the concurrent generation of fine particles and increased pore throat tortuosity can lead to a substantial permeability reduction. Fine particles play a dual role: they serve as a source of soluble material for dissolution reactions while also acting as primary agents of pore blockage. Consequently, ore samples with a high fines content, such as Sample 2, exhibit a greater susceptibility to permeability decay.
(4) Quantitative analysis of the evolution of leaching rate and leaching efficiency during leaching was conducted based on models with different particle size distributions. Due to its superior permeability and longer effective leaching duration, the Sample 1 model achieved a leaching rate of 61%, significantly higher than the 45% observed for Sample 2. The leaching efficiency of both models continuously decreased over time, showing a strong correlation with the effective reaction area (Aeff), with an R2 value of 0.93. The decline in Aeff was identified as the root cause of the sharp drop in leaching efficiency. Although Sample 2 initially exhibited a slightly higher leaching efficiency than Sample 1 due to its higher fine particle content, which facilitated chemical dissolution, its efficiency later fell significantly below that of Sample 1 due to factors such as clogging. This finding highlights that a high initial leaching rate can be deceptive. Ore Sample 2, despite its rapid initial leaching, suffered irreversible permeability impairment due to the rapid dissolution of fine particles, leading to premature termination of the leaching process. In contrast, Ore Sample 1 maintained a stable seepage environment, supporting sustained and efficient leaching—underscoring that permeability, rather than the initial rate, is the key determinant of overall leaching performance.
(5) The CT scanning resolution employed in this study is 76 μm, which precludes the direct resolution of pores smaller than this limit (i.e., sub-resolution pores). These pores fall into two main categories: (i) micro-cracks, cleavage fractures, and dissolution voids within mineral grains, with sizes ranging from sub-micron to tens of microns; and (ii) micro-throats formed by the packing of fine particles, which are particularly prevalent in the fines-rich Ore Sample 2. Quantitative analysis reveals a strong positive correlation between the leaching rate and the effective reactive surface area. Although sub-resolution pores are below the imaging threshold, they contribute substantially to the effective specific surface area available for reaction. This explains the faster initial kinetic response observed in Ore Sample 2. Nevertheless, during the middle to late stages, these sub-resolution pores typically exhibit poor connectivity and are susceptible to clogging due to mineral precipitation or fine particle migration, resulting in a rapid decline in the reaction rate.
6. Discussion and Prospect
By integrating indoor dynamic leaching experiments with high-resolution CT scanning, this study elucidates the coupled evolution of pore structure, permeability, and leaching efficiency in ores with varying initial particle size distributions. The findings offer both theoretical insights and practical guidance for field-scale leaching operations. Results demonstrate that initial gradation is a key determinant of pore structure evolution and leaching performance. Uniformly graded ores, characterized by a lower fines content, exhibit greater structural stability and better-preserved seepage pathways, leading to superior leaching rates—an insight that can inform blasting optimization. Furthermore, permeability evolution is distinctly stage-dependent, underscoring the need for adopting stage-specific irrigation strategies in engineering practice to enhance both leaching efficiency and system stability.
Despite these contributions, this study acknowledges certain limitations inherent to its laboratory scale and methodological constraints, pointing to two priority areas for future research:
(1) Multi-physics, cross-scale upscaling modeling
Current laboratory experiments cannot fully replicate the dynamic interplay of stress, temperature, and chemical concentration fields characteristic of field conditions. To address this, future work should develop multi-scale numerical models that integrate thermal-hydraulic-chemical (THC) coupling.
(2) Quantitative characterization of sub-resolution porosity
Limited by the 76 μm spatial resolution of the CT system employed, this study could not directly resolve pore features below this threshold (nano- to submicron scale). Subsequent investigations should employ complementary high-resolution techniques, such as nano-CT (<100 nm) and focused ion beam-scanning electron microscopy (FIB-SEM) 3D reconstruction, on representative subsamples.
Author Contributions
K.L.—software, data curation, investigation, Validation, writing—original draft; D.G.—conceptualization, formal analysis, funding acquisition, project administration, supervision, writing—review and editing; Z.X.—methodology, resources, supervision, writing—review and editing. All authors have read and agreed to the published version of the manuscript.
Funding
This research was funded by the National Natural Science Foundation of China [grant number: 52074124].
Data Availability Statement
The original contributions presented in this study are included in the article. Further inquiries can be directed to the corresponding author.
Conflicts of Interest
The authors declare no conflicts of interest.
Abbreviations
The following abbreviations are used in this manuscript:
| CT | Computed tomography |
| Cu | Coefficient of non-uniformity |
| DW | Dry weight |
References
- Karimian, Z.; Maleki, H.; Aslani, S.; Noaparast, M.; Rezaei, A. Implementation of a Comprehensive Flotation and Bioleaching Processes to Recover Copper from Low-Grade Ore Sample. JOM 2025, 77, 4579–4593. [Google Scholar] [CrossRef] [Scilit]
- Sahu, S.N.; Behera, P.; Sahoo, S.; Sushobhan, B.R. A Critical Review on the Magnetization Roasting of Low/Lean-Grade Iron Ore Resources Using Renewable/Non-Renewable Reductant: An Approach Towards Iron ore Sustainability. J. Sustain. Metall. 2025, 11, 160–185. [Google Scholar] [CrossRef] [Scilit]
- Lan, Z.Y.; Lai, Z.N.; Zheng, Y.X.; Lv, J.F.; Pang, J.; Ning, J.L. Recovery of Zn, Pb, Fe and Si from a low-grade mining ore by sulfidation roasting-beneficiation-leaching processes. J. Cent. South Univ. 2020, 27, 37–51. [Google Scholar] [CrossRef] [Scilit]
- Liu, Y.X.; He, Y.; Chen, J.L.; Cheng, N.; Wang, H. Progress on enhancing seepage-leaching mass-transfer research for in-situ leaching mining of low-permeability uranium-bearing sandstone: A review. J. Radioanal. Nucl. Chem. 2024, 333, 4485–4502. [Google Scholar] [CrossRef] [Scilit]
- Estay, H.; Diaz-Quezada, S.; Arancibia, E.; Vargas, T. Economic Assessment of an In Situ Leaching Operation with Ore Preconditioning Using Sublevel Stoping Techniques. Min. Metall. Explor. 2023, 40, 493–504. [Google Scholar] [CrossRef] [Scilit]
- Nkuna, R.; Ijoma, G.N.; Matambo, T.S.; Chimwani, N. Accessing Metals from Low-Grade Ores and the Environmental Impact Considerations: A Review of the Perspectives of Conventional versus Bioleaching Strategies. Minerals 2022, 12, 506. [Google Scholar] [CrossRef] [Scilit]
- Huang, W.; Chen, L.; Xie, Y.; Wang, Z.Q.; Wang, X.B. Test study of recycling remnant uranium ore resources by stope leaching technology. Adv. Mater. Res. 2012, 524, 765–768. [Google Scholar] [CrossRef] [Scilit]
- Huang, W.G.; Ouyang, M.; Huo, L.; Shu, C.X.; Yang, P. Effect of Acidic Solution on Mechanical Properties and Mesoscopic Structure of Hard Sandstone. Geotech. Geol. Eng. 2021, 39, 783–797. [Google Scholar] [CrossRef] [Scilit]
- Machaca, D.M.C.; Botelho, A.B., Jr.; Carvalho, T.C.; Tenorio, J.A.S.; Espinosa, D.C.R. Hydrometallurgical processing of chalcopyrite: A review of leaching techniques. Int. J. Miner. Metall. 2024, 31, 2537–2555. [Google Scholar] [CrossRef] [Scilit]
- Qin, X.J.; Cai, J.C.; Wang, G. Pore-scale modeling of pore structure properties and wettability effect on permeability of low-rank coal. Int. J. Min. Sci. Technol. 2023, 33, 573–584. [Google Scholar] [CrossRef] [Scilit]
- Zhang, X.M.; Gao, Z.Q.; Rao, Y.Z.; Shi, L.; Xu, W. Evolutionary Law of Pore Structure of Ion-Adsorbed Rare Earth Ore Leaching Process. Minerals 2023, 13, 322. [Google Scholar] [CrossRef] [Scilit]
- Annapareddy, V.S.R.; Sufian, A.; Bore, T.; Bajodek, M.; Scheuermann, A. Computation of local permeability in gap-graded granular soils. Geotech. Lett. 2022, 12, 68–73. [Google Scholar] [CrossRef] [Scilit]
- Qin, X.J.; Xia, Y.X.; Qiao, J.C.; Chen, J.H.; Zeng, J.H.; Cai, J.C. Modeling of multiphase flow in low permeability porous media: Effect of wettability and pore structure properties. J. Rock Mech. Geotech. Eng. 2024, 16, 1127–1139. [Google Scholar] [CrossRef] [Scilit]
- Karlsons, K.; Kort, D.W.; Alpak, F.O.; Dietderich, J.; Freeman, J.J.; Appel, M.; Mantle, M.D.; Sederman, A.J.; Gladden, L.F. Integrating Pore-Scale Flow MRI and X-ray μCT for Validation of Numerical Flow Simulations in Porous Sedimentary Rocks. Transp. Porous Media 2022, 143, 373–396. [Google Scholar] [CrossRef] [Scilit]
- Chen, Z.; Zhu, C.Y.; Yu, B.; Gong, L. Pore-scale study on the permeability characteristics of fractured rock under hydraulic-chemical coupling. Comput. Geosci. 2024, 28, 967–978. [Google Scholar] [CrossRef] [Scilit]
- Guzman, A.; Korsikas, S.S.; Olson, T.; Zepeda, P.Y.O.Z. Agglomeration Scale: A Method to Improve Leaching Performance. Min. Metall. Explor. 2024, 41, 501–514. [Google Scholar] [CrossRef] [Scilit]
- Deng, H.; Poonoosamy, J. Mineral precipitation in porous media systems: Controlling factors and impacts on porous media evolution. Adv. Colloid Interface 2025, 348, 103745. [Google Scholar] [CrossRef] [Scilit]
- Avila, M.; Navarro, P.; Vargas, C.; Varava, P.; Castillo, J.; Duran, C. Effect of a pre-treatment with hydrochloric acid on the copper solubilization of a bornite concentrate with posterior leaching in chloride medium. DYNA 2022, 89, 97–106. [Google Scholar] [CrossRef] [Scilit]
- Zhu, B.Y.; Tang, H.M.; Wu, Y.X.; Chen, G.Y.; Zhao, F. Granular LCM migration and plugging behavior in shear-slip fractures. Part. Sci. Technol. 2023, 41, 876–895. [Google Scholar] [CrossRef] [Scilit]
- Yan, X.P.; Kang, Y.L.; Xu, C.Y.; Xu, F.; Shang, X.Y.; Bai, Y.R.; Jing, H.R. Impact of friction coefficient on the mesoscale structure evolution under shearing of granular plugging zone. Powder Technol. 2021, 394, 133–148. [Google Scholar] [CrossRef] [Scilit]
- Top, S.; Kursunoglu, S.; Ichlas, Z.T. Effects of leaching parameters on the dissolution of nickel, cobalt, manganese and iron from Caldag lateritic nickel ore in hydrochloric acid solution. Can. Metall. Q. 2020, 59, 368–376. [Google Scholar] [CrossRef] [Scilit]
- Faraji, F.; Alizadeh, A.; Rashchi, F.; Mostoufi, N. Kinetics of leaching: A review. Rev. Chem. Eng. 2022, 38, 113–148. [Google Scholar] [CrossRef] [Scilit]
- Prasetya, A.; Putera, A.D.P.; Sujoto, V.S.H.; Zaidan, M.H.; Abdurrahman, M.T.; Andriani, A.; Astuti, W. Enhanced Recovery of Nickel and Cobalt from Limonitic Laterite Ore: Optimization and Kinetics of Atmospheric Sulfuric Acid Leaching. J. Sustain. Metall. 2025, 11, 4127–4140. [Google Scholar] [CrossRef] [Scilit]
- Yan, H.S.; Liang, T.M.; Liu, Q.S.; Qiu, T.S.; Ai, G.H. Compound leaching behavior and regularity of ionic rare earth ore. Poeder Technol. 2018, 333, 106–114. [Google Scholar] [CrossRef] [Scilit]
- Luo, G.J.; Zhang, C.F.; Zhang, X.X.; Wang, W.J.; Chen, M.F.; Jia, M.T. Simulation of multiple parameter effects on efficiency of uranium ore acid leaching. Ann. N. Y. Acad. Sci. 2025, 1549, 332–342. [Google Scholar] [CrossRef] [Scilit] [PubMed]
- Ilankoon, I.M.S.K.; Neethling, S.J. Liquid spread mechanisms in packed beds and heaps. The separation of length and time scales due to particle porosity. Miner. Eng. 2016, 86, 130–139. [Google Scholar] [CrossRef] [Scilit]
- Prasomsri, J.; Takahashi, A. Experimental study on suffusion under multiple seepages and its impact on undrained mechanical responses of gap-graded soil. Soils Found. 2021, 61, 1660–1680. [Google Scholar] [CrossRef] [Scilit]
- Song, J.Y.; Sun, B.; Zeng, S.; Li, D.; Cai, Q.E.; Zhang, X.; Chen, X.G. Seepage starting pressure gradient of leaching solution under microscopic pore structure evolution of uranium-bearing sandstone by acid in situ leaching. Phys. Fluids 2025, 37, 063102. [Google Scholar] [CrossRef] [Scilit]
- Liu, D.F.; Yan, W.X.; Zhang, Z.Y.; Chi, R. Effect of particle gradation on pore structure and seepage law of solution in weathered crust elution-deposited rare earth ores. Int. J. Min. Sci. Technol. 2023, 33, 1261–1272. [Google Scholar] [CrossRef] [Scilit]
- Loizeau, S.; Rossier, Y.; Gaudet, J.P.; Refloch, A.; Besnard, K.; Angulo-Jaramillo, R.; Lassabatere, L. Water infiltration in an aquifer recharge basin affected by temperature and air entrapment. J. Hydrol. Hydromech. 2017, 65, 222–233. [Google Scholar] [CrossRef] [Scilit]
- Ghadiri, M.; Harrison, S.T.L.; Fagan-Endres, M.A. Quantitative X-ray μCT Measurement of the Effect of Ore Characteristics on Non-Surface Mineral Grain Leaching. Minerals 2020, 10, 746. [Google Scholar] [CrossRef] [Scilit]
- Fagan-Endres, M.A.; Cilliers, J.J.; Sederman, A.J.; Harrison, S.T.L. Spatial variations in leaching of a low-grade, low-porosity chalcopyrite ore identified using X-ray μCT. Miner. Eng. 2017, 105, 63–68. [Google Scholar] [CrossRef] [Scilit]
- He, G.C.; Zhang, S.P.; Fu, H.Y.; Cui, J.X.; Zhang, H. Experimental investigate on the evolution of porosity structure in uranium-bearing sandstone cores within CO2 +O2 in-situ leaching uranium mining. J. Min. Saf. Eng. 2024, 41, 179–189. [Google Scholar]
- Xie, C.X.; Chi, P.; Xiao, R.; Chu, Z.X.; Li, X.Z. Representative elementary volume determination and heat conduction simulation for porous geomaterials based on CT images. J. Min. Sci. Technol. 2025, 10, 236–247. [Google Scholar]

Disclaimer/Publisher’s Note: The statements, opinions and data contained in all publications are solely those of the individual author(s) and contributor(s) and not of MDPI and/or the editor(s). MDPI and/or the editor(s) disclaim responsibility for any injury to people or property resulting from any ideas, methods, instructions or products referred to in the content. |
© 2026 by the authors. Licensee MDPI, Basel, Switzerland. This article is an open access article distributed under the terms and conditions of the Creative Commons Attribution (CC BY) license.