


Abstract
In this study, compared with traditional scaffolds, the arrangement and structural dimensions of steel tubular crossing frames used in transmission engineering are significantly different, making it difficult to efficiently and accurately evaluate their structural stability using existing specifications and conventional methods. Therefore, a finite element model of a steel tubular crossing frame considering the semi-rigid characteristics of joints was established, and the influence of frame parameters on structural stability and the effective length factor (μ) of the vertical members was analyzed. On this basis, the main factors affecting the effective length factor μ were identified using orthogonal testing and multiple linear regression, and a predictive formula was obtained through curve fitting. The results show that the step distance and number of steps of the horizontal members are the primary factors influencing the bearing capacity and μ value of the crossing frame, followed by the spacing of vertical members, the number of spans, and the number of rows. The height of the bottom sweeping member has a weak influence within the range of 0.1–0.6 m but becomes significantly more influential when it exceeds 0.7 m. The installation of peripheral cross bracing increases the bearing capacity of the crossing frame by at least 20%. The accuracy of the proposed formula was verified by comparing the stresses of the vertical members calculated using the formula, the specifications JGJ130-2019 and BS5975-2019, and the finite element analysis results. The findings provide a useful reference for the stability assessment and erection scheme design of steel tubular crossing frames in transmission engineering.
1. Introduction
With the gradual progress of a number of ultra-high-voltage projects, the situation of conductors crossing existing lines and high-speed railways has also increased dramatically [1,2,3]. According to statistics, on the Beijing–Shanghai high-speed rail line, overhead transmission lines cross the railway at least 421 times [4]. In order to avoid huge economic losses and serious social impact caused by wire breakage or running, it is necessary to build a crossing frame to protect existing lines and high-speed railways.
The steel tube crossing frame is often set in an open area, and it may bear the impact load caused by the disconnection of the ground wire in the construction of the line. Therefore, the stability check of the pole is very important to ensure the safety of the frame. However, at present, the erection of a steel tube crossing frame mostly depends on construction experience, and its vertical rod spacing and row spacing often exceed the standard reference range, which makes it difficult for construction personnel to determine the calculated length coefficient μ, and then the stress of vertical rod cannot be accurately calculated. Therefore, combined with the structural characteristics of the steel tube crossing frame, this study systematically analyzes the influence of various factors on its bearing performance, aiming at proposing an accurate method for calculating the length coefficient, providing a key mechanical basis for the formulation of the construction plan so as to improve the safety and reliability of crossing construction. The research results have important theoretical significance and engineering application value.
Zeng Fankui et al. [5] studied the semi-rigid characteristics of joints through a field bending test of the disc-type steel tube support. Through an analysis of the bending moment–rotation curve obtained from the test, the accurate initial bending stiffness value and the calculation model of the semi-rigid joint are established, and the effective correction coefficient μ of the effective length under different erection parameters considering the semi-rigidity of the joint is determined. Wang Qinglin et al. [6] established a theoretical model of lateral displacement for semi-rigid frame joints by using the slope-deflection method, and verified the bending, axial and shear deformation of beam–column joints through finite element analysis. Al-Sadoon, Zaid A. et al. [7] studied the axial buckling behavior of spiral steel tubular columns. The results show that the buckling strength increases significantly when the insertion length exceeds 1/3 of the total length, and the effective length factor equation is established, which can be seamlessly integrated into the Euler buckling equation, thus promoting the determination of the buckling capacity of the enhanced propeller. Dong Jinfeng et al. [8] studied the stability of the disc formwork support structure and carried out a multi-parameter experimental analysis on the disc formwork support structure by means of experiment and finite element analysis. The results show that the error of the stability bearing capacity of the two structures is within 6%, and the finite element can accurately simulate the stability bearing capacity of the structure. Ma ‘en Abdel-Jaber et al. [9] studied the effect of lateral cyclic loading on the performance of scaffolding. The results show that the periodic load will significantly change the structural response, especially when the bearing is not fixed, it is recommended that the relevant specifications include the dynamic load to improve safety. Huang Hua et al. [10] studied the influence of various uncertain factors on the ultimate bearing capacity of the support frame. The results show that the wedge tightness of the joint has the greatest influence, followed by the connecting wall components at the bottom and top. Li Rui et al. [11] studied the buckling behavior of a scaffold independent support system considering semi-rigid joints and proposed a numerical simulation method to analyze the buckling behavior and determine the effective length factor of the scaffold. The results show that the initial imperfection has no significant effect on the effective length factor. LIU.H et al. [12,13] studied the horizontal bearing capacity of the disc–buckle support under horizontal load and carried out the disc–buckle joint test, full-scale scaffold specimen test, finite element analysis and theoretical research. The results show that the anchor, tie and cross brace are very important to improve the lateral stiffness of the scaffold and limit the lateral deformation of the scaffold. Zhu, Mingliang et al. [14] evaluated the mechanical properties of a Q620M high-strength steel tube disc lock scaffold through experiments and VFIFE numerical simulation. The results show that the initial stiffness of HSTDS is higher, and the bearing capacity can be significantly improved through layout optimization. The semi-rigid joint model has accurate prediction and no convergence problem.
From the current research status, most studies focus on the mechanical properties of traditional scaffolding. There are few studies on the influence of different factors on the effective length factor μ and the value of the effective length factor μ of the steel tube crossing frame for transmission engineering. This leads to the construction personnel having no reasonable basis to determine the effective length factor μ of the pole. In order to realize an accurate control of the safety of the construction process of steel tube crossing frames used in the transmission project and formulate a perfect construction plan, it is necessary to study the mechanical characteristics of the steel tube crossing frame, determine the main factors affecting the effective length factor μ, and propose a scientific and reasonable calculation method for the effective length factor μ of the crossing frame to determine whether the stress of the pole meets the requirements and avoid instability and overturning accidents for the steel tube crossing frame.
In this paper, the steel tube crossing frame for transmission engineering is taken as the research object. Firstly, using ANSYS 2022R2 finite element software, a steel tube crossing frame model for transmission engineering considering semi-rigid joints is established. Then, the nonlinear buckling analysis of the finite element model is carried out. The bearing capacity and instability mode calculated using the finite element method are compared with the experiment to verify the accuracy of the finite element model. The factors that have a significant influence on the effective length factor μ are screened through mechanical property analysis and orthogonal testing. Finally, the calculation formula is fitted through multiple linear regression and compared with other methods to verify the validity and accuracy of the formula.
The structure of this paper is as follows: Section 2, “Nonlinear Buckling Analysis Theory of Steel Tube Crossing Frame”, describes the nonlinear buckling analysis theory of a steel tube crossing frame. In Section 3, “Finite Element Model of Steel Tube Crossing Frame”, the finite element model of the steel tube spanning frame considering semi-rigid joints is established, and the accuracy of the finite element model is verified by comparing the finite element results with the existing experimental results. In Section 4, “The Influence of the Structure Form on the Bearing Performance of the Crossing Frame”, the influence of the span spacing, the number of spans, the height of the sweeping bar and the scissors brace on the bearing capacity of the spanning frame and the effective length factor μ of the vertical bar is analyzed. In Section 5, “Calculating the Value of Effective Length Factor μ”, the orthogonal experimental design was used to screen out the factors that have a significant influence on the effective length factor μ of the opposite rod, and the calculation formula was fitted using multiple linear regression. According to the actual case, the vertical rod stress calculated according to the fitting formula, the Chinese specification , and the British specification are compared with the finite element analysis results to verify the accuracy of the fitting formula.
2. Nonlinear Buckling Analysis Theory of Steel Tube Crossing Frame
Although the linear buckling analysis is simple to calculate, it is only applicable to the ideal linear elastic structure. In order to accurately evaluate the actual bearing capacity of the crossing frame, a nonlinear buckling analysis of the crossing frame is carried out by considering the influence of initial defects, geometric nonlinearity and material nonlinearity [15,16,17].
The equilibrium equation of the crossing frame structure can be written as
where represents the total tangent stiffness matrix of the structure, ; , , and represent the linear stiffness matrix, large deformation matrix and total stress matrix of the structure, respectively; and δ and P represent the total displacement array and the total load array.
To solve Equation (1), it is rewritten in an incremental form:
3. Finite Element Model of Steel Tube Crossing Frame
3.1. Crossing Frame Structure Form
In this paper, a typical six-span ten-step four-row frame, with a sweeping pole height of 0.5 m across the frame, is used as an example; ANSYS is used to establish its geometric model. The composition of the crossing frame and the spacing of the components are shown in Figure 1. Its main components include a vertical bar, large cross bar, small cross bar, scissors, and so on.
Figure 1.
Steel tube crossing frame structure.
3.2. Material Parameters
The steel tube steel in the model is Q235 steel (manufactured in Anhui, China), and the material parameters of the steel tube are shown in Table 1 [18,19,20].
Table 1.
Material parameters of steel tube.
It is assumed that the material property of the steel tube is an ideal elastic–plastic material, and the stress–strain curve is shown in Figure 2.
Figure 2.
Stress–strain relationship curve.
In the nonlinear buckling analysis, the effect of plasticity is to determine the buckling behavior and the actual ultimate bearing capacity of the structure after entering the yield. If only the geometric nonlinearity is considered, the buckling behavior of the ideal elastic structure is obtained. Considering plasticity at the same time, the post-buckling strength and failure mode after material yield can be revealed. When the stress in the structure exceeds the yield point of the material, the stiffness will decrease significantly. This stiffness degradation will cause buckling failure of the structure under loads far below the theoretical value of elastic buckling. Therefore, plasticity is the key factor for determining the true ultimate bearing capacity of the structure. Ignoring plasticity will seriously overestimate the bearing capacity of the structure, resulting in unsafe design.
3.3. Model Establishment
3.3.1. Unit Selection
When establishing the ANSYS model, the steel tube members are all CTUBE annular section types, and the section size of the steel tube is shown in Figure 3. Because the shear deformation and bending deformation are considered at the same time, and the length of the steel tube is much larger than the section of the steel tube, the Beam188 element is used to simulate the steel tube member.
Figure 3.
Section drawing of steel tube.
3.3.2. Semi-Rigid Joints
Right angle fasteners are used between the vertical and horizontal bars and the vertical bars of the steel tube crossing frame. Rectangular fasteners have a certain bending stiffness and can withstand and transmit bending moments. Therefore, this paper uses the spring element to create a semi-rigid node to simulate the right-angle fastener of the crossing frame. In order to improve the modeling efficiency of multi-node spanning frames, the parametric modeling method of semi-rigid nodes is realized by using macro files, and the semi-rigid nodes at the connection of components can be established and assigned in batches. The semi-rigid joint model is shown in Figure 4. By establishing three spring elements, COMBIN14, the rotation characteristics of the nodes in the X, Y and Z directions are simulated, respectively. In this model, each beam can be regarded as having a zero-length rotating spring at both ends. Referring to the relevant literature, the rotational stiffness at the joint is set to 15.17 kN·m/rad [21,22,23].
Figure 4.
Simulation diagram of semi-rigid joints.
In order to consider the semi-rigid influence of the joint connection, the stiffness matrix of the joint needs to be modified to establish the corresponding semi-rigid stiffness matrix. The local coordinate system of the element is shown in Figure 5 [24,25,26].
Figure 5.
Beam element node displacement and force diagram.
The element node displacement vector is
The force vector of the unit node is
where , and represent the displacement of the i node in the coordinate system; represents the torsional angular displacement of the i node; and represent the angular displacements of the i node in the xz and xy planes, respectively; represents the axial force of the i node; and represent the shear force of the i node in the xy and xz planes; represents the torque of the i node; and and represent the bending moments of the i node in the xz and xy planes. The symbol meaning of the j node is the same as that of the i node.
The spring is used to consider the influence of the semi-steelness of the joint on the stiffness of the beam element. The initial stiffness of the spring is and (μ = x, y, z); the modified equilibrium equation is
Let
where
Then, the equilibrium equation can be simplified as
where E represents the elastic modulus; G represents the torsion modulus; and I represents the moment of inertia of the cross-section.
The modified stiffness matrix of the semi-rigid beam element is
where
3.3.3. Meshing and Boundary Conditions
In this paper, the LMESH command is used for meshing. Considering the impact load on the top of the cross frame, the stress concentration of the cross bar and the vertical bar at the top of the cross frame, the meshing is more detailed, and the mesh size is set to 10 mm. The stress distribution of the remaining bars is relatively simple, and the mesh size is set to 20 mm. The boundary conditions of the model are set to be hinged at the bottom of the pole and the ground. The impact load of the conductor is applied to the top of the crossing frame in the form of a concentrated load.
3.4. Verification of Mechanical Model
The steel pipe span frame used in the transmission project is larger than the traditional scaffold, and the collapse risk is higher than that of the traditional scaffold because it is usually on both sides of the railway and highway and cannot be arranged with connecting rods. But, considering that the steel tube crossing frame and the scaffold have similar mechanical properties, this paper compares the experimental results of the ST6 test scaffold in Reference [21] with the calculation results of the established finite element model to verify the accuracy of the model. The ST6 test scaffold is 8.05 m high, 4.5 m long and 4.5 m wide. The height of the sweeping rod from the ground is 0.3 m, the step distance of the crossbar is 1.55 m, the longitudinal distance of the vertical bar is 0.9 m, and the row distance is 0.9 m. The steel tube specification is φ48.3 × 3; the vertical scissors braces are arranged around the frame body; the elastic modulus of the steel tube is 225 GPa; and the yield strength is 360 MPa. The test value of the rotational stiffness of the joint is 22.58 kN·m/rad.
The finite element model of the ST6 test scaffold is established using ANSYS finite element software. The process of establishing the model is as follows: (1) The nodes of horizontal bar, vertical bar and scissor support are established, respectively, and the vertical bar, long transverse bar, short transverse bar and oblique support are simulated by the Beam188 element. (2) The spring element Combin14 is used to simulate the semi-rigid node of the scaffold, and the rotational stiffness of the node at the intersection of the vertical bar and the long transverse bar is 22.58 kN·m/rad in the direction of rotation around the short transverse bar and 1 × 10⁻³ kN·m/rad in the other two directions. The rotational stiffness of the node at the intersection of the vertical bar and the short transverse bar is 22.58 kN·m/rad in the direction of rotation around the long transverse bar and 1 × 10⁻³ kN·m /rad in the other two directions. The scissor support is only connected to the pole. (3) At the intersection of the scissor brace and the vertical bar, the translational degrees of freedom of the joints of the scissor brace and the vertical bar are coupled to simulate the constraint effect of the rotating fastener. (4) The bottom of the scaffold pole is set to hinge. (5) The first-order mode of the linear buckling analysis is used as the initial defect in the nonlinear buckling analysis. At the same time, the large deformation option is turned on to consider the geometric large deformation effect of the structure and calculate the bearing capacity of the scaffold. The load–displacement curve and instability mode of the test scaffold are shown in Figure 6.
Figure 6.
Nonlinear buckling analysis. (a) Load–displacement curve. (b) Instability mode.
It can be seen from Figure 6a that the instability and failure process of the finite ele-ment model is realized so that the load increases linearly with the displacement at the ini-tial stage of loading. When a certain load value is reached, that is, the bearing capacity, the load–displacement curve appears as a platform segment. At this time, a small increase in load causes a sharp increase in displacement, and the structure is destabilized. The cal-culated bearing capacity of the frame is about 1026 kN, and the average bearing capacity is Ft = 28.5 kN. The average bearing capacity of the ST6 test scaffold in Reference [21] is Ft = 27.2 kN, and the deviation between the two is 4.78%.
As shown in Figure 6b, the instability mode presented by the finite element model shows the lateral bending of the top two layers of the pole. This feature is consistent with the experimental phenomenon found by Liu HB et al. in Reference [21]. During the loading process, the frame body has significant bending deformation to the east side of the pole, and the deformation is concentrated on the top two layers, which eventually leads to the overall instability. The two are consistent in the instability mode. This verifies the accuracy of the finite element model established in this paper.
4. The Influence of the Structure Form on the Bearing Performance of the Crossing Frame
According to the Code of safety operation in power engineering construction [27], the spacing of each member of the steel tube spanning frame should not be greater than the provisions in Table 2.
Table 2.
Spacing of steel tube crossing frame.
4.1. Effective Length Factor
In practical engineering, because it is difficult for construction personnel to directly use the finite element modeling method to check the stability of the vertical rod of the spanning frame, the effective length factor μ of the rod is usually determined according to the structural layout of the frame, and then the slenderness ratio is calculated. The stability coefficient of the corresponding axial compression member is determined using the slenderness ratio, and the stability of the vertical rod of the frame is finally checked. Therefore, the accurate value of the effective length factor μ is of great significance to ensure construction safety. In order to study the influence of different factors on the effective length factor μ, this paper calculates the effective length factor μ through the bearing capacity N of the frame. The bearing capacity of the crossing frame can be calculated as follows:
where N represents the bearing capacity of the crossing frame; A represents the cross-sectional area of the vertical bar; f represents the design value of the compressive strength of the steel, and its value is 235 N/mm2; and φ represents the stability coefficient of the axial compression member.
The stability coefficient of the axial compression member can be determined using Equation (10), , and the corresponding slenderness ratio can be found according to the value table. The slenderness ratio can be calculated as follows:
where represents the slenderness ratio; represents effective length; i represents the radius of gyration of the section, and its value is 15.9 mm; μ represents the effective length factor; and represents the crossbar step distance.
The calculated length can be determined using Equation (11), .
4.2. The Influence of Spacing on the Bearing Performance of the Crossing Frame
This section analyzes the influence of the vertical bar spacing, the horizontal bar step spacing and the row spacing on the bearing performance of the steel tube crossing frame. Therefore, the three spacings of the crossing frame are changed while other conditions remain unchanged. In order to analyze the possible working conditions of the steel tube crossing frame, based on the conventional spacing values in Table 2, the vertical rod longitudinal distance = 1, 1.2, 1.4, 1.6, 1.8, 2 m, the horizontal rod step distance = 0.8, 1.0, 1.2, 1.4, 1.6 m, the row spacing = 2.2, 2.4, 2.6, 2.8, 3 m, the nonlinear buckling analysis method is used to calculate the bearing capacity N of the frame under different working conditions, and then the corresponding effective length coefficient μ is inversely calculated. Figure 7 shows the relationship between the bearing capacity and the effective length coefficient μ of the crossing frame under different spacings with the longitudinal distance, step distance and row spacing.
Figure 7.
The relationship surface of the bearing capacity and effective length coefficient with , , and . (a) The relationship surface of the stable bearing capacity with , , and . (b) The relationship surface of the calculation coefficient μ with , , and .
The six surfaces from top to bottom in Figure 7a correspond to the calculation results when is 1, 1.2, 1.4, 1.6, 1.8 and 2 m, respectively. It can be seen from Figure 7a that the bearing capacity of the steel tube crossing frame gradually increases with the decrease in the spacing, and the longitudinal distance of the vertical bar has little effect on the bearing capacity. Among them, the bearing capacity of the step distance decreases from 0.8 m to 1.6 m with the step distance of the crossbar, and the average reduction is about 26.98%. With the increase in the row spacing from 2.2 m to 3 m, the bearing capacity decreases by about 10.1% on average. It can be seen from the diagram that the six sides are relatively close, the spacing of the uprights increases from 1.0 m to 2.0 m, and the bearing capacity changes by only about 1.9%. The six surfaces from top to bottom in Figure 7b correspond to the calculation results of the effective length coefficient when is 2, 1.8, 1.6, 1.4, 1.2 and 1 m, respectively. The effective length coefficient μ increases with the increase in the row spacing and decreases with the increase in the crossbar step distance, As the crossbar step increases from 0.8 m to 1.6 m, the effective length coefficient decreases by about 43.7% on average, as the row spacing increases from 2.2 m to 3 m, the effective length factor increases by about 7.2% on average; the influence of the crossbar step distance on the calculation coefficient is much larger than that of the row spacing. It can be seen from Figure 7b that the six surfaces are very close. With the change in the rod distance, the effective length factor only changes by about 1.0% on average, indicating that the effective length coefficient μ is almost not affected by the longitudinal distance of the vertical bar when the step distance of the horizontal bar and the row spacing are fixed. In this paper, the change trend of the effective length factor μ with the change in the step distance and rod distance is the same as that of the u value in the literature [11]. The u value decreases greatly with the increase in the step distance of the horizontal bar, and the u value decreases with the increase in the vertical bar, but the decrease is small.
The instability modes of the crossing frames with different rod spacing are shown in Figure 8.
Figure 8.
The instability modes of crossing frames with different rod spacings. (a) The instability mode of the crossing frame when the rod spacing is 1 m. (b) The instability mode of the crossing frame when the rod spacing is 1.5 m. (c) The instability mode of the crossing frame when the rod spacing is 2 m.
As shown in Figure 8, when the rod spacing is 1 m, 1.5 m and 2 m, respectively, the instability mode of the crossing frame is such that the vertical rod mainly buckles along the Z-axis direction. It can be seen from Figure 8a–c that, with the increase in the rod spacing, the failure mode of the crossing frame does not change fundamentally, which is manifested as the waveform buckling of the vertical bar, and the lateral displacement of the vertical bar changes little. The shear braces around it can effectively provide lateral constraints, thereby reducing the influence of the spacing of the vertical rods on the bearing capacity of the spanning frame. Therefore, in the range of parameter analysis in this study, the influence of bar spacing on the overall ultimate bearing capacity is relatively small.
The instability modes of the crossing frame with different step distances are shown in Figure 9.
Figure 9.
The instability modes of crossing frames with different step distance. (a) The instability mode of the crossing frame when the step distance is 0.8 m. (b) The instability mode of the crossing frame when the step distance is 1.2 m. (c) The instability mode of the crossing frame when the step distance is 1.6 m.
As shown in Figure 9, when the span is 0.8 m, 1.2 m and 1.6 m, the instability modes of the crossing frame are shown in Figure 9a, Figure 9b and Figure 9c, respectively. With the increase in span, the failure mode of the crossing frame has changed fundamentally. The original wave buckling of the bar is gradually transformed into the overall overturning caused by the toppling of the bottom column. This is because, with the gradual increase in the step distance of the cross bar, the constraint effect of the opposite bar is gradually weakened, resulting in the gradual decrease in the bearing capacity of the crossing frame.
The instability modes of the crossing frame with different row spacing are shown in Figure 10.
Figure 10.
The instability modes of crossing frames with different row spacing. (a) The instability mode of the crossing frame when the row spacing is 2.2 m. (b) The instability mode of the crossing frame when the row spacing is 2.6 m. (c) The instability mode of the crossing frame when the row spacing is 3 m.
Figure 10 shows the instability mode of the crossing frame when the row spacing is 2.2 m, 2.6 m and 3 m. As shown in Figure 10a–c, the change in the row spacing does not change the instability mode of the crossing frame. The instability modes of the three working conditions are all the waveform buckling of the vertical bar, but, with the increase in the spacing, the lateral displacement of the vertical bar increases to a certain extent, and the bearing capacity decreases with the row spacing. This is because, as the row spacing increases, the load area shared by a single vertical rod increases, but the moment of inertia of the overall cross-section composed of multiple rows of vertical rods also increases, which makes the bending stiffness of the entire frame increase, causing the row spacing to have little effect on the bearing capacity of the frame.
4.3. The Influence of the Number of Spans on the Bearing Performance of the Crossing Frame
This section mainly analyzes the influence of the number of vertical rod spans, the number of transverse rod steps and the number of rows on the bearing performance of the steel tube crossing frame so as to keep other conditions unchanged and change the number of various spans of the crossing frame. The various spacings of the crossing frames are valued according to Table 2. The corresponding parameter ratio of the crossing frame under different working conditions is set as shown in Table 3. The red numbers in the table indicate the variation ranges of the three parameters.
Table 3.
Parameters corresponding to structural form analysis conditions.
The nonlinear buckling analysis of the steel tube crossing frame under different working conditions is carried out, and the bearing capacity under different working conditions is obtained. The influence of different structural forms on the bearing capacity and effective length factor of the crossing frame is shown in Figure 11.
Figure 11.
The influence of the number of vertical rod spans, the number of transverse rod steps and the number of rows on the bearing capacity and the effective length factor. (a) The influence of the number of vertical rod spans on the bearing capacity and the effective length factor. (b) The influence of the number of transverse rod steps on the bearing capacity and the effective length factor. (c) The influence of the number of rows on the bearing capacity and the effective length factor.
Figure 11 shows the influence of the number of vertical bars, the number of horizontal bars and the number of rows on the bearing capacity and effective length coefficient of the crossing frame when other conditions remain unchanged. It can be seen from Figure 11 that the bearing capacity of the cross frame decreases linearly by about 2.4% with the increase in the number of spans of the vertical rod and increases linearly by about 4.3% with the increase in the number of rows. The change trend of the effective length coefficient is opposite to the bearing capacity. The bearing capacity and the number of steps of the crossbar show a strong nonlinear negative correlation. With the increase in the number of transverse rod steps, the height of the frame increases gradually, and the bearing capacity decreases by about 11%. The effective length coefficient μ increases linearly with the increase in steps, and its variation range is larger than the other parameters. As the number of transverse rod steps increases from 8 to 16, the effective length coefficient increases by about 9.3%. The number of spans of the vertical rod changes from 4 to 8, and the effective length coefficient only increases by 1.4%. The number of rows changed from two rows to six rows, and the effective length factor only changed by 2.4%. Therefore, it can be considered that the effective length coefficient μ is almost not affected by the number of spans and rows of uprights under other conditions.
The instability modes of the crossing frames with different numbers of vertical rod spans are shown in Figure 12.
Figure 12.
The instability modes of the crossing frames with different numbers of vertical rod spans. (a) The instability mode of the crossing frame when the number of vertical rod spans is four spans. (b) The instability mode of the crossing frame when the number of vertical rod spans is six spans. (c) The instability mode of the crossing frame when the number of vertical rod spans is eight spans.
Figure 12a, Figure 12b and Figure 12c are the instability modes when the number of vertical rod spans across the erecting rod is 4, 6 and 8, respectively. These three instability forms all show the waveform buckling of some vertical members, and the waveform characteristics are similar, indicating that the instability is localized and independent of the number of spans. Increasing the number of spans will only expand the number of components in the non-instability region but cannot change the critical bearing capacity. Therefore, the number of vertical rod spans has little effect on the bearing capacity of the crossing frame.
The instability modes of the crossing frames with different numbers of transverse rod steps are shown in Figure 13.
Figure 13.
The instability modes of the crossing frames with different numbers of transverse rod steps. (a) The instability mode of the crossing frame when the number of transverse rod steps is 8 steps. (b) The instability mode of the crossing frame when the number of transverse rod steps is 12 steps. (c) The instability mode of the crossing frame when the number of transverse rod steps is 16 steps.
Figure 13a, Figure 13b, and Figure 13c show the instability modes of the crossing frame when the number of transverse rod steps is 8, 12, and 16, respectively. It can be seen from the figure that, as the number of steps gradually increases, the horizontal displacement at the top of the frame gradually increases, which leads to the aggravation of the P− Δ effect and a decrease in the bearing capacity of the frame. This is because, with the increase in the number of steps of the crossbar, the weight of the frame body that the vertical bar needs to bear gradually increases; the fastener is a semi-rigid connection node, and the increase in the number of steps of the crossbar leads to a gradual increase in the number of nodes, resulting in a more significant horizontal displacement at the top of the frame.
The instability modes of the crossing frames with different numbers of rows are shown in Figure 14.
Figure 14.
The instability modes of the crossing frames with different numbers of rows. (a) The instability mode of the crossing frame when the number of rows is three rows. (b) The instability mode of the crossing frame when the number of rows is four rows. (c) The instability mode of the crossing frame when the number of rows is five rows.
In Figure 14a, Figure 14b and Figure 14c, the instability modes of the crossing frame with three rows, four rows and five rows are shown, respectively. It can be seen from the figure that, with the gradual increase in the number of rows, the instability mode of the frame does not change, and the horizontal displacement at the top of the frame does not change significantly, indicating that the change in the number of rows has little effect on the bearing capacity of the frame.
4.4. The Influence of the Height of the Sweeping Rod on the Bearing Performance of the Crossing Frame
The sweeping rod is the horizontal bar closest to the foundation in the crossing frame structure. Its core role is to restrain the lateral displacement at the bottom of the vertical rod and effectively connect the roots of the vertical rod into a whole, thus significantly enhancing the overall stability of the structure. In the Code of safety operation in power engineering construction and other specifications, the setting of the sweeping rod usually requires that the height from the ground is not more than 300 mm. However, in practical engineering, due to uneven terrain, site obstacles and other reasons, the actual height of the sweeping rod is too large. This section mainly analyzes the influence of the height of the sweeping rod on the bearing performance. The height of the sweeping rod is set to 0.1~1.2 m, and the interval is 0.1 m. The influence of different sweeping rod heights on the bearing capacity and effective length factor of the crossing frame is shown in Figure 15.
Figure 15.
The influence of the height of the sweeping rod on the bearing capacity and the effective length factor.
It can be seen from Figure 15 that an increase in the height of the sweeping rod will lead to a decrease in the overall bearing capacity of the structure and an increase in the effective length factor μ. The height of the sweeping rod is in the range of 0.1 m~0.4 m, and the bearing capacity decreases slowly, with a decrease of about 1%. When the height is 0.4 m~0.6 m, the bearing capacity decreases faster; when the height exceeds 0.7 m, its decline is up to 10%. The change trend of the effective length factor is opposite to the bearing capacity. When the height of the sweeping rod is 0 m~0.6 m, the effective length factor rises slowly, and the rising speed is within 2%. When the height of the sweeping rod reaches 0.7 m, the rising speed of the effective length factor reaches 5%.
The instability modes of the crossing frame with four different sweeping rod heights are shown in Figure 16.
Figure 16.
The instability mode of the crossing frame under different heights of sweeping rods. (a) The instability mode of the crossing frame when the height of the sweeping rod is 0.1 m. (b) The instability mode of the crossing frame when the height of the sweeping rod is 0.4 m. (c) The instability mode of the crossing frame when the height of the sweeping rod is 0.6 m. (d) The instability mode of the crossing frame when the height of the sweeping rod is 1.2 m.
The sweeping rod is the first constraint at the bottom of the pole, and the change in its height will change the constraint condition, which will lead to different instability modes. It can be seen from Figure 16 that, when the height of the sweeping rod is between 0.1 m and 0.6 m, the rotation and lateral displacement of the bottom of the upright rod are effectively limited because the sweeping rod is closer to the ground. From Figure 16a,b, it can be seen that the deformation of the crossing frame occurs in the middle and upper parts of the frame body, and, with the increase in the height of the sweeping rod, the deformation of the upper part of the crossing frame decreases, the bottom upright rod bends, and the bearing capacity of the crossing frame decreases. When the height of the sweeping rod is 0.6 m, it can be seen from Figure 16c that the deformation of the crossing frame mainly occurs in the middle and lower part of the frame body, and the bending of the bottom of the crossing frame is more obvious than that of the sweeping rod with a height of 0.4 m; when the height of the sweeping rod is 1.2 m, it can be seen from Figure 16d that, because the height of the sweeping rod is too high, the bottom of the pole lacks an effective lateral fulcrum in a long range. At this time, the bottom section can hardly restrain the pole, and the pole at the bottom of the crossing frame is overturned, which leads to the overturning of the whole crossing frame, greatly reducing the bearing capacity of the crossing frame.
4.5. The Influence of Scissors on the Bearing Performance of the Crossing Frame
For the steel tube crossing frame, in order to strengthen the overall strength of the frame body, the surrounding scissor brace should be set up, and it must be connected with the vertical rod. In this section, in order to study the influence of scissor bracing on the performance of the steel tube crossing frame, the bearing capacity and effective length factor of multiple sets of crossing frames with different steps of crossbars are calculated respectively under the conditions of not setting and setting scissor bracing. The calculation results are shown in Figure 17.
Figure 17.
The influence of scissors on the bearing capacity and the effective length factor. (a) The influence of scissors on the bearing capacity. (b) The influence of scissors on the effective length factor.
From Figure 17a, it can be seen that the setting of surrounding shear braces can significantly improve the bearing capacity of the spanning frame, and the increase can reach more than 20%. From the comparison of the curves in Figure 17a, it can be seen that, when the crossing frame is not arranged with peripheral scissors, the bearing capacity of the crossing frame changes little with the number of steps. The bearing capacity of the crossing frame with peripheral scissors decreases gradually with the increase in the number of steps, but the bearing capacity is still significantly larger than that of the crossing frame without peripheral scissors. It can be seen from Figure 17b that the effective length factor of the non-peripheral scissors is obviously larger than that of the arrangement of the peripheral scissors, but the change range is small. In the actual construction of the crossing frame, in order to facilitate transportation, the construction personnel will use fasteners to make the frame body reach the required height, which will make the initial deflection of the vertical rod larger, resulting in an increase in the initial defects of the crossing frame and a decrease in the bearing capacity of the crossing frame. Therefore, it is necessary to arrange the surrounding scissor braces when building the steel tube spanning frame.
In the case where the number of transverse rod steps is 10 steps and the step distance is 1.2 m, the instability modes of the cross frame with or without scissor support are compared, as shown in Figure 18.
Figure 18.
The instability mode of the crossing frame with or without the arrangement of scissors. (a) The instability mode of crossing frame without scissors. (b) The instability mode of crossing frame with scissors.
It can be seen from Figure 18 that, in the case of rearranging the surrounding scissors, the rectangular frame composed of a simple vertical bar and a horizontal bar is essentially a geometric variable system under the action of lateral force, which is prone to the lateral overturning mode shown in Figure 18a. The arrangement of scissor braces provides rigid constraints for the diagonal direction of the quadrilateral, which makes the vertical bar change from overall side-wing overturning to multi-wave buckling, as shown in Figure 18b, which greatly improves the bearing capacity of the spanning frame. The triangular system composed of scissor braces can temporarily maintain the overall stability of the structure under the condition of partial member failure and prevent overall overturning collapse. Therefore, for the crossing frame which is arranged for important situations such as railways and highways, it must be arranged around the scissors to ensure the safety of the line project.
4.6. The Influence of Joint Rotational Stiffness of the Crossing Frame
In this part, the relationship between the mechanical performance of the crossing frame and the stiffness of the joint is obtained by analyzing the bearing capacity of the crossing frame under different joint stiffnesses. The calculation results are shown in Figure 19.
Figure 19.
The influence of rotational stiffness on bearing capacity and effective length factor.
It can be seen from Figure 19 that an increase in the rotational stiffness will lead to an increase in the overall bearing capacity of the structure and a decrease in the effective length coefficient μ. When the rotational stiffness is in the range of 10 kN·m/rad~35 kN·m/rad, the bearing capacity increases gradually, and the increase is about 160%. The change trend of the effective length coefficient is opposite to that of the bearing capacity. When the rotational stiffness changes in the range of 10 kN·m/rad~35 kN·m/rad, the effective length coefficient decreases with the increase in rotational stiffness, and the decrease is about 37.9%.
The instability modes of crossing frames with different rotational stiffnesses, rigid connections and hinged connections are shown in Figure 20.
Figure 20.
The instability mode of the crossing frame under different rotational stiffnesses. (a) The instability mode of the crossing frame when hinged. (b) The instability mode of the crossing frame when the rotational stiffness is 15.7 kN·m/rad. (c) The instability mode of the crossing frame when the rotational stiffness is 35 kN·m/rad. (d) The instability mode of crossing frame in rigid connection.
It can be seen from Figure 20 that, for the instability mode of the cross frame under different rotational stiffnesses, the cross frames of the four working conditions have different degrees of lateral displacement, and, with the increase in the rotational stiffness, the amplitude of this lateral displacement gradually decreases. The semi-rigid connection causes a specific rotation of the joint, and the reduction in the rotational stiffness will cause a large lateral displacement of the structure under vertical load. The increase in lateral displacement will aggravate the P−Δ effect, that is, the vertical load will add a bending moment to the structure that generates lateral displacement. This will further reduce the stability of the pole, making it possible to lose stability at a lower load level. And, when the node has a certain stiffness, the instability trend of the vertical bar will be transmitted to the adjacent bars. It can be seen from the figure that, as the rotational stiffness gradually increases, the load distribution of the scissor support of the crossing frame gradually increases, and the overall bearing capacity of the crossing frame also gradually increases.
5. Calculating the Value of Effective Length Factor μ
5.1. Calculation Method of Effective Length Factor μ
Through the analysis of the previous section, it can be seen that the effective length factor μ is mainly affected by factors such as the step distance of the crossbar, the row spacing, the number of steps of the crossbar, the height of the sweeping rod, the arrangement of the scissors and the rotational stiffness. Specifically, μ shows an approximately linear growth trend with the increase in the step distance, row spacing and the number of transveres rod steps. With the increase in the rotational stiffness, it shows a decreasing trend. It changes nonlinearly with the increase in the height of the sweeping rod; the setting of a scissor brace can significantly reduce the μ value, and the setting of a scissor brace can enhance the overall stability of the frame. Among them, according to the Code of safety operation in power engineering construction and the actual investigation of multiple crossing projects in Anhui, the height of the sweeping rod of the steel tube crossing frame is set to be between 0.2 m and 0.5 m. In this interval, the calculated length factor only changes by 1.2%, so the influence of the height of the sweeping rod on the effective length coefficient can be ignored. And, because most of the layout area of the steel tube crossing frame is the expressway on both sides of the railway, it is impossible to arrange the wall fittings to improve the stability performance of the frame; so, for any height of the steel tube crossing frame, it is necessary to arrange the scissor support according to the requirements of the regulations, so that the influence of the scissors support on the effective length coefficient μ can be ignored.
Orthogonal design is a multi-factor experimental method based on the fractional principle of factor design, using an orthogonal table to arrange the design experiment and statistical analysis of the results [28,29,30]. In the parameter setting, this paper uses the four factors of the bar step distance, the row spacing, the number of bar steps and the rotational stiffness, which are linearly related to the calculated length factor μ, as the test factors. The value of the step distance is 0.8~1.2 m, and the interval is 0.2 m; the value of the row spacing is 2.2~3 m, and the interval is 0.2 m; the number of transverse rod steps is 8~16 steps, and the interval is 2 steps; the rotational stiffness S is 10~30 kN·m/rad, and the interval is 5 kN·m/rad. Each factor has five levels, and the orthogonal table L25 (56) is used to arrange the calculation conditions. The working conditions based on the orthogonal experimental design and its corresponding effective length factor μ are shown in Table 4.
Table 4.
Working condition setting and simulation results of calculated length factor μ.
The variance analysis method is used to investigate the significance of the influence of the step distance, the row spacing, the number of transverse rod steps and the rotational stiffness on the effective length factor μ, so as to control the design related to each factor. According to the theory of variance analysis and the data in Table 4, the sum of squared errors, the sum of mean squared errors and the test statistics (F value) of each factor are calculated. The results are shown in Table 5. It can be seen from Table 5 that the F value of the step distance, the number of transverse rod steps and the rotational stiffness is greater than , indicating that the influence of the step distance, crossbar step number and rotational stiffness on the effective length coefficient is because the probability of accidental factors is less than 0.1%. These three factors have a high significance. Meanwhile, the F value of the row spacing is less than , indicating that the influence of row spacing on the effective length coefficient is because the probability of accidental factors exceeds 0.1%, so it is determined that the influence of the row spacing on the effective length is not significant.
Table 5.
Multi-factor analysis of variance of effective length coefficient.
In order to determine the quantitative relationship between the calculated length coefficient and the above three factors, the step distance, the number of steps of the crossbar and the rotational stiffness of the steel tube crossing frame are used as independent variables, and, in order to verify the independence of the data, the 5, 7, 14, 16, and 23 conditions marked in Table 4 are used as the verification set, and the other 20 conditions are used as the training set. Through multiple linear regression analysis [31,32,33], the following equation is obtained:
The significance test of the regression model showed that the statistical value of F was 51, which was much larger than F0.001 (4,20) = 7.1, indicating that there was a significant linear relationship between the independent variables and the fitting results. The coefficient of determination R2 = 0.91, indicating that the regression equation has a high degree of fitting. Comparing the fitting formula with the simulation results, the results are shown in Figure 21. In Figure 21, the data in standard red are the simulation results of the verification set, the fitting calculation results, and the relative error, respectively. The standard red data is the calculation result of the training set. It can be seen from the figure that the average relative error of the training set is 3.9%, and the average relative error of the validation set is 4.2%, which is basically consistent with the results of the training set, indicating that the fitting formula has a high prediction accuracy [34].
Figure 21.
Fitting results and relative error.
It should be noted that the formula has some limitations: the default height of the sweeping rod of the spanning frame is 0.2~0.5 m, and the surrounding scissor support is arranged. When the height of the sweeping rod exceeds 0.5 m or the surrounding scissor support is arranged, the formula cannot be applied; the formula is only applicable to the φ48 × 3.5 steel tube of Q235 steel. The formula is applicable to the value of each parameter within the scope of this study.
5.2. Comparison of Calculation Results
This paper selects the steel tube crossing frame used in a line project in Anhui to cross the Beijing–Shanghai high-speed railway as an example. The line span of the project is 326 m, and the span conductor model adopts a 1 × JL/G1A-300/25 steel core aluminum strand cable. The crossing frame is made of Q235 steel. The height of the frame on both sides of the frame is 18.5 m, the length of the frame is 16 m, the width of the frame is 8 m, and the spacing of the frame is 21 m. In this paper, the left steel tube crossing frame is tak-en as an example. The distance between the vertical rods of the crossing frame is 2 m, the step distance of the horizontal rods is 1.3 m, the row spacing is 2 m, the number of vertical rod spans is 8, the number of horizontal rod steps is 14, and the number of rows is 5. The rotational stiffness of the fastener is about 18 kN·m/rad. The site layout diagram of the crossing frame is shown in Figure 22.
Figure 22.
Layout diagram of crossing frame. (a) Side view. (b) Top view.
In order to check the stability of the vertical rod of the steel tube crossing frame, it is necessary to calculate the axial force of the steel tube crossing frame. The axial force is calculated according to the following equation:
where represents the vertical rod axial force generated by the self-weight structure of the crossing frame; represents the axial force generated by the vertical load.
The vertical load is concentrated on the top of the frame, and its value is calculated as follows:
where represents the impact coefficient, and its value is 1.3~1.5; represents the vertical span when considering the wire falling on the spanning frame, and the project takes 200 m; represents the number of sub-conductors pulled at the same time; and represents the gravity per unit length of a single wire.
According to the calculation, the axial force across the erecting rod section is 6883.8 N.
The finite element model of the crossing frame in the project is established, and the corresponding load is applied at the top of the crossing frame. The stress cloud diagram of the steel tube crossing frame is shown in Figure 23.
Figure 23.
Stress cloud diagram of crossing frame.
It can be seen from Figure 13 that the maximum stress of the crossing frame is located at the bottom of the pole, and its value is 131.6 MPa.
According to the specification JGJ130-2019 Technical code for safety of steel tubular scaffold with couplers in construction [35], the effective length of the pole is calculated. Because the pole spacing and row spacing of the actual arrangement exceed the search range provided by the specification, this paper determines the closest effective length factor μ according to the step distance of the bar, and the table shows that μ = 2.358. According to the specification JGJ130-2019, the effective length is calculated according to the following formula:
where is 1.217 when the height is 20 m and below.
After determining the effective length of the crossing frame, the stress of the vertical bar of the crossing frame is calculated according to the calculation steps in Section 3.1 to judge the stability of the vertical bar. After calculation, the stress across the erecting rod section is 102.31 MPa.
The stress of the pole is calculated according to the British standard BS 5975-2019 Code of practice for temporary works procedures and the permissible stress design offalsework [36]. In the specification BS 5975-2019, the effective length is determined to be 2 times the crossbar step with the constraint condition of the vertical bar, and the stress of the vertical bar is calculated according to the following equation:
where
where
where represents the effective length; E represents elastic modulus; and i represents yield stress.
After calculation, according to the calculation method of the British code and considering the corresponding load coefficient, the stress across the erecting rod section is 163.73 MPa.
According to the fitting equation in this paper, the effective length factor μ is 3.373, and the effective length is calculated according to the following equation:
After determining the effective length of the crossing frame, the vertical rod stress of the crossing frame is calculated according to the calculation steps in Section 3.1. After calculation, the stress across the erecting rod section is 141.34 MPa.
The stress results obtained using different calculation methods are shown in Table 6.
Table 6.
Comparison table of calculation results.
It can be seen from Table 6 that, although there are differences in the stress of the vertical rod obtained using the four calculation methods, they all meet the design requirements, indicating that the steel tube crossing frame in the project will not collapse.
According to the fitting equation method, the calculation results are about 5.4% compared with the finite element analysis results. It can be seen that the fitting equation obtained in this paper can obtain the effective length factor μ more accurately. According to the specification JGJ130-2019, the calculation results are about 22% smaller than the finite element analysis results. In the calculation of the stress of the vertical pole of the crossing frame, because the special frame body used in the transmission line project, such as the steel tube crossing frame, is not suitable for the specification JGJ130-2019, it is difficult to accurately select the effective length factor μ of the crossing frame according to the specification. If the similar value is selected for calculation, the obtained stress result is small, and there is a risk of overturning and collapse of the crossing frame. The stress results calculated according to the specification BS5975-2019 are about 25% higher than the finite element analysis results. In the specification BS 5975-2019, the effective length factor μ is not determined, but the effective length is determined according to the constraint mode of the frame. However, the stress calculation process of the specification is complicated, and the calculation results are conservative, which will cause a certain waste of resources.
The two specifications will have different errors because, in the specification JGJ130-2019, although the specification considers the fastener as a semi-rigid joint, it does not specifically consider the influence of the semi-rigid joint on the frame body, and its empirical coefficient is based on the conventional scaffold (with wall fittings, small spacing). The large spacing structure of the crossing frame weakens the node constraints, and the absence of couplings reduces the overall lateral stiffness. These factors lead to the actual μ value greater than the standard value. Therefore, the calculation results of the code are unsafe; the standard BS5975-2019 regards the vertical bar as a model with hinged ends or one end hinged and one end free. The effective length is twice the step distance of the horizontal bar. It ignores the rotation constraint of the node and adopts a single bar calculation, which is not included in the cooperative work of the space frame, so the calculation result is too conservative.
6. Discussion
In this paper, the influence of structural parameters on the bearing capacity of a steel pipe crossing frame and the effective length coefficient μ of a vertical bar is systematically analyzed.
From the analysis of the Section 4 of this paper, it can be seen that the step distance and the number of transverse rod steps have a significant effect on the bearing capacity and μ value of the cross frame, and the two are approximately linearly correlated with the μ value. This is because the increase in the step distance directly increases the free length of the vertical rod between the nodes and weakens the rotational constraints provided by the nodes. The increase in the number of steps increases the total height of the frame, the increase in the number of steps increases the total number of nodes, and the P −Δ effect accumulates layer by layer, resulting in the structure being more sensitive to initial defects and lateral displacement, thereby reducing the stability-bearing capacity. It is worth noting that, when the step distance increases from 0.8 m to 1.6 m, the instability mode as shown in Figure 9 gradually evolves from multi-wave bending–buckling to the overall overturning of the bottom layer, indicating that the change in parameters has caused a change in the instability mechanism. This finding suggests that the upper limit of the step distance should be carefully controlled in the design of the crossing frame to avoid a sudden drop of the bearing capacity caused by a sudden change in the instability mode.
The height of the sweeping rod has a significant effect on the bearing capacity. When the height is in the range of 0.1~0.6 m, the bearing capacity decreases gently. However, when the height exceeds 0.7 m, the bearing capacity decreases sharply, and the instability mode changes from the bending of the pole waveform to the instability of the bottom pole, resulting in an overall overturning. This is because the sweeping rod is the first lateral constraint at the bottom of the pole, and its height is too large to make the bottom section lose effective lateral fulcrum, which makes the bottom structure unable to constrain the pole. This finding verifies the rationality of the specification [27] that the height of the sweeping rod should not be greater than 300 mm and provides a quantitative basis for the safety assessment when the sweeping rod has to be lifted due to terrain restrictions in engineering practice.
The setting of scissors around can increase the bearing capacity of the crossing frame by more than 20%. The mechanical mechanism is such that the scissor support transforms the quadrilateral frame, which is originally only based on the bending stiffness of the node, into a spatial triangular truss system, and introduces an axial force path, which significantly improves the overall lateral stiffness of the structure. From the perspective of energy, the scissors provide a high-stiffness strain energy storage path, such that the structure has a higher energy barrier under the same load, thereby delaying the occurrence of instability. As shown in Figure 18, the instability mode changes from the overall roll without scissors to the multi-wave bending–buckling after setting the scissors, which intuitively confirms this mechanism.
The influence of the rotational stiffness of the joint on the bearing capacity and μ value of the frame is also significant—in the range of 10~35 kN · m/rad, the bearing capacity is increased by about 160%, and the value is decreased by about 37.9%. This quantitative relationship reveals the core role of semi-rigid joints in the stability of the crossing frame: the joint stiffness directly determines the boundary constraints of the pole, which in turn affects its buckling load. The range of joint stiffness set in this paper is 10~30 kN · m/rad, which covers the common discrete interval of fastener rotational stiffness in construction sites, so the results of the parameter analysis are representative in engineering. However, the degradation effect of joint stiffness under long-term use or impact load still needs further study.
According to the instability modes of different working conditions in this paper, whether it is multi-wave bending–buckling or overall overturning, it shows typical geometric nonlinear instability characteristics. The instability is dominated by a sharp increase in lateral displacement rather than material yield. Therefore, it can be considered that geometric nonlinearity is the dominant mechanism of the instability of the spanning frame, and material nonlinearity is the auxiliary acceleration mechanism.
The essence of structural instability is the transformation process of energy from one form to another. In the early stage of loading, the work done by the external force is converted into the strain energy of the structure and stored in the bar. When the load reaches the critical value, the structural system will suddenly jump from the current equilibrium path to the new equilibrium path in order to seek a lower energy state. In this process, the stored strain energy will be released instantaneously and converted into kinetic energy, and the lateral displacement will increase sharply, resulting in structural instability. Under the condition of considering the strain energy and potential energy of the external force, there is energy conservation [37]:
where represents the total potential energy; represents the load potential energy; and represents the strain energy of the component.
The equilibrium state of the structure corresponds to the first-order change in the total potential energy divided into zero ( = 0). The stability of the equilibrium state is determined by the second-order variation () of the total potential energy: When , the total potential energy takes the minimum value, and the equilibrium state is stable. When , the total potential energy takes the maximum value, and the equilibrium state is stable. When , this corresponds to the critical state of the structure. In the finite element analysis, this energy criterion corresponds to the positive definite change in the tangent stiffness matrix of the structure. The essence of instability is that the tangent stiffness matrix changes from positive definite to singular, that is, . The change in the crossbar step, the number of crossbar steps, the height of the sweeping rod, the arrangement of the scissors and the rotational stiffness will affect the tangent stiffness to a certain extent, thus affecting the strain energy of the frame and ultimately affecting the bearing capacity of the frame.
Based on orthogonal testing and multiple linear regression, this paper proposes a prediction formula for the effective length coefficient μ of the spanning pole. In the parameter range, the average error of the training set is 3.9%, and the average error of the verification set is 4.2%. The formula has a high prediction accuracy, and its stability is confirmed through cross-validation. However, the formula has some limitations: the default height of the sweeping pole across the frame is 0.2–0.5 m, and the scissors are set around it. When the height of the sweeping rod exceeds 0.5 m or the scissor brace is set around the sweeping rod, the formula cannot be applied. This formula is only applicable to a φ48 × 3.5 steel pipe of Q235 steel. The formula is suitable for the value of each parameter in the analysis range of this paper. The formula is based on finite element numerical simulation and multiple linear regression, and its extrapolation application has a significant risk of instability mode transition. When the step distance is extrapolated to less than 0.8 m, the formula will not consider an increase in node constraints and will lead to an over-conservative design. When the step distance is extrapolated to more than 1.6 m, the node constraint of the pole is relatively weakened, and the structural instability is transformed into overall overturning. However, the linear relationship of the formula does not consider this fundamental change, which will seriously underestimate the actual μ value and cannot be extrapolated. When the number of steps is extrapolated to more than 16 steps, the total height of the frame increases, the number of nodes increases, the P−Δ effect accumulates layer by layer, and the top instability or overall roll of the structure may occur. The prediction of the formula will not reflect this change. When the rotational stiffness of the joint is extrapolated to below 10 kN · m/rad, the structure approaches the hinged system, the bearing capacity decreases in a collapsed manner, and the μ value increases sharply. When extrapolated to more than 30 kN · m/rad, the joint is close to a rigid connection, the marginal effect of stiffness enhancement decreases, and the μ value tends to the lower limit. If the linear relationship is continuously extrapolated, the joint constraint force will be overestimated, and the structural stability cannot be judged. Therefore, the formula is only applicable to the preliminary design of the crossing frame with the parameters strictly falling within the above range. For the over-limit condition, it must be reviewed using refined finite element analysis to avoid potential safety hazards caused by the fundamental change in the instability mode.
In this paper, the influence of different factors on the bearing capacity of the crossing frame is analyzed, and the fitting formula for the effective length factor is proposed. In the future, the following aspects will be studied in depth:
- (1)
- In the next step, we will carry out a full-scale experiment on the crossing frame and further carry out an analysis of the mechanical properties.
- (2)
- Although the sensitivity of the above factors is preliminarily revealed through parametric analysis, it is still necessary to use probability analysis methods (such as Monte Carlo simulation) to conduct in-depth research on uncertainty quantitative analysis. In the follow-up work, we will establish a probability distribution model of joint stiffness based on field measured data, comprehensively consider the influence of multiple random factors, and correct and calibrate the fitting formula proposed in this paper based on reliability.
- (3)
- Based on the instability mode revealed in this paper, the subsequent research can further explore the feasibility of using higher-yield-strength steel for local replacement in the initial buckling area and evaluate the effect of this measure on the overall bearing capacity of the crossing frame under the premise of controlling the cost, so as to provide a theoretical basis and engineering guidance for the collaborative optimization of safety and economy.
- (4)
- The impact load may aggravate the nonlinear deformation of the joint or stimulate the high-order buckling mode, resulting in the dynamic instability of the structure below the static ultimate load. This will be the direction of further exploration in this study.
7. Conclusions
In view of the lack of value basis for the effective length factor μ in the actual construction process of a steel tube crossing frame, this paper establishes a refined finite element model for a steel tube crossing frame considering the semi-rigid characteristics of joints, systematically analyzes its bearing capacity and influencing factors, and focuses on the value method of effective length factor μ for engineering design. The main conclusions are as follows:
- (1)
- Through an analysis of the structural parameters of the crossing frame, the step distance and the number of transverse rod steps have a significant impact on the structural bearing capacity and the effective length factor μ, and show a significant linear correlation. The influence of the pole spacing, pole span number and row number is relatively small; the height of the sweeping rod has little effect on the bearing capacity and the effective length factor μ in the range of 0.1 m–0.6 m, but it changes sharply after exceeding 0.7 m; the setting of peripheral scissors can significantly improve the overall stability of the crossing frame and increase the bearing capacity by more than 20%.
- (2)
- Based on the results of the parameter analysis, it is found that the step distance and the number of transverse rod steps have a significant effect on the effective length factor μ. The multiple linear regression method is used to establish the calculation equation of the effective length factor μ of the steel tube crossing the erecting rod.
- (3)
- The calculation results of the fitting formula, Chinese code JGJ130-2019 and British code BS 5975-2019 are compared with the results of the refined finite element analysis by using actual engineering cases. The results show that the calculation results of the fitting formula in this paper are the closest to the results of the finite element analysis, with an average error of about 7%. The calculation results for Chinese code JGJ130-2019 are unsafe because the special structure of the spanning frame is not fully considered. The calculation process of British standard BS 5975-2019 is complex, and the results are conservative.
- (4)
- The formula has some limitations: 1. The height of the sweeping rod of the cross frame should be less than 0.5 m, and the scissor brace should be set around it. 2. The steel tube of the frame body should be a φ48 × 3.5 steel tube of Q235 steel. 3. The values of each parameter should be within the analysis range of this paper.
Author Contributions
Conceptualization, S.W. and Z.G.; methodology, S.W., B.T. and Z.G.; software, Z.G.; validation, S.W., Z.G., G.Z., Q.H. and P.Z.; formal analysis, Z.G.; investigation, G.Z., Q.H. and P.Z.; resources, S.W., G.Z., Q.H. and P.Z.; data curation, S.W. and Z.G.; writing—original draft preparation, S.W. and Z.G.; writing—review and editing, S.W., B.T., G.Z., Q.H. and P.Z.; supervision, B.T.; project administration, S.W.; funding acquisition, S.W. and B.T. All authors have read and agreed to the published version of the manuscript.
Funding
This research received no external funding.
Data Availability Statement
The original contributions presented in the study are included in the article; further inquiries can be directed to the corresponding author.
Conflicts of Interest
Authors Guanmin Zhu, Pengcheng Zhang, and Qiyun Han were employed by the company Anhui Electric Power Transmission & Transformation Co., Ltd. The remaining authors declare that the research was conducted in the absence of any commercial or financial relationships that could be construed as potential conflicts of interest.
References
- Xie, B.C.; Wu, Q.X.; Qin, Y.Y.; Zhang, C. Performance Evaluation of Emerging Grid Infrastructure Operations: Evidence from ultra-high-voltage transmission lines in China. Socio-Econ. Plan. Sci. 2025, 102, 102313. [Google Scholar] [CrossRef] [Scilit]
- Zhao, X.Z.; Wu, H.D.; Yang, D.Q.; Wei, J.Y.; Li, Z.P.; Guo, Z.; Zhang, S. Residual Magnetism Elimination Method for Large Power Transformers Based on Energy Storage Oscillation. IEEE Trans. Power Deliv. 2025, 40, 2759–2768. [Google Scholar] [CrossRef] [Scilit]
- Wang, Z.; Duan, N.; Chen, J.; Zhou, X.; Lu, M.; Zhao, S. Effect of Tree Quantity and Distribution on the Electric Field under Transmission Lines. Appl. Sci. 2024, 14, 8487. [Google Scholar] [CrossRef] [Scilit]
- Yang, W.H.; Xu, C.; Li, T.; Sun, J.J.; Li, L.; Feng, L.Y.; Wang, P.; Chen, J.Y.; Xiao, Z.K. Landslide Traces Inventory and Spatial Distribution Analysis Along the Hubei Section of the Jinsha River–Hubei Ultra-High-Voltage Transmission Line, China. Forests 2025, 16, 1686. [Google Scholar] [CrossRef] [Scilit]
- Zeng, F.K.; Zou, G.X.; Ji, M.; Zhang, J.H. Study on Semi-Rigid Joint Performance and Stability Bearing Capacity of Disc-Type Steel tube Support. Buildings 2025, 15, 1955. [Google Scholar] [CrossRef] [Scilit]
- Wang, Q.L.; Su, M.Z. Lateral Displacement Mode of Column-Supported Modular Steel Structures with Semi-Rigid Connections. J. Build. Eng. 2022, 62, 105397. [Google Scholar] [CrossRef] [Scilit]
- Al-Sadoon, Z.A.; Barakat, S.; Abed, F.; Al Ateyat, A. Stability of Structural Steel Tubular Props: An Experimental, Analytical, and Theoretical Investigation. Steel Compos. Struct. 2023, 49, 143–159. [Google Scholar]
- Dong, J.F.; Liu, H.Q.; Xia, S.Y.; Cheng, Y.; Lei, M.; Chen, Z.M. Experimental Research and Finite Element Analysis on Structural Stability of Disc-Buckle type Formwork Support. Int. J. Steel Struct. 2022, 22, 748–766. [Google Scholar] [CrossRef] [Scilit]
- Abdel-Jaber, M.; Abdel-Jaber, M.S.; Beale, R.G. An Experimental Study into the Behaviour of Tube and Fitting Scaffold Structures under Cyclic Side and Vertical Loads. Metals 2022, 12, 40. [Google Scholar] [CrossRef] [Scilit]
- Huang, H.; Peng, Z.; Hou, J.; Zheng, X.; Ding, Y.X.; Wu, H. Study on the Ultimate Load-Bearing Capacity of Disc Buckle Tall Formwork Support Considering Uncertain Factors. Buildings 2024, 14, 828. [Google Scholar] [CrossRef] [Scilit]
- Li, R.; Tao, Q.; Liu, Z.; Wang, Y.M.; Dong, W.; Zhang, B.S. Investigation on Buckling Behaviour of Scaffold Independent Supporting System Considering Semi-Rigid Nodes. Buildings 2025, 15, 443. [Google Scholar] [CrossRef] [Scilit]
- Liu, H.; Hao, T.; Zhang, H.; Shi, Y.; Ni, C.; Liu, Q.; He, Y.; Chen, Z. Experimental and theoretical investigation on the lateral bearing capacity of disk-lock scaffold. J. Constr. Steel Res. 2026, 236, 109936. [Google Scholar] [CrossRef] [Scilit]
- Liu, H.; He, Y.; Zhang, H.; Shi, Y.; Ni, C.; Liu, Q.; Hao, T.; Chen, Z. Experimental and analytical studies on the lateral bearing performance of disk lock steel tubular scaffold under horizontal load. Structures 2025, 78, 109290. [Google Scholar] [CrossRef] [Scilit]
- Zhu, M.L.; Jin, Z.Y.; Yu, B.; Qin, Y.F. Experimental and numerical studies on mechanical properties of high-strength steel tubular disk-lock scaffold. KSCE J. Civ. Eng. 2025, 29, 100292. [Google Scholar]
- Xiao, J.L.; Liu, J.; Liu, Y.F.; Fan, J.S. Inelastic Numerical Analysis-Based Optimal Design of Iongitudinal Stiffeners in Steel Web Plates. J. Constr. Steel Res. 2026, 238, 110201. [Google Scholar]
- Ismail, M.S.; Mahmud, J.; Ifayefunmi, O.; Purbolaksono, J. Buckling Failures in Curved Shell Structures: A Comprehensive review of Theory, design, and applications. J. Braz. Soc. Mech. Sci. 2026, 48, 83. [Google Scholar]
- Gomaa, I.M.; Mohareb, M.; Mourad, S.A.; Attia, S. Second 0rder Effects on Lateral Torsional Buckling of Beam-Columns. Eng. Struct. 2025, 345, 121327. [Google Scholar] [CrossRef] [Scilit]
- Levadnyi, I.; Liu, F.J.; Gu, Y.D. Identification of Material Parameters at High Strain Rates Using Ballistic Impact Tests and Inverse Finite Element Analysis. AIP Adv. 2024, 14, 045031. [Google Scholar] [CrossRef] [Scilit]
- Yang, S.; Cao, X.; Xu, Z. Corrosion Behaviour of Q235 Steel in Accelerated Simulated Acid rain Condition. Corros. Eng. Sci. Technol. 2025. [Google Scholar] [CrossRef] [Scilit]
- Kong, Z.Y.; Jin, Y.; Hossen, G.M.S.; Wang, Y.; Vu, Q.V.; Truong, V.H.; Tao, Q.L.; Kim, S.E. Experimental and theoretical study on mechanical properties of mild steel after corrosion. Ocean Eng. 2022, 246, 110652. [Google Scholar] [CrossRef] [Scilit]
- Liu, H.B.; Meng, Y.; Jia, L.; Chen, Z.H.; Liu, Q.; Wen, S.L. Structural Behavior of Steel Tube and Coupler Scaffolds with Stability Strengthening Details. Int. J. Steel Struct. 2018, 18, 79–95. [Google Scholar] [CrossRef] [Scilit]
- Ramezantitkanloo, A.; Czepiżak, D.; Pieńko, M. Comparative Analysis of Properties and Behaviour of Scaffolding Joints and Anchors. Appl. Sci. 2025, 15, 10371. [Google Scholar] [CrossRef] [Scilit]
- Malekzadeh, M.; Shayanfar, M. Numerical Study on Seismic Behavior of Flexural Frames with Semi-Rigid Welded Steel Connections Considering Static and Reciprocating Loads: A Performance-Based Earthquake Approach. Appl. Sci. 2022, 12, 7617. [Google Scholar] [CrossRef] [Scilit]
- Wang, F.M.; Liu, Y.; Xu, X.T.; Xie, W. Progressive Collapse Resistance of Disk Lock Scaffolds with Different Semi-Rigid Joint Connections. J. Constr. Steel Res. 2025, 235, 109918. [Google Scholar] [CrossRef] [Scilit]
- Ilchi Ghazaan, M.; Manafi, A. Optimal Member Size and Stiffness Distribution for Semi-Rigid Joints in Three-Dimensional Steel Frames Considering Inelastic Second-Order Analysis. Int. J. Steel Struct. 2025, 25, 1117–1130. [Google Scholar] [CrossRef] [Scilit]
- Genovese, F.; Sofi, A. A Novel Interval Matrix Stiffness Method for the Analysis of Steel Frames with Uncertain Semi-Rigid Connections. Adv. Eng. Softw. 2024, 192, 103629. [Google Scholar] [CrossRef] [Scilit]
- DL 5009.2-2013; Safety Regulations for Power Construction Part 2: Power Lines. Electric Power Publishing House: Beijing, China, 2014.
- Agrawal, H.; Durucan, S.; Cao, W.; Cai, W. Analytical Estimation of Strain Energy Accumulation in Retreating Longwall Mining and Sensitivity Analysis Using the Orthogonal Testing Method. Rock Mech. Rock Eng. 2024, 57, 2829–2845. [Google Scholar] [CrossRef] [Scilit]
- Shanmugam, V.; Marimuthu, U.; Rajendran, S.; Veerasimman, A.; Basha, A.M.; Majid, M.S.B.A.; Esmaeely Neisiany, R.; Försth, M.; Sas, G.; Razavi, N. Experimental Investigation of Thrust Force, Delamination and Surface Roughness in Drilling Hybrid Structural Composites. Materials 2021, 14, 4468. [Google Scholar] [CrossRef] [Scilit] [PubMed]
- Zhang, P.; Wang, J.; Jiang, L.; Zhou, T.; Yan, X.; Yuan, L.; Chen, W. Influence Analysis and Stepwise Regression of Coal Mechanical Parameters on Uniaxial Compressive Strength Based on Orthogonal Testing Method. Energies 2020, 13, 3640. [Google Scholar] [CrossRef] [Scilit]
- Yang, H.; Xie, B.; Liu, X.; Chu, X.; Ruan, J.; Luo, Y.; Yue, J. Breakdown Pressure Prediction of Tight Sandstone Horizontal Wells Based on the Mechanism Model and Multiple Linear Regression Model. Energies 2022, 15, 6944. [Google Scholar] [CrossRef] [Scilit]
- Thai, D.K.; Nguyen, D.L.; Pham, T.H. Prediction of residual strength of FRC columns under blast loading using the FEM method and regression approach. Constr. Build. Mater. 2021, 276, 122253. [Google Scholar] [CrossRef] [Scilit]
- Kim, S.-H.; Batbold, T.; Shah, S.H.A.; Yoon, S.; Han, O. Development of Shear Resistance Formula for the Y-Type Perfobond Rib Shear Connector Considering Probabilistic Characteristics. Appl. Sci. 2021, 11, 3877. [Google Scholar] [CrossRef] [Scilit]
- Park, S.J.; Heogh, W.; Yang, J.; Kang, S.; Jeong, W.; Lee, H.; Jang, T.-S.; Jung, H.-D.; Jahazi, M.; Han, S.C.; et al. Meta-structure of amorphous-inspired 65.1 Co28. 2Cr5. 3Mo lattices augmented by artificial intelligence. Adv. Compos. Hybrid Mater. 2024, 7, 224. [Google Scholar] [CrossRef] [Scilit]
- JGJ130-2019; Safety Technical Specification for Construction Fastener-Type Steel Tube Scaffold. China Building Industry Press: Beijing, China, 2019.
- BS 5975:2019; Code of Practice for Temporary Works Procedures and the Permissible Stress Design of Falsework. British Standards Institution: London, UK, 2019.
- Wang, J.; Li, H.M.; Yan, K. Stability analysis of spatial steel structure based on energy method. Chin. J. Appl. Mech. 2025, 42, 869–878. [Google Scholar] [CrossRef]
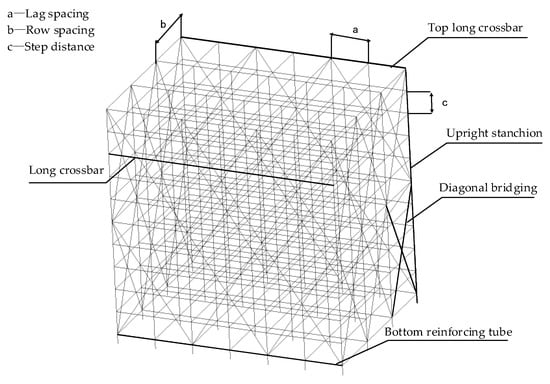
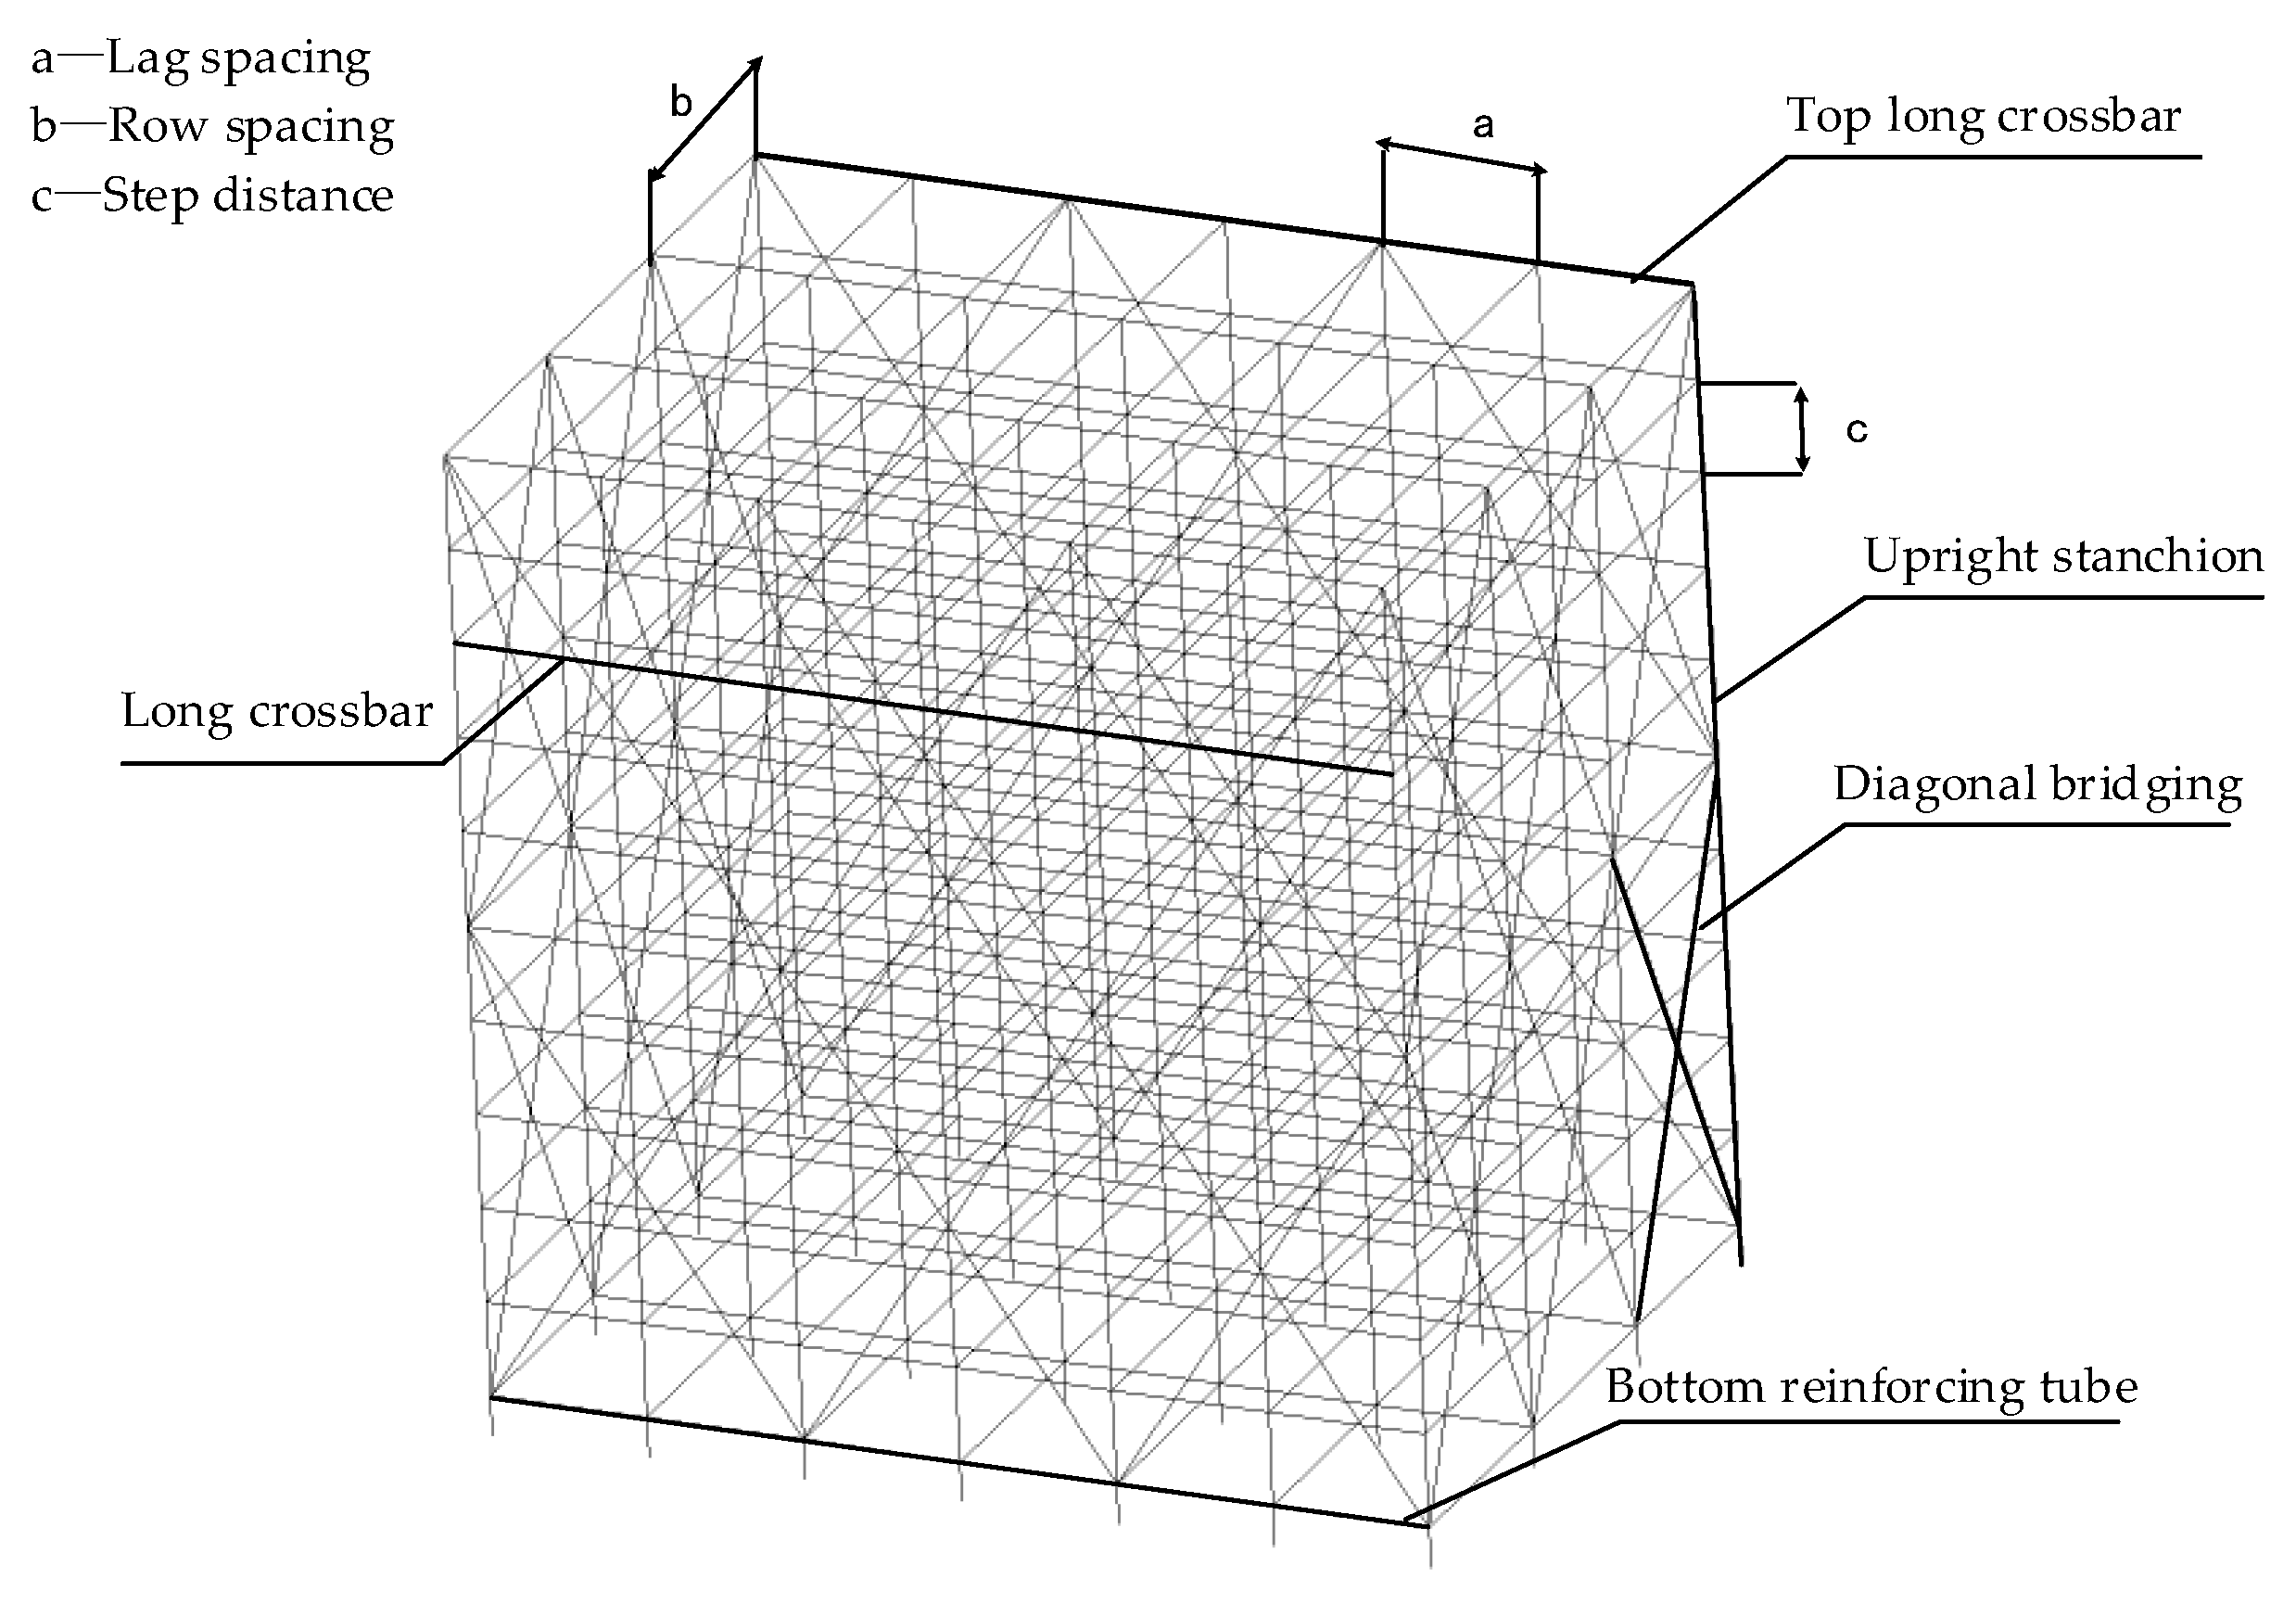
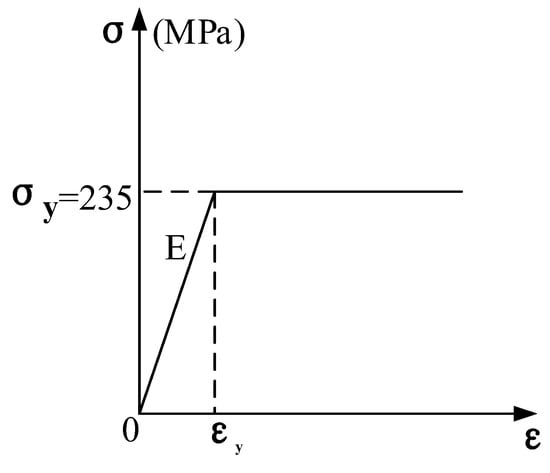
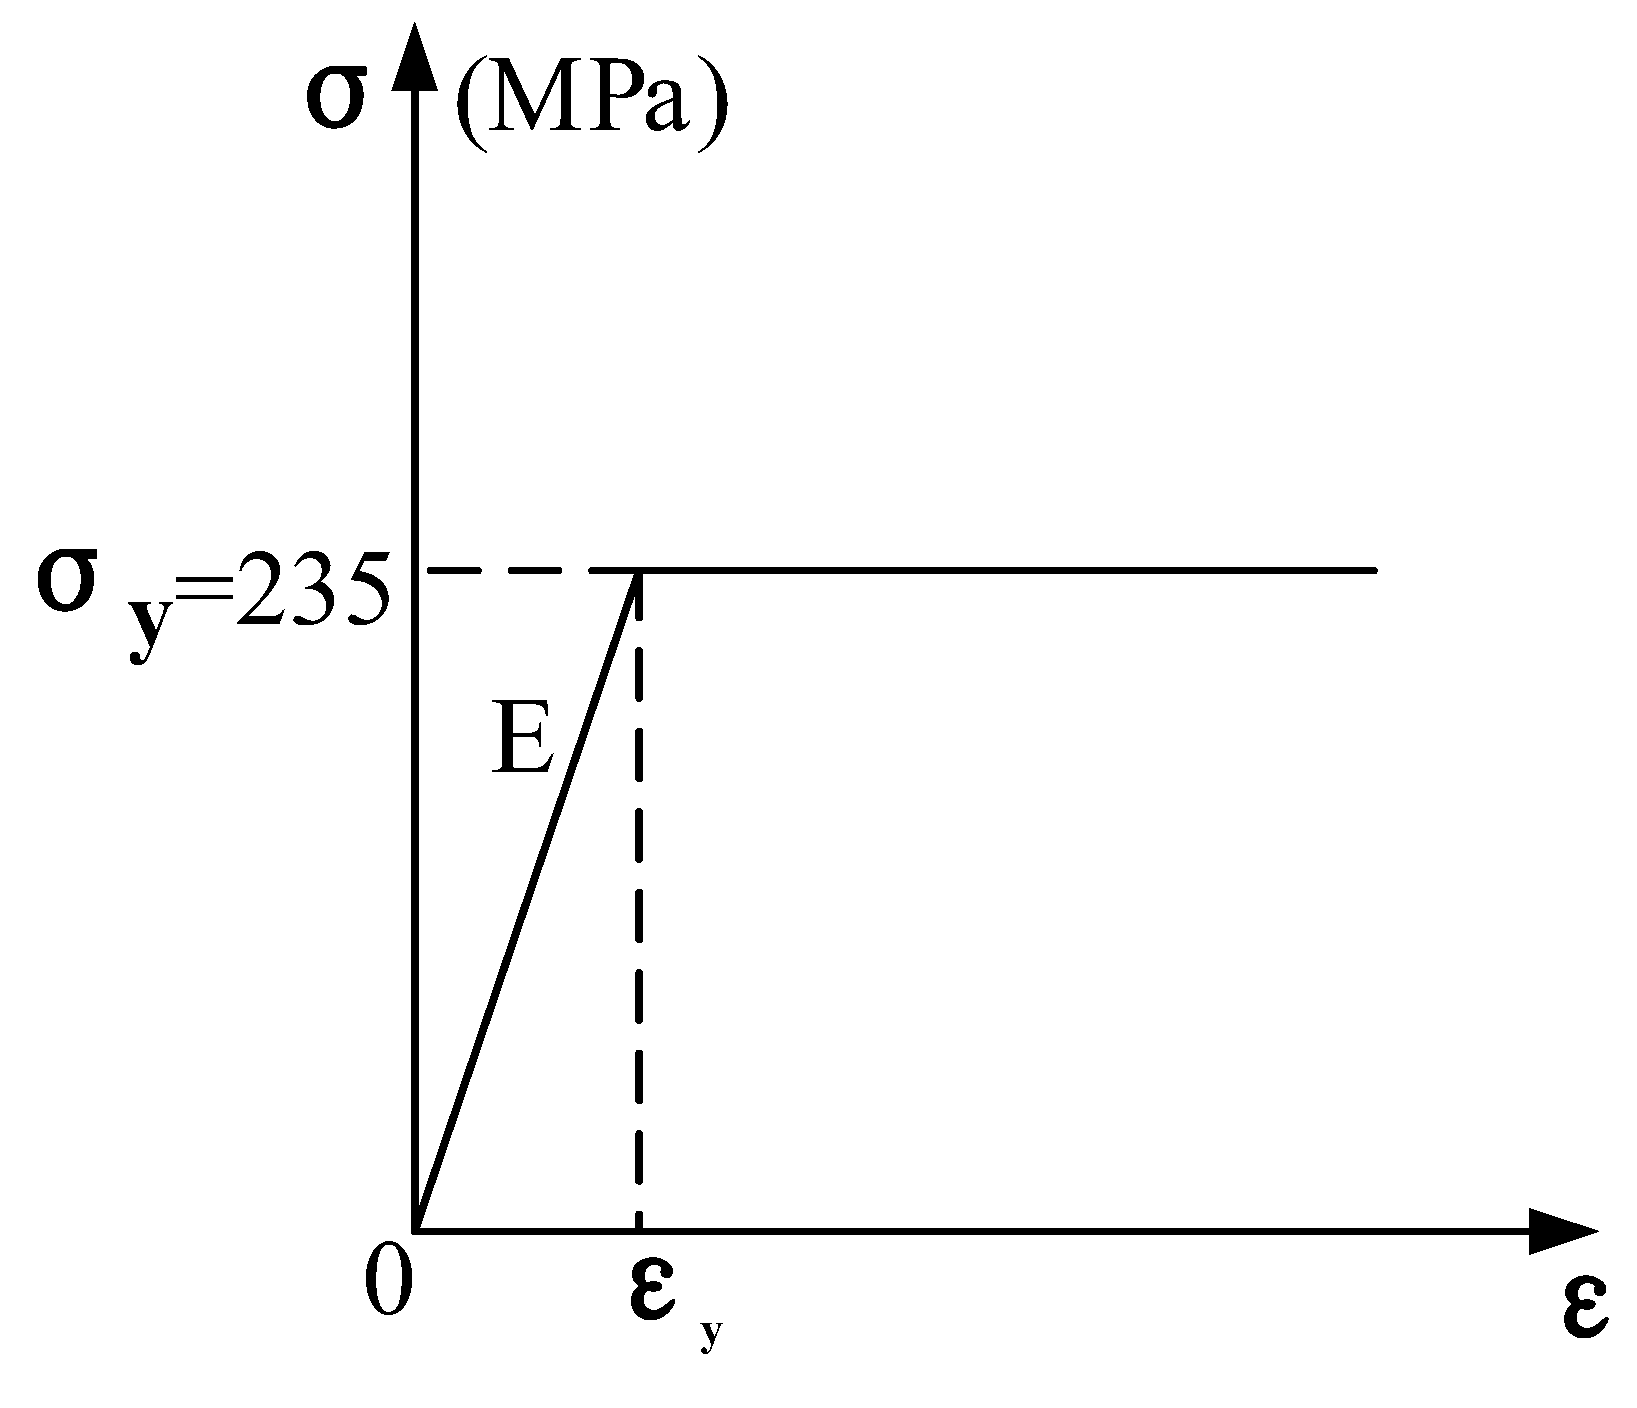
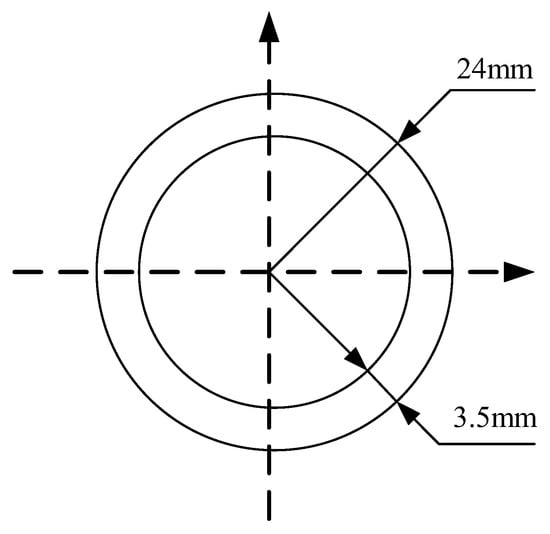
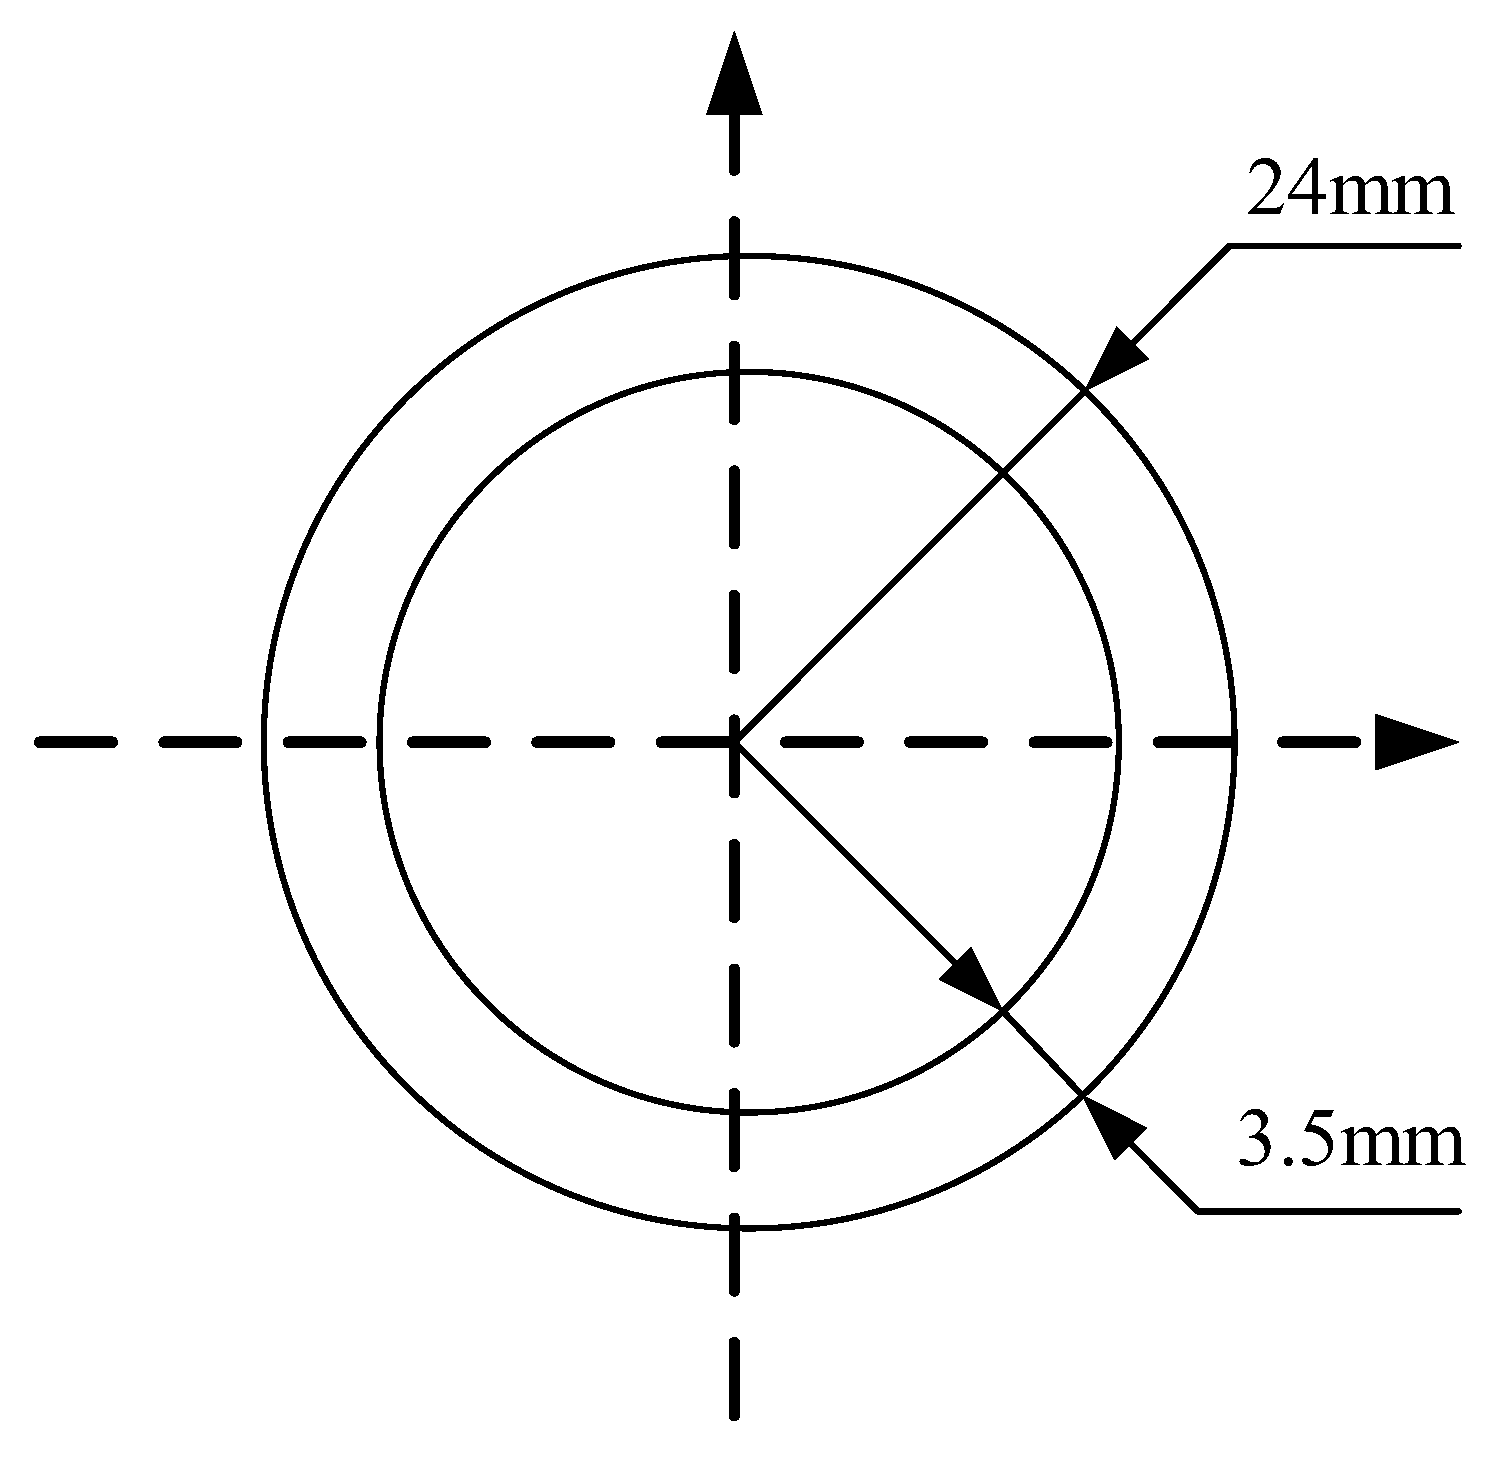


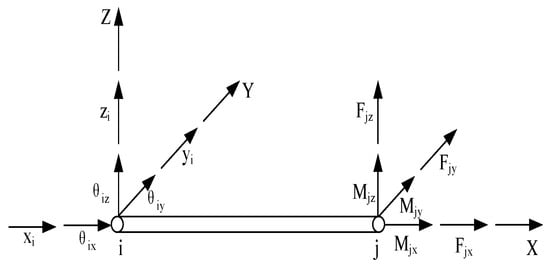
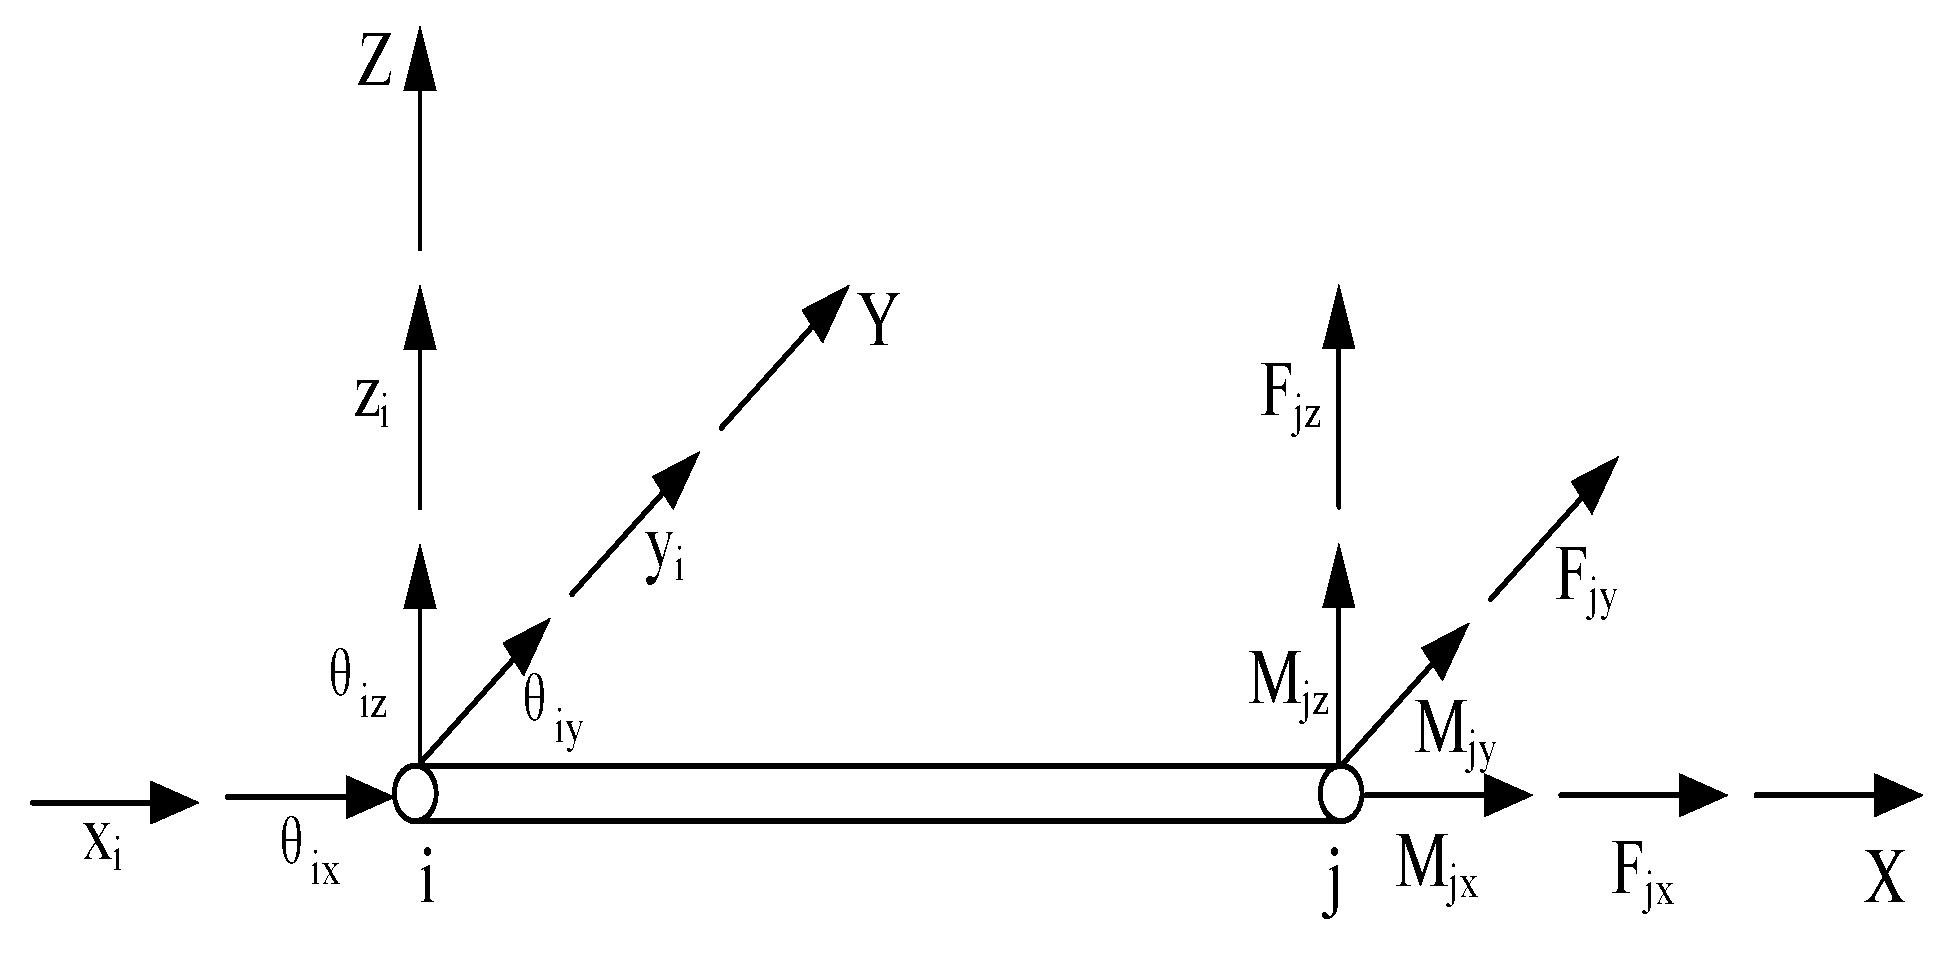
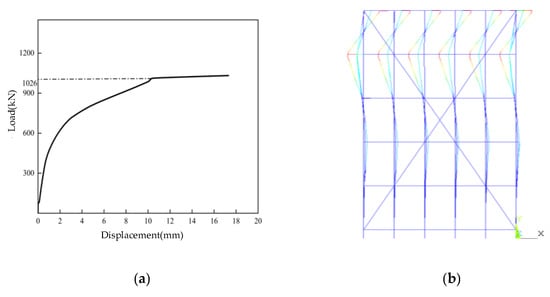
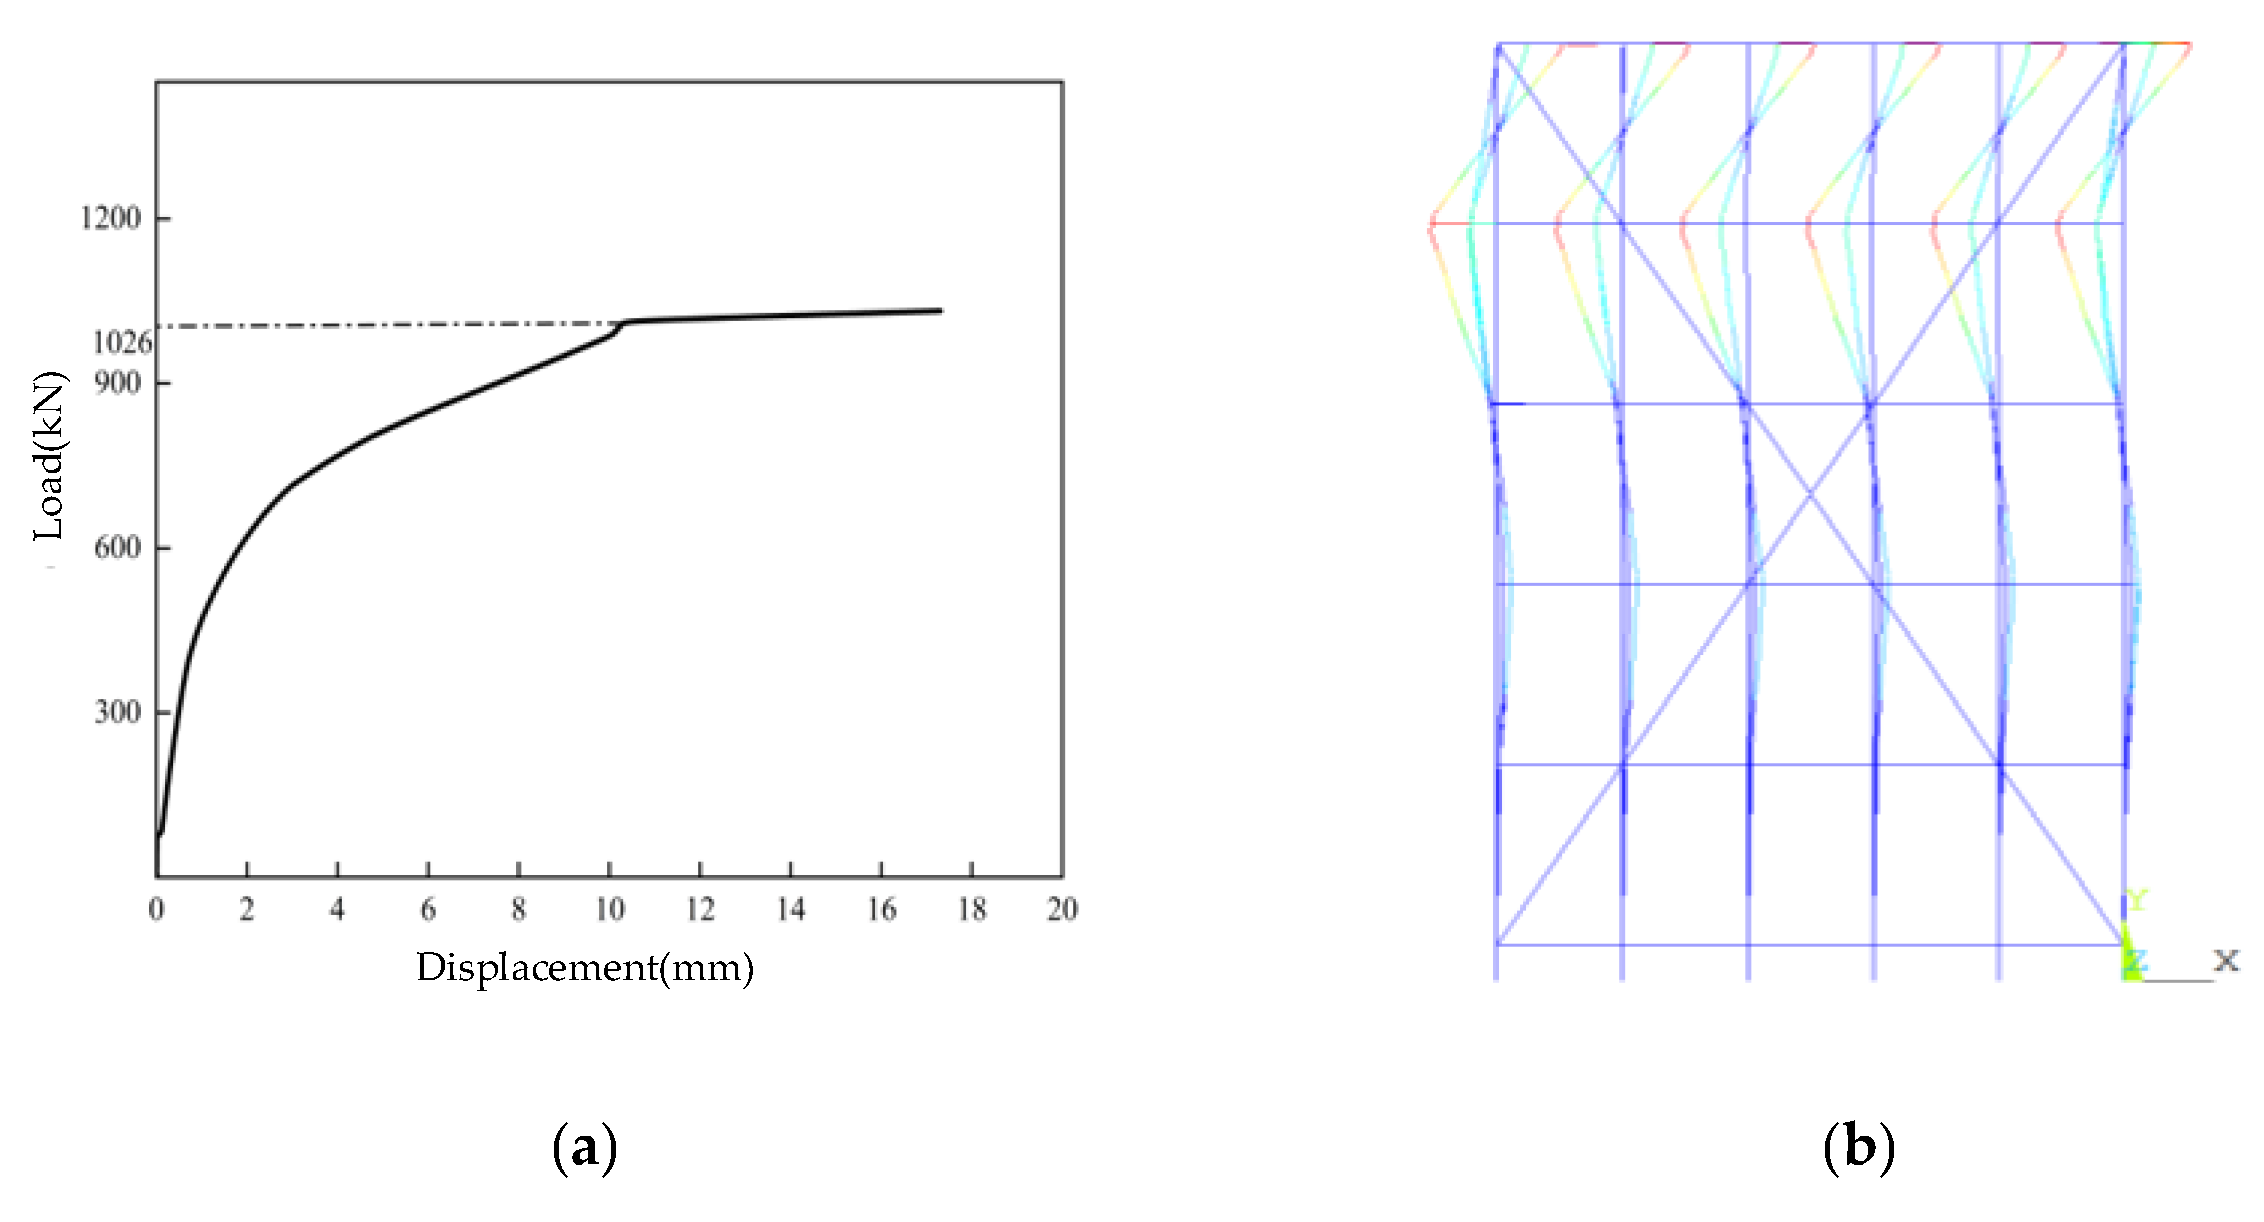
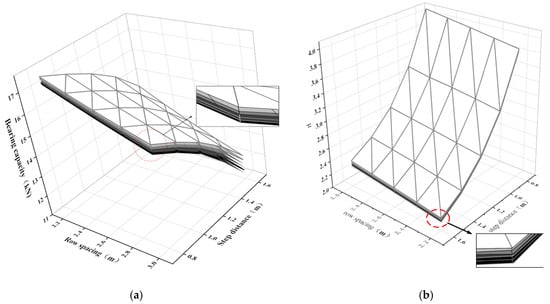
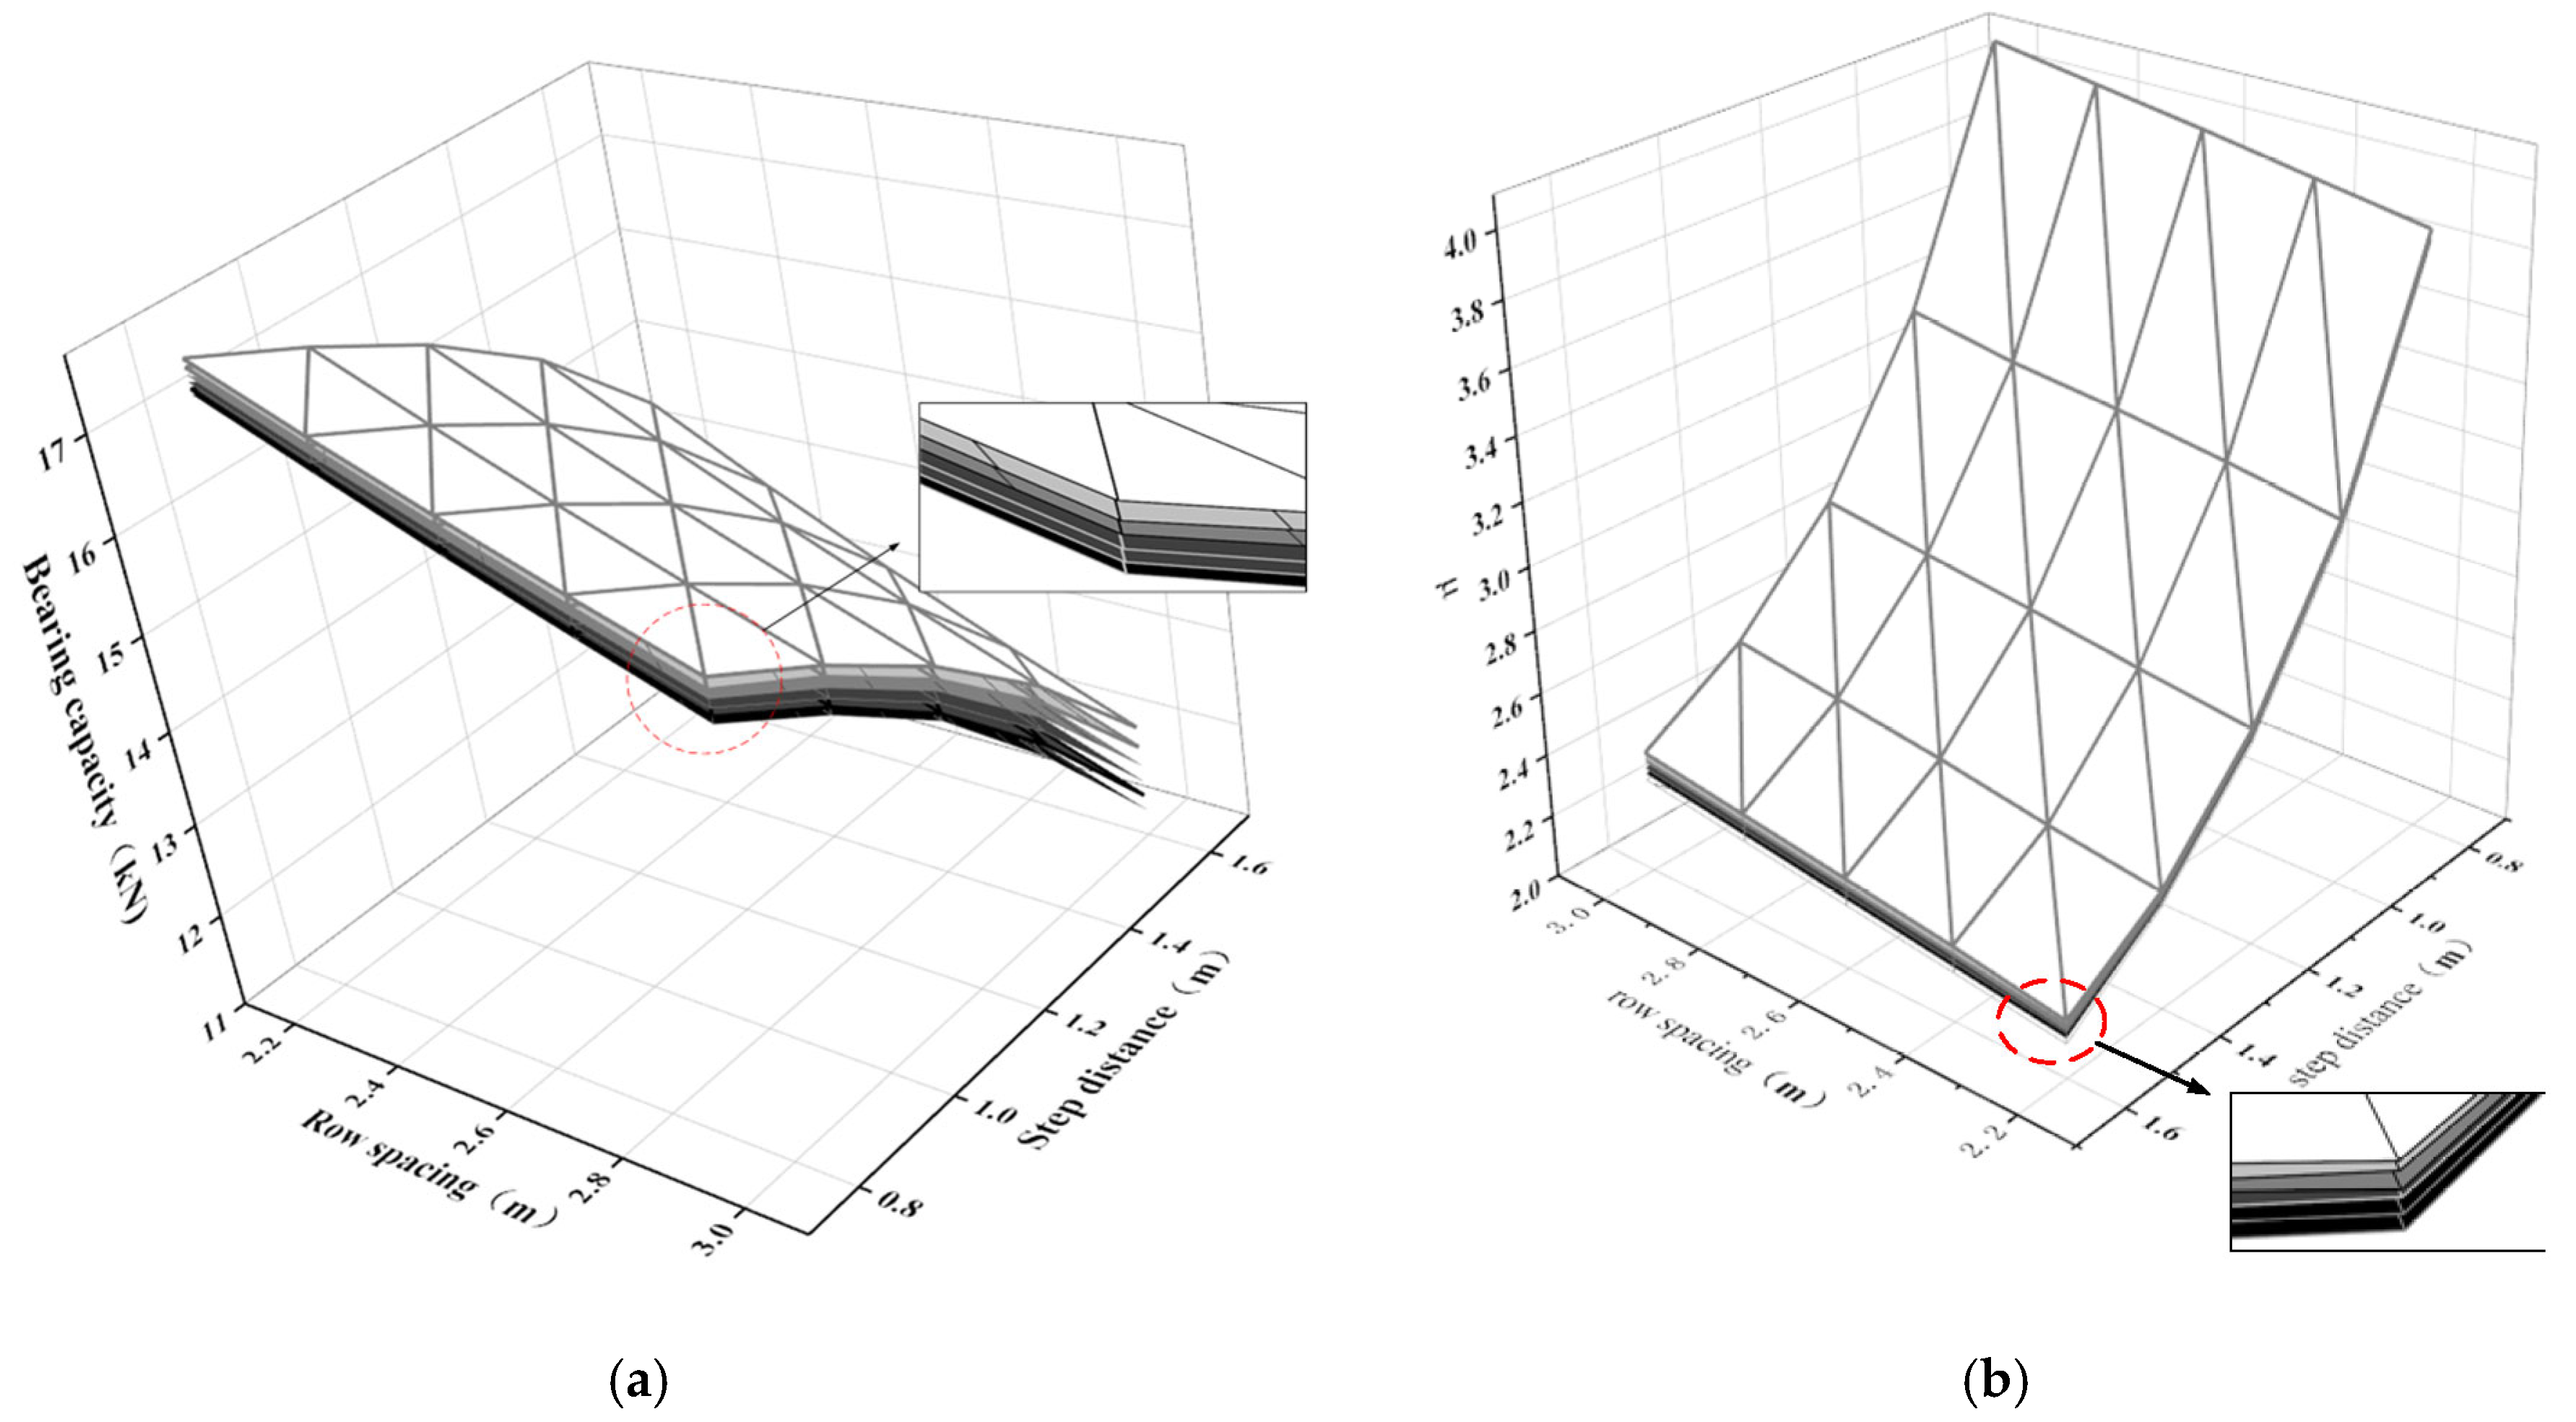
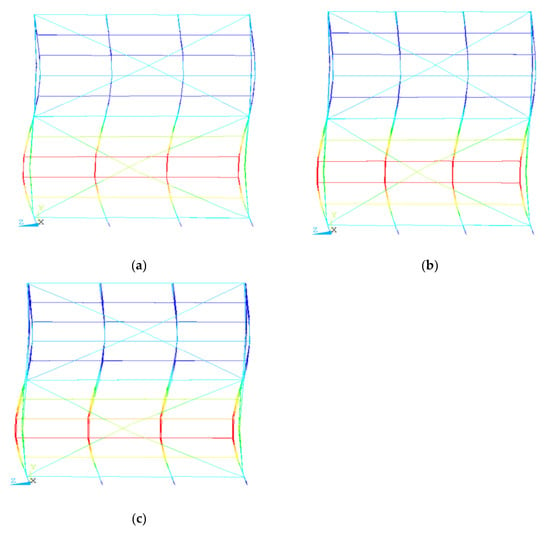
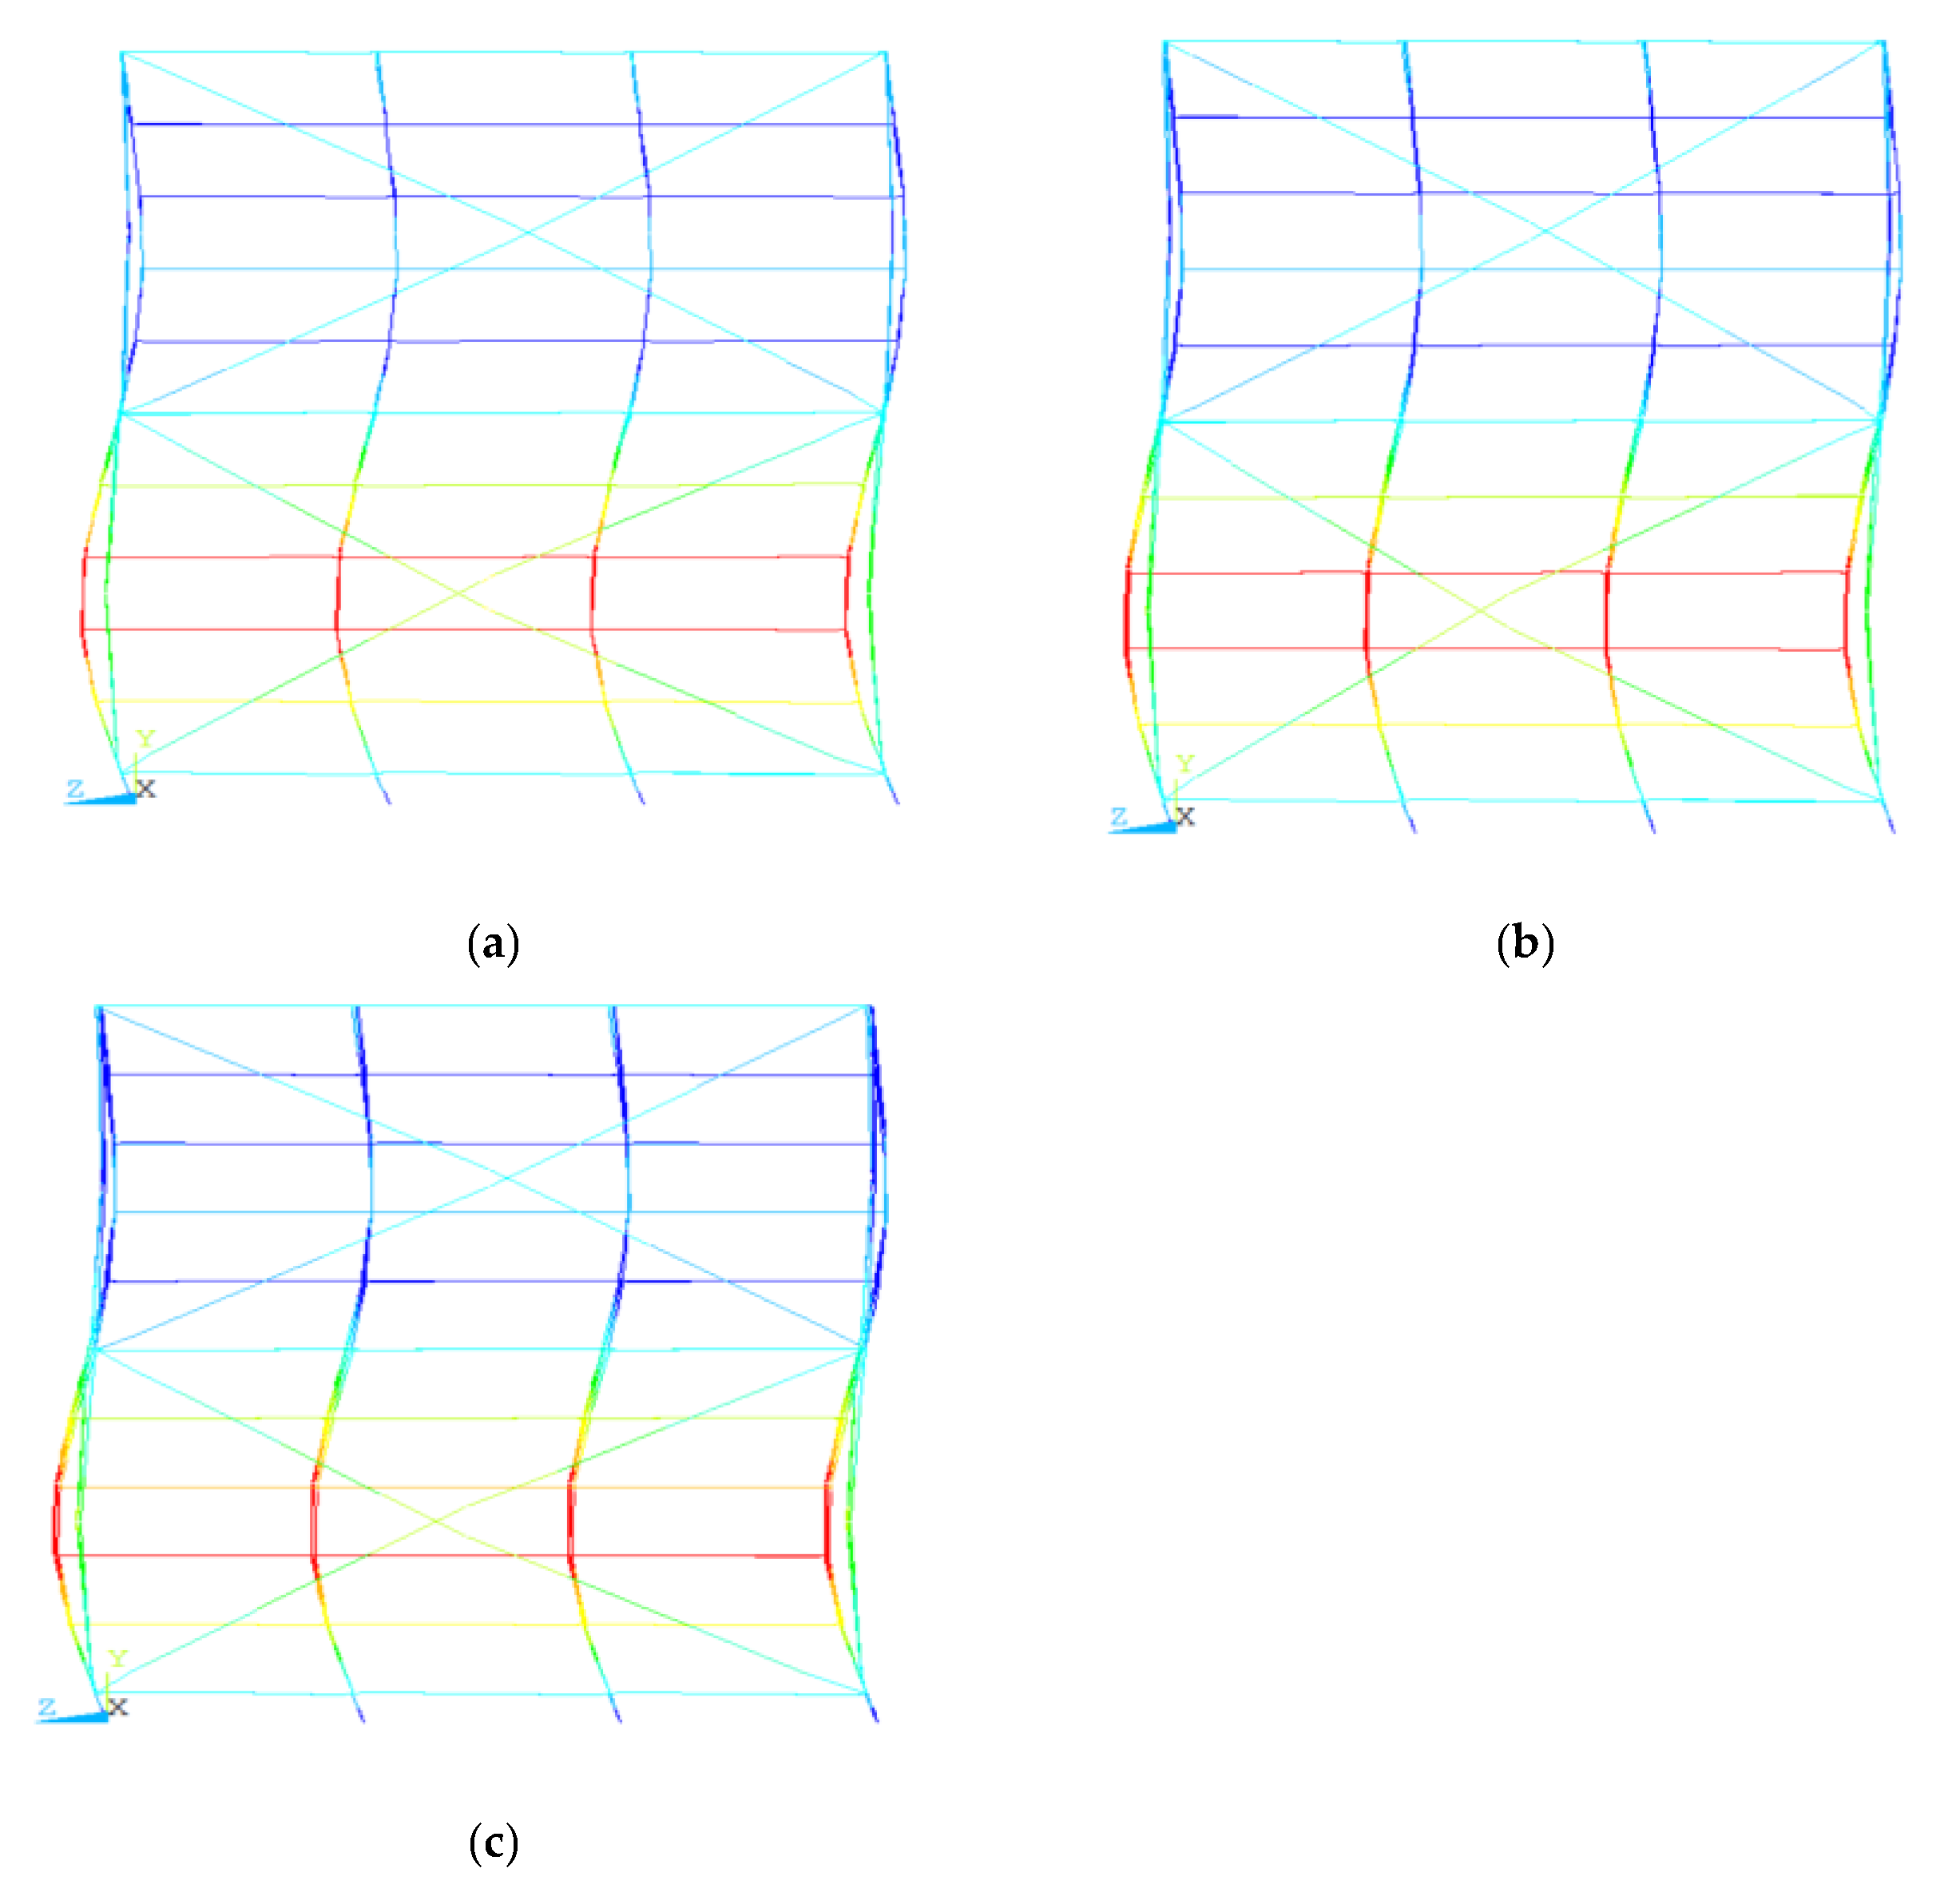
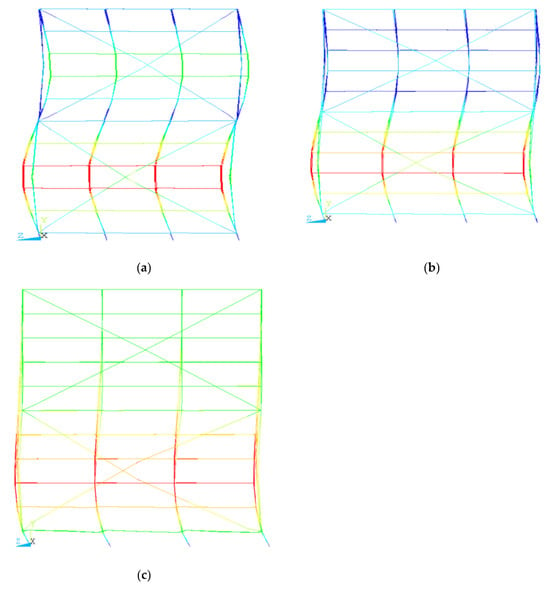
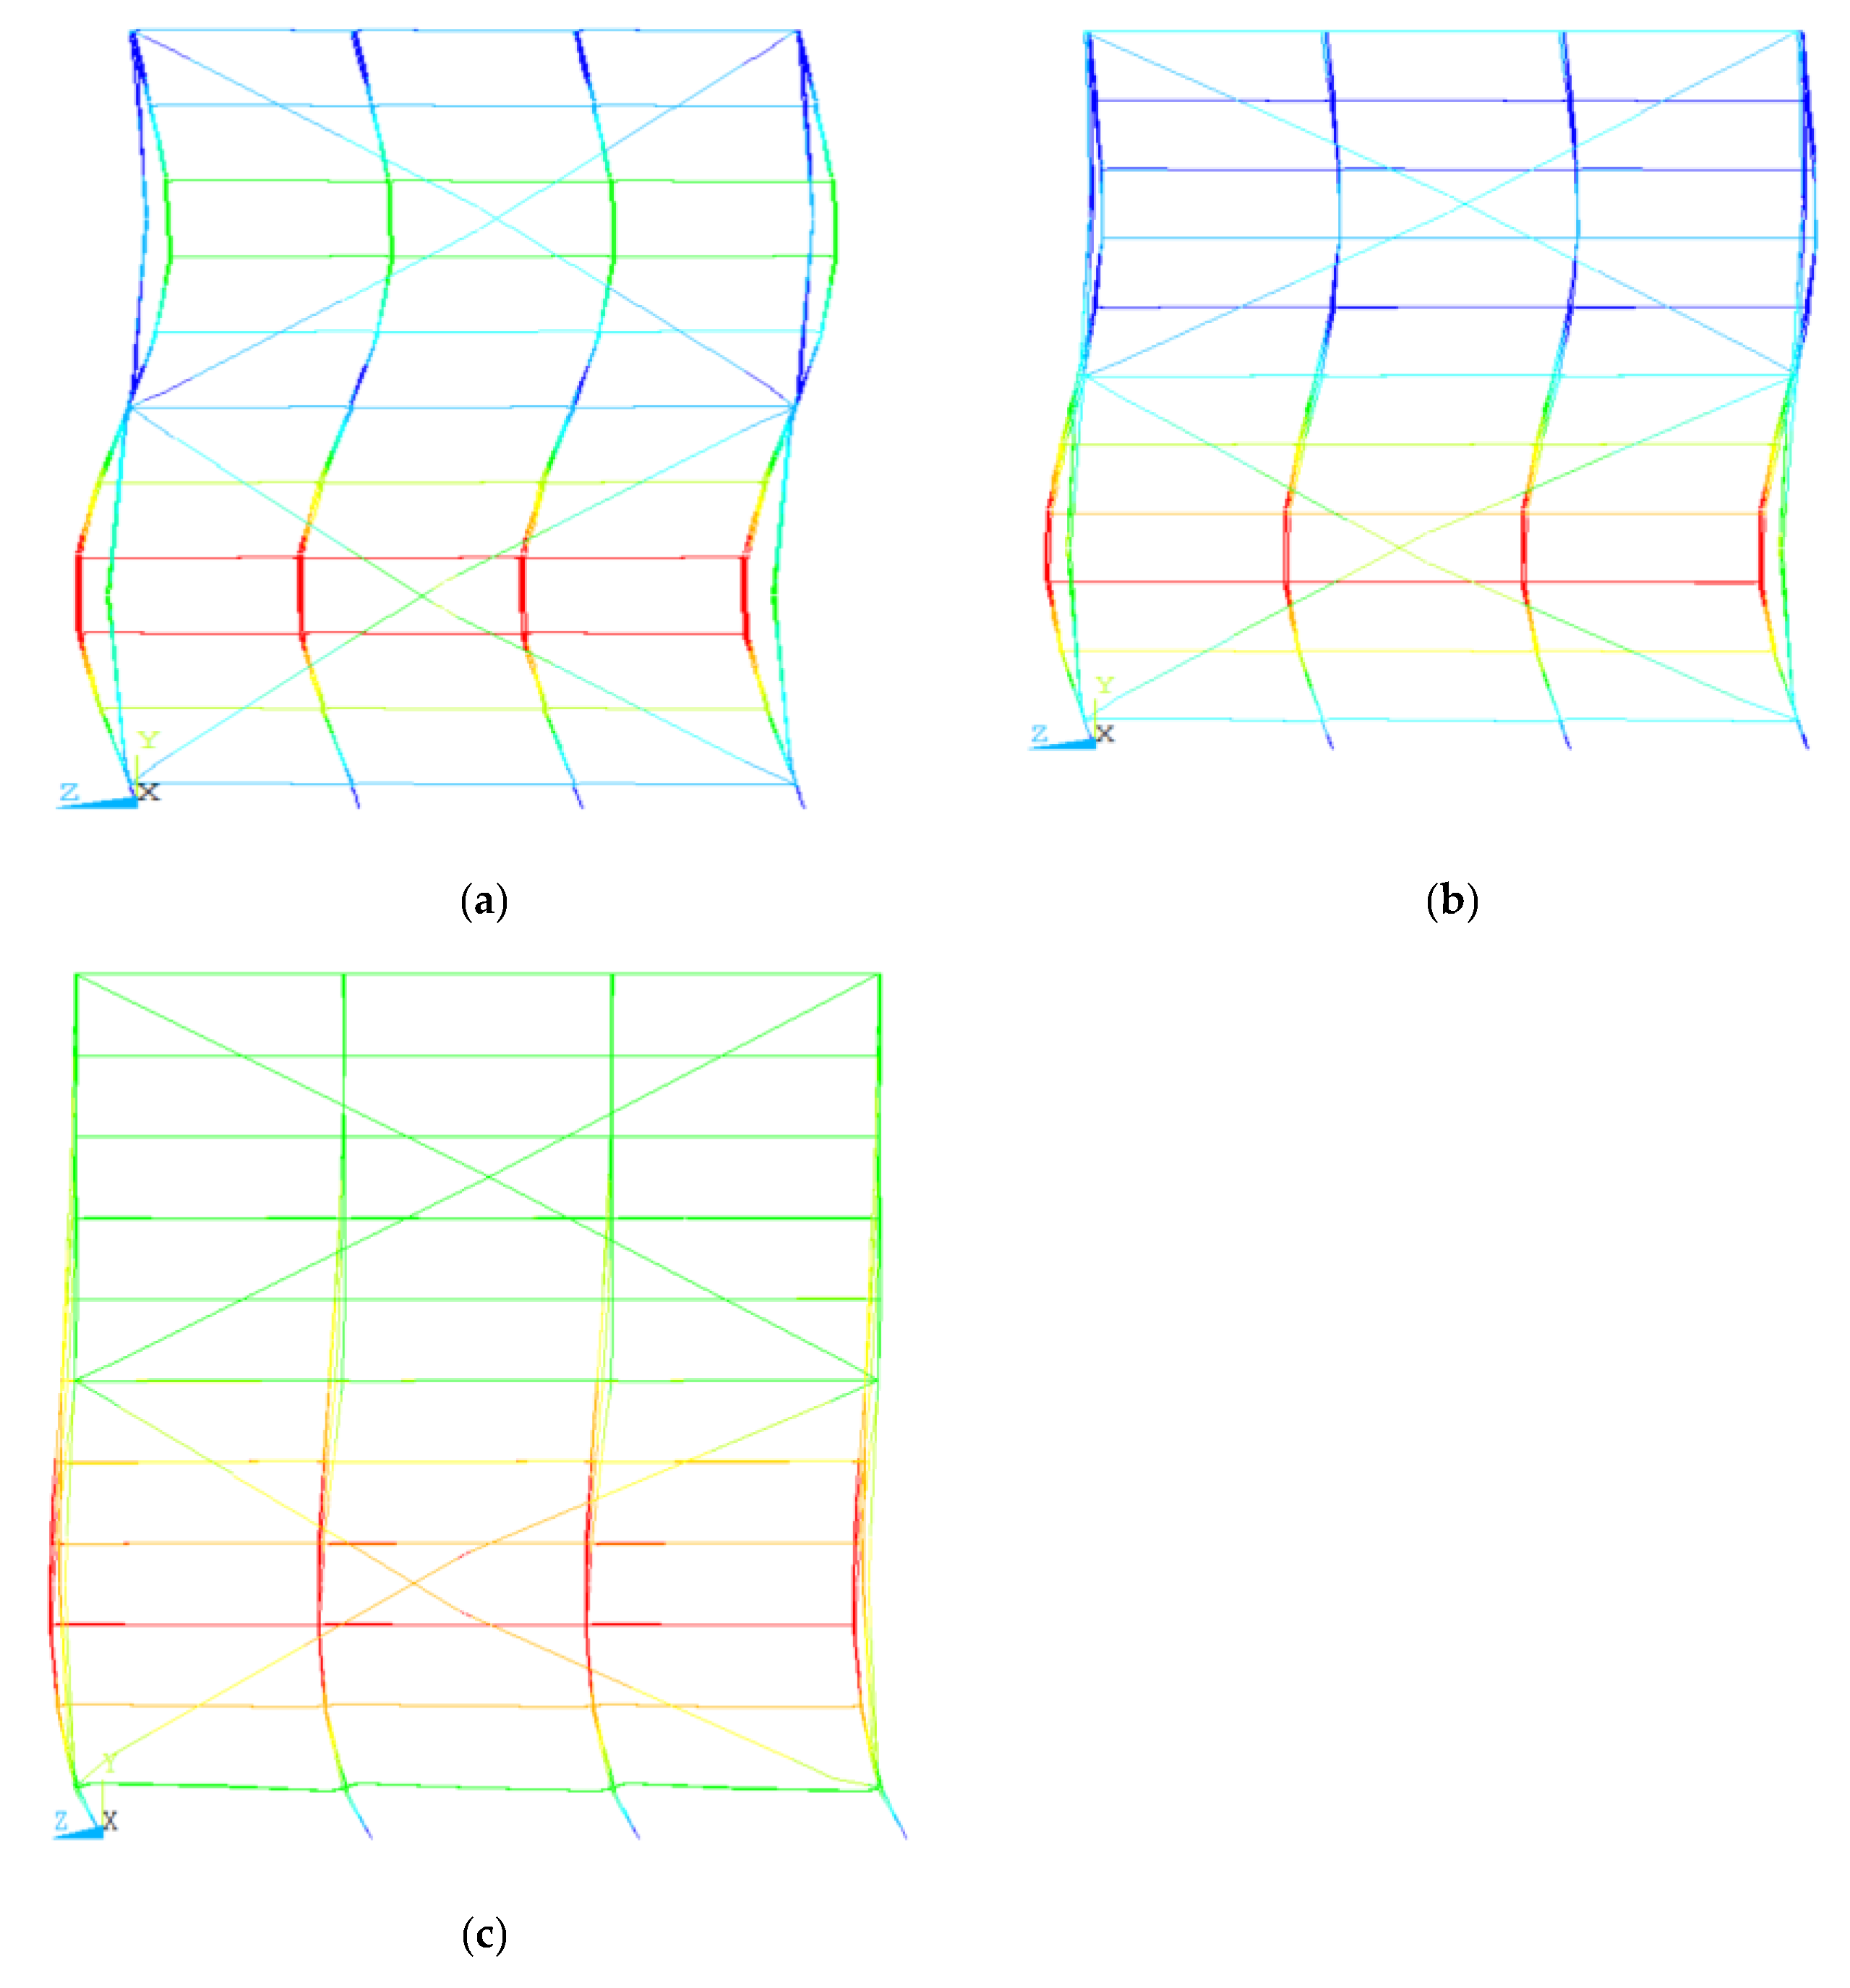
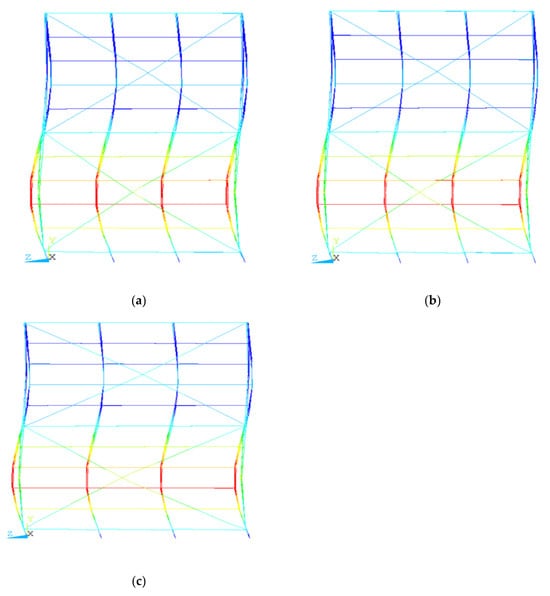
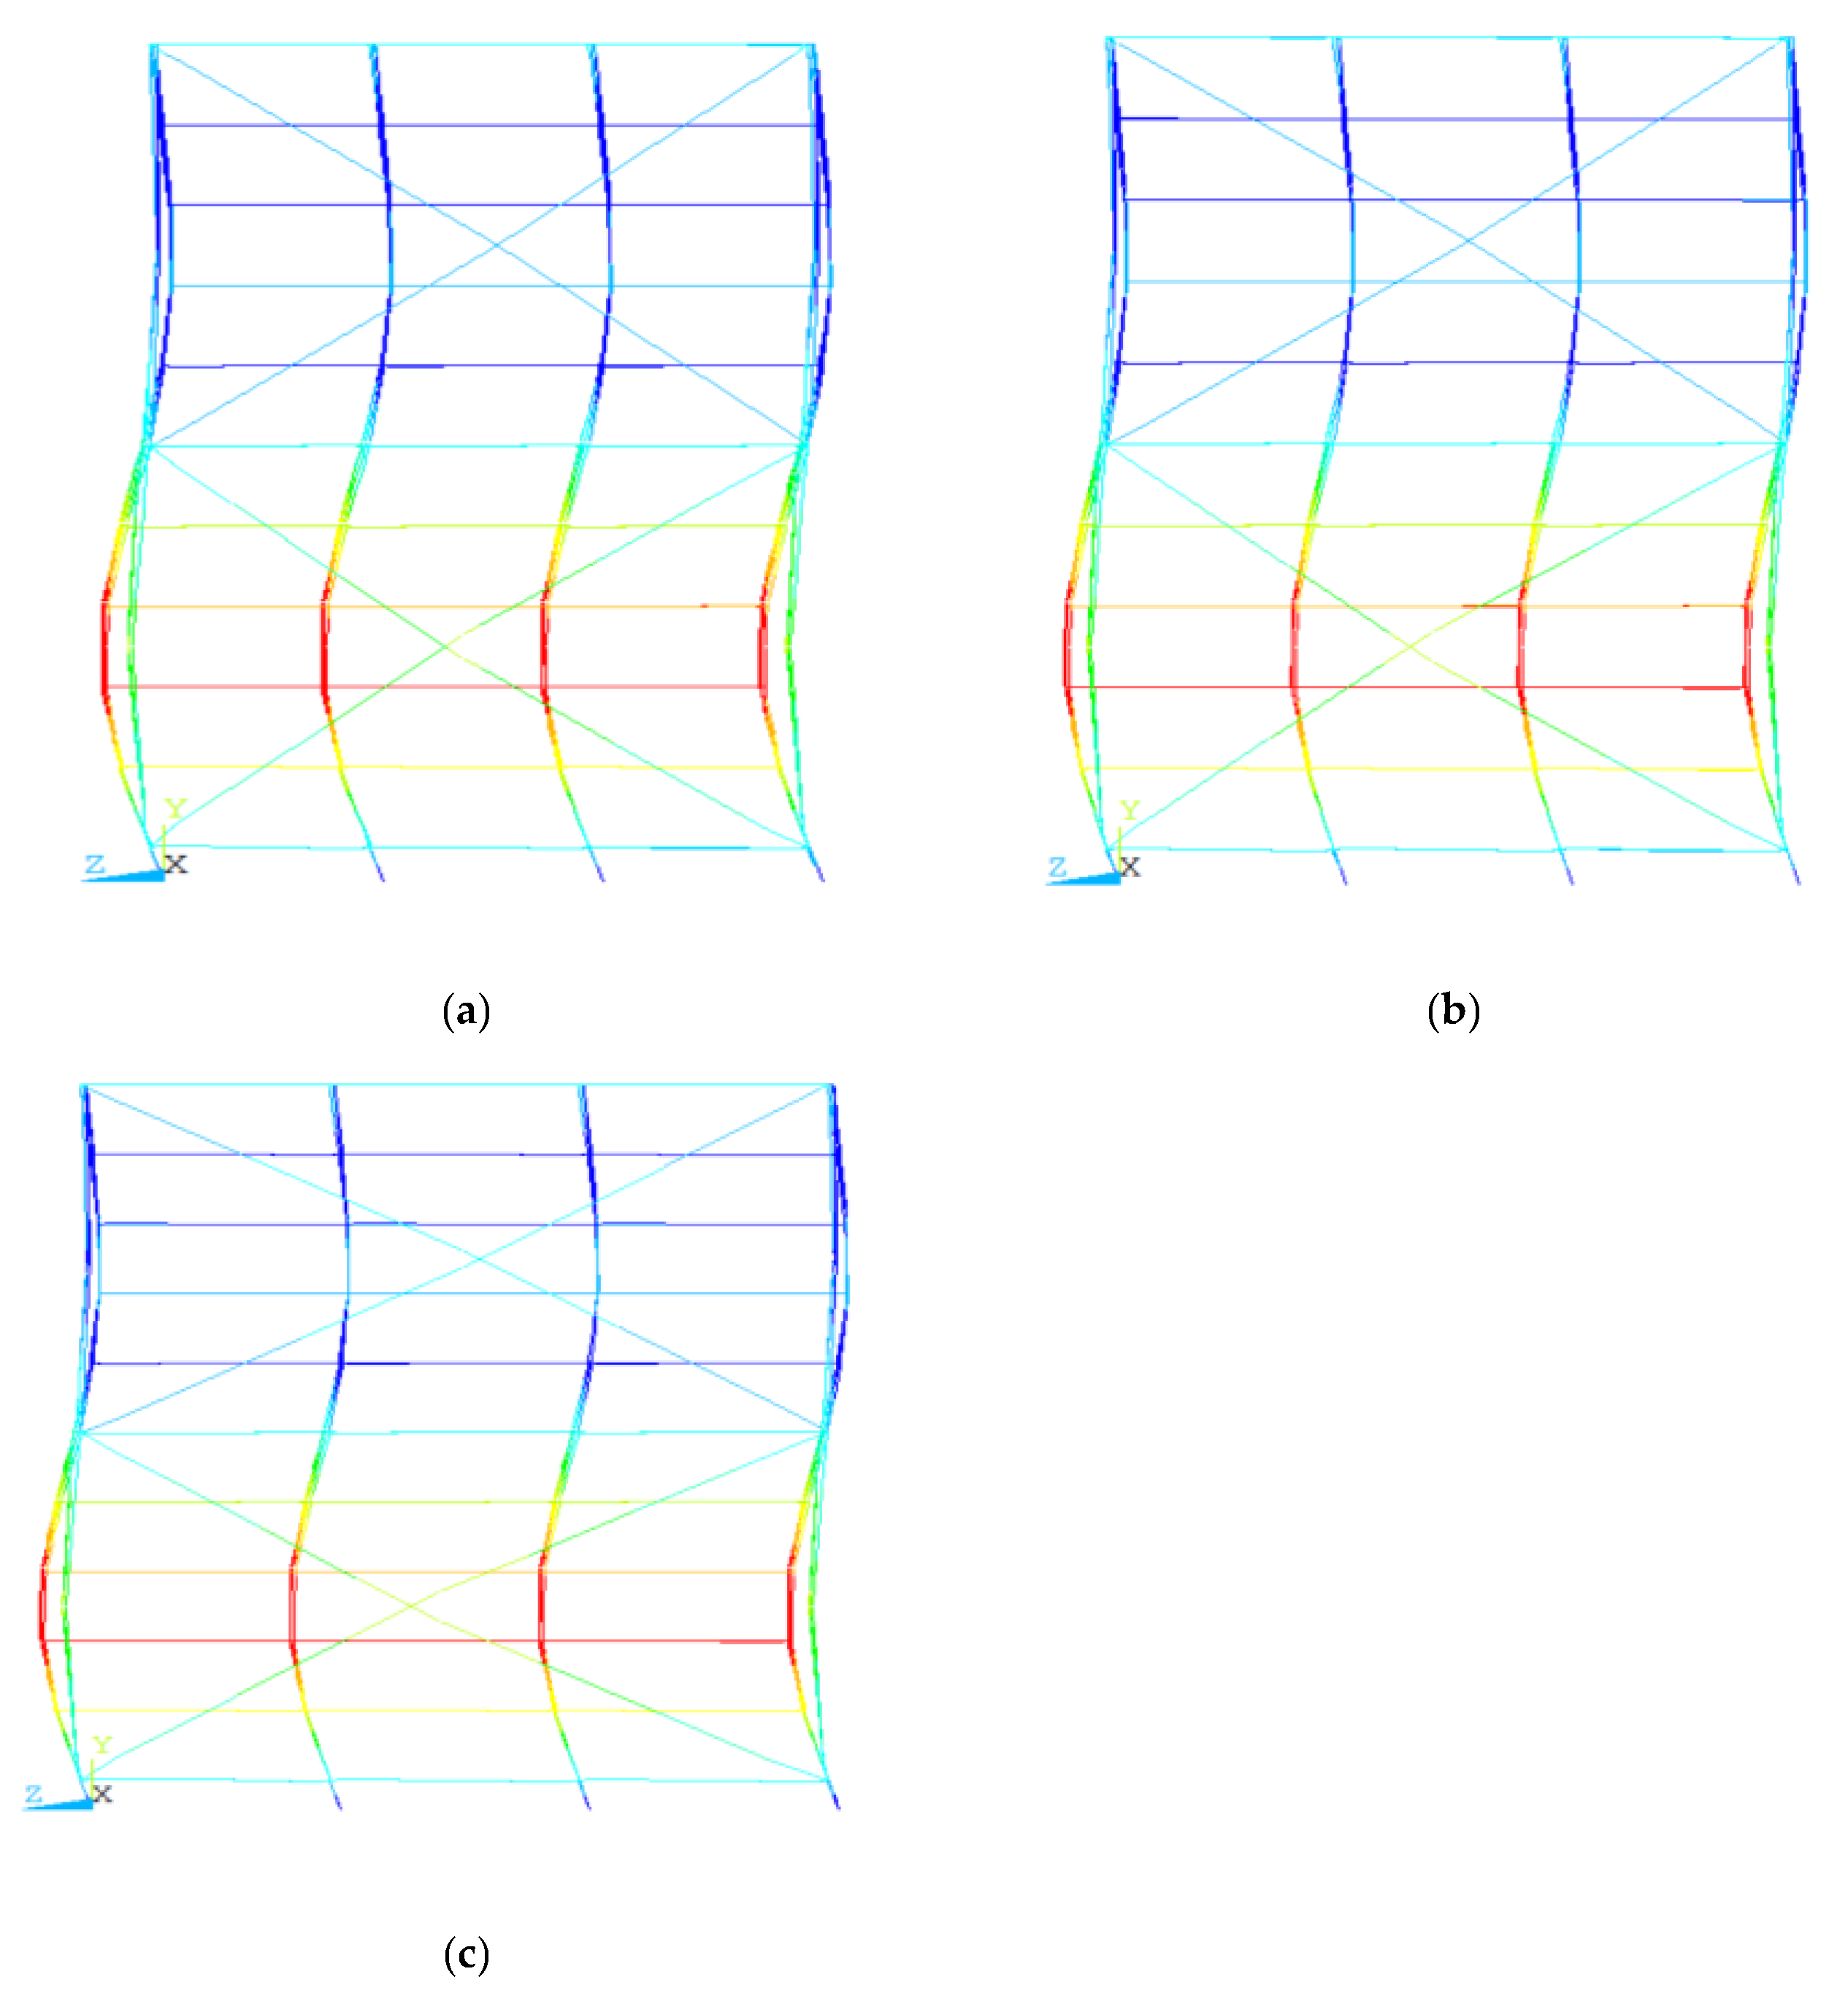
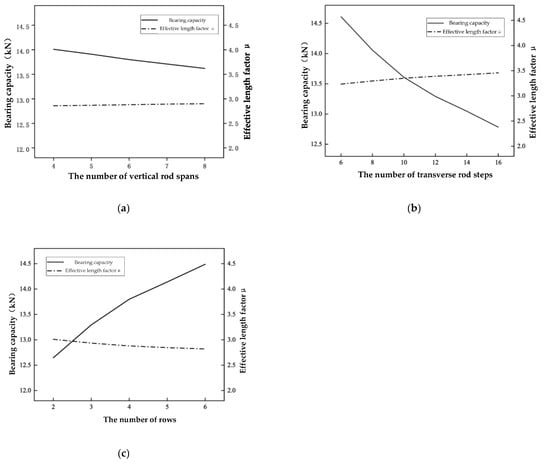
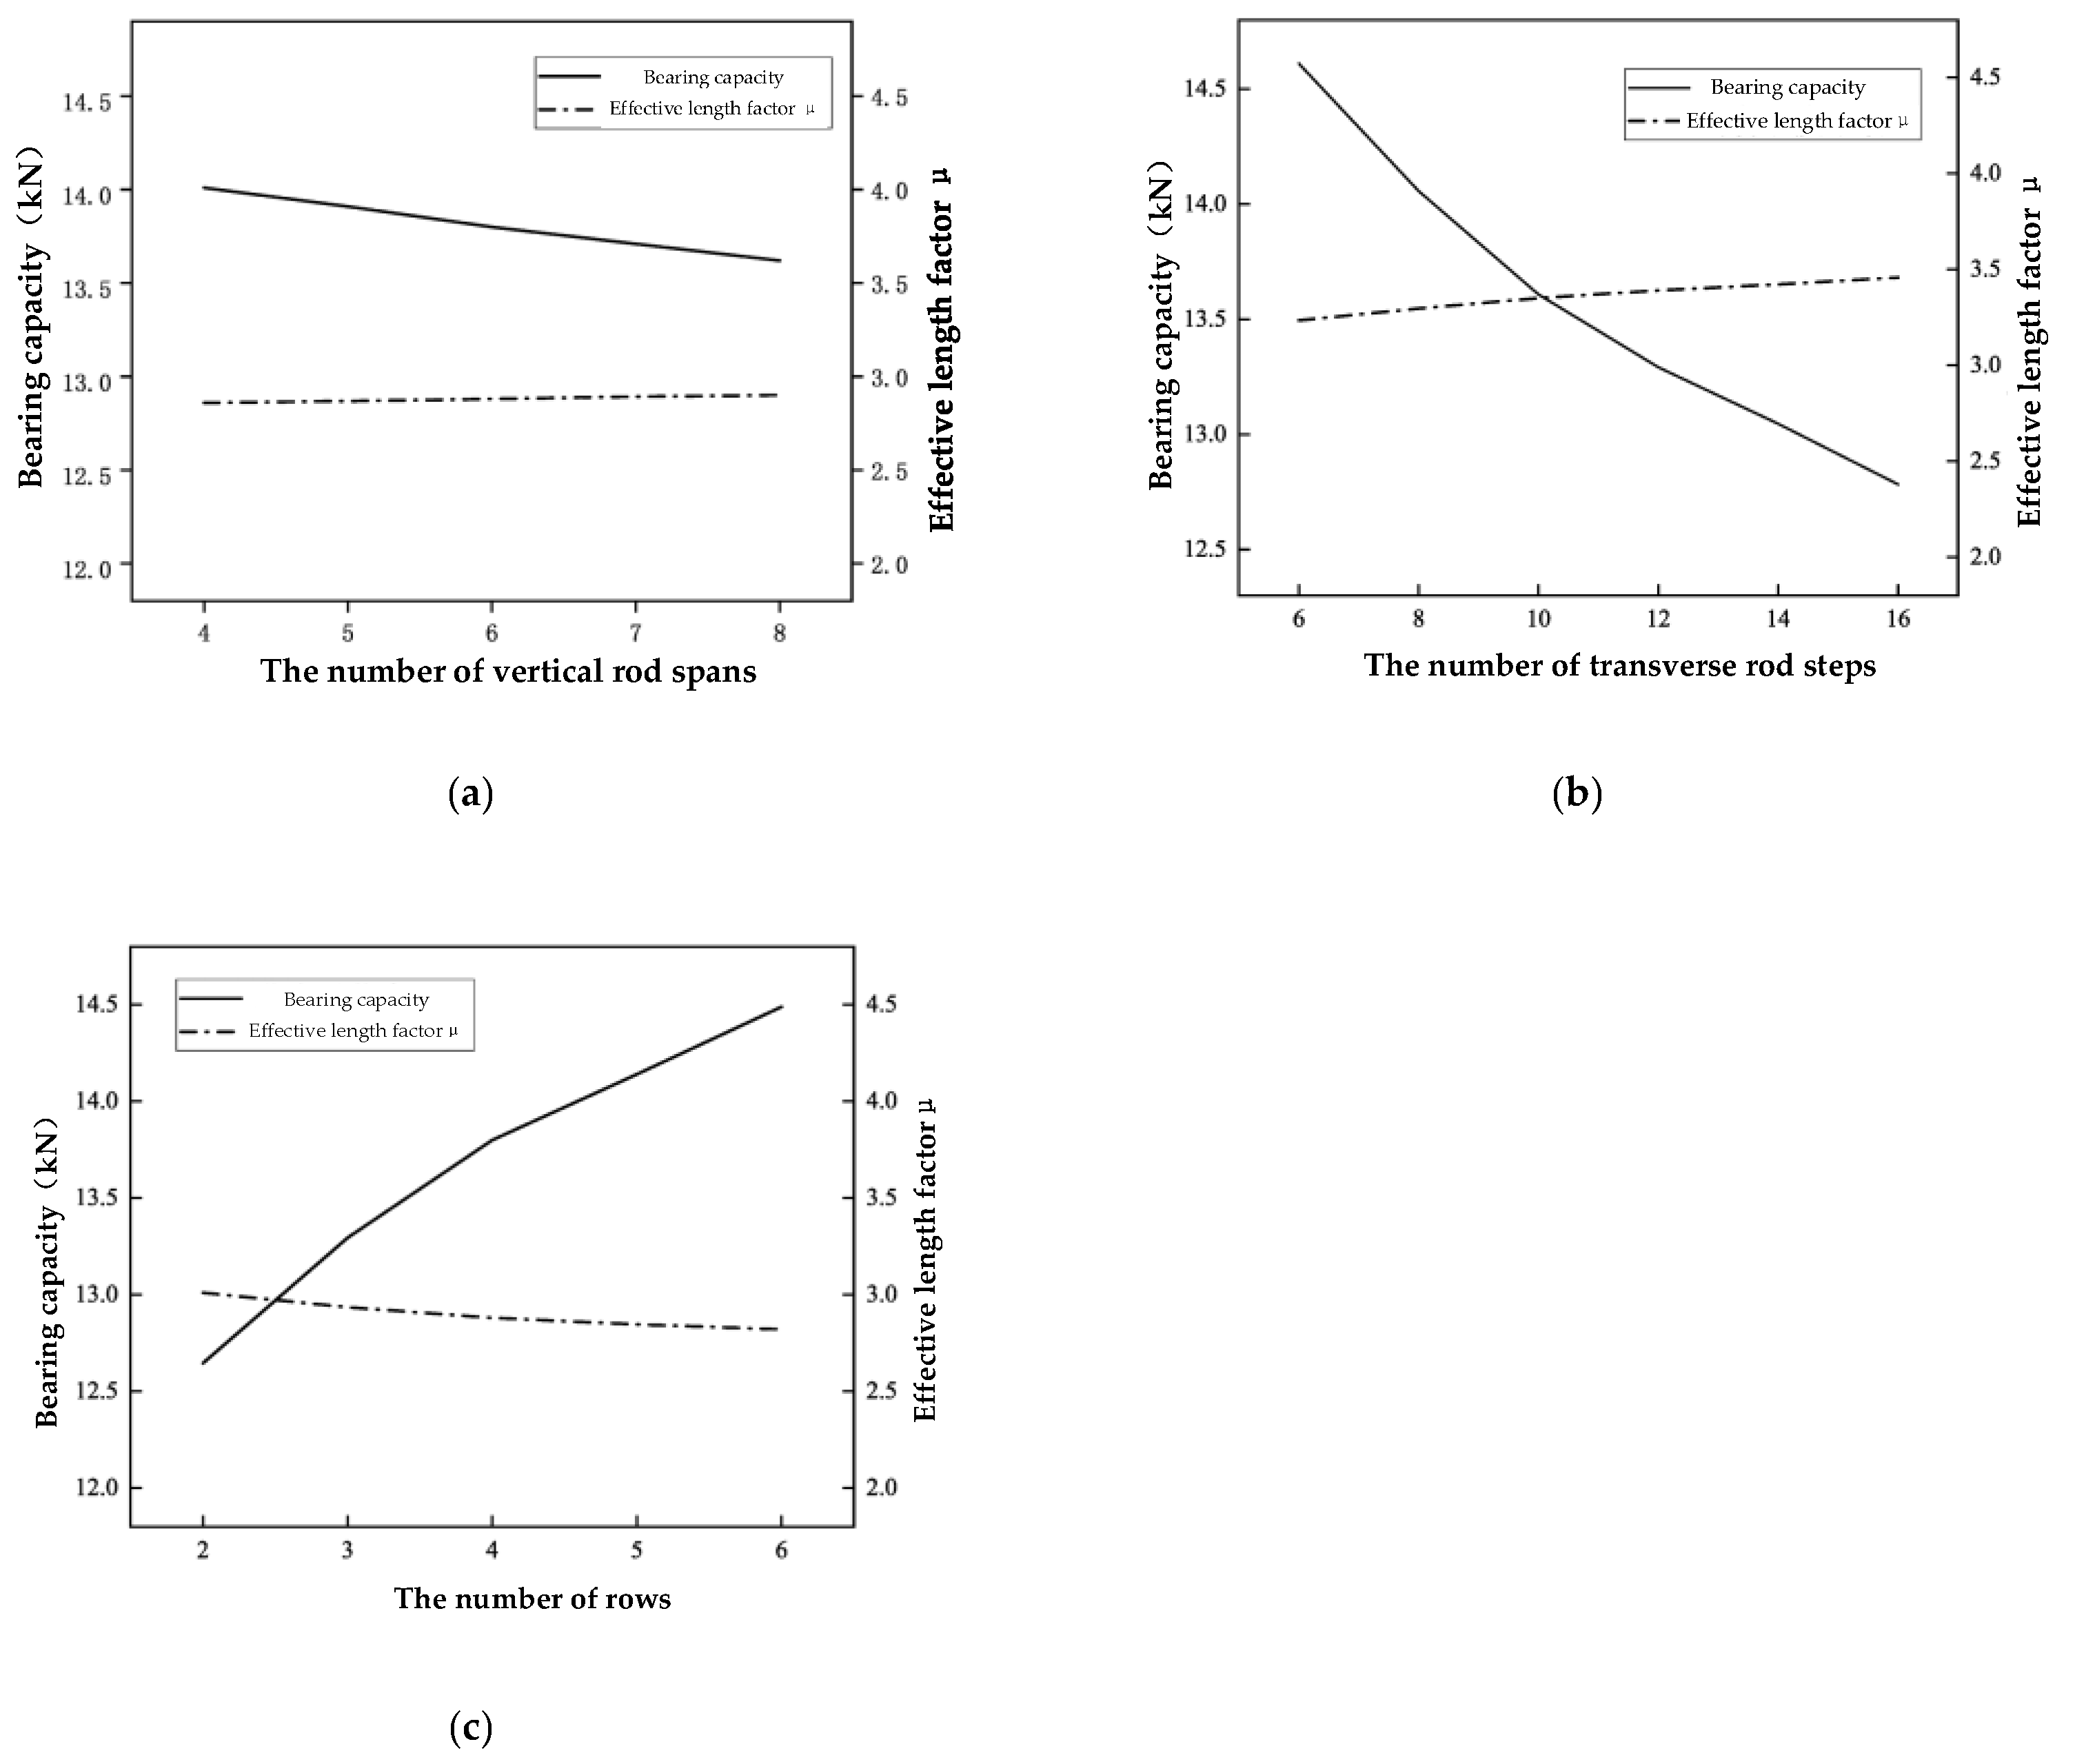
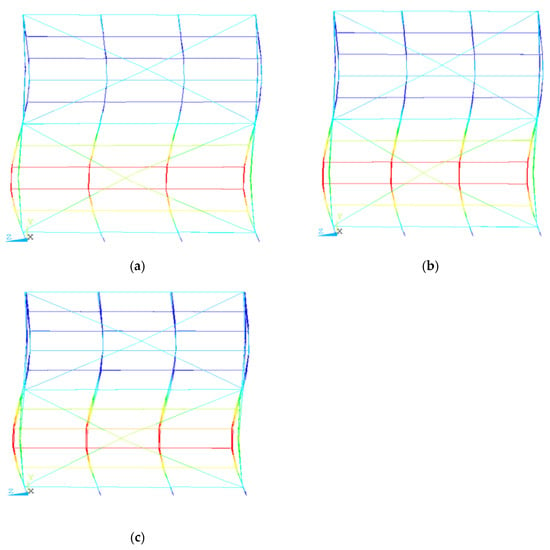
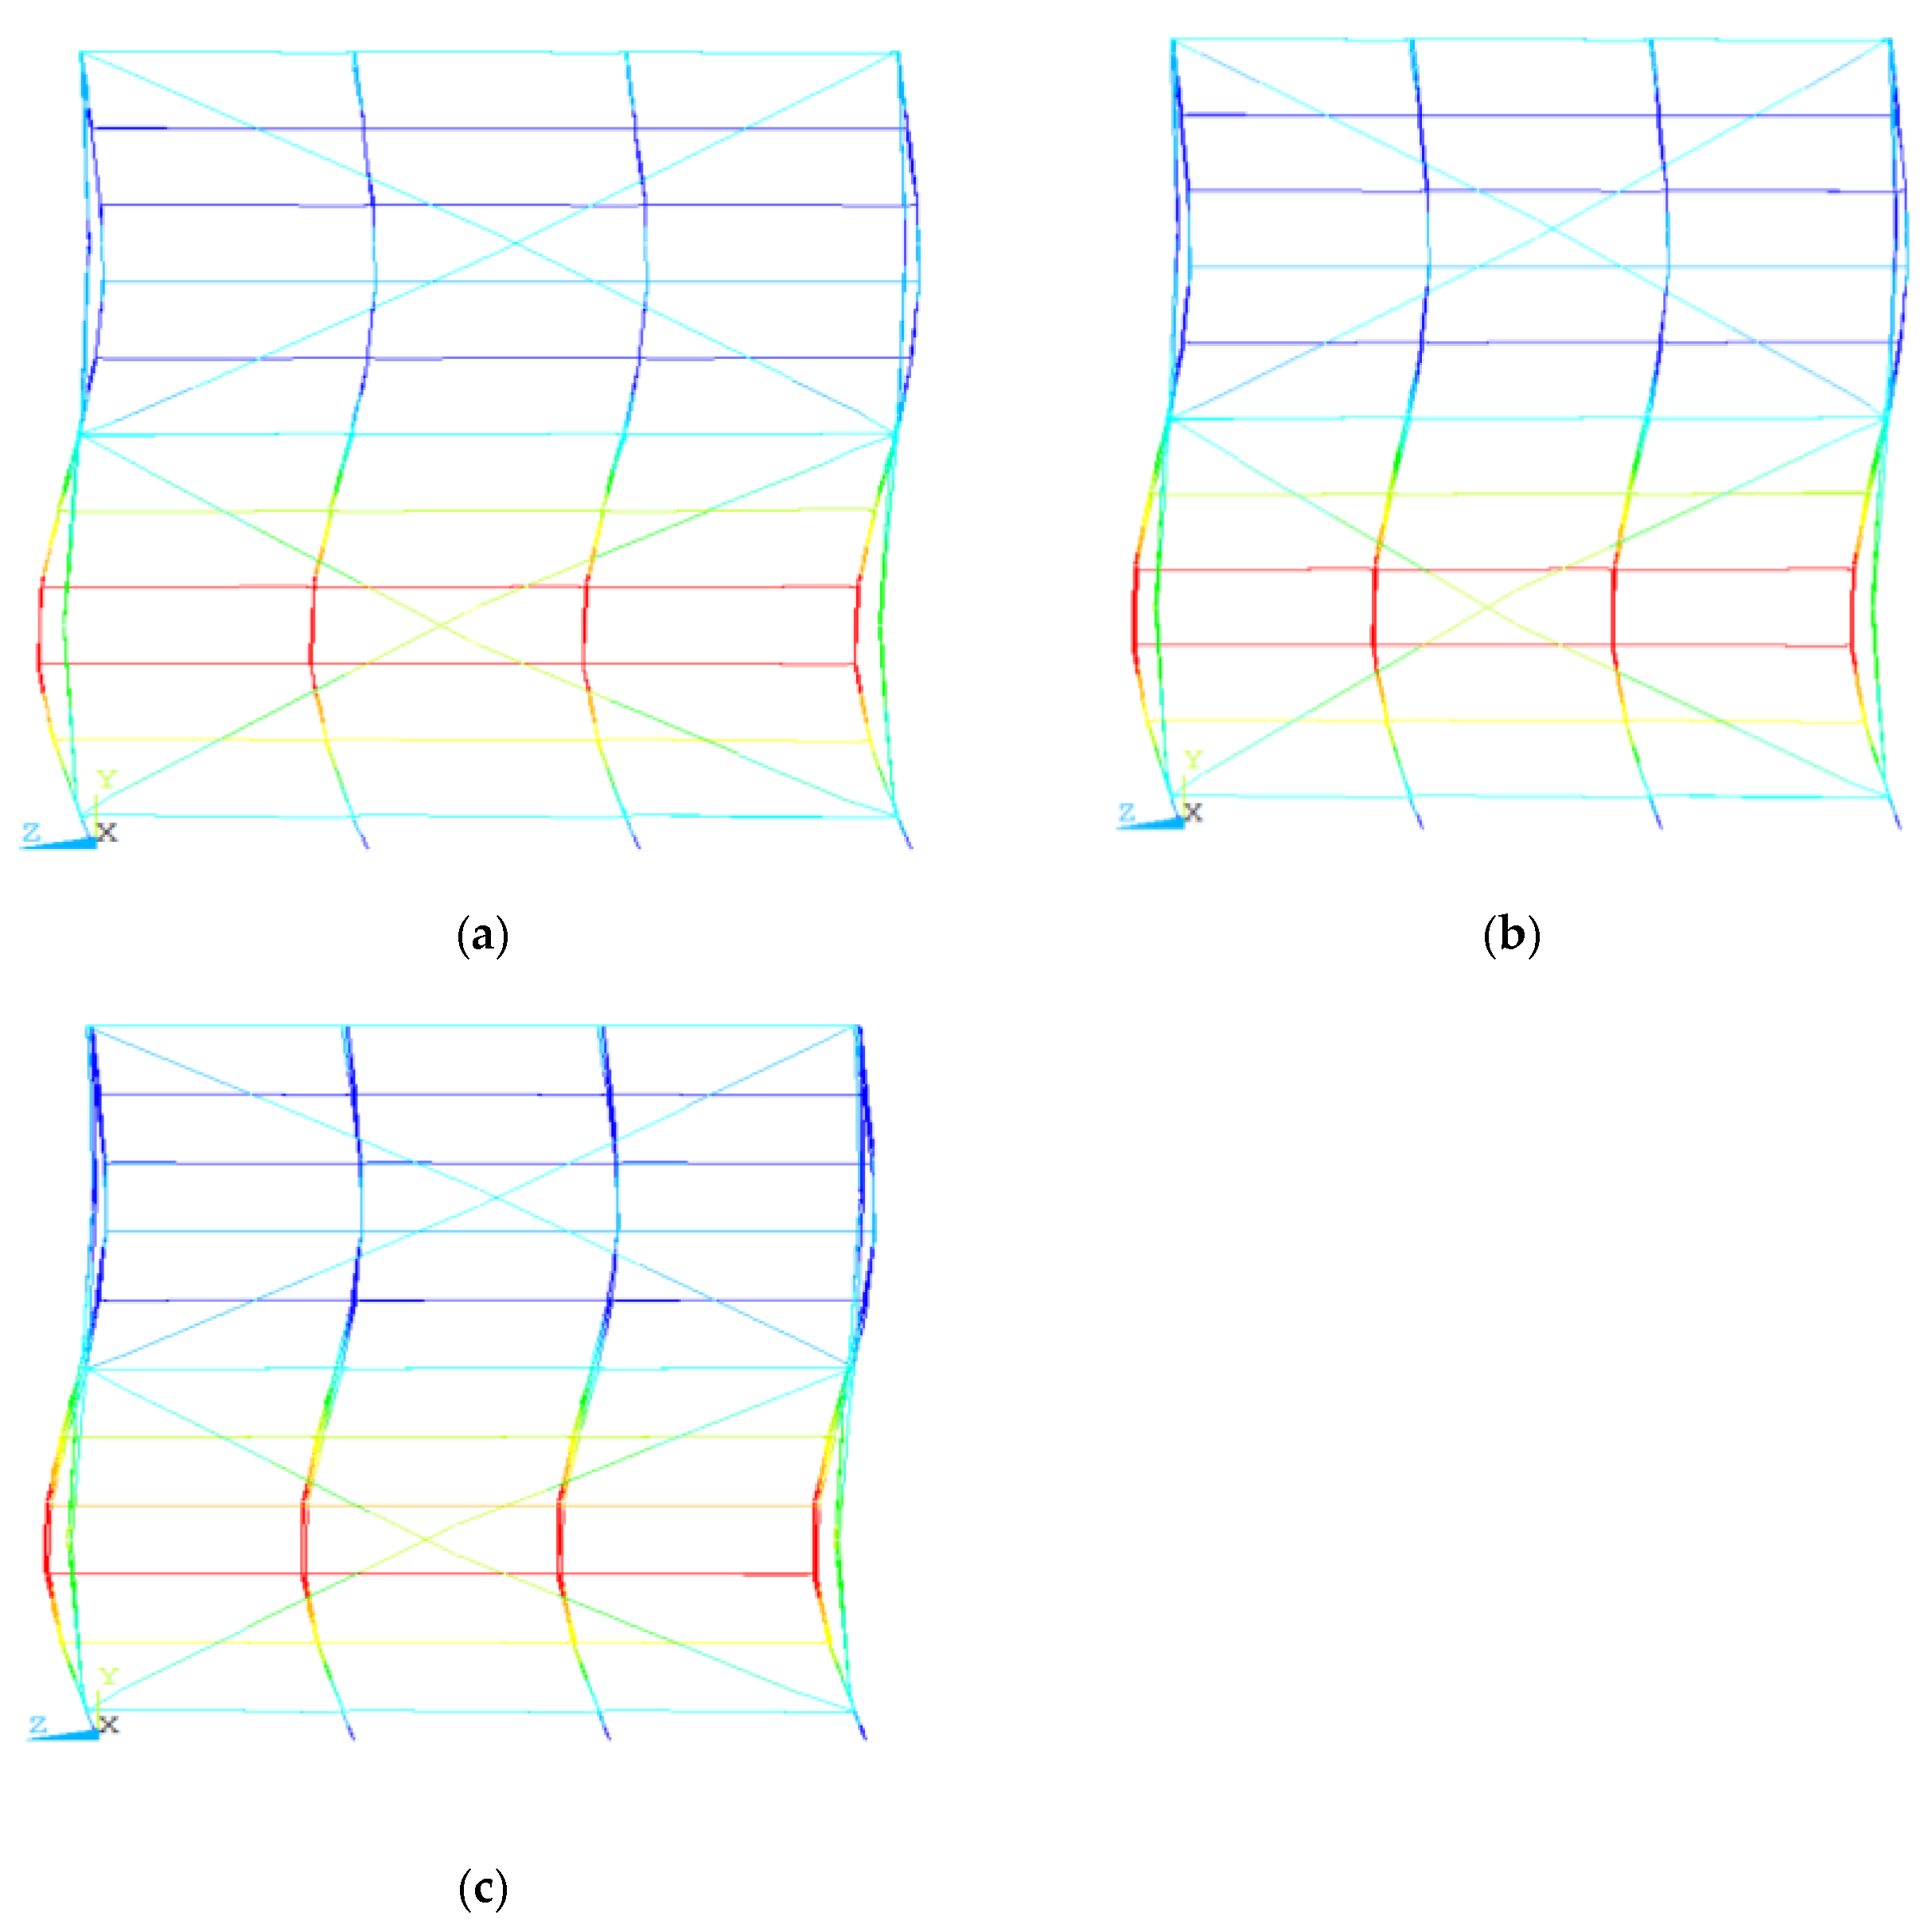
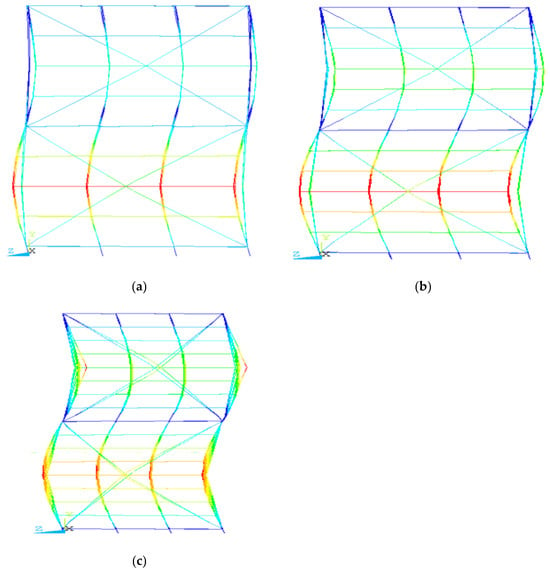
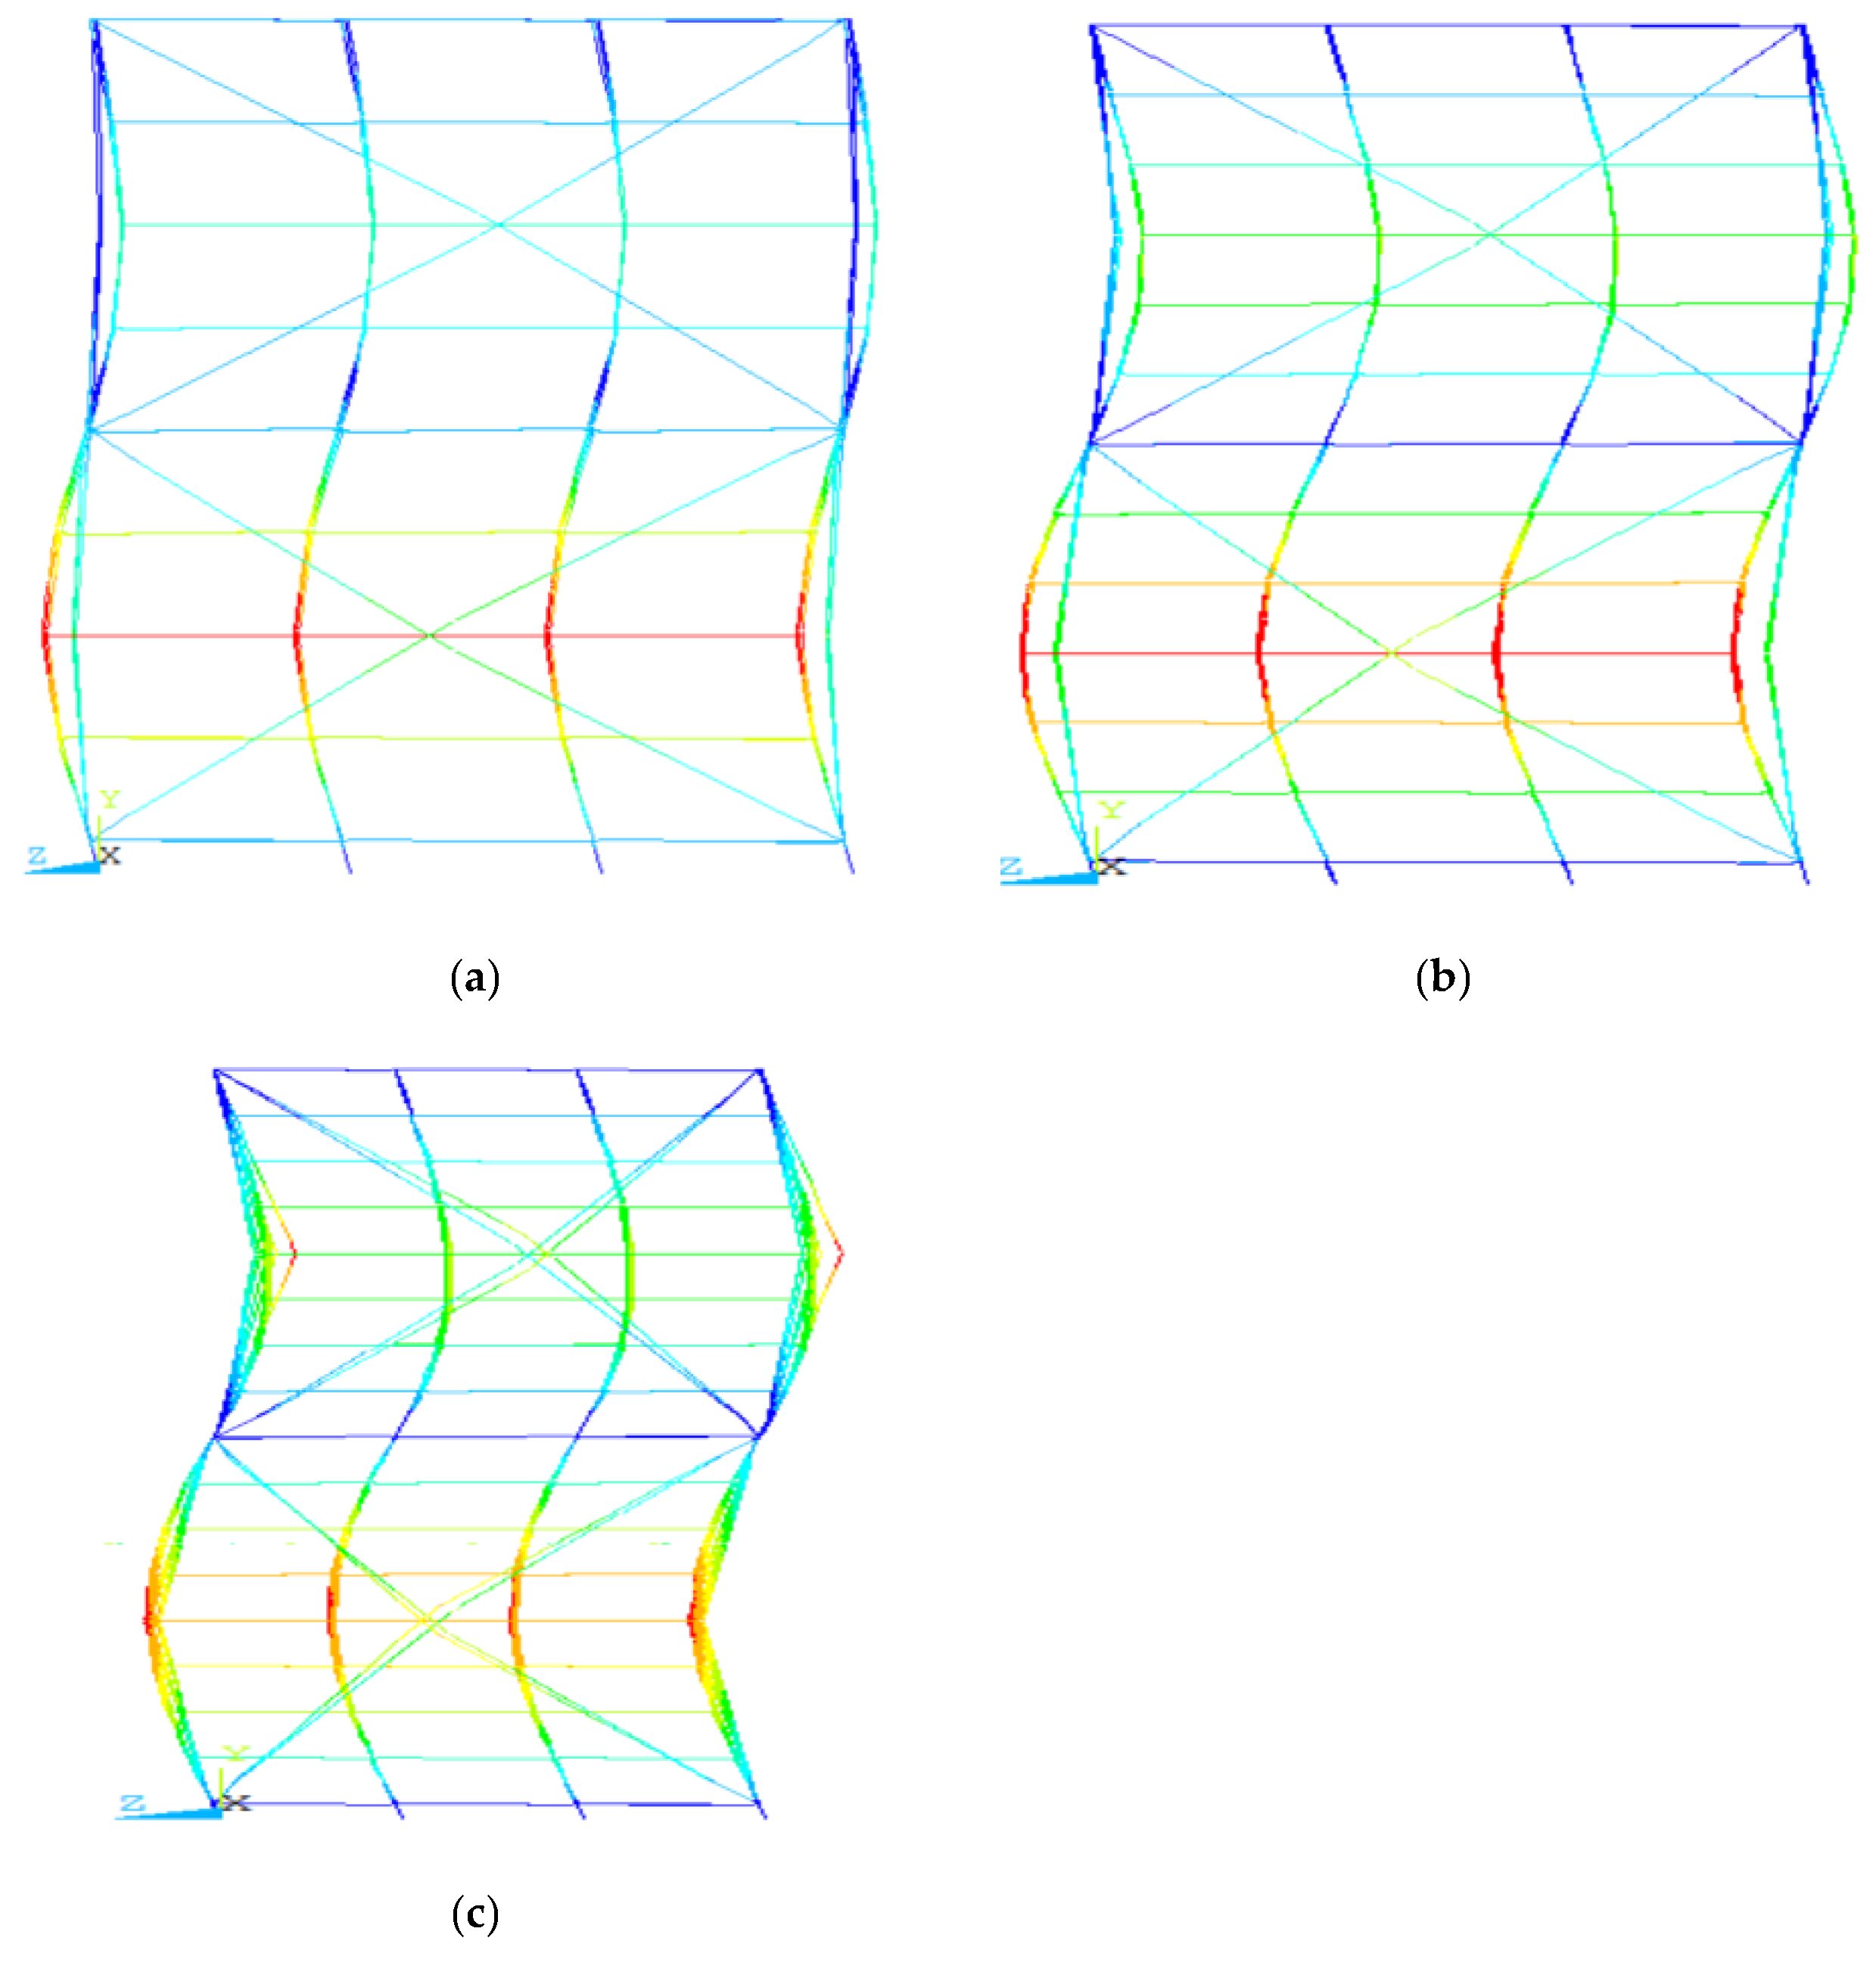
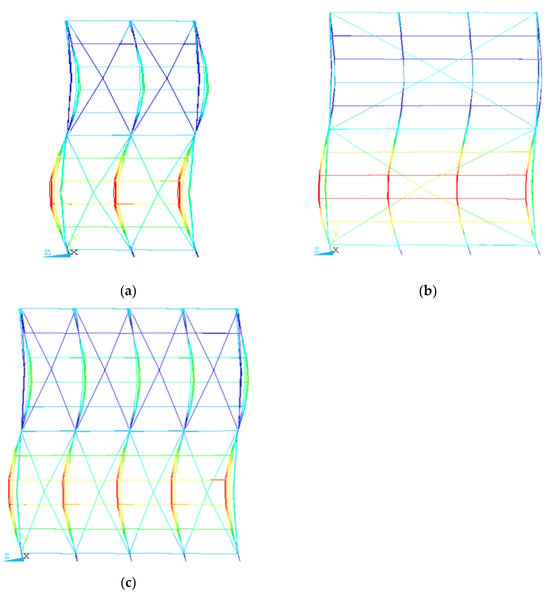
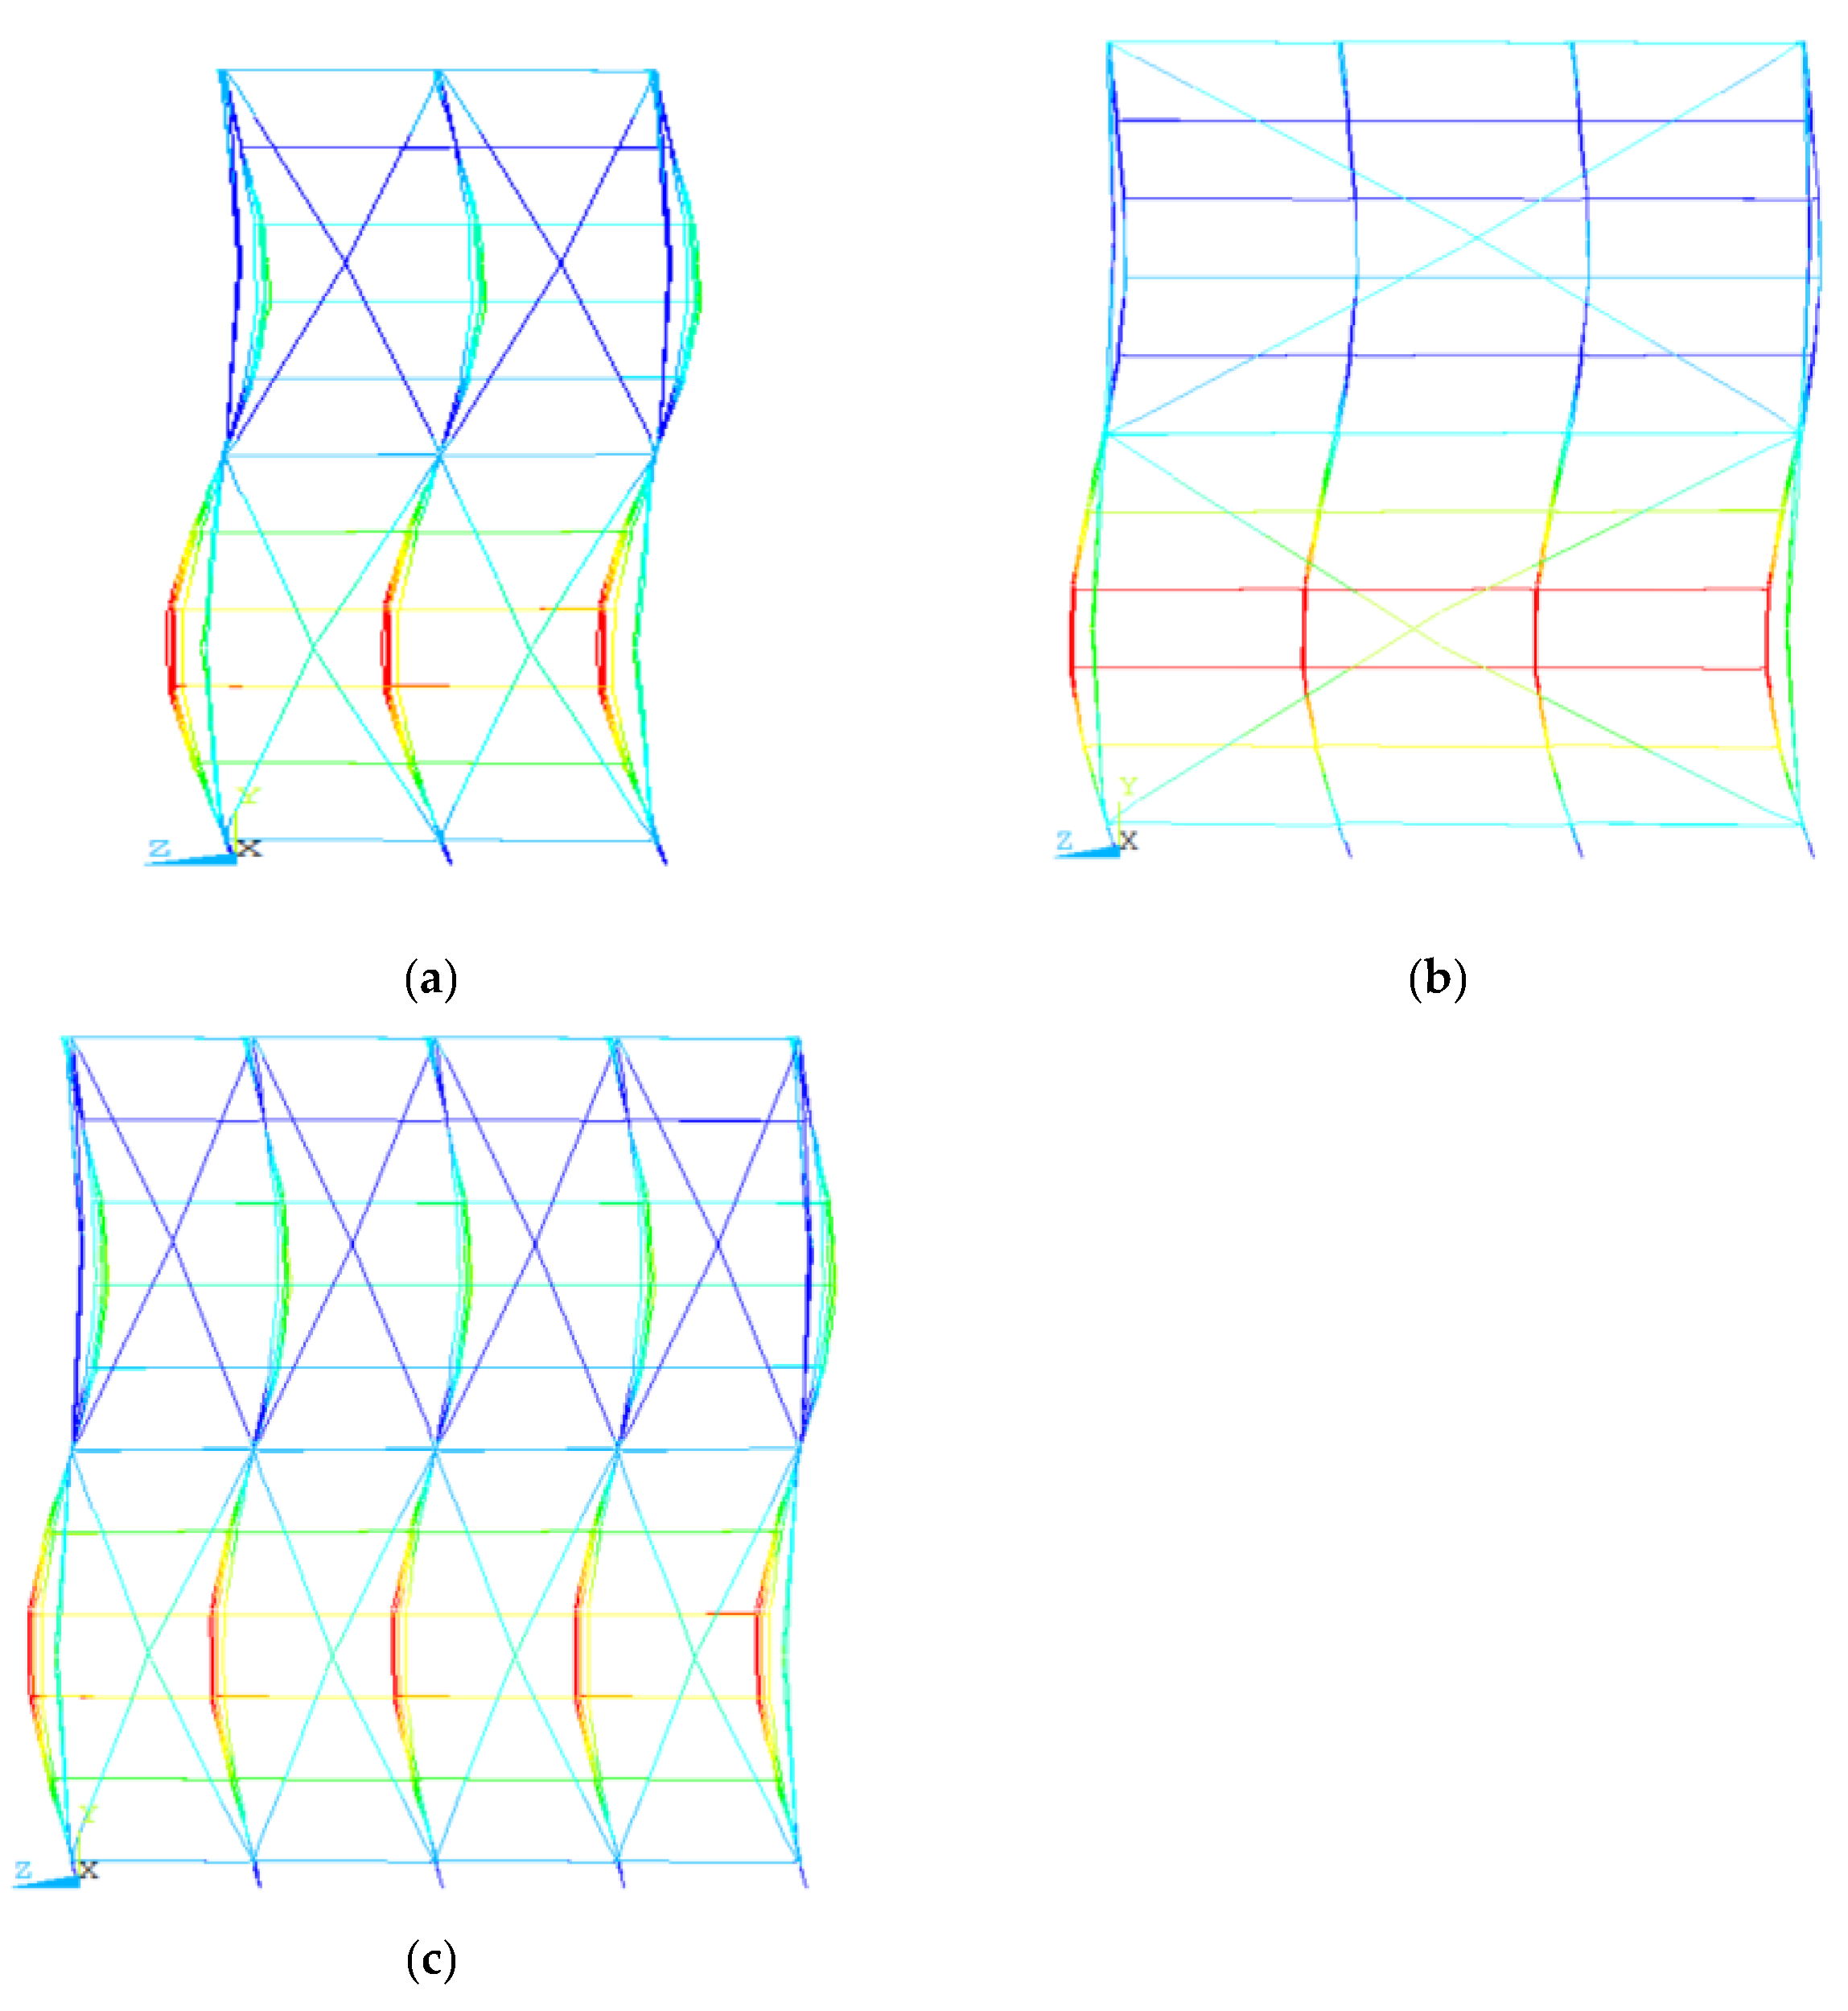
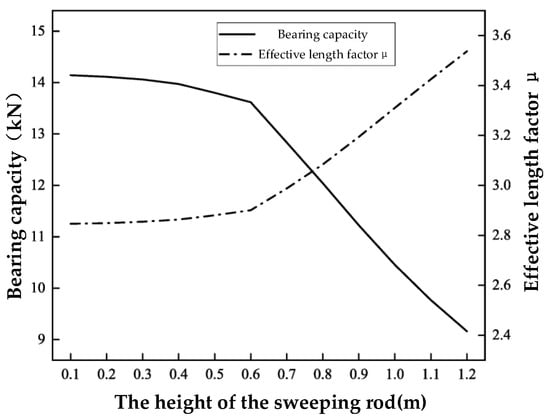
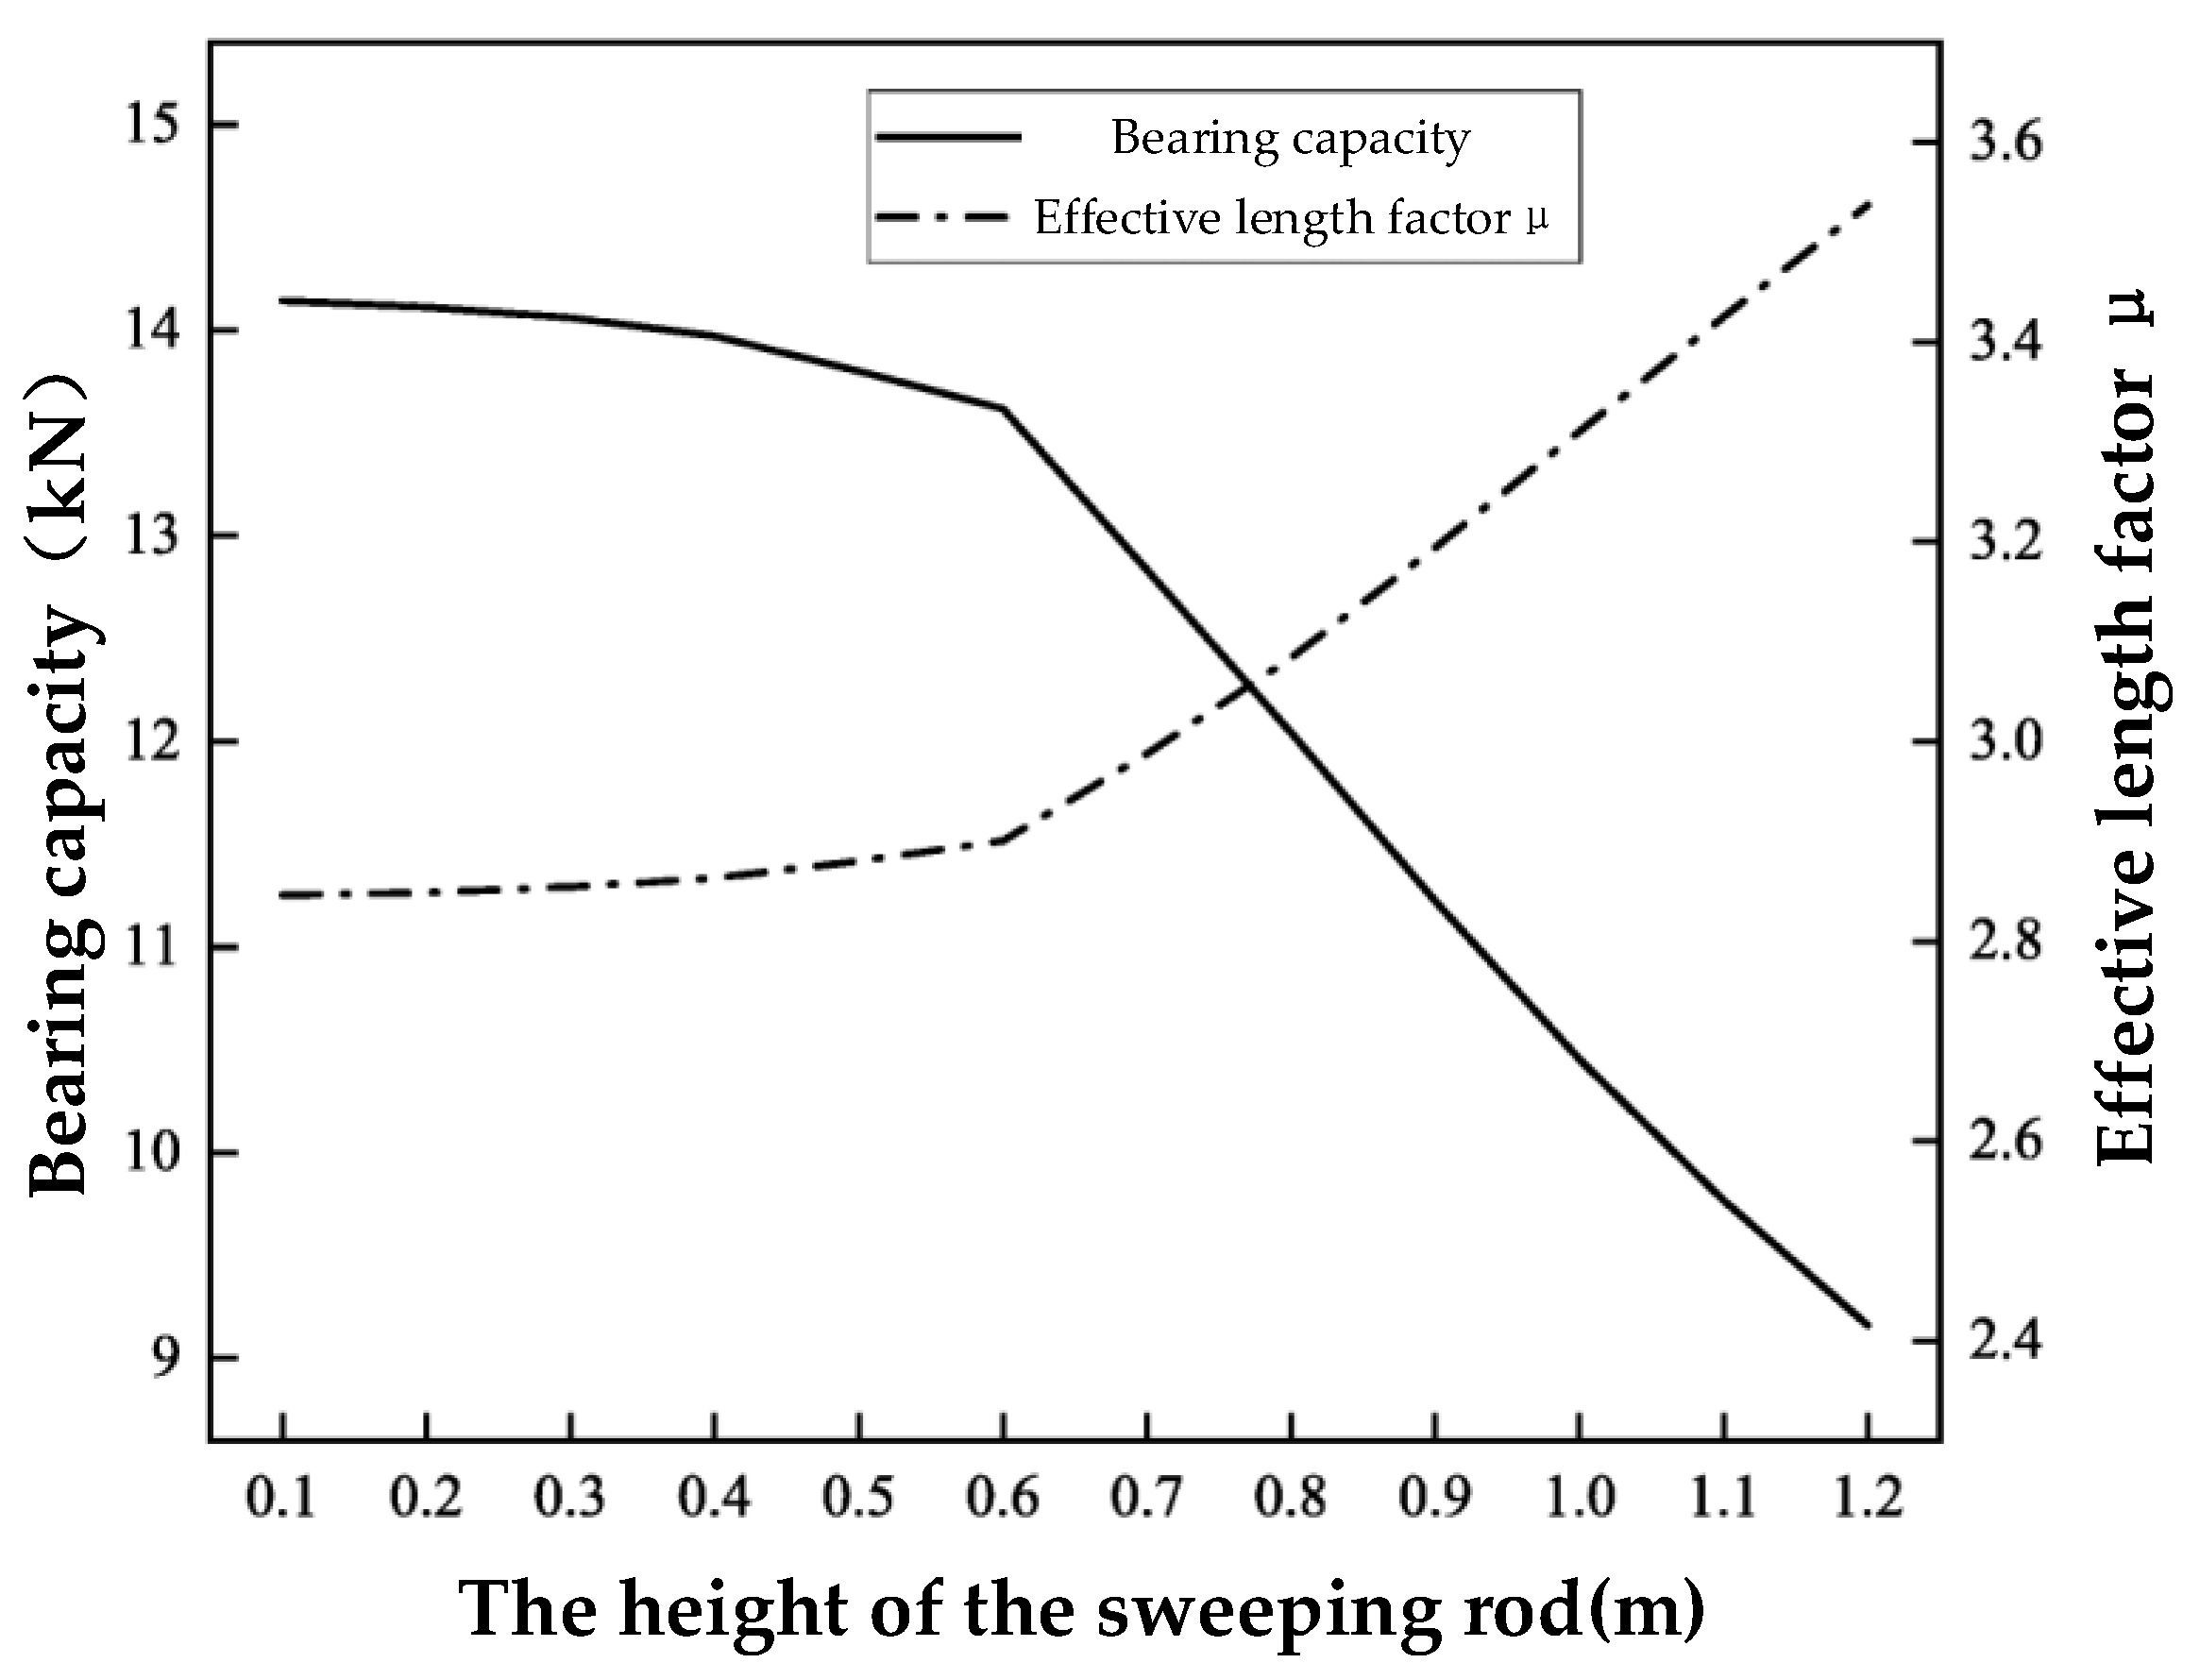
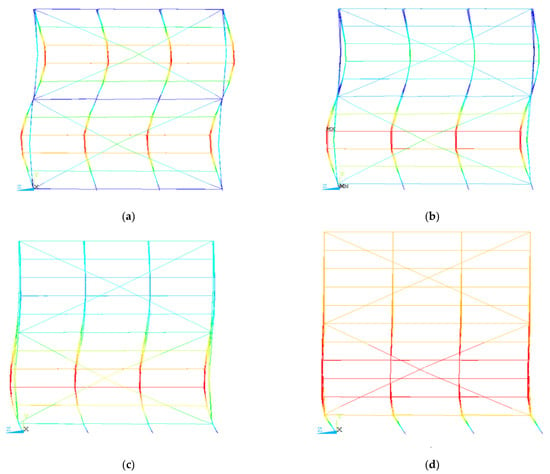
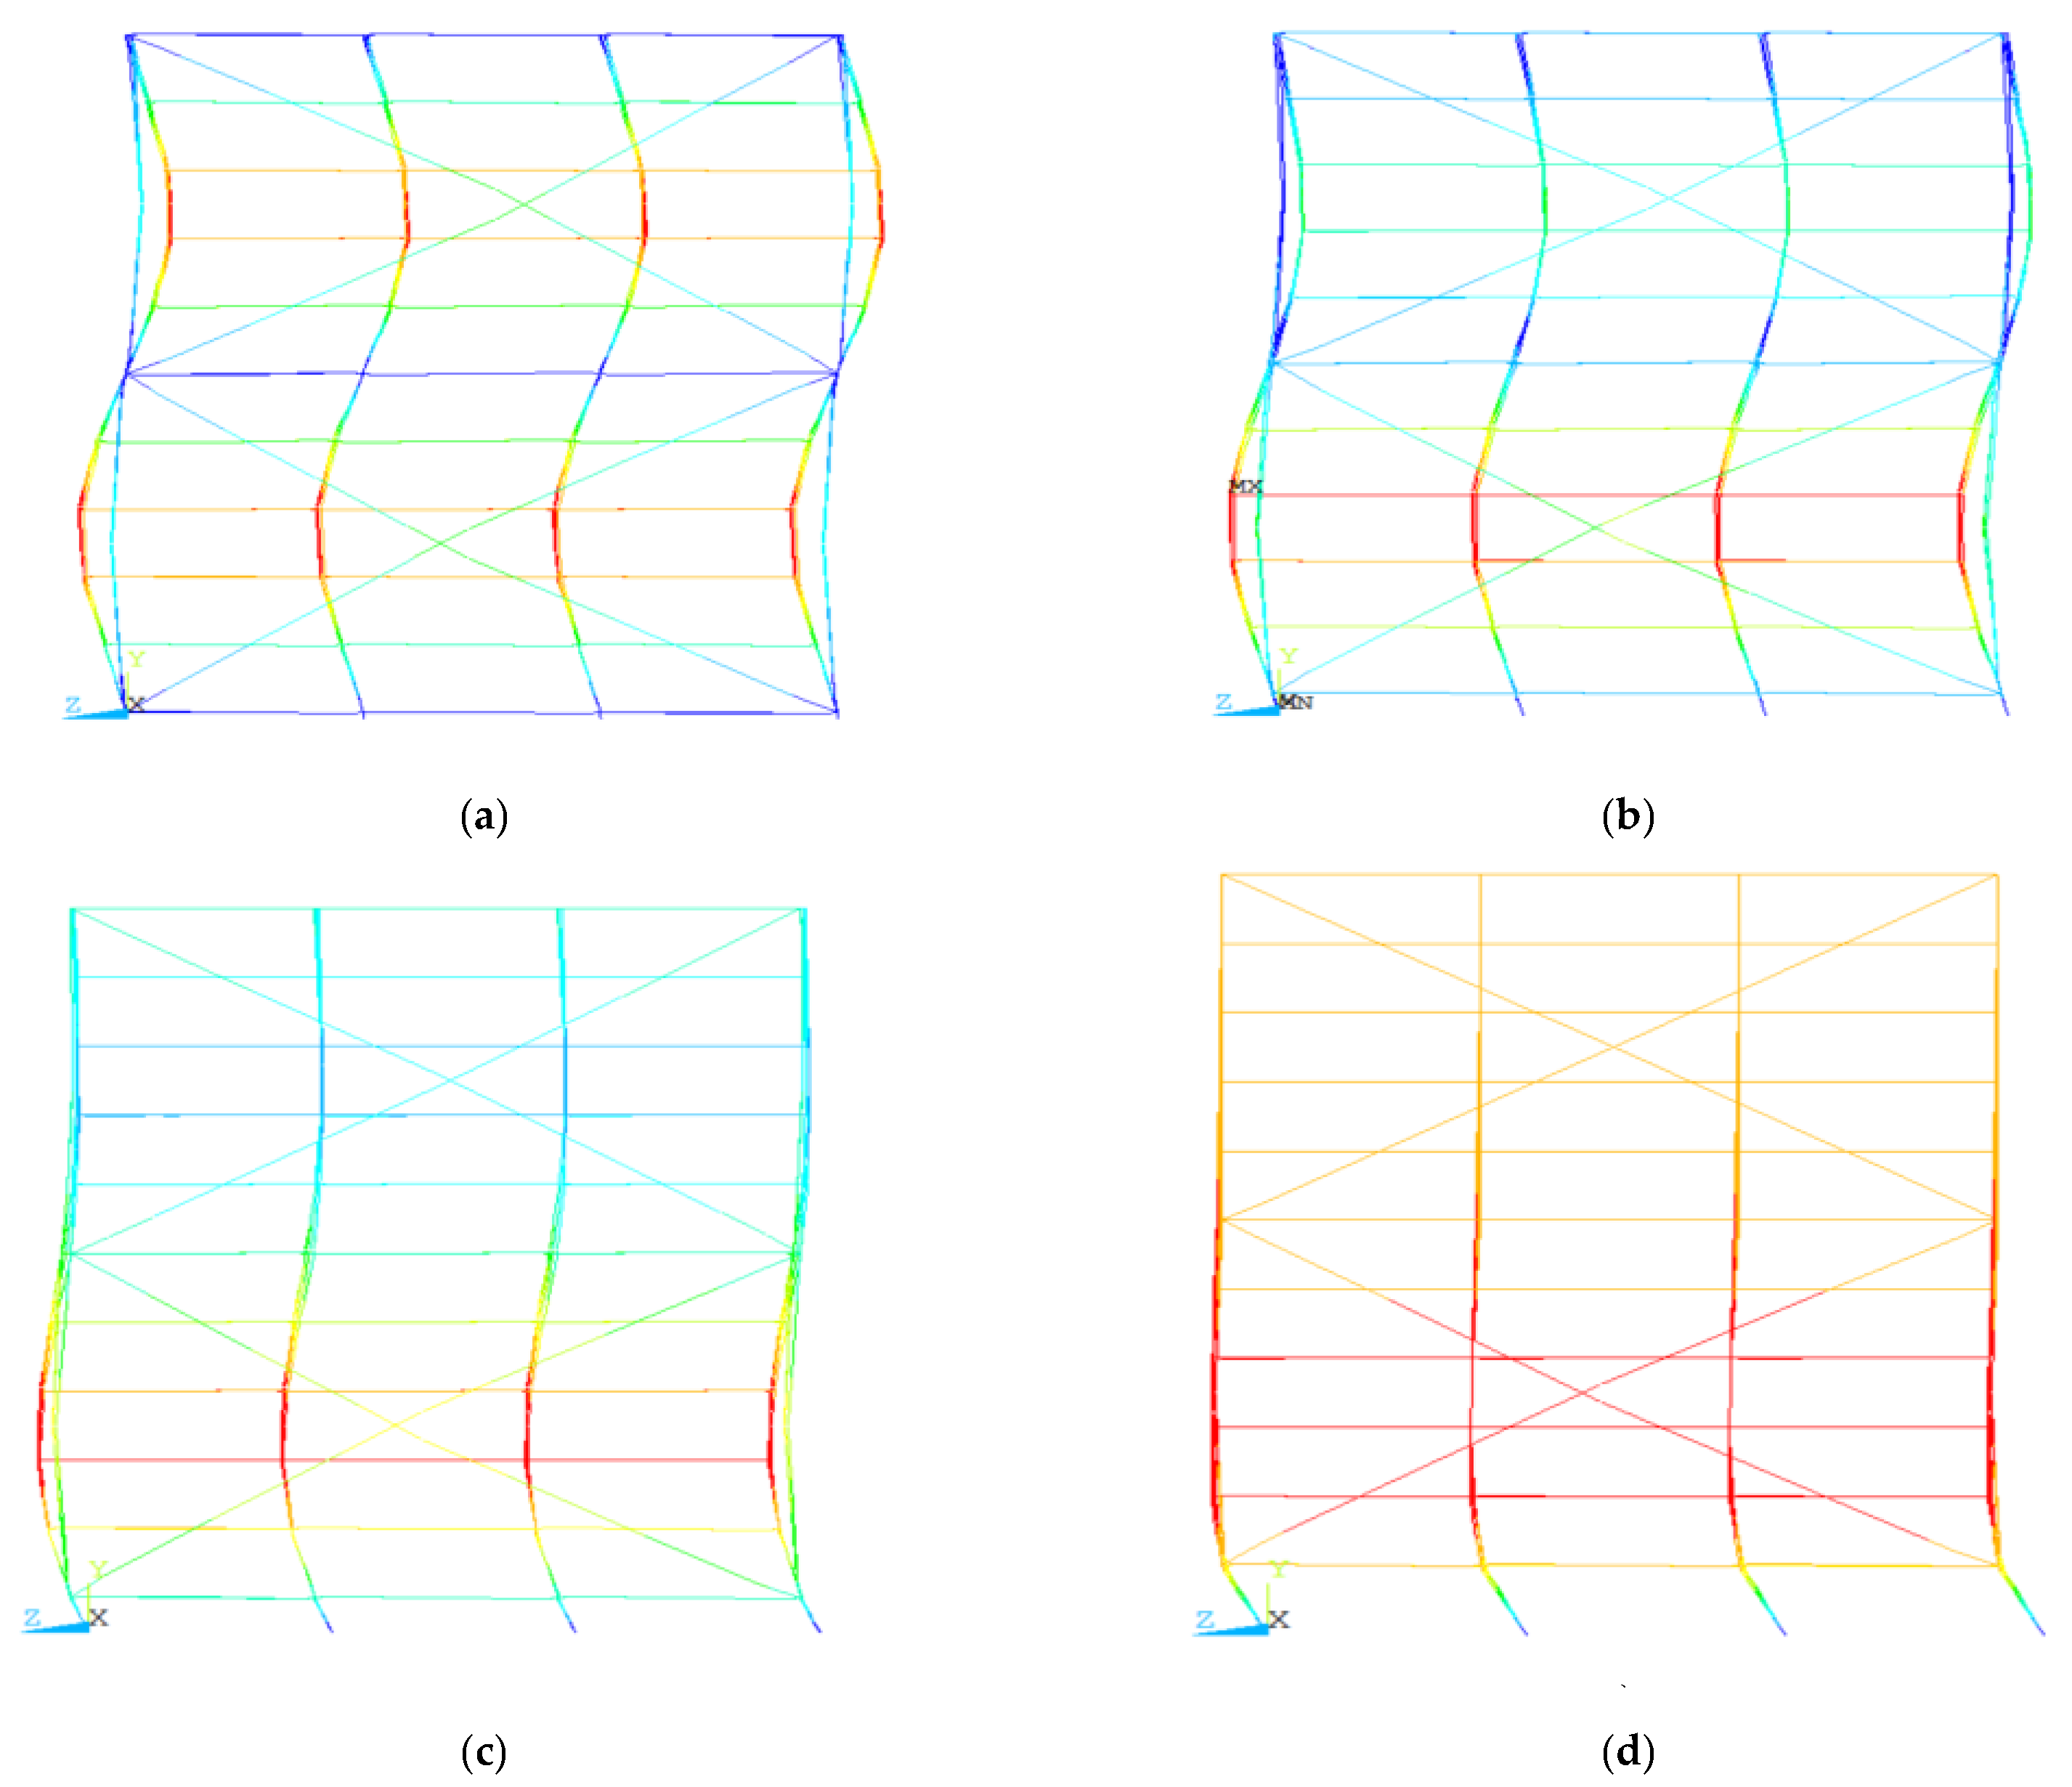
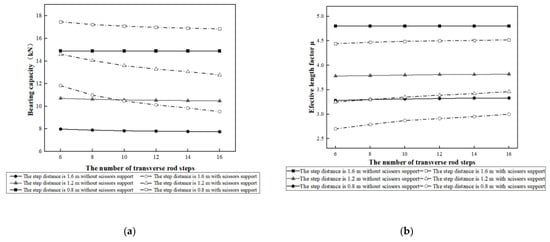
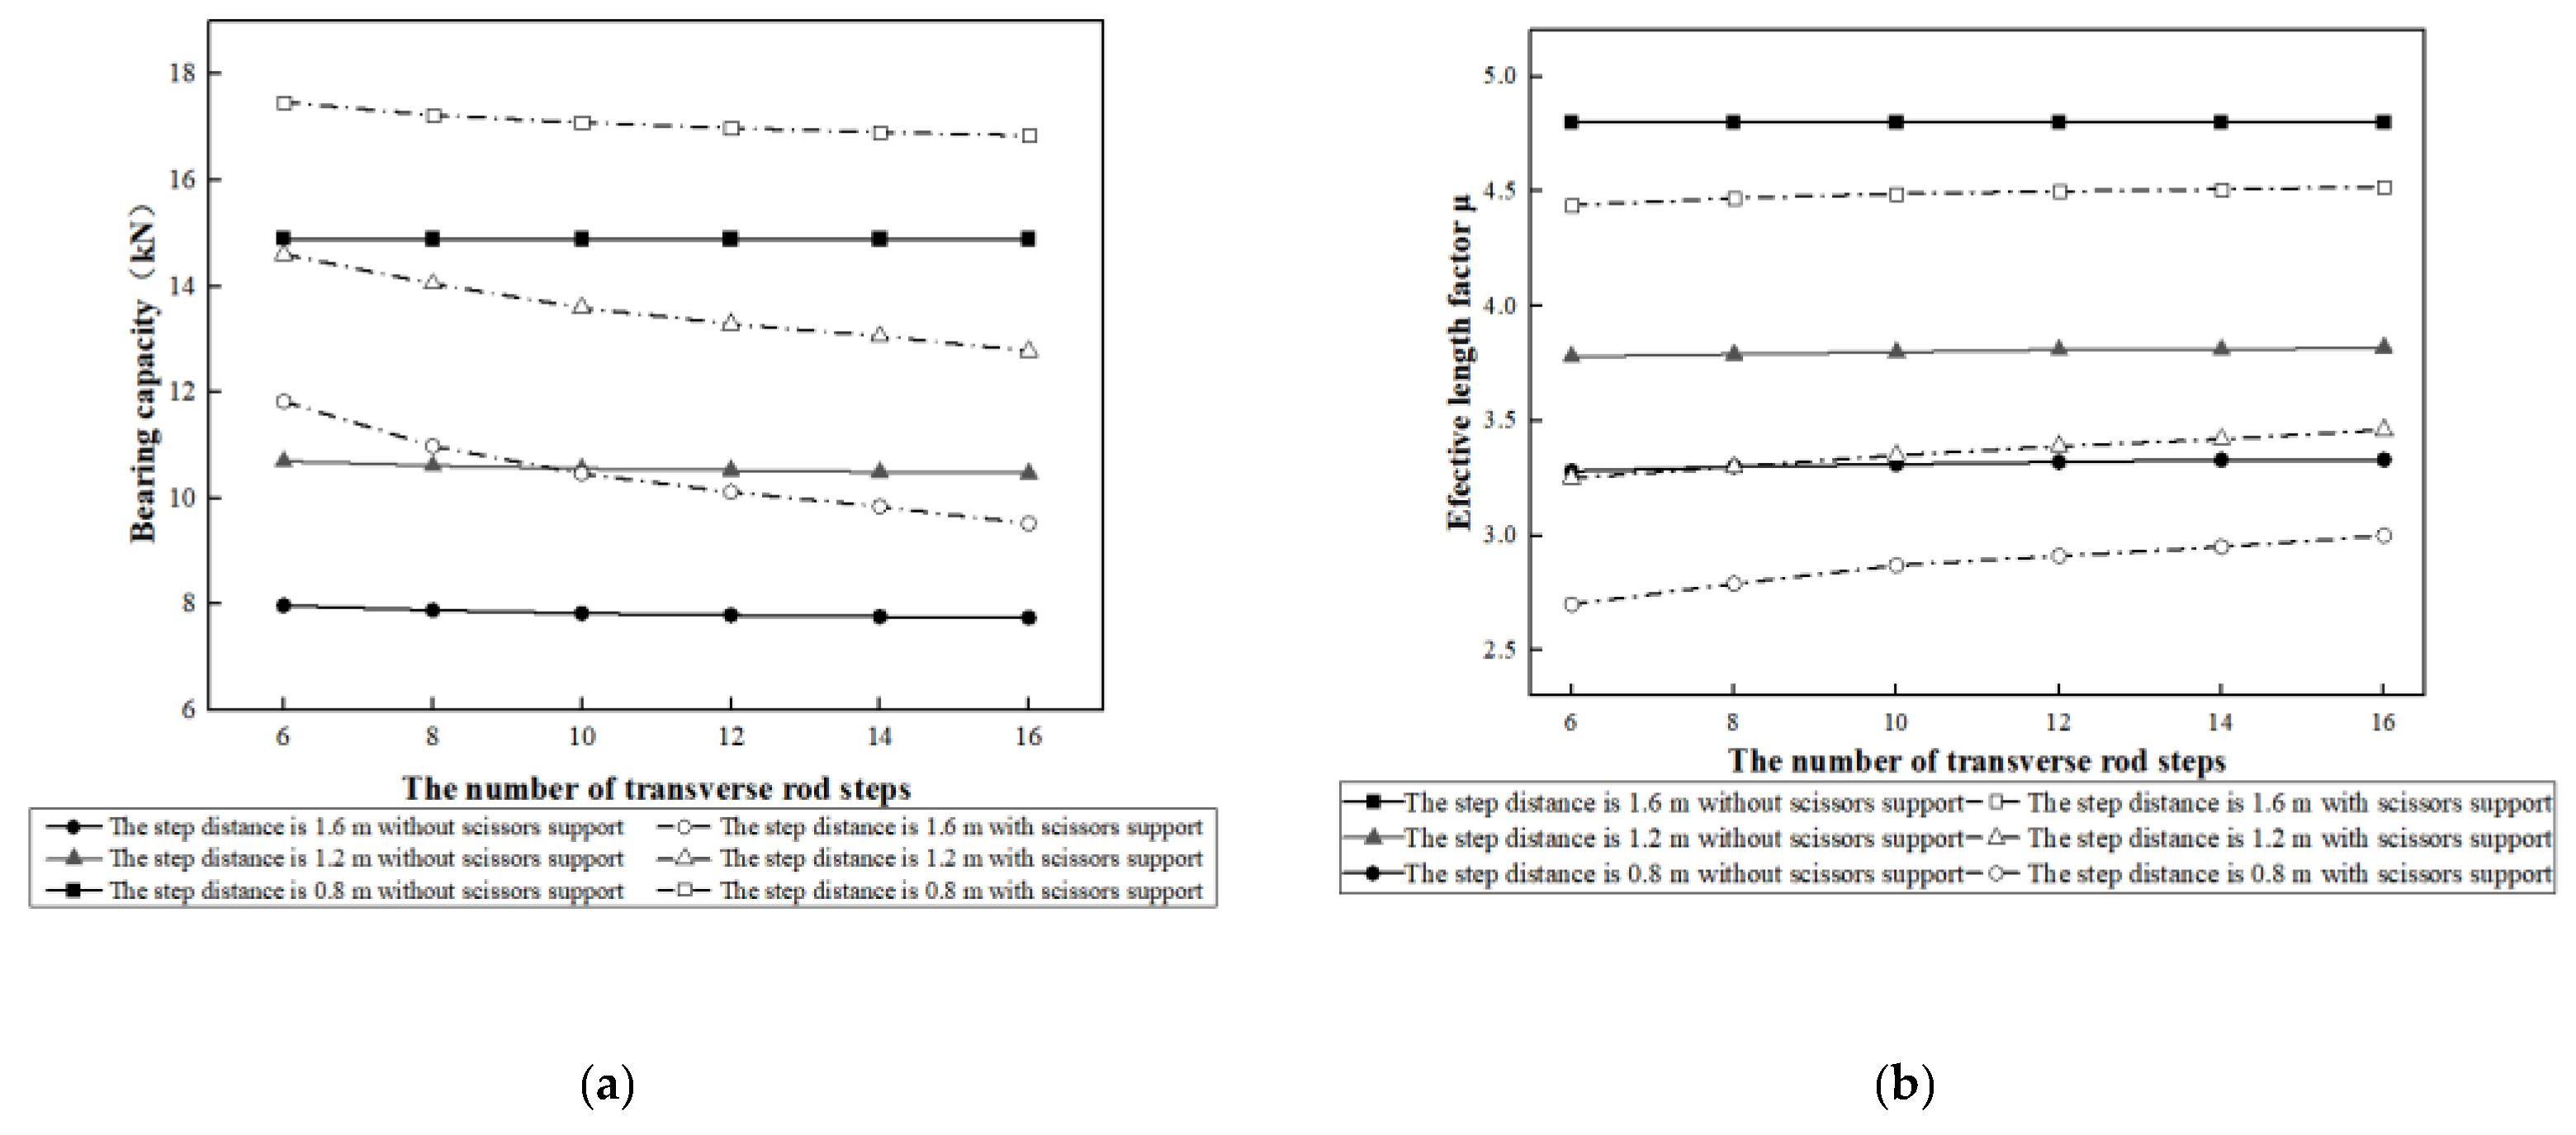
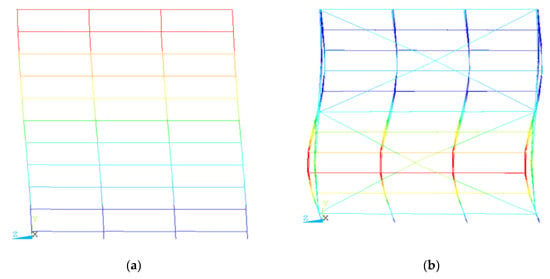
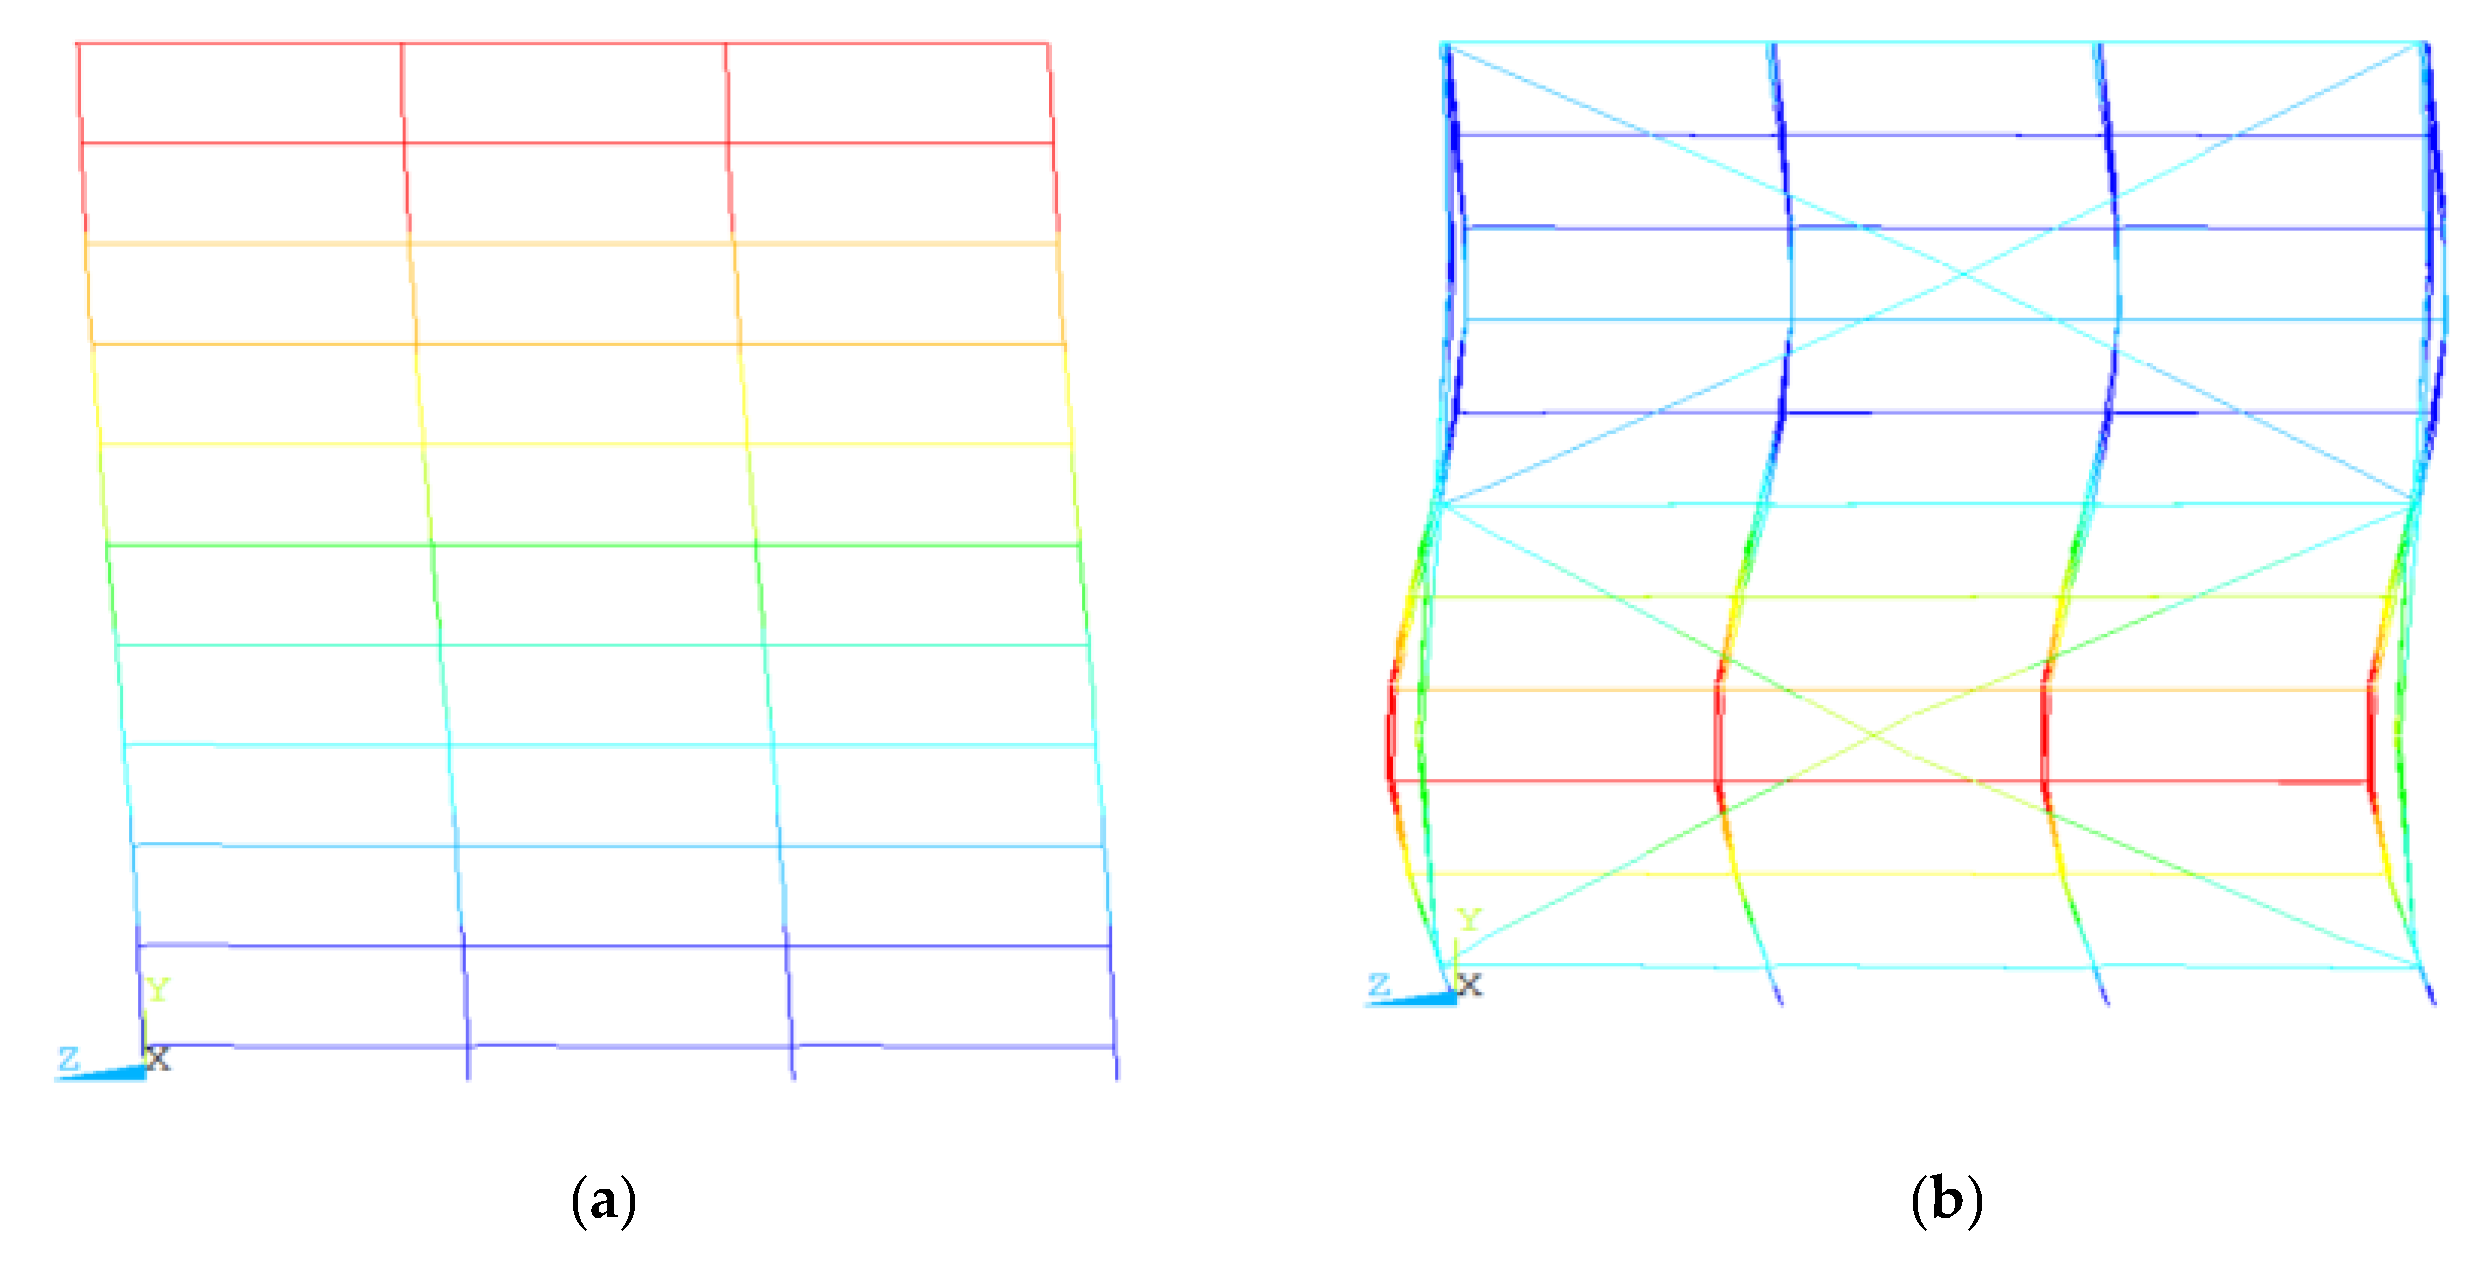
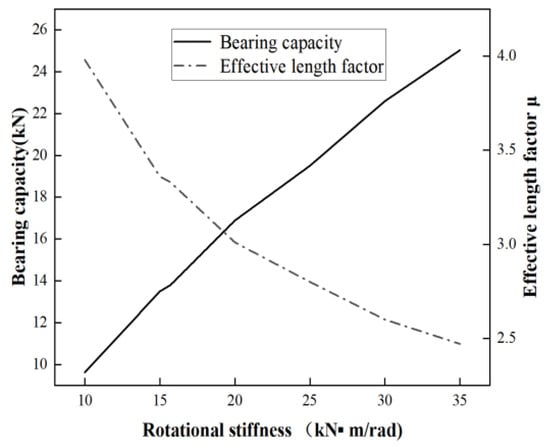
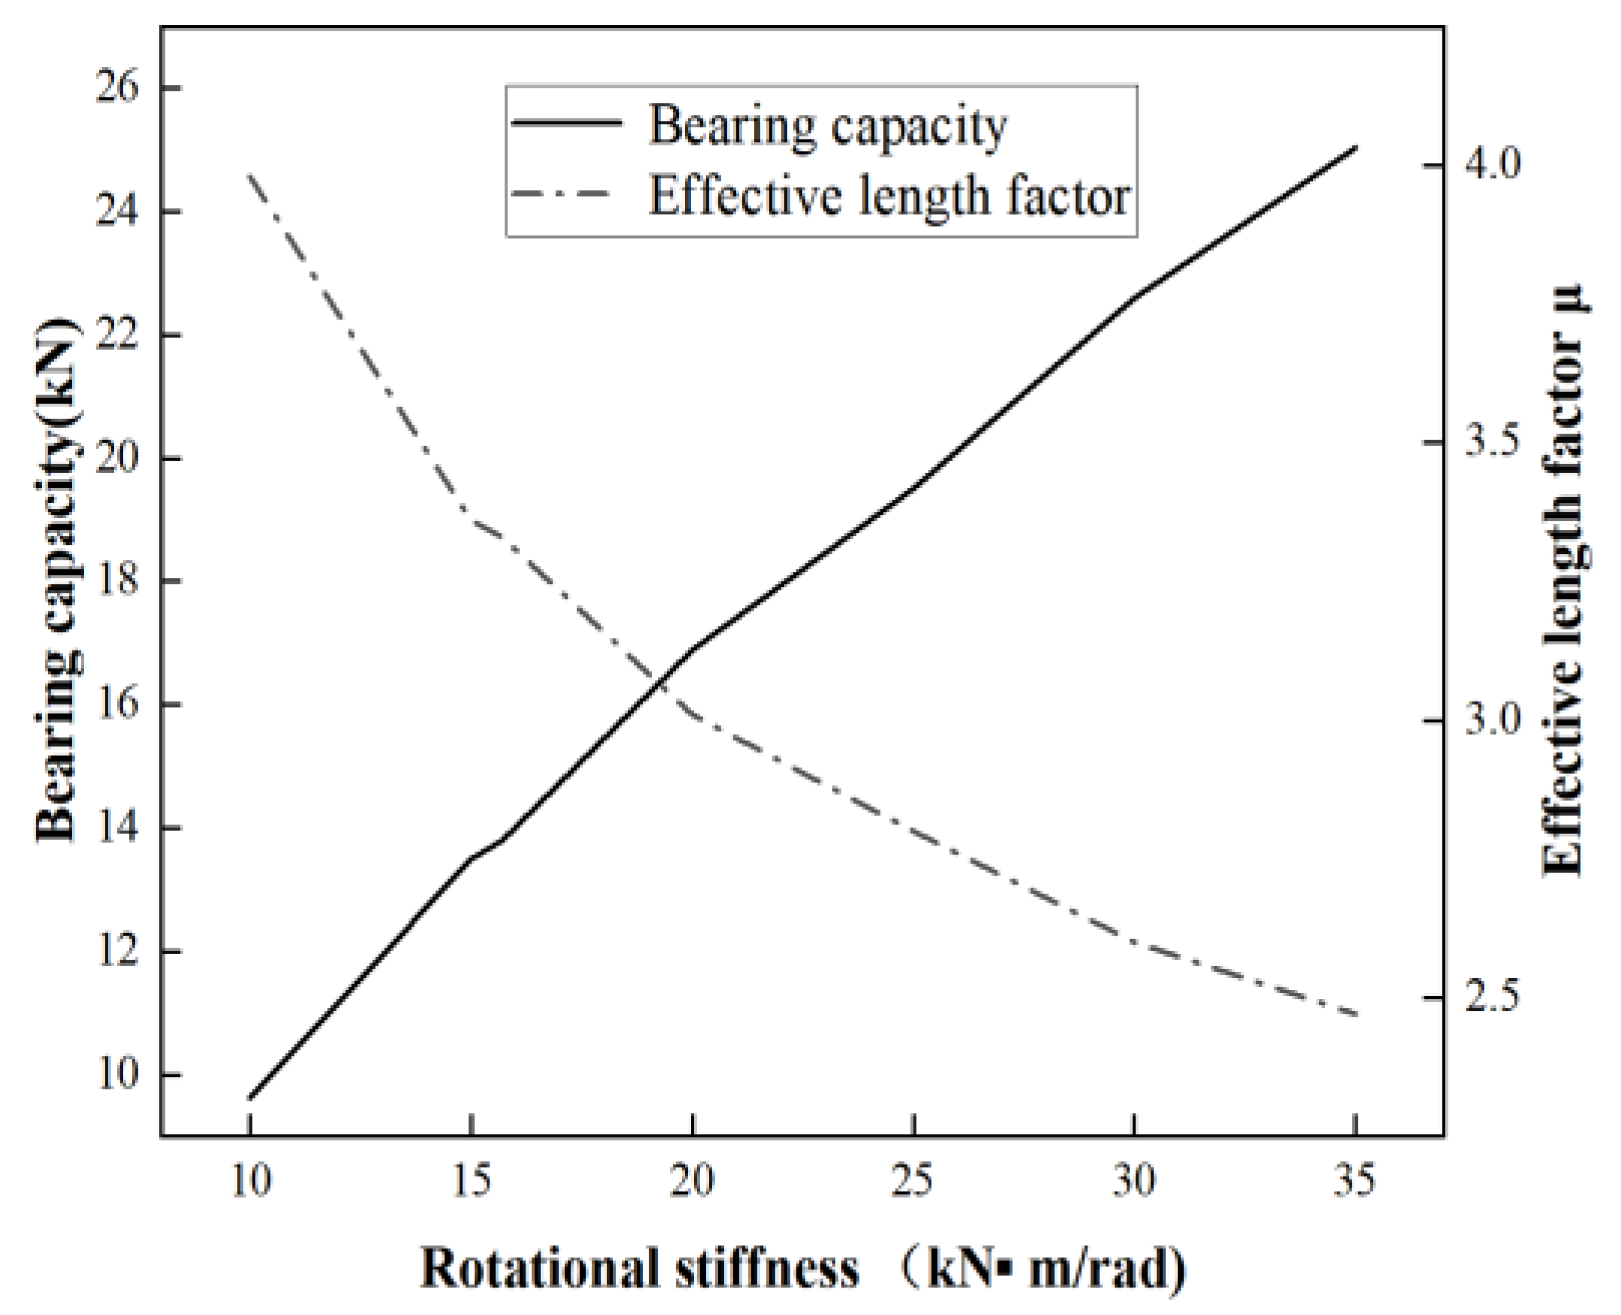
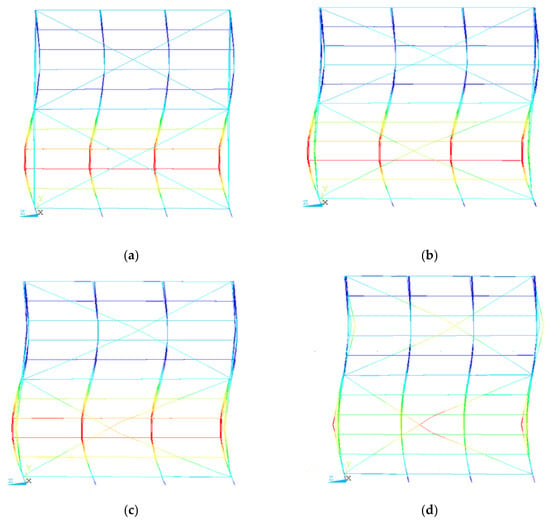
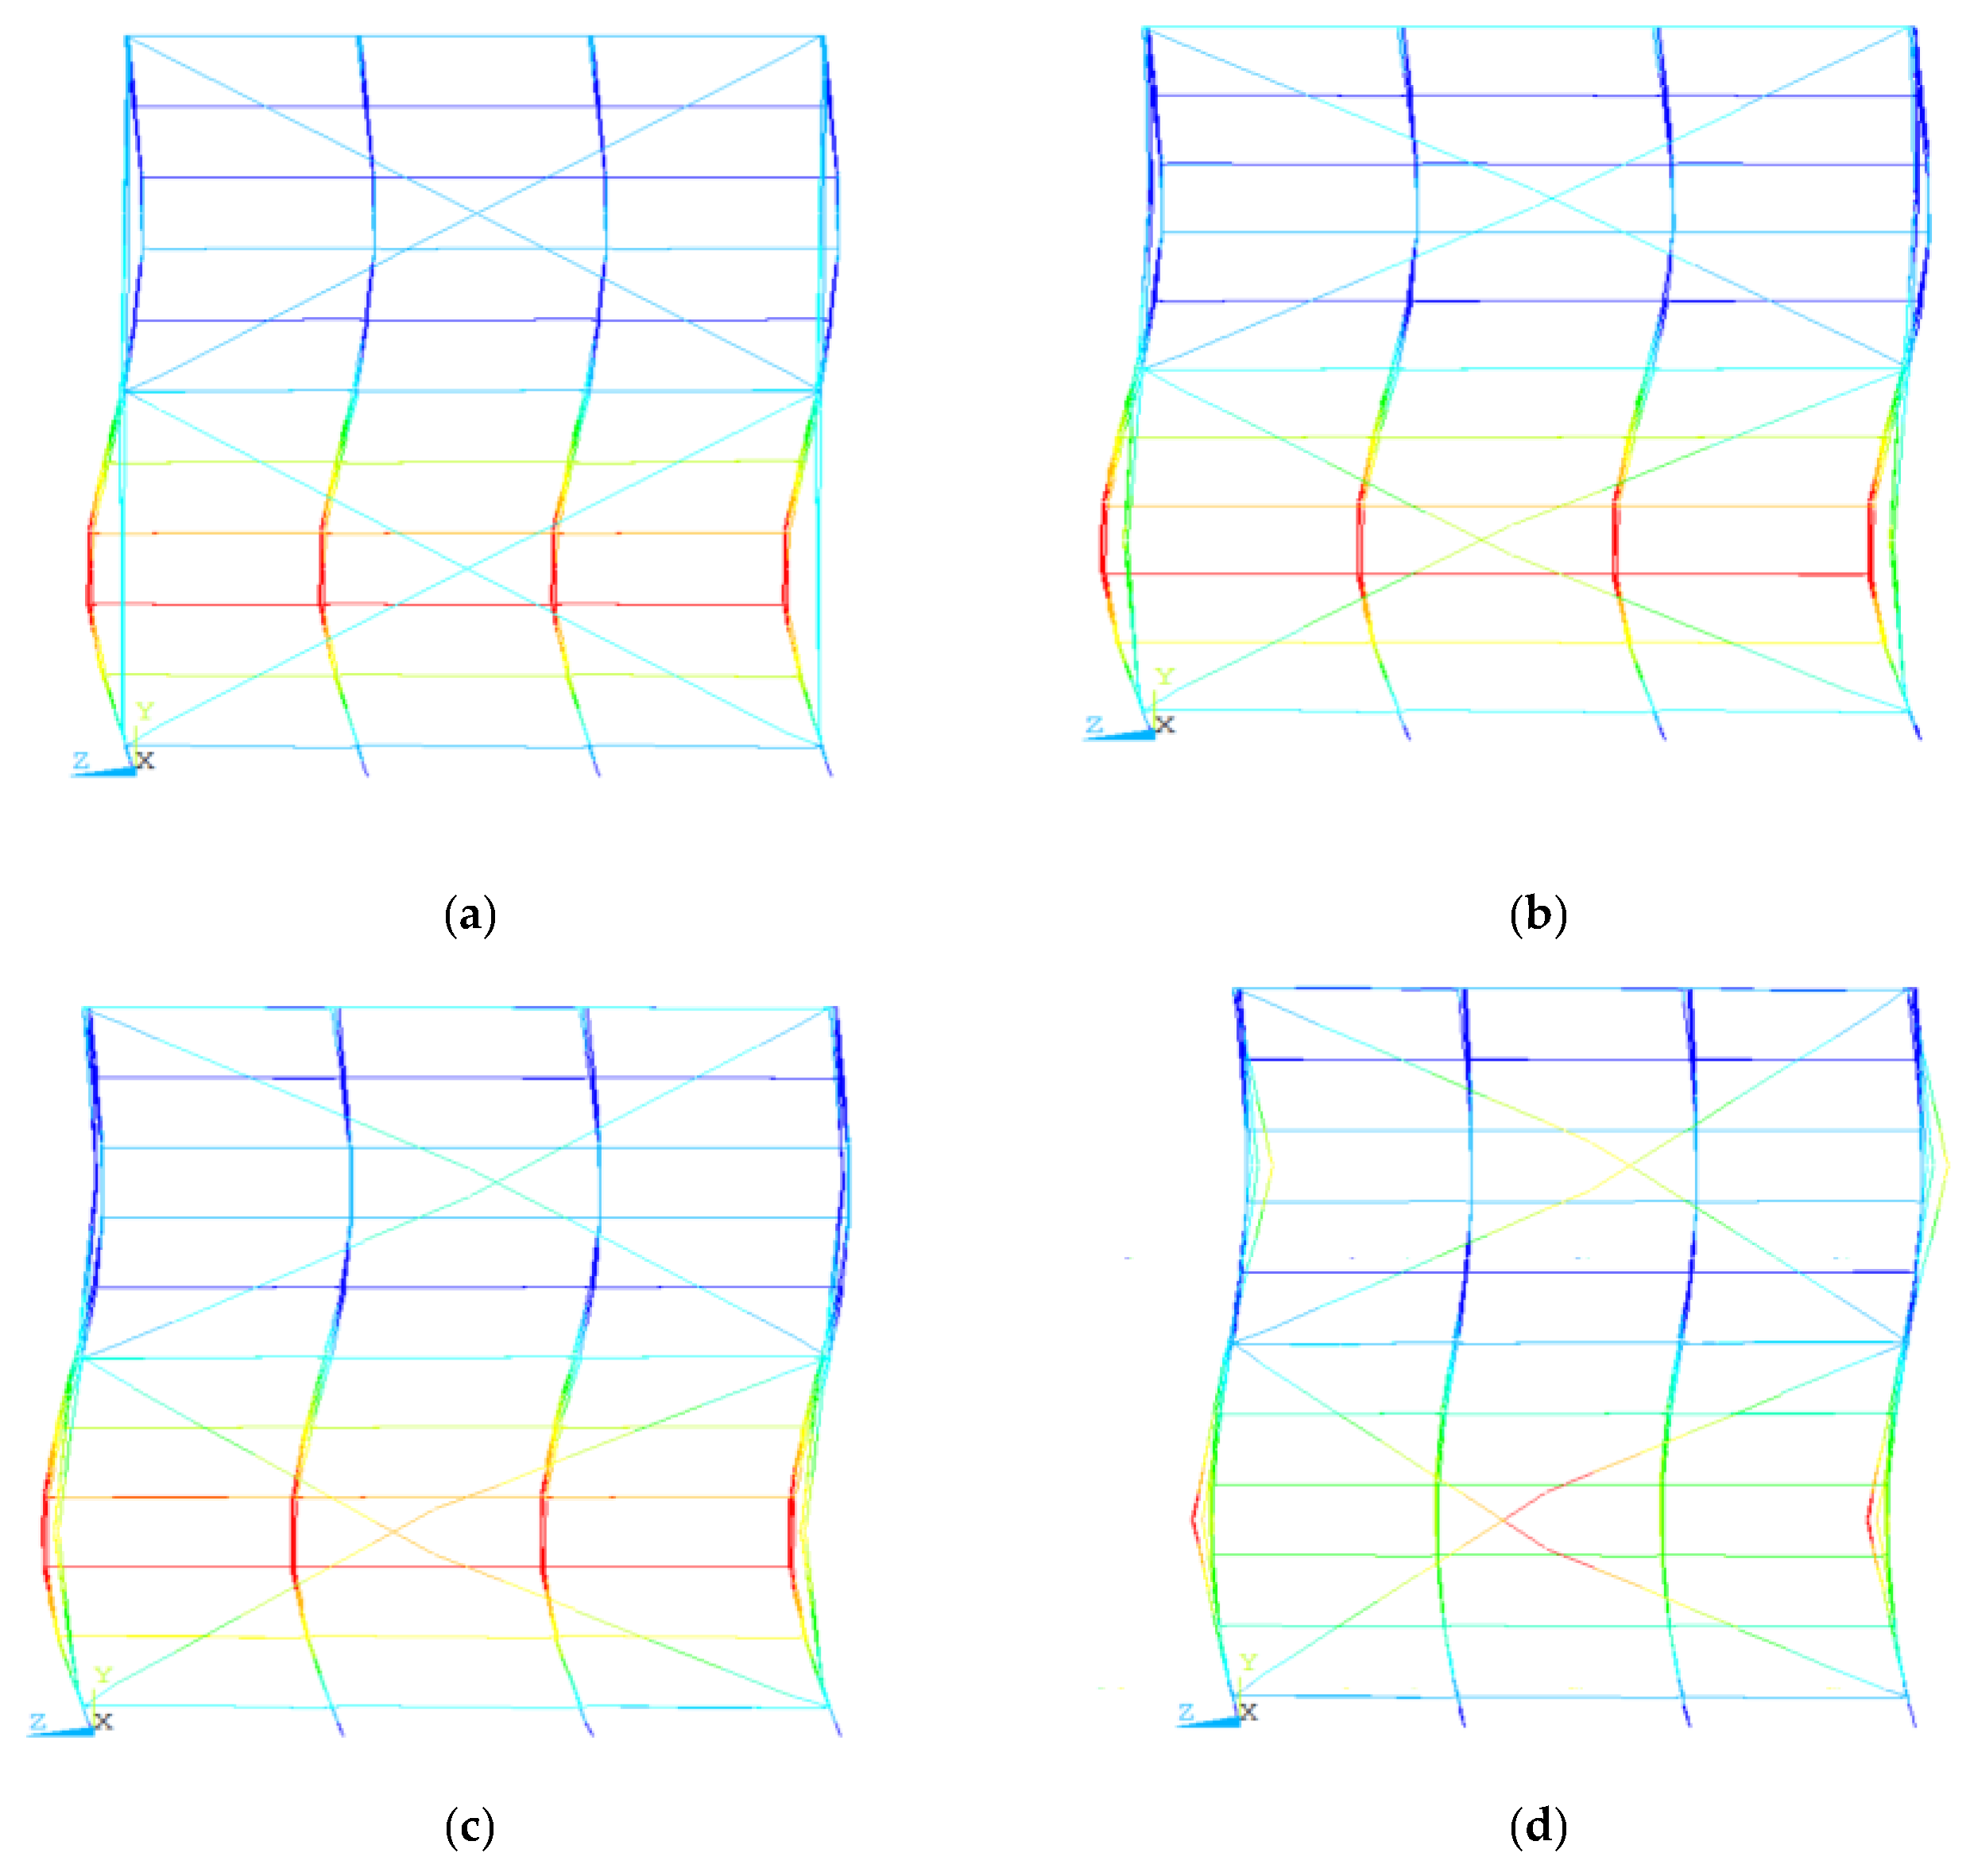
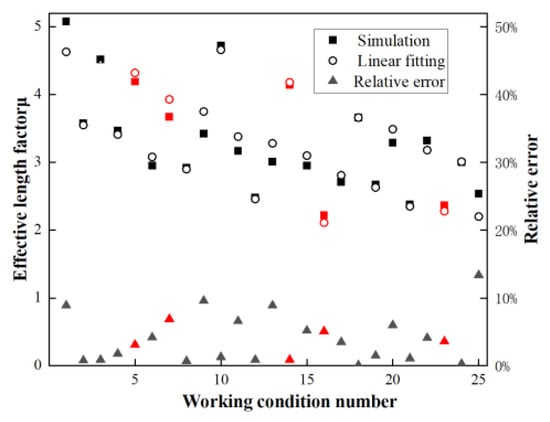
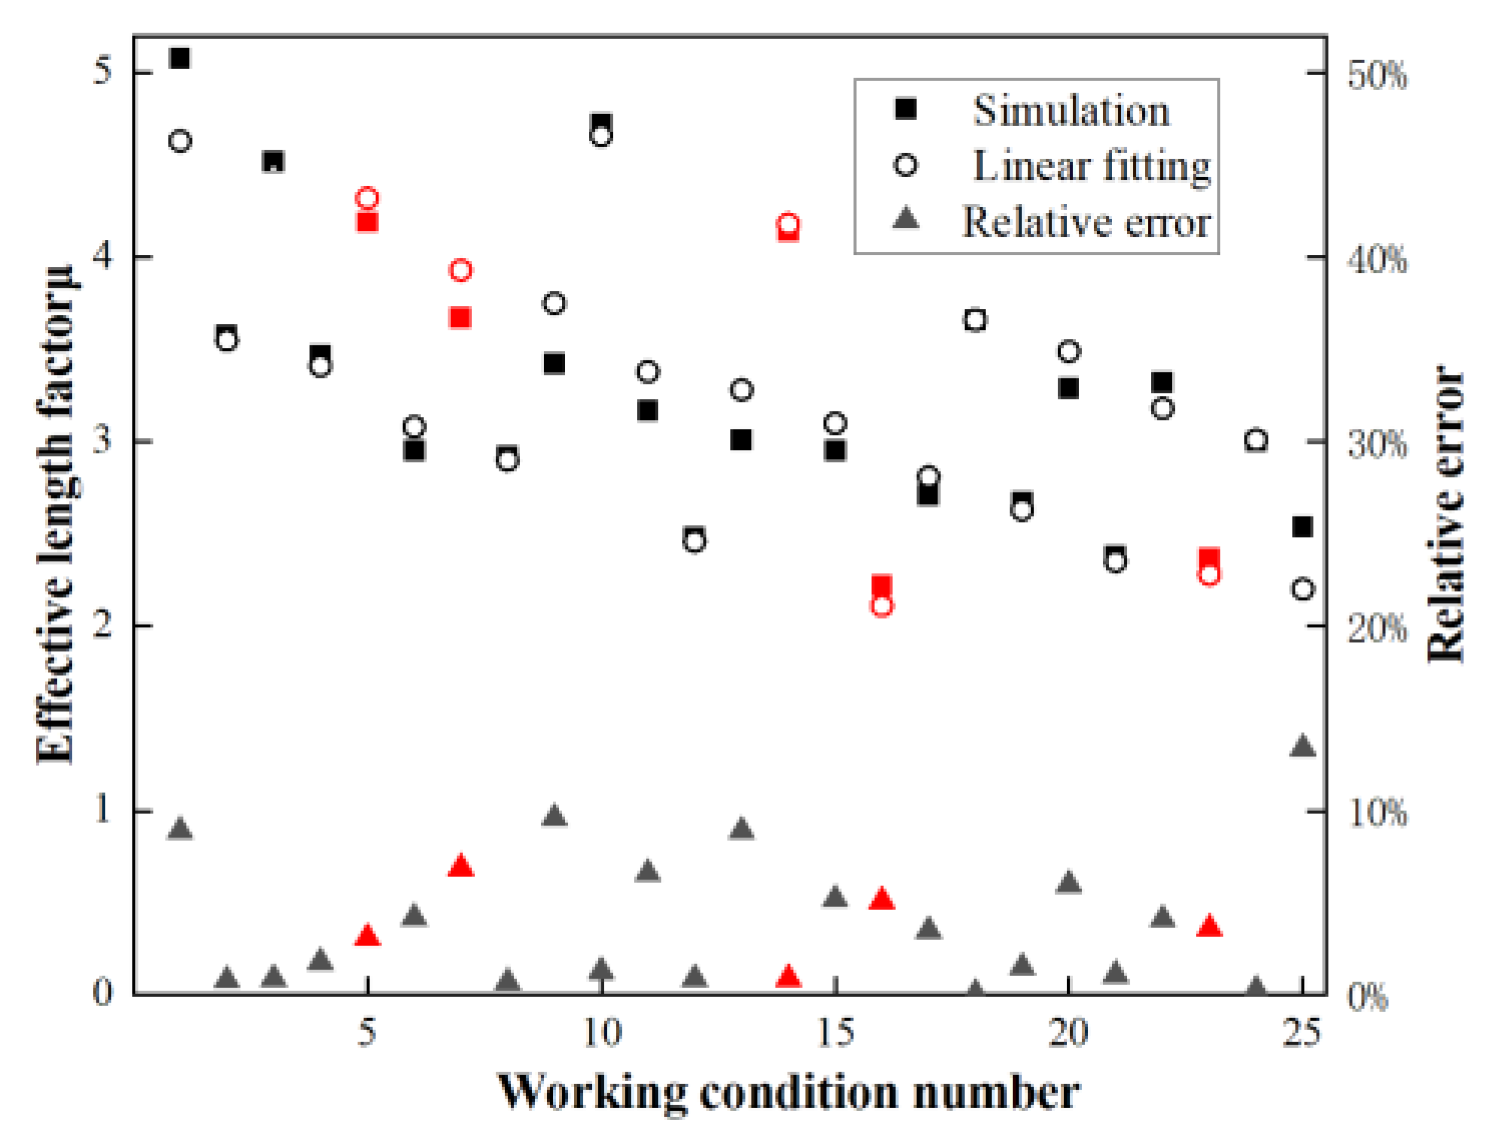
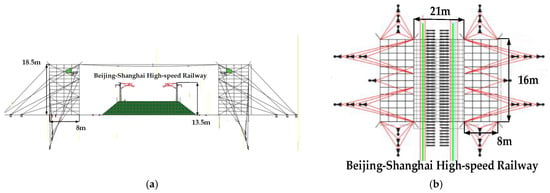
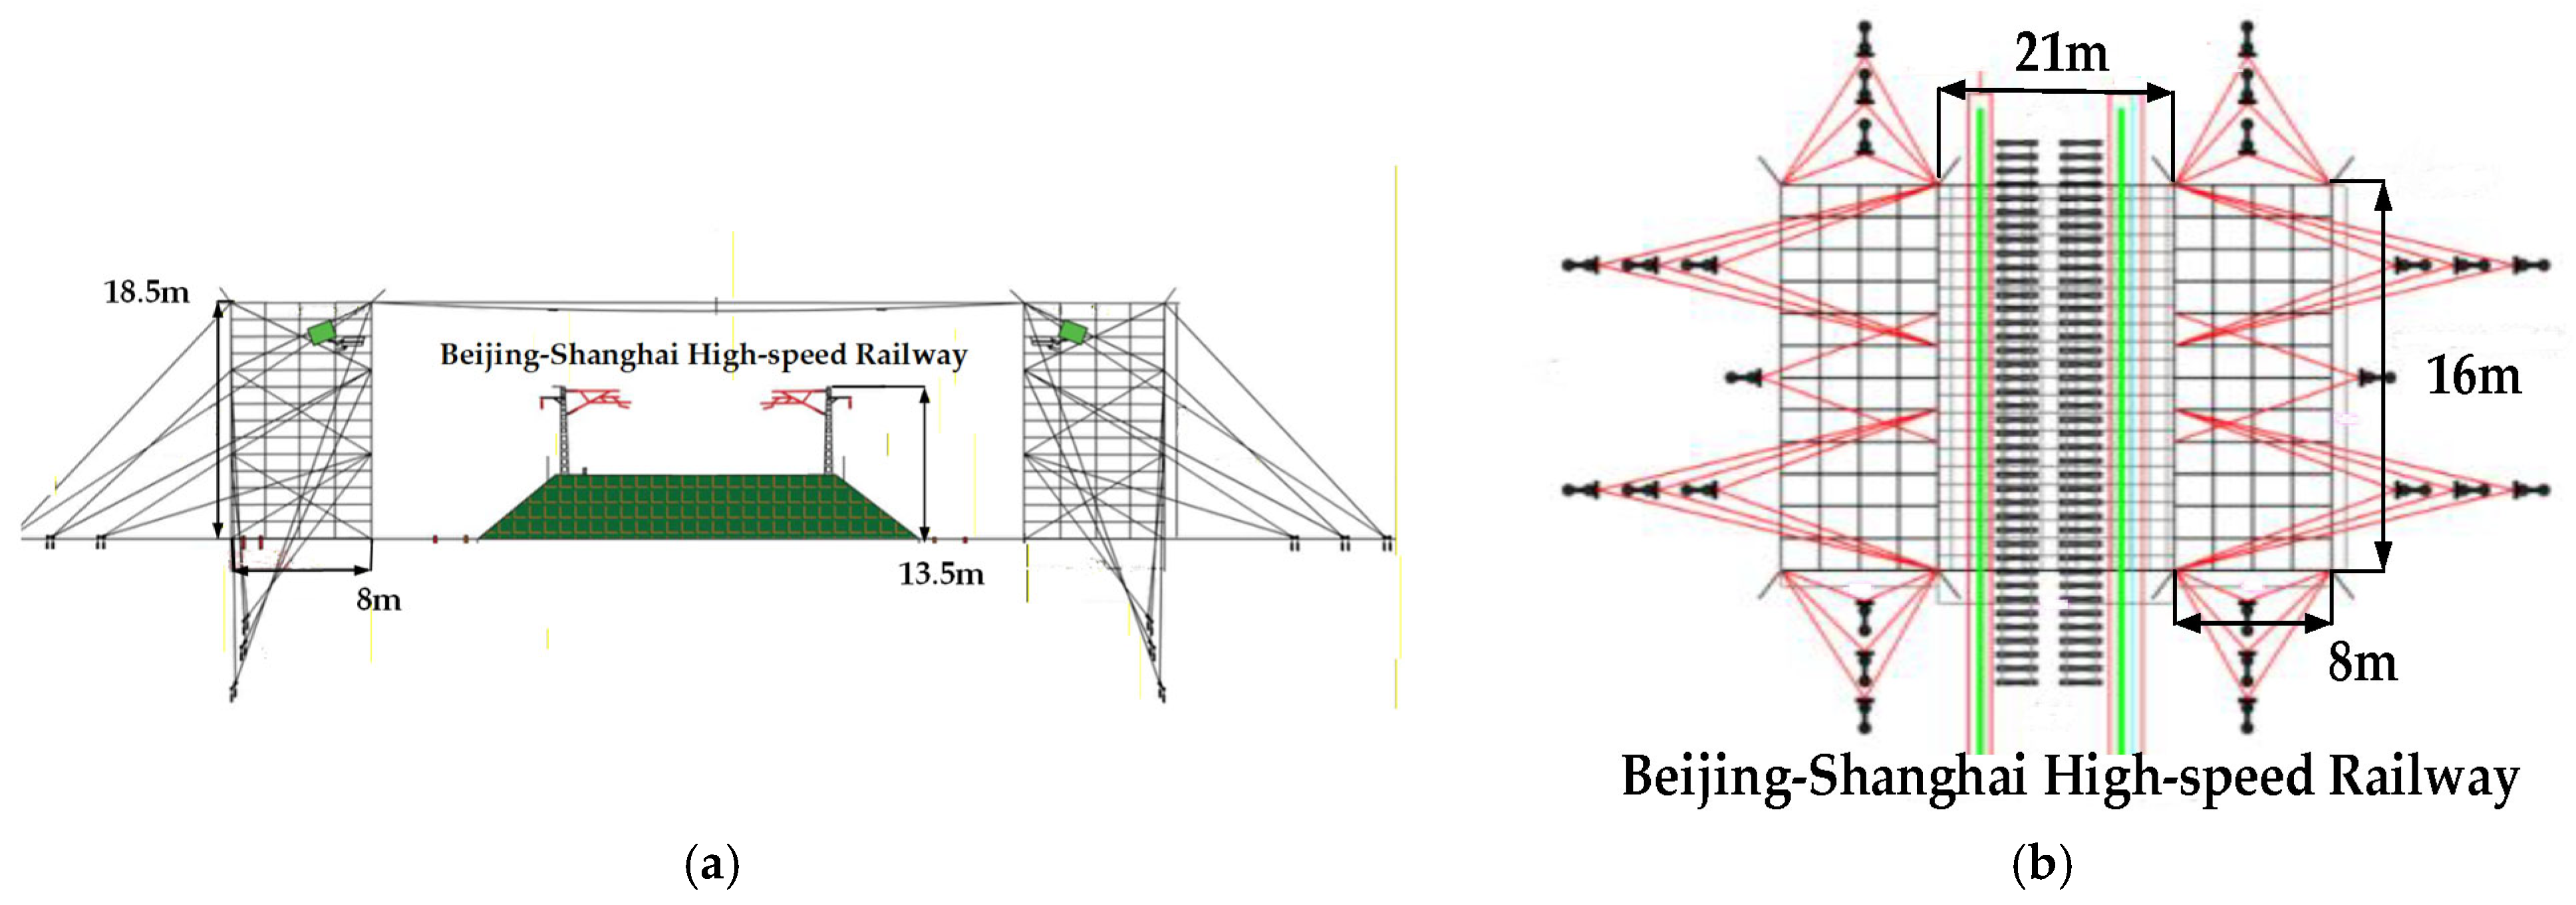
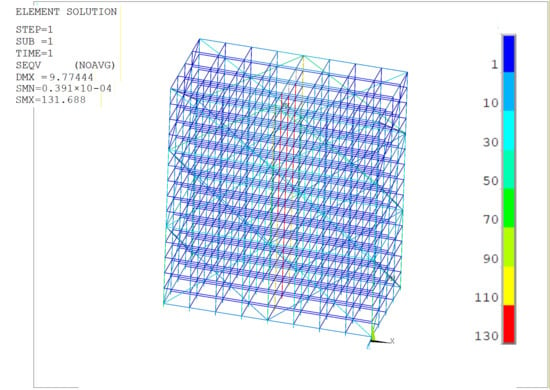
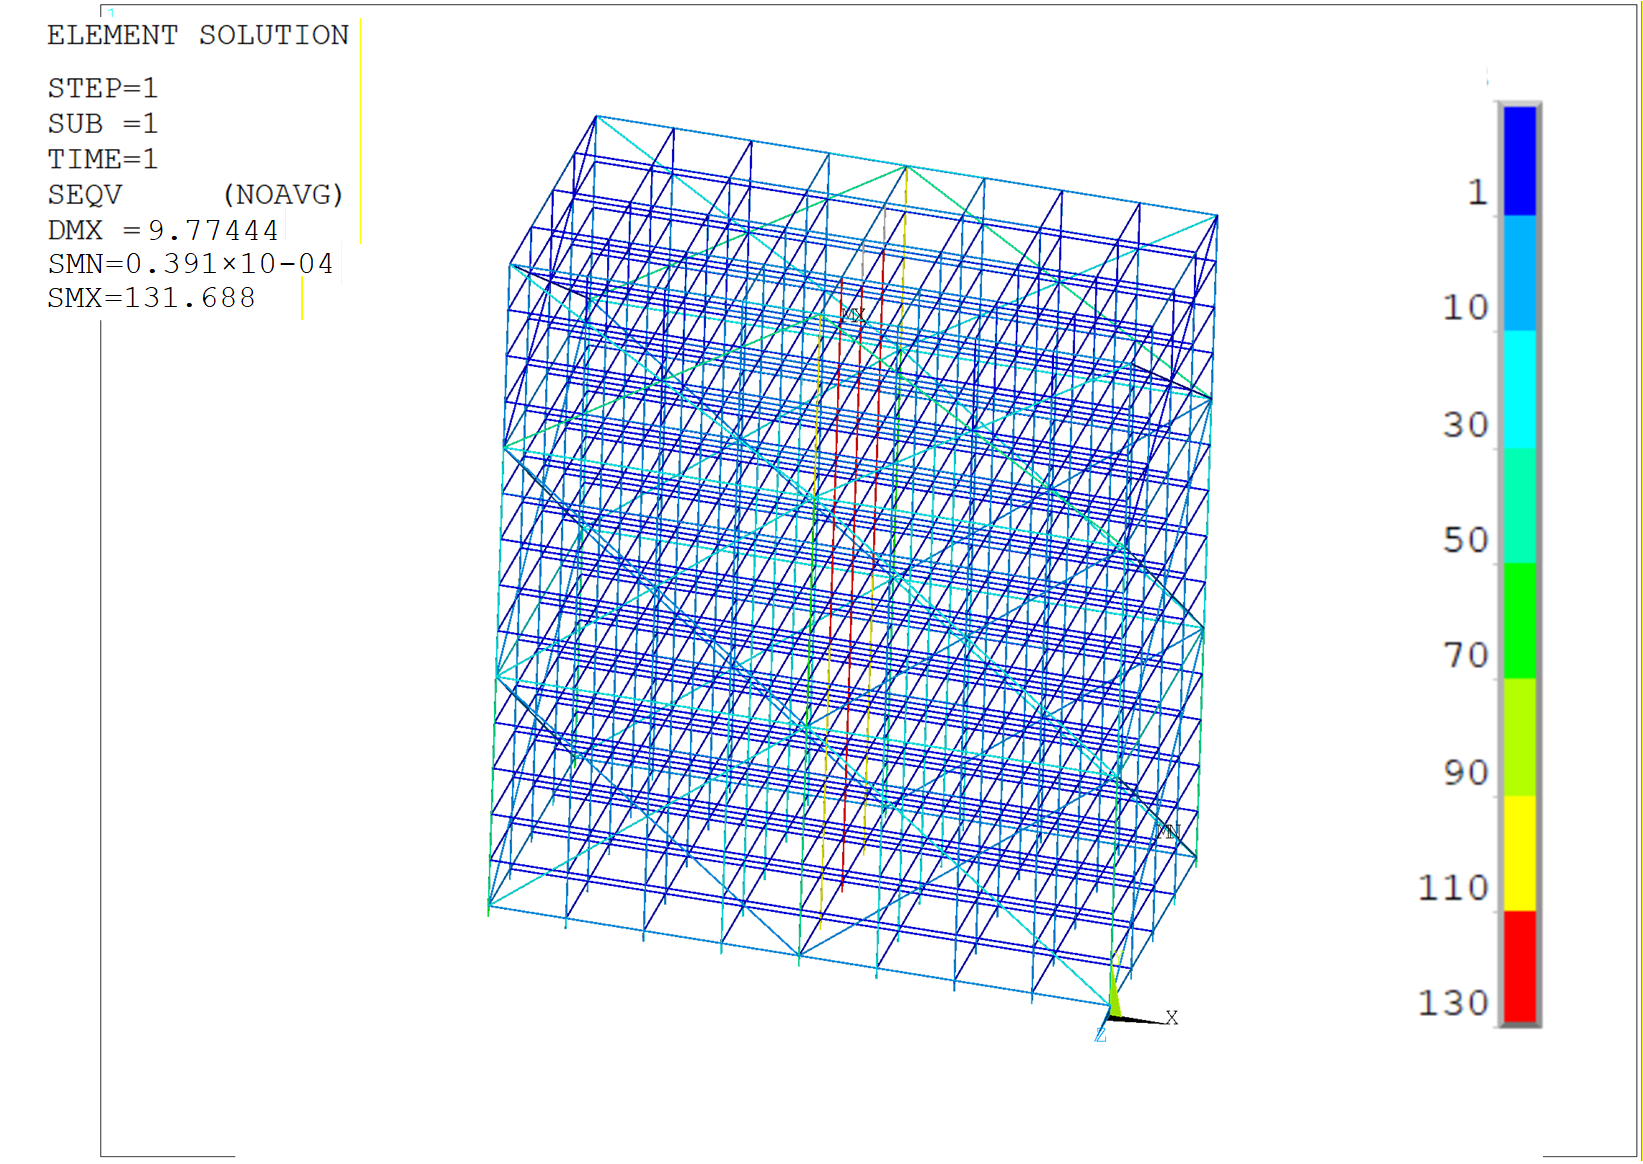

Disclaimer/Publisher’s Note: The statements, opinions and data contained in all publications are solely those of the individual author(s) and contributor(s) and not of MDPI and/or the editor(s). MDPI and/or the editor(s) disclaim responsibility for any injury to people or property resulting from any ideas, methods, instructions or products referred to in the content. |
© 2026 by the authors. Licensee MDPI, Basel, Switzerland. This article is an open access article distributed under the terms and conditions of the Creative Commons Attribution (CC BY) license.