1. Introduction
High-entropy alloys (HEAs) have emerged in recent years as promising substitutes for superalloys in structural applications, particularly those requiring stability in extreme high-temperature environments [
1,
2]. The HEA concept was initially defined by equiatomic compositions designed to maximize configurational entropy and stabilize single-phase solid solutions [
3,
4]. HEAs exhibit four “core effects” that contribute to their promising characteristics: high configurational entropy, sluggish diffusion, severe lattice distortion, and the “cocktail effect”. High configurational entropy lowers the Gibbs free energy, thereby promoting the formation of solid solution phases, especially at elevated temperatures [
5,
6,
7,
8]. Sluggish diffusion kinetics contribute to enhanced thermal stability and resistance to grain growth [
9]. Furthermore, severe lattice distortion, arising from the atomic size mismatch among multiple principal elements, significantly influences dislocation motion and provides substantial solid solution strengthening [
10,
11].
The solid-solution stability of many nominally single-phase HEAs is compromised during exposure to intermediate temperatures, and therefore, the definition has progressively broadened. Contemporary classifications now encompass alloys containing at least five principal elements with atomic concentrations between 5% and 35%, allowing for a wider compositional design space and improved phase stability [
5,
6]. Importantly, this conceptual expansion is not limited to composition but also includes microstructural design, where multiphase HEAs are intentionally developed as a strategy to tailor mechanical performance [
5,
6,
7]. In particular, dual-phase FCC–BCC or FCC–HCP HEAs have attracted increasing attention due to their ability to combine the high ductility of FCC phases with the high strength of BCC/HCP phases, enabling synergistic mechanical behavior through phase-specific plastic deformation and load partitioning mechanisms [
12,
13,
14,
15,
16,
17,
18].
Among the various HEA systems, the AlCoCrFeNi system—particularly near-equiatomic compositions—has been extensively studied as a leading candidate for demanding engineering applications [
19,
20]. Equiatomic AlCoCrFeNi HEAs typically exhibit a microstructure consisting of a mixture of body-centered cubic (BCC) and ordered BCC (B2) phases [
3,
6,
19]. In contrast, non-equiatomic alloys display face-centered cubic (FCC) phases or complex multi-phase hierarchies depending on specific elemental ratios. For instance, increasing the aluminum content is known to promote BCC phase transition [
21]. Conversely, deviations from equiatomic ratios can induce the precipitation of intermetallic phases, such as L12 or sigma phases, which significantly alter the mechanical properties [
22,
23]. Furthermore, the presence of ordered phases or nanoprecipitates in non-equiatomic alloys influences dislocation motion through mechanisms such as Orowan looping or particle shearing, thereby enhancing the overall strength [
11,
24]. Recent research has also highlighted the critical role of chemical short-range order (SRO) on defect behavior [
25]. The presence of ordered atomic clusters within the nominally random solid solution alters the energy landscape for dislocation movement, thereby influencing the alloy’s plasticity and strain hardening capability [
25,
26].
The processing route employed for manufacturing AlCoCrFeNi HEAs also plays a decisive role in determining the resulting phases, microstructure, and consequently the mechanical properties. A diverse range of processing techniques is utilized, including casting, thermomechanical processing, severe plastic deformation, powder metallurgy (PM) and additive manufacturing (AM) [
6,
7,
20,
27,
28]. Conventional casting often leads to dendritic segregation and non-equilibrium solidification defects [
3,
27]. Processing techniques that produce fine-grained microstructures enhance mechanical strength and superplastic forming capability [
20,
27,
29]. On the other hand, AM provides unique control over the microstructure through rapid solidification, potentially stabilizing non-equilibrium phases and hierarchical structures [
7,
28]. Moreover, post-processing heat treatments can further modify the phase composition, promoting mechanisms such as dynamic recrystallization [
30].
Considerable research efforts have focused on understanding how variations in composition and processing, especially the proportion of FCC and BCC phases, influence the operative deformation mechanisms [
18,
21,
31]. FCC-rich alloys generally exhibit ductile behavior dominated by dislocation slip and twinning, whereas BCC-rich alloys demonstrate higher strength but limited ductility [
31,
32]. The critical balance between FCC and BCC phases is a key factor in determining the strength–ductility trade-off in AlCoCrFeNi HEAs [
20]. Recent crystal plasticity simulations [
18] have revealed that BCC grains develop significantly higher geometrically necessary dislocation (GND) densities than adjacent FCC grains, thereby acting as dynamic strengthening networks through phase-boundary pinning effects. Stress concentrations are particularly pronounced at grain boundaries where gradients of stress, strain, and dislocation density are observed. Moreover, the activation of slip systems in neighboring FCC and BCC regions exhibits a high degree of compatibility, indicating strong mechanical coupling across phase boundaries.
Accordingly, the non-equiatomic composition Al5Co35Cr30Fe20Ni5 (at. %) was selected to stabilize a dual-phase FCC/BCC microstructure suitable for analyzing phase-specific load partitioning and interface-mediated plasticity. Despite considerable progress in understanding dual-phase HEAs, a detailed investigation of the microstructural interactions at the FCC/BCC interfaces is still lacking. The present study aims to elucidate the plastic deformation compatibility between FCC and BCC phases in a non-equiatomic AlCoCrFeNi HEA. The material investigated in this study was a non-equiatomic dual-phase AlCoCrFeNi high-entropy alloy, processed by forging as-cast ingots at 1200 °C, followed by a short heat treatment at 1200 °C and subsequent water quenching. High-resolution techniques, including digital image correlation under in situ deformation (HRDIC) and transmission electron microscopy (TEM), are employed to characterize strain localization, interface-mediated mechanisms, and the influence of nanoprecipitates on dislocation motion. These experimental insights are used to rationalize and complement recent crystal plasticity simulations, providing a comprehensive understanding of phase-specific load partitioning and the mechanisms governing the strength–ductility balance in dual-phase HEAs.
2. Materials and Methods
The nominal composition of the HEA, given in atomic percentage, is Al5Co35Cr30Fe20Ni5. The proper amounts of pure, commercially available elements were melted in an induction furnace under a protective argon atmosphere to prevent oxidation. The purity of the different elements was as follows: electrolytic cobalt 99.95 wt.%; aluminothermic chromium 99.32 wt.% (containing as main impurities 0.23% Fe and 0.14% Al); electrolytic nickel 99.92 wt.%; iron 99.63 wt.%; and aluminum 99.95 wt.%. Melting was carried out using an induction furnace, model VCT800V from Indutherm (Indutherm Erwärmungsanlagen GmbH, Walzbachtal, Germany), with a maximum power of 20 kW. In total, 70% of the maximum power of the furnace was selected, i.e., 14 kW, for melting. The elements were cut into small pieces with sizes below 2 cm and placed in an 800 cm3 zirconia crucible. The temperature was measured using a pyrometer, which allowed for instantaneous control of the level of power supplied in the course of heating up to 1700 °C. The heating took about 15 min, and then, this temperature was maintained for 10 min to ensure good homogeneity of the melt prior to pouring it into a cylindrical copper mold. The cast ingot was cut into slices 12 mm thick, which were hot-forged at 1200 °C down to a final thickness of 6 mm (a reduction of 50%), followed by heat treatment at 1200 °C for 15 min and subsequent water quenching.
Tensile tests were performed using an MTS-870 servo-hydraulic machine (MTS Systems Corporation, Eden Prairie, MN, USA) according to the ASTM E8M standard [
33] at a strain rate of 10
−3 s
−1. Tensile samples were cylindrical, with a gauge length of 18 mm, a diameter of 3 mm and a radius of 4 mm, while compression samples were cylindrical, measuring 10 mm in length and 5 mm in diameter (a drawing of the tensile sample is provided in
Figure S1).
Microstructural characterization of the forged and thermally treated alloy before and after plastic deformation was performed using scanning (SEM) and transmission electron (TEM) microscopes equipped with energy-dispersive spectroscopy detectors (EDS). Jeol 6500F SEM (JEOL Ltd., Tokyo, Japan) was operated at 20 kV for fracture observations and electron backscatter diffraction (EBSD) measurements. In addition, the working distance for EBSD acquisition was 15 mm and the step size during acquisition varied from 0.57 μm to 0.09 μm depending on the magnification of the image. For TEM, two microscopes were used: Jeol JEM 2100 (JEOL Ltd., Tokyo, Japan) operated at 200 kV and Jeol JEM 3000F (JEOL Ltd., Tokyo, Japan) operated at 300 kV. Samples for SEM and EBSD were prepared by mechanical polishing with alumina and colloidal silica in the final steps. EBSD data processing and analysis were performed using Aztec Crystal software version 6.1 SP1 (Oxford Instruments, Abingdon, UK). Deformed specimens for TEM were prepared by electrolytic jet polishing using a reactive mixture of 10% nitric acid in methanol at −35 °C.
Synchrotron radiation diffraction (SRD) experiments during compression tests were performed on the P07 beamline of PETRA III at the Deutsches Elektronen-Synchrotron (DESY, Hamburg, Germany). In situ compressive tests were carried out at a strain rate of 10
−3 s
−1. Compressive samples were machined from the forged plate in the radial direction. Samples for the compression tests were cylinders with a diameter of 5 mm and a length of 10 mm. The gauge volume was defined as 0.8 × 0.8 × 5 mm
3 (beam section × cylinder diameter). The diffraction patterns were obtained at a frequency of 2 Hz using a Perkin-Elmer XRD 1621 detector (PerkinElmer Inc., Waltham, MA, USA) with an array of 2048
2 pixels
2, with an effective pixel size of 200 × 200 µm
2. The wavelength was 0.0124 nm. LaB
6 powders were used as a reference to calibrate the system. The detector-to-sample distance was 1646 mm. Conventional 2θ diffraction profiles were obtained by azimuthal integration of the Debye–Scherrer rings in the axial and radial directions around ±7.5°. The fitting of the diffraction peaks was carried out using a Gaussian function. The lattice strain for each orientation can be calculated by the relative shift in the position of the diffraction peak defined by
where
dhkl and
d0,hkl are the planar spacing of the hkl plane in the stressed and stress-free crystal. The lattice spacing and the diffraction angle
θ are related through Bragg’s law throughout:
Rietveld analysis is obtained from the Debye–Scherrer pattern using the MAUD software version 2.8 [
34].
The characterization of the strain distribution via high-resolution digital image correlation (HRDIC) requires the development of a homogeneous and finely distributed marker pattern on the sample surface. In this study, a gold speckle pattern was obtained by remodeling a thin gold layer, previously sputtered on the sample surface, using the procedure described in [
35]. Prismatic compression samples of 5 × 5 × 10 mm
3 were machined with the compressive axis perpendicular to the forging direction. Then, one of the prismatic faces was ground, polished with 9, 3 and 1 µm oil-based diamond suspensions and finished using water-free fumed silica (0.2 µm) suspension. Gold speckles were generated by the flow of water vapor at 300 °C, achieving an optimum speckle pattern size of 10–30 nm after four hours of remodeling time.
Back-scattered electron images of the remodeled gold pattern were acquired using a FEI SEM FEI VERIOS 460 (FEI Company, Hillsboro, OR, USA). An area of around 91 × 61 µm2 was captured by stitching 64 images of 2048 × 1768 pixel resolution with an overlap of 20%. The samples were tested in uniaxial compression at a constant strain rate of 10−4 s−1 up to a macroscopic strain of around 2% and 4%.
Images of the same area for the undeformed and deformed states (2 and 4% plastic strain) were correlated using DaVis software version 8.3 [
36], selecting a sub-window size of 8 × 8. The displacement data, with a strain resolution of 23 nm, were obtained using the same procedure described in previous papers [
37].
4. Discussion
The two-phase structure of this alloy is similar to that of eutectic alloys with a composition close to that of the AlCoCrFeNi2.1 alloy [
13,
17,
20,
39,
40,
41,
42]. However, the nature and volume fraction of the phases present in the Al5Co35Cr30Fe20Ni5 HEA are completely different due to the large differences in Al and Ni contents, which are much higher in eutectic alloys. Large Ni and Al contents stabilize the ordered BCC and FCC phases, promoting the stability of B2 and/or L12, respectively. These phases can appear, depending on thermal treatments, as main or secondary phases [
20,
43,
44]. In the case of the Al5Co35Cr30Fe20Ni5 alloy, the low Ni and Al contents preclude the formation of the ordered L1
2 phase. Thus, the alloy is constituted by a disordered FCC phase as the main phase, comprising about 75% in volume fraction, while the disordered BCC phase (A2 structure) constitutes the secondary phase (about 24% in volume fraction). In addition, the A2-BCC phase contains a very low fraction of the ordered BCC phase (B2 structure). Nevertheless, no large compositional differences have been found between the FCC and BCC phases; the FCC phase is slightly enriched in Co and Ni with respect to the nominal composition of the alloy, while the BCC phase exhibits certain enrichment in Cr and Al. The microstructure of the alloy corresponds to that which is thermodynamically stable at the forging temperature, i.e., a two-phase microstructure, which is frozen during subsequent water quenching from forging temperature. Consequently, both phases are present with the same volume fractions as those found in the forged material. It is worth noting that quenching prevents the formation of the σ-phase, which could render the alloy brittle [
45].
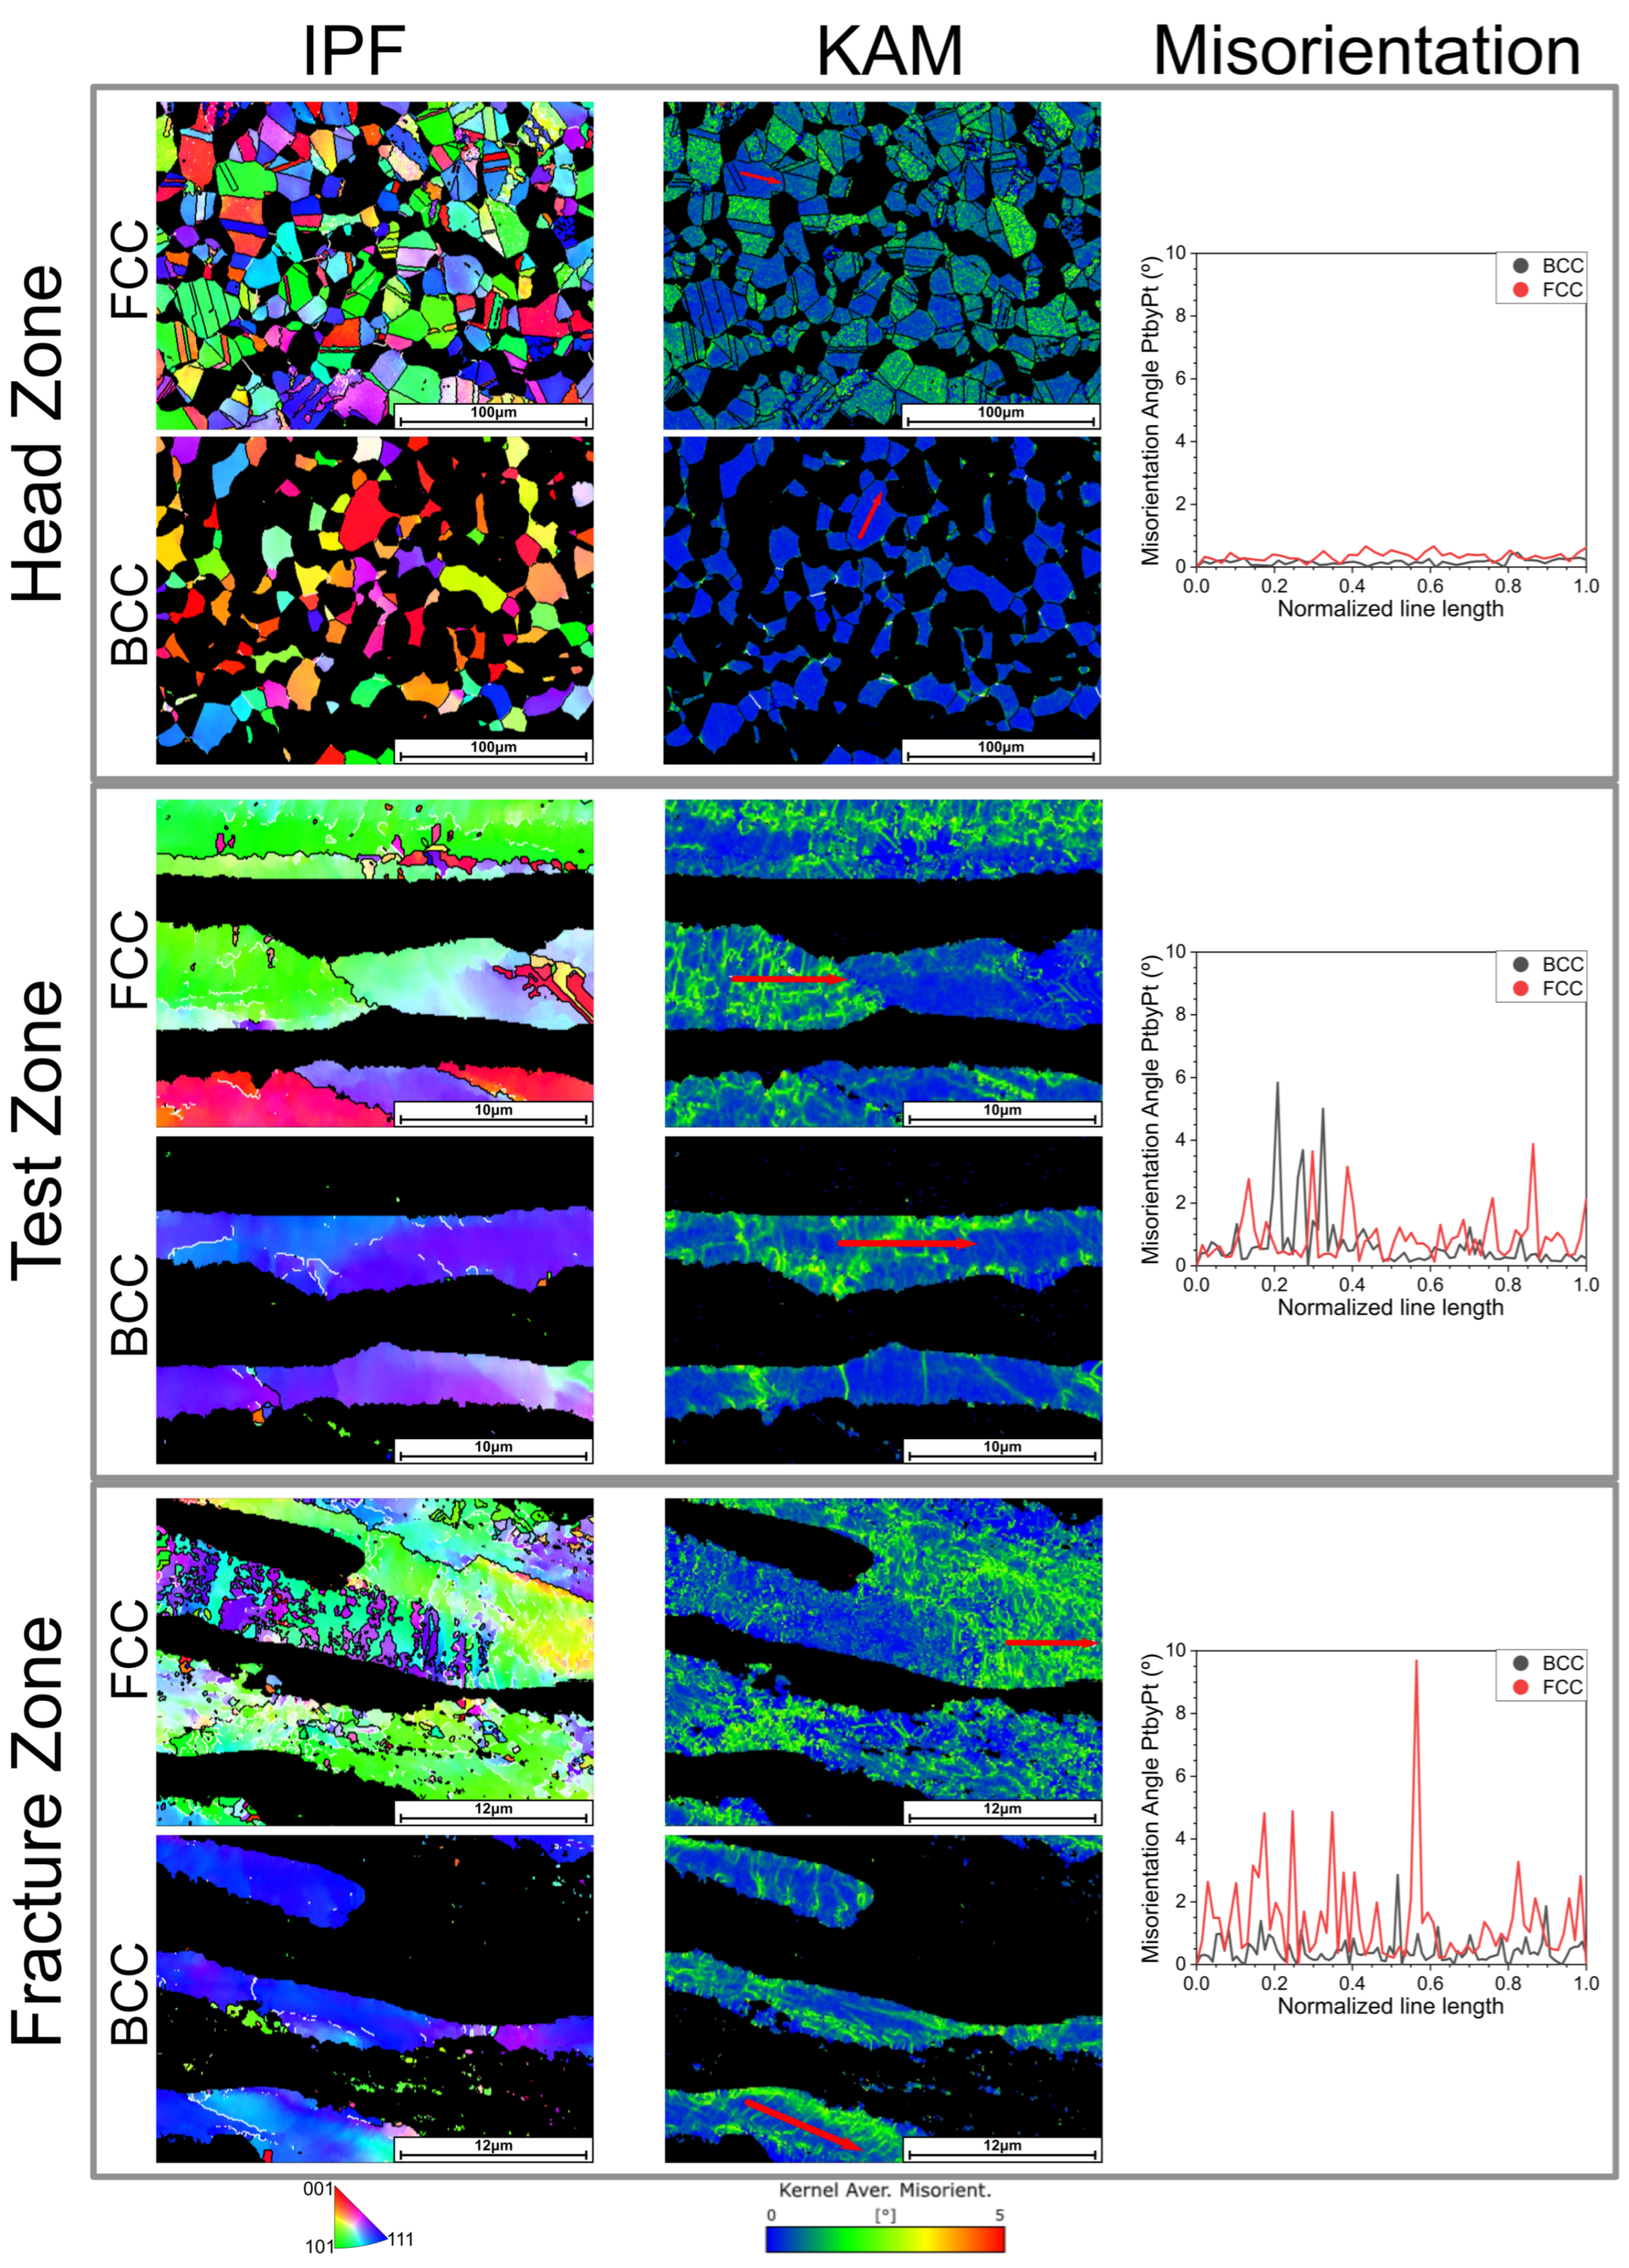
Tensile and compressive curves present similar aspects, and the yield stress is also similar, so it could be considered that the alloy behaves in the same way, disregarding the load direction. This behavior probably arises from the not fully recrystallized microstructure existing in the forged material, although microstructural features associated with the recrystallization of FCC and BCC phases are slightly different. KAM maps of the forged alloy reveal that some grains of the FCC phase contain a high density of dislocations, while other grains are almost dislocation-free (see
Figure 6). The development of such a microstructure is not related to grain orientation, because grains with the same orientation can exhibit a range from high to low dislocation density (see OIM of the non-deformed forged alloy in
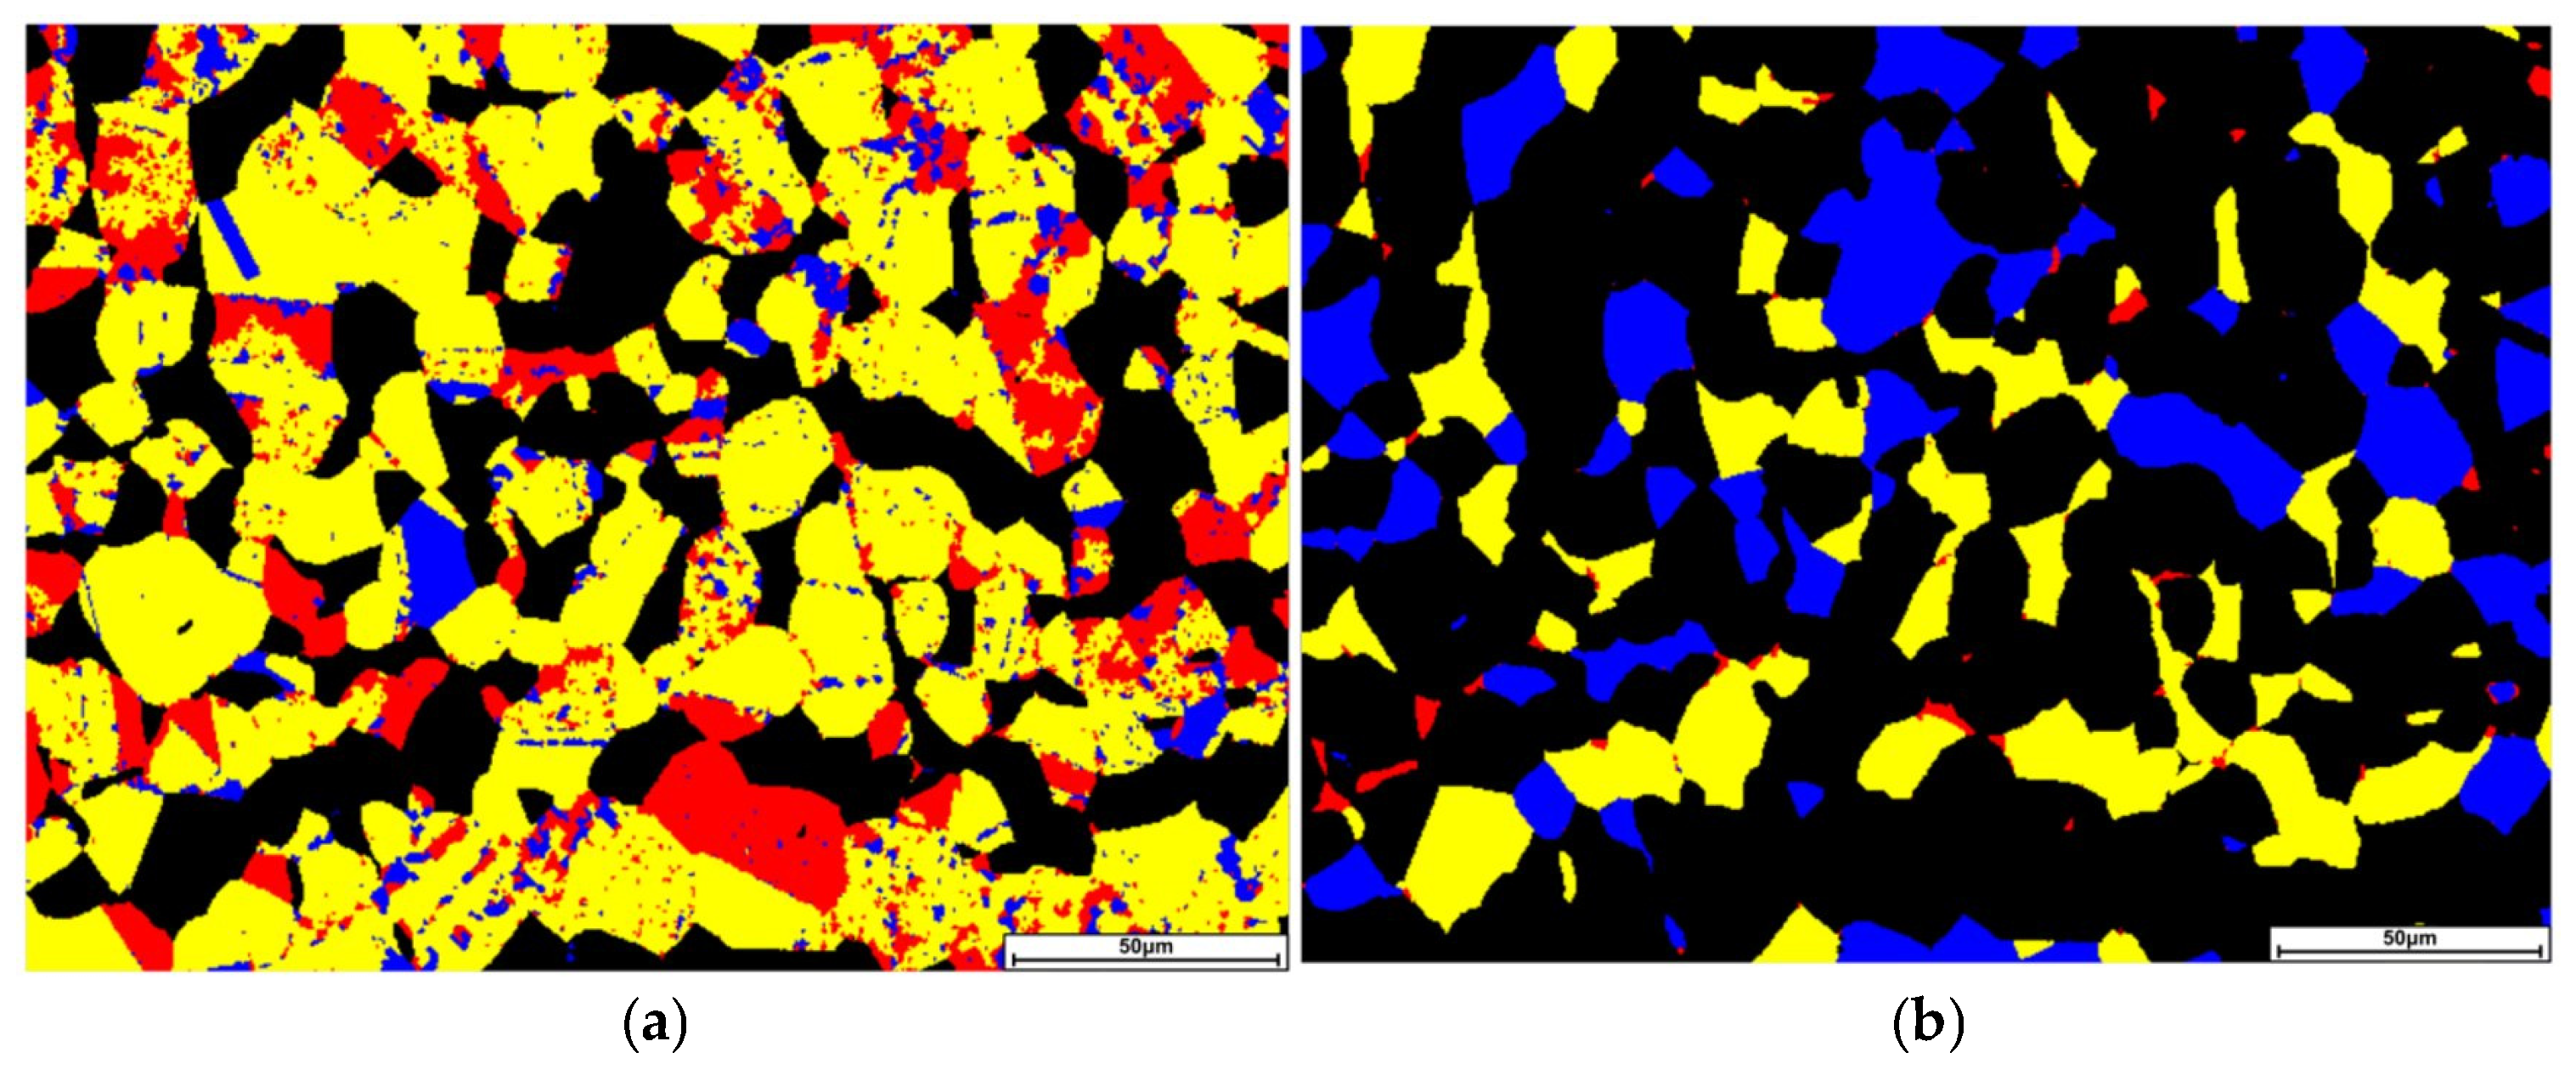
Figure 6 (Heads-Zone)). On the other hand, BCC grains are totally free of dislocations, and there are some dislocations in local regions at the interface with the FCC phase. The distribution maps of recrystallized grains, shown in
Figure 15, indicate that only a small fraction of the FCC phase corresponds to recrystallized grains free of dislocations, with the rest of the grain constituting a deformed substructure consisting of recovered grains or, even, regions in which the deformed structure generated during the deformation is still retained. Recrystallization of the BCC phase proceeds more favorably because the fraction of recrystallized and recovered regions is almost identical, with very few residual grains in which the deformed structure is still present. In any case, misorientation in recrystallized and recovered grains in the FCC phase is very small, below 1º, but it increases to 3.5° in deformed grains (compare misorientation plots of the forged alloy presented in
Figure 6 and
Figure S2).
Deformation of dual-phase AlCoCrFeNi HEAs, especially those compositions close to eutectic compositions, is very complex because a large number of deformation mechanisms have been identified: the formation of stacking faults, which can act as pinning points for dislocations, leading to dislocation entanglements [
13,
44,
46]; the hardening effect due to nanoprecipitates of the L12 or B2 phases [
42,
43,
44]; and the piling up of dislocations at phase interfaces or the backstresses induced by such accumulation of dislocations at these interfaces [
20,
39,
43,
46,
47,
48]. It is well reported that deformation begins in the FCC phase because it is the softer main phase [
20,
42,
44,
47,
48,
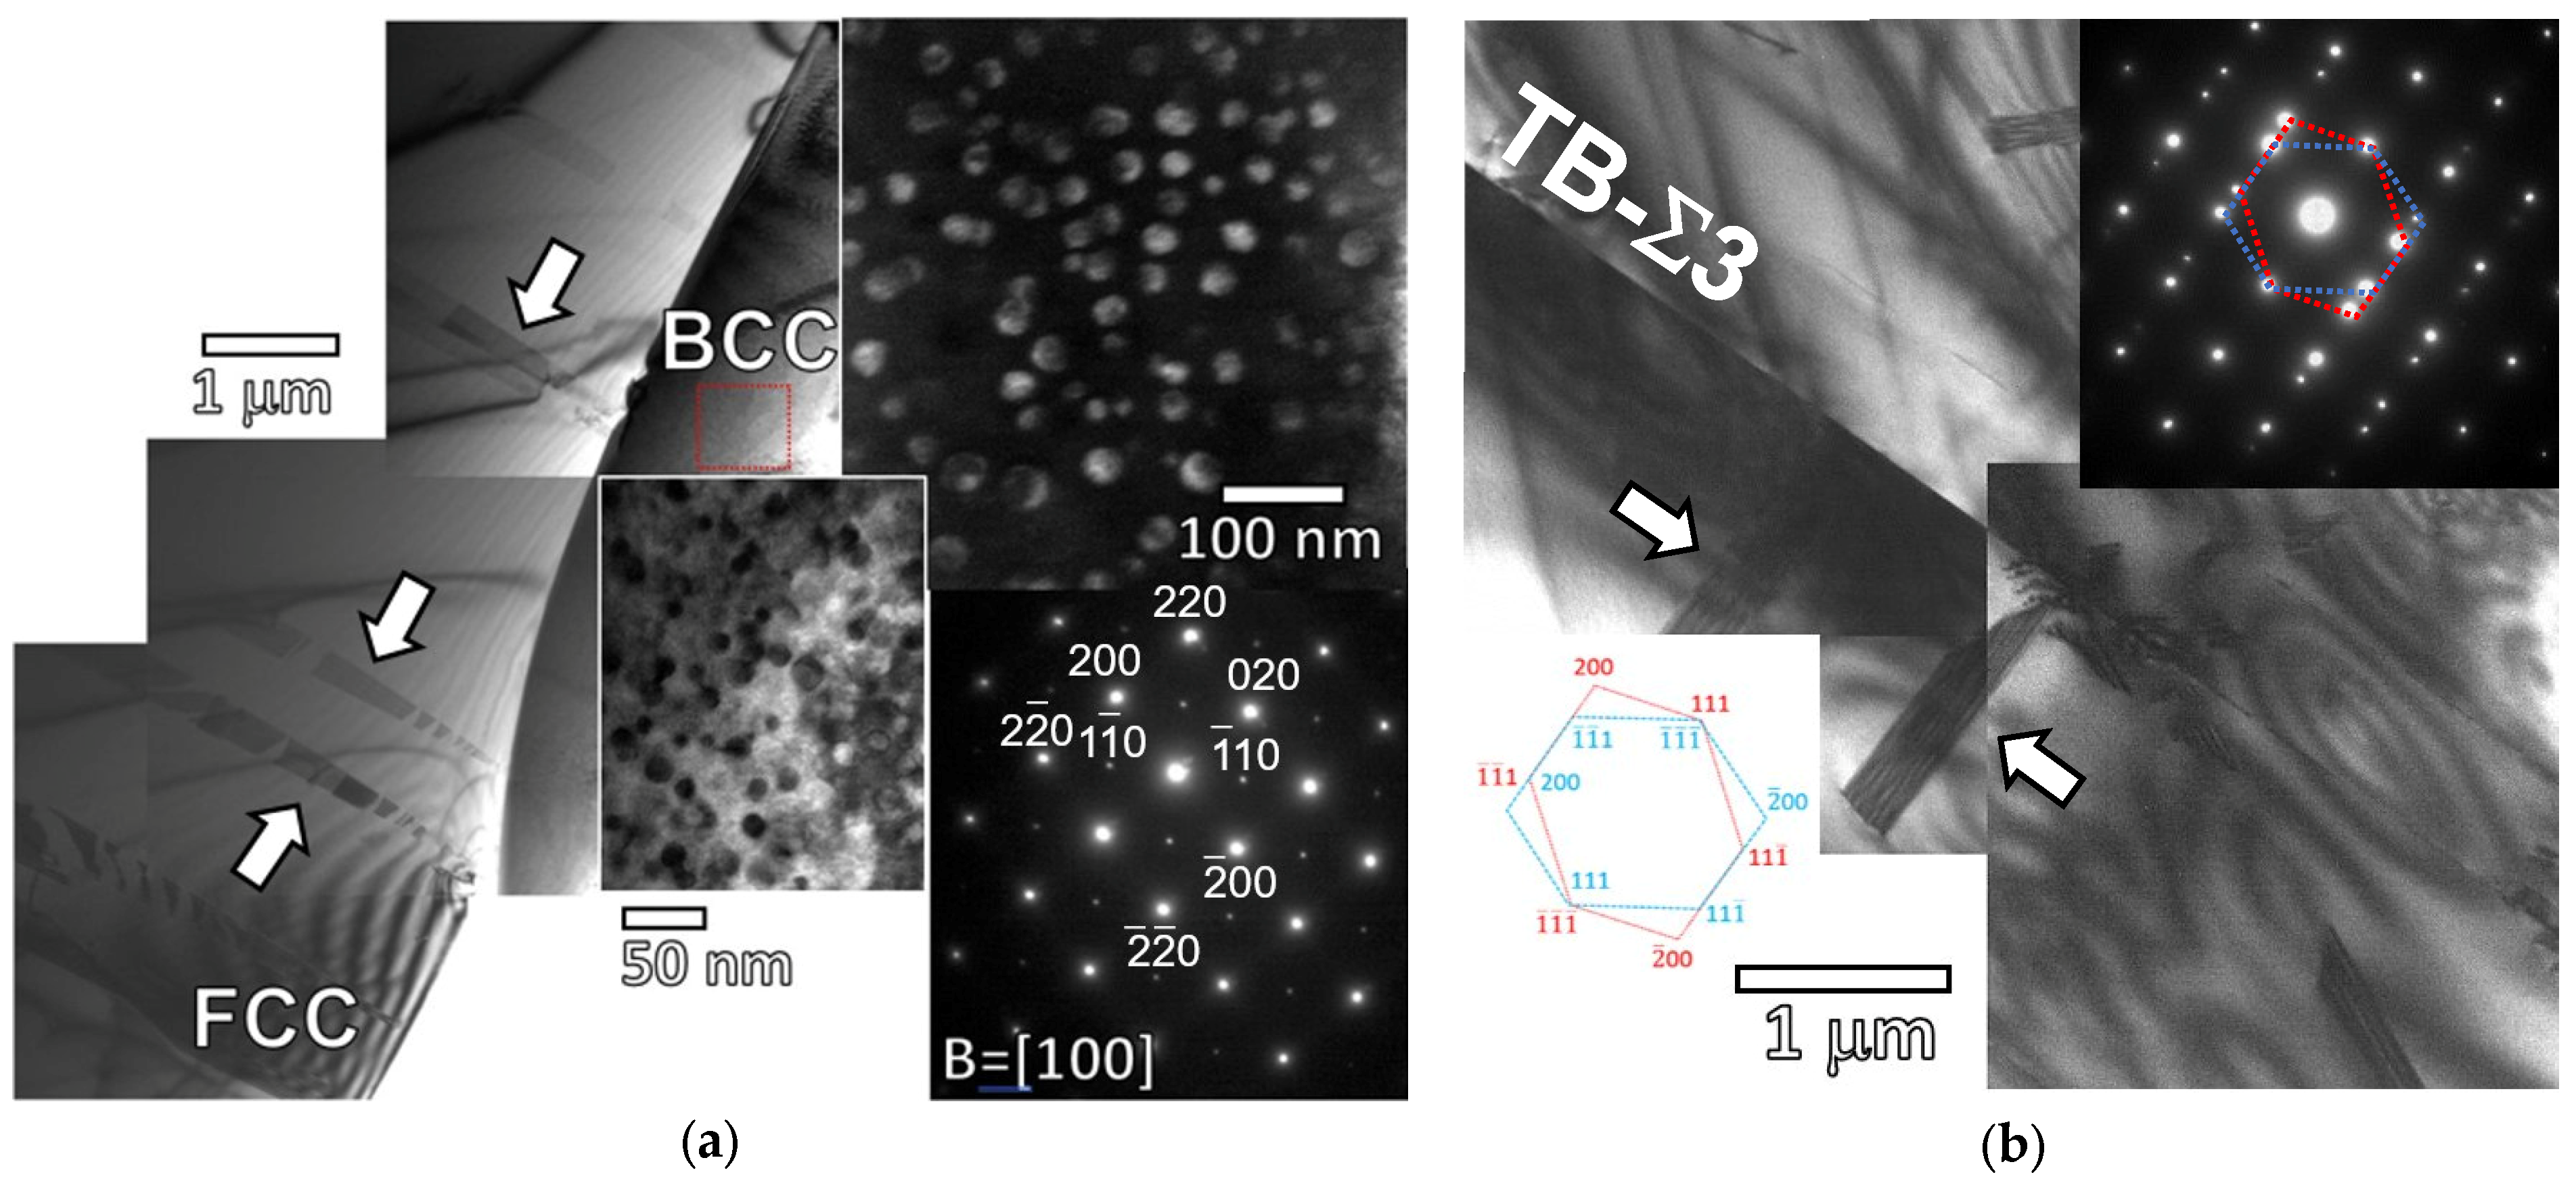
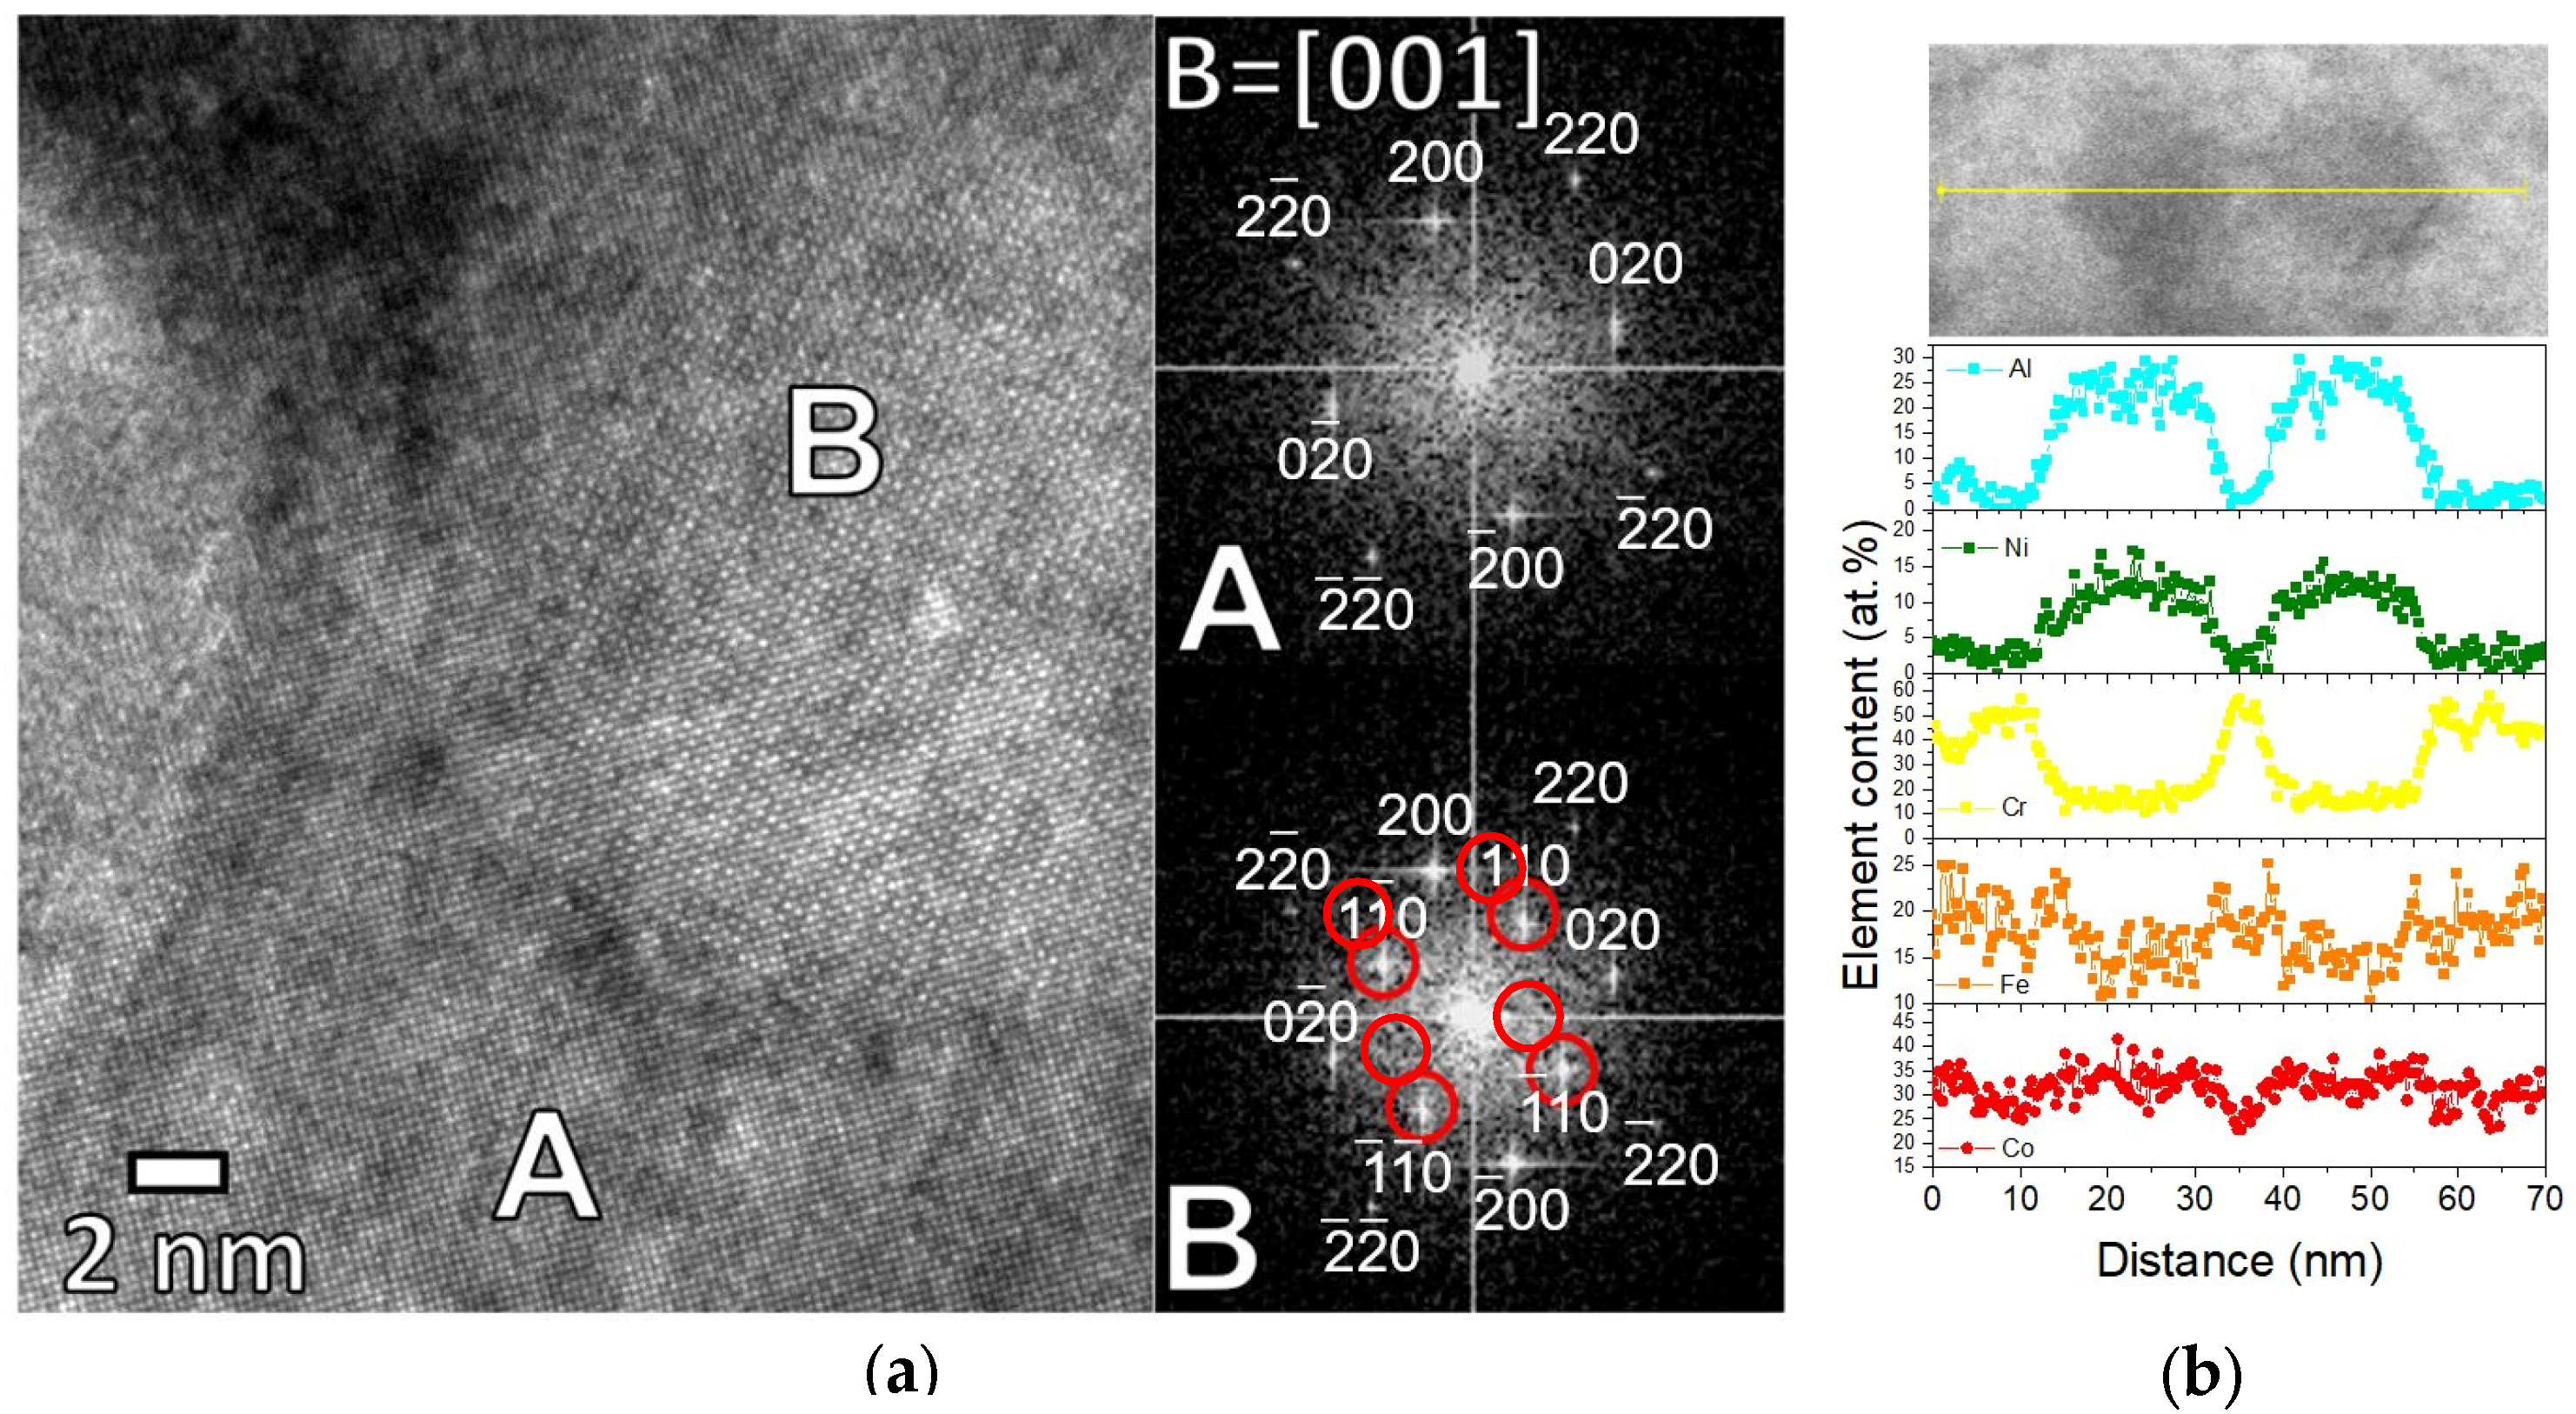
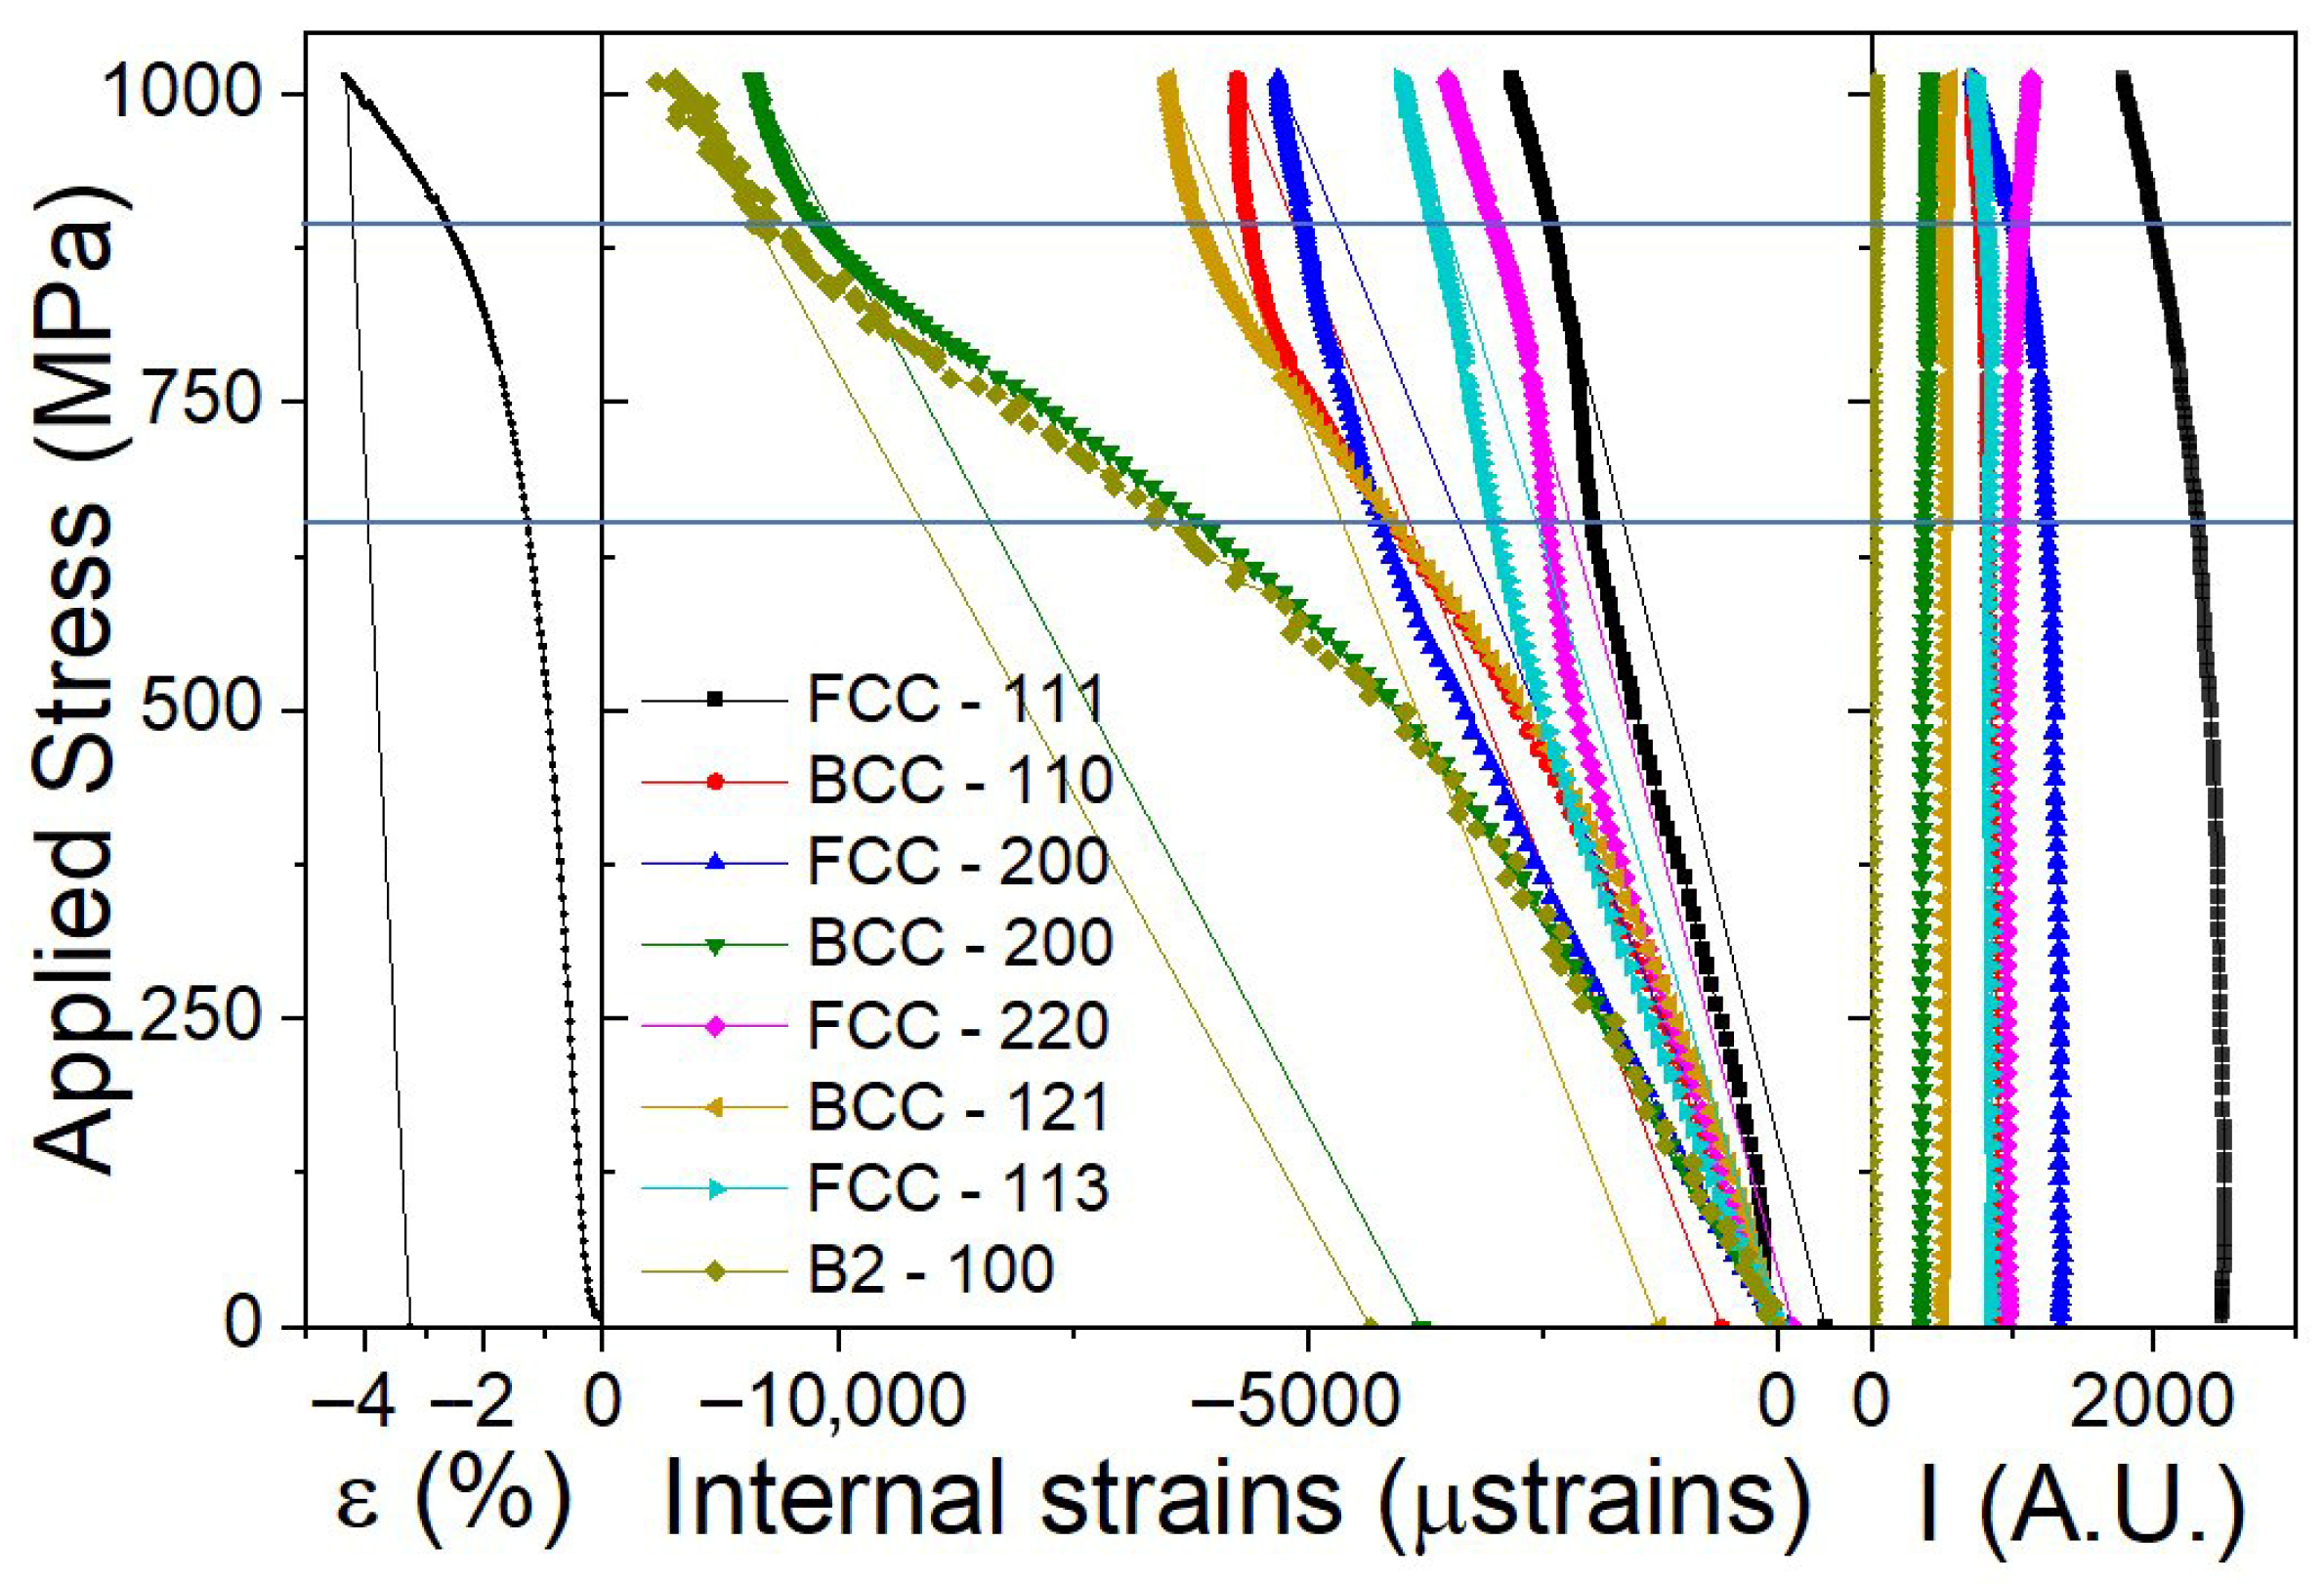
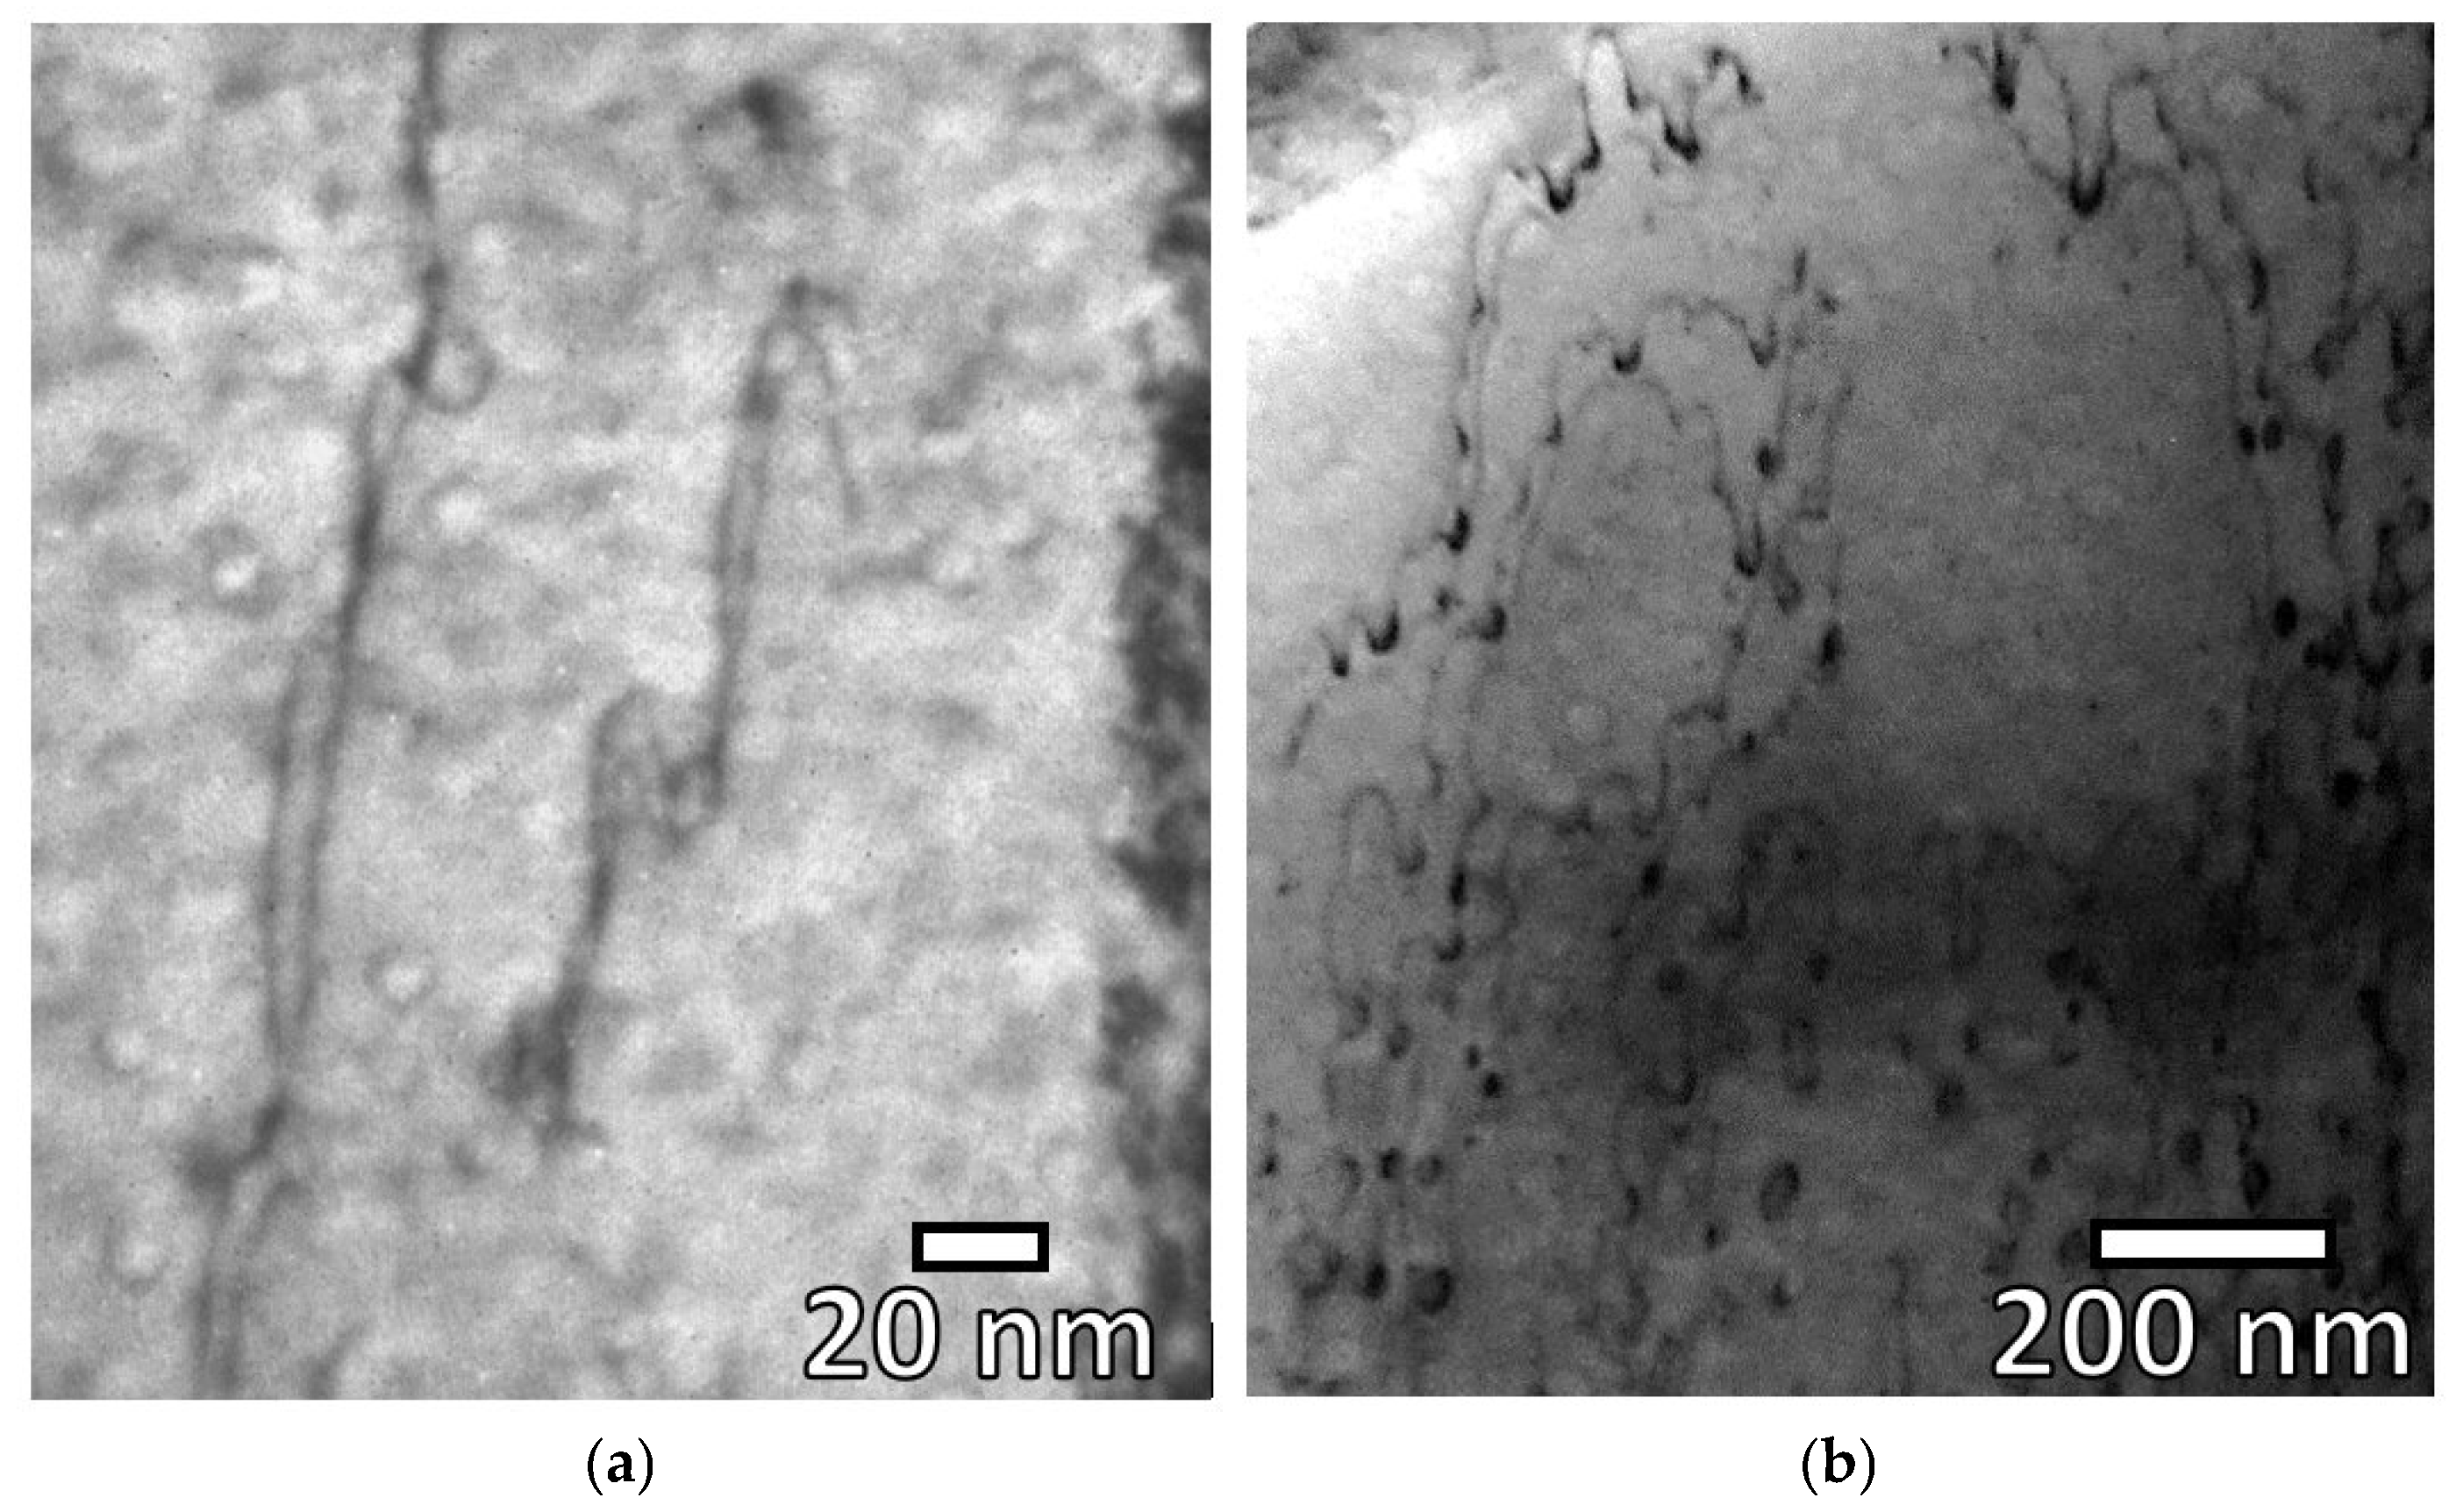
49]. Synchrotron measurements clearly demonstrate that deformation is governed by deformation in the FCC phase, but there is a significant contribution from the BCC phase. There is a load transfer from FCC grains to BCC grains, which is manifested by the large increase of internal strains in the BCC phase, especially in the (200) planes. Thus, the BCC phase assumes part of the applied load, releasing the stress level of neighboring FCC grains, even when the material is deforming in the elastic regime. A similar behavior is found for the B2 nanoparticles dispersed in BCC grains, but in this case the B2 phase would assist the BCC in withstanding higher stresses transferred from the adjacent FCC grain. TEM observations prove that the dislocation line bows around B2 nanoparticles, drawing a curved segment among them. If the stress is high enough, the dislocation can overcome the particles, leaving a dislocation loop around the particles, as observed in
Figure 10.
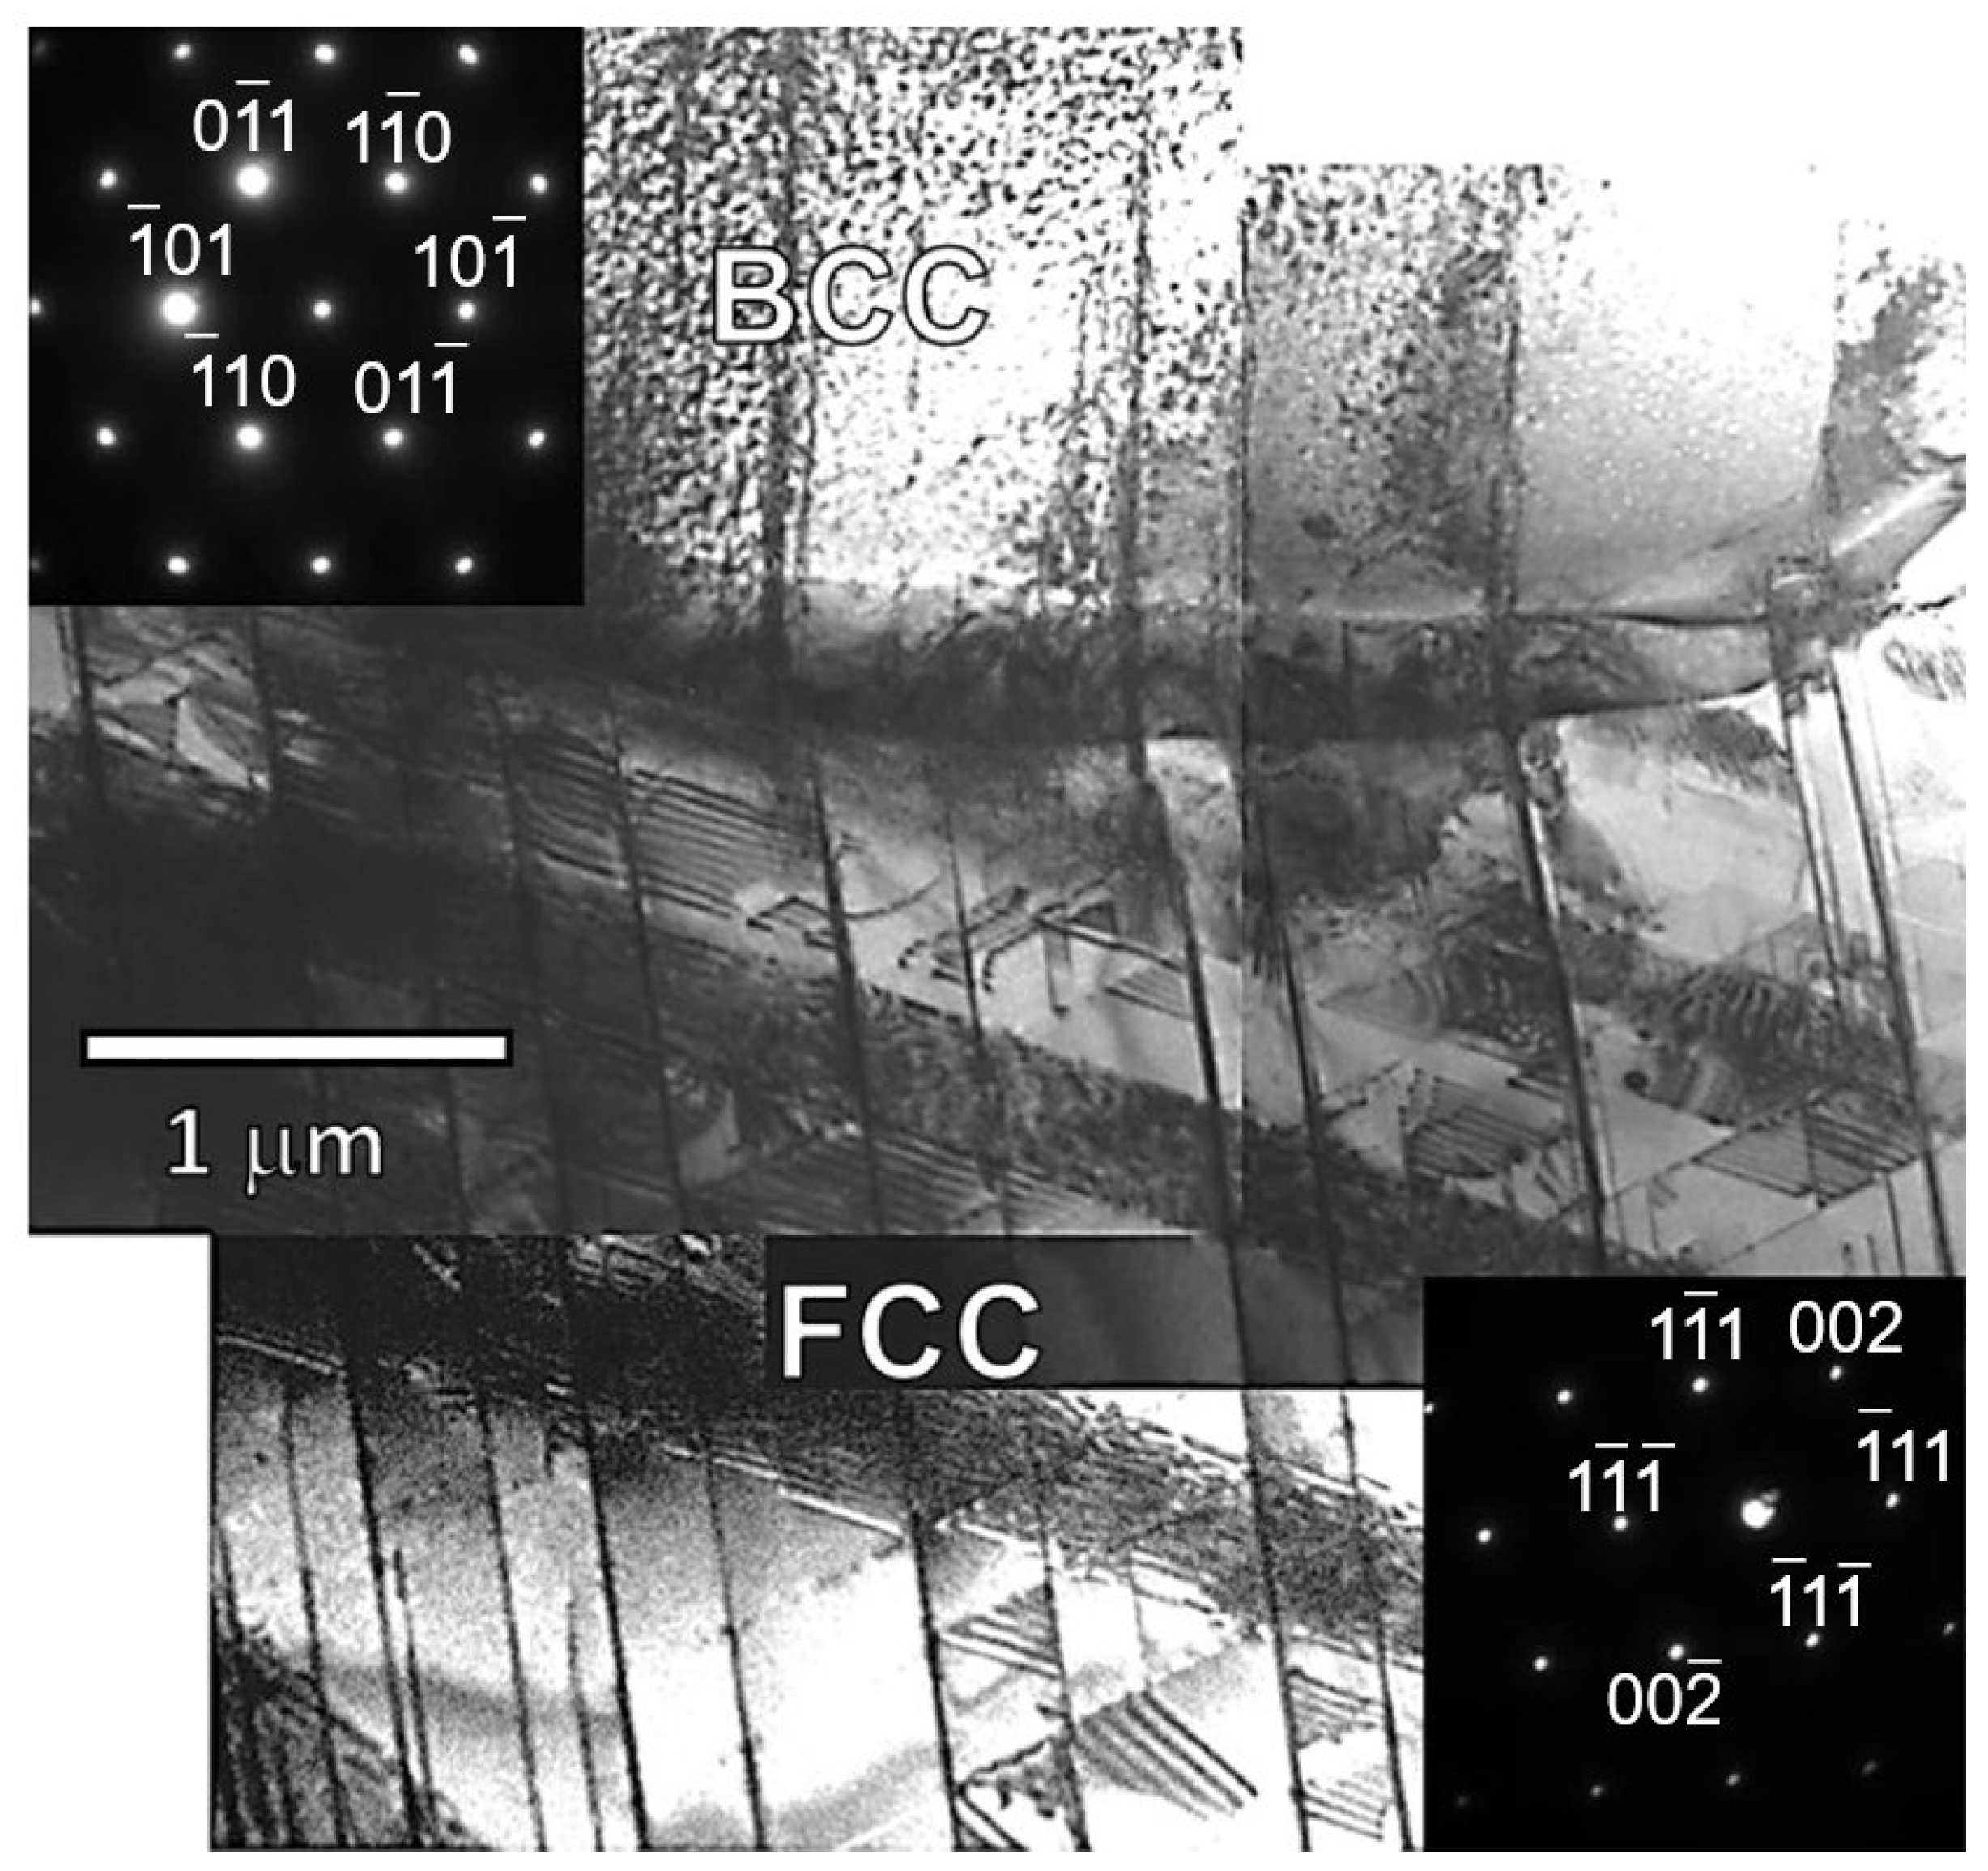
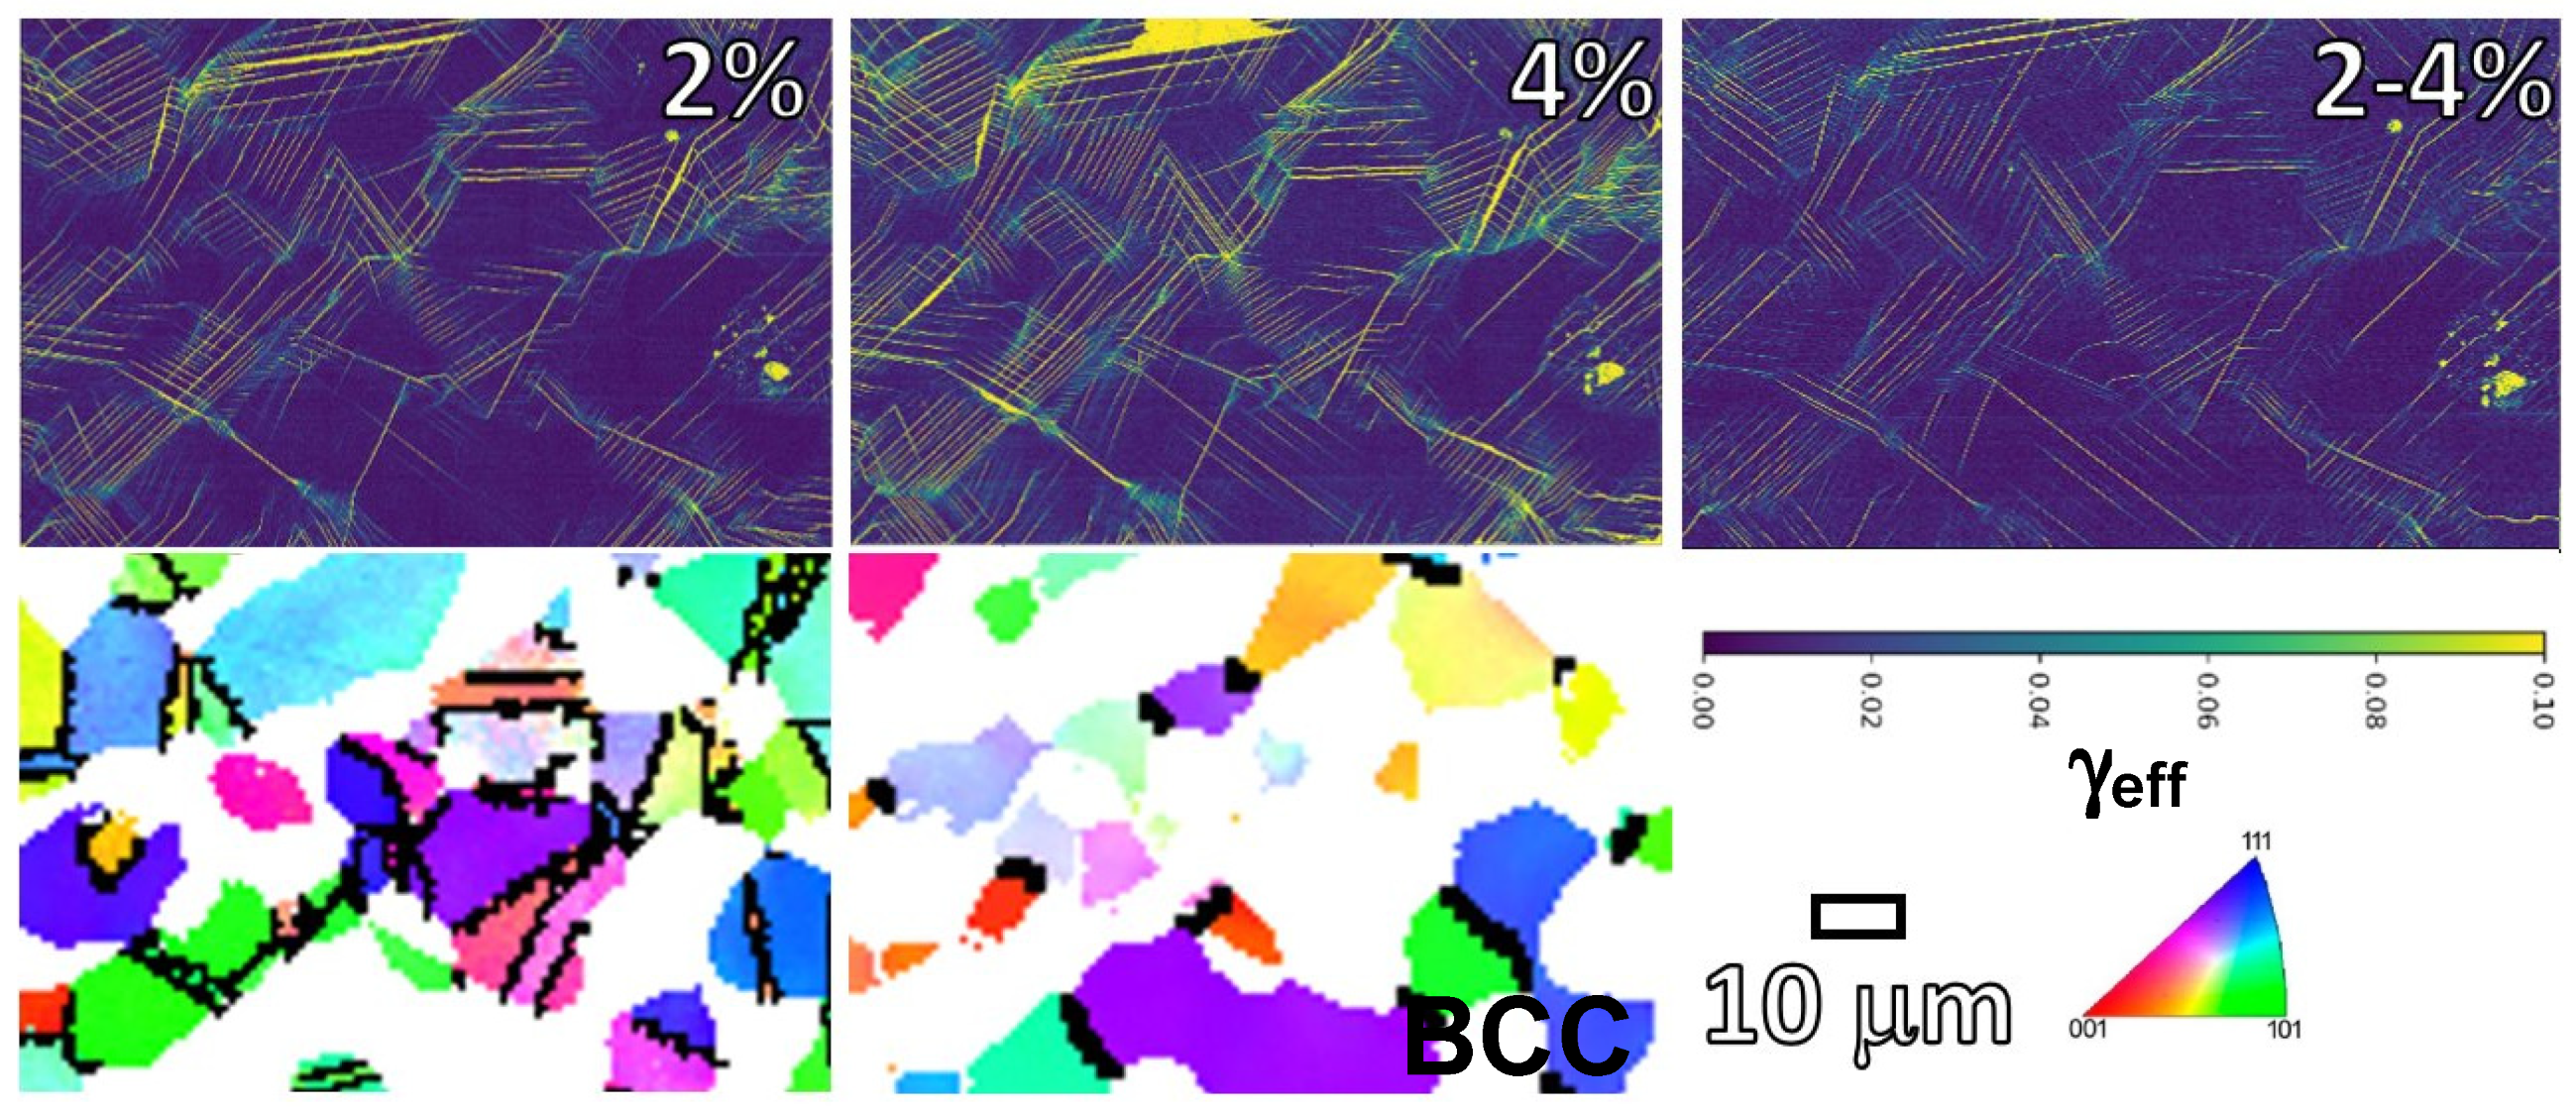
TEM and HRDIC analysis in samples compressed during the initial stage of plastic deformation, up to 4%, show slip bands and stacking faults. At low strain (2%), the deformation localizes in very few slip bands within the FCC phase, while higher strains are required to activate slip in the BCC phase. Nevertheless, the distribution of such bands is irregular in FCC grains, indicating that dislocation motion is promoted initially in those grains that are oriented favorably for slip. Similarly, grain orientation determines the activation of a secondary slip system intersecting with primary slip bands. At this strain level, only a few slip bands are present in some BCC grains, primarily nucleated to relieve stress at grain boundaries shared with FCC grains. Only with increasing the strain is a major density of bands found within the BCC phase. Activation of slip in BCC grains appears to be induced by the stress accumulation associated with dislocation pile-up at local points of the FCC/BCC interface. This slip transfer mechanism allows the release of stresses in spite of plastic incompatibility between both phases, resulting in a load transfer from FCC grains to BCC grains. TEM observations also support this argument.
The microstructure of the FCC and BCC grains continues to evolve during the course of plastic deformation. This can be clearly seen by comparing KAM maps in the tensile sample tested up to failure with the non-deformed alloy (head of the tensile sample), as shown in
Figure 9. It can be observed that dislocation activity within FCC/BCC grains results in an increase in misorientation, higher in the case of the BCC phase, leading to the format
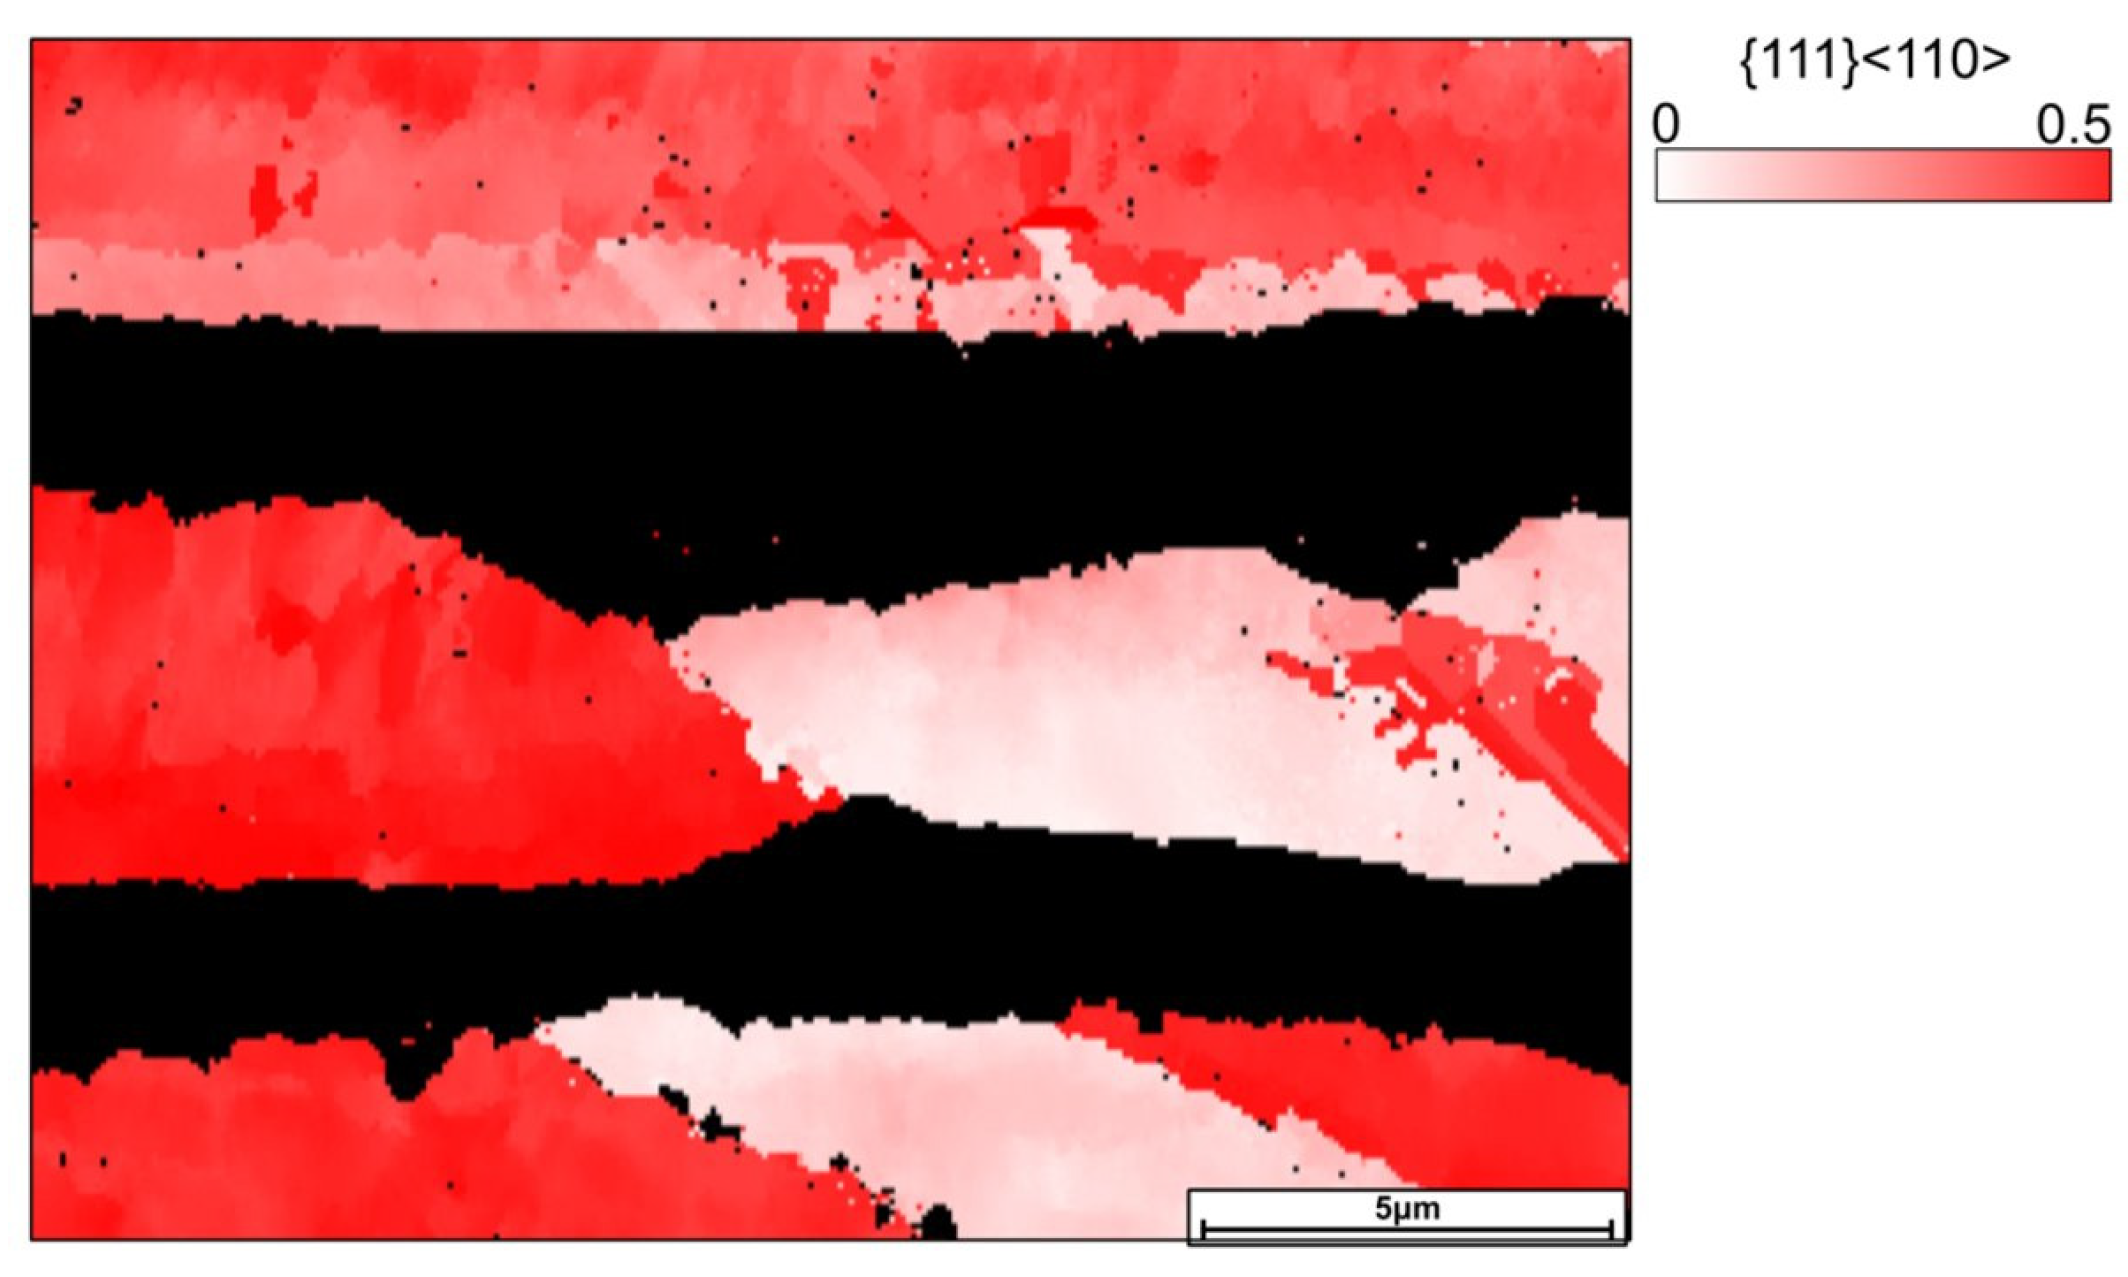
Figure 16 on of low-angle subgrains. Since the accumulation of dislocations coincides with subgrain boundaries, the latter act as effective barriers for dislocation motion. It is interesting to note that dislocations tend to be concentrated close to grains not favorably oriented for the activation of the primary slip system in both phases (see Schmid factor map of
Figure 15 corresponding to the same region presented in
Figure 9), even after large strains, or close to the interfaces with the BCC phase.
Figure 16.
Schmid factor map corresponding to the {111}<110> slip deformation system for the FCC phase. The step size during map acquisition is 0.09 μm.
To gain insight into the potential of the Al5Co35Cr30Fe20Ni5, its tensile properties have been compared in
Table 3 with those reported for other HEAs in the AlCoCrFeNi/AlCoFeNi systems [
20,
40,
41,
50,
51,
52,
53,
54,
55,
56,
57,
58]. The data evidence that the strength of the present HEA, processed by forging at 1200 °C, is comparable to as-cast eutectic HEAs, with the difference that the volume fraction of the BCC phase is much lower than that of the hard B2 phase in eutectic alloys. It could be expected that the optimization of the thermomechanical processing could yield a high-strength fine-grained microstructure, as found in the case of thermomechanically processed eutectic HEAs (see
Table 3). Furthermore, other strategies for improving the strength of the alloy could involve those used to increase the strength of superalloys: addition of small amounts of carbon to form carbides [
58,
59,
60,
61,
62] or elements such as Ti to promote the formation of hard intermetallic phases. Small Ti contents have been demonstrated to be effective in hardening AlCoCrFeTNi alloys [
53,
54,
55]. In the same way, the dispersion of fine particles of hard phases as alumina [
63] or Y
2O
3 [
64] could also improve the mechanical properties of the alloy. All this evidence suggests that there is a large margin for strengthening this alloy.
Author Contributions
Conceptualization, P.P. and G.G.; methodology, A.S., N.S., P.P., G.G. and P.A.; validation, A.S., S.P. and J.M.; formal analysis, J.M., A.O.-C., G.G. and P.P.; investigation, P.A., E.L., G.G., J.M., R.H. and P.P.; resources, A.S. and N.S.; data curation R.H., E.L., S.P., A.O.-C. and G.G.; writing—original draft preparation, G.G.; writing—review and editing, All authors.; supervision, P.P.; funding acquisition, P.P. and G.G. All authors have read and agreed to the published version of the manuscript.
Funding
We would like to acknowledge the financial support of the Spanish Ministry of Economy and Competitiveness under projects PID2019-104382RB-I00 and PID2022-143068OB-I00. The Deutsches Elektronen-Synchrotron (DESY) is acknowledged for providing beamtime at the P07 beamline of the PETRA III synchrotron facility under proposal I-20221015EC. The research leading to this result has received funding from the European Union’s Horizon 2020 research and innovation programme under grant agreement No. 730872 (CALIPSOplus). We also acknowledge the services provided by the MiNa Laboratory at IMN, as well as funding from CM (project S2018/NMT-4291 TEC2SPACE), MINECO (project CSIC13-4E-1794) and the EU (FEDER, FSE).
Data Availability Statement
The data presented in this study are available on request from the corresponding author. The data are not publicly available due to privacy.
Acknowledgments
We would like to acknowledge the technical support of the Electron Microscopy Laboratory at the National Center for Metallurgical Research (CENIM-CSIC) for access to their facilities and expert assistance.
Conflicts of Interest
The authors declare no conflicts of interest.
Abbreviations
The following abbreviations are used in this manuscript:
| HEA | High-Entropy Alloy |
| FCC | Face-Centered Cubic |
| BCC | Body-Centered Cubic |
| HCP | Hexagonal Close-Packed |
| SRO | Short-Range Order |
| PM | Powder Metallurgy |
| AM | Additive Manufacturing |
| SEM | Scanning Electron Microscopy |
| TEM | Transmission Electron Microscopy |
| SAED | Selected Area Electron Diffraction |
| OIM | Orientation Image Map |
| HRDIC | High-Resolution Digital Image Correlation |
| ROI | Region of Interest |
| KAM | Kernel Average Misorientation |
| HIP | Hot Isostatic Pressing |
| SRD | Synchrotron Radiation Diffraction |
| XRD | X-ray Diffraction |
| FWHM | Full Width at Half Maximum |
| GND | Geometrically Necessary Dislocation |
References
- Panigrahi, A.; Sengupta, P.; Bhanj, T.K. High Entropy Alloys as Alternatives to Ni-Based Superalloys. In Handbook of High Entropy Alloys; CRC Press: Boca Raton, FL, USA, 2025; pp. 329–370. [Google Scholar]
- Ye, Y.F.; Wang, Q.; Lu, J.; Liu, C.T.; Yang, Y. High-entropy alloy: Challenges and prospects. Mater. Today 2016, 19, 349–362. [Google Scholar] [CrossRef] [Scilit]
- Yeh, J.-W.; Chen, S.K.; Lin, S.-J.; Gan, J.-Y.; Chin, T.-S.; Shun, T.-T.; Tsau, C.-H.; Chang, S.-Y. Nanostructured high-entropy alloys with multiple principal elements: Novel alloy design concepts and outcomes. Adv. Eng. Mater. 2004, 6, 299–303. [Google Scholar] [CrossRef] [Scilit]
- Cantor, B.; Chang, I.T.H.; Knight, P.; Vincent, A.J.B. Microstructural development in equiatomic multicomponent alloys. Mater. Sci. Eng. A 2004, 375, 213–218. [Google Scholar] [CrossRef] [Scilit]
- Miracle, D.B.; Senkov, O.N. A critical review of high entropy alloys and related concepts. Acta Mater. 2017, 122, 448–511. [Google Scholar] [CrossRef] [Scilit]
- Tokarewicz, M.; Grądzka-Dahlke, M. Review of recent research on AlCoCrFeNi high-entropy alloy. Metals 2021, 11, 1302. [Google Scholar] [CrossRef] [Scilit]
- Liu, S.; Wan, D.; Guan, S.; Fu, Y.; Zhang, Z.; He, J. A comparative study on nanoscale mechanical properties of CrMnFeCoNi high-entropy alloys fabricated by casting and additive manufacturing. J. Mater. Res. Technol. 2024, 33, 1211–1219. [Google Scholar] [CrossRef] [Scilit]
- Hsu, W.-L.; Tsai, C.-W.; Yeh, A.-C.; Yeh, J.-W. Clarifying the four core effects of high-entropy materials. Nat. Rev. Chem. 2024, 8, 471–485. [Google Scholar] [CrossRef] [Scilit]
- Tsai, K.-Y.; Tsai, M.-H.; Yeh, J.-W. Sluggish diffusion in Co–Cr–Fe–Mn–Ni high-entropy alloys. Acta Mater. 2013, 61, 4887–4897. [Google Scholar] [CrossRef] [Scilit]
- Hu, Y.; Wang, X.; Ma, Y.; Chen, J.; Zhao, X.; Cheng, J.; Xu, T.; Zhao, W.; Song, X.; Wu, S.; et al. Strong solid solution strengthening caused by severe lattice distortion in body-centered cubic refractory high-entropy alloys. Scr. Mater. 2025, 263, 116671. [Google Scholar] [CrossRef] [Scilit]
- Wu, Z.; Xu, X.; Wei, L.; Yu, Y.; Fu, X.; Cheng, G.; Jia, H.; Jiang, Y. Rapid precipitation of L12 phase in Al0.5CoCrFeNi high-entropy alloy under electropulsing. Mater. Res. Lett. 2025, 13, 475–484. [Google Scholar] [CrossRef] [Scilit]
- Tang, Z.; Zhang, S.; Cai, R.; Zhou, Q.; Wang, H. Designing high entropy alloys with dual fcc and bcc solid-solution phases: Structures and mechanical properties. Metall. Mater. Trans. A 2019, 50, 1888–1901. [Google Scholar] [CrossRef] [Scilit]
- Chen, H.; Lang, L.; Shang, X.; Dash, S.S.; He, Y.; King, G.; Zou, Y. Anisotropic co-deformation behavior of nanolamellar structures in additively manufactured eutectic high entropy alloys. Acta Mater. 2024, 271, 119885. [Google Scholar] [CrossRef] [Scilit]
- Ding, Z.; Ding, C.; Yang, Z.; Zhang, H.; Wang, F.; Li, H.; Xu, J.; Shan, D.; Guo, B. Ultra-High Strength in FCC+ BCC High-Entropy Alloy via Different Gradual Morphology. Materials 2024, 17, 4535. [Google Scholar] [CrossRef] [Scilit] [PubMed]
- He, L.; Wang, C.; Zhang, M.; Li, J.; Chen, T.; Zhou, X. Design of BCC/FCC dual-solid solution refractory high-entropy alloys through CALPHAD, machine learning and experimental methods. npj Comput. Mater. 2025, 11, 105. [Google Scholar]
- Li, Z.; Körmann, F.; Grabowski, B.; Neugebauer, J.; Raabe, D. Ab initio assisted design of quinary dual-phase high-entropy alloys with transformation-induced plasticity. Acta Mater. 2017, 136, 262–270. [Google Scholar] [CrossRef] [Scilit]
- Li, Z.; Tasan, C.C.; Springer, H.; Gault, B.; Raabe, D. Interstitial atoms enable joint twinning and transformation induced plasticity in strong and ductile high-entropy alloys. Sci. Rep. 2017, 7, 40704. [Google Scholar] [CrossRef] [Scilit]
- Wang, H.; Lu, W.; Liu, B.; Li, J.; Liaw, P.K.; Fang, Q. Multiscale Mechanics of Architectured Dual-Phase High-Entropy Alloys: Dislocation-Interface Synergy Governing Strength-Ductility Paradigm. J. Alloys Compd. 2025, 1035, 181379. [Google Scholar] [CrossRef] [Scilit]
- Tang, X.; Zhang, H.; Xue, P.; Wu, L.; Liu, F.; Zhu, Z.; Ni, D.; Xiao, B.; Ma, Z. Microstructure and Mechanical Properties of As-Cast and Laser Powder Bed Fused AlCoCrFeNi2.1 Eutectic High-Entropy Alloy. Acta Met. Sin. 2023, 60, 1461–1470. [Google Scholar]
- Tang, X.; Zhang, H.; Zhu, Z.; Xue, P.; Wu, L.; Liu, F.; Ni, D.; Xiao, B.; Ma, Z. Dual-phase synergistic deformation characteristics and strengthening mechanism of AlCoCrFeNi2.1 eutectic high entropy alloy fabricated by laser powder bed fusion. J. Mater. Sci. Technol. 2023, 150, 75–85. [Google Scholar] [CrossRef] [Scilit]
- Pengyan, M.A.O.; Hui, Z.; Hongda, L.I. Effect of Al content on microstructure and mechanical properties of AlxCoCrFeNi high-entropy alloys. Nonferr. Met. Sci. Eng. 2024, 15, 867–876. [Google Scholar]
- Charkhchian, J.; Zarei-Hanzaki, A.; Moshiri, A.; Schwarz, T.; Lawitzki, R.; Schmitz, G.; Schell, N.; Shen, J.; Oliveira, J.; Waryoba, D.; et al. Unraveling the formation of L12 nano-precipitates within the FCC-phase in AlCoCrFeNi2. 1 eutectic high entropy alloy. Vacuum 2024, 221, 112919. [Google Scholar] [CrossRef] [Scilit]
- Hussain, M.; Najib, A.S.M.; Fadil, N.A.; Bakar, T.A.A. X-Ray Diffraction Analysis of Sigma-Phase Evolution in Equimolar AlCoCrFeNi High Entropy Alloy. Int. J. Automot. Mech. Eng. 2024, 21, 11925–11935. [Google Scholar] [CrossRef] [Scilit]
- Li, H.; Wang, J.; Zhao, J.; Li, J.; Fu, M.W. Phase transformation within dynamically refined microbands inducing ultrahigh and sustained strain hardening in high-entropy alloys containing L12 precipitates. Acta Mater. 2025, 289, 120930. [Google Scholar] [CrossRef] [Scilit]
- Rasooli, N.; Chen, W.; Daly, M. Deformation mechanisms in high entropy alloys: A minireview of short-range order effects. Nanoscale 2024, 16, 1650–1663. [Google Scholar] [CrossRef] [Scilit] [PubMed]
- Sun, Z.; Shi, C.; Liu, C.; Shi, H.; Zhou, J. The effect of short-range order on mechanical properties of high entropy alloy Al0.3CoCrFeNi. Mater. Des. 2022, 223, 111214. [Google Scholar] [CrossRef] [Scilit]
- Qiu, Z.; Yao, C.; Feng, K.; Li, Z.; Chu, P.K. Cryogenic deformation mechanism of CrMnFeCoNi high-entropy alloy fabricated by laser additive manufacturing process. Int. J. Light. Mater. Manuf. 2018, 1, 33–39. [Google Scholar] [CrossRef] [Scilit]
- Vashistha, S.; Mahanta, B.K.; Rawat, P.; Reddy, K.V.; Singh, V.K.; Singh, S.K. Deformation mechanisms and predictive modeling of AlCoCrFeNi HEA under hot working conditions. J. Alloys Compd. 2025, 1035, 181636. [Google Scholar] [CrossRef] [Scilit]
- Jeong, H.T.; Kim, W.J. Superplastic behavior of ultrafine-grained Al5Cr20Fe35Co35Ni5 high-entropy alloy. Mater. Sci. Eng. A 2025, 923, 147699. [Google Scholar] [CrossRef] [Scilit]
- Yang, Z.; Chen, F.; Shen, S.; Yang, K.; Han, D.; Li, Y.; Lu, C.; Zhang, Y.; Tang, X. The staggered dual-phase structure in AlCoCrFeNi2.1 eutectic high-entropy alloys for superior irradiation and corrosion resistance. Intermetallics 2024, 173, 108427. [Google Scholar] [CrossRef] [Scilit]
- Li, J.; Ma, X.; Lu, K.; Wang, Y.; Zhu, Y. Unusual deformation mechanisms evoked by hetero-zone interaction in a heterostructured FCC high-entropy alloy. Acta Mater. 2025, 282, 120516. [Google Scholar] [CrossRef] [Scilit]
- Wang, F.; Ding, C.; Yang, Z.; Zhang, H.; Ding, Z.; Li, H.; Xu, J.; Shan, D.; Guo, B. Microstructure evolution and mechanical properties of AlCoCrFeNi2.1 eutectic High-Entropy alloys processed by High-Pressure torsion. Materials 2024, 17, 2954. [Google Scholar] [CrossRef] [Scilit] [PubMed]
- Standard’s ASTM E8M standard; Standard Test Methods for Tension Testing of Metallic Materials. ASTM International: West Conshohocken, PA, USA, 2011.
- Lutterotti, L. Maud: A Rietveld analysis program designed for the internet and experiment integration. Acta Crystallogr. Sect. A Found. Crystallogr. 2000, 56, s54. [Google Scholar] [CrossRef] [Scilit]
- Di Gioacchino, F.; Quinta da Fonseca, J. Plastic strain mapping with sub-micron resolution using digital image correlation. Exp. Mech. 2013, 53, 743–754. [Google Scholar] [CrossRef] [Scilit]
- LaVision GmbH. DaVis; LaVision GmbH: Goettingen, Germany, 2024; Available online: https://www.lavision.de/ (accessed on 3 March 2026).
- Garcés, G.; Orozco-Caballero, A.; da Fonseca, J.Q.; Pérez, P.; Medina, J.; Stark, A.; Schell, N.; Adeva, P. Initial plasticity stages in Mg alloys containing Long-Period Stacking Ordered phases using High Resolution Digital Image Correlation (HRDIC) and in-situ synchrotron radiation. Mater. Sci. Eng. A 2020, 772, 138716. [Google Scholar] [CrossRef] [Scilit]
- Tang, Z.; Senkov, O.N.; Parish, C.M.; Zhang, C.; Zhang, F.; Santodonato, L.J.; Wang, G.; Zhao, G.; Yang, F.; Liaw, P.K. Tensile ductility of an AlCoCrFeNi multi-phase high-entropy alloy through hot isostatic pressing (HIP) and homogenization. Mater. Sci. Eng. A 2015, 647, 229–240. [Google Scholar] [CrossRef] [Scilit]
- Amar, A.; Wang, M.; Huang, R.; Zhang, L.; Lu, Y. Achieving high strength and ductile eutectic high-entropy alloy with directional lamellar via laser additive manufacturing. J. Mater. Sci. Technol. 2025, 235, 70–80. [Google Scholar] [CrossRef] [Scilit]
- Wu, Q.; He, F.; Li, J.; Kim, H.S.; Wang, Z.; Wang, J. Phase-selective recrystallization makes eutectic high-entropy alloys ultra-ductile. Nat. Commun. 2022, 13, 4697. [Google Scholar] [CrossRef] [Scilit]
- Shi, P.; Zhong, Y.; Li, Y.; Ren, W.; Zheng, T.; Shen, Z.; Yang, B.; Peng, J.; Hu, P.; Zhang, Y.; et al. Multistage work hardening assisted by multi-type twinning in ultrafine-grained heterostructural eutectic high-entropy alloys. Mater. Today 2020, 41, 62–71. [Google Scholar] [CrossRef] [Scilit]
- Wang, J.; Ke, Y.; Chen, Y.; Li, C.; Lu, T.; Liu, X.; Xu, Z.; Zhang, W.; Tang, H.; Guo, C.; et al. Microstructural mechanisms imparting high strength-ductility synergy in heterogeneous structured as-cast AlCoCrFeNi2.1 eutectic high-entropy alloy. J. Mater. Res. Technol. 2023, 27, 8119–8131. [Google Scholar] [CrossRef] [Scilit]
- Liu, L.; Wang, Z.; Wu, Q.; Jia, Y.; Xu, Q.; He, F.; Li, J.; Wang, J. A hypoeutectic high-entropy alloy with hierarchical microstructure for high-temperature application. Scr. Mater. 2023, 232, 115502. [Google Scholar] [CrossRef] [Scilit]
- Lastovich, M.; Kareem, S.A.; Bodunrin, M.; Perkins, C.; Rock, C.; Gwalani, B. Solidification Pathway, Phase Stability, High-Temperature Deformation Mechanisms of a Dual-Phase High-Entropy Alloy. High. Entropy Alloy. Mater. 2025, 3, 387–405. [Google Scholar] [CrossRef] [Scilit]
- Zou, S.; Dong, C.; Tan, X.; Liang, Z.; Bao, W.; He, B.; Lu, W. Mitigating embrittlement of sigma phase in dual-phase high-entropy alloys through heterostructure design. Int. J. Plast. 2025, 187, 104272. [Google Scholar] [CrossRef] [Scilit]
- Luo, Z.; Feng, T.; Ma, X. Achieving exceptional strength-ductility synergy in dual-phase high-entropy alloys by designing a novel hierarchical heterostructure. Mater. Sci. Eng. A 2025, 936, 148420. [Google Scholar] [CrossRef] [Scilit]
- Xiao, B.; Chen, R.; Zhang, J.; Zhang, J.; Zhou, Y.; Ju, J.; Zhao, Y.; Xu, L.; Yang, T. Additively manufactured heterogeneous precipitation-strengthened high-entropy alloys with high strength and ductility. Addit. Manuf. 2023, 77, 103795. [Google Scholar] [CrossRef] [Scilit]
- Cui, D.; Chai, Z.; Zhou, K.; Li, M.; Chen, D.; Huang, J.; He, X.; Wang, Z.; He, F. Directed energy deposited Fe36Ni35Al17Cr10Mo2 eutectic high entropy alloy: Hierarchical microstructure and tensile properties. Mater. Sci. Eng. A 2025, 921, 147594. [Google Scholar] [CrossRef] [Scilit]
- Emdadi, A.; Stryzhyboroda, O.; Hecht, U.; Bambach, M. Complex dynamic restoration processes leading to a high degree of deformability in a dual-phase Al0.5CoCrFeNi high entropy alloy. J. Alloys Compd. 2022, 918, 165583. [Google Scholar] [CrossRef] [Scilit]
- Wu, H.; Xie, J.; Yang, H.; Shu, D.; Hou, G.; Li, J.; Zhou, Y.; Sun, X. A cost-effective eutectic high entropy alloy with an excellent strength-ductility combination designed by VEC criterion. J. Mater. Res. Technol. 2022, 19, 1759–1765. [Google Scholar] [CrossRef] [Scilit]
- Li, Q.; Chen, X.; Jayalakshmi, S.; Singh, R.A. Investigation of the effect of the thermo-mechanical processing of additively manufactured CoCrFeNiAl0.4 High Entropy Alloy. Adv. Eng. Mater. 2022, 24, 2101628. [Google Scholar] [CrossRef] [Scilit]
- Liu, Z.; Xiong, Z.; Chen, K.; Cheng, X. Large-size high-strength and high-ductility AlCoCrFeNi2.1 eutectic high-entropy alloy produced by hot-rolling and subsequent aging. Mater. Letters 2022, 35, 131933. [Google Scholar] [CrossRef] [Scilit]
- He, J.Y.; Wang, H.; Wu, Y.; Liu, X.J.; Mao, H.H.; Nieh, T.G.; Lu, Z.P. Precipitation behavior and its effects on tensile properties of FeCoNiCr high-entropy alloys. Intermetallics 2016, 79, 41–52. [Google Scholar] [CrossRef] [Scilit]
- He, F.; Yang, Z.; Liu, S.; Chen, D.; Lin, W.; Yang, T.; Wei, D.; Wang, Z.; Wang, J.; Kai, J.J. Strain partitioning enables excellent tensile ductility in precipitated heterogeneous high-entropy alloys with gigapascal yield strength. Int. J. Plast. 2021, 144, 103022. [Google Scholar] [CrossRef] [Scilit]
- Li, X.; Li, Z.; Wu, Z.; Zhao, S.; Zhang, W.; Bei, H.; Gao, Y. Strengthening in Al-, Mo- or Ti-doped CoCrFeNi high entropy alloys. A parallel comparison. J. Mater. Sci. Technol. 2021, 94, 264–274. [Google Scholar] [CrossRef] [Scilit]
- Hou, J.; Zhang, M.; Ma, S.; Liaw, P.K.; Zhan, Y.; Qiao, J. Strengthening in Al0.25CoCrFeNi high-entropy alloys by cold rolling. Mater. Sci. Eng. A 2017, 707, 593–601. [Google Scholar]
- Wani, I.S.; Bhattacharjee, T.; Sheikh, S.; Bhattacharjee, P.P.; Guo, S.; Tsuji, N. Tailoring nanostructures and mechanical properties of AlCoCrFeNi2.1 eutectic high entropy alloy using thermo-mechanical processing. Mater. Sci. Eng. A 2016, 675, 99–109. [Google Scholar] [CrossRef] [Scilit]
- Klimova, M.; Stepanov, N.; Shaysultanov, D.; Chernichenko, R.; Yurchenko, N.; Sanin, V.; Zherebtsov, S. Microstructure and mechanical properties evolution of the Al, C-containing CoCrFeNiMn-Type High-Entropy Alloy during Cold Rolling. Materials 2018, 11, 53. [Google Scholar] [CrossRef] [Scilit]
- Louzguine-Luzgin, D.V.; Edalati, K. Fe–Mn–Co–Al–C duplex high-entropy alloys with high hardness, high strength and good ductility processed via high-pressure torsion. J. Alloys Compd. 2025, 1045, 184597. [Google Scholar] [CrossRef] [Scilit]
- Zhu, J.M.; Fu, H.M.; Zhang, H.F.; Wang, A.M.; Li, H.; Hu, Z.Q. Microstructure and compressive properties of multiprincipal component AlCoCrFeNiCx alloys. J. Alloys Compd. 2011, 509, 3476–3480. [Google Scholar]
- Zhou, X.; Chen, J.; Ding, R.; Wu, H.; Lu, S.; He, J.; Pan, H. Effect of Mn on microstructure and tensile properties of as-cast Al0.5CoFeNiC0.1 high-entropy alloy. Mater. Sci. Eng. A 2023, 873, 144951. [Google Scholar]
- Lv, C.; Ma, M.; Yang, F.; Huang, C.; Zhao, C.; Bai, S.; Zhang, S.; Gao, W.; Ma, Y. The influence of C addition on microstructure and compressive properties of Al-Cr-Fe-Ni high entropy alloys. J. Alloys Compd. 2025, 1021, 79564. [Google Scholar] [CrossRef] [Scilit]
- Ghanbariha, M.; Ketabchi, M.; Farvizi, M. Investigation of alumina reinforcement effects on microstructure, hardness, and tribological behavior of AlCoCrFeNi high entropy alloy. Intermetallics 2025, 18, 108915. [Google Scholar] [CrossRef] [Scilit]
- Rao, K.R.; Sinha, S.K. Strengthening of AlCoCrFeNi based high entropy alloy with nano-Y2O3 dispersion. Mater. Sci. Eng. B 2022, 281, 115720. [Google Scholar]
Figure 1.
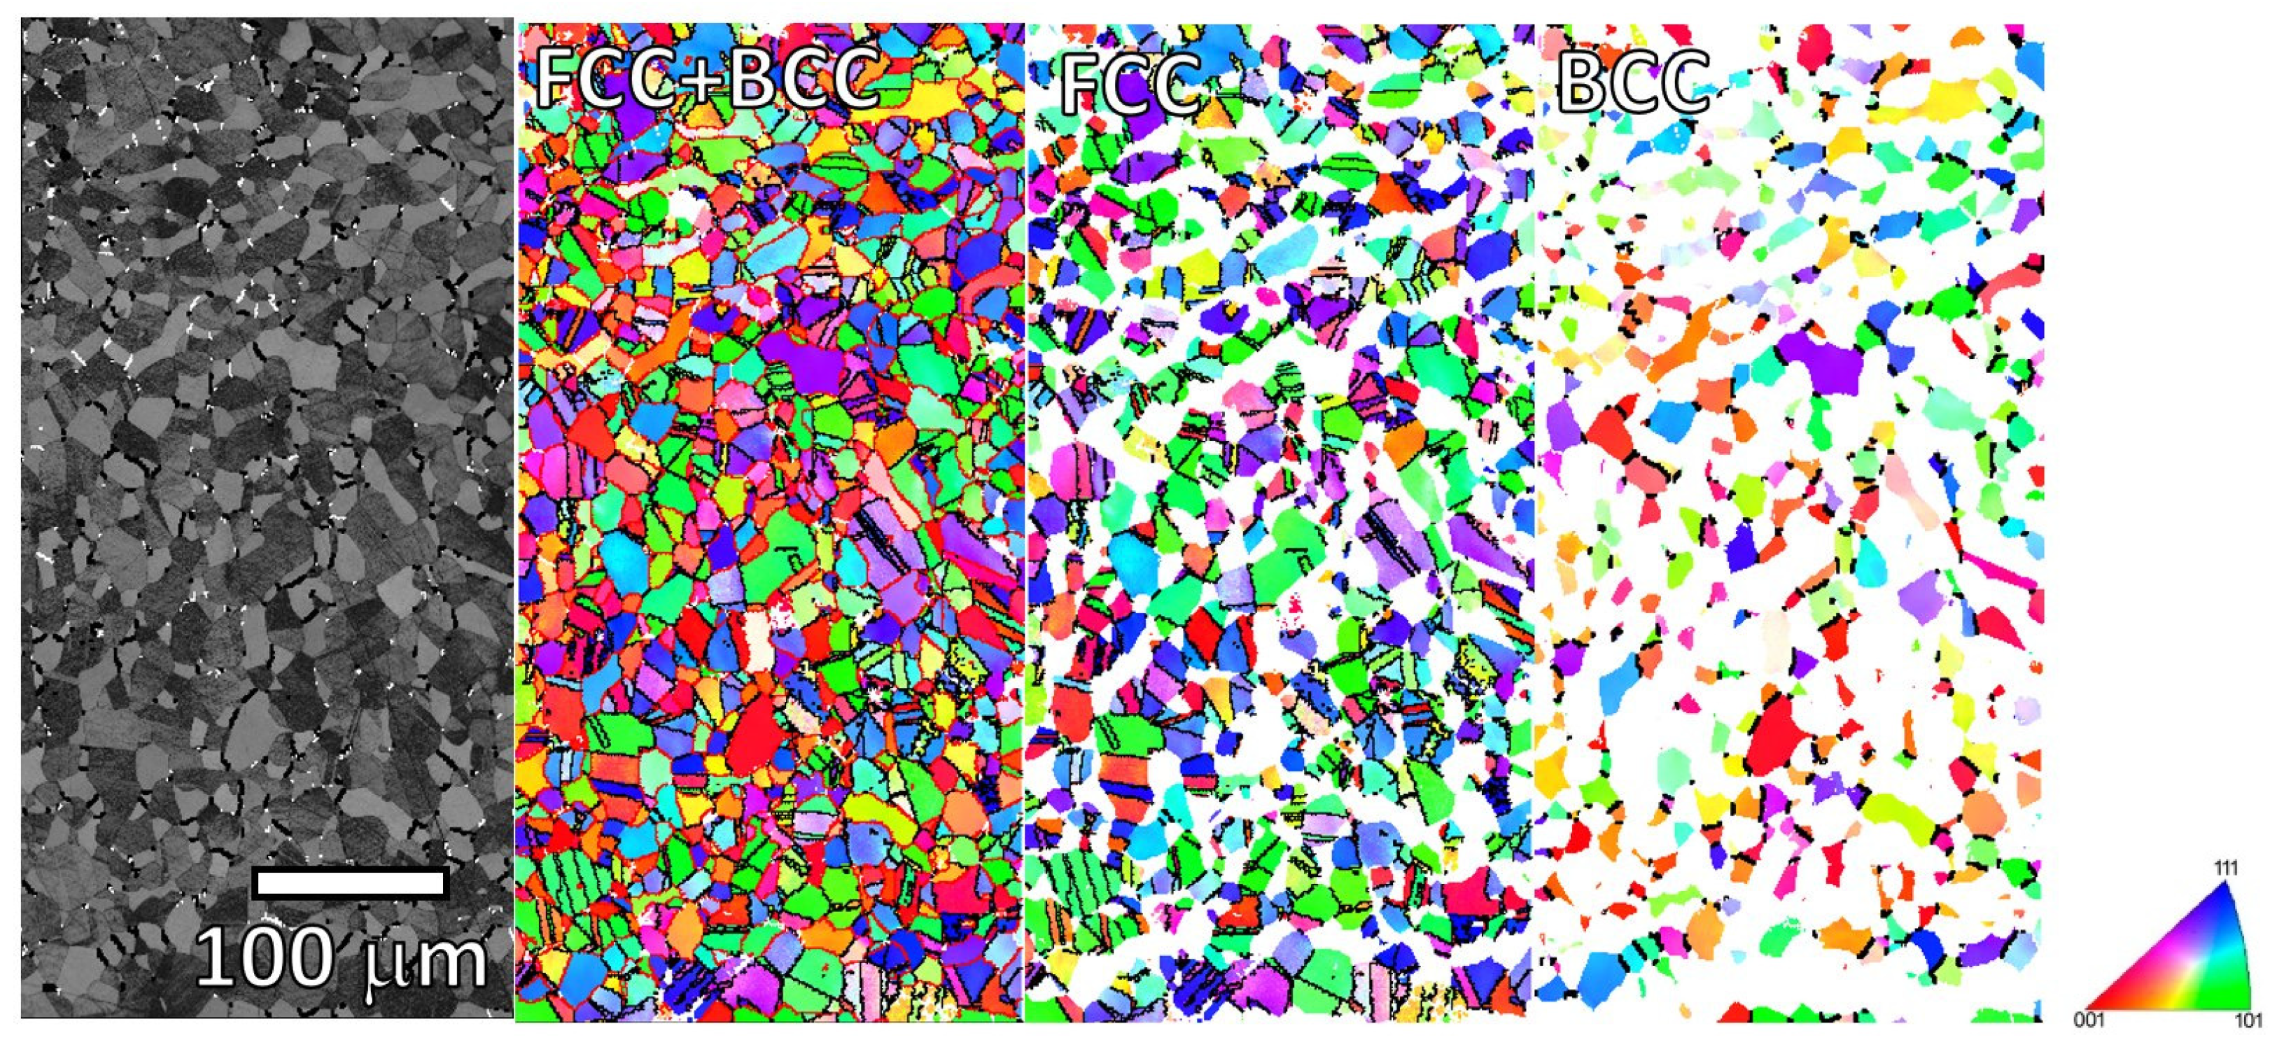
Microstructure and orientation image map of the forged alloy in the plane defined by the forging and the radial directions. The figure includes the OIMs corresponding to both the FCC and BCC phases, presented individually. The step size during map acquisition is 0.57 μm.
Figure 2.
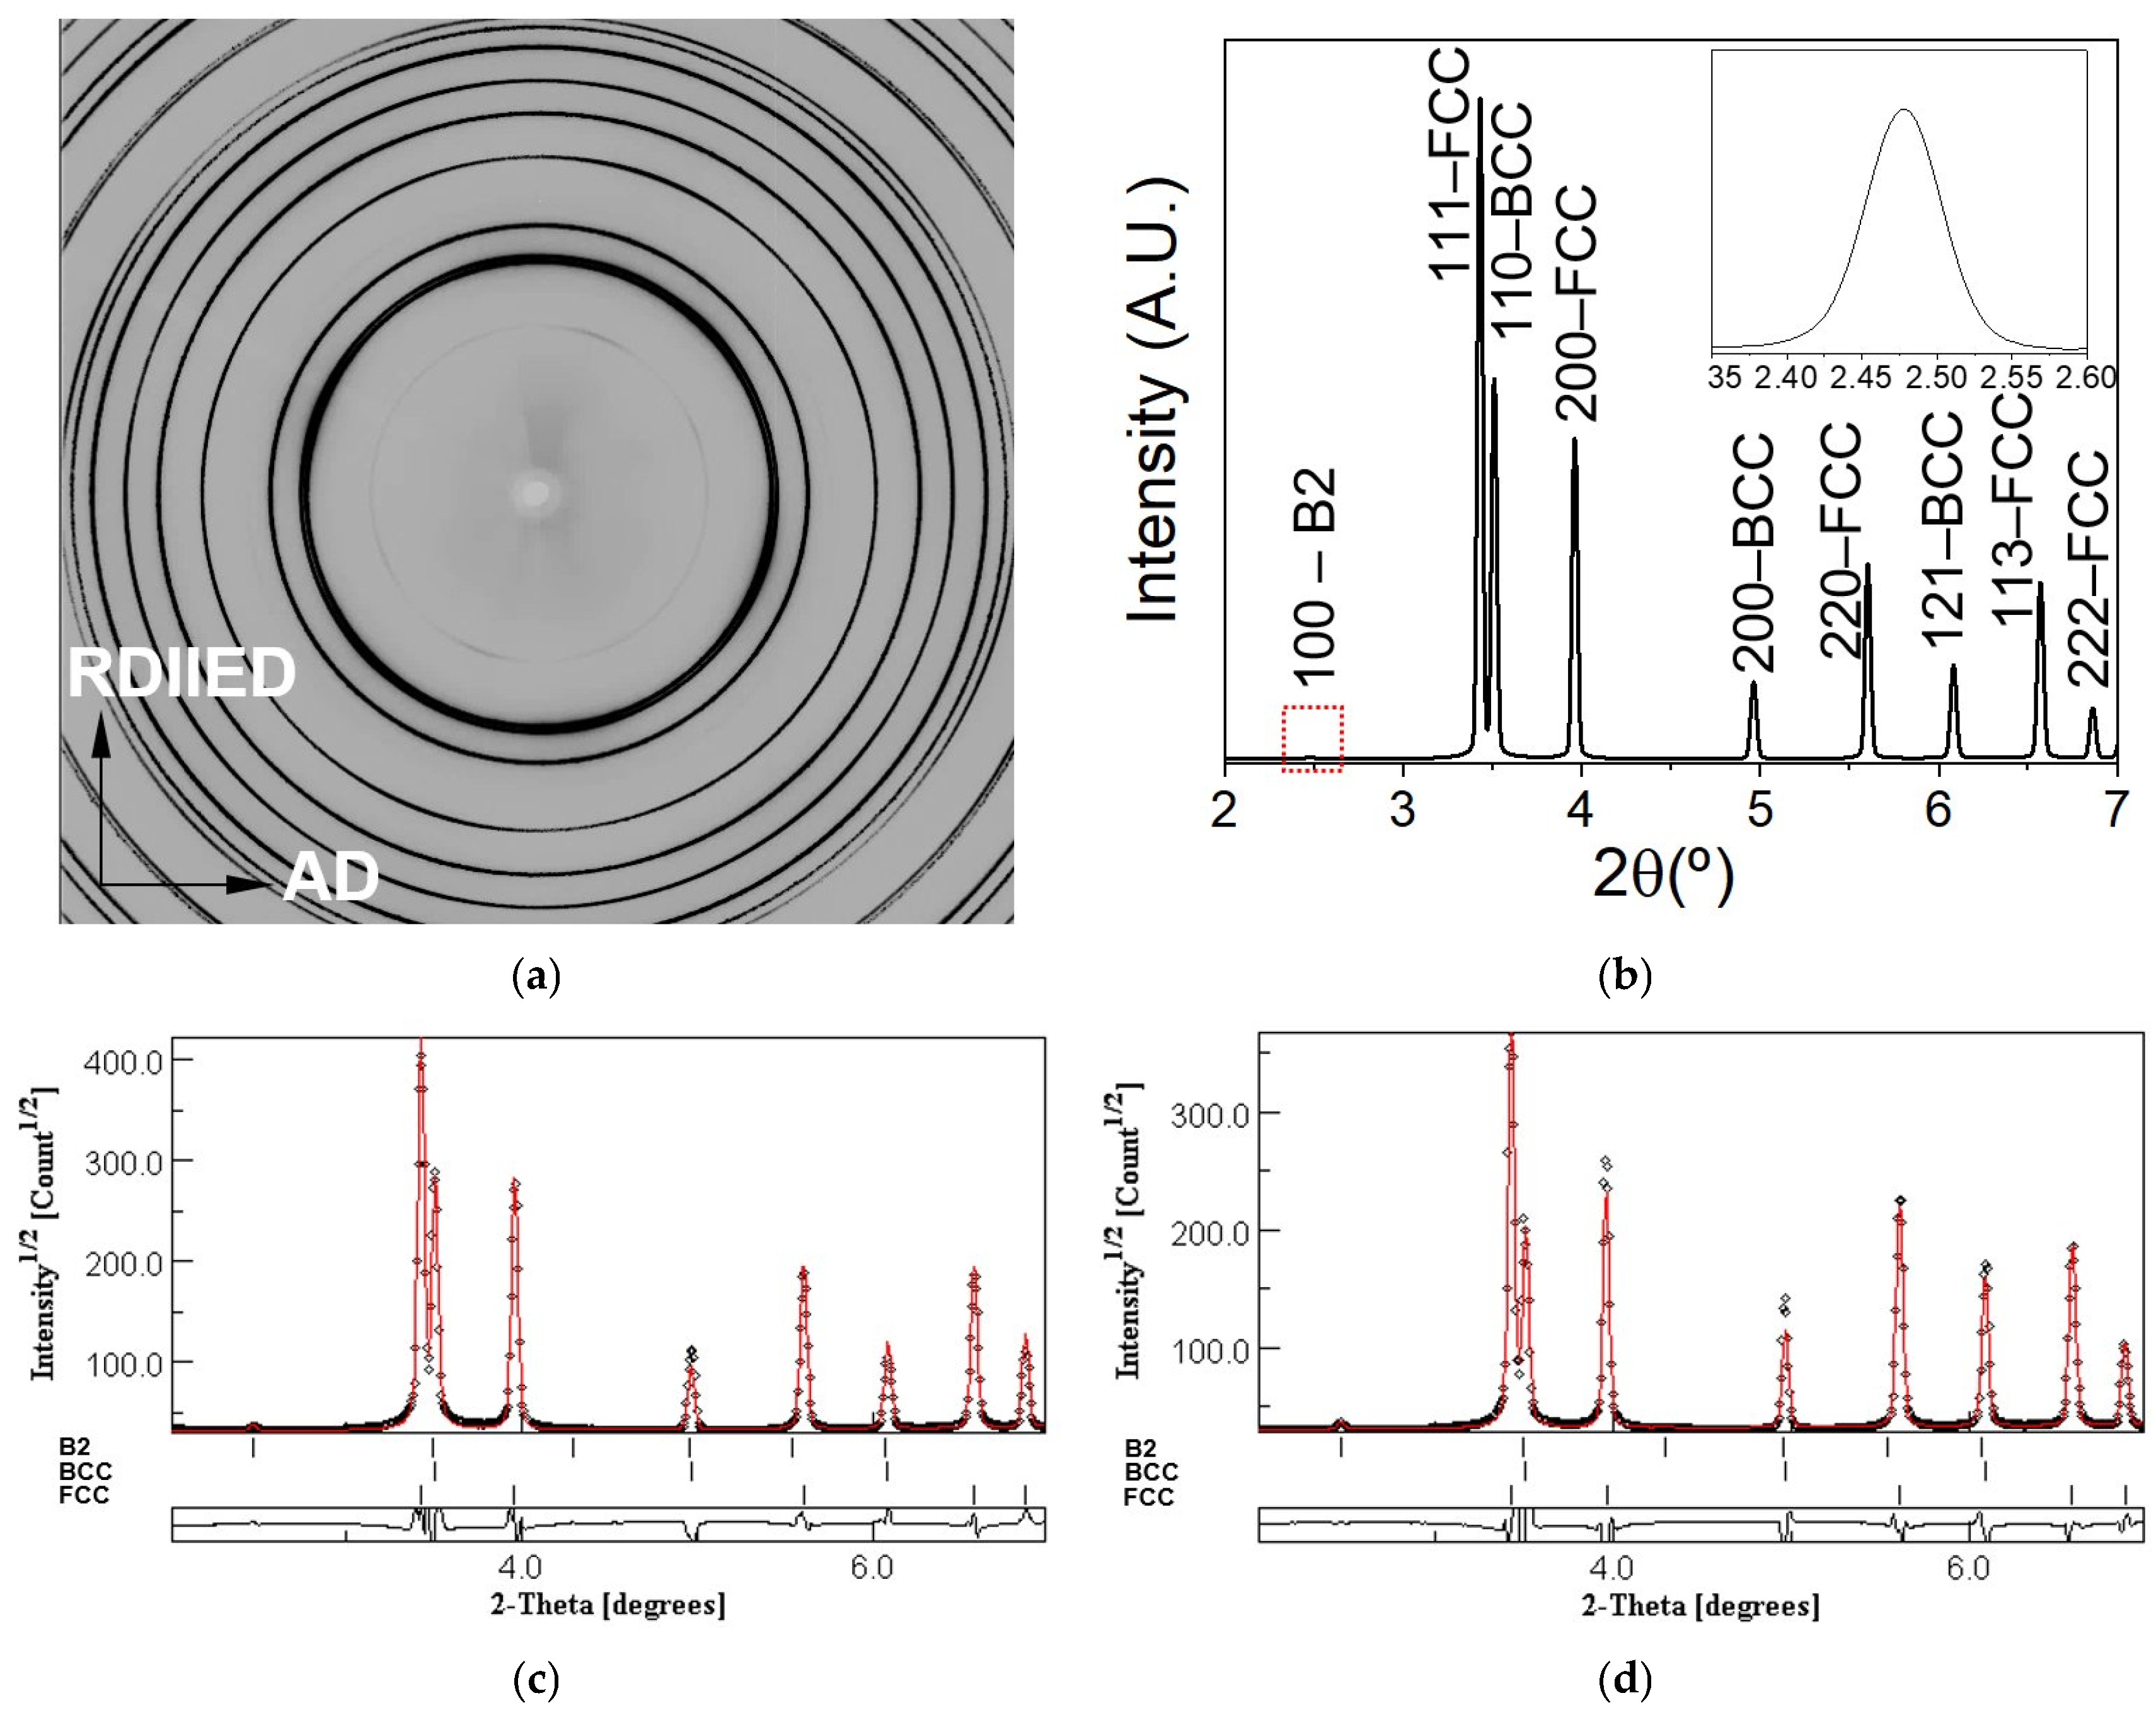
(a) Synchrotron radiation diffraction patterns recorded on the 2D flat-panel detector before the compressive test. (b) 2θ diffraction pattern in the axial direction before the compression test. The red dotted square marks B2 peak enlarged in the inset. Rietveld fitting of the diffraction patterns as a function of 2θ before the compression test in the (c) axial and (d) radial directions. Diamonds correspond to the experimental data while the red line corresponds to the fitted curve.
Figure 5.
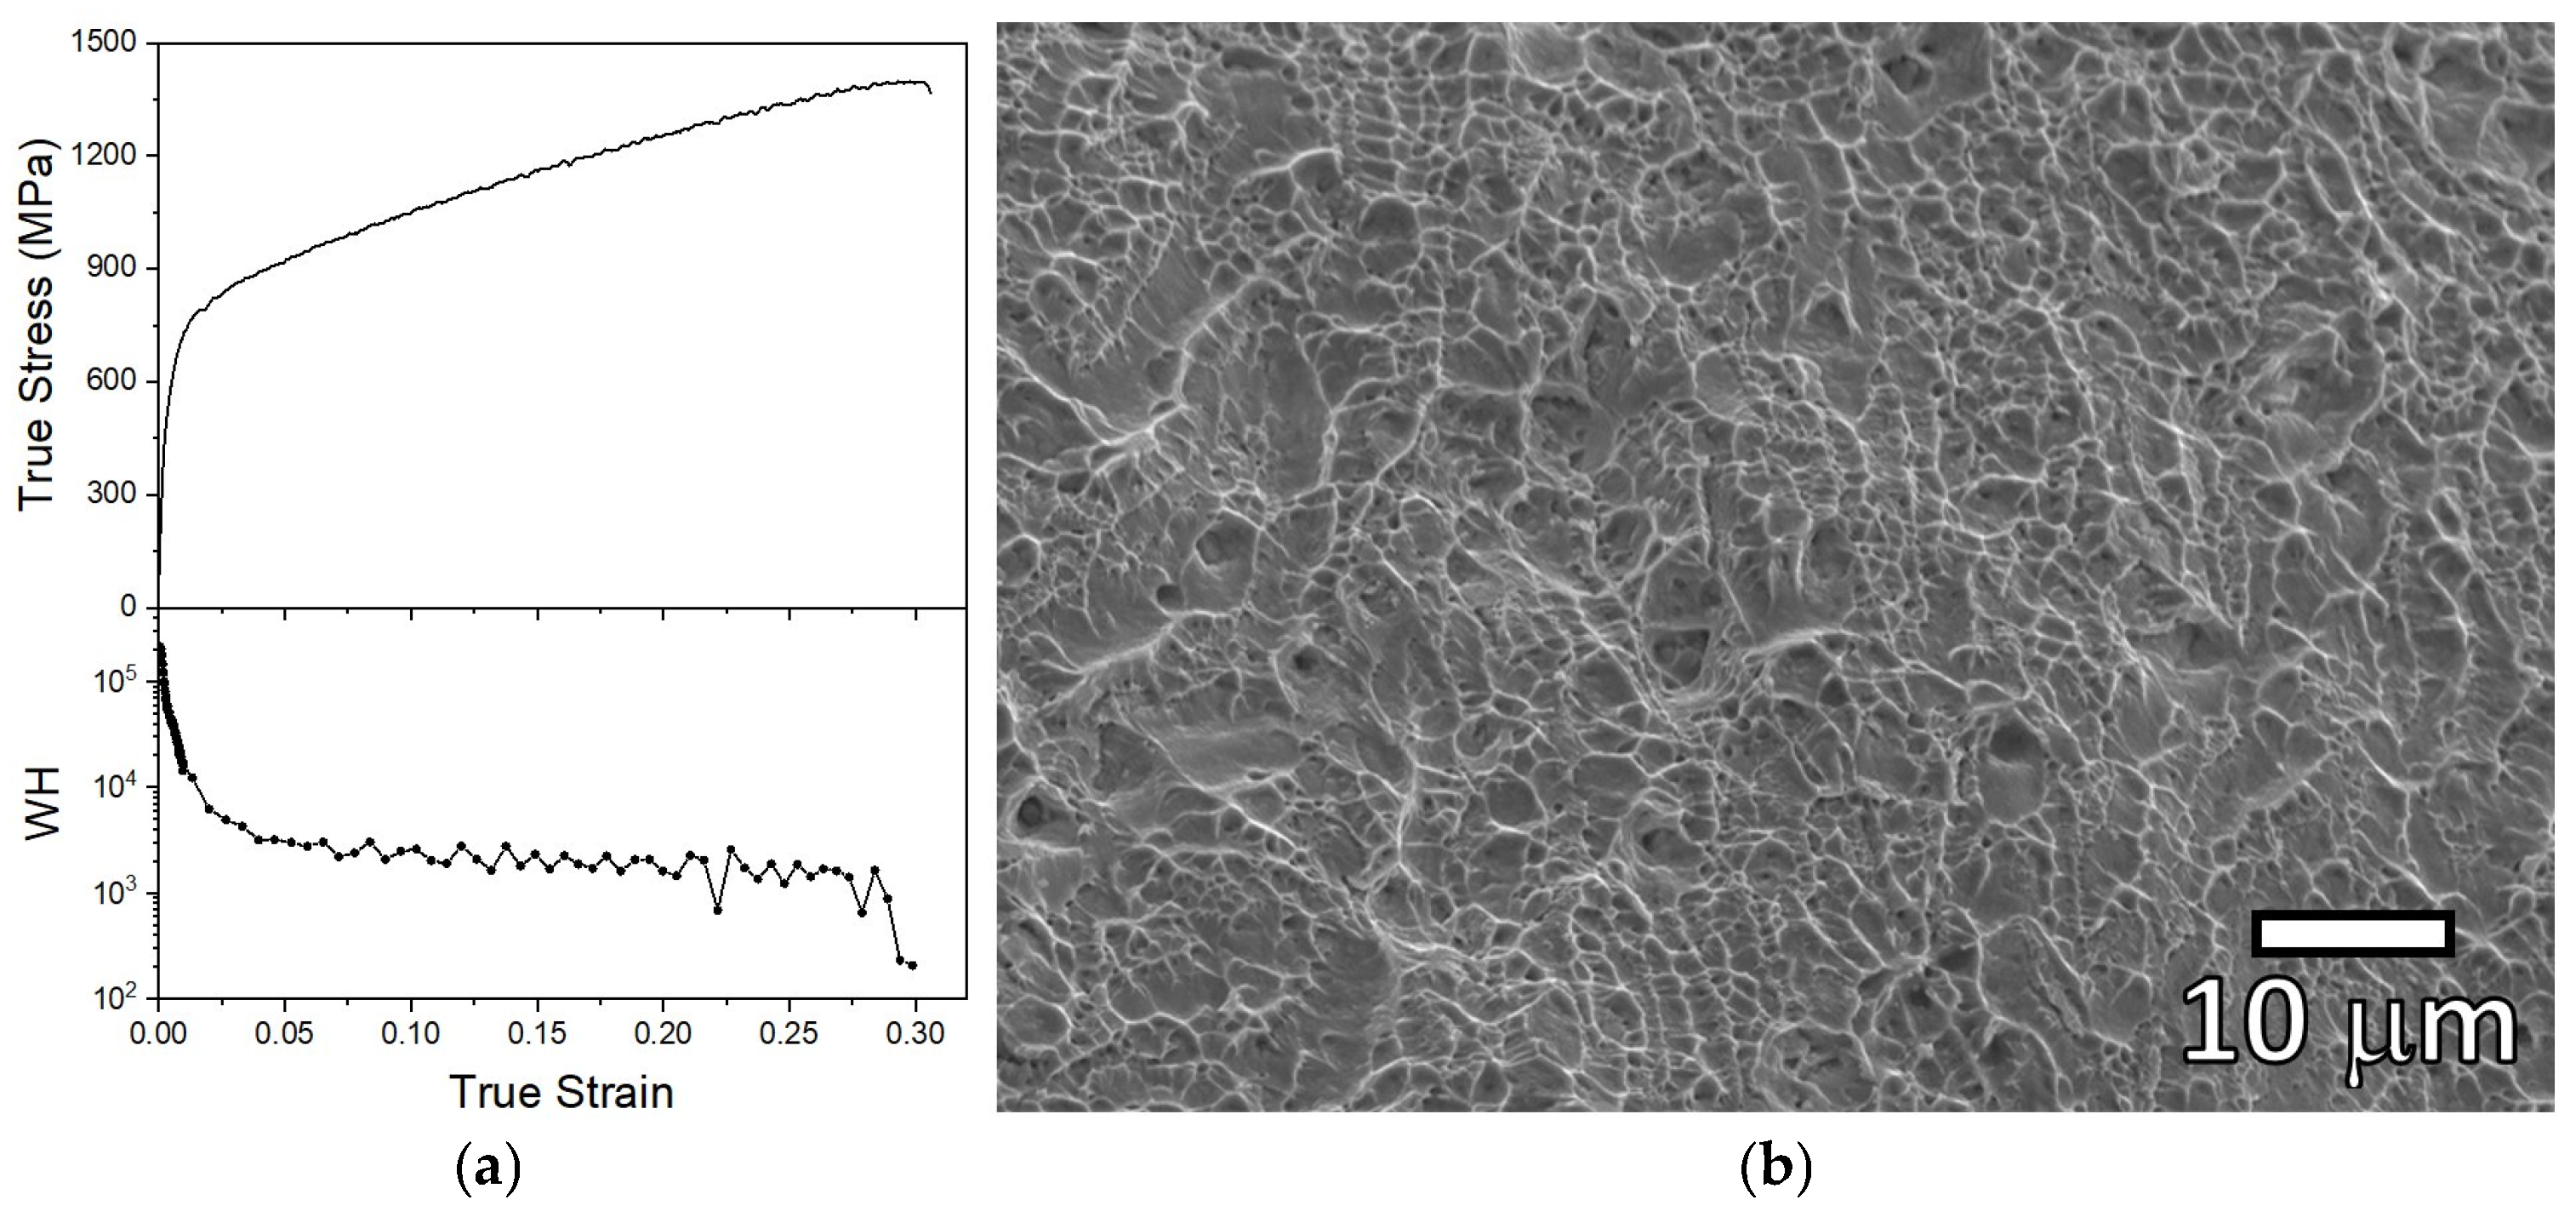
(a) True stress–true strain curve and corresponding work-hardening rate as a function of true strain for the forged alloy tested in tension at room temperature. (b) Fracture surface observed after tensile failure.
Figure 6.
Orientation image map and kernel average misorientation of FCC and BCC phases in the tensile sample after fracture in the head (no plastic deformation), test and fracture zones. Misorientation differences in FCC and BCC grains after deformation in the head (no plastic deformation), test and fracture zones. The step size during map acquisition is 0.5 μm in the head zone and 0.09 μm in the test and fracture zones.
Figure 7.
Compressive macroscopic stress–strain curve, evolution of internal strains as a function of the applied stress for different diffraction peaks of the FCC, BCC and B2 phases, and evolution of their integrated intensity as a function of the applied stress.
Figure 8.
Bright-field TEM image showing the interphase boundary between the FCC and BCC after 2% compressive strain. The SAED1 pattern in each phase is also presented (zone axes: BFCC=[110] and BBCC=[111]).
Figure 9.
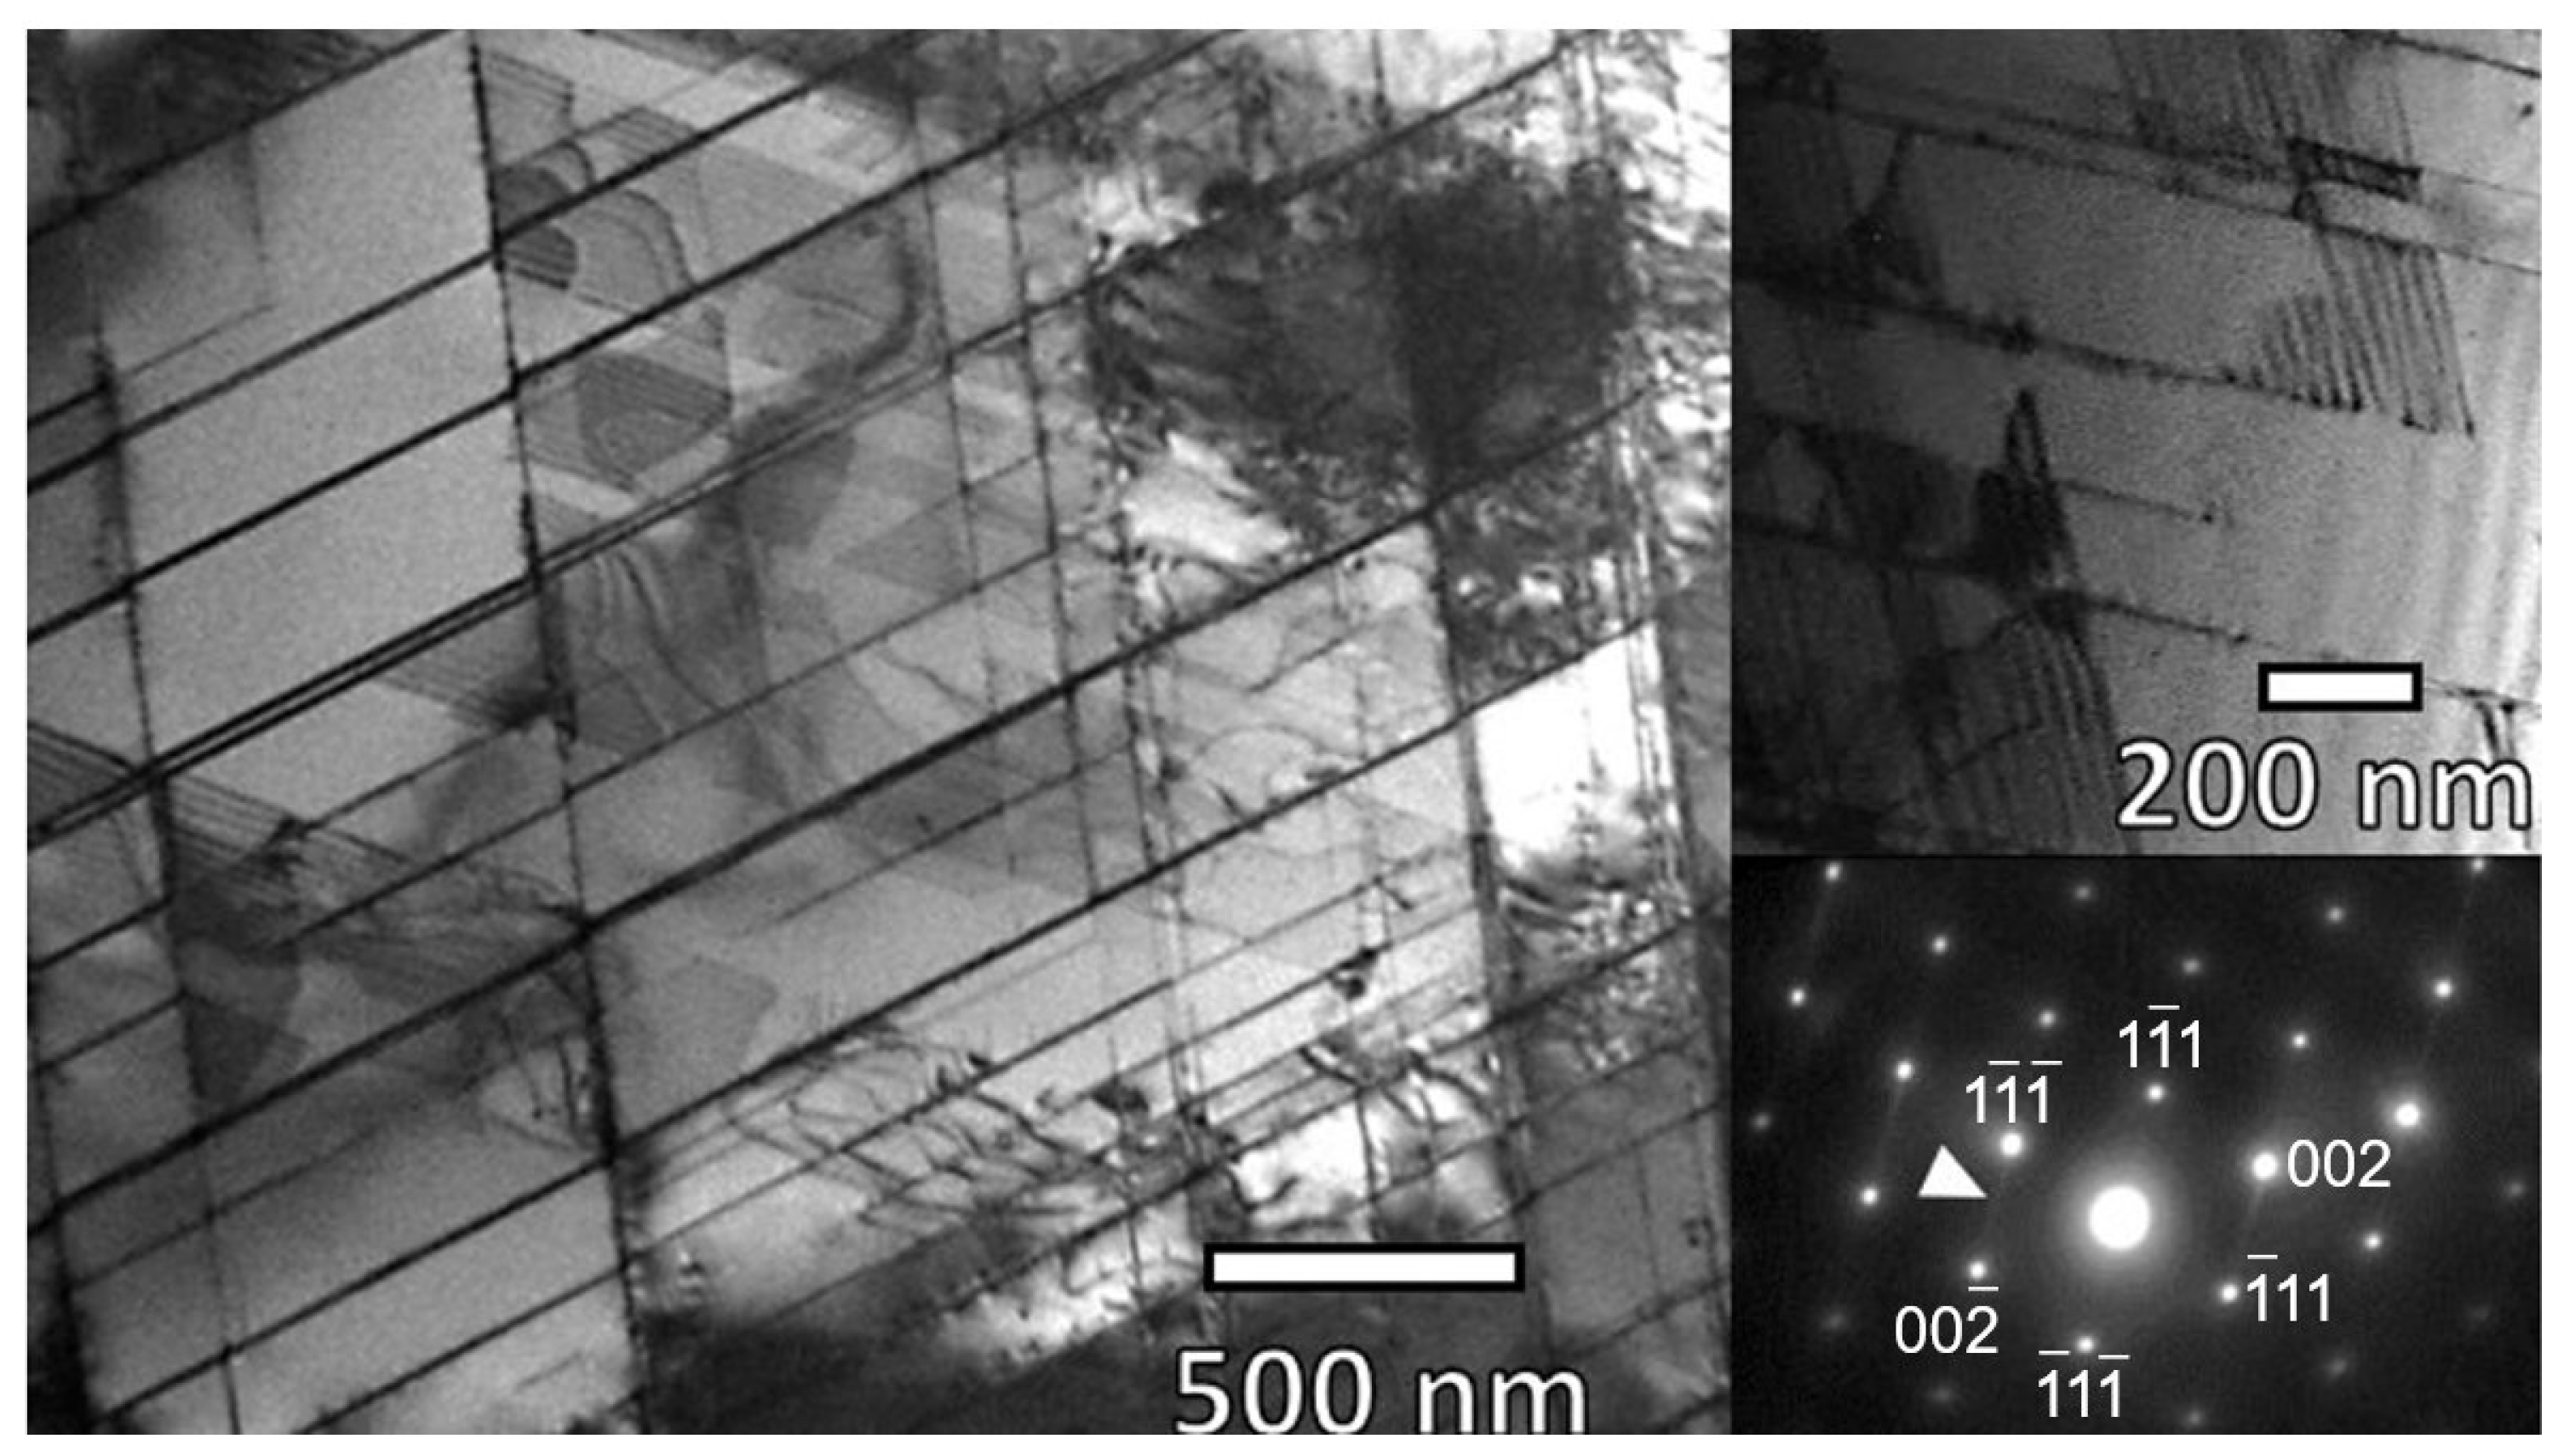
Bright-field TEM image showing the FCC after 2% compressive strain. Detail of the dislocations and stacking faults with the SAED pattern at zone axis B=[110]. Diffuse streaks produced by stacking faults are marked with a white arrow.
Figure 10.
(a) Bright-field TEM image of the BCCthephase after 2% compressive strain. (b) Detail of the interaction between dislocations and precipitates.
Figure 11.
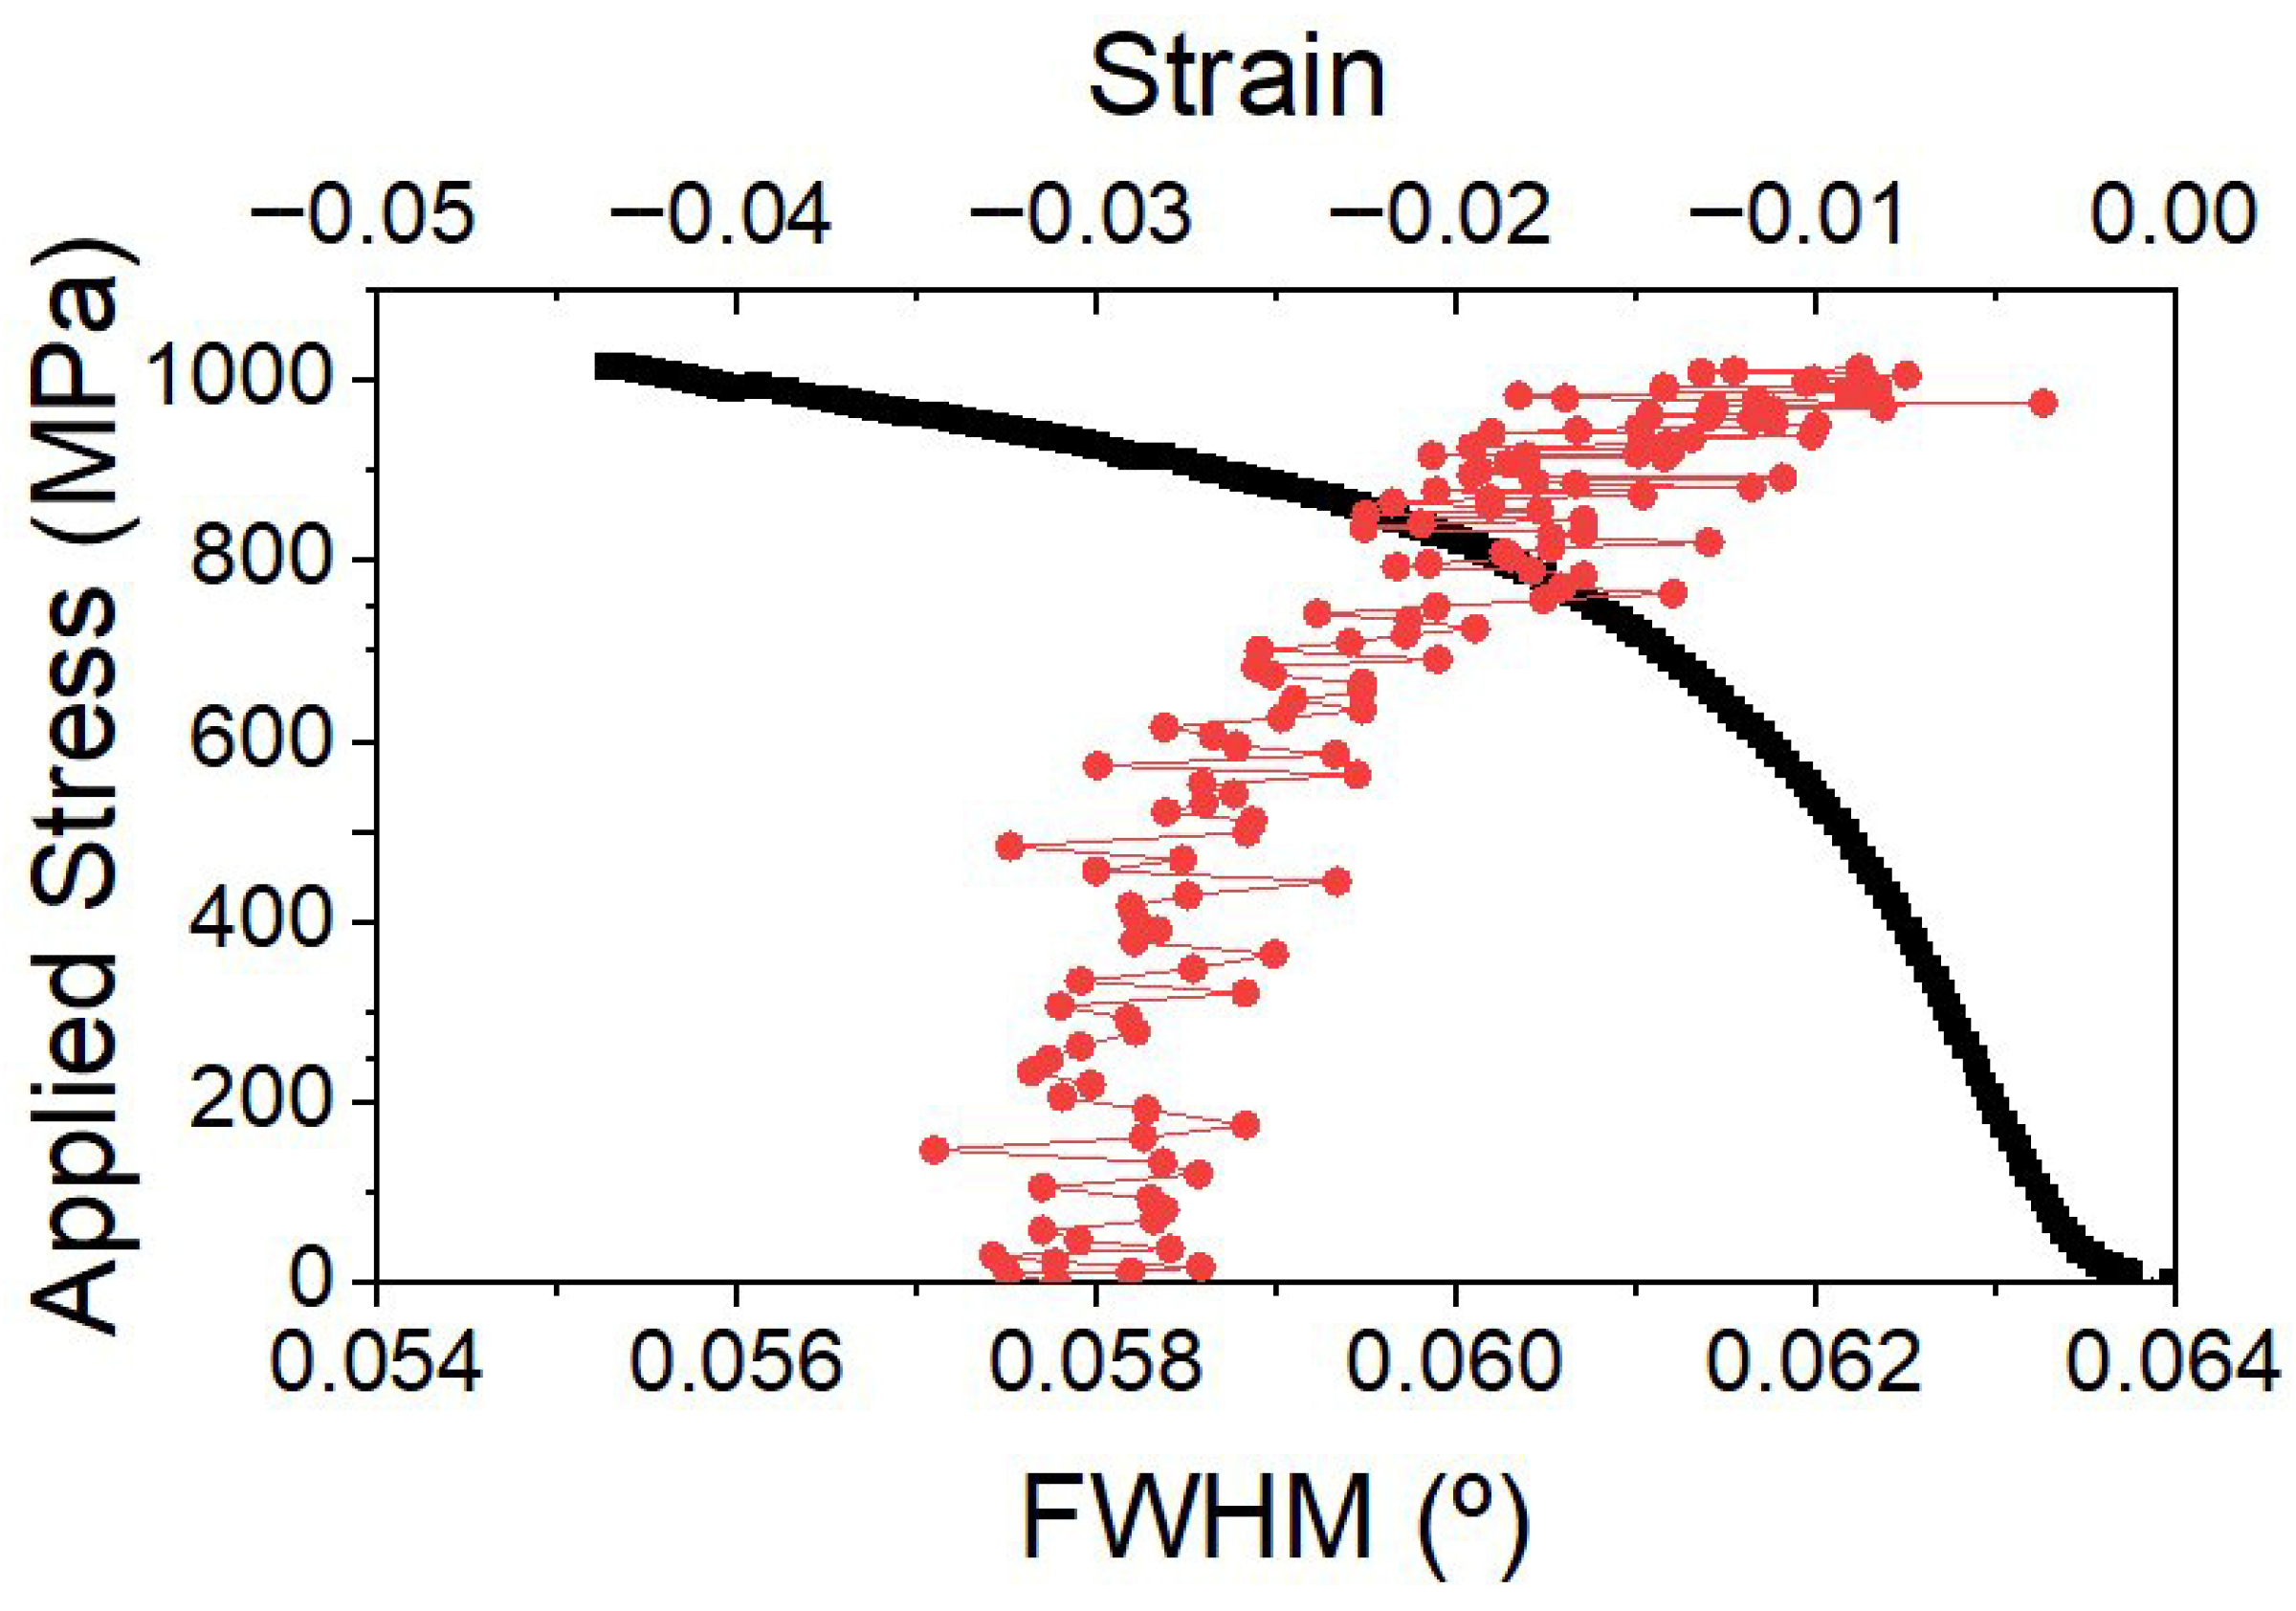
Evolution of the FWHM of the {001}-B2 diffraction peak as a function of strain. The compressive stress–strain curve is also plotted for comparison.
Figure 12.
Effective shear strain (γeff) map after 2% and 4% of macroscopic compressive strain (and the difference between both compressive strains), together with the corresponding orientation image maps (IOM) of the FCC and BCC phases, individually. It is interesting to point out that the X-axis (horizontal) and Y-axis (vertical) are conventionally aligned.
Figure 13.
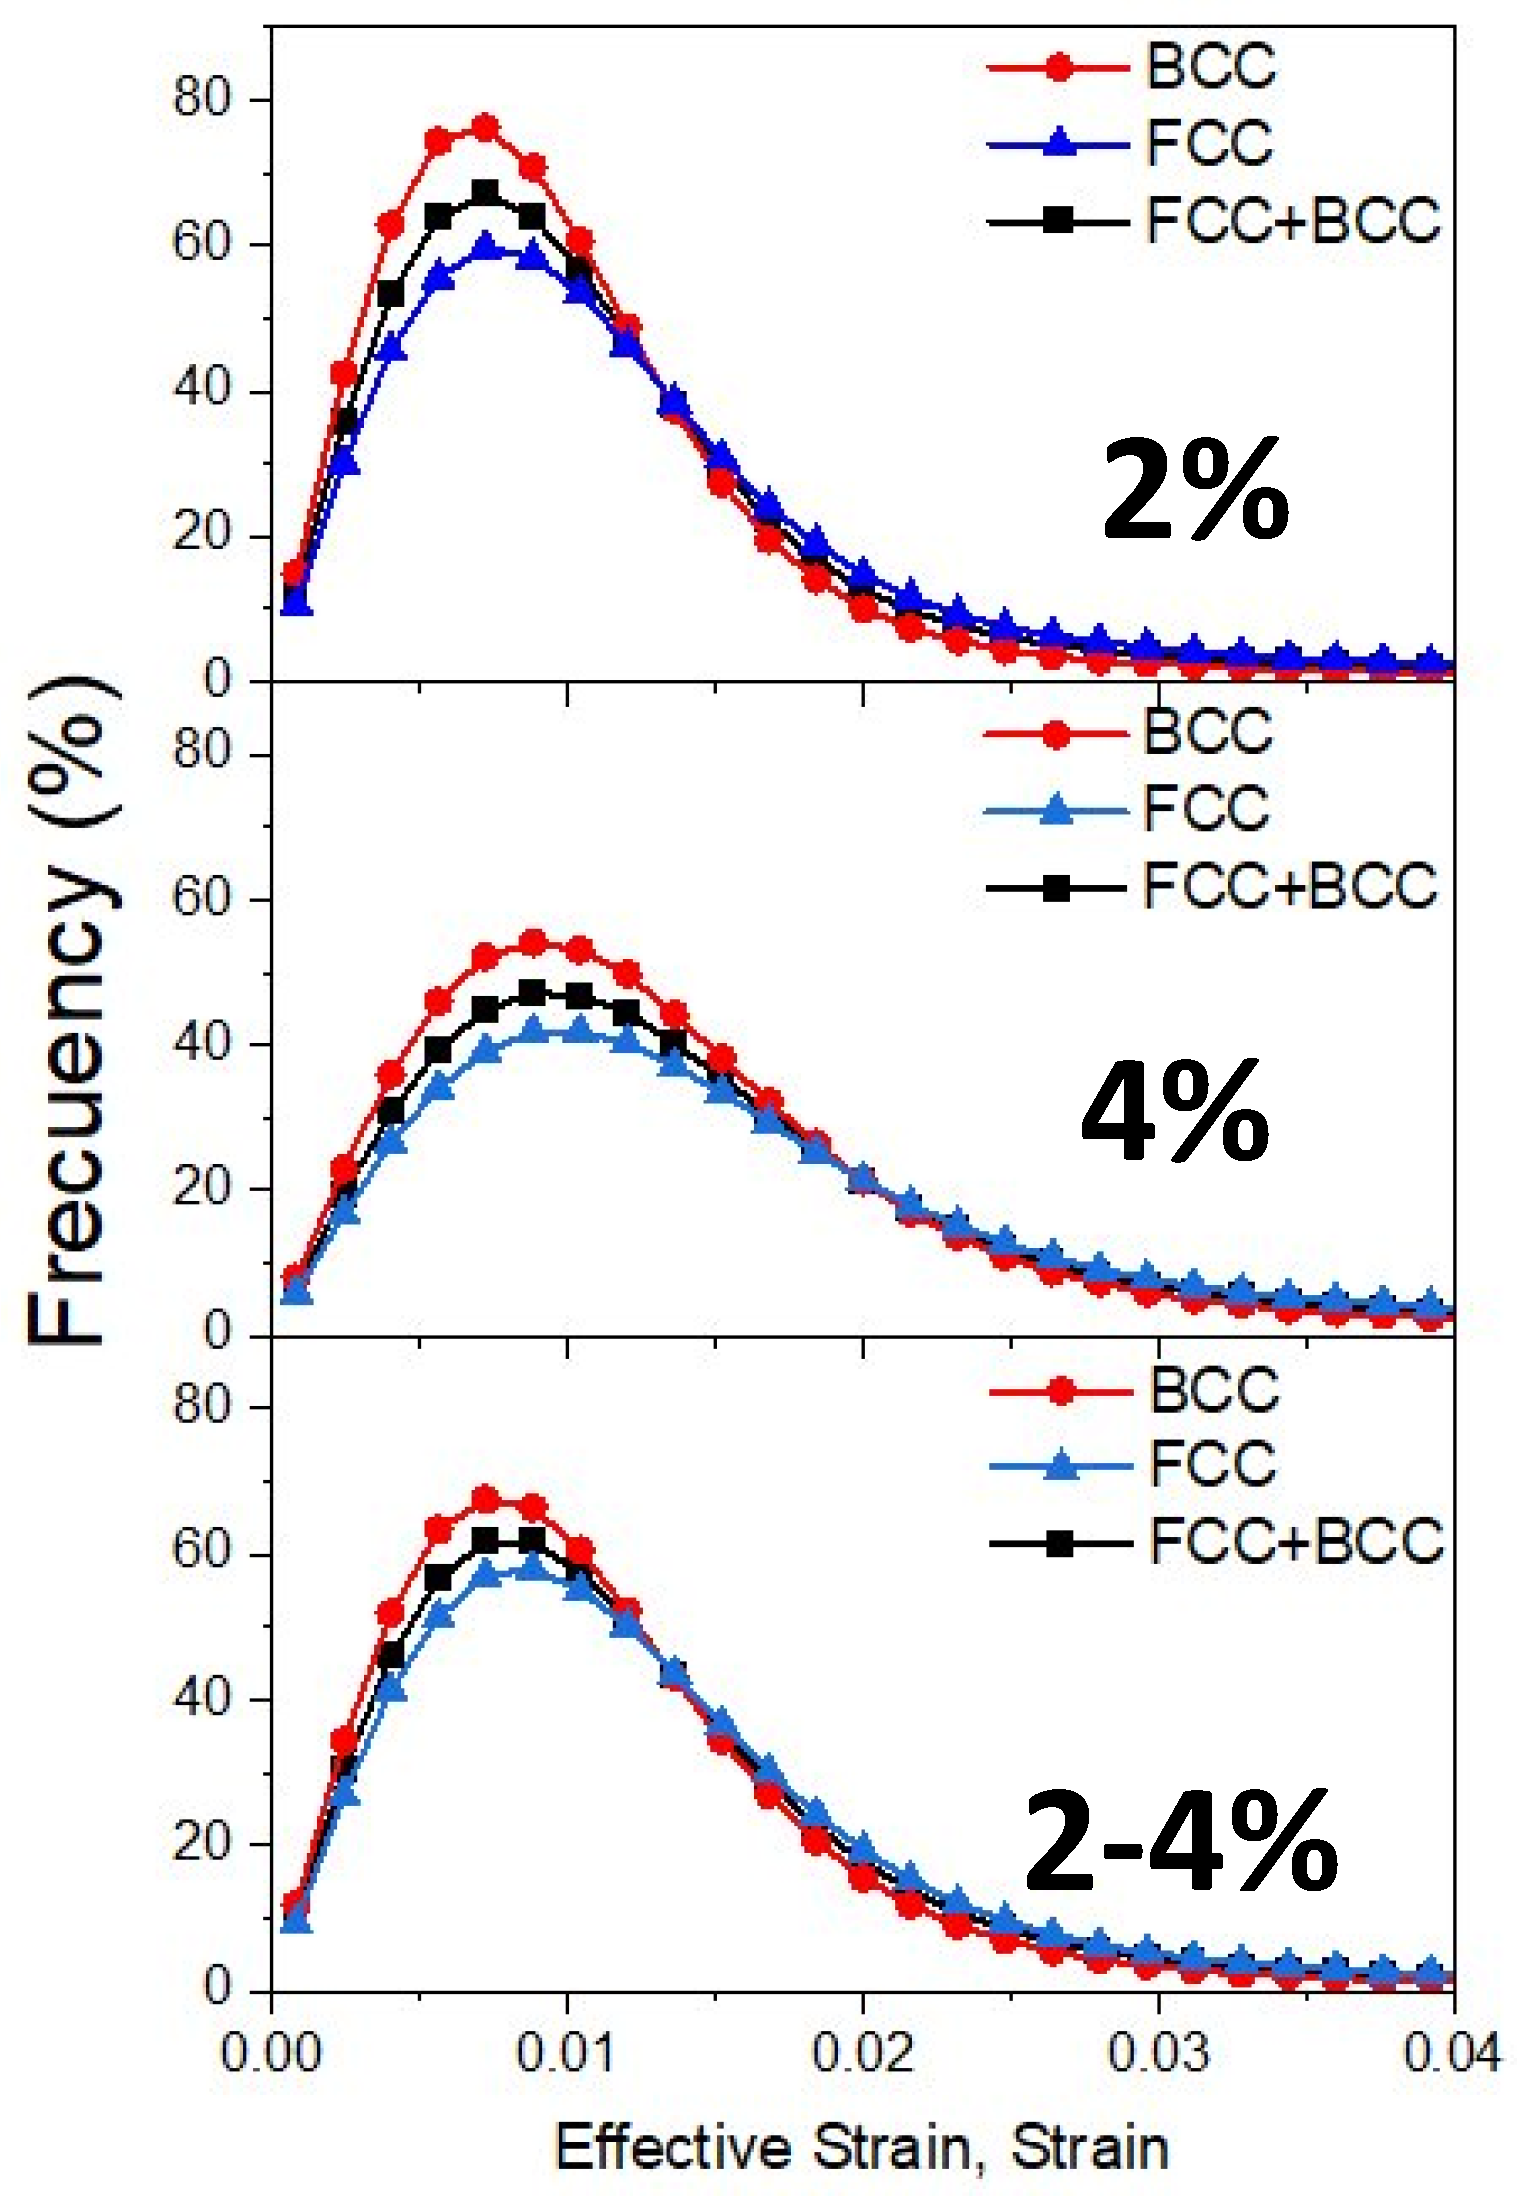
The strain distribution for FCC, BCC and FCC+BCC grains at compressive strains of 2% and 4% and the difference between both compressive strains.
Figure 14.
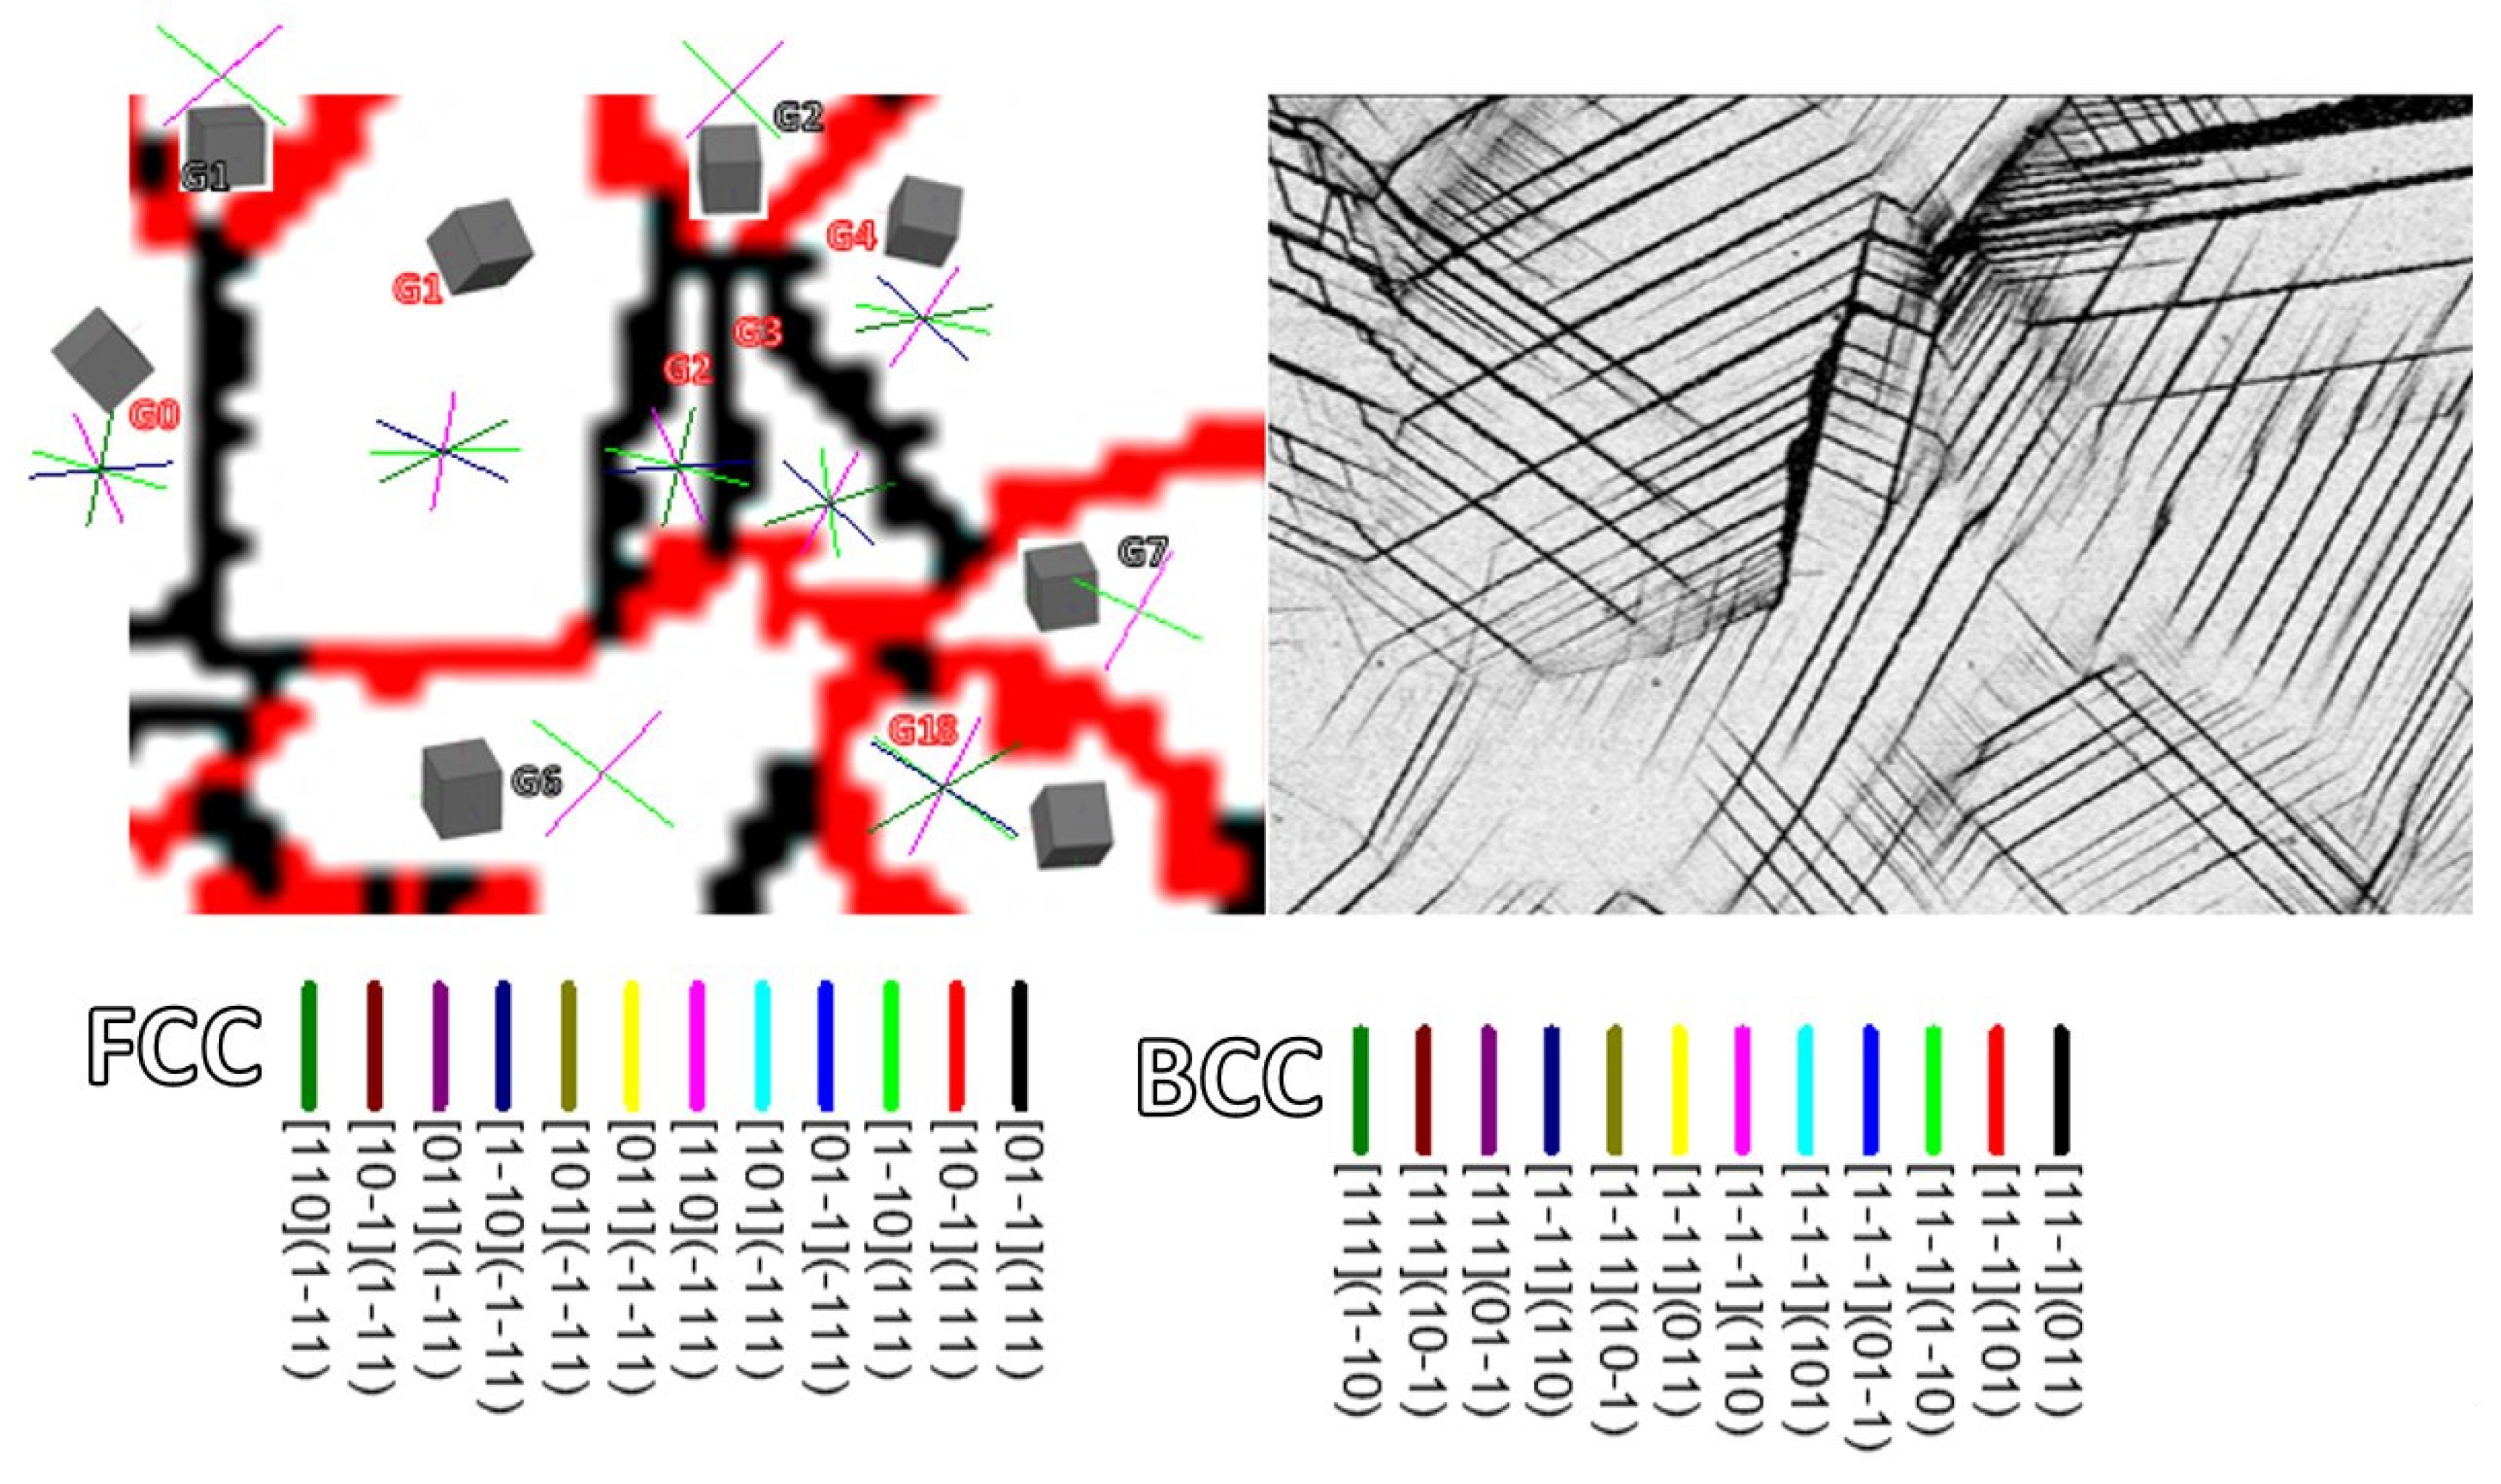
Effective shear strain (γeff) map of a detailed zone with different deformation mechanisms in the sample at 4% strain. Traces of the possible deformation systems for both FCC and BCC structures, calculated for specific grain orientations, are plotted to facilitate the identification of the active mechanisms. Grains labeled in red are FCC, while those grains labeled in black correspond to the BCC phase.
Figure 15.
Recrystallization grain structure of (a) FCC and (b) BCC phases. The blue color corresponds to recrystallized grains, the yellow color corresponds to a deformed substructure consisting of recovered grains and the red color corresponds to grains retaining deformation generated during forging. The step size during map acquisition is 0.5 μm.
Table 1.
Lattice parameters and volume fractions of the FCC, BCC and B2 phases in the forged alloy obtained using EBSD analysis and Rietveld fitting.
| Phase | Volume Fraction (%) EBSD | Volume Fraction (%) MAUD | Lattice Parameter, a (Å) |
|---|
| FCC | 74 | 74 | 3.59 |
| BCC | 26 | 24 | 2.86 |
| B2 | - | 2 | 2.87 |
Table 2.
Young modulus calculated from
Figure 7 of the studied diffraction peaks from FCC, BCC and B2 phases.
| FCC | E (GPa) | BCC | E (GPa) | B2 | E (GPa) |
|---|
| {111} | 289 | {110} | 201 | {100} | 129 |
| {200} | 155 | {200} | 134 | | |
| {220} | 231 | {121} | 280 | | |
| {311} | 293 | | | | |
Table 3.
Comparison among the tensile properties of the present Al5Co35Cr30Fe20Ni5 HEA with other AlCoCrFeNi/AlCoFeNi HEAs. Vacuum induction melting (VIM), laser powder bed fusion (LPBF), as-cast (AC), cold-rolled (CD), annealed (AN), vacuum arc melting (VAM), arc melting (AM), powder plasma arc additive manufacturing (PPA-AD), hot-rolled (HR), aging (AG).
| Reference | Processing | Elongation (%) | UTS (MPa) | YS (MPa) | Alloy |
|---|
| 20 | VIM | 25.0 | 983 | 536 | AlCoCrFeNi2.1 |
| 20 | LPBF | 10.9 | 1518 | 1235 | AlCoCrFeNi2.1 |
| 40 | AC | 16.2 | 1050 | 520 | Fe20Co20Ni41Al19 |
| 40 | AC+CR+AN | 24.2 | 1520 | 1220 | Fe20Co20Ni41Al19 |
| 39 | VAM | 14 | 1390 | | Ni30Co30Cr10Fe10Al18W2 |
| 39 | VAM+CR+AN | 17 | 1460 | | Ni30Co30Cr10Fe10Al18W2 |
| 39 | VAM+CR+AN | 30 | 1850 | | Ni30Co30Cr10Fe10Al18W2 |
| 49 | VIM | 17 | 1187 | 550 | AlCrFe1.5Ni2.6 |
| 50 | PPA-AD | 35 | 375 | 200 | Al0.4CoCrFeNi |
| 50 | PPA-AD+CR | 30 | 650 | 380 | Al0.4CoCrFeNi |
| 51 | VIM | 14.6 | 1072 | 545 | AlCoCrFeNi2.1 |
| 51 | VIM+HR | 18.5 | 1300 | 753 | AlCoCrFeNi2.1 |
| 51 | VIM+HR+Ag | 15.1 | 1519 | 951 | AlCoCrFeNi2.1 |
| 52 | AC+CR+AN | 58 | 570 | 275 | (FeCoNiCr)95Ti1Al4 |
| 53 | VAM+AN+CR+AN | 13 | 1560 | 1330 | Ni2CoCrFeTi0.24Al0.2 |
| 54 | VAM+AN+CR+AN | 45 | 715 | 425 | Al(4at.%)CoCrFeNi |
| 55 | AC | 62 | 526 | 127 | Al 0.25CoCrFeNi |
| 55 | AC+CR | 2.3 | 1479 | 1280 | Al0.25CoCrFeNi |
| 56 | AM | 17 | 1050 | 620 | AlCoCrFeNi2.1 |
| 56 | AM+CR | 6 | 1800 | 1625 | AlCoCrFeNi2.1 |
| This work | Forging | 30 | 1350 | 650 | Al5Co35Cr30Fe20Ni5(at.%) |
| Disclaimer/Publisher’s Note: The statements, opinions and data contained in all publications are solely those of the individual author(s) and contributor(s) and not of MDPI and/or the editor(s). MDPI and/or the editor(s) disclaim responsibility for any injury to people or property resulting from any ideas, methods, instructions or products referred to in the content. |





 ,
,