


Abstract
This study investigates the hot deformation behavior of electroslag remelted (ESR) 25Cr2Ni2MoV steel, focusing on the effects of deformation temperature and strain rate on flow stress, microstructure evolution, and dynamic recrystallization (DRX) mechanisms. Hot compression tests were performed at temperatures ranging from 1120 °C to 1210 °C and strain rates from 0.01 s−1 to 10 s−1 to generate true stress–strain curves. The friction and adiabatic temperature effects were corrected to ensure accurate results. The data reveal that the material exhibits a single-peak true stress–strain curve, characteristic of dynamic recrystallization softening. The flow stress is negatively sensitive to temperature and positively sensitive to strain rate. An Arrhenius-type constitutive model was developed, and the activation energy for hot deformation was determined to be 371.3 kJ/mol. EBSD analysis show that the recrystallized grain size is highly dependent on strain rate, with finer grains formed at lower strain rates (0.01–0.1 s−1). A processing map constructed at a true strain of 0.5 identified an optimal hot-working window at deformation temperatures of 1160–1200 °C with strain rates below 0.37 s−1, providing guidance for the forging process of large 25Cr2Ni2MoV steel.
1. Introduction
25Cr2Ni2MoV steel is a Cr–Ni–Mo–V-series steel developed for large steam turbine and nuclear power low-pressure welded rotors, which are critical load-bearing components operating under severe service conditions. This steel was developed on the basis of introducing 30Cr2Ni4MoV steel and integrating domestic alloy design experience. In order to achieve a balance between strength, toughness and weldability, its carbon content is usually controlled within the range of 0.18–0.27 wt.%, classifying it as a medium–low-carbon alloy steel. Meanwhile, alloying elements such as Cr, Ni, Mo and V significantly enhance hardenability and microstructural heredity, making post-forging heat treatment necessary to refine grains and alleviate mixed-grain structures [1,2]. For large rotor forgings, hot deformation is not only required to realize component shaping but also plays a vital role in microstructure control. During deformation in the austenitic region, dynamic recovery (DRV) and dynamic recrystallization (DRX) can effectively refine grains, reduce segregation and improve microstructural homogeneity, thereby decreasing the burden of subsequent heat treatment. Therefore, establishing an accurate constitutive model and hot processing map, combined with phase transformation behavior, is essential for determining a stable forging window and preventing defects such as cracking and mixed grains [3].
At present, the optimization of forging processes for large 25Cr2Ni2MoV low-pressure turbine rotors still mainly relies on traditional trial-and-error approaches [4,5,6]. These methods are time-consuming, costly and strongly influenced by external factors. Zhou et al. [7] investigated the explicit microstructural response of materials to processing parameters based on processing maps generated from flow stress data, addressing hot workability and microstructure control during deformation. At present, the optimization of forging processes for large 25Cr2Ni2MoV low-pressure turbine rotors still mainly relies on traditional trial-and-error approaches [4,5,6]. These methods are time-consuming, costly and strongly influenced by external factors. Zhou et al. [7] investigated the explicit microstructural response of materials to processing parameters based on processing maps generated from flow stress data, addressing hot workability and microstructure control during deformation. Luo et al. [8] simulated microstructure evolution during multidirectional forging of 30Cr2Ni4MoV steel using DEFORM software(https://link.springer.com/article/10.1007/s00170-021-08615-w, accessed 10 January 2026) and established a backpropagation neural network model for microstructure prediction. Wu et al. [9] quantitatively studied the deformation behavior and DRX kinetics of low-alloy high-strength Ni–Cr–Mo steel, determined the critical strain for DRX initiation, and verified the reliability of the proposed kinetic model. Mandal et al. [10] developed constitutive equations to predict the flow stress of austenitic alloys during hot deformation. Frost and Ashby [11] first proposed the concept of hot processing maps, which were later refined by Prasad [12,13]. This approach enables microstructure control through optimization of hot working parameters and has been widely applied to various alloys, including high-strength steels [14,15], austenitic stainless steels [16,17], magnesium alloys [18,19] and aluminum alloys [20,21].
Currently, most studies on Cr-Ni-Mo-V rotor steels are based on traditional cast or forged materials, and systematic research on the hot deformation behavior of electroslag remelted (ESR) 25Cr2Ni2MoV steel is still limited. Furthermore, the effects of friction and adiabatic heating corrections on constitutive modeling and the refinement of processing maps have seldom been clearly addressed. Therefore, this paper conducts hot compression tests on ESR 25Cr2Ni2MoV composite ingot samples with a true strain of 0.5, obtaining true stress–strain curves at different temperatures and strain rates [22]. Corresponding constitutive equations and processing maps are established [23]. By combining the corrected flow stress data with microstructural analysis, a more reliable processing window for large rotor forgings is established.
2. Experimental Procedure
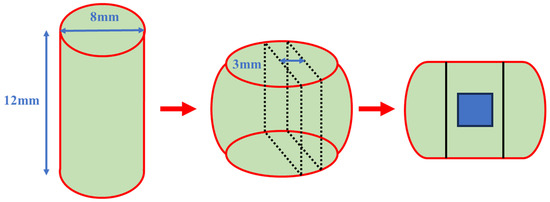
The material was prepared by vacuum induction melting at Northeastern University and subsequently remelted by electroslag remelting to produce square ingots. The chemical composition is listed in Table 1. Cylindrical samples with a diameter of 8 mm and a height of 12 mm were machined from the ingot. To reduce friction during deformation, thin graphite sheets were placed on the sample surfaces. Hot compression tests were carried out using a Gleeble-3500 thermomechanical simulator (Dynamic Systems Inc., Poestenkill, NY, USA). Since this study focused on the overall flow behavior and trends at different temperatures and strain rates, rather than the statistical variability under single experimental conditions, only one experiment was conducted for each deformation condition. The samples were heated at 5 °C·s−1 to 1100 °C, 1130 °C, 1160 °C and 1190 °C, followed by heating at 2 °C·s−1 to 1120 °C, 1150 °C, 1180 °C and 1210 °C, respectively, and held for 5 min. Compression was then performed to a total height reduction of 70% at strain rates of 0.01 s−1, 0.1 s−1, 1 s−1 and 10 s−1. After deformation, the samples were immediately quenched to preserve the dynamically recrystallized microstructure.
Table 1.
Composition of 25Cr2Ni2MoV steel.
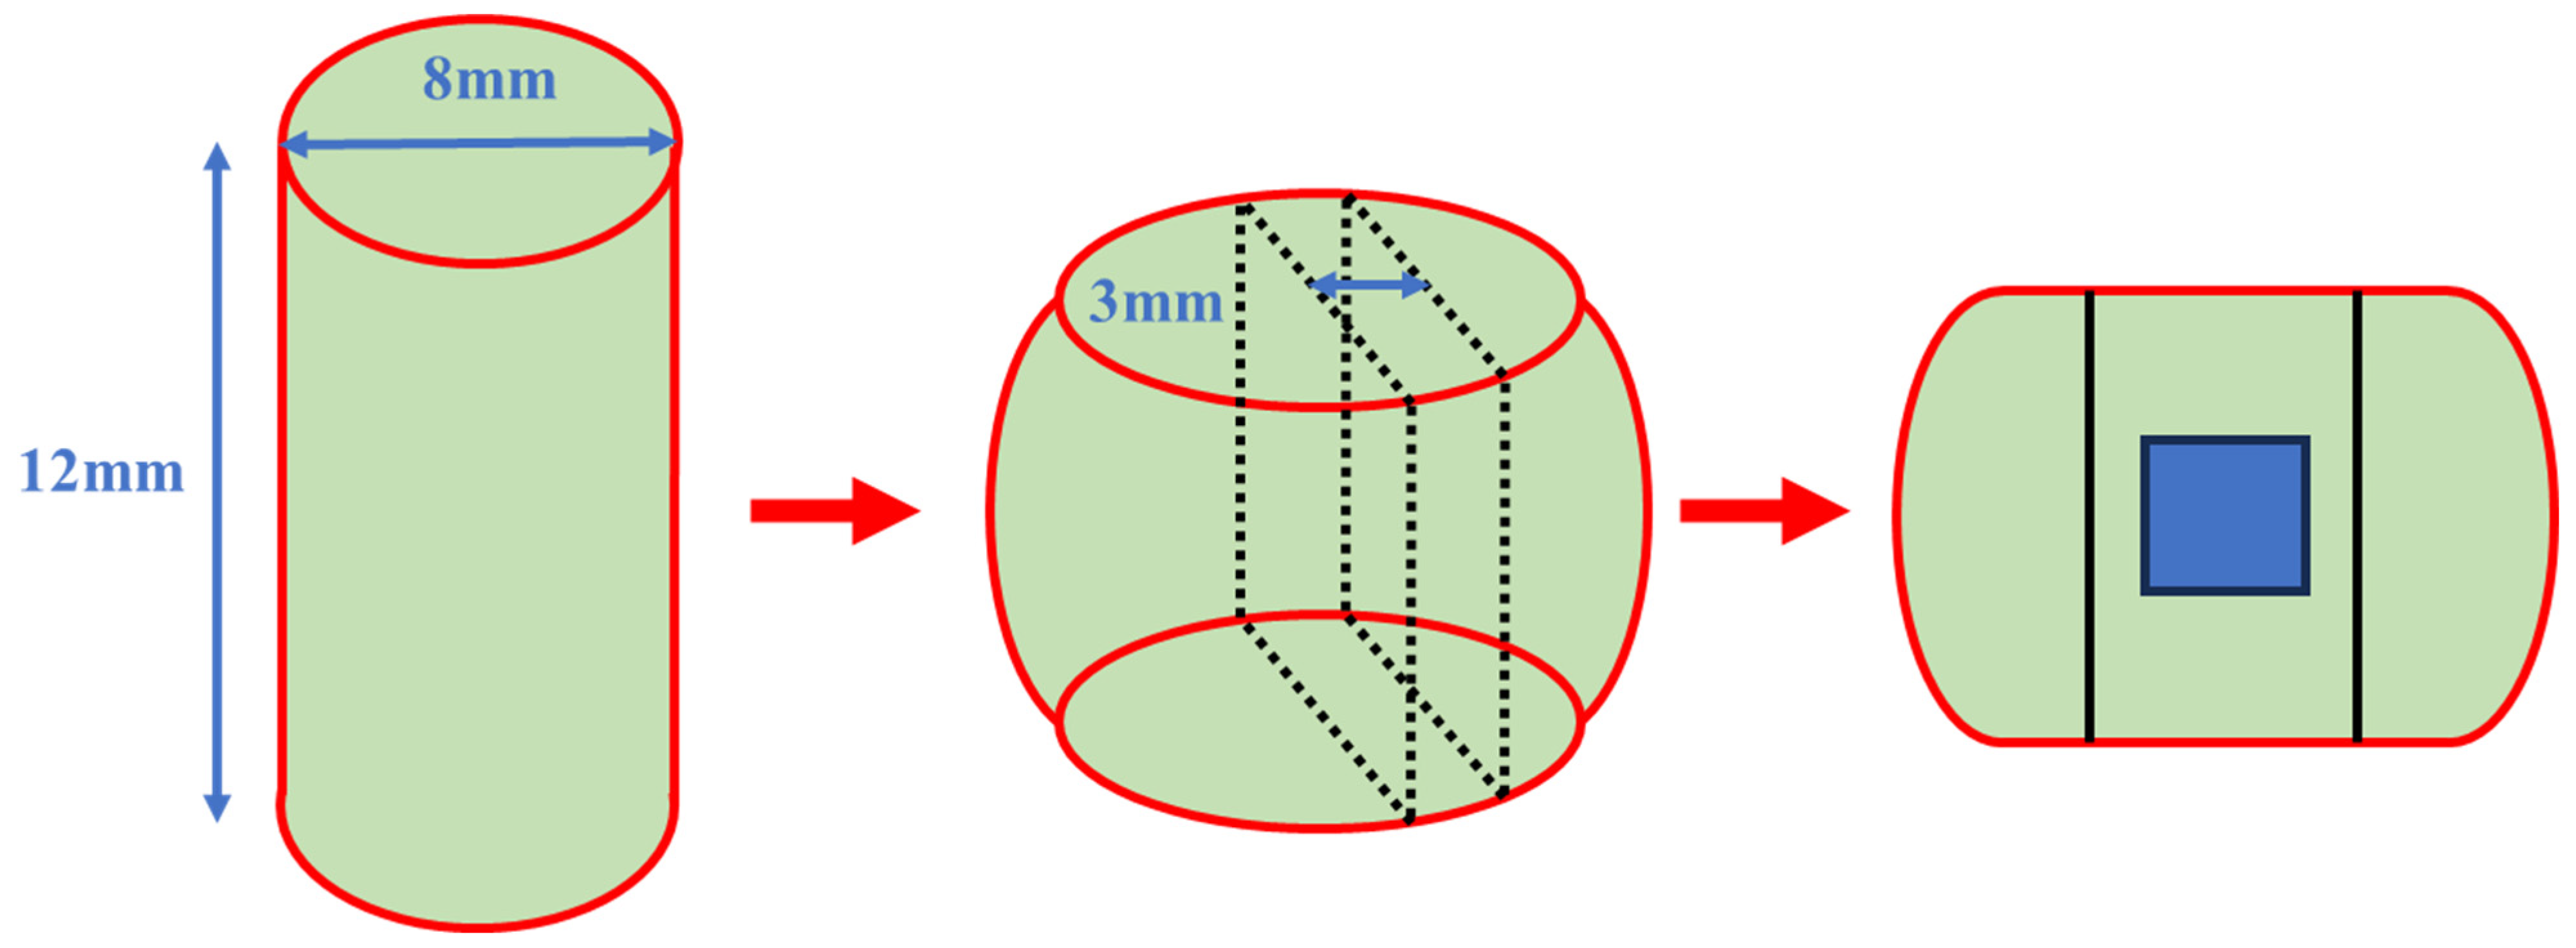
After compression, the samples were sectioned along the axial direction, and a 3 mm thick slice was cut from the center, as shown in Figure 1. The samples were mechanically ground and then electrolytically polished using a solution containing 8 mL of HClO4 and 92 mL of ethanol at 25 V and 1 A for 30 s. EBSD observations were conducted using a ZEISS Crossbeam 550 microscope with a step size of 0.2 μm, and the data were analyzed using Aztec Crystal software (version 2.1).
Figure 1.
Dimensions of thermal deformation samples and sampling positions after deformation.
3. Results and Discussion
3.1. True Stress–Strain Curves
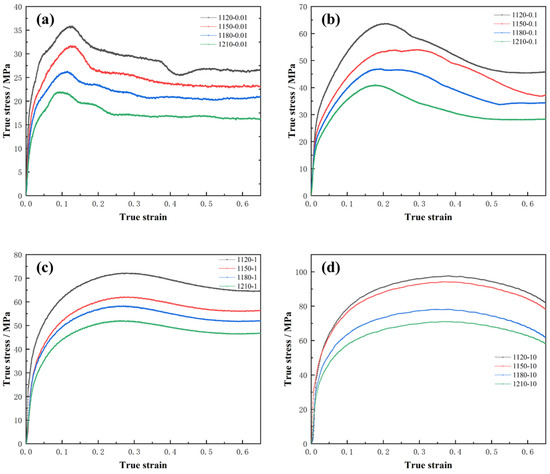
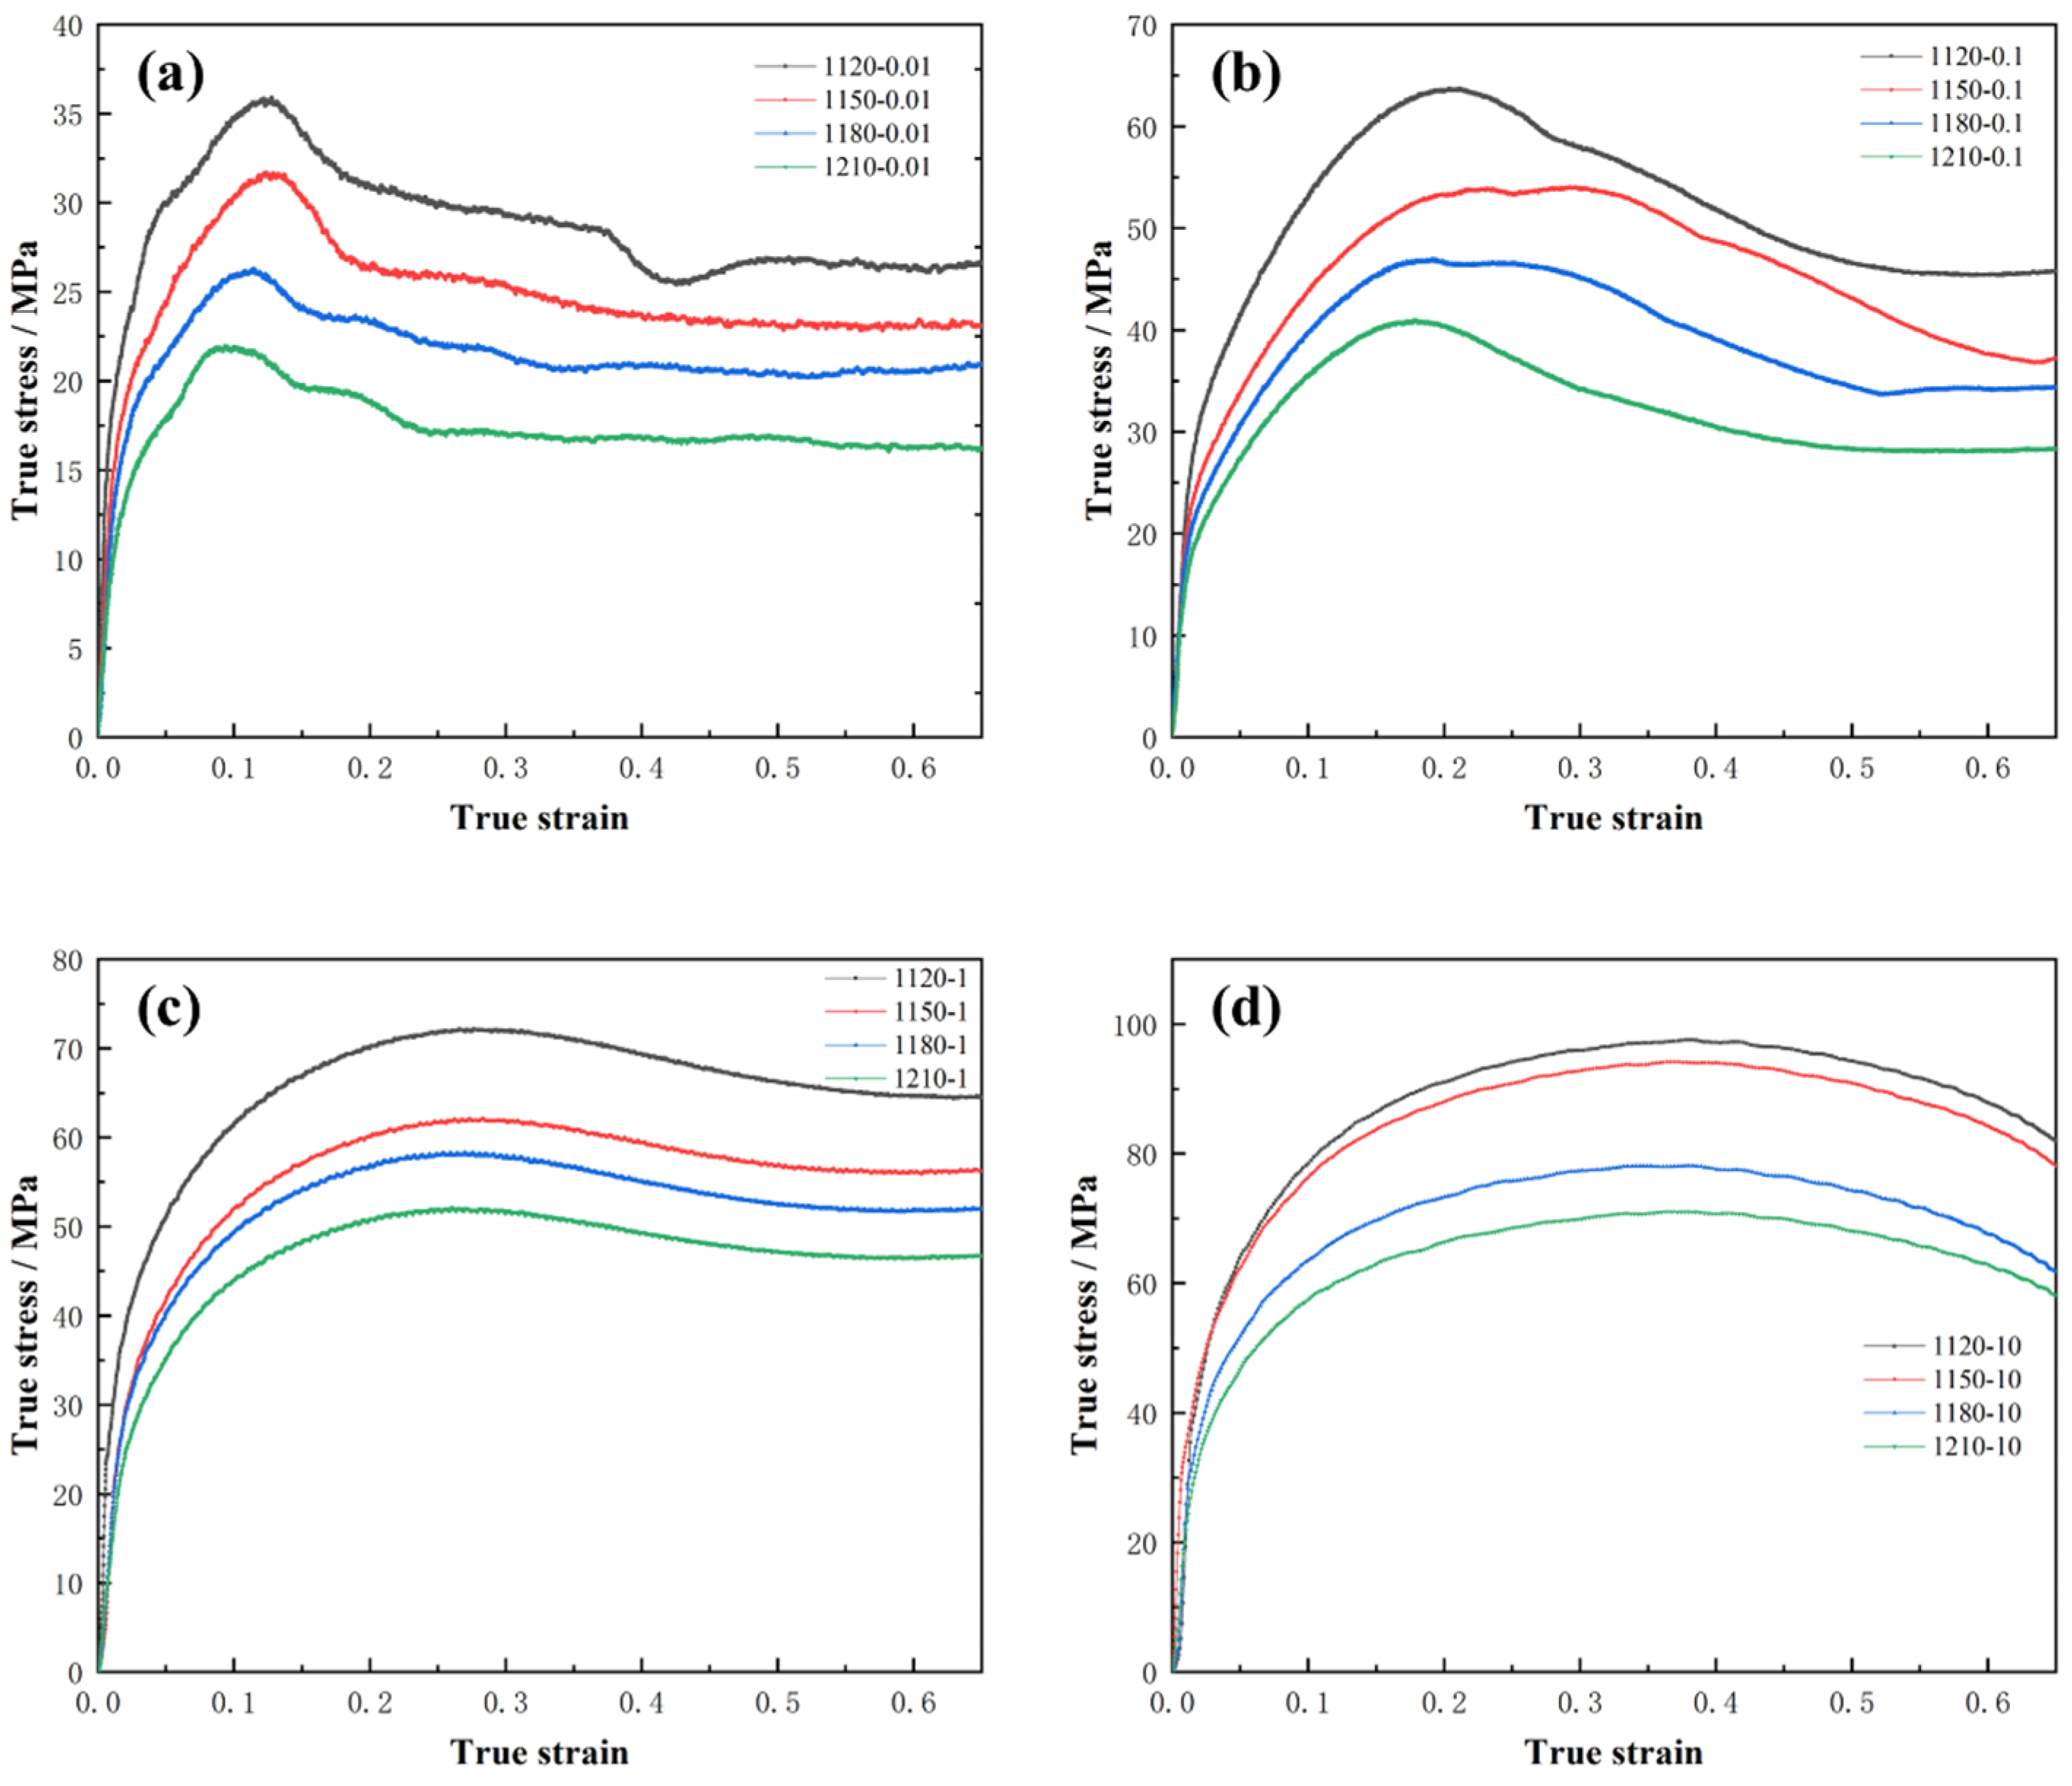
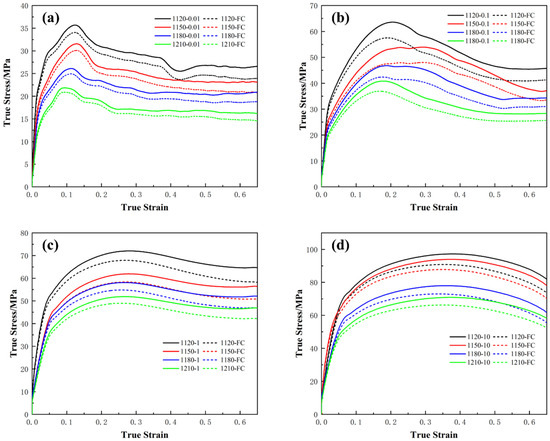
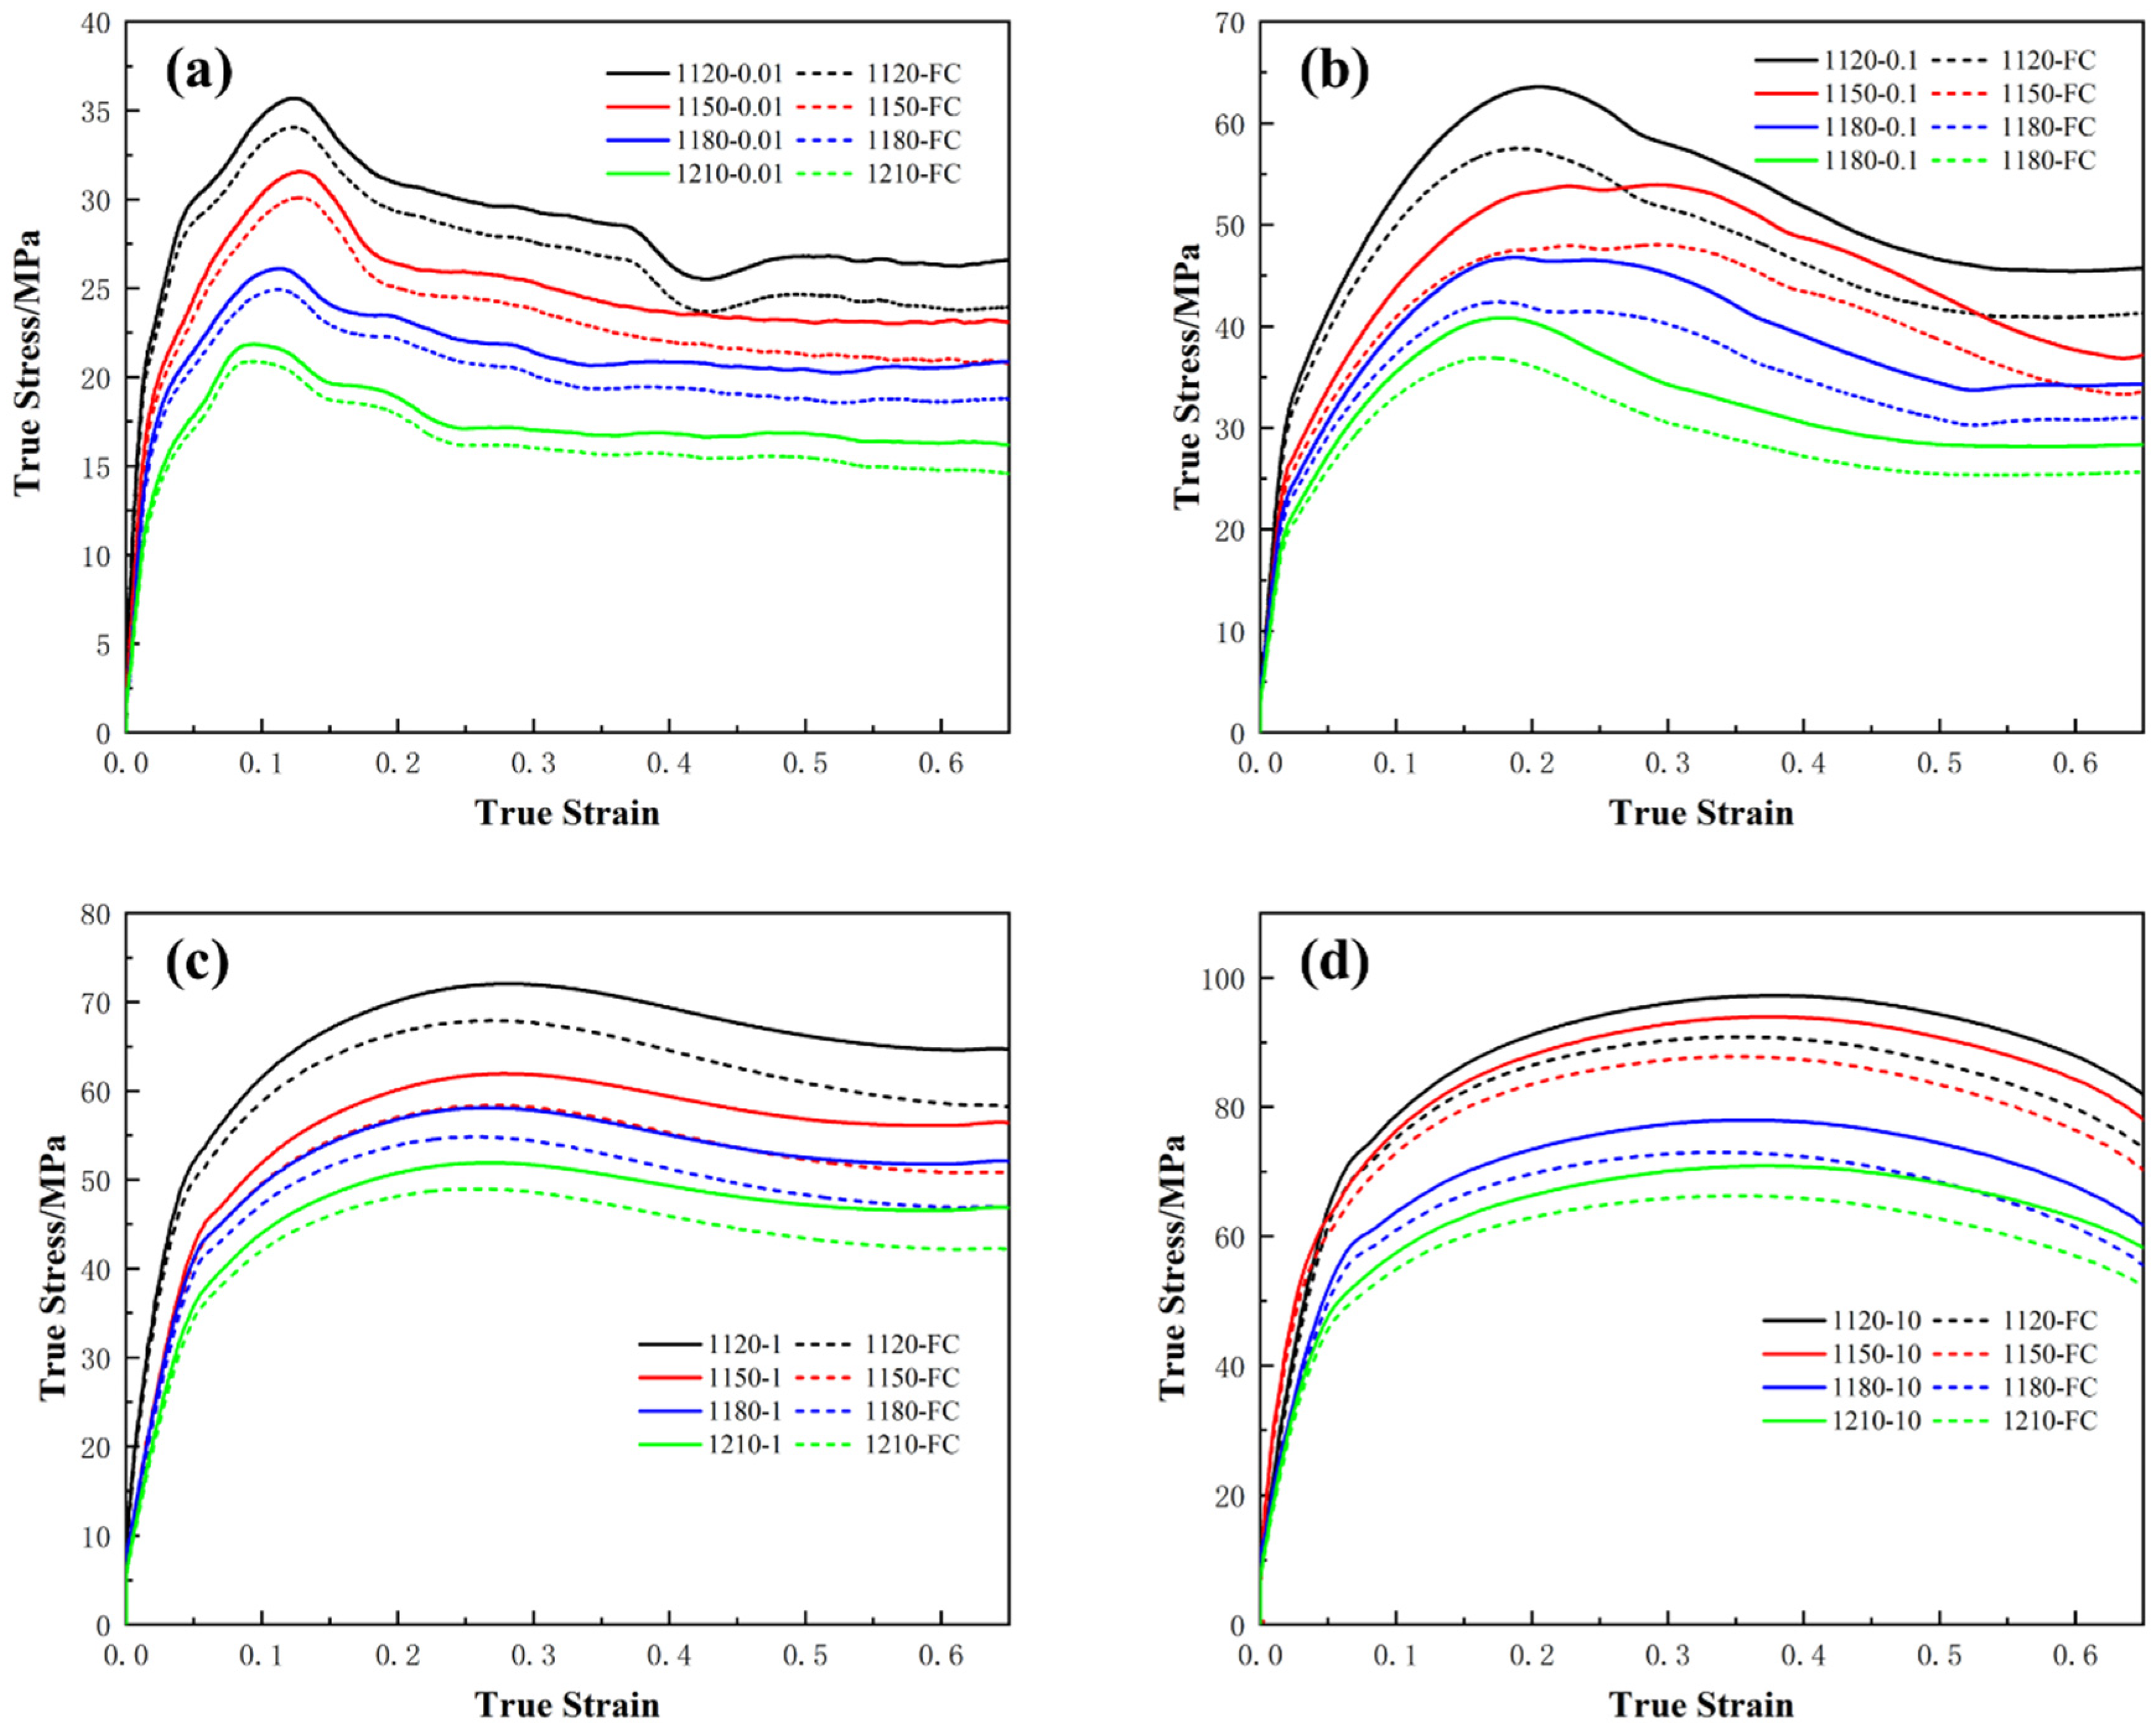
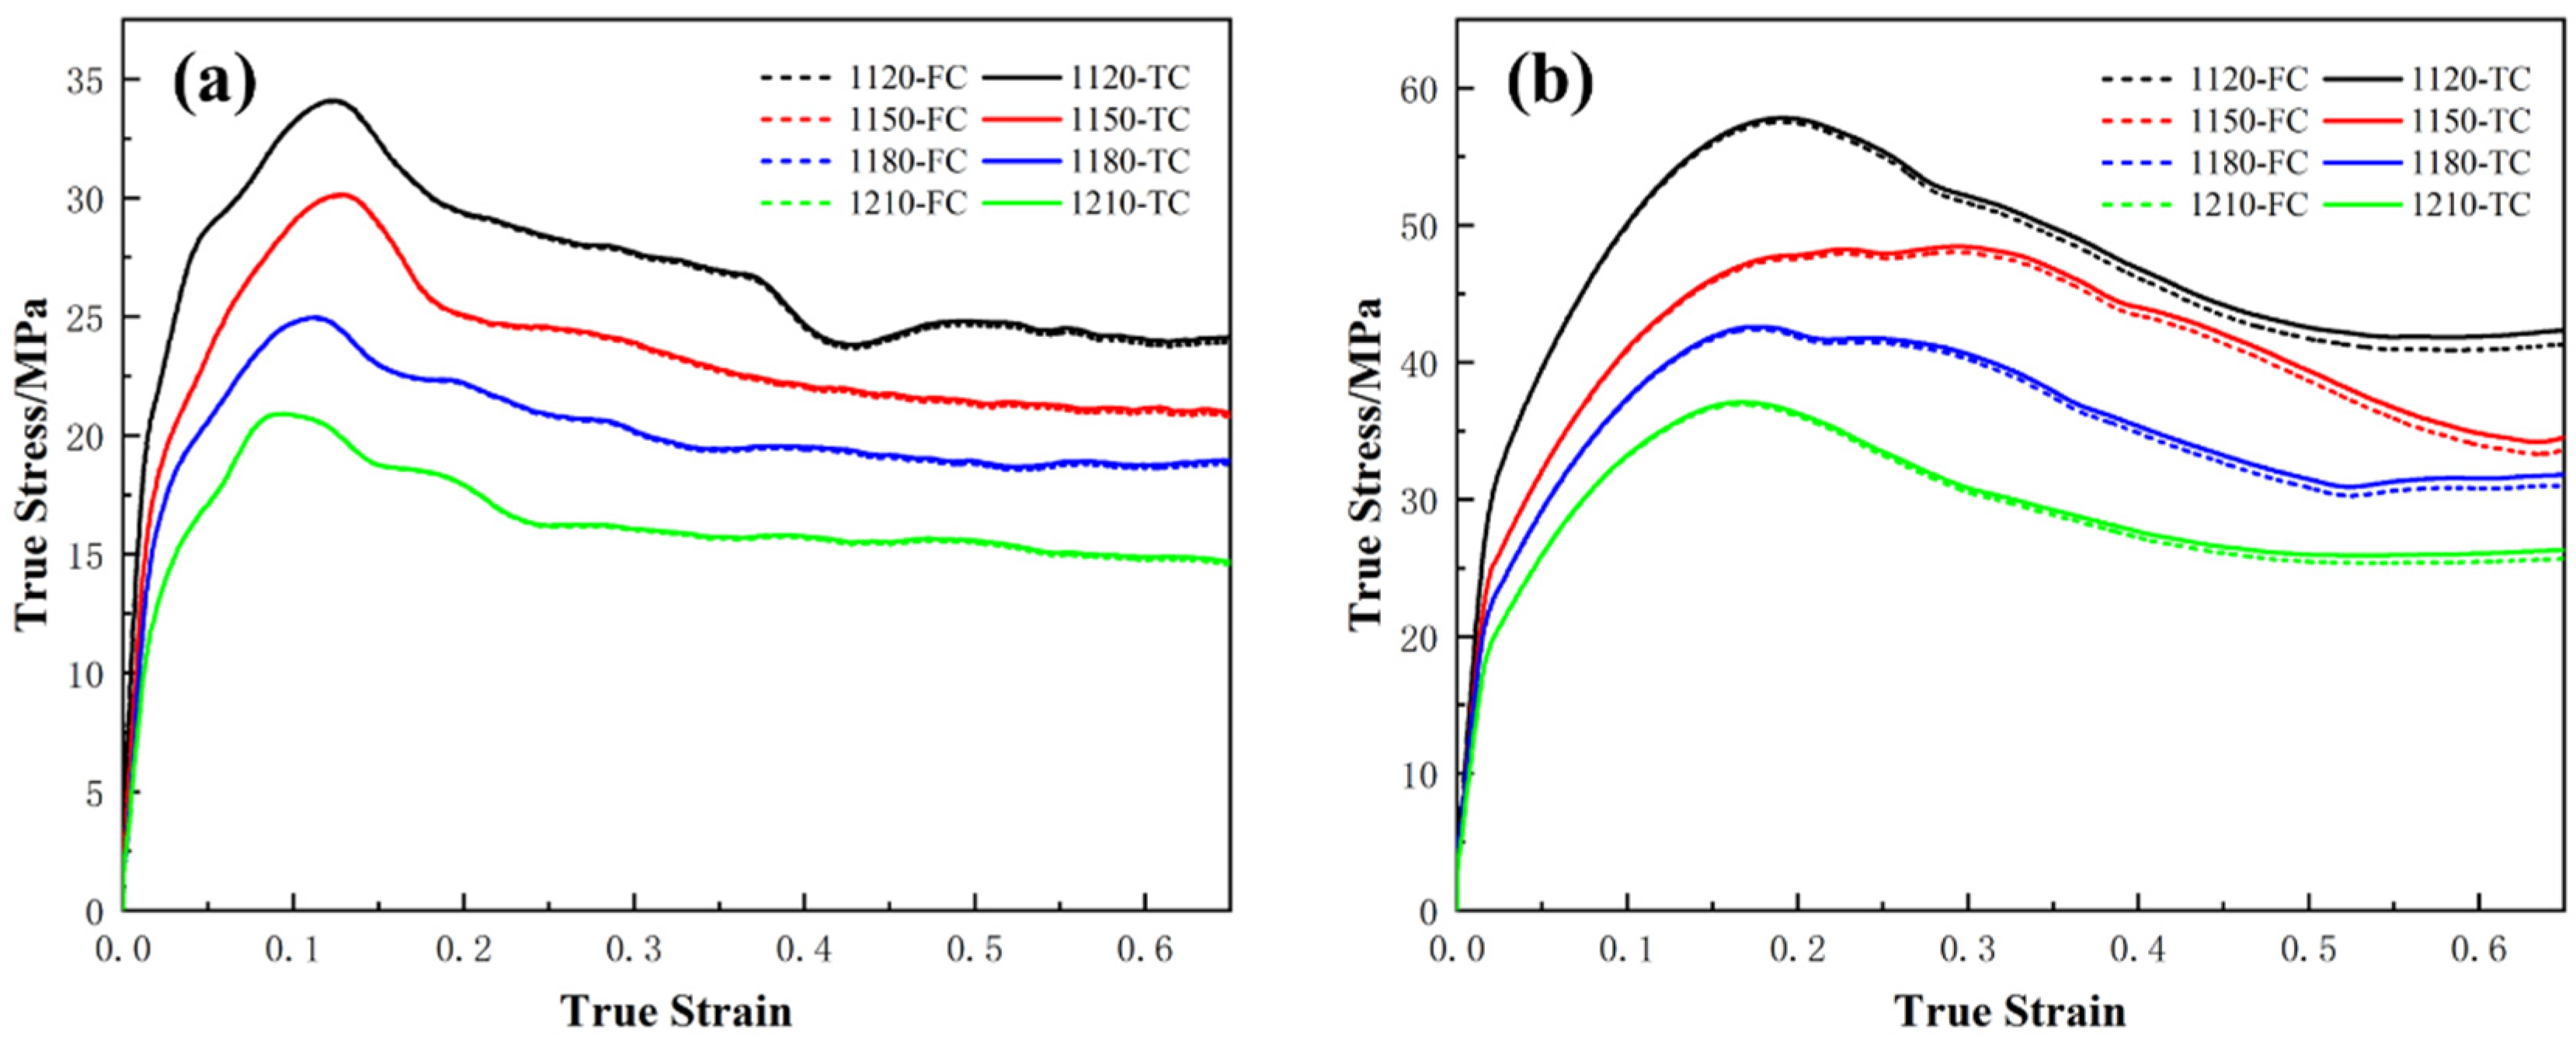
The true stress–strain curves obtained at different temperatures under the same strain rates are shown in Figure 2a–d. At a constant strain rate, the flow stress increases with decreasing deformation temperature. Conversely, at a given temperature, the flow stress increases with increasing strain rate. Lower strain rates combined with higher temperatures significantly reduce the flow stress, whereas higher strain rates at lower temperatures lead to pronounced stress elevation [24]. This behavior can be attributed to the dominance of work hardening at low temperatures, where limited slip systems and inhibited recovery processes result in dislocation intersections and pile-ups. At elevated temperatures, the vacancy diffusion, cross-slip of screw dislocations and the rise in edge dislocations are accelerated, facilitating dynamic recovery and softening. With increasing strain, dislocation density accumulates and deformation resistance increases. As DRX proceeds, dislocations are consumed, leading to a decrease in flow stress. When the energy generated by deformation equals that consumed by DRX, the flow stress reaches a steady state [25]. All curves show a single peak followed by softening, indicating the occurrence of DRX. The 25Cr alloy shows negative temperature sensitivity and positive strain rate sensitivity [26].
Figure 2.
True stress–strain curves at the same strain rate for different temperatures: (a) 0.01 s−1, (b) 0.1 s−1, (c) 1 s−1, and (d) 10 s−1.
3.2. Effect of Friction Correction on Stress–Strain Curves
During hot compression, large plastic deformation occurs, and friction between the sample and anvils is unavoidable. The friction-generated heat cannot be dissipated rapidly, leading to barreling of the sample with a bulged center. Consequently, the experimentally measured flow stress deviates from the intrinsic material response, and friction correction is therefore required. The friction correction equation uses the analytical model proposed by Ebrahimi and Najafizadeh [27], which takes into account the bulging effect during the hot compression of the cylindrical sample. The model assumes an axisymmetric deformation distribution, uniform material properties, and a constant friction coefficient at the sample–base interface. This model is applicable to cases with stable deformation and insignificant bulging effects, as shown in Equation (1).
where σ and σ0 are the corrected and measured flow stresses, respectively; R is the instantaneous radius of the sample during deformation; H is the instantaneous height; m is the friction factor; and b is the barreling parameter. The parameters m and b can be calculated using the following relationships:
where h0 and h are the initial and final heights of the sample, respectively; R0 is the initial radius; RM is the maximum radius after barreling; Rave is the average radius after compression; and RT is the radius of the end face.
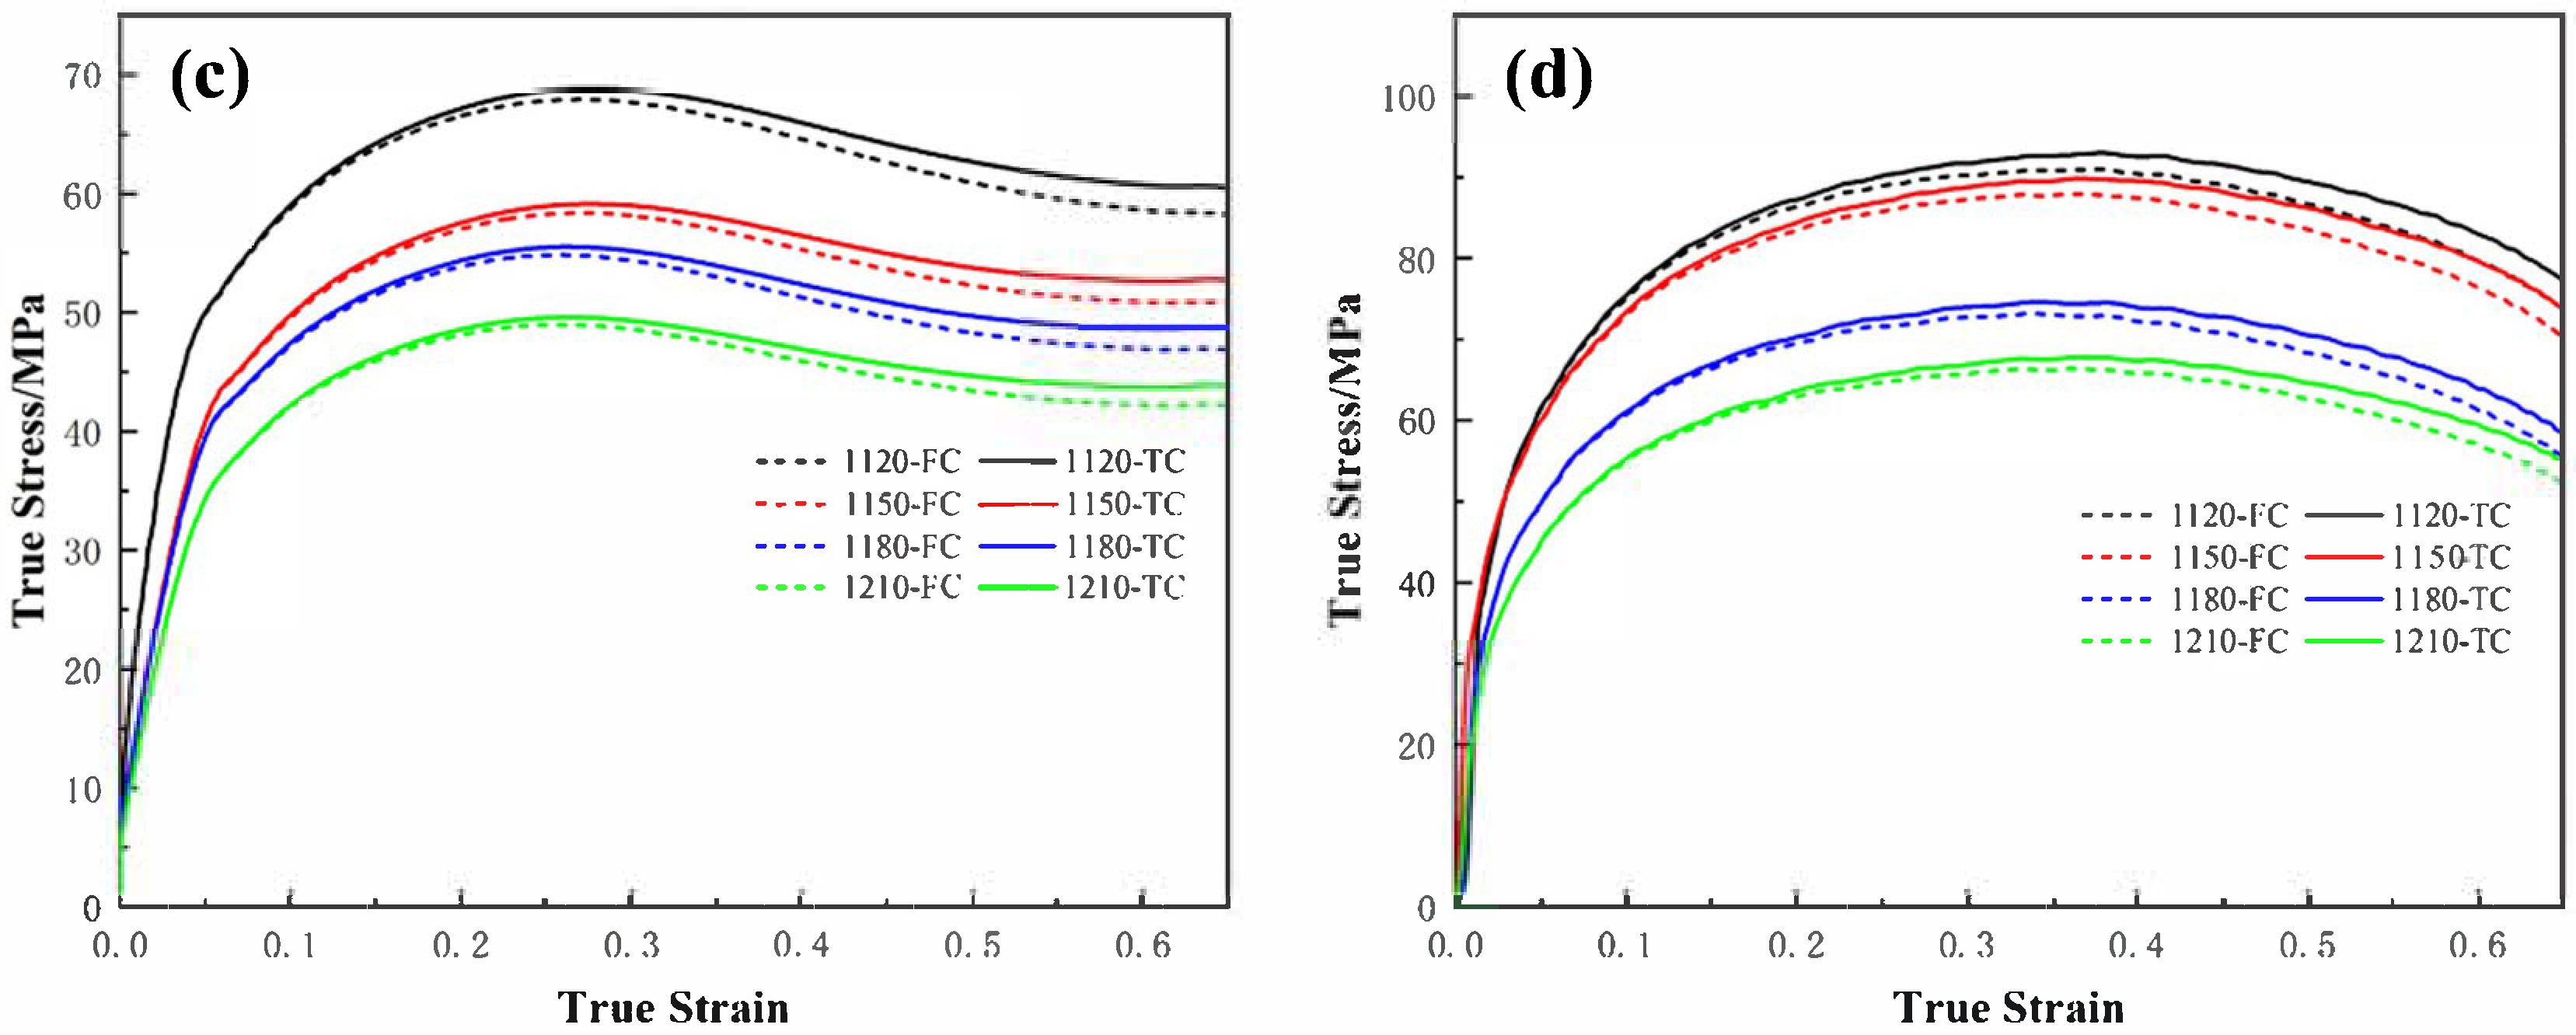
The friction-corrected true stress–strain curves are shown in Figure 3a–d. Compared with the uncorrected curves, the corrected flow stresses are slightly increased, especially at higher strain levels, indicating that friction has a non-negligible influence on the measured flow stress during large deformation.
Figure 3.
True stress–strain curves at different strain rates after friction correction: (a) 0.01 s−1, (b) 0.1 s−1, (c) 1 s−1, and (d) 10 s−1.
3.3. Effect of Temperature Correction on Stress–Strain Curves
During hot compression, a significant portion of plastic work is converted into internal energy, which cannot be dissipated instantaneously under adiabatic conditions. As a result, the sample temperature rises during deformation, particularly at high strain rates. This adiabatic heating leads to an underestimation of the flow stress if temperature correction is not applied. The temperature-corrected flow stress can be calculated using Equation (6) [28]:
where σT is the temperature-corrected flow stress (MPa), is the temperature sensitivity coefficient (MPa·K−1), and ΔT is the temperature increment (K), which can be expressed as:
where ρ is the density of the alloy (7.85 g·cm−3), is the strain rate (s−1), η is the adiabatic correction coefficient, and CP is the specific heat capacity of the alloy, which is approximately 650 J·kg−1·K−1, as calculated using JMatPro software (Version 7.0).
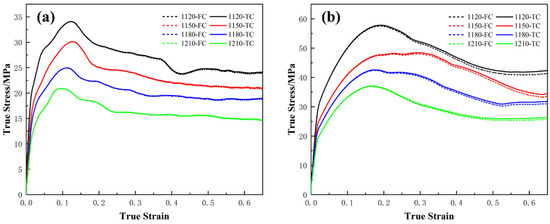
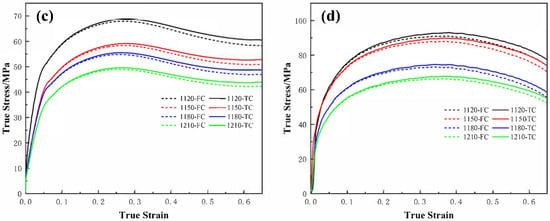
The temperature-corrected true stress–strain curves are presented in Figure 4a–d. Compared with the friction-corrected curves, the flow stresses after temperature correction are further increased, particularly at high strain rates, confirming the significant effect of adiabatic heating on hot deformation behavior. Compared with the uncorrected data reported in the literature, the joint correction of friction and temperature in this study allows more accurate determination of peak stress and deformation activation energy, thus refining the boundaries of stable and unstable regions in the processing map.
Figure 4.
True stress–strain curves at different strain rates after temperature correction: (a) 0.01 s−1, (b) 0.1 s−1, (c) 1 s−1, and (d) 10 s−1.
3.4. Arrhenius-Type Constitutive Equation
The Arrhenius-type constitutive equation is widely used to describe the relationship among flow stress, strain rate and deformation temperature during high-temperature deformation. The hyperbolic sine law provides an effective approximation for the relationship between the Zener–Hollomon parameter and flow stress [29,30]:
Under different stress conditions, Equation (9) can be simplified as:
where is the strain rate (s−1), R is the universal gas constant (8.318 J·mol−1·K−1), T is the absolute temperature (K), Q is the activation energy for hot deformation (kJ·mol−1), σ is the flow stress (MPa), and A, α and n are material constants.
Equation (9) is applicable to all deformation conditions, whereas Equation (10) is valid for the low-stress regime (ασ < 0.8), and Equation (3) applies to the high-stress regime (ασ > 0.8). Taking the natural logarithm of the above three equations yields:
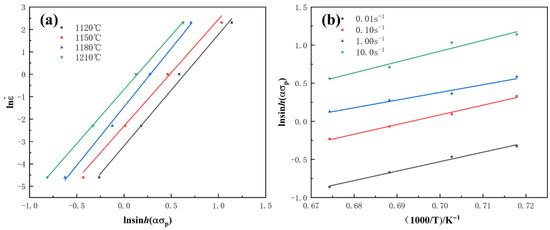
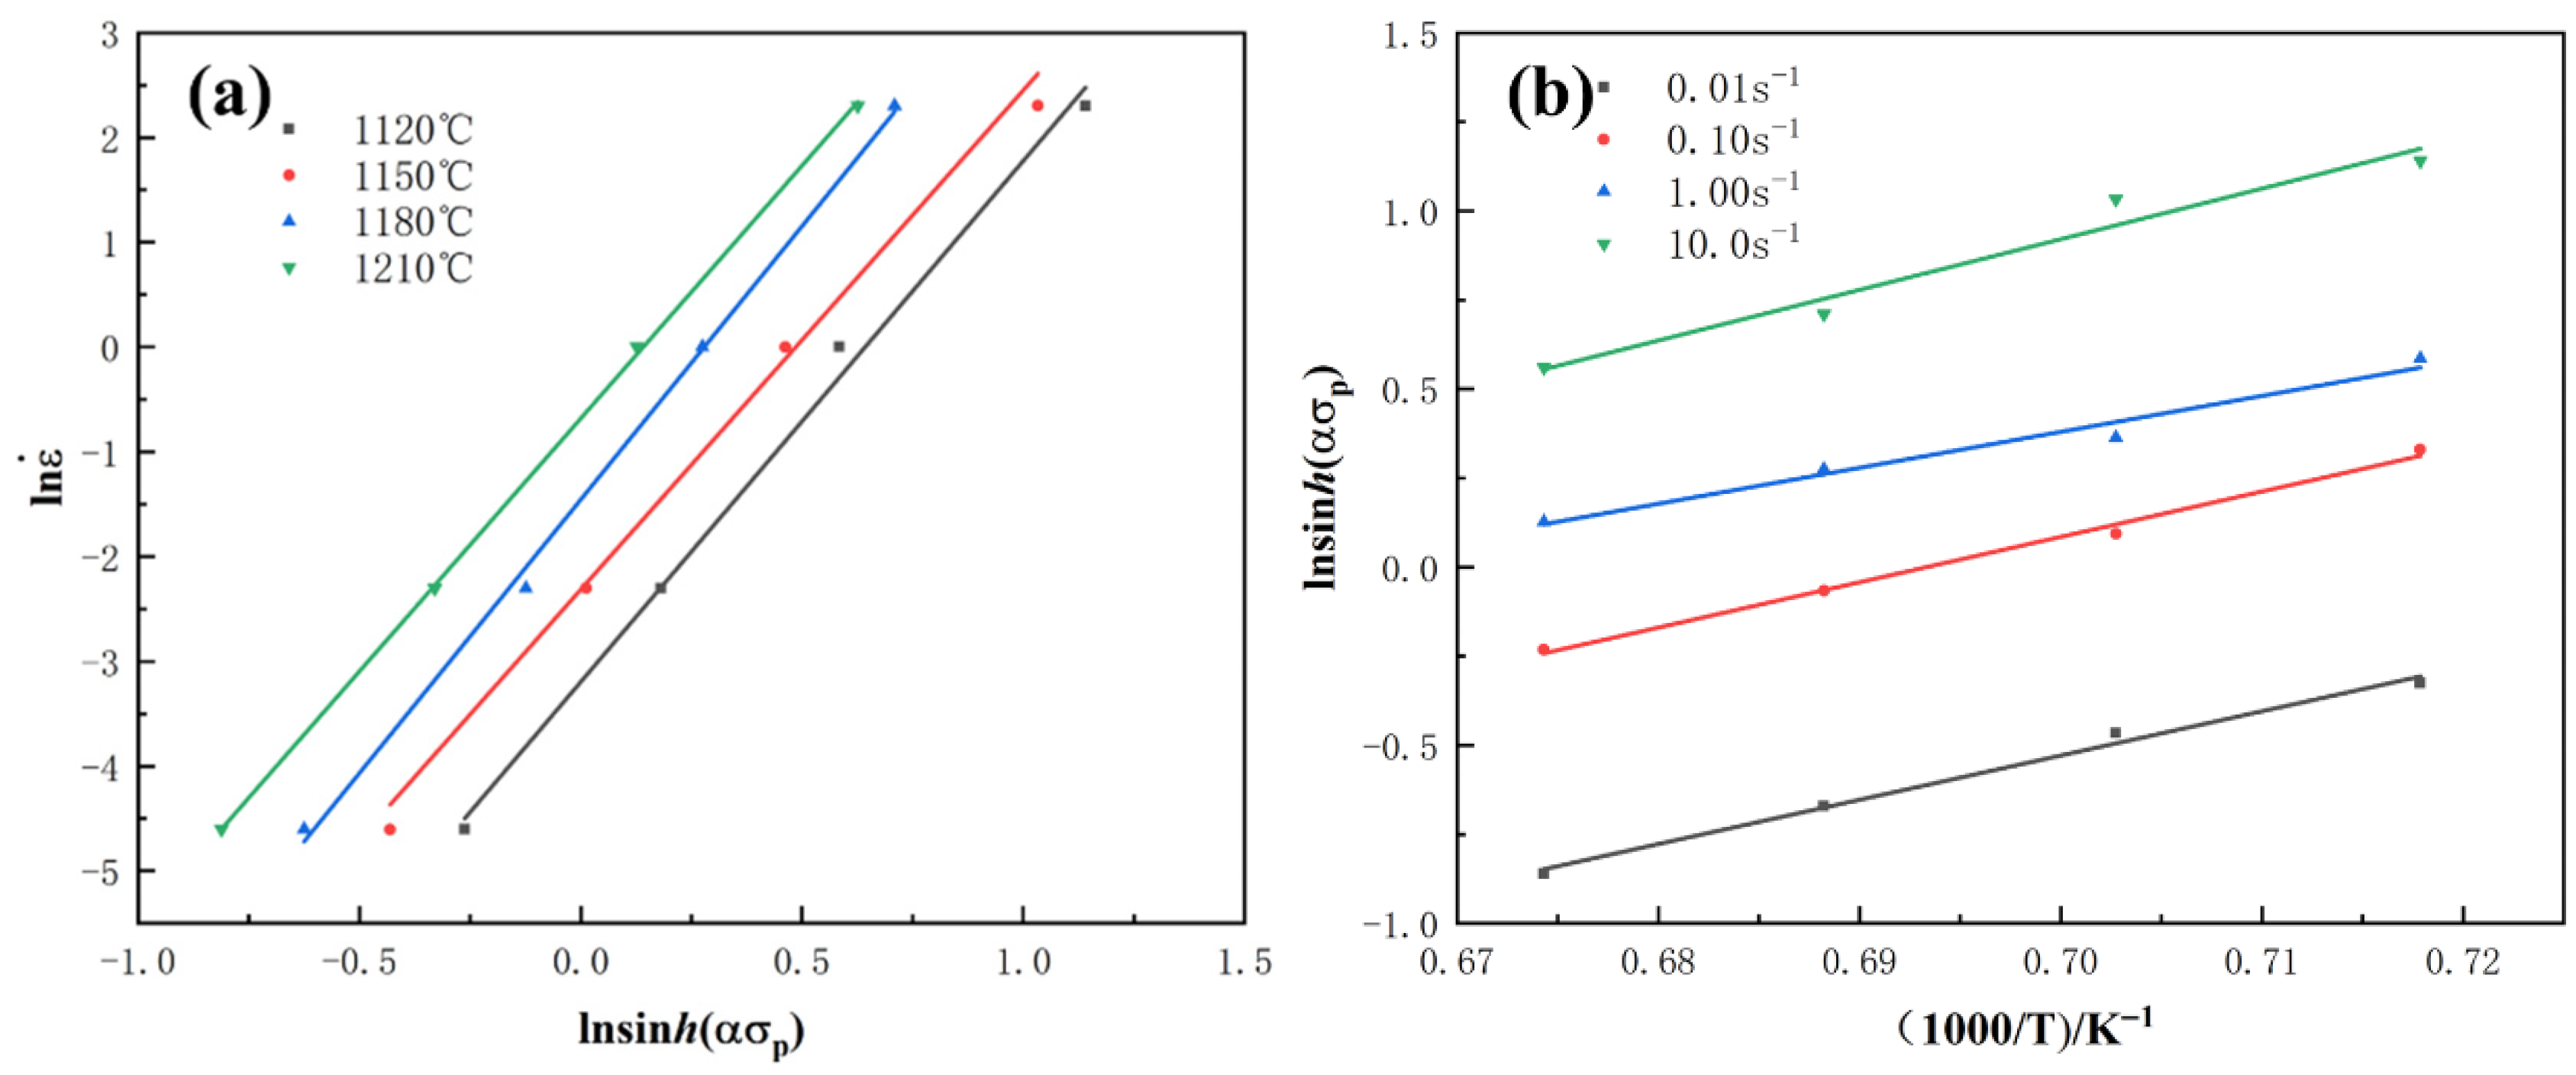
According to Equation (12), the flow stress, strain rate and deformation temperature are related through the hyperbolic sine Arrhenius equation. The corresponding linear fitting results are shown in Figure 5. From the fitting curves, the slopes of the linear relationships between ln and ln[sinh(ασp)], as well as between ln[sinh(ασp)] and 1000/T, are determined to be n2 = 4.14657 and k = 10.77083. Substituting the gas constant R into the equation, the activation energy for hot deformation is calculated as Q = n2Rk = 371.319 kJ/mol.
Figure 5.
Fitting curves at different deformation temperatures: (a) ln-ln[sinh(ασp)] and (b) ln[sinh(ασp)]-1000/T.
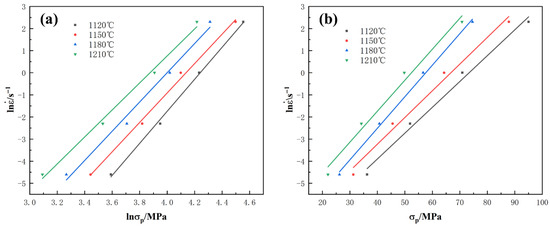
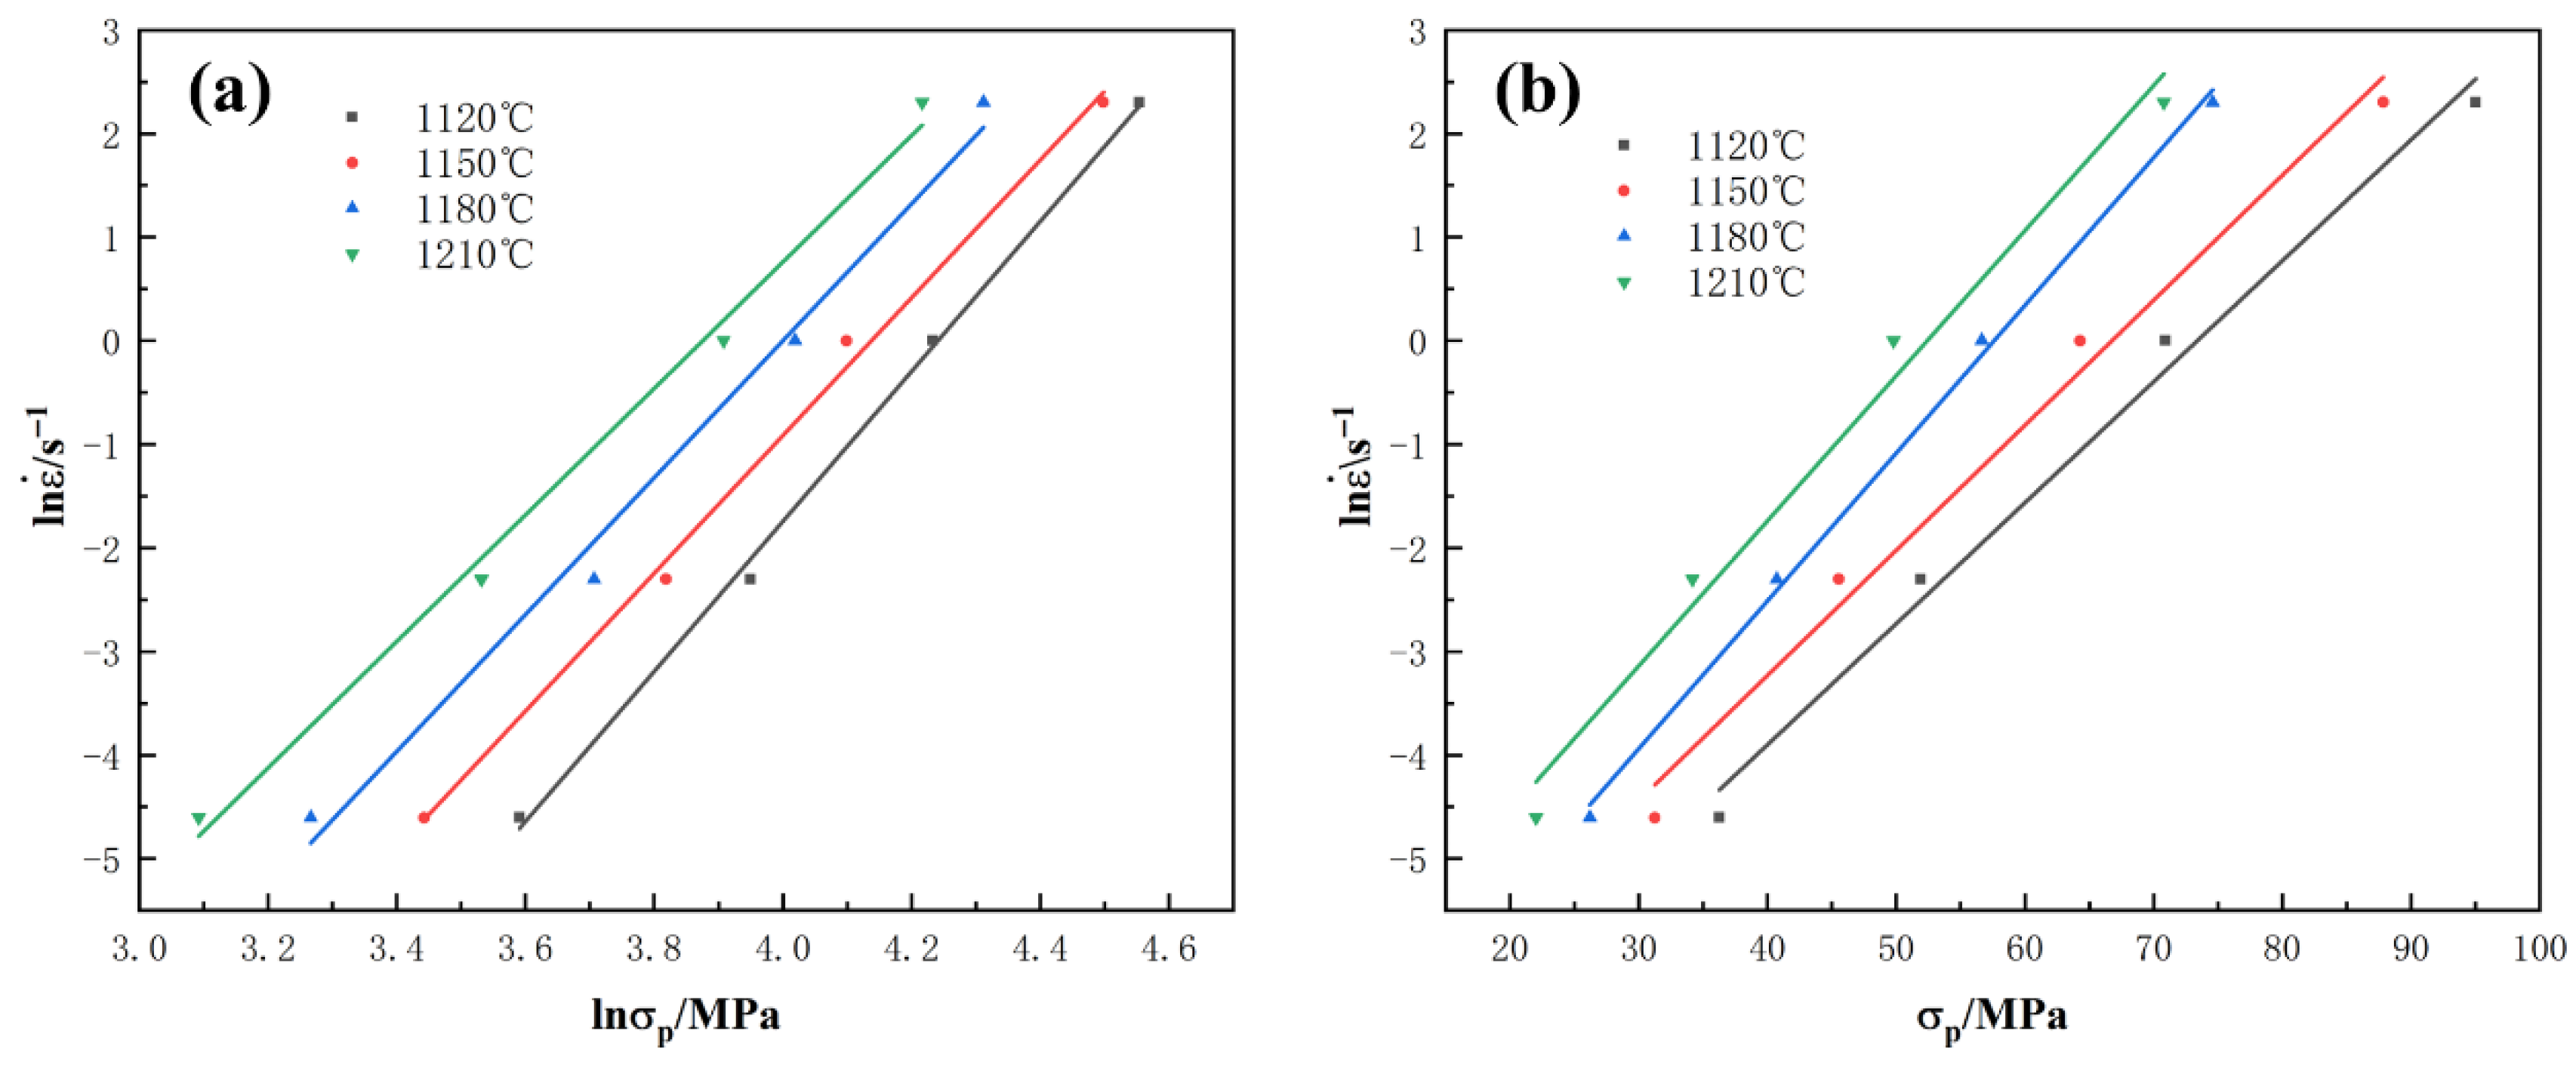
It can be seen from Equations (13) and (14), at a constant temperature, as shown in Figure 6, the slope of the linear relationship between ln and lnσp is n1 = 6.65248, while the slope of the linear relationship between ln and σp is β = 0.130075; thus, the parameter α can be calculated as α = β/n1 = 0.019553.
Figure 6.
Fitting curves at different deformation temperatures: (a) ln-lnσp and (b) ln-σp.
Zener and Hollomon [30] reported that, for high-temperature deformation experiments, the relationship between the deformation rate and deformation temperature can be described using a functional expression of the Zener–Hollomon parameter, which represents the temperature-compensated strain rate factor:
Currently, given that the thermal deformation activation energy, Q, is known, the corresponding Z values can be calculated under different deformation conditions. Taking the logarithm of Equation (16) yields:
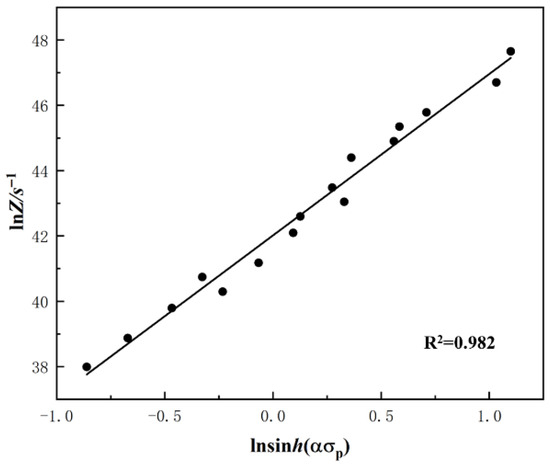
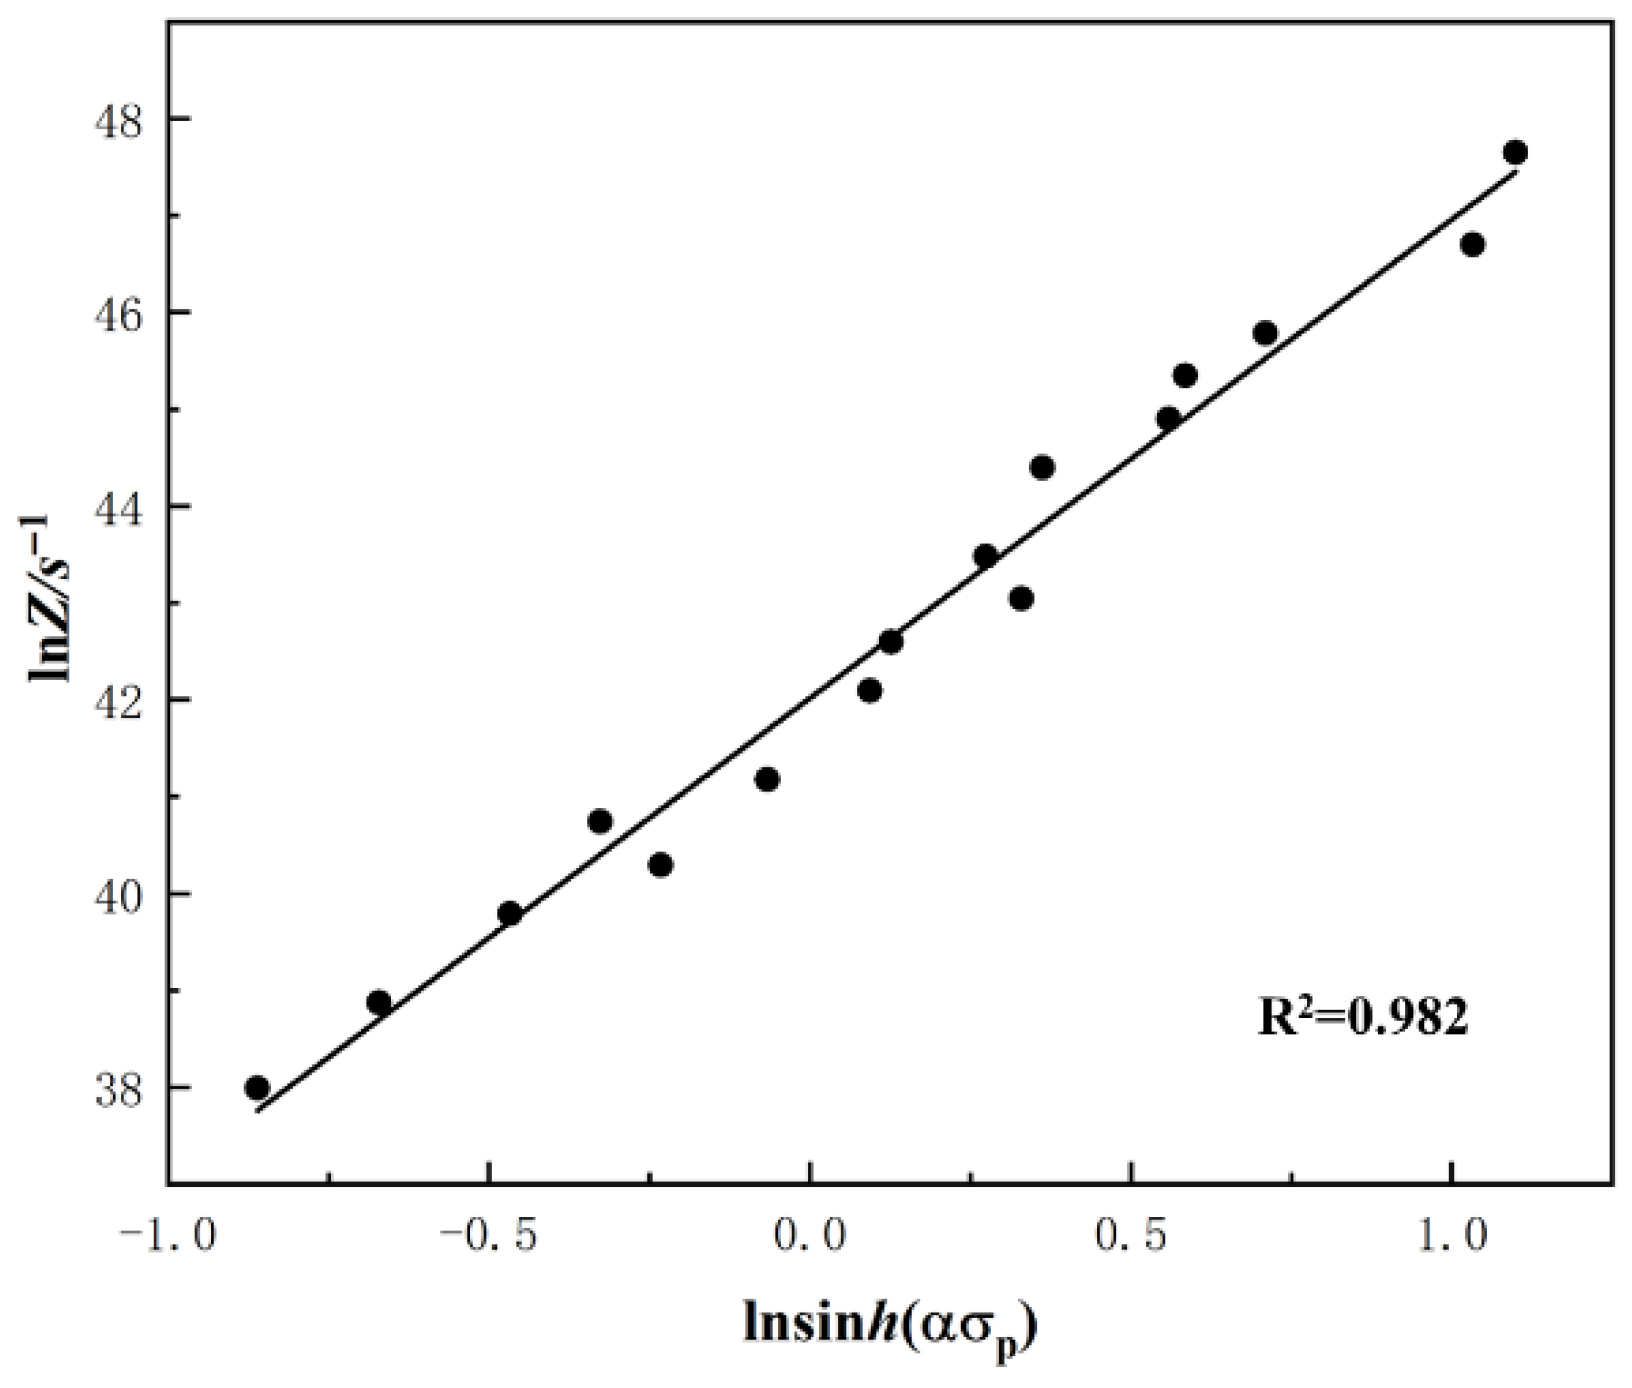
Linear fitting was performed between lnZ and ln[sinh(σp)], and the corresponding results are shown in Figure 7. The linear correlation coefficient is 0.982, and the intercept of the fitted line is lnA = 42.015, from which the material constant A is calculated to be A = 1.766 × 10¹⁸. Accordingly, the Zener–Hollomon parameter of the 25Cr alloy can be expressed as:
Figure 7.
The fitting curve of ln Z-ln[sinh(ασp)].
The Z parameter can also be used to predict the flow stress of the 25Cr alloy:
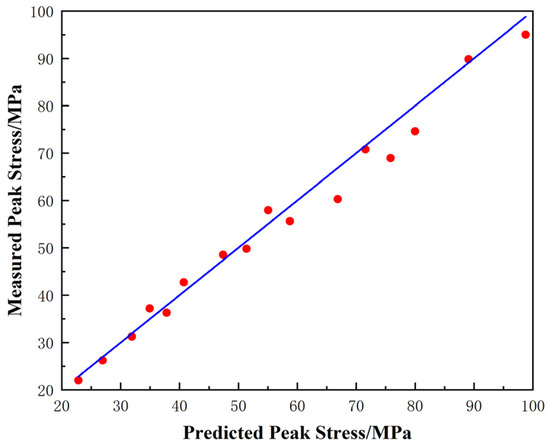
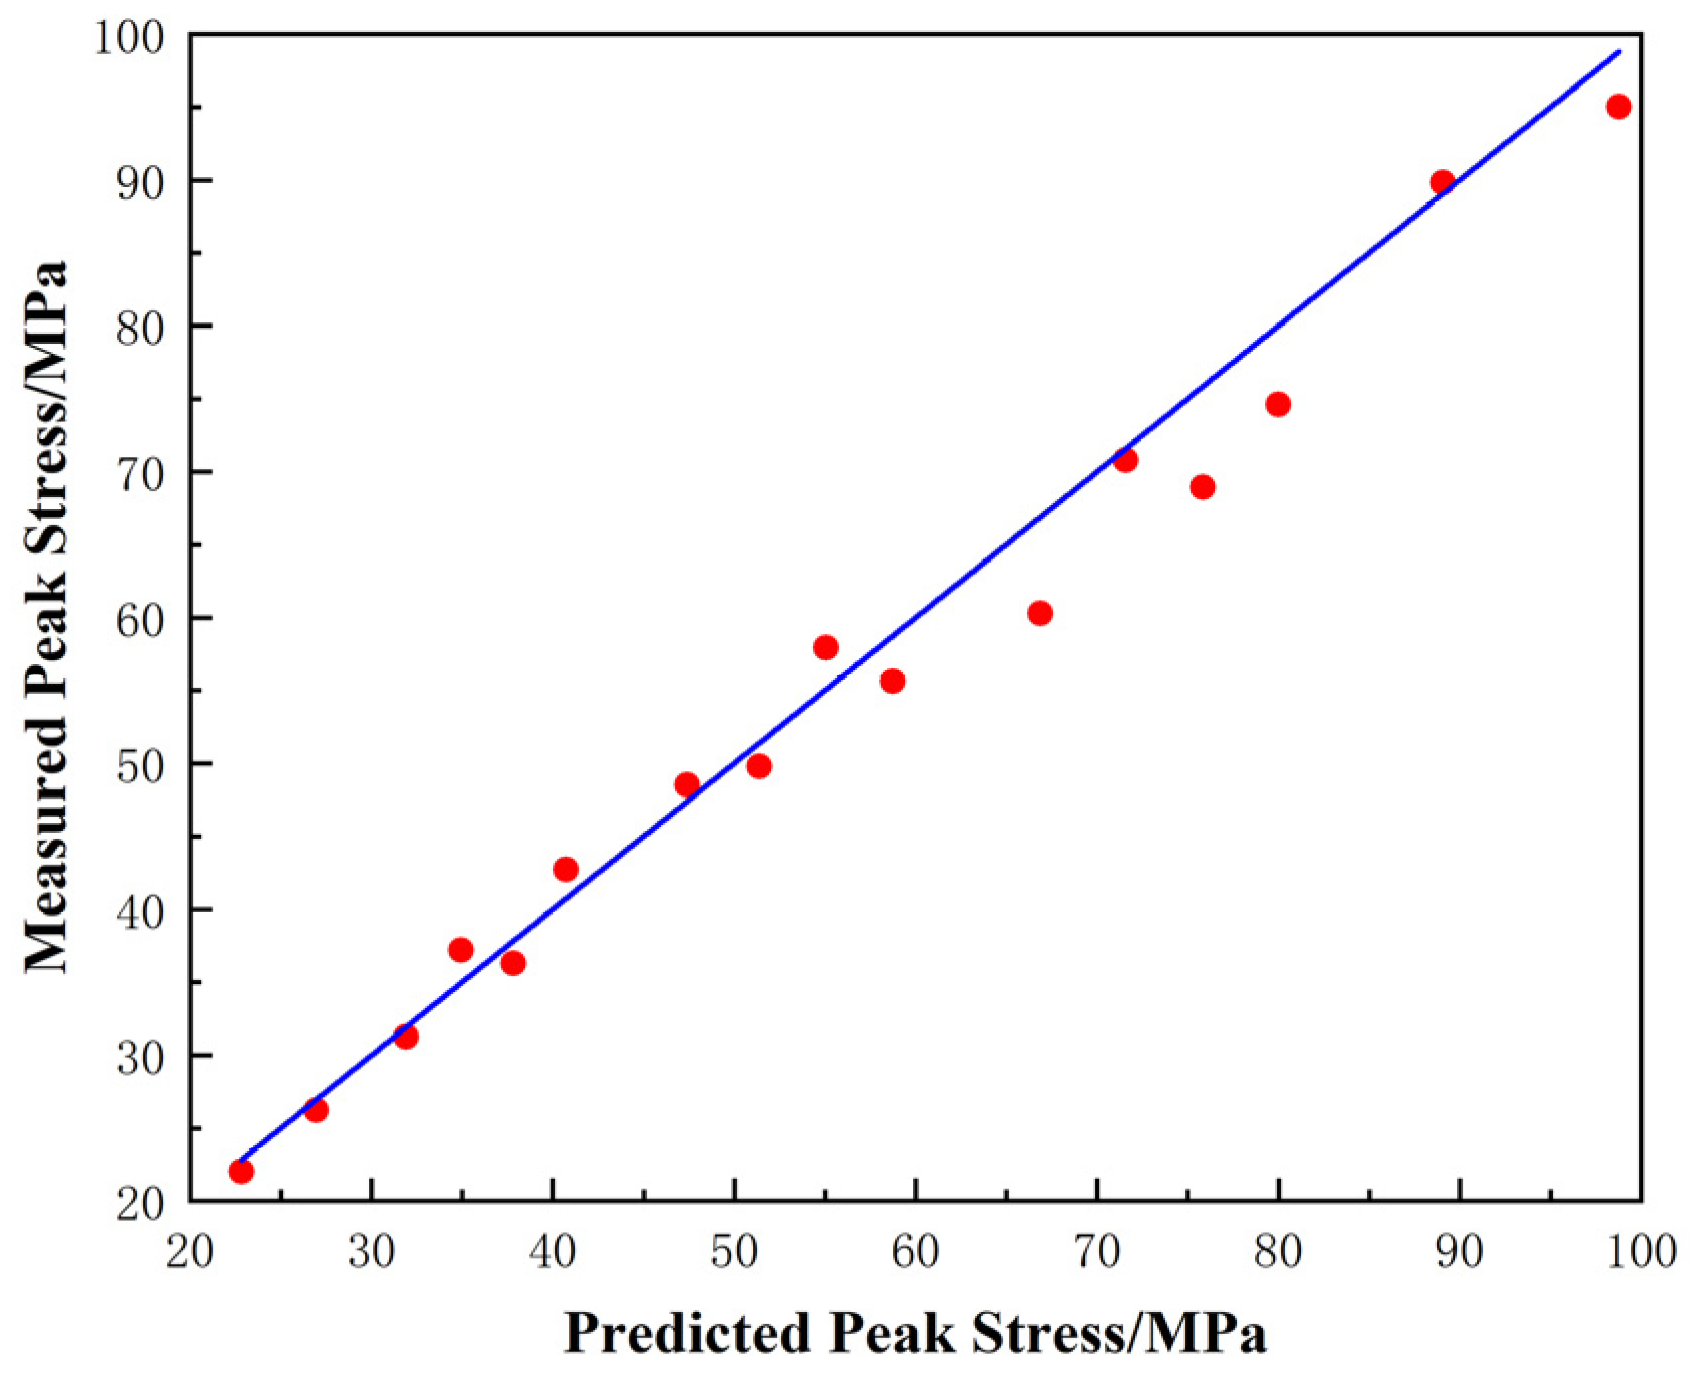
The predicted and experimental data were plotted against the reference line , as shown in Figure 8. The red data points represent the predicted values on the horizontal axis and the experimentally measured values on the vertical axis. All data points are closely distributed on both sides of the reference line, exhibiting a clear linear relationship and consistent variation trends. The maximum deviation between the predicted and experimental values is less than 5%, indicating that the Zener–Hollomon parameter effectively captures the variation in peak stress during hot deformation and that the proposed model exhibits high predictive accuracy.
Figure 8.
Comparison between predicted and measured values of true stress.
Compared to vacuum induction-melted ingots, the ESR ingot exhibits a higher activation energy for hot deformation than the 356.8 kJ·mol−1 reported for 25Cr2Ni4MoV steel [5]. The ESR process significantly improves compositional homogeneity and can effectively reduce the content of non-metallic inclusions. The enhanced cleanliness has a notable impact on DRX behavior—the reduction in inclusion content decreases available nucleation sites, making DRX more dependent on grain boundary movement. Grain boundary movement during DRX is strongly governed by atomic diffusion mechanisms. Since diffusion-controlled processes generally require higher thermal energy and exhibit stronger temperature dependence, DRX in electroslag remelted steel manifests a higher activation energy for hot deformation.
3.5. Dynamic Recrystallization Microstructure
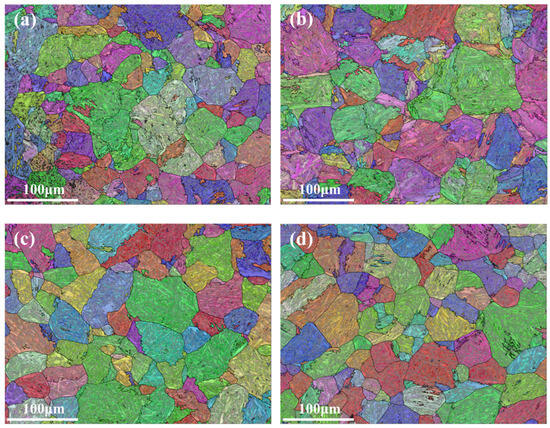
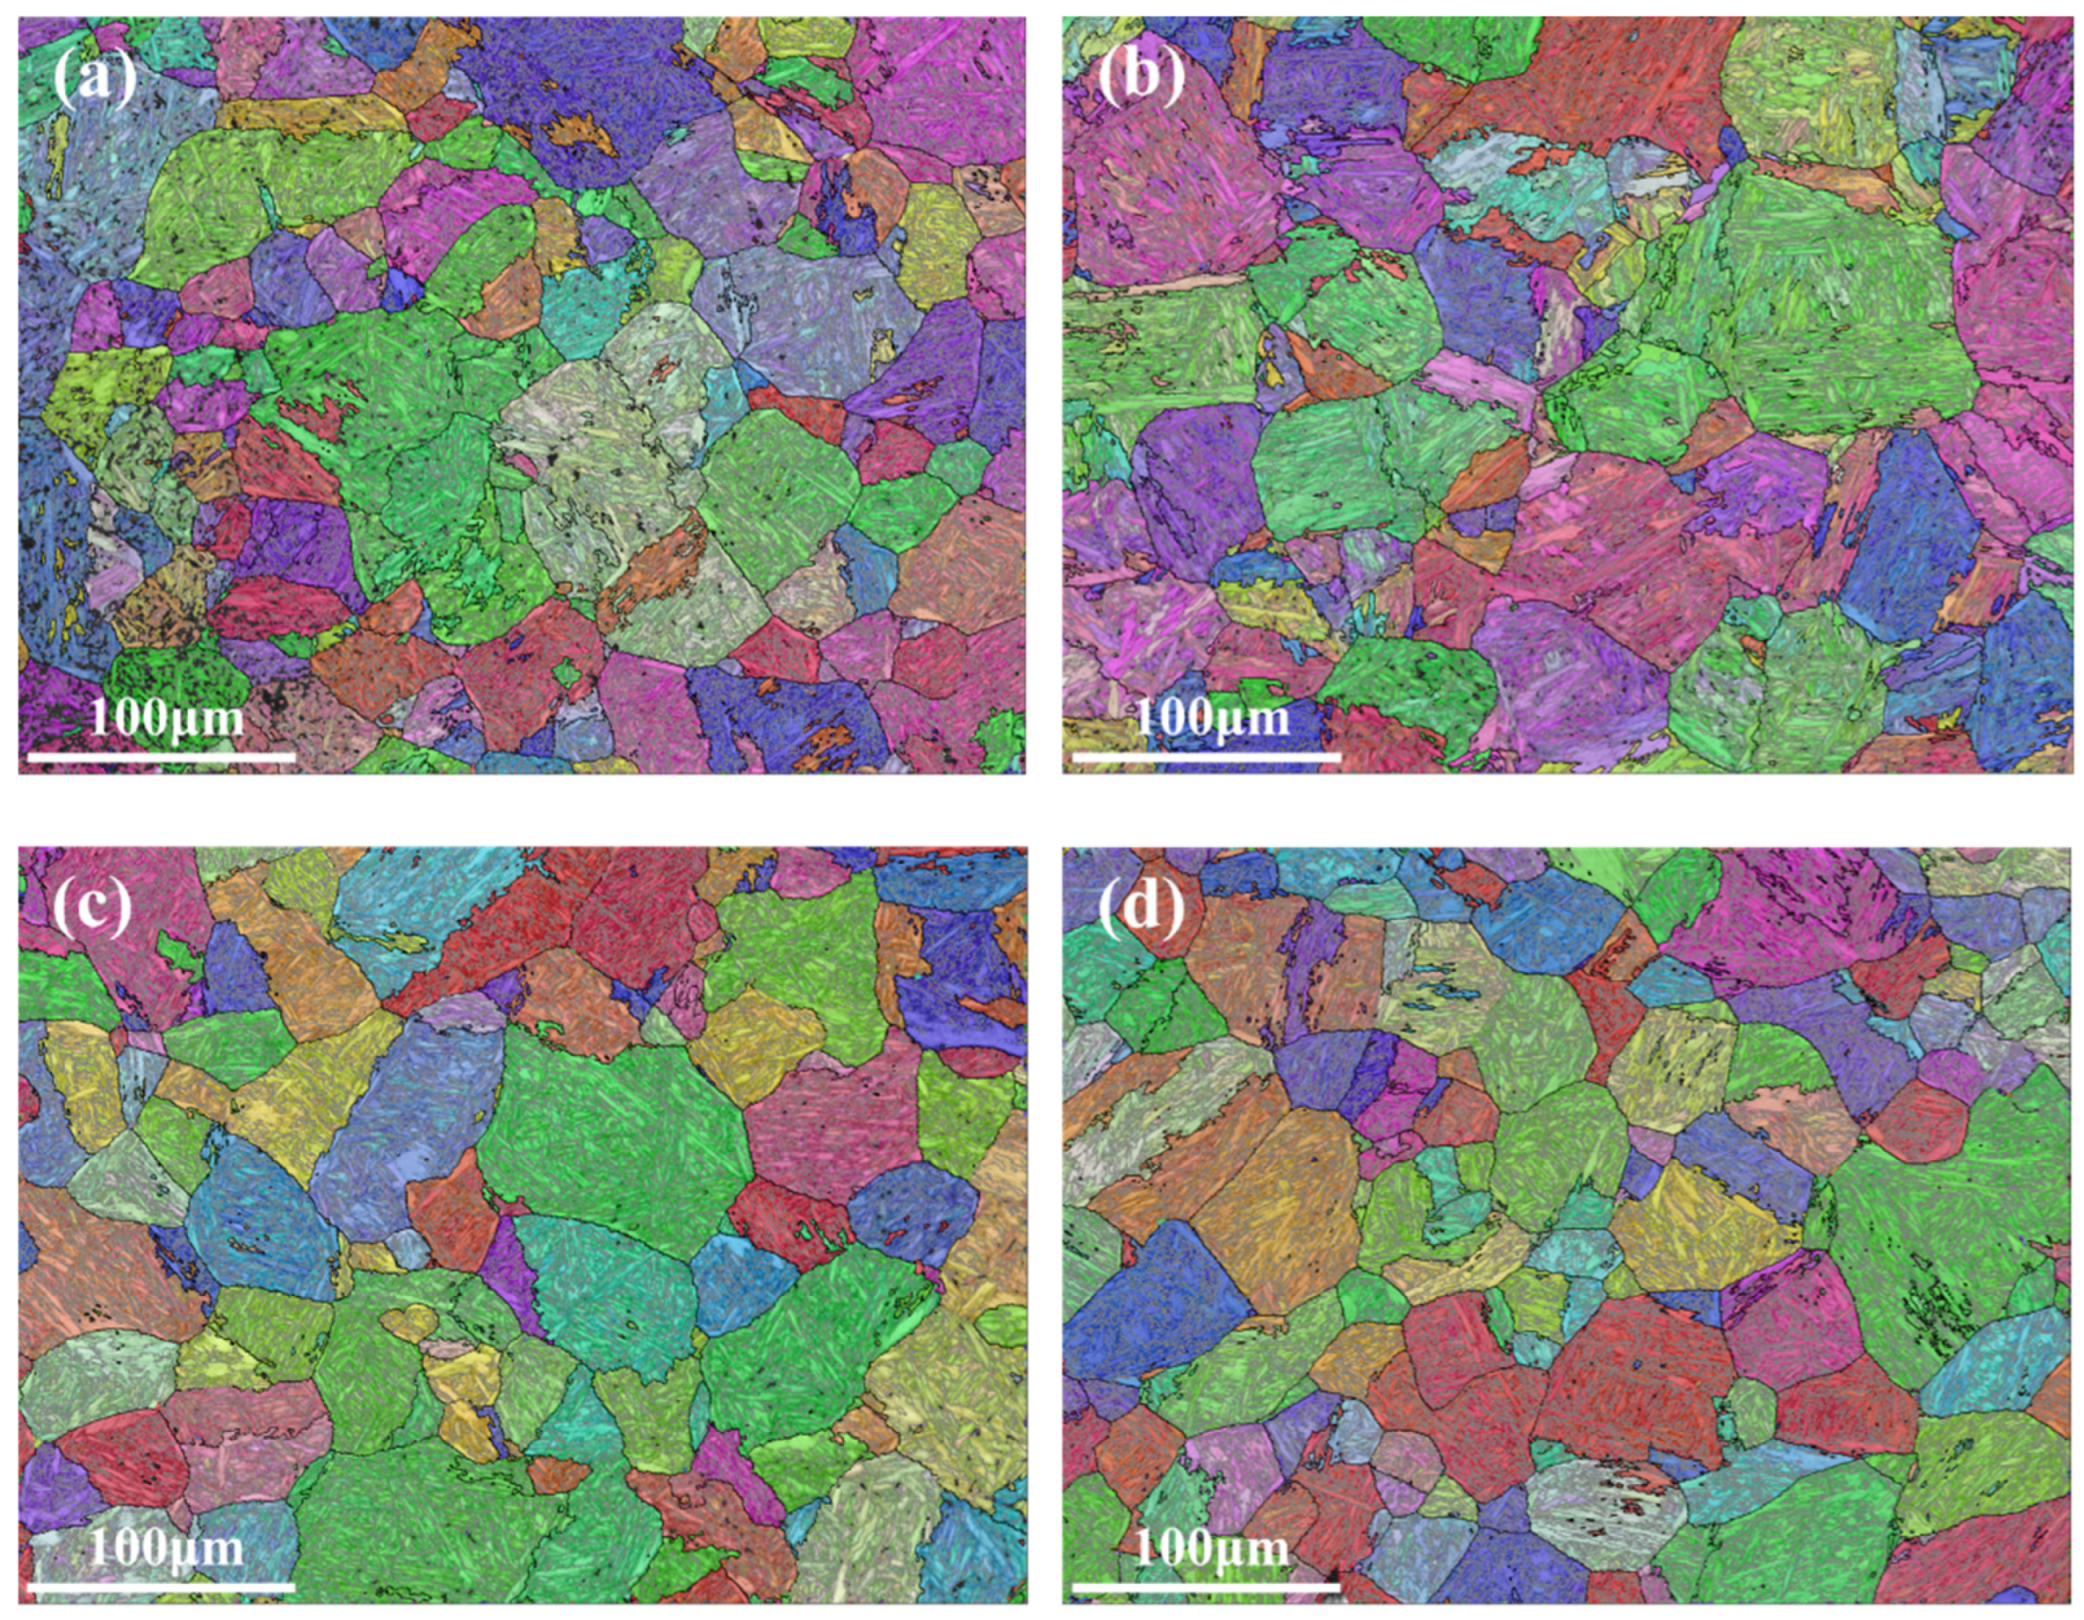
The samples deformed at 1180 °C with strain rates of 0.01 s−1, 0.1 s−1, 1 s−1 and 10 s−1 were sectioned along the maximum cross-section and electrolytically polished using a perchloric acid–ethanol solution. The quenched microstructures were examined by EBSD, and the prior austenite grain structure was reconstructed from the martensitic microstructure. Microstructural evolution plays a decisive role in deformation process design. As shown in Figure 9, the recrystallized austenite grain size exhibits a strong dependence on the strain rate, which can be reasonably explained by the variation in the Zener–Hollomon parameter. At a constant deformation temperature, an increase in the strain rate leads to a significant rise in the Z parameter, corresponding to a higher temperature-compensated deformation rate and greater resistance to grain boundary movement. Under low-strain-rate conditions (0.01 s−1 and 0.1 s−1), the corresponding Z values are low, providing sufficient deformation time and thermal energy for dynamic recrystallization (DRX) to proceed. Consequently, fully recrystallized, equiaxed, and uniformly distributed austenite grains are formed, indicating that grain growth via grain boundary movement is not significantly restricted. In contrast, at higher strain rates (1 s−1 and 10 s−1), the Z parameter increases, resulting in a refined grain structure and the appearance of sub-grain features. This behavior reflects a decrease in the time available for recrystallized grain growth under high-Z conditions. The observed inverse relationship between recrystallized grain size and the Zener–Hollomon parameter is consistent with classical dynamic recrystallization theory, where a higher Z value promotes higher recrystallization nucleation density while inhibiting grain growth. Therefore, the microstructure evolves toward finer but less homogeneous grains at high strain rates, whereas low-Z conditions favor grain coarsening and improved homogeneity.
Figure 9.
Austenite recrystallized grains under different deformation temperatures: (a) 0.01 s−1, (b) 0.1 s−1, (c) 1 s−1, and (d) 10 s−1.
The relatively high Cr and Ni contents in the 25Cr2Ni2MoV alloy enhance austenite stability and may promote deformation twinning, thereby influencing the recrystallization mechanism. In addition, Mo and V, as carbide-forming elements, exhibit high solubility at 1180 °C and therefore exert a relatively weak pinning effect on grain boundary movement. Consequently, the influence of alloying elements on recrystallization is mainly reflected in austenite stability rather than direct inhibition of grain boundary movement.
In addition to deformation parameters, alloying elements also influence recrystallization kinetics. The high Cr and Ni content in the alloy enhances the stability of austenite, which may promote twinning and subsequently influence the recrystallization mechanism. Mo and V are elements that can easily form carbides, and the solid solution of Mo and V atoms will delay the movement of grain boundaries, thus affecting the growth stage of recrystallized grains. Furthermore, fine precipitates containing Mo and V may partially dissolve during deformation and re-precipitate during cooling, producing a pinning effect on grain boundaries and further influencing recrystallization kinetics.
3.6. Hot Processing Map
The deformation behavior of materials is influenced by multiple factors. By determining material parameters during hot deformation and analyzing the corresponding data, appropriate processing conditions can be established to avoid defects such as flow instability. A hot processing map is a graphical representation that describes the relationships between microstructural evolution and material properties within a specific temperature range. It serves as an important tool for determining deformation parameters during hot working by identifying and avoiding unstable regions indicated on the map [31].
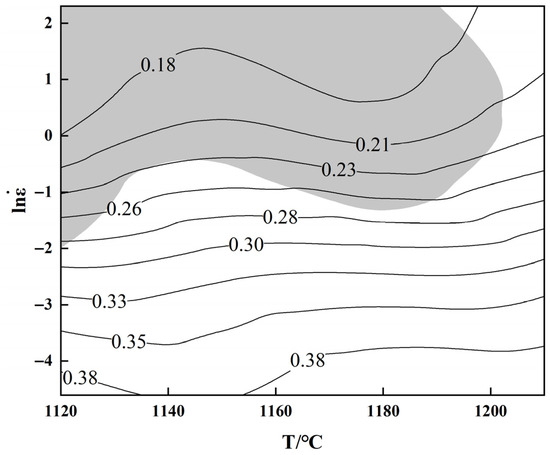
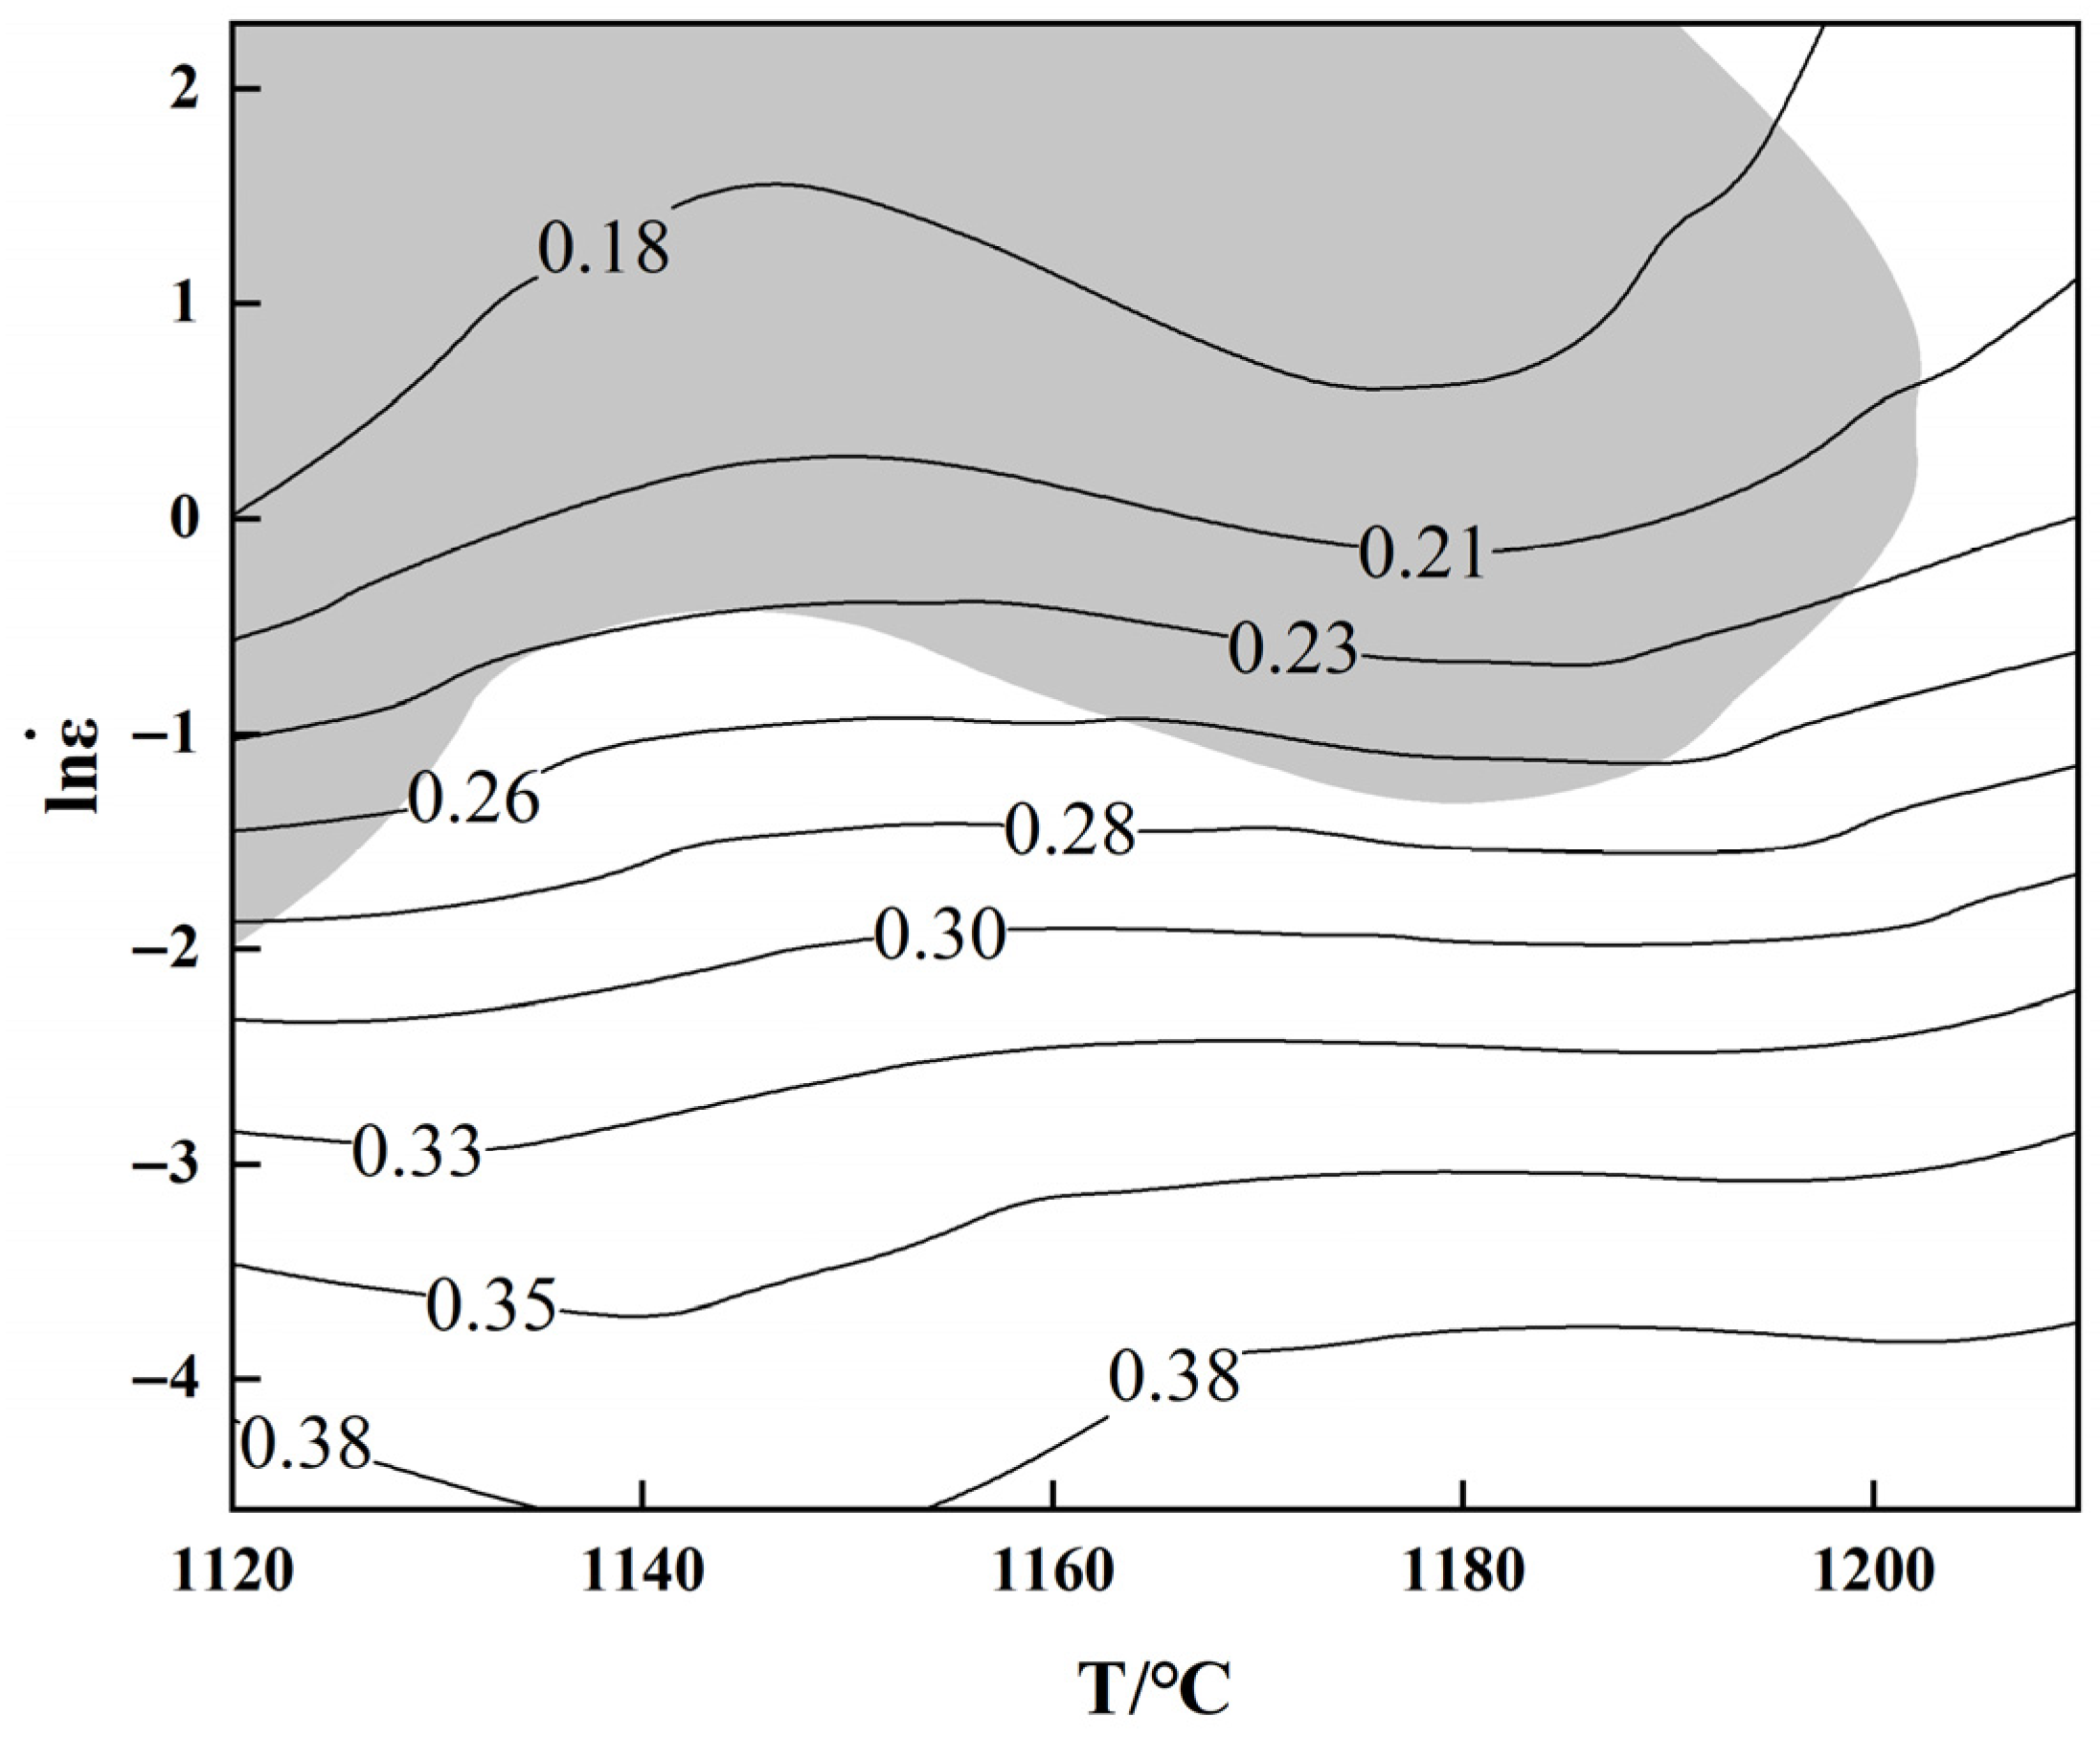
Figure 10 shows the hot processing map of the alloy at a true strain of 0.5. The contour lines in the map represent the power dissipation efficiency only, while the shaded areas indicate the flow-unstable regions determined by the unstable criterion. The unstable regions identified in the processing map are mainly located within the range of high strain rates (0.37–10 s−1) and relatively low temperatures (1120–1160 °C). Under such conditions, deformation is prone to strain localization, with limited time available for atomic diffusion and grain boundary movement, which inhibits dynamic recrystallization and results in deformation dominated by dynamic recovery. In such unstable regions, the imbalance between work hardening and dynamic softening leads to inhomogeneous overall deformation of the material. This localized deformation is usually associated with microstructural inhomogeneity, characterized by partially recrystallized regions, sub grain structures, and the coexistence of locally refined grains with coarse unrecrystallized grains. These features are consistent with the EBSD observations at high strain rates, which clearly indicate incomplete recrystallization and heterogeneous grain structures. The stable regions in the processing map are located within the range of lower strain rates (<0.37 s−1) and higher temperatures (1160–1200 °C), showing relatively high dissipation efficiency (η > 0.3). This indicates that deformation in these regions is dominated by dynamic recrystallization. Under these conditions, sufficient thermal activation and deformation time promote uniform nucleation and growth of recrystallized grains, effectively inhibiting strain localization and ensuring uniform microstructural evolution. Therefore, these conditions are recommended as the optimal hot processing window for industrial forging operations.
Figure 10.
Hot processing map at a true strain of 0.5.
From a practical perspective, deformation within the unstable region is not desirable for industrial forging of large 25Cr2Ni2MoV steel. Microstructural heterogeneity may increase the risk of surface cracking and internal defects, which would reduce the mechanical reliability of large forgings. In addition, such defects are difficult to completely eliminate through subsequent heat treatment, thus raising production risks and costs. It is worth noting that the hot processing map in this study was established under isothermal conditions at a true strain of 0.5, while actual industrial forging involves non-isothermal, multi-pass deformation. A true strain of 0.5 represents the cumulative equivalent strain within multiple passes in industrial production. In addition, considering the unavoidable temperature drop during actual forging, it is beneficial to start the deformation from the peak temperature in the stable zone to keep the subsequent deformation within the temperature range of recrystallization Therefore, although the proposed deformation window is derived from isothermal experiments, it can still provide effective guidance for practical industrial production.
4. Conclusions
(1) After the application of friction and adiabatic temperature rise corrections, the influences of friction and heat accumulation on flow stress were eliminated. The corrected curves all exhibit single-peak characteristics, indicating that dynamic recrystallization (DRX) serves as the main softening mechanism within the investigated temperature and strain rate ranges. The flow stress demonstrates negative temperature sensitivity and positive strain rate sensitivity.
(2) Based on the corrected peak stress data, a hyperbolic sine Arrhenius-type constitutive equation was established. The calculated activation energy for hot deformation is 371.319 kJ·mol−1, which is higher than that of some cast steels. The model based on the Zener–Hollomon parameter predicts peak stress with an error of less than 5%, indicating that this constitutive model possesses high predictive accuracy.
(3) EBSD analysis reveals that the recrystallization mechanism exhibits significant strain rate dependence. Under low-strain-rate conditions (0.01–0.1 s−1), the material has sufficient dynamic recrystallization, resulting in a microstructure with relatively good grain homogeneity. Conversely, at high strain rates (≥1 s−1), recrystallization is inhibited, leading to a heterogeneous microstructure characterized by the coexistence of fine and coarse grains.
(4) The hot processing map indicates that, at a true strain of 0.5, flow-unstable regions are primarily distributed within the ranges of relatively low temperatures (1120–1160 °C) and high strain rates (0.37–10 s−1). Under conditions of high temperatures (1160–1200 °C) and low strain rates (<0.37 s−1), a stable microstructure could be obtained. Considering the characteristics of industrial multi-pass, non-isothermal forging processes, it is recommended that this stable region be adopted as the preferred hot working window for large 25Cr2Ni2MoV rotor forgings.
Author Contributions
Conceptualization, Y.W. and Y.D.; methodology, Y.D.; software, Y.W.; validation, Y.W., Y.D., and Z.J.; formal analysis, Z.J.; investigation, Y.W.; resources, Y.D., Z.J., and L.M.; data curation, Y.W. and Y.D.; writing—original draft preparation, Y.W.; writing—review and editing, L.M. and G.S.; visualization, Y.D.; supervision, G.S.; project administration, Y.D. and L.M.; funding acquisition, Y.D. and Z.J. All authors have read and agreed to the published version of the manuscript.
Funding
The authors acknowledge the financial support from the National Key R&D Program of China (Grant No. 2023YFE0200300), the National Natural Science Foundation of China (Grant No. 52174303), and the Program of Introducing Talents of Discipline to Universities (Grant No. B21001).
Data Availability Statement
The original contributions presented in this study are included in the article. Further inquiries can be directed to the corresponding author.
Conflicts of Interest
Authors Lev Medovar and Ganna Stovpchenko were employed by the company ELMET-ROLL Sp. Z.O.O. The remaining authors declare that the research was conducted in the absence of any commercial or financial relationships that could be construed as a potential conflict of interest.
References
- Liang, Z.; Wang, J.; Li, H.; Zhang, X.; Liu, C.; Sun, D.; Yang, Z.; Zhang, F. Microstructure evolution of V-containing low carbon ultra-fine bainitic steel during medium-temperature tempering and strengthening-toughening mechanism. Mater. Sci. Eng. A 2024, 901, 146566. [Google Scholar] [CrossRef] [Scilit]
- Yang, J.; Su, Z.; Sui, F. Analysis on hot deformation and following cooling technology of 25Cr2Ni4MoVA steel. J. Iron Steel Res. Int. 2021, 28, 1305–1314. [Google Scholar] [CrossRef] [Scilit]
- Fu, Q.; Lei, M.; Li, B.; Zhang, M.; Song, H.; Guan, R. Hot deformation behavior, processing map and dynamic recrystallization mechanisms of Cu–Te alloy. Mater. Charact. 2025, 230, 115765. [Google Scholar] [CrossRef] [Scilit]
- Huo, X.; Liu, X. Microstructure and Hardness Investigation on 25Cr2Ni2MoV Steel Welding Joint of Nuclear Power Steam Turbine Low Pressure Welded Rotor and Engineering Applications. In Proceedings of the 2022 29th International Conference on Nuclear Engineering. Volume 10: Advanced Methods of Manufacturing for Nuclear Reactors and Components, Online, 8–12 August 2022. [Google Scholar]
- Ye, L.; Zhai, Y.; Zhou, L.; Wang, H.; Jiang, P. The hot deformation behavior and 3D processing maps of 25Cr2Ni4MoV steel for a super-large nuclear-power rotor. J. Manuf. Process. 2020, 59, 535–544. [Google Scholar] [CrossRef] [Scilit]
- Li, S.; Sun, M.; Liu, H.; Li, D. Study on void healing behavior during forging process for 25Cr2Ni4MoV steel. Acta Met. 2011, 47, 946–953. [Google Scholar]
- Zhou, P.; Ma, Q.; Luo, J. Hot Deformation Behavior of As-Cast 30Cr2Ni4MoV Steel Using Processing Maps. Metals 2017, 7, 50. [Google Scholar] [CrossRef] [Scilit]
- Luo, J.; Zhao, J.; Yang, Z.; Jin, Y.; Zhang, C. Microstructure prediction of multi-directional forging for 30Cr2Ni4MoV steel by the secondary development of Deform software and BP neural network. Int. J. Adv. Manuf. Technol. 2022, 119, 2971–2984. [Google Scholar] [CrossRef] [Scilit]
- Wu, C.; Han, S. Hot Deformation Behavior and Dynamic Recrystallization Characteristics in a Low-Alloy High-Strength Ni–Cr–Mo–V Steel. Acta Metall. Sin. (Engl. Lett.) 2018, 31, 963–974. [Google Scholar] [CrossRef] [Scilit]
- Mandal, S.; Rakesh, V.; Sivaprasad, P.; Venugopal, S.; Kasiviswanathan, K. Constitutive equations to predict high temperature flow stress in a Ti-modified austenitic stainless steel. Mater. Sci. Eng. A 2009, 500, 114–121. [Google Scholar] [CrossRef] [Scilit]
- Frost, H.J.; Ashby, M.F. Deformation-Mechanism Maps: The Plasticity and Creep of Metals and Ceramics; Franklin Book Company: Dallas, TX, USA, 1982. [Google Scholar]
- Prasad, Y.V.R.K.; Gegel, H.L.; Doraivelu, S.M.; Malas, J.C.; Morgan, J.T.; Lark, K.A.; Barker, D.R. Modeling of dynamic material behavior in hot deformation: Forging of Ti-6242. Metall. Trans. A 1984, 15, 1883–1892. [Google Scholar] [CrossRef] [Scilit]
- Murty, S.N.; Rao, B.N. Ziegler’s criterion on the unstable regions in processing maps. J. Mater. Sci. Lett. 1998, 17, 1203–1205. [Google Scholar] [CrossRef] [Scilit]
- Mohamadizadeh, A.; Zarei-Hanzaki, A.; Abedi, H.; Mehtonen, S.; Porter, D. Hot deformation characterization of duplex low-density steel through 3D processing map development. Mater. Charact. 2015, 107, 293–301. [Google Scholar] [CrossRef] [Scilit]
- Ji, G.; Li, F.; Li, Q.; Li, H.; Li, Z. Development and validation of a processing map for Aermet100 steel. Mater. Sci. Eng. A 2010, 527, 1165–1171. [Google Scholar] [CrossRef] [Scilit]
- Wang, S.; Hou, L.G.; Luo, J.R.; Zhang, J.S.; Zhuang, L.Z. Characterization of hot workability in AA 7050 aluminum alloy using activation energy and 3-D processing map. J. Mater. Process. Technol. 2015, 225, 110–121. [Google Scholar] [CrossRef] [Scilit]
- Pu, E.; Zheng, W.; Xiang, J.; Song, Z.; Li, J. Hot deformation characteristic and processing map of superaustenitic stainless steel S32654. Mater. Sci. Eng. A 2014, 598, 174–182. [Google Scholar] [CrossRef] [Scilit]
- Hadadzadeh, A.; Wells, M.A. Analysis of the hot deformation of ZK60 magnesium alloy. J. Magnes. Alloys 2017, 5, 369–387. [Google Scholar] [CrossRef] [Scilit]
- Wang, D.; Zhu, Q.; Wei, Z.; Lin, B.; Jing, Y.; Shi, Y.; Misra, R.; Li, J. Hot deformation behaviors of AZ91 magnesium alloy: Constitutive equation, ANN-based prediction, processing map and microstructure evolution. J. Alloys Compd. 2022, 908, 164580. [Google Scholar] [CrossRef] [Scilit]
- Li, H.Z.; Wang, H.J.; Liang, X.P.; Liu, H.T.; Liu, Y.; Zhang, X.M. Hot deformation and processing map of 2519A aluminum alloy. Mater. Sci. Eng. A 2011, 528, 1548–1552. [Google Scholar] [CrossRef] [Scilit]
- Mohammadi, H.; Eivani, A.; Seyedein, S.; Ghosh, M.; Jafarian, H. An investigation of hot deformation behavior of Zn–22Al alloy and development of its processing maps during isothermal compression. J. Mater. Res. Technol. 2021, 14, 507–520. [Google Scholar] [CrossRef] [Scilit]
- Cui, S.; Lin, P.; Xu, W.; Gu, G.C.; Shi, C.X.; Lu, Y.P. Mechanisms of recrystallization and microstructure evolution during hot deformation of 550 MPa grade HSLA steel. Mater. Sci. Eng. A 2026, 951, 149579. [Google Scholar] [CrossRef] [Scilit]
- Dong, C.; Zhao, X. Dynamic recrystallization behavior and microstructure evolution of high-strength low-alloy steel during hot deformation. J. Mater. Res. Technol. 2023, 25, 6087–6098. [Google Scholar] [CrossRef] [Scilit]
- Zhang, Y.; Sun, H.-L.; Volinsky, A.A.; Tian, B.-H.; Chai, Z.; Liu, P.; Liu, Y. Characterization of the Hot Deformation Behavior of Cu–Cr–Zr Alloy by Processing Maps. Acta Metall. Sin. (Engl. Lett.) 2016, 29, 422–430. [Google Scholar] [CrossRef] [Scilit]
- Sakai, T.; Belyakov, A.; Kaibyshev, R.; Miura, H.; Jonas, J.J. Dynamic and post-dynamic recrystallization under hot, cold and severe plastic deformation conditions. Prog. Mater. Sci. 2014, 60, 130–207. [Google Scholar] [CrossRef] [Scilit]
- Kong, F.; Cui, N.; Chen, Y.; Wang, X.; Xiong, N. Characterization of hot deformation behavior of as-forged TiAl alloy. Intermetallics 2014, 55, 66–72. [Google Scholar] [CrossRef] [Scilit]
- Ebrahimi, R.; Najafizadeh, A. A new method for evaluation of friction in bulk metal forming. J. Mater. Process. Technol. 2004, 152, 136–143. [Google Scholar] [CrossRef] [Scilit]
- Zhu, R.; Liu, Q.; Li, J.; Chen, Y.-L.; Zhang, X.-H.; Zheng, Z.-Q. Flow curve correction and processing map of 2050 Al–Li alloy. Trans. Nonferrous Met. Soc. China 2018, 28, 404–414. [Google Scholar] [CrossRef] [Scilit]
- Zhang, E.; Ge, Y.; Qin, G. Hot deformation behavior of an antibacterial Co–29Cr–6Mo–1.8 Cu alloy and its effect on mechanical property and corrosion resistance. J. Mater. Sci. Technol. 2018, 34, 523–533. [Google Scholar] [CrossRef] [Scilit]
- Zener, C.; Hollomon, J.H. Effect of Strain Rate Upon Plastic Flow of Steel. J. Appl. Phys. 1944, 15, 22–32. [Google Scholar] [CrossRef] [Scilit]
- Xu, X.; Zhang, P.; Fang, J.; Wen, L.; Yang, Y.; Zhao, Y.; Chen, L. The hot deformation behavior and processing map analysis of a high-nitrogen austenitic stainless steel. J. Mater. Res. Technol. 2024, 33, 1359–1365. [Google Scholar] [CrossRef] [Scilit]

Disclaimer/Publisher’s Note: The statements, opinions and data contained in all publications are solely those of the individual author(s) and contributor(s) and not of MDPI and/or the editor(s). MDPI and/or the editor(s) disclaim responsibility for any injury to people or property resulting from any ideas, methods, instructions or products referred to in the content. |
© 2026 by the authors. Licensee MDPI, Basel, Switzerland. This article is an open access article distributed under the terms and conditions of the Creative Commons Attribution (CC BY) license.