


Abstract
This study investigates microstructural and mechanical changes in automotive steel after a boriding process. Extended thermal exposure was analyzed to study the development of carbon diffusion zones (CDZs) and the resulting mechanical properties. Experimental results reveal the relationship between treatment conditions and carbon enrichment beneath the Fe2B phase. First, cylindrical samples were obtained from an automotive crankshaft. The samples were exposed to the boriding process at 900, 950, 1000, and 1050 °C for 2, 4, and 6 h. The results indicate a clear influence from the treatment conditions (temperature and time) on both the material microstructure and mechanical properties. Additionally, the carbon content of the steel was redistributed across the samples, reaching a maximum of 0.79% in the CDZ and a minimum of 0.55% in the core of the samples at short times and low temperatures. In contrast, at long times and high temperatures, the carbon concentration was homogeneous across the sample. Finally, the material microstructure and hardness exhibited behavior consistent with the carbon content as a function of the treatment conditions.
1. Introduction
The mechanical wear that automotive engine parts are exposed to, as well as the methods to avoid it, are highly relevant topics for research and development [1,2,3]. Of course, the easiest way to counteract this phenomenon is to provide an adequate lubrication system. However, enhancing surface properties becomes necessary when lubrication is suboptimal due to failure or when a lubrication system is not viable [4]. In this regard, several researchers have analyzed methods to enhance the surface properties of materials subject to wear, aiming to prevent or reduce wear of mechanical components. P.A. Ruiz-Trabolsi et al. [5] reported a considerable increase in the hardness and wear resistance of AISI 4140 steel by applying boriding treatment.
Additionally, in a previous work [4], it was demonstrated that the coefficient of friction of the crankshaft steel was reduced from 0.43 to 0.12 by boriding. It is a thermochemical process where a base metallic material (ferrous or non-ferrous) is exposed to a boron source, accompanied by an increase in temperature for a determined time. This process causes atomic boron to diffuse through the base material’s crystalline structure, forming intermetallic compounds on its surface. In ferrous alloys, two main phases form during processing: FeB and Fe2B, each with distinct mechanical properties. These phases appear as iron-boride layers at the surface, with the morphology depending mainly on the alloying elements present and the thermochemical process. Enhanced surface hardness, a reduced friction coefficient, and increased wear resistance are representative characteristics conferred by boriding to the base material.
The basis of the diffusion process during boriding in ferrous alloys is the increase in temperature to at least 700 °C and the achievement of an adequate concentration of boron on the surface [6]. Once the minimum temperature is reached (996.15 K, 0.8% C), the steel begins to transform into the austenitic phase. For hypoeutectoid steels, the transformation occurs above the A3 line, depending on the carbon composition. During gradual cooling, the austenite (γ) turns into structures such as proeutectoid ferrite (α) with a carbon content below 0.02%, cementite (Fe3C), and compound lamellar structures such as pearlite (eutectoid ferrite (α) + Fe3C). The austenitization and cooling temperatures determine the conformation and distribution of these structures [7,8].
After boriding, the material must cool slowly and be controlled within the furnace to avoid rapid cooling, which could cause subsequent layer cracking due to thermal stress. Therefore, the base material that has not been affected by boron diffusion is subjected to a thermal cycle equivalent to annealing. Normalizing, annealing, hardening, and tempering are examples of heat treatments widely used to control the mechanical properties of ferrous materials. Fadare D.A. et al. [9] reported the tensile strengths of annealed and untreated NST 37–2 steel (equivalent to AISI 1030) to be 325.42 and 343.80 N/mm2, respectively. A correct characterization of the resulting microstructure after the thermochemical process is essential for future applications in which the mechanical properties of iron boride layers and the subjacent material play a starring role. This study analyzes the effect of thermochemical treatment on the microstructure of automotive steel extracted directly from a crankshaft. First, cylindrical samples were obtained from an automotive crankshaft. The samples were metallographically prepared and exposed to the boriding process for 2, 4, and 6 h. For this study, four temperatures were selected to promote microstructural reorganization: 900, 950, 1000, and 1050 °C.
2. Materials and Methods
2.1. Sample Preparation
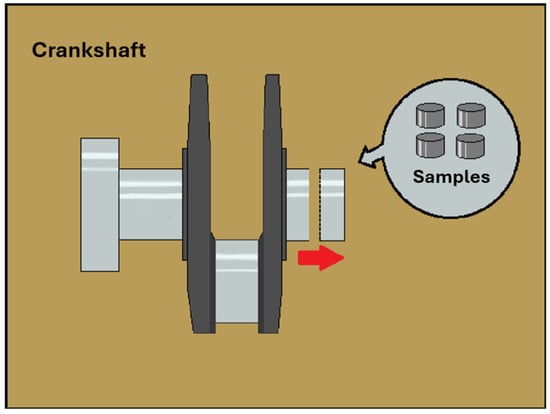
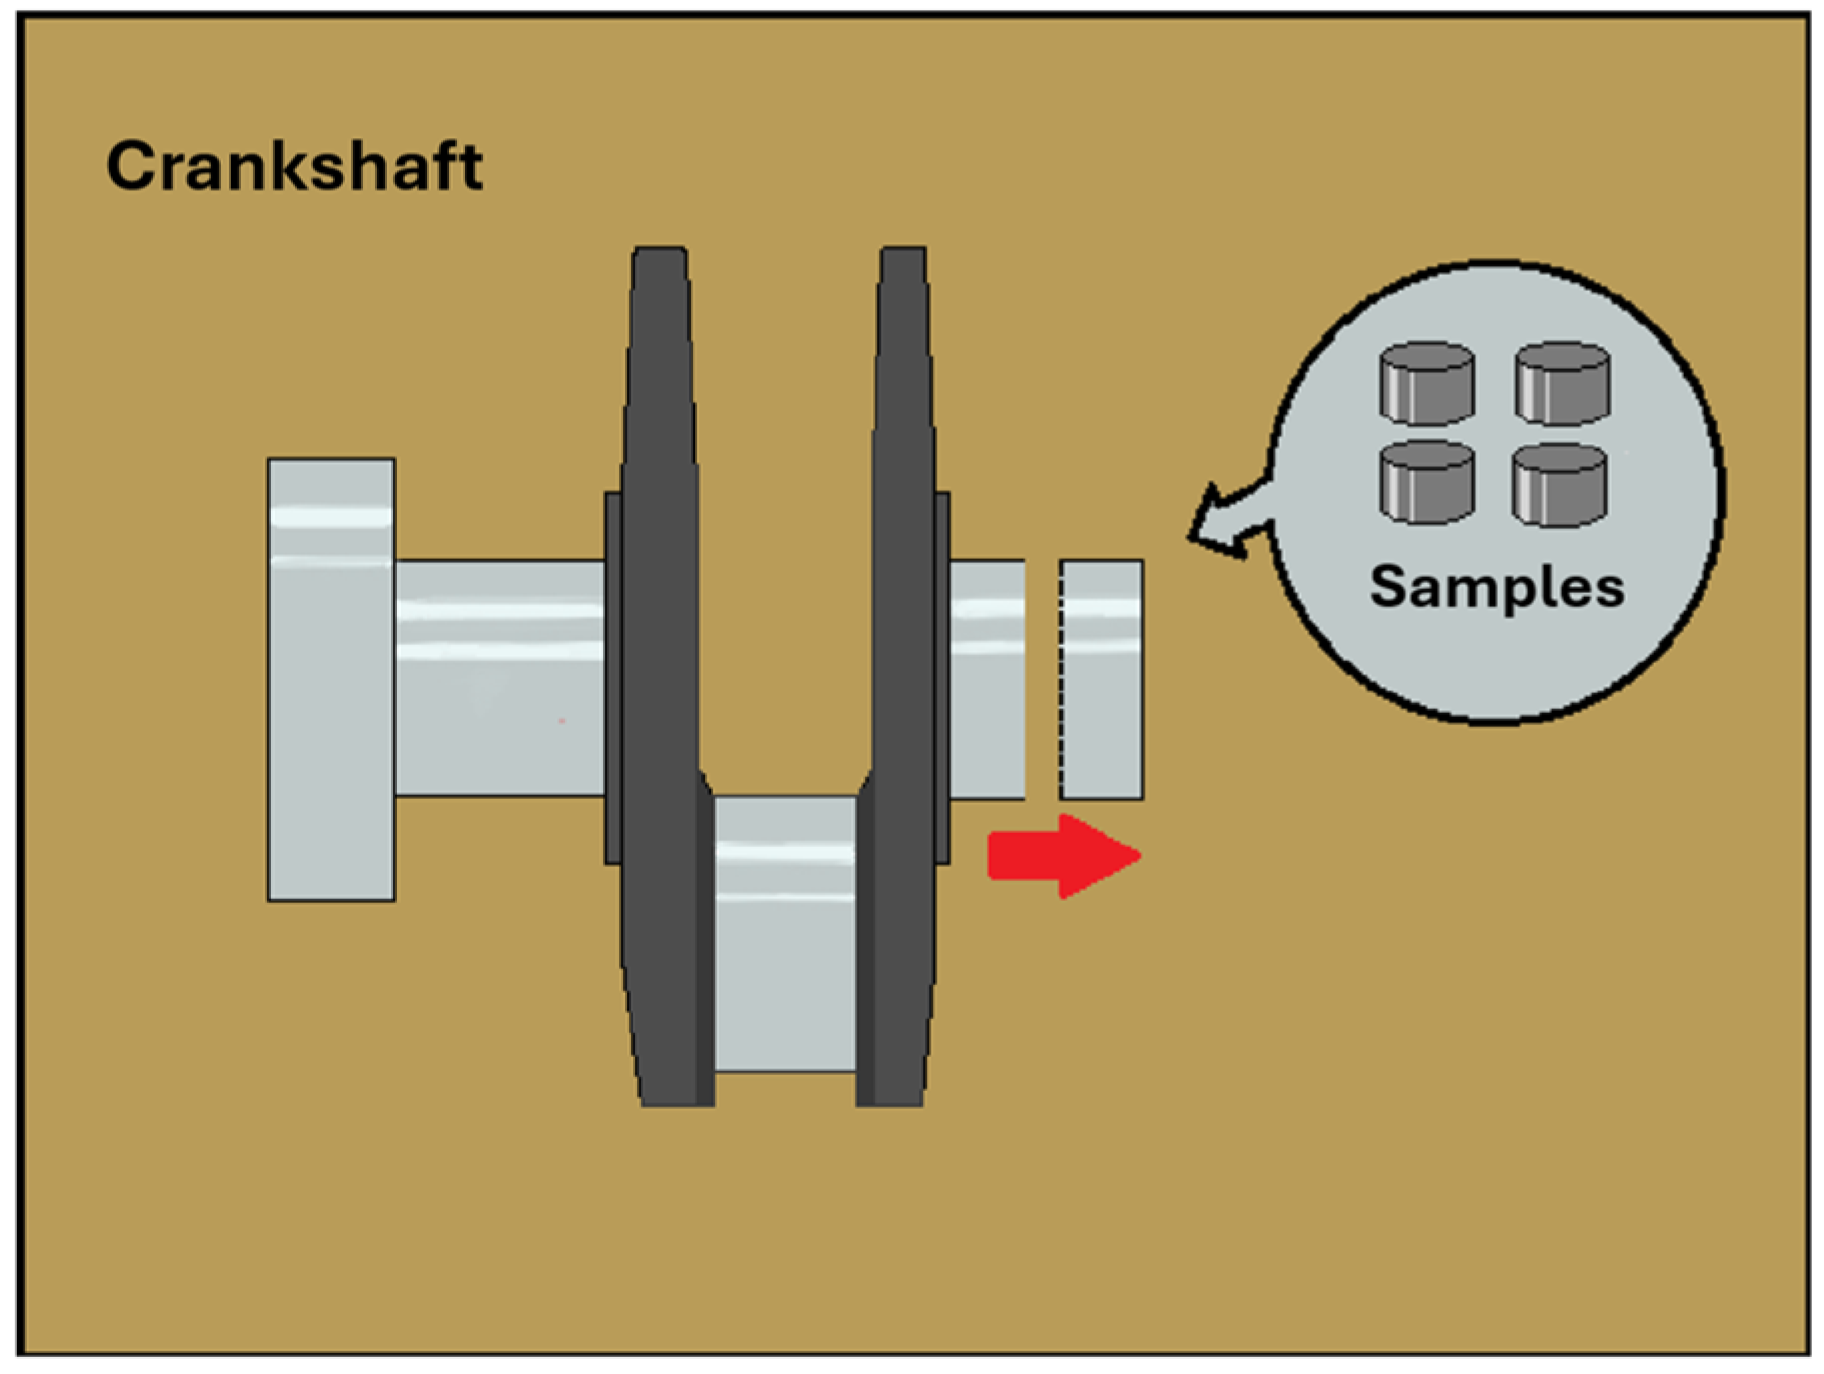
Samples with a cylindrical shape 10 mm in diameter and 5 mm in length were extracted directly from a worn crankshaft by cutting with a low-speed abrasive wheel under continuous cooling to minimize overheating and avoid microstructural alterations. After the extraction, the specimens were machined via turning (See Figure 1).
Figure 1.
Schematic representation of the extraction process of the samples from the crankshaft.
The crankshaft from which the steel was obtained had been worn under conditions of poor lubrication in the connecting rod journal (crankpin). The surface of this part was sufficiently worn to make movement impossible. The samples were extracted from the connecting rod journals that remained unworn. This piece was used instead of a new one to improve the steel’s tribological characteristics, as reported in a previous work [4]. This study used the same steel to investigate the applications of boriding in mechanical components subjected to mechanical stresses, focusing on the effects of boriding on the microstructure beneath the iron boride layer.
Thirteen samples were prepared using a conventional metallographic technique with up to 1000-mesh SiC paper (EXTEC CORPORATION, Enfield, CT, USA) to ensure a flat, smooth surface during the thermochemical process. After the metallographic process, the samples were cleaned in an ultrasonic bath for 5 min in a mixture of ethanol and distilled water (50/50). Previous studies described the chemical composition of steel [4].
The samples were then packed into 304 stainless steel crucibles, with boron powder (Hef-Durferrit; DURFERRIT, GmbH, Mannheim, Germany) as the boron source. The chemical composition of the powder was 5% B4C as the boron source, 5% KBF4 as an activator, and 90% SiC as a thermal diluent. During packing, the samples were covered with a 15-mm-thick layer of boron powder in each direction to prevent oxidation during the boriding process [10]. This preparation was the same for all the samples. Four treatments were carried out at 900, 950, 1000, and 1050 °C for 2, 4, and 6 h each. One sample remained as extracted from the crankshaft, untreated, and used as a control. The temperature and time conditions were selected to cover a representative range of thermal conditions, ensure formation of the austenitic phase in the substrate, and promote microstructural reorganization into a homogeneous face-centered cubic (austenite-γ) structure [11].
2.2. Microstructure
After the thermochemical process, the treated samples were cooled to room temperature inside the furnace to avoid rapid cooling, which could cause subsequent layer cracking due to thermal stresses on the Fe2B [12]. The 12 samples were cross-sectioned and processed using a standard metallographic technique with up to 1200-mesh SiC paper to ensure a flat surface. After the metallographic procedure, the samples were polished with a colloidal silica suspension (Buehler, Lake Bluff, IL, USA) to eliminate surface alterations that could distort the material’s microstructure during microscopy. A chemical etching was performed with 4% nital (96% ethyl alcohol and 4% nitric acid) for 5 s. The microstructure was observed via scanning electron microscopy (SEM) ((JSM−6360LV, JEOL, JEOL Ltd., Akishima, Japan), and light microscopy (OM) (GX−51, Olympus, Center Valley, PA, USA) to identify changes in the distribution of ferrite-α and pearlite resulting from the austenitization during the thermochemical process, compared with the control sample. In previous publications [4], the formation of the Fe2B phase in this steel was confirmed under these conditions.
2.3. Mechanical Characterization
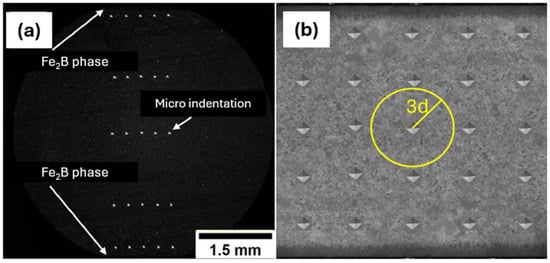
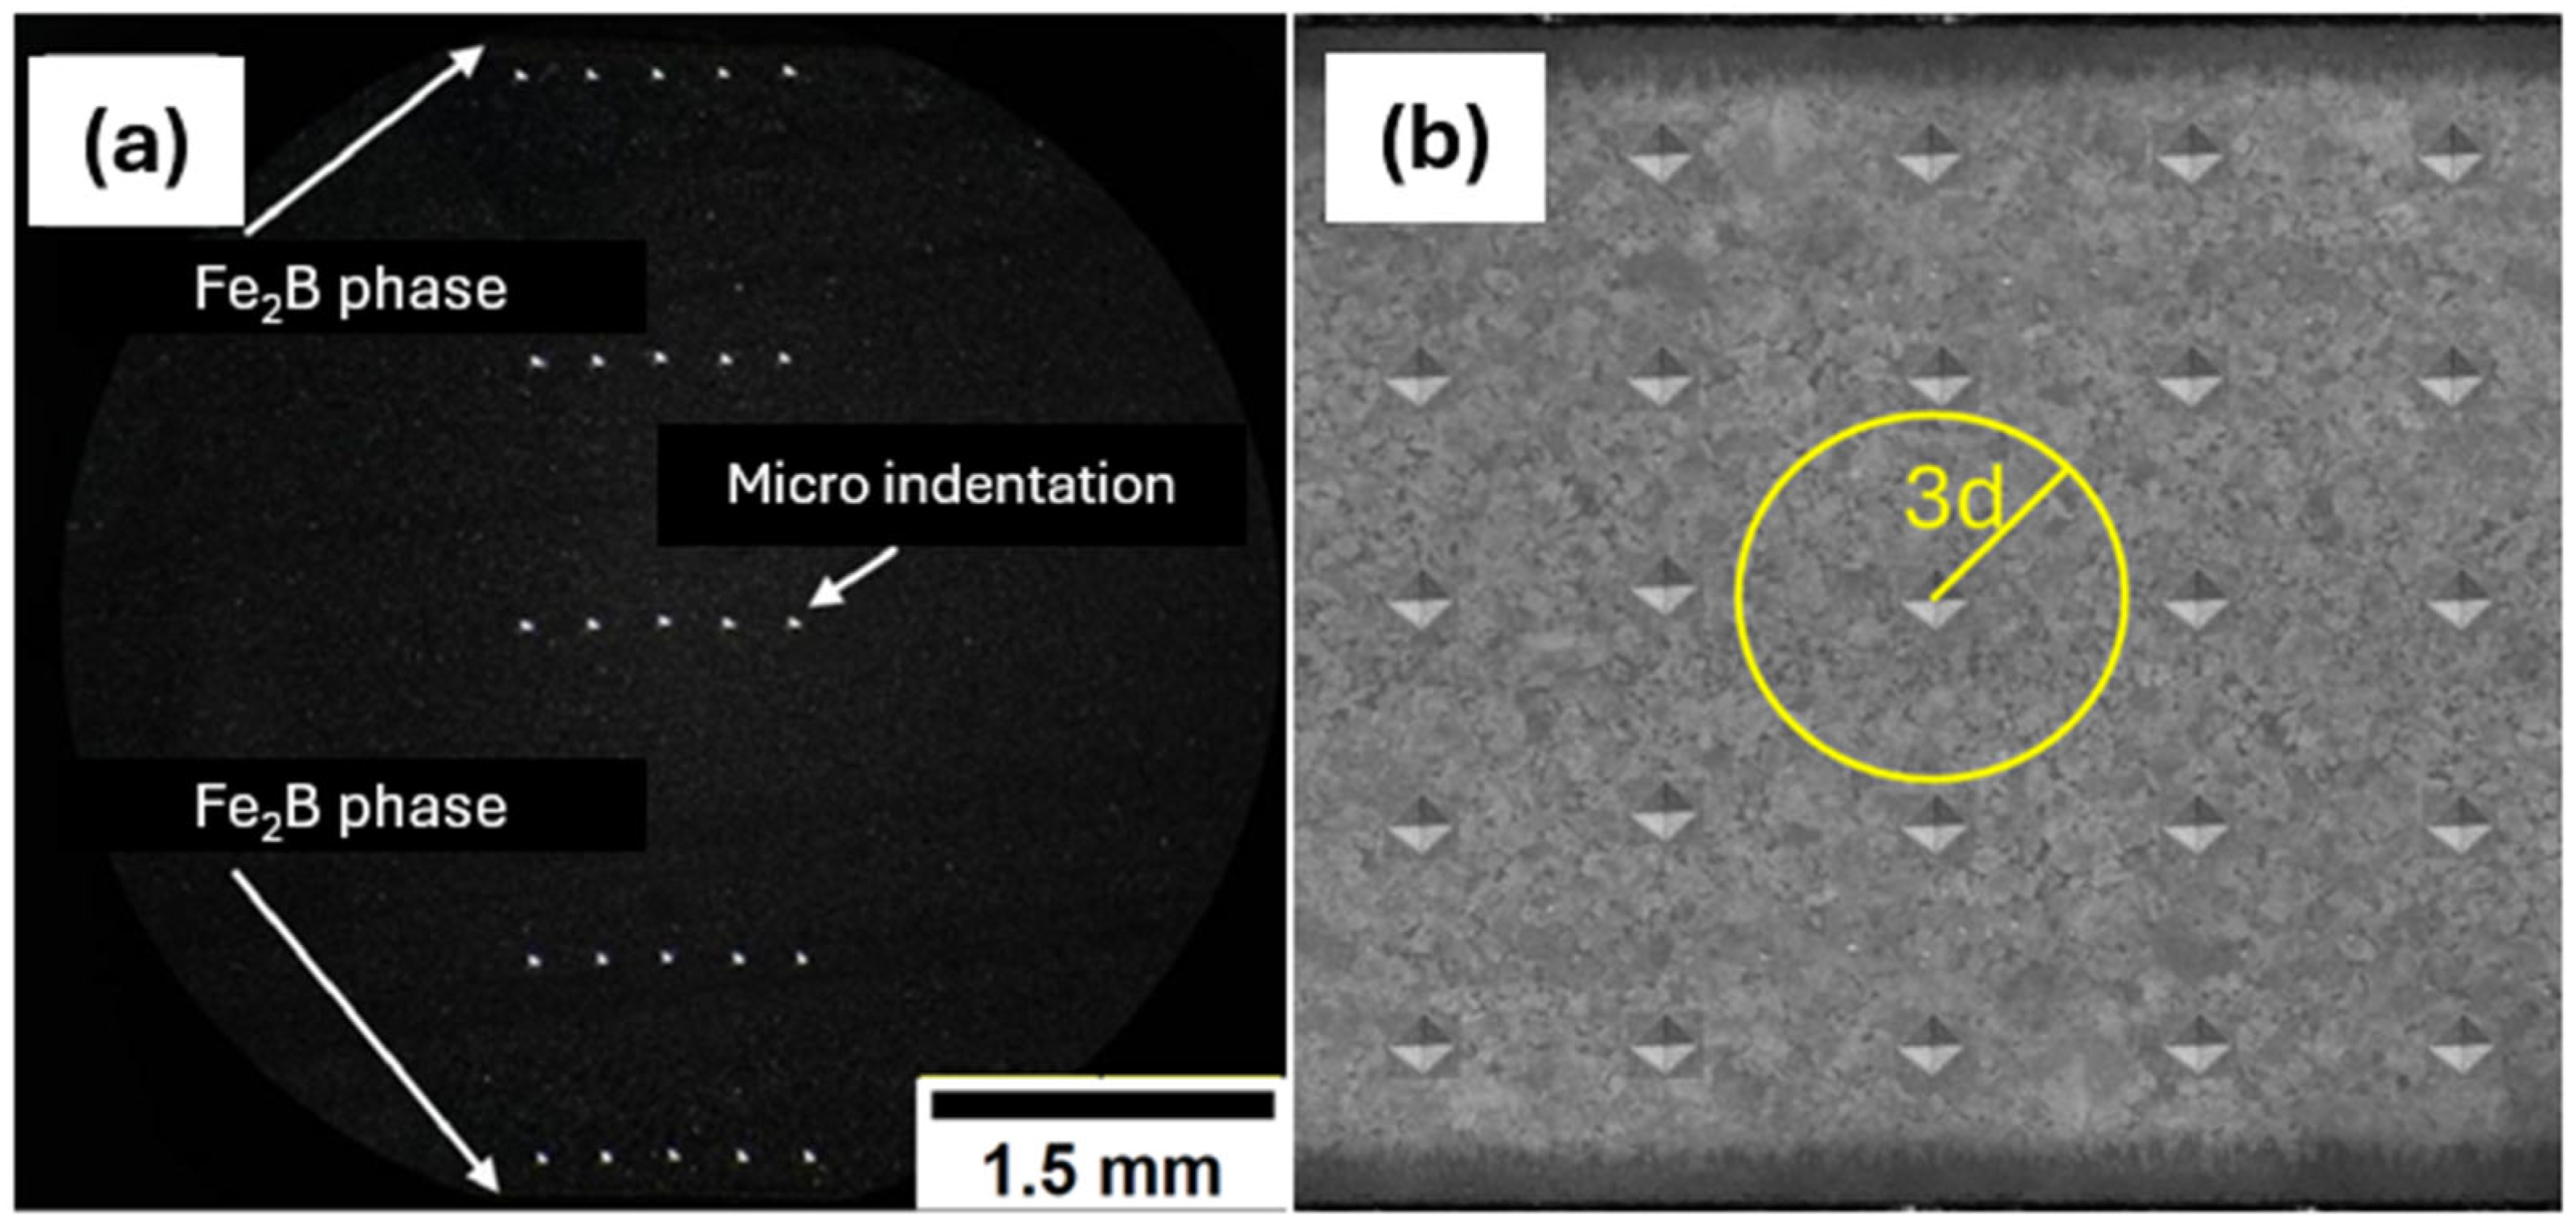
The hardness of the microstructure was measured using the Vickers method according to ASTM E384 [13] using a microhardness tester (CMS Metrology, Tlalnepantla de Baz, México). To obtain significant microhardness values, each microindentation must cover an area where ferritic phases and pearlite are tested simultaneously, since these two structures exhibit different microhardness characteristics [14]. To ensure a large analysis area for each indentation, a load of 1 kgf was applied, spanning the sample from just below the iron boride layer on one side to the zone below the opposite layer, with 5 microindentations. This method was performed 5 times, yielding 25 microindentations per sample, as schematized in Figure 2.
Figure 2.
(a) Micrograph obtained with optical microscopy of Vickers profiles of a sample treated for 6 h at 1000 °C (the white arrows indicate the location of the boride layers and the Vickers microindentations). (b) Schematic image of the microindentation distribution according to the ASTM E384 standard (the yellow circle indicates the spacing between indentations) Adapted from [13].
Then, the average microhardness was calculated using Vickers’ mathematical model (Equation (1)) for 5 microindentations at the same distance from the surface, yielding 5 microhardness profiles at different distances from the surface [13]. This method was applied to the 12 treated samples and to the non-treated sample:
2.4. Carbon Content
To estimate the carbon content, 5 micrographs were taken from the zone just below the Fe2B phase, along with 5 micrographs from the center of the samples. For each set, the micrographs were taken at the same distance from the surface. We also took another set of 5 images from the control sample.
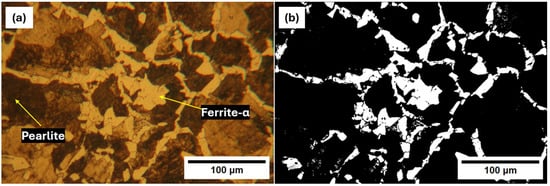
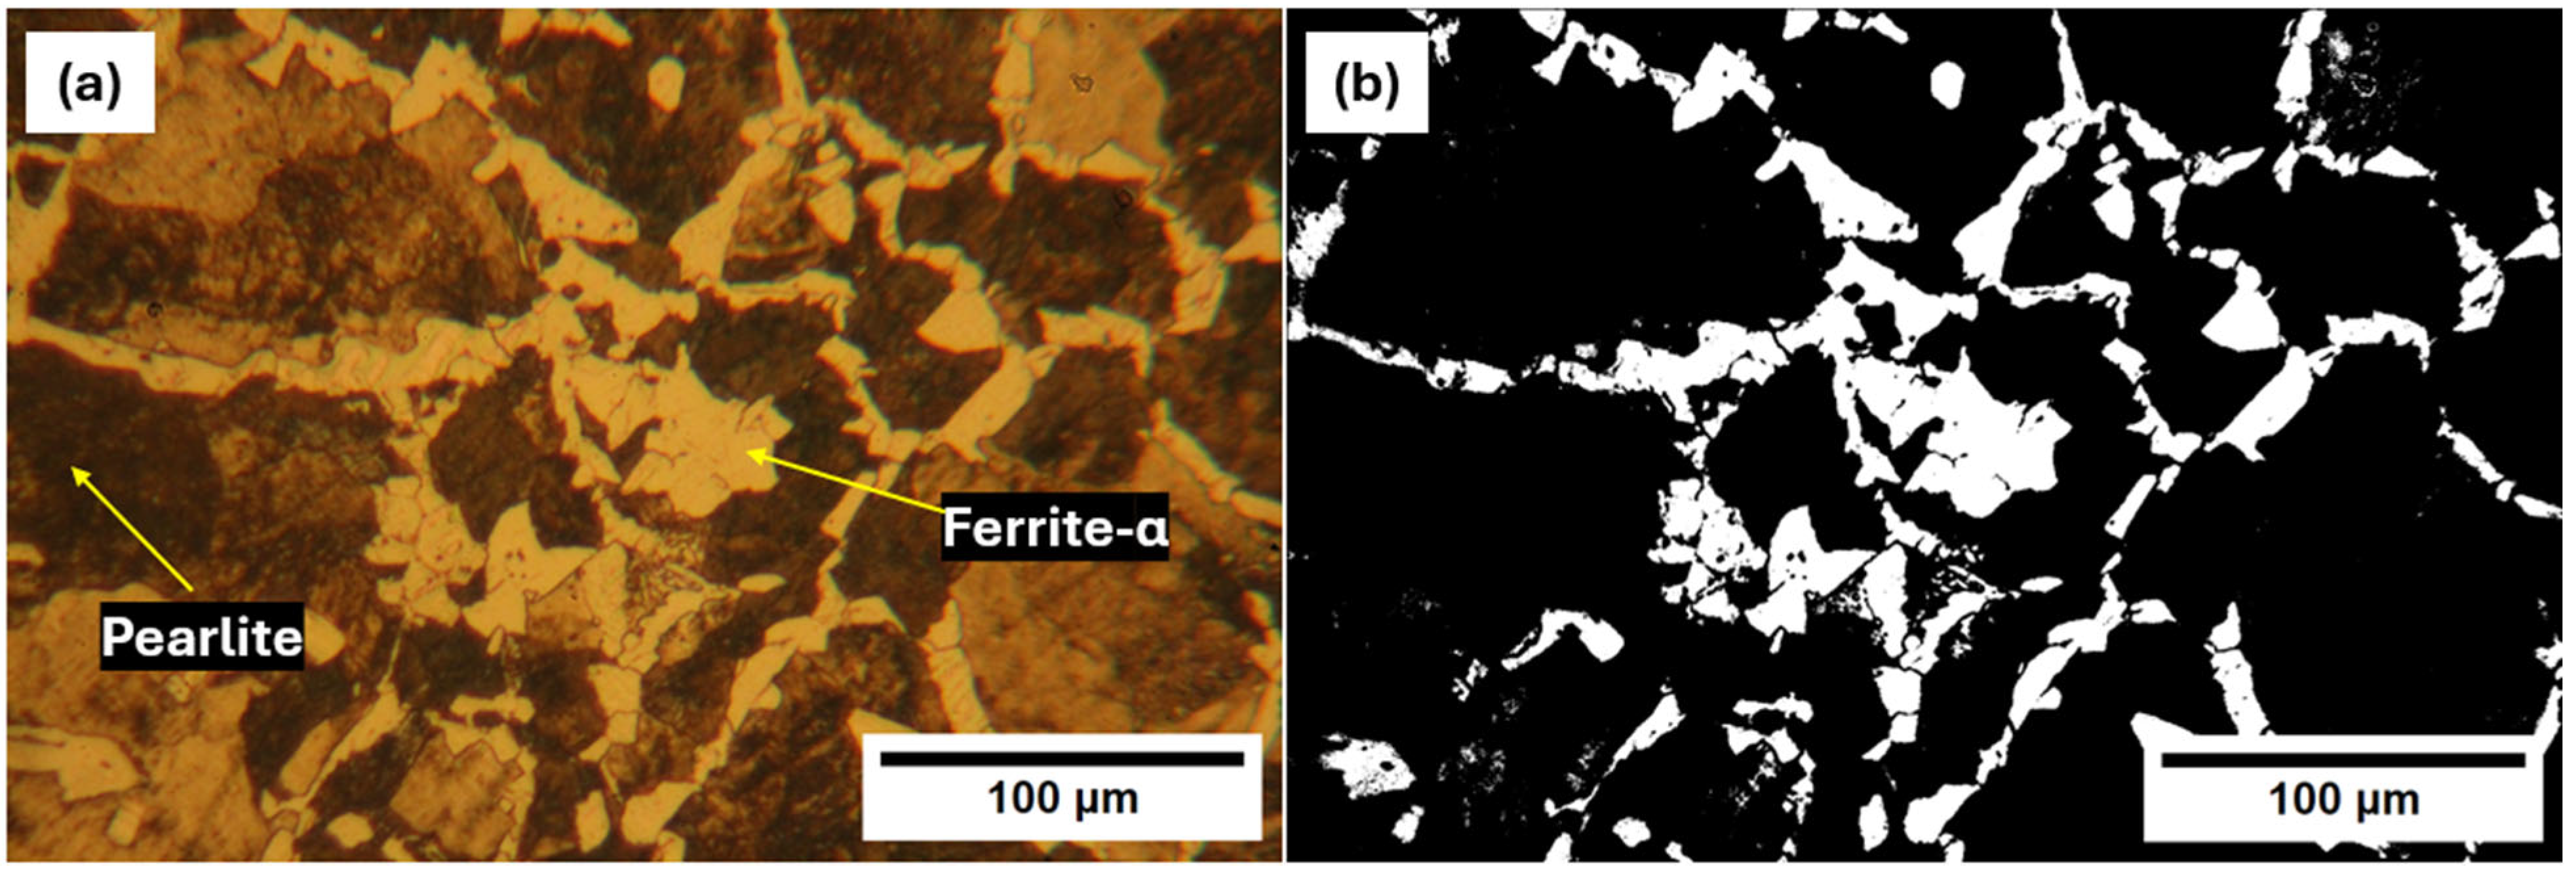
The images were analyzed using ImageJ (version 1.54g) to calculate the proportions of proeutectoid ferrite-α and pearlite [15]. With this analysis, an average proportion of ferrite-α and pearlite in each zone could be obtained, and subsequently, the carbon content could be calculated with the Lever rule [8] (Equation (2)) mathematical model for finding the ferritic percentage [8]:
where %f is the percentage of ferrite and %C is the carbon content percentage. According to the carbon-iron phase diagram, steel with a fully pearlitic structure would correspond to the eutectoid composition (0.8% C), and the ferrite fraction would be zero. In contrast, the micrographs in Figure 3 reveal a pearlite distribution that suggests hypoeutectoid steel [8].
Figure 3.
(a) Proportion of ferrite (α) and pearlite of non-treated sample. (b) Detection of pearlite colonies and ferrite by ImageJ.
2.5. Energy Dispersive X-Ray Spectroscopy Analysis (EDS)
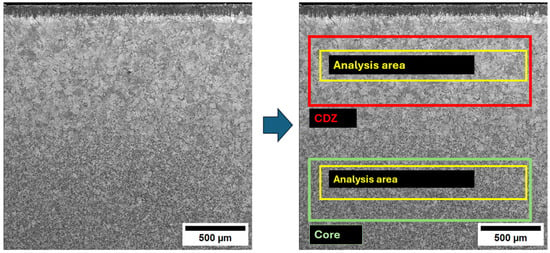
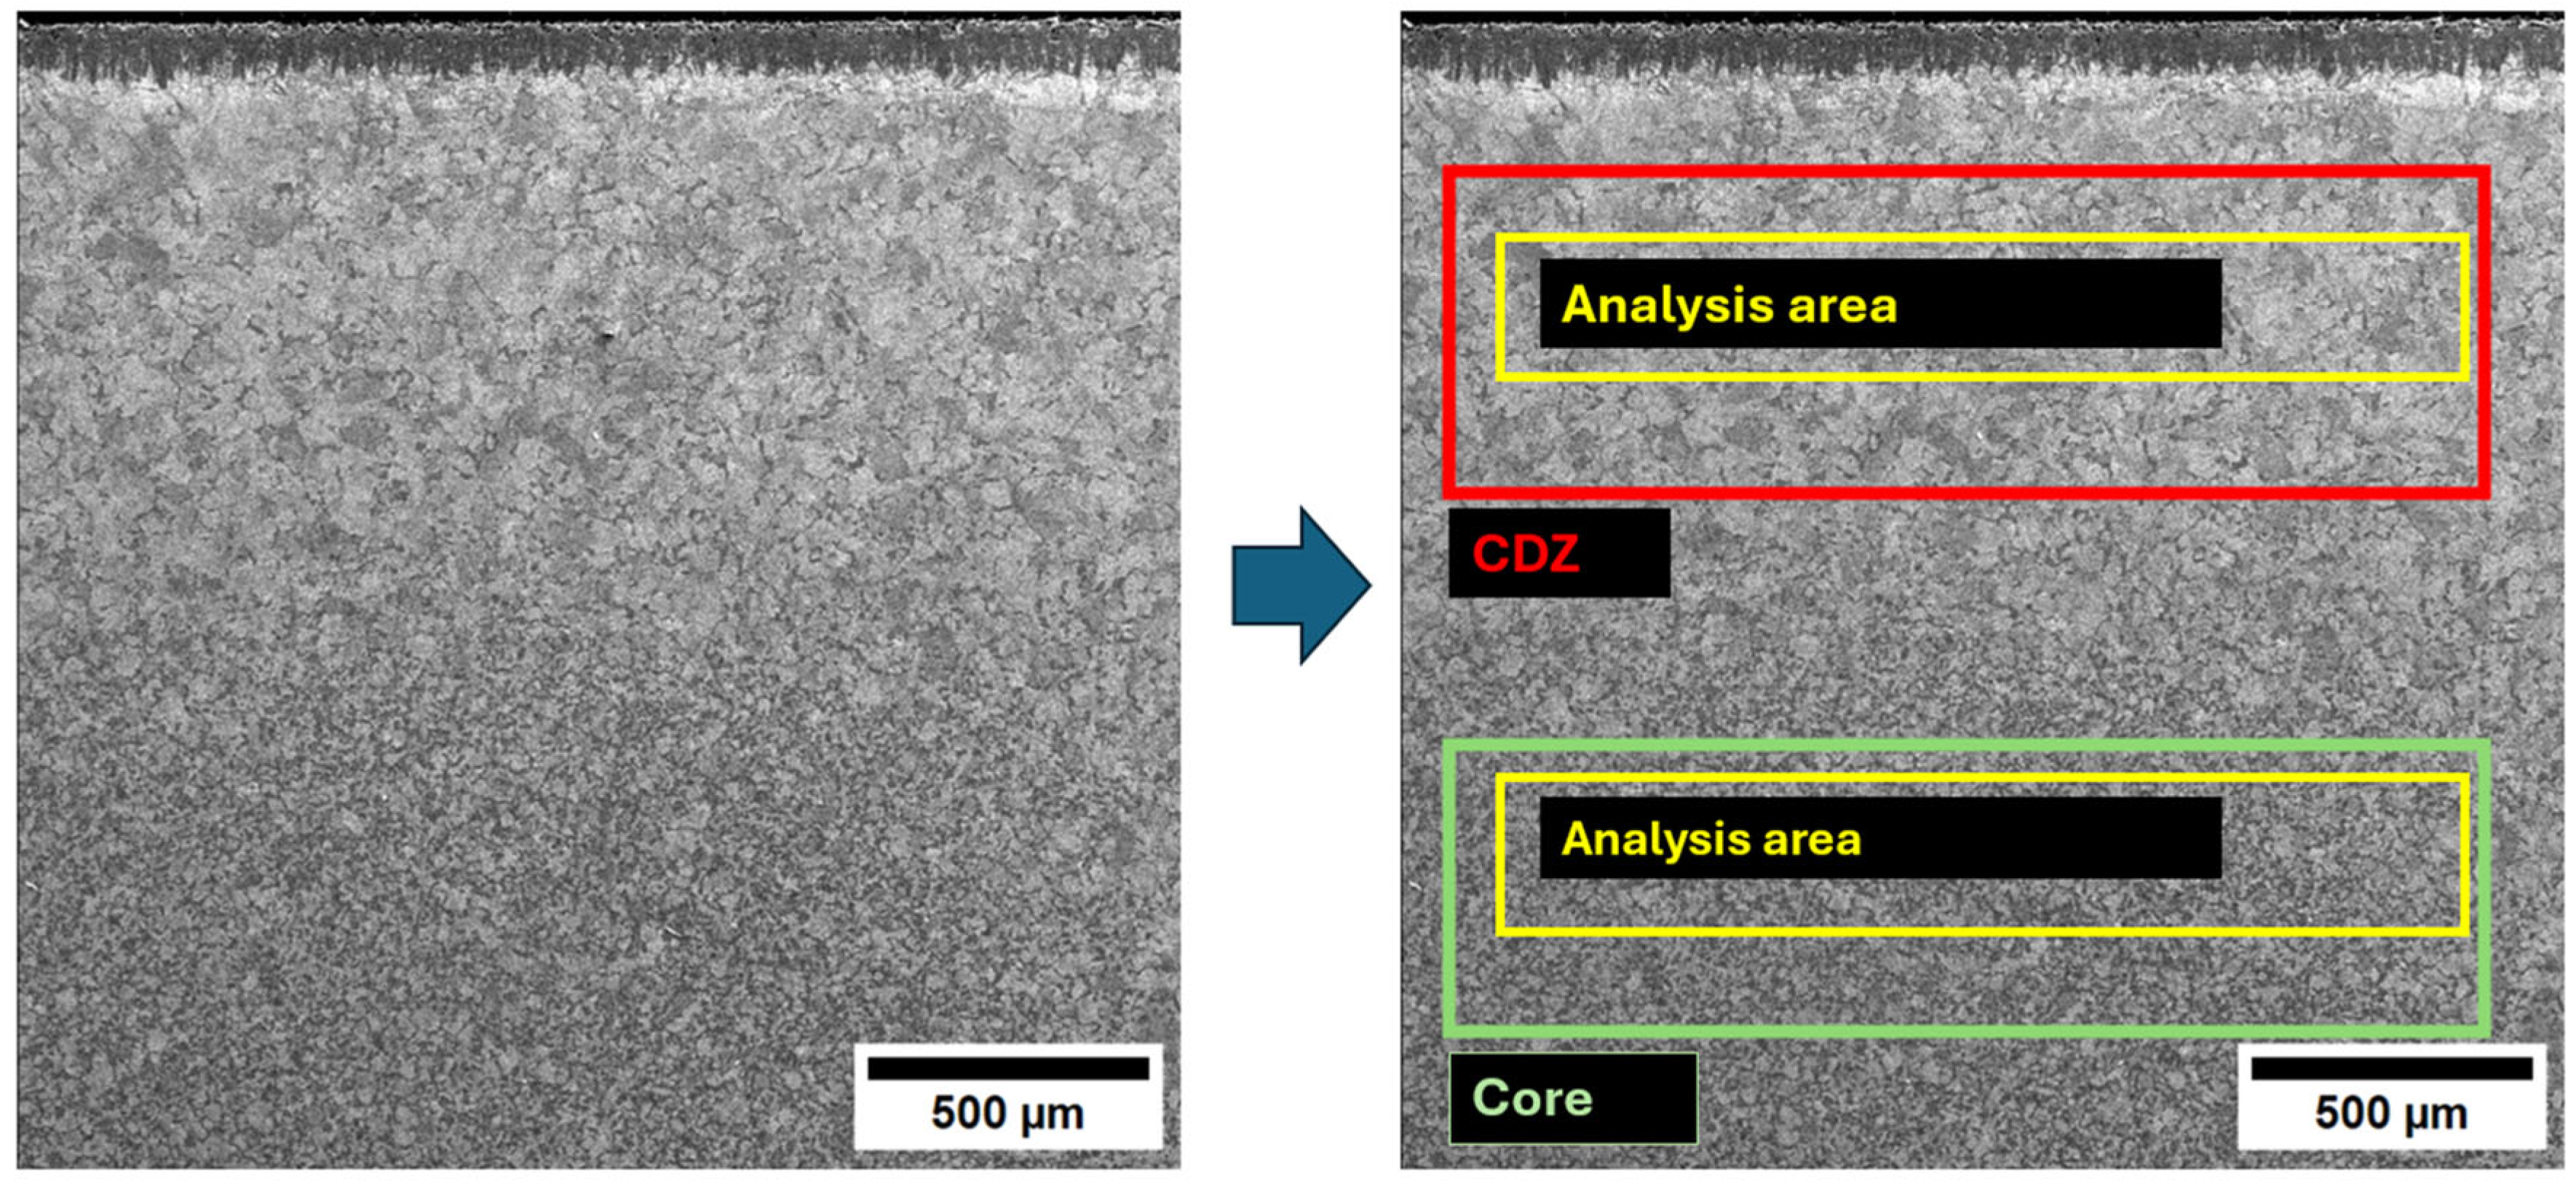
Due to the apparent symmetrical distribution of carbon across the sample, EDS tests were performed at 2 different depths from the surface: at the carbon diffusion zone (CDZ) under the Fe2B phase and at the center of the sample’s core (see Figure 4).
Figure 4.
Analysis area of EDS analysis at the CDZ and core.
Since boron diffusion begins at the surface and proceeds toward the center of the sample, the effects of boron diffusion and the temperature were expected to be symmetrical about the material’s axis. All tests were performed in a horizontal analysis area. The energy of the electron beam remained constant at 20 kV [16].
2.6. Grain Size
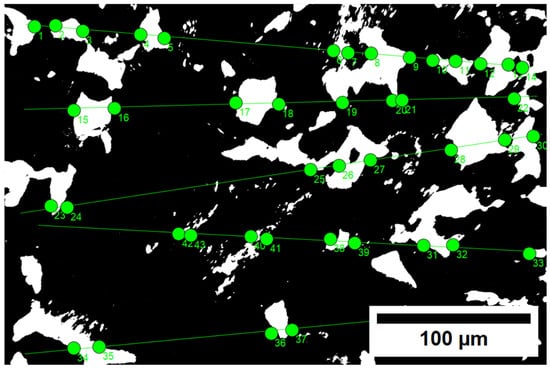
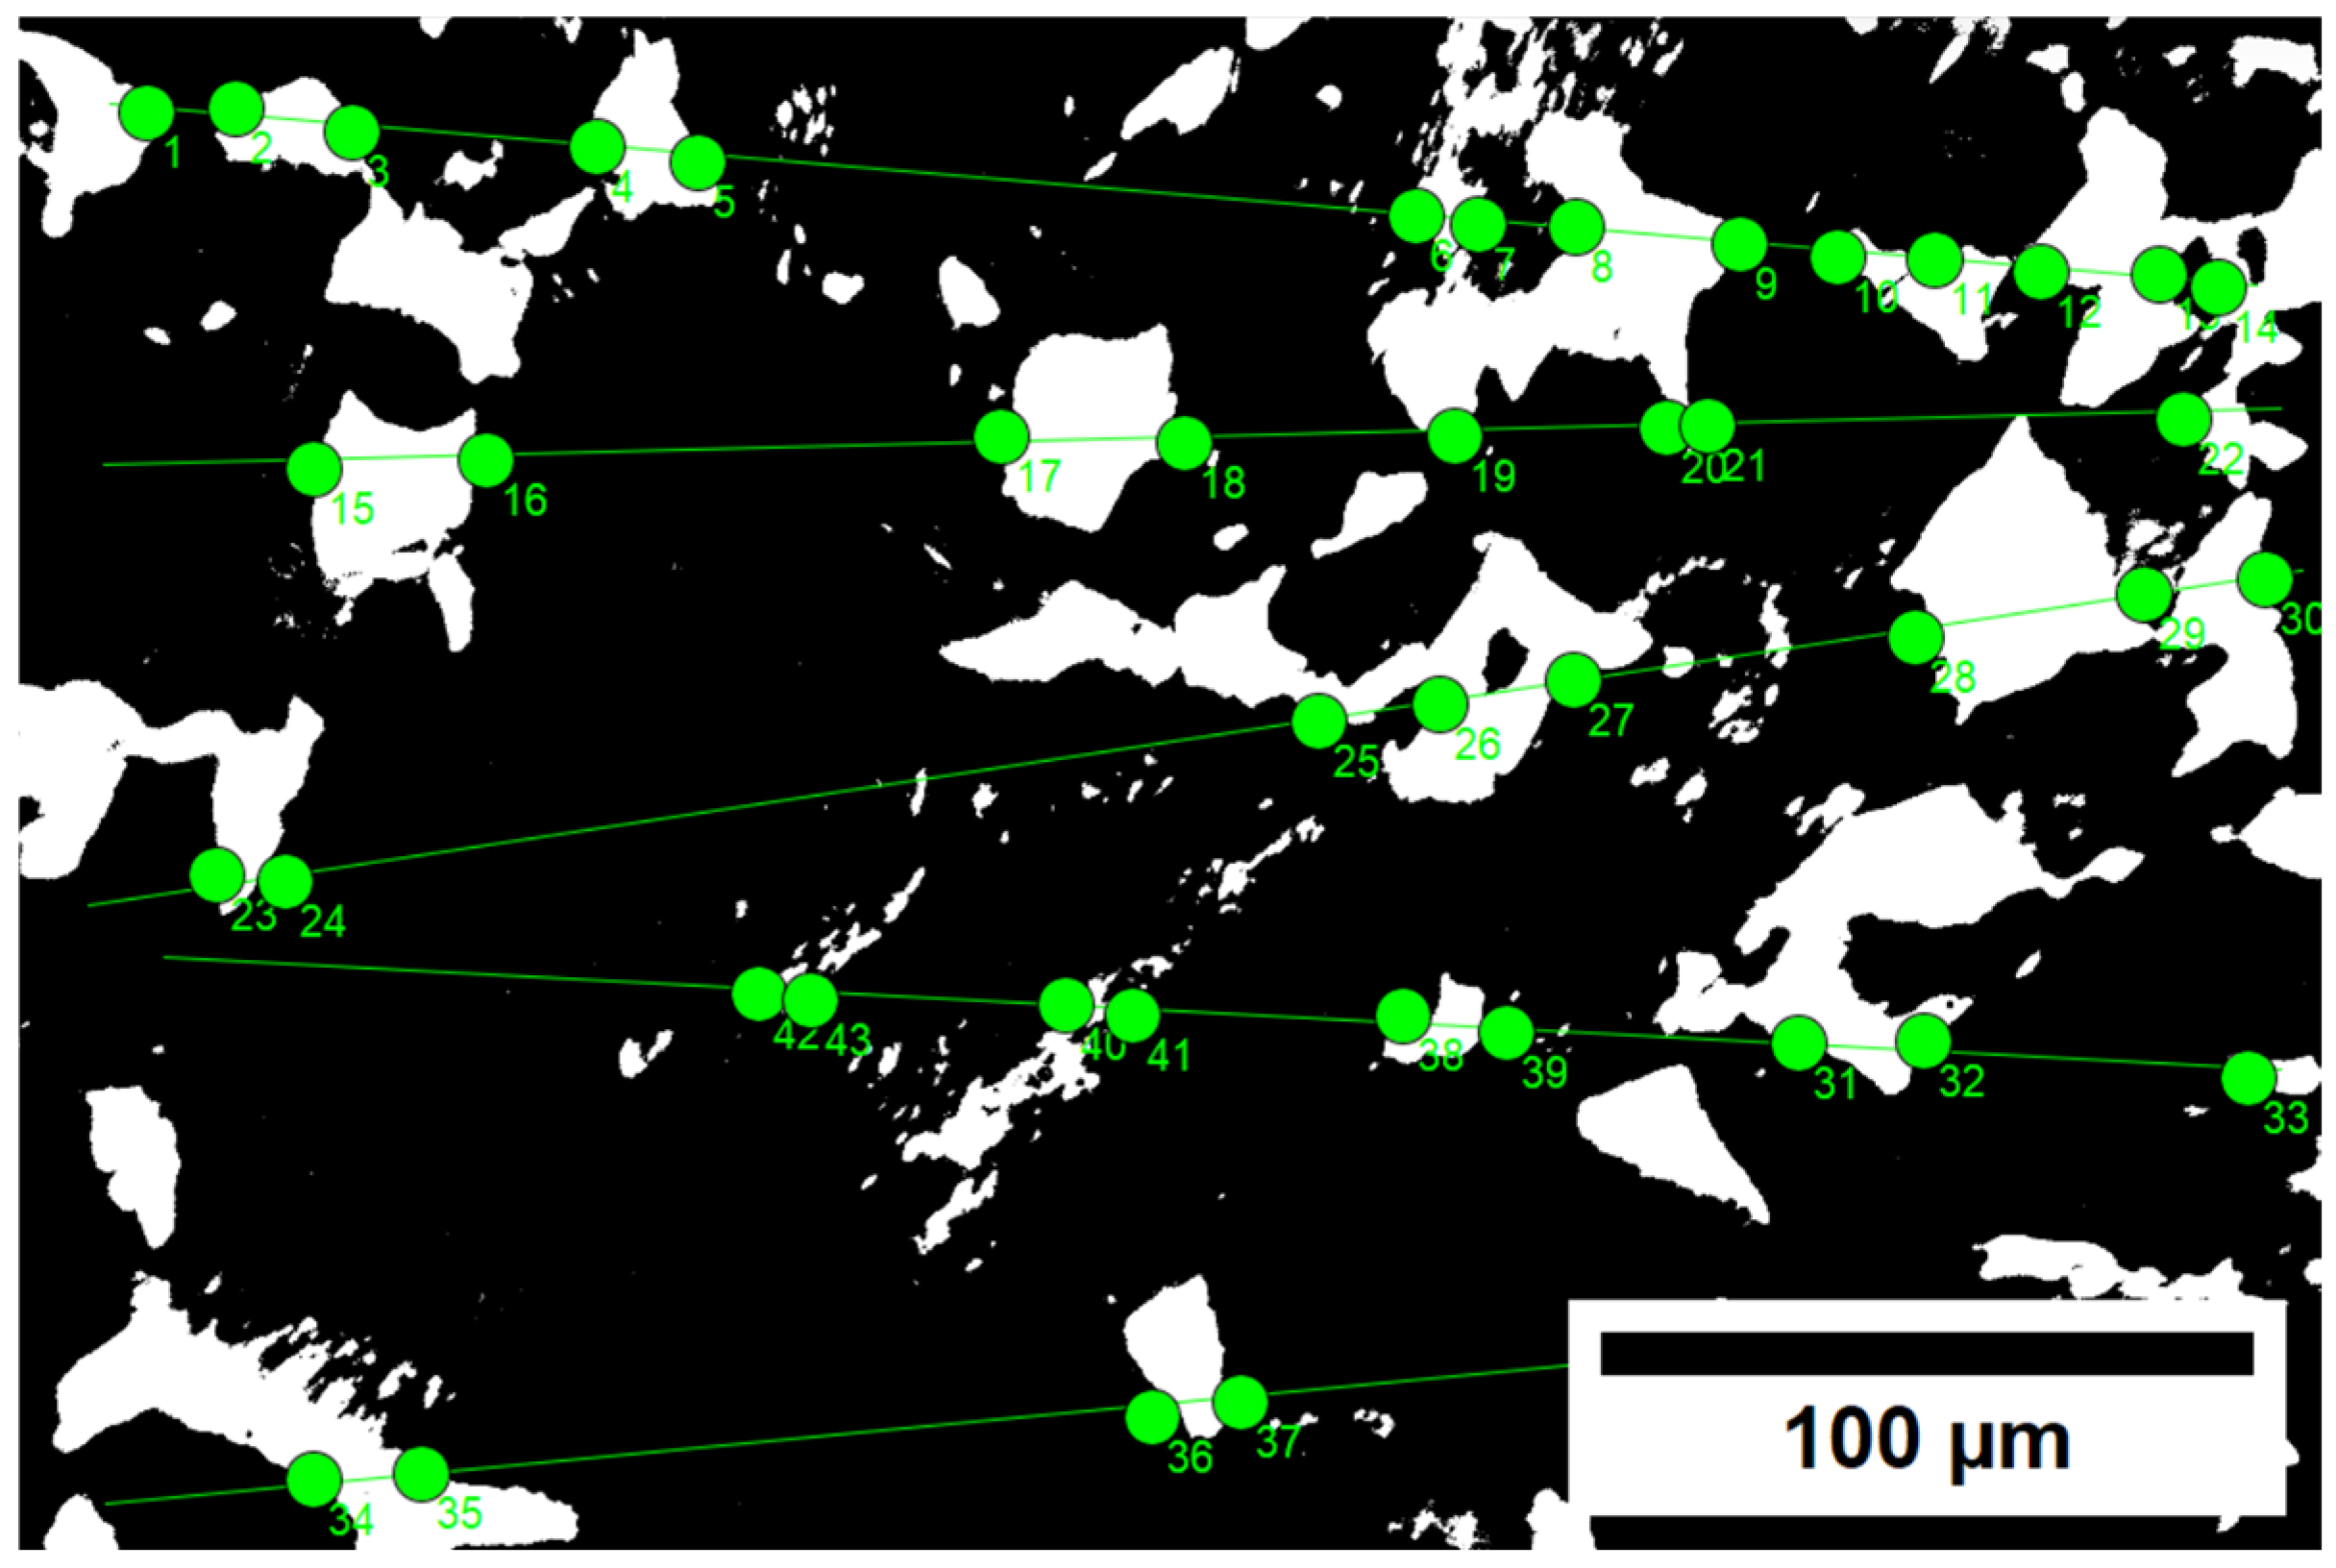
To analyze the effect of temperature on the microstructure, a grain size test was performed on the material according to ASTM E112–13 using the Heyn lineal intercept procedure [17]. The Figure 5 provides an example of how the method is applied. This method is suitable for equiaxed grains and reports measurements as mean grain diameters [8,17].
Figure 5.
A schematic of the procedure for determining the grain size of the microstructure of the treated samples.
Five lines were drawn in different directions in each micrograph. The number of intersections and the length of the lines were used to calculate the mean number of grain boundary intersections per unit length of the test line with Equation (3):
The magnification M can be considered 1 if the line length is expressed on the real scale of the micrograph in millimeters, where N is the number of intersections and L is the length of the line. Since 5 lines were drawn, the lengths of the lines were summed, as was the number of intersections.
To calculate the mean linear intercept , Equation (4) was used:
Thereafter, the grain size is expressed as the ASTM grain size number G through the mathematical model:
This number refers to the standard grain size scale.
3. Results
3.1. Morphological Characterization
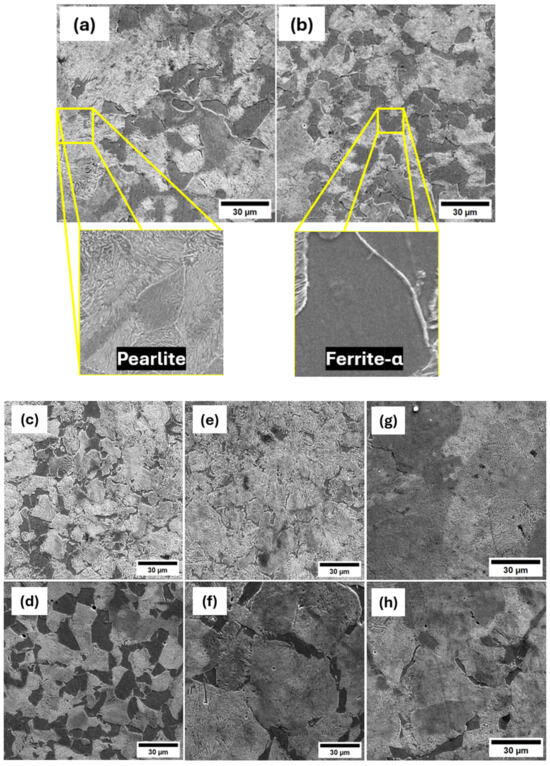
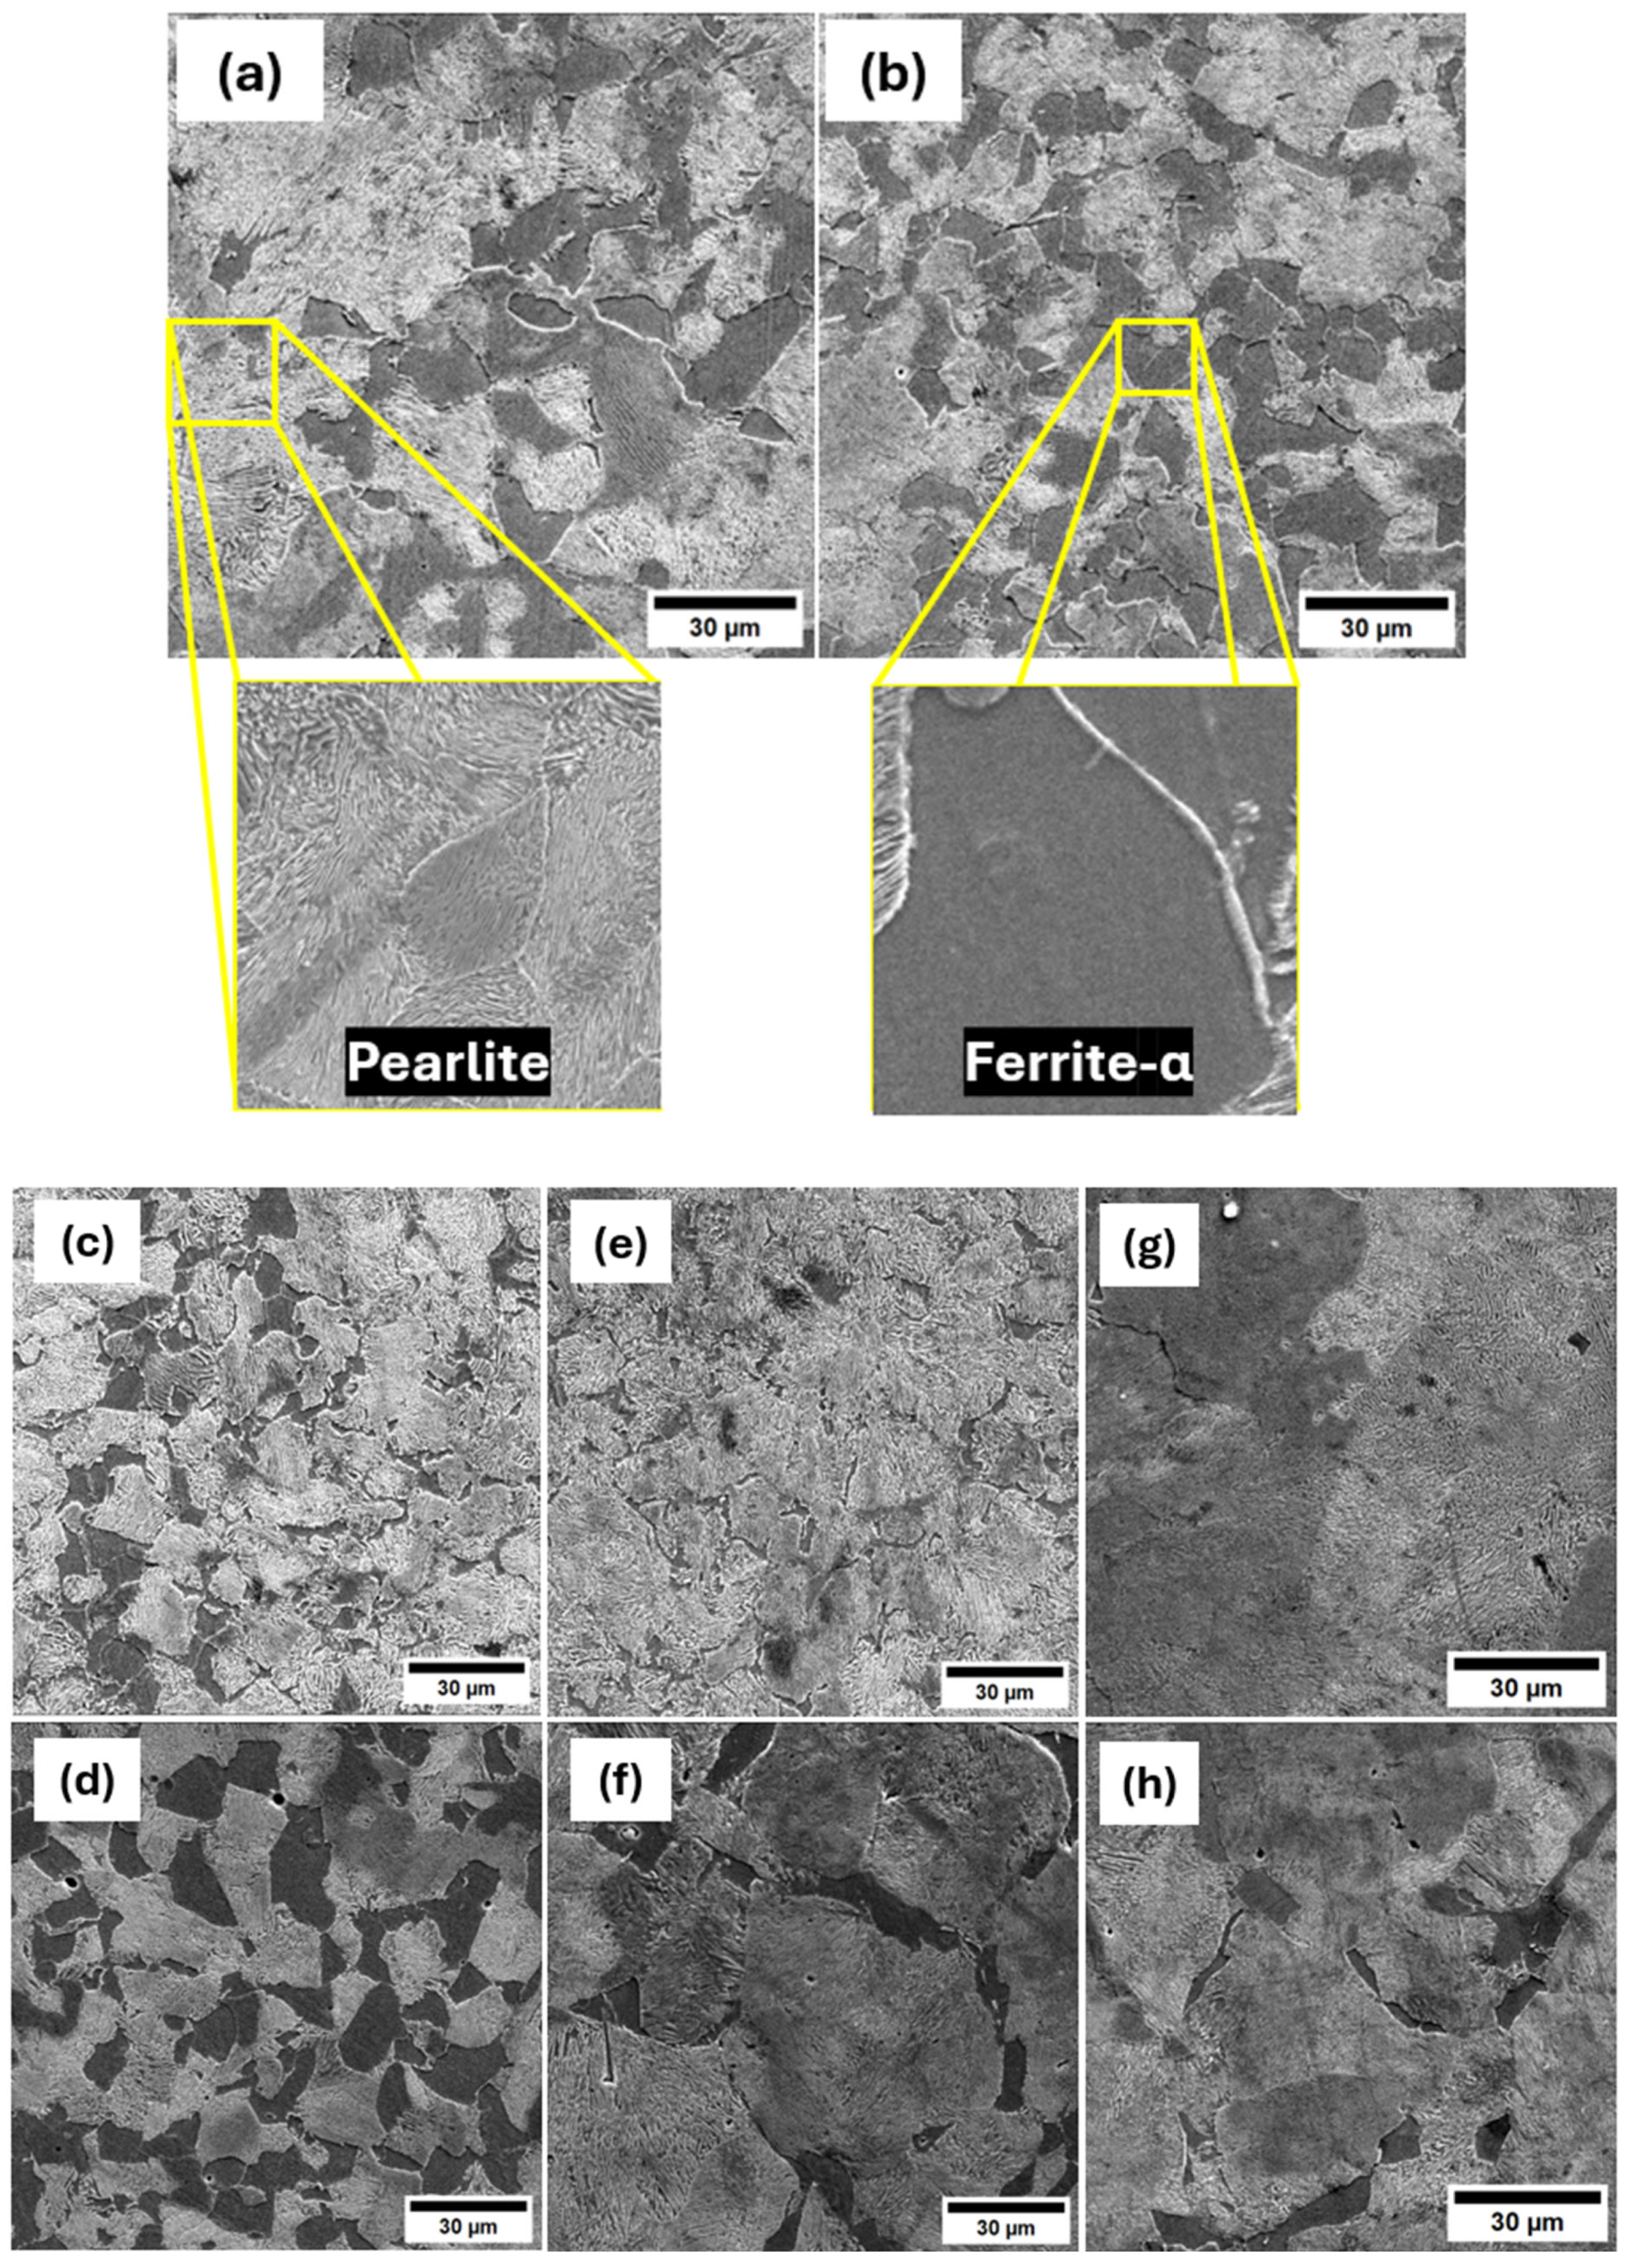
After chemical etching, the micrographs revealed the distribution of the pearlitic and ferritic phases across the sample, with these structures organized differently in two regions. In Figure 6a, the microstructure below the Fe2B phase, termed the carbon diffusion zone (CDZ), is predominantly composed of grouped pearlitic colonies. This CDZ appeared to extend from the surface to the center of the sample, reaching a limit. In the material’s core, chemical etching revealed a lower predominance of pearlitic structures (see Figure 6b,d,f,h); consequently, the ferritic fraction increased, indicating a lower carbon content.
Figure 6.
Micrographs of CDZ in samples treated for 2 h at (a) 900 °C, (c) 950 °C, (e)1000 °C, and (g) 1050 °C. Samples from core for same temperature conditions in (b), (d), (f), and (h), respectively.
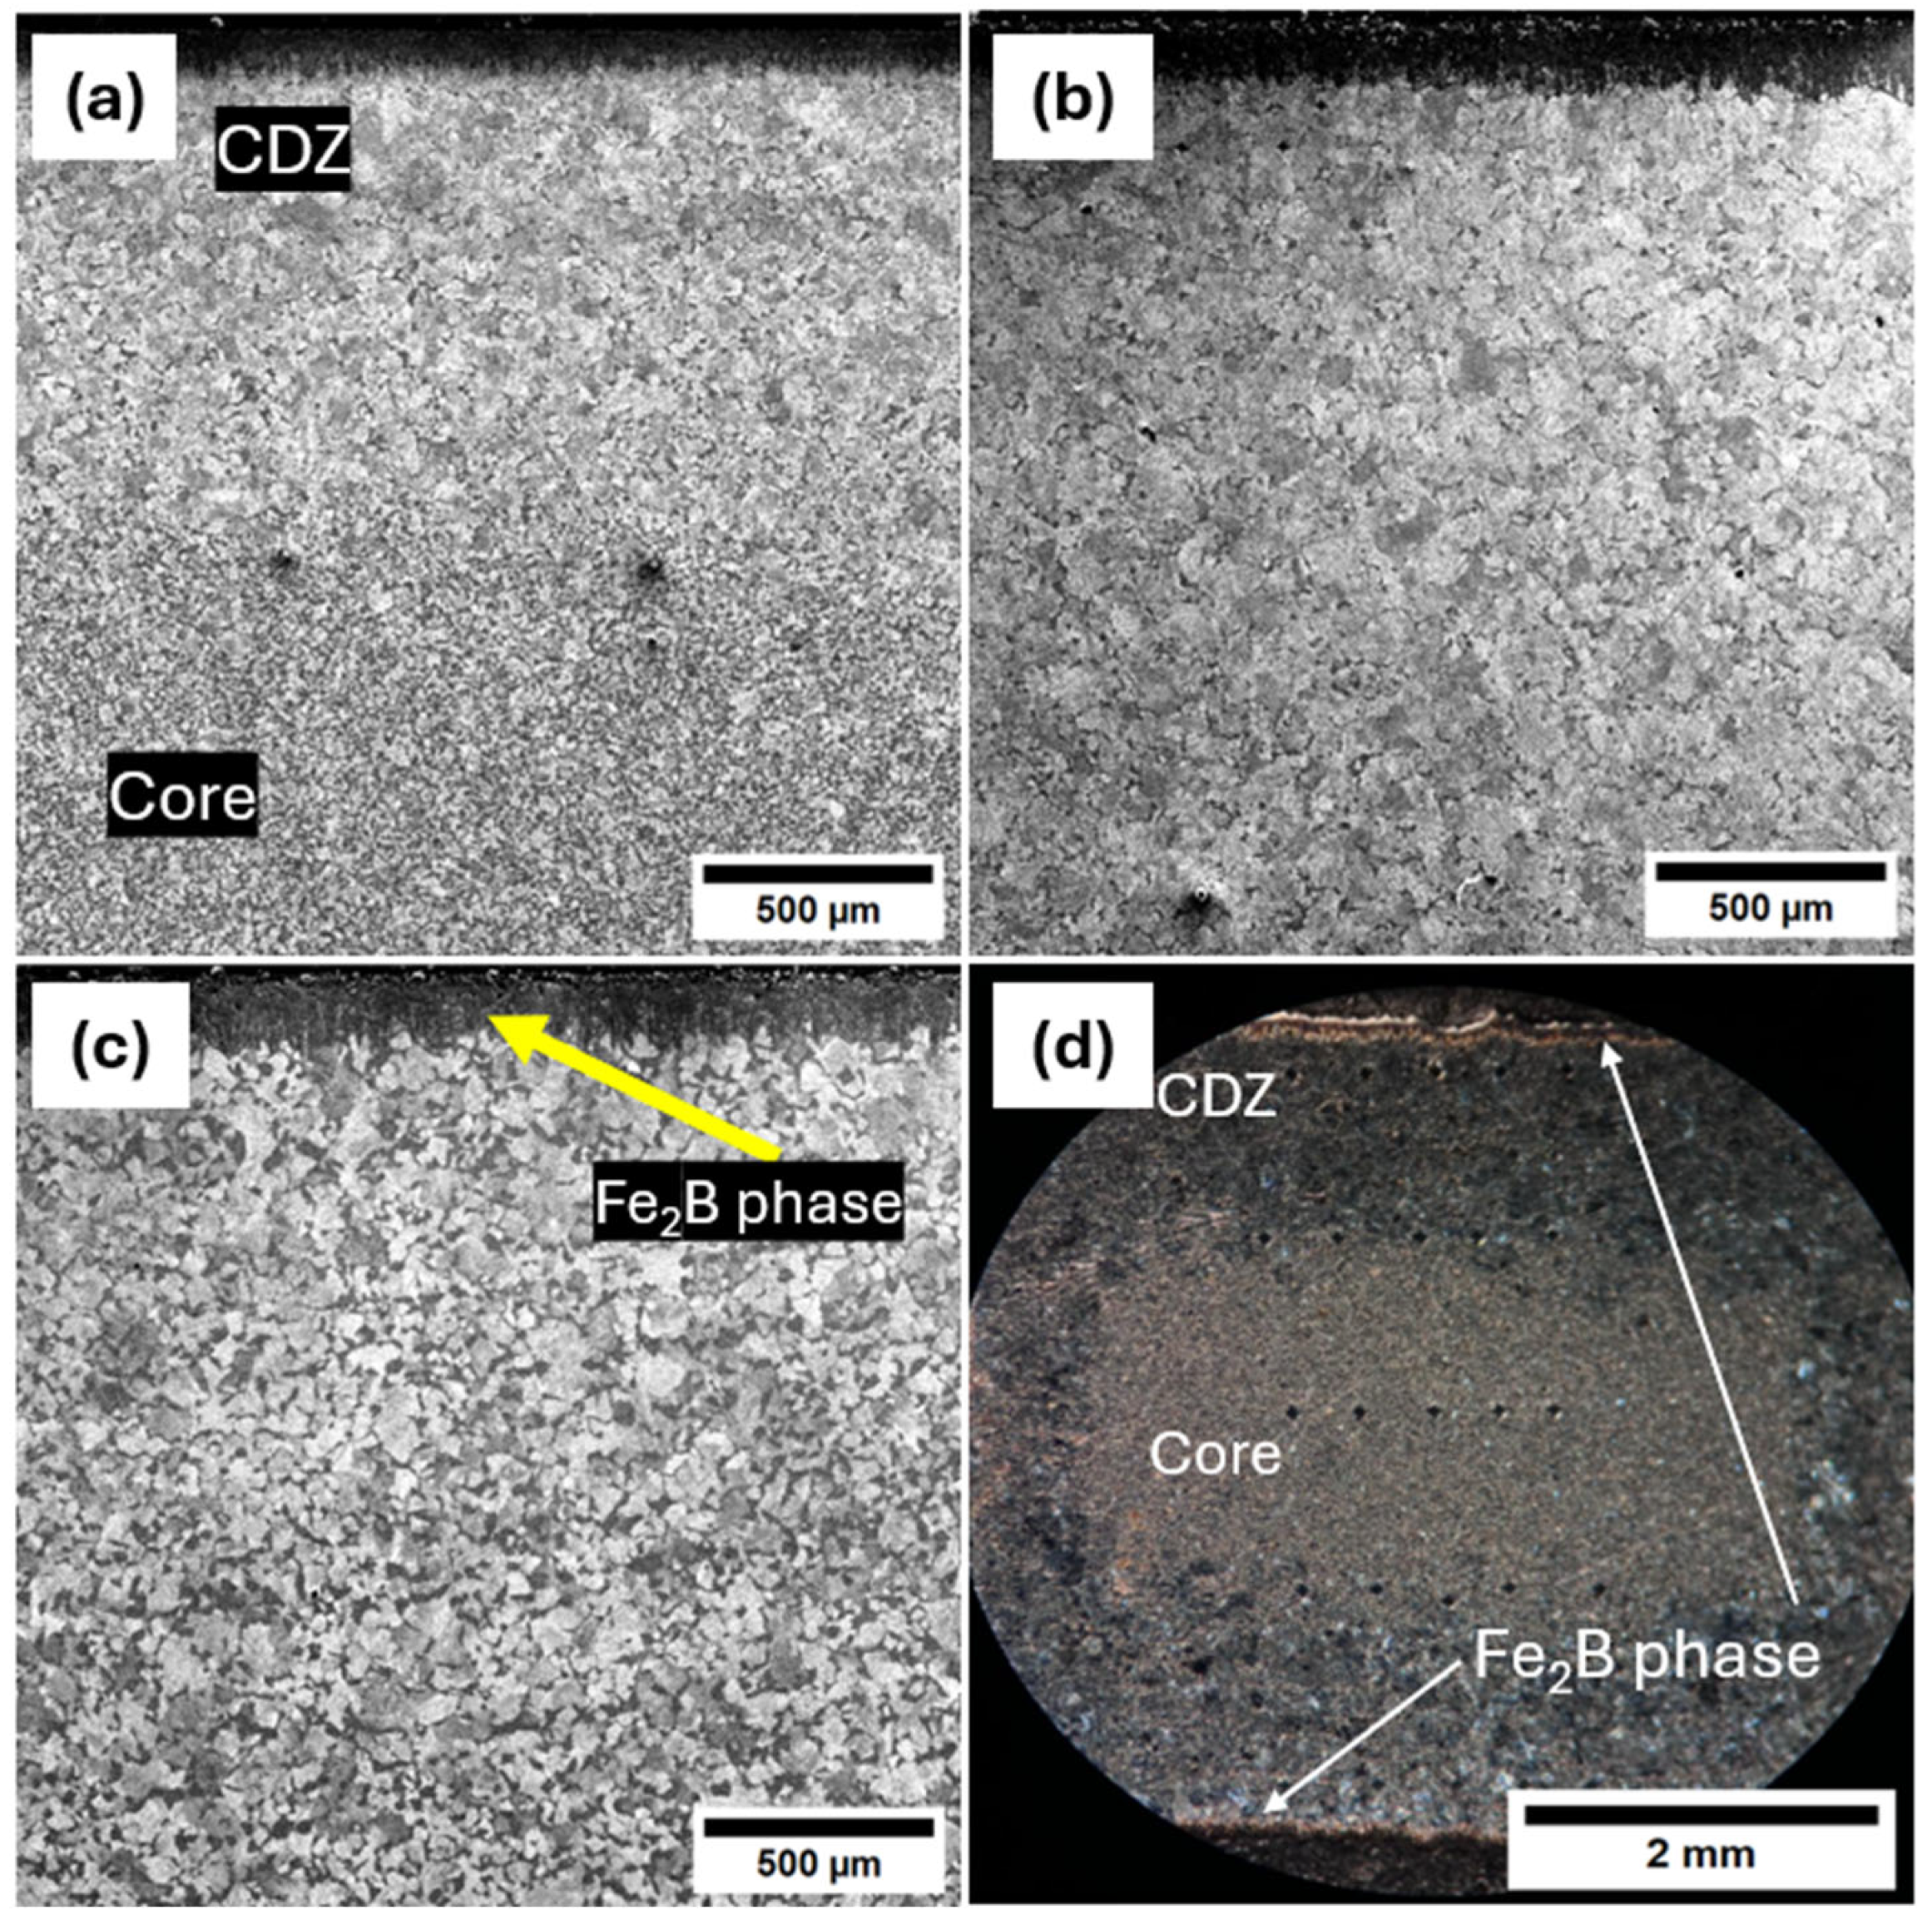
Figure 7 illustrates the representative behavior of the carbon diffusion zone (CDZ). In Figure 7a, the CDZ reached a limit marked by an increase in the ferritic phase fraction. Figure 7b shows the CDZ extending toward the center of the sample. In Figure 7c, a reduction in pearlite colonies and a corresponding increase in the ferritic fraction were observed. This behavior, as shown in Figure 7c, was present across the entire cross-section of the sample and remained consistent under all temperature conditions at 6 h. Figure 7d provides a general overview of the CDZ distribution.
Figure 7.
Micrographs of samples treated at 1000 °C for (a) 2 h, (b) 4 h, (c) and 6 h. (d) General view of sample treated at 1000 °C for 2 h.
At 2 and 4 h of treatment, the CDZ grew over time; see Figure 7a,b. Still, at 6 h of treatment, there was no clear differentiation between these two regions, indicating a homogeneous microstructure, as can be seen in Figure 7c. This behavior was constant over the range from 900 to 1000 °C. At 1050 °C, the differentiation between the carbon diffusion zone and the core was no longer observed. The SEM micrographs revealed the characteristic structures of carbon steels: iron carbide (cementite, Fe3C) organized with ferrite to form a lamellar, pearlite-rich carbon structure [18,19].
3.2. Hardness Measurements
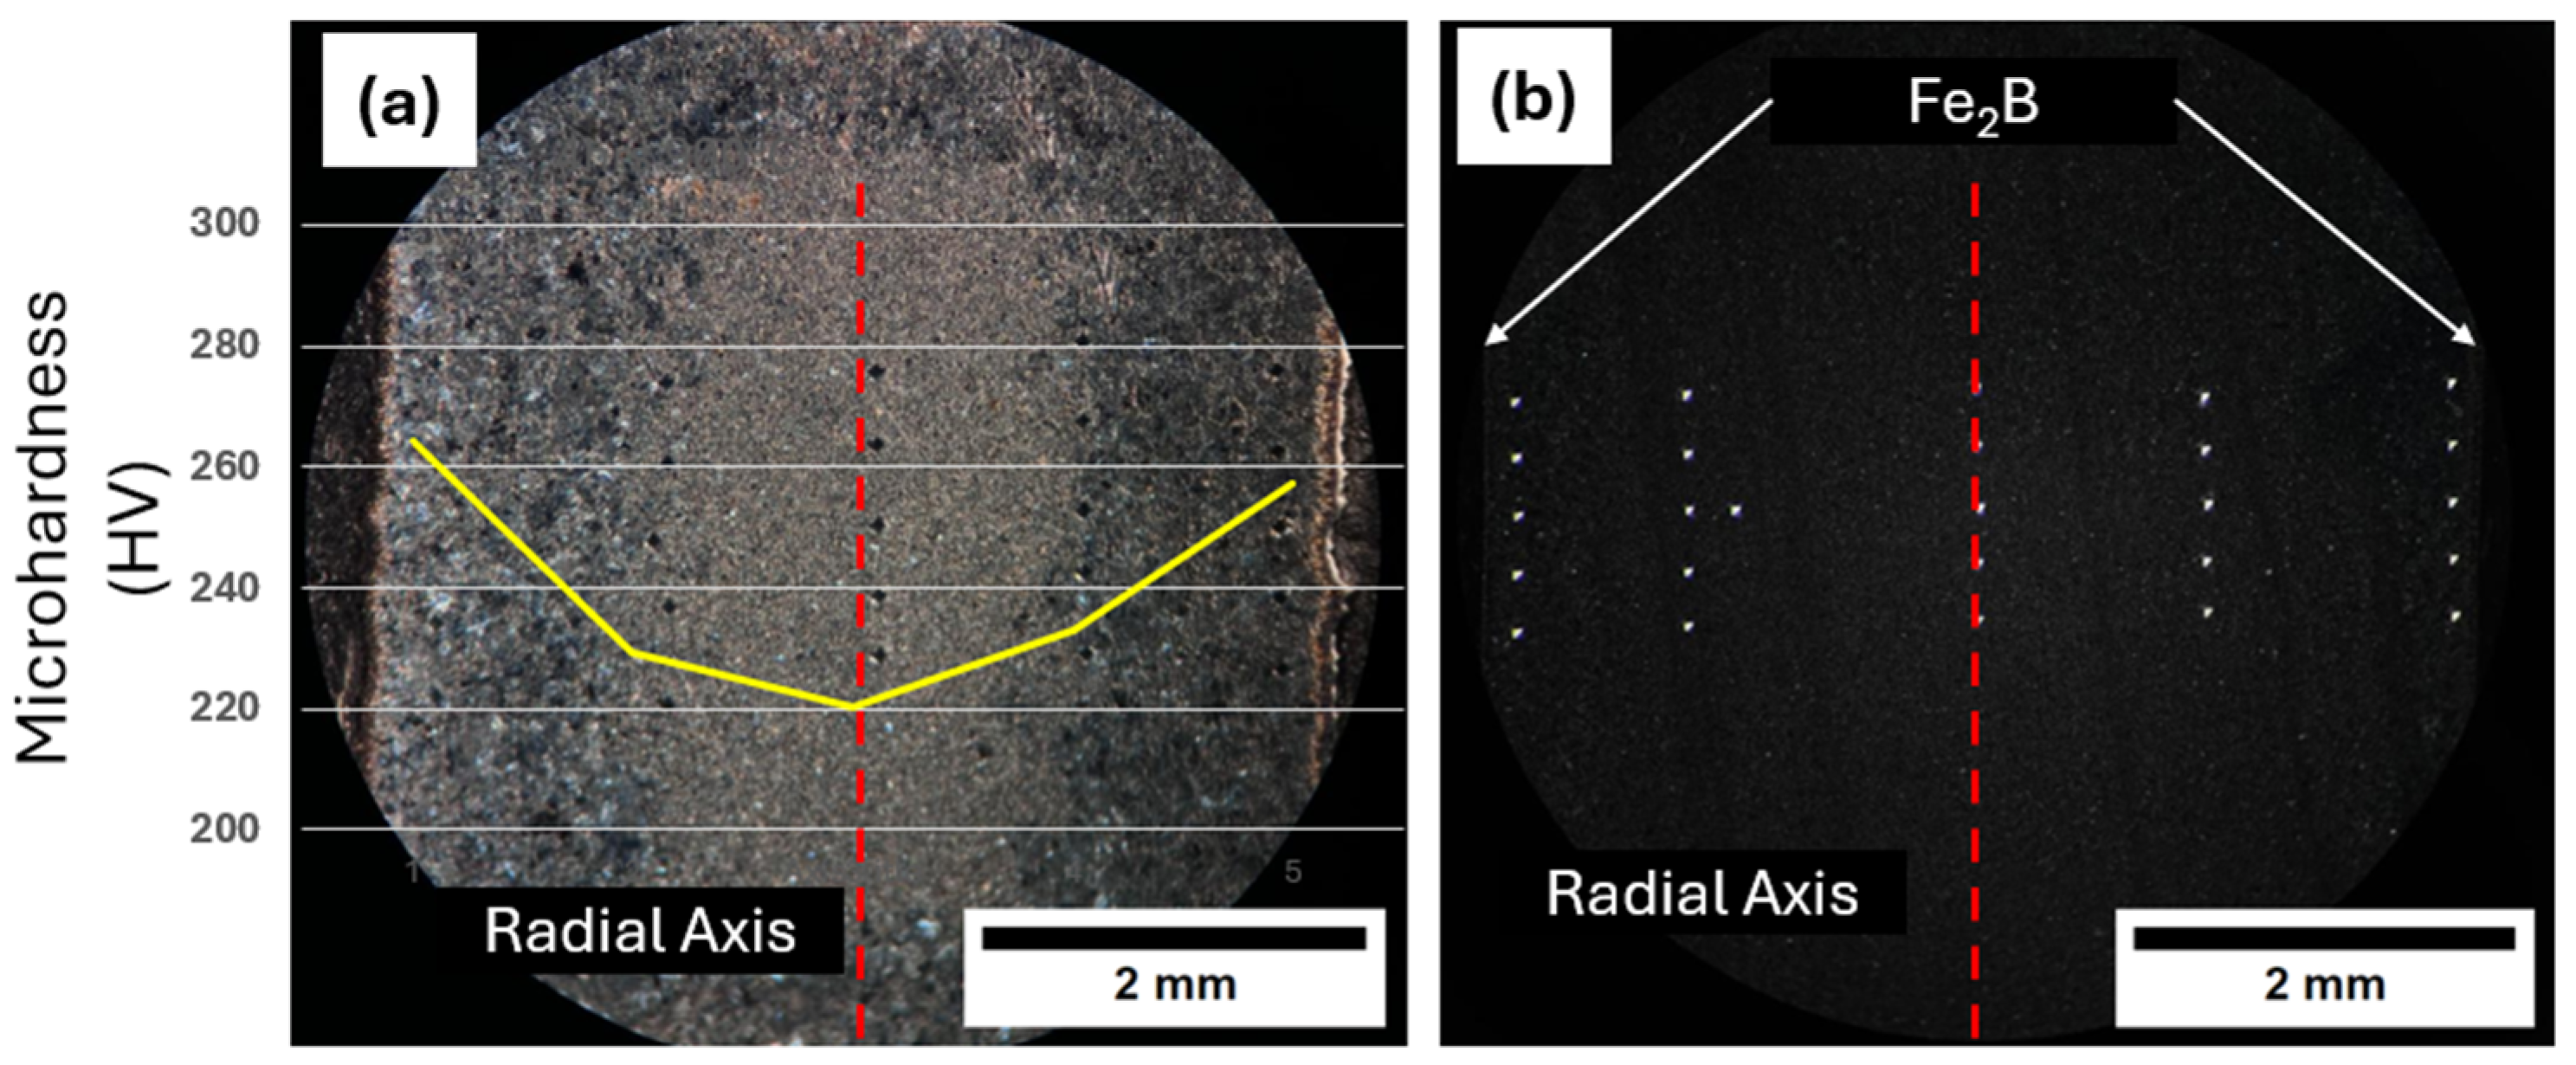
The hardness of the base material after the thermochemical boriding process was measured via Vickers microindentations. Five hardness profiles were realized, as shown in Figure 8b. The microhardness values suggest symmetrical behavior along the sample’s radial axis. In the CDZ, the highest hardness values were observed just beneath the Fe2B layer. From this region, the hardness decreased progressively with increasing distance from the surface, reaching minimum values in the core. Beyond the core, as the radial axis was passed, the hardness increased again until reaching the CDZ beneath the Fe2B layer, as shown in Figure 8.
Figure 8.
(a) Symmetrical behavior of the microhardness across the sample. (b) Distribution of Vicker’s profiles.
The Vickers test results show an increase in microhardness in the CDZ just below the Fe2B layer. A high carbon concentration promotes the growth of pearlite colonies, thereby increasing the microhardness. As the distance from the surface increased, the carbon concentration decreased, leading to a softer material in the sample’s core.
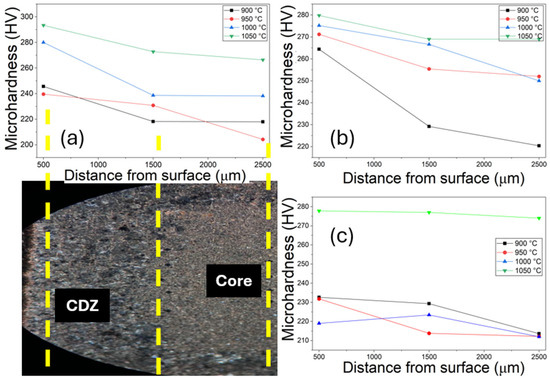
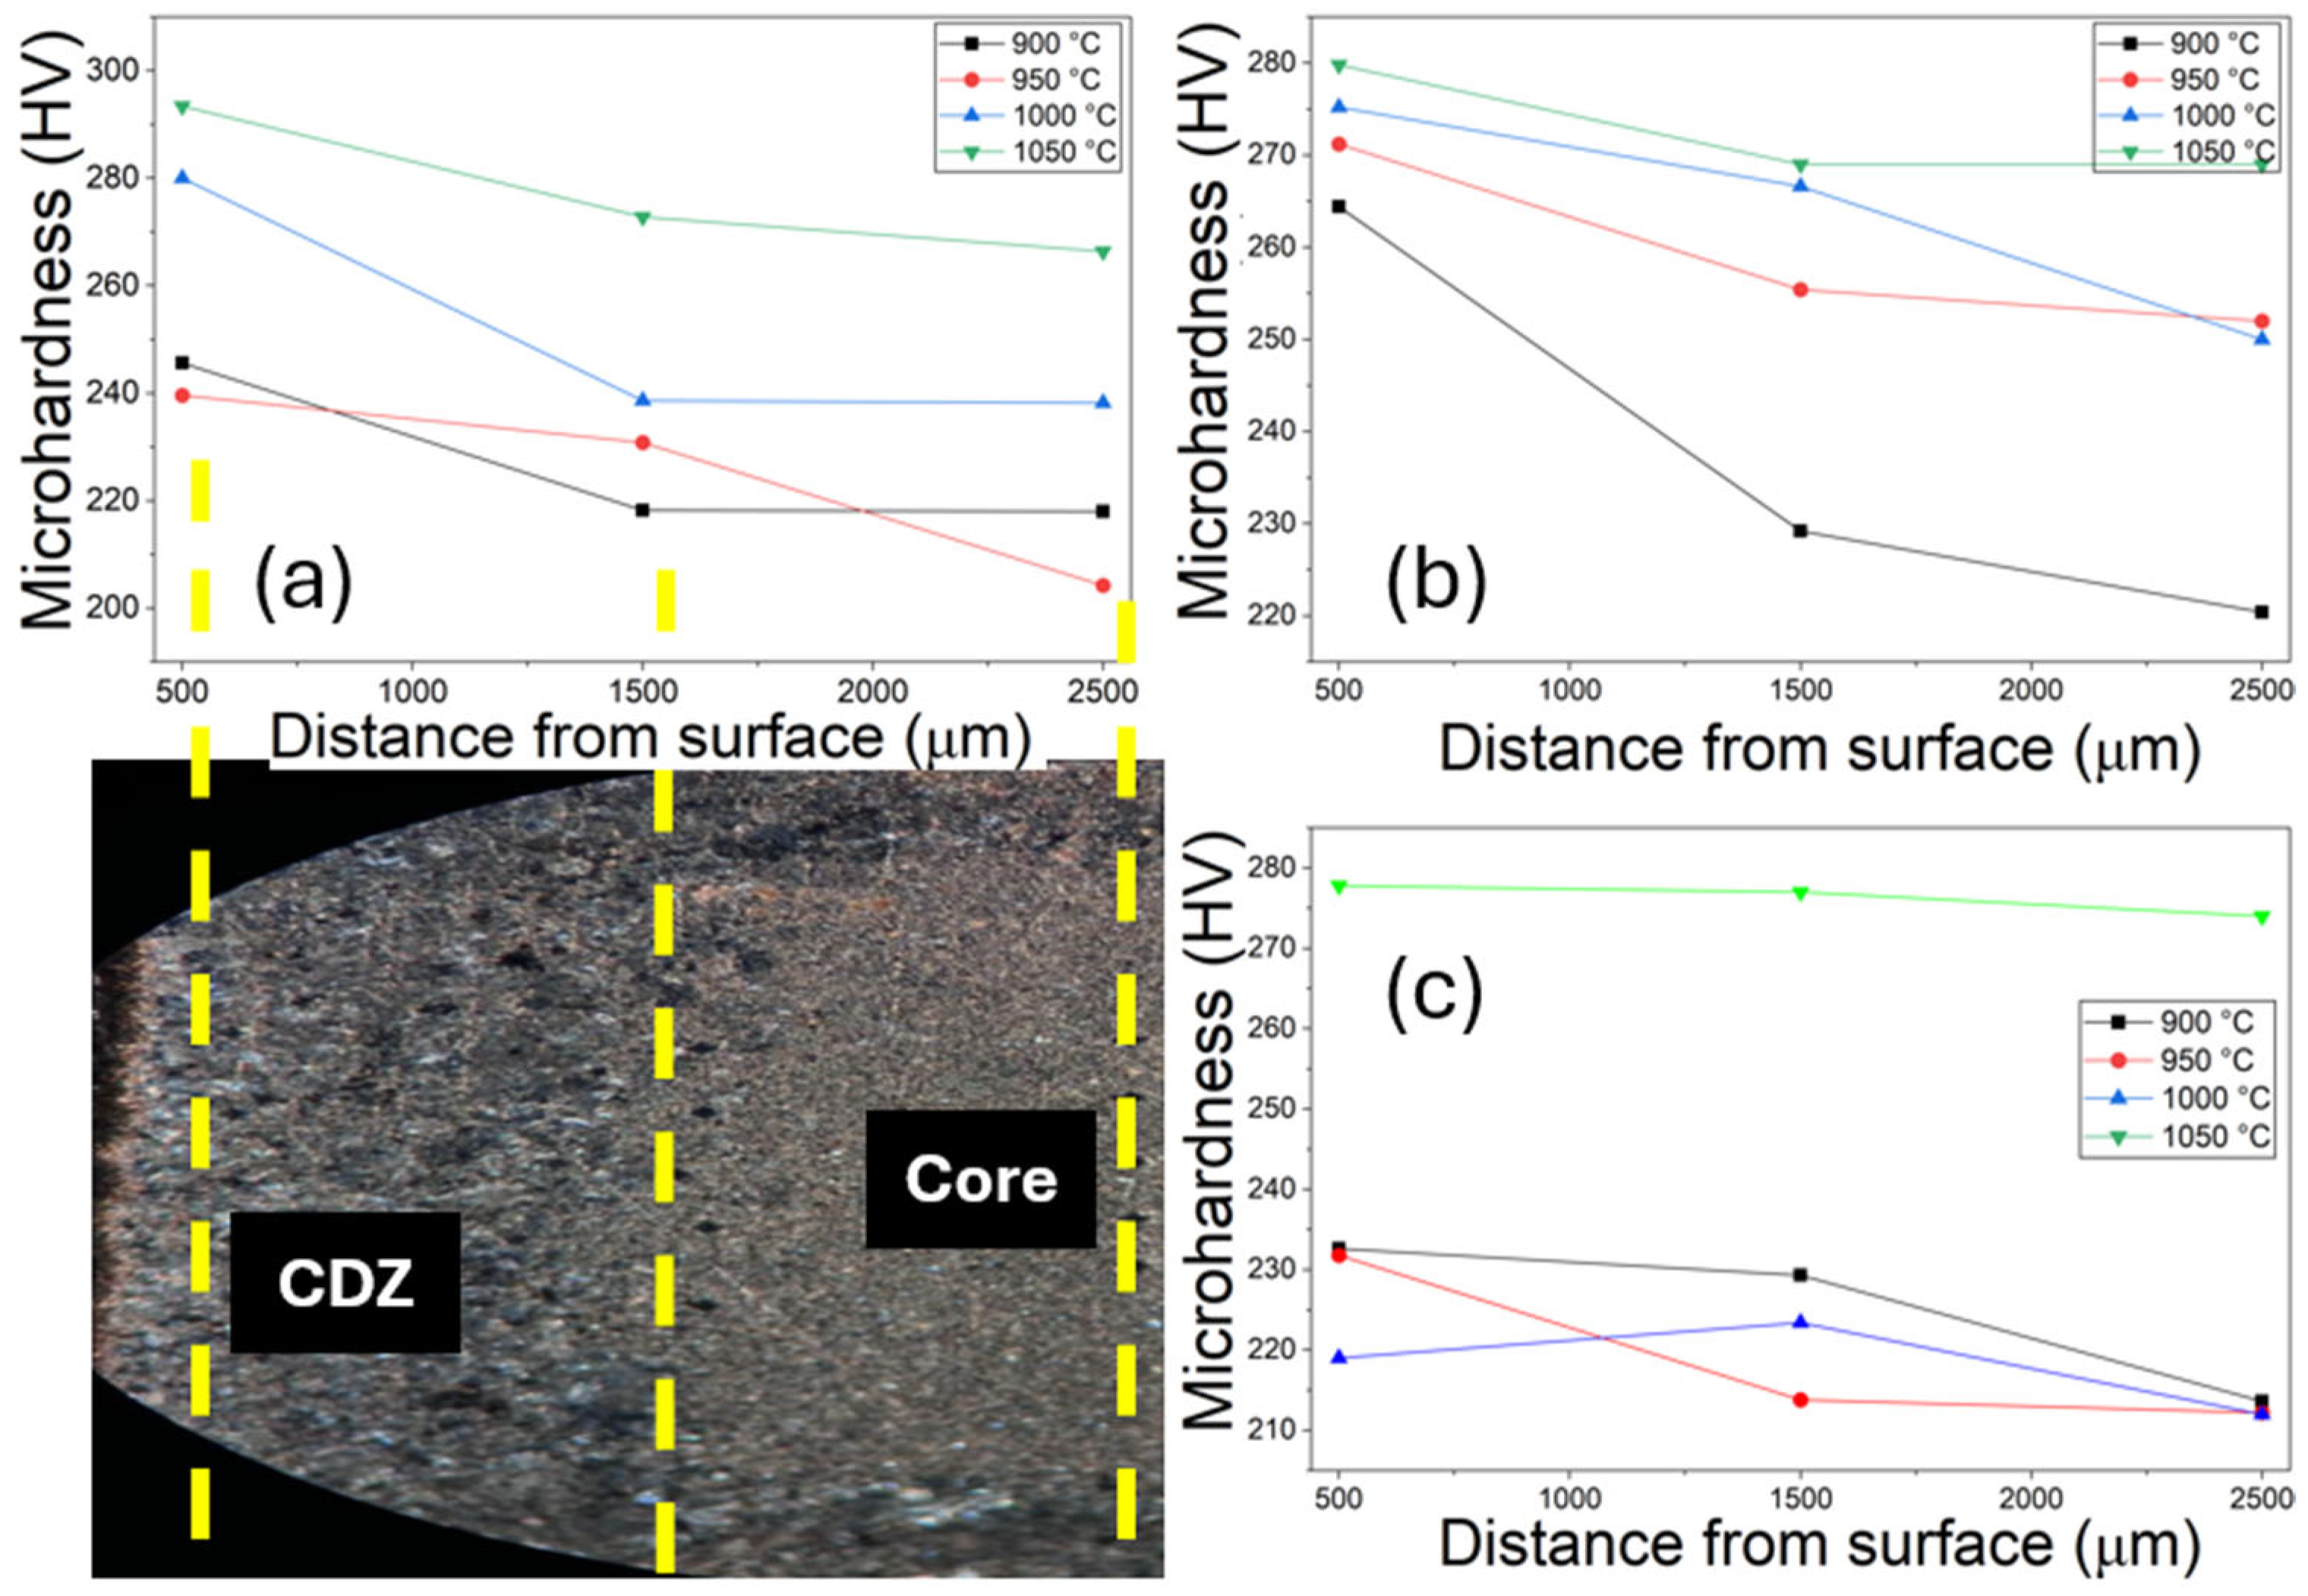
Table 1 and Figure 9 show that the microhardness behavior depended on the temperature and exposure time. According to the data, at low temperatures and short treatment times, a microhardness gradient was observed between the CDZ and the core, reflecting carbon diffusion. The microhardness beneath the Fe2B layer was consistently higher than that in the core of the sample. Likewise, as the temperature and treatment time increased, the microhardness difference between the CDZ and the core decreased, indicating a more uniform microhardness. Nevertheless, the microhardness beneath the iron boride (Fe2B) layer remained consistently higher than in the core.
Table 1.
Microhardness values.
Figure 9.
Microhardness behavior: (a) 2 h of treatment, (b) 4 h of treatment, and (c) 6 h of treatment.
As the temperature and treatment time increased, the difference in microhardness between the CDZ and the core decreased, indicating a more uniform microhardness. Nevertheless, the microhardness beneath the iron boride (Fe2B) layer remained consistently higher than in the core.
The authors of [20] explained the microhardness behavior across the samples. According to Jain, V. and Sundararajan, G., at temperatures where the ferritic phase is stable, carbon diffuses rapidly while boron is practically motionless. As the temperature increases, and the austenitic phase is reached, carbon diffusion slows down, and boron diffuses faster. Consequently, while boron diffusion is in the incubation stage, carbon is already diffusing. When iron boride nucleation begins, and the layer becomes large enough, carbon stops diffusing from the surface, but it does not completely stop; it continues to redistribute across the sample. As time passes, carbon becomes more evenly distributed, and the differentiation between the CDZ and the core disappears. A homogeneous carbon distribution means the average carbon content decreases.
3.3. Carbon Content
Lever rule was used to estimate the carbon content of a control sample of untreated original steel to analyze the effect of temperature on the carbon content of treated samples. The percentages of pearlite and ferrite in the microstructure were estimated using ImageJ to analyze micrographs of the rich-carbon region and the sample core.
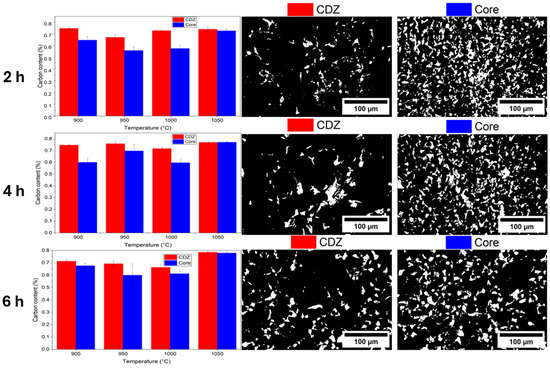
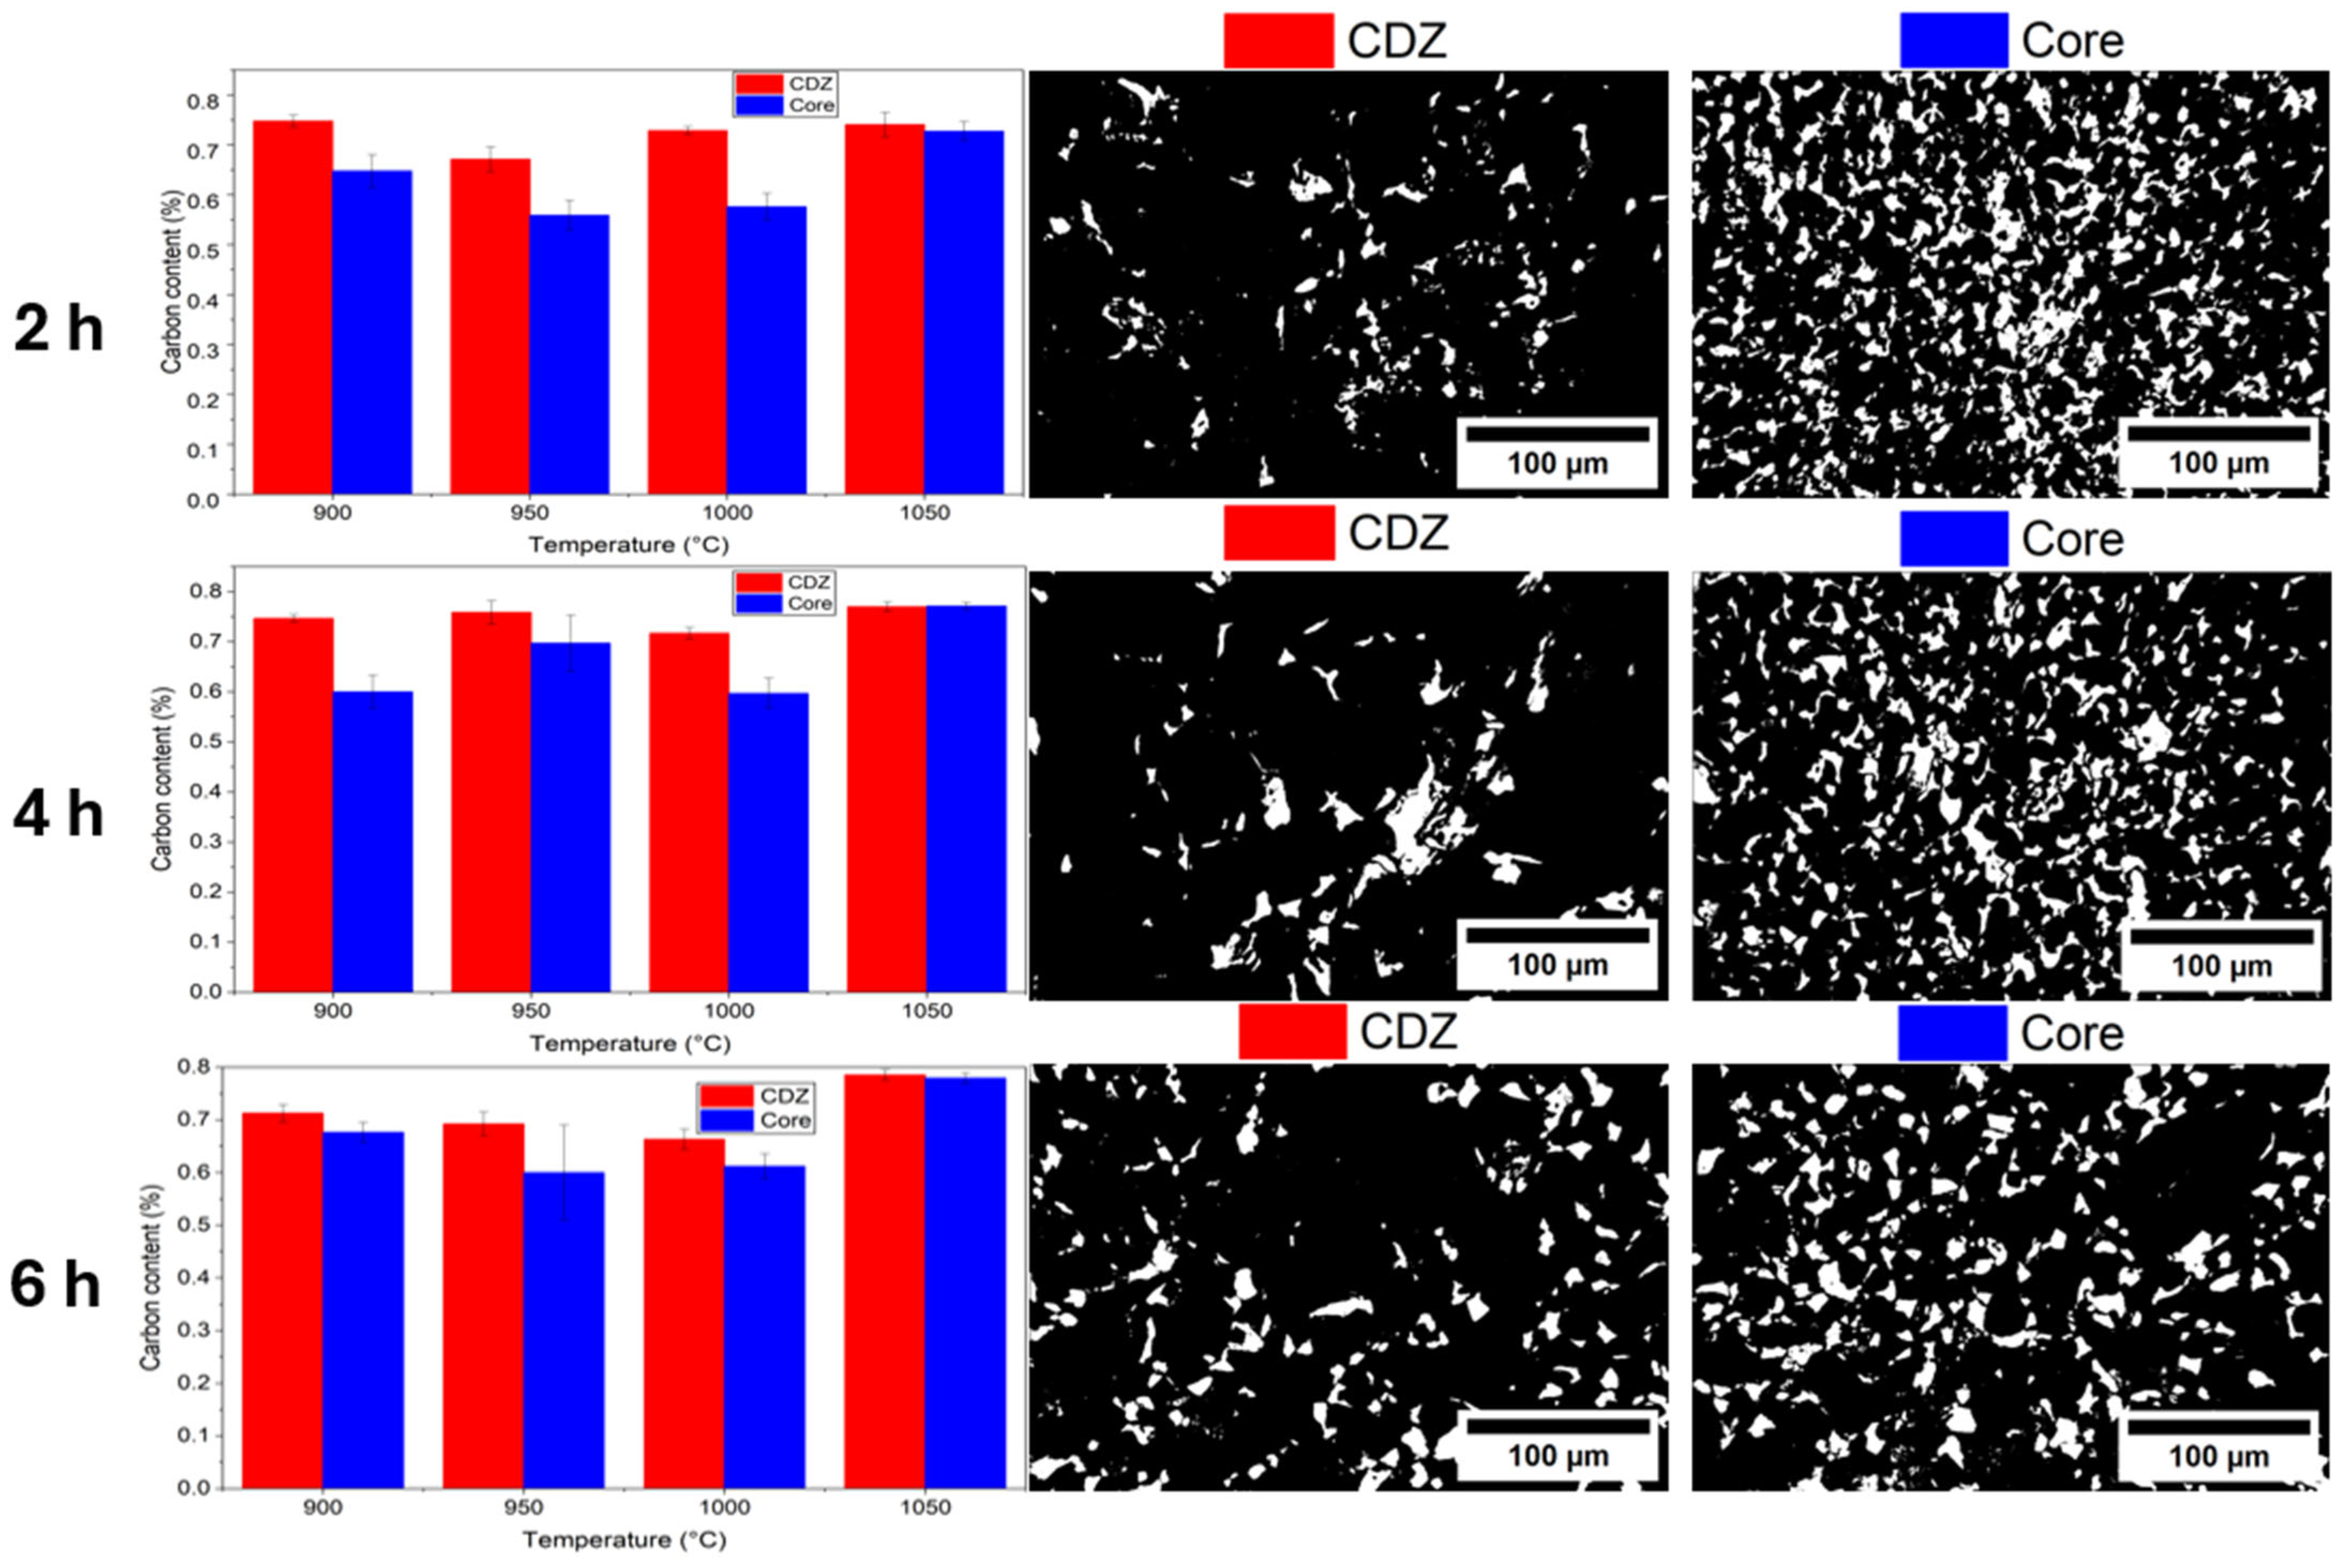
Acoording to the results reported by Lever rule, as the distance from the surface increased, so did the amount of ferrite (see Table 2), which contains less carbon in its structure. The results in Table 3 and the graphics in Figure 10 show a clear trend: at temperatures from 900 to 1000 °C and short treatment times, most pearlite colonies were near the surface, below the Fe2B layer. In contrast, at 1050 °C, the ferrite content decreased throughout the sample, resulting in a homogeneous microstructure from the surface to the core.
Table 2.
Ferrite proportion (%). The pearlite fraction is the balance.
Table 3.
Carbon content (%).
Figure 10.
Carbon content results: representative micrographs of CDZ and core regions.
An explanation for the apparent increase in the carbon content in the substrate during the boriding process is provided by Jain, V. and Sundararajan, G. [20]. The oxidation of B4C and SiC produces CO in the external regions of the pack where oxygen is available. In the inner regions protected from oxygen, the oxidation is incomplete, leading to the formation of residual carbon. This carbon diffuses toward the substrate, resulting in the high carbon content observed beneath the boride layer.
3.4. Energy Dispersive X-Ray Spectroscopy Analysis
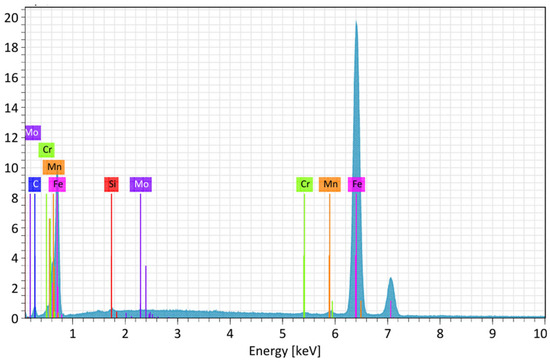
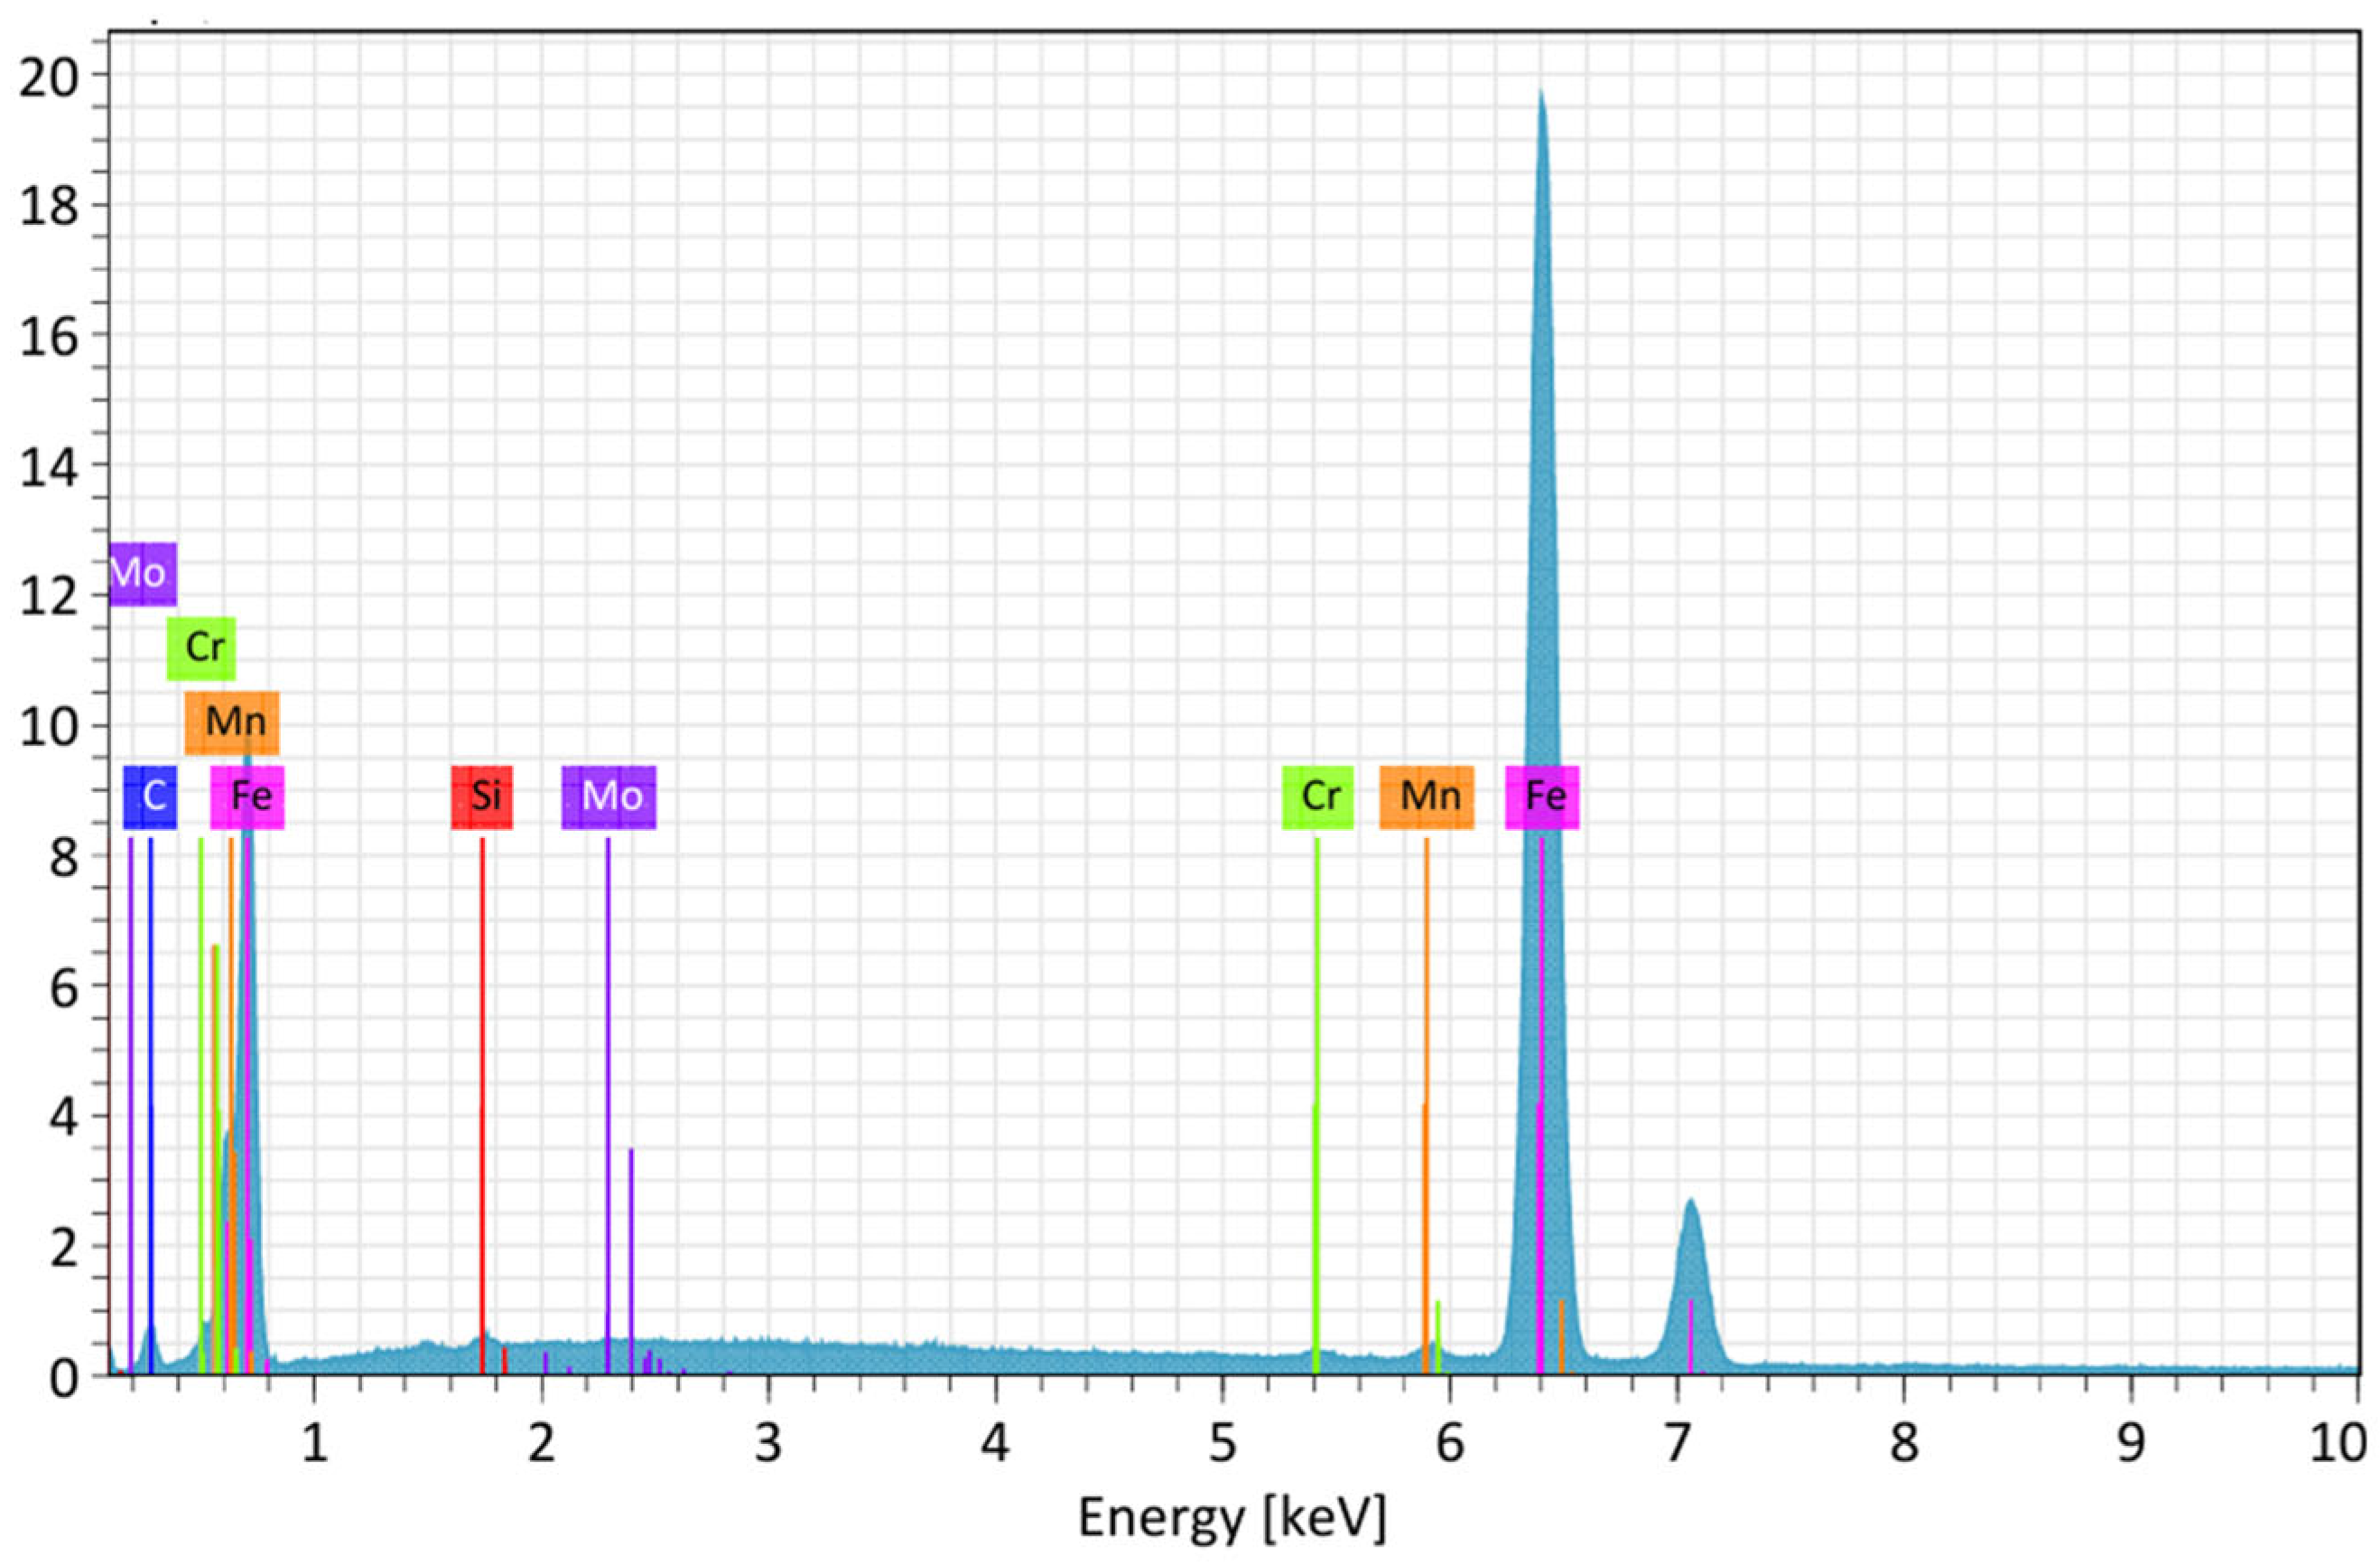
The EDS analysis revealed a redistribution of the carbon content during the thermochemical process. In all cases, the highest carbon concentration was in the CDZ below Fe2B. In contrast, the percentage decreased in the core. As shown in Table 4, for temperatures between 900 and 1000 °C, the increase in carbon content between the CDZ and the core was from 9 to 26%, depending on the treatment conditions. At 4 and 6 h at 1000 °C, the carbon content began to homogenize and remained constant. At 1050 °C, all time conditions showed a reduction in carbon content variation from 1 to 4%. These results are consistent with those obtained using the Lever rule [8]. The chemical composition is shown in Table 5. The EDS spectra in Figure 11 show a low presence of alloying elements and confirm that the boron diffusion did not reach the microstructure underlying the Fe2B phase.
Table 4.
EDS assays.
Table 5.
Chemical composition of untreated sample reported by EDS.
Figure 11.
Alloying elements of automotive steels.
3.5. Grain Size
In Table 6, the ASTM grain size values demonstrate the influence of the temperature and exposure time on the microstructure in the diffusion zone and the sample’s core. According to the study, the microstructure in the diffusion zone showed an increase in grain size; the number G decreased from 4 at 900 °C for 2 h to 2.5 at 1050 °C for 6 h, representing a size multiplier of 2.82.
Table 6.
Grain size number G.
In contrast, the grain size number G decreased from 9 at 900 °C for 2 h to 3 at 1050 °C for 6 h, resulting in a size multiplier of 64.4.
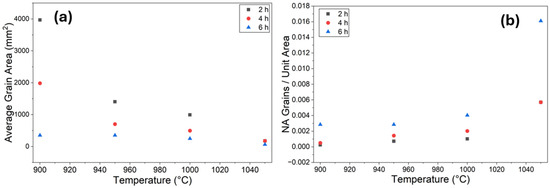
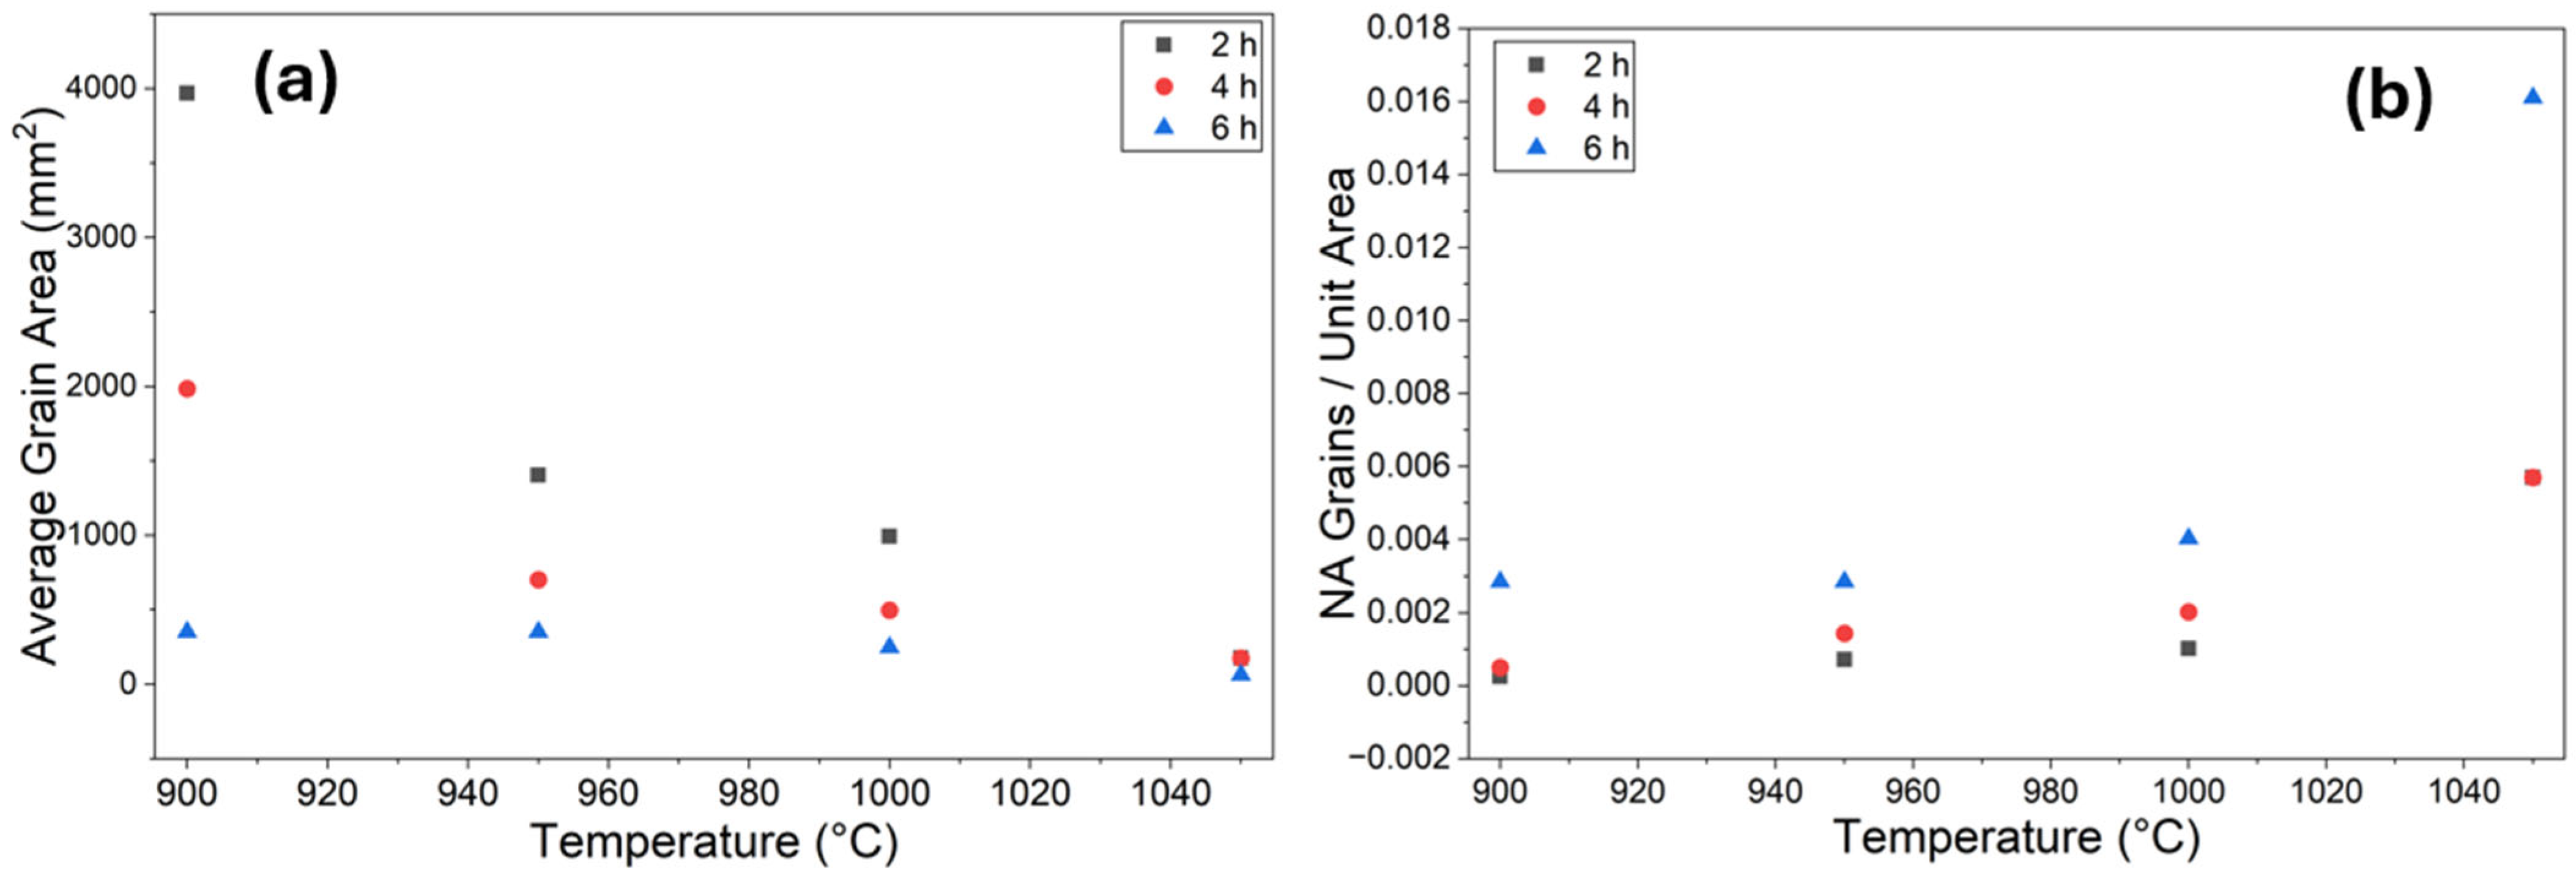
As the grain size increased, the number of grains per mm2 decreased by a factor of 64. Figure 12 shows the clear tendency of grain growth in terms of both the average grain area and number of grains per unit area.
Figure 12.
(a) Change in the average grain area in the material’s core. (b) Number of grains per square millimeter in the material’s core.
4. Discussion
Chemical etching with nital (4%) enabled the correct observation of the phases that comprise the microstructures of treated and untreated steel. OM and SEM analysis revealed redistribution of the carbon content within the two characteristic phases of iron-carbon structures. The pearlitic phase is composed of iron and iron carbide Fe3C (cementite), and the ferrite phase contains 0.022% wt. carbon content in its structure [8]. From 900 to 1000 °C, near the surface, the pearlitic phase represented around 91% of the microstructure; this proportion of pearlitic and ferritic phases remained unchanged as the distance from the surface increased, up to a limit. Near the center of the sample, the carbon content decreased, and the proportion of the pearlitic phase decreased to approximately 77% wt. These results are consistent with the Vickers test; the microhardness below the Fe2B layer was 19% higher than in the core. It is widely known that iron boride compounds do not allow great solubility of carbon. The presence of alloying elements, such as carbon, increases the activation energy required to displace them; consequently, the carbon atoms migrate to boron-free regions to relieve the stress caused by boriding. According to [20], the diffusion of carbon at ferritic temperatures (lower than 873 °K) is four orders of magnitude faster than that of boron at the same temperature. While at the austenitization temperature, the carbon diffusion slowed down, and the boron diffusion became faster. At the initial stage of boriding, if the sample has not reached the required temperature to begin the process, carbon from the silicon carbide (which accounts for 70% of the boron source) and carbon from B4C begin to diffuse into the base material.
In contrast, boron is practically static when the boriding process is at the incubation time. Therefore, carbon in the center of the material migrates to the outer regions, where the boron source is present, preventing reaction with the environment and causing carbon accumulation near the surface. Once boron diffusion has started, and iron boride compounds begin to form at the surface, both carbon diffusion from B4C and SiC and decarburization in the center are halted by the low solubility of carbon in iron boride compounds and the low diffusivity of carbon atoms at those temperatures. At 6 h of treatment, where the microhardness near the surface is just 7% higher than in the core, the carbon has enough time to distribute homogeneously in the hole microstructure and, consequently, so does the microhardness. At 1050 °C, the carbon content remained constant at 0.76% near the surface and in the core after three treatments of 2, 4, and 6 h. This apparent homogeneous microstructure is consistent with the Vickers test, where the microhardness profiles remained constant from the surface to the core. The grain size study indicates that the treatment temperature significantly influences the growth of pearlite colonies; the increased carbon content near the surface led to greater formation of extensive pearlite regions due to the slow cooling rate in the crucible after the thermochemical process. The mechanism of growth of pearlite colonies was described in [19] for eutectoid steels (0.81% carbon content); the pearlite nucleates at austenite grain boundaries. At austenite grain boundaries, cementite nucleates and precipitates, serving as a sink for carbon from the surroundings. During gradual cooling, ferrite nucleates and forms grain boundaries, which then nucleate and precipitate cementite. Once cementite has precipitated, the pearlite begins to grow toward the center of the grain. Thus, carbon enrichment in the boriding enhances this process, and the pearlite colonies seem to correspond to steel near the eutectoid point. The low carbon concentration in the core, where carbon from the surface has not yet reached, limits the growth of pearlite colonies, resulting in a lower microhardness in this region.
5. Conclusions
After analyzing the results on changes in the microstructure and their effects on the mechanical properties of the steel after being exposed to high temperatures, the following conclusions can be stated:
- The steel’s microstructure changed as the temperature rose during thermochemical treatment. These changes must be considered to avoid damage that could impair mechanical properties and render the material unsuitable for specific applications.
- As the temperature and treatment time increased, the carbon content changed, modifying the percentages of ferrite and pearlite in the microstructure and, as a consequence, the steel’s mechanical properties.
- At low temperatures and short treatment times, the carbon content in the steel was concentrated primarily beneath the layer formed during thermochemical treatment (CDZ). A high carbon concentration promotes the growth of pearlite colonies, thereby increasing the apparent microhardness of the steel.
- As the temperature and treatment time increased, the difference in microhardness between the CDZ and the core decreased, indicating a more uniform microhardness.
Author Contributions
Conceptualization, D.H.-D., R.T.-R., J.G.M.-H. and E.H.-S.; methodology, D.H.-D., R.C.-E. and J.G.M.-H.; validation, L.A.L.-D. and C.O.-Á.; formal analysis, J.G.M.-H. and E.H.-S.; investigation, Y.S.-F. and C.O.-Á.; resources, E.H.-S.; data curation, R.T.-R.; writing—original draft, D.H.-D., L.A.L.-D., Y.S.-F., C.O.-Á. and R.C.-E.; writing—review & editing, D.H.-D. and E.H.-S.; visualization, D.H.-D.; supervision, E.H.-S.; project administration, E.H.-S.; funding acquisition, E.H.-S. All authors have read and agreed to the published version of the manuscript.
Funding
This work was supported by the Instituto Politécnico Nacional in México, grant number 20254762.
Data Availability Statement
The original contributions presented in this study are included in the article. Further inquiries can be directed to the corresponding authors.
Acknowledgments
The authors thank the Center of Nanosciences and Micro–Nano Technologies of the Instituto Politécnico Nacional for their cooperation. They also thank the Universidad Autónoma de Coahuila and the Universidad de las Américas Puebla in México for their collaboration in developing this work.
Conflicts of Interest
The authors declare no conflicts of interest.
References
- Chen, A.Z.; Yu, X.; Ding, N.; Cong, J.; Sun, J.; Jia, Q.; Wang, C. Wear resistance enhancement of QT700-2 ductile iron crankshaft processed by laser hardening. Opt. Laser Technol. 2023, 164, 109519. [Google Scholar] [CrossRef] [Scilit]
- Zhu, S.; Yuan, W.; Cong, J.; Guo, Q.; Chi, B.; Yu, J. Analysis of regional wear failure of crankshaft pair of heavy-duty engine. Eng. Fail. Anal. 2023, 154, 107635. [Google Scholar] [CrossRef] [Scilit]
- Mateus, J.; Anes, V.; Galvão, I.; Reis, L. Failure mode analysis of a 1.9 turbo diesel engine crankshaft. Eng. Fail. Anal. 2019, 101, 394–406. [Google Scholar] [CrossRef] [Scilit]
- Hernández-Sánchez, E.; Hernández-Domínguez, D.; Tadeo-Rosas, R.; Sánchez-Fuentes, Y.; Linares-Duarte, L.A.; Orozco-Álvarez, C.; Miranda-Hernández, J.G.; Carrera-Espinoza, R. Tribological and Mechanical Behavior of Automotive Crankshaft Steel Superficially Modified Using the Boriding Hardening Process. Coatings 2024, 14, 716. [Google Scholar] [CrossRef] [Scilit]
- Ruiz-Trabolsi, P.A.; Chino-Ulloa, A.; Miranda-Hernández, J.G.; Tadeo-Rosas, R.; Carrera-Espinoza, R.; Velázquez, J.C.; Hernández-Sánchez, E. A Comparative Analysis of the Tribological Behavior of Hard Layers Obtained by Three Different Hardened-Surface Processes on the Surface of AISI 4140 Steel. Crystals 2022, 12, 298. [Google Scholar] [CrossRef] [Scilit]
- Campos-Silva, I.E.; Rodríguez-Castro, G.A. Boriding to improve the mechanical properties and corrosion resistance of steels. In Thermochemical Surface Engineering of Steels; Elsevier: Amsterdam, The Netherlands, 2015; pp. 651–702. [Google Scholar] [CrossRef] [Scilit]
- Alcántara, V. Transformaciones de la Austenita. 2004. Available online: https://www.researchgate.net/publication/380149966_CAPITULO_10_TRANSFORMACIONES_DE_FASES_DE_LA_AUSTENITA#full-text (accessed on 20 September 2026).
- Callister, W.D., Jr.; Rethwisch, D.G. Materials Science and Engineering: An Introduction, 10th ed.; John Wiley & Sons: Hoboken, NJ, USA, 2018. [Google Scholar]
- Fadare, D.A.; Fadara, T.G.; Akanbi, O.Y. Effect of Heat Treatment on Mechanical Properties and Microstructure of NST 37-2 Steel. J. Miner. Mater. Charact. Eng. 2011, 10, 299–308. [Google Scholar] [CrossRef]
- Duan, Y.; Wang, X.; Liu, D.; Bao, W.; Li, P.; Peng, M. Characteristics, wear and corrosion properties of borided pure titanium by pack boriding near α → β phase transition temperature. Ceram. Int. 2020, 46, 16380–16387. [Google Scholar] [CrossRef] [Scilit]
- Banerji, S.; Briant, C. Embrittlement, Engineering alloys. In Elsevier EBooks; Elsevier: Amsterdam, The Netherlands, 2003; pp. 407–432. [Google Scholar] [CrossRef] [Scilit]
- Rile, M. Reasons for the formation of cracks in boride coatings on steel. Metal. Sci. Heat Treat. 1974, 16, 836–838. [Google Scholar] [CrossRef] [Scilit]
- ASTM E-384-05a; Standard Test Method for Microindentation Hardness of Materials. The American National Standards Institute: Washington, DC, USA, 2005.
- Hanza, S.S.; Smoljan, B.; Štic, L.; Hajdek, K. Prediction of Microstructure Constituents’ Hardness after the Isothermal Decomposition of Austenite. Metals 2021, 11, 180. [Google Scholar] [CrossRef] [Scilit]
- Kral, M. Proeutectoid ferrite and cementite transformations in steels. In Elsevier EBooks; Elsevier: Amsterdam, The Netherlands, 2012; pp. 225–275. [Google Scholar] [CrossRef] [Scilit]
- ASM International. Materials Characterization. In ASM International eBooks; ASM International: Materials Park, OH, USA, 2019. [Google Scholar] [CrossRef] [Scilit]
- ASTM E112-13; Standard Test Methods for Determining Average Grain Size. ASTM International: Conshohocken, PA, USA, 2013.
- Caballero, F.; De Andrés, C.G.; Capdevila, C. Characterization and morphological analysis of pearlite in a eutectoid steel. Mater. Charact. 2000, 45, 111–116. [Google Scholar] [CrossRef] [Scilit]
- Zhang, F.; Zhao, Y.; Tan, Y.; Ji, X.; Xiang, S. Study on the Nucleation and Growth of Pearlite Colony and Impact Toughness of Eutectoid Steel. Metals 2019, 9, 1133. [Google Scholar] [CrossRef] [Scilit]
- Jain, V.; Sundararajan, G. Influence of the pack thickness of the boronizing mixture on the boriding of steel. Surf. Coat. Technol. 2002, 149, 21–26. [Google Scholar] [CrossRef] [Scilit]

Disclaimer/Publisher’s Note: The statements, opinions and data contained in all publications are solely those of the individual author(s) and contributor(s) and not of MDPI and/or the editor(s). MDPI and/or the editor(s) disclaim responsibility for any injury to people or property resulting from any ideas, methods, instructions or products referred to in the content. |
© 2026 by the authors. Licensee MDPI, Basel, Switzerland. This article is an open access article distributed under the terms and conditions of the Creative Commons Attribution (CC BY) license.