


Abstract
Historical copper tailings represent a potentially valuable secondary source of copper; however, their reprocessing is commonly constrained by complex mineral associations, insufficient liberation of copper-bearing minerals, and secondary alteration of mineral surfaces. This study develops and experimentally validates an integrated approach to the flotation reprocessing of historical copper tailings, combining chemical, mineralogical, phase, and particle-size characterization with optimization of grinding and reagent conditions, closed-circuit flotation tests, mathematical modeling, and pilot-scale validation. The investigated tailings contained approximately 0.2% Cu, with copper occurring predominantly as chalcopyrite together with secondary copper sulfides closely associated with pyrite, magnetite, and gangue minerals. Laboratory experiments established suitable grinding and flotation conditions and demonstrated the effectiveness of Na2S for sulfidization of altered copper minerals and a combined potassium butyl xanthate–AERO 9863 collector system. Closed-circuit tests showed that preliminary classification of the feed combined with regrinding of the rougher concentrate prior to cleaning provided the best separation performance among the investigated flowsheet configurations, producing a combined concentrate containing 6.74% Cu at a copper recovery of 46.09%. A statistically significant quadratic regression model (R2 = 0.9494) was developed to quantify the effects of the main flotation variables and identify a favorable reagent operating region. Pilot-scale testing of 5.15 t of historical tailings confirmed the technological applicability of the proposed flowsheet, producing a combined copper product containing 8.08% Cu at 55.38% recovery while reducing the Cu content of the final tailings to 0.1%. The results demonstrate the technological feasibility of recovering residual copper from the investigated historical tailings and highlight the value of integrating mineralogical characterization, process optimization, mathematical modeling, and pilot-scale validation for the development of tailings reprocessing flowsheets.
1. Introduction
Copper (Cu) is one of the most widely used non-ferrous metals and is increasingly regarded as a critical raw material [1,2]. Its high electrical and thermal conductivity, corrosion resistance, ductility, and recyclability have led to its extensive use in the electrical industry, renewable energy systems, electric vehicles, power grids, digital and communication technologies, mechanical engineering, construction, and transportation [3,4,5,6,7]. The ongoing expansion of electrification and energy infrastructure is driving further growth in copper demand [8,9]. Combined with declining Cu contents in primary ores, this trend has intensified interest in alternative and secondary sources of copper [9,10,11].
During the beneficiation of copper ores, valuable minerals are recovered into the concentrate, whereas the bulk of the processed material reports to tailings and is deposited in tailings storage facilities [12]. The amount of tailings generated may account for up to 99% of the processed ore [13,14], while the production of 1 t of copper from low-grade ores may generate approximately 128–196 t of beneficiation waste [15]. The tailings issue is particularly significant for the copper industry: in 2016, copper mining accounted for approximately 46% of the global volume of mining tailings, representing the largest share among the mineral commodities considered [16,17]. Therefore, the reprocessing and sustainable management of copper tailings are important both for the recovery of secondary mineral resources and for reducing the volume of accumulated mine waste [11,18].
Historical tailings storage facilities are of particular interest as potential secondary sources of copper. Modern copper tailings contain approximately 0.1% Cu on average, whereas Cu contents in historical tailings may reach 0.2–0.6% [19]. The feasibility of reprocessing such materials has been demonstrated in recent studies. Trifunović et al. [20], investigating historical flotation tailings from copper production in Bor, Serbia, reported a Cu content of approximately 0.24% and demonstrated that detailed chemical and mineralogical characterization is an essential step in selecting an appropriate technology for metal recovery. Similarly, Dadzie et al. [21] showed that residual copper in sulfide flotation tailings may occur predominantly as chalcopyrite, partly locked within iron oxides and silicate minerals. Consequently, mineral liberation and the nature of mineral intergrowths become key factors in selecting an appropriate reprocessing technology. Thus, the feasibility of reprocessing historical tailings is determined not only by the total Cu content but also by the modes of occurrence of Cu-bearing minerals, their degree of liberation, and their associations with gangue minerals.
Hydrometallurgical and flotation methods are commonly employed to recover residual copper from low-grade ores and secondary mineral resources [14,22,23,24,25,26,27,28]. The selection of an appropriate processing route strongly depends on the mineralogical and phase composition of the feed material. In flotation, separation efficiency is additionally governed by the degree of mineral liberation, mineral surface properties, and the selected reagent regime [29].
Recent studies [21,30,31,32] also indicate that, for complex low-grade materials, a promising strategy involves preliminary material characterization followed by the selection or combination of separation methods according to the properties of the constituent mineral phases. For example, based on the mineralogical characterization of copper tailings, Dadzie et al. [21] considered the application of advanced flotation technologies, magnetic separation, and gravity separation in addition to conventional flotation. A similar principle of targeted selection and integration of beneficiation methods according to mineralogical characteristics has been demonstrated for the processing of low-grade magnesite ores using magnetic separation and flotation [30]. These findings emphasize the need to directly link detailed characterization of secondary mineral resources with the selection and optimization of an appropriate processing flowsheet.
Published studies confirm the potential of tailings and other low-grade secondary mineral resources as sources of valuable components [20,21,30,31,32]. However, a substantial proportion of previous research has focused either on detailed tailings characterization and the assessment of potentially applicable processing methods [20,21] or on laboratory-scale investigations of individual beneficiation operations [30,31,32]. Studies demonstrating a systematic transition from mineralogical assessment and laboratory-scale flotation optimization to closed-circuit testing and subsequent pilot-scale validation remain limited. Such a transition is essential for assessing the technological feasibility of a proposed flowsheet for the reprocessing of historical copper tailings.
The relevance of the present study lies in the need to develop a technically sound approach to recovering residual copper from historical tailings while accounting for mineral associations, the degree of liberation, and secondary alteration of Cu-bearing minerals. Rather than assessing the reprocessing potential of tailings solely on the basis of their composition, systematic experimental validation of the proposed flowsheet is required, progressing from feed characterization and optimization of flotation parameters to closed-circuit and pilot-scale testing. The aim of this study is to develop and experimentally validate a flotation flowsheet for the reprocessing of historical copper tailings based on comprehensive feed characterization, optimization of the grinding fineness and flotation reagent regime, subsequent verification of the selected operating parameters in closed-circuit tests, mathematical modeling of the process, and pilot-scale testing.
2. Materials and Methods
2.1. Tailings Source and Sampling
The historical tailings investigated in this study originated from the tailings storage facility of a large copper beneficiation plant located in Central Kazakhstan, where predominantly sulfide copper ores have been processed. Tailings accumulation at the facility began in the 1950s and has continued over an extended period. The material used in the present study was obtained during an exploration drilling campaign conducted in 2019 and therefore represents tailings accumulated in the storage facility up to the time of sampling. Because material from different depths and depositional intervals was included in the composite sample, the tailings represent different periods of deposition and cannot be assigned a single storage duration.
Exploration sampling was performed predominantly within the central part of the main tailings impoundment using vertical percussion cable-tool drilling on an approximately 100 × 200 m grid. Samples were generally collected over 1–2 m depth intervals. At the base of the tailings deposit, material was sampled separately in one to three additional intervals of up to approximately 1 m. Material recovered from each drilling interval using a drive sampler was divided using a sample splitter; approximately 5–10 kg was retained as the exploration sample, while the remaining material was sealed in polyethylene bags and preserved in its as-recovered condition. A total of 1497 interval samples, corresponding to approximately 9.1 t of material, were collected during the sampling campaign. The collected material was stored under conditions protected from moisture and direct light prior to subsequent sample preparation and testing.
The individual exploration samples showed substantial compositional variability, with Cu contents ranging from <0.005 to 0.84%, reflecting the inherent heterogeneity of the historical tailings deposit. The mass-weighted Cu content of the composite material was approximately 0.21%. Sample preparation and atomic absorption analyses were performed in an accredited laboratory, and internal and external geological quality-control procedures were applied to the analytical results, with satisfactory control performance.
The technological sample used for the characterization and flotation experiments reported in this study was prepared predominantly from drilling material representing the central part of the main tailings impoundment. The material was composited and homogenized prior to subdivision into representative subsamples for chemical, mineralogical, phase, particle-size, and flotation investigations. Consequently, the technological sample is considered representative of the sampled central domain of the tailings impoundment; extrapolation of the results to the entire storage facility should take into account the spatial and vertical heterogeneity characteristic of historical tailings deposits.
2.2. Chemical and Phase Analyses
The concentrations of Cu, Pb, Zn, Fe, Mn, and other metallic elements in the historical tailings, flotation products, and solutions obtained during selective chemical extractions were determined by flame atomic absorption spectrometry (FAAS) using a novAA 800 F spectrometer (Analytik Jena, Jena, Germany) equipped with element-specific hollow-cathode lamps. Measurements were performed in an air–acetylene flame at acetylene and air flow rates of approximately 2.5 and 10 L min−1, respectively, using the corresponding analytical resonance lines; Cu was measured at 324.7 nm. Spectral data acquisition and concentration calculations were performed using ASpect LS software, version 1.8. (Analytik Jena).
Calibration solutions were prepared by serial dilution of certified single-element standard solutions with an initial metal-ion concentration of 1.0 mg mL−1. The working calibration range was 0.5–5.0 mg L−1 and was selected to remain within the linear response range of the instrument. Each calibration solution was measured in triplicate, and calibration curves with coefficients of determination (R2) ≥ 0.995 were accepted. Reagent blanks and independently prepared control solutions were analyzed within each analytical batch to monitor contamination, instrumental drift, and calibration stability.
For determination of the total metal contents, approximately 0.200 g of each homogenized analytical sample was subjected to acid digestion using concentrated HCl and HNO3 of analytical grade according to GOST 31875-2012 [33]. After digestion, the solutions were evaporated to moist salts, quantitatively transferred into 100-mL volumetric flasks, diluted to volume with double-distilled water, and analyzed by FAAS. GOST 31875-2012 specifies atomic-absorption methods for determination of Zn, Pb, Cu, Cd, Fe, Co, Ni, and Mn in non-ferrous-metal ores and their beneficiation/metallurgical products [33].
Copper phase analysis. The distribution of Cu among different mineral forms was determined by sequential selective chemical extraction according to GOST 33207-2014 [34]. The procedure distinguishes water-soluble Cu sulfates, oxidized Cu minerals, secondary Cu sulfides, and primary Cu sulfides by their differential solubility in the selective extractants specified by the standard. After each extraction step, the suspension was filtered and the corresponding filtrate was quantitatively transferred to a volumetric flask and diluted to the prescribed volume. The Cu concentration in each extract was subsequently determined by FAAS using the novAA 800 F spectrometer at the Cu resonance wavelength of 324.7 nm. Each phase determination was performed in duplicate, and the arithmetic mean was used for subsequent calculations. The contribution of each Cu form was expressed as a percentage of the total Cu accounted for by the phase analysis.
Iron analysis. Total Fe was determined titrimetrically in accordance with GOST 33209-2014 [35], which specifies a titrimetric procedure for determination of Fe in copper-bearing and polymetallic ores and their processing products. For Fe phase analysis, sequential selective dissolution was used to differentiate Fe associated with pyrrhotite, pyrite, and oxidized Fe-bearing phases. Iron released during each selective extraction step was determined titrimetrically. All determinations were performed in duplicate, and the arithmetic mean was used for calculation of the Fe distribution among the operationally defined fractions.
Sulfur determination. Total sulfur was determined gravimetrically according to ST RK 1354-2005 [36,37]. The homogenized analytical sample was decomposed with sodium peroxide to convert the sulfur species to sulfate. Sulfate was subsequently precipitated as BaSO4 by addition of an excess of hot barium chloride solution. The precipitate was allowed to digest, filtered through an ashless quantitative filter, and washed with hot double-distilled water until chloride ions were no longer detected in the washings using AgNO3. The filter containing the precipitate was transferred to a pre-weighed crucible, dried, and ignited in a SNOL 7.2/1100 muffle furnace (Umega, Utena, Lithuania) at 800–900 °C to constant mass. Total sulfur was calculated from the mass of BaSO4 using the corresponding gravimetric conversion factor. Weighing was performed using a Shimadzu AX220 analytical balance (Shimadzu Corporation, Kyoto, Japan) with a readability of 0.0001 g. Duplicate determinations were performed and the arithmetic mean was reported.
Analytical quality assurance and quality control (QA/QC). QA/QC procedures included calibration verification, reagent blanks, control solutions, and replicate analyses. FAAS calibration was performed using a minimum series of working standards prepared from certified metal standard solutions. Calibration curves were accepted when R2 ≥ 0.995, and the calibration response was periodically checked using control solutions during each analytical batch. Reagent blanks were carried through the corresponding analytical procedure to evaluate potential contamination from reagents and laboratory operations. Analytical samples used for chemical and phase analyses were analyzed in duplicate, whereas calibration standards were measured in triplicate. The mean of replicate sample determinations was reported. Analytical balances were checked using certified calibration weights prior to gravimetric measurements. For titrimetric analyses, reagent blanks were used to correct the titrant consumption.
Matrix-matched certified reference materials were not available for all investigated products; therefore, analytical performance was controlled primarily using certified calibration solutions, procedural blanks, independently prepared control solutions, and replicate sample analyses.
Method-specific limits of detection and quantification and expanded analytical uncertainties were not independently determined within the present study.
2.3. Semi-Quantitative Mineralogical Analysis
Representative subsamples were obtained from the homogenized bulk tailings sample and used to prepare polished briquettes for reflected-light microscopy. Mineralogical examination was performed using an OLYMPUS BX 53 optical microscope (Olympus, Tokyo, Japan) equipped with a SIMAGIS XS-3CU digital camera (SIAMS Ltd., Yekaterinburg, Russia) and Mineral C7 image-analysis software, version 7 (SIAMS Ltd.). Ore minerals were identified based on their diagnostic optical characteristics in reflected light, including reflectance, color, anisotropy, morphology, textural relationships, and associations with adjacent mineral phases. Grain size, degree of liberation, mineral intergrowths, and evidence of secondary alteration were also recorded. Semi-quantitative mineral abundances were estimated by digital image analysis of representative microscope fields acquired from the polished sections. Mineral phases were identified and assigned within the analyzed images, after which the projected area occupied by each identified mineral phase was measured using Mineral C7.
2.4. Particle-Size Analysis
The particle-size distribution of the feed material was determined by a combination of wet and dry sieving. The resulting size fractions were collected separately, dried, weighed, and subjected to chemical analysis for Cu and Fe. The mass yield of each size fraction was calculated relative to the total mass of the material subjected to size classification. The distributions of Cu and Fe among the size fractions were calculated from the mass yield of each fraction and its corresponding elemental content. The total Cu and Fe contents derived from the size-fraction analysis therefore represent mass-weighted values calculated from the individual fractions rather than independent analyses of the homogenized bulk sample. The particle-size data were used to assess the preferential distribution of Cu and Fe among coarse, intermediate, and fine particle-size fractions.
2.5. Flotation Tests
Prior to laboratory testing, the tailings were air-dried under ambient conditions and screened through a 1 × 1 mm sieve. The +1 mm fraction was crushed to a particle size below 1 mm and recombined with the −1 mm fraction. The entire material was then homogenized three times using the ring-and-cone method. The bulk sample was subsequently reduced by quartering, and a representative sample was obtained using the square-sampling method. Representative 1.0 kg test portions were prepared for the laboratory flotation experiments.
Prior to flotation testing, the feed material was ground in MShL-7 and MShL-1 laboratory ball mills (NPK Mekhanobr-Tekhnika, Saint Petersburg, Russia). The solid-to-liquid-to-ball charge ratio during grinding was maintained at S:L:B = 1:0.5:9.
Laboratory flotation tests were conducted using mechanical flotation machines (NPK Mekhanobr-Tekhnika, Saint Petersburg, Russia) with cell volumes of 0.5, 0.75, 1.0, and 3.0 dm3. During flotation, pulp pH was monitored using an IT pH-150MI pH meter (Izmeritelnaya Tekhnika LLC, Moscow, Russia). Lime (CaO) was used to control pulp alkalinity. Sodium sulfide (Na2S) was used as a sulfidizing agent for the surfaces of oxidized minerals. Methyl isobutyl carbinol (MIBC) was used as the frother.
The laboratory flotation tests were conducted using a 1.0 kg feed sample at a pulp solids content of approximately 25%. The impeller speed was maintained at 1500 rpm. The reagents were added sequentially under agitation prior to aeration in the following order: CaO → Na2S → collector → MIBC. The pulp was conditioned for 3 min after CaO addition, 2 min after Na2S addition, 2 min after collector addition (1 min for xanthate collectors), and 1 min after MIBC addition. Air was then introduced at a flow rate of 0.07 L s−1 to initiate flotation.
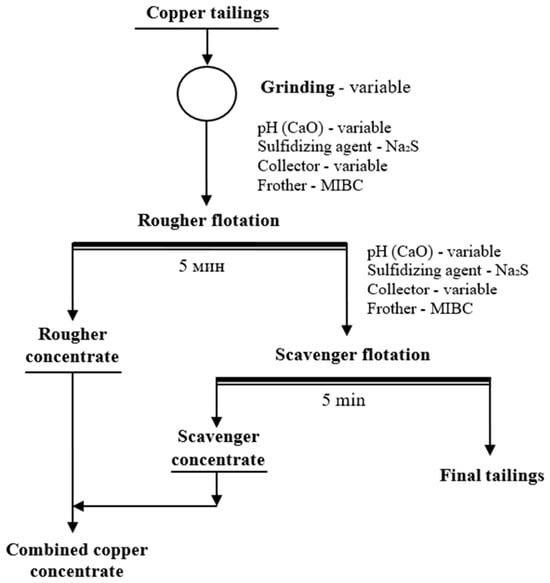
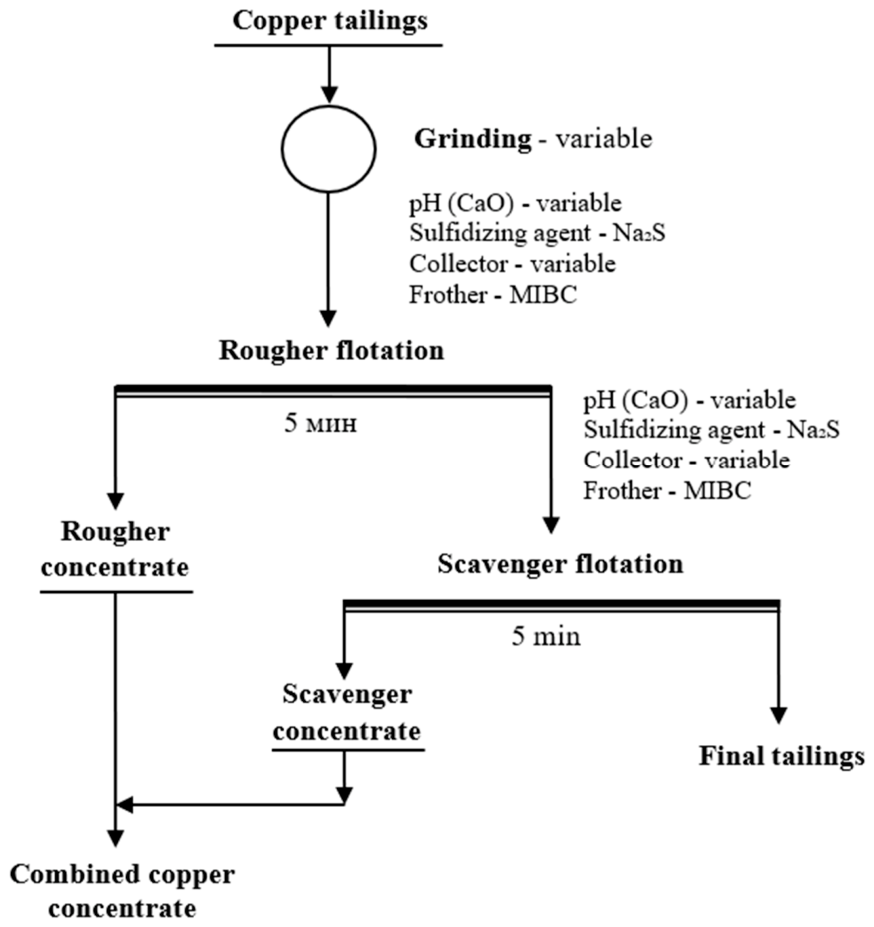
The experimental program comprised a systematic investigation of the effects of grinding fineness and reagent regime on flotation performance. Initial optimization of the operating parameters was performed through a series of open-circuit flotation tests. A flowsheet of the laboratory flotation tests is presented in Figure 1, while the ranges of the investigated operating parameters and reagent dosages are summarized in Table 1.
Figure 1.
Flowsheet of the open-circuit flotation tests.
Table 1.
Conditions and operating parameters of the open-circuit flotation tests.
The one-factor open-circuit flotation tests used to investigate grinding fineness, pulp pH, and reagent dosages were performed once for each investigated condition. These experiments were used to identify technological trends and sequentially select rational operating conditions; consequently, because independent replicates were not performed at this stage, the statistical significance of small differences between individual conditions was not evaluated.
During rougher flotation, the effects of feed grinding fineness, pulp pH, Na2S dosage, collector type, and collector dosage were investigated. Grinding fineness was varied from 70% to 90% passing 0.071 mm, with target values of 70%, 75%, 80%, 85%, and 90%. The pulp pH was varied from 7.5 to 11.0. The Na2S dosage during rougher flotation was 0, 50, 100, 150, and 200 g/t.
Potassium butyl xanthate (PBX), potassium ethyl xanthate (PEX), potassium amyl xanthate (PAX), butyl aerofloat, AEROPHINE 3418A, AERO 3894, AERO 9863, AERO 3715, and AERO 400 were investigated as collectors, either individually or in combination with PBX. The dosages of the individual collectors and collector mixtures investigated are given in Table 1.
During scavenger flotation, the Na2S dosage was varied from 50 to 125 g/t. PBX dosages of 20, 30, 40, 50, and 60 g/t were investigated. In addition, combined collector regimes comprising AERO 9863/PBX, AERO 3715/PBX, and AERO 400/PBX were evaluated at the ratios and dosages specified in Table 1.
The durations of both rougher and scavenger flotation in the open-circuit tests were 5 min (Figure 1). Based on the results of the systematic test series, appropriate grinding and reagent conditions were selected. The durations of the rougher and scavenger flotation stages and the number of cleaning stages for the copper concentrate were subsequently determined based on the laboratory test results and flotation kinetics.
In the one-factor laboratory tests, no formal multi-response desirability function was applied. Rational operating conditions were selected by jointly considering Cu recovery, Cu content in the flotation product, and Hancock–Luyken separation efficiency, with the aim of achieving an appropriate balance among these metallurgical indicators. In contrast, Cu recovery was used as the sole response variable in the subsequent Central Composite Design (CCD), and regression-based optimization was performed by maximizing the predicted Cu recovery within the investigated experimental domain.
The selected operating conditions were then verified in a series of closed-circuit tests incorporating cleaning stages for the rougher copper concentrate.
For each investigated flowsheet, six consecutive closed-circuit cycles were performed. The first cycle was conducted without recycled intermediate products. From the second cycle onward, the intermediate products generated in the preceding cycle were returned to the corresponding stages of the subsequent cycle. The rougher and scavenger concentrates were each subjected to three successive cleaning stages. The third-cleaner tailings were recycled to the second cleaning stage, and the second-cleaner tailings were recycled to the first cleaning stage. The first-cleaner tailings of the rougher concentrate were returned to the rougher flotation stage, whereas the first-cleaner tailings of the scavenger concentrate were returned to the scavenger flotation stage. The third-cleaner concentrates from the rougher and scavenger circuits were collected as final copper products, whereas the scavenger flotation tailings were discharged as final tailings. The final cycles showed relatively stable product yields, Cu grades, and Cu recoveries and were therefore used to evaluate the performance of the investigated flowsheets.
2.6. Evaluation of Flotation Efficiency
The Hancock–Luyken efficiency criterion was used to quantitatively evaluate flotation separation efficiency. For a two-component system, this criterion characterizes the efficiency of a beneficiation process by comparing the actual separation performance with the theoretical ideal separation [38,39]. The Hancock–Luyken efficiency criterion was calculated using Equation (1):
where α is the Cu content in the feed, β is the Cu content in the concentrate, and γ is the concentrate yield.
The Hancock–Luyken criterion was treated as a continuous comparative measure of separation performance. Its values range from 0%, corresponding to no effective separation, to a theoretical maximum of 100%, corresponding to ideal separation. Higher values indicate improved recovery of the valuable component relative to the recovery of gangue into the concentrate. Because universally accepted threshold values for classifying a process as inefficient, efficient, or highly efficient have not been established, the criterion was used only for comparative evaluation of the investigated operating conditions and flowsheet configurations.
2.7. Mathematical Modeling
To quantitatively assess the combined effects of the operating factors and optimize the parameters of rougher flotation, a designed multifactor experiment was conducted [1,40,41]. Rougher flotation was selected for mathematical modeling because it represents the key stage of the proposed flowsheet, during which the majority of the Cu-bearing minerals are recovered and the product subjected to subsequent cleaning stages is produced.
A central composite design (CCD) was employed for mathematical modeling of the flotation process. The independent factors were pulp pH (X1), Na2S dosage (X2), potassium butyl xanthate (PBX) dosage (X3), and AERO 9863 dosage (X4). The factor ranges were selected based on the results of the preliminary flotation tests. The investigated factor levels are presented in Table 2.
Table 2.
Factors and levels used in the central composite design.
Cu recovery to the combined copper concentrate (%) was used as the response variable (Y). The other flotation conditions were kept constant, including the flotation cell volume, aeration and pulp agitation conditions, and reagent conditioning time.
The experimental design comprised factorial, axial, and center points and included a total of 29 experimental runs, allowing the linear and quadratic effects of the investigated factors, as well as their two-factor interactions, to be evaluated.
The experimental data were fitted using a second-order polynomial model:
where Y is the Cu recovery to the combined copper concentrate, %; b0 is the intercept; b1, b2, b3, b4 are the coefficients of the linear terms; b12, b13, b14, b23, b24, b34—are the coefficients of the two-factor interaction terms; b11, b22, b33, b44 are the coefficients of the quadratic terms describing process nonlinearity; X1, X2, X3, X4 are the investigated factors.
Each experimental design point was performed in duplicate, and five center-point runs were included to assess response variability near the center of the experimental domain.
The coefficients of the regression model were estimated using the least-squares method. The statistical significance of the regression coefficients was evaluated using Student’s t-test, whereas the adequacy of the model was assessed using Fisher’s F-test. Based on the resulting model, response surfaces were constructed, and the combination of operating parameters providing the maximum Cu recovery within the investigated experimental domain was determined.
2.8. Pilot-Scale Tests
To verify the operating parameters established in the laboratory tests, pilot-scale tests were conducted at an experimental mineral processing plant with a throughput of 50 kg/h. The pilot plant comprised a crushing and screening circuit, a grinding and classification circuit, a flotation circuit with a reagent preparation and dosing system, and a wastewater treatment system.
The material was ground in a single stage using a ball mill with dimensions of 416 × 445 mm and a volume of 60 dm3 (NPK Mekhanobr-Tekhnika, Saint Petersburg, Russia). The mill was operated in a closed circuit with a classifier, with a ball charge of 110 kg and ball diameters ranging from 20 mm to 40 mm. The mill discharge was fed to the classifier, and the classifier sands were returned to the mill for further grinding. The classifier overflow, containing 70–75% of the −0.071 mm size fraction, was directed to rougher flotation.
Flotation was carried out in mechanical flotation cells (NPK Mekhanobr-Tekhnika, Saint Petersburg, Russia). Diaphragm pumps were used to feed the classifier overflow to the flotation circuit, whereas sand pumps were used to transport the flotation products. Flotation reagents were dosed using peristaltic pumps, while lime was fed to the mill using skip feeders. The resulting copper products were dewatered in two stages, comprising thickening in settling tanks followed by drying.
A total of approximately 5.15 t of historical copper tailings was processed during the pilot-scale campaign. Approximately 2.25 t was processed during the initial commissioning and operating-condition adjustment stage. After stabilization of the process conditions, a 58 h metallurgical balance stage was conducted at an average throughput of approximately 50 kg h−1, during which approximately 2.90 t of material was processed. Process monitoring and analytical control were performed by collecting samples at all designated sampling points throughout the flowsheet. During each 5 h operating shift, incremental samples were collected at 30 min intervals and combined to form a single representative composite sample for the shift. The resulting shift composite sample was subsequently analyzed to determine the main metallurgical performance indicators. During the 58 h balanced operating period, 42.3 kg of combined copper product was obtained, corresponding to a product yield of approximately 1.46%. The metallurgical performance reported for the pilot-scale tests was evaluated based on this stabilized balance period, together with the corresponding flotation reagent consumption.
3. Results and Discussion
3.1. Sample Characterization
The chemical composition of the historical copper tailings is presented in Table 3.
Table 3.
Chemical composition of the historical copper tailings sample.
The major component of the sample was SiO2, with a content of 65.33%. The Al2O3, CaO, MgO, and MnO contents were 9.23%, 4.98%, 0.76%, and 0.34%, respectively. The total Fe content was 6.01%. Thus, the chemical composition confirms the predominance of rock-forming components in the feed material.
The Cu content in the feed sample was 0.20%, while the Zn and Pb contents were 0.25 and 0.05%, respectively. The total sulfur content was 0.90%. The contents of precious metals were low, with 0.04 g/t Au and 0.55 g/t Ag.
From a technological perspective, the Cu content is of primary interest for subsequent recovery by flotation.
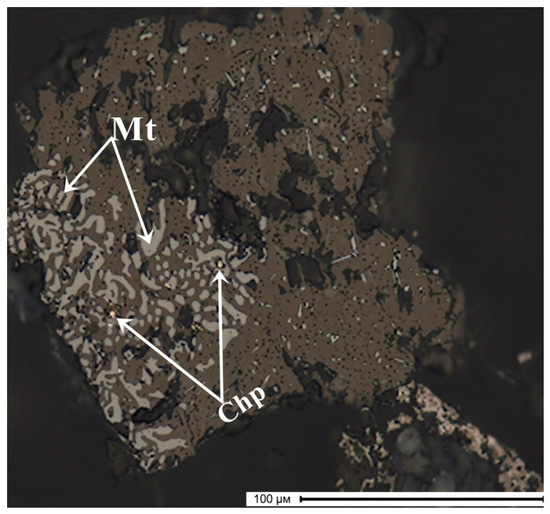
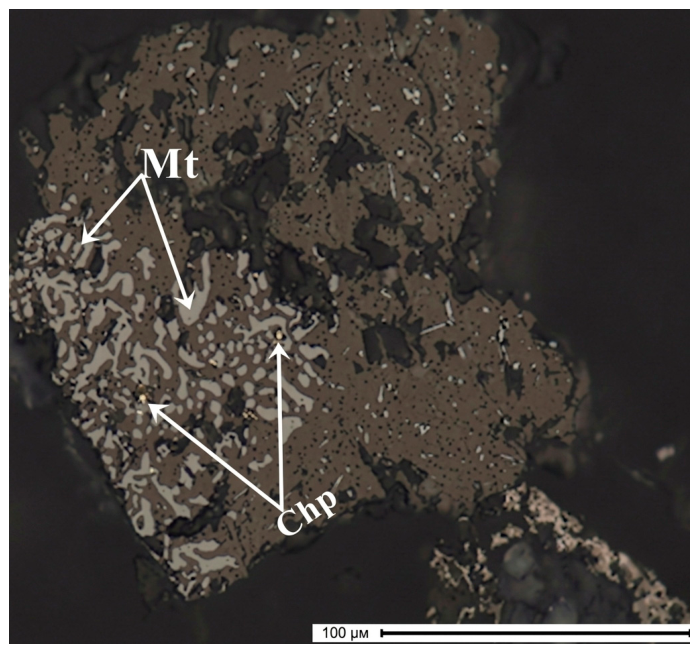
Mineralogical examination of the historical copper tailings showed that the ore mineral assemblage was dominated by magnetite, pyrite, and Cu-bearing minerals. Magnetite was the predominant ore mineral and occurred over a wide size range, from a few micrometers to 0.15 mm. It occurred predominantly as intergrowths with gangue minerals, exhibited extensive fracturing, and was partially replaced by hematite (Figure 2). Rare intergrowths of magnetite with chalcopyrite, pyrite, and native copper were also observed in individual grains.
Figure 2.
Magnetite inclusions in a gangue mineral, ×200 (Mt—magnetite; Chp—chalcopyrite; Hm—hematite; Py—pyrite).
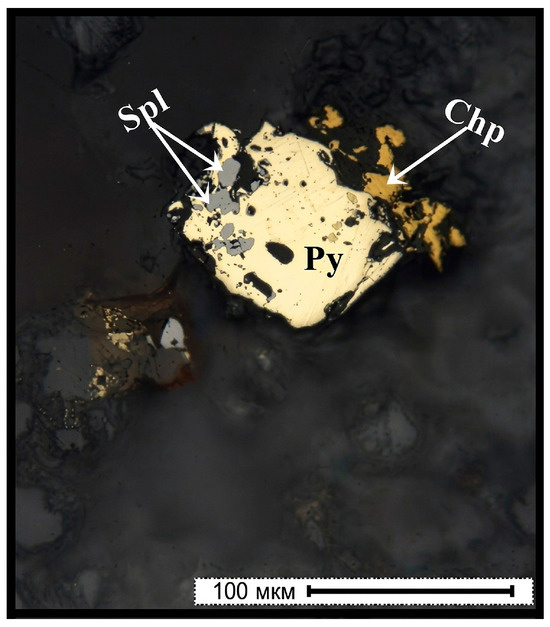
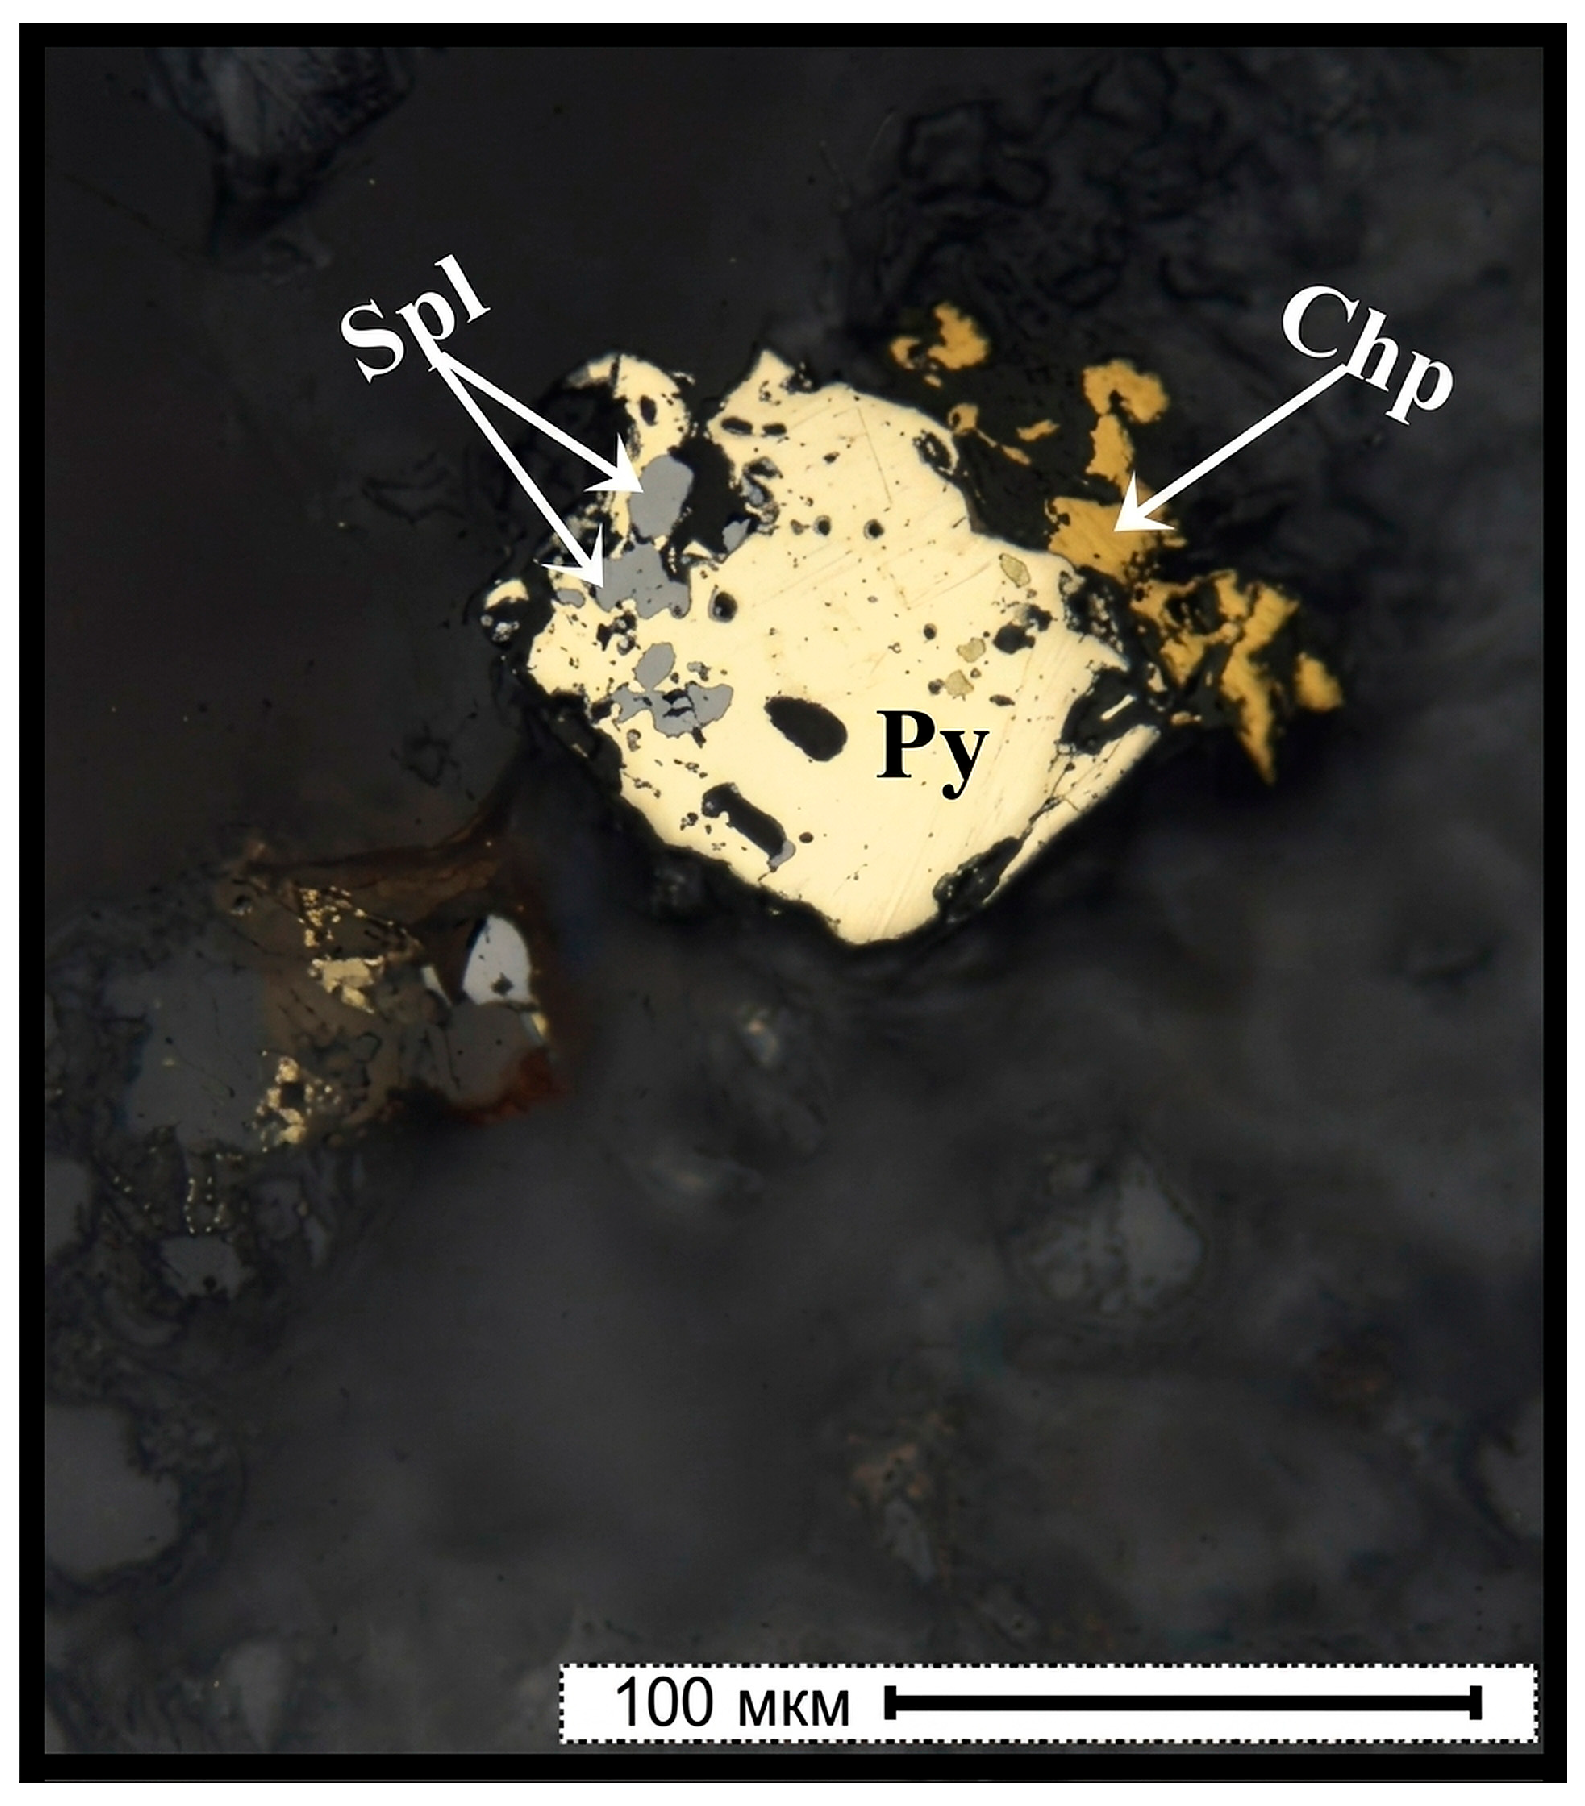
Pyrite and chalcopyrite were minor ore minerals and exhibited complex mutual associations. Pyrite occurred both as liberated grains and as intergrowths with gangue minerals and, less frequently, with magnetite, chalcopyrite, bornite, sphalerite, and chalcocite (Figure 3). Pyrite grain sizes ranged from 0.001 to 0.20 mm. Some pyrite grains exhibited oxidation with the formation of goethite, indicating secondary alteration of the sulfide mineralization.
Figure 3.
Polymineral intergrowth of pyrite, chalcopyrite, and sphalerite, ×200 (Py—pyrite; Chp—chalcopyrite; Hm—hematite; Bo—bornite; Spl—sphalerite).
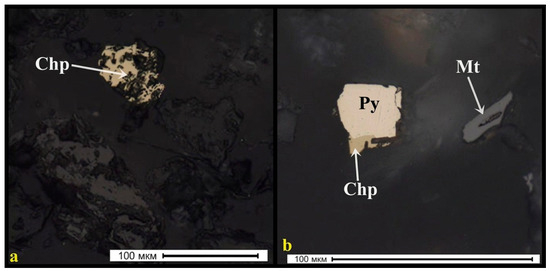
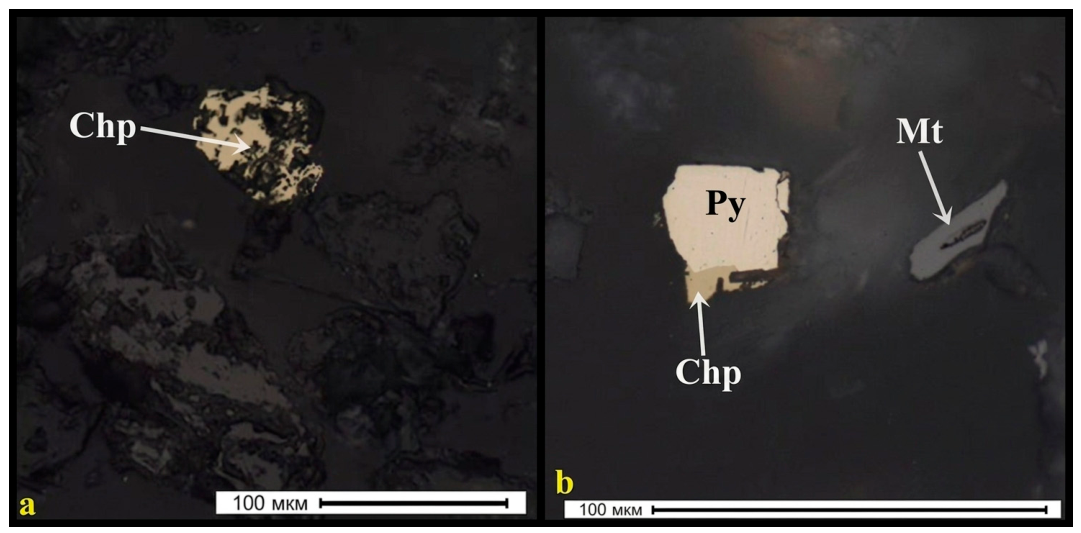
Chalcopyrite occurred predominantly in intimate intergrowths with magnetite and pyrite and was only rarely observed as liberated grains (Figure 4). Its grain size ranged from 0.001 to 0.33 mm. The grains and their fragments were predominantly irregular in shape and frequently exhibited evidence of leaching. Corrosion textures associated with the replacement of chalcopyrite by bornite, chalcocite, and covellite were observed in some grains.
Figure 4.
Chalcopyrite occurrences (Py—pyrite; Chp—chalcopyrite; Mt—magnetite): (a) liberated chalcopyrite grain exhibiting a corrosion texture, ×200; (b) pyrite–chalcopyrite intergrowth and a separate magnetite grain, ×500.
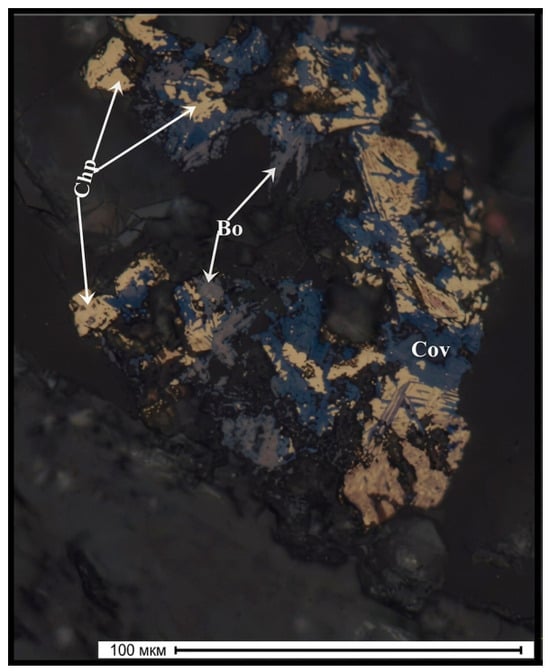
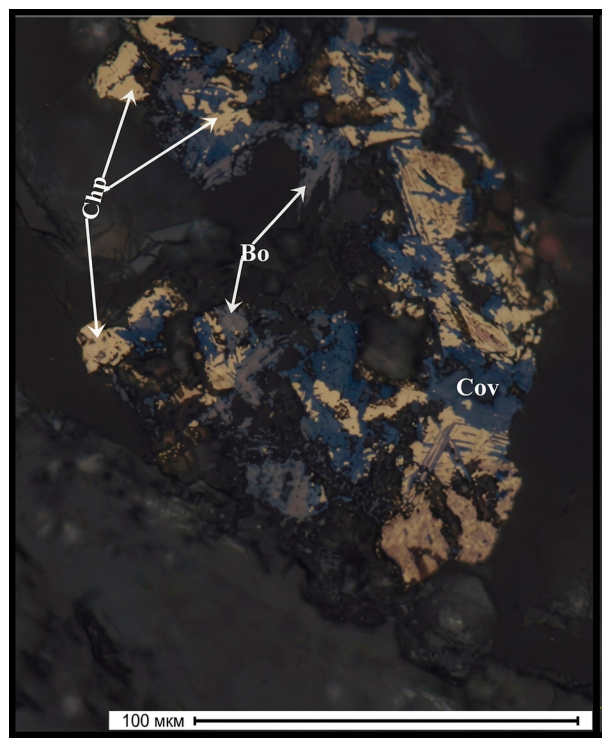
Secondary copper minerals were represented by chalcocite, covellite, bornite, and digenite. These minerals occurred in close association with one another and formed as a result of partial or complete replacement of primary copper sulfides. They were predominantly present as inclusions within gangue fragments and only rarely occurred as discrete grains. Their sizes ranged from a few micrometers to approximately 0.055–0.10 mm. Characteristic textures of chalcopyrite replacement by secondary copper minerals are shown in Figure 5.
Figure 5.
Secondary copper minerals (Cov—covellite; Chp—chalcopyrite; Bo—bornite): covellite and bornite partially replacing chalcopyrite, ×500.
The results of the semi-quantitative mineralogical analysis (Table 4) indicated that ore minerals accounted for approximately 5.78% of the analyzed area of the polished sections. Magnetite and pyrite were the predominant ore minerals, with estimated area fractions of 3.20% and 2.00%, respectively. Chalcopyrite accounted for approximately 0.50% of the analyzed area, whereas the combined area fraction of chalcocite, covellite, and bornite was approximately 0.02%. Iron oxides and hydroxides represented approximately 0.05%, while carbonaceous material accounted for less than 0.01% of the analyzed area. The combined area fraction of the identified Cu-bearing minerals was therefore approximately 0.52%. The values reported in Table 4 represent area-based semi-quantitative estimates of mineral abundance derived from image analysis of the polished sections rather than absolute bulk mineral concentrations determined by a fully quantitative mineralogical technique. Accordingly, these data were used primarily to characterize the relative abundance and occurrence of the ore minerals and, together with the microscopic observations, to evaluate their grain-size characteristics and intergrowth relationships.
Table 4.
Semi-quantitative mineralogical composition of the historical copper tailings.
The mineralogical characteristics of the feed material have direct technological implications. The predominant occurrence of chalcopyrite in intergrowths with magnetite, pyrite, and gangue minerals, together with fine inclusions of secondary copper minerals and the wide size range of ore-mineral grains, indicates incomplete liberation of Cu-bearing phases in relatively coarse particles. At the same time, evidence of leaching, corrosion textures, and secondary replacement of primary sulfides indicates substantial alteration of the surfaces of Cu-bearing minerals. These characteristics should therefore be taken into account when selecting the grinding fineness and flotation reagent regime.
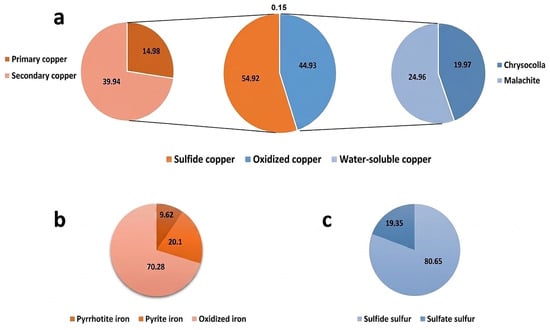
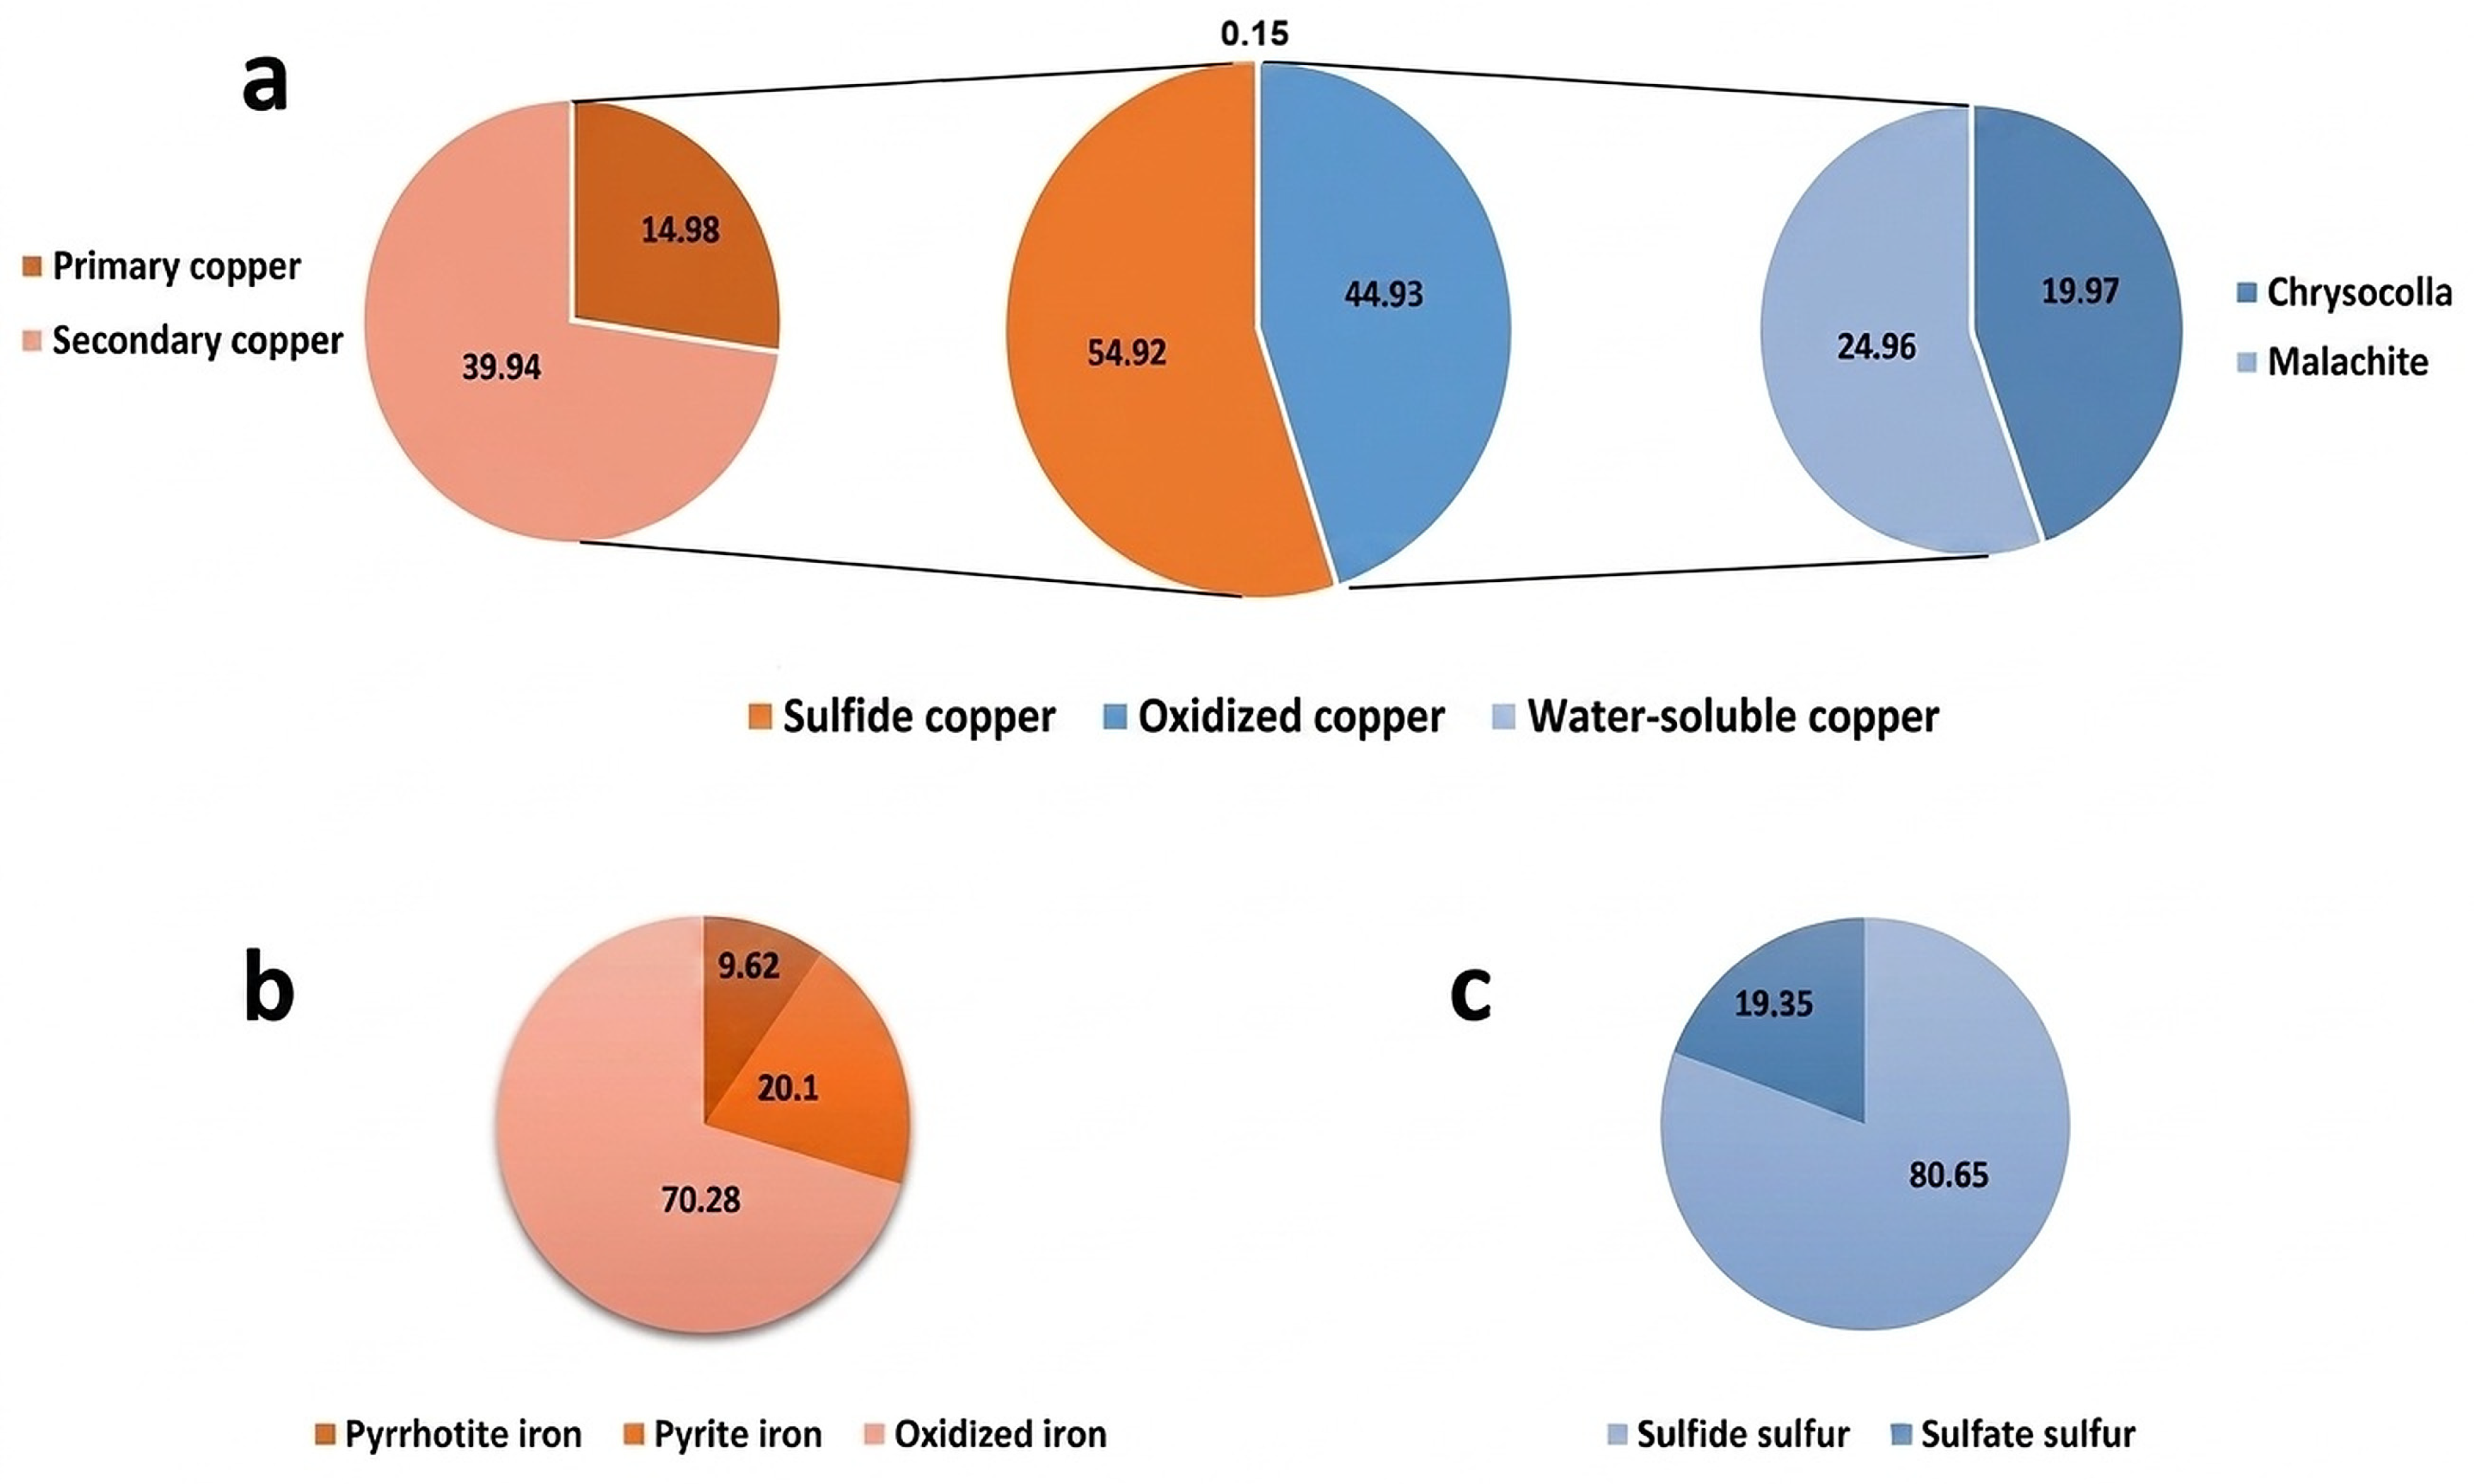
The results of the phase analyses of Cu, Fe, and S are presented in Figure 6. The phase composition of the feed material indicates a considerable degree of secondary alteration of the mineral phases. Copper occurred in both sulfide and oxidized forms (Figure 6a), consistent with the mineralogical evidence of secondary alteration of chalcopyrite and the formation of bornite, chalcocite, and covellite.
Figure 6.
Phase analysis of copper (a), iron (b), and sulfur (c) in the historical copper tailings sample.
The phase composition of iron (Figure 6b) was characterized by the presence of oxidized forms, consistent with the observed partial replacement of magnetite by hematite and oxidation of individual pyrite grains with the formation of goethite. Sulfur phase analysis (Figure 6c) indicated the predominance of sulfide sulfur over sulfate sulfur.
Taken together, the phase and mineralogical analyses indicate that the feed material is heterogeneous with respect to the degree of secondary alteration. From a technological perspective, the coexistence of primary and secondarily altered Cu-bearing minerals implies differences in their surface properties and, consequently, in their flotation behavior. These observations provided the basis for the subsequent investigation of Na2S treatment for the sulfidization of oxidized copper mineral surfaces and optimization of the flotation reagent regime.
The particle-size analysis (Table 5) revealed an uneven distribution of Cu and Fe among the size fractions. More than 77% of the material consisted of particles coarser than 0.071 mm. The finest fraction (−0.045 mm), with a yield of 18.09%, exhibited the highest Cu content of 0.33% and contained 27.86% of the total Cu, compared with an average Cu content of 0.21% in the sample. Iron was predominantly concentrated in the intermediate and fine size fractions, with the Fe content reaching 9.08% in the −0.071 + 0.045 mm fraction. The total Fe content calculated from the size-fraction balance was 5.46%, which is lower than the bulk Fe content of 6.01% determined directly in the homogenized feed sample (Table 3). The value in Table 5 represents a mass-weighted average calculated from the yields and Fe contents of the six individual size fractions rather than an independent direct analysis of the bulk sample. The difference of 0.55 percentage points may reflect cumulative effects associated with sample heterogeneity and subsampling, size fractionation and sample handling, determination of fraction yields, and separate chemical analyses of the individual fractions. Because the expanded uncertainty of the complete size-fractionation and mass-balance procedure was not determined, this difference cannot be attributed solely to analytical uncertainty. Therefore, the size-fraction data were used primarily to assess the distribution trend of Fe among the particle-size fractions rather than to demonstrate complete Fe mass-balance closure.
Table 5.
Distribution of copper and iron among the particle-size fractions of the historical copper tailings.
Together with the identified mineralogical characteristics—including intimate intergrowths of chalcopyrite with pyrite and magnetite, fine inclusions of secondary copper minerals, and evidence of secondary alteration of chalcopyrite—these results indicate that grinding fineness plays an important role in the liberation of Cu-bearing minerals. The presence of altered copper phases also provided the basis for investigating Na2S as a sulfidizing agent during subsequent flotation tests.
3.2. Open-Circuit Flotation Tests
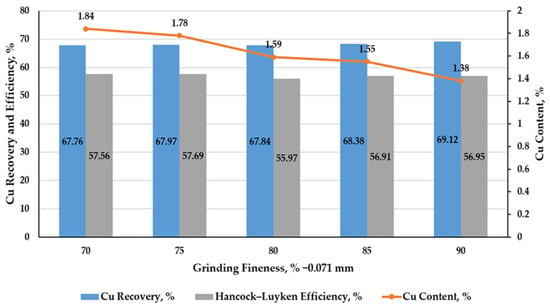
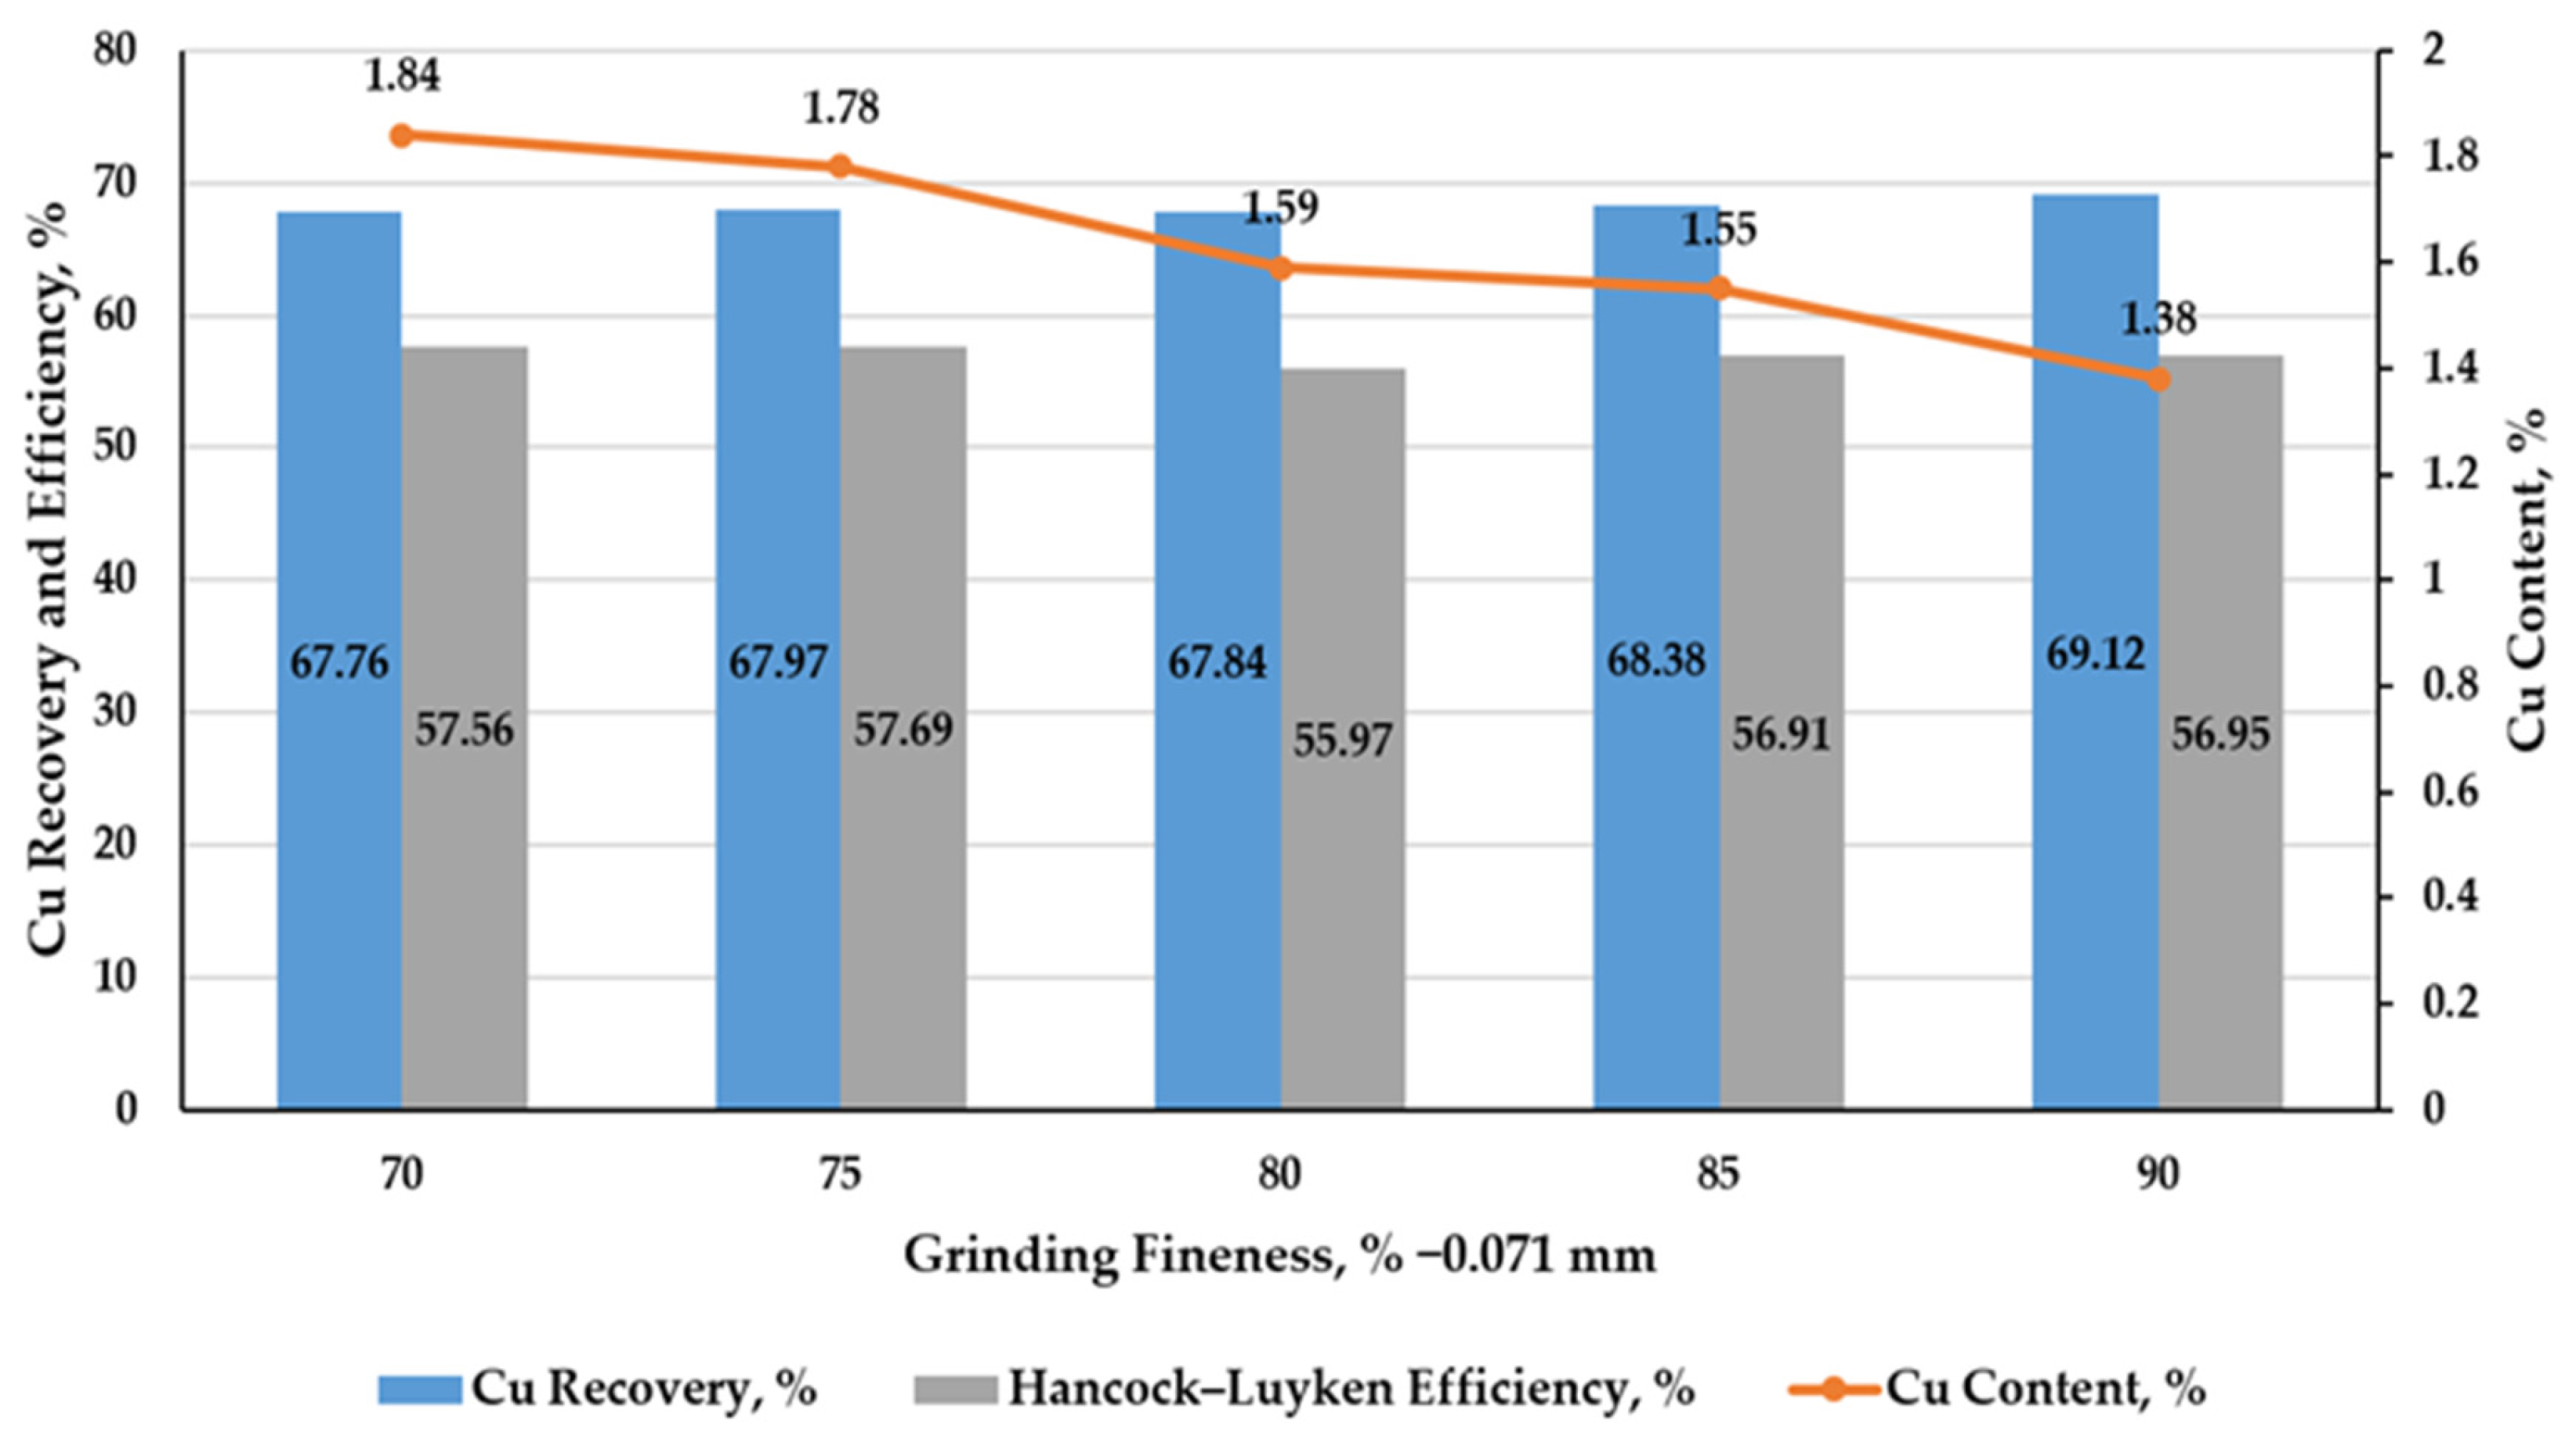
The effect of feed grinding fineness on flotation performance was investigated over the range of 70–90% of the −0.071 mm size fraction (Figure 7). Increasing the grinding fineness to 90% −0.071 mm did not result in a substantial increase in Cu recovery and was accompanied by a decrease in the Cu content of the flotation product. Evaluation using the Hancock–Luyken efficiency criterion also showed that finer grinding did not improve separation efficiency, indicating that excessive grinding was not beneficial. Based on these results, 70% −0.071 mm was selected as the appropriate grinding fineness prior to flotation. Under these conditions, the Cu content of the resulting copper concentrate was 1.84%, with a Cu recovery of 67.76%. Thus, the selected grinding fineness provided an appropriate balance between Cu recovery, Cu content in the copper concentrate, and flotation separation efficiency.
Figure 7.
Effect of feed grinding fineness on flotation performance.
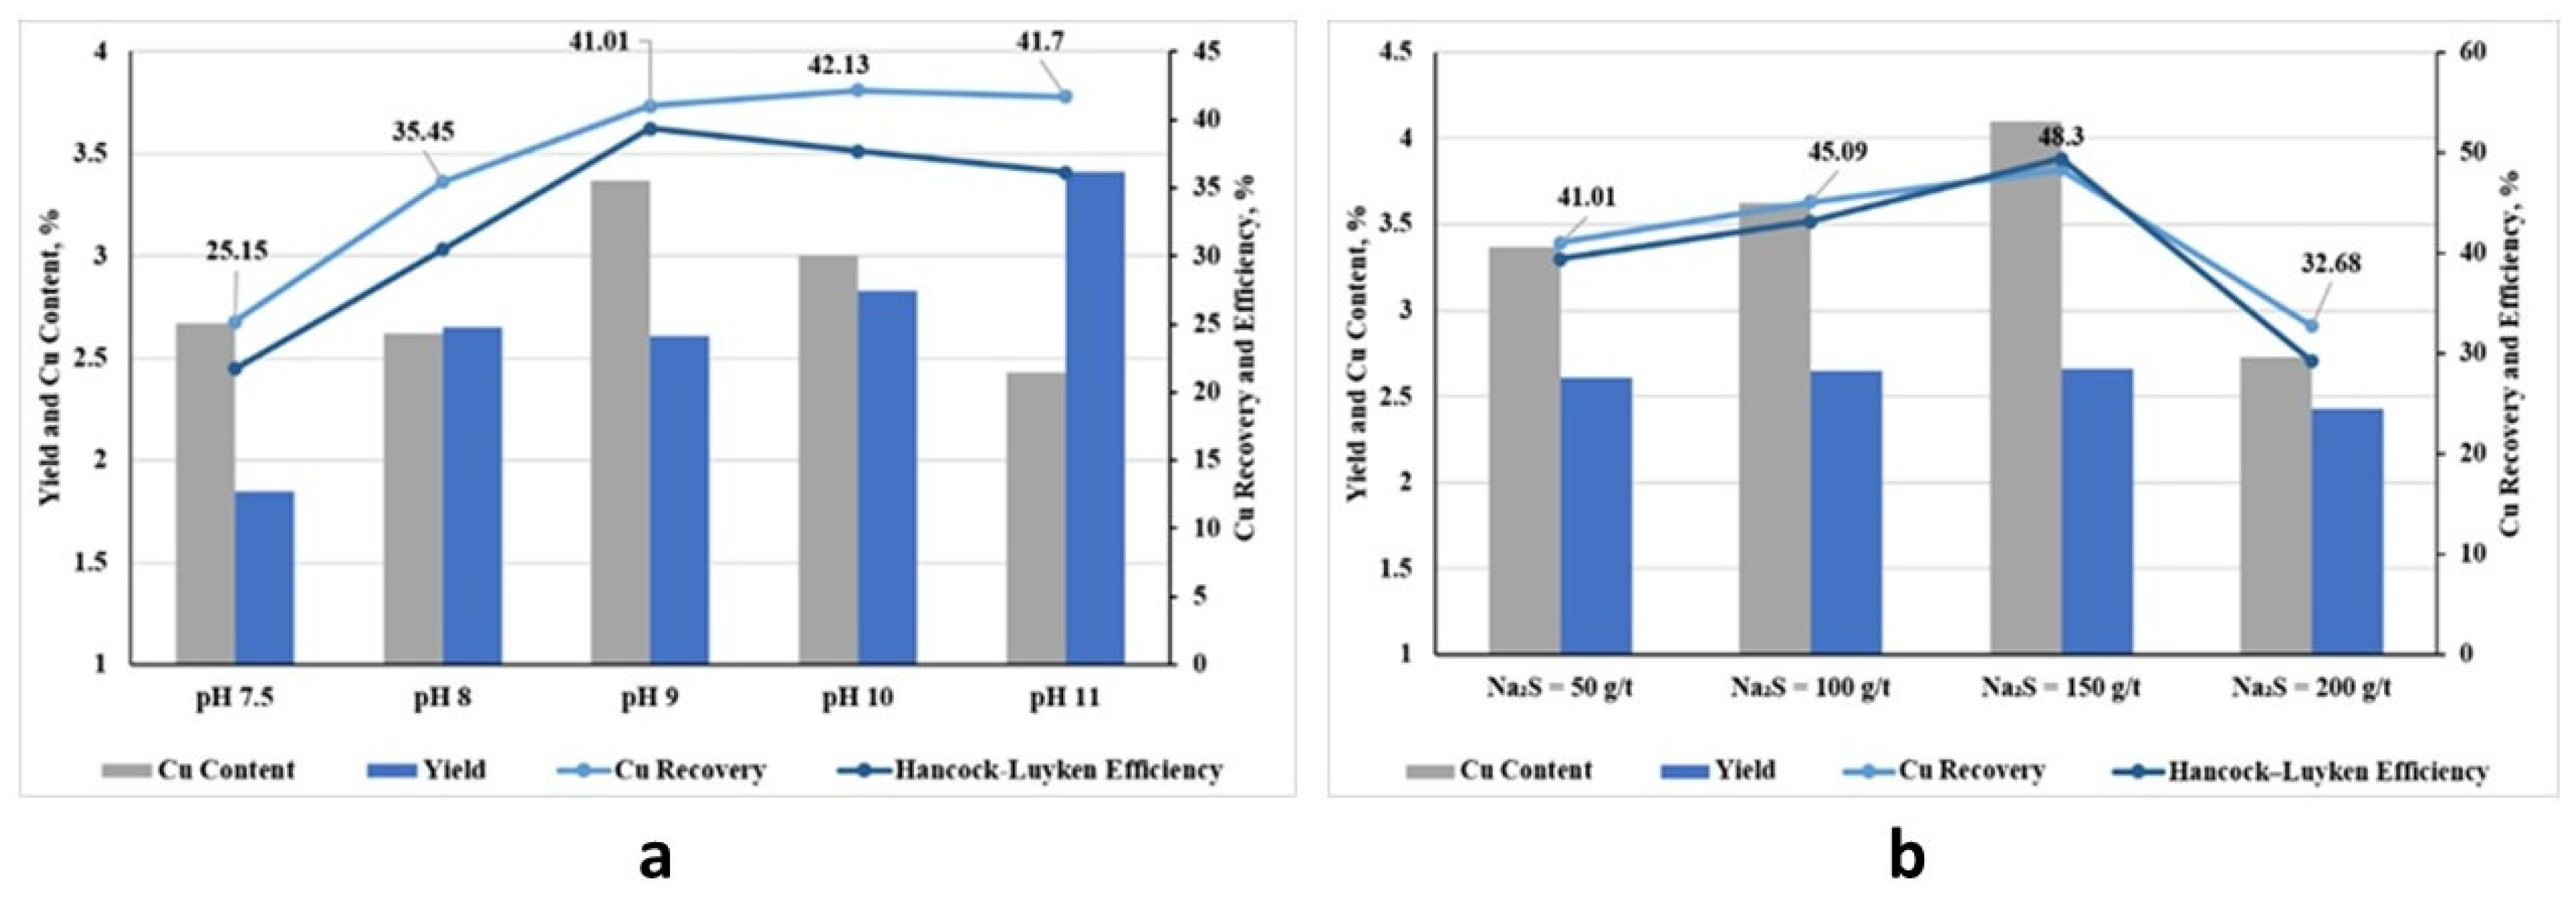
The effect of pulp pH on rougher flotation performance is presented in Figure 8a. Increasing the pulp pH from 7.5 to 9 resulted in a pronounced improvement in flotation performance: Cu recovery increased from 25.15% to 41.01%, while the Cu content in the concentrate increased from 2.67% to 3.37%. At pH 9, the Hancock–Luyken separation efficiency also reached its maximum value of approximately 39.4%, indicating the most favorable separation performance. A further increase in pH to 10 slightly increased Cu recovery to 42.13%; however, the Cu content decreased to 3.00% and the Hancock–Luyken efficiency declined to approximately 37.7%. Thus, the increase in Cu recovery from pH 9 to pH 10 was only 1.12 percentage points and was accompanied by a deterioration in concentrate grade and separation efficiency. At pH 11, Cu recovery slightly decreased to 41.70%, while the Cu content declined further to approximately 2.40%, despite an increase in product yield. Therefore, pH 9 was selected as the rational operating condition, providing the most favorable balance between Cu recovery, concentrate grade, and separation efficiency.
Figure 8.
Effect of pulp pH (a) and Na2S dosage (b) on rougher flotation performance.
The effect of Na2S dosage was investigated at pH 9 over the range of 0–200 g/t (Figure 8b). The addition of Na2S substantially improved flotation performance, with the maximum Cu recovery (48.30%) and Cu content in the copper concentrate (4.10%) obtained at a dosage of 150 g/t. A further increase in the Na2S dosage to 200 g/t resulted in a decrease in Cu recovery to 32.68%. Considering Cu recovery, Cu content in the concentrate, and the Hancock–Luyken efficiency criterion, an Na2S dosage of 150 g/t was selected for the subsequent rougher flotation tests.
Previous studies [42] investigated the selection and dosage of collectors for rougher flotation, including potassium butyl xanthate (PBX), potassium ethyl xanthate (PEX), potassium amyl xanthate (PAX), butyl aerofloat, AEROPHINE 3418A, AERO 3894, AERO 9863, AERO 3715, and AERO 400, as well as their combinations with PBX. Under otherwise identical conditions, the combination of PBX and AERO 9863 at dosages of 70 and 15 g/t, respectively, provided the highest Cu recovery. Under these conditions, Cu recovery to the rougher concentrate reached 59.17%, with a Cu content of 2.65%. The use of CuSO4 as an activator for Cu-bearing minerals and the replacement of Na2SiO3 with AERO 650 did not result in a substantial improvement in flotation performance.
In the tests aimed at optimizing the scavenger flotation reagent regime, the preceding rougher flotation conditions were kept constant: pH 9.0; Na2S dosage, 150 g/t; AERO 9863/PBX dosages, 15/70 g/t; and MIBC dosage, 10 g/t. The durations of rougher and scavenger flotation were initially 5 min each, and the pH during scavenger flotation was maintained at 9.0.
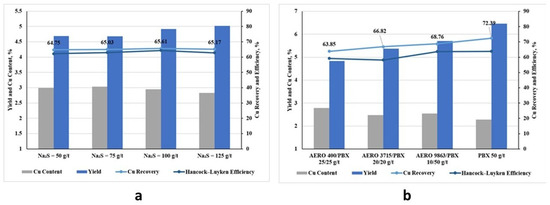
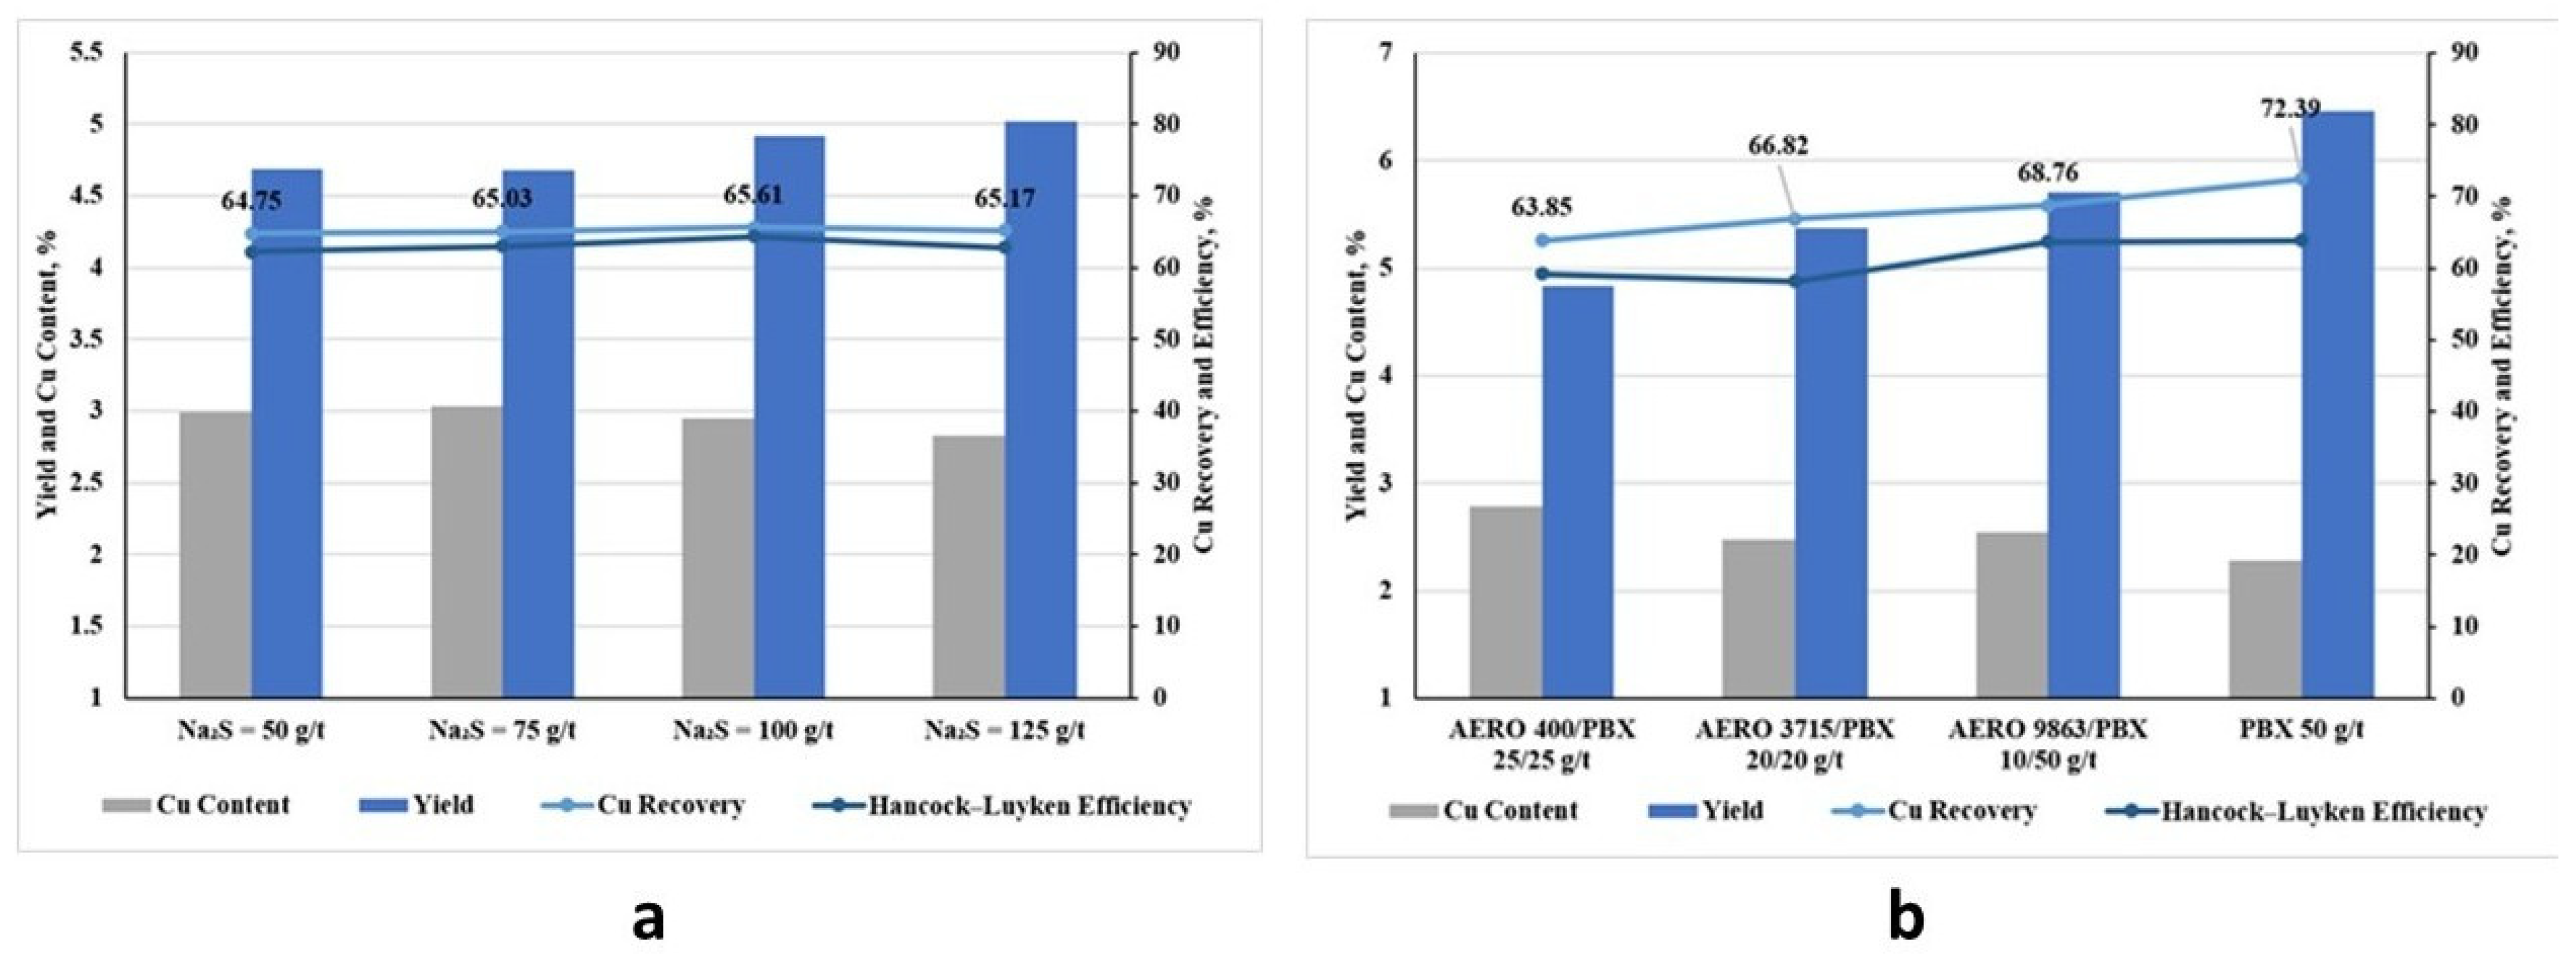
When the Na2S dosage was varied from 50 to 125 g/t at a constant PBX dosage of 20 g/t, flotation performance remained relatively stable (Figure 9). Cu recovery to the combined rougher and scavenger concentrate ranged from 64.75% to 65.61%, whereas the Cu content gradually decreased from 3.0% to 2.8%. Considering the overall flotation performance, an Na2S dosage of 100 g/t was selected for scavenger flotation.
Figure 9.
Effect of Na2S (a) and collector dosage (b) on scavenger flotation performance.
Testing different collectors and their combinations with PBX increased Cu recovery from 63.85% to 72.39%, with the maximum recovery obtained at a PBX dosage of 50 g/t. At the same time, the Cu content in the combined concentrate decreased to 2.25–2.50%, which was associated with the increased recovery of Cu into the scavenger concentrate.
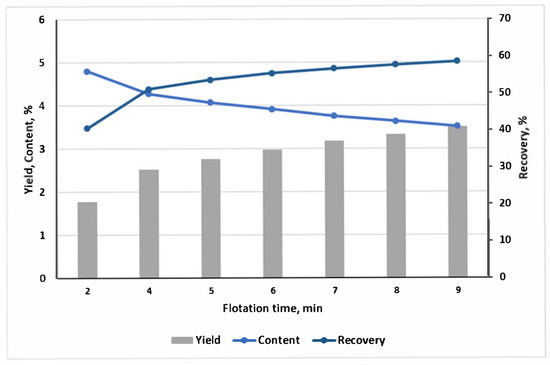
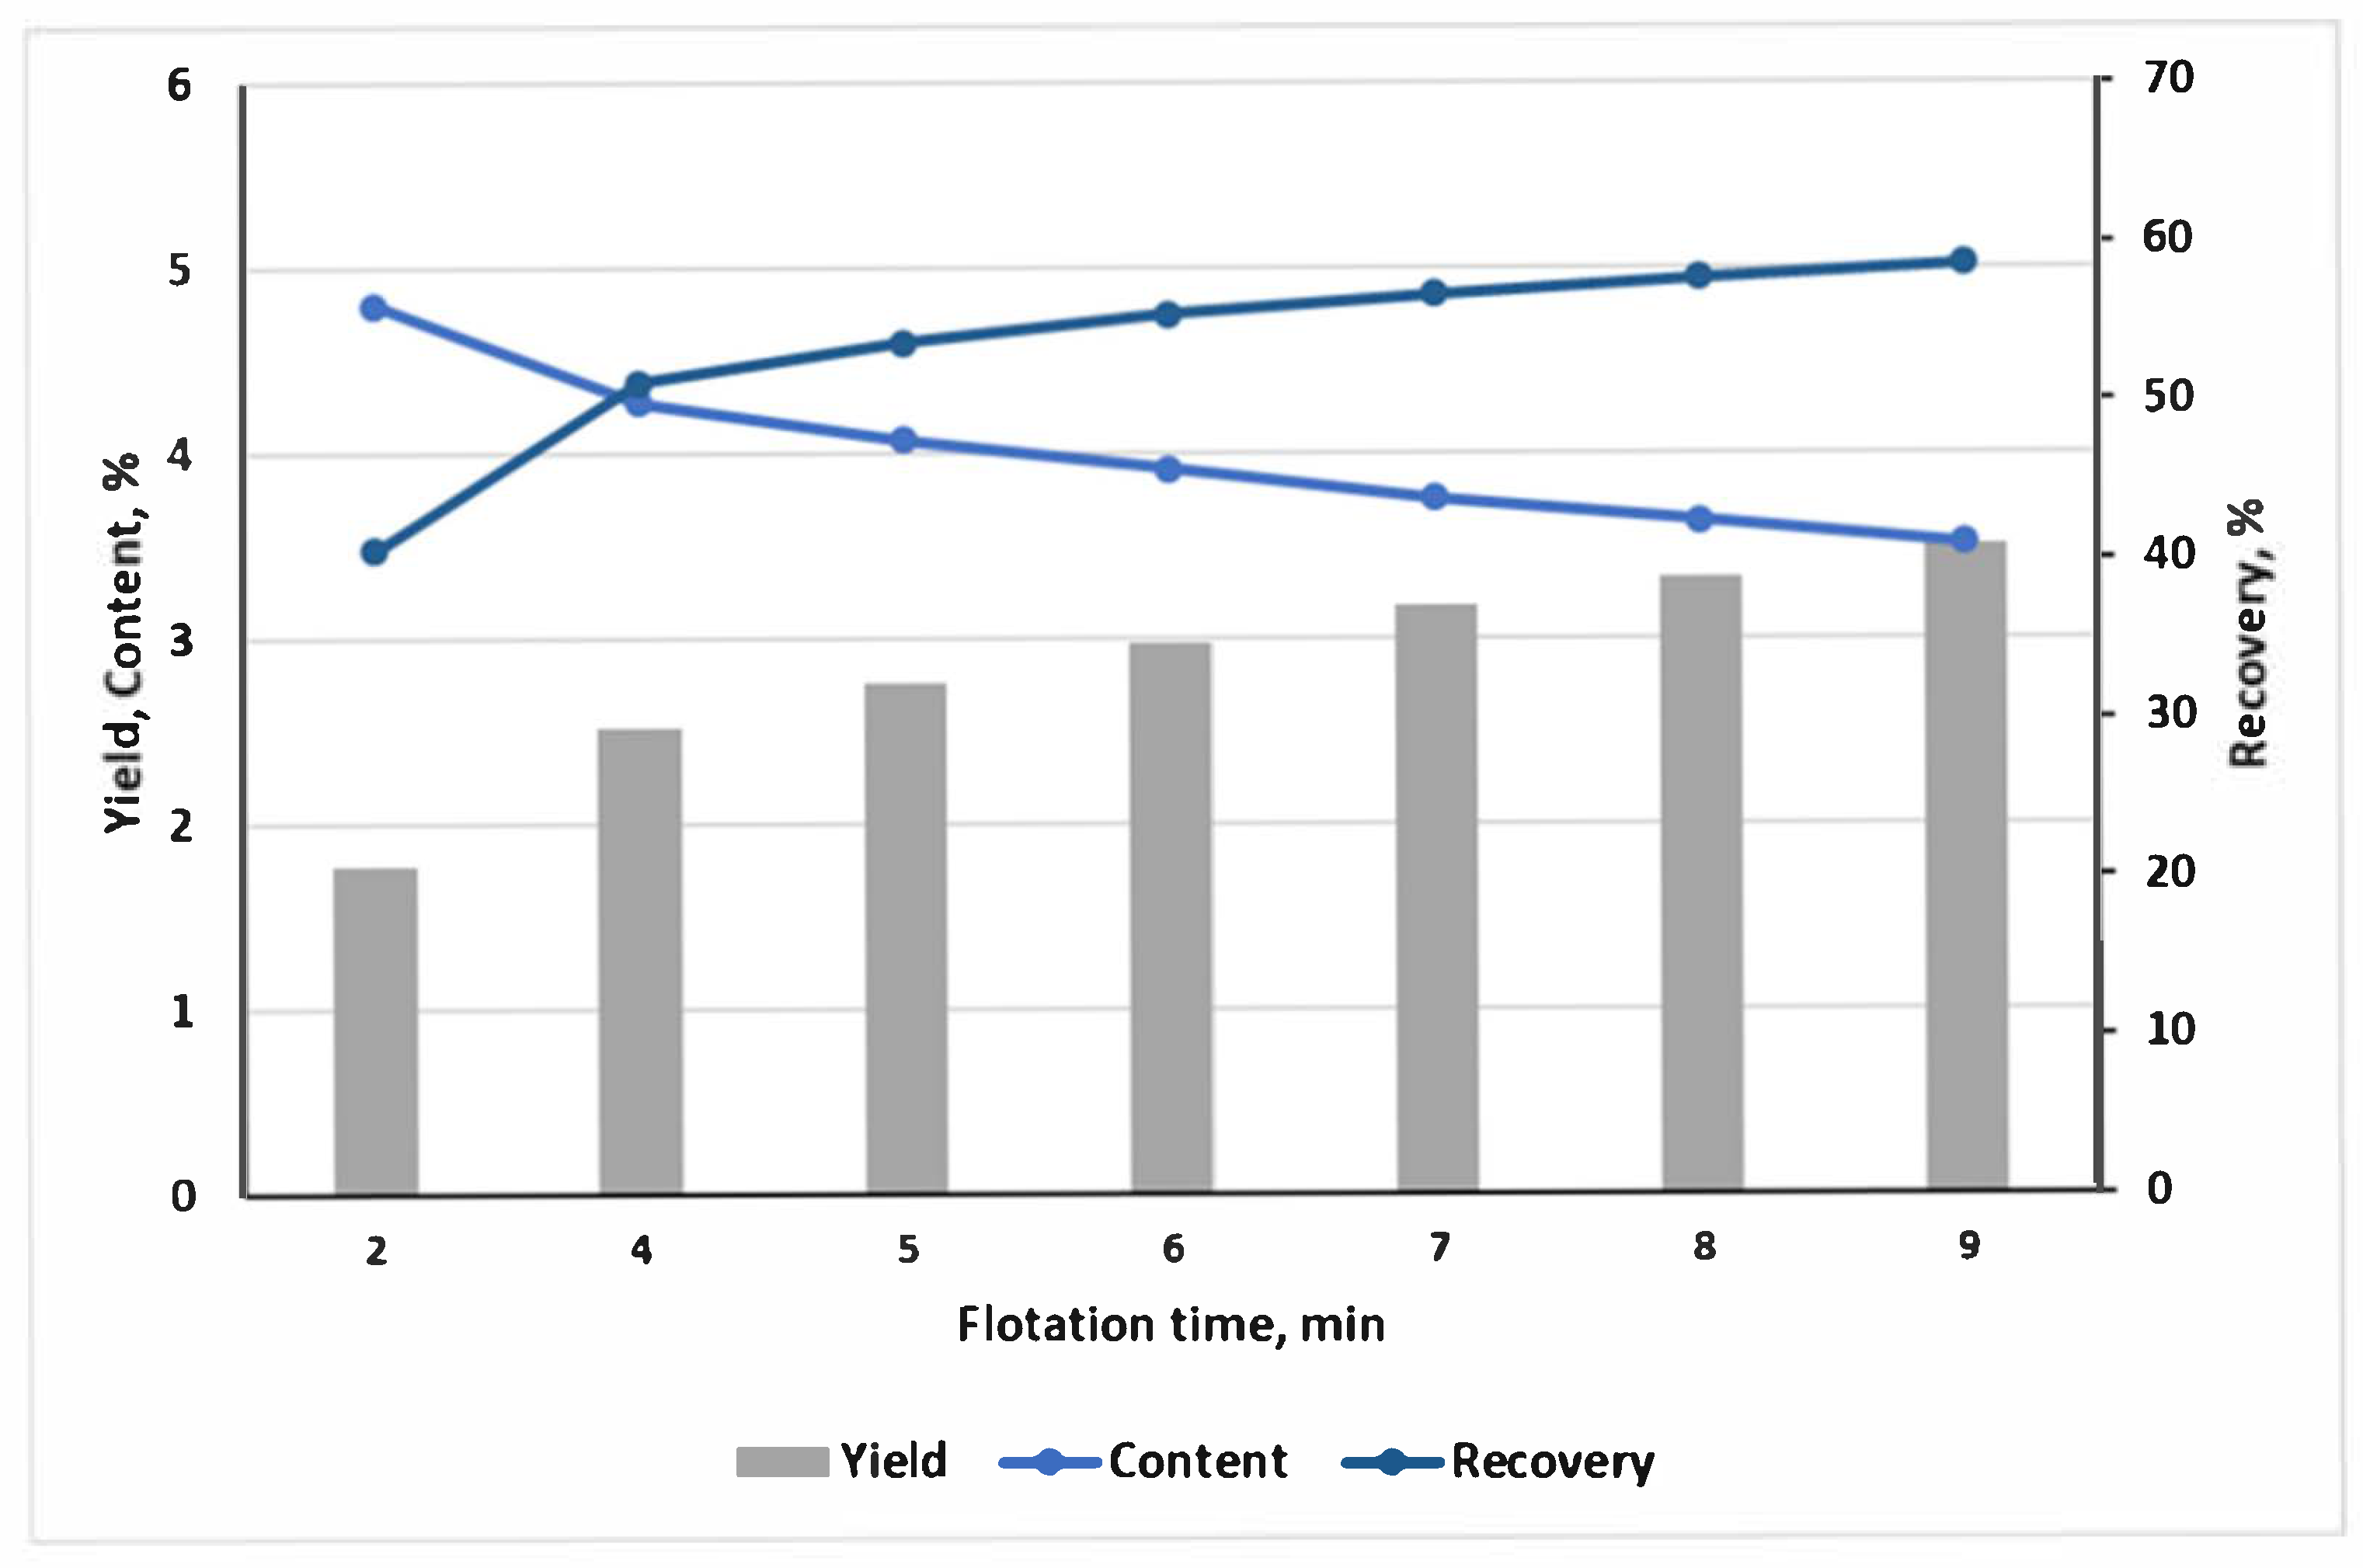
The kinetics of rougher flotation under the selected reagent regime are presented in Figure 10. Rapid recovery of Cu into the froth product was observed during the initial stage of flotation. Within the first 5 min, Cu recovery reached 53.60%, while the Cu content in the concentrate decreased from 4.80% to 4.07%. Further extension of the flotation time resulted in only a limited increase in Cu recovery, accompanied by a noticeable decrease in the Cu content of the concentrate. Therefore, the rougher flotation time was set at 5 min.
Figure 10.
Kinetics of rougher flotation.
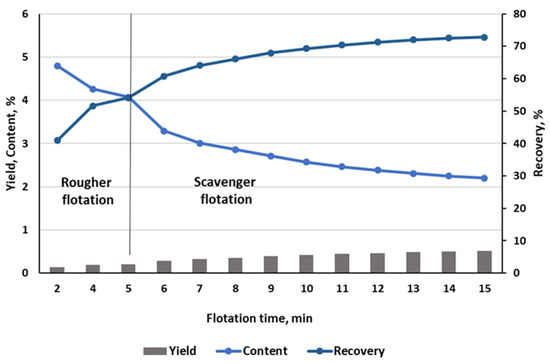
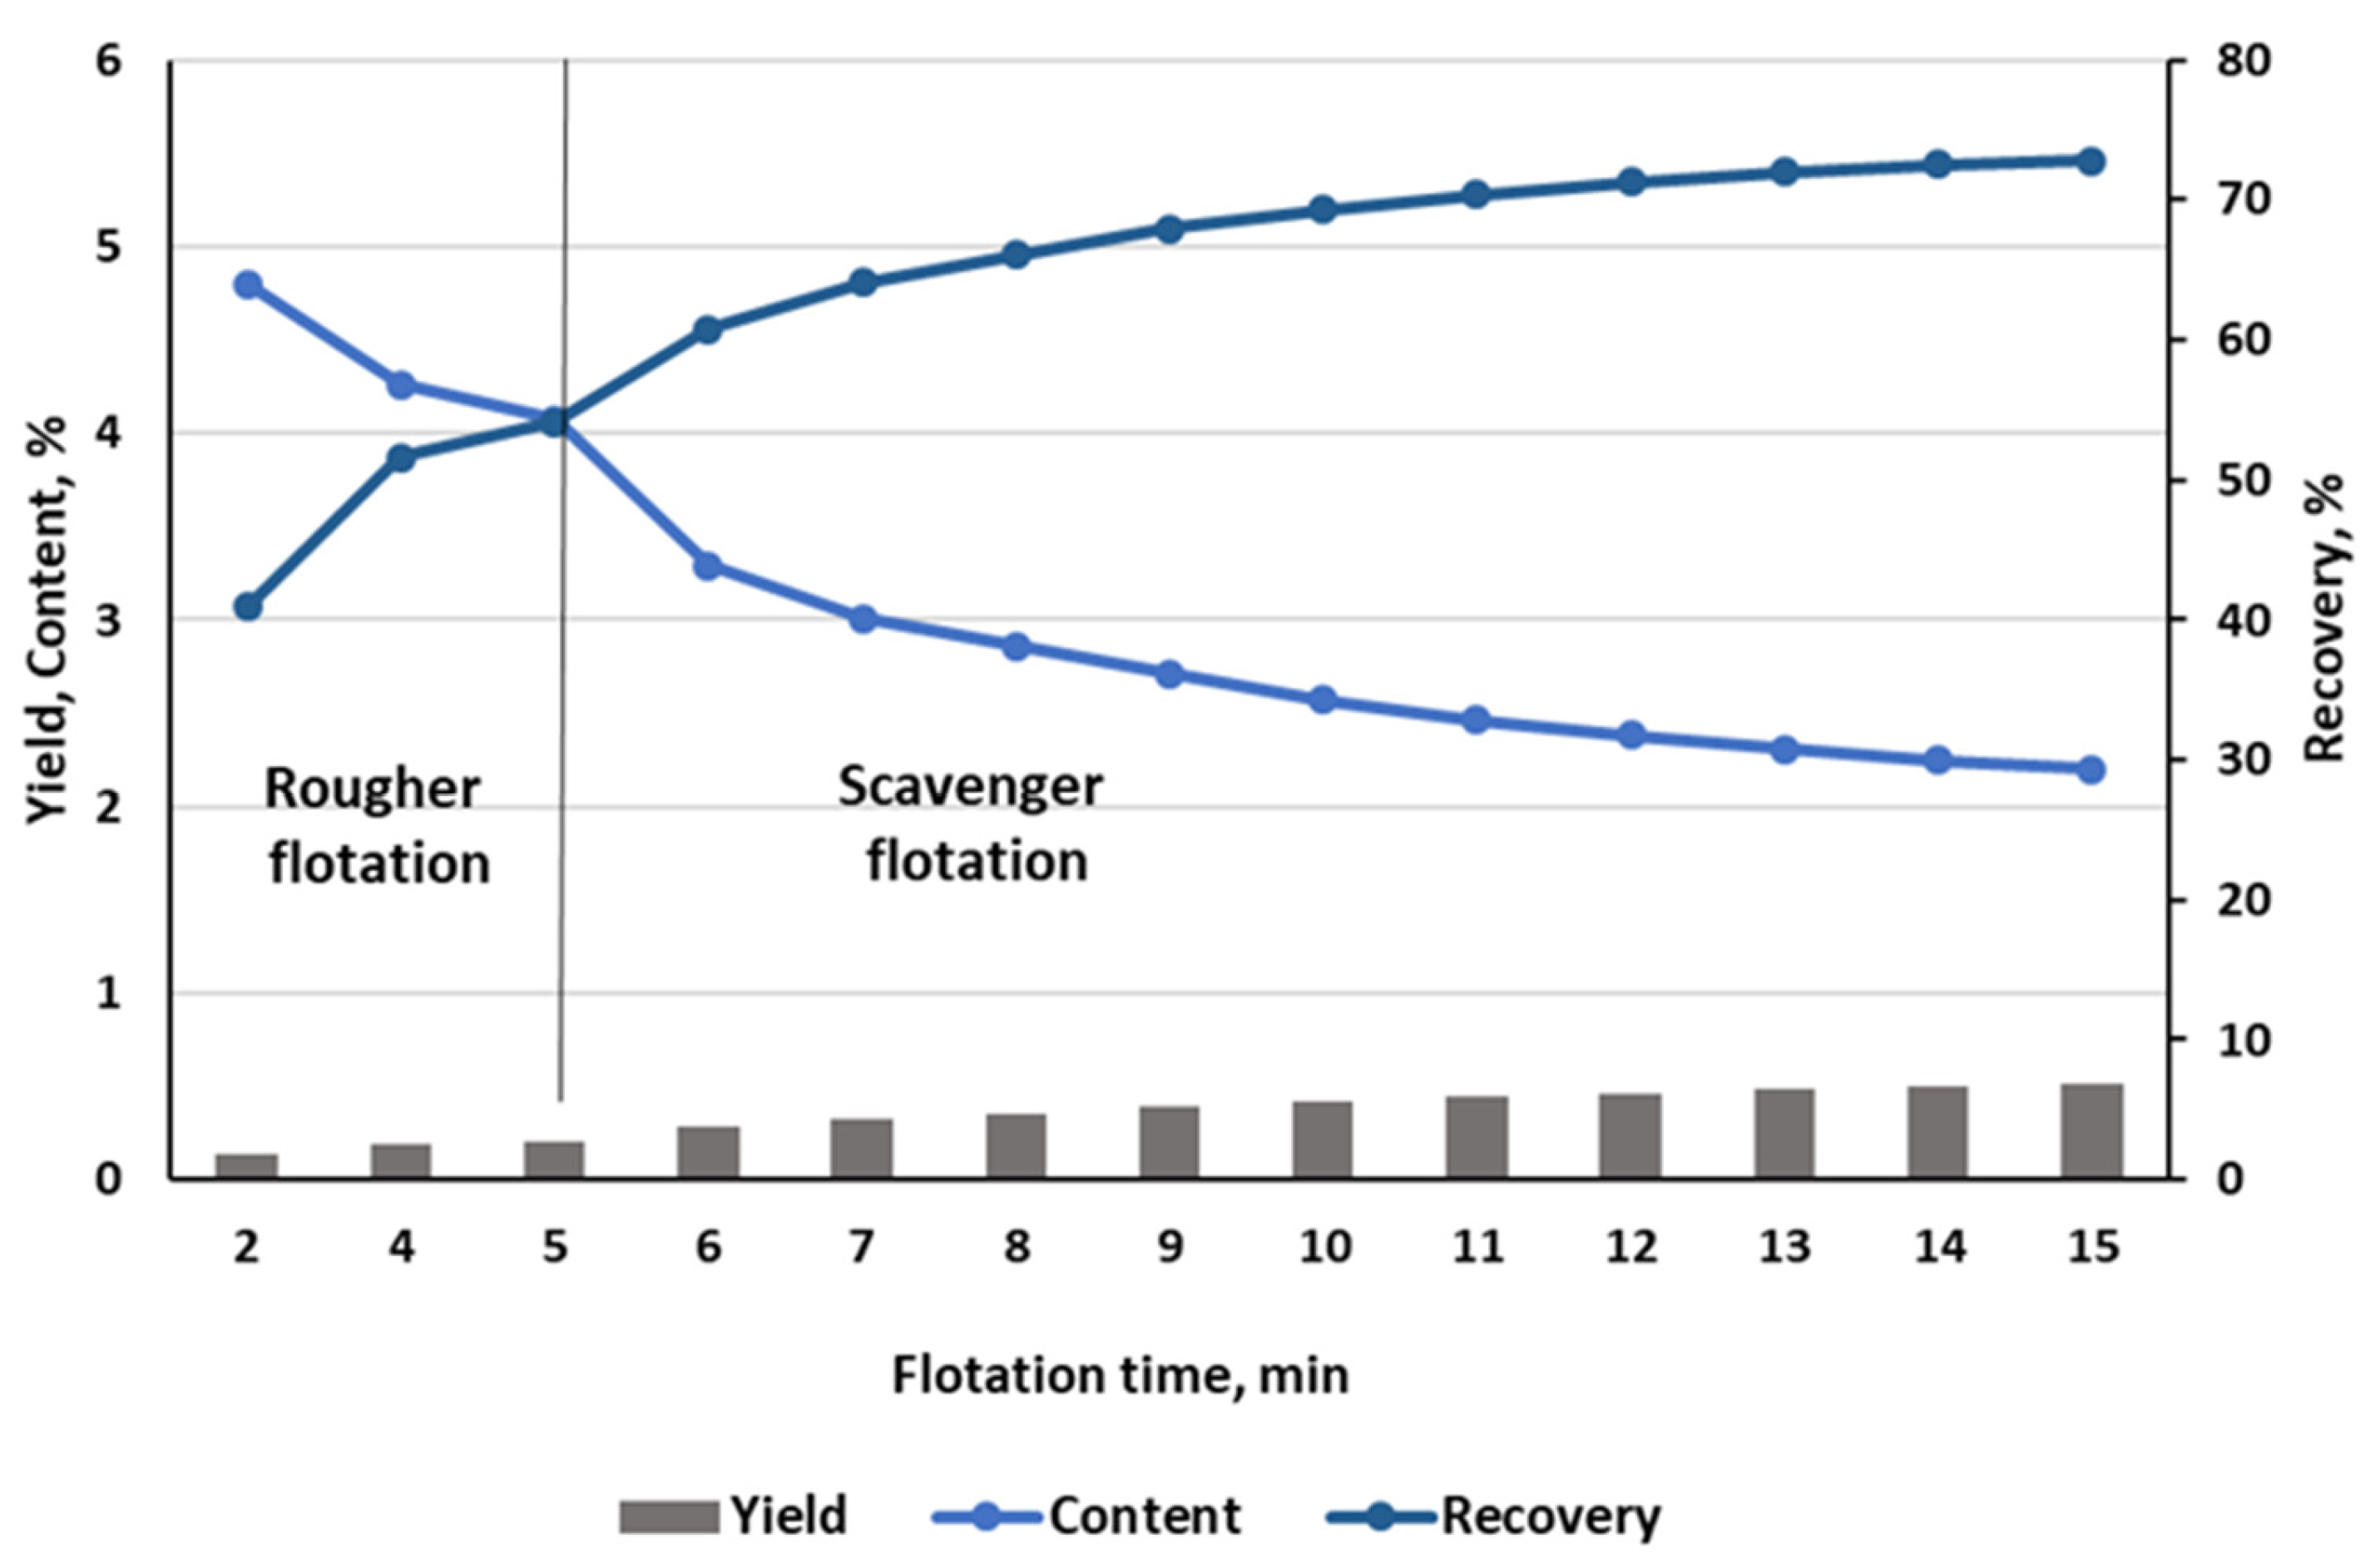
The cumulative kinetics of rougher and scavenger flotation (Figure 11) showed that Cu recovery continued to increase substantially during the scavenger stage, reaching 71.95% at 8 min, after which any additional increase in recovery became negligible. Accordingly, rougher and scavenger flotation times of 5 and 8 min, respectively, were selected for the subsequent investigations.
Figure 11.
Cumulative kinetics of rougher and scavenger flotation.
3.3. Closed-Circuit Flotation Tests
To evaluate flotation performance under conditions involving the recirculation of intermediate products, a series of closed-circuit tests was conducted using the selected reagent regime. The rougher and scavenger concentrates were subjected to three separate cleaning stages. Three flowsheet configurations were investigated: (i) the baseline flowsheet; (ii) a flowsheet incorporating regrinding of the rougher concentrate prior to cleaning; and (iii) a flowsheet incorporating feed classification prior to grinding followed by regrinding of the rougher concentrate prior to cleaning. The results of the closed-circuit tests are presented in Table 6.
Table 6.
Results of closed-circuit flotation tests for different flowsheet configurations.
Regrinding of the rougher concentrate to P80 = 30 μm improved the flotation separation performance compared with the baseline flowsheet. The Cu content in the combined concentrate increased from 5.51% to 6.01%, while the overall Cu recovery increased from 39.73% to 44.41%. At the same time, the Hancock–Luyken efficiency increased from 38.28% to 42.94%.
The highest flotation performance was achieved by combining feed classification prior to grinding with regrinding of the rougher concentrate prior to cleaning. With this flowsheet, the Cu content in Cu concentrate I reached 8.21% at a Cu recovery of 29.21%, whereas Cu concentrate II contained 5.14% Cu at a recovery of 16.88%. Consequently, a combined copper concentrate with a Cu content of 6.74% and an overall Cu recovery of 46.09% was obtained. The Hancock–Luyken efficiency reached 44.68%, which was 6.4 percentage points higher than that obtained with the baseline flowsheet.
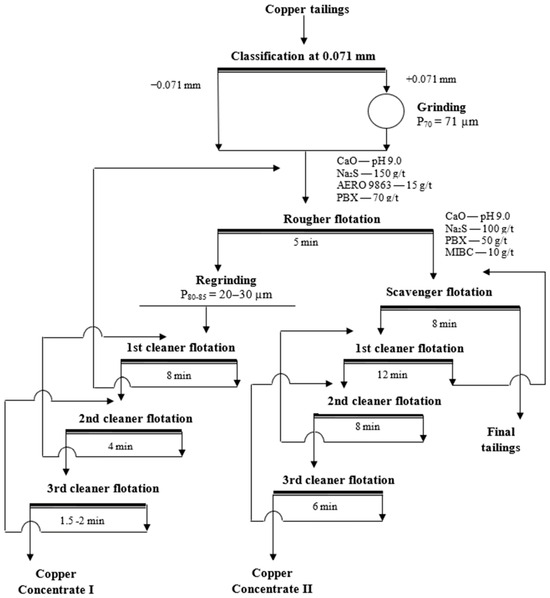
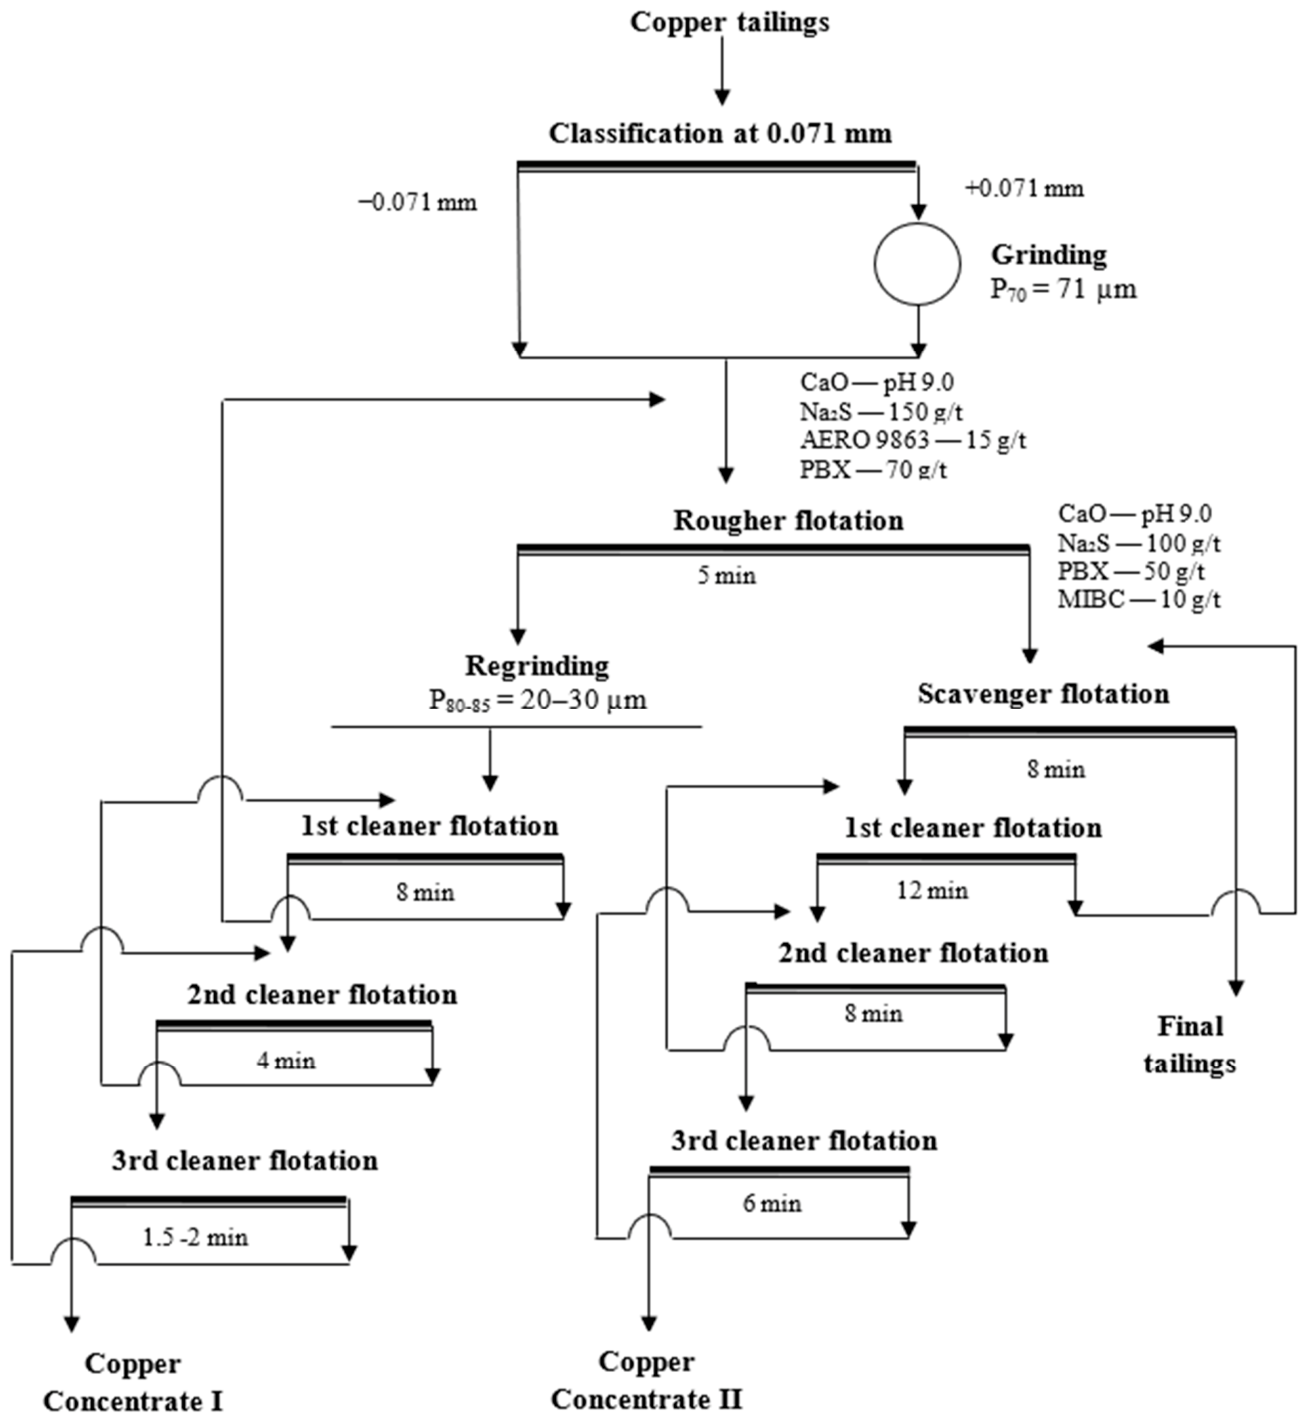
Thus, among the three investigated configurations, the flowsheet incorporating feed classification prior to grinding and rougher concentrate regrinding prior to cleaning demonstrated the best overall flotation performance (Figure 12). Compared with the baseline flowsheet, this configuration increased the Cu content in the combined concentrate from 5.51% to 6.74%, the overall Cu recovery from 39.73% to 46.09%, and the Hancock–Luyken efficiency from 38.28% to 44.68%.
Figure 12.
Flowsheet of the closed-circuit flotation test.
The gravimetric mass-balance closure calculated over the six consecutive closed-circuit cycles, including the final concentrates, final tailings, and intermediate products remaining after the sixth cycle, was approximately 99% for each of the three investigated flowsheets.
3.4. Results of Mathematical Modeling
Based on the analysis of the experimental data obtained from the 29 flotation tests conducted according to the central composite design matrix (Appendix A), a second-order quadratic regression model was developed to describe the effects of pH and the dosages of Na2S, PBX, and AERO 9863 on Cu recovery (Y).
The resulting regression model had a coefficient of determination of R2 = 0.9494, indicating good agreement between the predicted and experimental values. The adjusted coefficient of determination was Radj2 = 0.8987, and the standard error of the regression was 1.53. Analysis of variance (ANOVA) showed that the overall regression model was statistically significant (F = 18.75, p = 1.1 × 10⁻⁶). The main statistical parameters of the model are summarized in Table 7.
Table 7.
Analysis of variance (ANOVA) and statistical parameters of the regression model.
After excluding statistically insignificant terms, the reduced second-order quadratic regression model was expressed as:
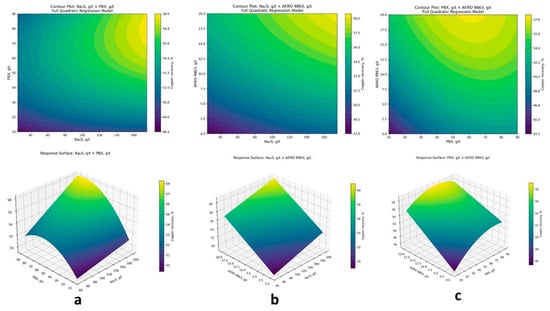
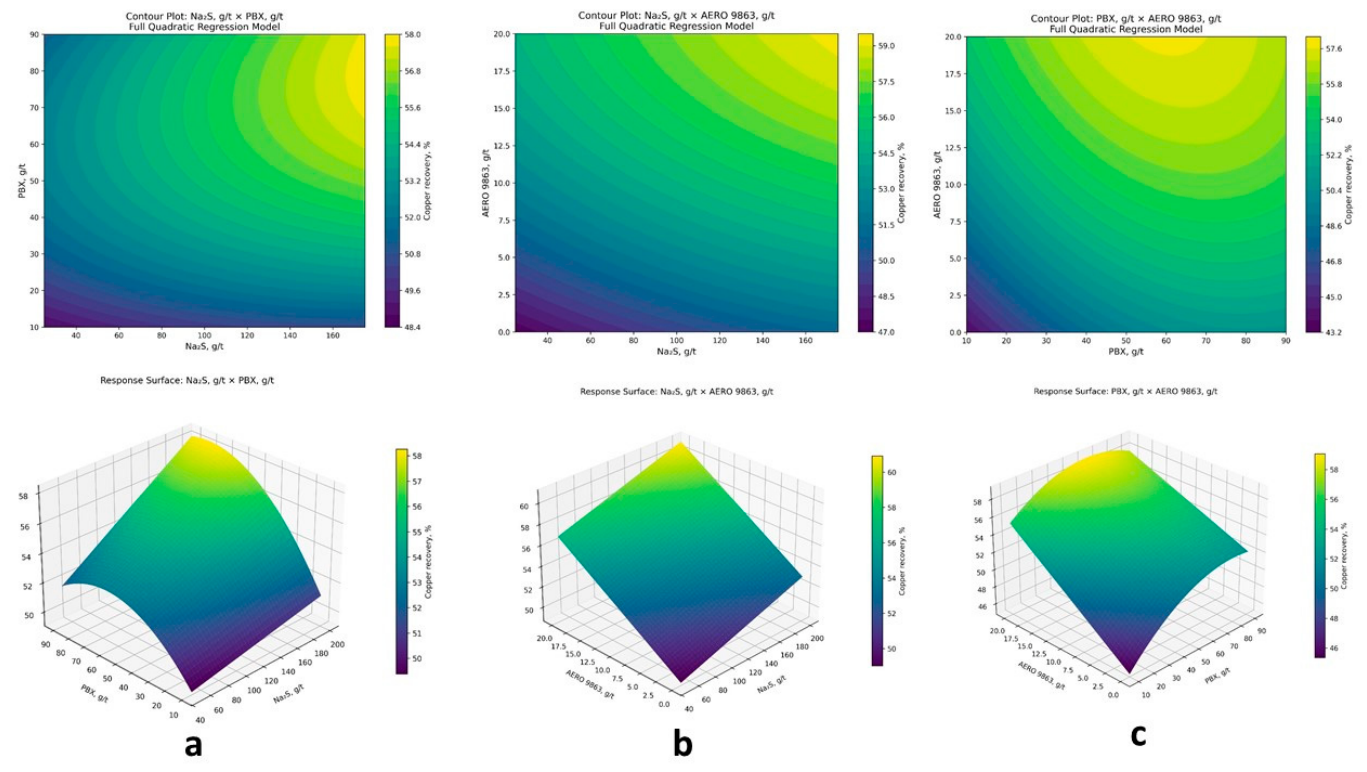
To evaluate the combined effects of the investigated factors on Cu recovery and identify the region of optimal operating conditions, two-dimensional response surface plots were constructed (Figure 13).
Figure 13.
Two-dimensional response surface plots showing the combined effects of the investigated factors on Cu recovery (%): (a) PBX and Na2S dosages; (b) AERO 9863 and Na2S dosages; (c) AERO 9863 and PBX dosages.
Analysis of the response surfaces showed that, within the investigated ranges, variations in Cu recovery were primarily associated with the dosages of Na2S, PBX, and AERO 9863. The effect of pH was statistically insignificant; therefore, the corresponding term was excluded from the reduced regression model.
For the Na2S–PBX system, a pronounced combined effect of the two factors on the predicted Cu recovery was observed. Increasing the Na2S dosage within the investigated range generally increased Cu recovery; however, the magnitude of this effect depended on the PBX dosage.
For the Na2S–AERO 9863 system, the response surface exhibited a more gradual variation. Within the investigated ranges, increasing the dosages of both reagents generally resulted in higher predicted Cu recovery, with a more pronounced change observed as the AERO 9863 dosage increased.
The response surface for the PBX–AERO 9863 system exhibited pronounced curvature, indicating a nonlinear dependence of Cu recovery on the combination of these factors. Increasing the AERO 9863 dosage generally increased the predicted Cu recovery; however, the magnitude of this effect depended on the PBX dosage. At higher PBX dosages, a further increase in PBX dosage resulted in a diminishing incremental increase in Cu recovery.
The maximum predicted Cu recovery within the investigated experimental domain was Ymax = 61.62%, corresponding to Na2S, PBX, and AERO 9863 dosages of 150, 60, and 15 g/t, respectively. The response surfaces indicated a region of elevated predicted Cu recovery in the vicinity of this combination of factors. These results were therefore used to select the operating conditions for subsequent pilot-scale testing.
3.5. Pilot-Scale Validation
Pilot-scale tests were conducted using the selected flowsheet (Figure 12) under the operating and reagent conditions presented in Table 8. The pilot-scale tests were performed in continuous mode with recycling of intermediate products. Several operating conditions were adjusted relative to the laboratory closed-circuit tests; therefore, the pilot-scale results should be considered as the performance of the optimized flowsheet under continuous pilot-scale operating conditions rather than as an effect of scale-up alone.
Table 8.
Operating and reagent conditions of the pilot-scale tests.
The grinding fineness was increased from 70% to 75% passing 0.071 mm to provide a somewhat finer feed under the operating conditions of the pilot-scale grinding circuit. This adjustment remained within the range previously investigated in the laboratory tests: grinding fineness values of 70% and 75% passing 0.071 mm resulted in similar Cu recoveries of 67.76% and 67.97%, respectively. The rougher and scavenger flotation times were adjusted to 8 and 12 min, respectively, under pilot-scale conditions. In addition, based on the mathematical modeling results, the PBX dosage in rougher flotation was reduced from 70 to 60 g/t. The total reagent consumption during the pilot-scale tests was 1300 g/t CaO, 250 g/t Na2S, 110 g/t PBX, 15 g/t AERO 9863, and 10 g/t MIBC (Table 8). These adjustments were made to maintain stable and selective flotation performance under continuous operation with circulating intermediate products. Because the residual PBX concentration in the circulating streams was not measured, possible accumulation of residual collector is considered only as a potential contributing factor rather than an experimentally verified mechanism.
The pilot-scale tests produced Cu concentrate I with a Cu content of 9.72% and a Cu recovery of 46.01%, and Cu concentrate II with a Cu content of 4.43% and a Cu recovery of 9.37% (Table 9). Combining these products yielded ~42 kg of copper concentrate with a Cu content of 8.08% and an overall Cu recovery of 55.38%. The yield of the combined copper concentrate was 1.46%, while the Cu content in the final tailings decreased to 0.10%.
Table 9.
Metallurgical balance of the stabilized pilot-scale operating period.
To further clarify the origin of the residual Cu losses during pilot-scale operation, the Cu phase composition of the final pilot tailings was determined. The results are presented in Table 10.
Table 10.
Phase composition of Cu in the final pilot-scale tailings.
The total Cu content determined in the final pilot tailings was 0.097%, which is consistent with the rounded value of 0.10% reported in the metallurgical balance (Table 9). The phase analysis showed that the residual Cu was dominated by the operationally defined oxidized Cu fraction, which accounted for 64.95% of the total residual Cu at a content of 0.063%. Sulfide Cu accounted for 35.05% at a content of 0.034%, comprising 11.34% primary sulfide Cu and 23.71% secondary sulfide Cu. No water-soluble Cu was detected.
These results indicate that the dominant directly identified contributor to the residual Cu inventory in the final pilot tailings is the oxidized Cu fraction. This is consistent with the evidence of secondary alteration observed during the mineralogical characterization of the feed. The laboratory flotation tests showed that Na2S addition substantially improved Cu flotation, supporting its use for the treatment of altered Cu-bearing mineral surfaces; nevertheless, the phase composition of the final pilot tailings indicates that the sulfidization conditions applied in the present flowsheet were insufficient to achieve complete recovery of the oxidized Cu forms.
The residual sulfide Cu may additionally be associated with incomplete liberation and fine-particle flotation limitations. Mineralogical examination of the feed showed that chalcopyrite occurred predominantly in intimate intergrowths with pyrite and magnetite and was also associated with gangue minerals, whereas secondary Cu minerals commonly occurred as fine inclusions. In addition, the −0.045 mm fraction of the feed contained 27.86% of the total Cu, indicating that a substantial proportion of Cu was associated with fine particles. These characteristics provide plausible mechanisms for the loss of part of the sulfide Cu to the final tailings through incomplete liberation and reduced flotation efficiency of fine and ultrafine particles.
However, quantitative mineralogical characterization of the final concentrate and final pilot tailings by automated mineralogy or quantitative optical mineralography was not performed in the present study. Consequently, mineral-specific Cu recoveries, liberation characteristics, and the relative contributions of locked chalcopyrite, pyrite–magnetite intergrowths, and fine or ultrafine Cu-bearing particles to the residual Cu losses cannot be quantified from the available data. Comparative quantitative mineralogical and particle-size-resolved characterization of the final flotation products is therefore an important direction for further investigation. These characteristics provide plausible mechanisms for the loss of part of the sulfide Cu to the final tailings through incomplete liberation and reduced flotation efficiency of fine and ultrafine particles.
The pilot-scale tests confirmed the applicability of the selected flowsheet under continuous pilot-scale operating conditions. Compared with the laboratory closed-circuit tests, the Cu content of the combined copper concentrate increased from 6.74% to 8.08%, while the overall Cu recovery increased from 46.09% to 55.38%. However, these differences should not be attributed to scale-up alone because several operating conditions were modified between the laboratory and pilot-scale tests, including grinding fineness, flotation time, reagent dosage, and the mode of intermediate-product recirculation. The observed metallurgical performance therefore reflects the combined effects of the adjusted operating conditions, continuous recycling of intermediate products, establishment of a relatively stable operating regime, and differences in the hydrodynamic conditions of the laboratory and pilot-scale flotation equipment.
From an industrial perspective, the pilot-scale results correspond to approximately 14.6 kg of Cu-bearing product, or 1.18 kg of recovered Cu, per tonne of dry tailings, with a total principal reagent consumption of approximately 1.685 kg/t. The 8.08% Cu product should be considered an intermediate product whose industrial viability would depend on further processing requirements and site-specific economic conditions. Because specific energy consumption and capital and operating costs were not determined, the present results demonstrate technological feasibility but do not establish economic viability. A dedicated techno-economic assessment is therefore required before industrial implementation.
The resource-recovery potential demonstrated in the present study should not be interpreted as evidence of the overall environmental sustainability of the proposed process. The pilot-scale flowsheet required 1300 g/t CaO, 250 g/t Na2S, 110 g/t PBX, 15 g/t AERO 9863, and 10 g/t MIBC, together with water and energy for grinding, regrinding, classification, and flotation. Although wastewater treatment was incorporated into the pilot-scale flowsheet, specific energy consumption, fresh and recycled water requirements, residual reagent concentrations, and wastewater quality were not quantified in the present study. In addition, reprocessing generates a residual tailings stream that requires appropriate management and further assessment of its geochemical stability. Therefore, the present results demonstrate the technical feasibility and resource-recovery potential of the proposed flowsheet rather than its overall environmental sustainability. A comprehensive environmental assessment should include energy and water balances, wastewater and residual-reagent characterization, and evaluation of the long-term geochemical behavior of the final tailings.
4. Conclusions
- Comprehensive chemical, mineralogical, phase, and particle-size characterization of the historical copper tailings showed that, at a Cu content of approximately 0.2%, copper mineralization is represented predominantly by chalcopyrite and secondary copper minerals. The close associations of copper-bearing phases with pyrite, magnetite, and gangue minerals, together with evidence of oxidation, leaching, and secondary replacement, result in complex flotation behavior and necessitate a combination of optimized grinding and targeted reagent treatment.
- Laboratory flotation tests demonstrated that excessive grinding of the initial tailings does not result in a substantial increase in copper recovery. A grinding fineness of approximately 70% passing 0.071 mm was identified as a rational condition. The flotation performance of altered copper minerals was improved by using Na2S as a sulfidizing agent and a combination of potassium butyl xanthate (PBX) and AERO 9863 as collectors.
- Closed-circuit tests confirmed the significant effect of flowsheet configuration on separation performance. The most effective configuration involved preliminary classification of the initial tailings prior to grinding, followed by regrinding of the rougher concentrate before cleaner flotation. Compared with the baseline flowsheet, the Cu content of the combined concentrate increased from 5.51% to 6.74%, Cu recovery increased from 39.73% to 46.09%, and the Hancock–Luyken separation efficiency increased from 38.28% to 44.68%.
- The quadratic regression model developed using a central composite design adequately described the combined effects of the main technological factors on copper recovery (R2 = 0.9494; Radj2 = 0.8987; p = 1.1 × 10⁻⁶). The predicted maximum recovery within the investigated experimental domain was 61.62% at reagent dosages of 150 g/t Na2S, 60 g/t PBX, and 15 g/t AERO 9863. These results were subsequently used to refine the reagent regime for pilot-scale validation.
- Pilot-scale tests conducted on 5.15 t of historical copper tailings confirmed the technological applicability of the developed flowsheet under continuous pilot-scale operating conditions. A combined copper product with a yield of 1.46%, a Cu content of 8.08%, and a Cu recovery of 55.38% was obtained, while the Cu content of the final tailings was reduced to 0.10%. Because several operating conditions differed from those used in the laboratory closed-circuit tests, the observed pilot-scale performance should be attributed to the optimized continuous operating conditions rather than to scale-up alone.
The results demonstrate the technological potential of the investigated historical copper tailings as a secondary mineral resource. The proposed approach, based on the sequential integration of mineralogical characterization, flotation optimization, closed-circuit testing, mathematical modeling, and pilot-scale validation, provides a technically validated basis for developing reprocessing flowsheets for complex, low-grade copper-bearing mine waste. Further techno-economic and environmental assessment is required before industrial implementation.
Author Contributions
Conceptualization, E.L. and A.S.; methodology, E.L., A.S. and A.N.; software, A.S., K.B., Z.B. and E.K.; validation, E.L., K.B., Z.B. and E.K.; formal analysis, A.S. and B.S.; investigation, E.L., A.S. and A.N.; resources, E.L. and E.B.; data curation, A.S. and B.S.; writing—original draft, E.L. and A.S.; writing—review and editing, E.L., A.S., E.B., A.N., K.B., Z.B., E.K. and B.S.; supervision, E.L. and A.S.; project administration, E.L., A.S. and E.B.; funding acquisition, E.L. and E.B. All authors have read and agreed to the published version of the manuscript.
Funding
This research is funded by the Committee of Industry of the Ministry of Industry and Construction of the Republic of Kazakhstan under program-targeted funding for scientific research for 2024–2026, BR23991563: “Creation of Innovative Resource-Saving Technologies for Mining and Integrated Processing of Mineral and Technogenic Raw Materials”.
Data Availability Statement
The original contributions presented in this study are included in the article. Further inquiries can be directed to the corresponding authors.
Conflicts of Interest
The authors declare no conflicts of interest.
Appendix A
Central Composite Design Matrix and Experimental Copper Recovery Results
| № | Point Type | X1 | X2 | X3 | X4 | pH (X1) | Na2S, g/t (X2) | PBX, g/t (X3) | AERO 9863, g/t (X4) | Y1, % | Y2, % | , % |
| 1 | Factorial | −1 | −1 | −1 | −1 | 8 | 50 | 30 | 5 | 41.62 | 41.72 | 41.67 |
| 2 | Factorial | 1 | −1 | −1 | −1 | 10 | 50 | 30 | 5 | 43.51 | 43.62 | 43.57 |
| 3 | Factorial | −1 | 1 | −1 | −1 | 8 | 150 | 30 | 5 | 44.93 | 45.03 | 44.98 |
| 4 | Factorial | 1 | 1 | −1 | −1 | 10 | 150 | 30 | 5 | 42.75 | 42.87 | 42.81 |
| 5 | Factorial | −1 | −1 | 1 | −1 | 8 | 50 | 70 | 5 | 49.39 | 49.51 | 49.45 |
| 6 | Factorial | 1 | −1 | 1 | −1 | 10 | 50 | 70 | 5 | 44.29 | 44.39 | 44.34 |
| 7 | Factorial | −1 | 1 | 1 | −1 | 8 | 150 | 70 | 5 | 53.24 | 53.35 | 53.30 |
| 8 | Factorial | 1 | 1 | 1 | −1 | 10 | 150 | 70 | 5 | 52.76 | 52.87 | 52.82 |
| 9 | Factorial | −1 | −1 | −1 | 1 | 8 | 50 | 30 | 15 | 52.32 | 52.41 | 52.37 |
| 10 | Factorial | 1 | −1 | −1 | 1 | 10 | 50 | 30 | 15 | 53.19 | 53.29 | 53.24 |
| 11 | Factorial | −1 | 1 | −1 | 1 | 8 | 150 | 30 | 15 | 54.28 | 54.37 | 54.33 |
| 12 | Factorial | 1 | 1 | −1 | 1 | 10 | 150 | 30 | 15 | 55.13 | 55.25 | 55.19 |
| 13 | Factorial | −1 | −1 | 1 | 1 | 8 | 50 | 70 | 15 | 52.67 | 52.78 | 52.73 |
| 14 | Factorial | 1 | −1 | 1 | 1 | 10 | 50 | 70 | 15 | 53.21 | 53.28 | 53.25 |
| 15 | Factorial | −1 | 1 | 1 | 1 | 8 | 150 | 70 | 15 | 59.33 | 59.42 | 59.38 |
| 16 | Factorial | 1 | 1 | 1 | 1 | 10 | 150 | 70 | 15 | 58.50 | 58.59 | 58.55 |
| 17 | Axial | −1 | 0 | 0 | 0 | 7.5 | 100 | 50 | 10 | 52.48 | 52.58 | 52.53 |
| 18 | Axial | 1 | 0 | 0 | 0 | 10.5 | 100 | 50 | 10 | 57.18 | 57.32 | 57.25 |
| 19 | Axial | 0 | −1 | 0 | 0 | 9 | 25 | 50 | 10 | 51.08 | 51.16 | 51.12 |
| 20 | Axial | 0 | 1 | 0 | 0 | 9 | 175 | 50 | 10 | 57.60 | 57.74 | 57.67 |
| 21 | Axial | 0 | 0 | −1 | 0 | 9 | 100 | 10 | 10 | 48.73 | 48.82 | 48.78 |
| 22 | Axial | 0 | 0 | 1 | 0 | 9 | 100 | 90 | 10 | 56.15 | 56.28 | 56.22 |
| 23 | Axial | 0 | 0 | 0 | −1 | 9 | 100 | 50 | 0 | 50.48 | 50.55 | 50.52 |
| 24 | Axial | 0 | 0 | 0 | 1 | 9 | 100 | 50 | 20 | 58.75 | 58.58 | 58.67 |
| 25 | Center | 0 | 0 | 0 | 0 | 9 | 100 | 50 | 10 | 54.90 | 54.98 | 54.94 |
| 26 | Center | 0 | 0 | 0 | 0 | 9 | 100 | 50 | 10 | 55.26 | 55.35 | 55.31 |
| 27 | Center | 0 | 0 | 0 | 0 | 9 | 100 | 50 | 10 | 54.82 | 54.91 | 54.87 |
| 28 | Center | 0 | 0 | 0 | 0 | 9 | 100 | 50 | 10 | 55.09 | 55.17 | 55.13 |
| 29 | Center | 0 | 0 | 0 | 0 | 9 | 100 | 50 | 10 | 54.95 | 55.04 | 55.00 |
References
- Koucham, M.; Derhy, M.; Ait-Khouia, Y.; Khalil, A.; Taha, Y.; Maacha, L.; El Adnani, M. Flotation Optimization and Mineralogical Constraints for Copper Recovery from Low-Grade Mine Tailings. Chem. Eng. J. Adv. 2026, 26, 101175. [Google Scholar] [CrossRef] [Scilit]
- Bonnin, M.; Azzaro-Pantel, C.; Montastruc, L.; Pibouleau, L.; Domenech, S.; Villeneuve, J. Development of a Sustainable Copper Scrap Management Model. Comput. Aided Chem. Eng. 2013, 32, 613–618. [Google Scholar] [CrossRef] [Scilit]
- Kirihara, T.; Narita, A.; Tokoro, C. High-Purity Copper Recovery from Polyimide-Enameled Wires Using Pulsed Discharge with a Grinding Pre-Treatment. Waste Manag. 2025, 206, 115044. [Google Scholar] [CrossRef] [Scilit]
- Moreno-Leiva, S.; Haas, J.; Junne, T.; Valencia, F.; Godin, H.; Kracht, W.; Nowak, W.; Eltrop, L. Renewable Energy in Copper Production: A Review on Systems Design and Methodological Approaches. J. Clean. Prod. 2020, 246, 118978. [Google Scholar] [CrossRef] [Scilit]
- Moats, M.; Alagha, L.; Awuah-Offei, K. Towards Resilient and Sustainable Supply of Critical Elements from the Copper Supply Chain: A Review. J. Clean. Prod. 2021, 307, 127207. [Google Scholar] [CrossRef] [Scilit]
- Jena, S.S.; Tripathy, S.K.; Mandre, N.R.; Venugopal, R.; Farrokhpay, S. Sustainable Use of Copper Resources: Beneficiation of Low-Grade Copper Ores. Minerals 2022, 12, 545. [Google Scholar] [CrossRef] [Scilit]
- Mamyrbayeva, K.; Tulepbergenov, A.; Baikonurov, E. Review article on the technology of leaching of substandard copper concentrates: Methods and trends. Can. Metall. Q. 2026, 65, 3368–3380. [Google Scholar] [CrossRef] [Scilit]
- The Role of Critical Minerals in Clean Energy Transitions. Executive Summary. 2025. Available online: https://www.iea.org/reports/the-role-of-critical-minerals-in-clean-energy-transitions/executive-summary (accessed on 24 August 2026).
- THUNDER SAID ENERGY the Research Consultancy for Energy Technologies. Copper: Global Demand Forecasts? Available online: https://thundersaidenergy.com/downloads/copper-global-demand-forecasts/?__cf_chl_f_tk=ihDwu1IF_3f9P0CcCkLjNFdvzU7mb8mo3Njf.2lUG7g-1782909404-1.0.1.1-pFuQXGFdvBduuus5Vus1GlXnA3LqhuSwp3JTMum.r8 (accessed on 24 August 2026).
- Xie, X.; Huo, J.; Zou, H. Green Process Innovation, Green Product Innovation, and Corporate Financial Performance: A Content Analysis Method. J. Bus. Res. 2019, 101, 697–706. [Google Scholar] [CrossRef] [Scilit]
- Franks, D.M.; Boger, D.V.; Côte, C.M.; Mulligan, D.R. Sustainable Development Principles for the Disposal of Mining and Mineral Processing Wastes. Resour. Policy 2011, 36, 114–122. [Google Scholar] [CrossRef] [Scilit]
- Global Tailings Review. About Tailings. 2026. Available online: https://thegtmi.org/history/ (accessed on 25 August 2026).
- Kossoff, D.; Dubbin, W.E.; Alfredsson, M.; Edwards, S.J.; Macklin, M.G.; Hudson-Edwards, K.A. Mine Tailings Dams: Characteristics, Failure, Environmental Impacts, and Remediation. Appl. Geochem. 2014, 51, 229–245. [Google Scholar] [CrossRef] [Scilit]
- Wang, C.; Harbottle, D.; Liu, Q.; Xu, Z. Current State of Fine Mineral Tailings Treatment: A Critical Review on Theory and Practice. Miner. Eng. 2014, 58, 113–131. [Google Scholar] [CrossRef] [Scilit]
- Adewuyi, S.O.; Anani, A.; Luxbacher, K. Advancing Sustainable and Circular Mining through Solid-Liquid Recovery of Mine Tailings. Process Saf. Environ. Prot. 2024, 189, 31–46. [Google Scholar] [CrossRef] [Scilit]
- Baker, E.; Davies, M.; Fourie, A.; Mudd, G.; Thygesen, K. Chapter II. Mine Tailings Facilities: Overview and Industry Trends. In Towards Zero Harm: A Compendium of Papers Prepared for the Global Tailings Review; Oberle, B., Brereton, D., Mihaylova, A., Eds.; Grid-Arendal: Arendal, Norway; Global Tailings Review: London, UK, 2020; pp. 14–25. Available online: https://thegtmi.org/wp-content/uploads/2025/11/towards-zero-harm_compendium.pdf (accessed on 23 August 2026).
- Surimbayev, B.; Bolotova, L.; Akcil, A.; Ghorbani, Y. Gold Mining Tailings as a Sustainable Secondary Resource: Environmental Impacts, Processing Technologies and Metal Recovery. A Review. Miner. Process. Extr. Metall. Rev. 2026, 1–33. [Google Scholar] [CrossRef] [Scilit]
- Schoenberger, E. Environmentally Sustainable Mining: The Case of Tailings Storage Facilities. Resour. Policy 2016, 49, 119–128. [Google Scholar] [CrossRef] [Scilit]
- Cacciuttolo, C.; Atencio, E. Past, Present, and Future of Copper Mine Tailings Governance in Chile (1905–2022): A Review in One of the Leading Mining Countries in the World. Int. J. Environ. Res. Public Health 2022, 19, 13060. [Google Scholar] [CrossRef] [Scilit]
- Trifunović, V.; Avramović, L.; Božić, D.; Jonović, M.; Šabaz, D.; Bugarin, D. Flotation Tailings from Cu-Au Mining (Bor, Serbia) as a Potential Secondary Raw Material for Valuable Metals Recovery. Minerals 2024, 14, 905. [Google Scholar] [CrossRef] [Scilit]
- Dadzie, R.A.; Zanin, M.; Skinner, W.; Addai-Mensah, J.; Asamoah, R.; Abaka-Wood, G.B. Reprocessing of Sulphide Flotation Tailings for Copper Recovery: Characterisation. Minerals 2025, 15, 649. [Google Scholar] [CrossRef] [Scilit]
- Kanaly, Y.; Surimbaev, B.; Bolotova, L.; Shalgymbaev, S. Choice of a Sorbent for Copper and Cobalt Sorption from Gold-Containing Heap Leaching Solutions. Metallurgist 2024, 67, 1457–1465. [Google Scholar] [CrossRef] [Scilit]
- Bolotova, L.; Surimbayev, B.; Kanaly, Y.; Assylbekov, A. Selection of an Organic Carbon Depressant for the Flotation of Refractory Gold Sulfide Ores. Min. Metall. Explor. 2025, 42, 3965–3973. [Google Scholar] [CrossRef] [Scilit]
- Surimbayev, B.; Kanaly, Y.; Bolotova, L.; Akzharkenov, M.; Mishra, B.; Yessengarayev, Y. Ion-Exchange Recovery of Copper from Gold–Copper Cyanide Solutions. JOM 2026, 78, 9337–9352. [Google Scholar] [CrossRef] [Scilit]
- Toro, N.; Ghorbani, Y.; Turan, M.D.; Robles, P.; Gálvez, E. Gangues and Clays Minerals as Rate-Limiting Factors in Copper Heap Leaching: A Review. Metals 2021, 11, 1539. [Google Scholar] [CrossRef] [Scilit]
- Nikvar-Hassani, A.; Hodges, R.; Zhang, L. Production of Green Bricks from Low-Reactive Copper Mine Tailings: Durability and Environmental Aspects. Constr. Build. Mater. 2022, 337, 127571. [Google Scholar] [CrossRef] [Scilit]
- Godirilwe, L.L.; Haga, K.; Altansukh, B.; Takasaki, Y.; Ishiyama, D.; Trifunovic, V.; Avramovic, L.; Jonovic, R.; Stevanovic, Z.; Shibayama, A. Copper Recovery and Reduction of Environmental Loading from Mine Tailings by High-Pressure Leaching and SX-EW Process. Metals 2021, 11, 1335. [Google Scholar] [CrossRef] [Scilit]
- Pérez, K.; Moraga, C.; Herrera, N.; Salinas-Rodríguez, E.; Gálvez, E. Effect of the Addition of Flocculants and KCl on Sedimentation Rate of Spodumene Tailings. Metals 2021, 11, 986. [Google Scholar] [CrossRef] [Scilit]
- Abramov, A.A.; Forssberg, K.S.E. Chemistry and Optimal Conditions for Copper Minerals Flotation: Theory and Practice. Miner. Process. Extr. Met. Rev. 2005, 26, 77–143. [Google Scholar] [CrossRef] [Scilit]
- Fathi, M.; Chegini, M.; Nakhaei, F. A Targeted Approach to Critical Mineral Recovery from Low-Grade Magnesite Ore Using Magnetic and Flotation Techniques. Minerals 2025, 15, 698. [Google Scholar] [CrossRef] [Scilit]
- Semushkina, L.; Tussupbayev, N.; Turysbekov, D.; Narbekova, S.; Kaldybayeva, Z. Flotation processing of copper-containing technogenic raw materials using a composite flotation reagent. Complex Use Miner. Resour. 2022, 324, 34–42. [Google Scholar] [CrossRef] [Scilit]
- Marcin, M.; Sisol, M.; Laubertová, M.; Behunová, D.M.; Ďuriška, I. Processing of Low-Grade Cu–Pb–Zn Sulfide Polymetallic Ore Stockpiles for Sustainable Raw Material Recovery by Froth Flotation. Processes 2025, 13, 2158. [Google Scholar] [CrossRef] [Scilit]
- GOST 31875-2012; Non-Ferrous Metal Ores, Products of Their Enrichment and Metallurgical Processing. Methods for Determination of Zinc, Lead, Copper, Cadmium, Iron, Cobalt, Nickel and Manganese. Standartinform: Moscow, Russia, 2012.
- GOST 33207-2014; Copper and Complex Ores and Products of Their Processing. Methods for Measurement of Copper in Mineral Forms Mass Fraction. Standartinform: Moscow, Russia, 2015.
- GOST 33209-2014; Copper and Complex Ores and Products of Their Processing. Method for Measurement of Iron Mass Fraction. Standartinform: Moscow, Russia, 2015.
- ST RK 1354-2005; State Standard of the Republic of Kazakhstan. Ores and Rocks. Method for Determination of Sulphur Total Content. Memstst: Astana, Kazakhstan, 2005.
- NSAM 3-Kh; Quantitative Chemical Analysis Method. Determination of the Total Sulfur Content in Rocks, Ores, and Products of Their Processing by the Gravimetric Method. Scientific Council for Analytical Methods: Moscow, Russia, 2006.
- Motovilov, I.; Adilzhan, Z.; Barmenshinova, M.; Algebraistova, N.; Makhmedun, A.; Omar, R.; Sergali, A.; Naurzalinov, S. Study of Satpayev Deposit Ore Clay Fractions Centrifugal Concentration and High-Gradient Magnetic Separation for Ilmenite Recovery. Minerals 2026, 16, 606. [Google Scholar] [CrossRef] [Scilit]
- Gerasimov, A.M.; Lazareva, V.V.; Samukov, A.D.; Strahov, V.M. Assessment of the Distribution of Mineral Inclusions and Coal Crushing. Coke Chem. 2019, 62, 390–393. [Google Scholar] [CrossRef] [Scilit]
- Azizi, A.; Masdarian, M.; Hassanzadeh, A.; Bahri, Z.; Niedoba, T.; Surowiak, A. Parametric Optimization in Rougher Flotation Performance of a Sulfidized Mixed Copper Ore. Minerals 2020, 10, 660. [Google Scholar] [CrossRef] [Scilit]
- Akhmadiyeva, N.; Abdulvaliyev, R.; Gladyshev, S.; Sukurov, B.; Abikak, Y.; Manapova, A.; Bakhytuly, N. Optimizing Technological Parameters for Chromium Extraction from Chromite Ore Beneficiation Tailings. Minerals 2025, 15, 555. [Google Scholar] [CrossRef] [Scilit]
- Li, E.M.; Smailova, A.B.; Beisembaev, E.B.; Daulet, B.E. Research on copper processing plant tailings to increase copper recovery. Sci. News Kazakhstan 2026, 168, 50–68. [Google Scholar] [CrossRef] [Scilit]

Disclaimer/Publisher’s Note: The statements, opinions and data contained in all publications are solely those of the individual author(s) and contributor(s) and not of MDPI and/or the editor(s). MDPI and/or the editor(s) disclaim responsibility for any injury to people or property resulting from any ideas, methods, instructions or products referred to in the content. |
© 2026 by the authors. Licensee MDPI, Basel, Switzerland. This article is an open access article distributed under the terms and conditions of the Creative Commons Attribution (CC BY) license.