


Abstract
Heap leaching efficiency is constrained by the non-uniform seepage of the leaching solution (such as sulphuric acid), where preferential flow and localized plugging lead to low leaching rates, prolonged cycles, and high acid consumption. Seepage behavior is fundamentally governed by pore structure, which evolves continuously during leaching through chemical dissolution and physical plugging, and in turn feeds back to affect reactive transport by altering seepage pathways. Taking low-grade copper oxide ore (0.58%) as the research object, this study systematically investigates the chemical–physical coupling mechanisms of pore structure evolution and the corresponding regulation strategies through column leaching experiments, shrinking-core kinetics analysis, migration-plugging analysis, and COMSOL multi-physics coupling simulation. The results indicate that copper leaching is jointly controlled by chemical reaction and diffusion, with the apparent rate constant following a power-law relationship with acid concentration (reaction order n = 0.65), demonstrating significantly diminishing marginal gains. Physical plugging is identified as a critical factor in the sharp decline of permeability, with the hydraulic conductivity of the 0.2 mm particle size group decreasing by 86.58%, far exceeding the 37.80% reduction observed in the 0.05 mm group. On this basis, chemical–physical coupling mechanism analysis reveals the competitive control of four mechanisms over pore evolution: dissolution-induced pore enlargement, precipitation-induced pore shrinkage, plugging-induced pore shrinkage, and collapse-induced pore shrinkage. A COMSOL-based multi-physics coupling model integrating seepage, reaction, migration, and mechanics is constructed to predict porosity, permeability, and leaching rate during the leaching process, with model errors below 10%. The temporal contribution rates of the four mechanisms reveal a three-stage evolution pattern: a dissolution-dominated stage in the early period, a multi-mechanism competitive stage in the middle period, and a precipitation-plugging synergistic densification stage (accounting for >90% in total) in the later period. Accordingly, a phased spray regulation strategy is proposed, achieving a leaching rate exceeding 65% under uniform flow velocity conditions. This study provides a theoretical basis and numerical tools for enhancing the leaching efficiency of low-grade copper ores.
1. Introduction
Copper is an indispensable strategic metal in the fields of electric power, electronics, construction, and national defense. With the continuous depletion of high-grade copper ore resources, the efficient development and utilization of low-grade copper ores have become a critical issue for ensuring the security of China’s copper resource supply. China’s copper resources are characterized by abundant low-grade ores but scarce high-grade ones, and a large quantity of low-grade ores has been long-term stockpiled due to the poor economic viability of conventional beneficiation and metallurgical processes. Stope leaching technology, featuring short process flow, low capital investment, and environmental friendliness, has emerged as an important technical approach for the development and utilization of low-grade copper ore resources [1,2,3,4]. Underground stope leaching technology adopts in situ blasting for ore fragmentation, eliminating the processes of surface ore transportation and heap leaching, which not only reduces environmental impact but also decreases transportation costs. After the completion of leaching, 70% to 80% of the fragmented ore remains in the stope, which can effectively alleviate the ground pressure control issues encountered in traditional mining operations [5,6,7]. The leaching rate and leaching efficiency of effective ore metal elements are the key factors in stope leaching technology [8,9].
The core constraint on stope leaching efficiency lies in the permeability characteristics of the granular ore media, which are primarily governed by pore structure. The leaching system is composed of granular ore media, pores and fractures, and the leaching solution: ore particles constitute the solid skeleton of the granular media, pore structures are formed between particles, and the leaching solution flows through these pores [10,11,12]. During the leaching process, the leaching solution reacts chemically with the ore, and chemical dissolution continuously erodes mineral surfaces. The saturated solution precipitates secondary precipitates at pore throats, while fine particles released by dissolution migrate with the solution and deposit at throats, causing plugging. Concurrently, the weakening of particle contact points due to dissolution induces local skeleton collapse and particle rearrangement. These four mechanisms act simultaneously on the pore space, causing the solution seepage channels to progressively shrink and the leaching rate to decline continuously with leaching time [13,14,15]. Elucidating the evolution law of pore structure governed by the coupling of these multiple mechanisms is the key to breaking through the bottleneck of leaching efficiency.
Research on pore structure evolution mechanisms serves as the theoretical foundation for transforming leaching processes from experience-based operation to quantitative regulation. Scholars both domestically and internationally have conducted extensive work on pore structure characterization and pre- and post-leaching comparisons. However, most studies remain limited to qualitative descriptions of single factors. On the one hand, they largely focus on macroscopic effect analyses, lacking in-depth investigation into microscopic pore evolution mechanisms. Faraji [16], Prasetya [17], Yan [18], Luo [19], and others have explored the effects of leaching parameters (lixiviant concentration, temperature, particle size, agitation, solid-to-liquid ratio) on dissolution rates through laboratory experiments and numerical simulations. However, their studies were not correlated with realistic stope leaching models, nor did they fundamentally consider the impact of pore structure evolution in granular ore media on leaching. Ilankoon [20], Prasomsri [21], Song [22], Liu [23], Loizeau [24], and others conducted column leaching experiments to analyze the effects of pore structure differences under various gradation, flow velocity, and temperature conditions on solution seepage behavior, but did not further track the controlling role of pore evolution on the ultimate leaching rate. On the other hand, most studies are confined to single-factor analyses of either chemical or physical aspects, lacking a systematic understanding of chemically and physically coupled pore evolution. In terms of chemical effects, Ma [25], Dangelmayr [26], and others employed experiments and modeling to reveal that chemical dissolution releases ions, affecting uranium adsorption behavior and leachate pH, as well as the retardation effect on uranium transport. However, they did not account for the feedback effects of dissolution-induced dynamic evolution of porosity and permeability on the flow field, nor the contribution of physical particle migration to pore plugging. In terms of physical aspects, Tompson [27], Wang [28], Loizeau [24], and others conducted column leaching experiments to investigate variations in pore permeability under different conditions, yielding valuable progress in particle migration and permeability impairment. Nevertheless, these studies focused on single-factor analyses of physical plugging and failed to reveal the complete mechanism of permeability attenuation under chemically and physically coupled driving forces. In reality, chemical and physical processes do not act as independent additive effects during leaching but form a complete feedback loop through “dissolution releasing particles, particle deposition causing plugging, plugging altering the flow field, and flow field regulating reactions.”
To address the aforementioned research gaps, this study takes stope leaching of low-grade copper ore as its engineering background and focuses on the temporal evolution of inter-particle pore structure as the main line of investigation. By comprehensively employing column leaching experiments, chemical kinetics analysis, fine particle migration experiments, and COMSOL (Version 6.4) multi-physics coupling numerical simulation, this study quantitatively separates the contribution rates of four mechanisms—dissolution-induced pore enlargement, precipitation-induced pore shrinkage, plugging-induced pore shrinkage, and mechanical collapse-induced pore shrinkage—at different leaching stages, and reveals the controlling effect of the shift in dominant mechanisms on the leaching efficiency of copper.
The innovations of this study are mainly reflected in the following three aspects: (1) It reveals the “one increase and three decreases” four-mechanism competition law governing pore evolution in the granular leaching system, and quantitatively elucidates the temporal evolution characteristics of the contribution rates of each mechanism. (2) It establishes a quantitative separation method for the contribution rates based on multi-physics coupling numerical simulation, achieving the advancement of pore evolution research from qualitative description to quantitative analysis. (3) It proposes a phased spray regulation strategy that divides the leaching process into the dissolution-dominated stage, the four-mechanism competitive stage, and the precipitation-plugging densification stage, forming a full-chain technical closed loop from mechanistic understanding to engineering application. The research findings provide a theoretical basis and technical support for the optimization of stope leaching processes for low-grade copper ores, and bear significant theoretical significance and engineering application value for improving copper resource utilization.
2. Materials and Methods
2.1. Ore Materials
The ore samples used in the experiment were collected from a low-grade copper mine in Hubei Province, China, with an average copper grade of 0.582%. The ore samples were crushed to the required particle size using a jaw crusher (PE100×150, Wuxi Jianyi Instrument & Machinery Co., Ltd., Wuxi, China), and then subjected to X-ray fluorescence spectrometry (XRF, PANalytical Axios, PANalytical B.V., Almelo, The Netherlands) analysis to determine the chemical elemental composition, as shown in Table 1. The mineral phases were identified by X-ray diffraction (XRD, X’Pert PRO MPD, Malvern Panalytical B.V., Almelo, The Netherlands) analysis combined with mineral liberation analysis (MLA 650, FEI Company, Hillsboro, OR, USA). The chemical composition and mineral phases are presented in and Table 2, respectively. It should be noted that Table 1 lists only the major chemical elements, and the remaining ~11.4% is mainly attributed to loss on ignition (LOI), combined water, and other unlisted minor components.
Table 1.
Main chemical element composition of ore sample.
Table 2.
Chemical phase analysis of copper in ore sample.
The gangue minerals are predominantly composed of quartz (SiO2, 60.49%). Among the alkaline oxides (Al2O3 + CaO + MgO, 20.72%), Al2O3 (15.16%) contributes to increased acid consumption, while CaO (4.88%) is prone to precipitation formation. The primary metallic elements are Cu and Fe (with an Fe/Cu ratio of 10.30, and Fe can be recovered concurrently). The trace elements such as Mn and Cl exert negligible influence on the leaching process.
2.2. Experimental Scheme
The experiment consisted of two main parts: (1) chemical dissolution–precipitation tests and (2) fine particle migration experiments.
- (1)
- Chemical experiments
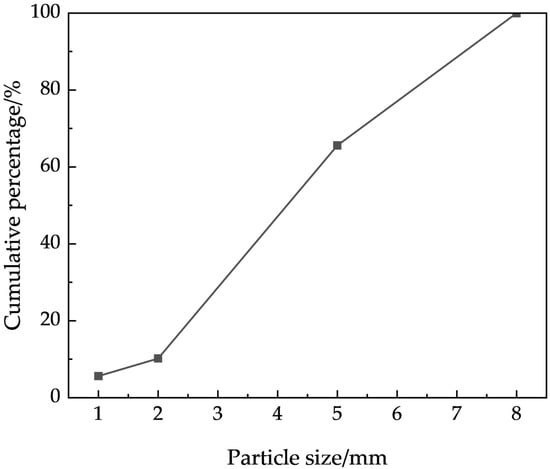
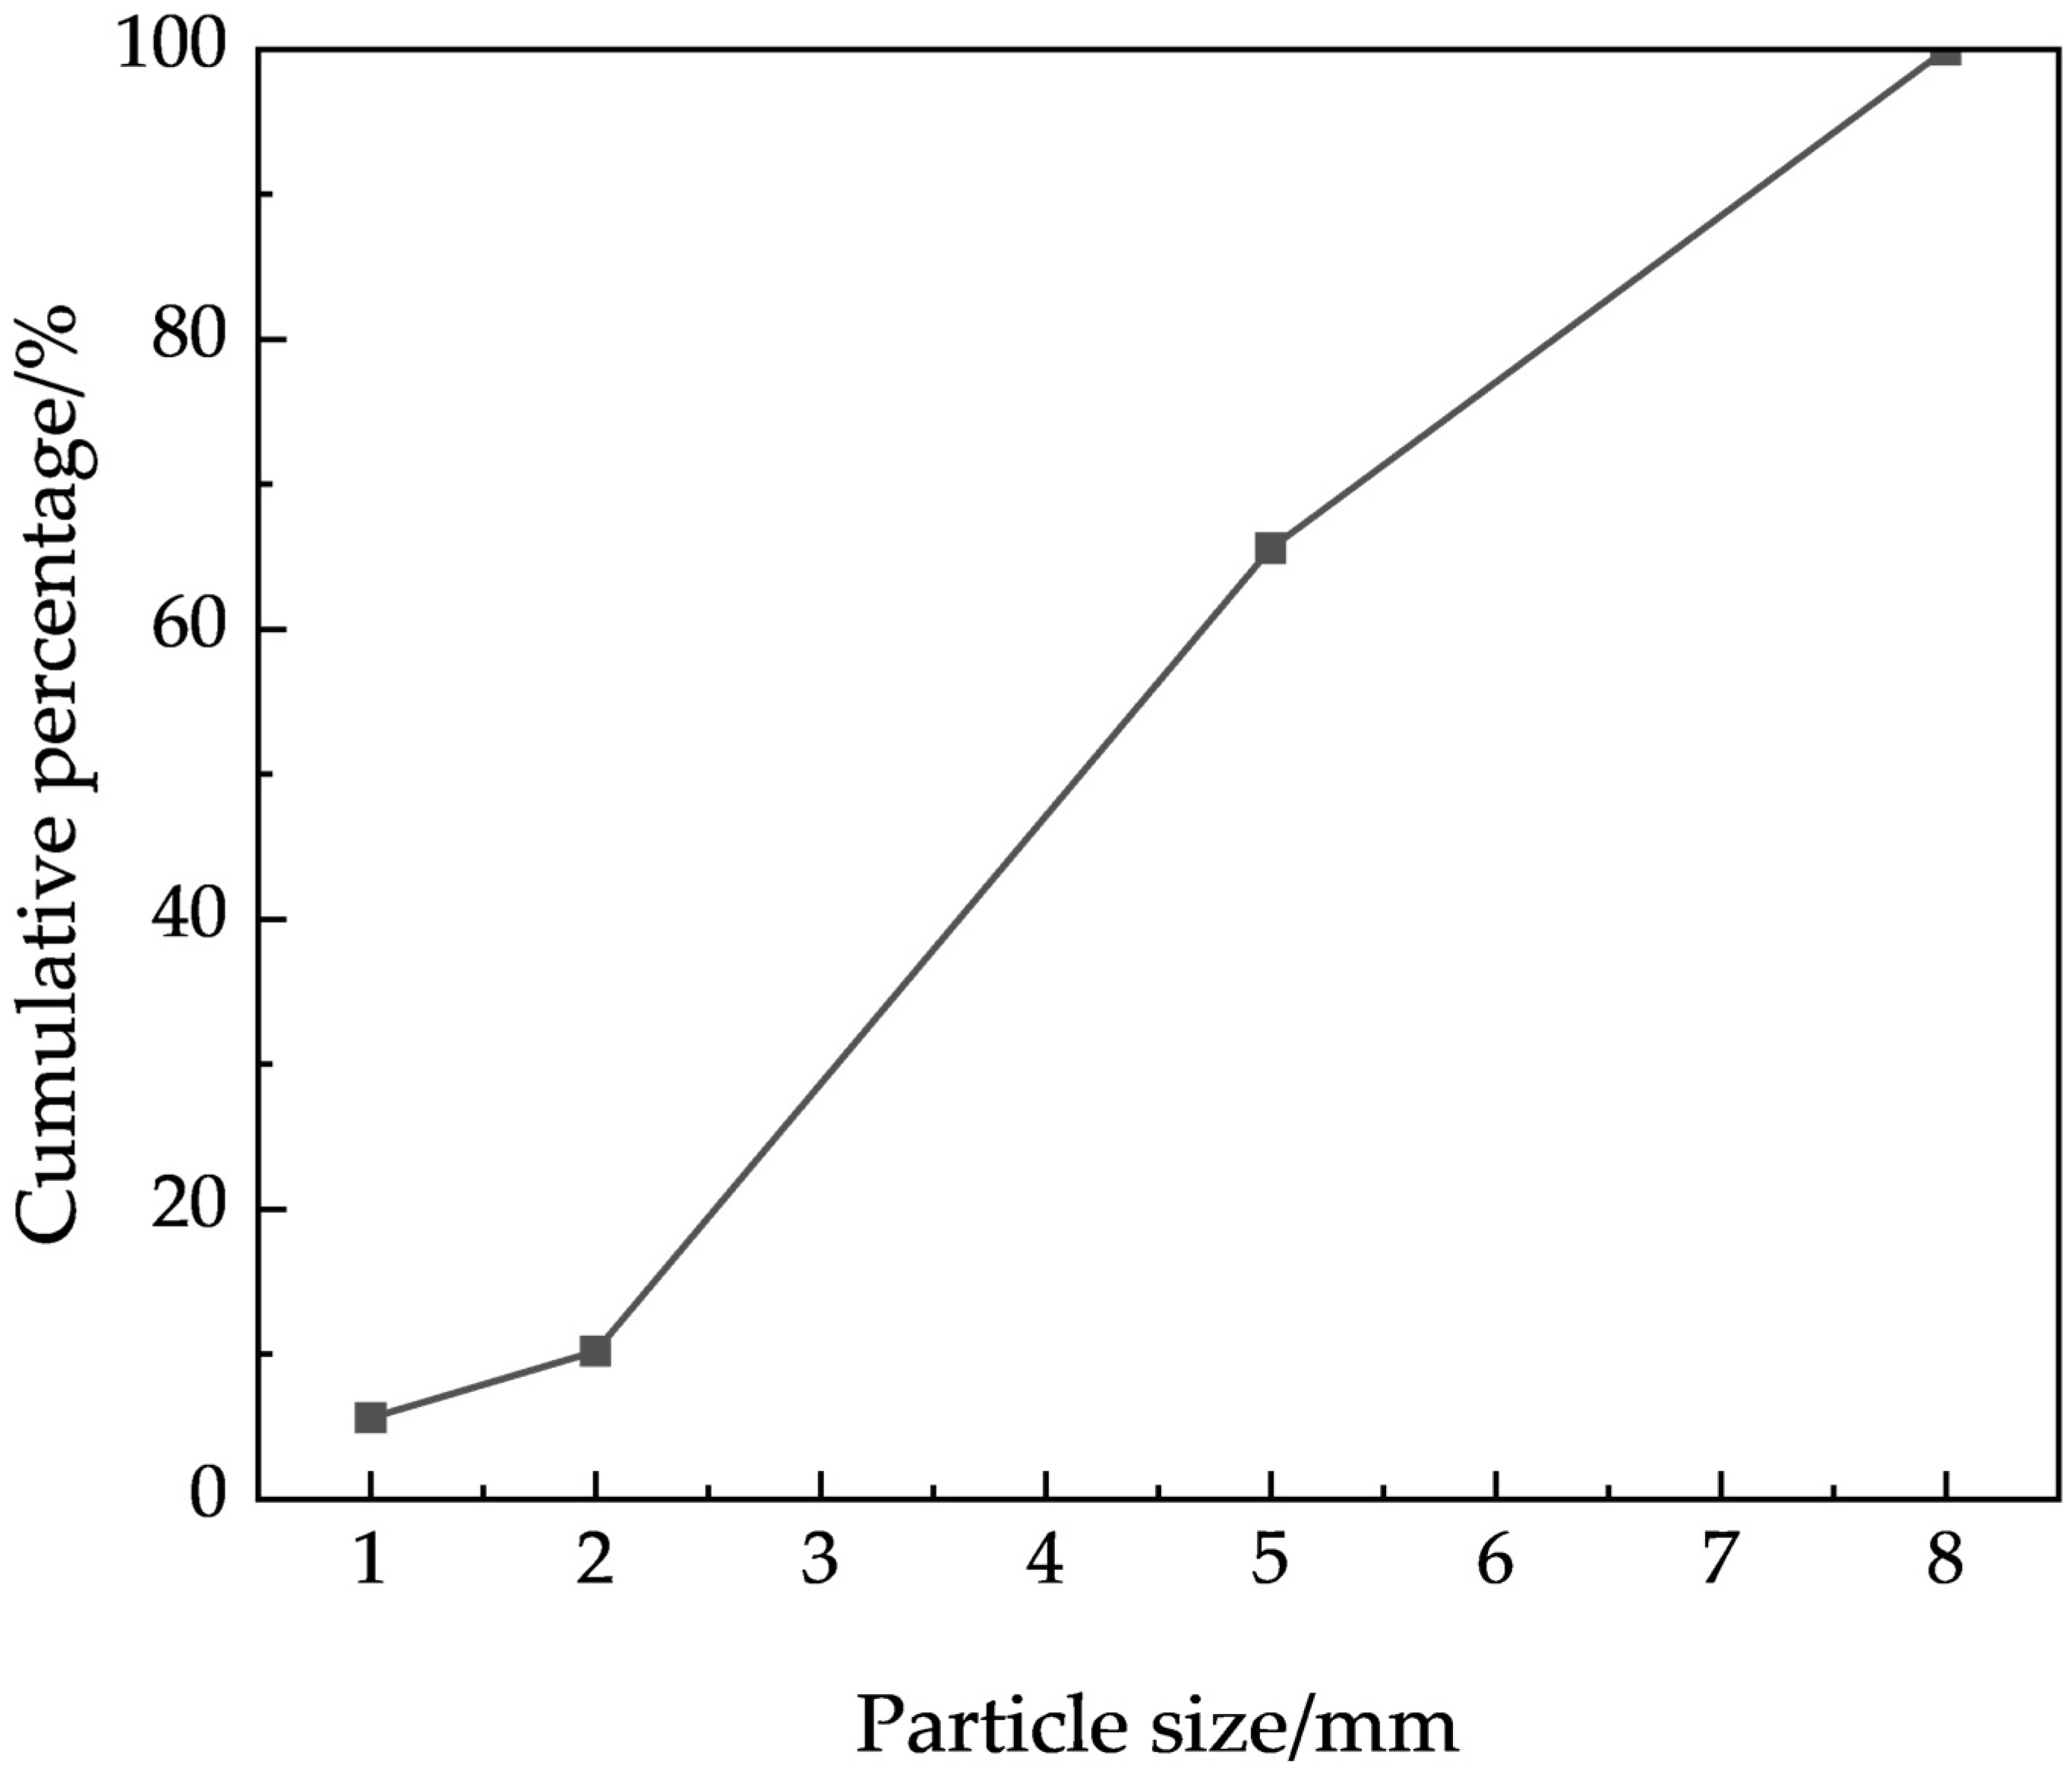
After being crushed by a jaw crusher, the ore samples were sieved using a screening machine (SZF-1030, Xinxiang Gaofu Machinery Co., Ltd., Xinxiang, China) and grouped by particle size into the following fractions: 0~1 mm, 1~2 mm, 2~5 mm, and 5~8 mm. The particle size distribution is shown in Figure 1.
Figure 1.
Particle size distribution.
Chemical dissolution–precipitation experiments were conducted at different acid concentrations (2.5 g/L, 5 g/L, 10 g/L, and 20 g/L, the initial pH values were 1.41, 1.15, 0.83, and 0.56, respectively.). Each experiment was performed in duplicate until stable results were obtained. According to the experimental numbering scheme, ore particles of equal mass were weighed based on particle size distribution and loaded into their respective leaching columns. After packing, a 3 mm glass bead layer was placed on top as a protective layer to prevent the spray solution from directly impacting the ore surface and causing channeling flow. During the experiment, data were monitored and recorded at intervals of 6 h within the first 72 h, and subsequently every 24 h from day 3 to day 14. At each scheduled time point, the effluent was collected, the volume was recorded, and the following parameters were measured: pH value, oxidation–reduction potential (Eh), Cu2+ concentration (by atomic absorption spectroscopy, AAS (iCE 3400, Thermo Fisher Scientific, Waltham, MA, USA)), Fe ion concentration (by EDTA sequential titration for Fe3+ and Fe2+), major impurity ion concentrations of Al, Ca, Mg, etc. (by inductively coupled plasma mass spectrometry, ICP-MS (Agilent 7900, Agilent Technologies, Santa Clara, CA, USA)), and SO42− concentration (by ion chromatography, TIC-680, Skyray Instrument, Suzhou, China).
- (2)
- Fine particle migration experiments
The coarse particles constituting the skeleton in the specimens ranged from 1 to 8 mm in size, with 70% in the 1~4 mm fraction and 30% in the 4~8 mm fraction. After sieving, the different particle size groups were repeatedly rinsed with deionized water until the dust adhering to the ore surfaces was completely removed. The cleaned samples were then placed in an oven (DHG-9030A, Shanghai Jinghong Laboratory Instrument Co., Ltd., Shanghai, China) and dried at 105 °C for 24 h. Silicon dioxide (SiO2) powder was used as the fine particles, and a suspension with a concentration of 0.3 g/L was prepared by mixing SiO2 powder with deionized water. The experimental particle sizes were set at 0.05 mm, 0.1 mm, 0.15 mm, and 0.2 mm.
2.3. Experimental Setup
- (1)
- Chemical experiments
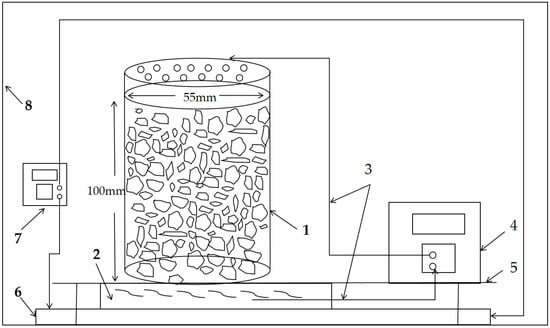
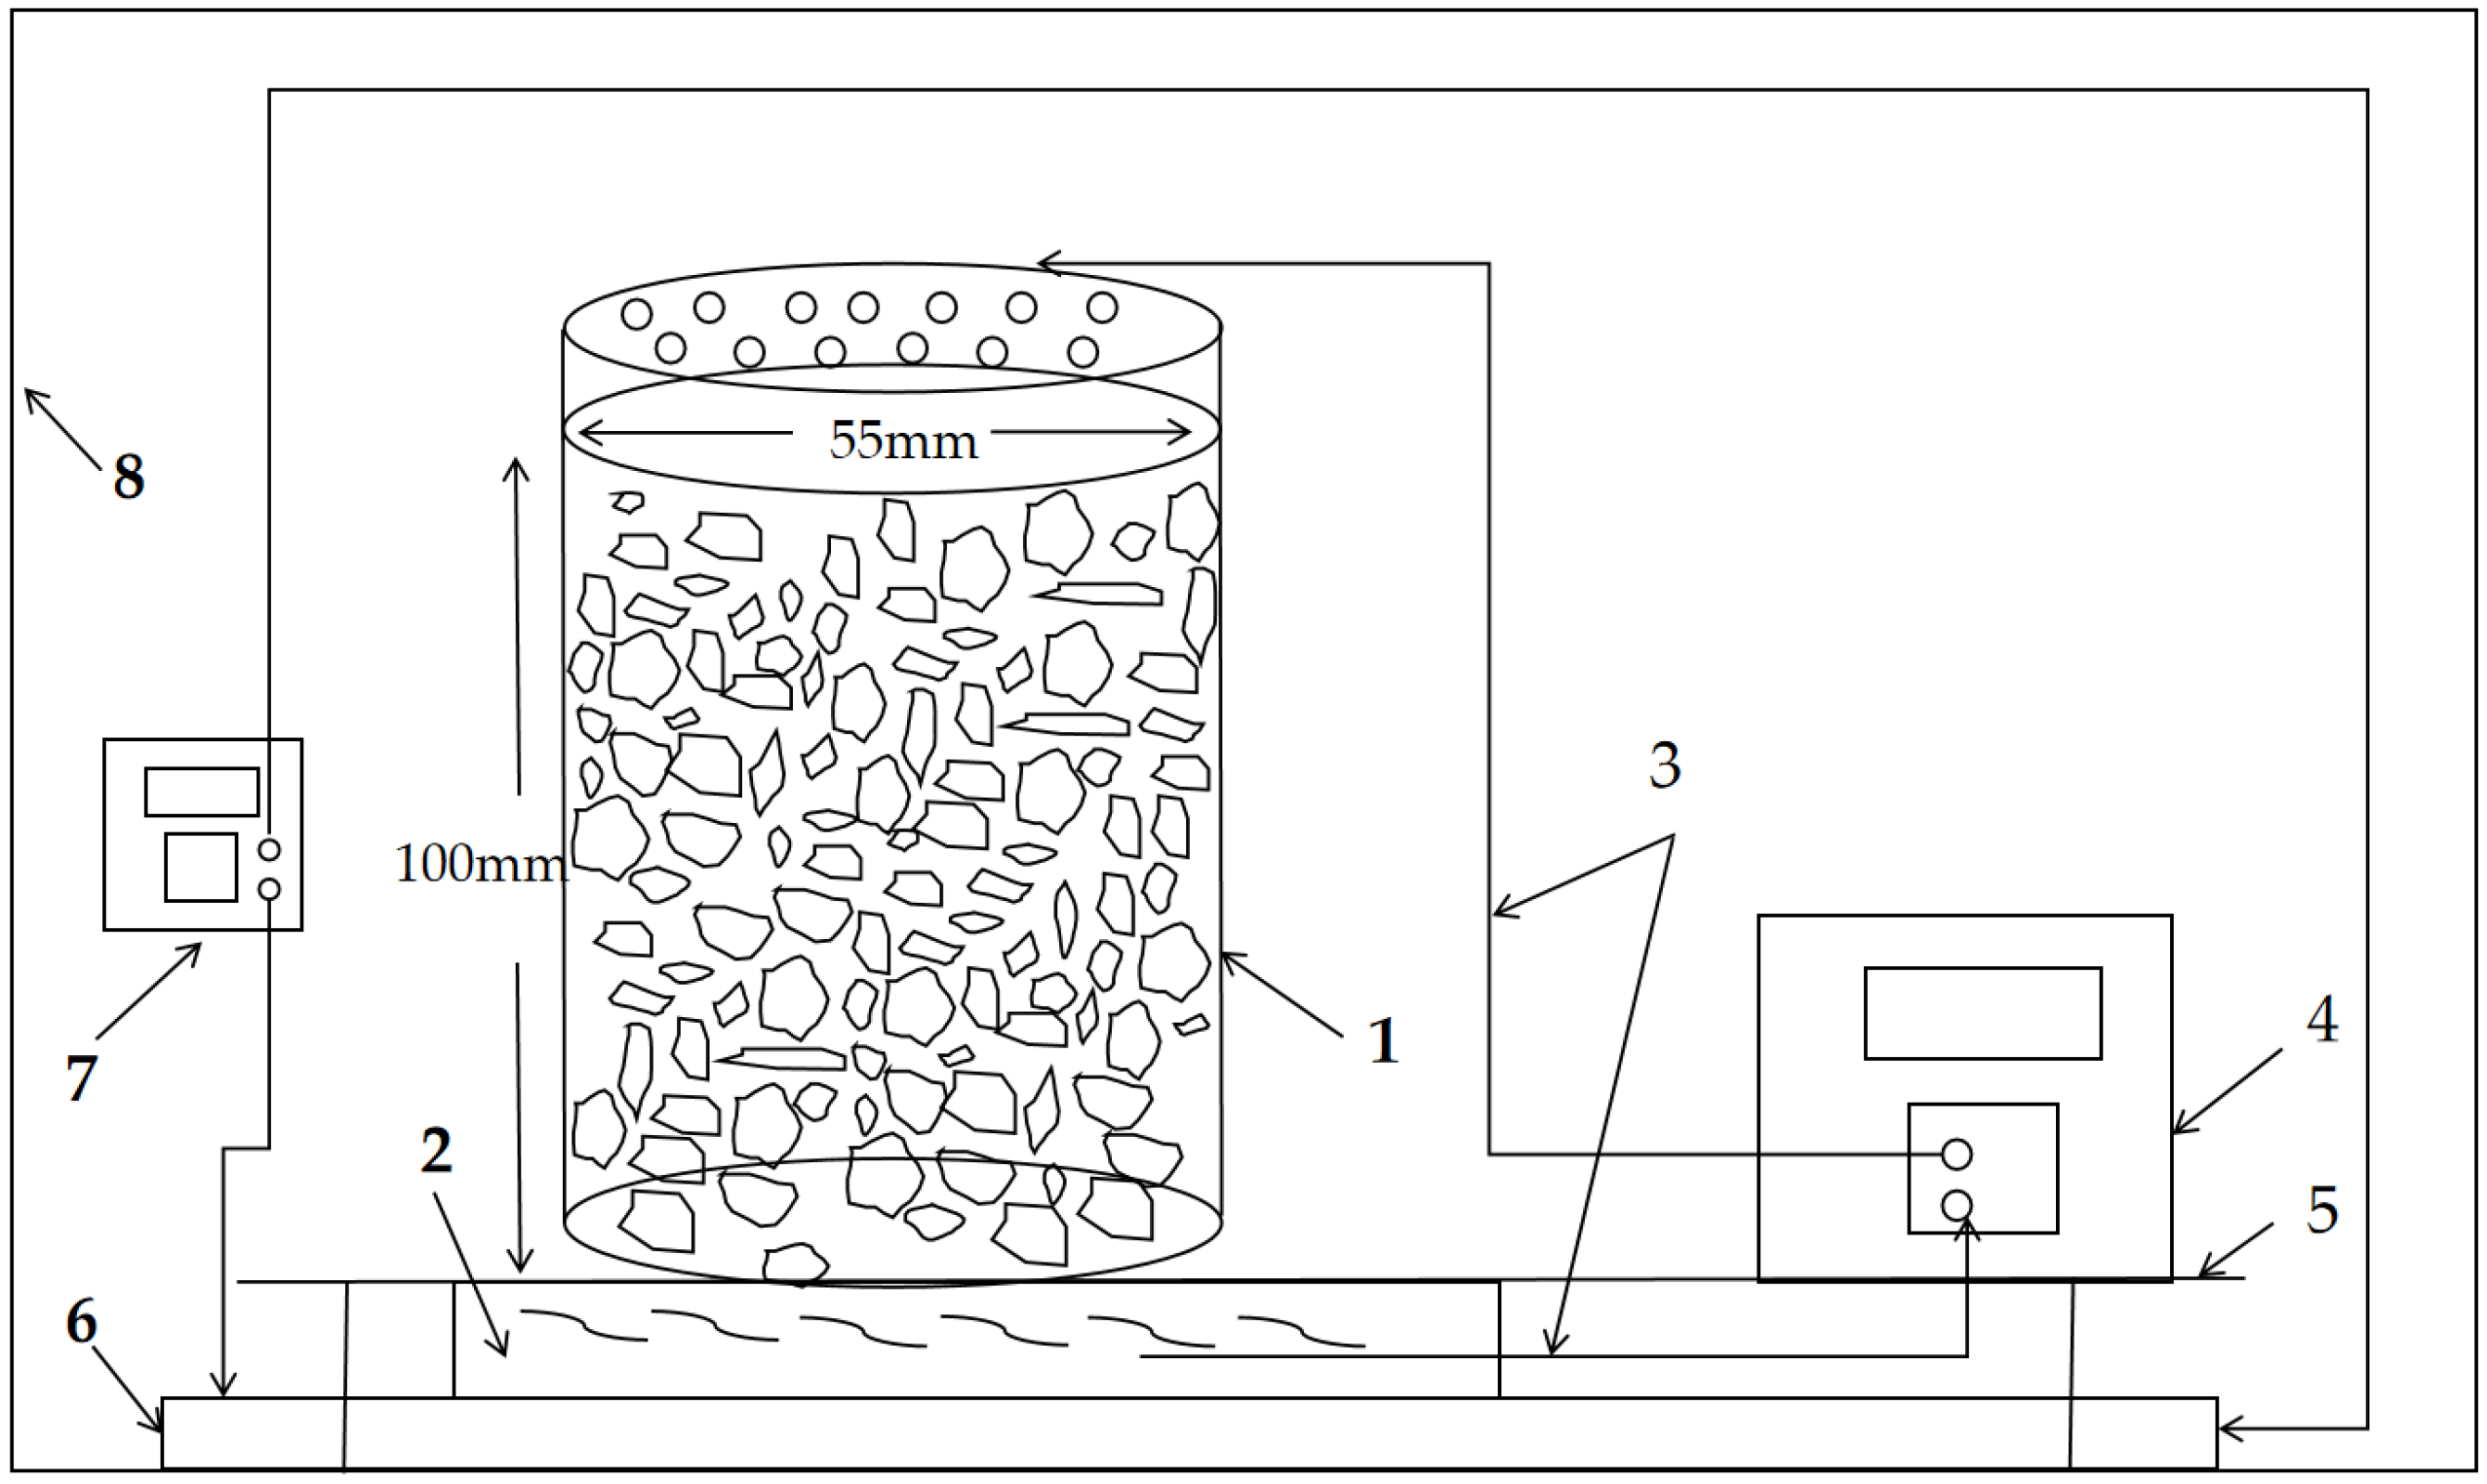
The self-designed chemical experimental system consisted of a plexiglass column, a constant-temperature incubator (BXQ-800 constant-temperature incubator, Shanghai Boxun Industry Co., Ltd., Shang-hai, China), a TA5000 electronic balance (OHAUS Corporation, Parsippany, NJ, USA), a peristaltic pump (Jieheng KY-300EA, Chongqing Jieheng Peristaltic Pumps Co., Ltd, Chongqing, China), a graduated cylinder (100 mL graduated cylinder, Wuxi Jianyi Instrument & Machinery Co., Ltd., Wuxi, China), a pH meter (Leici PHS-25, Shanghai INESA Scientific Instrument Co., Ltd, Shanghai, China), an oxidation–reduction potential (ORP) meter (Bell BPP-922, Bell Analytical Instruments (Dalian) Co., Ltd., Dalian, China), pipettes (10 mL glass pipette, Sichuan Shubo (Group) Co., Ltd., Chongzhou, China), and other auxiliary equipment. The physical model of the stope leaching system was a plexiglass column with an inner diameter of 55 mm and a height of 100 mm. A 200 μm filter mesh was placed at the bottom of the leaching column. The top of the column was connected to a constant-flow pump for the input of the leaching agent, and the leachate was collected at the bottom outlet. The experimental setup is shown in Figure 2.
Figure 2.
Schematic diagram of the custom-built leaching test system: 1—stope model; 2—liquid collection reservoir; 3—closed-loop circulation pipeline; 4—constant-flow peristaltic pump; 5—operation platform; 6—electric heating plate; 7—digital temperature controller; 8—thermally insulated enclosure.
- (2)
- Fine particle migration experiments
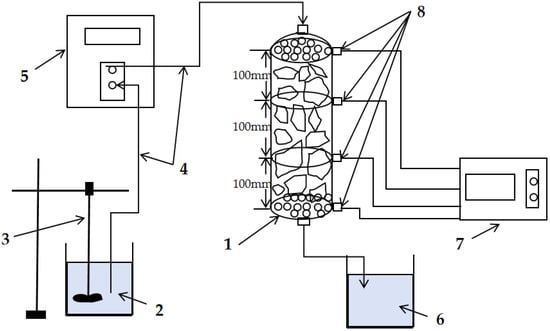
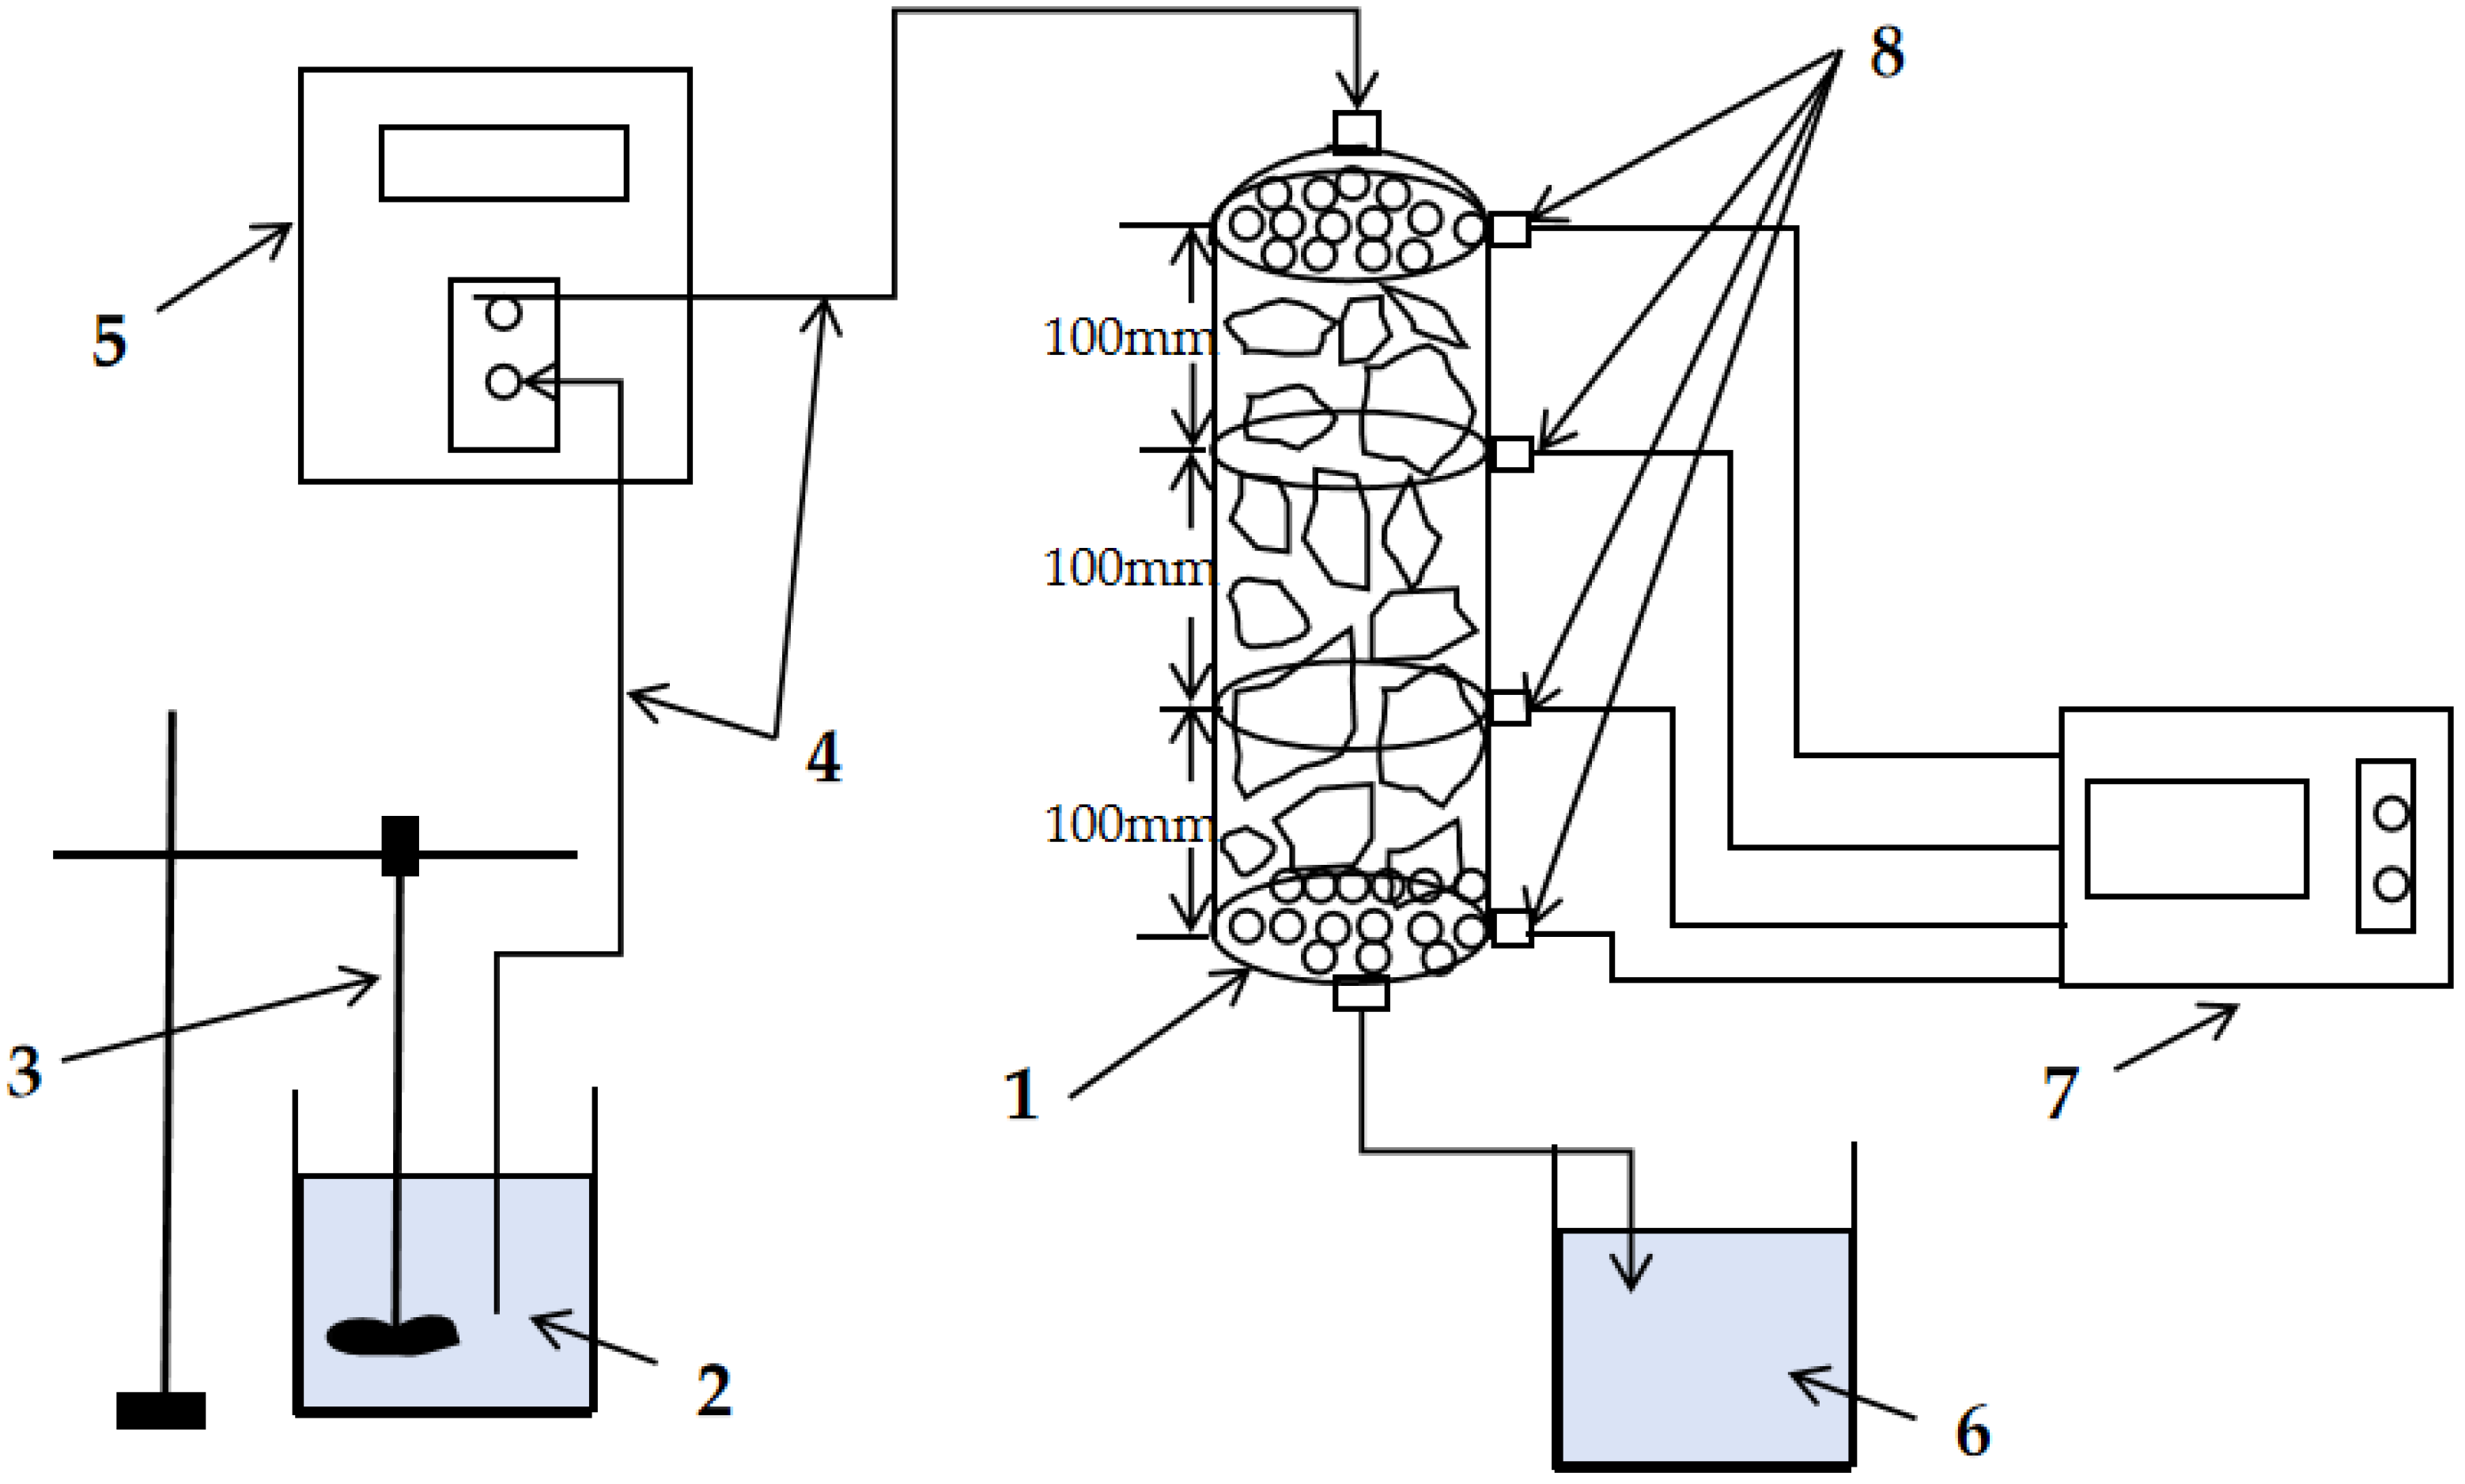
The self-designed fine particle migration experimental apparatus is shown in Figure 3. The leaching column model had an inner diameter of 60 mm and a height of 300 mm. The column device could be disassembled into three sections, each 100 mm in length, connected and secured by flanges. A total of four pressure sensor (MPM380 pressure sensor, Micro Sensor Co., Ltd., Baoji, China) measurement points were installed on the column, located at distances of 0 mm, 10 mm, 20 mm, and 30 mm from the top of the column, respectively, from top to bottom. Screens with uniform aperture were placed at both the inlet and outlet ends to ensure uniform seepage flow entering and exiting the entire soil column cross-section; the screen aperture was 0.5 mm. An automatic stirring device (JJ-1 overhead stirrer, Changzhou Gaode Instrument Manufacturing Co., Ltd., Changzhou, China) was used to continuously agitate the prepared suspension to ensure uniform distribution of suspended particles and maintain a well-suspended state.
Figure 3.
Self-designed fine particle migration experimental system: 1—model column; 2—suspension; 3—stirrer; 4—pipeline; 5—peristaltic pump; 6—effluent; 7—data logger; 8—pressure measurement points.
3. Chemically Driven Evolution of Pore Structure
The dissolution reaction between the acid solution and ore minerals directly alters the particle surface morphology and pore wall structure, serving as the direct driving force for changes in pore-throat dimensions. Meanwhile, ions released by the dissolution reaction can generate secondary precipitates under certain conditions, which occupy pore space and block throats, constituting an important cause of connectivity reduction. The quantitative influence of chemical processes on pore evolution and the dominant reaction types at different stages cannot be fully revealed by macroscopic column leaching phenomena alone. This section investigates the chemically driven mechanisms through ore particle chemical dissolution experiments, combined with the shrinking-core kinetic model to quantitatively characterize the rate-controlling steps, and introduces the saturation index to evaluate the thermodynamic equilibrium state of the dissolution–precipitation competition. The aim is to elucidate, from a chemical perspective, the competitive relationship between the two chemical processes of dissolution and precipitation, as well as the net effect of chemically driven dissolution-induced pore enlargement and precipitation-induced plugging on pore evolution.
3.1. Kinetic Analysis Based on the Shrinking-Core Model
The leaching process of copper oxide in the sulfuric acid system is a complex solid–liquid reaction process, which can be described by the unreacted shrinking-core model. The leaching rate is controlled either by the slowest step among solid-film diffusion and apparent chemical reaction, or by their combined control. According to the different rate-controlling steps, the shrinking-core model is mainly expressed in three mathematical forms:
- (a)
- Chemical reaction control model: When the leaching rate is dominated by the chemical reaction step at the interface, the leaching time t and the leaching rate X satisfy the following relationship:where α is the leaching rate (%); kc is the apparent rate constant for chemical reaction control, day−1.
- (b)
- Diffusion control model: When the leaching rate is dominated by the internal diffusion step through the solid product layer (or residual layer), the kinetic equation is expressed as:where kd is the apparent rate constant for diffusion control, day−1.
- (c)
- Mixed control model: When the leaching rate is controlled by both chemical reaction and diffusion, the kinetic equation is expressed as:where km is the mixed rate constant, day−1.
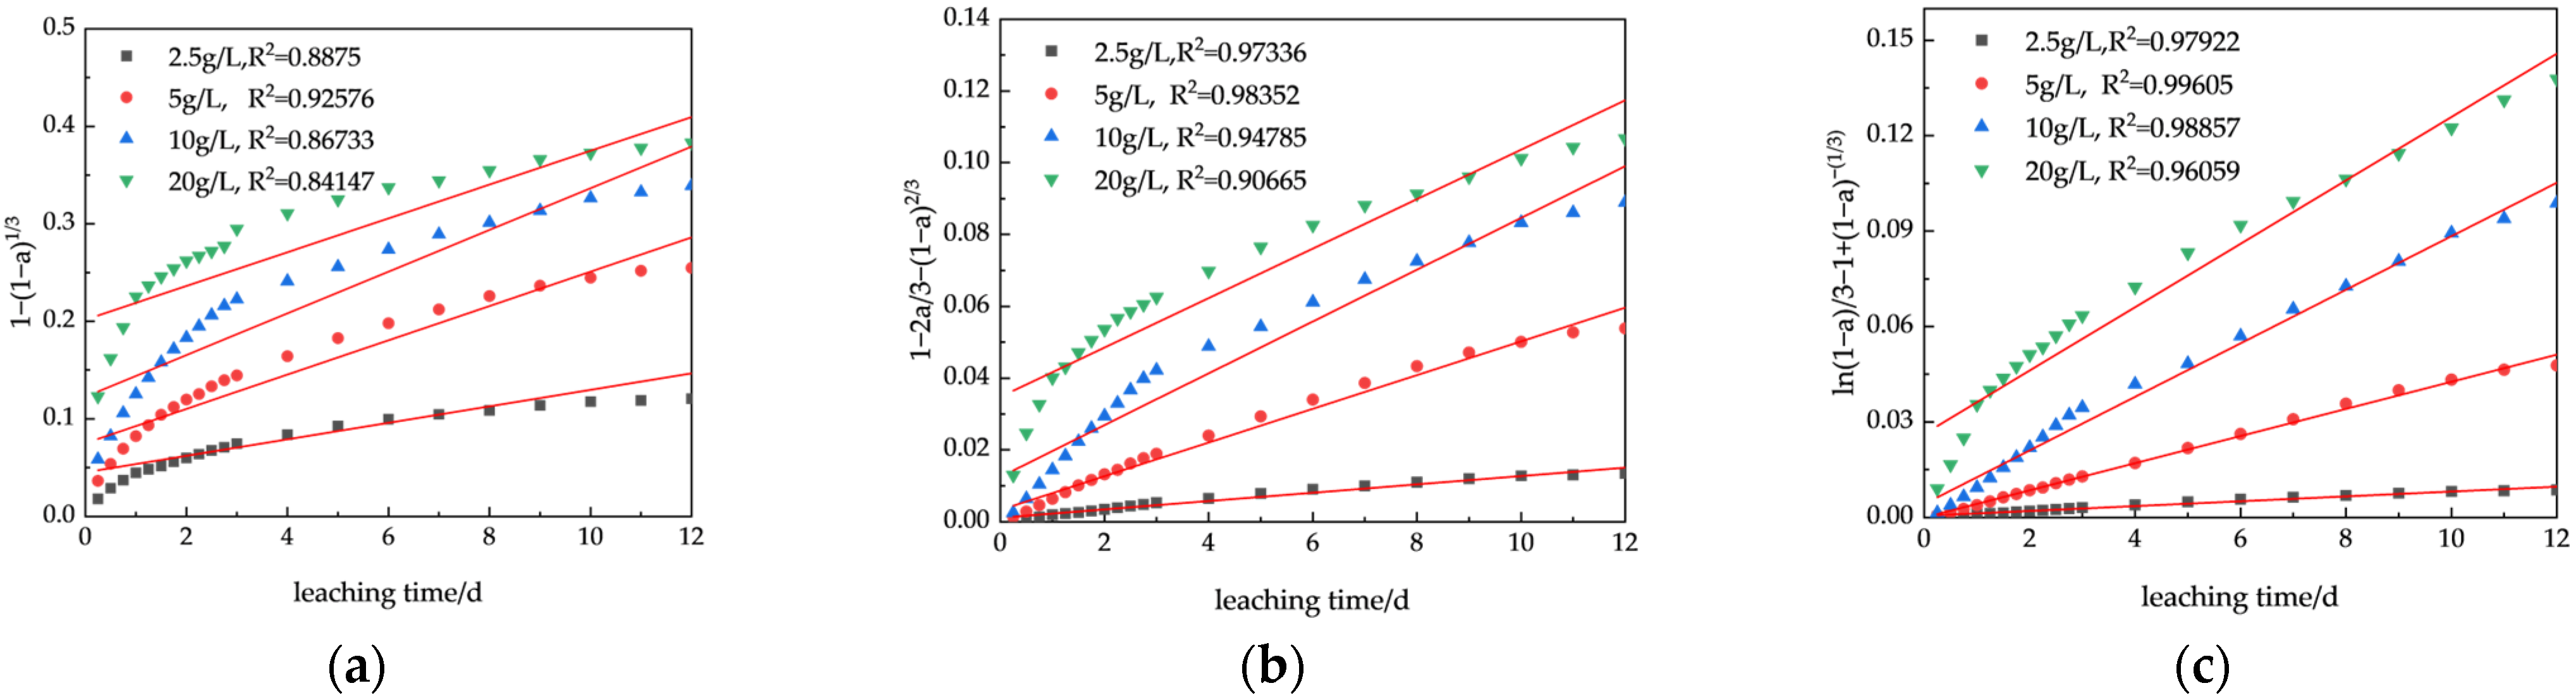
To determine the leaching controlling mechanism of copper ore particles in the dilute sulfuric acid system, the leaching rate data at different acid concentrations were respectively substituted into the left-hand functions of the different controlling models of the shrinking-core model, and linear fitting was performed with time t as the abscissa. The fitting results are shown in Figure 4.
Figure 4.
Relationship between leaching time and shrinking-core model under different acid concentrations: (a) 1 − (1 − X)1/3 versus time t; (b) 1 − 2X/3 − (1 − X)2/3 versus time t; (c) 1 − (1 − X)1/3 + [1 − 2X/3 − (1 − X)2/3] versus time t.
From the kinetic fitting results shown in Figure 4, it can be seen that for the mixed control model at different acid concentrations (2.5 g/L, 5 g/L, 10 g/L, and 20 g/L), the left-hand function exhibits a good linear relationship with the overall leaching time t, with correlation coefficients R2 reaching 0.97922, 0.99605, 0.98857, and 0.96059, respectively. This indicates that the mixed control model is more applicable across different acid concentrations, i.e., the copper leaching process is mainly controlled by both chemical reaction and diffusion. The corresponding apparent reaction rate constants are 1.16 × 10⁻³ day−1, 4.27 × 10⁻³ day−1, 8.42 × 10⁻³ day−1, and 9.97 × 10⁻³ day−1, respectively.
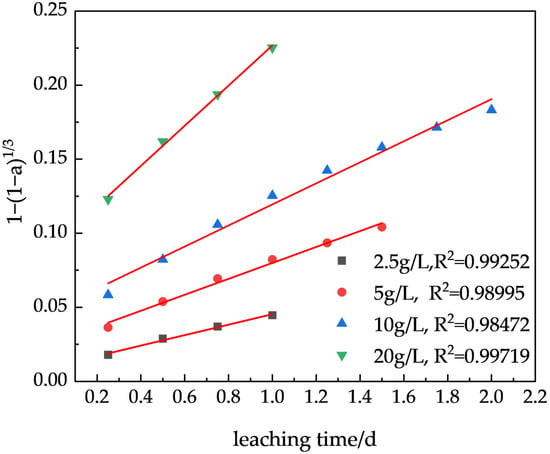
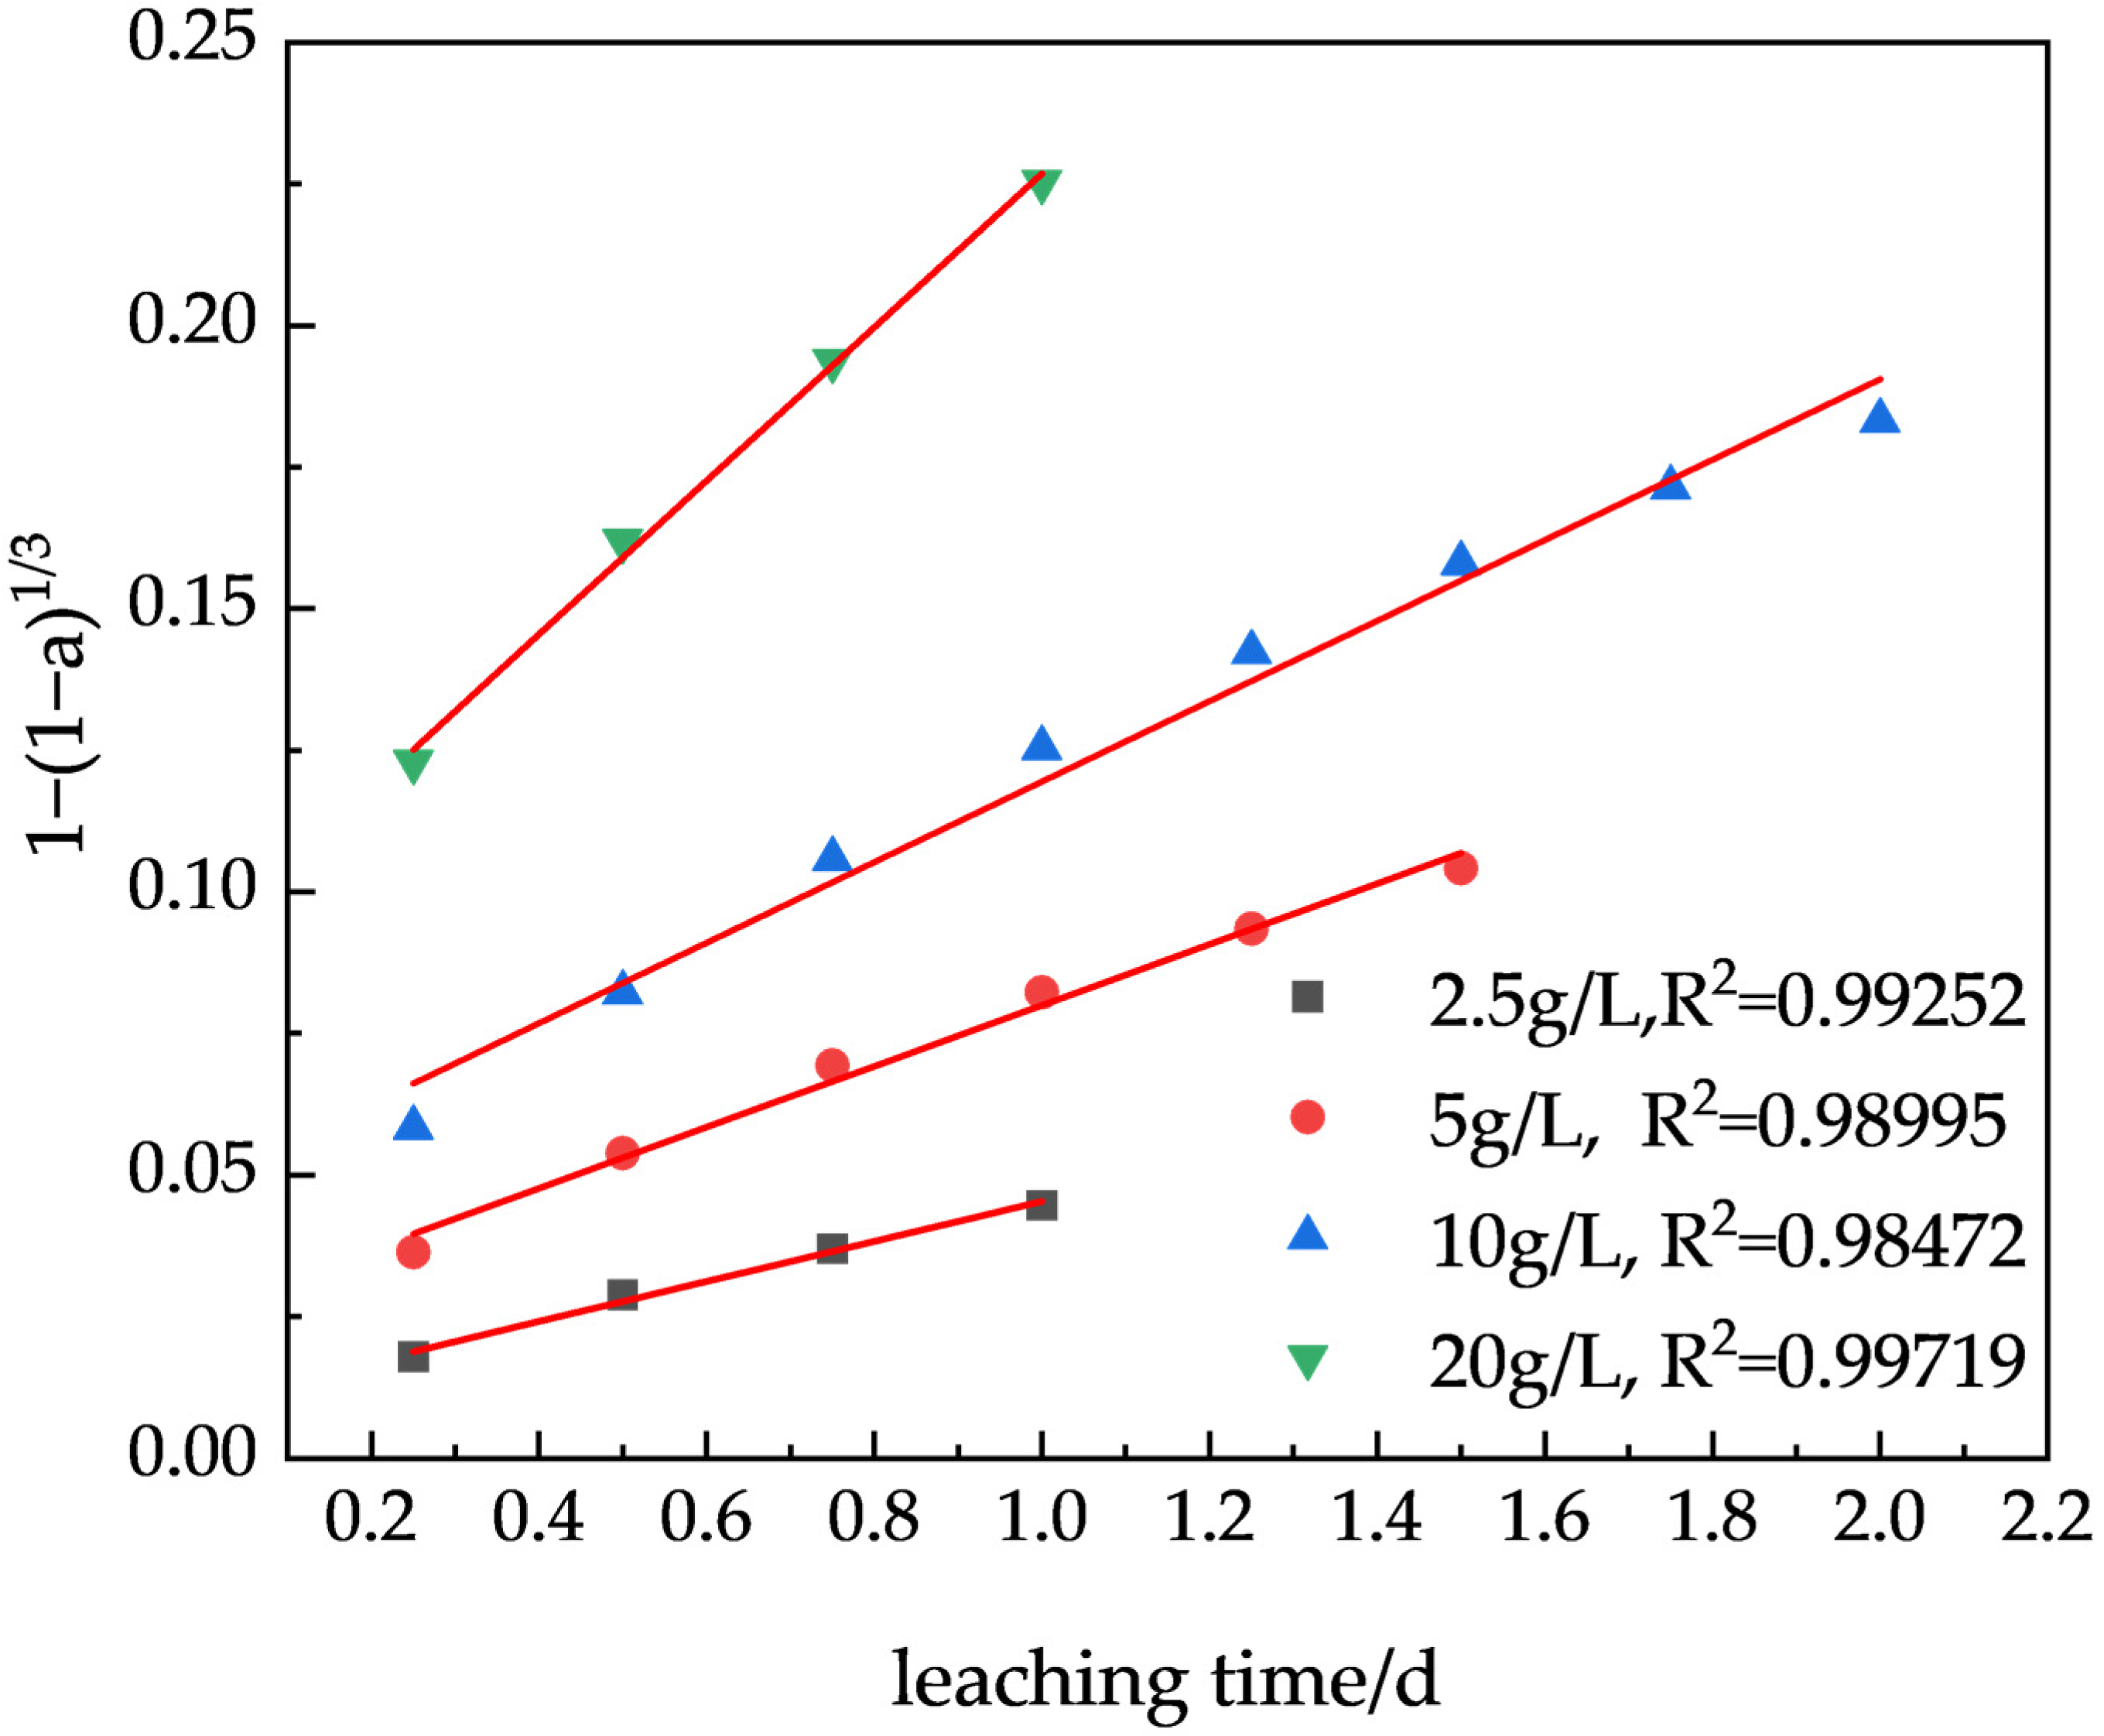
The reaction control model was also fitted for different time intervals under each acid concentration, as shown in Figure 5. It can be observed that under different sulfuric acid concentrations, the duration of the chemical reaction control stage exhibits systematic differences. For each concentration, the process conforms to the chemical reaction control model from the initial leaching time up to 1.0 d, 1.5 d, 2.0 d, and 1.0 d, respectively, after which it transitions to mixed control. These results indicate that the relationship between the duration of the chemical reaction control stage and acid concentration is not monotonically increasing, but rather exhibits an asymmetric trend of first increasing and then decreasing.
Figure 5.
Differences in the chemical reaction control stage under different acid concentrations (at 40 °C).
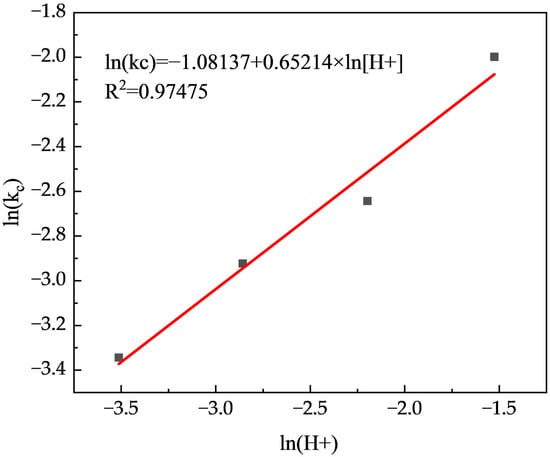
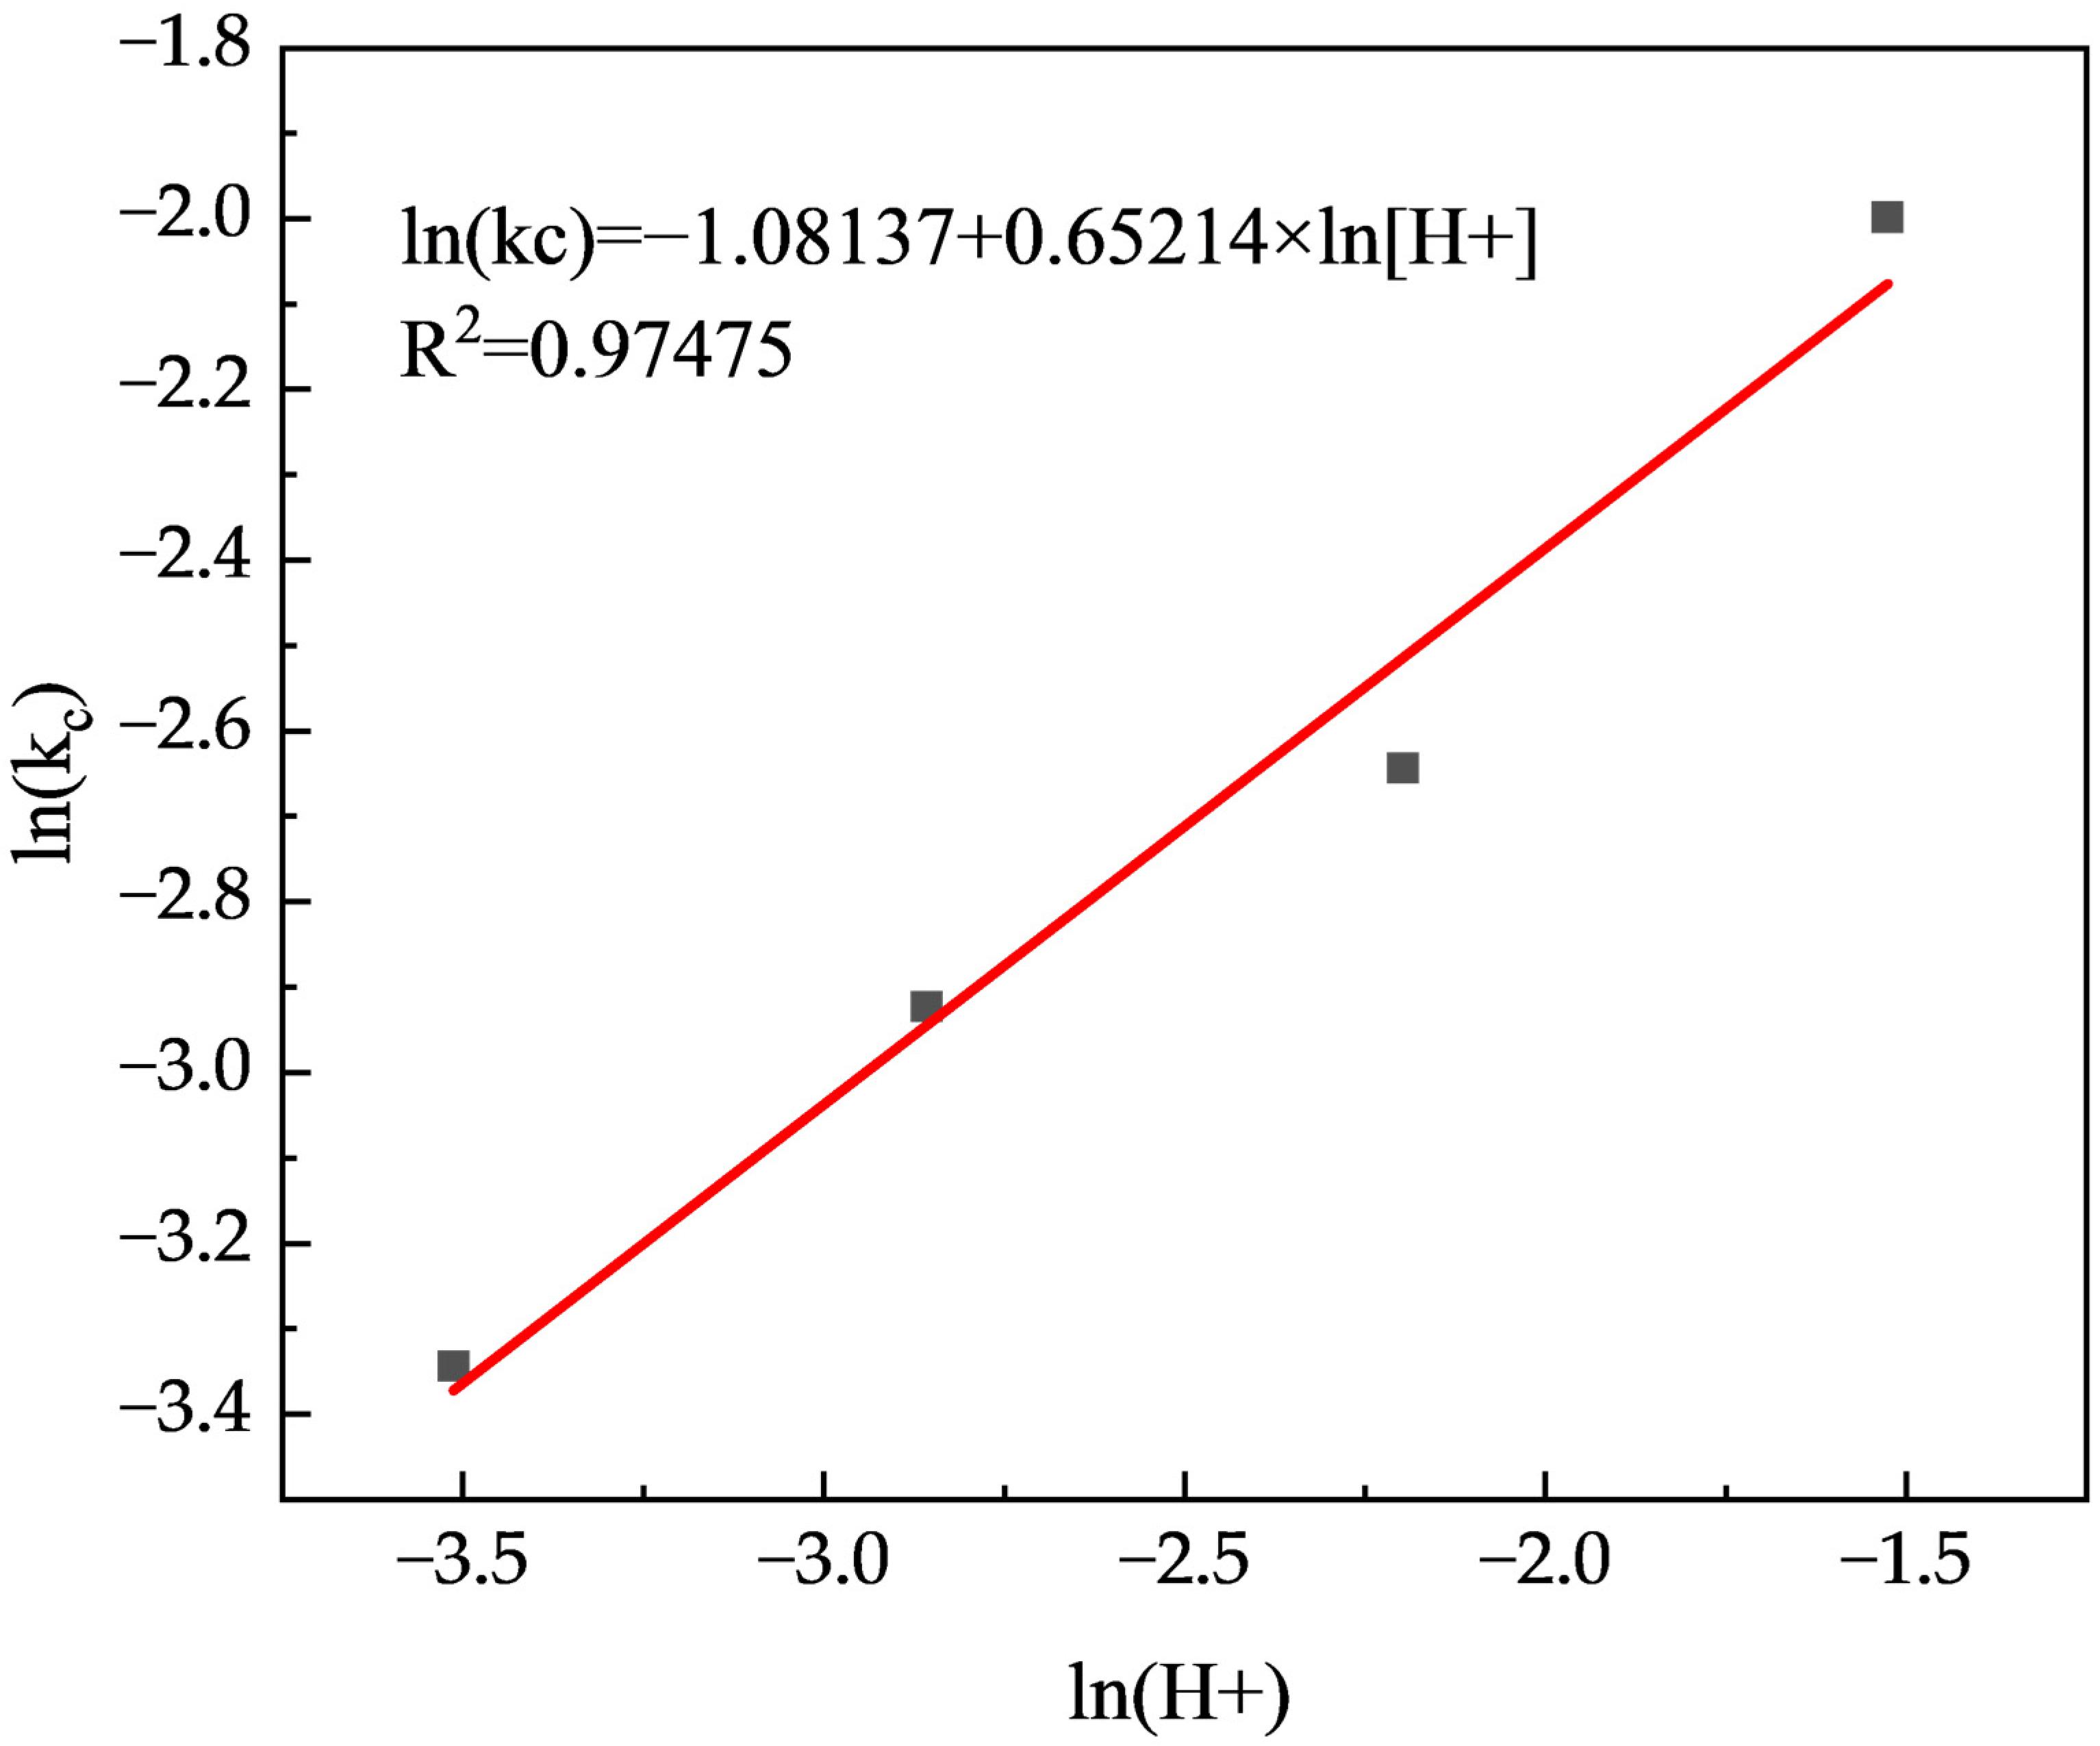
The reaction order n was calculated based on the reaction rate constants during the chemical reaction control stage. The apparent rate constants at different acid concentrations were 3.53 × 10⁻² day−1, 5.38 × 10⁻² day−1, 7.11 × 10⁻² day−1, and 13.56 × 10⁻² day−1, respectively. The apparent rate constant kc exhibits a power-law relationship with acid concentration, as shown in Equation (4):
Fitting of the leaching data at different acid concentrations was performed, and the resulting fitting plot is shown in Figure 6. It can be seen from the figure that the correlation coefficient R2 between ln kc and ln[H+] reaches as high as 0.97, indicating an excellent fit. The reaction order n is determined to be 0.65, which further demonstrates that doubling the acid concentration does not lead to a doubling of leaching efficiency, and that there exists an optimal acid concentration that achieves the best match between leaching efficiency and economic benefits.
Figure 6.
Fitting of apparent rate constant kc with acid concentration H+ under different acid concentration conditions.
3.2. Precipitation Analysis Based on Saturation Index (SI)
Saturation index (SI) analysis serves as a critical bridge connecting solution chemistry and solid mineral evolution behavior. Its core function is to quantitatively determine the precipitation tendency of various secondary minerals in the leaching system from a thermodynamic perspective. SI is a thermodynamic indicator for judging the precipitation or dissolution tendency of minerals in solution, defined as:
where IAP is the ion activity product, i.e., the product of the activities of relevant ions in solution; Ksp is the solubility product constant, i.e., the thermodynamic equilibrium constant of the mineral at a specific temperature.
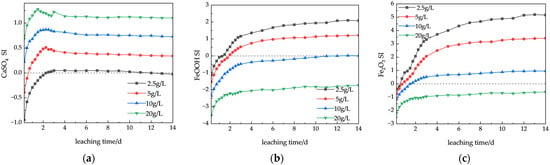
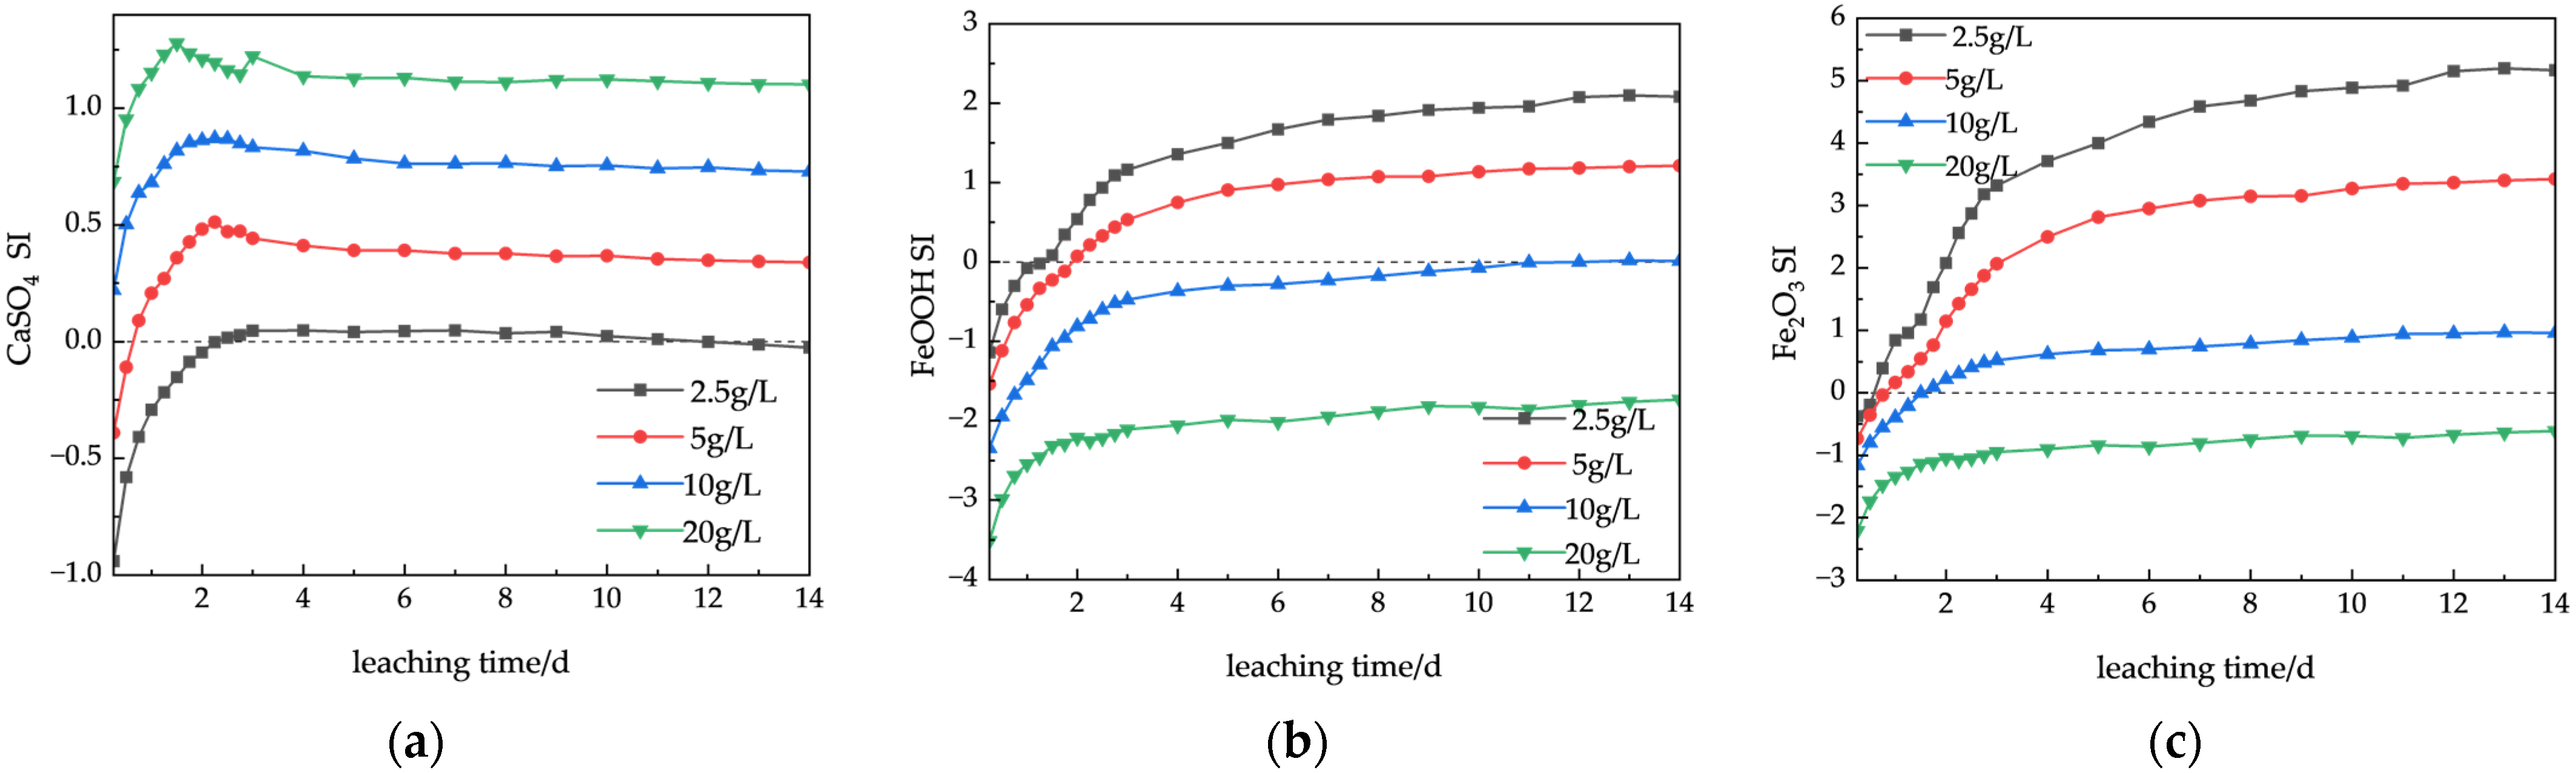
When SI = 0, the mineral is in an equilibrium state; when SI > 0, the mineral is in a precipitation state; when SI < 0, the mineral is in a dissolution state [29]. Based on the chemical composition of the low-grade copper ore, the secondary precipitates that are likely to form are gypsum (CaSO4·2H2O), goethite (FeOOH), and hematite (Fe2O3). The simulated SI evolution over time under different acid concentrations is shown in Figure 7.
Figure 7.
Evolution of saturation indices (SI) of major precipitates with leaching time under different acid concentrations: (a) CaSO4; (b) FeOOH; (c) Fe2O3.
As shown in Figure 7a, the saturation index of gypsum increases significantly with rising acid concentration, and the high-acid groups exhibit a trend of first increasing and then decreasing. In the low-acid 2.5 g/L group, the SI remains predominantly negative, indicating that gypsum is in an undersaturated state. In the high-acid 10 g/L and 20 g/L groups, the SI rapidly rises to peak values (at 1.25~1.75 d) and then gradually declines, indicating that gypsum first reaches supersaturation and subsequently precipitates. The peak time of SI advances with increasing acid concentration (pH range is 0.56~1.41), reflecting that higher acidity accelerates Ca2+ release and the formation of gypsum supersaturation.
As shown in Figure 7b,c, the saturation indices of goethite and hematite exhibit opposite trends with increasing acid concentration: in the low-acid groups, the SIs turn from negative to positive and continue to rise, whereas in the high-acid groups, the SIs remain negative throughout and show lower values. This pattern is closely related to pH evolution. In the low-acid groups, the pH rises above 2.0, entering the Fe3+ hydrolysis window, while in the high-acid groups, the pH remains below 1.5, inhibiting iron precipitation. Additionally, the SI of hematite is higher than that of goethite under all acidity conditions, indicating that hematite is thermodynamically more prone to supersaturation. However, its actual precipitation is kinetically constrained and requires overcoming a higher nucleation energy barrier.
3.3. Effect of Dissolution–Precipitation on Pore Evolution
Section 3.1 and Section 3.2 have respectively revealed the effects of acid concentration on the leaching reaction rate and the dissolution–precipitation equilibrium from kinetic and thermodynamic perspectives. Kinetically, Section 3.1 has demonstrated that the k value exhibits a marginally diminishing trend with increasing acid concentration (1.16, 4.27, 8.42, 9.97 × 10⁻³ day−1), indicating that further increasing acid concentration in the high-acid range yields sharply diminishing returns in enhancing the reaction rate. Thermodynamically, the evolution of the saturation index (SI) under different acid concentrations shows significant differences, among which the mean SI of gypsum increases monotonically with rising acid concentration (−0.94, −0.39, 0.22, 0.69), indicating that under high-acid conditions, gypsum exhibits the strongest and earliest precipitation tendency. Based on the known correlations between the two chemical indicators (reaction rate constant k and saturation index SI) and pore structure, the trends of pore structure evolution under different acid concentrations are inferred.
At a low acid concentration of 2.5 g/L, the reaction rate constant k is the lowest, and the severely insufficient driving force H+ implies limited mineral dissolution, suppressing both the generation of new pores and the expansion of existing ones. At a medium-low acid concentration of 5 g/L, the k value increases by 268% compared to 2.5 g/L, indicating a significantly enhanced reaction driving force. However, the gypsum SI turns positive after 0.5 d and continues to rise. The reaction control window is 1.5 d, and pore development is expected to be better than under the 2.5 g/L condition. At a medium acid concentration of 10 g/L, the k value reaches 8.42 × 10⁻³ day−1, indicating a strong reaction driving force. The gypsum SI is positive from the very beginning and continues to increase, but the SIs of goethite and hematite only turn from negative to positive at 6–8 d. Meanwhile, the chemical reaction control window under this condition is 2 d (the widest among all concentrations). Based on the combined evaluation of k value (driving force), goethite/hematite SI (precipitation timing), and chemical reaction control window, 10 g/L is identified as the optimal acid concentration for pore development. At a high acid concentration of 20 g/L, although the k value is the highest (9.97 × 10⁻³ day−1), the increase is only 18.41% compared to 10 g/L, indicating that the marginal gain is approaching saturation. The gypsum SI reaches 0.69 (strongly supersaturated) from the very beginning, which will occupy substantial pore space and block throats, leading to a significant reduction in total pore number and a macro-porosity lower than that under the 10 g/L condition.
4. Effect of Fine Particle Migration on Pore Plugging
Through column leaching experiments and time-series CT scanning, it was found that ore samples with high fine particle content exhibited significantly greater declines in connectivity and porosity during the leaching process compared to well-graded ore samples. Section 3 revealed the driving mechanisms of dissolution and precipitation on pore walls from a chemical perspective. However, the rapid plugging of pore throats cannot be fully explained by chemical precipitation alone, as the amount of chemical precipitates (e.g., iron hydrolysis products) is limited. The extent of throat reduction and connectivity decline suggests the existence of another important physical process, namely, the migration and deposition of fine particles within the pore space.
4.1. Particle Penetration Characteristics
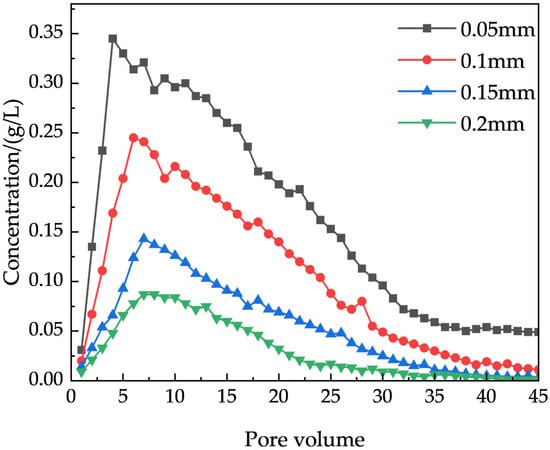
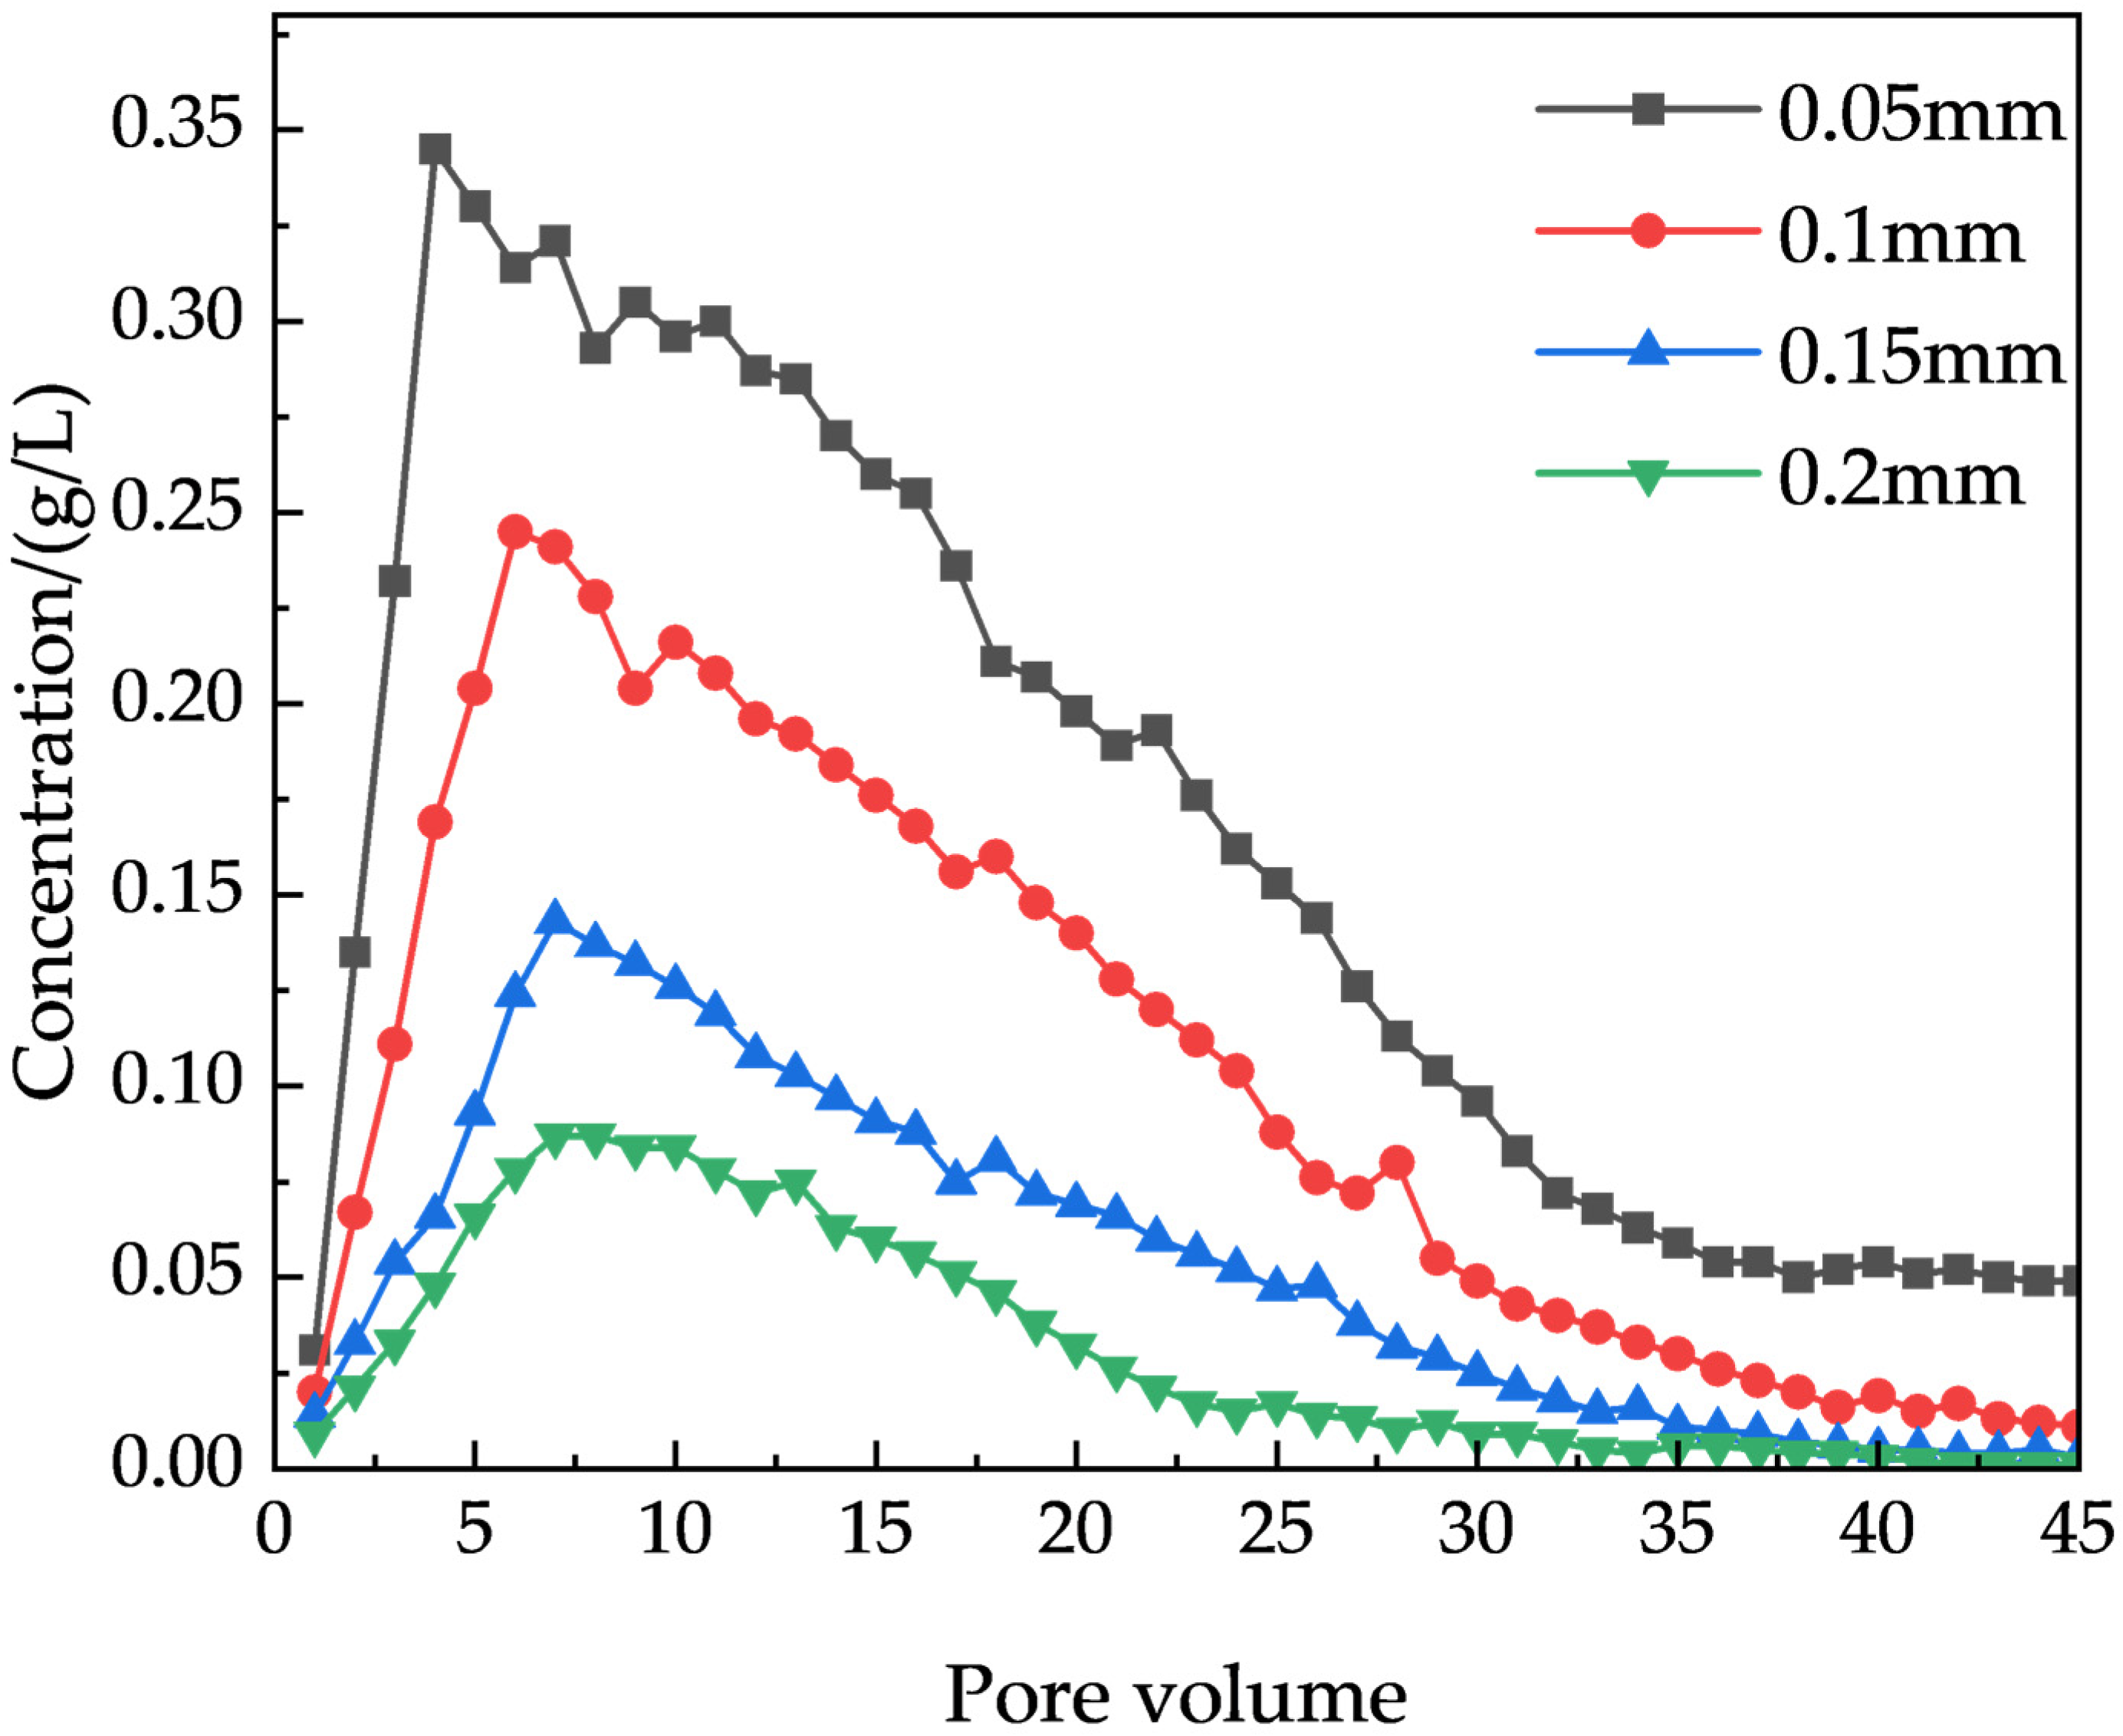
The penetration curves of fine particles under different particle size conditions at a flow velocity of 0.16 cm/s are shown in Figure 8.
Figure 8.
Breakthrough curves of fine particles under different particle size conditions.
As shown in Figure 8, particle size is the primary factor controlling particle migration and retention behavior in porous media. The calculated breakthrough rates for different particle sizes ranging from 0.05 to 0.2 mm were 55.01%, 34.61%, 20.07%, and 10.23%, respectively, showing a negative correlation with particle size. With increasing pore volumes, the effluent concentration of particles of each size exhibited a typical breakthrough trend of first rising and then declining. However, the smaller the particle size, the higher the peak breakthrough concentration and the earlier the peak appearance; the larger the particle size, the lower the peak concentration and the later the peak appearance. This indicates that smaller particles are primarily transported by advection with the flow, are less affected by pore filtration and gravitational settling, and possess stronger migration ability and lower deposition rates. In contrast, larger particles are more readily captured by pore throats or medium surfaces, resulting in a significantly higher retention ratio.
4.2. Effect of Physical Plugging on Permeability
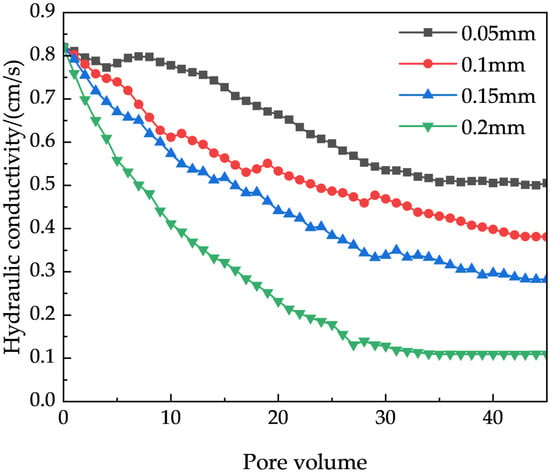
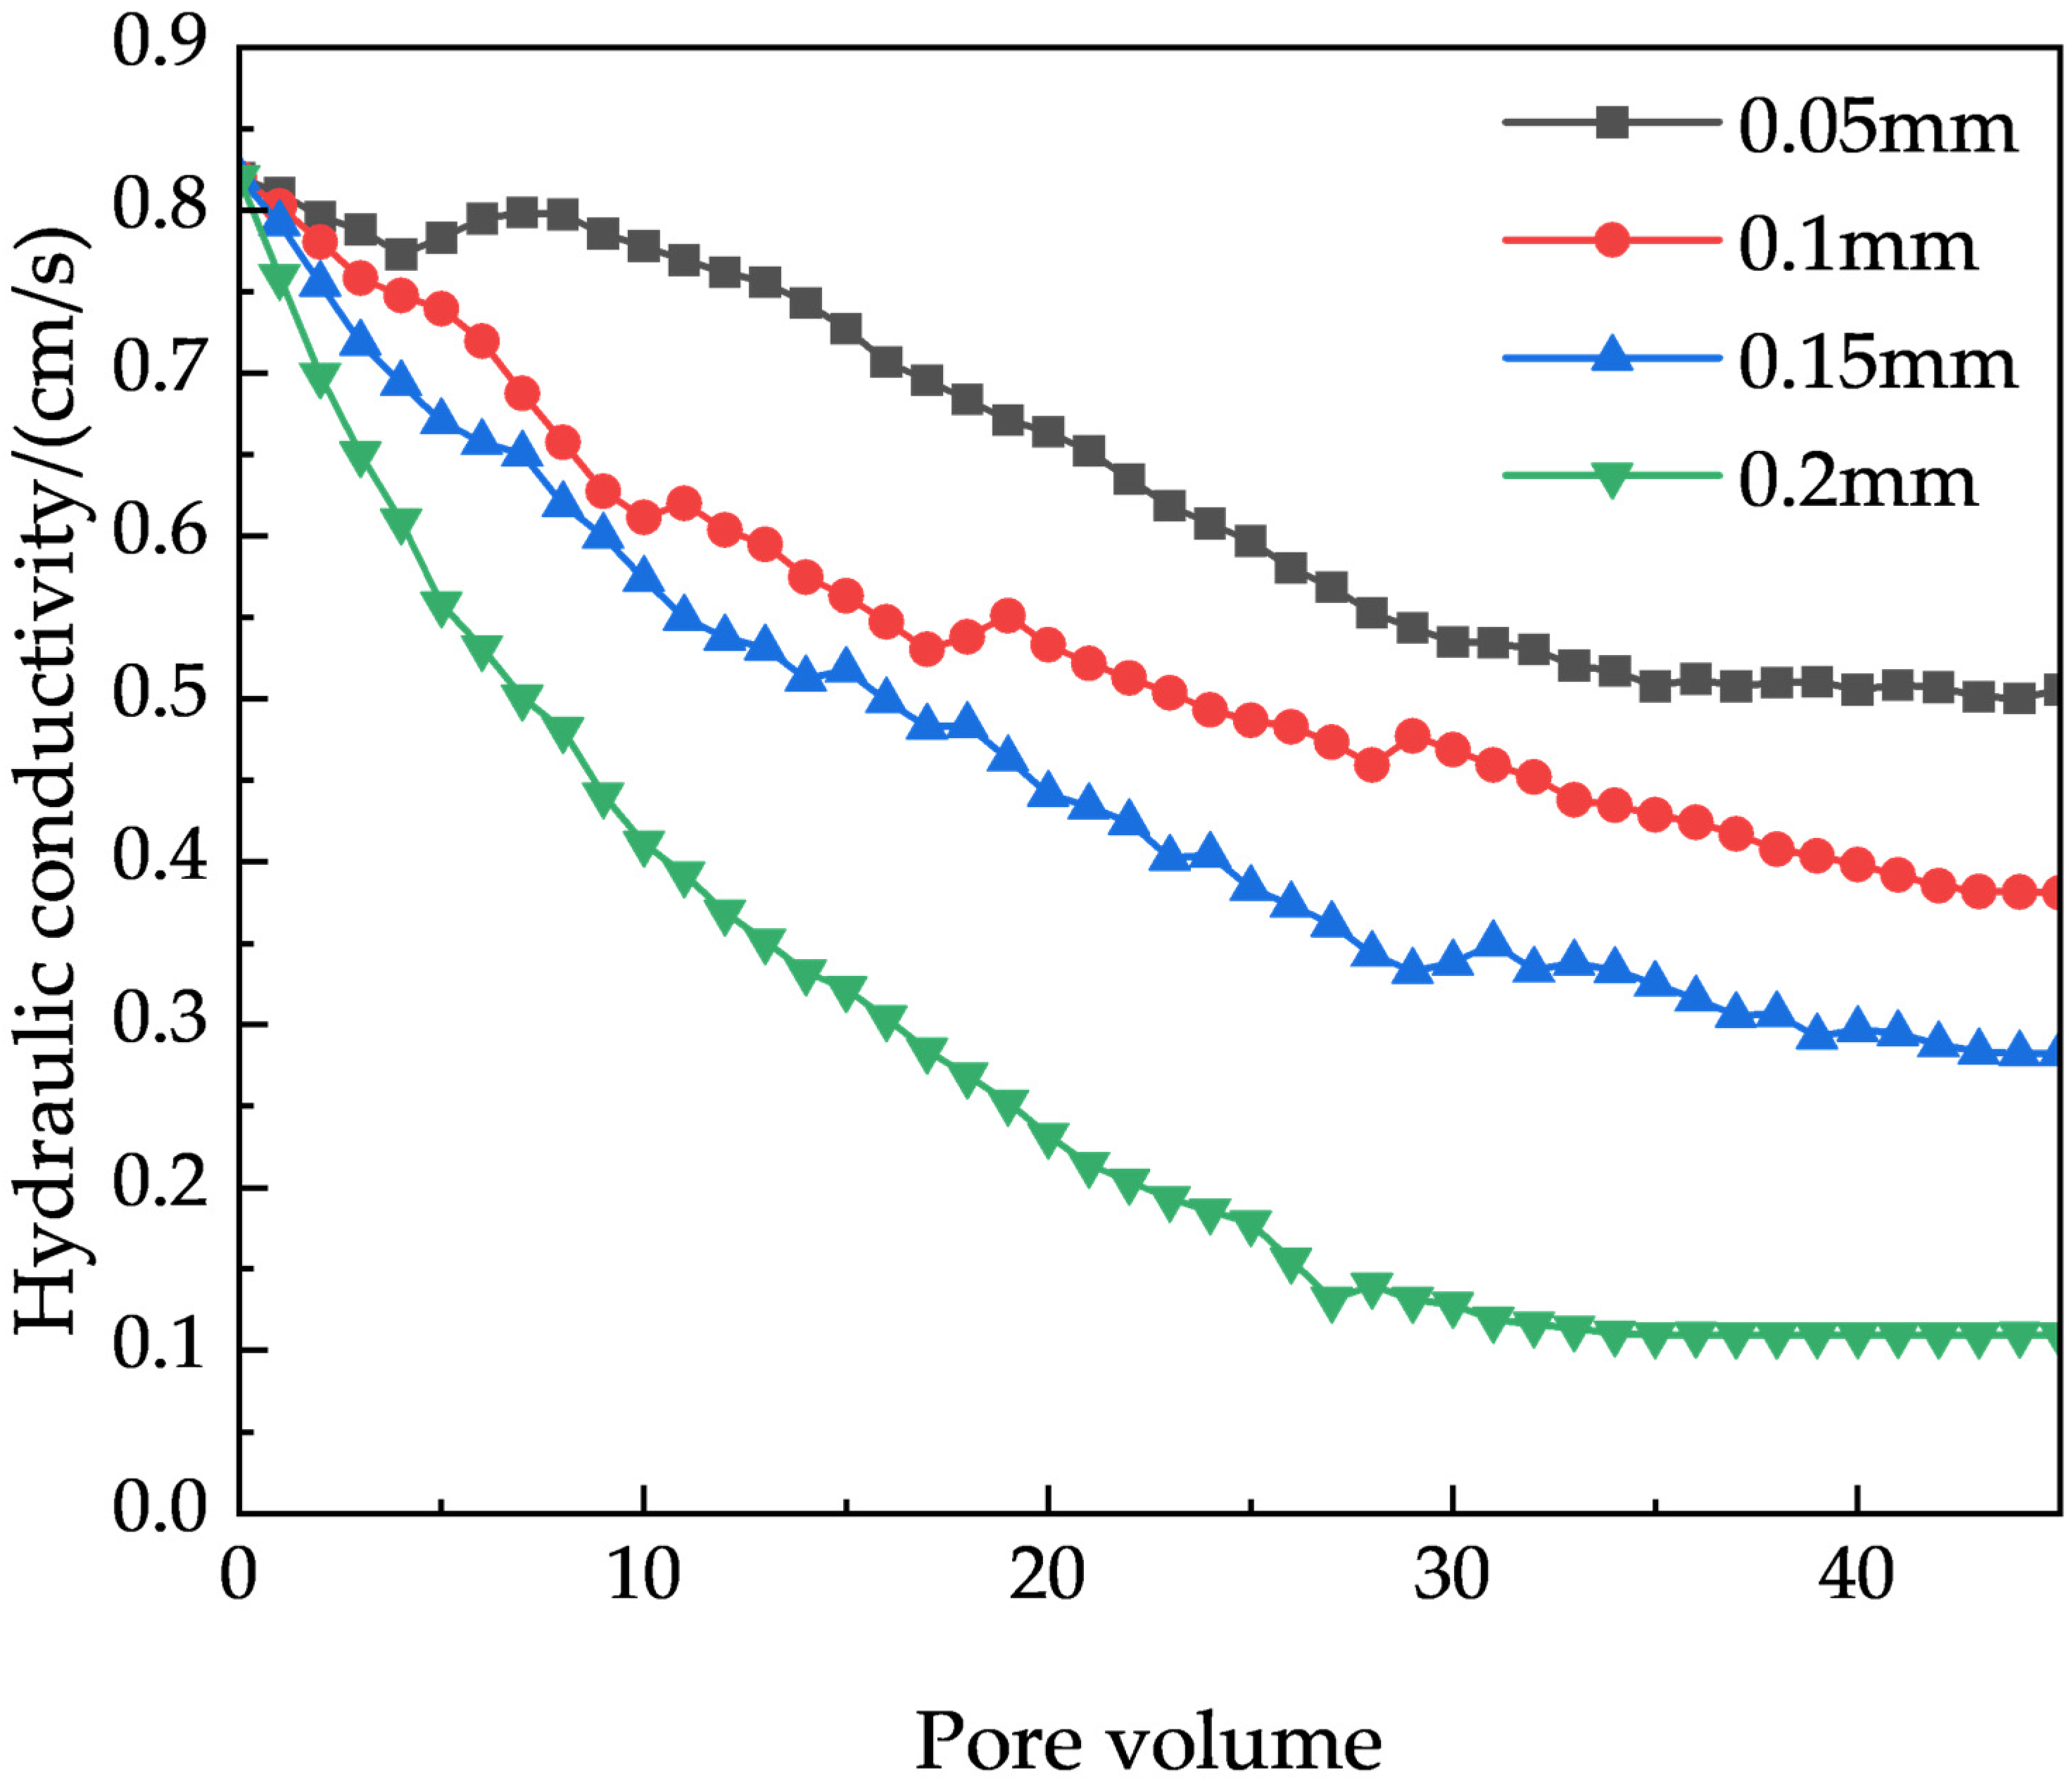
During the experiment, the migration and deposition of suspended particles in the sandy soil modified the internal pore structure, resulting in changes in hydraulic conductivity with particle injection. The overall hydraulic conductivity variation in the leaching columns under different particle size conditions is presented in Figure 9.
Figure 9.
Variation in the overall hydraulic conductivity of leaching columns under different particle size conditions.
As shown in Figure 9, with increasing pore volumes of injected fine particles, the hydraulic conductivity of each particle size group exhibited a declining trend to varying degrees. The larger the particle size, the greater the reduction in hydraulic conductivity, the faster the decay rate, and the lower the final stable value. For the 0.05 mm particle size group, the hydraulic conductivity decreased slowly from an initial value of 0.82 cm/s to approximately 0.51 cm/s, representing a reduction of 37.80%. The decline process was relatively gradual and tended to stabilize in the middle and later stages. Notably, the curve showed a brief increase within the pore volume range of 5~8, indicating a dynamic process of deposition–re-release of fine particles within the coarse particle skeleton. For the 0.1 mm and 0.15 mm groups, the reductions were 53.54% and 65.85%, respectively. The 0.20 mm particle size group exhibited the most severe decline, with hydraulic conductivity dropping sharply from 0.82 cm/s to approximately 0.11 cm/s—a reduction of up to 86.58%—and essentially stabilizing after about 30 pore volumes. These results indicate that larger fine particles are more prone to deposition and plugging within porous media, leading to a significant reduction in hydraulic conductivity. In contrast, smaller particles, owing to their stronger migration ability and lower deposition ratio, exert a relatively limited detrimental effect on the permeability performance of the medium. This finding further confirms that fine particle size is a key factor controlling the evolution of permeability in porous media.
5. Mechanism and Simulation-Based Regulation of Pore Structure Evolution Under Chemical–Physical Coupling
Section 3 and Section 4 have respectively revealed the independent mechanisms of pore structure evolution during the leaching process from two dimensions: chemical dissolution–precipitation and fine particle migration. However, in the actual leaching process, these two types of effects do not exist in isolation. Chemical dissolution both generates new pores and releases fine particles; chemical precipitation both blocks pores and alters pore wall properties. Conversely, particle deposition modifies the local flow field and reactant supply conditions, thereby influencing the balance between dissolution and precipitation. These two processes are intertwined and mutually feed back on each other across spatial and temporal scales, jointly determining the ultimate direction of pore structure evolution. Based on the experimental findings from the previous two sections, this section adopts a chemical–physical coupling perspective to elucidate the independent regulatory characteristics of the two types of effects on pore structure (the four basic mechanisms: dissolution-induced pore enlargement, precipitation-induced pore shrinkage, plugging-induced pore shrinkage, and collapse-induced pore shrinkage), with a particular focus on analyzing the chemical–physical interaction feedback mechanisms. Furthermore, it analyzes the transition of dominant mechanisms at different leaching stages, forming a holistic mechanistic explanation of pore structure evolution. On this basis, a COMSOL multi-physics coupling model is established to quantitatively analyze the temporal evolution of the contribution rates of the four mechanisms to pore evolution, and to propose practical stope regulation and optimization strategies.
5.1. Four Pore Evolution Mechanisms
Based on chemical and physical experimental analyses, the evolution of pore structure during the leaching process is governed by four fundamental mechanisms acting in concert.
- (1)
- Dissolution-induced pore enlargement
After the acidic solution invades the granular ore medium, it chemically dissolves the ore minerals, with mineral components entering the solution as ions. The dissolution of pore-throat wall minerals enlarges the pore-throat dimensions, and the solid skeleton correspondingly dissolves and detaches, resulting in a stepwise improvement in pore connectivity. This is the only pore-enlarging mechanism.
- (2)
- Precipitation-induced pore shrinkage
When the ion concentration in the solution continuously increases and generally exceeds the critical supersaturation level, secondary minerals begin to nucleate and grow. Chemical precipitates either adhere to particle surfaces or migrate with the solution and accumulate at pore throats, causing pore shrinkage. Another negative effect of chemical precipitation is the passivation of mineral surfaces, which hinders the contact between the acid solution and fresh mineral surfaces. This stage is predominantly controlled by diffusion.
- (3)
- Plugging-induced pore shrinkage
Fine particles migrate and deposit within the porous medium, leading to pore shrinkage and, in particular, throat plugging, which severely affects permeability distribution. When the particle size is much smaller than the pore-throat diameter, it reduces the pore cross-section; when the particle size is smaller than the pore-throat diameter, it forms bridging; and when the particle size is larger than the pore-throat diameter, it causes direct plugging.
- (4)
- Collapse-induced pore shrinkage
Chemical dissolution occurs not only on pore walls but also preferentially at contact points and edges between particles. Dissolution at contact points reduces the contact area between particles and increases the contact stress. When the load-bearing capacity of the contact points is insufficient to support the weight of the overlying particles, the particles slide and rotate, moving into the pore space below and filling the original pores. This is a pore-reducing mechanism. This mechanism is initiated by chemical dissolution but is governed by mechanical laws, representing a product of chemical–mechanical coupling.
5.2. Chemical–Physical Coupled Evolution Mechanism
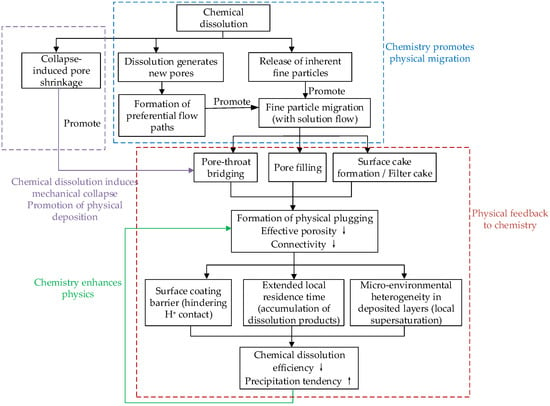
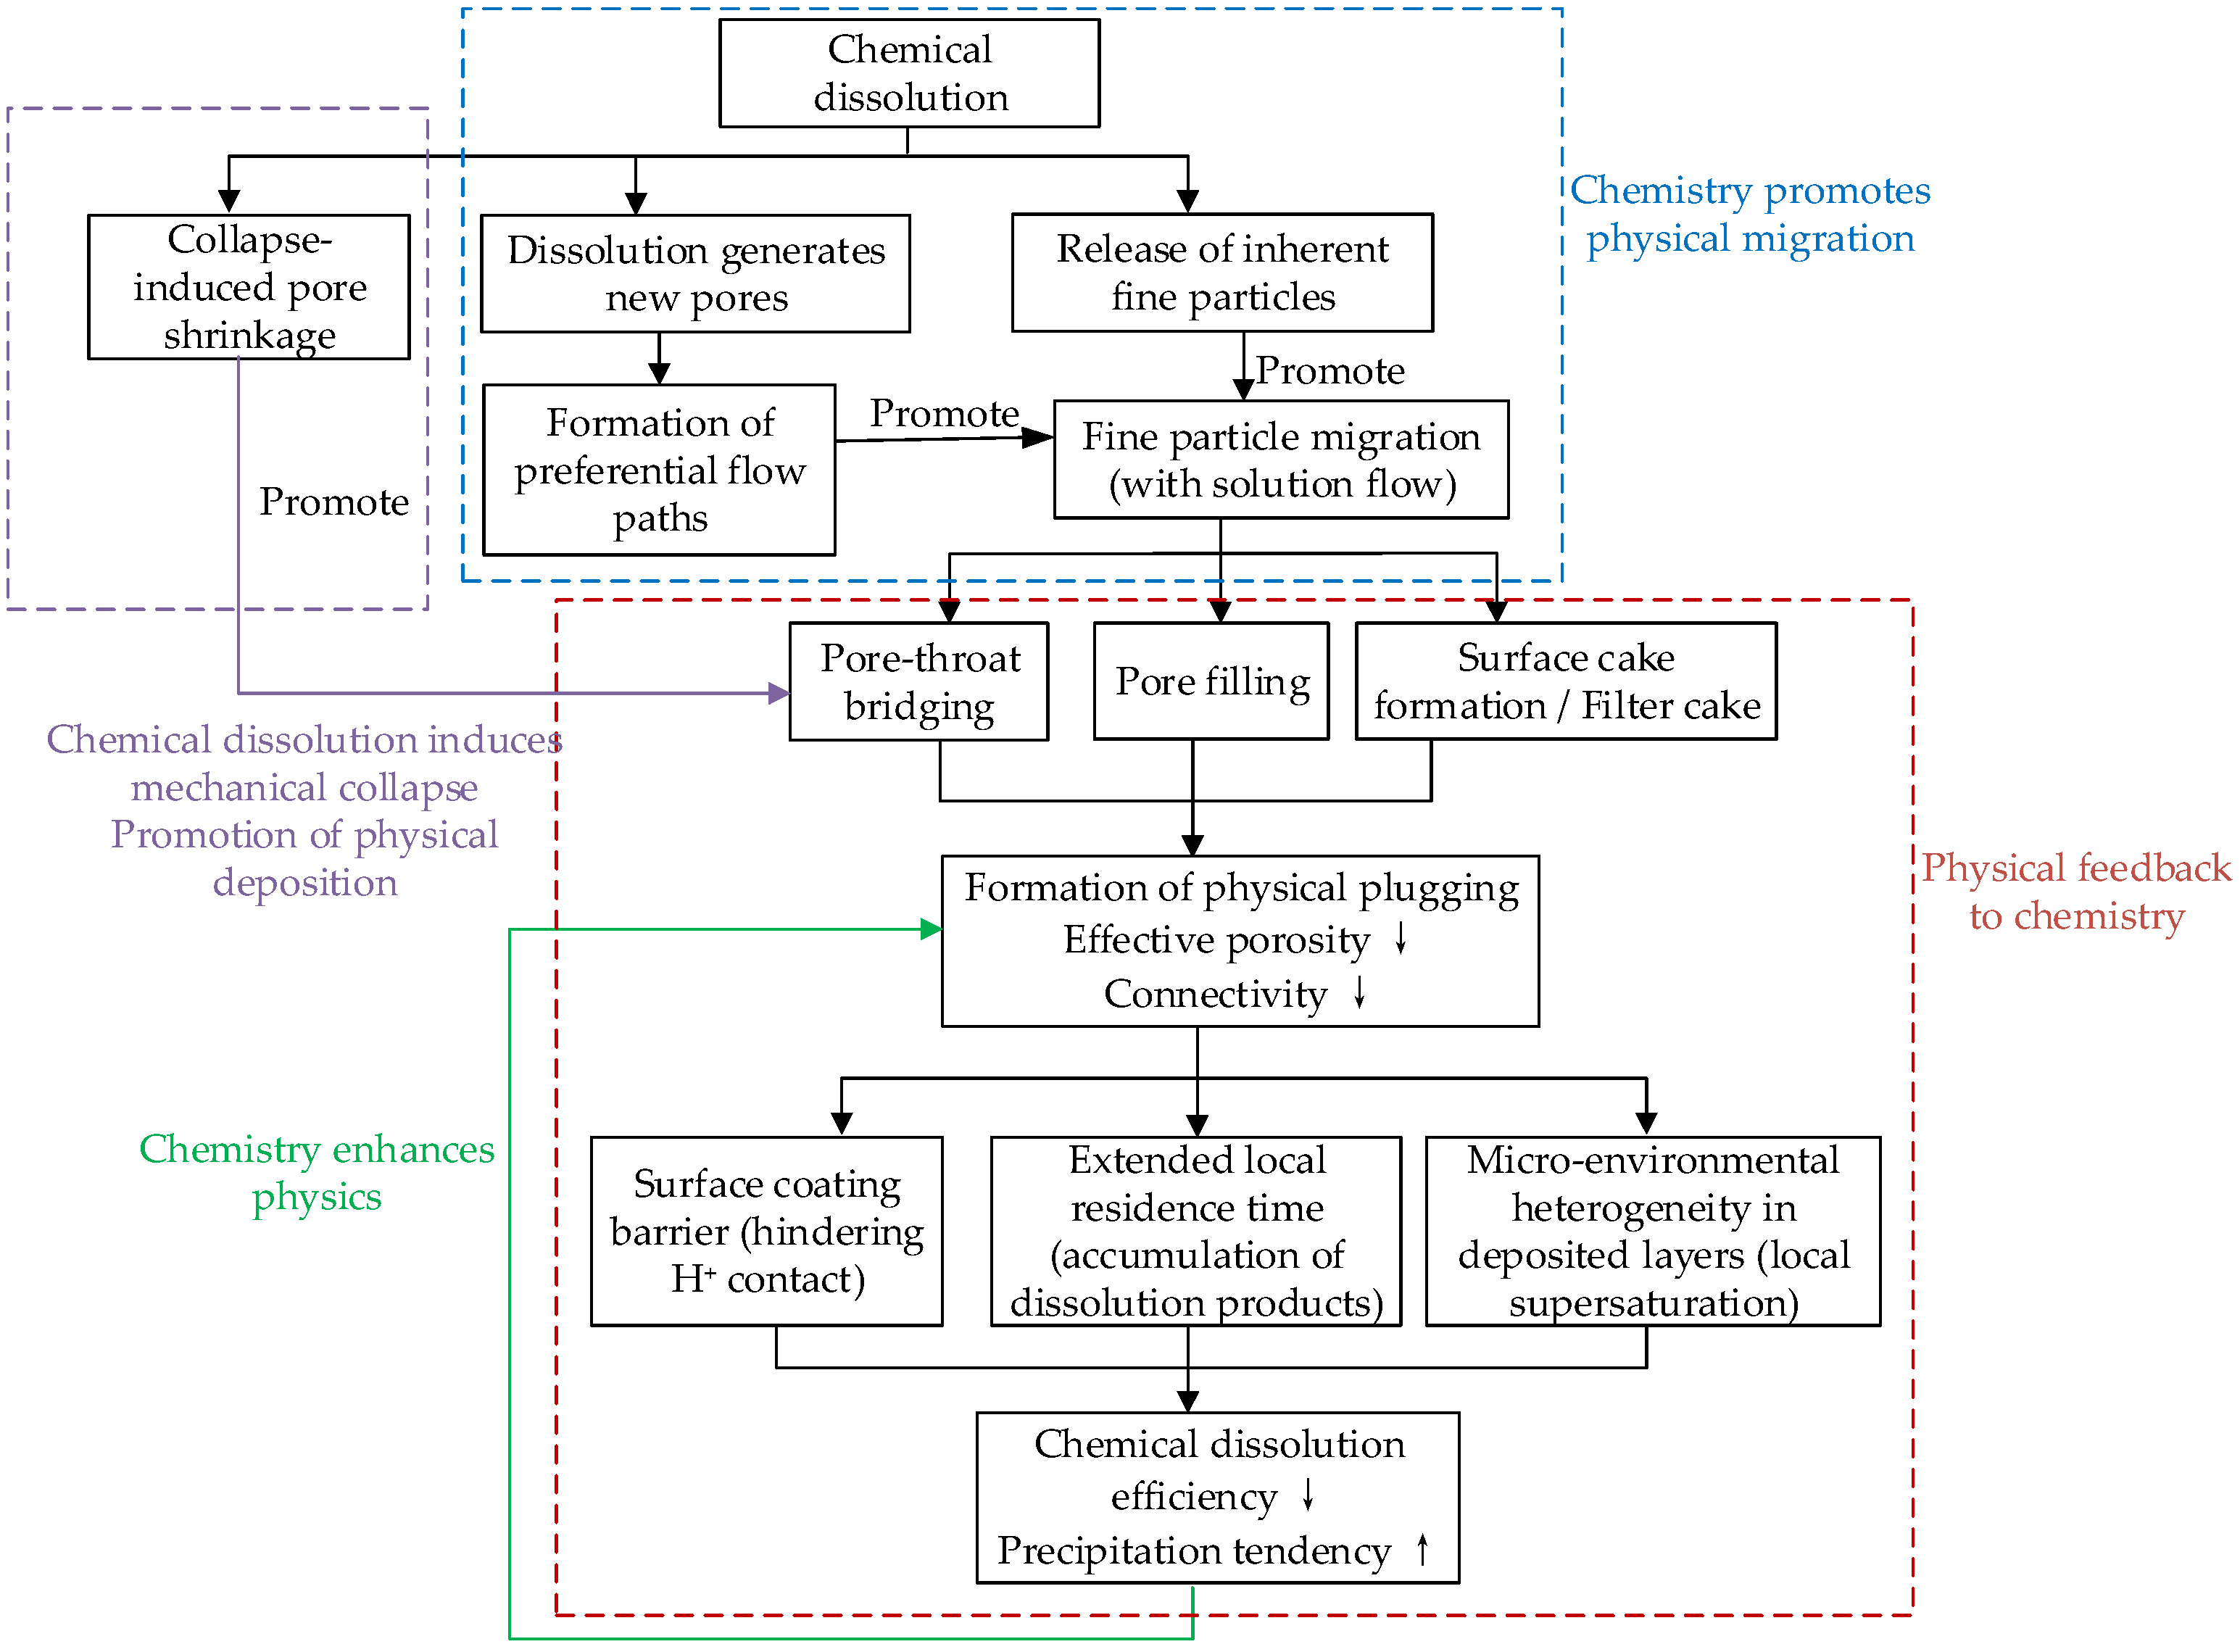
In the actual leaching environment, chemical and physical processes do not exist independently but rather interact through bidirectional feedback. The chemical–physical interaction feedback mechanism can be summarized as a closed-loop conceptual model, as shown in Figure 10. The model comprises four core feedback pathways, constituting a self-driven coupled evolution system.
Figure 10.
Closed-loop chemical–physical interaction feedback system.
Path 1—Chemical action pathway: Chemical dissolution generates new pores, and solution supersaturation leads to the formation of chemical precipitates that fill pores, while simultaneously promoting the release of fine particles. This reflects chemical action driving physical migration.
Path 2—Physical action pathway: Fine particles migrate and deposit at pore throats, resulting in reduced porosity and connectivity. This pathway forms a shielding layer through deposition that subsequently inhibits chemical processes, reflecting physical feedback to chemical reactions.
Path 3—Chemical–mechanical pathway: Chemical dissolution induces mechanical collapse of the particle skeleton, significantly reducing pore space, accelerating particle plugging, and retarding chemical reactions.
Path 4—Chemical–physical interaction feedback pathway: Precipitates produce cementation that further exacerbates plugging, reflecting the reinforcement of physical deposition by chemical products.
5.3. Pore Evolution Prediction Model
The evolution of pore structure in granular ore media during the leaching process is not governed by the continuous action of a single mechanism, but rather by the competitive superposition of four mechanisms under the coupling of seepage, reaction, and mechanical fields. This multi-field interaction cannot be directly decoupled through standalone experiments or analytical formulas alone. Therefore, this section establishes a coupled mathematical model that integrates the governing equations of seepage, reaction kinetics, and particle migration into a unified framework. Based on COMSOL Multiphysics, a pore evolution prediction model for the stope leaching system is developed, enabling quantitative tracking and prediction of the spatiotemporal evolution of pore structure over the entire leaching cycle. However, COMSOL modeling of the leaching process also has certain limitations, such as simplified multiphysics coupling and high computational costs for complex geometries and multiscale problems. The multiphysics mathematical equations are shown in Equations (6)–(11).
- (1)
- Basic governing equation of the seepage field
- (2)
- Dynamic coupling relationship between permeability and porosity
- (3)
- Dissolution/precipitation control
- (4)
- Fine particle migration and deposition
- (5)
- Collapse control
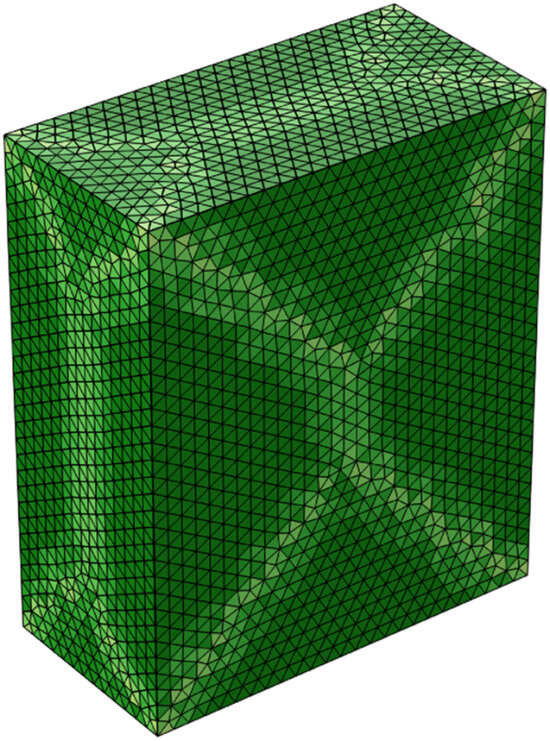
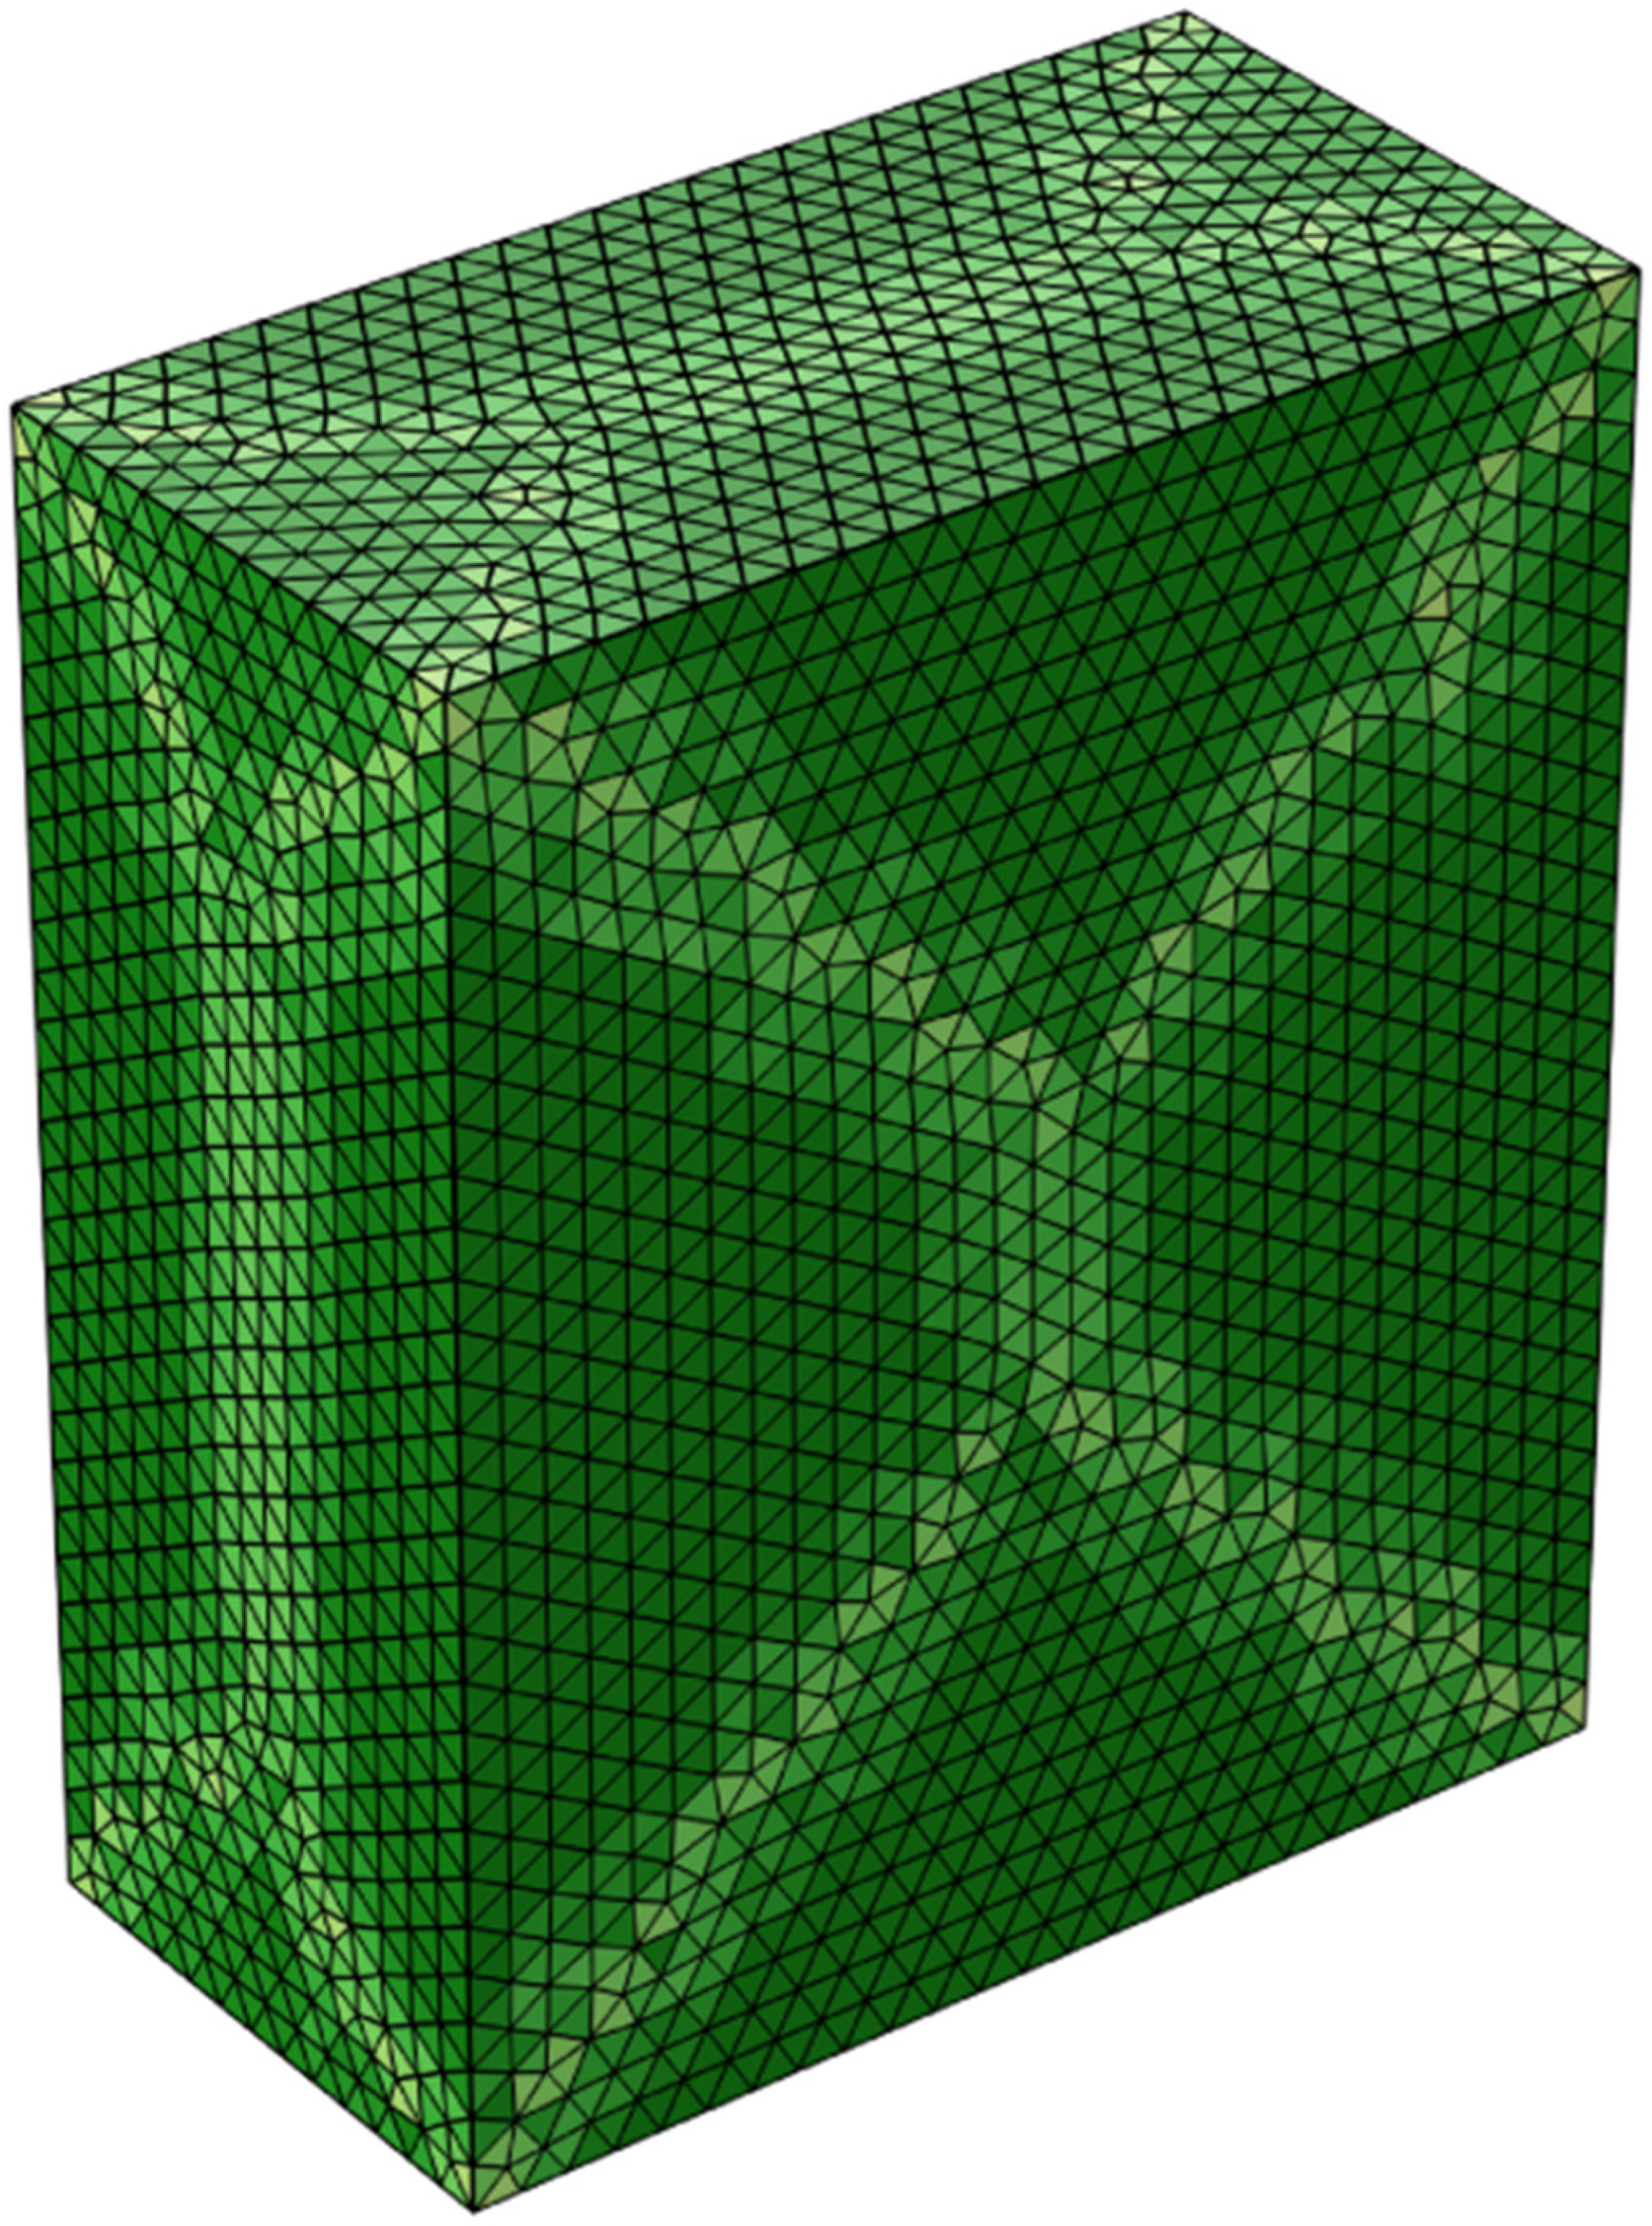
The geometric model was constructed according to the physical dimensions of the leaching experimental model, i.e., length × width × height = 100 mm × 50 mm × 120 mm, and the particle size distribution. Tangential spherical ore particles were randomly generated based on the particle size distribution ratio, forming flow channels between ore particles and matrix regions within the ore. The physical model was subjected to CT scanning and Avizo reconstruction at 0 d, 15 d, 30 d, and 45 d during the leaching process, and the pore structure parameters, permeability, etc., were quantitatively calculated. The leaching rate was calculated from the copper ion concentration; the data can be found in reference [30]. The mesh generation adopts a “free tetrahedral mesh”, and the transient solution employs the fully coupled method, with “automatic time stepping” and “automatic damping” enabled to improve the convergence of nonlinear problems; the relative tolerance is set to 10−5. The mesh model is shown in Figure 11, consisting of 157,636 free tetrahedral elements, with a maximum element size of 4 mm and a minimum element size of 0.6 mm.
Figure 11.
COMSOL three-dimensional finite element refined mesh of the stope leaching model.
The four physical fields involved in this study can all be modeled in COMSOL through the corresponding physics interfaces, as shown in Table 3. A total of 26 storage time points were set for the leaching process, of which six were set between 0 and 5 days, and 20 between 5 and 45 days.
Table 3.
COMSOL interfaces corresponding to the physical fields.
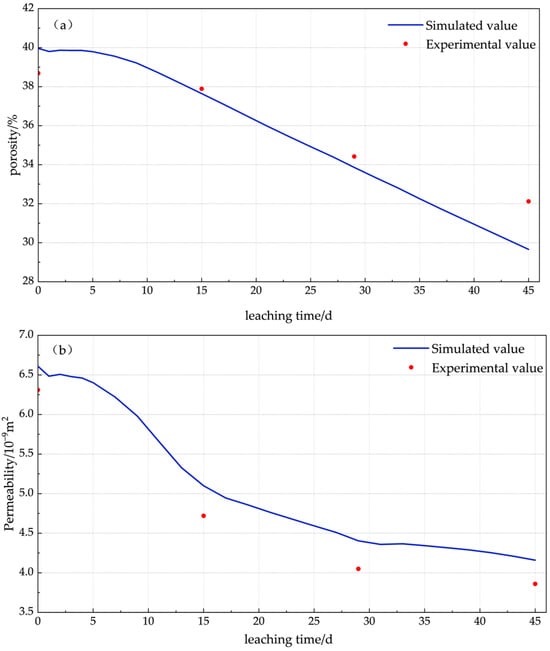
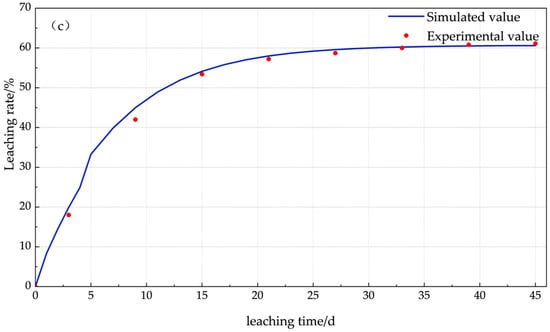
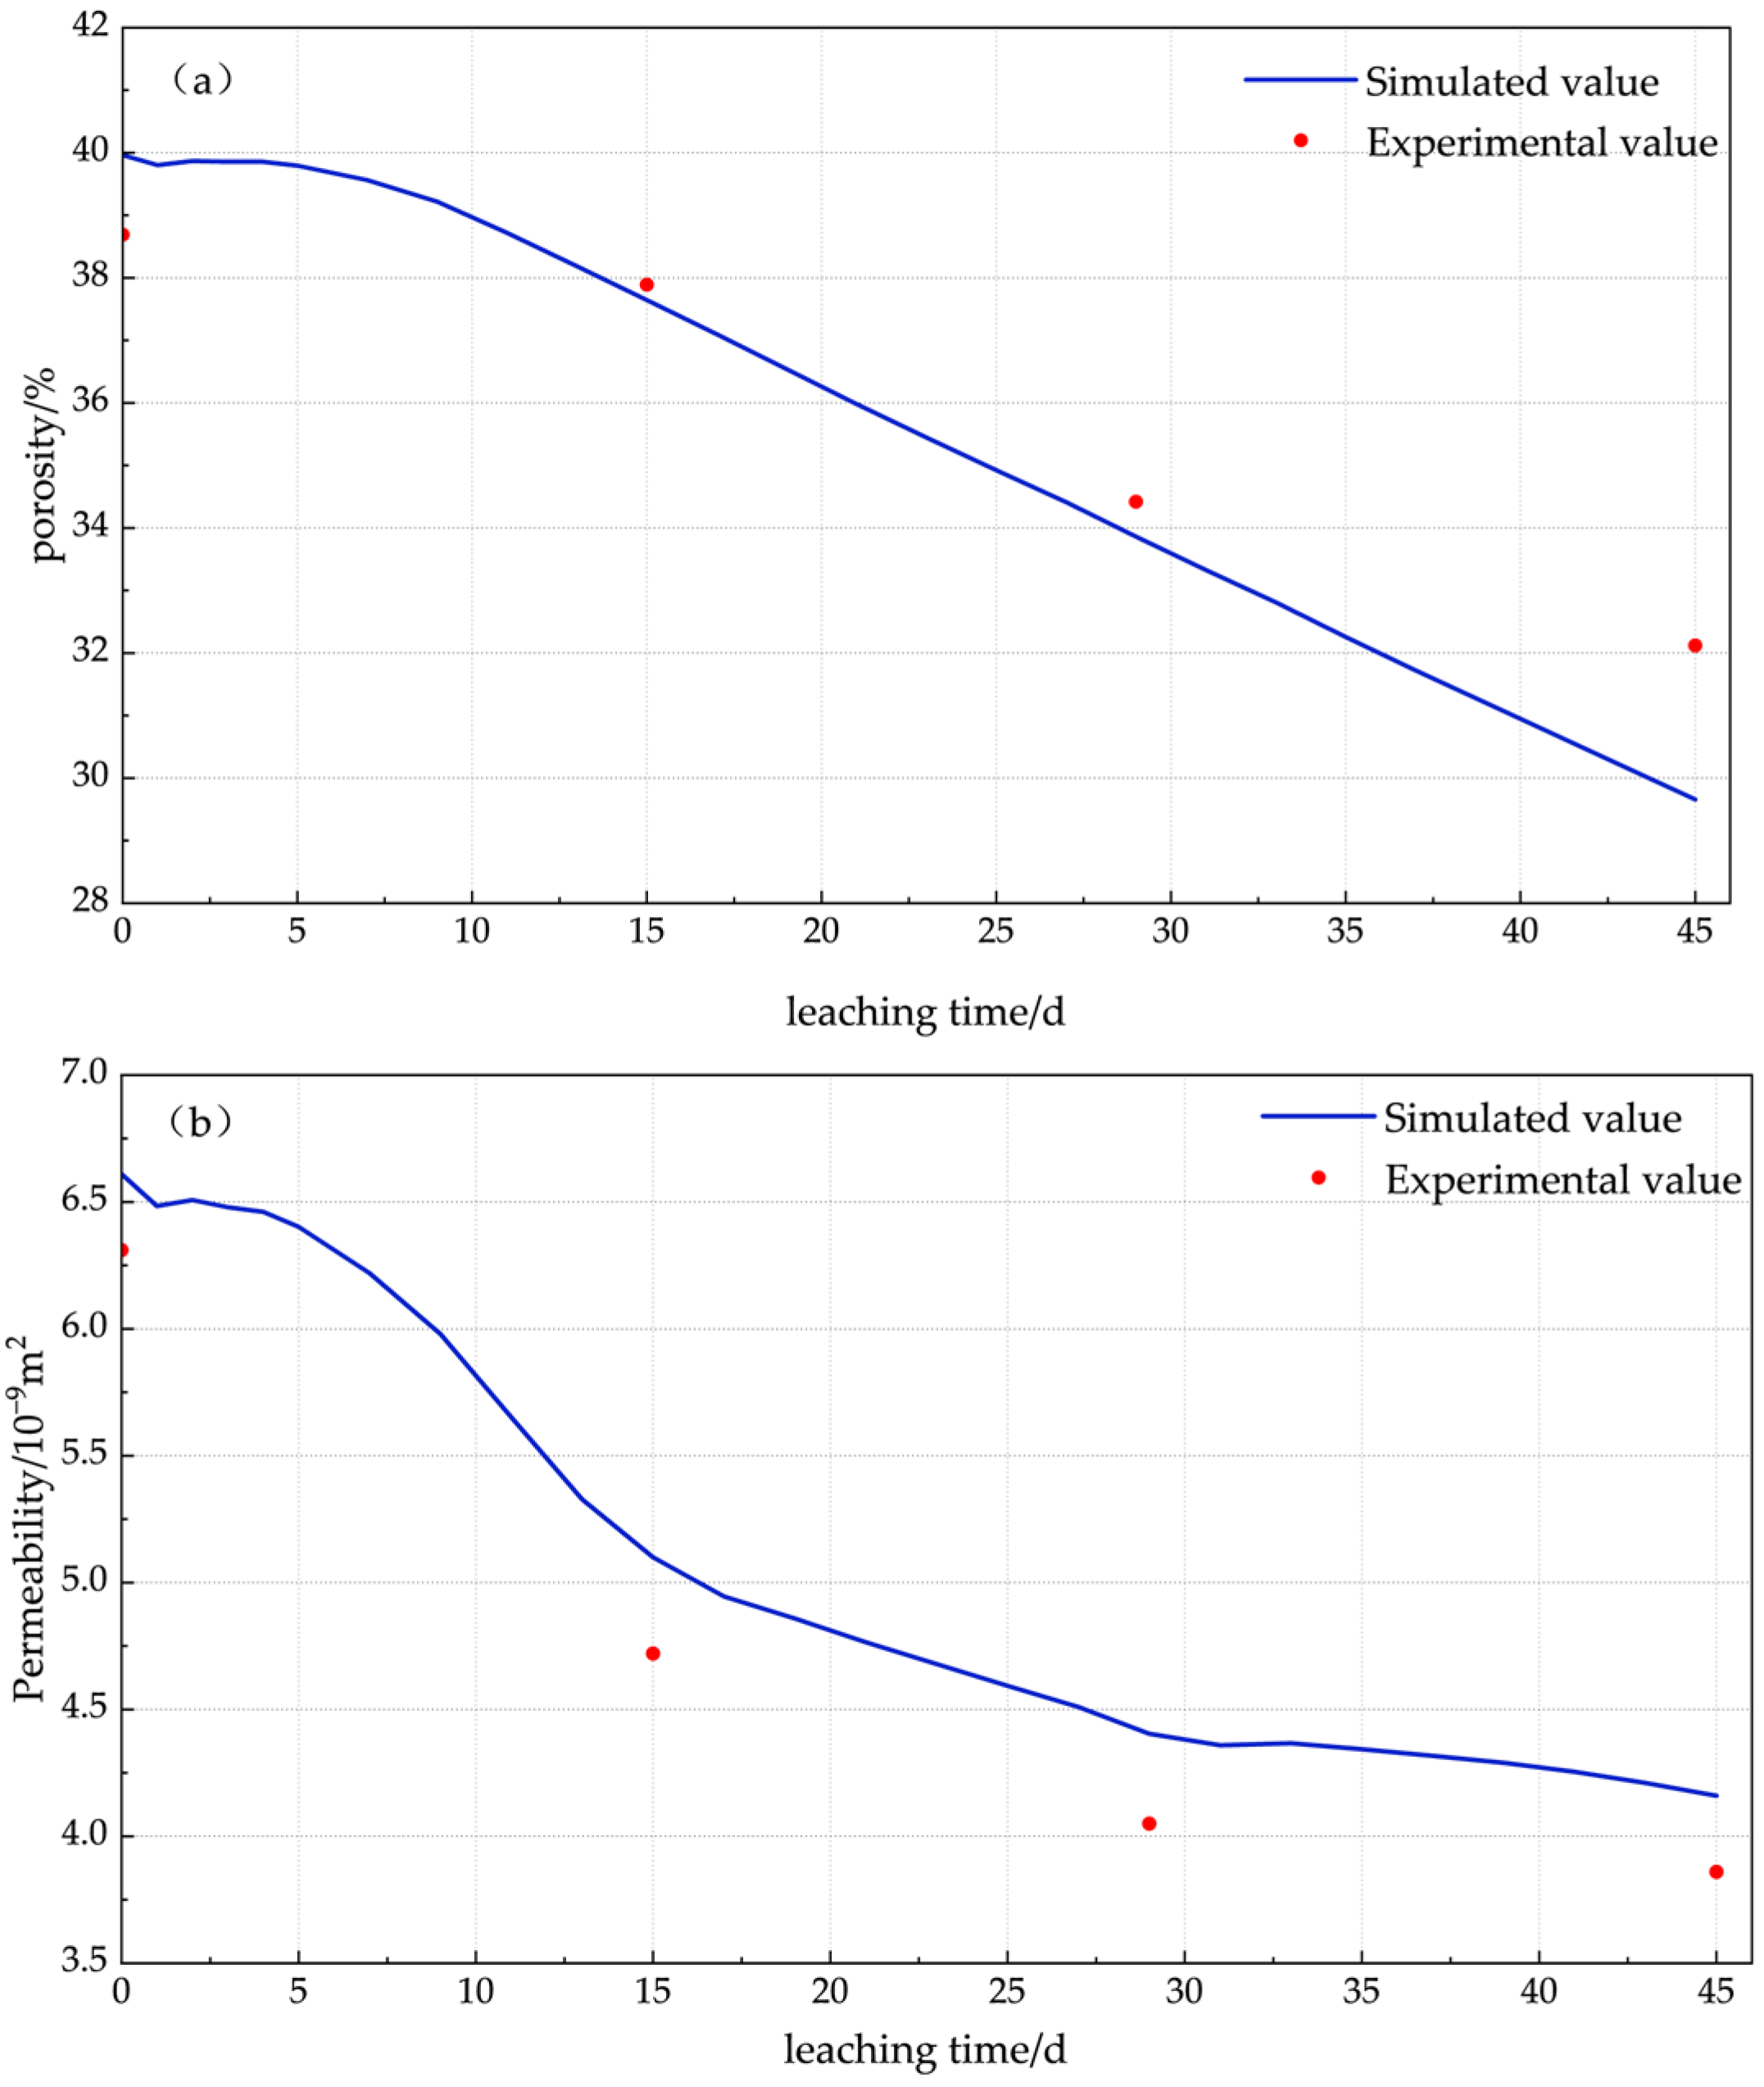
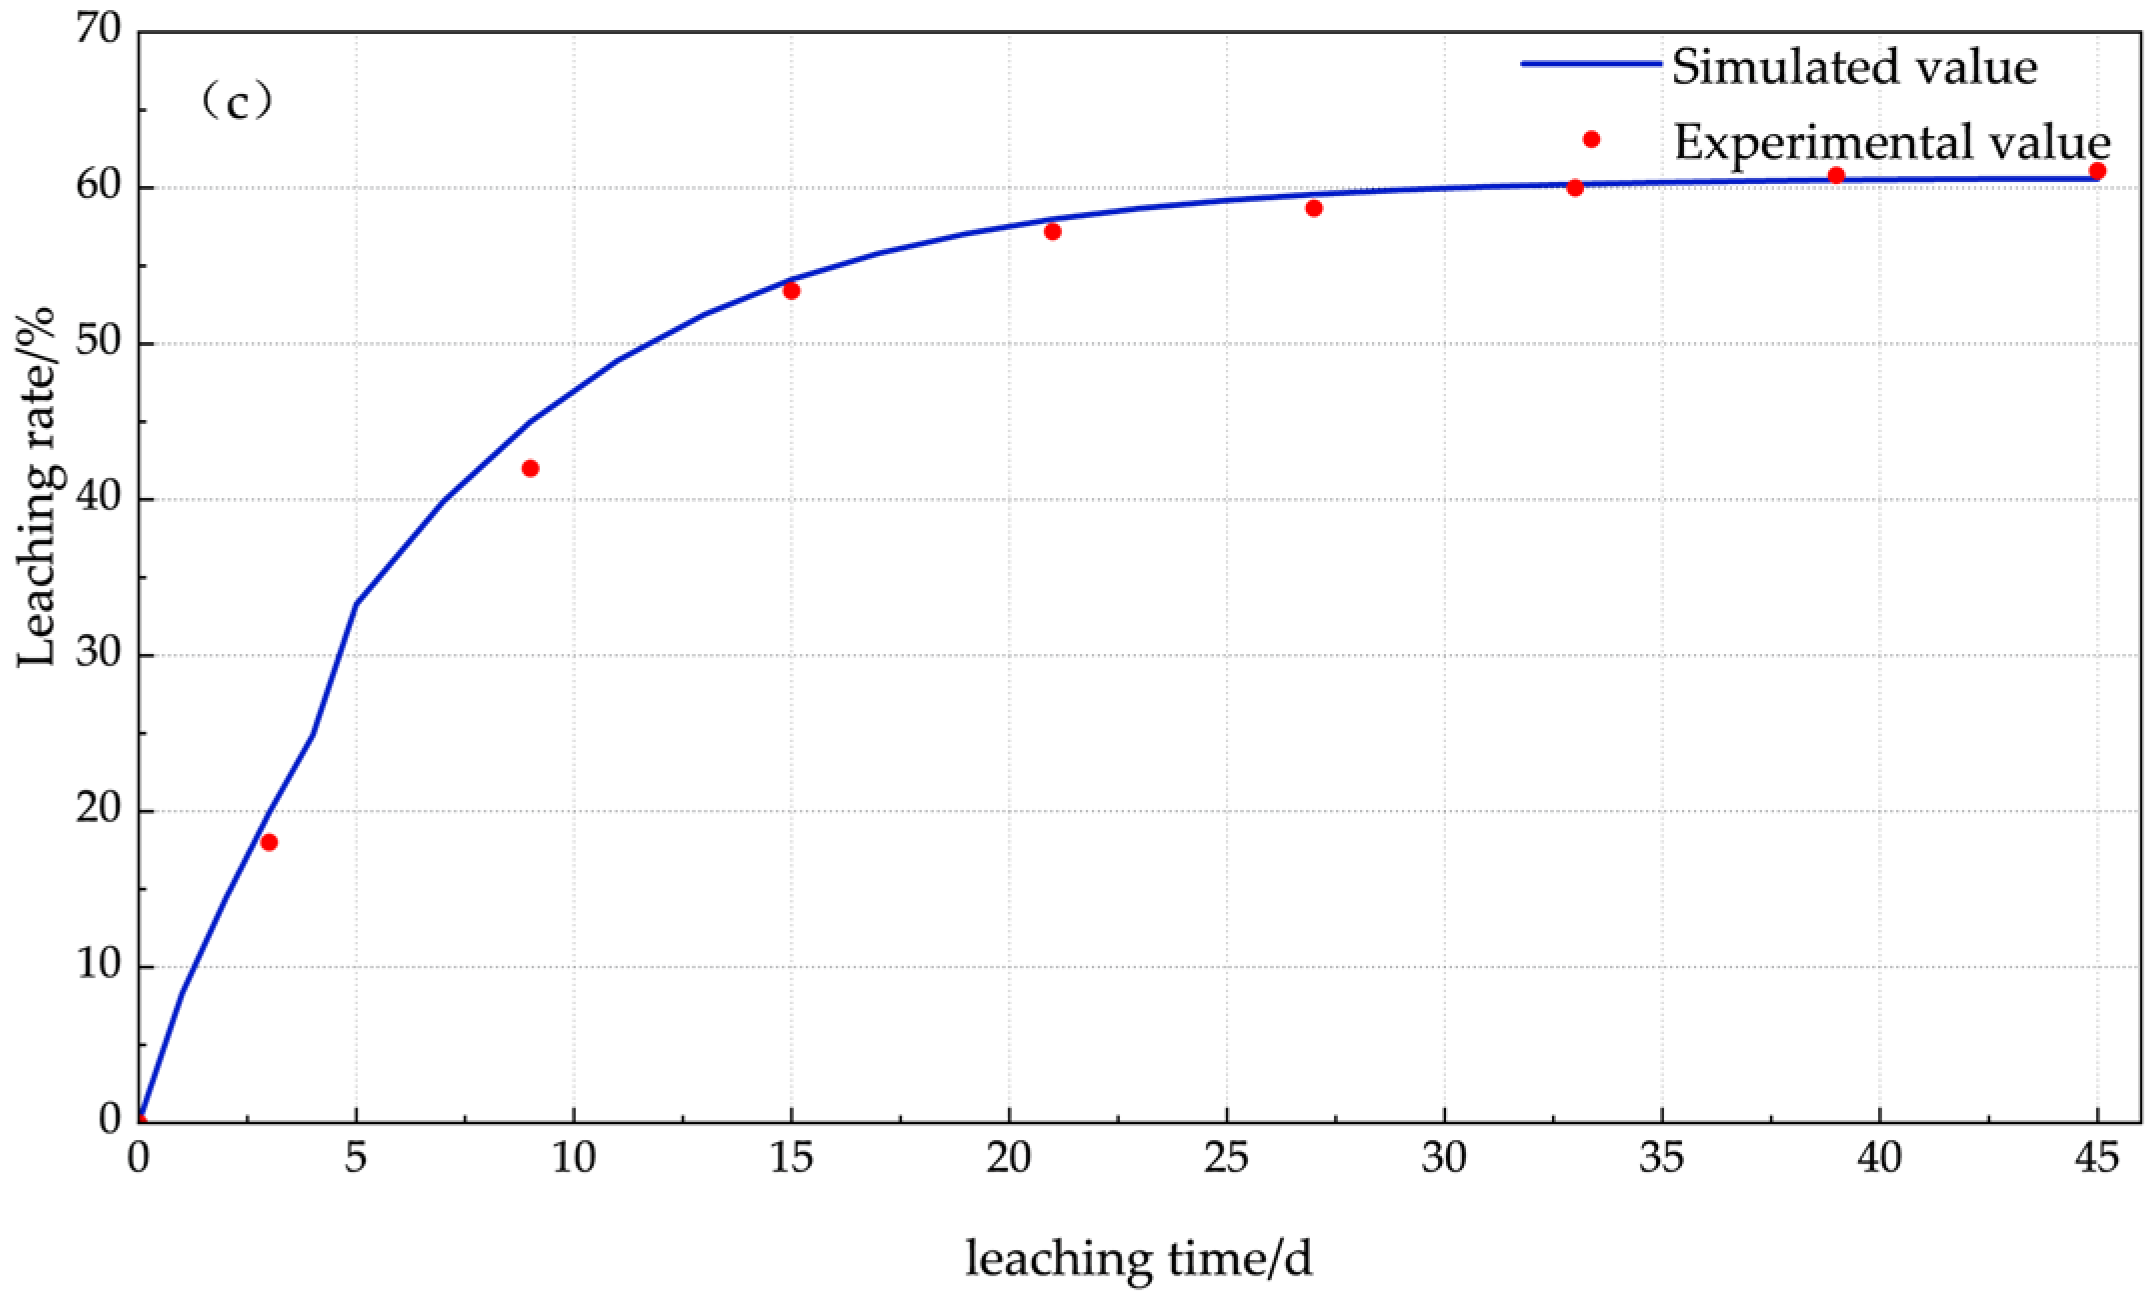
To further verify the accuracy of the model, the evolution curves of porosity, permeability, and leaching rate with leaching time are exported and shown in Figure 12. The relative errors between the simulated and experimental values are all maintained within 10%, indicating that the model is effective in predicting both the pore structure evolution and the leaching rate during the leaching process. It should be clarified that the leaching experimental data in this study were independent of the numerical model and were used only for model validation, without participating in any calibration or fitting of model parameters. To ensure the accuracy of the simulation model, the initial porosity and permeability parameters used in the model were independently determined by CT scanning, the leaching rate data were independently calculated from the copper ion concentration in the leachate, and the reaction kinetic parameters, startup flow velocity, and deposition parameters were determined by independent chemical dissolution experiments and fine particle migration experiments. Therefore, the experimental dataset used for validation is independent of the dataset used for model parameter determination, and the model error of less than 10% can reasonably reflect its predictive capability.
Figure 12.
Evolution curves of porosity, permeability, and leaching rate with leaching time: (a) porosity; (b) permeability; (c) leaching rate.
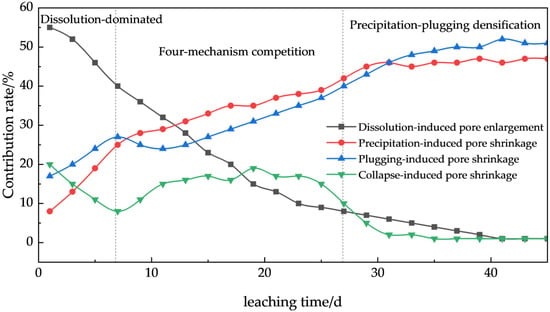
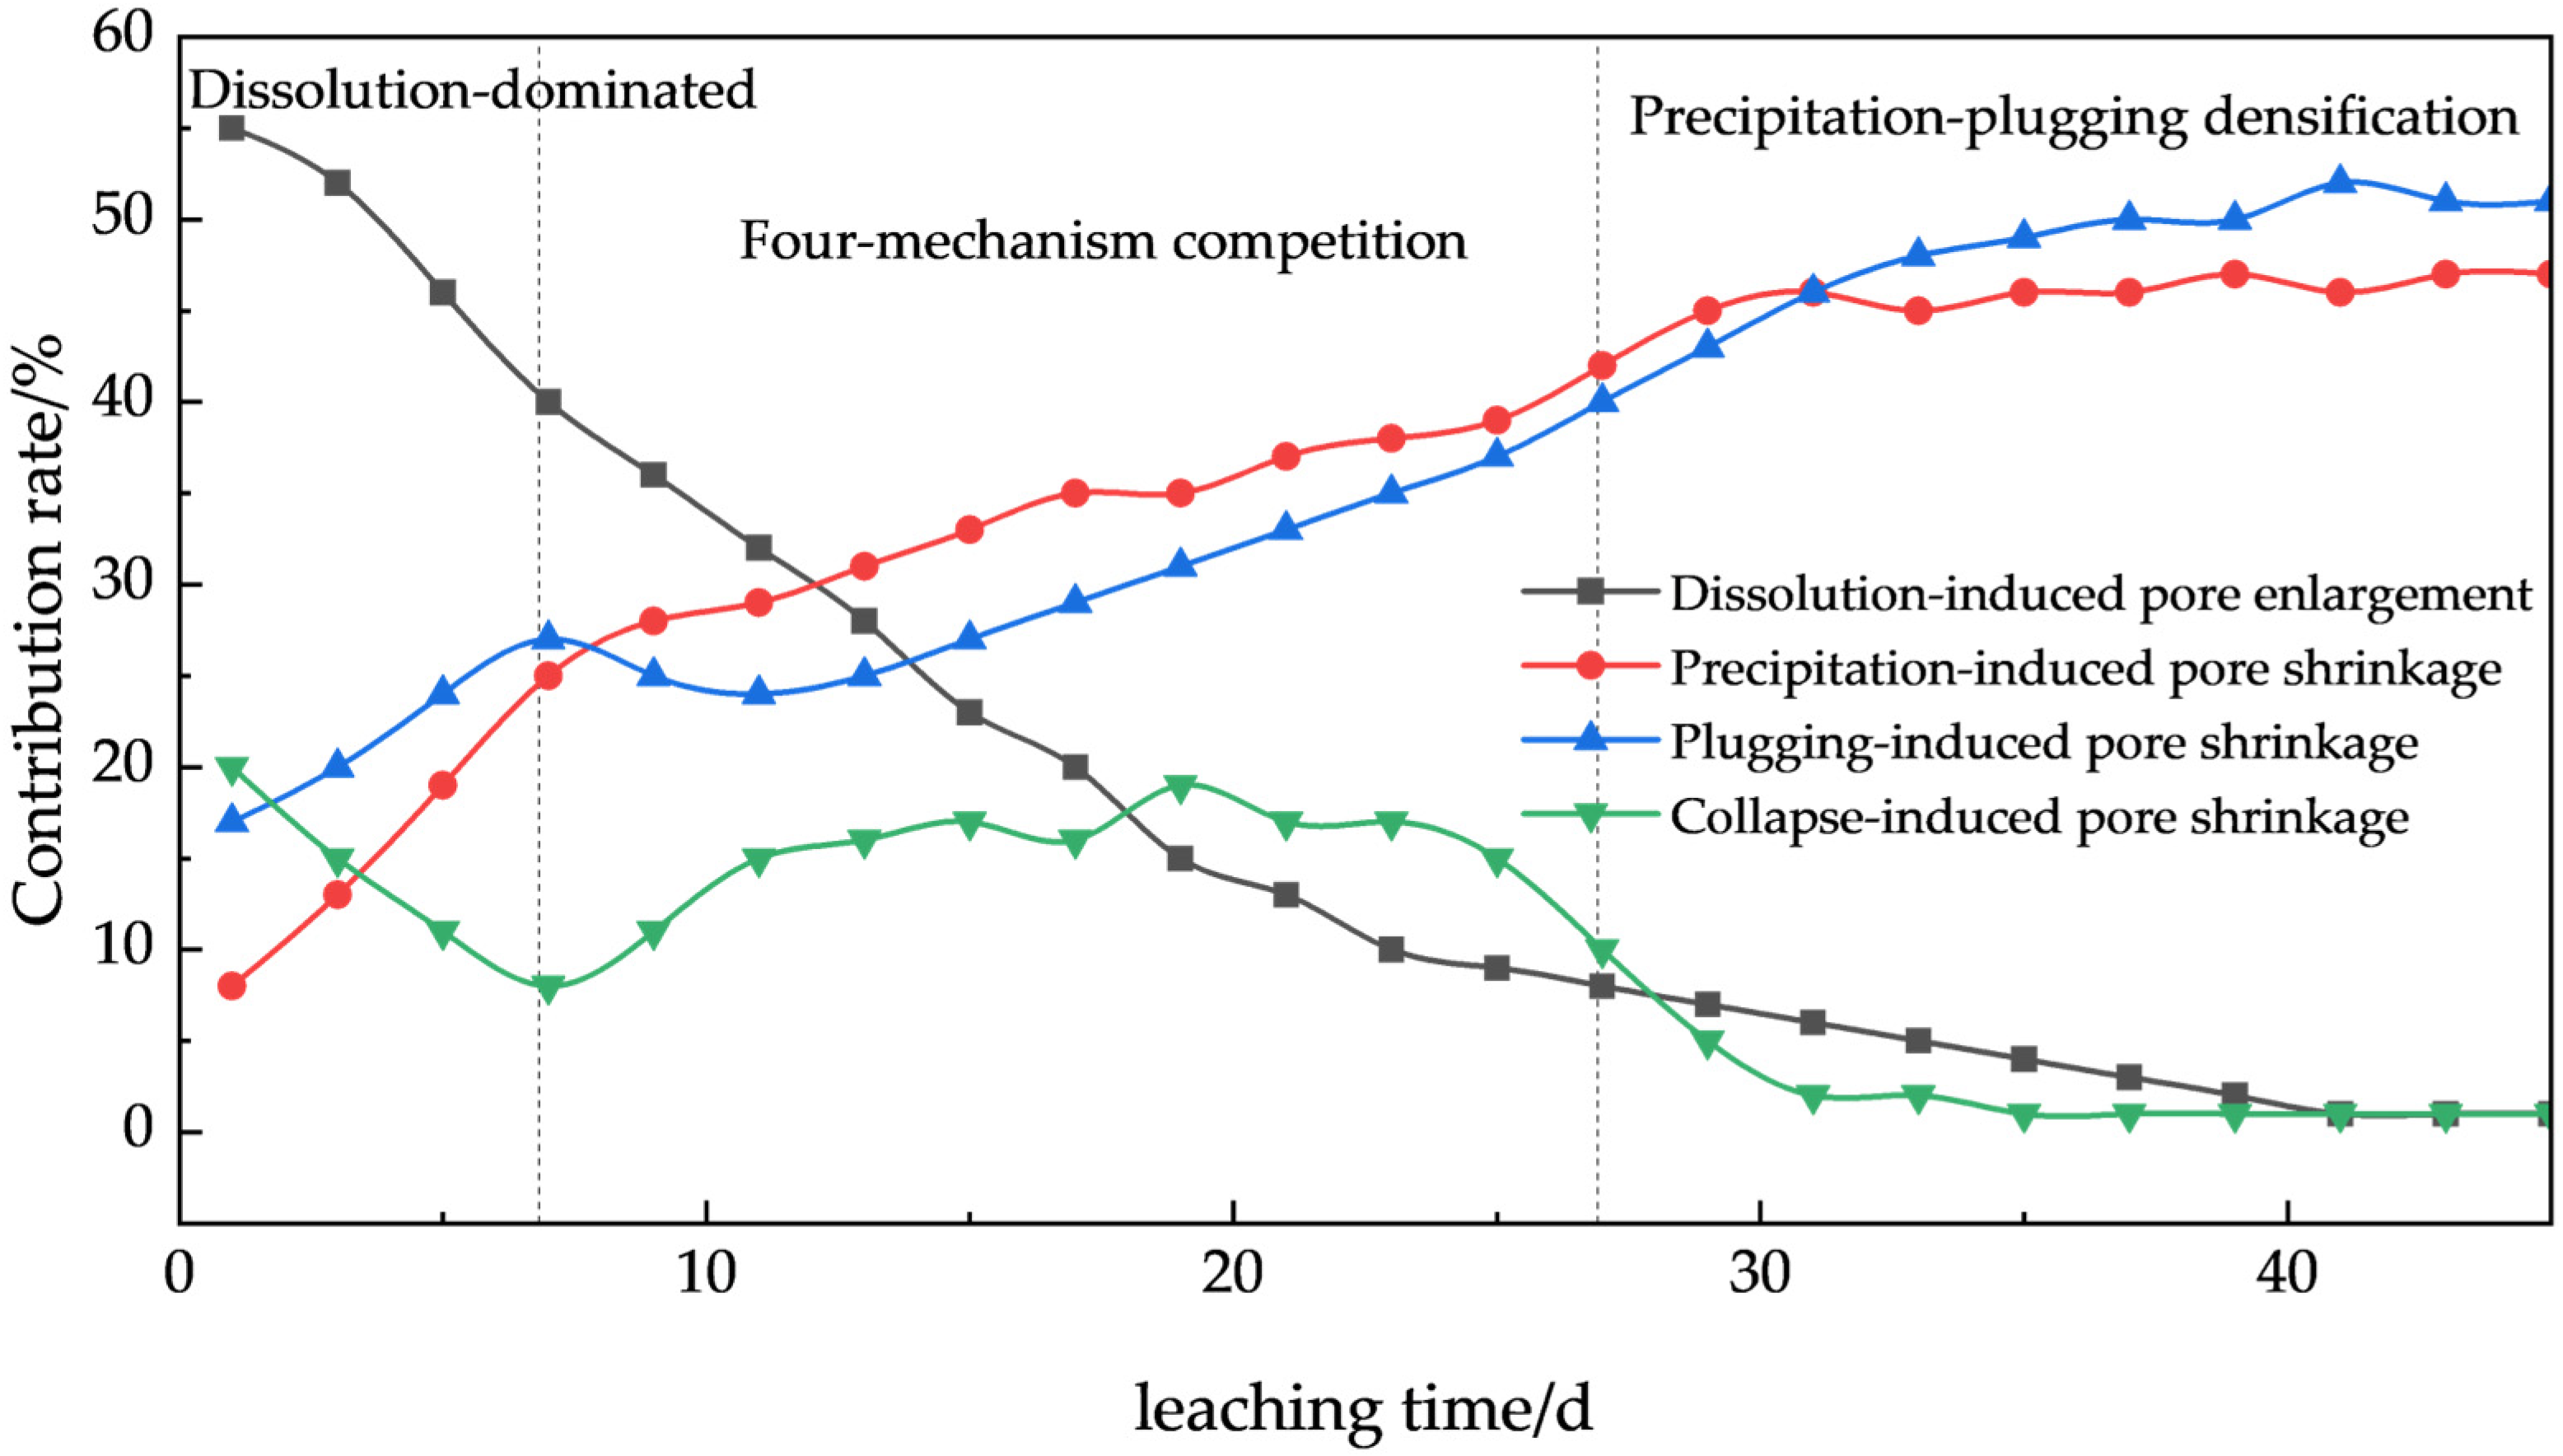
In COMSOL, the contribution of each mechanism to the rate of porosity change (dφ/dt) was extracted using the “Derived Values” function. In the results node, all computational domains were selected for global evaluation, and the four user-defined variables—rate_diss, rate_ppt, rate_dep, and rate_col—were entered sequentially. The output times were set in the “Time” tab (from 1 to 45 days at 2-day intervals), and the volume-averaged values of the four rate variables were computed. The sum of the absolute values of the four terms was further calculated, and the contribution rate of each mechanism at a given time was obtained by dividing the absolute value of each rate variable by the total sum. This approach reveals the contribution proportions of the four pore evolution mechanisms and the transitions of dominant controls at different leaching stages. The resulting contribution rate curves over time are shown in Figure 13.
Figure 13.
Contribution rates of each mechanism at different leaching stages.
As shown in the figure, the stope leaching process can be divided into three stages. The first is the dissolution-dominated stage in the early period, where chemical-dissolution-induced pore enlargement plays a dominant role. During this stage, the chemical reaction is the fastest and the leaching efficiency is the highest. The second is the four-mechanism competitive stage, which is the most complex stage in terms of mechanism composition during the leaching process. The contribution rates of the four mechanisms remain at comparable levels throughout this stage (dissolution: 8.21%~40.33%, chemical precipitation: 24.98%~42.06%, physical plugging: 26.85%~39.67%, and mechanical collapse: 7.84%~19.06%). No single mechanism accounts for more than 50%, nor does any mechanism completely disappear; instead, they collectively drive the direction of pore structure evolution. The third is the precipitation-plugging synergistic densification stage, in which chemical precipitation and physical plugging together account for more than 90% of the total contribution, becoming the absolute dominant forces in pore evolution. This stage corresponds to the later period of the leaching experiments, where the leaching rate enters a plateau phase.
5.4. Stope Optimization Regulation Strategy
The dominant controlling mechanism of pore evolution during the leaching process undergoes systematic transitions with leaching time, and the dominant factors and rates of pore degradation differ significantly across stages. Therefore, the stope regulation strategy must be matched to the dominant mechanisms of each stage: maximizing dissolution efficiency during the dissolution-dominated stage, implementing active intervention to delay the onset of plugging during the competitive stage, and controlling costs while accepting irreversible degradation during the densification stage. In actual stope operations, the ore particle size (0~200 mm) is far larger than that used in simulations; the reduced specific surface area leads to lower reaction rates, and the increased heap height extends solution transport pathways, resulting in a systematic delay in the timing of stage transitions. Consequently, for stope application, the stage division established in Section 5.3 should serve as a qualitative framework, while the actual transition times need to be calibrated using stope monitoring data. Indicators such as effluent Cu2+ concentration, pH, and flow rate should be measured and combined with numerical model inversion to identify the actual transition nodes under stope conditions. During the dissolution-dominated stage (estimated at 15~30 days for stope conditions), the spray intensity is set to 25 L/(m2·h), with an acid concentration of 20 g/L and continuous spraying of this acid solution. During the competitive stage (estimated at 30~60 days for stope conditions), the spray intensity is 20 L/(m2·h), with an acid concentration of 15 g/L and intermittent spraying (12 h on, 12 h off). During the densification stage (estimated at 60~90 days for stope conditions), the spray intensity is 10 L/(m2·h), with an acid concentration of 8 g/L and long-interval intermittent spraying.
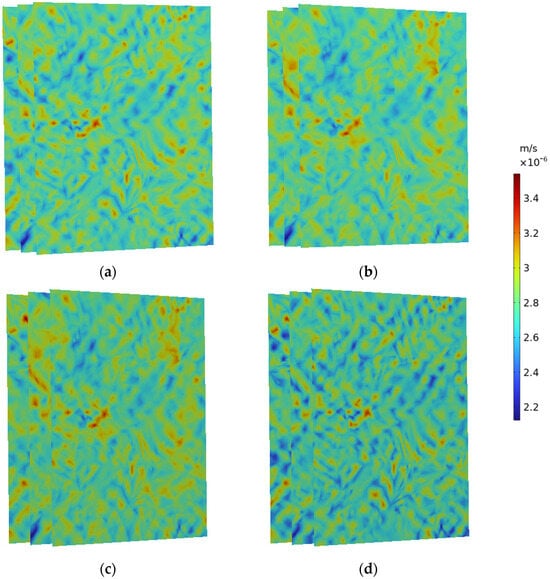
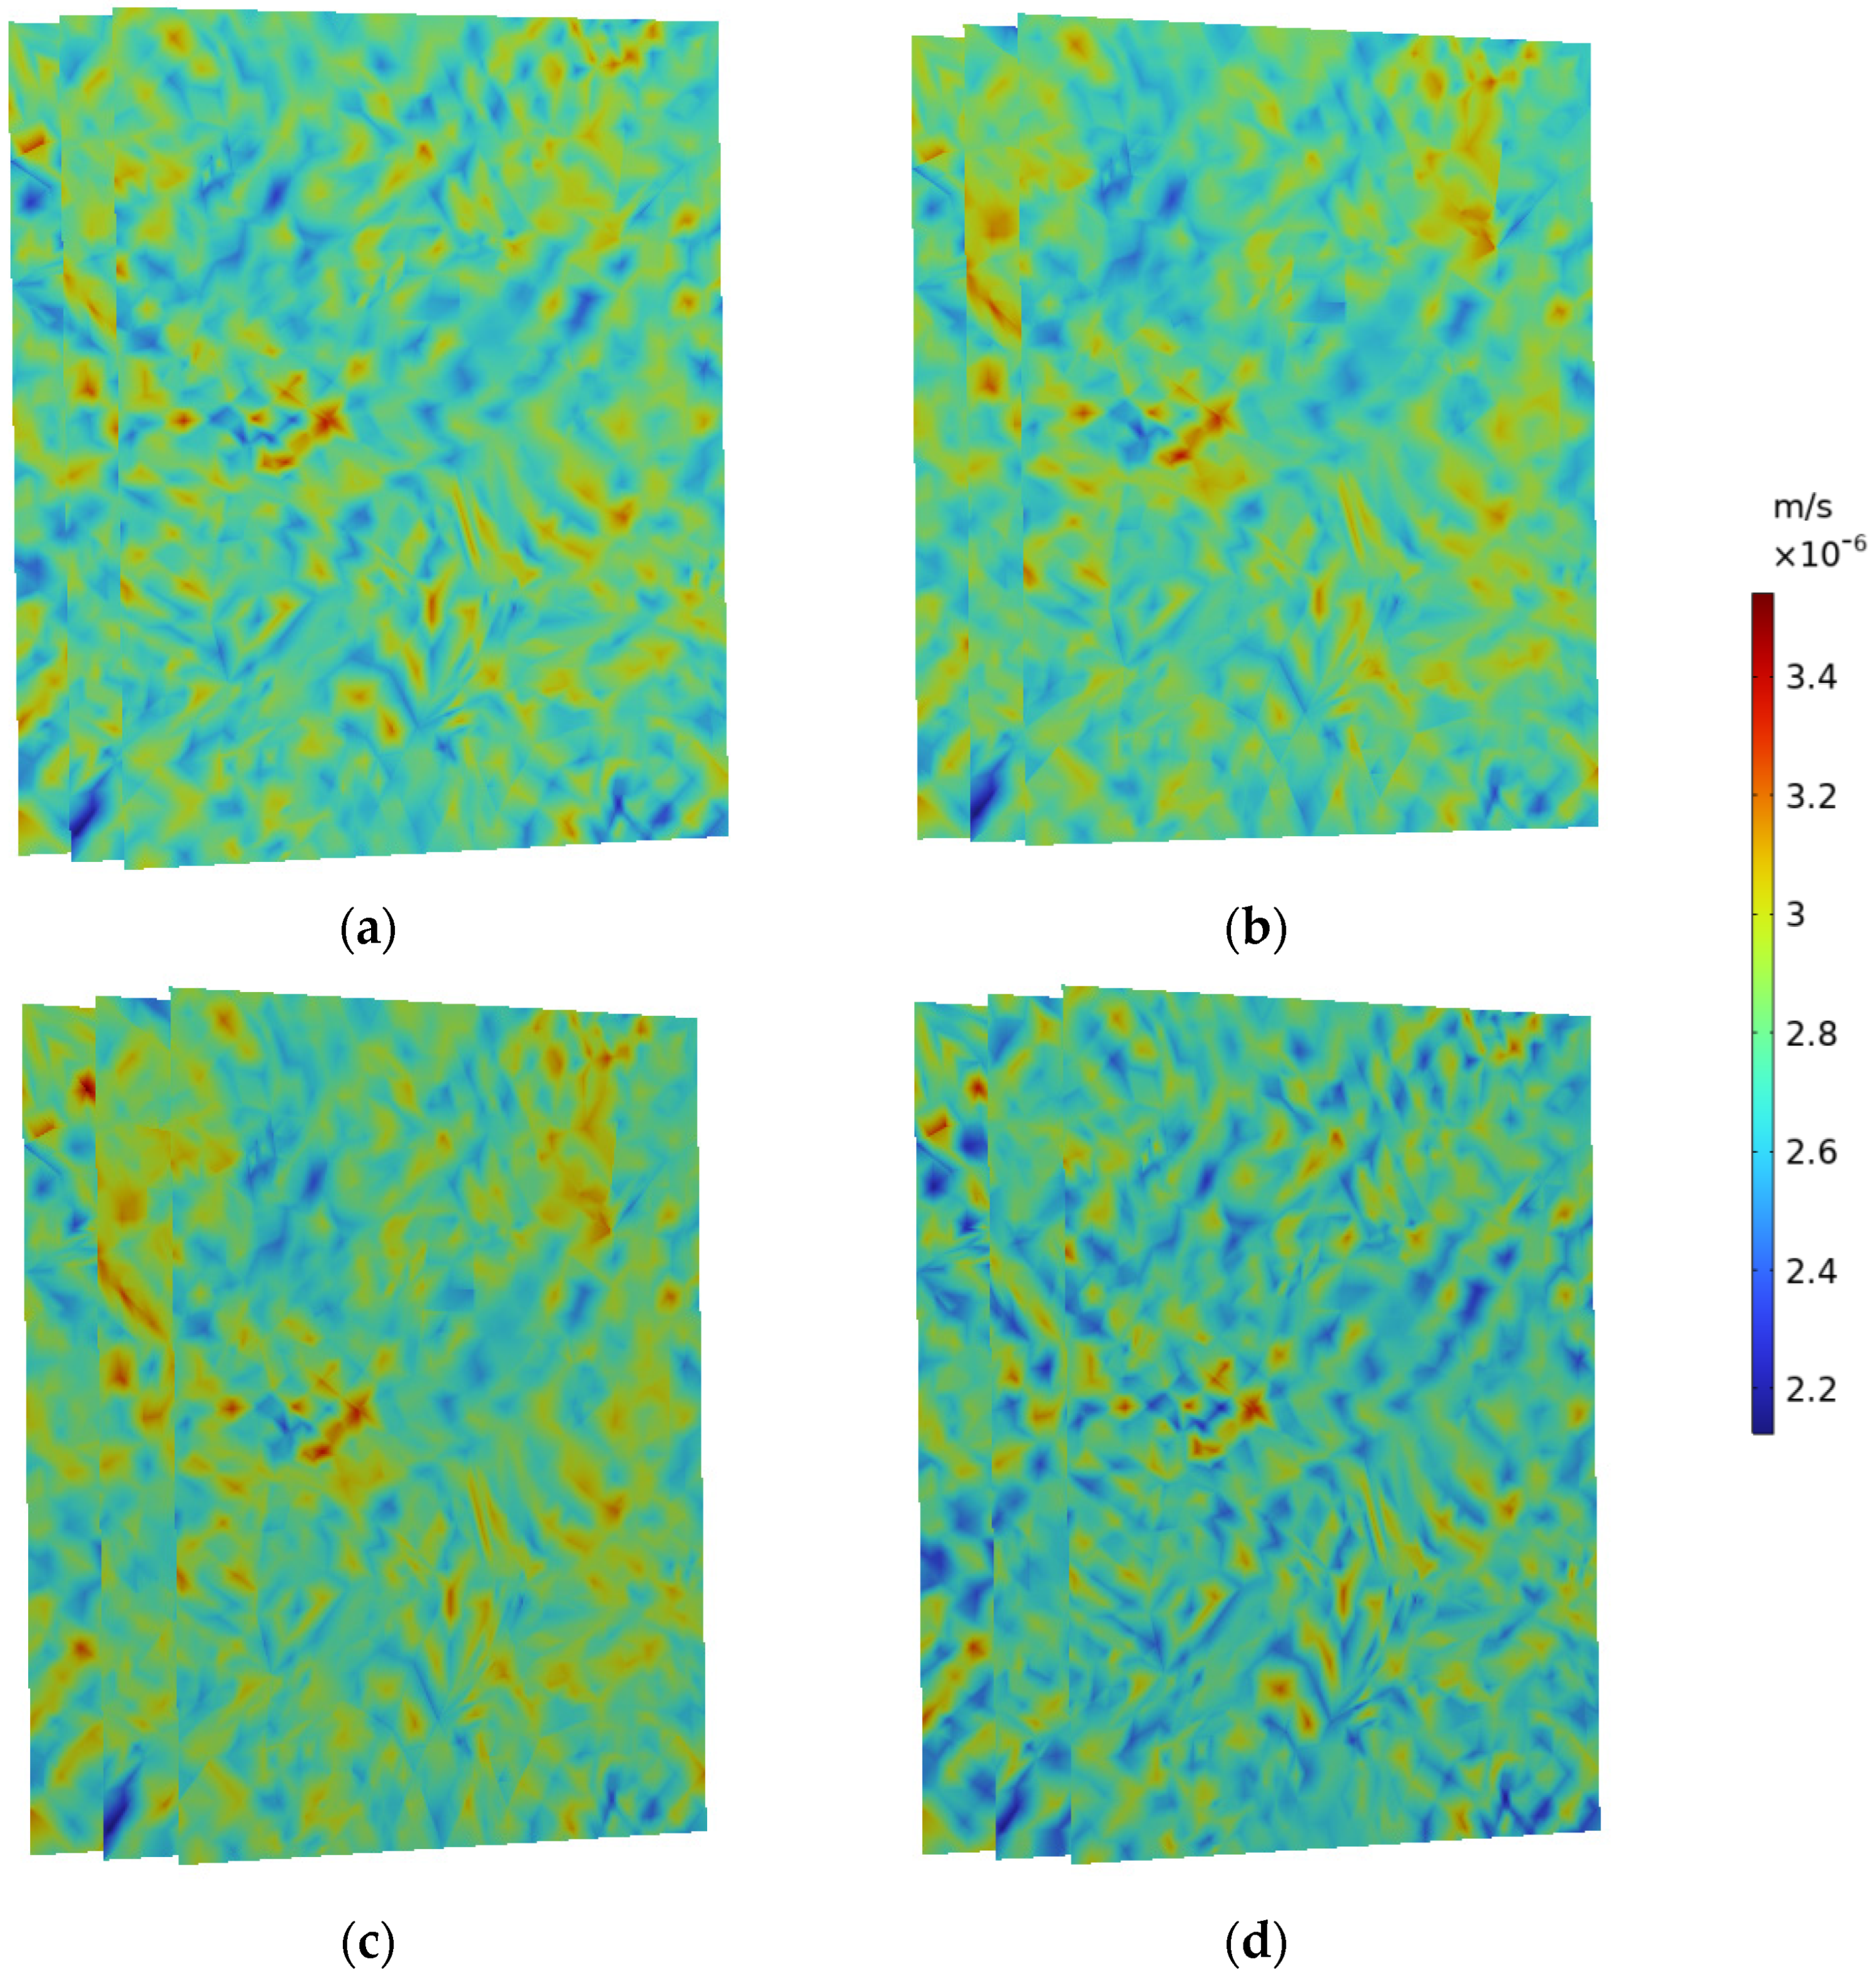
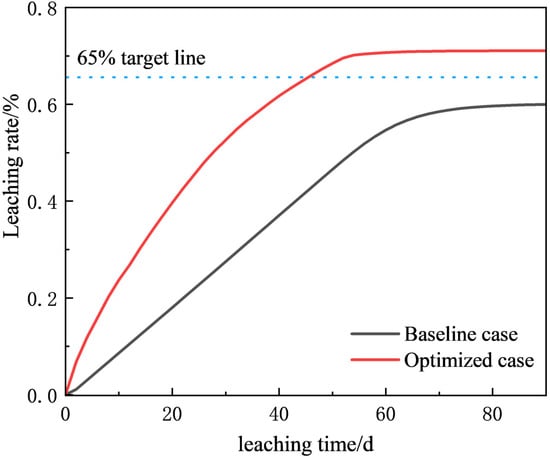
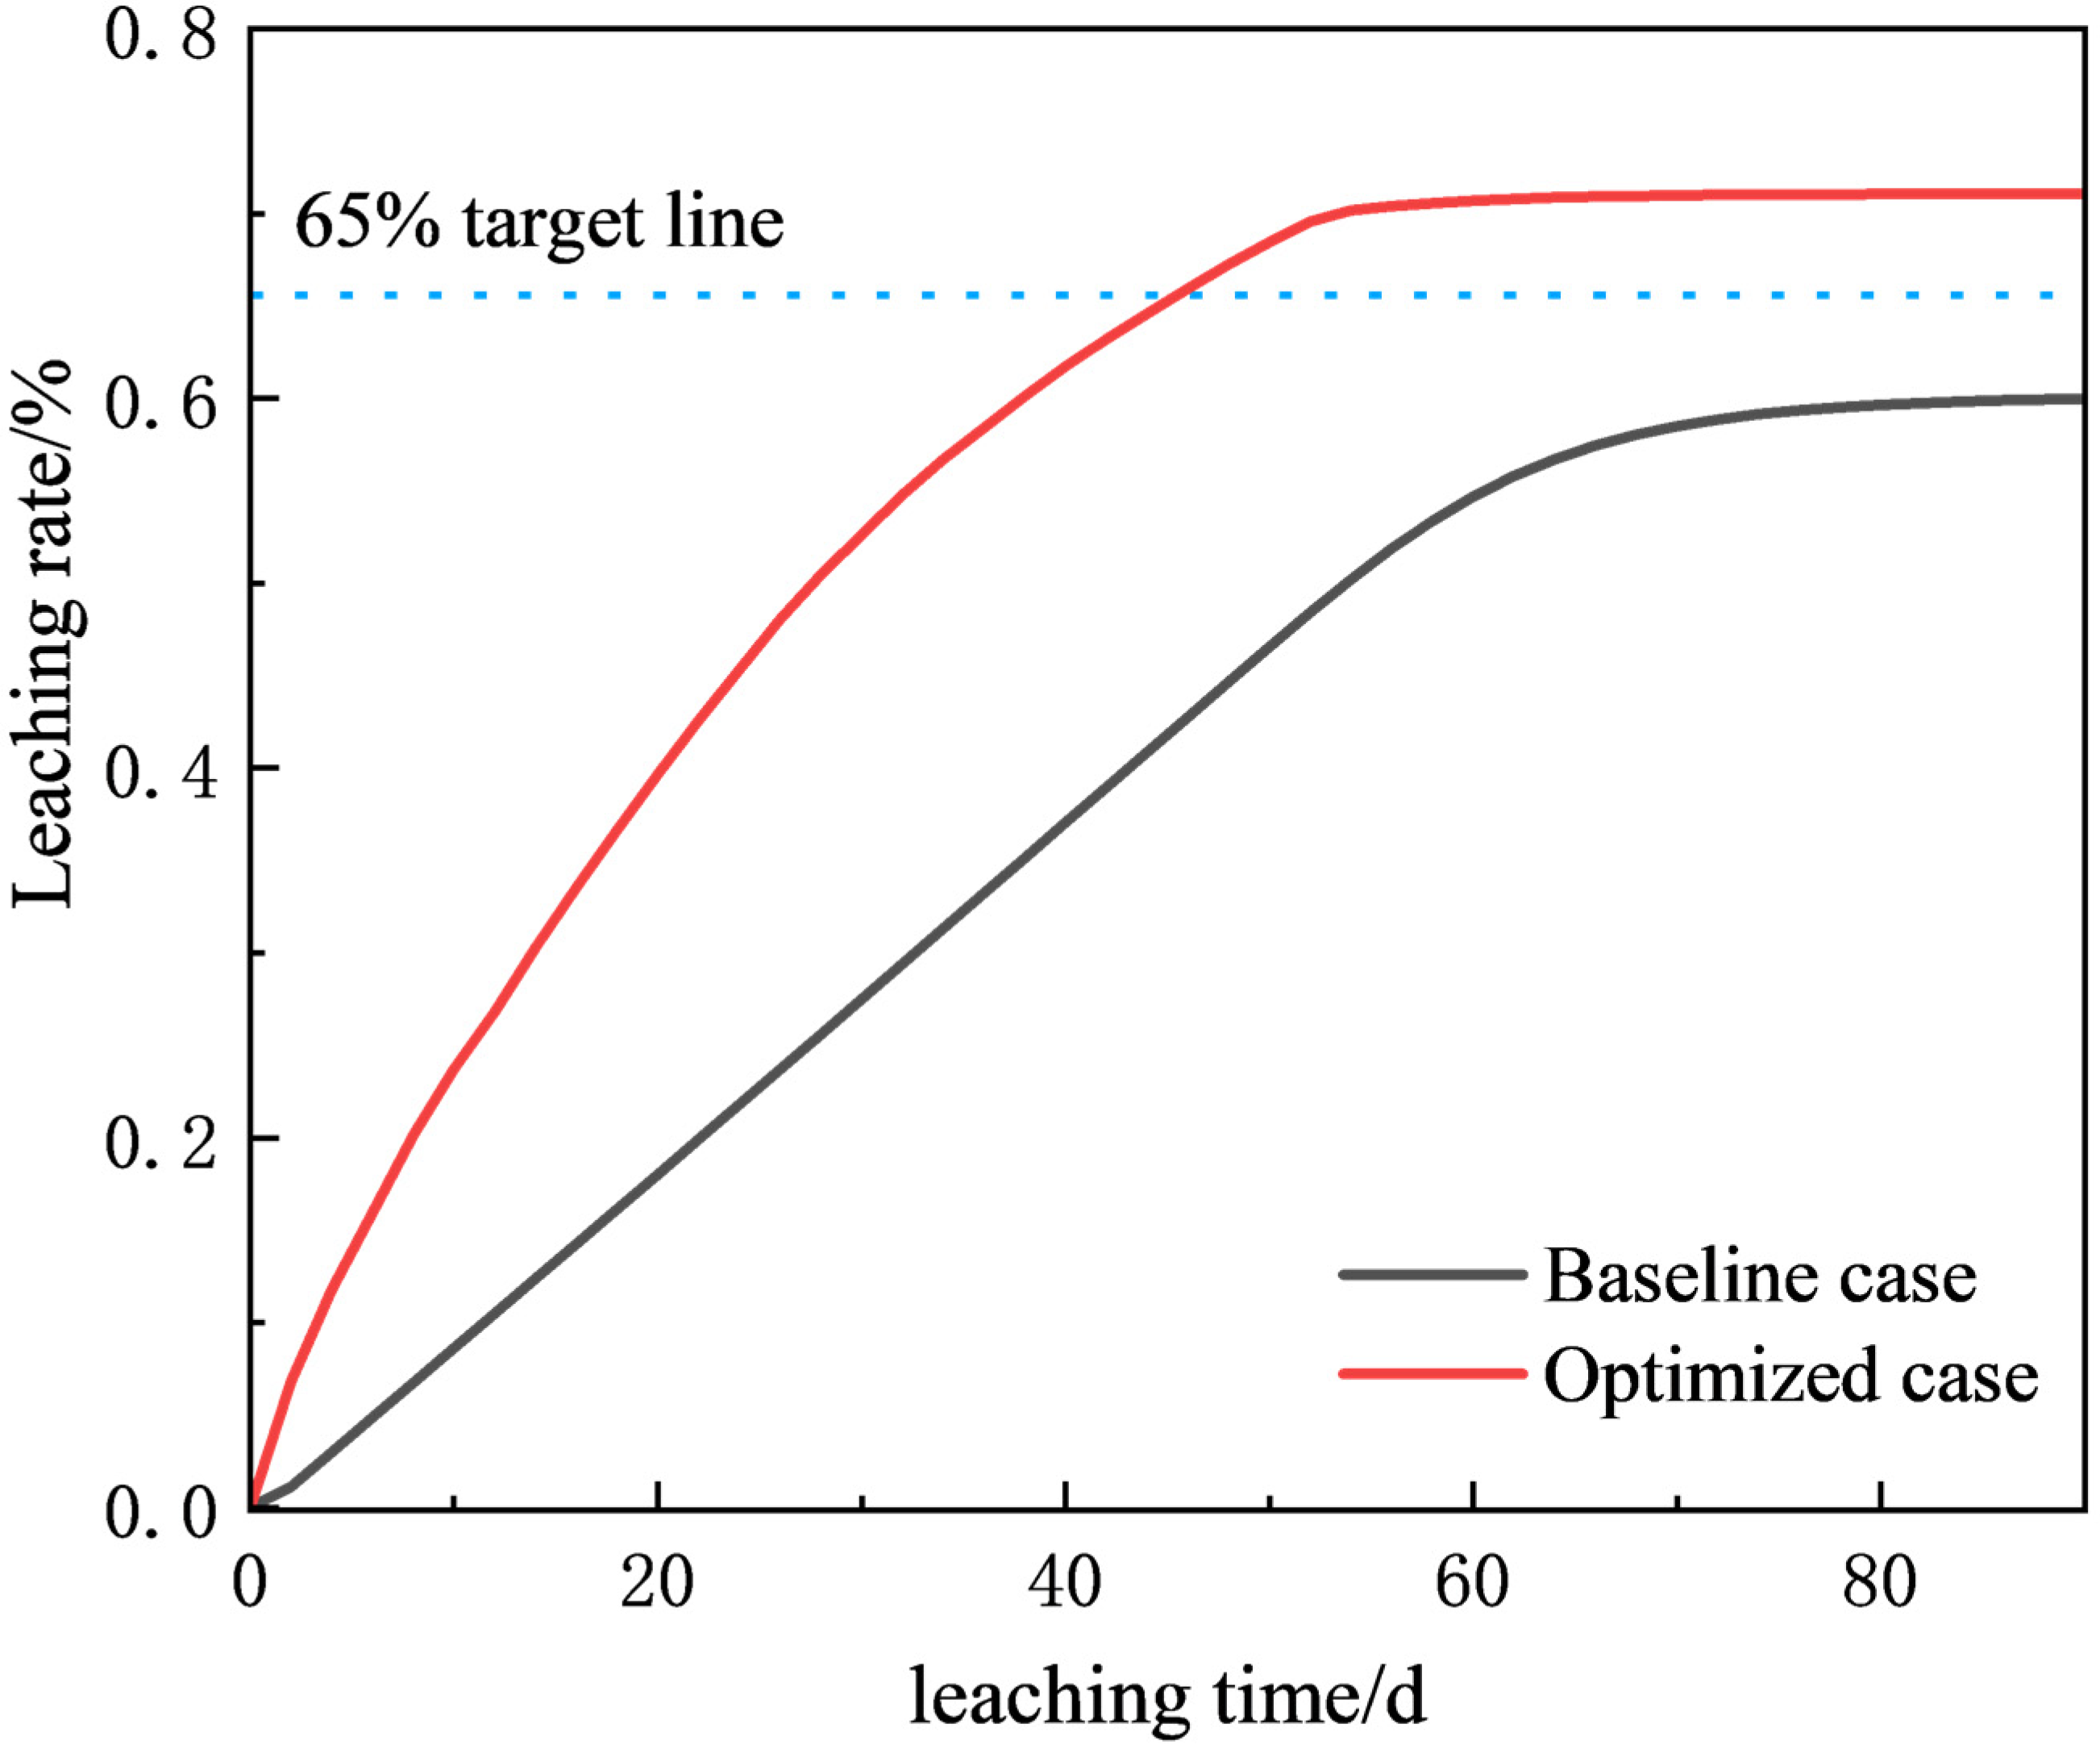
The flow velocity distribution during the leaching process is shown in Figure 14. It can be seen that the flow velocity distribution is relatively uniform throughout the leaching process, with no significant preferential flow paths formed, which is conducive to uniform solution flow and chemical reactions, indicating that the regulation strategy facilitates the leaching of the target minerals. The evolution of the leaching rate during the process is shown in Figure 15, where the target leaching rate of over 65% is achieved. Moreover, the leaching rate is relatively fast in the early stage, which can significantly shorten the leaching time in practical engineering to achieve the same leaching target, while simultaneously reducing acid consumption and improving the economic efficiency of the leaching operation.
Figure 14.
Seepage velocity distribution during the leaching process: (a) 5 d; (b) 15 d; (c) 30 d; (d) 60 d.
Figure 15.
Comparison of leaching rates between the optimized control case and the baseline case.
6. Conclusions
In this study, irregular ore particles were used as samples to conduct chemical dissolution–precipitation experiments and fine particle migration-plugging experiments, respectively. The effects of chemical dissolution-precipitation on pore evolution and the permeability evolution caused by pore plugging due to fine particle migration were analyzed and discussed. Furthermore, the chemical and physical pore evolution mechanisms were coupled and analyzed, and a multi-physics coupling prediction model was established using COMSOL, with differentiated stope regulation strategies proposed. The main conclusions are summarized as follows:
- (1)
- The chemically driven evolution of pore structure in low-grade copper ore by an acid solution is essentially the dynamic result of the competitive interplay between two chemical processes: dissolution-induced pore enlargement and precipitation-induced plugging. Kinetic analysis indicates that the copper leaching process is jointly controlled by chemical reaction and diffusion, with the increase in acid concentration exhibiting a diminishing marginal effect on leaching efficiency (reaction order n = 0.65). Moreover, the duration of the chemical reaction control window shows an asymmetric trend of first increasing and then decreasing with acid concentration, with the widest control window (2 d) occurring at 10 g/L, providing more time, sufficient for dissolution development. Thermodynamically, SI calculations reveal that the precipitation tendency of gypsum increases significantly with rising acid concentration, with the earliest precipitation onset and highest plugging risk under high-acid (20 g/L) conditions. In contrast, the precipitation of goethite and hematite is regulated by pH, exhibiting a precipitation tendency only under low-acid conditions where pH rises into the Fe3+ hydrolysis window. Based on the combined evaluation of reaction rate, precipitation timing, and chemical reaction control window, 10 g/L is identified as the optimal acid concentration for pore development in this experiment, offering a relatively strong dissolution driving force with delayed precipitation plugging, thus achieving the best net pore-enlargement effect. Although the 20 g/L high-acid concentration exhibits a slightly higher reaction rate (only 18.41% higher than that at 10 g/L), the intense gypsum precipitation occupies substantial pore space and blocks throats, which is detrimental to pore connectivity and effective porosity enhancement.
- (2)
- Fine particle migration and deposition constitute the key physical process leading to pore plugging and permeability degradation in porous media, with the extent of impact primarily governed by the matching relationship between particle size and pore-throat diameter. Breakthrough experiments demonstrate that smaller particles exhibit higher breakthrough rates (55.01% for 0.05 mm particles versus only 10.23% for 0.2 mm particles), indicating stronger migration ability and lower deposition rates; conversely, larger particles are more readily captured and retained at pore throats. Hydraulic conductivity measurements further confirm this pattern: the 0.05 mm particle size group exhibited a reduction of only 37.80%, whereas the 0.20 mm group showed a dramatic reduction of 86.58%, indicating that larger particles exert significantly stronger physical plugging effects. This physical process, together with chemical precipitation, constitutes the dual driving mechanism of pore evolution, providing key physical evidence for explaining the nonlinear characteristics of connectivity decline.
- (3)
- The evolution of pore structure during the leaching process is not governed by the continuous action of a single mechanism, but rather by the competitive superposition of four fundamental mechanisms—dissolution-induced pore enlargement, precipitation-induced pore shrinkage, plugging-induced pore shrinkage, and collapse-induced pore shrinkage—over the temporal scale. Chemical and physical processes form a bidirectional interactive feedback loop: chemical dissolution both generates new pores and releases fine particles, while chemical precipitation both blocks pores and alters pore wall properties; fine particle deposition modifies the local flow field and reactant supply conditions, which in turn feeds back to influence the dissolution–precipitation balance. The temporal evolution of the contribution rates of the four mechanisms reveals that the leaching process can be divided into three dominant stages: the early dissolution-dominated stage (dissolution contribution predominates), the middle four-mechanism competitive stage (contributions of all mechanisms are comparable, with no single mechanism exceeding 50%), and the late precipitation-plugging synergistic densification stage (the two together account for more than 90%, with the leaching rate entering a plateau phase). This mechanistic model clarifies that pore structure evolution is a dynamic process driven by chemical–physical–mechanical multi-field coupling, with the ultimate evolution direction determined by the net superposition of the four mechanisms at different stages.
- (4)
- Based on the mechanistic understanding outlined above, this study established a COMSOL multi-physics coupling model that integrates the seepage field, chemical reaction field, fine particle migration field, and mechanical compression field into a unified framework, enabling quantitative prediction of porosity, permeability, and the contribution rates of the four mechanisms throughout the entire leaching cycle. The model validation errors are controlled within 10%, demonstrating engineering reliability. Based on the stage transition patterns revealed by the model, a differentiated stope regulation strategy was proposed: during the dissolution-dominated stage, high acid concentration (20 g/L) and high spray intensity (25 L/(m2·h)) with continuous spraying are adopted to maximize dissolution efficiency; during the competitive stage, the acid concentration (15 g/L) and spray intensity (20 L/(m2·h)) are moderately reduced with intermittent spraying to delay precipitation and plugging; during the densification stage, the acid concentration (8 g/L) and spray intensity (10 L/(m2·h)) are further reduced to control costs while accepting irreversible degradation. This strategy achieved a target leaching rate of over 65% under uniform flow velocity distribution, providing an actionable quantitative reference for the optimization of actual stope leaching processes.
Author Contributions
K.L.—software, data curation, investigation, validation, writing—original draft; D.G.—conceptualization, formal analysis, funding acquisition, project administration, supervision, writing—review and editing; Z.X.—methodology, resources, supervision, writing—review and editing. All authors have read and agreed to the published version of the manuscript.
Funding
This research received no external funding.
Data Availability Statement
The original contributions presented in this study are included in the article. Further inquiries can be directed to the corresponding author.
Conflicts of Interest
The authors declare no conflicts of interest.
Abbreviations
The following abbreviation are used in this manuscript:
| SI | Saturation index |
References
- Karimian, Z.; Maleki, H.; Aslani, S.; Noaparast, M.; Rezaei, A. Implementation of a Comprehensive Flotation and Bioleaching Processes to Recover Copper from Low-Grade Ore Sample. JOM 2025, 77, 4579–4593. [Google Scholar] [CrossRef] [Scilit]
- Sahu, S.N.; Behera, P.; Sahoo, S.; Sushobhan, B.R. A Critical Review on the Magnetization Roasting of Low/Lean-Grade Iron Ore Resources Using Renewable/Non-Renewable Reductant: An Approach Towards Iron ore Sustainability. J. Sustain. Metall. 2025, 11, 160–185. [Google Scholar] [CrossRef] [Scilit]
- Lan, Z.Y.; Lai, Z.N.; Zheng, Y.X.; Lv, J.F.; Pang, J.; Ning, J.L. Recovery of Zn, Pb, Fe and Si from a low-grade mining ore by sulfidation roasting-beneficiation-leaching processes. J. Cent. South Univ. 2020, 27, 37–51. [Google Scholar] [CrossRef] [Scilit]
- Machaca, D.M.C.; Botelho, A.B., Jr.; Carvalho, T.C.; Tenório, J.A.S.; Espinosa, D.C.R. Hydrometallurgical Processing of Chalcopyrite: A Review of Leaching Techniques. Int. J. Miner. Metall. Mater. 2024, 31, 2537–2555. [Google Scholar] [CrossRef] [Scilit]
- Liu, Y.X.; He, Y.; Chen, J.L.; Cheng, N.; Wang, H. Progress on enhancing seepage-leaching mass-transfer research for in-situ leaching mining of low-permeability uranium-bearing sandstone: A review. J. Radioanal. Nucl. Chem. 2024, 333, 4485–4502. [Google Scholar] [CrossRef] [Scilit]
- Estay, H.; Diaz-Quezada, S.; Arancibia, E.; Vargas, T. Economic Assessment of an In Situ Leaching Operation with Ore Preconditioning Using Sublevel Stoping Techniques. Min. Metall. Explor. 2023, 40, 493–504. [Google Scholar] [CrossRef] [Scilit]
- Nkuna, R.; Ijoma, G.N.; Matambo, T.S.; Chimwani, N. Accessing Metals from Low-Grade Ores and the Environmental Impact Considerations: A Review of the Perspectives of Conventional versus Bioleaching Strategies. Minerals 2022, 12, 506. [Google Scholar] [CrossRef] [Scilit]
- Sepúlveda, R.; Martínez, M.; Hernández, P.; Guzmán, A.; Castillo, J. Effect of Chloride and Ferrous Ions on Improving Copper Leaching from Black Copper Ores. Processes 2023, 12, 13. [Google Scholar] [CrossRef] [Scilit]
- Xiao, F.; Luo, Z.; Peng, Y.; Luo, X.; Yan, Y.; Sun, S.; Tu, G. Leaching Kinetics of Cu from Low-Grade Oxidized Copper Ore with High Alkalinity Gangue Using EDTA·2Na Solution. JOM 2024, 76, 7023–7033. [Google Scholar] [CrossRef] [Scilit]
- Yang, B.H.; Wu, A.X.; Wang, C.L.; Niu, W.-X.; Liu, J.-Z. Three-dimensional simulation of pore scale fluid flow in granular ore media with realistic geometry. Transctions Nonferrous Met. Soc. China 2012, 22, 3081–3086. [Google Scholar] [CrossRef] [Scilit]
- Wang, H.; Wang, X.J.; Wang, Y.; Wang, D.; Hu, K.; Zhong, W.; Guo, Z. Influence of ammonium sulfate leaching agent on engineering properties of weathered crust elution-deposited rare earth ore. Acta Geotech. 2024, 19, 2041–2062. [Google Scholar] [CrossRef] [Scilit]
- Yang, Z.; Ding, H.; Guo, L.; Lian, M. Superpixel image segmentation-based particle size distribution analysis of fragmented rock. IEEE Access 2021, 9, 59048–59058. [Google Scholar] [CrossRef] [Scilit]
- Ansah, E.O.; Black, J.R.; Haese, R.R. Impact of Mineral Dissolution-Precipitation on Pore Geometry during Copper Sulphide Heap Leaching. Miner. Eng. 2025, 230, 109379. [Google Scholar] [CrossRef] [Scilit]
- Chen, W.; Tang, H.Y.; Yin, S.H. Study on Migration and Adhesion of Fine Particles in the Pores of a Heap Leaching System. Chin. J. Eng. 2024, 46, 994–1003. [Google Scholar]
- Ortega-Tong, P.; Jamieson, J.; Kuhar, L.; Faulkner, L.; Prommer, H. In Situ Recovery of Copper: Identifying Mineralogical Controls via Model-Based Analysis of Multistage Column Leach Experiments. ACS ES&T Eng. 2023, 3, 773–786. [Google Scholar] [CrossRef] [Scilit]
- Faraji, F.; Alizadeh, A.; Rashchi, F.; Mostoufi, N. Kinetics of leaching: A review. Rev. Chem. Eng. 2022, 38, 113–148. [Google Scholar] [CrossRef] [Scilit]
- Prasetya, A.; Putera, A.D.P.; Sujoto, V.S.H.; Zaidan, M.H.; Abdurrahman, M.T.; Andriani, A.; Astuti, W. Enhanced Recovery of Nickel and Cobalt from Limonitic Laterite Ore: Optimization and Kinetics of Atmospheric Sulfuric Acid Leaching. J. Sustain. Metall. 2025, 11, 4127–4140. [Google Scholar] [CrossRef] [Scilit]
- Yan, H.S.; Liang, T.M.; Liu, Q.S.; Qiu, T.S.; Ai, G.H. Compound leaching behavior and regularity of ionic rare earth ore. Poeder Technol. 2018, 333, 106–114. [Google Scholar] [CrossRef] [Scilit]
- Luo, G.J.; Zhang, C.F.; Zhang, X.X.; Wang, W.J.; Chen, M.F.; Jia, M.T. Simulation of multiple parameter effects on efficiency of uranium ore acid leaching. Ann. N. Y. Acad. Sci. 2025, 1549, 332–342. [Google Scholar] [CrossRef] [Scilit] [PubMed]
- Ilankoon, I.M.S.K.; Neethling, S.J. Liquid spread mechanisms in packed beds and heaps. The separation of length and time scales due to particle porosity. Miner. Eng. 2016, 86, 130–139. [Google Scholar] [CrossRef] [Scilit]
- Prasomsri, J.; Takahashi, A. Experimental study on suffusion under multiple seepages and its impact on undrained mechanical responses of gap-graded soil. Soils Found. 2021, 61, 1660–1680. [Google Scholar] [CrossRef] [Scilit]
- Song, J.Y.; Sun, B.; Zeng, S.; Li, D.; Cai, Q.E.; Zhang, X.; Chen, X.G. Seepage starting pressure gradient of leaching solution under microscopic pore structure evolution of uranium-bearing sandstone by acid in situ leaching. Phys. Fluids 2025, 37, 063102. [Google Scholar] [CrossRef] [Scilit]
- Liu, D.F.; Yan, W.X.; Zhang, Z.Y.; Chi, R. Effect of particle gradation on pore structure and seepage law of solution in weathered crust elution-deposited rare earth ores. Int. J. Min. Sci. Technol. 2023, 33, 1261–1272. [Google Scholar] [CrossRef] [Scilit]
- Loizeau, S.; Rossier, Y.; Gaudet, J.P.; Refloch, A.; Besnard, K.; Angulo-Jaramillo, R.; Lassabatere, L. Water infiltration in an aquifer recharge basin affected by temperature and air entrapment. J. Hydrol. Hydromech. 2017, 65, 222–233. [Google Scholar] [CrossRef] [Scilit]
- Ma, R.; Liu, C.; Greskowiak, J.; Prommer, H.; Zachara, J.; Zheng, C. Influence of calcite on uranium (VI) reactive transport in the groundwater-river mixing zone. J. Contam. Hydrol. 2014, 156, 27–37. [Google Scholar] [CrossRef] [Scilit] [PubMed]
- Dangelmayr, M.A.; Reimus, P.W.; Wasserman, N.L.; Punsal, J.J.; Johnson, R.H.; Clay, J.T.; Stone, J.J. Laboratory column experiments and transport modeling to evaluate retardation of uranium in an aquifer downgradient of a uranium in-situ recovery site. Appl. Geochem. 2017, 80, 1–13. [Google Scholar] [CrossRef] [Scilit]
- Thompson, A.R.; Stotler, R.L.; Macpherson, G.L.; Liu, G. Laboratory Study of Low-Flow Rates on Clogging Processes for Application to Small-Diameter Injection Wells. Water Resour. Manag. 2015, 29, 5171–5184. [Google Scholar] [CrossRef] [Scilit]
- Wang, Z.J.; Du, X.Q.; Yang, Y.S.; Ye, X. Surface clogging process modeling of suspended solids during urban stormwater aquifer recharge. J. Environ. Sci. 2012, 24, 1418–1424. [Google Scholar] [CrossRef] [Scilit] [PubMed]
- Benavente, J.; García-Aróstegui, J.L.; Goycoechea, H.S. Estimation of mineral saturation and CO2 partial pressure in natural waters using electrical conductivity and pH. J. Hydrol. 2025, 660, 133474. [Google Scholar] [CrossRef] [Scilit]
- Liu, K.; Gan, D.; Xue, Z. Analysis of pore structure evolution and leaching effectiveness in ore granular materials during stope leaching. Metals 2026, 16, 327. [Google Scholar] [CrossRef] [Scilit]

Disclaimer/Publisher’s Note: The statements, opinions and data contained in all publications are solely those of the individual author(s) and contributor(s) and not of MDPI and/or the editor(s). MDPI and/or the editor(s) disclaim responsibility for any injury to people or property resulting from any ideas, methods, instructions or products referred to in the content. |
© 2026 by the authors. Licensee MDPI, Basel, Switzerland. This article is an open access article distributed under the terms and conditions of the Creative Commons Attribution (CC BY) license.