


Abstract
Empirical approaches alone have significant limitations for accurate estimation of the fracture toughness of welds in gas line pipes being considered for repurposing to hydrogen service. These problems arise because most samples machined from ex-service welds contain a range of microstructures. The different microstructural zones have different properties and even when compact tension samples with side grooves are utilized, it is unlikely that plane strain conditions are achieved during laboratory testing. Thus, the measured toughness may not be directly relevant to assessing in-service performance. The present research has been undertaken as part of an integrated series of projects seeking to define a robust protocol for assessing the damage tolerance of piping used for the transmission of hydrogen, especially when considering repurposing existing infrastructure. The key work described in this paper involved establishing heat treatments which produced microstructures relevant to the constituents found in ex-service welds of X46 type steel. Following comprehensive microstructural characterization, these heat treatments were applied to steel sections which allowed for the fabrication of standard compact tension specimens, which were subsequently tested in hydrogen to measure fracture toughness. The results obtained showed that the fracture behavior varied for different microstructures. To identify the influence that hydrogen gas has on the performance of pipeline steels, it is important to assess microstructures relevant to the welds present, as testing only on base metal may not provide conservative information. However, the results from well-planned and carefully executed programs can be used to identify the relative performance in hydrogen. The data can also be used as critical input to models which form part of an integrated approach to structural integrity assessment.
1. Introduction
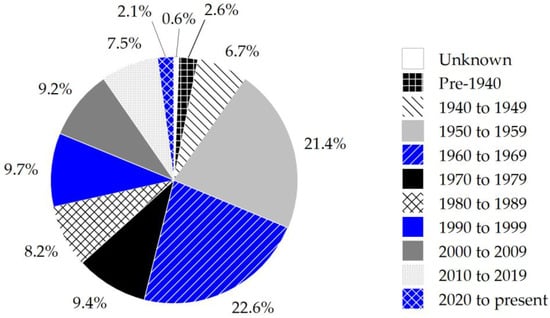
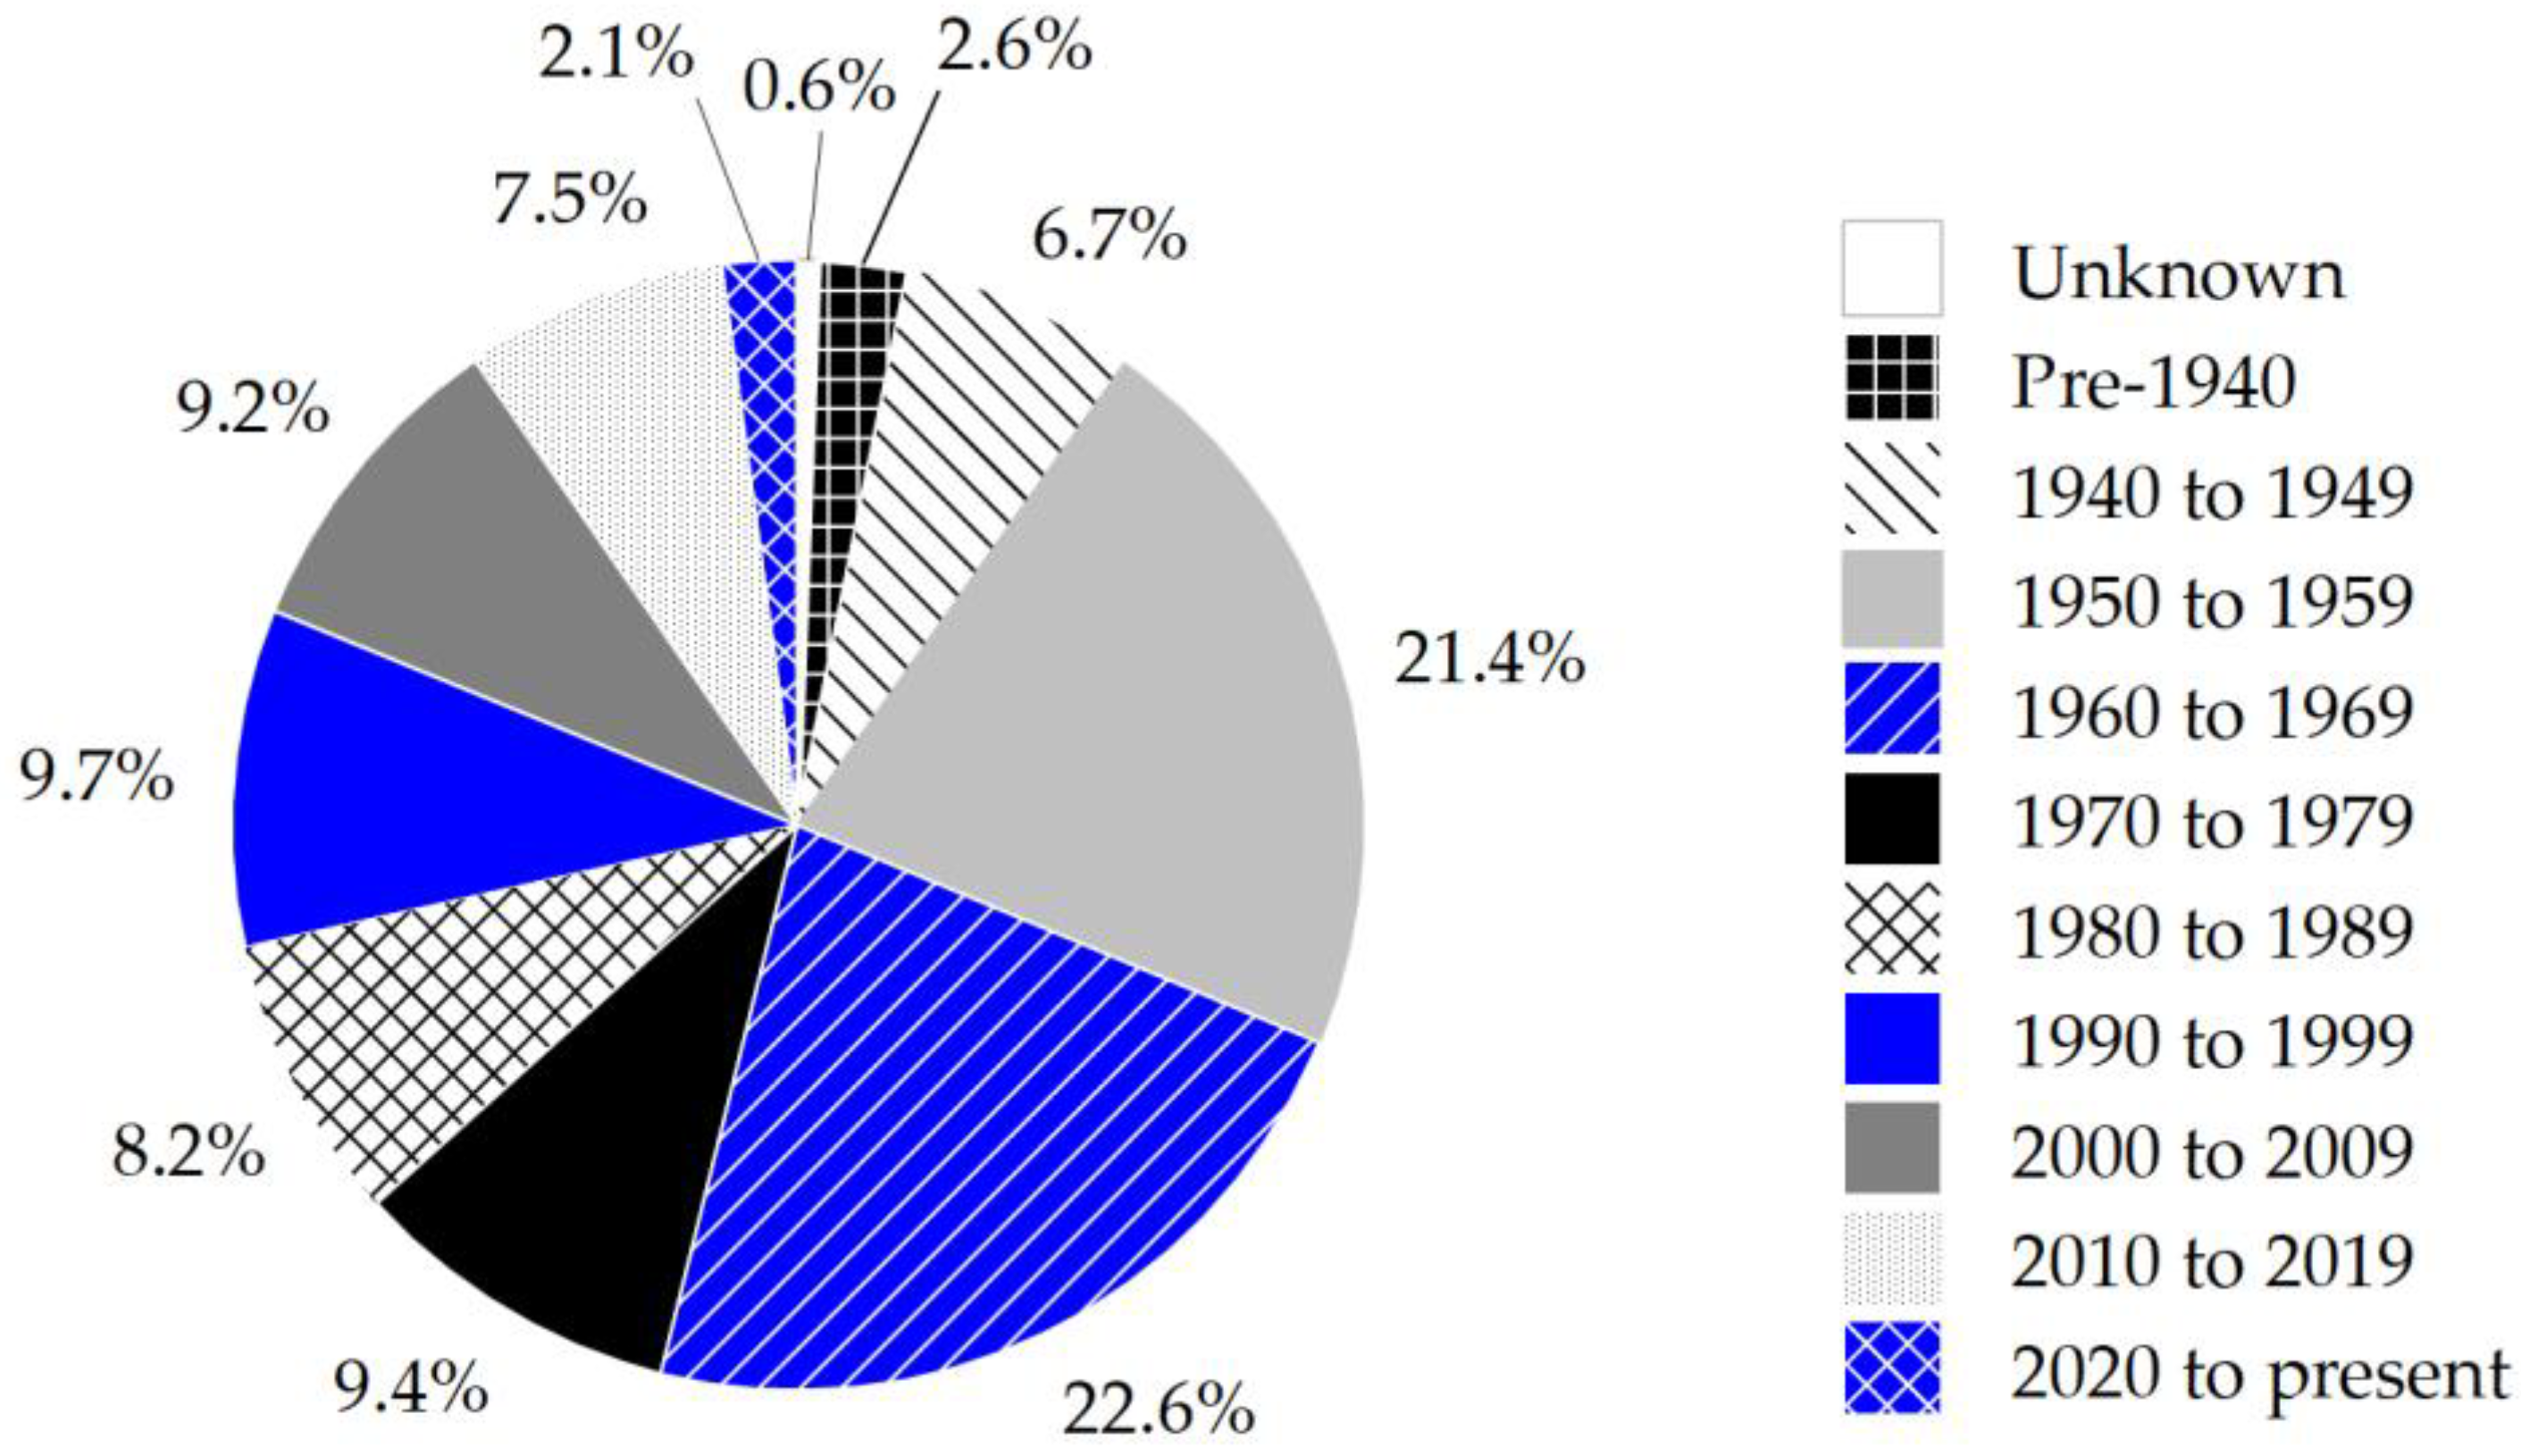
In decarbonizing the energy system, there has been significant interest in pursuing hydrogen (H2) as a low carbon fuel. Currently, proposed applications for hydrogen include direct use as a fuel, either in pure form, or blended into natural gas (NG) supply, as well as an option for long-term energy storage. However, the ability to take advantage of these options requires safe, reliable, and efficient transport of vast quantities of hydrogen. As such, many countries and organizations [1,2,3,4] are examining the feasibility of repurposing existing transmission pipeline networks to efficiently and economically convey large volumes of hydrogen over relatively long distances. Service experience reveals that existing pipelines have experienced failures, even in natural gas service. Since exposure to hydrogen has been shown to have detrimental effects on the fracture properties of commonly used pipeline materials, the required engineering assessment to justify safe operation is complex [5,6]. This is particularly the case in the United States (US) where more than 50% of the current gas transmission pipelines were designed and installed before 1970, with about 10% of the 483,000 km (300,000 miles) of existing pipeline being installed before 1950, as shown in Figure 1 [7]. The age of the line pipe introduces the challenge of establishing the engineering risks associated with repurposing pipes for hydrogen service when details of the original systems may be incomplete or inadequate. Moreover, transmission pipelines in the US are predominately seam welded so meaningful engineering assessments must be capable of evaluating the risks associated with seam and girth welds.
Figure 1.
Decade of installation for the existing 483,000 km (300,000 miles) of high-pressure natural gas transmission pipelines in the US (as of March 2025). Adapted from Ref. [7].
Vintage pipeline steels manufactured before 1970 have been shown to exhibit greater variability in base metal microstructures and mechanical properties than typically achieved using modern methods, due in part to the steel-making practices that were used at the time [8]. Furthermore, the fabrication processes used during original manufacture produced welds with a higher number of flaws and defects than welds made using modern best practices [9,10]. Vintage welds often contain locally hard microstructures, especially in the weld heat-affected zones (HAZs) of electric resistance welded (ERW) and flash welded seams. The levels of hardness measured in these ex-service welds have been shown to exceed 350 HV [11]. This is a cause for concern when considering operation in hydrogen gas because experience suggests that susceptibility of steel to hydrogen embrittlement increases with increasing tensile strength [12,13,14]. As such, to minimize the risk of embrittlement, current codes and standards recommend the use of lower strength steel grades (i.e., ≤X52) for gaseous hydrogen pipeline service [15,16].
Pipeline steels are primarily manufactured in accordance with API Specification 5L: Line Pipe [17], where the specific grade designation is based on minimum yield properties, such that X46 grade steel, which is the subject of this paper, has a minimum yield strength of 46 ksi or 317 MPa. For vintage steels, earlier editions of API 5L provided no upper limit on tensile properties of the specific grades; consequently, steels within the same grade designation may exhibit large variations in mechanical properties and metallurgical characteristics, which could lead to variable fracture behavior in gaseous hydrogen service. Furthermore, as the strength of vintage steels was primarily achieved through carbon additions, the resulting weld and HAZ microstructures can contain a complex mixture of transformation products with different mechanical properties, which are dictated by steel composition and details of the weld thermal cycle(s). These microstructural complexities, coupled with the different weld geometries used in seam and girth welds, suggest that ascertaining the performance of vintage components in hydrogen is not straightforward.
It should be emphasized that when assessing the suitability of a pipeline for hydrogen service, the critical information needed is steel performance data in gaseous hydrogen. While previous studies [18,19,20] have compared specific properties (e.g., fracture toughness, tensile strength, elongation, etc.) between tests in air and hydrogen, the critical input to meaningful analysis is the value in hydrogen, not the ratio of the properties. For example, a steel that exhibits high fracture toughness in air, but experiences a reduction in more than 50% when tested in hydrogen may still be suitable for hydrogen service, provided its toughness in hydrogen is sufficient to minimize the risk of brittle fracture. In contrast, if steel with relatively low fracture toughness in air exhibits even a modest reduction (i.e., 25%) in fracture toughness in gaseous hydrogen, the risk of brittle fracture may increase to an unacceptable level.
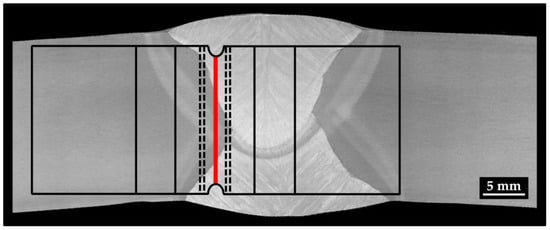
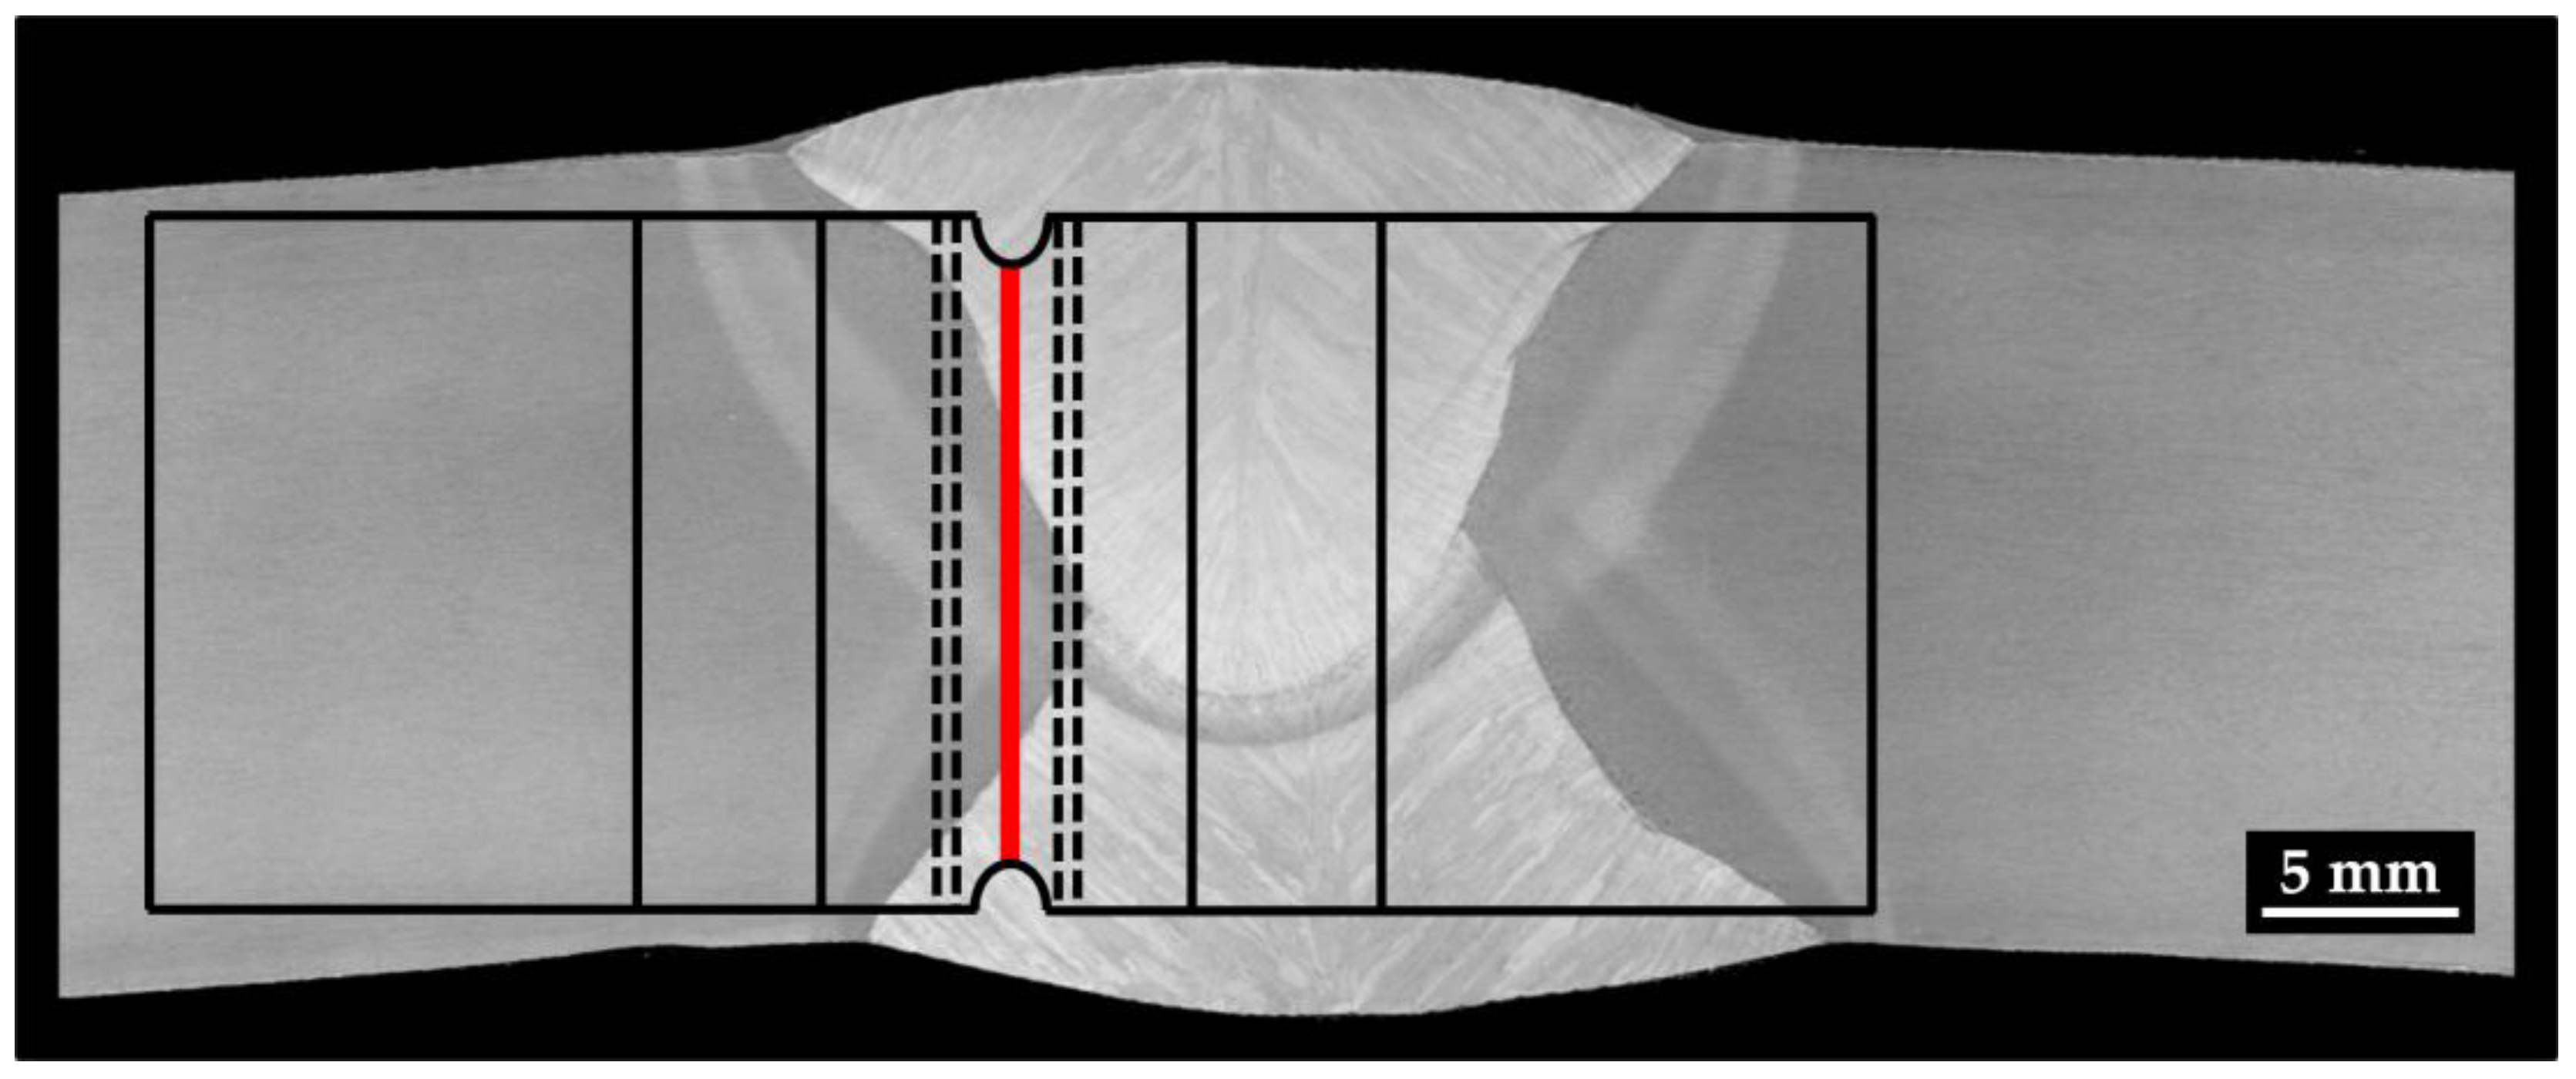
An additional problem arises because standard practices for testing to measure mechanical properties are usually developed for materials containing a uniform or homogeneous microstructure. Thus, these methods are most accurate when assessing the base metal fracture behavior. However, when evaluating the in-service performance of line pipe steel in hydrogen service, it is by no means certain that base metal properties are representative of the “worst case”. Evaluating the performance of piping weldments in hydrogen is not straightforward. Often, attempts to establish fracture properties of weld HAZs are made by using standard compact tension (CT) specimens that contain a machined notch within the region that is deemed most representative of the HAZ [21]. Unfortunately, the notch will inevitably span across several microstructural zones, indicating that the measured fracture toughness is a composite value, as illustrated in Figure 2. Experience suggests that even in carbon steels, the different microstructures present will exhibit different properties so that the crack growth may not be constrained to the plane strain conditions required by standards. Thus, due to the microstructural heterogeneity and variability in properties in welds and HAZs, compliance with recommended testing approaches to produce valid data is difficult, if not impossible to achieve. As such, information relevant to the engineering analysis of a pipeline weld may not be obtained using this approach and therefore should be used with caution.
Figure 2.
Macroscopic image of a representative line pipe seam weld with the typical location of a CT fracture test sample overlaid. The location of the machined notch is shown in red.
The present paper examines the performance of vintage X46 pipeline steel in hydrogen, specifically regarding the influence of microstructure and hardness on fracture properties. To deconvolute the inherent challenges with testing as-welded specimens, the test program reported here involved using controlled heat treatments and cooling rates to produce microstructures typical of HAZ in vintage ERW long seams. Similar microstructures are also likely to be present in the HAZ of girth welds. In addition to describing the heat treatments performed, details are provided regarding the microstructures produced, the hardness and mechanical properties in air, and the fracture toughness behavior of these structures when tested in hydrogen gas. Post-test laboratory examination is used to document key information on the fracture surfaces produced for the different microstructural constituents, and the relevance of these results to the in-service performance of pipeline welds is discussed.
2. Material and Experimental Methods
2.1. Steel Examined
The material evaluated in this study was a section removed from an ex-service, X46 steel pipeline. The pipe, with a 508 mm (20-in.) outside diameter (OD) and 7.1 mm (0.280-in.) wall thickness, was manufactured in the 1940s using a low frequency ERW process to fabricate the weld seam. The steel composition is presented in Table 1, along with the compositional requirements for API 5L (46th Edition) PSL1 X46 pipe for comparison. As shown, the measured level of carbon, 0.26%, is at the maximum allowable limit for modern steels, but is typical for line pipe manufactured in the 1940s. The measured sulfur content is also near the maximum permissible limit for modern steels. To minimize the risk of sulfur embrittlement, it is generally advisable to ensure that the Mn:S ratio is at least 20. The high level of sulfur will be expected to result in high volume fractions of MnS inclusions. The reported level of phosphorus is higher than the maximum limit reported in API 5L 46th edition. This level of phosphorus likewise has the potential to introduce embrittlement to the steel. In general, the composition and the levels of the elements present are considered typical of steel making in the 1940s.
Table 1.
Measured composition of the pipe examined in the present study with the compositional requirements from API 5L (46 edition) PSL1 X46 given for comparison.
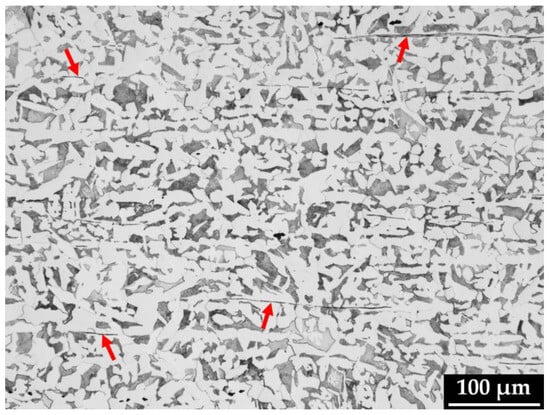
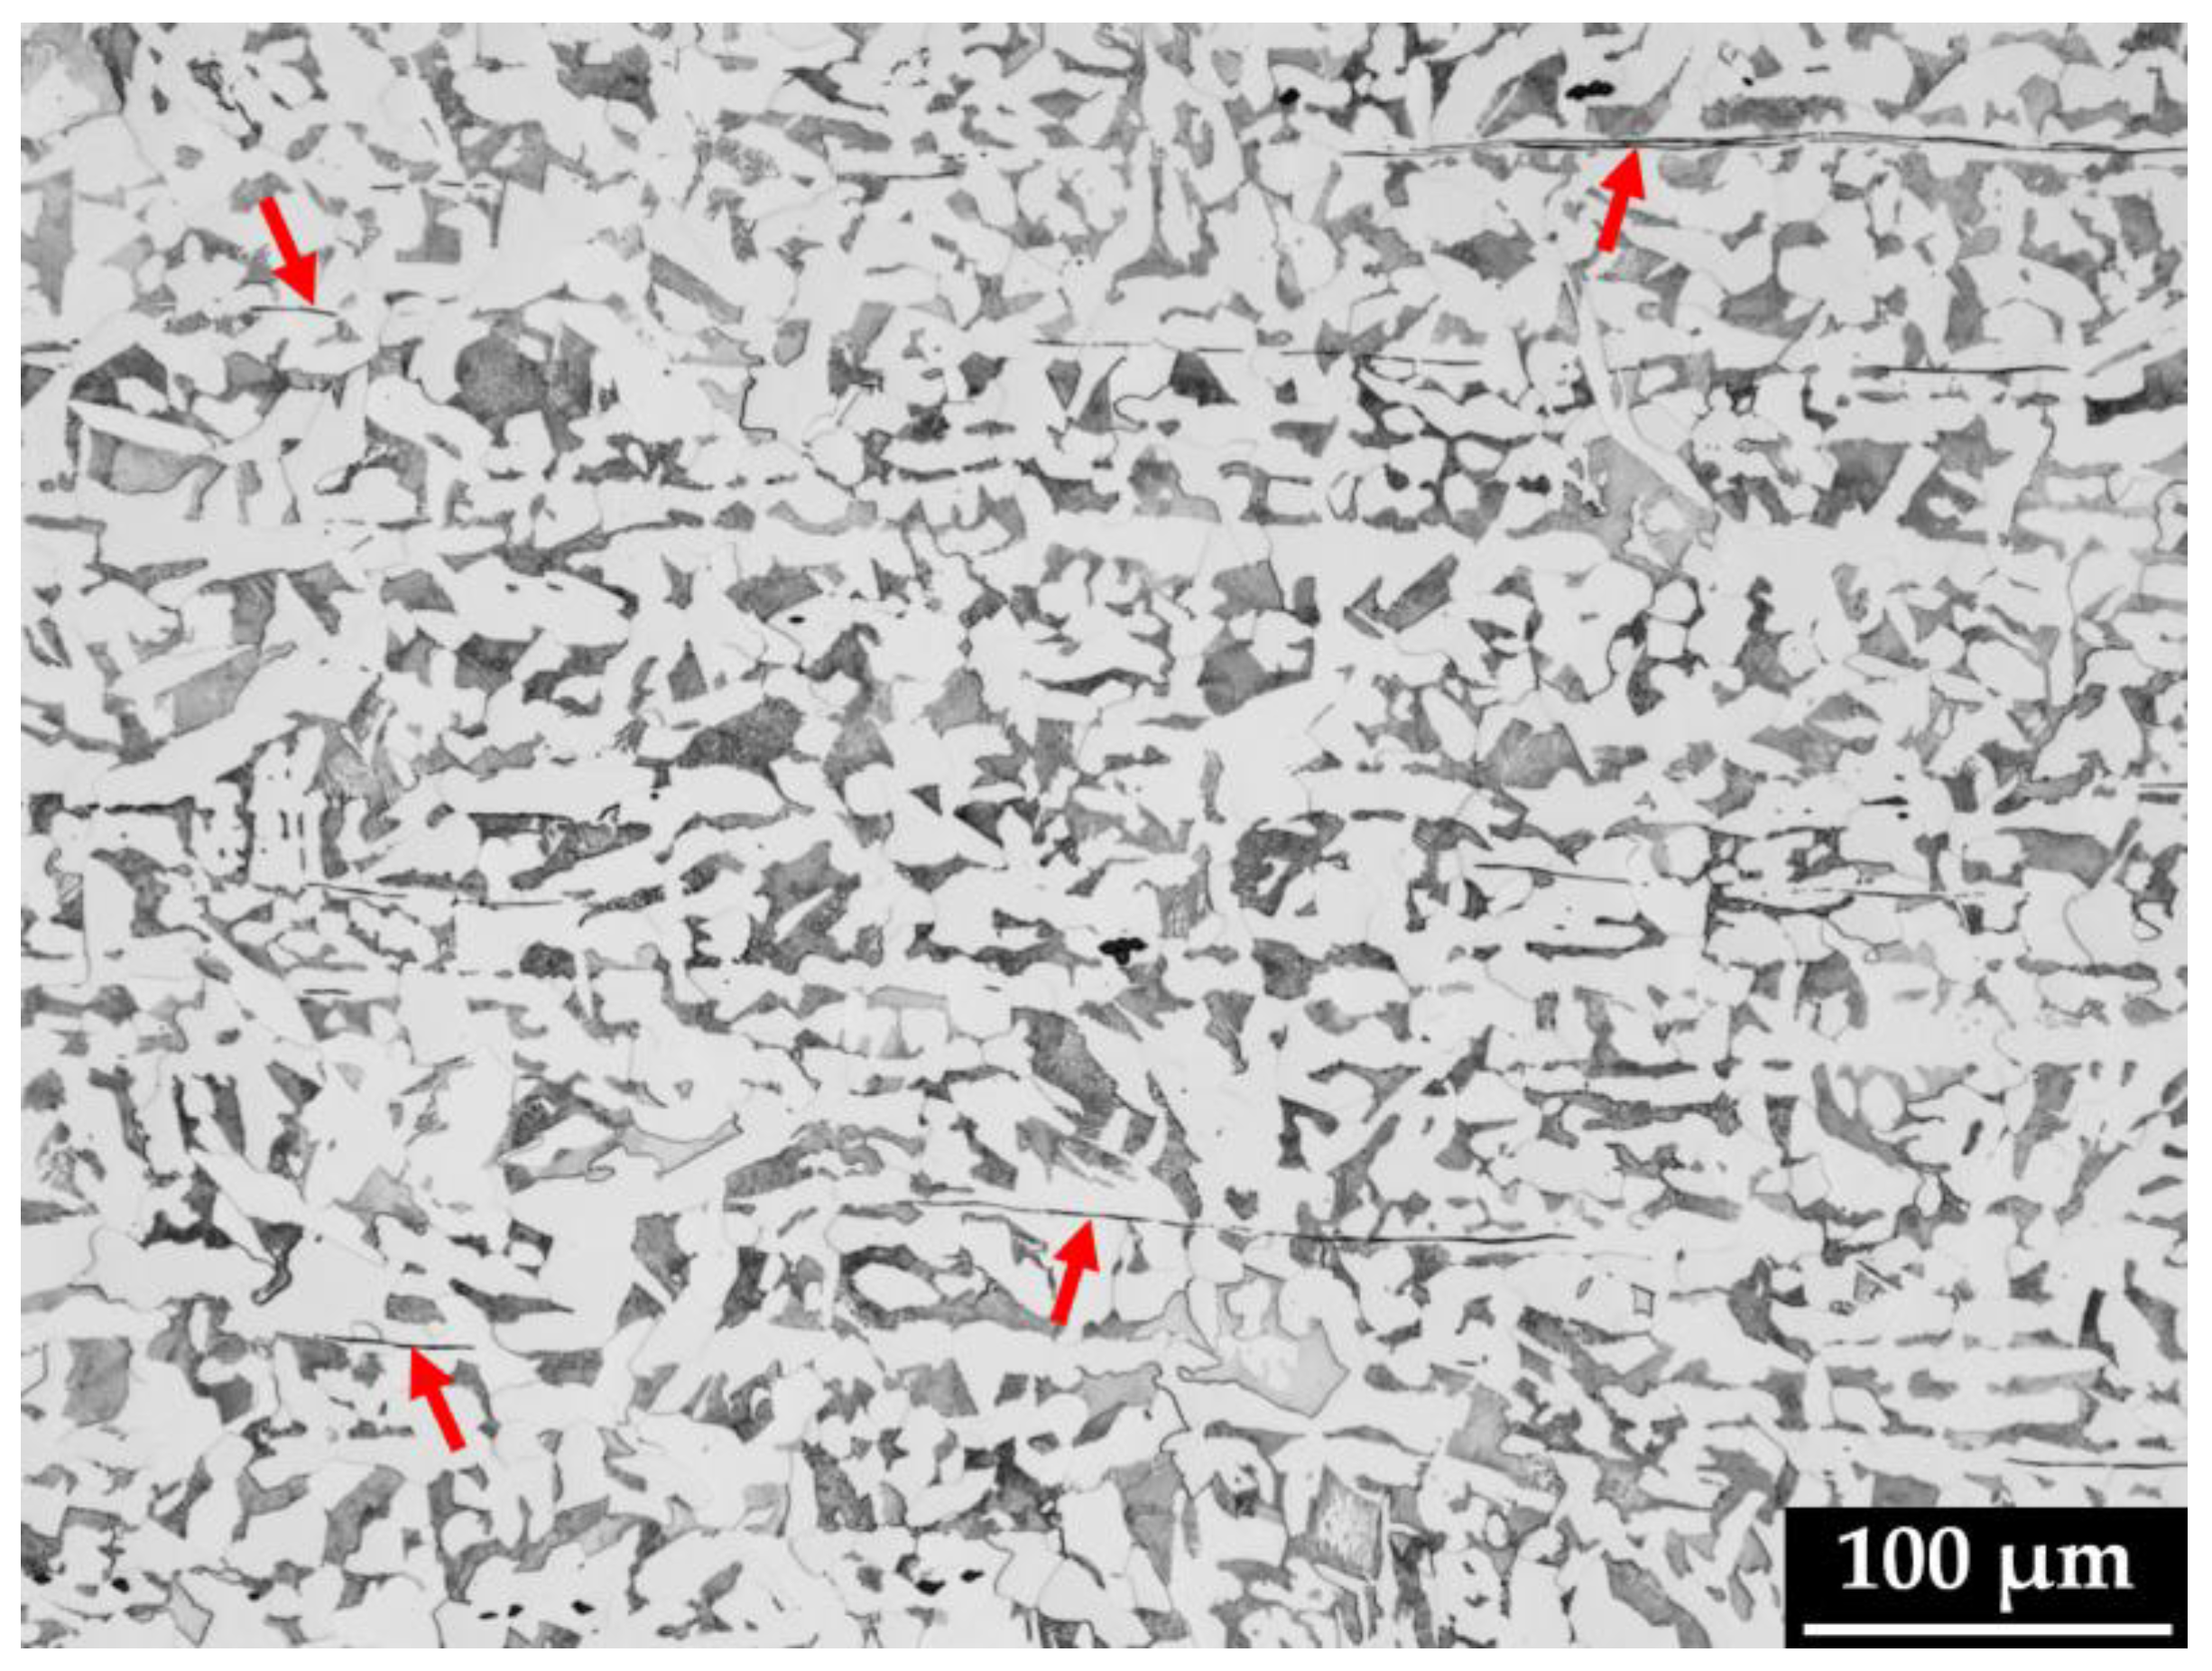
As expected, the base metal from this vintage line pipe exhibited a ferrite and pearlite microstructure, which is illustrated in Figure 3. The proportions of ferrite and pearlite were consistent throughout the pipe thickness with the ferrite fraction comprising about 70%. Consideration of Figure 3 also shows examples of the MnS inclusions, which were predominantly present as stringers. These stringers are elongated in the original rolling direction of the plate that was subsequently formed into a cylinder and seam welded to fabricate the pipe. Examples of these inclusion stringers in Figure 3 are identified by red arrows.
Figure 3.
Representative micrograph showing the ferrite–pearlite microstructure in a section taken parallel to the pipe axis in the base metal of the X46 pipe (etched in 2% nital). Red arrows highlight examples of MnS inclusions. Original magnification: 500X.
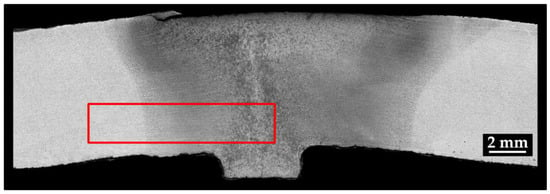
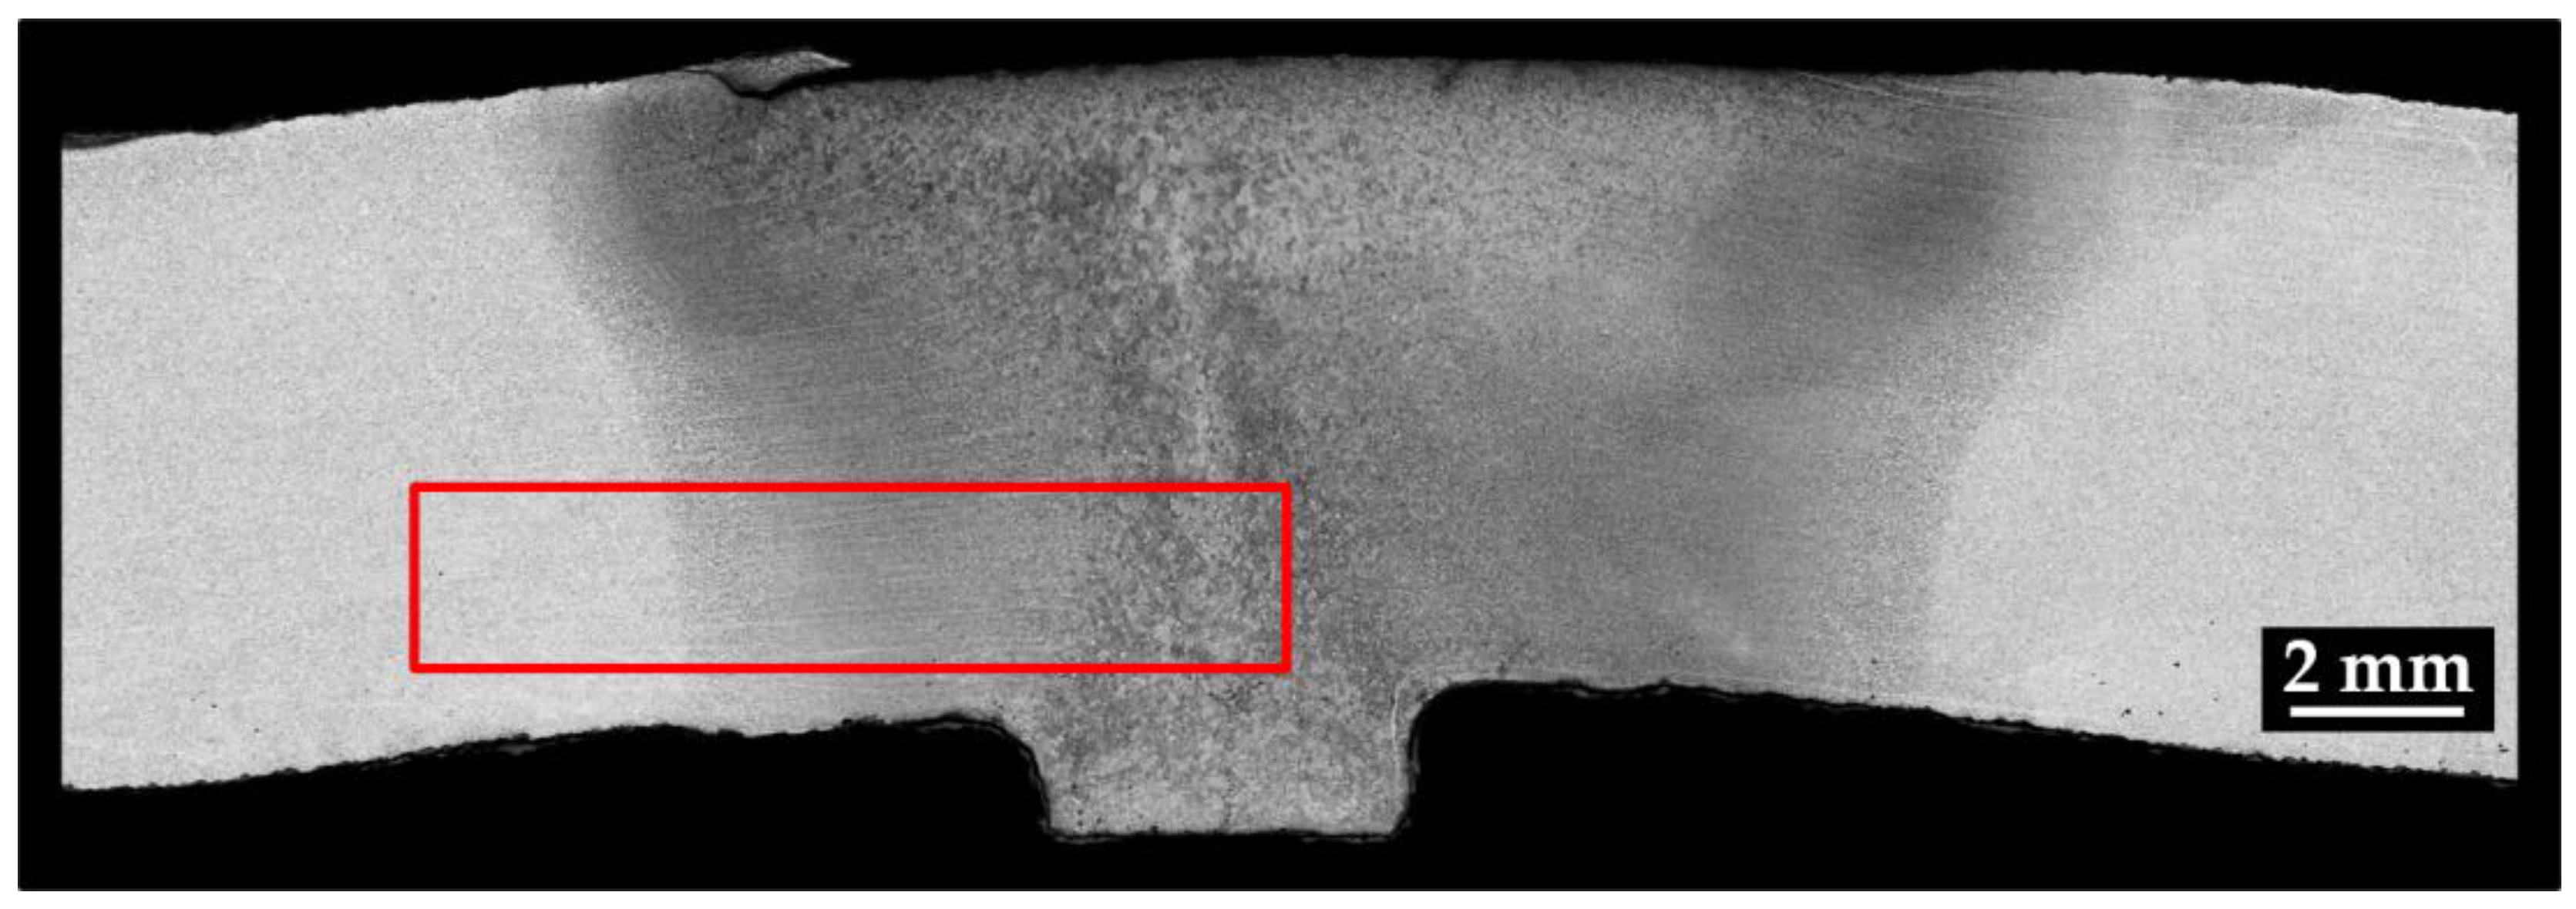
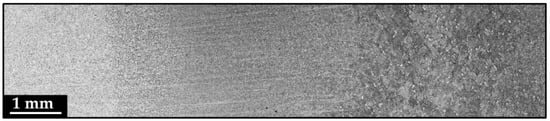
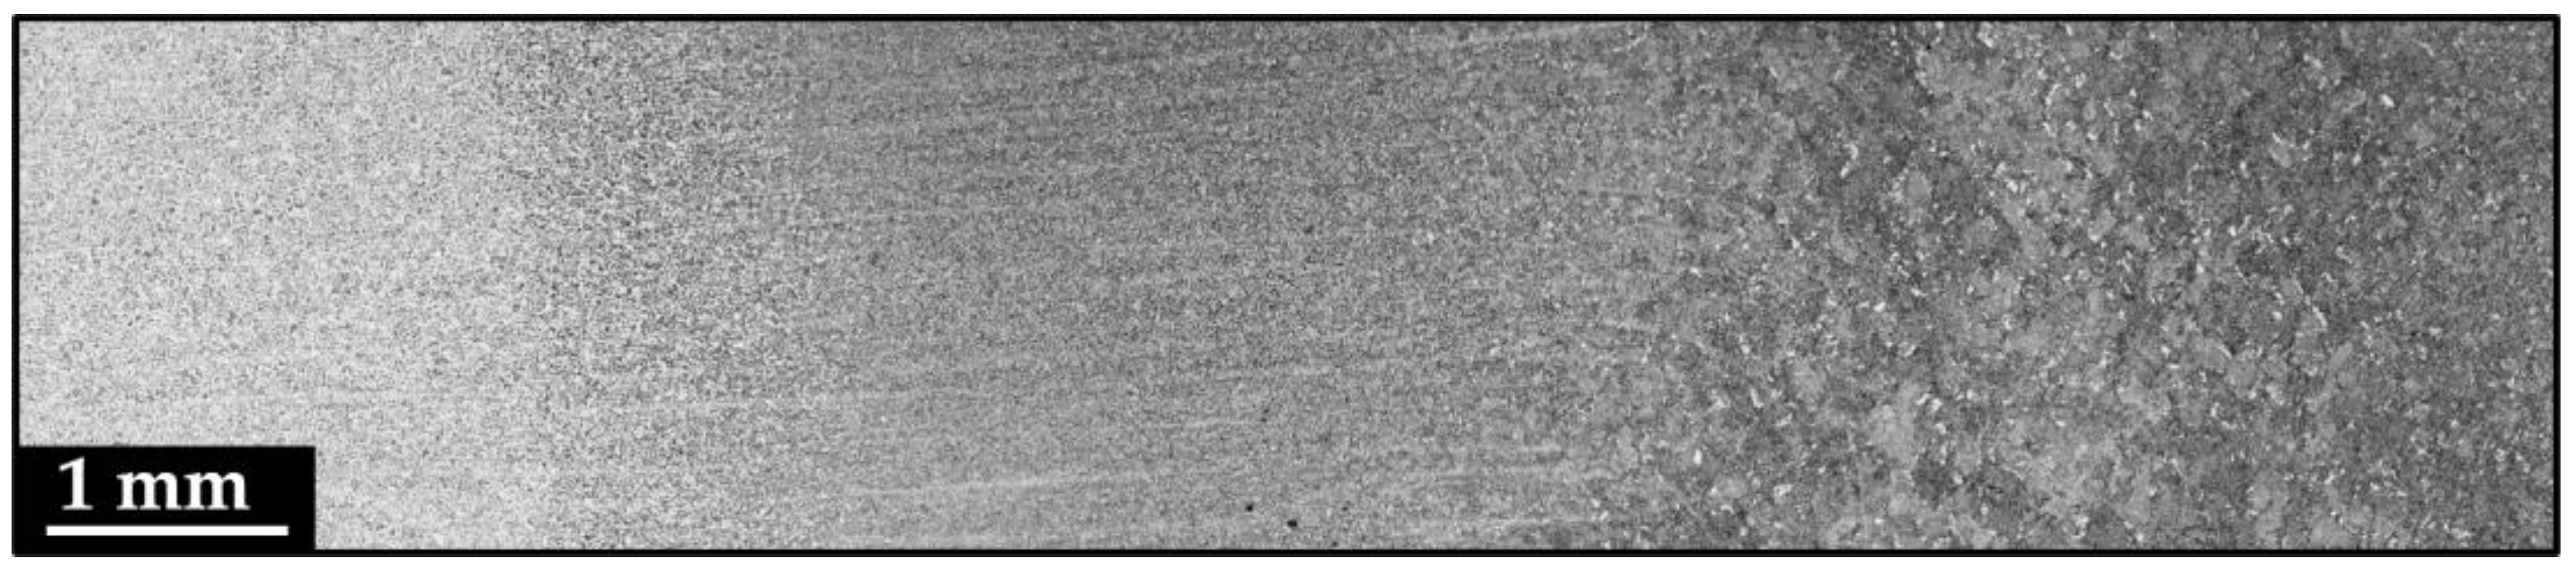
The weld and HAZ microstructures varied considerably from fine-grain ferrite and pearlite to coarse-grained, untempered martensite near the weld centerline. A macrophotograph of the weld is shown in Figure 4, with details from selected locations shown in Figure 5. Historically, ERW was selected for fabrication of longitudinal seam welds as it is a relatively simple method for manufacturing seam welded pipes. Typically, once the edges of the bent plate are in contact, a single heat cycle is applied. While the seam welding process is relatively simple, the resultant microstructure is complex, containing a range of microstructural phases and grain sizes, as indicated in Figure 4 and Figure 5.
Figure 4.
Macrophotograph showing the microstructural variations associated with the ERW seam weld, etched in 2% nital. The red rectangle represents the region shown below in Figure 5. Original magnification 100X stitched.
Figure 5.
Stitched optical micrographs showing how the microstructure changes from pearlite–ferrite in the base metal (left) to a coarse-grained, untempered martensite near the weld centerline (right). Original magnification: 100X stitched.
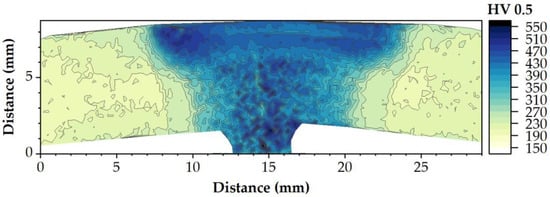
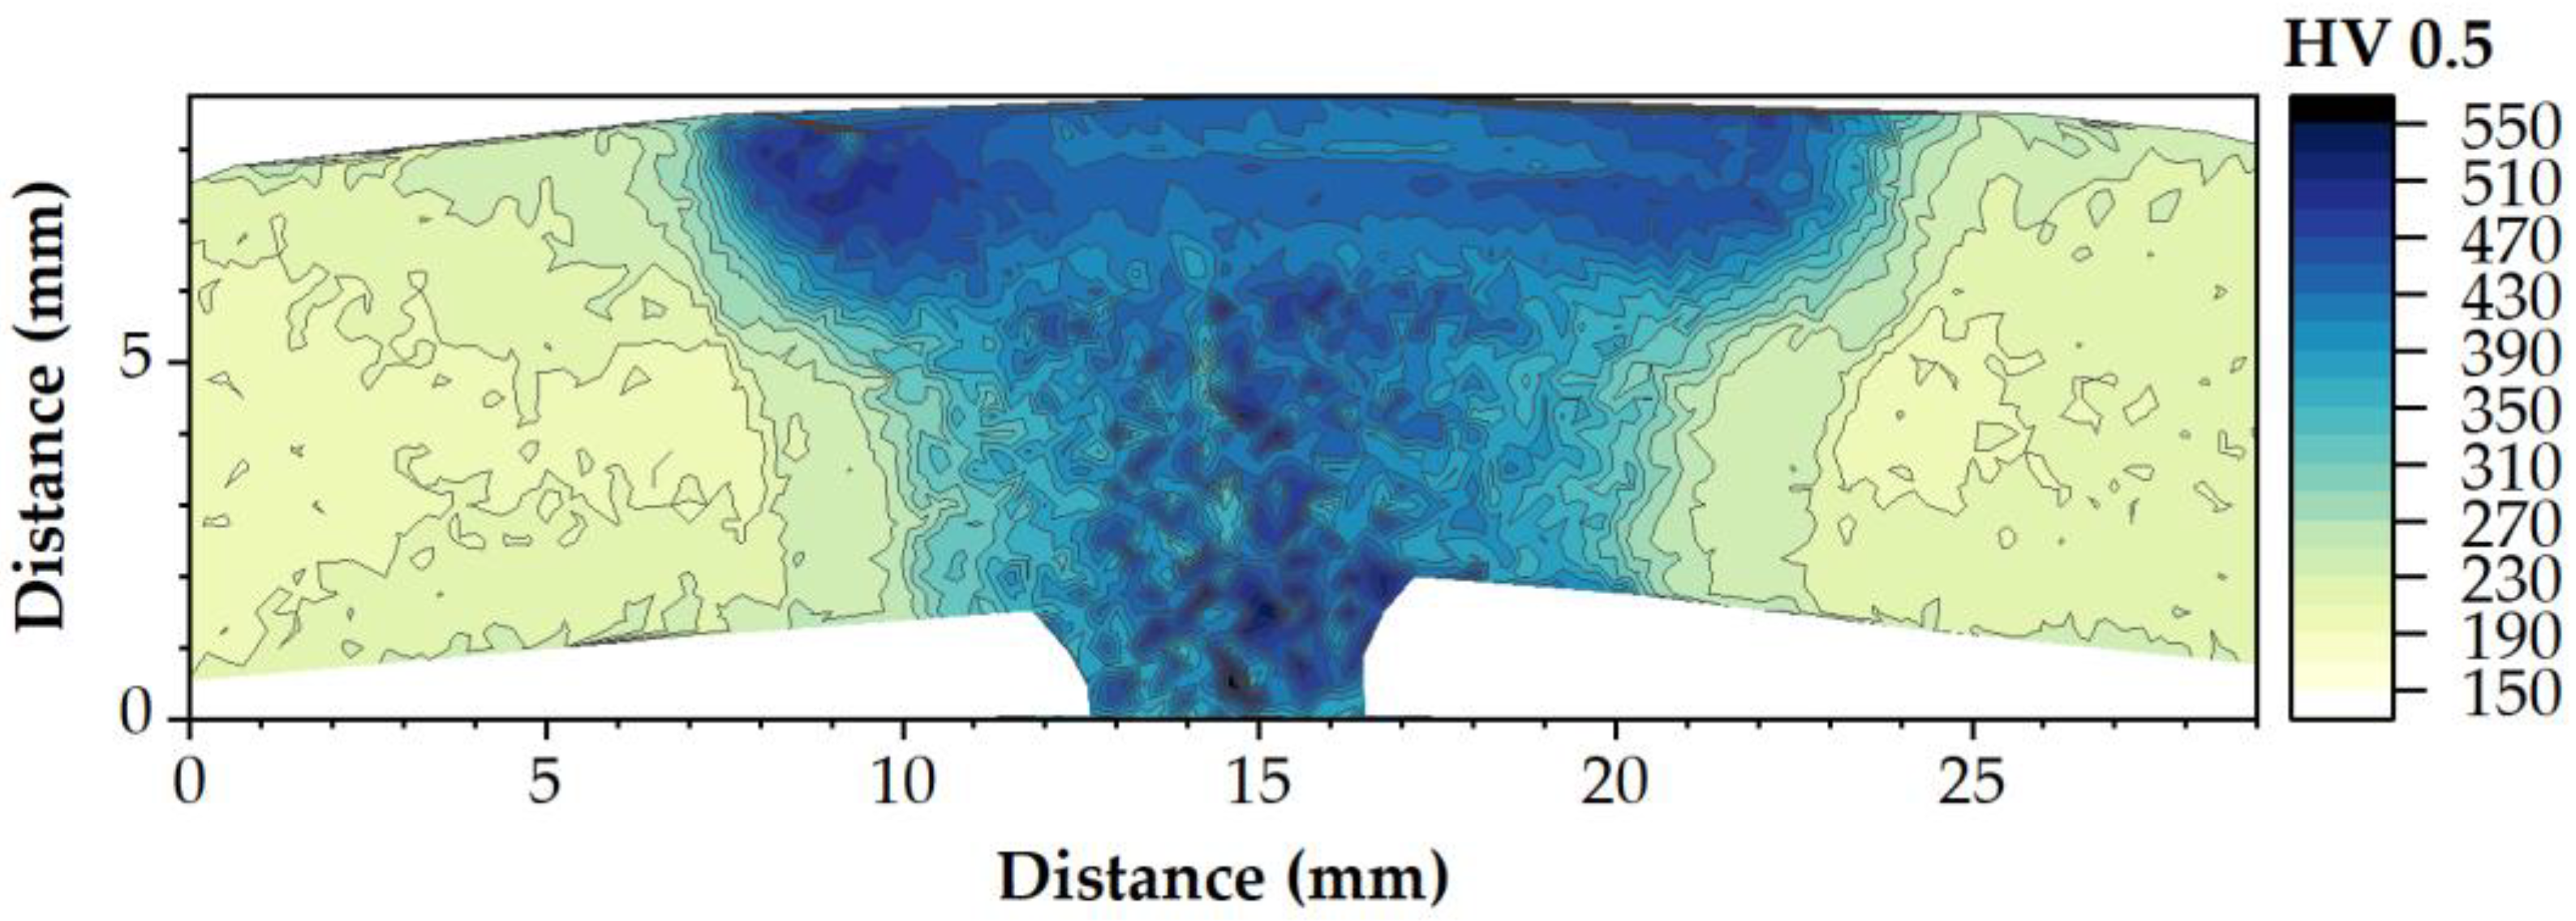
The average hardness of the base metal was measured to be approximately 200 HV0.5 near the weld seam and about 175 HV0.5 away from the weld. Detailed evidence of the complexity of the microstructures associated with the ERW seam was obtained by weld hardness mapping. A map showing the distribution of measured hardness values across the seam weld, presented in Figure 6, was created using a Vickers indentor with a test load of 0.5 kgf (HV0.5), a 13 s dwell time, and an indent-to-indent spacing of 250 µm. It is interesting to note that while lower grade steels such as X46 are generally recommended for hydrogen service to minimize the propensity for hydrogen embrittlement, the X46 seam weld evaluated in this study exhibited local hardness values that exceeded 500 HV0.5. The high hardness values were recorded at the inside diameter (ID) surface of the pipe near the weld centerline. The microstructure at these regions was primarily comprised of untempered martensite.
Figure 6.
Microhardness map taken across the section containing the ERW weld.
2.2. Heat Treatments to Produce Weld-Relevant Microstructures
In this study, the heat treatments were designed and selected to produce relatively large sections with uniform microstructures and mechanical properties that were representative of those observed in the HAZ and at the weld centerline of the as-fabricated pipe. As detailed in [11], the goal of the heat treatment study was to produce homogenous sections with the following characteristics:
- Two sections with hardness values near the upper limit stipulated in ASME B31.12 (2023) [15] for pipeline production welds in hydrogen service, but with very different microstructures and grain sizes.
- Two sections with typical hardness values similar to that of the base pipe and containing ferrite–pearlite microstructures, but with very different grain sizes. The intent of these sections was to assess whether grain size has any influence on fracture properties in gaseous hydrogen for relatively low strength steels.
- A very hard, coarse-grained material with a microstructure that is representative of that observed at and near the weld centerline of the vintage ERW seam displayed in Figure 4 and Figure 5. This section would be indicative of “worst case” and therefore can be used to establish a conservative lower-bound estimate of fracture toughness.
The heat treatments were performed on five sections of the base pipe, each measuring 9.0 cm × 16.5 cm × WT (3.5 in × 6.5 in × WT), to produce weld relevant microstructures. The section size was selected to allow for relatively large, homogenous samples to be produced with consistent mechanical properties and microstructural characteristics. Heat treatments were carried out at 900 °C (1652 °F) and 1200 °C (2192 °F) by placing the test sections in a large (0.5 m × 0.5 m × 0.5 m [20 in × 20 in × 20 in]), preheated box furnace to facilitate rapid heating of the blocks. Thermocouples were used to monitor the temperature of each test section during the thermal cycle; temperature measurements were made at half-second intervals until the section was cooled below 38 °C (100 °F) following heat treatment. Target temperatures, hold times, and cooling media for each heat treatment condition are presented in Table 2. Note that the air-cooling rates (T8/5) were less than 1.5 °C/s (2.7 °F/s), indicating that the sections were slowly cooled through the temperature range of 800 to 500 °C (1472 to 932 °F) to produce a ferrite–pearlite microstructure. Conversely, water quenching achieved cooling rates faster than 150 °C/s (270 °F/s), with the resultant microstructures consisting of non-equilibrium austenite decomposition products.
Table 2.
Heat treatment conditions used to produce weld relevant microstructures.
Following heat treatment, sections were removed from each test block and subjected to detailed characterization, which included the following:
- Optical microscopy to determine the microstructure and estimate the resulting grain size.
- Microhardness mapping to evaluate the through-thickness homogeneity and uniformity in mechanical properties.
- Room temperature tensile testing to establish the mechanical properties for each heat treatment condition. Tensile testing was conducted by a third-party service provider in accordance with ASTM E8 [22] using sub-sized specimens that were tested in the longitudinal direction. The sub-sized, dog-bone-shaped specimens had nominal cross-sectional dimensions of 6.35 mm × 6.35 mm (0.25 in × 0.25 in) and a gauge length of 25.4 mm (1.0 in). Testing was performed at a constant strain rate of 0.15 mm/mm/min.
- Fracture toughness testing in hydrogen to assess the influences that microstructure, grain size, and mechanical properties have on fracture behavior. This testing was carried out by a well-established third-party service laboratory located in the US; details of the fracture toughness tests are discussed below.
2.3. Fracture Toughness Testing of Samples with Weld-Relevant Microstructures
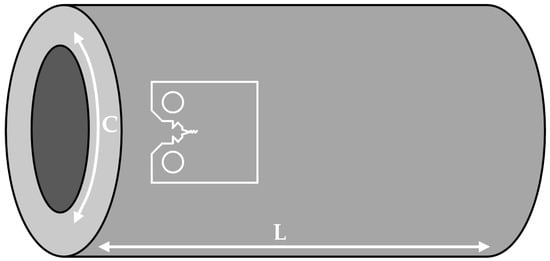
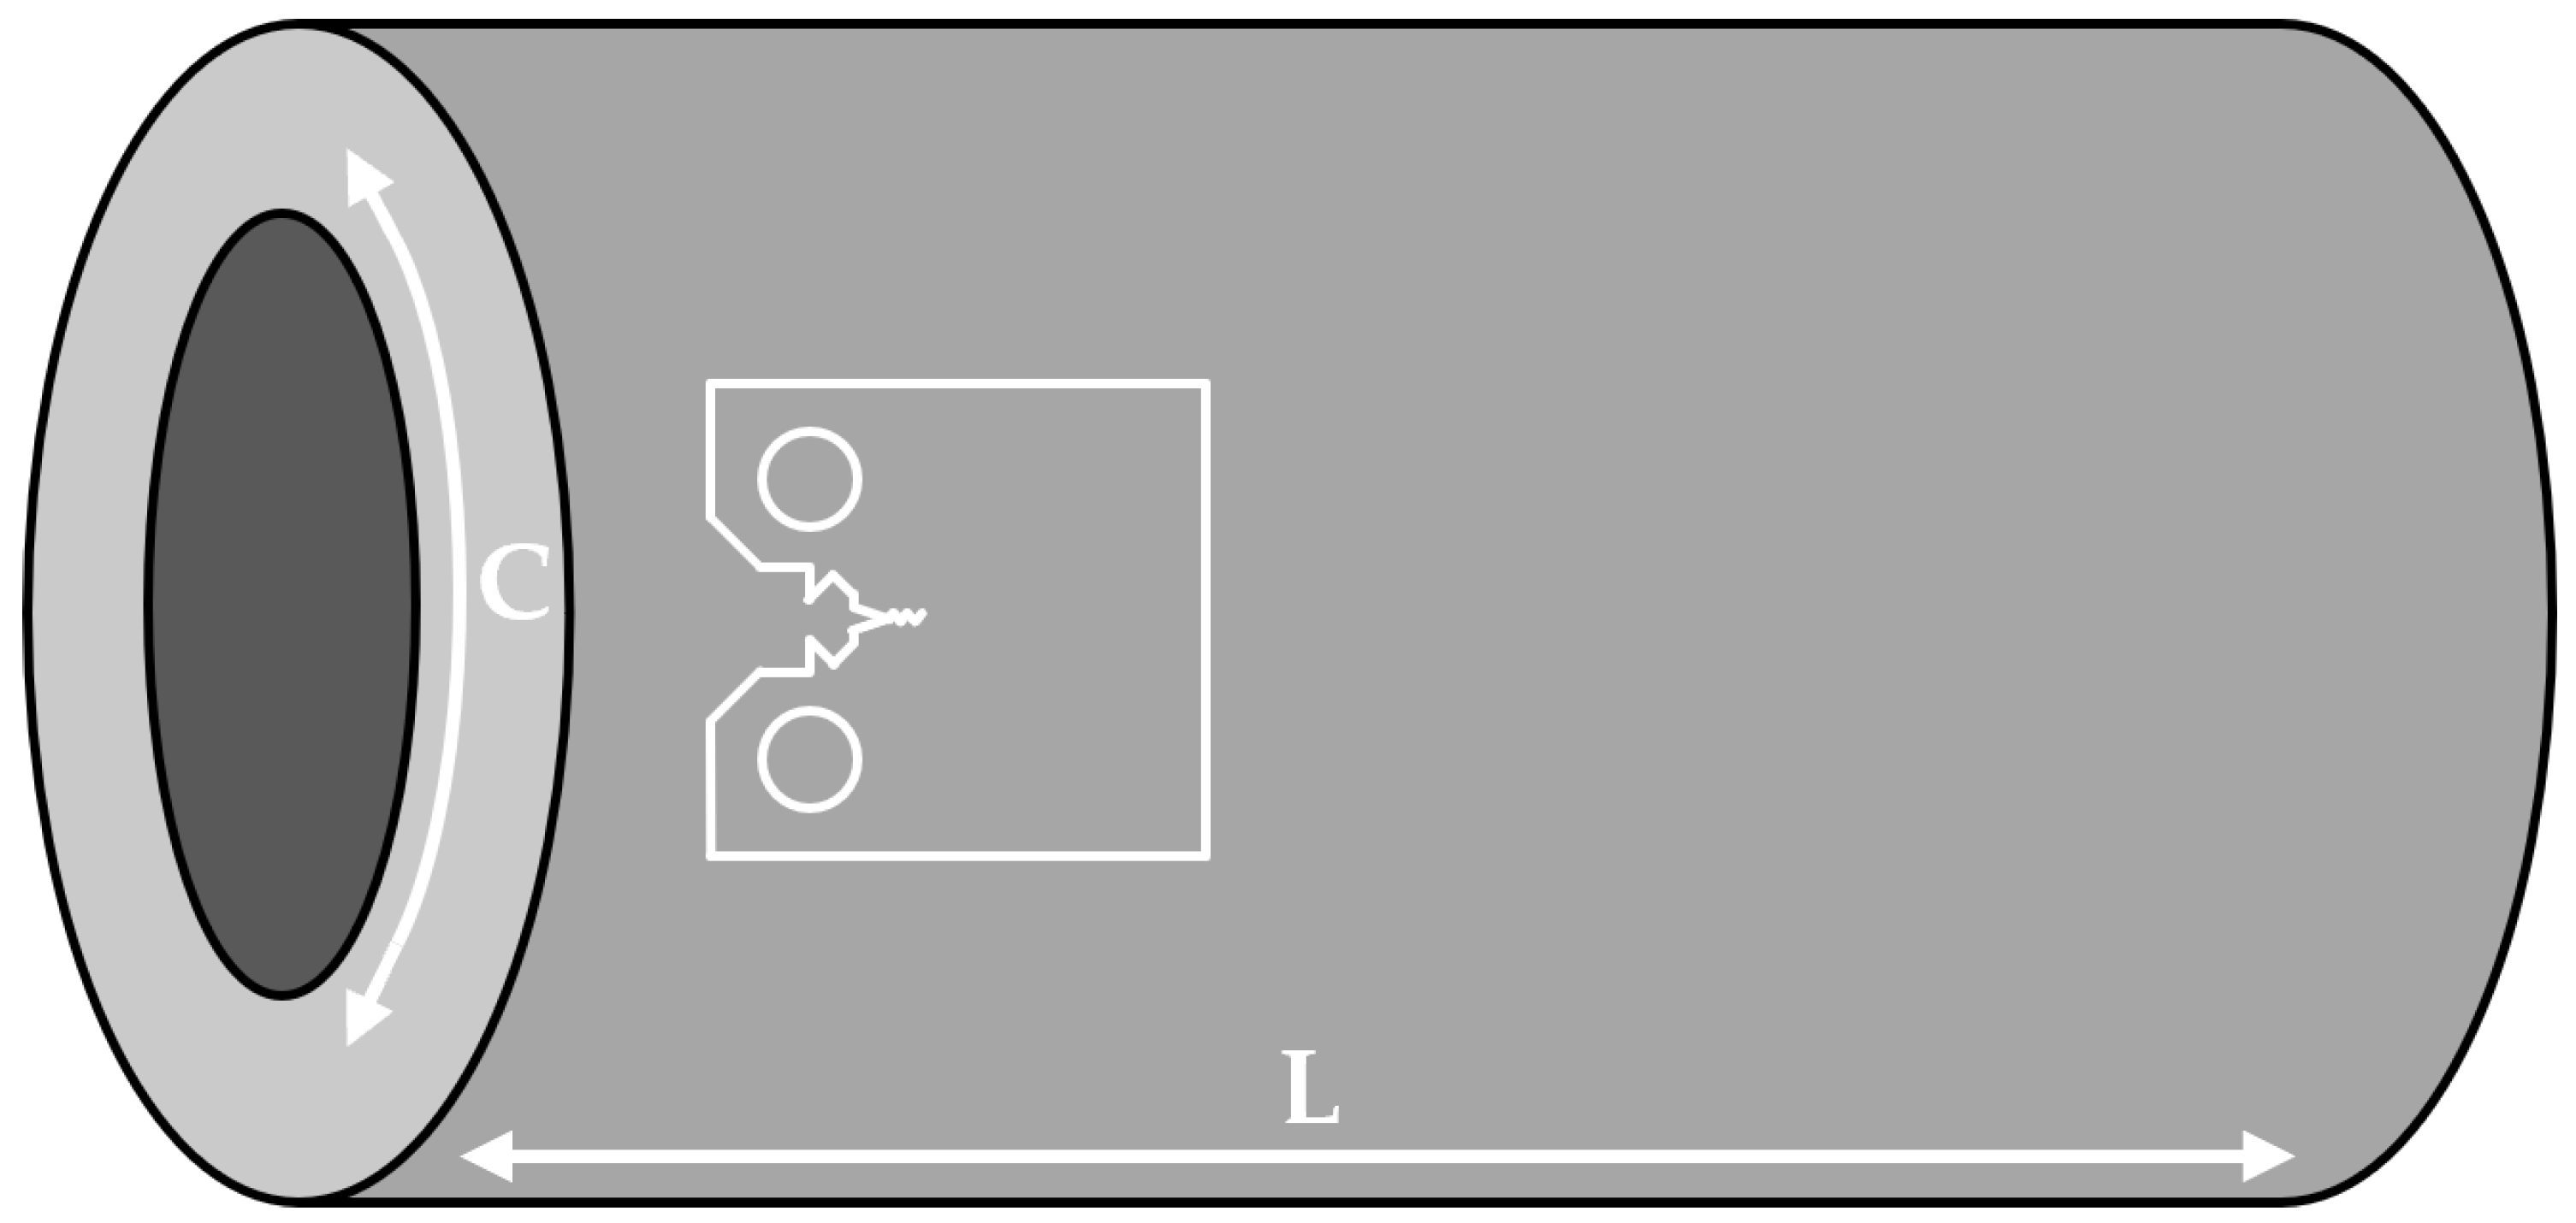
Fracture toughness testing was performed using CT specimens that were removed in the C-L orientation such that the crack propagation path was in the axial direction, as illustrated in Figure 7. Side grooves extending roughly 5% into the sample thickness were machined on each side to ensure that the crack propagation path remained in plane. Prior to testing in hydrogen, the samples were fatigue pre-cracked to a length of a0/W = ~0.50, where a0 is the length of the pre-crack (from the load line to the end of the fatigue pre-crack) and W is the width of the sample (from the load line to the end of the specimen).
Figure 7.
Schematic representation (not drawn to scale) showing the orientation (C-L) from which CT specimens were removed from the X46 pipeline steel.
Gaseous hydrogen testing was carried out in high-pressure autoclaves. Prior to testing, samples were loaded into the autoclave and pressurized with nitrogen gas to ensure that the system was leak tight. The system was then pressurized and purged multiple times with nitrogen to ensure any oxygen and moisture was removed from the autoclave. The system was then filled with pure hydrogen gas, and the same process was repeated multiple times, at which point the system was pressurized to the hydrogen gas test pressure. During each test, oxygen and moisture levels were maintained below 2 ppm and 10 ppm, respectively. Crack length was monitored using direct current potential drop (DCPD). Details of the purge and test procedures have been reported elsewhere [23].
To maximize the information obtained from each individual test in the present program, the aim was to undertake fatigue crack sharpening prior to a period of cyclic loading to measure fatigue crack growth rate. The loading was then paused and a second period of fatigue loading in air was performed to ensure that the defect present had a sharp crack tip. Fracture testing was performed in accordance with ASTM E1820 [24] using the rising displacement test method and DCPD. Analysis of the data was undertaken to calculate the variation in J–integral (fracture resistance) with crack extension (∆a), which was expressed as a J-R curve. As previous testing has shown that the fracture behavior in hydrogen is dependent on hydrogen gas pressure (or fugacity) [25], in the present work, all tests were performed at a hydrogen pressure of 6.9 MPa (1000 psig).
As indicated in ASTM E1820 [24], recorded values of J can be converted to K at specific crack extensions (i.e., 0.0 mm and 0.2 mm) through the following relationship:
where E is Young’s modulus (assumed to be 200 GPa), v is Poisson’s ratio (assumed to be 0.3), and J is measured in N/mm.
2.4. Post-Test Characterization Methods
It is frequently the case that the fracture toughness values recorded from individual tests are not evaluated with respect to the physical evidence present on the fracture surfaces. In the present work, comprehensive characterization of the post-test CT specimens was conducted using a multi-stage approach with in-house validated procedures. The fracture surface of each sample was initially analyzed using a Keyence VHX-7000 digital optical microscope (Keyence Corporation, Osaka, Japan). Three-dimensional (3D) optical stitched images of each fracture face were captured at 50X magnification, and a two-dimensional (2D) representation of the fracture face was used to document initial observations and evaluate each zone of the test specimens.
A procedure was developed for analyzing the critical locations within the fracture toughness region of the fracture face, namely at four locations, ∆a = 0.0, 0.2, 0.5, and 1.0 mm, where ∆a represents the change in crack length due to loading during testing. To properly visualize the planarity (or non-planarity) of the fatigue pre-crack and the fracture toughness region, the raw 3D data from the optical image was extracted using the Keyence software VHX3DExporter. Over 35 million datapoints were extracted from each sample with an X and Y resolution of 0.002 mm. The data were then converted from a matrix into X-Y-Z data that was plotted in a standard Z-height map and sliced at 0.1 mm intervals to collect individual profile lines. The new sub-dataset of 0.1 mm spaced profile lines was plotted as a 3D mesh and further analyzed.
After fractography was completed, metallurgical cross-sections were prepared in the longitudinal orientation for selected samples using standardized metallographic polishing procedures. Two-dimensional optical images were collected and used for comparison to the initial fractographic analysis.
3. Results and Discussion
3.1. Weld-Relevant Microstructures
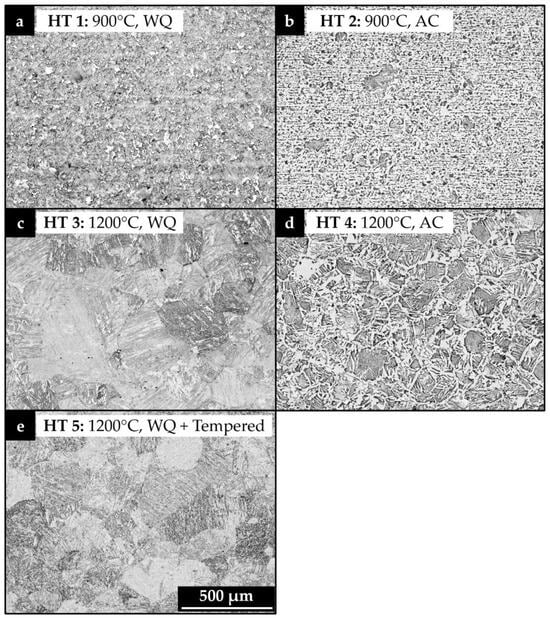
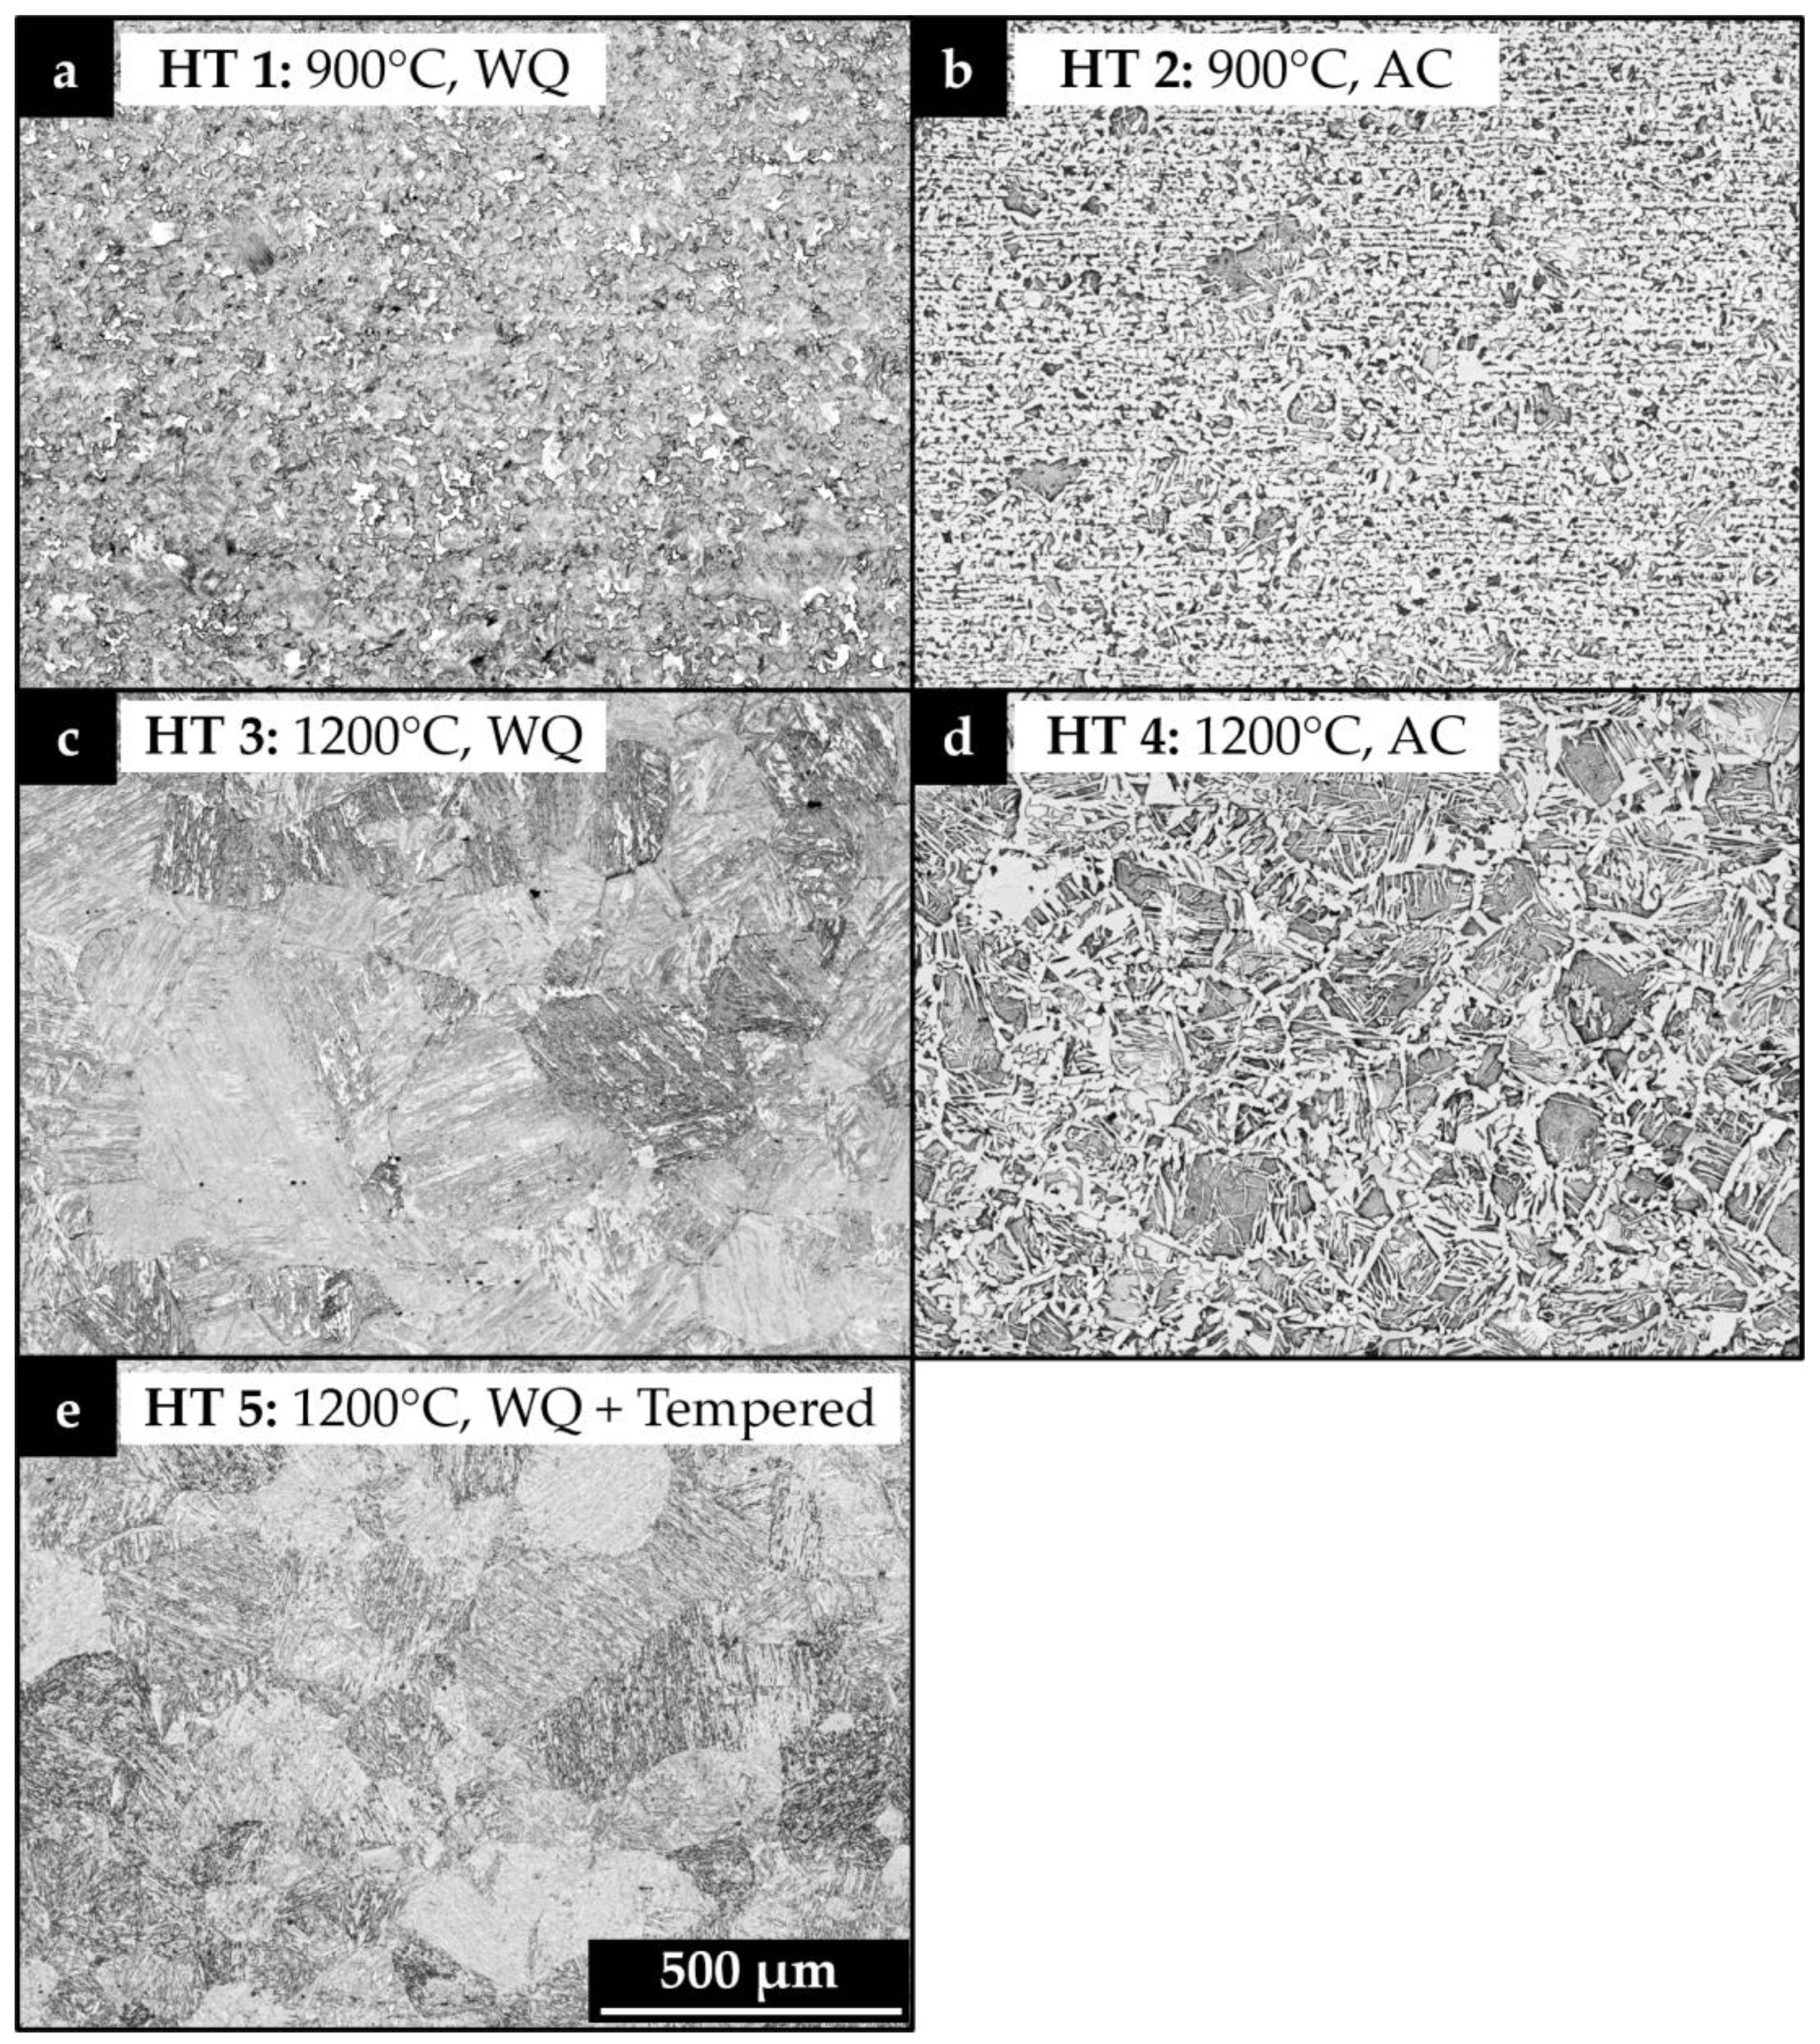
The images shown in Figure 8 are representative etched optical micrographs showing the resulting microstructures following the different thermal treatments. As indicated, the following microstructures were produced:
Figure 8.
Micrographs of the X46 base pipe after heat treatment to produce weld-relevant microstructures, etched in 2% nital. Note that the tempering treatment used as part of the heat treatment of sample HT 5 was 538 °C (1000 °F) for 60 min. Original magnification: 200X.
- HT 1: Austenitizing and water quenching from 900 °C (1652 °F) resulted in a fine-grain microstructure consisting primarily of ferrite, bainite, and localized regions of martensite. It appears that the relatively limited duration of the austenitizing treatment was insufficient to completely dissolve the pre-existing carbide structure which should have resulted in a predominately martensitic microstructure.
- HT 2: Air-cooling from 900 °C (1652 °F) yielded a fine-grain, ferrite–pearlite microstructure with about 70% ferrite. The resulting microstructure was consistent with the as-received base pipe microstructure.
- HT 3: Water quenching from 1200 °C (2192 °F) produced a coarse-grained, untempered martensite with a grain size and hardness comparable to what was observed at the weld centerline of the vintage ERW seam.
- HT 5: Water quenching from 1200 °C (2192 °F), then subsequent tempering at 538 °C (1000 °F) for 60 min, resulted in a microstructure consisting of coarse-grained tempered martensite.
3.2. Mechanical Properties
Room temperature tensile testing in air was performed by a qualified third-party service provider to quantify tensile properties. Two tensile specimens were tested for each section that was heat-treated to produce weld-relevant microstructures. For each microstructural condition, complimentary hardness mapping was also undertaken. The results obtained are summarized in Table 3. As expected from the range of microstructures detailed in Section 3.1, significant differences in mechanical properties were measured. The results obtained are summarized below; however, the order of specimens has been listed based on the recorded strength values (highest to lowest).
Table 3.
Summary of tensile properties, average hardness values, and estimated grain size for the heat treatments applied to the X46 pipeline steel.
- HT 3: Water quenching from 1200 °C (2192 °F) resulted in a fully martensitic microstructure with measured yield and tensile strengths of 1005 and 1380 MPa (145.8 and 200.1 ksi), respectively, and an average hardness of 464 (HV0.5). Unsurprisingly, this sample exhibited very low ductility with a reduction in area (RoA) of only 5.3%.
- HT 5: The initial heat treatment was the same as HT 3; however, this specimen was subsequently tempered at 538 °C (1000 °F) for 60 min. Tempering significantly reduced the yield and tensile strengths to 636 and 755 MPa (92.2 and 109.5 ksi), respectively, but improved the ductility to an RoA of 57.2%. The average measured hardness was 248 (HV0.5).
- HT 1: This sample was heat-treated at a peak temperature of 900 °C and water quenched. Although the cooling rate was very rapid, the time at temperature was not sufficient to produce a fully martensitic microstructure, which resulted in yield and tensile strengths of 487 MPa (70.6 ksi) and 748 MPa (113.7 ksi), respectively. The measured ductility was very good, with an RoA of 52.8% and the average hardness was 244 (HV0.5), which was very similar to HT 5.
- HT 2: The sample was air-cooled from 900 °C, resulting in a yield and tensile strength of 329 and 519 MPa (47.7 and 75.3 ksi), respectively. The RoA was 62.1%, indicating good ductility. The average measured hardness was 141 (HV0.5).
- HT 4: This sample was air-cooled from a peak temperature of 1200 °C (2192 °F), which resulted in the lowest yield strengths and ultimate tensile strength of 280 and 516 MPa (40.6 and 74.8 ksi), respectively; however, the ductility was excellent with a measured RoA of 62.7%. Average hardness was 141 (HV0.5), which was the same as HT 2.
The average hardness levels tracked reasonably well with the measured values of tensile strength. Although the trends are sensible, it is apparent that a specific measured value of hardness does not unambiguously define the specific constituent microstructure, as indicated by the fact that HT 1 and HT 5 had very similar hardness values, but grossly different grain sizes and microstructures.
3.3. Fracture Toughness
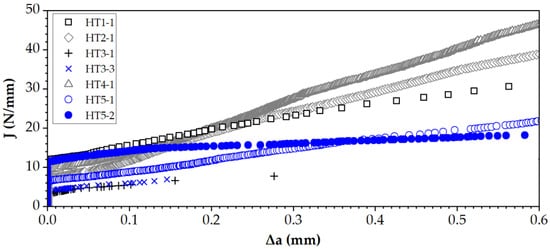
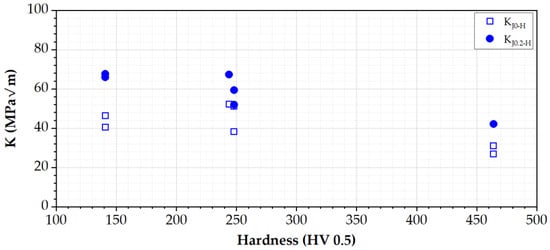
Figure 9 shows the J-R curves for the tests conducted on each of the heat-treated samples. Single tests were carried out for HT 1, HT 2, and HT 4, while duplicate tests were undertaken on the samples with the martensitic microstructure: HT 3 and HT 5. In general, at J0-H (which represents the value of J at the point where ∆a = 0.0 mm), all samples exhibited relatively poor initial fracture toughness. This observation is consistent with the fact that the vintage line pipe steel likely had some inherent brittleness. Moreover, as noted earlier, the steel used to manufacture this pipe was relatively high in carbon, phosphorus, and sulfur, so it is not surprising that there was a trend towards brittle behavior. The following is a summary of the observations for the fracture toughness tests in hydrogen from Figure 9:
Figure 9.
Recorded J-R curves for CT specimens extracted from test sections that were heat-treated to produce different weld-relevant microstructures and subsequently tested at a hydrogen pressure of 6.9 MPa (1000 psig).
- HT 2-1 and HT 4-1, which were air-cooled, had the highest J0-H values and also exhibited the largest slope or tearing modulus. This is not surprising as both samples had low yield and tensile strengths and a pearlite–ferritic microstructure.
- HT 1-1 and HT 5-2, which had similar average hardness values, had J0-H values that were nearly identical; however, the slopes of the curve were quite different, suggesting an influence of microstructure.
- HT 1-1 and HT 5-1 had very different J0-H values, but similar slopes, suggesting that their resistance to stable crack growth was similar. The repeat tests on the two HT 5 samples, which showed uniform mechanical properties, hardness, and microstructure, exhibited differences in fracture behavior, such that HT5-1 had a relatively low J0-H, but positive slope, while HT 5-2 had a comparatively higher J0-H, but had a near-zero slope. Although HT 5-1 and HT 5-2 had different measured J0-H values, the fact that HT 5-2 has a more positive slope resulted in measured J0.2-H values (fracture resistance at the intersection of the 0.2 mm crack extension line [25]) that were essentially the same. This observation shows that taking a singular value of fracture toughness at a specific extension does not reveal full details of the behavior.
- The repeat tests for the HT 3 (untempered martensite) resulted in very similar outcomes with both specimens exhibiting very low toughness and very little crack extension before the final fast fracture.
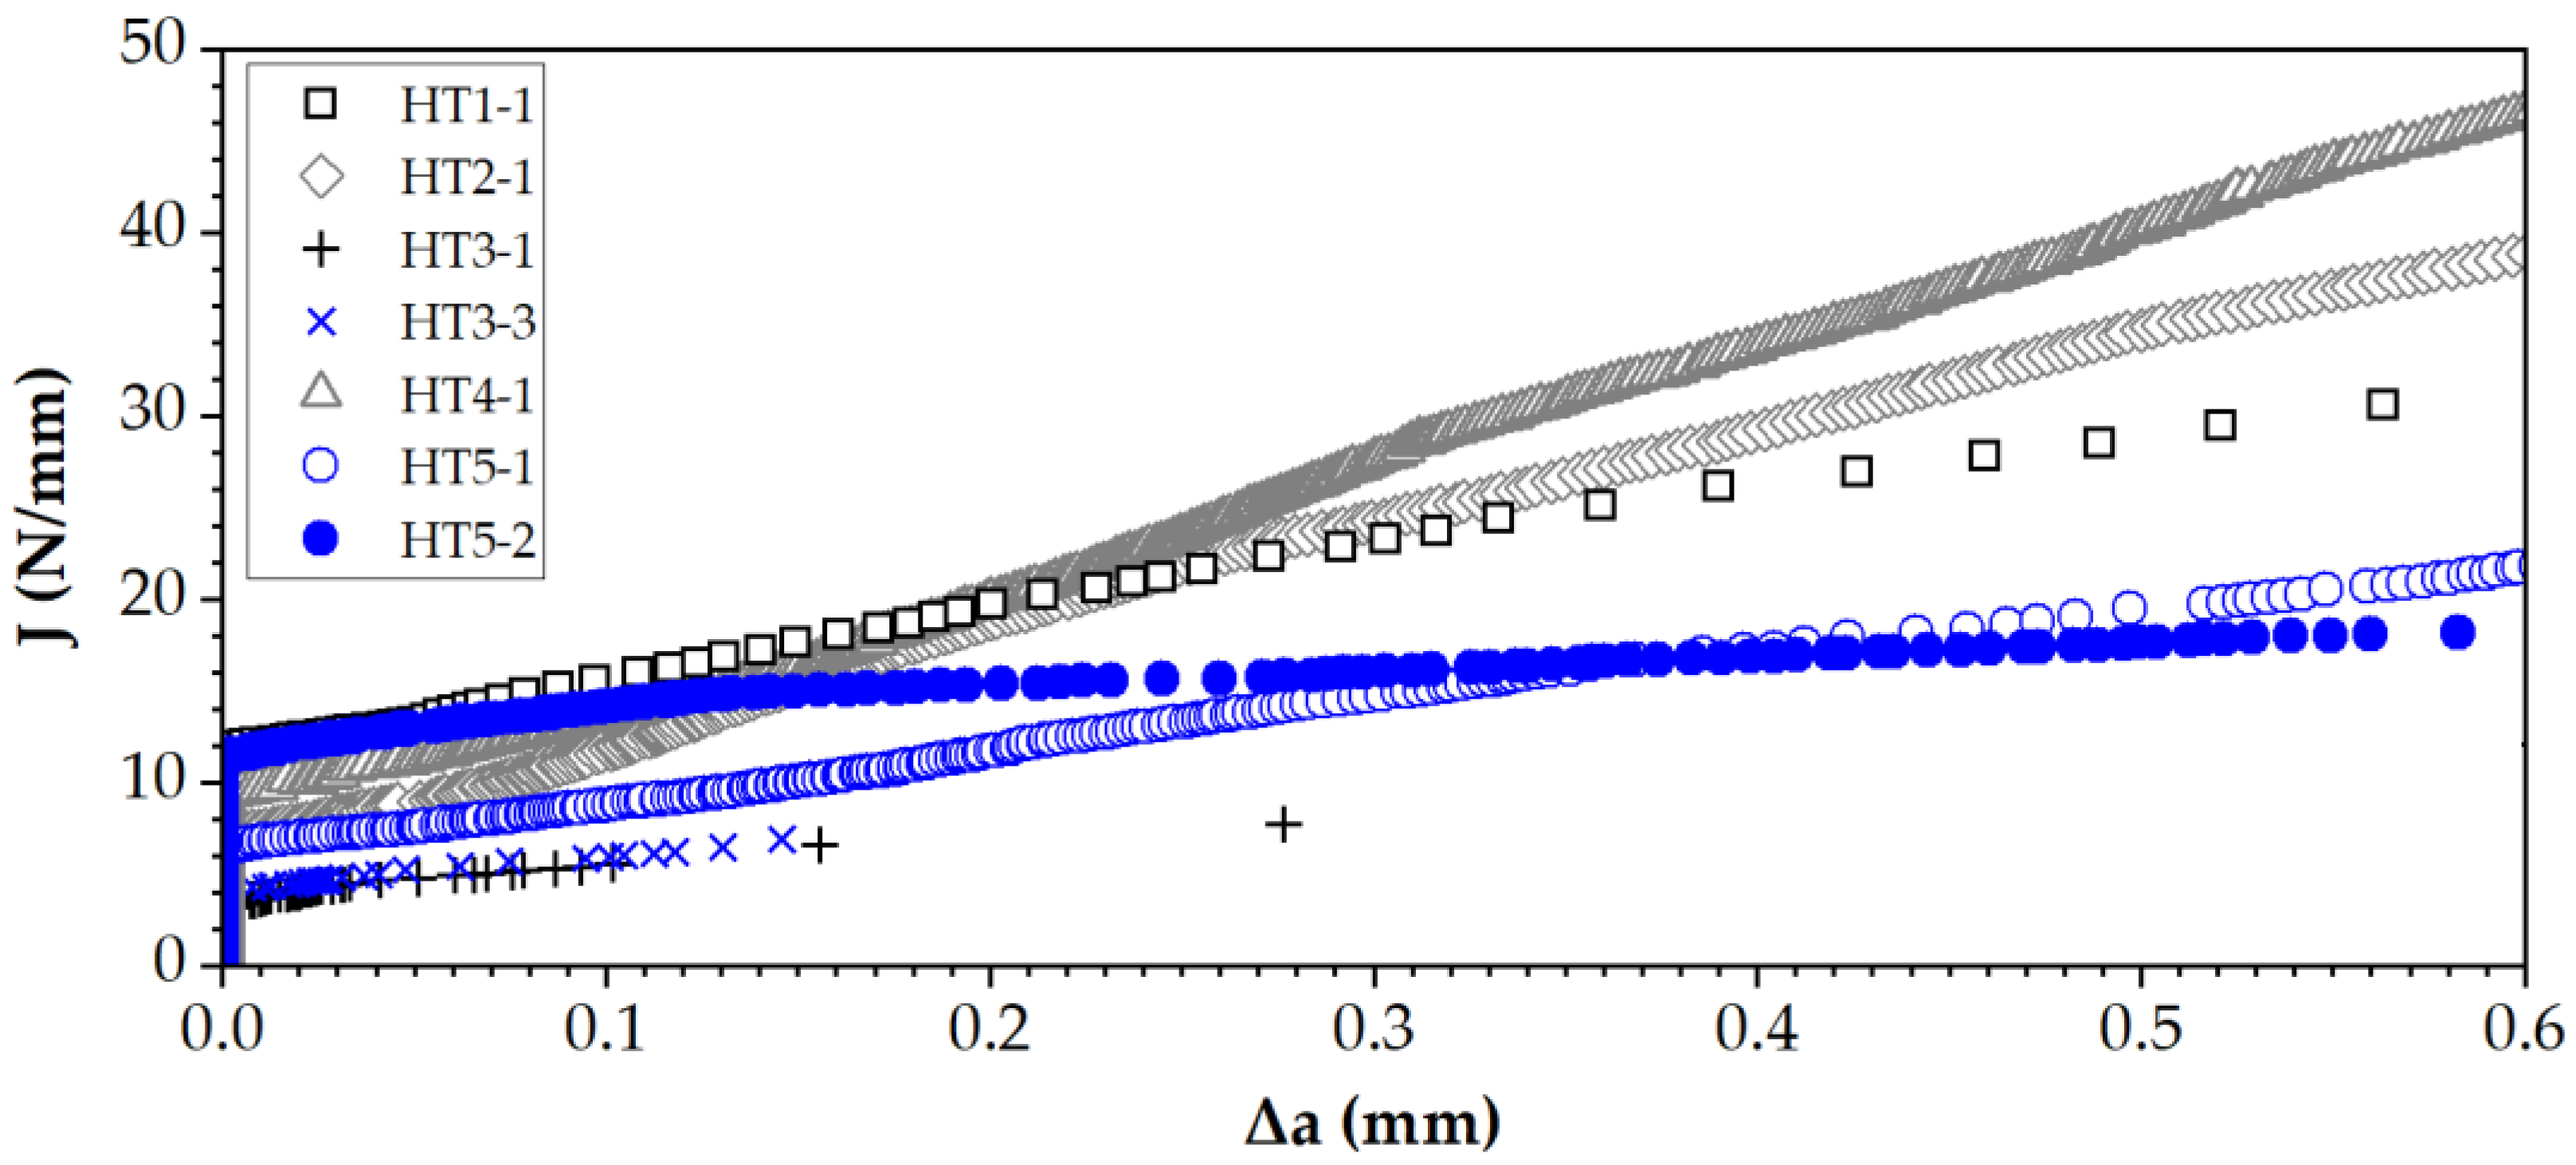
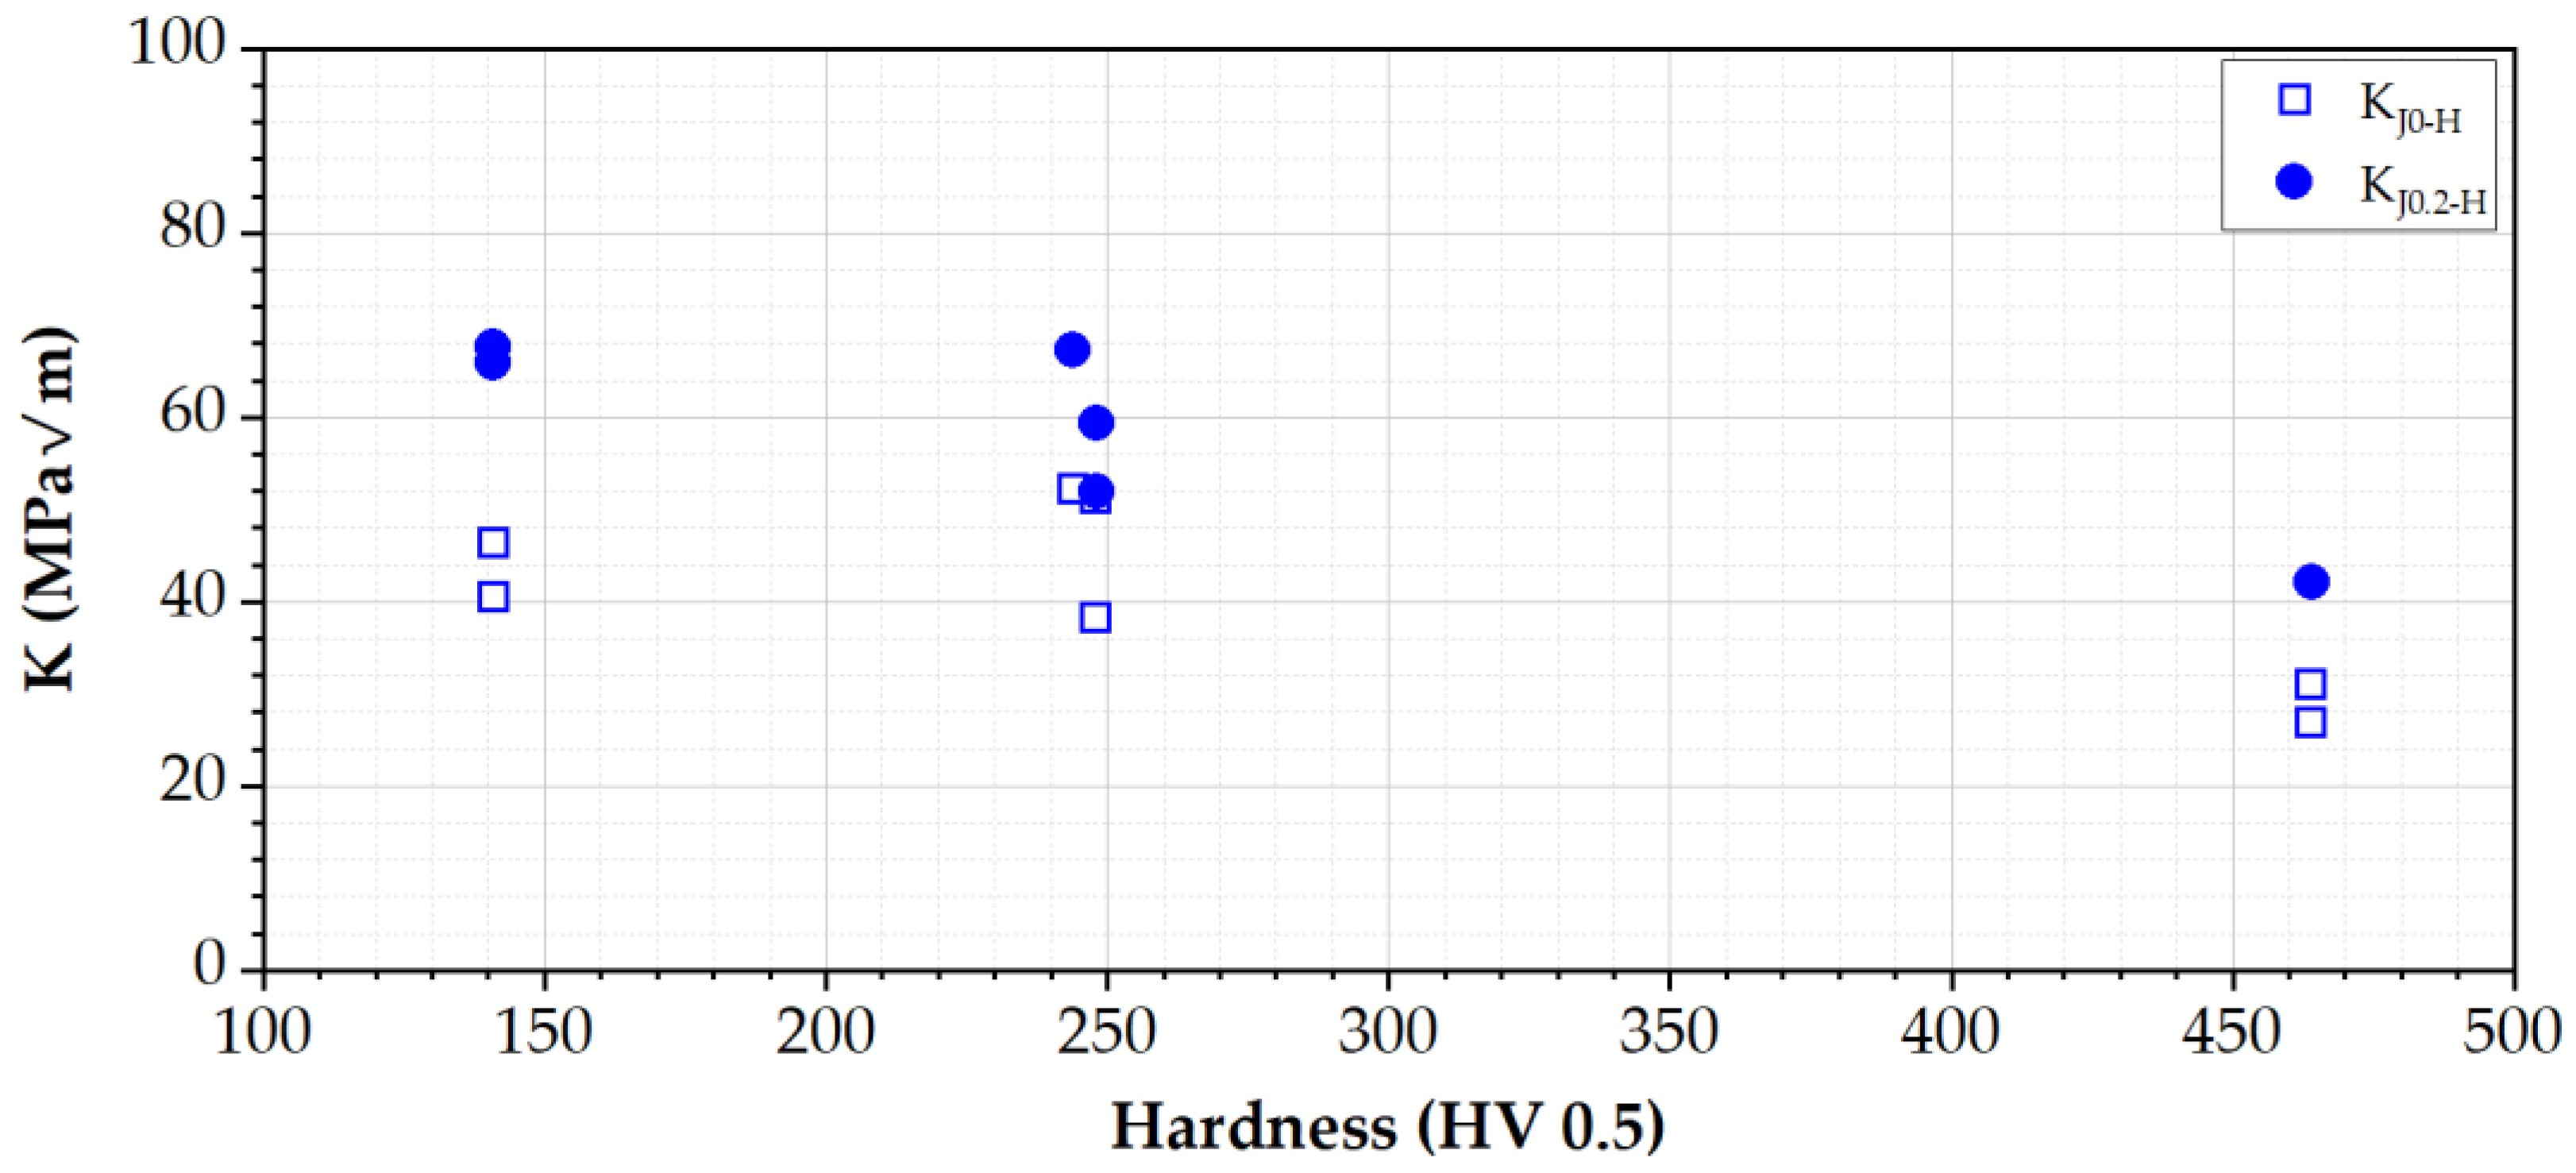
As has been reported in previous publications [13,14,25,26,27,28], the fracture toughness measured in hydrogen gas decreases with increasing hardness. Results from the present work, shown in Figure 10, exhibit the expected trend where the fracture resistance decreases as average hardness increases. In line with expectations, the recorded K-values at 0.0 mm are the lowest at each hardness level but for the vintage X46 steel examined in this study, the differences in KJ0-H values are not significant over the hardness range of 150 HV to 500 HV, as all microstructural conditions exhibited relatively poor toughness.
Figure 10.
Fracture resistance, K, as a function of hardness for the simulated heat-affected zone samples tested at a hydrogen gas pressure of 6.9 MPa (1000 psig). K was calculated based on J values recorded at 0.0 mm and 0.2 mm crack extension.
Also shown in Figure 10 are the calculated fracture toughness values representative of the J values recorded at 0.2 mm displacement, KJ0.2-H. These values were selected as there is on-going discussion regarding the value of displacement that provides the ‘representative’ value at the start of crack growth [23]. Testing on a 1970s vintage API 5L X60 C-Mn pipeline steel material involved detailed analysis of potential drop measurements in relation to load line displacement. The analysis, in combination with heat tinting at selected test interruptions, was used to identify physical evidence of crack initiation for fracture toughness tests on base steel. The results obtained indicated that observable evidence of initiated cracking was found for interruptions at (or near) 0.2 mm displacement. While the observations reported from this study are important, there remains uncertainty as to whether the conclusions can be applied to all tests, including those on welded specimens.
3.4. Post-Test Characterization
Procedures were developed for characterization of metallurgical samples after testing to fracture. In general, the approach used is to record the information at a macro scale and then, based on the evidence obtained, undertake detailed evaluation to record additional data at selected locations to provide maximum value. The detailed assessments are aimed at recording specific features associated with the fracture, and identifying how these features relate to the constituent microstructure. The results provided here are specific to examination of the X46 steel fracture toughness samples and have been selected to illustrate the documentation involved and report key evidence.
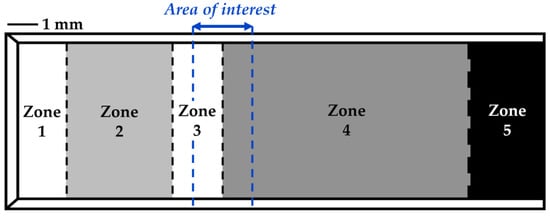
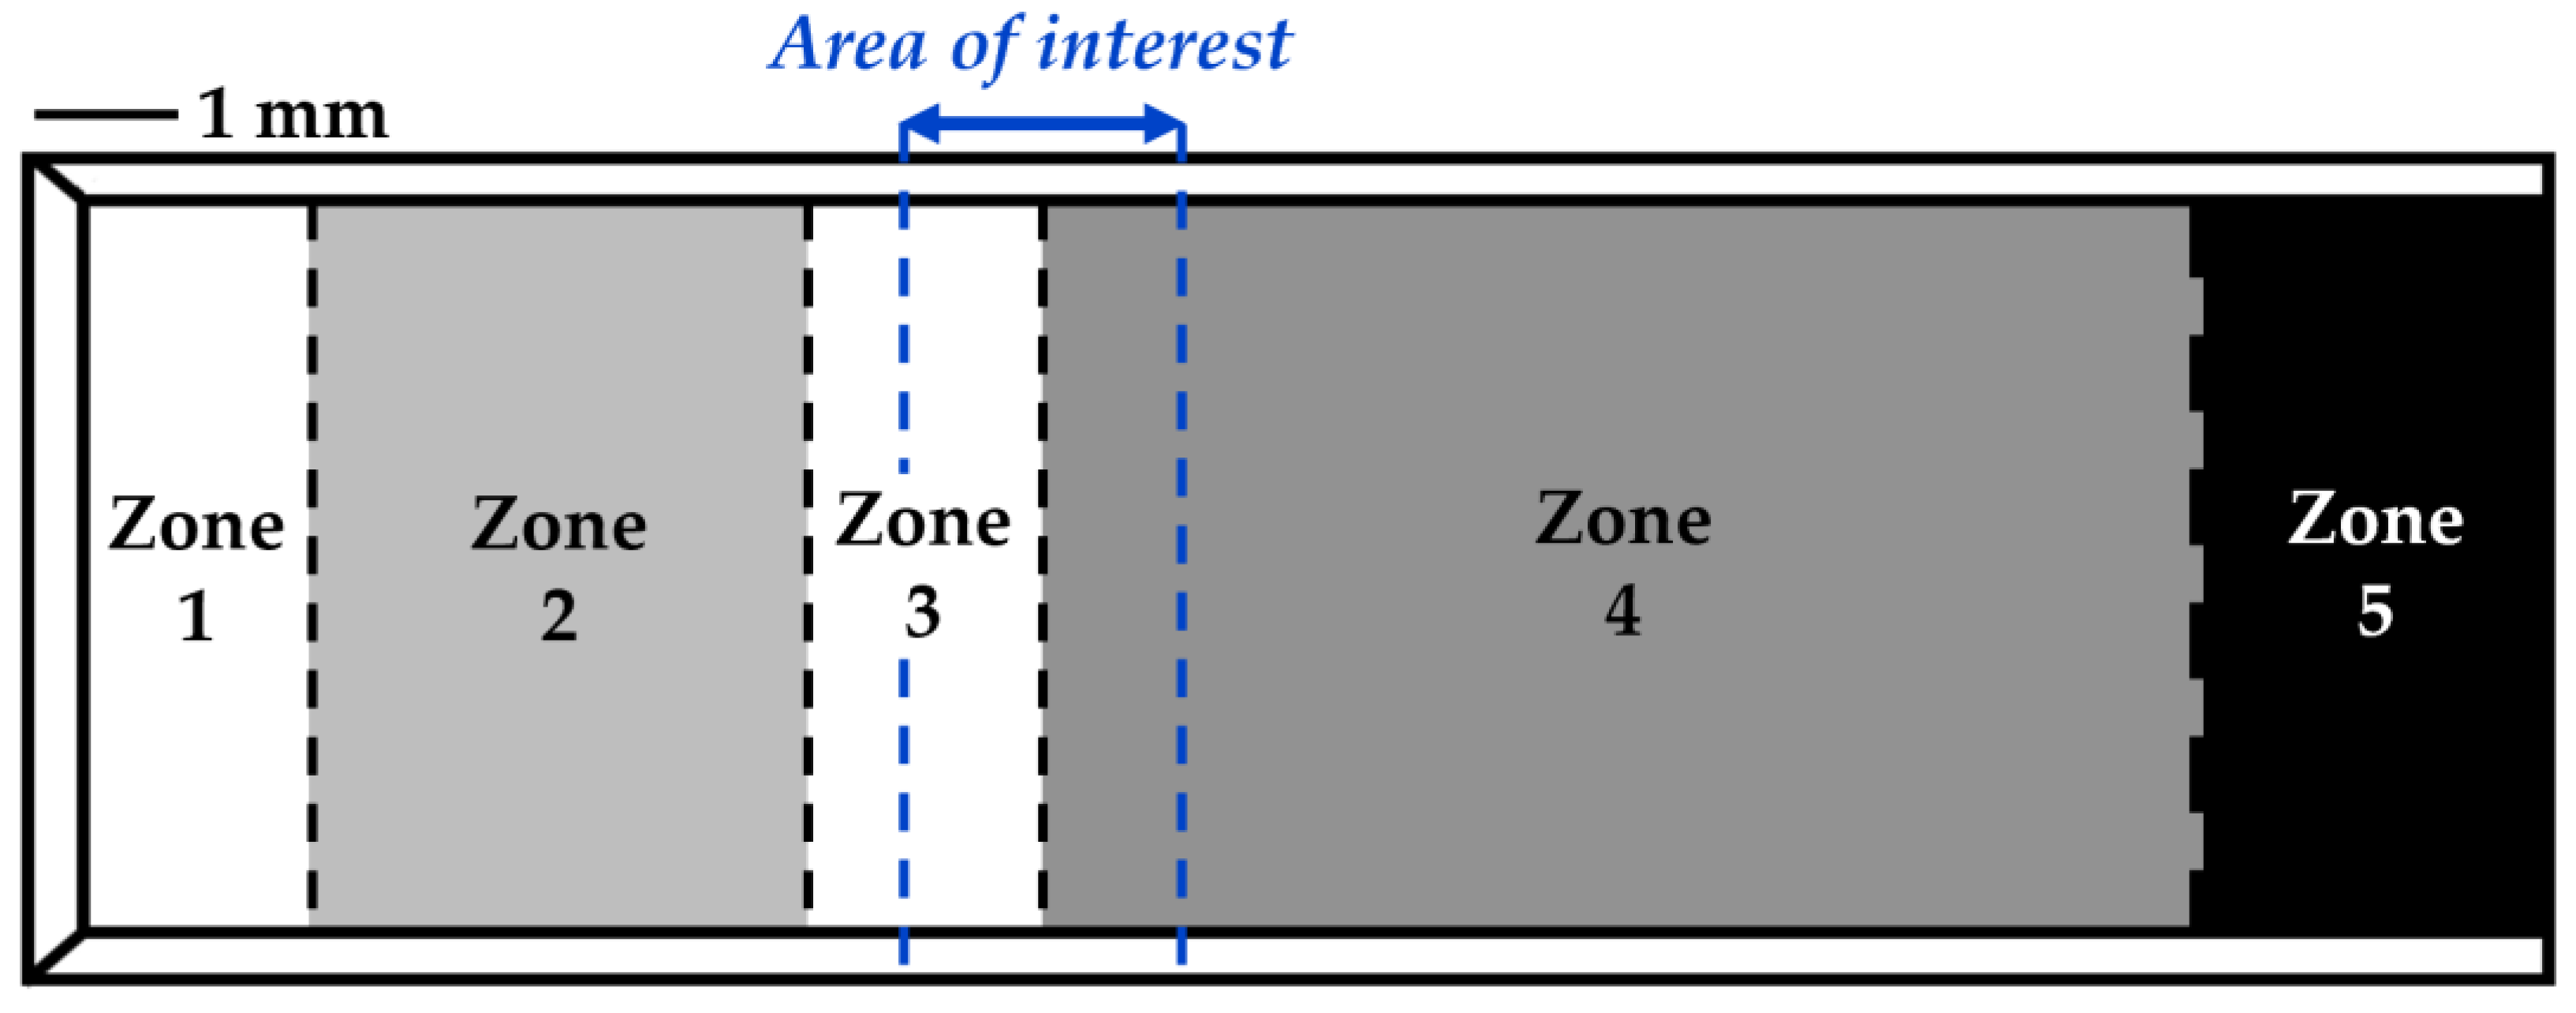
For the loading conditions in the current tests, several different zones would be expected to be present on the fracture surface. The expected zones are identified on the schematic diagram shown in Figure 11, which corresponds to the following (note that in this schematic, the notch is located on the extreme left-hand side):
Figure 11.
Schematic diagram of the fracture surface of a CT specimen representative of tests performed in the current work.
- Zone 1: Fatigue pre-cracking in air was performed to ensure that the crack was sharp prior to fatigue crack growth testing.
- Zone 2: Fatigue crack growth testing in H2 was performed on all samples except HT 3. For the HT 3 samples, fast fracture occurred prior to achieving Kmax, thus preventing cyclic testing.
- Zone 3: Fatigue pre-cracking in air was performed to ensure that the crack was sharp prior to fracture toughness testing.
- Zone 4: Fracture toughness testing was performed in 6.9 MPa (1000 psig) hydrogen gas.
- Zone 5: Final fast fracture zone was performed following testing in hydrogen gas (observed on all samples except HT 3, which fractured in half during testing).
Although laboratory examination of all regions can be important, as outlined in Section 3.2, the area of particular interest in assessing the J-R behavior is the transition from the second fatigue pre-crack (zone 3) to the fracture toughness test (zone 4). This region is highlighted with a blue box in Figure 11.
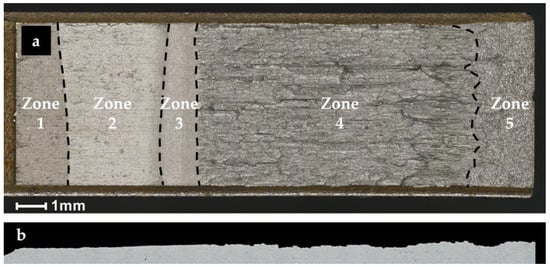
An optical image of the fracture face from sample HT 1 is shown in Figure 12. The different fracture zones are highlighted, and it is apparent that in an actual test sample, the idealized view shown in Figure 11 is not realized because the sizes of the individual zones are not uniform. Nevertheless, the individual features are present as identifiable zones. Because the testing was undertaken on samples heat-treated to represent microstructures in a line pipe weld, the structure in each sample was homogeneous. Thus, observed variability in the surface characteristics is a consequence of the way in which damage developed rather than microstructural changes. Consideration of Figure 12 reveals that the regions where fatigue cracking took place are predominantly planar. The differences in the dimensions of the zones highlight some of the challenges in calculating a specific value for crack growth, even when DCPD monitoring is used. The post-test examination enables the specific crack sizes to be established, which can be used to inform analysis.
Figure 12.
Light optical image of the fracture surface of sample HT 1 with the individual zones identified (a). The fracture surface has been sectioned at the centerline to allow for preparation of a metallographic cross-section (b).
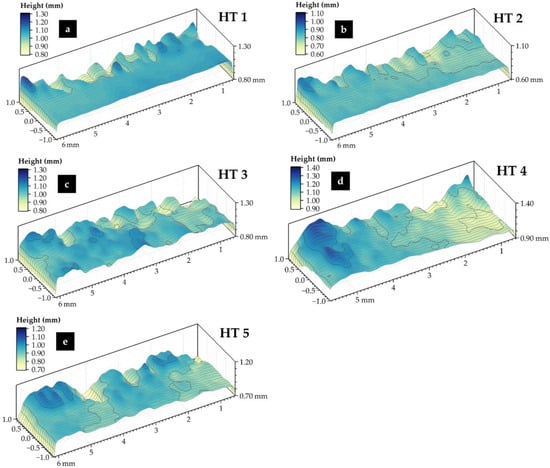
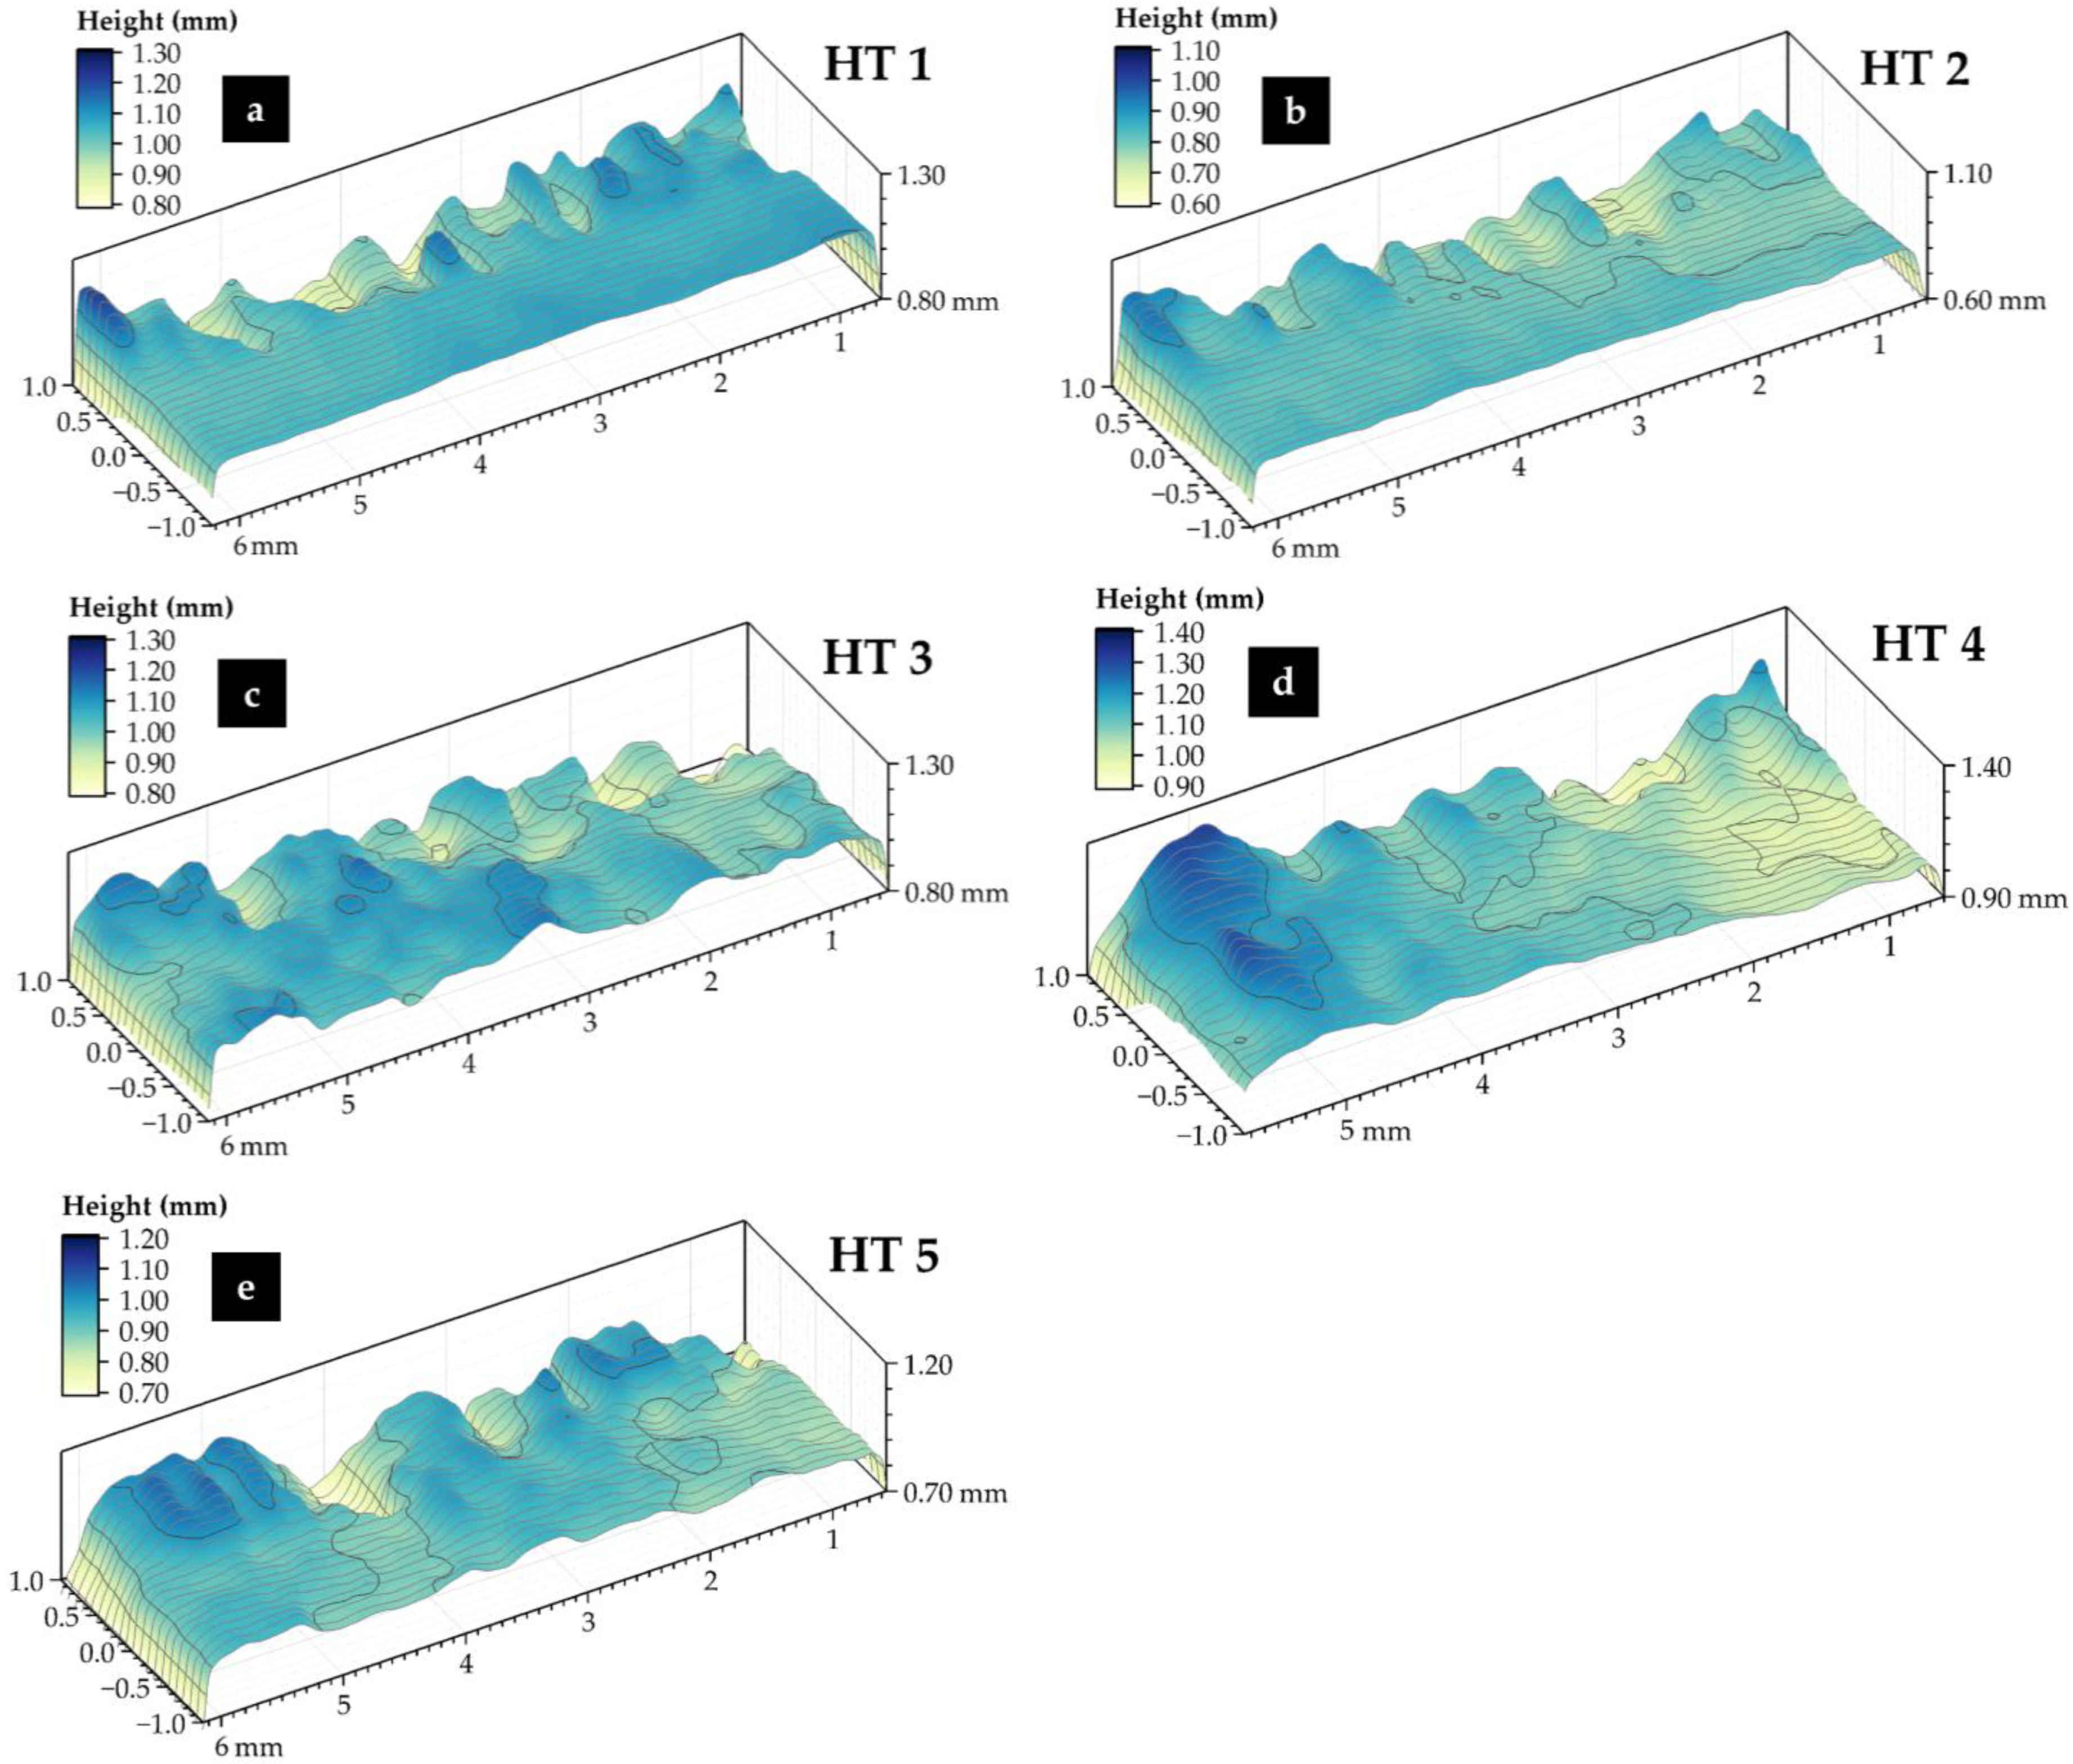
As noted, a particular goal of the post-test examination is to document features associated with the transition from the second fatigue pre-crack (zone 3) to the region where fracture toughness (zone 4) was assessed via 3D optical scans using the Keyence VHX-7000 digital optical microscope. In the current work, data from across the nominally 6 mm thickness of the CT samples were plotted over a distance of 2.0 mm. In Figure 13a–e, which represent results for HT 1 through HT 5, respectively, the 2.0 mm width is presented as −1.0 mm to +1.0 mm, where the 0.0 mm position represents the transition from the fatigue pre-crack to the fracture toughness testing. With this length scale, it should be expected that the manner in which the crack propagation features transition from the predominantly planar fatigue (pre-crack) growth can be assessed. The aim of this evaluation is to consider whether there is evidence in the zone examined that can be used to guide the assessment of where crack initiation in hydrogen starts.
Figure 13.
Data from the Keyence digital microscope analyzed to produce 3D plots of the features recorded at the transition from the fatigue pre-crack (zone 3) to into the fracture toughness region (zone 4) for each of the microstructural conditions. Samples HT 1 to HT 5 are represented in (a–e), respectively. Note that the height variation recorded across each sample is significantly less than 1 mm.
Samples HT 1 and HT 2, which were heat-treated at a peak temperature of 900 °C, both show relatively flat zones in the fatigue pre-crack region; see Figure 13a,b. This is likely a consequence of the fact that the fine-grain microstructures present had little to no bearing on fatigue growth in air. Likewise, the transition to the fracture toughness region does not indicate evidence of out-of-plane growth. These results are generally consistent with the J-R curves shown in Figure 9, which show similar slopes over the range of stable crack growth for HT 1 and HT 2.In contrast, the pattern of behavior for HT 3 and HT 5 is very different as both samples were water quenched after being austenitized at 1200 °C, resulting in the formation of coarse-grained martensite. Even though a subsequent tempering treatment was applied to HT 5, it appears that the established coarse-grained microstructure influenced crack growth in both the fatigue pre-crack (zone 3) and fracture toughness-tested (zone 4) regions. This is particularly evident in sample HT 3 (Figure 13c) where the features of the fatigue pre-cracking appear to be influenced by the coarse-grained microstructure. It is clear that this sample also exhibited the poorest fracture toughness of specimens tested in hydrogen (see Figure 9). Although HT 4 was air-cooled from 1200 °C, and the structure displayed relatively low tensile strength and good ductility, the crack profile shown in Figure 13d indicates that the fatigue pre-crack region (zone 3) was similar to that of HT 3 and HT 5, suggesting that the prior austenite grain size had an influence on fatigue crack growth in air. This figure also shows evidence that the crack propagation in hydrogen deviated from the plane of the fatigue pre-crack.
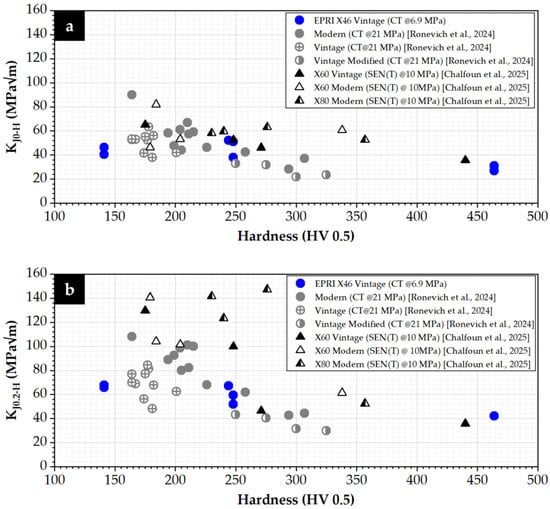
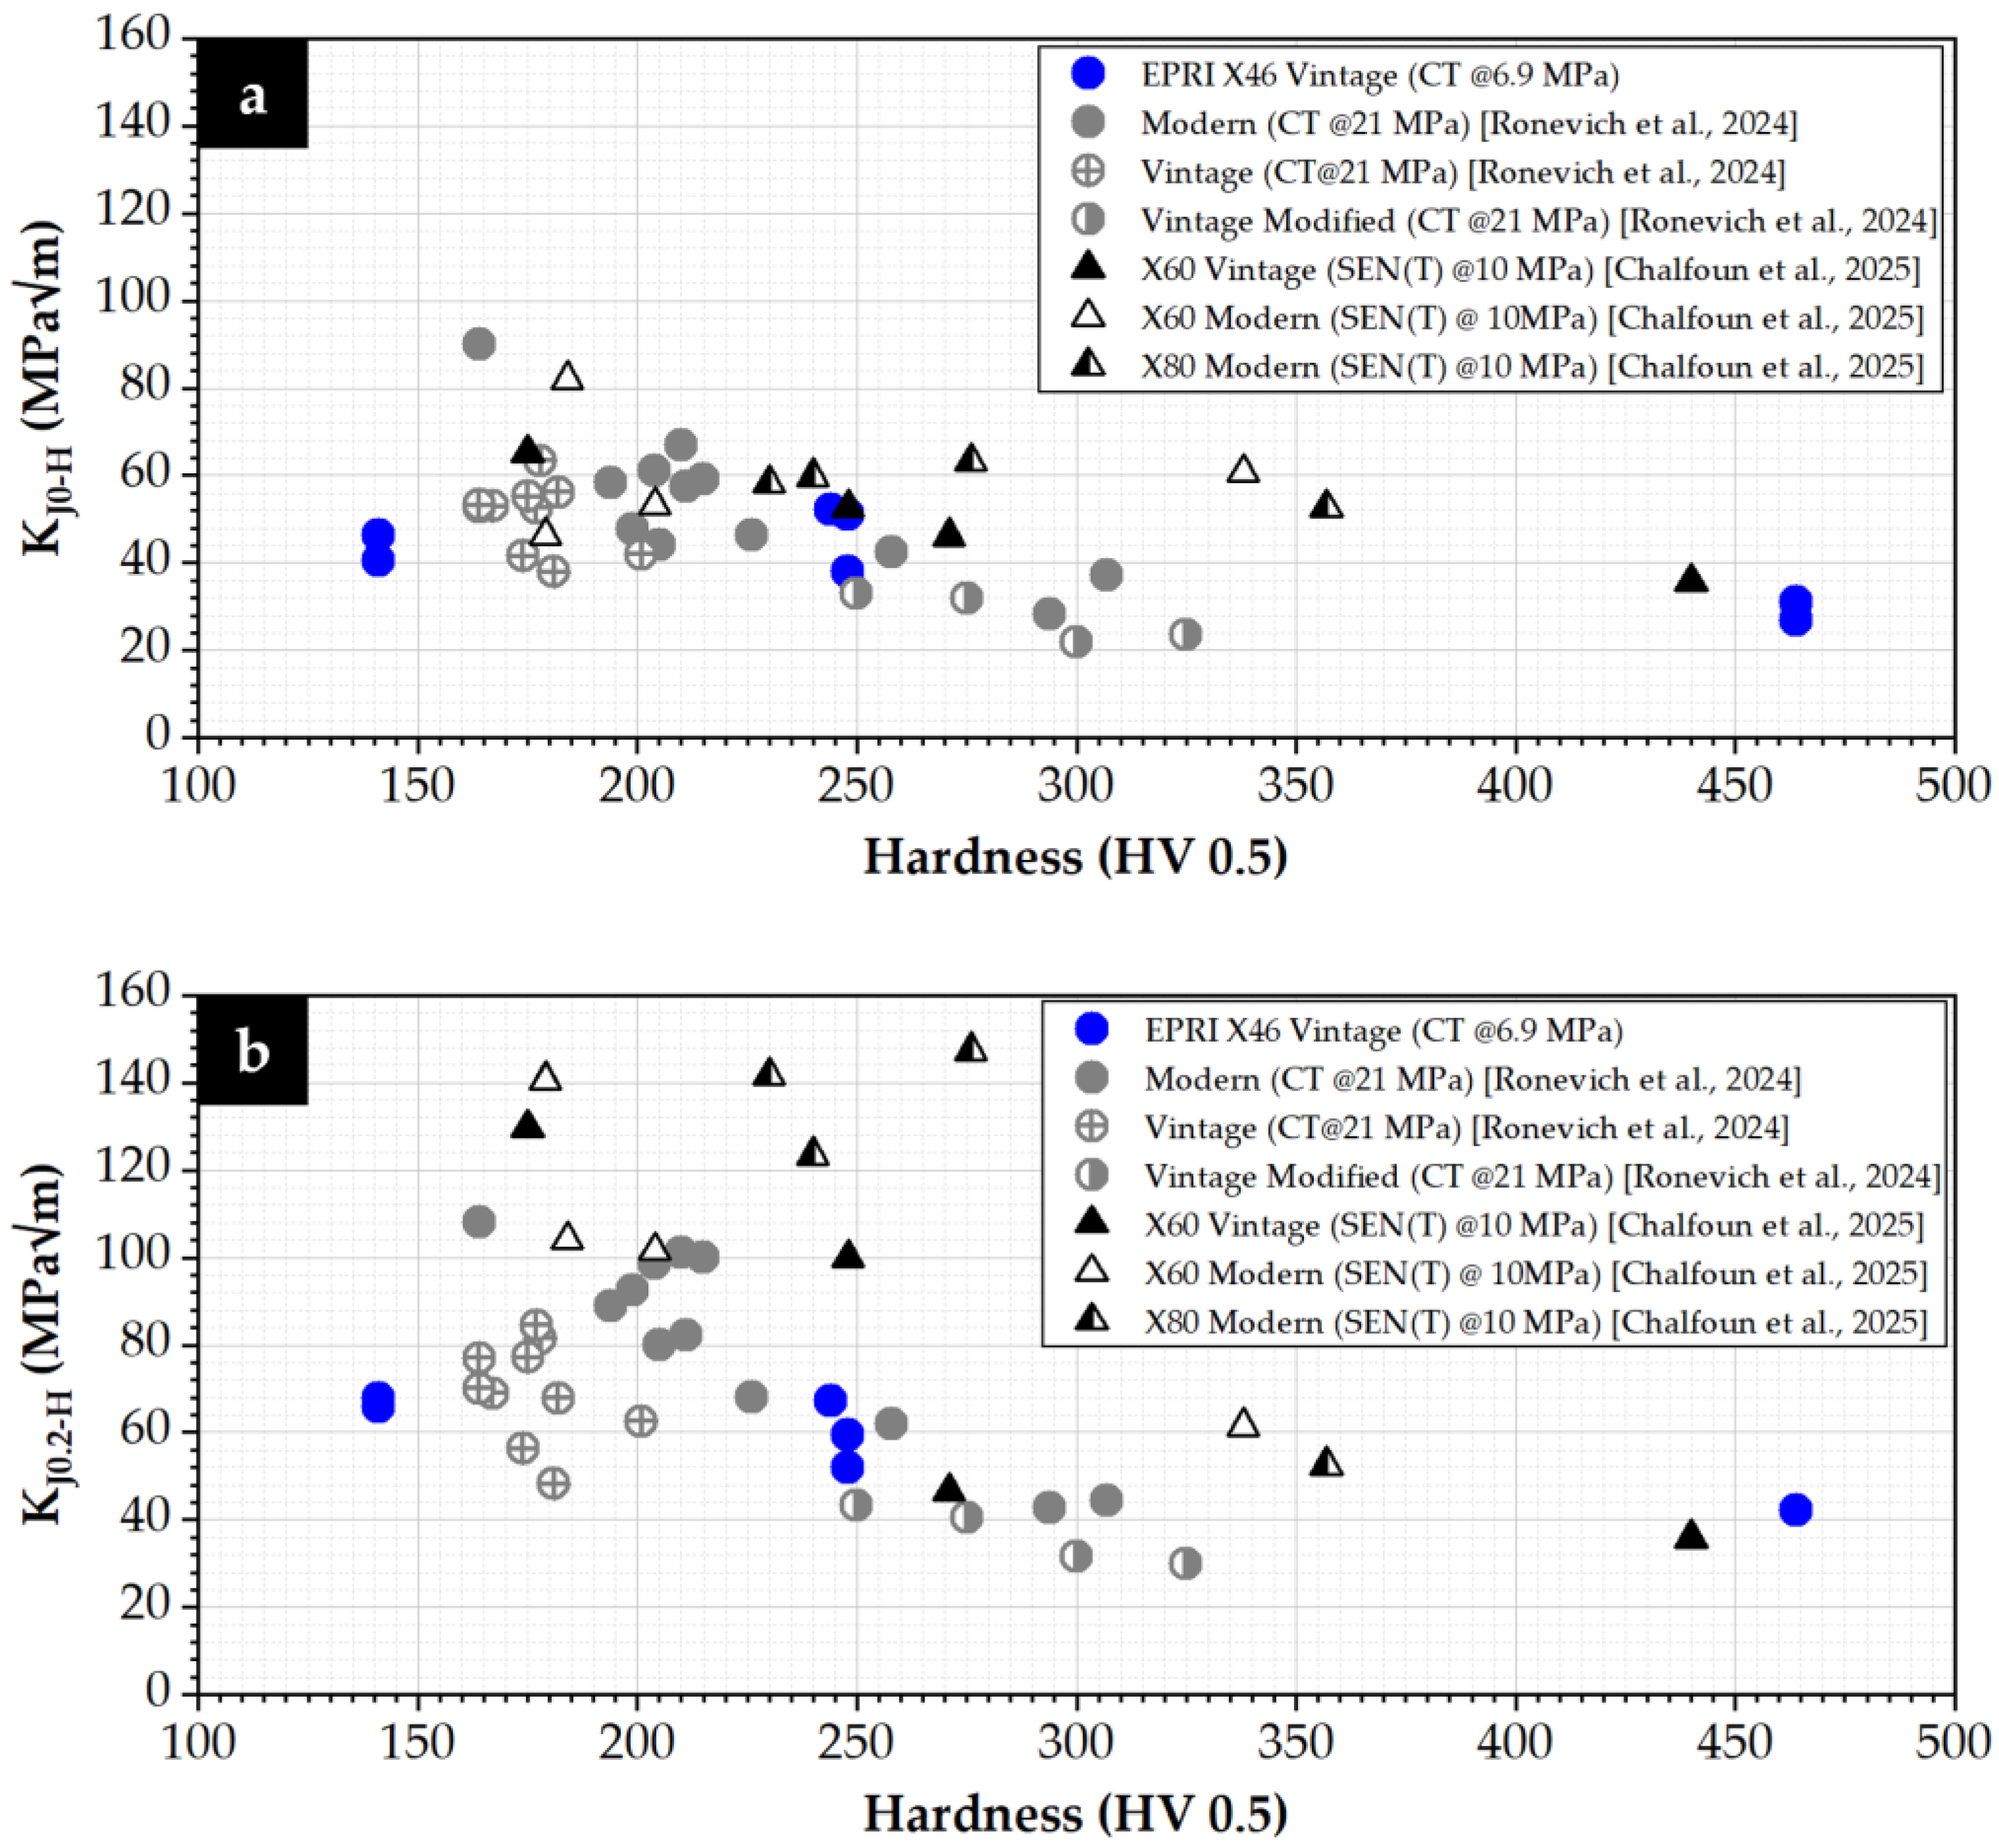
The results reported for the current tests clearly demonstrate that the steel grade does not define the fracture toughness. More importantly, the fracture toughness measured from base metal tests in hydrogen does not appear to provide a meaningful value of the lower-bound toughness. The present results are compared with other published data in Figure 14a for KJ0-H and in Figure 14b for KJ0.2-H. In each case, the fracture toughness in hydrogen decreased with increasing hardness. As expected, the fracture toughness results obtained for single-edge notch samples [20] show higher values of fracture toughness than data obtained using compact tension specimens. In general, this trend is explained because compact tension samples have the highest level of constraint.
Figure 14.
Fracture toughness in gaseous hydrogen as a function of hardness for crack extensions of 0.0 mm (a) and 0.2 mm (b). Data from the present work and previously published data, adapted from Refs. [20,25], are included for comparison. Note that circles represent testing performed on CT specimens whereas triangles represent testing performed on SEN(T) specimens.
Given the complexities and the uncertainties involved, it is very unlikely that laboratory testing alone will provide a complete engineering assessment of pipeline performance in hydrogen. However, having relevant material data in combination with validated models of performance offers real potential to provide the answers necessary for safe, reliable, and affordable transmission of hydrogen [20,29,30]. However, a cautionary note is that the data presented in Figure 14 shows that the initiation toughness values (KJ0-H) in hydrogen may be as low as 20 MPa√m in vintage steels that exhibit high hardness [25]. Thus, this is lower than the minimum fracture toughness value of 55 MPa√m recommended for pipeline steels in ASME B31.12 [15]. As shown in Figure 14b, even at 0.2 mm crack extension (KJ0.2-H), recorded fracture toughness values in hydrogen for vintage pipeline steels that have been heat-treated to produce weld relevant microstructures with hardness values above 250 HV (i.e., closed black triangles [20], semi-closed gray circles [25], and closed blue circles) are typically below 50 MPa√m. In general, there is little difference in the toughness values for the selected levels of displacement because the J-R curves are flat. In the current testing, this behavior was observed in samples with large prior austenite grain size and which were relatively brittle. The current findings are consistent with observations that pipeline steels with localized regions of high hardness are susceptible to damage formation. Similarly, weld HAZs that contain coarse-grained martensite microstructures are likely to exhibit low toughness in hydrogen service. It is apparent then that weld procedures should consider the size and sequence of electrode deposition such that the welding thermal cycles minimize the extent of coarse prior austenite grains [20].
4. Concluding Remarks
Previous work has clearly demonstrated that empirical approaches alone have significant limitations for accurate estimation of the fracture toughness of welds in gas line pipe. These problems arise because most samples machined from ex-service welds will contain a range of microstructures. The different microstructural zones have different properties and even when CT samples with side grooves are utilized, it is unlikely that plane strain conditions are achieved. The lack of constraint significantly complicates the interpretation of the results and makes application of the results to decisions regarding whether pipeline welds are suitable for hydrogen service very difficult.
A key complexity in obtaining representative fracture toughness information for welds is that the thermal cycles involved in fusion welding significantly modify the microstructure of the base steel. Moreover, in vintage pipelines, there is variability in the composition and processing of the individual pipe sections even within a single grade. When seeking to make informed judgements regarding repurposing of existing natural gas pipelines for use with hydrogen gas, it is critical that representative data and associated analyses are available. The present research provides key evidence with respect to assessing how hydrogen will influence the performance of steels. The following summarize the primary factors:
- The steel examined in the work was removed from the same section of vintage X46 pipe. The composition of this pipe had relatively high levels of carbon, phosphorus, and sulfur. This combination promoted brittle behavior in tensile tests on samples heat-treated to produce hardness values around 450 HV. While this hardness may be considered excessively high, testing of ex-service seam welds showed that this level of hardness may be present in existing vintage pipeline steels, especially in the US.
- It is apparent that, although composition is an important factor, which certainly should be considered when assessing performance in hydrogen, heat treatment and the resultant microstructural constituents can influence the embrittlement behavior in hydrogen.
- When seeking to assess the influence that hydrogen gas will have on the performance of pipelines designed for use with natural gas, it is critical to evaluate the full range of representative microstructures using relevant testing geometries. Too often, research has involved relatively simple laboratory tests on samples of base metal, and there is little evidence to suggest that the results obtained will ever be suitable, establishing the worst-case performance.
- Consideration of the level of extension that represents the crack initiation toughness is important and remains a topic of interest. The techniques described in this paper, including identifying the crack plane, and how the crack propagation path deviates from the initial plane of fatigue pre-cracking, can offer critical insights into fracture behavior. Indeed, when post-test analysis has been performed on fractured CT samples machined from variable microstructures, the results have shown crack branching, secondary crack development, and even significant ductility.
Author Contributions
Conceptualization, J.P. and M.G.; Formal analysis, E.G.; Investigation, M.G. and E.G.; Data curation, E.G.; Writing—original draft, J.P.; Writing—review & editing, M.G. All authors have read and agreed to the published version of the manuscript.
Funding
This research received no external funding.
Data Availability Statement
The original contributions presented in this study are included in the article. Further inquiries can be directed to the corresponding author.
Conflicts of Interest
The authors declare no conflict of interest.
References
- Wang, A.; van der Leun, K.; Peters, D.; Buseman, M. European Hydrogen Backbone: How a Dedicated Hydrogen Infrastructure Can Be Created; Guidehouse: Utrecht, The Netherlands, 2020. [Google Scholar]
- Topolski, K.; Reznicek, E.P.; Erdener, B.C.; San Marchi, C.W.; Ronevich, J.A.; Fring, L.; Simmons, K.; Fernandez, O.J.G.; Hodge, B.-M.; Chung, M. Hydrogen Blending into Natural Gas Pipeline Infrastructure: Review of the State of Technology; NREL/TP-5400-81704; National Renewable Energy Laboratory: Golden, CO, USA, 2022.
- Télessy, K.; Barner, L.; Holz, F. Repurposing Natural Gas Pipelines for Hydrogen: Limits and Options from a Case Study in Germany. Int. J. Hydrogen Energy 2024, 80, 821–831. [Google Scholar] [CrossRef] [Scilit]
- Mielich, T.; Dobler, R.; Hollnagel, J.; Akca, O.; Müller-Kirchenbauer, J. Europe’s Way from Natural Gas to Green Hydrogen: Modeling and Simulation of the Transforming European Gas Transport Infrastructure. Int. J. Hydrogen Energy 2025, 135, 156–171. [Google Scholar] [CrossRef] [Scilit]
- Gallon, N.; Hopkin, S.; Martin, T. Hydrogen Pipelines Integrity Management and Repurposing Guideline White Paper; European Pipeline Research Group: Duisburg, Germany, 2023. [Google Scholar]
- Monsa, V.; Illson, T.; Thodla, R.; Hussain, A. Repurposing Onshore Pipelines for Hydrogen: Guiding Operators Through the Re-Evaluation Process; DNV: Bærum, Norway, 2023. [Google Scholar]
- United States Department of Transportation, Pipeline and Hazardous Materials Safety Administration (PHMSA). Gas Distribution, Gas Gathering, Gas Transmission, Hazardous Liquids, Liquefied Natural Gas (LNG) and Underground Natural Gas Storage (UNGS) Annual Report. Available online: https://www.phmsa.dot.gov/data-and-statistics/pipeline/gas-distribution-gas-gathering-gas-transmission-hazardous-liquids (accessed on 28 March 2025).
- Pipeline Research Council International (PRCI). Analysis of Line Pipe Manufacturing, Materials, and Construction Practices; PR-186-123716; Pipeline Research Council International: Houston, TX, USA, 2013. [Google Scholar]
- Fact Sheet: Pipe Manufacturing Process. Available online: https://primis.phmsa.dot.gov/comm/FactSheets/FSPipeManufacturingProcess.htm (accessed on 25 October 2025).
- The Interstate Natural Gas Association of America (INGAA). Integrity Characteristics of Vintage Pipelines. Available online: https://www.ingaa.org/File.aspx?id=6145 (accessed on 9 December 2025).
- Gagliano, M.; Griscom, E.; Parker, J. Influence of Hardness and Microstructure on the Fracture Behavior of Vintage X46 Pipeline Steel in Hydrogen Gas. In ASME 2025 Pressure Vessels & Piping Conference, Montreal, QC, Canada, 20–25 July 2025; PVP2025-151830; The American Society of Mechanical Engineers: Livingston, NJ, USA, 2025. [Google Scholar]
- Gangloff, R.P. Hydrogen-Assisted Cracking. In Comprehensive Structural Integrity; Milne, I., Ritchie, R., Karihaloo, B., Eds.; Elsevier Science: Amsterdam, The Netherlands, 2003; Volume 6, pp. 31–101. [Google Scholar]
- San Marchi, C.; Somerday, B. Technical Reference on Hydrogen Compatibility of Materials. SAND2012-7321; Sandia National Laboratory: Albuquerque, NM, USA, 2012.
- Nanninga, Y.S.; Levy, E.S.; Drexler, E.S.; Condon, R.T.; Stevenson, A.E.; Slifka, A.J. Comparison of Hydrogen Embrittlement in Three Pipeline Steels in High Pressure Gaseous Hydrogen Environments. Corros. Sci. 2012, 59, 1–12. [Google Scholar] [CrossRef] [Scilit]
- ASME B31.12; Hydrogen Piping and Pipelines. American Society of Mechanical Engineers (ASME): New York, NY, USA, 2023.
- European Industrial Gases Association (EIGA). IGC Doc. 121/14: Hydrogen Pipeline Systems; EIGA: Brussels, Belgium, 2014. [Google Scholar]
- American Petroleum Institute (API). API Specification 5L: Line Pipe, 46th ed.; API: Washington, DC, USA, 2018. [Google Scholar]
- Nguyen, T.T.; Park, J.; Kim, W.S.; Nahm, S.H.; Beak, U.B. Effect of Low Partial Hydrogen in a Mixture with Methane on the Mechanical Properties of X70 Pipeline Steel. Int. J. Hydrogen Energy 2020, 45, 2368–2381. [Google Scholar] [CrossRef] [Scilit]
- Ronevich, J.A.; Song, E.J.; Somerday, B.P.; San Marchi, C.W. Hydrogen-Assisted Fracture Resistance of Pipeline Welds in Gaseous Hydrogen. Int. J. Hydrogen Energy 2021, 46, 7601–7614. [Google Scholar] [CrossRef] [Scilit]
- Chalfoun, D.R.; Parker, J.; Gagliano, M.; Martínez-Paneda, E. Tailored Heat Treatments to Characterize the Fracture Resistance of Critical Weld Regions in Hydrogen Transmission Pipelines. Int. J. Hydrogen Energy 2025, 192, 152347. [Google Scholar] [CrossRef] [Scilit]
- European Pipeline Research Group (EPRG). Draft Best Practice Guidelines for Small Scale Fracture Toughness Testing in Hydrogen Gas of Carbon Steel Pipeline Material; EPRG: Duisburg, Germany, 2024; Available online: https://www.eprg.net/fileadmin/EPRG_Dokumente/EPRG-Guidelines-Rev-4a_01.pdf (accessed on 12 January 2026).
- ASTM E8-22; Standard Test Methods for Tension Testing of Metallic Materials. ASTM International (ASTM): West Conshohocken, PA, USA, 2022.
- Thodla, R.; Huggins-Gonzalez, A.; Ronevich, J.; San Marchi, C.; Bezensek, B. Determination of Fracture Initiation in H2 Environments from Rising Displacement Tests. In ASME 2025 Pressure Vessels & Piping Conference, Montreal, QC, Canada, 20–25 July 2025; PVP2025-154581; The American Society of Mechanical Engineers: Livingston, NJ, USA, 2025. [Google Scholar]
- ASTM E1820-23a; Standard Test Method for Measurement of Fracture Toughness. ASTM International (ASTM): West Conshohocken, PA, USA, 2023.
- Ronevich, J.; Agnani, M.; Gagliano, M.; Parker, J.; San Marchi, C. Influence of Hardness on Hydrogen-Assisted Fracture in Pipeline Steels. In Proceedings of the 15th International Pipeline Conference, Calgary, AB, Canada, 23–27 September 2024. [Google Scholar] [CrossRef] [Scilit]
- Barthelemy, H. Effect of Pressure and Purity on the Hydrogen Embrittlement of Steels. Int. J. Hydrogen Energy 2011, 36, 2750–2758. [Google Scholar] [CrossRef] [Scilit]
- Martin, M.; Connolly, M.; Slifka, A. Hydrogen Embrittlement in Ferritic Steels. Appl. Phys. Rev. 2020, 7, 1–24. [Google Scholar] [CrossRef] [Scilit] [PubMed]
- Dadfarnia, M.; Sofronis, P.; Brouwer, J.; Sosa, S. Assessment of Resistance to Fatigue Crack Growth of Natural Gas Line Pipe Steels Carrying Gas Mixed with Hydrogen. Int. J. Hydrogen Energy 2019, 44, 10808–10822. [Google Scholar] [CrossRef] [Scilit]
- Mandal, T.K.; Parker, J.; Gagliano, M.; Martínez-Paneda, E. Computational Predictions of Weld Structural Integrity in Hydrogen Transport Pipelines. Int. J. Hydrogen Energy 2025, 136, 923–937. [Google Scholar] [CrossRef] [Scilit]
- Wijnen, J.; Parker, J.; Gagliano, M.; Martínez-Paneda, E. A Computational Framework to Predict Weld Integrity and Microstructural Heterogeneity: Application to Hydrogen Transmission. Mater. Des. 2025, 249, 113533. [Google Scholar] [CrossRef] [Scilit]

Disclaimer/Publisher’s Note: The statements, opinions and data contained in all publications are solely those of the individual author(s) and contributor(s) and not of MDPI and/or the editor(s). MDPI and/or the editor(s) disclaim responsibility for any injury to people or property resulting from any ideas, methods, instructions or products referred to in the content. |
© 2026 by the authors. Licensee MDPI, Basel, Switzerland. This article is an open access article distributed under the terms and conditions of the Creative Commons Attribution (CC BY) license.