


Abstract
Background/Objectives: Human immunodeficiency virus (HIV) infection is characterized by chronic systemic inflammation. Antiretroviral therapy (ART) can reduce persistent inflammation, as measured by C-reactive protein (CRP). The CRP methylation risk score (MRSCRP) acts as proxy for plasma CRP, but longitudinal changes in this score for people with HIV (PWH) before and after initiating ART have not been described. Methods: We evaluated a previously published MRSCRP in the Emory Twin Study (N = 352), testing its correlation with plasma CRP and CRP-responsive biomarkers, as well as associations with cardiometabolic traits using generalized estimating equations (GEEs). We then applied MRSCRP in the HIV AIDS Drug Resistance Surveillance Study (ADReSS) cohort (N = 440) to assess longitudinal changes before and after ART, using paired t-tests and linear mixed-effects models. Results: MRSCRP showed moderate correlation with CRP (r = 0.38) and other inflammatory biomarkers (r = 0.25–0.34). MRSCRP was associated with hypertension, type 2 diabetes, coronary artery disease, and obesity, and remained independently associated with obesity (odds ratio = 1.49) after adjusting for measured CRP. Z-score-standardized MRSCRP decreased by 0.254 standard deviation units between baseline and follow-up among PWH receiving ART, confirmed by linear mixed-effects models. Conclusions: MRSCRP showed associations with chronic inflammation and cardiometabolic diseases. The observed decline in MRSCRP following ART initiation may reflect changes in inflammatory status among PWH. These findings highlight the potential of MRSCRP as a marker of inflammation-related changes and comorbidity risk in PWH.
1. Introduction
More than 1.2 million people in the United States are living with human immunodeficiency virus (HIV) infection [1]. Untreated HIV infection can lead to significant CD4+ T-cell depletion and dysfunction, ultimately leading to acquired immune deficiency syndrome (AIDS) [2]. Over the past several decades, antiretroviral therapy (ART) has substantially reduced the global burden of AIDS by improving immune function and suppressing HIV viral replication [3,4]. Although ART can delay progression to AIDS, people with HIV (PWH) frequently experience comorbidities during long-term treatment [5].
Inflammation is an independent predictor of HIV progression and a risk factor for HIV-related comorbidities [6,7]. Chronic low-grade inflammation induced by persistent HIV infection contributes to inflammatory cytokine elevation, which increases the risk of cardiometabolic diseases [8,9,10], including acute myocardial infarction [9] and chronic obstructive pulmonary disease (COPD) [11].
C-reactive protein (CRP) is a biomarker that provides information about an individual’s chronic inflammatory status, distinct from traditional markers of HIV infection progression, such as CD4 count and viral load [12]. CRP levels can be reduced during ART [13]; therefore, monitoring CRP levels could enhance the prediction of HIV-related cardiometabolic diseases and mortality [9,14,15]. However, the use of CRP as a marker of ART-related inflammatory changes is complicated by its sensitivity to acute conditions such as infection, trauma, liver dysfunction, and psychological stress [16,17,18,19,20]. This variability could complicate the assessment of inflammatory recovery from ART in PWH, reducing the utility of CRP as a biomarker for risk of chronic diseases attributable to inflammation.
DNA methylation is an epigenetic modification that regulates gene expression without changing the underlying DNA sequence, primarily occurring at cytosine-phosphate-guanine (CpG) sites. In a cell-based epigenomic study, DNA methylation changes induced by the HIV trans-activator of transcription (Tat) protein were associated with inflammatory regulation in PWH [21]. An epigenome-wide association study (EWAS) that examined DNA methylation patterns at CpG sites across the genome revealed unique inflammation-related signatures among PWH [22]. Recently, several large, multi-ancestry EWAS have discovered CpG sites associated with plasma CRP levels [23,24,25,26]. These results are the basis for CRP methylation risk scores (MRSCRP) that have been built using advanced statistical and machine-learning models. In several cross-sectional studies, MRSCRP demonstrated stronger associations than plasma CRP with cardiometabolic diseases, sleep outcomes, and COPD [23,24,27]. However, MRSCRP has not been investigated for its potential to monitor longitudinal, chronic inflammatory changes.
MRSCRP has better temporal stability than plasma CRP, as demonstrated by its higher intraclass correlation coefficient in a longitudinal setting [28]. By capturing an epigenetic signature of CRP, MRSCRP may provide a more robust measure of cumulative inflammation in individuals with chronic infections like HIV. In this study, we aimed to evaluate the use of MRSCRP in a longitudinal cohort of PWH. We utilized three previously published MRSCRP derived from large multi-ancestry cohorts to maximize generalizability and assess their potential utility in capturing inflammation-related changes following ART. We hypothesized that MRSCRP could be a potential indicator of chronic, low-grade inflammatory changes in PWH before and after ART.
2. Results
2.1. MRSCRP Evaluation in the Emory Twin Study
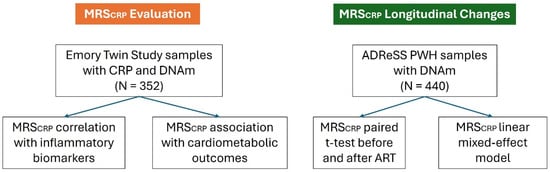
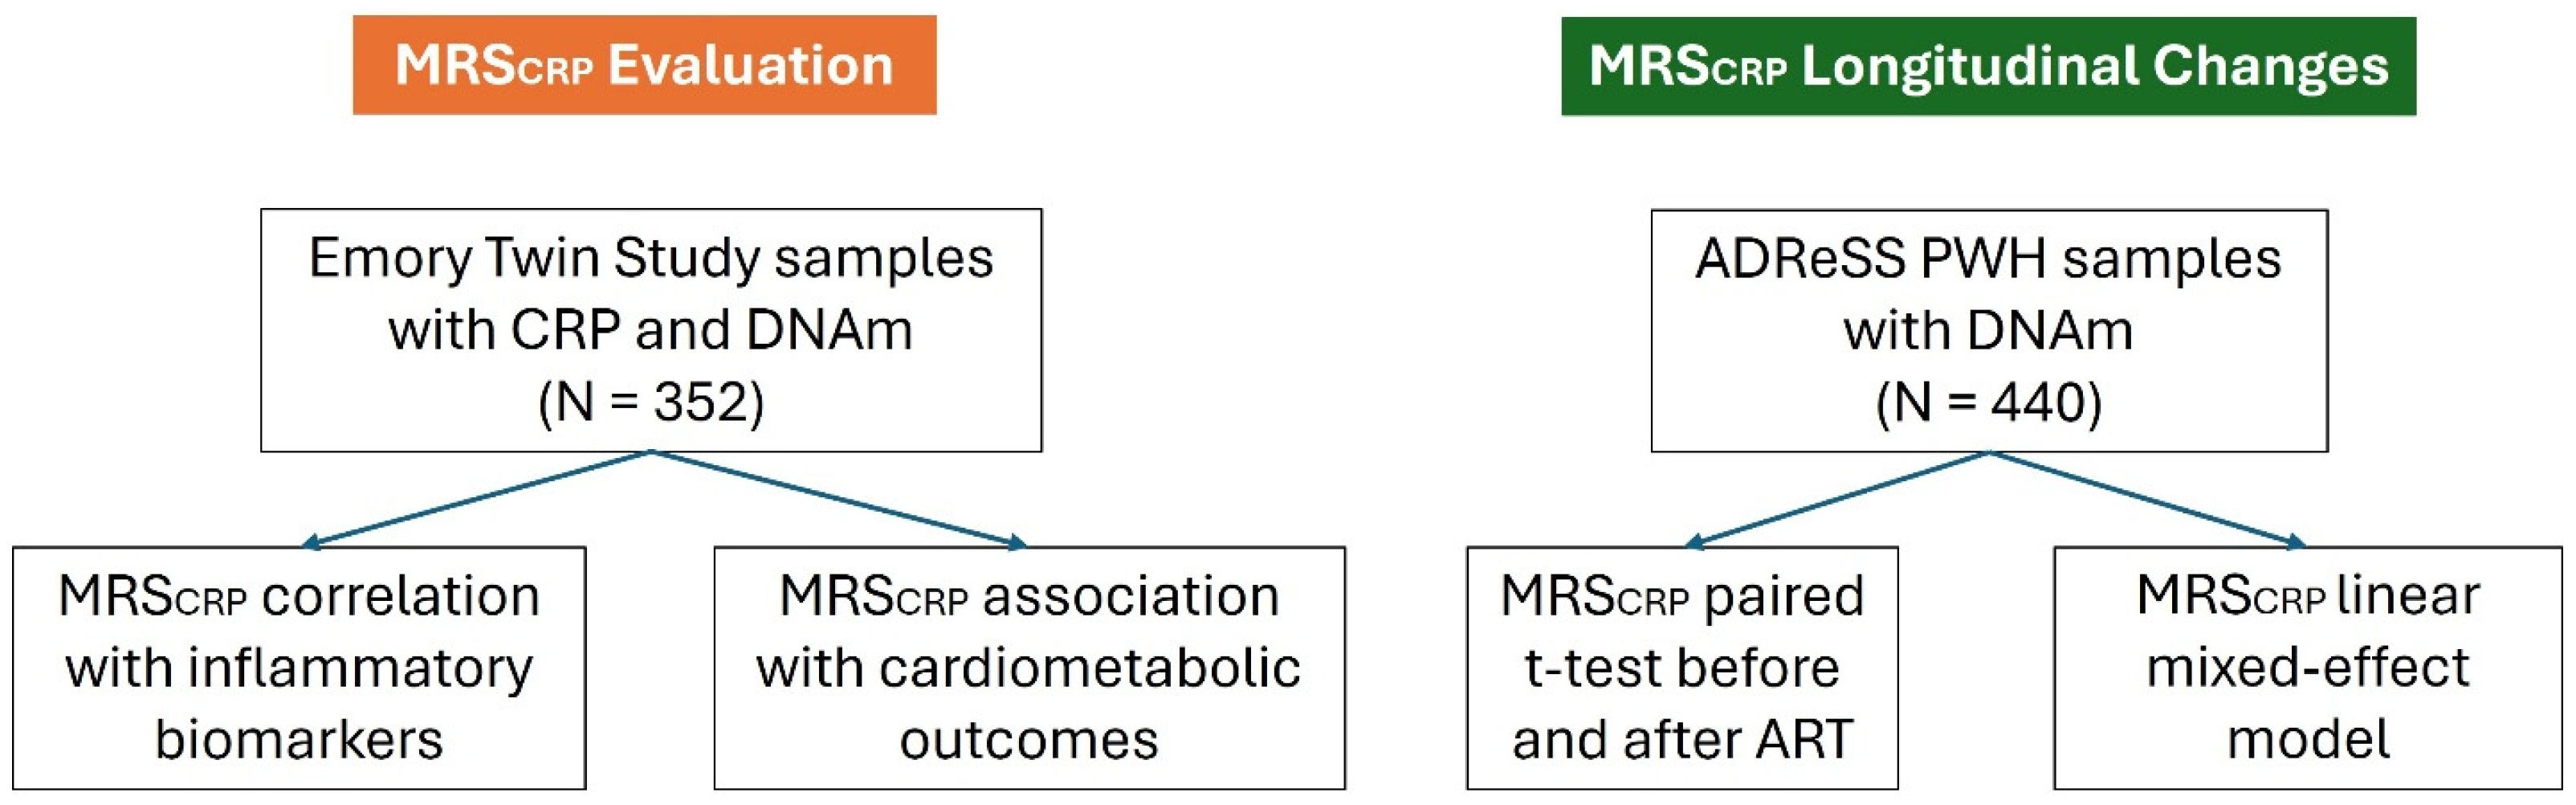
As outlined in the study design (Figure 1), we first evaluated three previously published MRSCRP derived from large multi-ancestry EWAS in the Emory Twin Study to identify the best-performing score. The MRSCRP included MRSCRP developed from an EWAS by Wielscher et al. (MRSCRP_W) [23] and MRSCRP developed from Hillary et al.’s EWAS using (1) a Bayesian penalized-regression-based model (MRSCRP_B) and (2) an elastic net regression-based model (MRSCRP_E) [24]. Demographic and clinical information for the Emory Twin Study participants is presented in Table 1. A total of 352 male participants were included in the evaluation of MRSCRP, with an average age of 55.7 years. Most participants were non-Hispanic white. Approximately 27% of the study population were current smokers. The mean body mass index (BMI) was 29.8 kg/m2. The median and interquartile range (IQR) of plasma high-sensitivity CRP and triglyceride levels were 1.5 mg/L (2.6 mg/L) and 161.0 mg/dL (109 mg/dL). Clinical traits among participants included obesity (45%), type 2 diabetes (12.8%), and prevalent coronary artery disease (CAD) (11.4%).
Figure 1.
Overview of study design and workflow.
Table 1.
Emory Twin Study participant characteristics (N = 352).
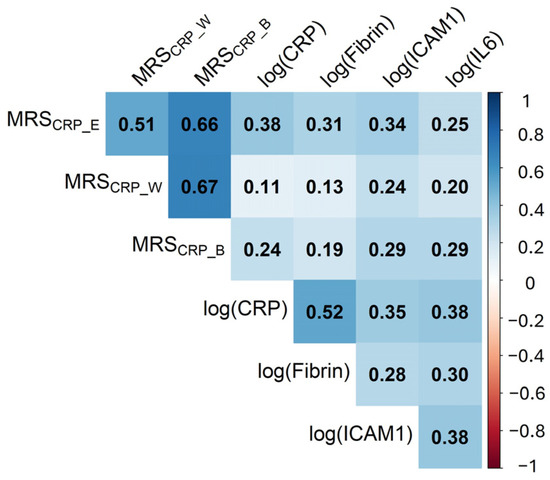
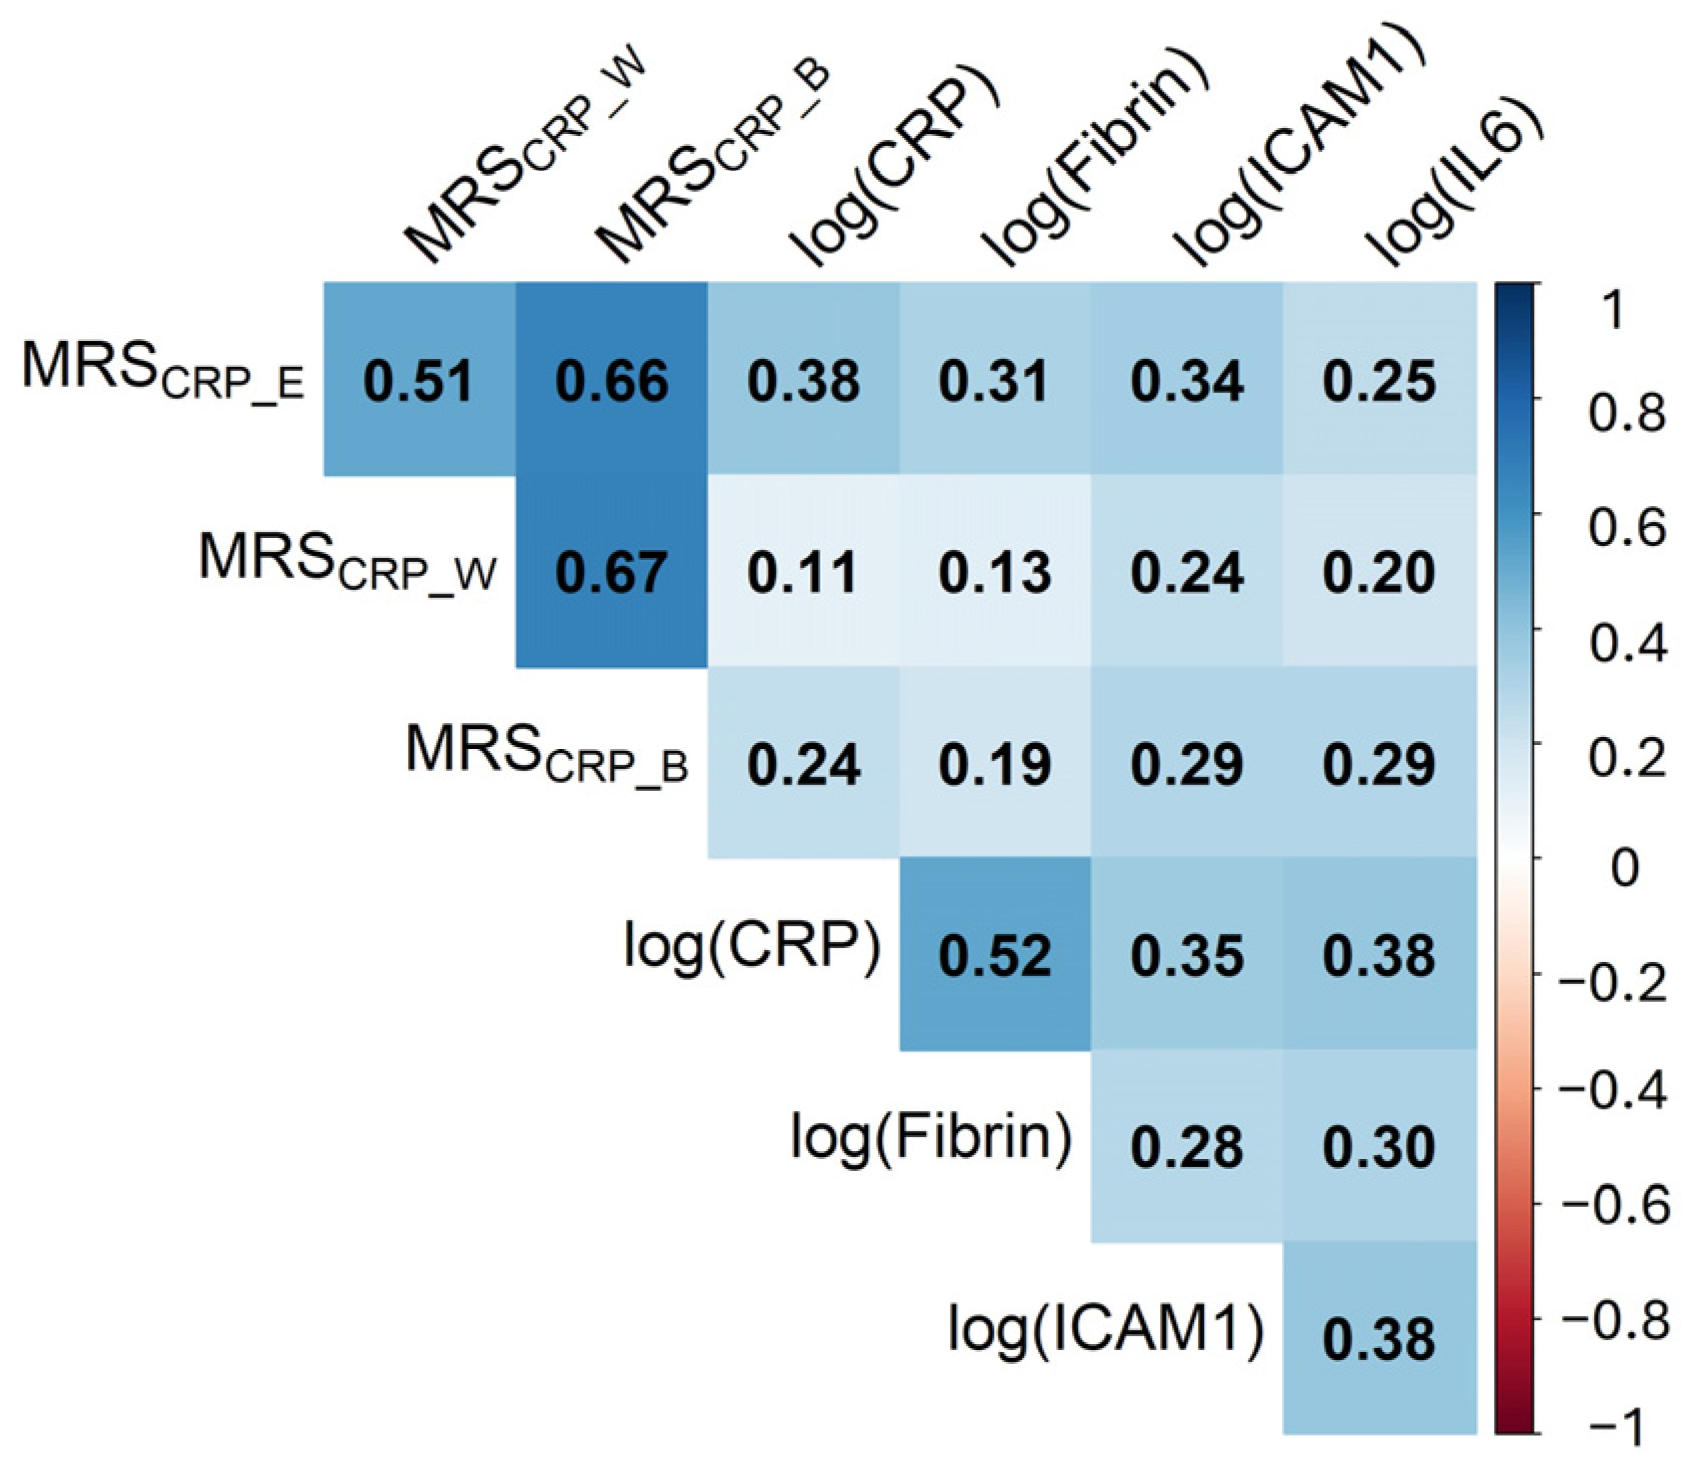
Three MRSCRP (MRSCRP_W, MRSCRP_B, and MRSCRP_E) with different weights were calculated for participants in the Emory Twin Study. Among the three MRSCRP, MRSCRP_E showed the strongest correlation with natural log-transformed plasma CRP, with a Pearson correlation coefficient of 0.38. In addition, MRSCRP_E correlated most strongly with pro-inflammatory markers fibrin and Intercellular Adhesion Molecule 1 (ICAM-1) (Pearson correlation coefficients 0.31 and 0.34, respectively). Interleukin-6 (IL-6) was slightly less strongly correlated with MRSCRP_E compared with MRSCRP_B. All MRSCRP showed weaker correlations with other inflammatory markers compared with plasma CRP. The full results are summarized in Figure 2.
Figure 2.
Pearson correlation matrix between calculated MRSCRP and plasma level of other inflammatory biomarkers in the Emory Twin Study, while accounting for twin pairs. Due to skewed data for these biomarkers, each was transformed (natural log transformation) to obtain a normal distribution. The values in each cell represent Pearson correlation coefficients and are shown in gradient colors.
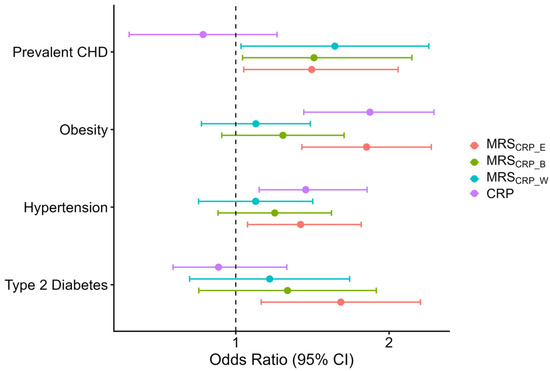
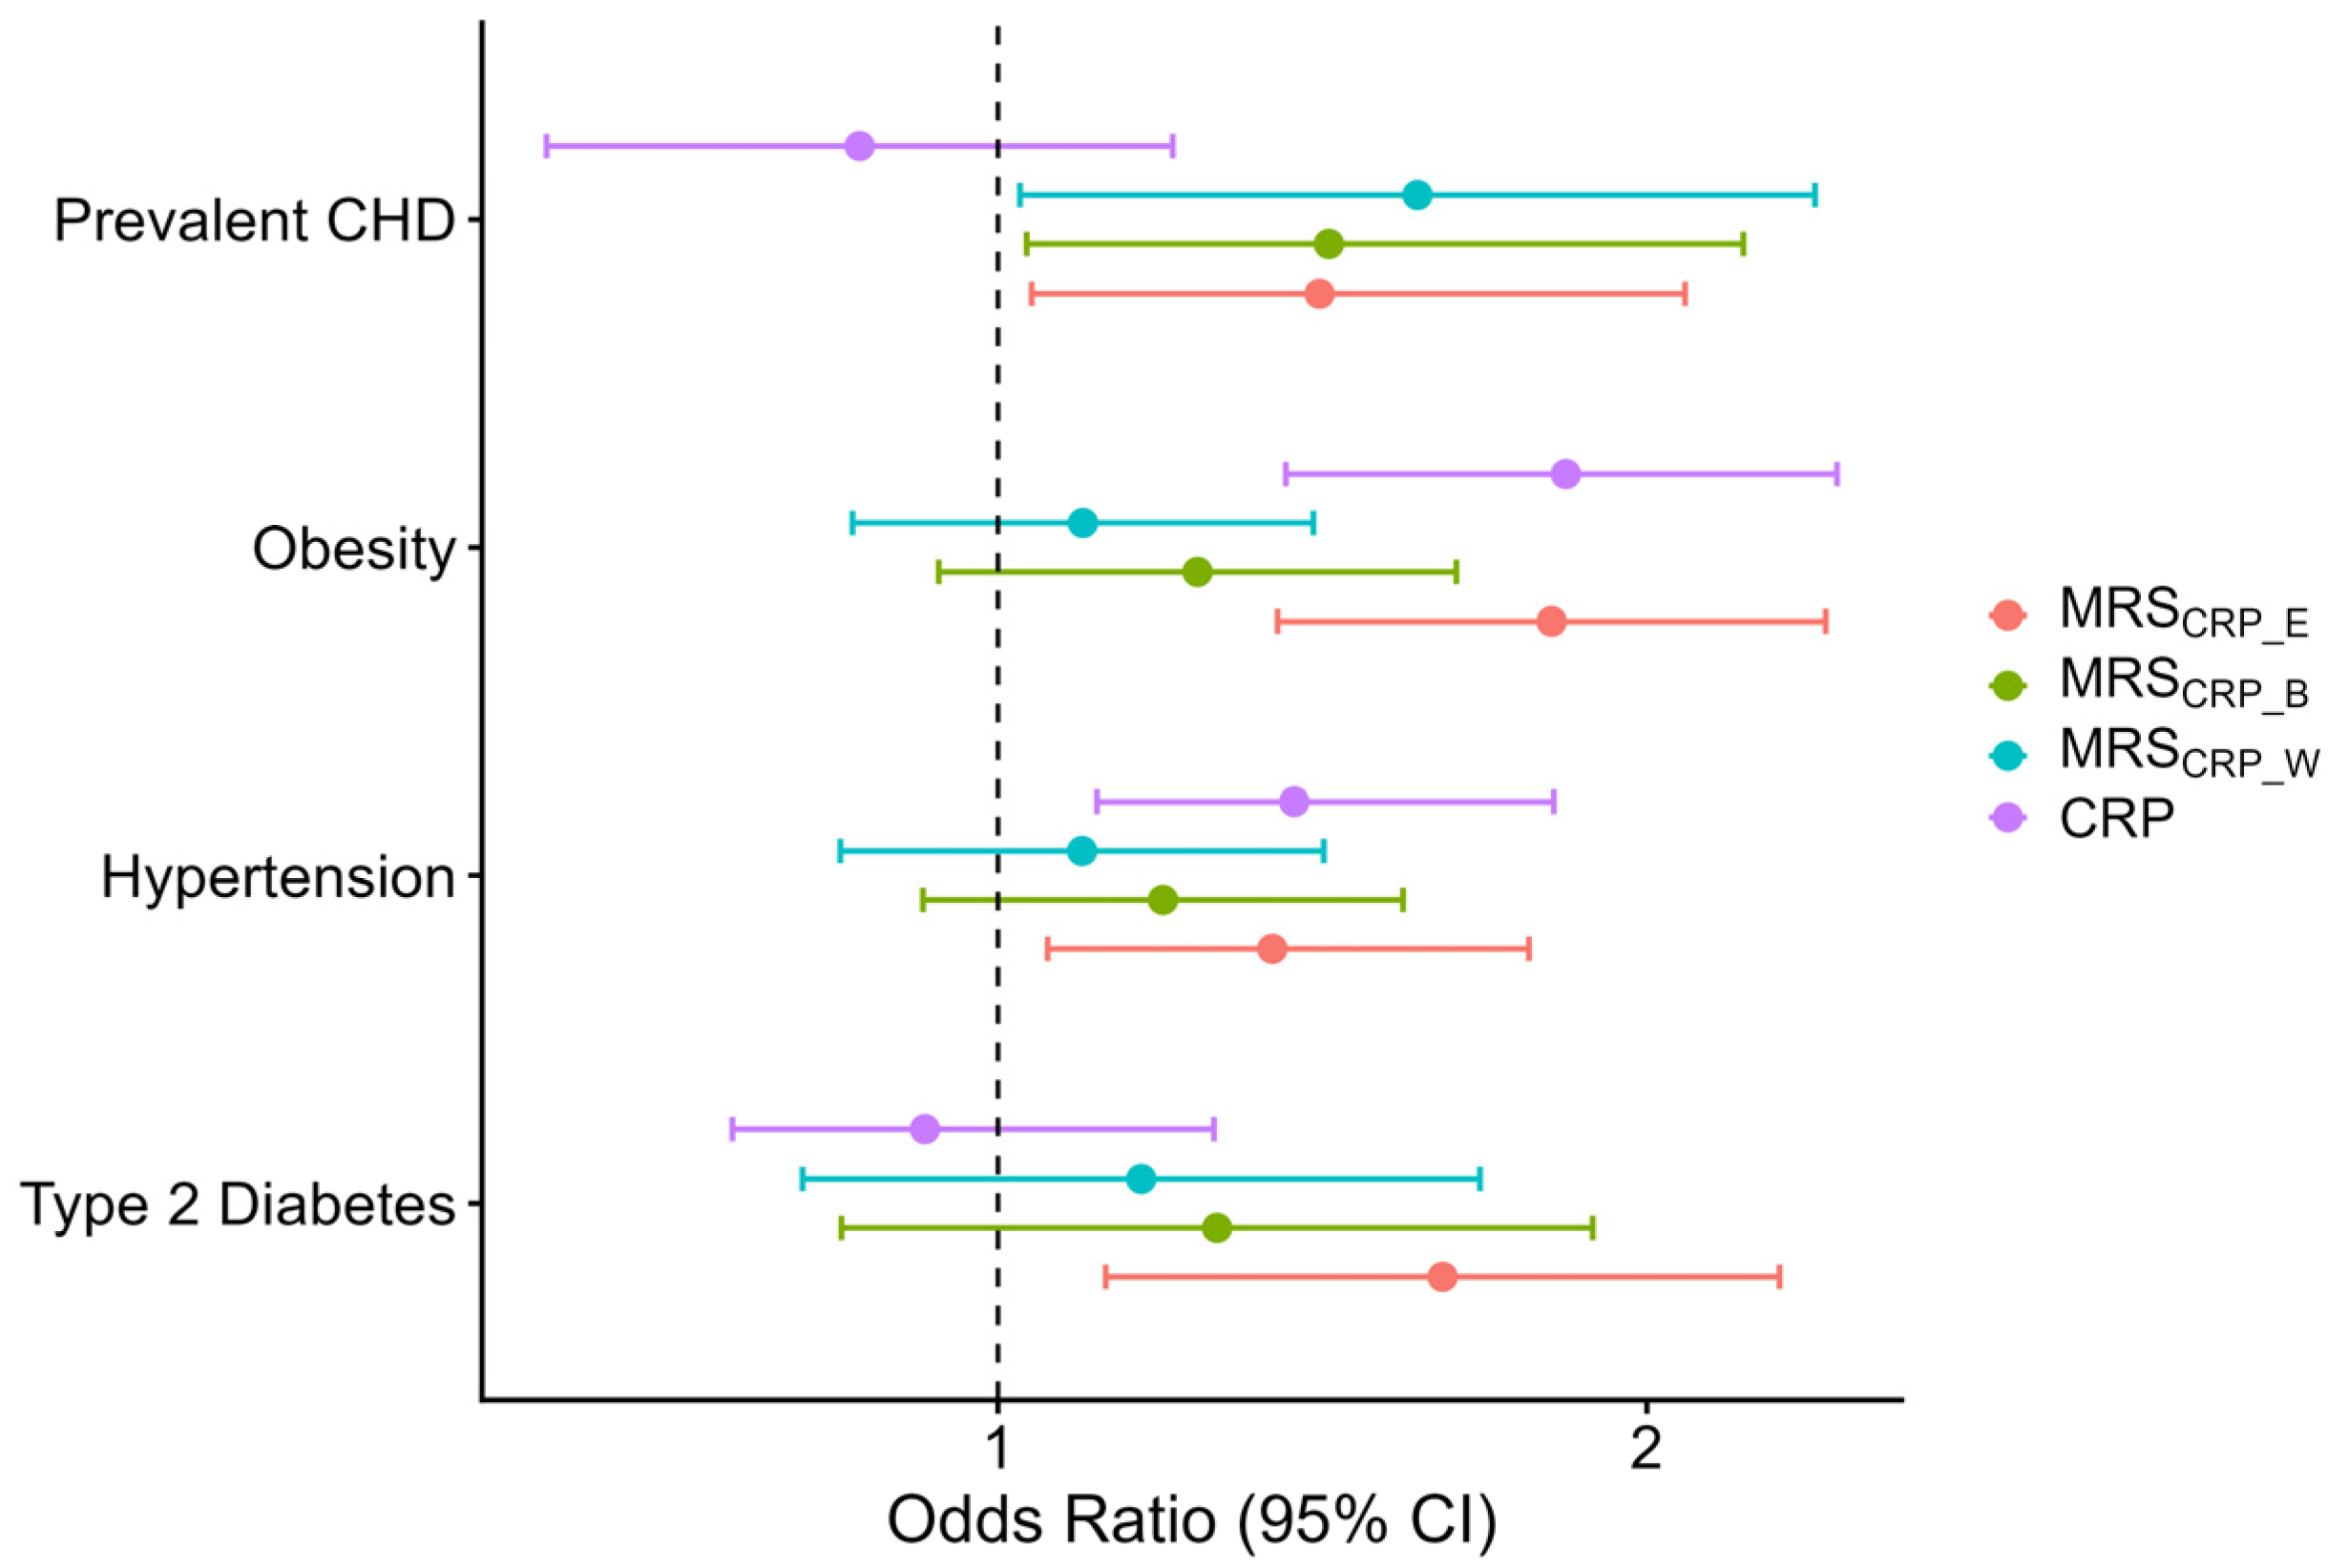
The associations of plasma CRP and MRSCRP with binary cardiometabolic variables, including prevalent CAD, obesity, hypertension, and type 2 diabetes, are shown in Figure 3. In the generalized estimating equation (GEE) models testing associations between CRP, MRSCRP, and binary clinical phenotypes, only MRSCRP_E was significantly associated with all tested traits. Plasma CRP was significantly associated only with obesity and hypertension. MRSCRP_W and MRSCRP_B exhibited similar effect sizes for prevalent CAD compared with MRSCRP_E but showed weaker associations for all other clinical phenotypes. Linear mixed-effects models for continuous variables showed that CRP and MRSCRP_E had comparable association strengths with the tested continuous phenotypes, whereas the other MRSCRP had weaker associations. These results are available in Figure S1.
Figure 3.
CRP measures associated with clinical phenotypes in the Emory Twin Study. Odds ratios with 95% confidence intervals based on the GEE model. The vertical dashed line indicates null values.
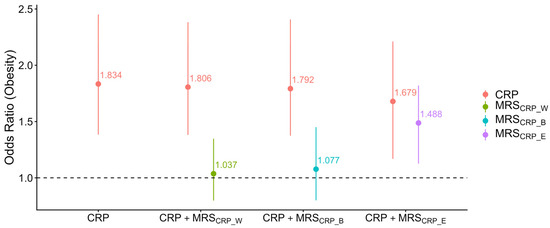
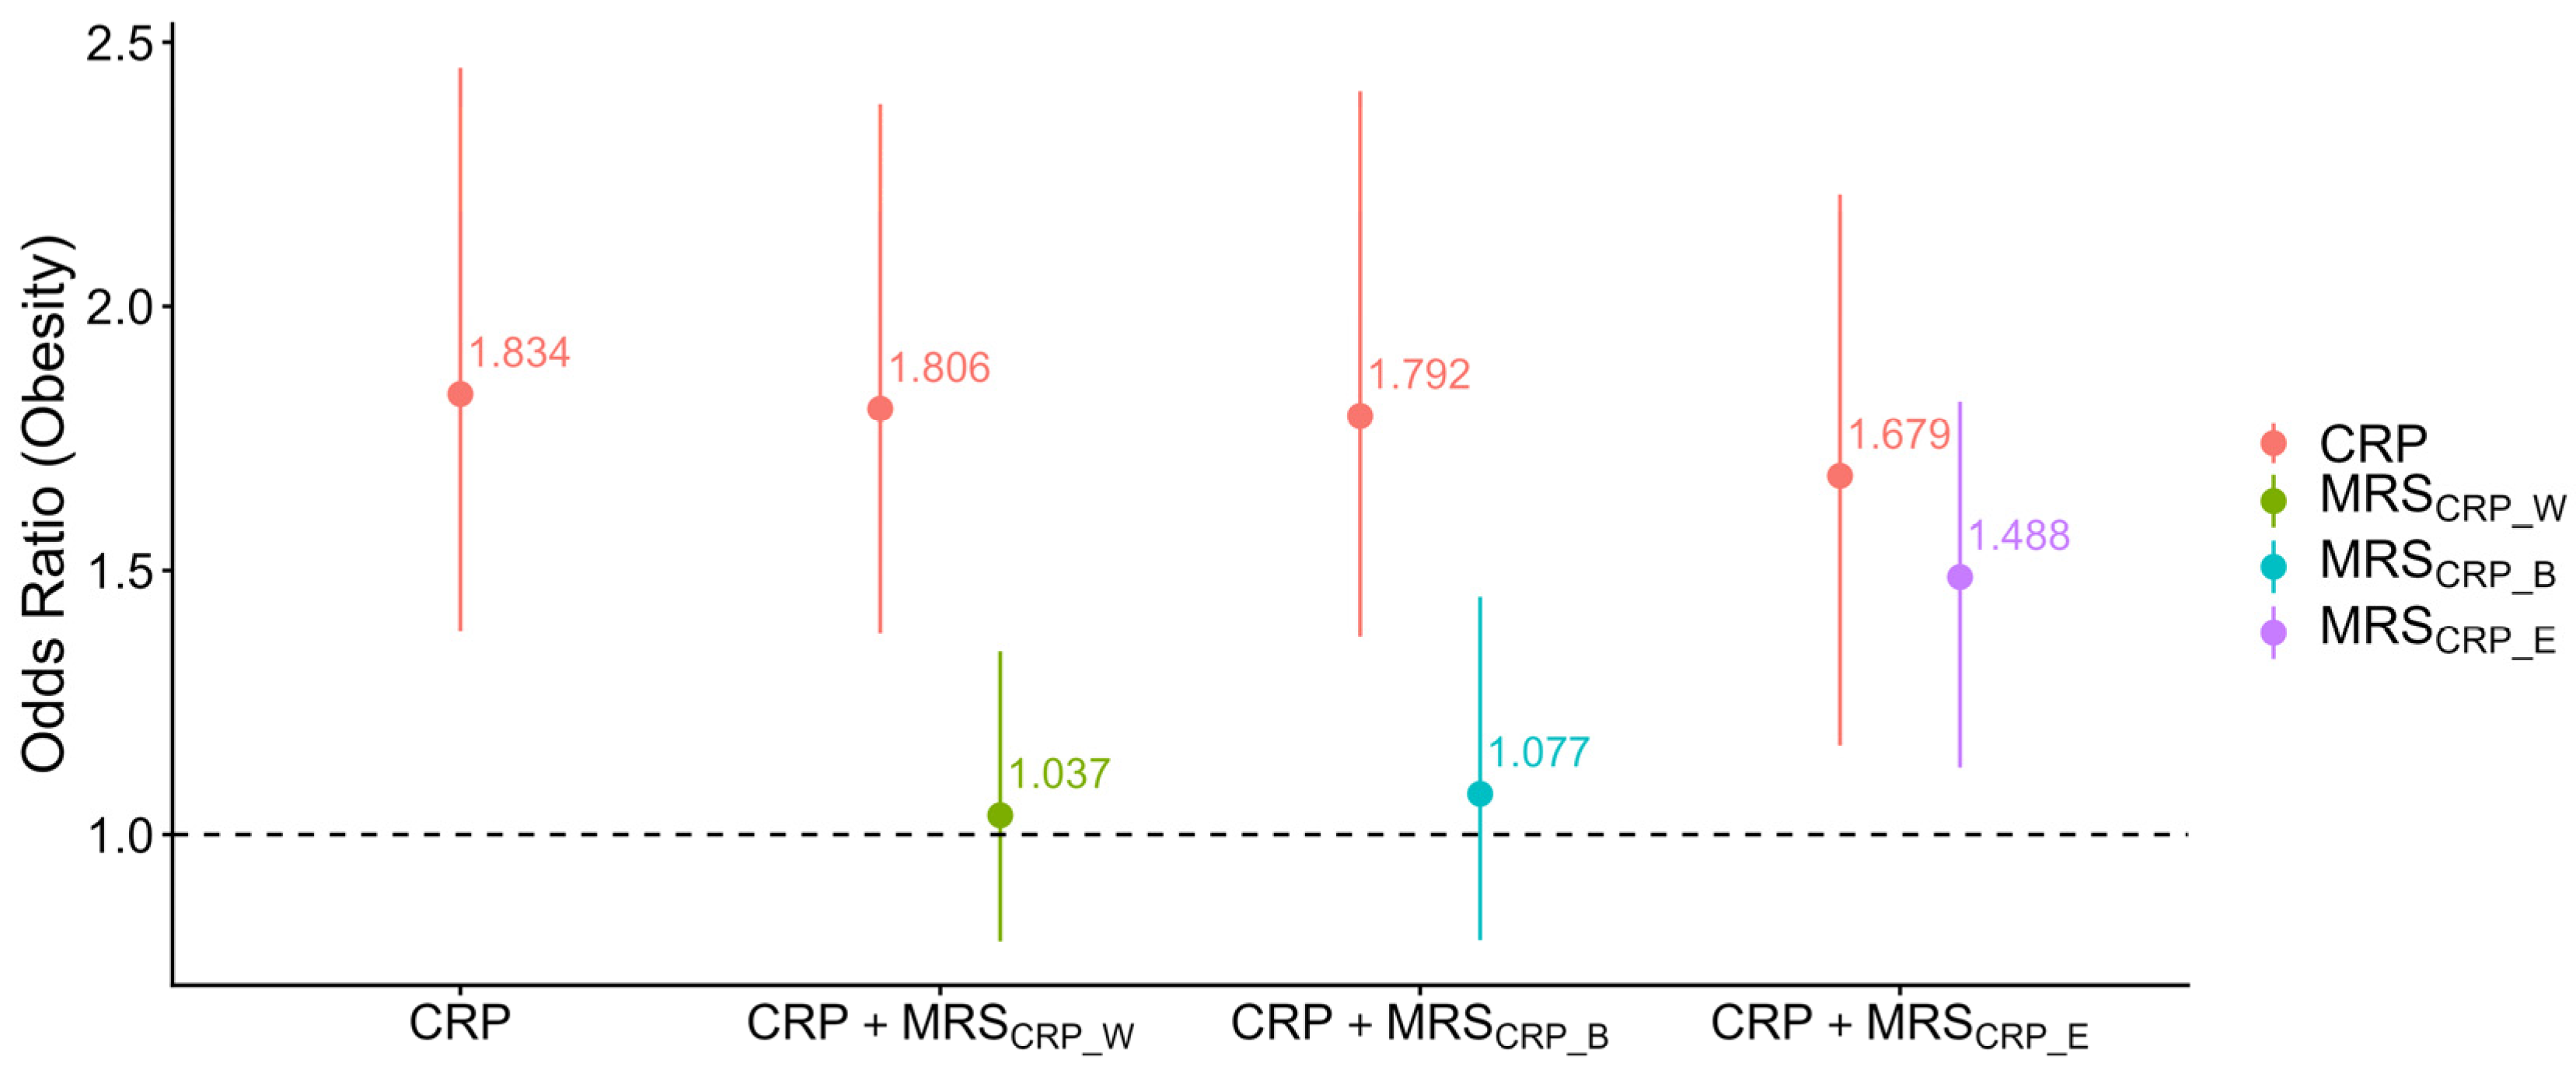
We further examined associations of MRSCRP with clinical phenotypes, adjusted for plasma CRP to evaluate independent associations. The only MRSCRP association that remained significant after adjusting for plasma CRP was the association of MRSCRP_E with obesity (Figure 4, Figure S2). In the last model, where plasma CRP and MRSCRP_E were included with adjustment for age and co-twins, significant positive associations were observed for both CRP and MRSCRP_E, but not for other MRSCRP. In this model, plasma CRP and MRSCRP_E were both significantly associated with obesity, with one-unit increases corresponding to 1.68 and 1.49 times the odds of obesity, respectively.
Figure 4.
Association of CRP with obesity in models including MRSCRP, adjusting for age and co-twin status. Each CRP measure is labeled in a different color. Bars represent effect estimates and 95% confidence intervals. The horizontal dashed line indicates null values.
In conclusion, because of its consistent correlations with CRP and other inflammatory biomarkers and its significant and independent association with obesity, we decided to proceed with MRSCRP_E as an indicator of low-grade inflammation for exploring longitudinal changes in PWH before and after ART.
2.2. MRSCRP Longitudinal Changes in ADReSS
We evaluated the longitudinal changes in MRSCRP_E in ADReSS. Demographic information for the ADReSS study populations at baseline and follow-up is summarized in Table 2. At both time points, 60.7% of participants were female. With an average of 6.5 years of follow-up, the mean age of participants increased from 34.6 years to 41 years. Mean CD4 counts increased from 259 cells/μL at baseline to 504 cells/μL at follow-up. Over 98% of participants in the study population received the fixed-dose combination tablet of efavirenz/emtricitabine/tenofovir disoproxil fumarate (EFV/FTC/TDF), while participants with contraindications to this regimen received zidovudine or abacavir in place of TDF and nevirapine in place of EFV. Because nearly all participants received the same first-line ART regimen, meaningful comparisons across treatment regimens were not feasible.
Table 2.
ADReSS cohort participant characteristics (N = 440).
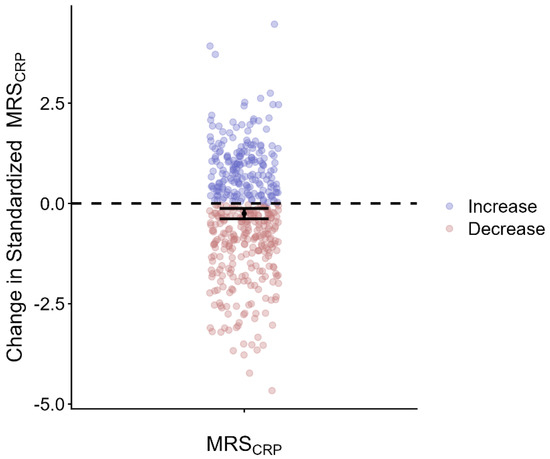
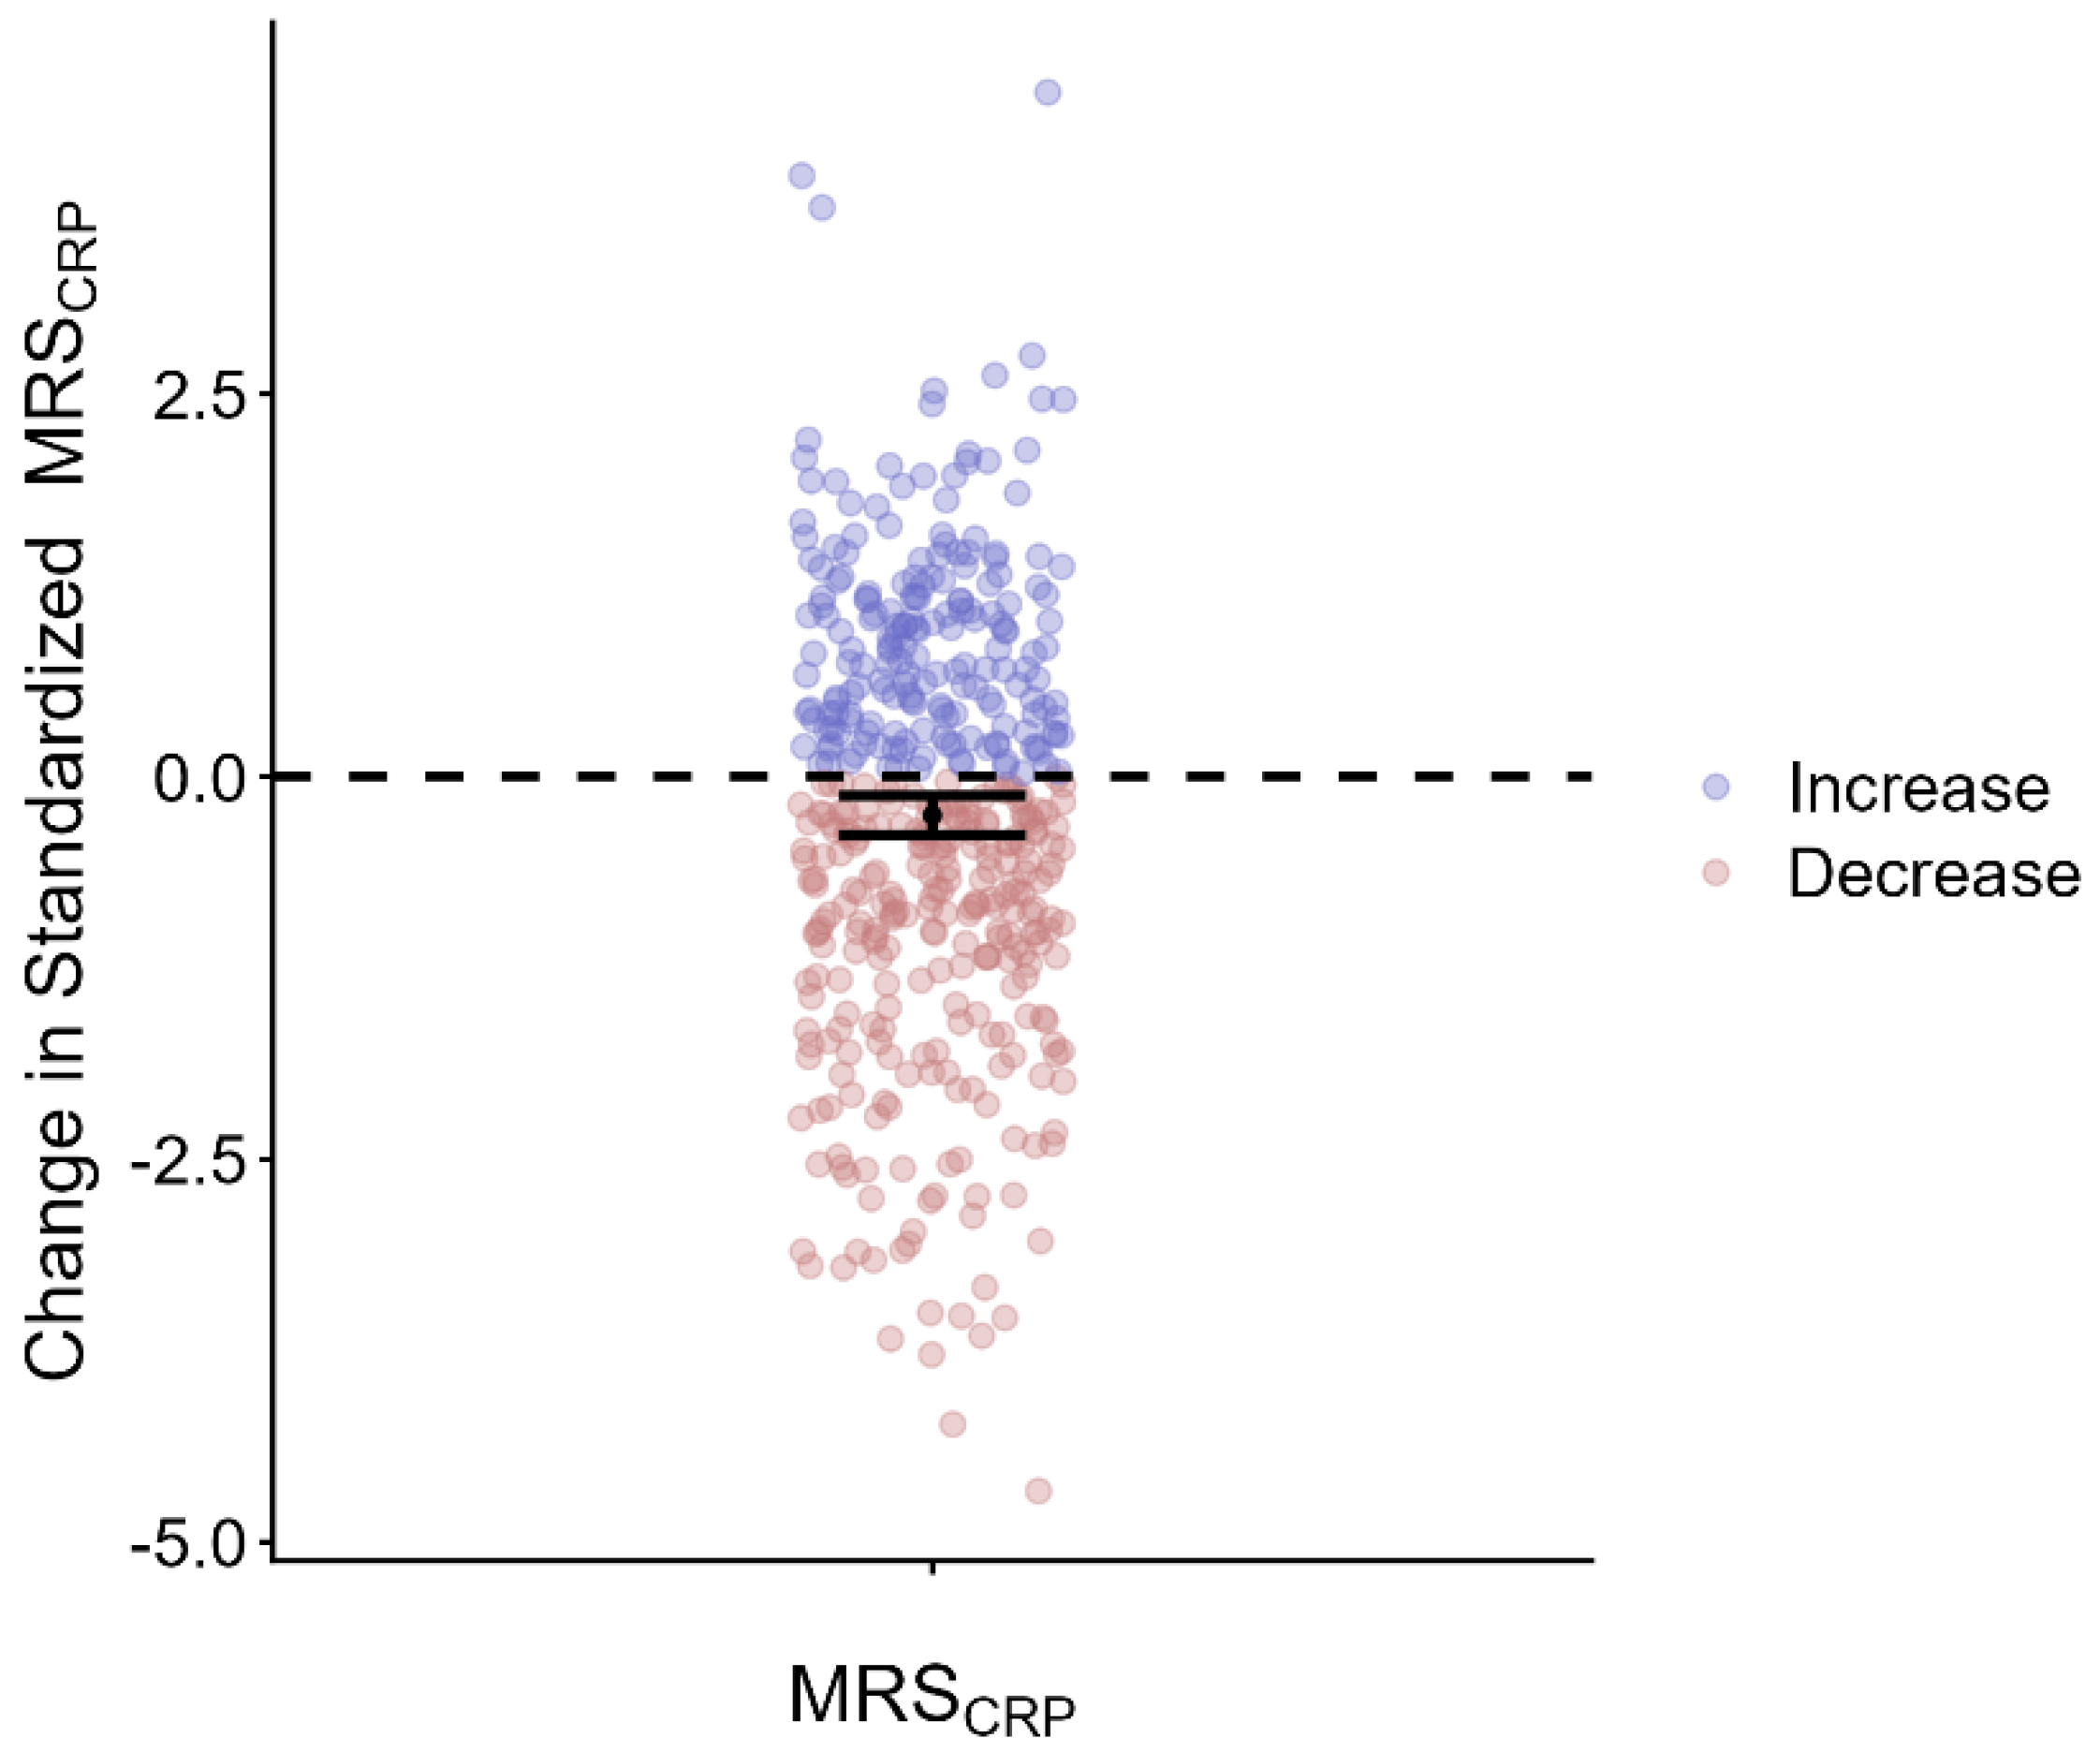
On average, MRSCRP_E declined by 0.254 standardized units after ART, corresponding to a decrease of 0.254 standard deviations relative to the overall ADReSS cohort distribution (paired t-test, p = 5.47 × 10⁻⁵) (Figure 5). The average MRSCRP_E predicted by a linear mixed-effects model with a random intercept for each participant showed an overall longitudinal decline in MRSCRP_E (Figure S3). Predicted plasma CRP levels (mg/L) are presented in Figure S3. In sensitivity analyses, the overall decrease in MRSCRP_E remained significant when the same linear mixed-effects model was adjusted for time-varying CD4 counts and their interaction with follow-up duration (Table S1). The results were still consistent after further adjustment for time-varying white blood cell proportions and methylation-based smoking status (Table S1).
Figure 5.
Changes in MRSCRP after ART initiation among people with HIV. The y-axis represents the change in standardized MRSCRP. People with decreased MRSCRP after ART compared with baseline are colored in red, and people with increased MRSCRP after ART compared with baseline are colored in blue. The black dot represents the overall change in standardized MRSCRP after ART, calculated as the mean difference between ART follow-up and baseline MRSCRP values (paired t-test), and the error bar represents the corresponding 95% confidence interval. MRSCRP values were jointly standardized. The reported change represents the difference in standard deviation (SD) units (mean difference: 0.254 SD units, paired t-test p-value: 5.47 × 10⁻⁵).
3. Discussion
Our study evaluated MRSCRP, an epigenetic proxy of plasma CRP, as a potential marker for chronic inflammatory changes in PWH. We first evaluated three previously published MRSCRP [23,24] in the Emory Twin Study for correlations with plasma CRP and other common biomarkers of inflammation. We further examined associations of MRSCRP with selected cardiometabolic traits. We found that the MRSCRP published by Hillary et al. using an elastic net regression model (MRSCRP_E) [24] performed best. MRSCRP_E remained significantly associated with obesity after adjusting for plasma CRP, suggesting that it captured additional biological information. We proceeded to evaluate longitudinal changes in MRSCRP_E among PWH in ADReSS, before and an average of 6.5 years after beginning ART. We found that, on average, MRSCRP_E declined, although some increases were observed.
CRP is an important marker of chronic, systemic low-grade inflammation [29], but it also increases rapidly during acute infection or injury [30]. In comparison, MRSCRP, an epigenetic proxy of CRP, exhibits greater temporal stability [28]. In previously reported results, MRSCRP_E showed a moderate correlation with plasma CRP, ranging from 0.27 to 0.53 across cohorts. In our study, MRSCRP_E was consistently correlated with plasma CRP, as well as with IL-6, ICAM-1, and fibrinogen, outperforming the other MRSCRP we evaluated.
The moderate correlation between MRSCRP_E and plasma CRP in our study (Pearson correlation coefficient = 0.38) is expected because these measures may capture overlapping but different dimensions of inflammatory biology. Given that DNA methylation patterns can capture cumulative biological responses to environmental and disease-related exposures [31], while plasma CRP reflects circulating inflammatory status at a specific time point and can be influenced by transient inflammatory events [16,17,18,19,20], MRSCRP_E captures a component of CRP-related inflammatory biology while also reflecting additional biological information, which may not be fully represented by a single CRP measurement. MRSCRP should therefore not be interpreted as a replacement or direct surrogate for plasma CRP, but rather as a complementary epigenetic biomarker that provides additional information on chronic inflammatory processes. These results support the validity of MRSCRP_E as an epigenetic proxy of systemic inflammatory status. These findings suggest that MRSCRP_E captures not only biological information complementary to plasma CRP but also a broader systemic inflammatory burden.
MRSCRP_E showed significant associations with cardiometabolic traits, including continuous measures (BMI, triglycerides, and HDL) and binary phenotypes (obesity, hypertension, type 2 diabetes, and prevalent CAD). Plasma CRP demonstrated similar directionality of associations with these traits, whereas other MRSCRP showed weaker or attenuated relationships. Notably, the association between MRSCRP_E and obesity remained significant after adjustment for plasma CRP. Together, these findings suggest that MRSCRP_E captures components of systemic inflammatory burden not fully reflected by circulating CRP and may serve as an epigenetic marker of cardiometabolic-related inflammation.
As plasma CRP is prone to fluctuations with infection and other chronic diseases [16,17,32], MRSCRP could have improved performance as a marker of long-term inflammation among people with a chronic infection. Previous studies have underscored how epigenetics can provide additional biological insight into inflammatory processes for PWH [21,22]. In our ADReSS cohort, the average longitudinal decrease in MRSCRP_E was 0.254 standard deviation units, corresponding to an estimated reduction of 0.16 mg/L in plasma CRP during an average follow-up of 6.5 years after ART initiation. The lack of measured CRP limits our ability to directly reference changes in inflammatory status. However, CRP may be influenced by acute inflammatory events and therefore may not fully capture long-term inflammatory burden. A prior study reported a minimal median within-person change in plasma CRP levels after ART initiation (approximately a 1% reduction from pre-ART levels), compared with larger median reductions observed for other inflammatory biomarkers (ranging from 5% to 25%) [33]. Given that a prior EWAS has shown that ART initiation in PWH is associated with DNA methylation changes [34], the observed overall reduction in MRSCRP in our study may capture longitudinal epigenetic changes associated with inflammatory regulation and provide additional insight into inflammatory changes during ART beyond what may be reflected by transient plasma CRP measurements. A previous epigenetic study has demonstrated that DNA methylation changes after ART are enriched in immune-related pathways [34], and other work has demonstrated the partial reversal of HIV-associated DNA methylation after ART [35]. While these studies have focused on immune-related processes, the longitudinal decline in MRSCRP observed in our study, and the consistent decline after accounting for changes in CD4 count, white blood cell proportions, and methylation-based smoking status, are consistent with the possibility that ART-associated epigenetic changes may reflect improvements in inflammatory regulation. This may represent a complementary dimension of ART-induced epigenetic dynamics and could direct future epigenetic studies on inflammation for PWH under ART.
Our finding of longitudinal changes in MRSCRP after ART among PWH aligns with emerging work suggesting that DNA methylation-based inflammatory signatures can capture cumulative inflammatory exposure [36,37]. Therefore, among PWH receiving ART, MRSCRP may reflect longer-term inflammatory recovery and immune activation better than the transient fluctuations seen in circulating CRP levels. Overall, our results support the potential utility of methylation-based biomarkers as dynamic indicators of inflammation in PWH.
Our study has several limitations. First, due to a lack of relevant data, our analysis did not consider factors other than ART that could have effects on inflammation or epigenetic profiles. These could include other infections or unmeasured environmental or behavioral factors. Furthermore, the lack of a non-HIV longitudinal control group limits our ability to determine whether the observed changes in MRSCRP were attributable to ART or reflected other longitudinal factors, such as aging, lifestyle changes, long-term medication use, and comorbidities. Although we performed sensitivity analyses adjusting for time-varying CD4 counts, estimated white blood cell proportions, and methylation-based smoking status, the observed decline in MRSCRP may not fully capture the true changes in inflammatory status among PWH. In particular, the lack of measured plasma CRP levels in ADReSS can introduce uncertainty because changes in MRSCRP may not directly correspond to changes in circulating CRP levels, limiting our ability to determine how closely longitudinal changes in MRSCRP reflect changes in conventional inflammatory biomarkers. We observed some individuals with increased MRSCRP after ART initiation, despite the overall decline observed in the cohort. This unexpected pattern may reflect residual confounding factors affecting DNA methylation levels or individual variability in inflammatory responses. Future studies incorporating more comprehensive phenotypic data will be needed to further investigate the factors contributing to longitudinal changes in MRSCRP. Our longitudinal analysis was conducted in a South African cohort. Therefore, the results may not be generalizable to other ancestry groups. Additionally, although MRSCRP did not demonstrate sex- or ancestry-specific differences [23,24], further validation is needed to evaluate its cross-ancestry performance and its ability to capture longitudinal changes across diverse populations. Finally, the causal relationships between MRSCRP and clinical traits require further investigation, especially in a longitudinal setting.
4. Materials and Methods
4.1. Study Design
We selected three MRSCRP from previous EWAS across multiple ancestry groups [23,24]. In the Emory Twin Study, we first evaluated the performance of each MRSCRP to identify the optimal score. We calculated three MRSCRP and assessed their correlations with plasma CRP and other inflammatory markers, and their associations with various clinical phenotypes known to be associated with inflammation. We further evaluated whether these associations persisted after adjustment for plasma CRP to assess whether MRSCRP captured complementary information.
After selecting the best-performing MRSCRP, we applied this score to an independent cohort, the HIV/AIDS Drug Resistance Surveillance Study (ADReSS), to evaluate longitudinal changes before and after ART initiation among PWH. The study design workflow is presented in Figure 1.
4.2. The Emory Twin Study
The Emory Twin Study is a subset of the Vietnam Era Twin (VET) Registry, one of the largest national registries of male monozygotic (MZ) and dizygotic (DZ) twin pairs. Participants were enlisted by the US military during the Vietnam conflict and were mostly White [38]. Participants underwent paired, in-person baseline evaluations and blood collection at the Emory University General Clinical Research Center between 2002 and 2010. Follow-up evaluations took place on average 11.5 years later, either on-site or by phone [39]. Medical history and physical examinations were conducted for all participants at the in-person visits. All twin pairs were examined on the same day for consistency. In total, 352 twins (226 MZ and 126 DZ) with complete phenotypes and DNA methylation data were included in the present analysis to evaluate MRSCRP. The Emory Twin Study was approved by the Institutional Review Board at Emory University, and written informed consent was obtained from all participants.
Whole blood was collected and returned to the VET Registry overnight, where DNA was then extracted and stored for future research [40,41]. Plasma levels of inflammatory biomarkers, including high-sensitivity CRP (hs-CRP), interleukin-6 (IL-6), fibrinogen, and intercellular adhesion molecule-1 (ICAM-1), were quantified using commercially available ELISA kits (R&D Systems, Minneapolis, MN, USA). Enzymatic assays were used to quantify total cholesterol and triglyceride concentrations (Beckman Coulter Diagnostics, Fullerton, CA, USA). Body mass index (BMI) was calculated from each participant’s height and weight, measured in meters and kilograms. Obesity was defined as a BMI ≥ 30 kg/m2. Type 2 diabetes was defined by either the use of antidiabetic medications or a fasting glucose level > 126 mg/dL. A systolic/diastolic blood pressure measurement ≥ 130/80 mmHg was used to define hypertension. Prevalent coronary artery disease (CAD) was assessed through self-reported history of physician-diagnosed heart conditions or prior cardiovascular surgeries, including a history of myocardial infarction (MI), angioplasty, or coronary artery bypass graft (CABG).
Raw DNA methylation data were generated using the Illumina Infinium MethylationEPIC (850K) BeadChip (Illumina, Inc., San Diego, CA, USA) [42]. The preprocessing steps were performed as previously described [43]. Two probe designs were implemented: Infinium I probes measured methylated and unmethylated signals separately, whereas Infinium II probes used a single bead type to infer methylation status. Raw data were obtained from IDAT files and further processed using the minfi package in R [44]. Methylated and unmethylated signal intensities were extracted, and DNA methylation levels were quantified as beta values ranging from 0 (hypomethylation) to 1 (hypermethylation). Probes with a detection p-value greater than 0.01 were set to missing. Probes with more than 5% missing sites were removed. Samples with more than 10% missing methylation data (n = 4) were excluded. Quantile normalization was performed to correct batch effects. After these quality control procedures, 846,459 CpG sites quantified by beta values remained.
4.3. The KwaZulu-Natal HIV AIDS Drug Resistance Surveillance Study
The KwaZulu-Natal (KZN) HIV/AIDS Drug Resistance Surveillance Study (ADReSS) is a longitudinal cohort study of ART effects among ART-naïve PWH conducted in the province of KZN, South Africa. Recruitment took place at RK Khan Hospital and Bethesda Hospital in the province between 2014 and 2016 [45]. One thousand participants were enrolled in ADReSS, with an average of 6.5 years of follow-up. Among 616 samples with DNA methylation data, 440 had both baseline and follow-up measurements and were included in this analysis. Institutional Review Board approval was obtained from the University of KwaZulu-Natal, Emory University, and Mass General Brigham prior to the start of this study. All participants provided written informed consent.
Demographic and clinical data, including age, sex, and CD4+ T-cell counts, were collected at each study visit. All participants initiated ART after enrollment and received standard clinical care during the follow-up period. Detailed information on ART use, including medication type, duration of treatment, and the date of ART initiation, was also documented [45].
Blood samples were collected and processed for genome-wide DNA methylation profiling using the Illumina Human Methylation EPIC v2.0 (935K) BeadChip array (Illumina, Inc., San Diego, CA, USA) at each visit. This array type has greater robustness and adaptability than previous EPIC versions [46,47]. It includes over 900,000 CpG sites and provides more signals from 200,000 newly added probes at open chromatin and enhancer regions [48]. Baseline and follow-up samples were assayed during the same laboratory period; however, paired samples were not processed on the same array, plate, or batch. Samples were randomized by time point, sex, clinical site, and other relevant characteristics to minimize potential batch effects. DNA methylation preprocessing followed the pipeline described previously, with modifications for the EPIC v2.0 platform [49]. Technical variations, including dye bias, probe-type bias, slide, array, row, column, plate, and bisulfite-conversion batch effects, were addressed during preprocessing. Quantile normalization was performed separately within each of the six probe categories, and the positive controls included on each plate were evaluated. Quality control procedures were implemented to remove probes with a detection p-value greater than 0.01 and a missing rate exceeding 5%, ensuring an overall call rate above 90% for all samples. Beta values were calculated for the remaining 929,871 CpG sites that passed the preprocessing steps and quality control for further longitudinal testing of MRSCRP.
4.4. MRSCRP Calculation
We selected three MRSCRP that included published weights for different lists of CpG sites that had been associated with plasma CRP in previous multi-ancestry, epigenome-wide studies [23,24]. The first weights were obtained from an EWAS by Wielscher et al., who analyzed European, African, and South Asian cohorts using both Illumina450K and EPIC platforms and identified 1511 independent genome-wide significant CpG sites associated with CRP (MRSCRP_W) [23]. The other two weighted matrices were constructed from Hillary et al.’s EWAS, conducted in multi-ethnic cohorts across a broad age range using both Illumina 450K and EPIC arrays. Advanced algorithms were implemented to establish (1) a Bayesian penalized regression-based MRSCRP (MRSCRP_B) and (2) an elastic net regression-based MRSCRP (MRSCRP_E) [24].
Using the published weights from these three MRSCRP, we computed individual scores separately for each model. Individual DNA methylation beta values at each CpG site were multiplied by their corresponding weights and summed across all the required CpG sites for that MRSCRP. Missing CpG sites within individual samples were imputed using mean imputation based on the observed beta values of the corresponding CpG sites. CpG sites that were completely unavailable across all samples were primarily missing due to differences between methylation array versions [50], as some CpG sites included in the original MRSCRP models were not present on the EPIC v2 array. These missing CpGs were imputed using the mLiftOver function from the sesame package [51].
4.5. Statistical Model in MRSCRP Evaluation
The three MRSCRP were evaluated in the Emory Twin Study. All skewed biomarkers were transformed to natural log scales to achieve a normal distribution. Linear mixed-effects models for each pair of MRSCRP and plasma CRP were fitted with a random intercept for twin pair, and Pearson correlation coefficients were calculated from the model-derived estimates.
To further assess the biological relevance of MRSCRP as epigenetic proxies of CRP levels, we also evaluated correlations of MRSCRP with selected CRP-responsive inflammatory biomarkers, including IL-6, ICAM-1, and fibrinogen.
Due to the established connection between inflammation and cardiometabolic diseases [52,53], we also investigated associations with these phenotypes. We used linear mixed-effects models with random effects for twin relatedness to investigate associations of plasma CRP or MRSCRP with cardiometabolic-related continuous measurements, including BMI (kg/m2), high-density lipoprotein (HDL) cholesterol (mg/dL), and triglycerides (mg/dL). Generalized estimating equations (GEE) were used to assess associations between plasma CRP or MRSCRP and binary clinical variables (obesity, hypertension, type 2 diabetes, and prevalent CAD), accounting for twin-pair relatedness. All statistical models were adjusted for age. Each MRSCRP, as well as plasma CRP, was z-score-standardized before analysis to ensure comparability of effect sizes across models.
CRP is a marker of acute inflammation, but MRSCRP is a more stable measure reflecting chronic, low-grade inflammation. We tested for independent effects of plasma CRP and each MRSCRP on clinical traits, which would suggest complementary effects.
We selected the best-performing MRSCRP based on its correlation with CRP and other inflammatory biomarkers, as well as its associations with cardiometabolic traits. The best-performing MRSCRP was further evaluated for longitudinal changes in PWH on ART.
4.6. Statistical Model for Longitudinal Changes in MRSCRP
The MRSCRP_E derived from the elastic net regression model from Hillary et al.’s study was selected for testing longitudinal changes among PWH from the ADReSS cohort [24]. MRSCRP_E was z-score standardized jointly across both baseline and follow-up samples. Paired t-tests and linear mixed-effects models with random intercepts for each participant were performed to characterize longitudinal changes in chronic, low-grade inflammation measured by MRSCRP_E after ART, while accounting for participants’ age, sex, and follow-up duration. Estimated average MRSCRP levels were calculated to illustrate cohort-level longitudinal changes. Due to the lack of measured plasma CRP levels in ADReSS, we predicted the CRP levels using coefficients from the relationship between plasma CRP and MRSCRP_E in the Emory Twin Study.
In a sensitivity analysis, the same linear mixed-effects model was extended to adjust for time-varying CD4 count and its interaction with the follow-up period to evaluate whether changes in MRSCRP_E after ART were independent of CD4 changes. Additionally, due to the lack of measured white blood cell proportions (including CD4+ T cells, CD8+ T cells, B cells, natural killer cells, monocytes, and granulocytes), these cell-type proportions were estimated from DNA methylation data using the Houseman method implemented in the minfi package [54,55]. We then repeated the sensitivity analysis by further adjusting for these estimated cell-type proportions to examine the robustness of MRSCRP_E changes. Furthermore, we adjusted for methylation-based smoking status (EpiSmokEr2) to account for lifestyle factors that could also lead to changes in MRSCRP_E [56].
5. Conclusions
In summary, our results suggest further investigation of the potential utility of MRSCRP in caring for PWH receiving ART. Longitudinal changes in MRSCRP may reflect epigenetic responses associated with inflammatory recovery. As a DNA methylation-based marker, MRSCRP may complement traditional biomarkers by capturing epigenetic responses to treatment. Future studies in larger and more diverse populations, including cohorts with directly measured inflammatory biomarkers, are needed to further validate the performance of MRSCRP and determine its potential role in evaluating treatment response and long-term health outcomes among PWH.
Supplementary Materials
The following supporting information can be downloaded at https://www.mdpi.com/article/10.3390/epigenomes10030054/s1. Figure S1: CRP measurements associated with continuous clinical markers in the Emory Twin Study; Figure S2: Association of plasma CRP with clinical variables adjusting for each MRSCRP, age, and co-twin status in the Emory Twin Study; Figure S3: Longitudinal changes in standardized MRSCRP_E and predicted plasma CRP levels (mg/L); Table S1: summary statistics of sensitivity analysis.
Author Contributions
Conceptualization, Y.V.S.; methodology, Y.V.S.; formal analysis, Y.H.; resources, V.C.M. and Y.V.S.; writing—original draft preparation, Y.V.S., J.C., A.Y. and Y.V.S.; writing—review and editing, Y.H., J.C., A.Y., Q.H., J.A.E., A.P., M.R.D., S.P., J.B., M.Y.S.M., M.G., V.V., V.C.M. and Y.V.S.; supervision, Y.V.S.; funding acquisition, V.C.M. and Y.V.S. All authors have read and agreed to the published version of the manuscript.
Funding
This research was funded by the National Institutes of Health (NIH), grant number R01 DK125187; NIH/NIAID for salary support and funding for the parent study ADReSS (R01 AI098558); and the Emory Center for AIDS Research (P30 AI050409), with funding received by V.C.M.
Institutional Review Board Statement
Ethical approval from the Biomedical Research Ethics Committee of University of KZN (BE180/13, 9 September 2015), Emory University (IRB00024979, 24 March 2010), and Mass General Brigham institutional review boards (2012P002700/BWH, 29 July 2013) was obtained prior to the start of this study. All participants provided informed consent. ART-naïve patients who provided signed informed consent were enrolled just prior to their treatment initiation from 2014 to 2016.
Informed Consent Statement
Informed consent was obtained from all subjects involved in the study.
Data Availability Statement
The data are available from the National Health Laboratory Service in South Africa, but restrictions apply to the availability of these data, which were used under license for the current study, and so are not publicly available. Data are, however, available from the authors upon reasonable request and with permission of the National Health Laboratory Service in South Africa.
Conflicts of Interest
V.C.M has received investigator-initiated research grants (to the institution) and research support from Eli Lilly, Bayer, Gilead Sciences, Merck, Pfizer, Optinosis, and ViiV.
References
- US CDC. Estimated HIV Incidence and Prevalence. 25 May 2026. Available online: https://www.cdc.gov/hiv-data/nhss/estimated-hiv-incidence-and-prevalence.html (accessed on 20 June 2026).
- Okoye, A.A.; Picker, L.J. CD4(+) T-cell depletion in HIV infection: Mechanisms of immunological failure. Immunol. Rev. 2013, 254, 54–64. [Google Scholar] [CrossRef] [Scilit] [PubMed]
- Forsythe, S.S.; McGreevey, W.; Whiteside, A.; Shah, M.; Cohen, J.; Hecht, R.; Bollinger, L.A.; Kinghorn, A. Twenty Years Of Antiretroviral Therapy For People Living With HIV: Global Costs, Health Achievements, Economic Benefits. Health Aff. 2019, 38, 1163–1172. [Google Scholar] [CrossRef] [Scilit] [PubMed]
- Hileman, C.O.; Funderburg, N.T. Inflammation, Immune Activation, and Antiretroviral Therapy in HIV. Curr. HIV/AIDS Rep. 2017, 14, 93–100. [Google Scholar] [CrossRef] [Scilit] [PubMed]
- Roomaney, R.A.; van Wyk, B.; Wyk, V.P.-V. Aging with HIV: Increased Risk of HIV Comorbidities in Older Adults. Int. J. Environ. Res. Public Health 2022, 19, 2359. [Google Scholar] [CrossRef] [Scilit] [PubMed]
- Melchior, J.C.; Niyongabo, T.; Henzel, D.; Durack-Bown, I.; Henri, S.-C.; Boulier, A. Malnutrition and wasting, immunodepression, and chronic inflammation as independent predictors of survival in HIV-infected patients. Nutrition 1999, 15, 865–869. [Google Scholar] [CrossRef] [Scilit]
- Deeks, S.G.; Tracy, R.; Douek, D.C. Systemic effects of inflammation on health during chronic HIV infection. Immunity 2013, 39, 633–645. [Google Scholar] [CrossRef] [Scilit] [PubMed]
- Mugisha, N.; Ghanem, L.; Komi, O.A.I.; Noureddine, R.; Shariff, S.; Wojtara, M.; Nanehkeran, M.M.; Uwishema, O. Addressing Cardiometabolic Challenges in HIV: Insights, Impact, and Best Practices for Optimal Management-A Narrative Review. Health Sci. Rep. 2025, 8, e70727. [Google Scholar] [CrossRef] [Scilit] [PubMed]
- Triant, V.A.; Meigs, J.B.; Grinspoon, S.K. Association of C-reactive protein and HIV infection with acute myocardial infarction. J. Acquir. Immune Defic. Syndr. 2009, 51, 268–273. [Google Scholar] [CrossRef] [Scilit] [PubMed]
- Obare, L.M.; Temu, T.; Mallal, S.A.; Wanjalla, C.N. Inflammation in HIV and Its Impact on Atherosclerotic Cardiovascular Disease. Circ. Res. 2024, 134, 1515–1545. [Google Scholar] [CrossRef] [Scilit] [PubMed]
- Read, A.T.; Akodu, J.; Barber, T.J.; Brown, J.P.; Burns, F.M.; Hurst, J.R.; Miller, R.F.; Lipman, M.C. Chronic Obstructive Pulmonary Disease in People with HIV: An Evidence-Based Review. HIV AIDS 2025, 17, 153–174. [Google Scholar] [CrossRef] [Scilit] [PubMed]
- Drain, P.K.; Kupka, R.; Msamanga, G.I.; Urassa, W.; Mugusi, F.; Fawzi, W.W. C-reactive protein independently predicts HIV-related outcomes among women and children in a resource-poor setting. AIDS 2007, 21, 2067–2075. [Google Scholar] [CrossRef] [Scilit] [PubMed]
- Hileman, C.O.; Kinley, B.; Scharen-Guivel, V.; Melbourne, K.; Szwarcberg, J.; Robinson, J.; Lederman, M.M.; Mccomsey, G.A. Differential Reduction in Monocyte Activation and Vascular Inflammation With Integrase Inhibitor-Based Initial Antiretroviral Therapy Among HIV-Infected Individuals. J. Infect. Dis. 2015, 212, 345–354. [Google Scholar] [CrossRef] [Scilit] [PubMed]
- Chukwuanukwu, R.C.; Nwosu, N.B.; Ifeanyichukwu, M.O.; Nsonwu-Anyanwu, A.C.; Manafa, P.O. Evaluation of some immune and inflammatory responses in diabetes and HIV co-morbidity. Afr. Health Sci. 2023, 23, 120–128. [Google Scholar] [CrossRef] [Scilit] [PubMed]
- Ciccacci, F.; Welu, B.; Ndoi, H.; Karea, I.; Altan, A.M.D.; Brambilla, D.; Munene, K.; Opanga, B.; Ronoh, A.; Mukwanjagi, S.; et al. The role of high-sensitivity C-reaction protein in the prediction of long-term mortality in people living with HIV: Results from the IDEA-TB cohort study in Kenya. Infect. Dis. Now 2025, 55, 105100. [Google Scholar] [CrossRef] [Scilit] [PubMed]
- Lau, B.; Sharrett, A.R.; Kingsley, L.A.; Post, W.; Palella, F.J.; Visscher, B.; Gange, S.J. C-Reactive Protein Is a Marker for Human Immunodeficiency Virus Disease Progression. Arch. Intern. Med. 2006, 166, 64–70. [Google Scholar] [CrossRef] [Scilit] [PubMed]
- Calderwood, C.J.; Reeve, B.W.; Mann, T.; Palmer, Z.; Nyawo, G.; Mishra, H.; Ndlangalavu, G.; Abubakar, I.; Noursadeghi, M.; Theron, G.; et al. Clinical utility of C-reactive protein-based triage for presumptive pulmonary tuberculosis in South African adults. J. Infect. 2023, 86, 24–32. [Google Scholar] [CrossRef] [Scilit] [PubMed]
- Pritchett, J.W. C-reactive protein levels determine the severity of soft-tissue injuries. Am. J. Orthop. 1996, 25, 759–761. [Google Scholar] [PubMed]
- Schrepf, A.; Markon, K.; Lutgendorf, S.K. From childhood trauma to elevated C-reactive protein in adulthood: The role of anxiety and emotional eating. Psychosom. Med. 2014, 76, 327–336. [Google Scholar] [CrossRef] [Scilit] [PubMed][Green Version]
- Jun, J.H.; Choi, J.H.; Bae, S.H.; Oh, S.H.; Kim, G.J. Decreased C-reactive protein induces abnormal vascular structure in a rat model of liver dysfunction induced by bile duct ligation. Clin. Mol. Hepatol. 2016, 22, 372–381. [Google Scholar] [CrossRef] [Scilit] [PubMed]
- Rodríguez-Agustín, A.; Ayala-Suárez, R.; Díez-Fuertes, F.; Maleno, M.; De Villasante, I.; Merkel, A.; Coiras, M.; Casanova, V.; Alcamí, J.; Climent, N. Intracellular HIV-1 Tat regulator induces epigenetic changes in the DNA methylation landscape. Front. Immunol. 2025, 16, 1532692. [Google Scholar] [CrossRef] [Scilit] [PubMed]
- Chen, J.; Hui, Q.; Titanji, B.K.; So-Armah, K.; Freiberg, M.; Justice, A.C.; Xu, K.; Zhu, X.; Gwinn, M.; Marconi, V.C.; et al. A multi-trait epigenome-wide association study identified DNA methylation signature of inflammation among men with HIV. Clin. Epigenet. 2024, 16, 152. [Google Scholar] [CrossRef] [Scilit] [PubMed]
- Wielscher, M.; Mandaviya, P.R.; Kuehnel, B.; Joehanes, R.; Mustafa, R.; Robinson, O.; Zhang, Y.; Bodinier, B.; Walton, E.; Mishra, P.P.; et al. DNA methylation signature of chronic low-grade inflammation and its role in cardio-respiratory diseases. Nat. Commun. 2022, 13, 2408. [Google Scholar] [CrossRef] [Scilit] [PubMed]
- Hillary, R.F.; Ng, H.K.; McCartney, D.L.; Elliott, H.R.; Walker, R.M.; Campbell, A.; Huang, F.; Direk, K.; Welsh, P.; Sattar, N.; et al. Blood-based epigenome-wide analyses of chronic low-grade inflammation across diverse population cohorts. Cell Genom. 2024, 4, 100544. [Google Scholar] [CrossRef] [Scilit] [PubMed]
- Ligthart, S.; Marzi, C.; Aslibekyan, S.; Mendelson, M.M.; Conneely, K.N.; Tanaka, T.; Colicino, E.; Waite, L.L.; Joehanes, R.; Guan, W.; et al. DNA methylation signatures of chronic low-grade inflammation are associated with complex diseases. Genome Biol. 2016, 17, 255. [Google Scholar] [CrossRef] [Scilit] [PubMed]
- Lundin, J.I.; Peters, U.; Hu, Y.; Ammous, F.; Avery, C.L.; Benjamin, E.J.; Bis, J.C.; Brody, J.A.; Carlson, C.; Cushman, M.; et al. Methylation patterns associated with C-reactive protein in racially and ethnically diverse populations. Epigenetics 2024, 19, 2333668. [Google Scholar] [CrossRef] [Scilit] [PubMed]
- Wang, Z.; Wallace, D.A.; Spitzer, B.W.; Huang, T.; Taylor, K.D.; Rotter, J.I.; Rich, S.S.; Liu, P.Y.; Daviglus, M.L.; Hou, L.; et al. Methylation risk score of C-reactive protein associates sleep health with related health outcomes. Commun. Biol. 2025, 8, 821. [Google Scholar] [CrossRef] [Scilit] [PubMed]
- Stevenson, A.J.; McCartney, D.L.; Hillary, R.F.; Campbell, A.; Morris, S.W.; Bermingham, M.L.; Walker, R.M.; Evans, K.L.; Boutin, T.S.; Hayward, C.; et al. Characterisation of an inflammation-related epigenetic score and its association with cognitive ability. Clin. Epigenet. 2020, 12, 113. [Google Scholar] [CrossRef] [Scilit] [PubMed]
- Zhou, H.H.; Tang, Y.-L.; Xu, T.-H.; Cheng, B. C-reactive protein: Structure, function, regulation, and role in clinical diseases. Front. Immunol. 2024, 15, 1425168. [Google Scholar] [CrossRef] [Scilit] [PubMed]
- Sproston, N.R.; Ashworth, J.J. Role of C-Reactive Protein at Sites of Inflammation and Infection. Front. Immunol. 2018, 9, 754. [Google Scholar] [CrossRef] [Scilit] [PubMed]
- Ladd-Acosta, C.; Fallin, M.D. DNA methylation signatures as biomarkers of prior environmental exposures. Curr. Epidemiol. Rep. 2019, 6, 1–13. [Google Scholar] [CrossRef] [Scilit] [PubMed]
- Devaraj, S.; Singh, U.; Jialal, I. Human C-reactive protein and the metabolic syndrome. Curr. Opin. Lipidol. 2009, 20, 182–189. [Google Scholar] [CrossRef] [Scilit] [PubMed]
- Kroeze, S.; Wit, F.W.; Rossouw, T.M.; Steel, H.C.; Kityo, C.M.; Siwale, M.; Akanmu, S.; Mandaliya, K.; de Jager, M.; Ondoa, P.; et al. Plasma Biomarkers of Human Immunodeficiency Virus-Related Systemic Inflammation and Immune Activation in Sub-Saharan Africa Before and During Suppressive Antiretroviral Therapy. J. Infect. Dis. 2019, 220, 1029–1033. [Google Scholar] [CrossRef] [Scilit] [PubMed]
- Zhang, J.; Sehl, M.E.; Shih, R.; Breen, E.C.; Li, F.; Lu, A.T.; Bream, J.H.; Duggal, P.; Martinson, J.; Wolinsky, S.M.; et al. Effects of highly active antiretroviral therapy initiation on epigenomic DNA methylation in persons living with HIV. Front. Bioinform. 2024, 4, 2024. [Google Scholar] [CrossRef] [Scilit] [PubMed]
- Esteban-Cantos, A.; Rodríguez-Centeno, J.; Silla, J.C.; Barruz, P.; Sánchez-Cabo, F.; Saiz-Medrano, G.; Nevado, J.; Mena-Garay, B.; Jiménez-González, M.; de Miguel, R.; et al. Effect of HIV infection and antiretroviral therapy initiation on genome-wide DNA methylation patterns. eBioMedicine 2023, 88, 104434. [Google Scholar] [CrossRef] [Scilit] [PubMed]
- Verschoor, C.P.; Vlasschaert, C.; Rauh, M.J.; Paré, G. A DNA methylation based measure outperforms circulating CRP as a marker of chronic inflammation and partly reflects the monocytic response to long-term inflammatory exposure: A Canadian Longitudinal Study on Aging analysis. Aging Cell 2023, 22, e13863. [Google Scholar] [CrossRef] [Scilit] [PubMed]
- Jones, M.J.; Goodman, S.J.; Kobor, M.S. DNA methylation and healthy human aging. Aging Cell 2015, 14, 924–932. [Google Scholar] [CrossRef] [Scilit] [PubMed]
- Tsai, M.; Mori, A.M.; Forsberg, C.W.; Waiss, N.; Sporleder, J.L.; Smith, N.L.; Goldberg, J. The Vietnam Era Twin Registry: A quarter century of progress. Twin Res. Hum. Genet. 2013, 16, 429–436. [Google Scholar] [CrossRef] [Scilit] [PubMed]
- Vaccarino, V.; Goldberg, J.; Rooks, C.; Shah, A.J.; Veledar, E.; Faber, T.L.; Votaw, J.R.; Forsberg, C.W.; Bremner, J.D. Post-traumatic stress disorder and incidence of coronary heart disease: A twin study. J. Am. Coll. Cardiol. 2013, 62, 970–978. [Google Scholar] [CrossRef] [Scilit] [PubMed]
- Liu, C.; Wang, Z.; Hui, Q.; Goldberg, J.; Smith, N.L.; Shah, A.J.; Murrah, N.; Shallenberger, L.; Diggers, E.; Bremner, J.D.; et al. Association between depression and epigenetic age acceleration: A co-twin control study. Depress. Anxiety 2022, 39, 741–750. [Google Scholar] [CrossRef] [Scilit] [PubMed]
- Wang, Z.; Hui, Q.; Goldberg, J.; Smith, N.; Kaseer, B.; Murrah, N.R.; Levantsevych, O.M.M.; Shallenberger, L.; Diggers, E.M.; Bremner, J.D.; et al. Association Between Posttraumatic Stress Disorder and Epigenetic Age Acceleration in a Sample of Twins. Psychosom. Med. 2022, 84, 151–158. [Google Scholar] [CrossRef] [Scilit] [PubMed]
- Moran, S.; Arribas, C.; Esteller, M. Validation of a DNA Methylation Microarray for 850,000 CpG Sites of the Human Genome Enriched in Enhancer Sequences. Epigenomics 2016, 8, 389–399. [Google Scholar] [CrossRef] [Scilit] [PubMed]
- Vaccarino, V.; Huang, M.; Wang, Z.; Hui, Q.; Shah, A.J.; Goldberg, J.; Smith, N.; Kaseer, B.; Murrah, N.; Levantsevych, O.M.; et al. Epigenetic Age Acceleration and Cognitive Decline: A Twin Study. J. Gerontol. A Biol. Sci. Med. Sci. 2021, 76, 1854–1863. [Google Scholar] [CrossRef] [Scilit] [PubMed]
- Fortin, J.-P.; Triche, T.J., Jr.; Hansen, K.D. Preprocessing, normalization and integration of the Illumina HumanMethylationEPIC array with minfi. Bioinformatics 2016, 33, 558–560. [Google Scholar] [CrossRef] [Scilit] [PubMed]
- Brijkumar, J.; Edwards, J.A.; Johnson, B.A.; Ordonez, C.; Sunpath, H.; Lee, M.; Dudgeon, M.R.; Rautman, L.; Pillay, S.; Moodley, P.; et al. Comparing effectiveness of first-line antiretroviral therapy between peri-urban and rural clinics in KwaZulu-Natal, South Africa. HIV Med. 2022, 23, 727–737. [Google Scholar] [CrossRef] [Scilit] [PubMed]
- Noguera-Castells, A.; García-Prieto, C.A.; Álvarez-Errico, D.; Esteller, M. Validation of the new EPIC DNA methylation microarray (900K EPIC v2) for high-throughput profiling of the human DNA methylome. Epigenetics 2023, 18, 2185742. [Google Scholar] [CrossRef] [Scilit] [PubMed]
- Zhuang, B.C.; Jude, M.S.; Konwar, C.; Yusupov, N.; Ryan, C.P.; Engelbrecht, H.-R.; Whitehead, J.; Halberstam, A.A.; MacIsaac, J.L.; Dever, K.; et al. Accounting for differences between Infinium MethylationEPIC v2 and v1 in DNA methylation–based tools. Life Sci. Alliance 2025, 8, e202403155. [Google Scholar] [CrossRef] [Scilit] [PubMed]
- Peters, T.J.; Meyer, B.; Ryan, L.; Achinger-Kawecka, J.; Song, J.; Campbell, E.M.; Qu, W.; Nair, S.; Loi-Luu, P.; Stricker, P.; et al. Characterisation and reproducibility of the HumanMethylationEPIC v2.0 BeadChip for DNA methylation profiling. BMC Genom. 2024, 25, 251. [Google Scholar] [CrossRef] [Scilit] [PubMed]
- Lehne, B.; Drong, A.W.; Loh, M.; Zhang, W.; Scott, W.R.; Tan, S.-T.; Afzal, U.; Scott, J.; Jarvelin, M.-R.; Elliott, P.; et al. A coherent approach for analysis of the Illumina HumanMethylation450 BeadChip improves data quality and performance in epigenome-wide association studies. Genome Biol. 2015, 16, 37. [Google Scholar] [CrossRef] [Scilit] [PubMed]
- Lussier, A.A.; Schuurmans, I.K.; Großbach, A.; Maclsaac, J.; Dever, K.; Koen, N.; Zar, H.J.; Stein, D.J.; Kobor, M.S.; Dunn, E.C. Technical variability across the 450K, EPICv1, and EPICv2 DNA methylation arrays: Lessons learned for clinical and longitudinal studies. Clin. Epigenet. 2024, 16, 166. [Google Scholar] [CrossRef] [Scilit] [PubMed]
- Chen, B.H.; Zhou, W. mLiftOver: Harmonizing data across Infinium DNA methylation platforms. Bioinformatics 2024, 40, btae423. [Google Scholar] [CrossRef] [Scilit] [PubMed]
- Ridker, P.M.; Hennekens, C.H.; Buring, J.E.; Rifai, N. C-Reactive Protein and Other Markers of Inflammation in the Prediction of Cardiovascular Disease in Women. N. Engl. J. Med. 2000, 342, 836–843. [Google Scholar] [CrossRef] [Scilit] [PubMed]
- Hotamisligil, G.S. Inflammation and metabolic disorders. Nature 2006, 444, 860–867. [Google Scholar] [CrossRef] [Scilit] [PubMed]
- Aryee, M.J.; Jaffe, A.E.; Corrada-Bravo, H.; Ladd-Acosta, C.; Feinberg, A.P.; Hansen, K.D.; Irizarry, R.A. Minfi: A flexible and comprehensive Bioconductor package for the analysis of Infinium DNA methylation microarrays. Bioinformatics 2014, 30, 1363–1369. [Google Scholar] [CrossRef] [Scilit] [PubMed]
- Houseman, E.A.; Accomando, W.P.; Koestler, D.C.; Christensen, B.C.; Marsit, C.J.; Nelson, H.H.; Wiencke, J.K.; Kelsey, K.T. DNA methylation arrays as surrogate measures of cell mixture distribution. BMC Bioinform. 2012, 13, 86. [Google Scholar] [CrossRef] [Scilit] [PubMed]
- Zhu, T.; Faragó, T.; Bollepalli, S.; Heikkinen, A.; Hukkanen, M.; Raitakari, O.; Lehtimäki, T.; Korhonen, T.; Kaprio, J.; Fang, F.; et al. EpiSmokEr2: A robust epigenetic classifier for smoking status inference using Illumina EPIC methylation data. Epigenomics 2026, 18, 205–215. [Google Scholar] [CrossRef] [Scilit] [PubMed]

Disclaimer/Publisher’s Note: The statements, opinions and data contained in all publications are solely those of the individual author(s) and contributor(s) and not of MDPI and/or the editor(s). MDPI and/or the editor(s) disclaim responsibility for any injury to people or property resulting from any ideas, methods, instructions or products referred to in the content. |
© 2026 by the authors. Licensee MDPI, Basel, Switzerland. This article is an open access article distributed under the terms and conditions of the Creative Commons Attribution (CC BY) license.