


Abstract
Accurate prediction of wear in lubricated metal-to-metal contacts remains a critical challenge, as calibration parameters derived from laboratory tests often lack transferability to finite element method (FEM) simulations. While classical linear Archard models are widely applied, they fail to capture the nonlinear load-dependent wear behavior observed under varying operating conditions. This study addresses this limitation by developing and validating a nonlinear wear formulation based on the Archard–Bayer law within a coupled experimental–numerical framework. A comprehensive Pin-on-Disc test matrix was conducted under lubricated conditions using carbide–steel contacts across varying loads and cycle counts. Wear progression was quantified and analysed using outlier-corrected weighted regression, yielding a force exponent and cycle exponent . The calibrated nonlinear model was implemented in a FEM environment and systematically evaluated across multiple loading scenarios. The nonlinear formulation demonstrates improved predictive capability compared to the classical linear Archard model, particularly under higher load conditions (15 N–20 N), where deviations between simulation and experiment remain below 11%. The FEM-calibrated exponent (m = 1.35) lies within the 95% confidence interval of the experimental value, indicating that numerical adjustments required for stability are statistically non-significant. The results show that nonlinear wear models provide a more accurate representation of load-dependent wear behavior but require constrained calibration ranges for reliable application. The proposed methodology enables robust transfer of experimentally derived wear parameters into FEM simulations and provides a practical basis for tool-life prediction, parameter tuning, and model deployment in sheet metal forming processes.
1. Introduction
The reduction of friction and wear in metal-to-metal contacts remains a fundamental challenge in tribology, particularly in industrial applications where components are subjected to high loads and repeated sliding interactions [1,2]. Accurate prediction of wear is essential for ensuring process stability, component quality, and tool life, especially in sheet metal forming operations where progressive wear directly influences dimensional accuracy and maintenance intervals [3,4,5].
Although Archard-type models are widely used to describe wear behavior, their predictive capability under lubricated, high-cycle conditions remains limited [6,7]. The classical linear Archard formulation assumes proportionality between wear, normal load, and sliding distance [8], which restricts its applicability under realistic operating conditions where contact behavior is inherently nonlinear. Lubricated contacts exhibit load-dependent transitions in lubrication regime, surface roughness evolution, and contact pressure distribution, leading to wear responses that cannot be adequately captured by linear formulations.
Recent comprehensive reviews of Archard-type wear laws [9] and of mechanically dominated wear modelling methods [7] both identify the same unresolved issue: published calibrations are almost always reported as a single, internally consistent parameter set, with little quantitative discussion of whether—or by how much—a laboratory-fitted exponent must be altered to remain numerically stable once it is implemented in a coupled, geometry-updating FEM solver. This study addresses that specific gap. Rather than presenting one calibrated parameter set, it (i) derives the experimental exponents with explicit statistical uncertainty (weighted regression, 95% confidence intervals, outlier diagnostics), (ii) quantifies the adjustment required for FEM stability against that uncertainty rather than reporting it as a separate, unrelated value, and (iii) explicitly delineates the load range over which the calibrated model remains valid instead of presenting a single accuracy figure averaged across all conditions.
To address these limitations, nonlinear extensions such as the Archard–Bayer model introduce exponent-based relations that account for load- and cycle-dependent wear behavior [10]. While such formulations provide improved physical representation, their practical application remains constrained by challenges in parameter identification, statistical robustness, and numerical implementation within finite element method (FEM) frameworks [11,12].
Finite element simulations offer the capability to reproduce tribological experiments virtually and extend their applicability to complex forming operations [11,13]. In this context, FEM-based wear modelling enables the prediction of wear evolution and supports process optimization without the need for extensive physical testing [14]. However, a critical limitation remains the transferability of experimentally derived wear parameters into FEM simulations, where numerical stability constraints, discretisation effects, and contact modelling significantly influence the predicted wear evolution. Existing studies often focus either on experimental characterisation or on simulation-based model application under idealised conditions, while a systematic calibration-to-simulation workflow remains insufficiently explored [7,12].
Recent comprehensive reviews of Archard-type wear laws [15] and mechanically dominated wear-modelling approaches [7] consistently identify a key unresolved issue: wear model calibrations are typically reported as single, internally consistent parameter sets, with limited discussion of their transferability to numerical simulations. In particular, it remains unclear whether—and to what extent—experimentally derived wear exponents must be adjusted to ensure numerical stability when implemented in coupled, geometry-updating FEM frameworks. The present study addresses this gap by moving beyond single-parameter-set calibration. Unlike conventional approaches that treat experimental calibration and numerical implementation separately, this study explicitly links both within a unified and reproducible framework. The key innovations of the present study are: (i) deriving experimental exponents with explicit statistical uncertainty, (ii) quantifying the adjustment required for stable FEM implementation relative to that uncertainty, and (iii) defining the load range over which the calibrated model remains valid, rather than reporting a single averaged accuracy metric.
In industrial sheet metal forming, tool wear is governed by interactions between hard tool materials, such as carbide or coated surfaces, and softer metallic sheets under lubricated conditions [3,4,5]. These interactions occur predominantly in mixed and boundary lubrication regimes, where contact mechanics, surface evolution, and lubrication breakdown jointly influence wear progression [16,17]. Consequently, controlled laboratory experiments must balance physical representativity with methodological robustness to ensure reproducible and interpretable results.
The Pin-on-Disc test is a widely used method for evaluating wear mechanisms and provides a controlled experimental framework for tribological model development [18,19]. The carbide–steel pairing was chosen deliberately over generic metal–metal couples such as Cu–steel or Al–steel because it directly reproduces the material pairing at the tool–workpiece interface in stamping and forming operations, where hardened carbide or tool-steel inserts slide against softer metallic sheets. In contrast, ductile metal–metal systems are typically dominated by adhesion, galling, and material transfer, leading to wear behavior that differs significantly from forming conditions [20,21]. The selected Pin-on-Disc configuration therefore preserves the relevant hardness contrast and lubrication regime of the target application, rather than serving as a general-purpose tribological benchmark. In the present study, this carbide–steel configuration was used to ensure stable and reproducible wear behavior and to enable the calibration of nonlinear wear models under controlled conditions.
Despite significant advances in computational wear modelling, the translation of experimental tribological data into robust and transferable FEM parameters remains a key challenge. Recent studies have proposed calibration frameworks based on production-scale measurements, demonstrating improved predictive capability and transferability across forming operations [22]. However, the integration of such calibrated nonlinear models into fully coupled FEM simulations under controlled laboratory conditions remains limited.
The present work addresses this gap by developing and validating a nonlinear Archard–Bayer wear model within a coupled experimental–numerical framework. A comprehensive Pin-on-Disc test matrix under lubricated conditions is used to systematically quantify load- and cycle-dependent wear behavior. The experimentally derived parameters are subsequently transferred into a fully coupled FEM environment with geometry updating and evaluated across multiple loading conditions.
The main contributions of this study are as follows:
- (i)
- the systematic calibration of a nonlinear Archard–Bayer wear model based on an extensive experimental dataset;
- (ii)
- a quantitative comparison between linear and nonlinear wear formulations within a FEM framework;
- (iii)
- a critical evaluation of parameter sensitivity, transferability, and model limitations under lubricated conditions.
Despite significant progress in computational wear modelling, the translation of experimental tribological data into robust simulation parameters remains a key challenge. Previous studies have primarily focused on demonstrating model performance under idealised conditions, often neglecting the practical limitations associated with parameter calibration and transferability [7,12].
Recent work has addressed these challenges by proposing data-driven calibration frameworks based on production-scale measurements, demonstrating high predictive accuracy and transferability across forming operations [22]. However, the integration of such calibrated models into fully coupled FEM wear simulations under controlled laboratory conditions remains insufficiently explored.
This work contributes to the field by establishing a reproducible calibration-to-simulation workflow that directly links experimental wear data with nonlinear FEM implementation under lubricated, high-cycle conditions. By systematically validating parameter transferability and explicitly quantifying model limitations, the study provides a robust foundation for improving the reliability of wear prediction in both research and industrial tribological applications.
This manuscript is an extended and revised version of a previously published preprint available at SSRN: https://ssrn.com/abstract=5854016 or https://dx.doi.org/10.2139/ssrn.5854016 (accessed on 20 June 2026), including additional analyses and methodological refinements.
2. Materials and Methods
2.1. Experimental Setup and Materials
Disc specimens were manufactured from austenitic stainless steel X10CrNi18-8, while hemispherical pins were made of carbide CF-H40S. The marked hardness contrast between the disc and the pin provides a well-defined wear couple suitable for systematic analysis (disc hardness ≈ HV10 587; pin hardness ≈ HV10 1400). The carbide pin, with its superior hardness and lower surface roughness, acts as an effective indenter against the softer stainless-steel substrate. Elastic moduli, strength values, and Poisson’s ratios are summarized in Table 1.
Table 1.
Material properties of the embossing insert and the workpiece.
Surface topographies were characterized using confocal microscopy (µCMM, Bruker Alicona, Graz, Austria), and the data were analyzed using Alicona IFM software (version 6.4.1, Bruker Alicona, Graz, Austria). The discs showed ground lay patterns, while the pins showed polished finishes with minimal irregularities. These initial surface conditions influence both the running-in phase and the transition to steady-state wear behavior [23].
All experiments were performed under lubrication using CLF-11-SG at 25 °C (kinematic viscosity at 20 °C: ≈; density: 0.822 g ), ensuring stable film formation throughout the test duration.
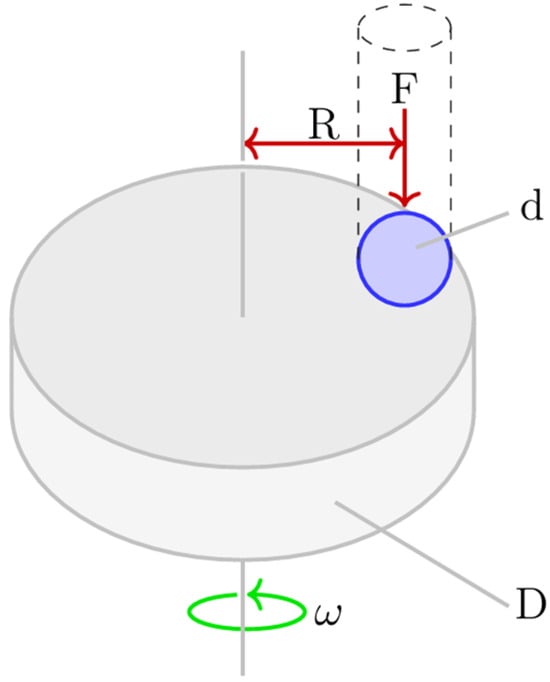
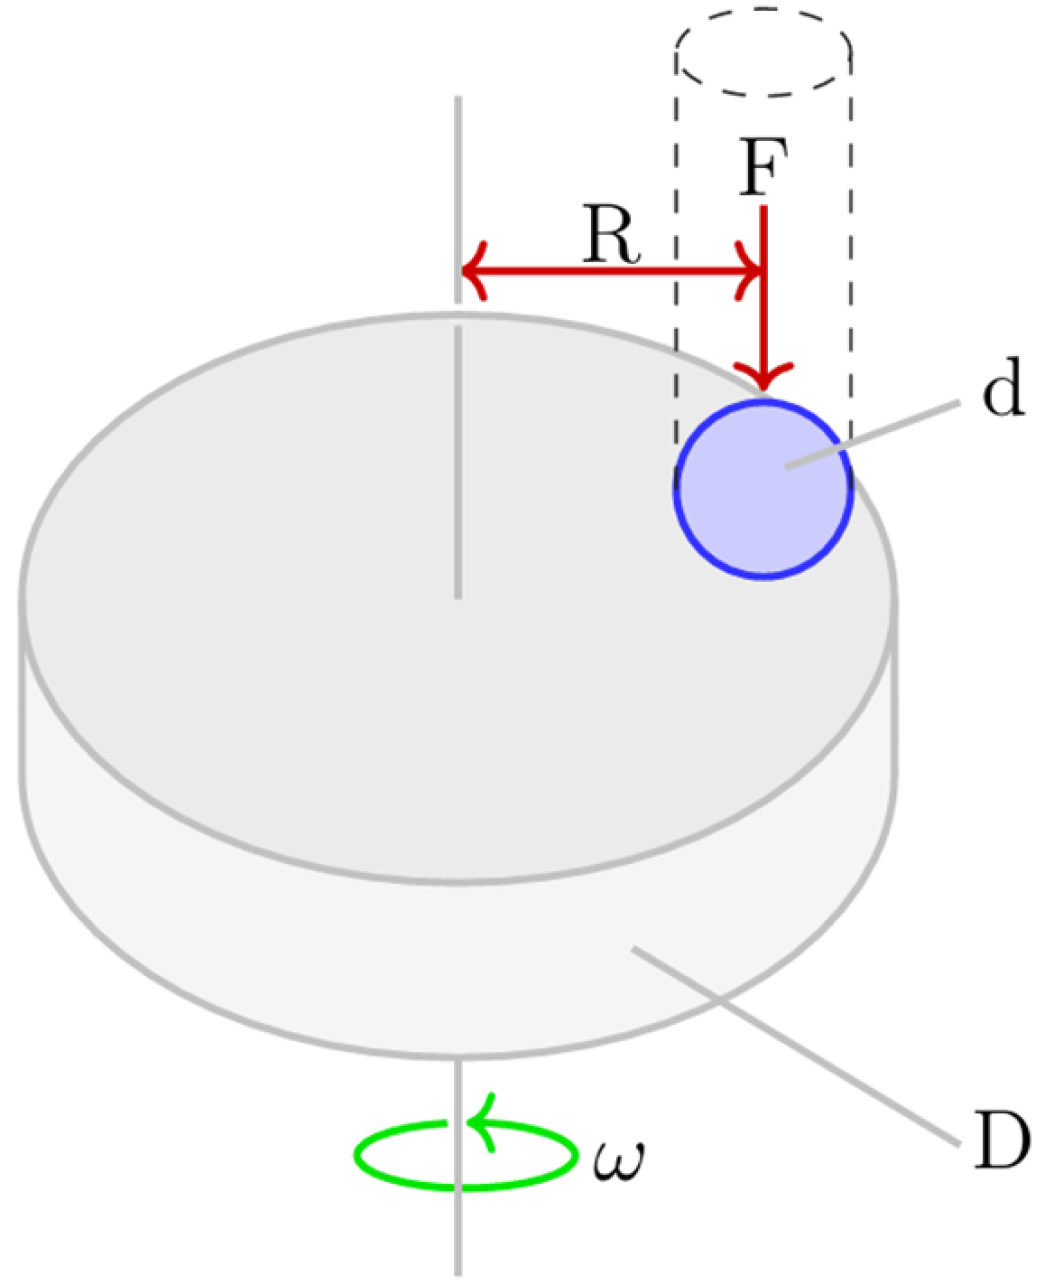
A Pin-on-Disc (ball-on-flat) tribometer was used—specifically, the Anton Paar (Anton Paar GmbH, Graz, Austria) [24]. A schematic representation of the experimental setup is shown in Figure 1. The instrument allows precise control of normal load and rotational speed and operates up to 60 N and at rotational speeds of up to 2000 rpm, enabling investigation across a broad range of tribological operating conditions (18).
Figure 1.
Schematic representation of the Pin-on-Disc testing system. The hemispherical pin (blue) with diameter (d) is pressed onto the rotating disc (grey) with diameter D by the normal force F. The disc rotates with angular velocity and the pin is positioned at a radial distance R from the disc center.
The carbide–steel pairing was chosen deliberately over generic metal–metal combinations such as Cu–steel or Al–steel because it directly reproduces the material pairing at the tool–workpiece interface in sheet metal forming processes, where hardened carbide or tool-steel inserts slide against softer metallic sheets. In contrast, ductile metal–metal systems are typically dominated by adhesion, galling, and material transfer, leading to wear behaviour that differs significantly from forming conditions [20,21]. The selected Pin-on-Disc configuration therefore preserves the relevant hardness contrast and lubrication regime of the target application rather than serving as a generic tribological benchmark. In the present study, the carbide–steel configuration was used to ensure stable and reproducible wear behaviour and to enable reliable parameter identification under controlled conditions. Compared to ductile metal–metal systems such as Al–steel or Cu–steel, this configuration reduces adhesive transfer and material smearing effects and enables a clearer separation of load- and cycle-dependent wear mechanisms [20,21].
A comprehensive experimental campaign was conducted to systematically investigate load- and cycle-dependent wear behavior under lubricated conditions. Tests were performed at normal loads of 10 N, 15 N, and 20 N and over cycle counts ranging from 50,000 to 240,000, ensuring a sufficiently broad parameter space for model calibration.
Pin-on-Disc experiments were carried out under strictly controlled environmental conditions. The temperature was maintained at 24.7 ± 2.2 °C and relative humidity at 16 ± 5% to minimize external influences on the tribological system. The hemispherical carbide pin (radius 6.715 ± 0.513 mm) was positioned at a track radius of 10.4 ± 0.2 mm. The rotational speed was kept constant at 250 rpm, corresponding to a sliding velocity of 0.27 m/s.
To ensure statistical robustness, each of the 15 test conditions (three normal loads combined with five cycle counts) was repeated three times, resulting in a total of 45 individual experiments. This experimental design ensures statistical significance and reproducibility [25]. Wear quantification was performed using complementary measurement techniques to ensure accuracy across different length scales. Optical microscopy was used to measure wear-scar diameters with a measurement accuracy of approximately ±1 μm.
The cycle counts achieved for each load condition were not identical, ranging from up to 150,000 cycles at 10 N to 240,000 cycles at 15 N and 100,000 cycles at 20 N. This asymmetry was not a deliberate experimental design choice but resulted from equipment-related constraints. Under sustained operation at higher normal loads, the Anton Paar TRB3 tribometer approached its operational limits, and the load sensor required replacement before testing could continue. As a consequence, the high-load (20 N) series could not be extended beyond 100,000 cycles within the available study timeframe, whereas lower-load conditions imposed less mechanical stress on the instrument and could be continued to higher cycle counts. This limitation is acknowledged as a constraint of the experimental design and explains the differing cycle ranges across load conditions.
2.2. Wear Quantification and Data Reduction
Wear quantification under lubricated conditions presented significant methodological challenges [26]. The minimal wear volumes (<0.001 ) approached the detection limits of optical microscopy (±1 resolution), particularly at 10 N loads where wear depths were typically <5 . The following validation protocols were implemented:
- Geometric validation: Confocal microscopy (Alicona μCMM) verified the spherical wear-scar assumption for 20% of specimens, revealing deviations of up to 15% from perfect sphericity.
- Lower detection limit: Tests with wear heights were excluded from statistical analysis due to insufficient signal-to-noise ratio.
Wear was quantified from the wear-scar geometry. The wear-scar diameter was measured optically with a resolution of ±1 μm, and the corresponding wear depth was computed using a spherical cap approximation, following standard wear evolution methods [27], as shown in Equation (1):
where is the pin tip radius and is the optically measured wear-scar diameter. Confocal microscopy verified this assumption in ≈20% of specimens, revealing deviations of up to ≈15% in individual cases.
Prior to regression, each condition mean wear depth was verified for physical monotonicity: accumulated wear depth must be non-decreasing with cycle count. One specimen from the 15 N series at 100,000 cycles yielded h = 25.3 µm, exceeding measurements at 200,000 cycles (11.7 µm) and 240,000 cycles (15.1 µm) under identical loading. This physically impossible progression identifies the measurement as an outlier attributable to an experimental artefact (e.g., surface contamination or an optical scar boundary distorted by displaced lubricant). The corresponding data point was excluded from parameter estimation, leaving 44 valid measurements across 8 distinct load–cycle conditions.
2.3. Nonlinear Wear Modeling and Parameter Estimation
Many approaches have been developed for calculating wear between material pairs [2,7]. The most widely used is the Archard model [8], in which the wear volume () is proportional to the normal force and the sliding distance , and inversely proportional to the Vickers hardness of the softer material, as given in Equation (2), according to Archard [8]:
In the stress-based, time-integrated form, the wear formulation can be expressed as shown in Equation (3), following generalized Archard-type formulations used in finite element wear modelling [9]:
where is the local normal stress, is the relative sliding velocity, and is the dimensionless wear coefficient accounting for differences in material pair properties and operating conditions.
As the classical Archard model applies primarily to dry sliding, further development was necessary. Hoffmann et al. [28] showed that increases over sliding distance, necessitating a more adapted formulation. This behavior arises from the progressive rounding of surface asperities: after sufficient sliding, roughness features become rounded rather than sharp, altering the contact pressure distribution over the plastically deformed area [10]. In 1993, R.G. Bayer introduced a nonlinear correction in which the wear is no longer linear in either the number of loading cycles or the contact pressure [10], as expressed in Equation (4), following Bayer [23]:
where W is the wear depth (mm) as defined by Equation (1), P is the applied normal load (), is the number of loading cycles, and are empirical constants. Note that while Equations (2) and (3) are formulated in terms of wear volume, the Bayer formulation is applied here to the wear depth h, which is the directly measured quantity in this study (Equation 1). In contrast to Equations (2) and (3), the hardness is absorbed into , and the wear response is governed nonlinearly by the exponents and .
The physical interpretation of the exponents is crucial for understanding the underlying wear mechanisms. An exponent indicates nonlinear load dependency, arising from: (i) increased plastic deformation at higher loads, (ii) transition from elastic to plastic contact conditions, (iii) breakdown of lubrication films under high pressure, or (iv) simultaneous activation of multiple wear mechanisms (abrasion, adhesion, and fatigue). The exponent reflects surface accommodation effects, where initial roughness is modified during the running-in period, leading to decreasing wear rates over time [27,29,30].
Based on the nonlinear wear formulation, the model parameters were determined experimentally. Stage I—Laboratory parameter identification. Model parameters () were first identified from the experimental dataset. Prior to regression, each condition-mean wear depth was checked for physical monotonicity with cycle count; one measurement violating this constraint was excluded (see Section 3.2). Weighted least-squares regression in log-space was then applied to the remaining 44 measurements aggregated as 8 condition means, with weights derived from the replicate standard deviations . This approach yields parameter estimates that are efficient under heteroscedastic measurement noise and provides well-defined frequentist confidence intervals via the t-distribution with five degrees of freedom.
2.4. Finite Element Model: Geometry, Mesh, Contact, and Solver Software
All finite element analyses were performed using Simufact Forming 2024 (based on MSC Marc 2023). Implementation of the nonlinear Archard–Bayer wear model required manual modification of the solver input file (.dat format), where the empirical coefficients , and the material hardness were specified directly within the WEAR data block. The wear model identifier was configured to type 2 (Bayer exponential form), applied to contact body 3 (pin), with the geometry update flag activated. Surface node positions were incrementally adjusted at each solution step to reflect accumulated material removal [31,32,33].
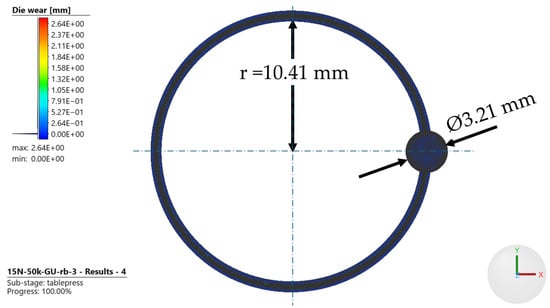
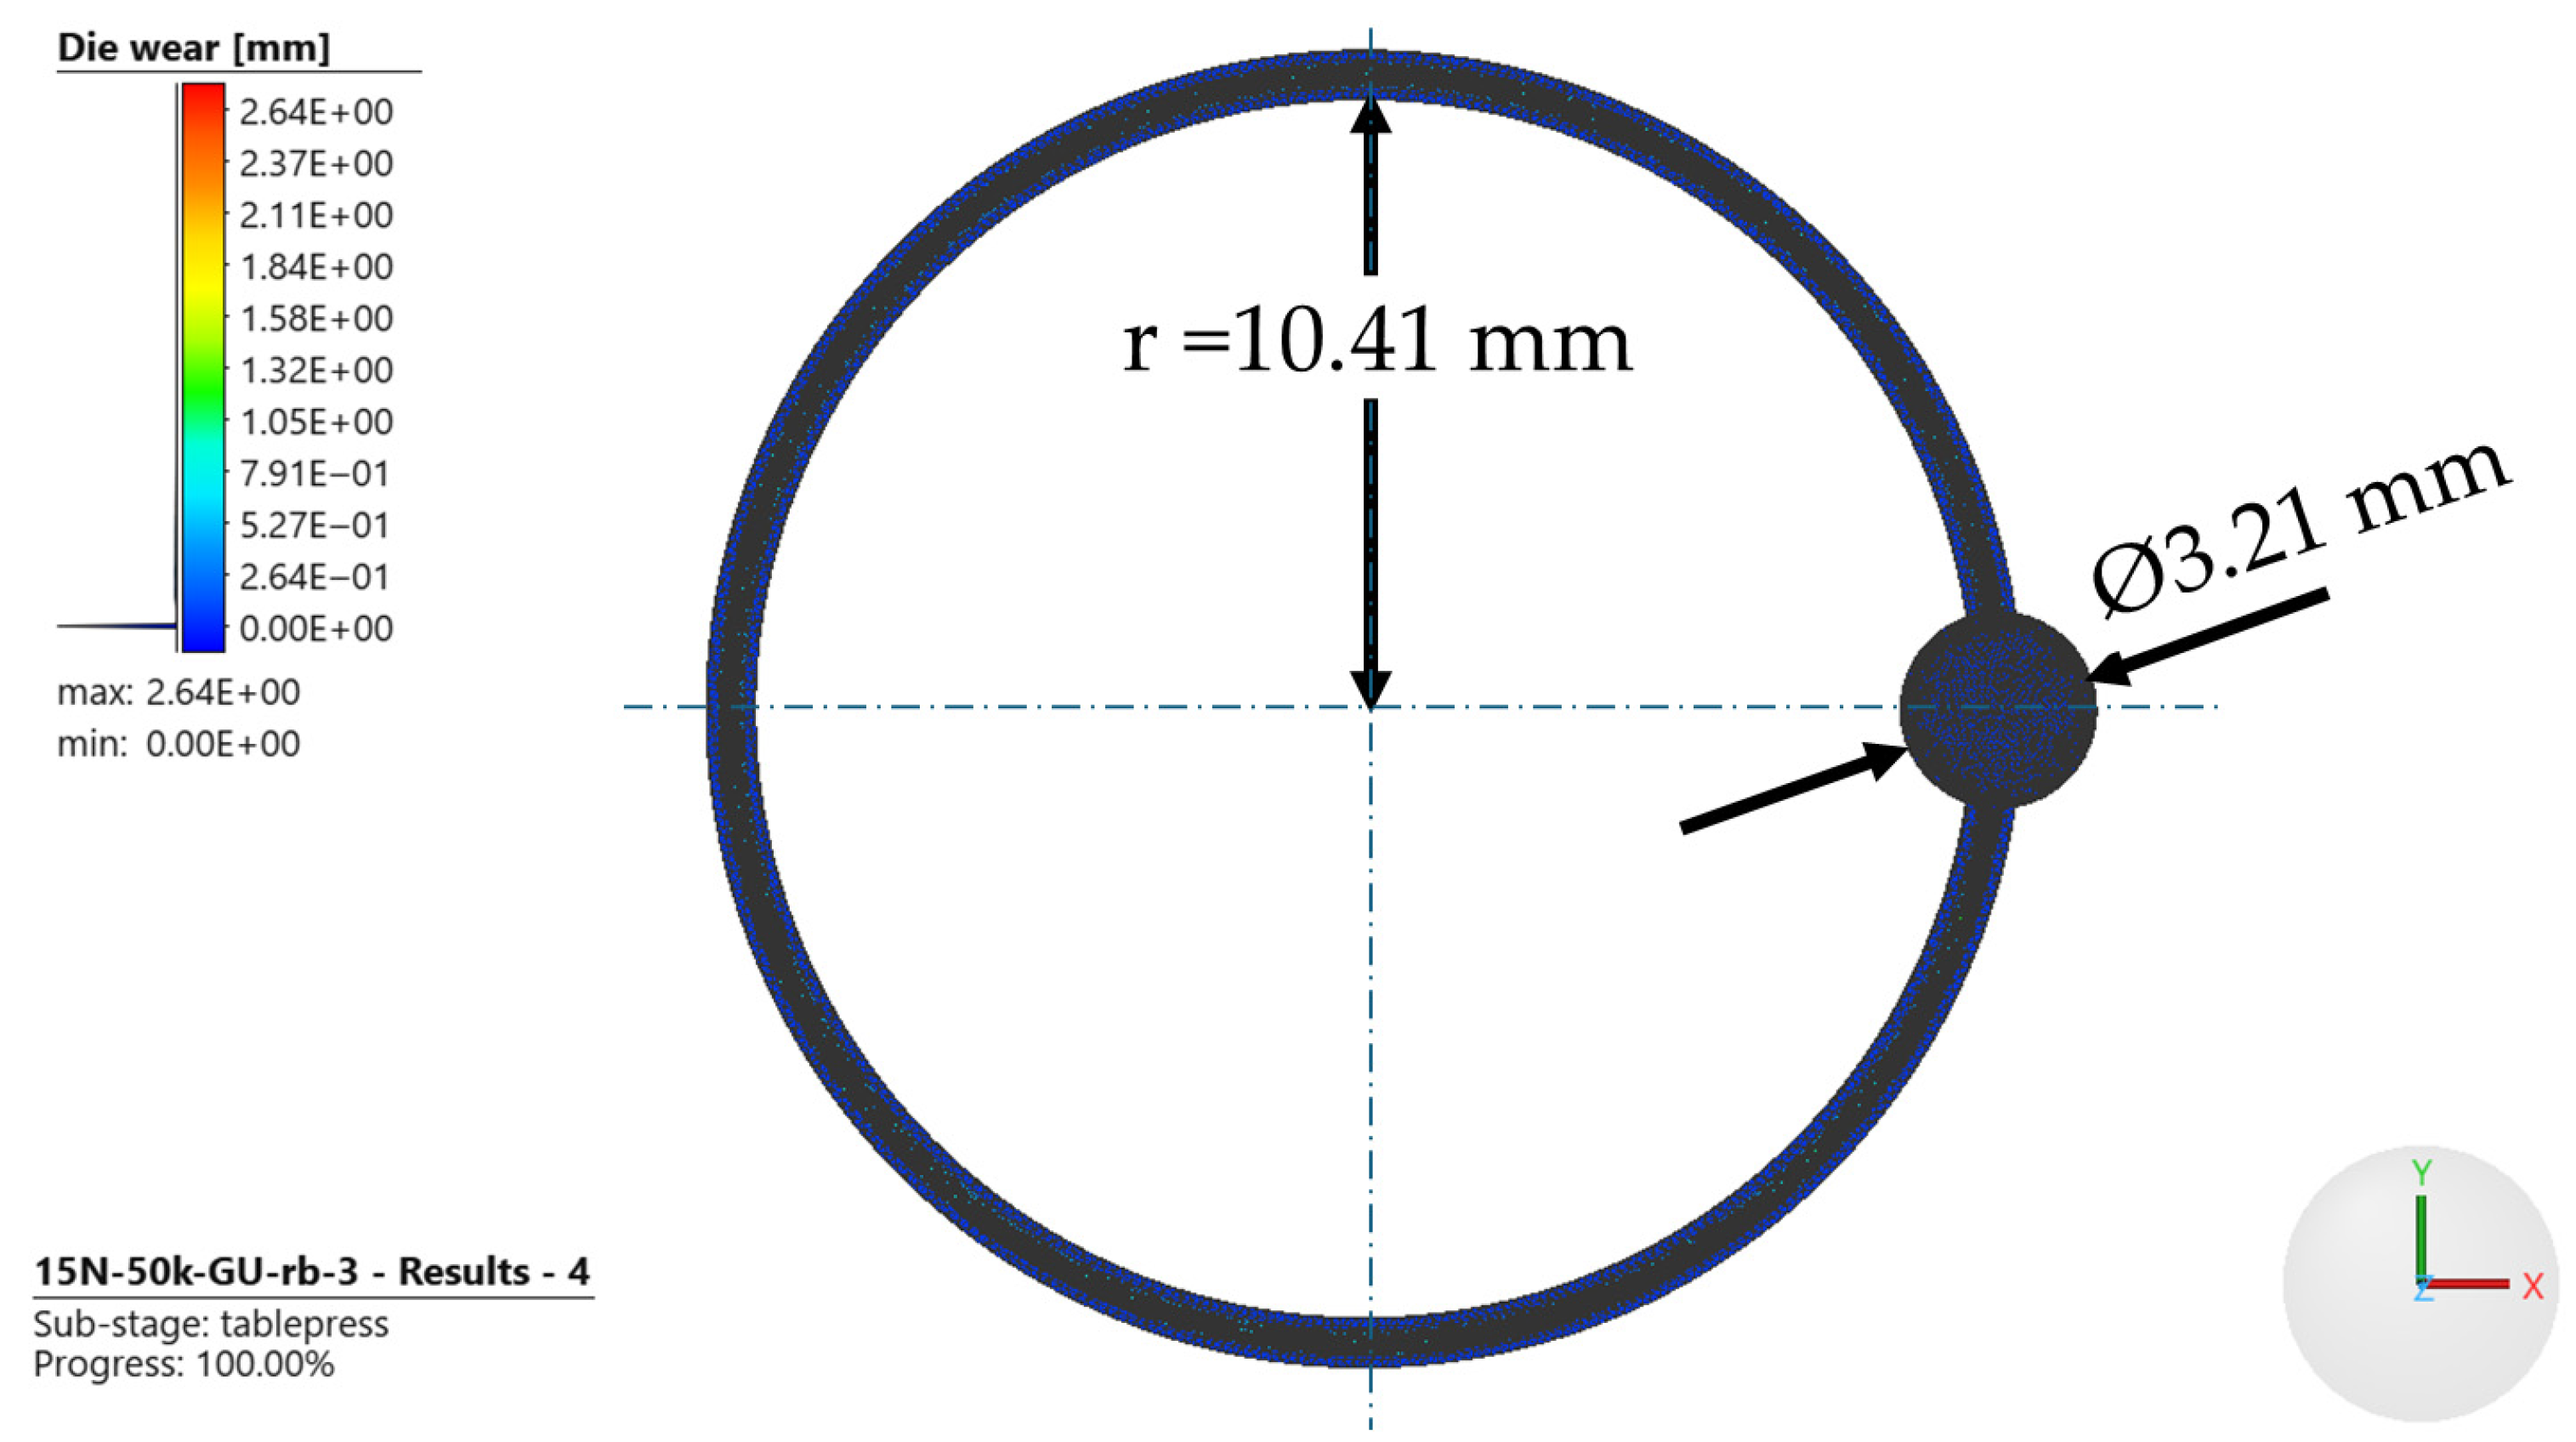
The computational domain and boundary conditions of the finite element model were defined to replicate the experimental tribometer setup described in Section 2.1. The disc was modelled as a deformable body; the pin was treated as a rigid contact surface. The resulting top-view geometry of the simulation domain, including the circular wear track and pin placement, is depicted in Figure 2. The pin was positioned at a track radius of = 10.41 mm, resulting in a circular wear path. The contact area is characterised by a pin contact diameter of approximately 3.21 mm, which defines the localised interaction zone on the disc surface.
Figure 2.
Top-View FEM representation of the wear simulation (wear depth in mm). The pin is positioned at a track radius of 10.41 mm, forming a circular wear path. The local contact region (diameter ≈ 3.21 mm) is highlighted, and the resulting wear track on the disc surface is visible as a continuous circumferential band. The color scale indicates the wear depth distribution. Values are displayed in E-notation as generated by the simulation software.
The disc remained spatially fixed throughout the analysis. Pin motion was restricted to pure translation along the surface-normal axis, replicating experimental constraint conditions. Disc rotation velocity matched the tribometer setting (250 rpm at 10.4 mm track radius, equivalent to 0.27 m/s sliding speed). Normal force was transmitted via a virtual die spring element (stiffness: 0.001 N/m; preload as specified by the test case) applied at the pin’s geometrical center.
The spatial discretization of the computational domain was carried out using a sheet mesh with five-layer solid shell elements (type 185), with an in-plane edge length of 0.08 mm, yielding 48,861 total elements. The rigid pin contact interface employed a triangular surface mesh with a characteristic facet size of 0.0236 mm (refined locally to 0.0059 mm), producing 21,578 surface elements. A cylindrical mesh refinement zone (10.3–10.5 mm radial extent, level-2 subdivision) ensured adequate spatial resolution within the primary wear track. Mesh sensitivity was verified by monitoring the peak nodal wear depth under the reference case.
(15 N/240,000 cycles): Reducing the in-plane edge length from 0.10 mm to 0.08 mm changed the predicted wear depth by less than 2%, confirming that the chosen discretization is within the converged regime.
Contact interactions were defined using a node-to-segment penalty formulation with program-controlled normal stiffness. Contact detection employed a force-based separation criterion (0.001 kN threshold), permitting iterative release and re-establishment within individual increments (up to 5 cycles per increment). Tangential traction obeyed a bilinear Coulomb law with friction coefficient μ = 0.134, representing the lubricated regime established by CLF-11-SG [16,21]. Frictional force updates incorporated a relaxation tolerance of 0.05 to stabilize stick–slip transitions. Hydrodynamic film effects were captured phenomenologically through the calibrated wear exponents [17].
The numerical solution of the nonlinear equilibrium equations was performed using Marc’s default Newton–Raphson algorithm, augmented with line-search backtracking. The nonlinear equilibrium equations were solved using Marc’s default Newton–Raphson algorithm augmented with line-search backtracking. System matrices were factorised via the MUMPS (Multifrontal Massively Parallel Solver) direct sparse solver (parallel mode). Convergence required simultaneous satisfaction of a displacement norm criterion ( relative tolerance) and a residual force criterion ( relative tolerance), with a per-increment iteration limit of 25. Automatic load-step subdivision was activated near convergence difficulties or steep geometric changes. All simulations were isothermal at 20 °C.
Each test scenario (50,000–24,0000 cycles) was partitioned into 30 uniform time intervals. Wear geometry modifications occurred at every increment, ensuring continuous coupling between evolving contact area, pressure redistribution, and cumulative material loss—essential for capturing the nonlinear feedback mechanisms inherent to the Archard–Bayer formulation. Each simulation required approximately 140 h of wall-clock time on a single-thread configuration (MUMPS parallel direct solver), confirming the computational cost of fully coupled geometry-updating wear analyses.
2.5. Calibration and Validation Strategy
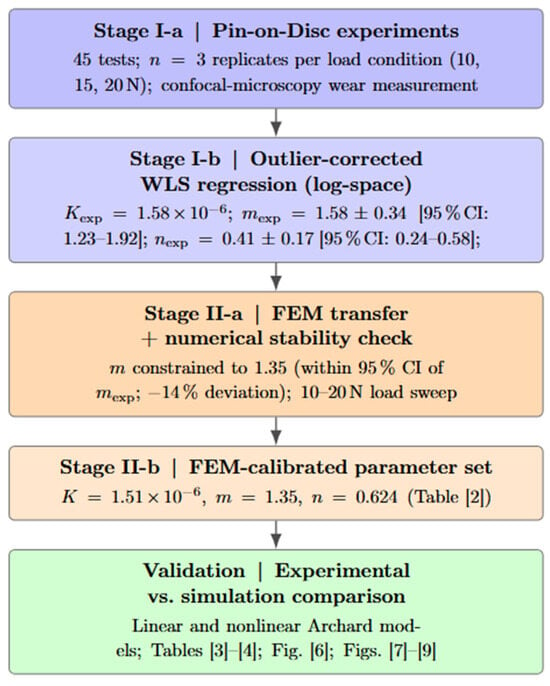
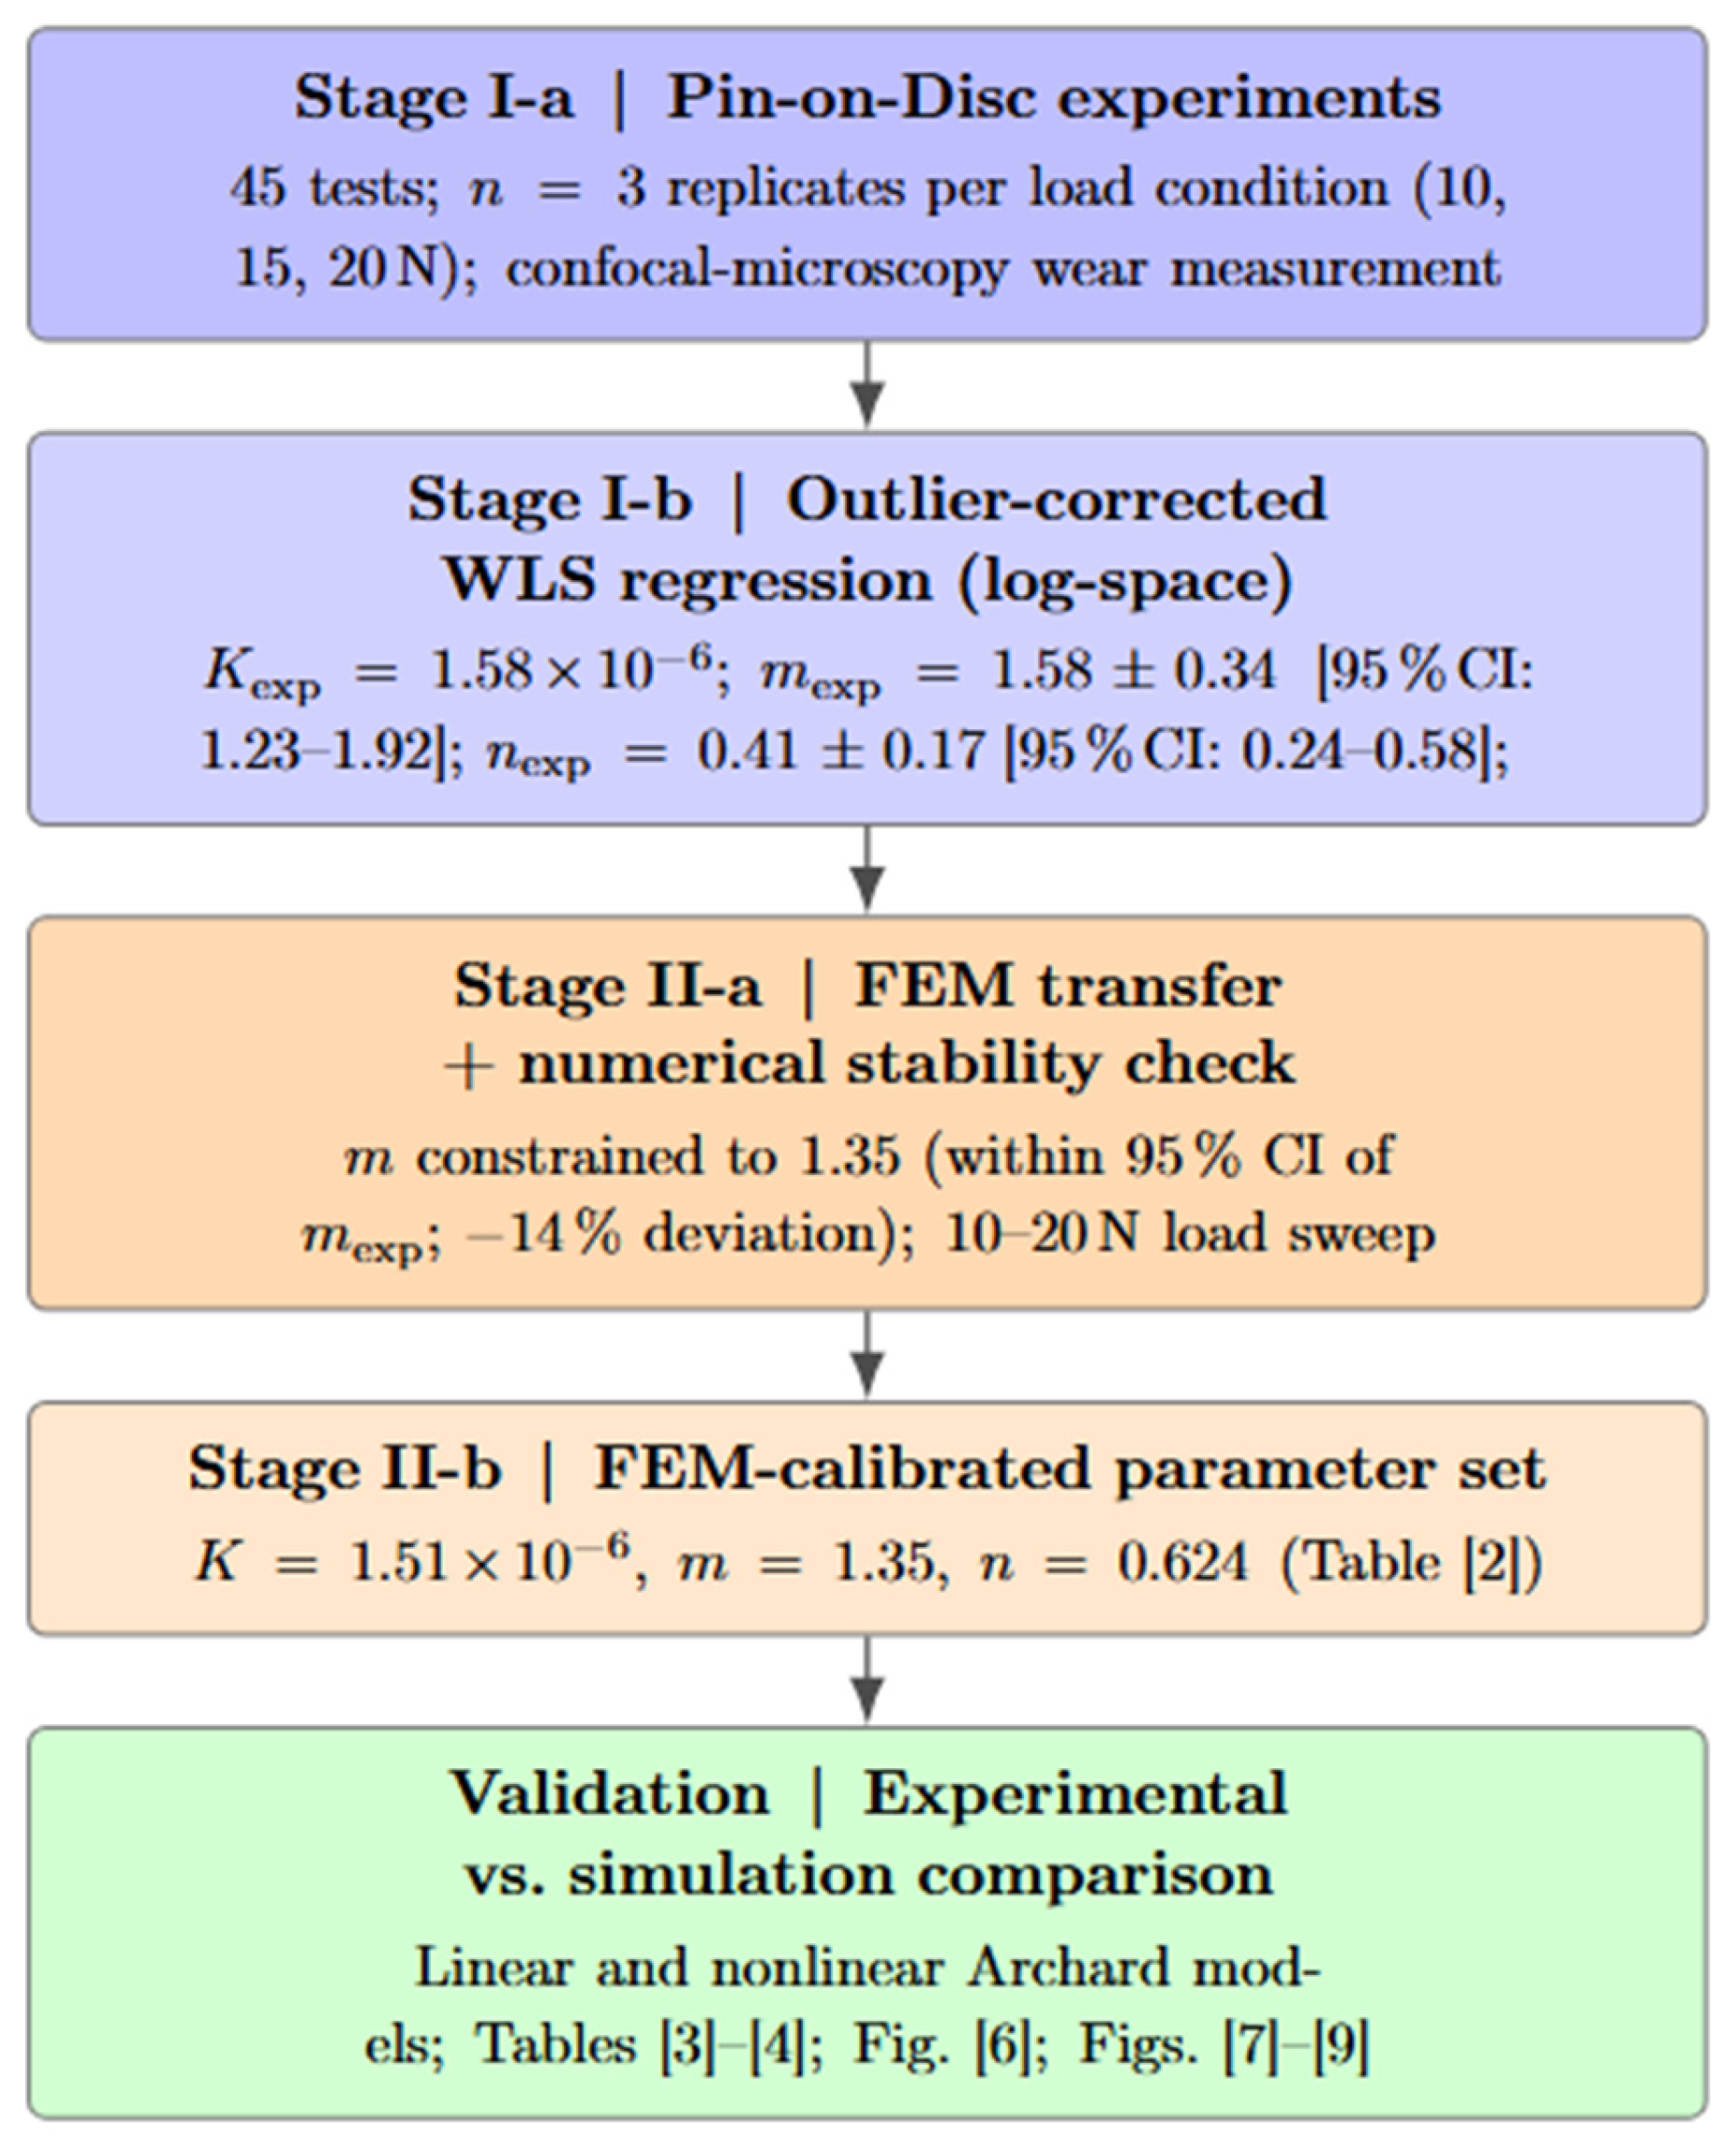
The calibration of the nonlinear Archard–Bayer model followed a structured two-stage procedure, as illustrated in Figure 3.
Figure 3.
Two-stage calibration workflow. Stage I: Pin-on-Disc experiments followed by outlier-corrected WLS regression in log-space to identify of the experiment. Stage II: transfer to FEM with numerical stability check; m is constrained to 1.35, which lies within the 95% confidence interval of . All confidence intervals at 95%.
Following the experimental parameter identification (Stage I), the calibrated parameters were transferred to the finite element model and refined to ensure numerical stability and physical consistency.
Direct use of the laboratory-fitted load exponent resulted in numerical instability and non-physical divergence at low loads, reflecting the sensitivity of nonlinear wear formulations to exponent scaling. To obtain a stable and physically consistent numerical response, the exponents were systematically reduced within a narrow admissible band and re-evaluated across the 10 N–20 N load range. Parameter candidates were iteratively assessed against mid- and high-load experimental conditions, prioritizing robust convergence behavior and physically realistic wear evolution.
The iterative parameter refinement was terminated once two conditions were simultaneously satisfied: (i) numerical convergence of the FEM solution under the prescribed solver tolerances (displacement norm , residual force ), and (ii) stabilization of the predicted wear response, such that further parameter adjustments resulted in less than 5% change in wear depth across the investigated load range. The resulting parameter sets are summarized and discussed in Section 3.3.
To assess the robustness of the calibrated model and to separate the contributions of load dependence and temporal evolution, a one-factor-at-a-time sensitivity analysis was conducted. The exponents and were perturbed by ±20% around their FEM-calibrated values, and the model was re-evaluated across all load conditions (10 N, 15 N, 20 N) under identical cycle counts. Parameter influence was quantified through normalized sensitivity coefficients, defined as the relative change in wear depth with respect to the relative change in model parameters (Equation (5)) as commonly used in engineering sensitivity analysis [22].
The evolution of these coefficients along the sliding distance was examined. This approach enables a clear separation between load-dominated effects (governed by ) and temporal wear progression (governed by ), providing a data-efficient and structurally identifiable calibration strategy. Model fidelity was assessed using nonlinear least-squares regression. Parameter estimates, 95% confidence intervals, and R2 statistics are reported. Replicate measurements ( = 3 per condition) were aggregated using inverse-variance weighting. Wear depths below 3 μm were excluded in accordance with metrological limits, and confocal microscopy revealed sphericity deviations of up to ≈15%, which were incorporated as an explicit uncertainty component at low wear amplitudes.
All simulation parameters and solver settings are fully documented; FEM input files and post-processing scripts are available from the corresponding author upon request.
3. Results
3.1. Wear Behavior Under Lubricated Conditions
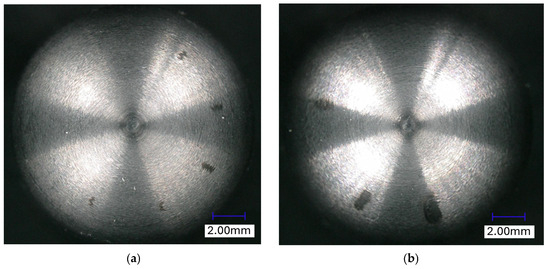
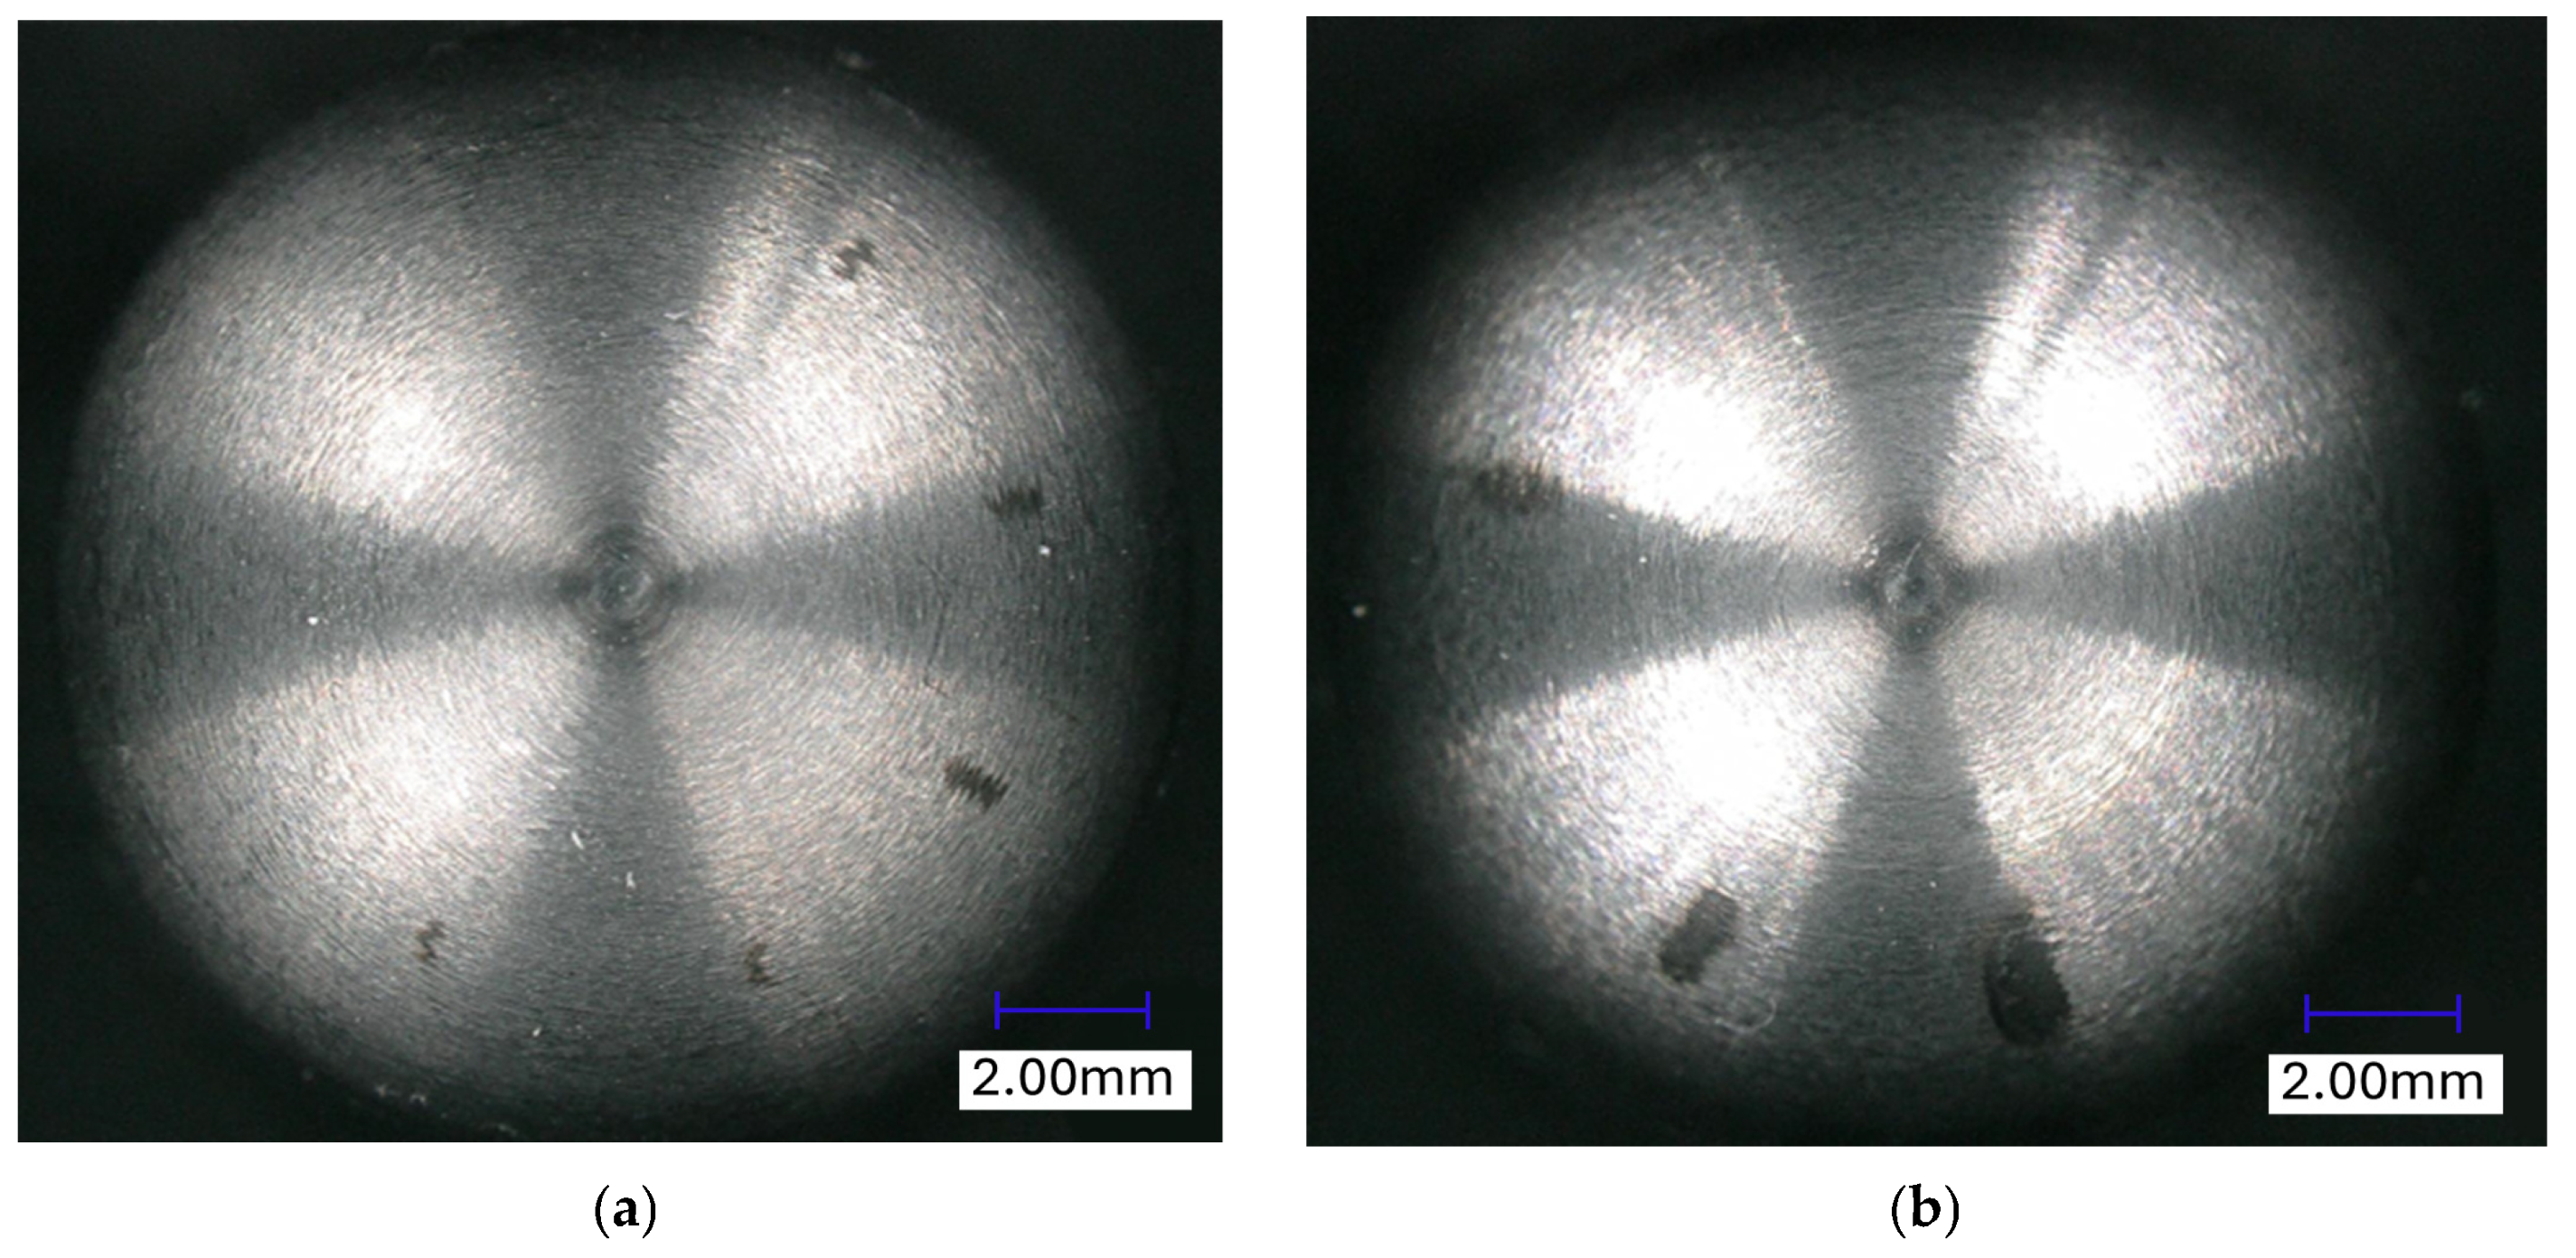
Optical images of pin surfaces after Pin-on-Disc experiments highlight the formation of wear scars under different loads and cycle counts. At lower loads, scars appear relatively shallow, whereas at higher loads material removal is significantly increased, resulting in deeper and wider wear tracks, consistent with the expected tribological behavior [34].
Figure 4a shows a pin after testing from 10 N/50,000 cycles up to 15 N/200,000 cycles. Wear scars appear as dark regions extending radially from the center, indicating material loss due to frictional interaction. In contrast, Figure 4b shows a pin subjected to 15 N/240,000 cycles followed by 20 N/100,000 cycles. Here, the wear scars are more pronounced, wider, and darker, demonstrating the intensification of wear damage at higher loads and cycle counts.
Figure 4.
Optical micrographs of the carbide pin after Pin-on-Disc testing. Dark regions indicate wear-scar material loss. (a) Lower and lighter scars, 10 N/50,000–15 N/200,000 cycles; (b) Wider and darker scars, 15 N/240,000–20 N/100,000 cycles, confirm the intensification of wear at higher loads and cycle counts.
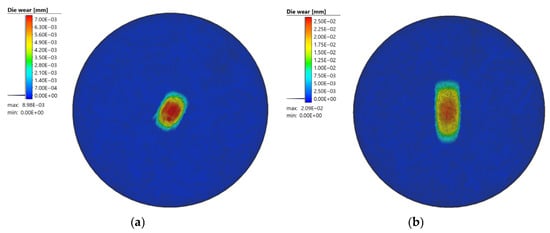
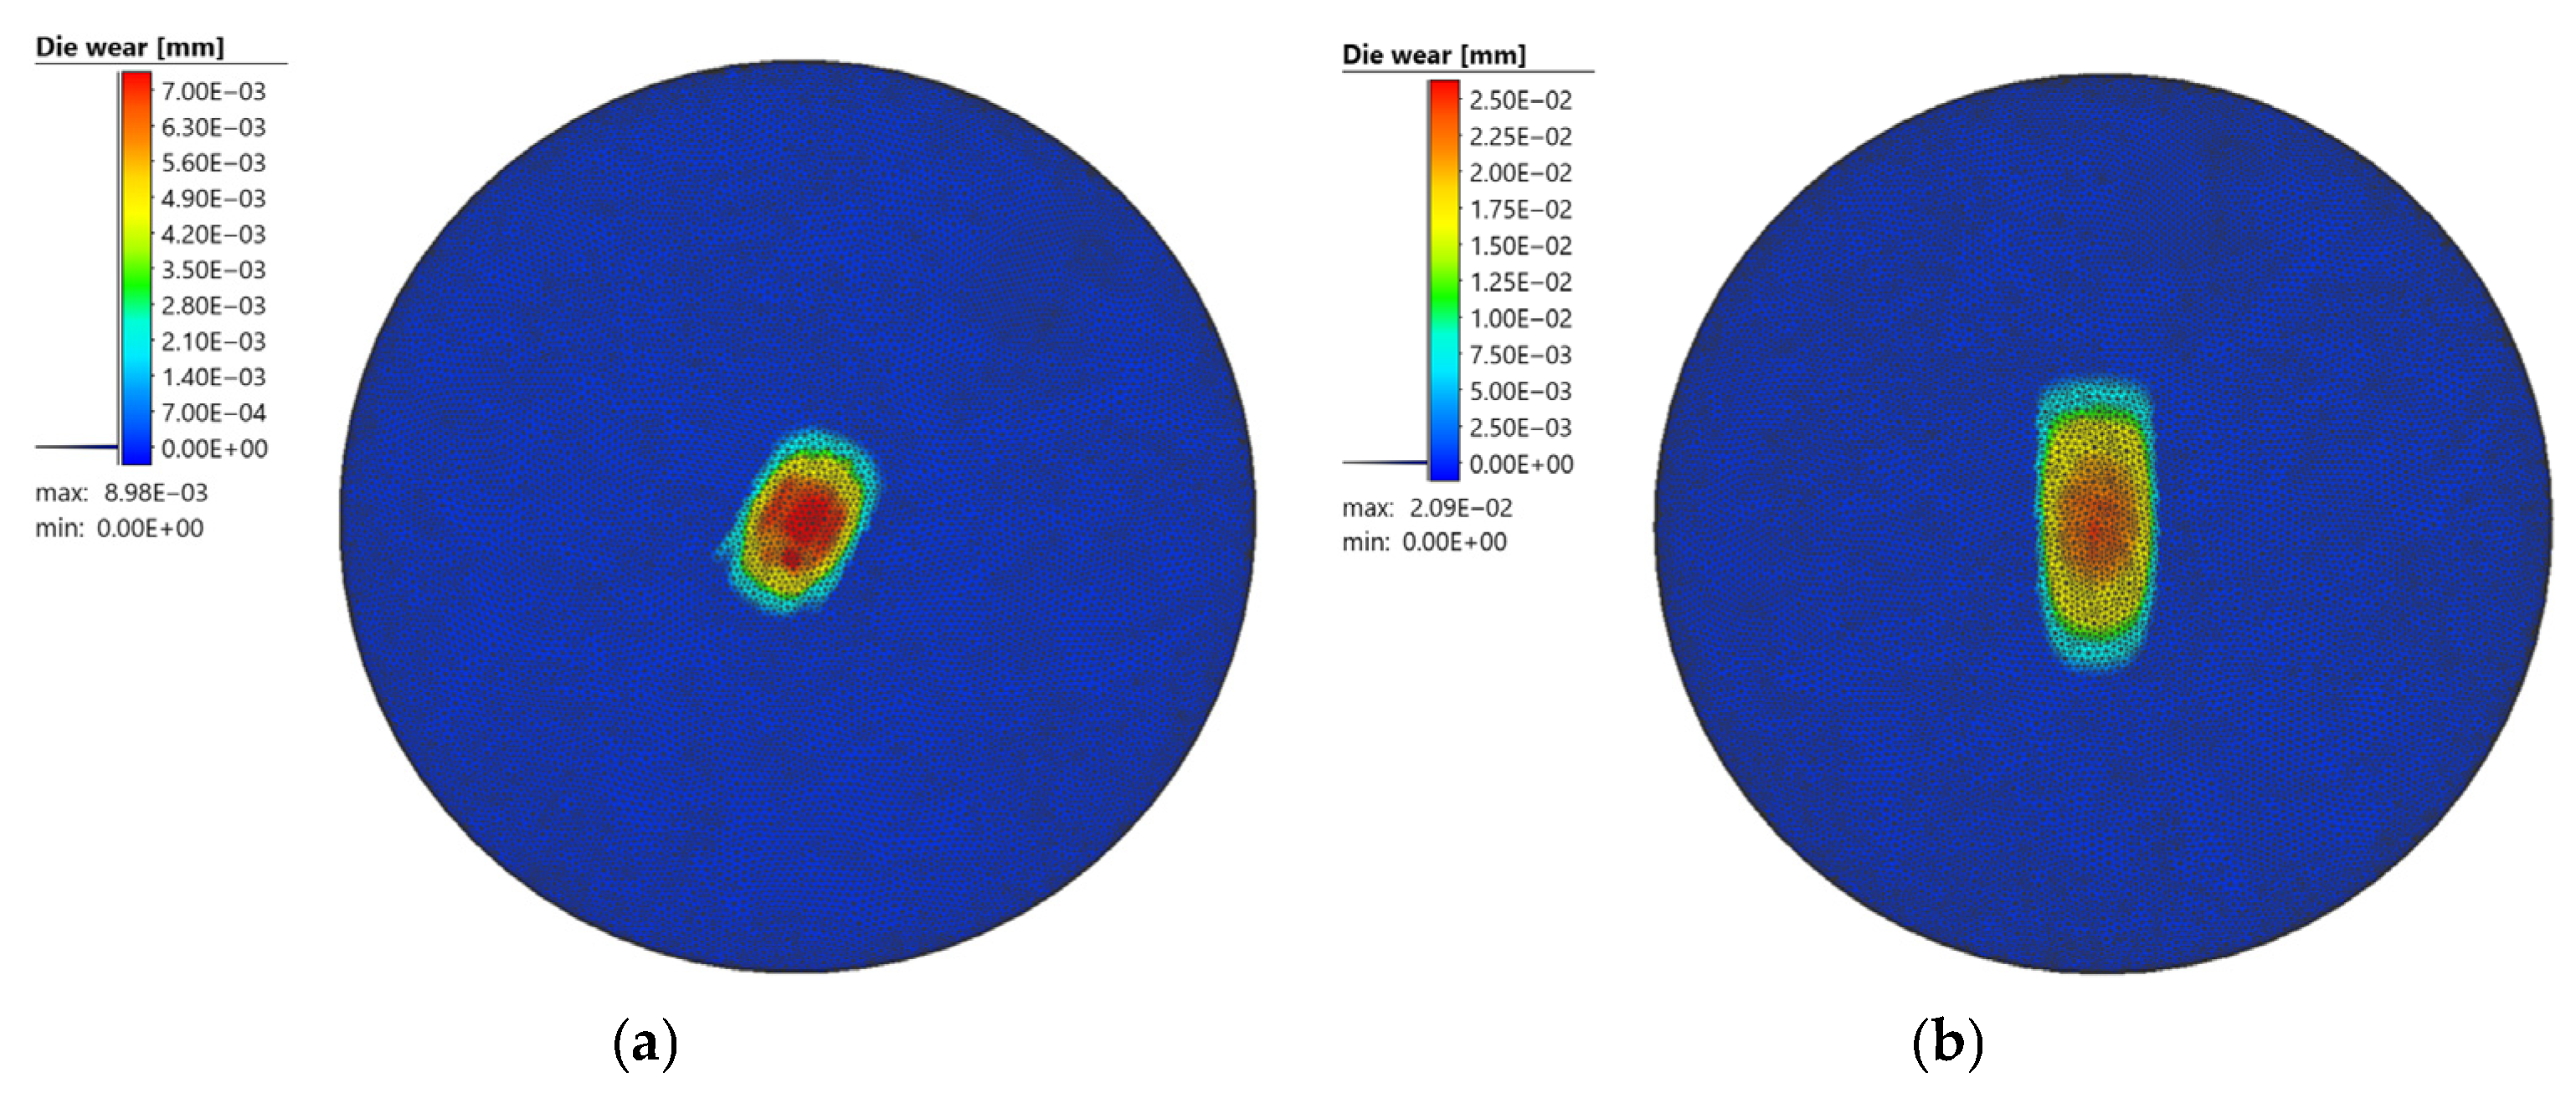
Figure 5a,b shows FEM-predicted wear-depth distributions after 50,000 cycles at 10 N and 240,000 cycles at 15 N, respectively. The early-stage scar (predicted depth: 0.007 mm) is localized; the high-cycle scar is significantly larger, reflecting cumulative material loss.
Figure 5.
FEM-predicted wear-depth distributions (colour maps, mm) on the disc surface. The contact wear zone corresponds to the cylindrical mesh refinement region at radial position 10.4 mm. (a) Condition 10 N/50,000 cycles; peak depth 0.007 mm. (b) Condition 15 N/240,000; peak depth 0.021 mm. The color scale indicates the wear depth distribution. Values are displayed in E-notation as generated by the simulation software.
3.2. Parameter Identification and Nonlinear Exponents
The experimental results demonstrate an exponential relationship between wear depth, applied load, and sliding distance, consistent with the formulation given in Equation (4).
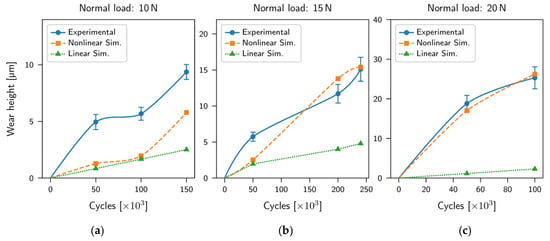
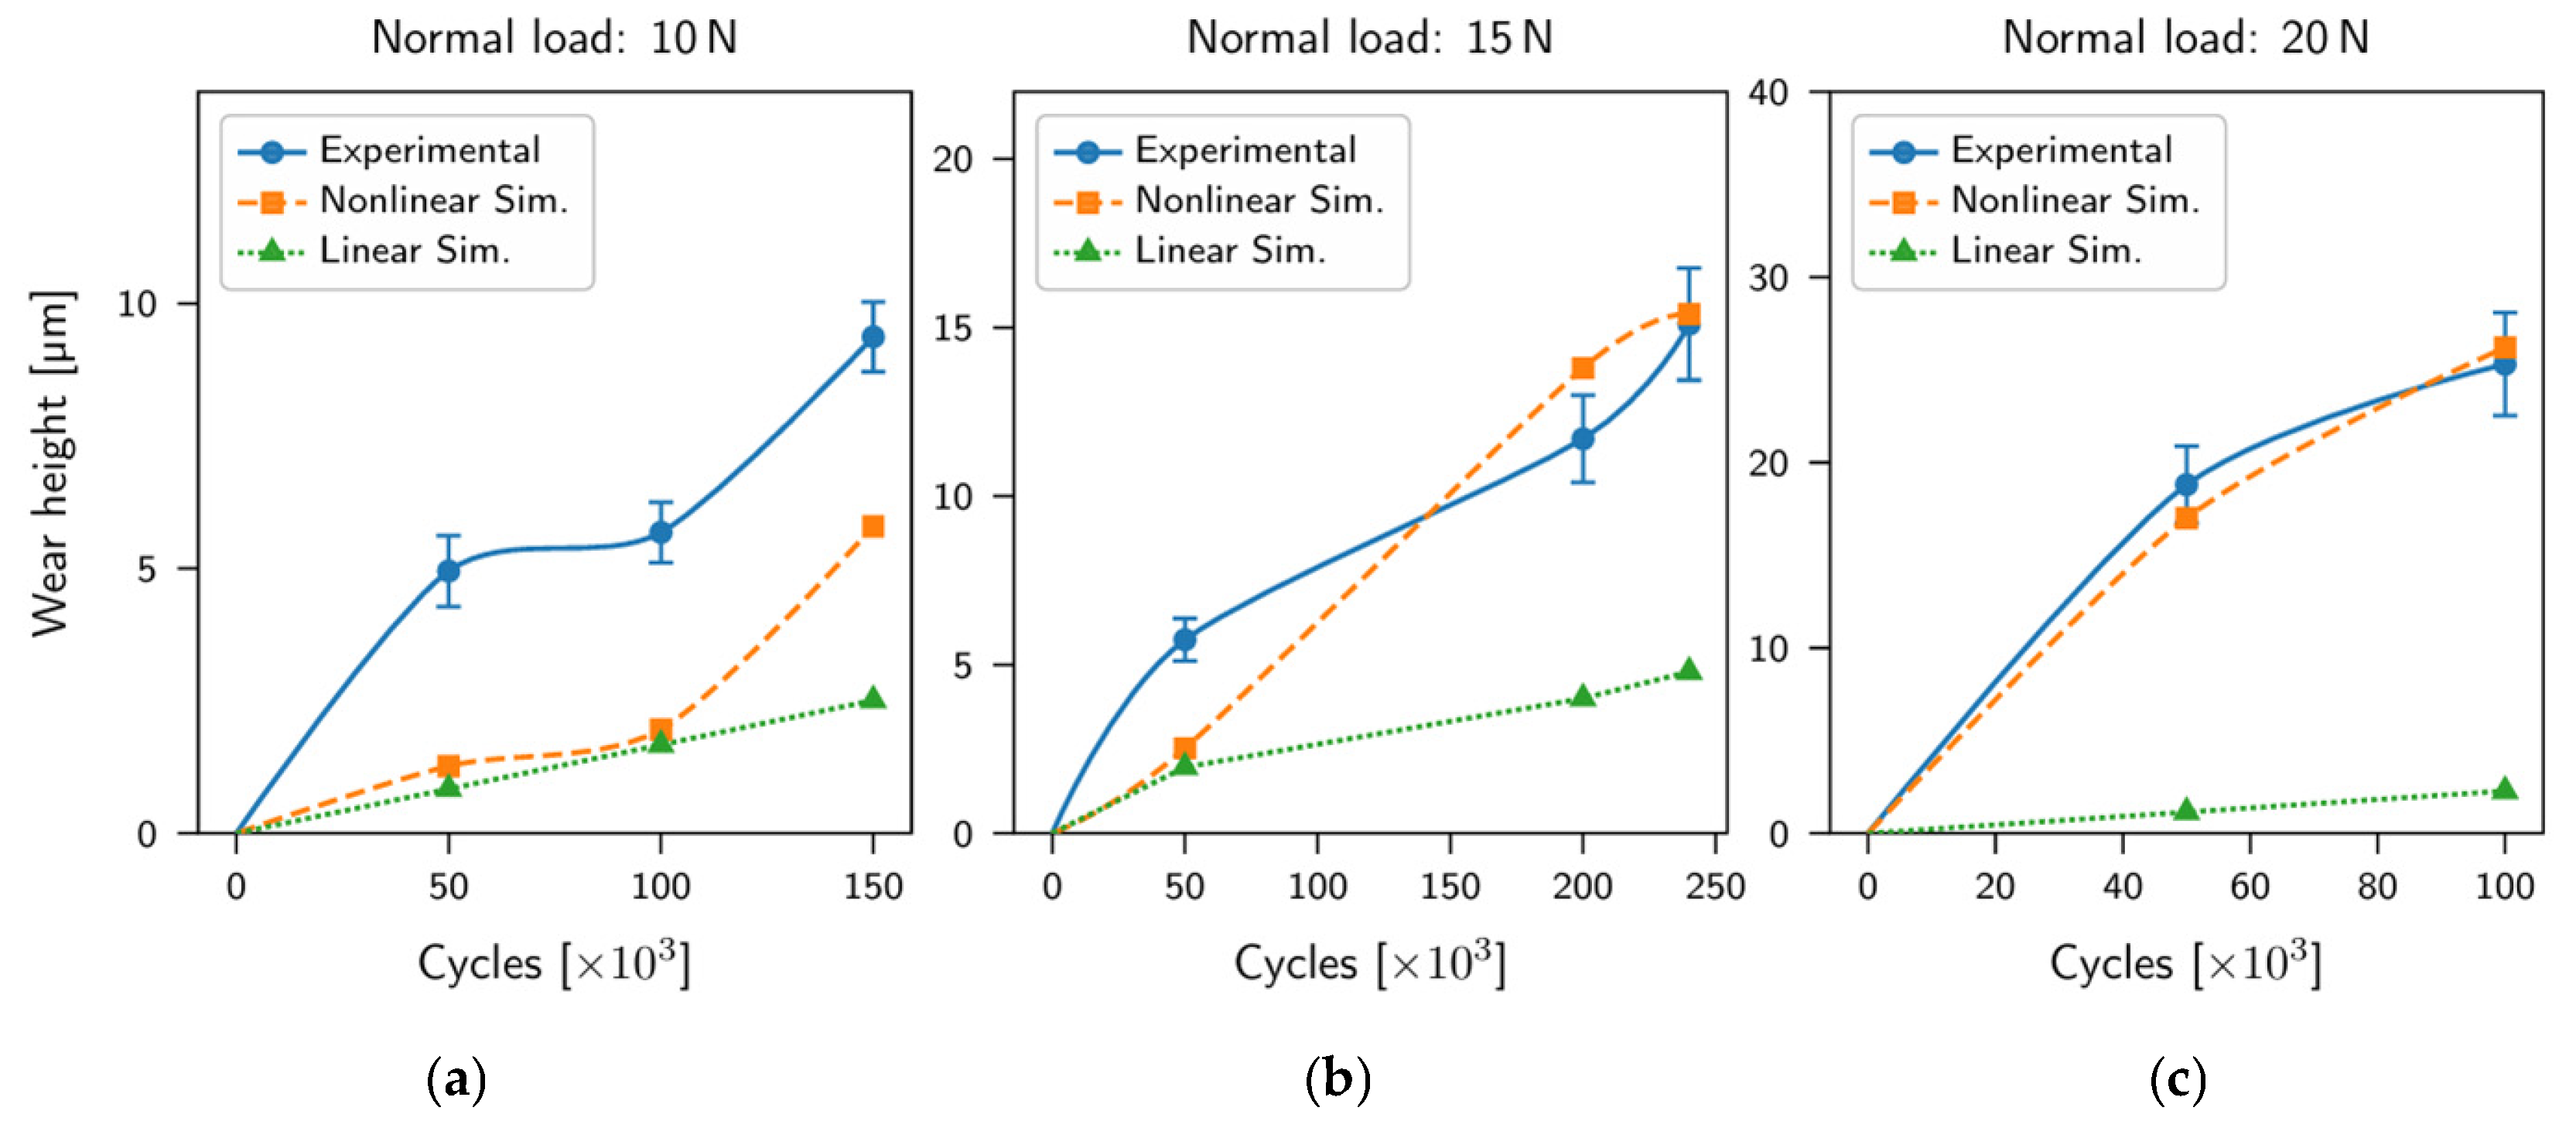
The experimental wear-depth data as a function of cycle count and load are presented in Figure 6. The data show a clear exponential dependency on both cycle count and load, consistent with Equation (4). Notably, it exhibits a stronger sensitivity to load than to cycle count, consistent with the condition and .
Figure 6.
Wear depth as a function of cycle count for (a) 10 N, (b) 15 N, and (c) 20 N normal loads. Solid line with open circles: experimental mean (n = 3); error bars: ±1 standard deviation; dashed line with filled squares: nonlinear Archard–Bayer simulation ; dotted line with filled triangles: linear Archard simulation.
The parameter estimation was performed using weighted least-squares (WLS) regression in log-space with weights derived from replicate standard deviations, yielding the parameter estimates reported in Equation (6).
The wide confidence interval on (Equation (6)) reflects strong multicollinearity between the prefactor and the exponents; m and n (Equations (7) and (8)) are the physically interpretable quantities. The force exponent indicates moderately nonlinear load sensitivity, consistent with the lubricated mixed-regime contact conditions of this study and with exponents reported for comparable lubricated contacts [10,28].
The cycle exponent reflects a progressively decreasing wear rate with cycle count, consistent with surface accommodation and running-in effects [29,30,35].
The FEM required a reduction to to achieve numerical convergence across all load cases (Section 2.5), a difference of 14% from the experimental central estimate. This adjustment lies within the 95% confidence interval of and is therefore statistically indistinguishable from the laboratory-derived value. The residual deviation is attributable to discretisation-induced pressure concentrations in the FEM contact zone rather than to a fundamental model inadequacy.
The cycle exponent followed a different pattern: the FEM-retained value () lies above the upper bound of (95% CI: 0.24–0.58), rather than within it, in contrast to m. This is because, unlike m, n was not independently re-optimised once the load-exponent reduction had restored numerical stability: is the value obtained during the initial stability-oriented fit (Table 2, note “FEM from initial stability fit”), and was carried forward without a subsequent, dedicated re-calibration against the full cycle-count dataset. The resulting gap to nexp is therefore best understood as an artefact of the two-stage calibration sequence (Section 2.5) rather than evidence of a load–cycle coupling effect distinct from the one responsible for the m adjustment. A dedicated re-calibration of n within the FEM, using the full set of cycle-count data points rather than only the mid-/high-load stabilisation cases, is identified as the direct way to close this gap (see Section 4).
Table 2.
Experimentally determined and FEM-calibrated Archard–Bayer parameters. Experimental values are from outlier-corrected weighted least-squares regression (8 condition means, ); 95% confidence intervals given. and differ in magnitude because the FEM WEAR block specifies hardness separately, whereas the experimental regression absorbs it into .
3.3. FEM Implementation and Calibration
In Stage II of the calibration workflow, the experimentally derived parameters were transferred into the finite element model and refined with respect to numerical stability and physical consistency.
Direct use of the laboratory-fitted load exponent resulted in numerical instability and non-physical divergence at low loads, reflecting the strong sensitivity of nonlinear wear formulations to exponent scaling. To obtain a stable and physically consistent numerical response, the exponents were systematically reduced within a narrow admissible range and re-evaluated across the 10 N–20 N load range. Parameter candidates were iteratively assessed against mid- and high-load experimental conditions, prioritizing robust convergence behavior and physically realistic wear evolution.
In accordance with the calibration strategy defined in Section 2.5, the iterative refinement was continued until convergence of both numerical stability and predictive accuracy was achieved. The stopping criteria required (i) convergence of the FEM solution under the prescribed solver tolerances and (ii) stabilization of the wear prediction, such that further parameter adjustments resulted in less than 2% change in predicted wear depth across the investigated load range. The resulting parameter sets are summarized in Table 2.
To achieve stable numerical convergence across all load cases, the load exponent was reduced to , corresponding to a deviation of 14% from the experimental central estimate. This adjustment lies within the 95% confidence interval of (1.23–1.92) and is therefore statistically indistinguishable from the laboratory-derived value. The remaining deviation is attributed to discretisation-induced pressure concentrations within the FEM contact zone rather than to a fundamental limitation of the wear formulation.
The cycle exponent followed a different behavior. The FEM-retained value (n = 0.624) lies above the experimental confidence interval ( = 0.41 ± 0.17) because it was not independently re-optimised after stabilization of the load exponent. Instead, it reflects the initial stability-oriented fit carried forward within the two-stage calibration procedure. A dedicated recalibration of n within the FEM framework, incorporating a denser cycle-dependent dataset, is identified as a necessary step for further improving model accuracy.
3.4. Model Validation Under Varying Loads
The comparison between simulated and experimental wear under 10 N, 15 N, and 20 N load conditions (Figure 7, Figure 8 and Figure 9) reveals a clear separation of functional roles: m predominantly governs the load sensitivity of the wear response, whereas n controls its temporal progression. This explicit decoupling provides a structured pathway for parameter identification not available in conventional linear wear models.
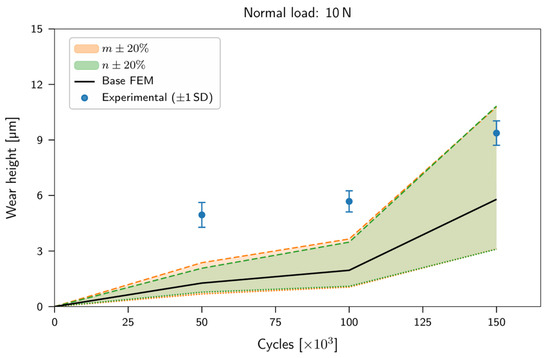
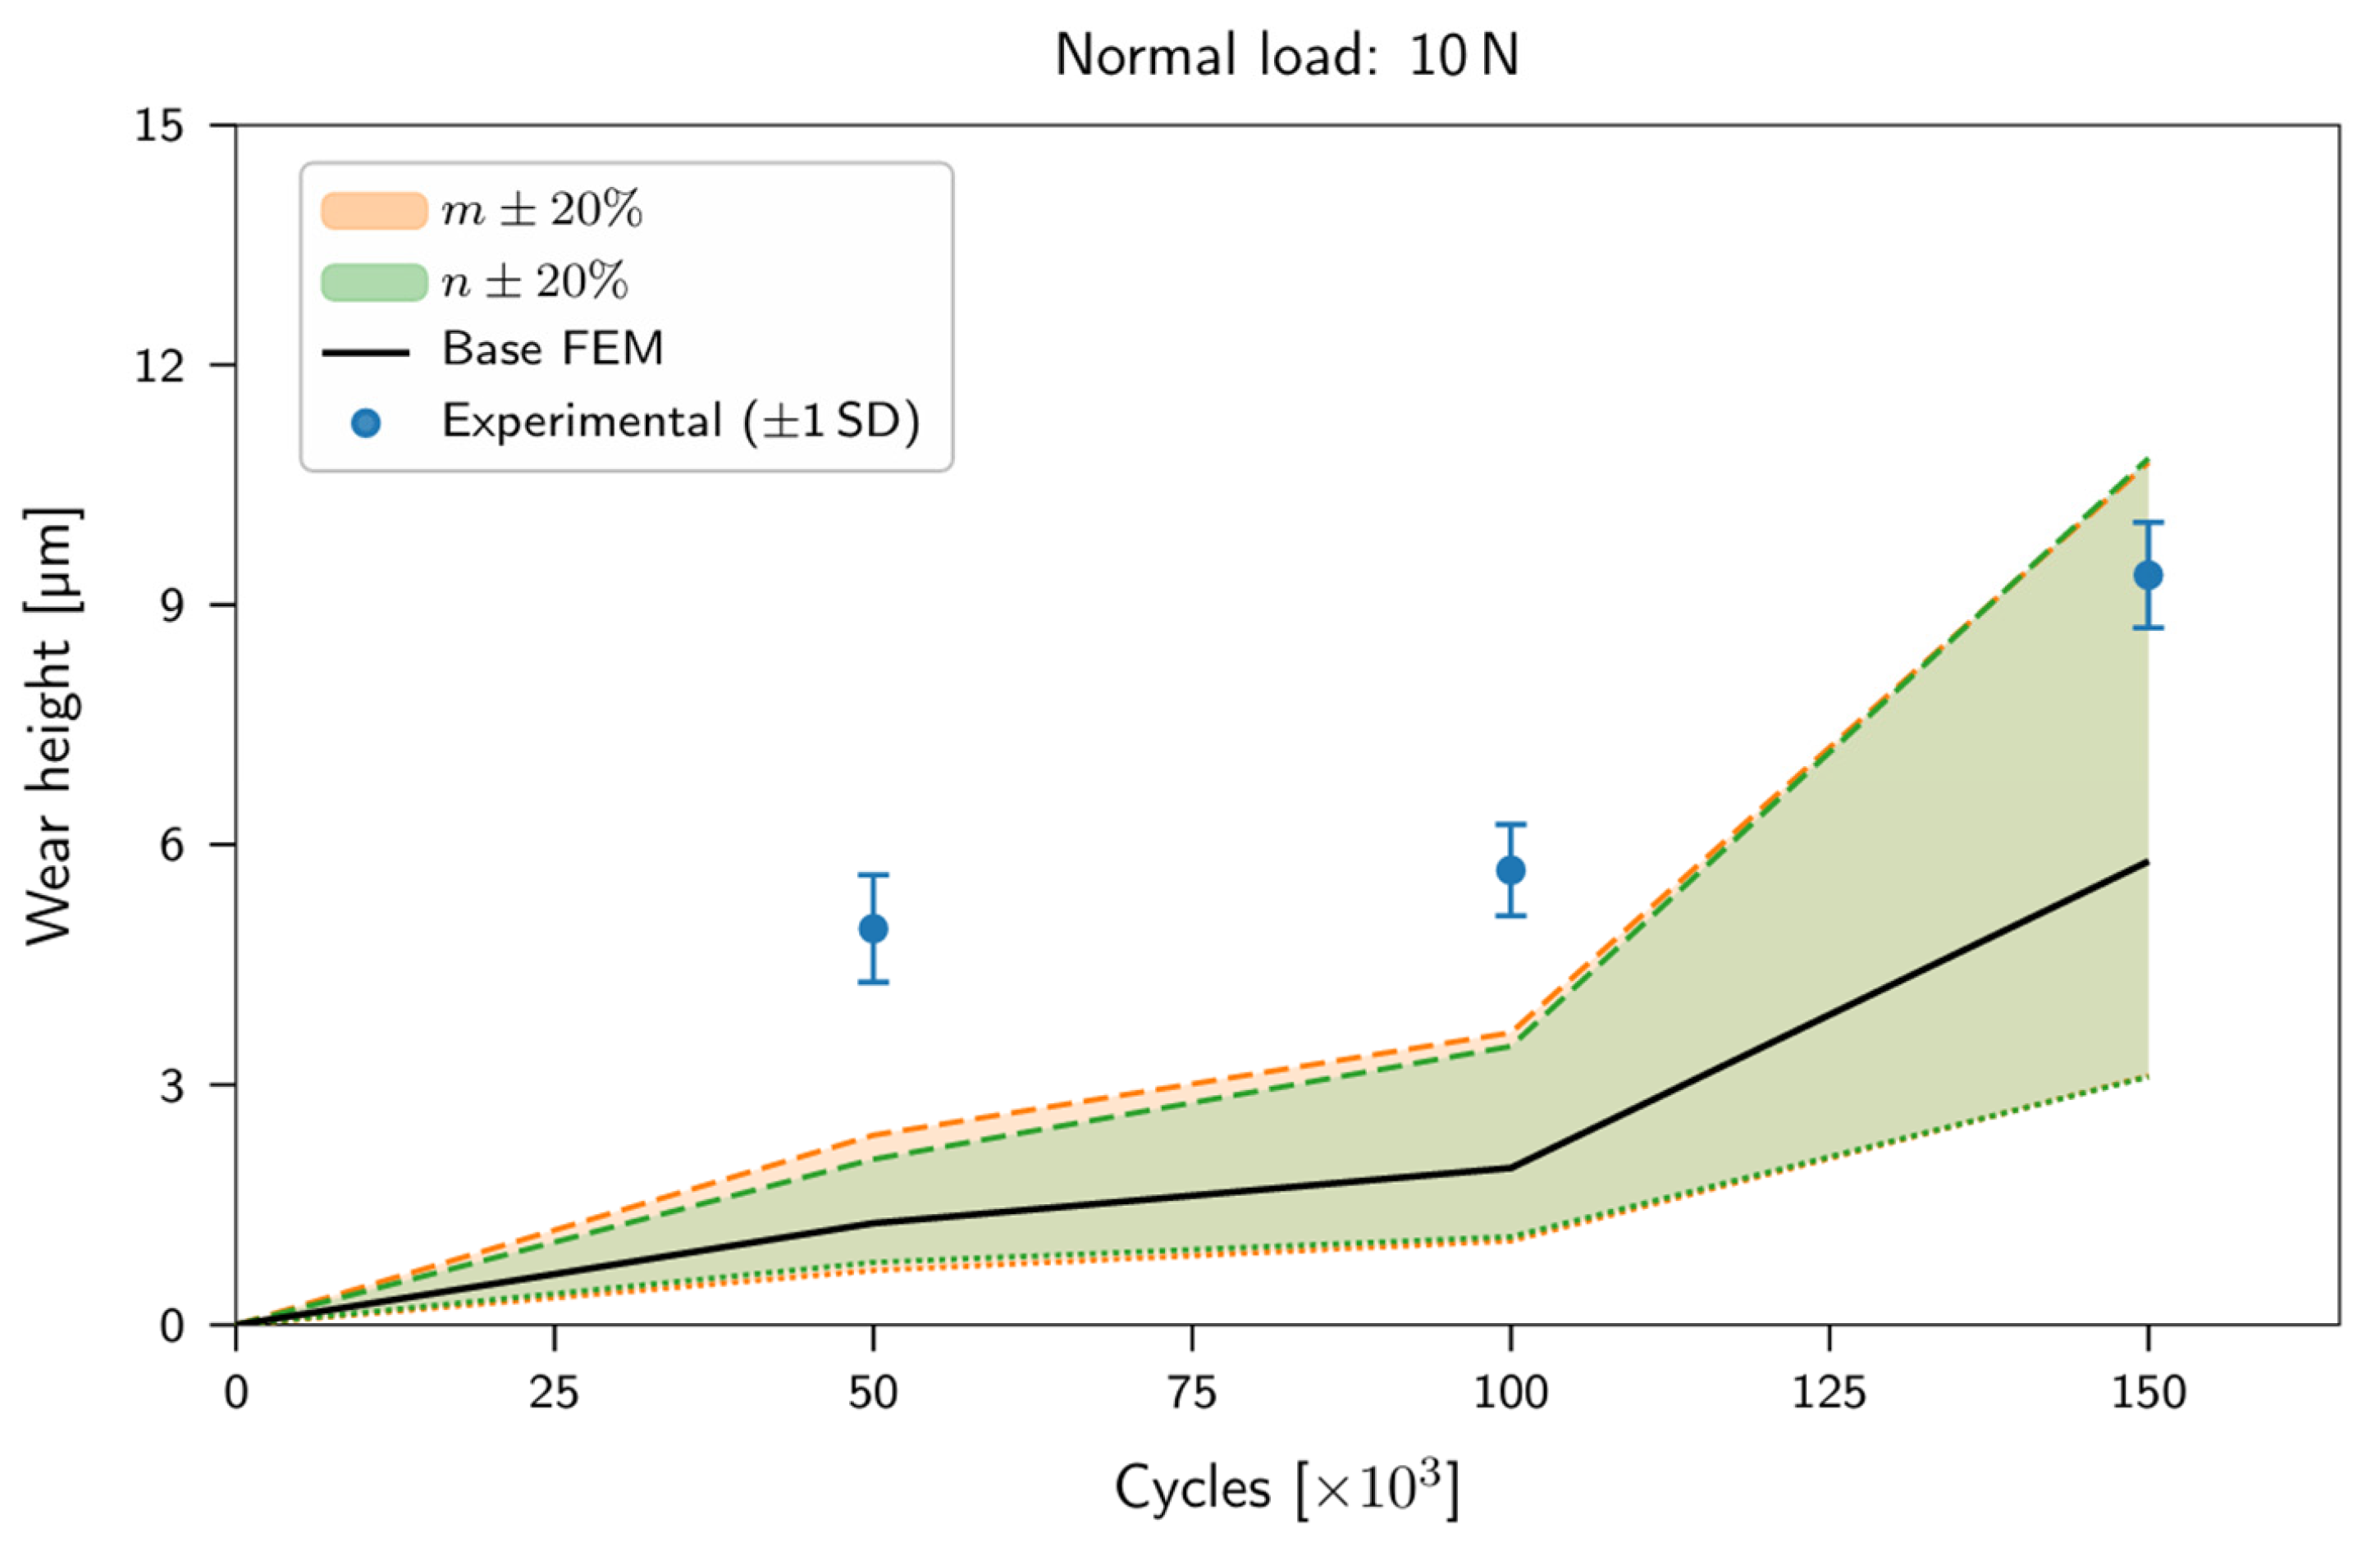
Figure 7.
Sensitivity of the nonlinear Archard–Bayer model to ±20% perturbations of the load exponent (orange band) and cycle exponent (green band) at 10 N. The base FEM solution (m = 1.35, n = 0.624) and experimental data (±1 SD) are shown for comparison.
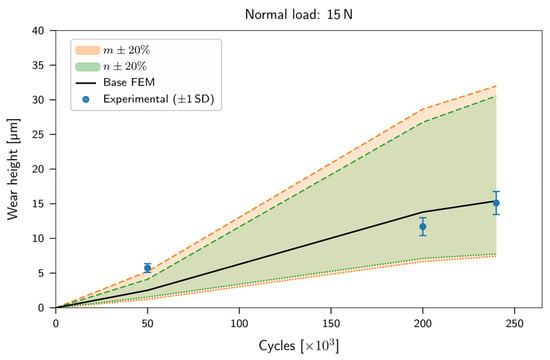
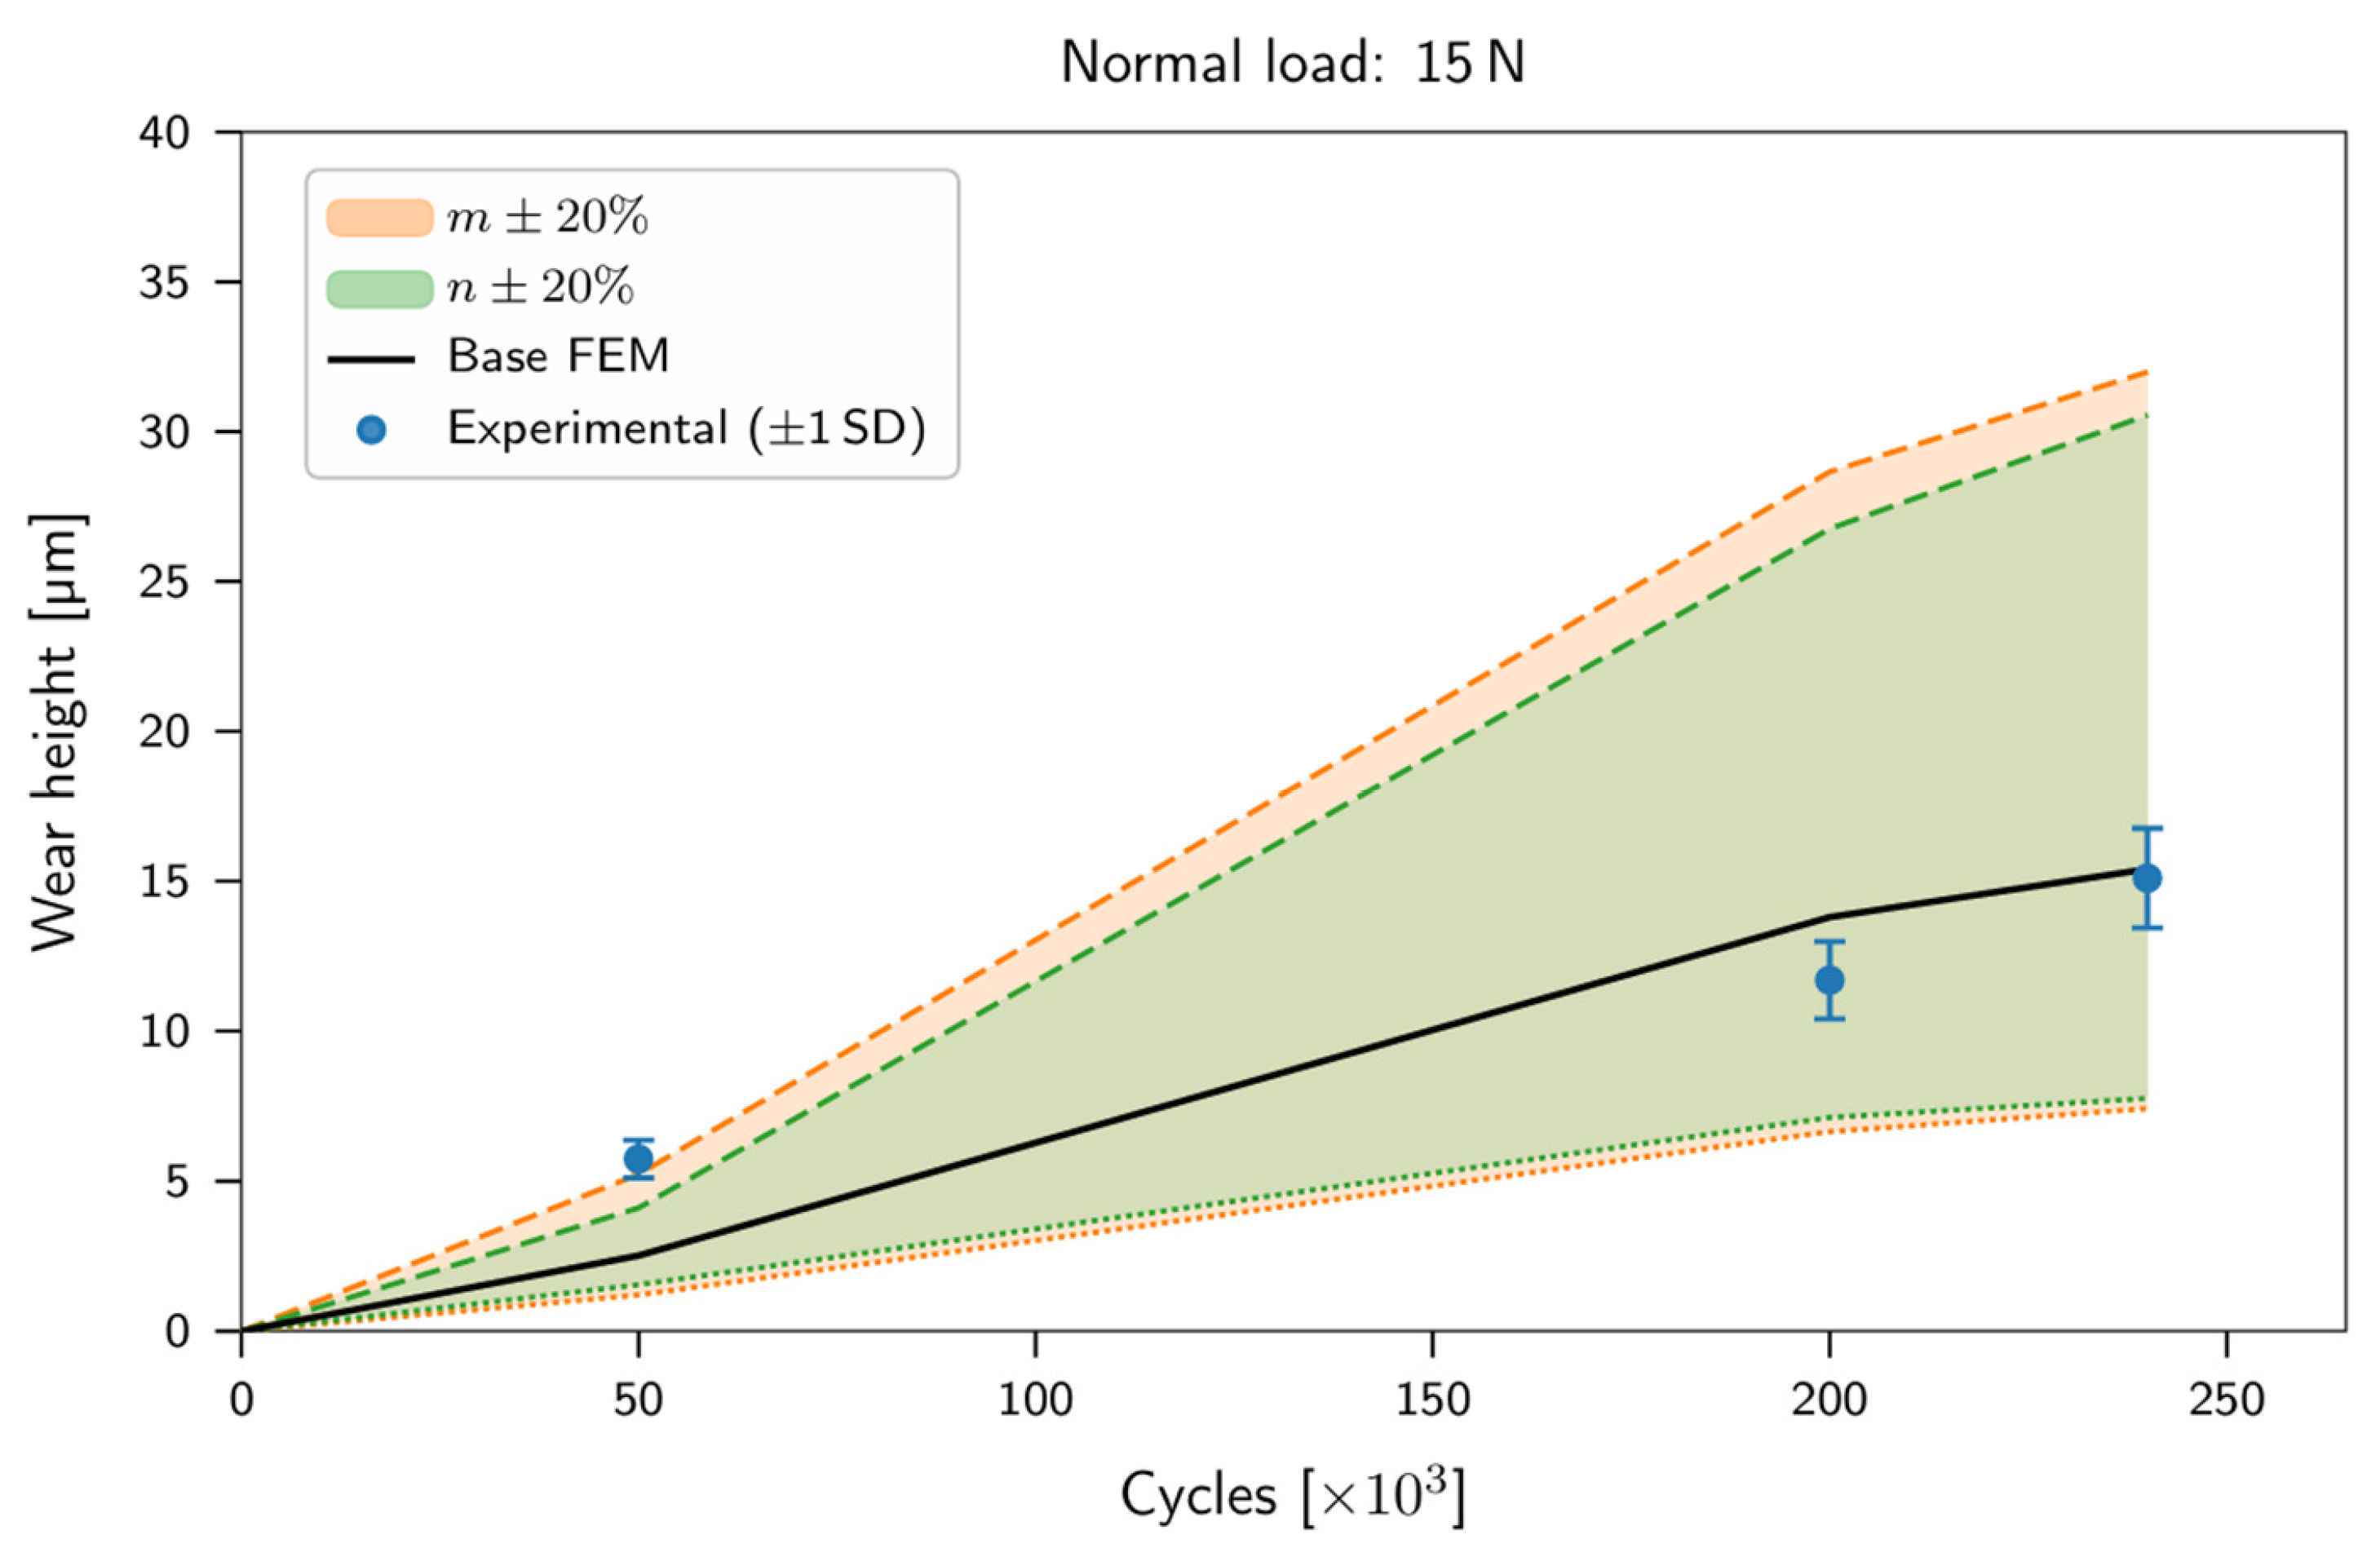
Figure 8.
Sensitivity of the nonlinear model at 15 N. Bands and symbols as in Figure 7. The increased band spread at high cycle counts indicates stronger temporal sensitivity at elevated normal force.
Figure 9.
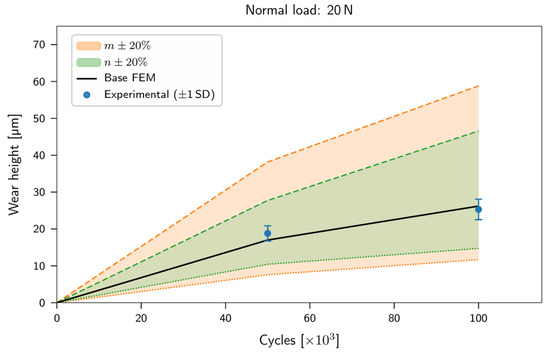
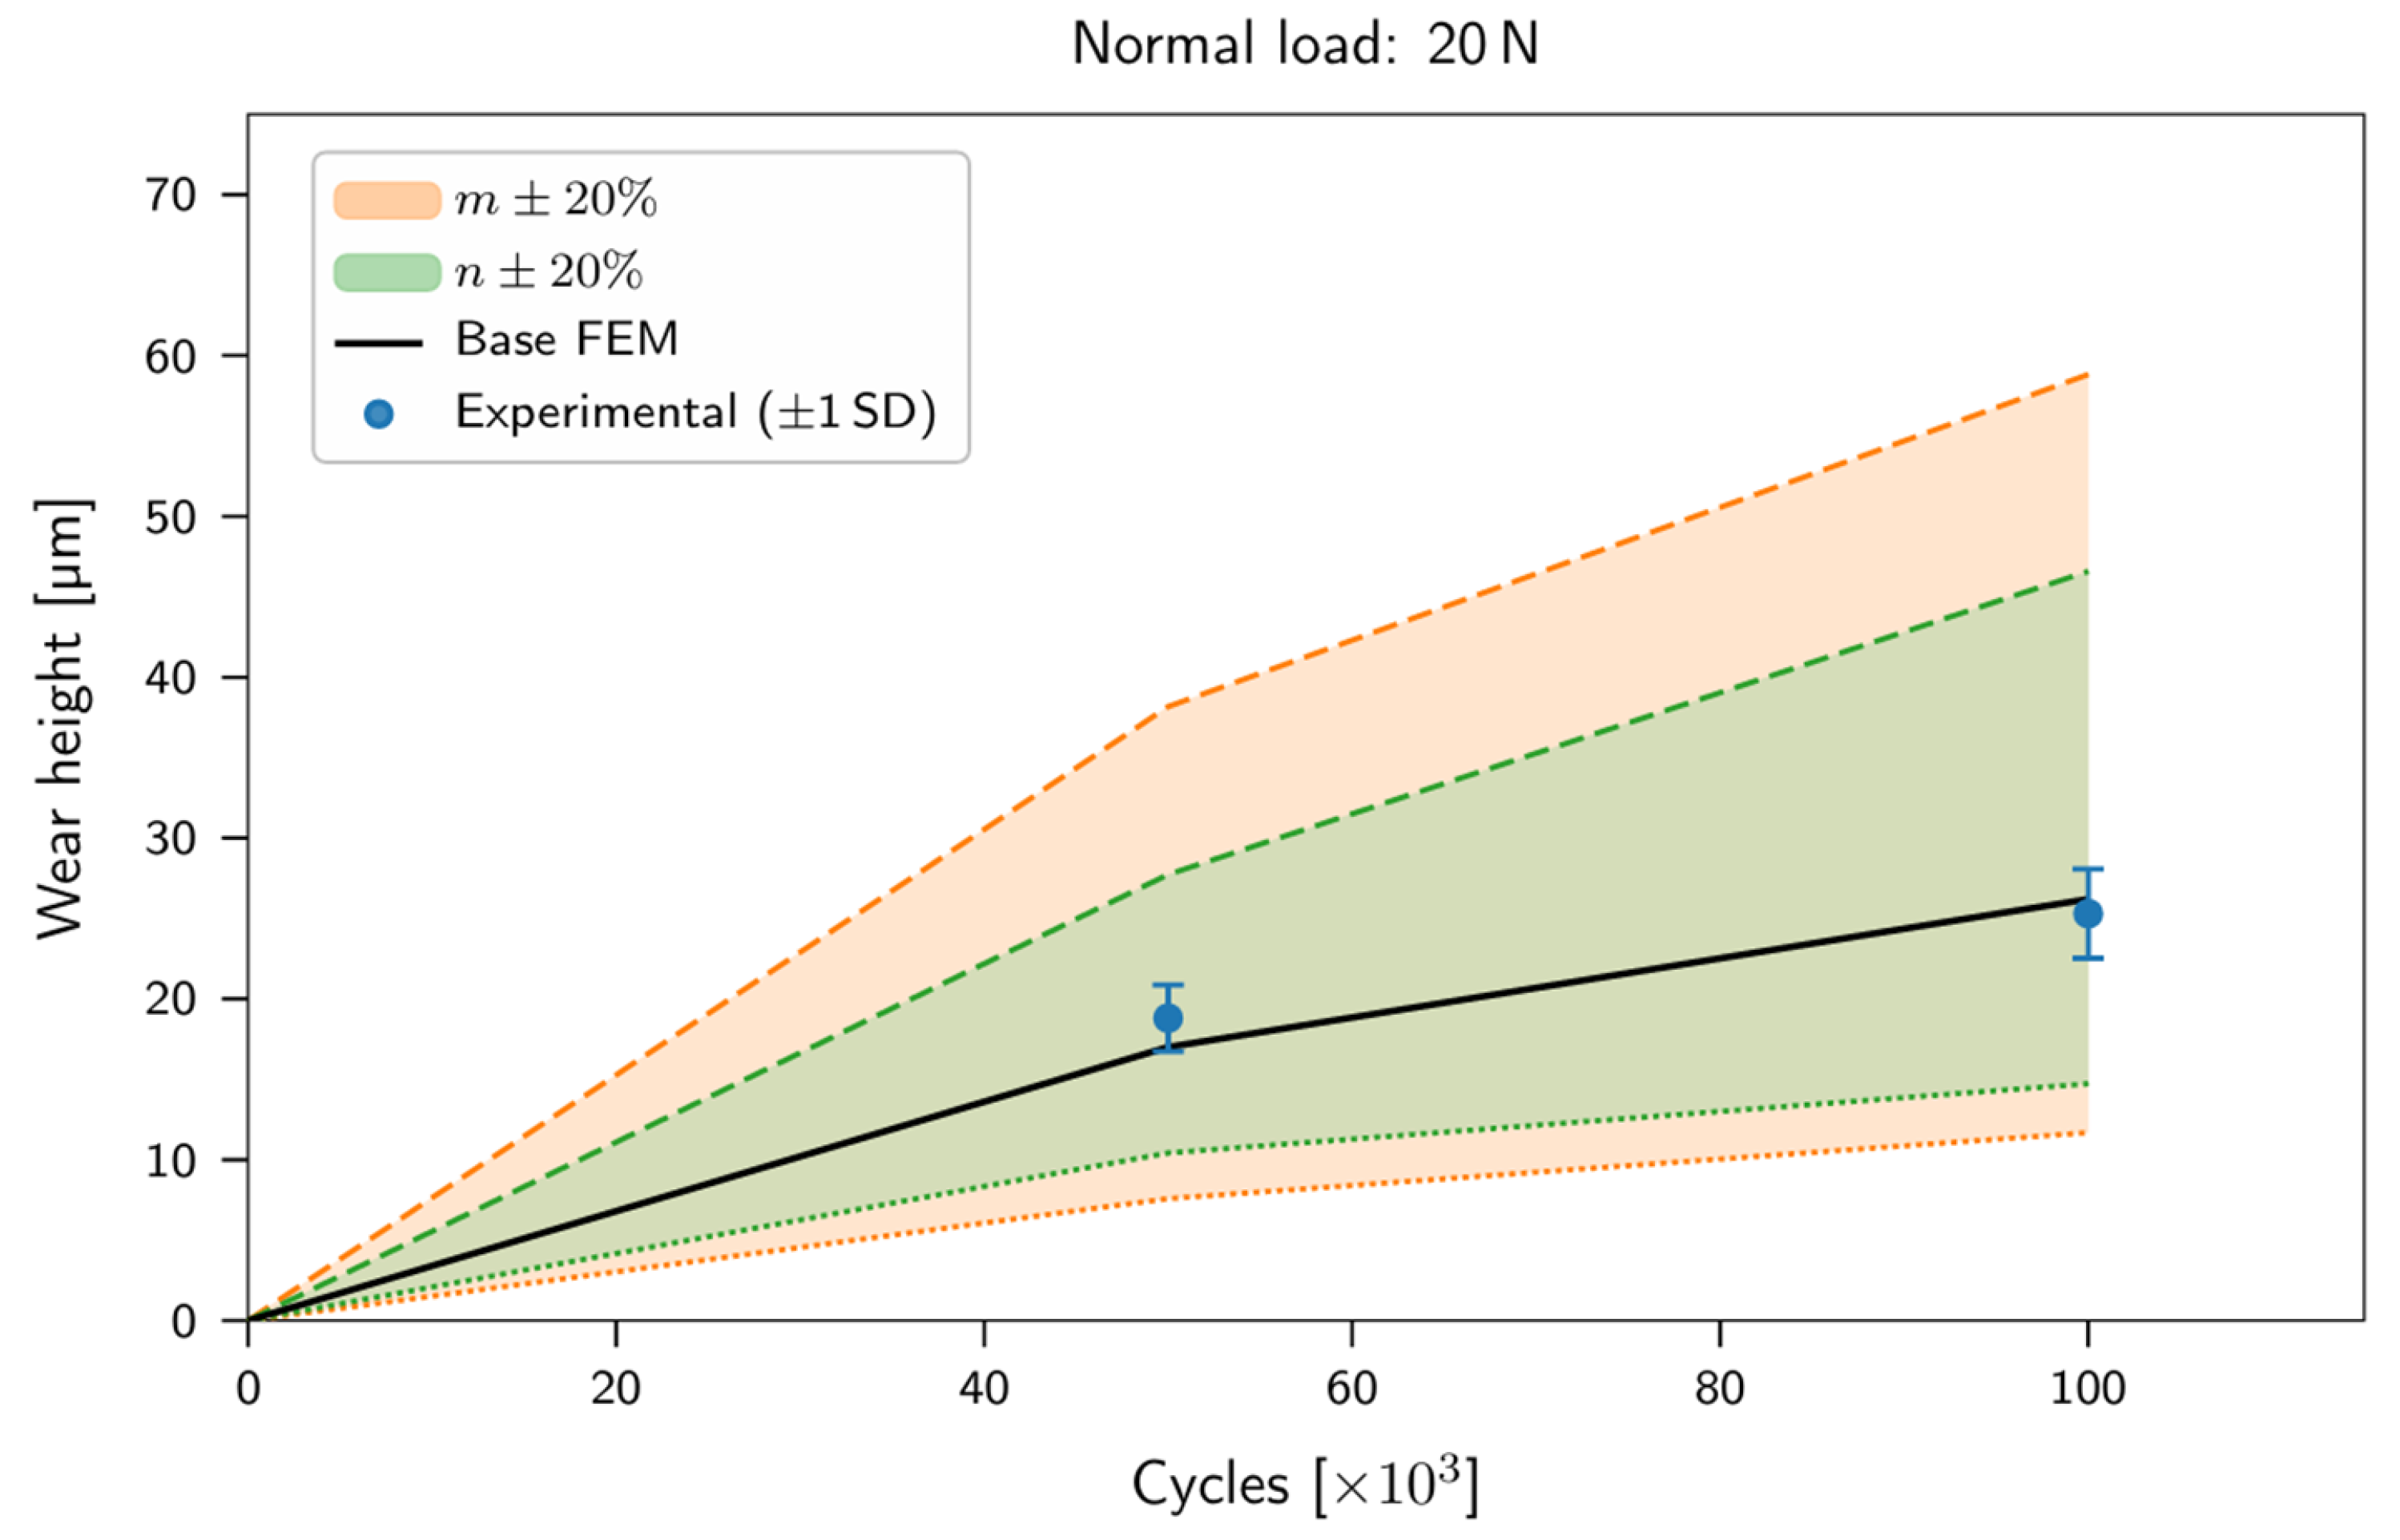
Sensitivity of the nonlinear model at 20 N. Bands and symbols as in Figure 7. The -band (orange) is significantly wider than the n-band (green), indicating that load-dependent effects dominate wear behavior at high normal loads. The x-axis is restricted to the cycle counts tested at this load (up to 100,000 cycles).
Accordingly, the cycle ranges differ between load conditions, and a unified x-axis representation was not applied in order to avoid truncation or extrapolation of the experimental datasets and to preserve their physical interpretability.
Figure 7 illustrates the sensitivity of the nonlinear Archard–Bayer model to variations in the load exponent m and the cycle exponent n at 10 N.
The shaded bands represent ±20% perturbations around the calibrated base case (), highlighting the relative influence of both parameters on the predicted wear evolution. Variations in m primarily affect the absolute wear magnitude, whereas variations in n influence the curvature of the wear progression over the cycle range. The x-axis is restricted to the experimentally investigated cycle range (up to 150,000 cycles) to ensure direct comparability and avoid extrapolative bias.
The corresponding behaviour at 15 N is shown in Figure 8, confirming the suitability of the exponent-based representation for the investigated carbide–steel tribosystem.
Agreement between experimental data and the nonlinear simulation is strong, particularly under 15 N and 20 N loading, confirming the suitability of the exponent-based representation for the investigated carbide–steel tribosystem. At higher loads, the sensitivity analysis (Figure 9) indicates that variations in the load exponent m dominate the model response, as reflected by the significantly wider m-band compared to the n-band. This confirms that wear behavior in this regime is primarily governed by load-dependent mechanisms, while the influence of the cycle exponent n becomes comparatively less pronounced. As in Figure 7, the x-axis is restricted to the experimentally investigated cycle range (up to 100,000 cycles) to ensure consistent comparison.
Deviations emerge most prominently at 10 N (Figure 7), where increasing divergence at higher cycle counts suggests the presence of contact-scale effects—such as micro-adhesive instabilities or non-uniform pressure distributions—that are not explicitly captured by classical wear formulations.
Overall, the sensitivity analysis not only validates the nonlinear model under representative operating conditions but also delineates its range of validity. The results clearly indicate that model accuracy improves with increasing load, while deviations at low loads highlight inherent limitations of simplified wear formulations. This provides a well-defined basis for future model extensions and refinement.
3.5. Comparison of Linear and Nonlinear Simulation Results
A quantitative comparison between linear and nonlinear Archard formulations and experimental measurements is presented in Table 3 and Table 4, covering the full range of investigated load and cycle conditions.
Table 3.
Comparison of nonlinear and linear Archard formula in simulation—Part A. Results for 10 N and 15 N conditions at lower cycle counts.
Table 4.
Comparison of nonlinear and linear Archard formula in simulation—Part B. Results for higher loads and extended cycle counts.
Table 3 summarizes the results for lower loads and cycle counts (10 N and 15 N), whereas Table 4 reports the corresponding behavior at higher loads and extended cycle ranges.
At low load levels (10 N), both models show poor agreement with experimental observations. The nonlinear formulation yields deviations ranging from 2.20% to 290%, while the linear Archard model exhibits substantially larger deviations between 193% and 1550%. These discrepancies indicate fundamental modelling limitations under low-load conditions, where wear behavior is influenced by phenomena not explicitly captured in the underlying formulations.
Possible reasons for this behavior include (i) boundary lubrication effects not explicitly captured by the model, (ii) threshold phenomena in wear initiation, (iii) dominant surface roughness interactions at small contact pressures, and (iv) measurement uncertainties at very low wear volumes.
In contrast, the nonlinear Archard–Bayer model demonstrates significantly improved predictive capability at higher loads. At 15 N/240,000 cycles and across all 20 N conditions, the nonlinear model achieves deviations below 11%, closely matching experimental observations. The linear model, however, continues to exhibit large deviations, exceeding 1000% in several cases.
These results clearly demonstrate that the nonlinear formulation provides a substantially more accurate representation of load-dependent wear behavior. While both models are limited at low loads, the nonlinear model achieves reliable predictive capability within the practically relevant load range for stamping applications.
4. Discussion
The present study provides a systematic evaluation of the nonlinear Archard–Bayer wear model under lubricated Pin-on-Disc conditions, combining extensive experimental data with FEM-based simulations. While the nonlinear formulation demonstrated improved predictive capability compared to the classical linear Archard model, several critical limitations emerged that constrain its broader applicability.
A key methodological outcome is the identification and exclusion of a physically inconsistent outlier in the 15 N measurement series. Inclusion of this point would have resulted in a strongly inflated force exponent , exceeding both the monotonicity constraint and values reported for comparable lubricated contacts [10,28]. After outlier-corrected weighted least-squares regression, the resulting exponent places the system within a moderately nonlinear regime. This is consistent with lubricated mixed-contact conditions, where load-dependent wear is primarily governed by boundary film degradation under increasing contact pressure [16,17]. Optical micrographs (Figure 4) support this interpretation, showing progressively wider and deeper wear scars with increasing load, indicative of a single dominant wear mechanism rather than multiple competing processes.
Within the FEM framework, the calibrated value m = 1.35 is approximately 14% lower than the experimental central estimate. This reduction reflects a numerical consistency requirement rather than a physical discrepancy. Specifically, discretisation-induced pressure concentrations and the fully coupled geometry update amplify the nonlinear term , necessitating a reduced exponent for stable simulations. Despite this adjustment, the final parameter set () achieves deviations below 11% for 15 N and 20 N conditions (Table 4), confirming reliable predictive capability within the primary operating range.
The cycle exponent used in FEM slightly exceeds the experimental confidence interval of . Unlike was not independently re-optimised after stabilization of the load exponent. The retained value therefore reflects the initial stability-oriented fit rather than a dedicated calibration against the full cycle-count dataset and consequently represents a compromise between numerical stability and predictive accuracy.
For a fixed load, the relative scaling of wear depth with cycle count follows , indicating a moderate sensitivity of approximately 15–16% in predicted wear across the investigated cycle range. Given that the baseline FEM already reproduces the experimental values within approximately 2% under high-load conditions (Table 4), this deviation remains within the combined bounds of measurement uncertainty and numerical approximation. A dedicated recalibration of n within the FEM framework, incorporating additional cycle-dependent data, remains an important avenue for future work.
An additional factor influencing the interpretation of the results is the non-uniform distribution of cycle counts across load conditions. The maximum number of cycles achieved varied between load levels (10 N: up to 150,000 cycles; 15 N: up to 240,000 cycles; 20 N: up to 100,000 cycles), which is reflected in Figure 6, Figure 7, Figure 8 and Figure 9. This asymmetry is not a result of experimental design but is attributed to equipment-related constraints. Under sustained operation at higher loads, the tribometer approached its operational limits, preventing extension of the high-load test series to higher cycle counts. From a modelling perspective, this limitation primarily affects the temporal calibration of the wear exponent n, as the high-load regime is less represented at extended cycle ranges. However, the load dependence governed by exponent m remains well constrained due to the clear separation between load levels. Importantly, the highest-load condition (20 N), which is most relevant for industrial applications, still demonstrates strong agreement between simulation and experiment within the investigated cycle range. The observed limitation therefore does not compromise the main conclusion regarding the improved predictive capability of the nonlinear model, but it defines the bounds of its validated application domain.
Comparable challenges have been reported in recent studies on wear modelling in forming processes [5,9,28], where experimentally derived parameters often require adjustment for numerical implementation. The present results confirm that, although nonlinear wear models improve conceptual representation, their predictive performance depends strongly on calibration within a limited operating range. Alternative modelling approaches, such as energy-based or fractal formulations, may provide improved representation of nonlinear wear phenomena and should be explored in future work [15].
The experimental quantification of minimal wear under lubricated conditions remains a significant challenge. Optical measurement limitations at very small wear depths (<3 μm), assumptions regarding spherical wear-scar geometry, and systematic uncertainties associated with indirect measurement approaches all contribute to the overall uncertainty. These limitations indicate the need for advanced surface characterization techniques, such as white-light interferometry or atomic force microscopy [36], as well as improved uncertainty propagation frameworks.
Beyond these conceptual alternatives, the remaining deviation (≤11% at 15–20 N) can be further reduced through targeted model refinements. First, the cycle exponent n is currently retained at a numerically stability-driven value (0.624) rather than its statistically optimal experimental estimate (0.41); recalibration using a denser set of cycle counts and a refined contact-zone mesh may allow n to approach without reintroducing the stability limitations observed during the initial calibration step. Second, discretisation-induced pressure concentrations scale with element size at the contact interface; further mesh refinement focused on the early-cycle contact region is therefore a promising approach. Third, since the largest residual deviations occur at 10 N (Table 3), additional experimental data combined with higher-resolution metrology (e.g., white-light interferometry or atomic force microscopy) would allow the low-load regime to be calibrated independently rather than constrained by a single global parameter set.
From an industrial perspective, the calibrated nonlinear model provides satisfactory accuracy (≤15% deviation) within the 15 N–20 N load range, enabling improved tool-life prediction compared to linear models in stamping and forming operations: deviations of 2.20–10.87% at 15 N/240 k and all 20 N conditions (Table 4), representing an improvement of more than one order of magnitude. However, deviations increase substantially at lower loads (10 N), reaching 61.9–290% (Table 3). This highlights the limited transferability of the calibrated model outside the validated operating window and the need for caution when extrapolating beyond these conditions.
5. Conclusions
This study systematically evaluated the predictive capability of a nonlinear Archard–Bayer wear behavior for lubricated Pin-on-Disc contacts using a combined experimental and FEM-based approach. The main findings are summarised as follows:
- Statistically robust experimental calibration. A physically inconsistent outlier in the 15 N dataset was identified and excluded based on monotonicity constraints. Outlier-corrected regression yields and
- Nonlinear model outperforms the classical linear Archard law. Deviations remain below 11% for 15–20 N, compared to (193–1550%) for the linear model under identical conditions (Table 4).
- FEM parameter adjustment is statistically consistent. The calibrated value m = 1.35 lies within the confidence interval of , indicating that the reduction required for numerical stability does not represent a physical discrepancy. The cycle exponent n = 0.624 remains above and requires dedicated recalibration.
- Validity is bounded at low loads. At 10 N, both models show substantial deviations (up to 290% for the nonlinear model), indicating contact-scale effects such as lubrication breakdown and measurement limitations that are not captured by the power-law formulation.
- Practical relevance for industrial applications. The calibrated model provides reliable predictions within the 15–20 N range, supporting improved tool-life estimation. Extrapolation beyond this range, particularly at low loads, is not recommended.
- Identified next steps. A consistent recalibration of both exponents within the FEM framework, supported by increased cycle resolution and refined contact discretisation, is required to further improve model accuracy.
- Future work should incorporate multiphysics effects such as lubrication dynamics, thermal coupling, and surface roughness evolution, as well as explore hybrid approaches combining physics-based models with machine learning [37,38,39].
Author Contributions
T.B.H. and W.R. conceptualised the study; M.A.O. and T.B.H. performed the trials; M.A.O. and T.B.H. set up the simulations; T.B.H. and A.K.M.D. wrote the manuscript; T.B.H. performed industrial measurements and validation; A.K.M.D. supervised the study and contributed to methodology; A.K.M.D. and M.K. contributed to methodology, validation and manuscript editing; W.R. and M.A.O. contributed to manuscript review and editing. All authors have read and agreed to the published version of the manuscript.
Funding
This research did not receive any specific grant from funding agencies in the public, commercial, or not-for-profit sectors.
Data Availability Statement
The datasets generated and/or analyzed during the current study are not publicly available due to proprietary constraints at the industrial site but are available from the corresponding author on reasonable request. Aggregated measurement outputs supporting the key findings are included within the article figures.
Acknowledgments
The authors thank the industrial partner for access to production facilities and metrology equipment.
Conflicts of Interest
The authors declare no conflicts of interest.
References
- Kuwahara, T.; Romero, P.A.; Makowski, S.; Weihnacht, V.; Moras, G.; Moseler, M. Mechano-chemical decomposition of organic friction modifiers with multiple reactive centres induces superlubricity of ta-C. Nat. Commun. 2019, 10, 151. [Google Scholar] [CrossRef] [Scilit] [PubMed]
- Meng, Y.; Xu, J.; Ma, L.; Jin, Z.; Prakash, B.; Ma, T.; Wang, W. A review of advances in tribology in 2020–2021. Friction 2022, 10, 1443–1595. [Google Scholar] [CrossRef] [Scilit]
- Da Silva Simioni, G.C.; Pinheiro, T.d.V.; Vasques, G.d.L.; Lantmann, R.V.; Lopes, M.M.; Wettergreen, M.; Oden, Z.M.; Vianna, F.D.; dos Santos, C.A. Engineering design process in developing a pin-on-disk apparatus to perform dry or lubricated sliding wear test. IEEE Trans. Instrum. Meas. 2023, 72, 6011409. [Google Scholar] [CrossRef] [Scilit]
- Nowotyńska, I. The influence of geometrical parameters of a tool on its wear in selected technological processes. Adv. Sci. Technol. Res. J. 2021, 15, 198–207. [Google Scholar] [CrossRef] [Scilit] [PubMed]
- Bang, J.; Park, N.; Song, J.; Kim, H.-G.; Bae, G.; Lee, M.-G. Tool wear prediction in the forming of automotive DP980 steel sheet using statistical sensitivity analysis and accelerated U-bending based wear test. Metals 2021, 11, 306. [Google Scholar] [CrossRef] [Scilit]
- Siopis, M.; Neu, R.W. Wear at high sliding speeds and high contact pressures. Wear 2015, 342–343, 356–363. [Google Scholar] [CrossRef] [Scilit]
- Pawlus, P.; Reizer, R. A state of the art on mechanically dominated methods of wear modelling. Arch. Comput. Methods Eng. 2025, 33, 2471–2524. [Google Scholar] [CrossRef] [Scilit]
- Archard, J.F.; Hirst, W. The wear of metals under unlubricated conditions. Proc. R. Soc. Lond. A 1956, 236, 397–410. [Google Scholar] [CrossRef] [Scilit]
- Delaney, B.; Wang, Q.; Aggarwal, V.; Chen, W.; Evans, R.D. A Contemporary Review and Data-Driven Evaluation of Archard-Type Wear Laws. Appl. Mech. Rev. 2025, 77, 022101. [Google Scholar] [CrossRef] [Scilit]
- Bayer, R.G. A general model for sliding wear in electrical contacts. Wear 1993, 162–164, 913–918. [Google Scholar] [CrossRef] [Scilit]
- Yan, L.; Guan, L.; Wang, D.; Xiang, D. Application and prospect of wear simulation based on ABAQUS: A review. Lubricants 2024, 12, 57. [Google Scholar] [CrossRef] [Scilit]
- Springis, G.; Boiko, I. Comparative analysis of wear models for accurate wear predictions. Lubricants 2025, 13, 100. [Google Scholar] [CrossRef] [Scilit]
- Bortoleto, E.M.; Rovani, A.; Seriacopi, V.; Profito, F.; Zachariadis, D.; Machado, I.; Sinatora, A.; Souza, R. Experimental and numerical analysis of dry contact in the pin on disc test. Wear 2013, 301, 19–26. [Google Scholar] [CrossRef] [Scilit]
- Okereke, M.; Keates, S. Finite Element Applications—A Practical Guide to the FEM Process; Springer: Berlin/Heidelberg, Germany, 2018. [Google Scholar] [CrossRef] [Scilit]
- Choudhry, J.; Almqvist, A.; Larsson, R. Improving Archard’s wear model: An energy-based approach. Tribol. Lett. 2024, 72, 93. [Google Scholar] [CrossRef] [Scilit]
- Stephan, S.; Schmitt, S.; Hasse, H.; Urbassek, H.M. Molecular dynamics simulation of the Stribeck curve: Boundary lubrication, mixed lubrication, and hydrodynamic lubrication on the atomistic level. Friction 2023, 11, 2342–2366. [Google Scholar] [CrossRef] [Scilit]
- Zhang, S.; Yan, Z.; Liu, Z.; Jiang, Y.; Sun, H.; Wu, S. Experimental and Numerical Study of the Mixed Lubrication Considering Boundary Film Strength. Materials 2023, 16, 1035. [Google Scholar] [CrossRef] [Scilit] [PubMed]
- Ceretti, E.; Fiorentino, A.; Giardini, C. Process parameters influence on friction coefficient in sheet forming operations. Int. J. Mater. Form. 2008, 1, 1219–1222. [Google Scholar] [CrossRef] [Scilit]
- Di Puccio, F.; Di Pietro, A.; Mattei, L. Pin-on-plate vs. pin-on-disk wear tests: Theoretical and numerical observations on the initial transient phase. Lubricants 2024, 12, 134. [Google Scholar] [CrossRef] [Scilit]
- Challen, J.M.; Oxley, P.L.B. An explanation of the different regimes of friction and wear using asperity deformation models. Wear 1979, 53, 229–243. [Google Scholar] [CrossRef] [Scilit]
- Villanueva, E.; Albizuri, J.; Caballero, P.; Guraya, T.; Vicario, I. Prediction of wear rate by a new direct method using the friction coefficient curve. J. Manuf. Mater. Process. 2024, 9, 6. [Google Scholar] [CrossRef] [Scilit]
- Humpf, T.B.; De Silva, A.K.M.; Rimkus, W.; Oppold, M.A.; Kulatunga, M. Iterative Calibration of an Archard Wear Model from Production Data: Framework, Industrial Validation and Transferability Assessment for Sheet Metal Stamping. Appl. Sci. 2026, 16, 5915. [Google Scholar] [CrossRef] [Scilit]
- Ba, E.C.T.; Dumont, M.R.; Martins, P.S.; Drumond, R.M.; da Cruz, M.P.M.; Vieira, V.F. Investigation of the effects of skewness Rsk and kurtosis Rku on tribological behavior in a pin-on-disc test of surfaces machined by conventional milling and turning processes. Mater. Res. 2021, 24, e20200435. [Google Scholar] [CrossRef] [Scilit]
- Zemzemi, F.; Bensalem, W.; Rech, J.; Dogui, A.; Kapsa, P. New tribometer designed for the characterisation of the friction properties at the tool/chip/workpiece interfaces in machining. Tribotest 2008, 14, 11–25. [Google Scholar] [CrossRef] [Scilit]
- Dul, J.; van der Laan, E.; Kuik, R. A statistical significance test for necessary condition analysis. Organ. Res. Methods 2020, 23, 385–395. [Google Scholar] [CrossRef] [Scilit]
- Kuo, W.-F.; Chiou, Y.-C.; Lee, R.-T. A study on lubrication mechanism and wear scar in sliding circular contacts. Wear 1996, 201, 217–226. [Google Scholar] [CrossRef] [Scilit]
- Salguero, J.; Iglesias, P.; Vazquez-Martinez, J.M.; Batista, M.; Del Sol, I. A comparative study of disk wear volume evaluation of Al2024 based on ASTM G99. In Proceedings of the ASME 2022 International Mechanical Engineering Congress and Exposition, Columbus, OH, USA, 30 October–3 November 2022. [Google Scholar] [CrossRef] [Scilit]
- Hoffmann, H.; Hwang, C.; Ersoy, K. Advanced wear simulation in sheet metal forming. CIRP Ann. Manuf. Technol. 2005, 54, 217–220. [Google Scholar] [CrossRef] [Scilit]
- Kumar, R.; Prakash, B.; Sethuramiah, A. A systematic methodology to characterise the running-in and steady-state wear processes. Wear 2002, 252, 445–453. [Google Scholar] [CrossRef] [Scilit]
- Ismail, R. Running-In of Rolling-Sliding Contacts; University of Twente: Twente, The Netherlands, 2013. [Google Scholar]
- Mattei, L.; Di Puccio, F. Frictionless vs. Frictional Contact in Numerical Wear Predictions of Conformal and Non-conformal Sliding Couplings. Tribol. Lett. 2022, 70, 115. [Google Scholar] [CrossRef] [Scilit]
- Worasaen, K. Predictive FEM modeling of dry sliding wear in WC-Co incorporating UMESHMOTION and sliding-distance scaling. Eng. Solid Mech. 2026, 14, 161–172. [Google Scholar] [CrossRef] [Scilit]
- He, Z.; Hu, Y.; Zheng, X.; Yu, Y. A Calculation Method for Tooth Wear Depth Based on the Finite Element Method That Considers the Dynamic Mesh Force. Machines 2022, 10, 69. [Google Scholar] [CrossRef] [Scilit]
- Zhang, G.; Tang, J.; Yang, K.; Wang, R.; Chen, Y.; Xiong, Y.; Wu, C.; Li, Z.; Wang, Y.; Lin, H. Important contributions of metal interfaces on their tribological performances: From influencing factors to wear mechanisms. Compos. Struct. 2024, 337, 118027. [Google Scholar] [CrossRef] [Scilit]
- Abd, A.M. Estimation of Wear Depth as an Approach to Predict Tool Service Life in Cold Forming Process. DJES 2019, 12, 13–34. [Google Scholar] [CrossRef] [Scilit]
- Mattei, L.; Di Puccio, F. How accurate is the Archard law to predict wear of UHMWPE in hard-on-soft hip implants? A numerical and experimental investigation. Tribol. Int. 2023, 187, 108768. [Google Scholar] [CrossRef] [Scilit]
- Lyu, B.; Meng, X.; Yin, J.; Cui, Y.; Wang, C. Scuffing failure analysis based on a multiphysics coupling model and experimental verification. Friction 2023, 12, 1214–1234. [Google Scholar] [CrossRef] [Scilit]
- Marian, M.; Tremmel, S. Physics-Informed Machine Learning—An Emerging Trend in Tribology. Lubricants 2023, 11, 463. [Google Scholar] [CrossRef] [Scilit]
- Sose, A.T.; Joshi, S.Y.; Kunche, L.K.; Wang, F.; Deshmukh, S.A. A review of recent advances and applications of machine learning in tribology. Phys. Chem. Chem. Phys. 2023, 25, 4408–4443. [Google Scholar] [CrossRef] [Scilit] [PubMed]

Disclaimer/Publisher’s Note: The statements, opinions and data contained in all publications are solely those of the individual author(s) and contributor(s) and not of MDPI and/or the editor(s). MDPI and/or the editor(s) disclaim responsibility for any injury to people or property resulting from any ideas, methods, instructions or products referred to in the content. |
© 2026 by the authors. Licensee MDPI, Basel, Switzerland. This article is an open access article distributed under the terms and conditions of the Creative Commons Attribution (CC BY) license.