


Abstract
Vehicle loading alters the service load spectrum of railway axles and consequently affects fatigue damage and crack growth. This study investigates axle fatigue under the tare, fully seated, fully laden, and crush-laden conditions. Primary-suspension force histories are obtained from a rigid–flexible coupled vehicle model incorporating wheelset flexibility and are then applied to a wheelset model incorporating the wheel–axle interference fit to calculate local axle-stress histories. Rainflow counting and Miner’s rule are used to evaluate fatigue damage and identify the critical location. A semi-elliptical surface crack is introduced at this location to calculate the mixed-mode stress-intensity factor histories and crack-growth life. Increasing vehicle loading markedly intensifies the fluctuations of the primary-suspension forces. The numerical results show that the transition groove adjacent to the wheel seat remains the fatigue-critical location under all four loading conditions. Compared with the tare condition, the maximum fatigue damage increases by factors of 9.24, 19.93, and 102.07 under the fully seated, fully laden, and crush-laden conditions, respectively. For a crack introduced at this location, the maximum equivalent stress-intensity factor increases with both vehicle loading and crack depth. Meanwhile, the dominant fracture mode shifts from Mode I to Mode II, with the transition occurring at a greater crack depth under the crush-laden condition. Consistent with the higher stress-intensity factor levels under increased vehicle loading, the predicted crack-growth life decreases by 45.8–47.5%, 53.2–55.1%, and 69.7–72.2% under the fully seated, fully laden, and crush-laden conditions, respectively, relative to the tare condition. These findings show that passenger loading should be explicitly considered in axle-fatigue-life assessment and provide a basis for evaluating inspection intervals under different operating load conditions.
1. Introduction
Railway axles are safety critical load bearing components whose structural integrity directly affects wheelset reliability and operational safety [1,2]. Long-term cyclic loading can cause local fatigue damage and promote the growth of manufacturing defects, surface damage, and cracks formed during service [3,4]. Stress-based fatigue assessment identifies critical locations and evaluates fatigue damage in an initially uncracked axle, whereas damage-tolerance assessment considers the propagation of an existing crack and predicts its crack-growth life [5,6]. These two approaches address different structural states and provide complementary information for axle integrity assessment.
Vehicle-loading condition is an important operational factor affecting the service loads of a wheelset. Changes in passenger occupancy alter the car body mass and mass moments of inertia, and consequently modify the dynamic response of the vehicle-track system [7,8]. The resulting changes in suspension forces and wheel–rail interactions affect the loads acting on the wheelset. Vehicle loading may therefore influence not only vehicle-level dynamic performance, but also the local stress cycles and fatigue response of the axle.
Measured service loads, prescribed load spectra, and loads obtained from vehicle dynamic simulations have been used in railway axle-fatigue assessment [9,10]. Previous studies have mainly examined stress concentration and fatigue damage at wheel seats and axle diameter transitions [11,12], together with the effects of contact pressure and assembly-induced stresses arising from the wheel–axle interference fit [13,14]. In these studies, service loads are generally introduced into the structural model as prescribed load histories or load spectra, and the resulting axle-fatigue response is evaluated using rainflow counting and cumulative damage methods [15,16]. These methods provide an established basis for fatigue assessment under variable amplitude loading, but the service load spectrum is normally treated as a given input.
Damage-tolerance assessment considers the presence of an initial crack and evaluates its propagation using fracture mechanics methods [17,18]. Fatigue crack growth in railway axles has been investigated under measured service loads, prescribed load spectra, and variable-amplitude loading conditions [19,20,21]. Previous studies have also examined the effects of the wheel–axle interference fit, local stress state, and load sequence on crack propagation and crack-growth life [22,23]. Under combined bending, torsion, and contact loading, the crack front may experience mixed-mode stress-intensity factors, and their relative contributions may vary with crack geometry and loading condition [24,25]. These studies provide methods for predicting axle crack growth, but the applied load history or load spectrum is generally specified independently of the vehicle-loading condition.
The effects of different vehicle-loading conditions across both axle fatigue and crack propagation have not yet been investigated. Existing vehicle dynamic studies mainly examine system level responses under different loading conditions, whereas axle fatigue and damage-tolerance studies generally begin with a specified load history or load spectrum. Consequently, it remains unclear how changes in vehicle loading affect the primary-suspension forces, local axle-stress cycles, fatigue damage, equivalent stress-intensity factor cycles, and crack-growth life under otherwise identical operating conditions. It is also necessary to determine whether the effect of vehicle loading on crack growth depends on the prescribed crack aspect ratio.
To address these issues, this study investigates a high-speed railway axle under tare, fully seated, fully laden, and crush-laden conditions. A rigid–flexible coupled vehicle model incorporating wheelset flexibility is used to calculate the primary-suspension force histories under identical track and operating conditions. These force histories are applied to a wheelset structural model incorporating the wheel–axle interference fit to calculate the local axle-stress histories, evaluate fatigue damage, and identify the fatigue-critical location. Semi-elliptical surface cracks with different prescribed aspect ratios are then introduced at this location. The corresponding mixed-mode stress-intensity factor histories are reconstructed using the unit load method, and employed to predict the crack-growth life. Comparisons among the four vehicle-loading conditions quantify the resulting changes in dynamic force histories, local stress-cycle distributions, fatigue damage, and mixed-mode crack-growth response, including the sensitivity of crack-growth life to the prescribed crack aspect ratio.
2. Theoretical Models and Assessment Methods
2.1. Rigid–Flexible Coupled Vehicle Dynamic Model
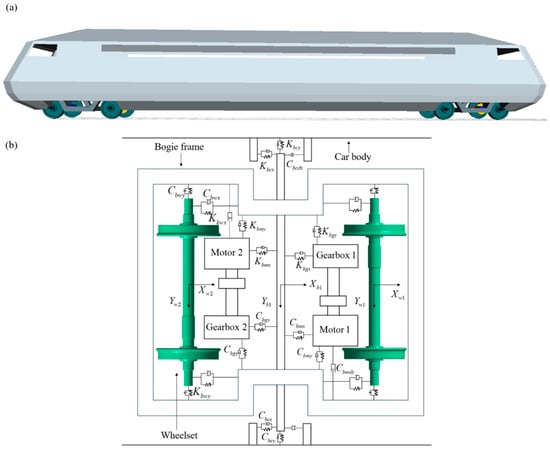
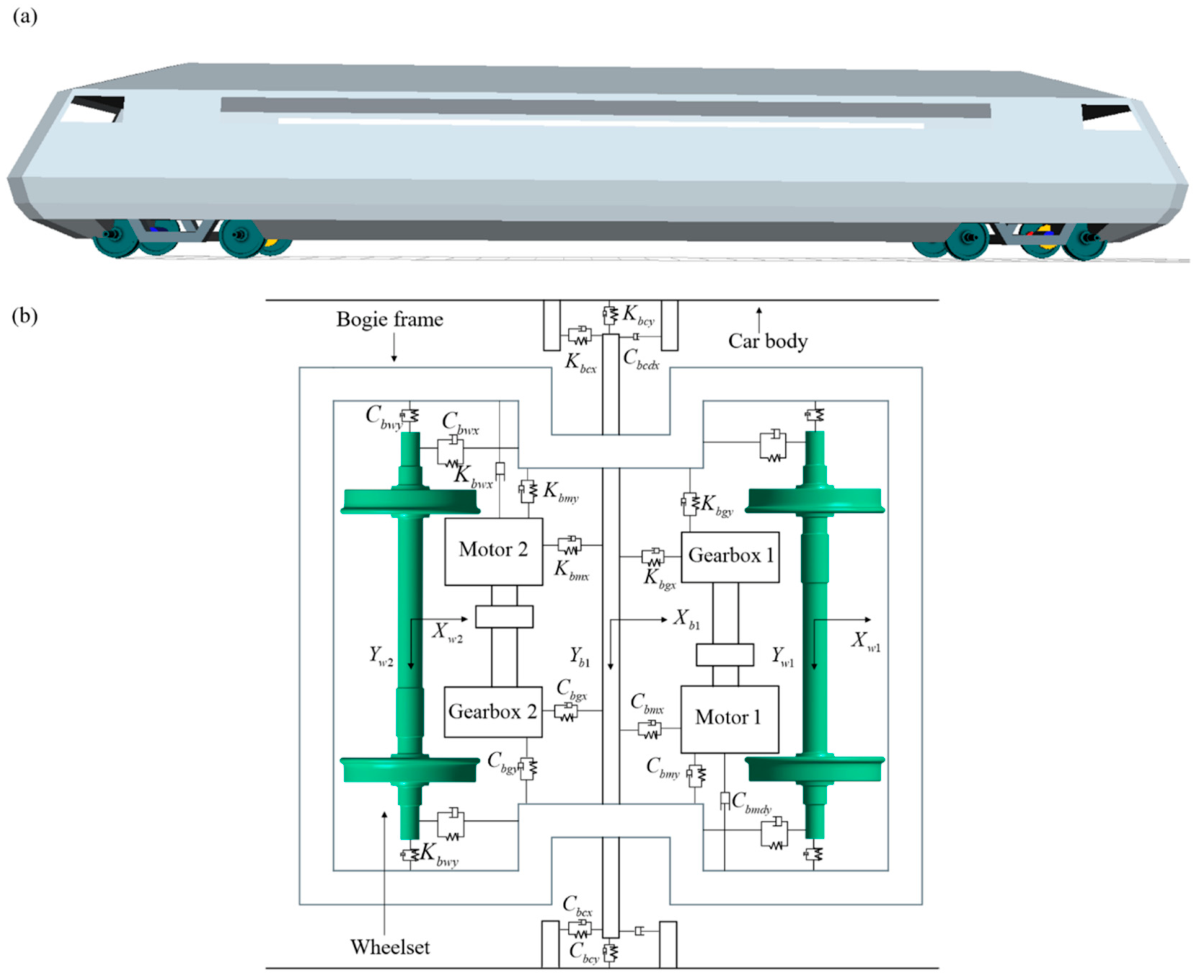
A rigid–flexible vehicle dynamic model is established, as shown in Figure 1. The car body is supported on the bogie frames through the secondary suspension, while the primary suspension connects the bogie frames to wheelsets. The motors and gearboxes are connected to the bogie frame through force elements. Here, K and C denote stiffness and damping, respectively. The subscripts bc, bw, bm, and bg refer to the connections of the bogie frame with the car body, wheelset, motor, and gearbox, while x, y, and z denote the longitudinal, lateral, and vertical directions. The wheelset is modeled as a flexible body; the remaining components are treated as rigid bodies [26,27,28]. Wheel–rail contact couples the vehicle response to the prescribed track geometry. Normal contact forces are determined from the local elastic approach using Hertzian contact, while tangential creep forces are calculated with FASTSIM [29,30,31].
Figure 1.
Rigid–flexible coupled vehicle dynamic model of the investigated high-speed train: (a) three-dimensional vehicle model; (b) plan view topology of the vehicle system.
The elastic deformation of the investigated wheelset is represented using modal superposition. The nodal elastic displacement vector is expressed as
where ϕk is the kth retained mode shape obtained from the eigenvalue analysis of the wheelset finite-element model, ηk is the corresponding modal coordinate, and nm is the number of retained modes. And Φ is the modal matrix. The modal matrix is defined as
The modal coordinates of the flexible wheelset are incorporated into the generalized coordinate vector of the vehicle system:
where qr contains the rigid-body generalized coordinates.
Using independent rigid-body and elastic coordinates, the assembled equations of motion are written in the general form [32]
where q is the generalised coordinate vector, and M, C and K are the generalised mass, damping and stiffness matrices, respectively. The vector Q contains the applied generalised forces, velocity-dependent inertial terms and the remaining nonlinear force contributions.
2.2. Wheel–Axle Interference-Fit Model
The radial interference between the axle wheel seat and the wheel hub bore is defined as
where Da and Dh are the diameters of the axle wheel seat and the wheel hub bore, respectively. The prescribed interference is introduced as an initial normal penetration at the contact interface [33]. For the adopted augmented Lagrangian formulation, the normal contact pressure at the ith iteration is expressed as [34]
where is the current normal penetration, kn is the normal contact stiffness, is the Lagrange multiplier, and ⟨x⟩ = max(0, x). The multiplier is updated during the equilibrium iterations, according to
The contact pressure is iteratively corrected until both the structural equilibrium and penetration-tolerance criteria are satisfied. Coulomb friction is considered for the tangential interaction at the wheel–axle interface [35]. The converged contact pressure and assembly-induced stress field are subsequently retained in the fatigue-damage and fatigue crack-growth analyses.
2.3. Fatigue-Damage Assessment
The local stress history σ(t) could be obtained by the constitutive equations, and is decomposed into cycles by rainflow counting [36]. The amplitude and mean stress of cycle group i are defined as
The corresponding fully reversed stress amplitude is obtained using the Goodman correction [37]:
where σu is the ultimate tensile strength. For elastic high-cycle loading with σm,i < σu, the fatigue life associated with each corrected amplitude is determined from the bilinear S − N relation:
where (σk,Nk) is the knee point and m1 and m2 are the slope magnitudes of the upper and lower branches. The parameters describe the adopted full-scale design curve; the lower branch accounts for low-amplitude cycles under variable-amplitude loading [38,39].
According to Miner’s rule [40], the fatigue damage at position x under loading condition j and its value per unit running distance are
where nij and Nij are the number of applied cycles and the fatigue life of group i, respectively, ns is the number of cycle groups, and is the running distance corresponding to one load block. The damage distribution identifies the critical region for the subsequent crack-growth analysis.
After obtaining the accumulated fatigue damage over a single load block, the allowable fatigue life in terms of running distance can be calculated according to Miner’s linear cumulative damage rule, assuming repeated application of the same load block:
where Da is the allowable cumulative fatigue damage.
2.4. Fatigue Crack-Growth Life Prediction Using the Unit Load Method
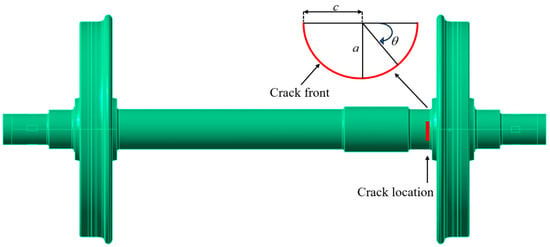
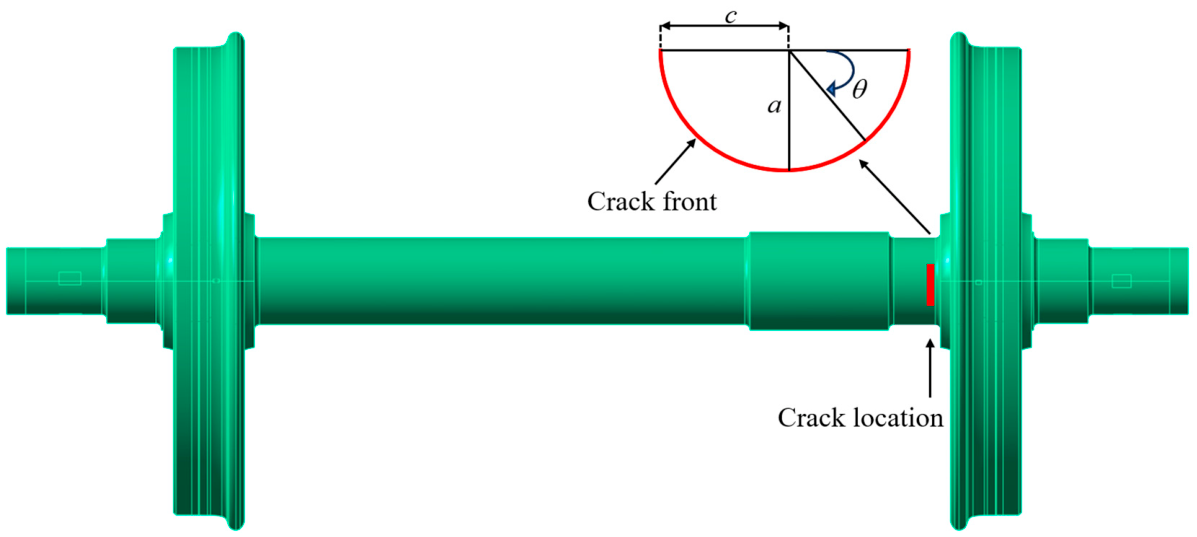
As shown in Figure 2, a semi-elliptical surface crack is defined by its depth a and surface half-length c. The front coordinate θ varies from 0 to π, with θ = π/2 at the deepest point. Mode I, II and III stress-intensity factors (SIFs) are extracted using the interaction integral for a sequence of crack geometries [41]. Railway-axle SIF solutions provide the relevant fracture-mechanics basis [42].
Figure 2.
Crack location in the wheelset and geometric definition of the semi-elliptical surface crack.
The SIF histories are reconstructed by the unit load method. For each crack geometry, the incremental response to each independent force or moment is calculated separately and superposed with the press-fit contribution [43,44]. This permits the vehicle-load histories to be introduced directly into the fracture analysis [5,10]:
where α = I, II, III, g = (a,c), and Qr,j is the r th load component. The coefficient Hαr is the incremental SIF per unit force or moment about the press-fit state, and is the associated initial SIF. Dependence on the wheelset angle φ(t) accounts for rotation of the loads and supports, relative to the crack. Superposition assumes a quasi-static, linear-elastic response with a fixed or consistently linearised contact state. The coefficients are updated with crack geometry and angular position.
The Tanaka-based equivalent stress-intensity factor formulation combines the mixed-mode stress-intensity factors through a fourth-power relation [45,46]. The equivalent stress-intensity factor is expressed as
where v is Poisson’s ratio. The Tanaka-based equivalent stress-intensity factor formulation is applicable to crack growth along a prescribed path, consistent with the self-similar crack-growth assumption adopted in this study.
Rainflow counting of the equivalent SIF history yields
where Keq,max,i > 0. The scalar ratio Req,i characterises the equivalent history, and is distinct from the opening-mode stress ratio. Crack advance per cycle is described by a NASGRO-type relation [22]:
where , m, p and q are material parameters, fi is the opening-function term [47], ΔKth,i is the growth threshold and Kc is the critical SIF parameter. The relation applies for ΔKeq,i > ΔKth,i and Keq,max,i < Kc; subthreshold cycles produce no growth. Its mixed-mode use requires parameters calibrated to the adopted equivalent driving force and cycle ratio.
The local crack advance over one load block is
With the aspect ratio held at ρ = a/c, self-similar crack growth is assumed. The equivalent crack-depth increment Δab,j(a) = Δsb,j(θ*;a,a/ρ) with θ* being the critical crack-front position for the current crack geometry. SIF-influence coefficients are interpolated between adjacent crack geometries [25]. The running distance required for growth from a0 to af follows, as
where is the representative crack depth in interval k. This block-accumulation model neglects load-sequence retardation [23]. The resulting crack propagation life and the stress-based damage measure characterise different initial axle states, and are evaluated separately.
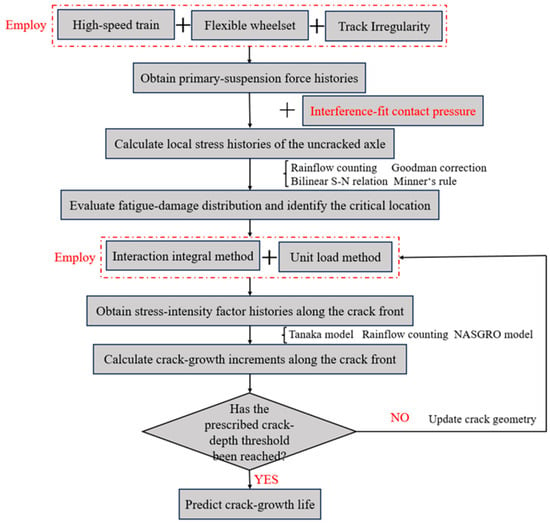
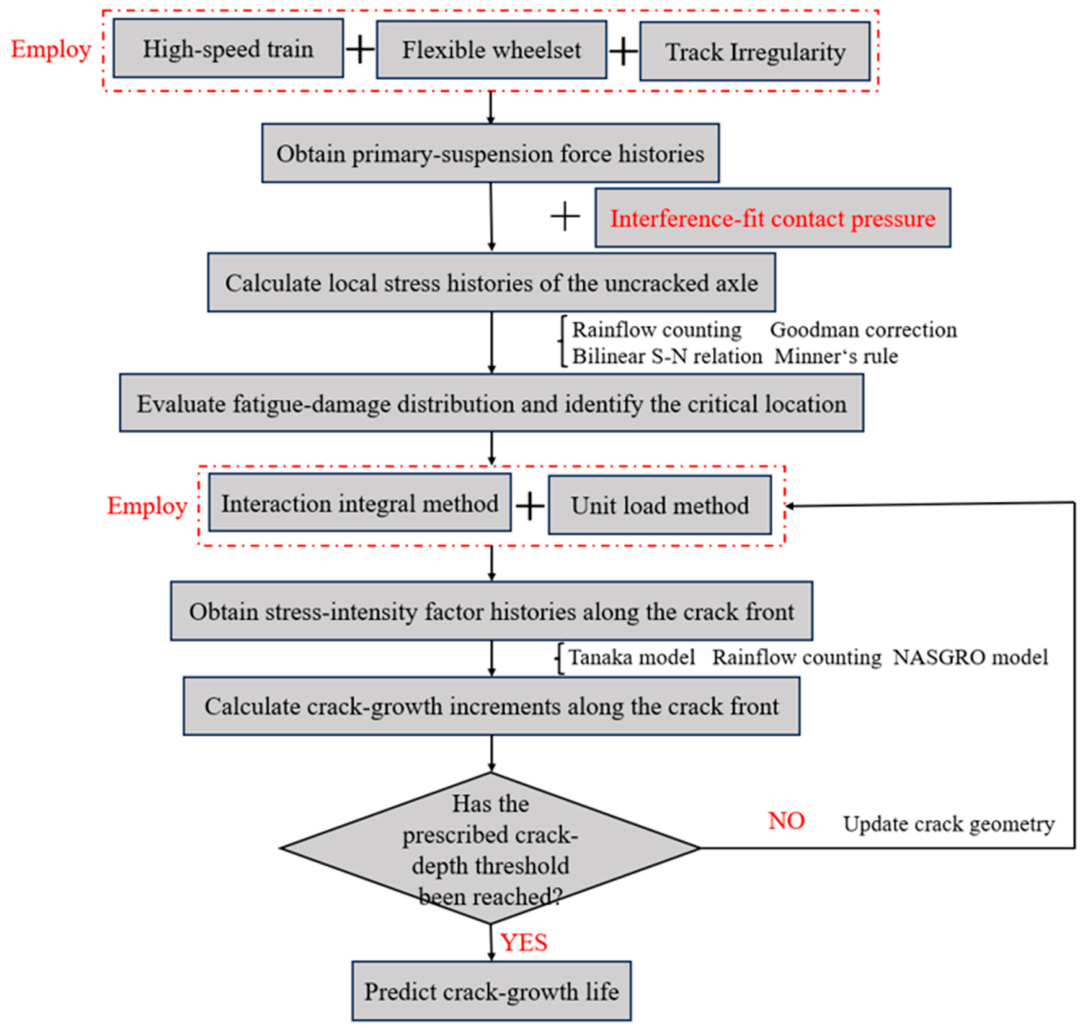
Based on the theoretical models described above, an integrated framework for assessing axle-fatigue damage and crack-growth life under different vehicle-loading conditions was established, as shown in Figure 3.
Figure 3.
Flowchart of fatigue-damage assessment and crack-growth life prediction for the high-speed railway wheelset.
3. Numerical Results and Discussion
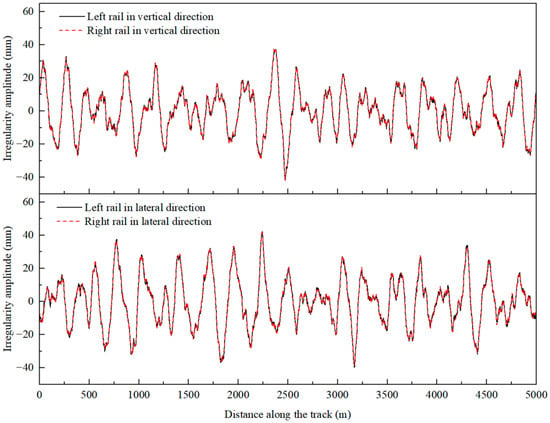
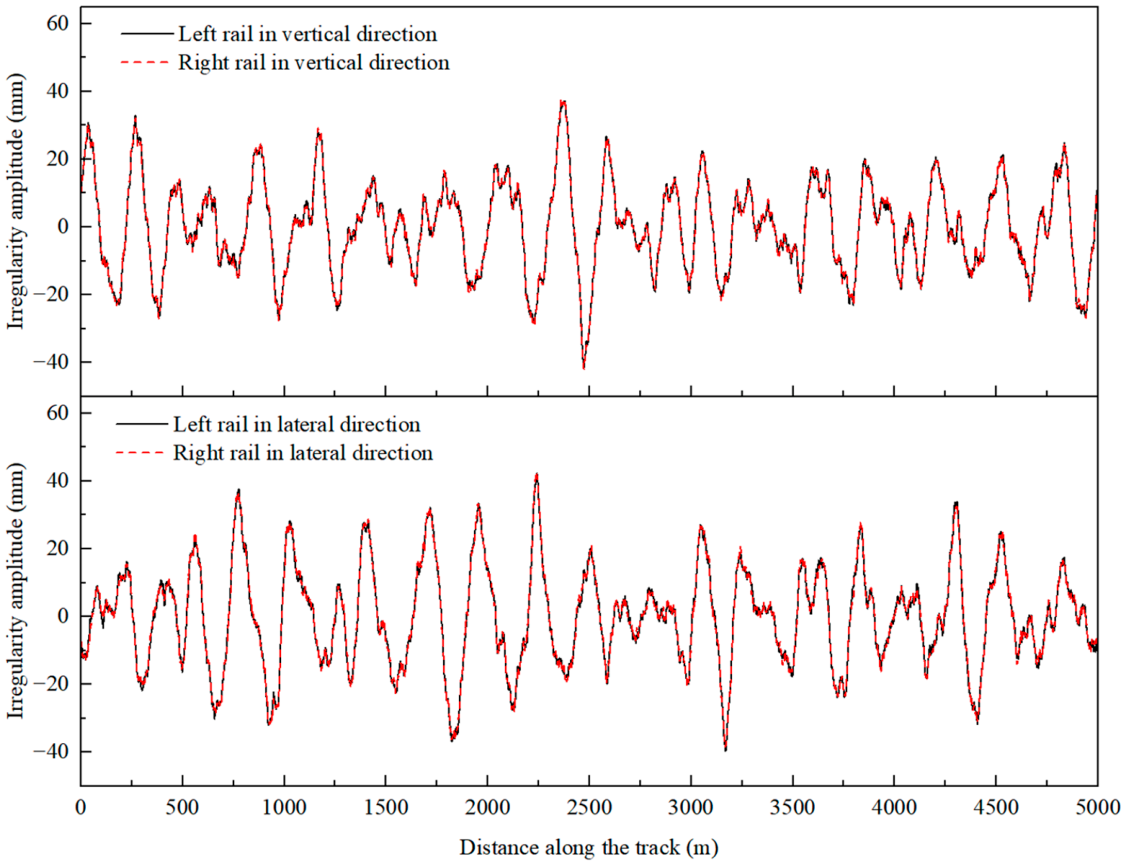
The rigid–flexible coupled vehicle dynamic simulations are performed using SIMPACK. Four vehicle-loading conditions are considered: tare, fully seated, fully laden and crush-laden, with car body masses of 33.786, 39.626, 41.226 and 44.994 t, respectively [48]. The corresponding mass moments of inertia are assigned to each loading condition, while the suspension parameters and component geometries remain unchanged. The track irregularity (Figure 4) is used for all loading conditions. The vehicle operates at 350 km/h over a 5000 m track section comprising a curve radius of 7000 m and a transition-curve length of 600 m. The main vehicle parameters are listed in Table 1.
Figure 4.
Vertical- and lateral-track irregularities of the left and right rails along the track.
Table 1.
The basic dynamic and suspension parameters of the considered vehicle model.
The simulated vehicle responses are assessed in terms of running safety using the derailment coefficient, wheel-unloading ratio, wheelset lateral force, and bogie lateral accelerations, according to GB/T 5599–2019 [49]. The results are presented in Table 2. For the present operating conditions, the limits of the derailment coefficient and wheel-unloading ratio are both 0.8, while the wheelset lateral force is required to satisfy H ≤ 15 + P0/3 kN, where P0 is the static axle load. For bogie lateral accelerations, six consecutive peaks must not reach or exceed 8 m/s2. All indices satisfy the specified safety limits.
Table 2.
Running safety indices under different vehicle-loading conditions.
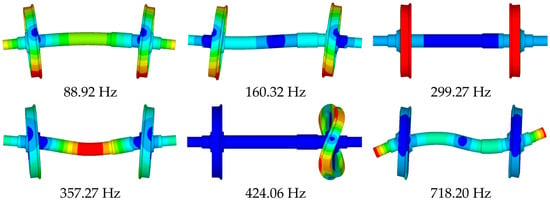
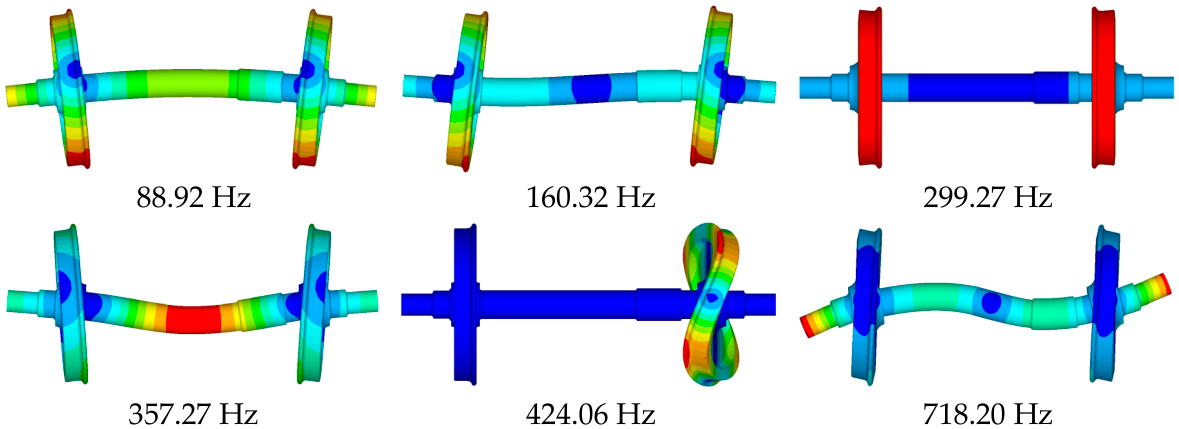
The wheelset finite-element model is incorporated into the vehicle dynamic model, with 25 elastic modes below 1500 Hz retained. Six representative mode shapes and their corresponding natural frequencies are shown in Figure 5. The interference fit of wheel–axle is defined using a radial interference of 0.3 mm and a coefficient of friction of 0.6 [50]. The material properties and parameters are summarized in Table 3 [5].
Figure 5.
Representative elastic-mode shapes and natural frequencies of the flexible wheelset.
Table 3.
Tensile-property parameters of the railway EA4T steel.
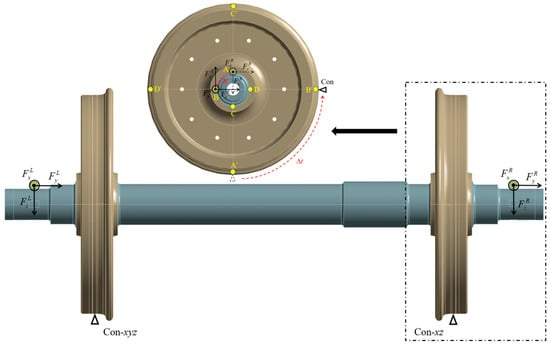
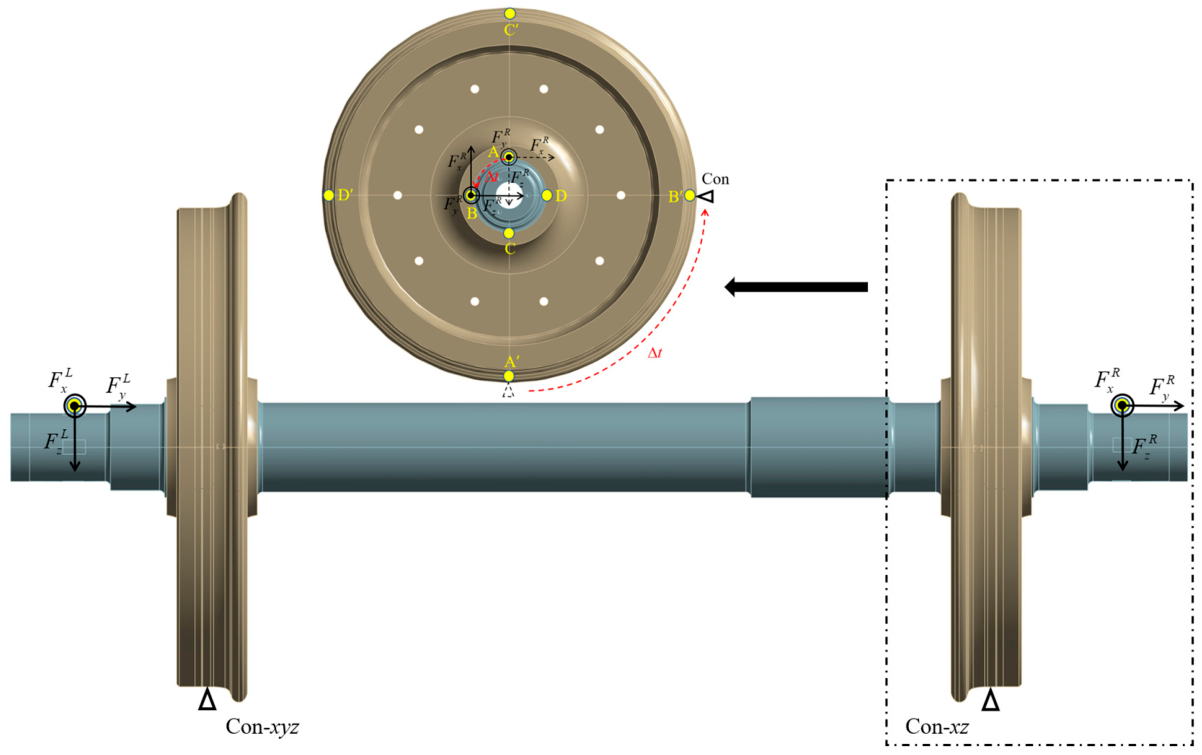
The longitudinal, lateral and vertical primary-suspension forces on the left and right of the wheelset, denoted by (, , ) and (, , ), respectively, are extracted from the vehicle dynamic simulation. These forces are transformed into the rotating axle-fixed coordinate system and applied at the wheelset (Figure 6). At the wheel–rail contact, translations in x, y, and z are constrained (Con-xyz); at the right contact, only x and z are constrained (Con-xz). The constrained nodes are updated as the wheelset rotates, and the same boundary conditions are used in the unit load analyses.
Figure 6.
Loading and time-dependent boundary conditions of the rotating-wheelset model.
3.1. Dynamic Load Responses Under Different Vehicle-Loading Conditions
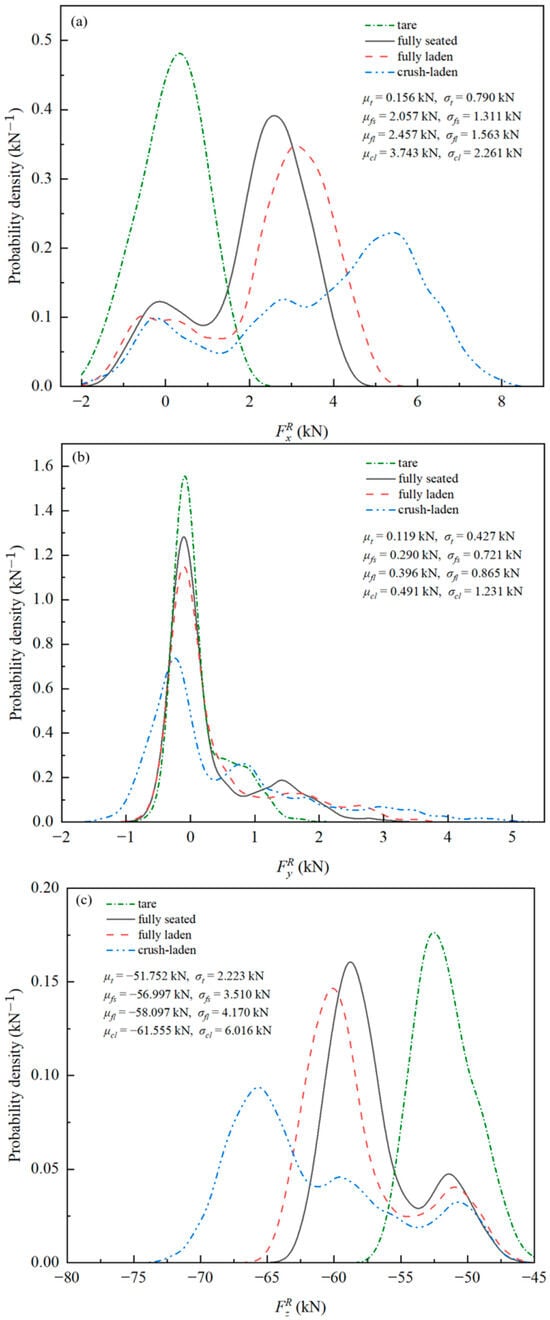
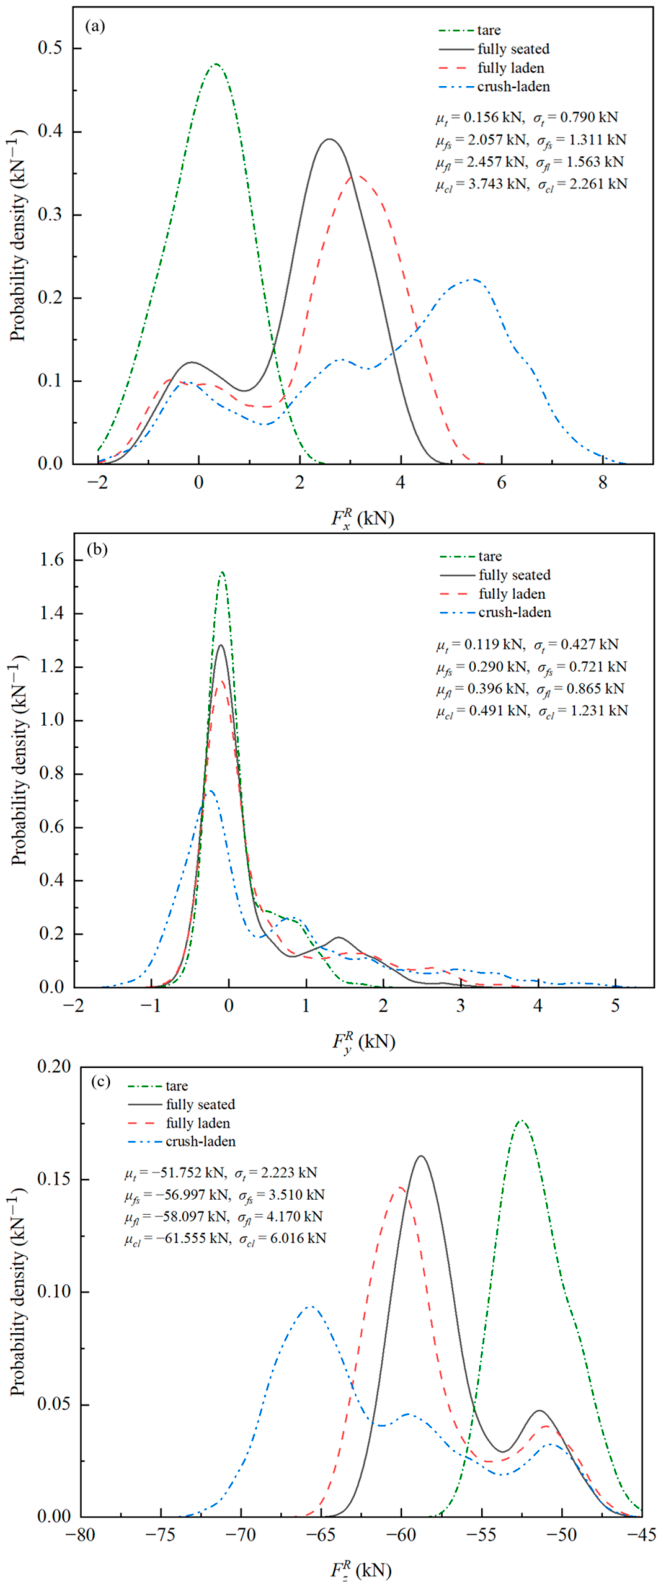
Under identical track irregularity, vehicle speed, and running distance, the histories of the right-side primary-suspension forces are extracted under the tare, fully seated, fully laden and crush-laden conditions. The predicted primary-suspension-force magnitudes are of the same order of magnitude as those reported in previous research [51]. Figure 7 presents the probability density distributions of the longitudinal, lateral and vertical primary-suspension forces, together with their mean values μ and standard deviations σ. As vehicle loading increases, all three force components change, but their distribution characteristics exhibit clear directional differences.
Figure 7.
Probability density distributions and statistical characteristics of the right-side primary-suspension forces under different vehicle-loading conditions: (a) longitudinal; (b) lateral; and (c) vertical.
Figure 7a shows a redistribution of longitudinal-force probability density towards higher positive forces as vehicle loading increases. Under the tare condition, the probability density is mainly concentrated around 0 kN, with its main peak at approximately 0.3 kN. Under the fully seated condition, most of the probability density is concentrated around 2–3 kN, with a smaller peak near zero. The main peak moves to approximately 3 kN under fully laden loading; under crush-laden loading, the density spreads across a much wider positive-force range, with its highest peak near 5–6 kN. Consistent with this shift and broadening, the mean rises from 0.156 to 3.743 kN and its standard deviation from 0.790 to 2.261 kN, between the tare and crush-laden conditions.
For the lateral force, the highest probability density remains close to zero in all four conditions (Figure 7b). Increasing loading lowers this narrow central peak and spreads the density over a wider force range, particularly on the positive side. The change in mean , from 0.119 to 0.491 kN, is small in absolute terms, whereas its standard deviation rises from 0.427 to 1.231 kN. The principal change is therefore in how widely the lateral forces are distributed, rather than where the distribution is centred.
The vertical-force density is redistributed differently (Figure 7c). Its main concentration moves from around −53 kN under tare loading to around −66 kN under crush-laden loading, while a smaller concentration near −51 kN remains visible under the three loaded conditions. Under crush-laden loading, the principal peak is also lower, and the density occupies a wider range of negative forces. Accordingly, although the magnitude of the mean increases by only 18.9% from tare to crush-laden, its standard deviation increases by 170.6%.
3.2. Fatigue Damage and Determination of the Critical Location
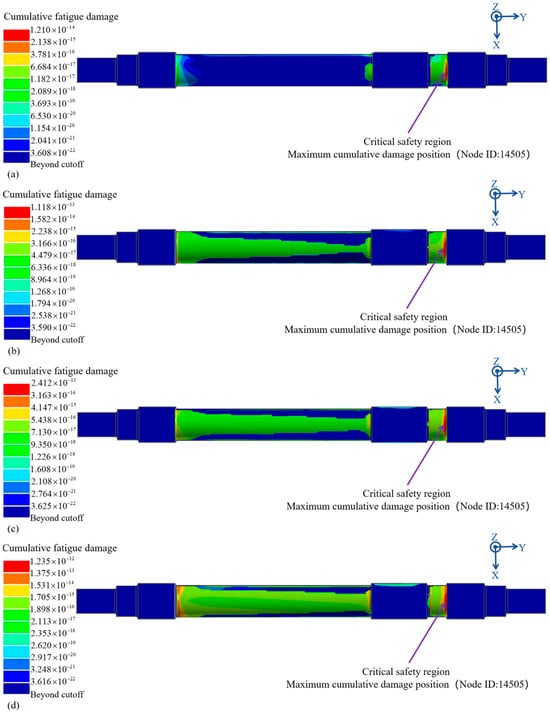
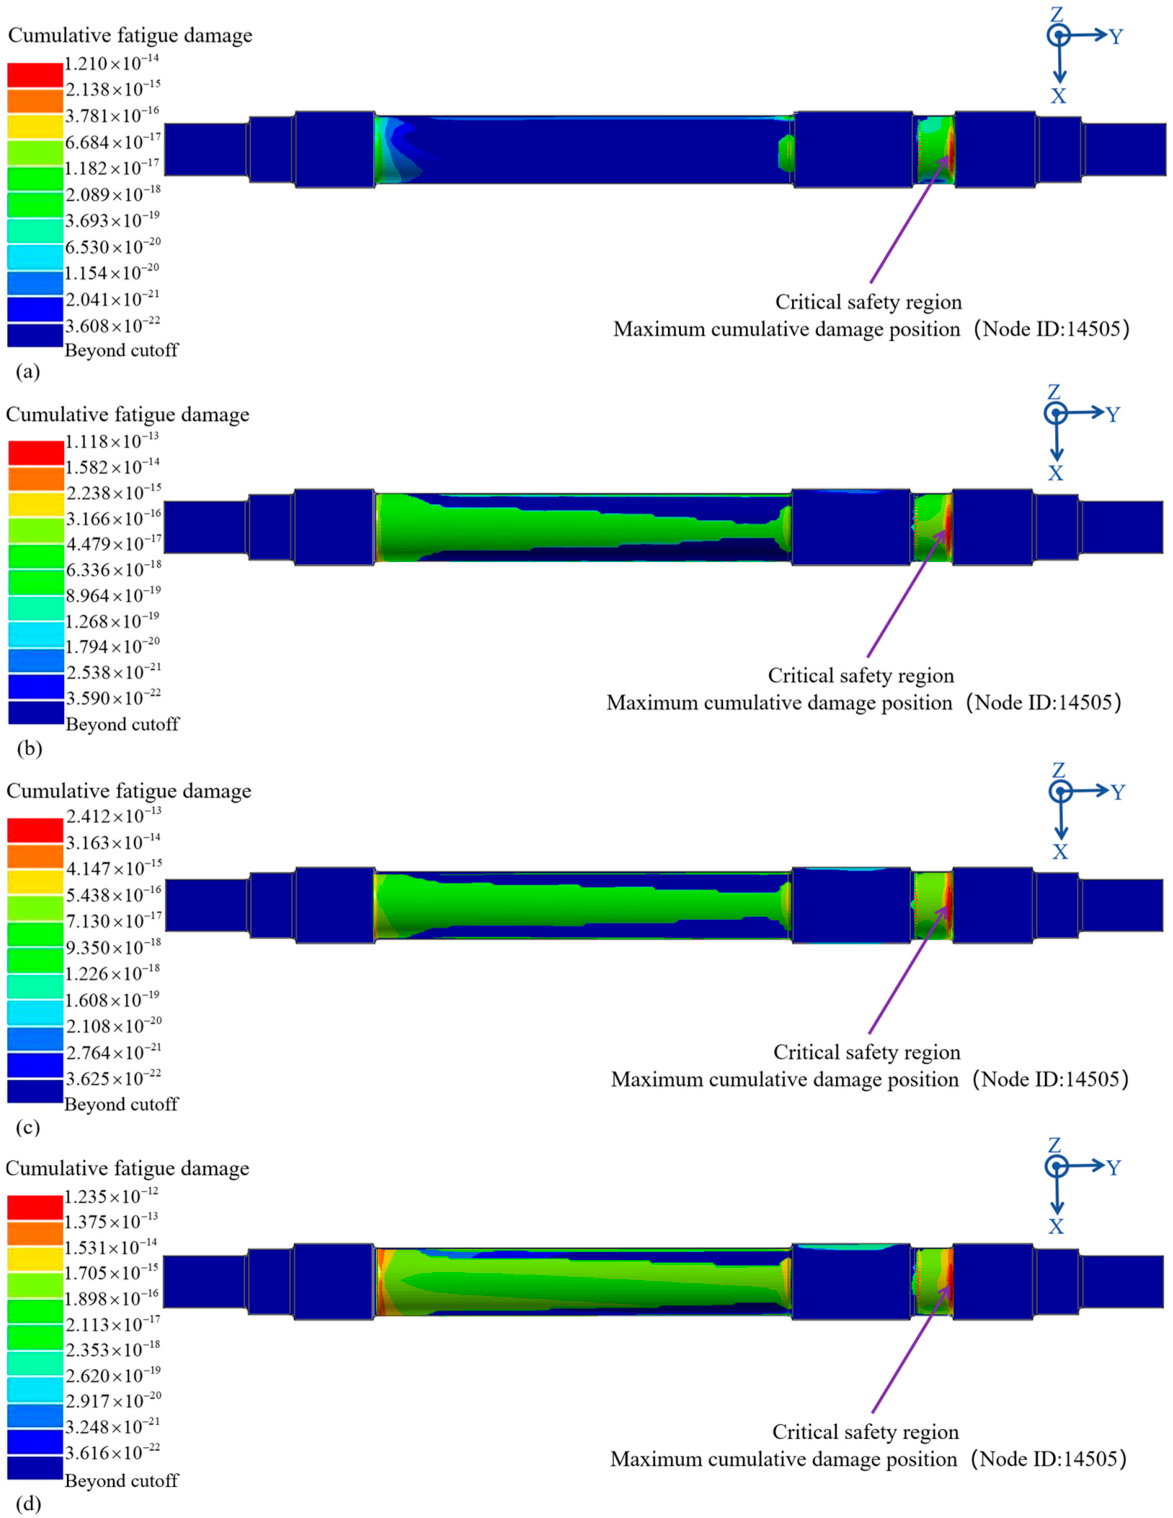
The axle experiences non-proportional multiaxial loading, as the stress components vary without maintaining fixed ratios over time. In addition, under rotating bending loads, the axial normal-stress component is an important factor governing fatigue-crack initiation and growth [52], and the fatigue-crack-growth direction is perpendicular to the maximum principal-stress direction [5]. Therefore, the absolute maximum principal-stress (Abs Max Principal) method is employed in nCode DesignLife, with the sign of the selected principal stress retained. The axle-stress histories reconstructed using the unit load method are processed by rainflow counting, and the fatigue damage accumulated over the same 5000 m load block is calculated for each vehicle-loading condition. The resulting fatigue-damage distributions are presented in Figure 8.
Figure 8.
Fatigue-damage distributions of the axle under different vehicle-loading conditions: (a) tare; (b) fully seated; (c) fully laden; and (d) crush-laden.
For all four conditions, the damage is concentrated at the root of the transition groove adjacent to the wheel seat, and the maximum value occurs at Node 14505. The concentration of fatigue damage at this location may be associated with the transition groove geometry, the local stiffness effect of the press-fitted wheel, and the wheel–axle interference fit. This interpretation is consistent with the stress concentration at the root of the stress relief groove reported by Zou et al. [53]. The corresponding maximum accumulated fatigue-damage values are 1.210 × 10⁻¹⁴, 1.118 × 10⁻¹³, 2.412 × 10⁻¹³, and 1.235 × 10⁻¹² for the tare, fully seated, fully laden, and crush-laden conditions, respectively. According to Equation (12), the allowable fatigue life is calculated by repeatedly applying the 5000 m load block using Miner’s rule, with an allowable cumulative damage of Da = 0.3. The predicted life mileages are 1.240 × 10¹⁴, 1.342 × 10¹³, 6.219 × 10¹², and 1.215 × 10¹² km under the tare, fully seated, fully laden, and crush-laden conditions, respectively. Relative to the tare condition, the maximum damage increases by factors of approximately 9.24, 19.93 and 102.07 under the fully seated, fully laden and crush-laden conditions. Thus, increasing vehicle loading raises the local fatigue-damage level without changing the location of the maximum damage. These substantial differences in damage ratios highlight the significant sensitivity of axle-fatigue damage to changes in vehicle loading. Therefore, in practical engineering applications, the proportions of operation under different vehicle-loading conditions should be considered, to properly assess fatigue-damage accumulation at critical axle locations and avoid assessment bias arising from the use of a single loading condition.
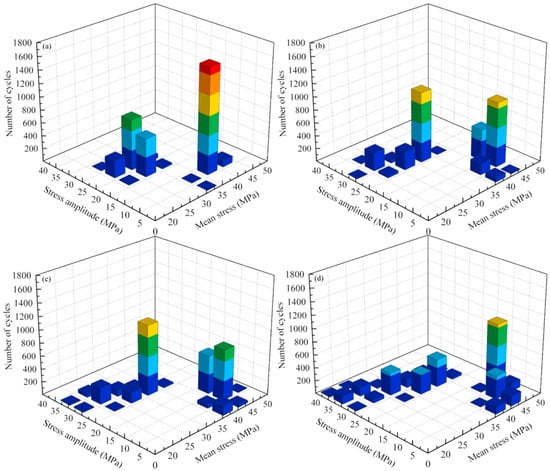
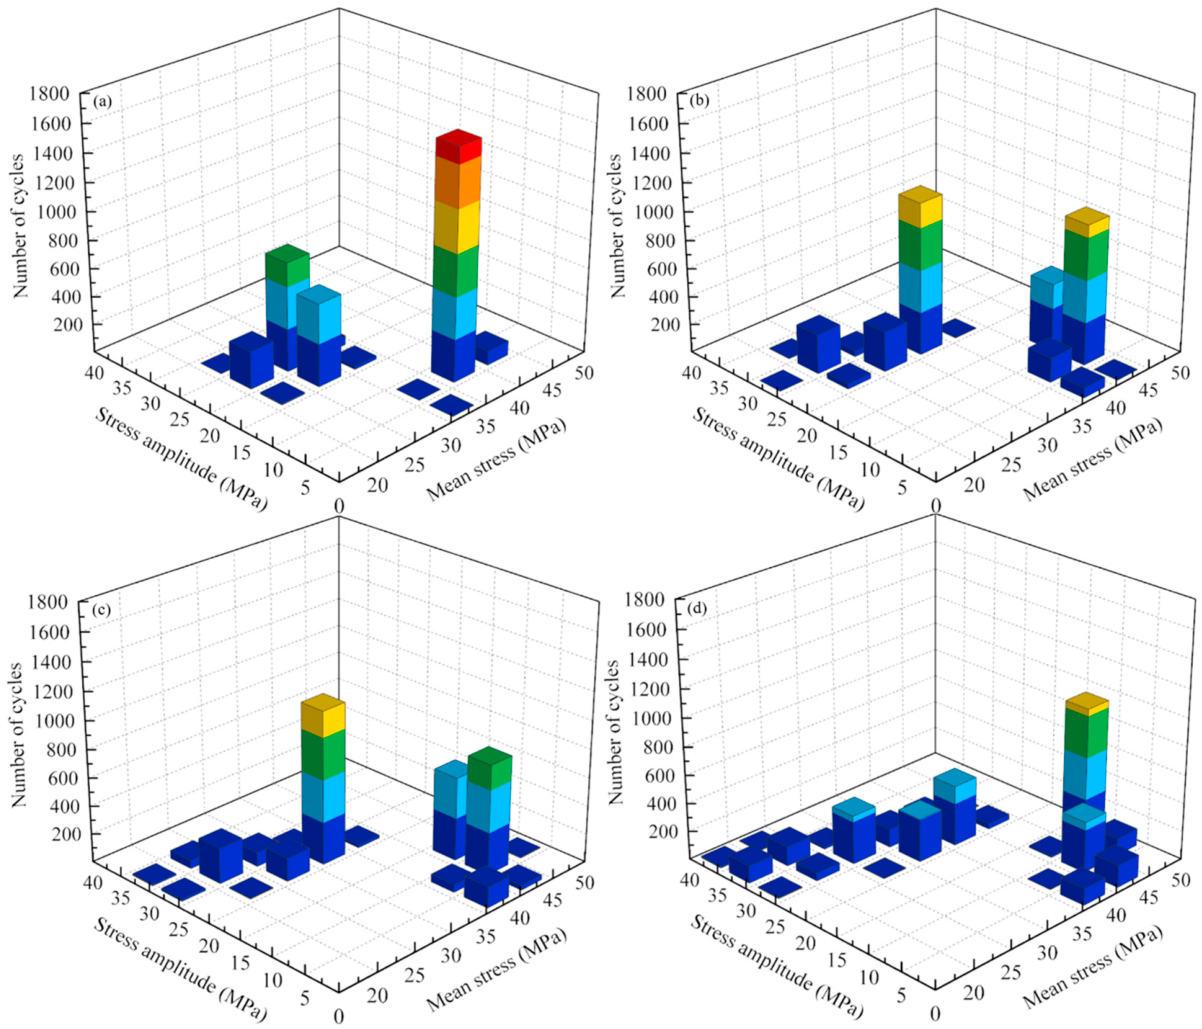
To explain the differences in fatigue damage among the four loading conditions, rainflow counting is performed on the local stress history at the identified fatigue-critical position (Node 14505), as shown in Figure 9. The total number of counted cycles remains at 3445 under all four conditions, whereas their distributions in terms of stress amplitude and mean stress vary considerably. From the tare condition to the fully seated, fully laden and crush-laden conditions, the maximum stress amplitude increases from 26.99 MPa to 30.43, 32.09 and 38.19 MPa, respectively, while the maximum mean stress increases from 41.54 MPa to 45.38, 46.53 and 49.73 MPa. The number of cycles with stress amplitudes of at least 25 MPa increases from 2 to 324, 448 and 951. Similarly, the number of cycles within the mean stress interval of 45–50 MPa increases from 0 to 4, 117 and 1072. Thus, increasing vehicle loading does not change the total number of counted cycles, but shifts the cycle distribution towards larger stress amplitudes and higher tensile mean stresses.
Figure 9.
Rainflow matrices at the selected fatigue-critical position under different vehicle-loading conditions: (a) tare; (b) fully seated; (c) fully laden; and (d) crush-laden.
3.3. Fatigue Crack Growth Under Different Vehicle-Loading Conditions
Based on the fatigue-damage distribution obtained in Section 3.2, a semi-elliptical surface crack is introduced at the position of maximum fatigue damage. The crack location, geometry and crack-front coordinate system are defined in Section 2.4. An initial crack depth of a0 = 3 mm and three prescribed aspect ratios of ρ = 0.5, 0.6 and 0.7 are considered. Each aspect ratio is maintained during crack propagation, and the surface half-length c is updated, according to the current crack depth a. For each aspect ratio, the same crack location and initial geometry are adopted under the tare, fully seated, fully laden and crush-laden conditions.
The fatigue-crack-growth parameters of EA4T steel and the prescribed crack configurations are listed in Table 4. Crack propagation is calculated from an initial depth of 3 mm to a prescribed depth of 25 mm. Accordingly, the crack-growth life reported in this section represents the running distance required for the crack depth to increase from 3 to 25 mm.
Table 4.
Fatigue crack-growth parameters of EA4T steel and prescribed crack configurations.
3.4. Effect of Vehicle Loading on the Fracture Mode
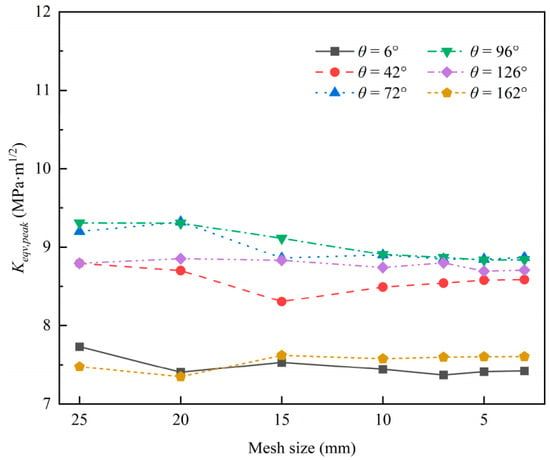
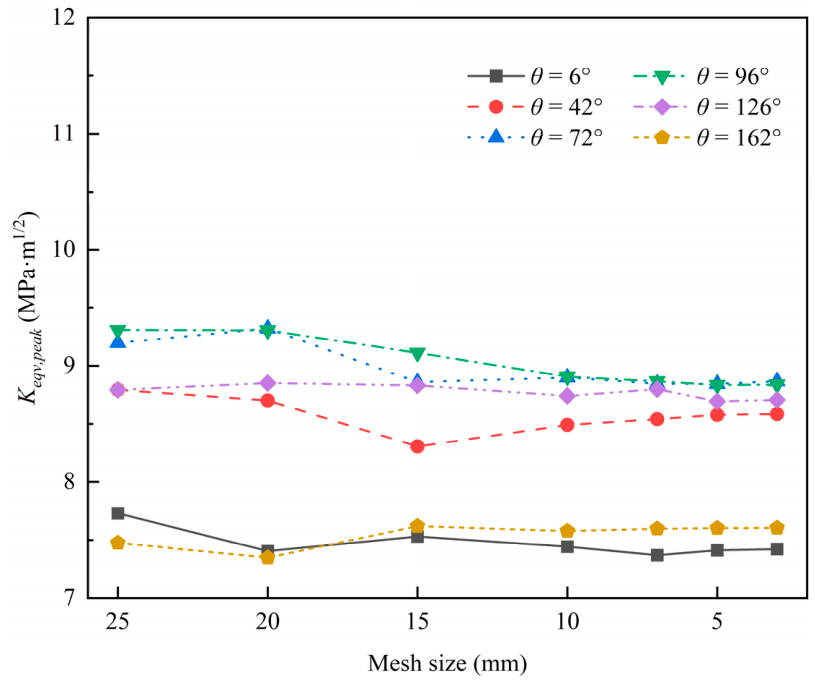
To characterise the fracture mode during crack propagation, the equivalent stress-intensity factor Keqv(θ,t,a) is evaluated along the entire crack front at each prescribed crack depth. At each crack-front position, the peak value over the load history is first determined. The maximum among these peak values is then taken as the governing equivalent SIF for the prescribed crack depth. For a given crack-front position θ, the peak value over the loading history was defined as , and the global maximum over the entire crack front is then determined as . ANSYS 2025 R2 is used for the wheelset finite-element analysis, with SOLID187 elements for the main structure and SOLID186 elements near the crack front. A mesh-sensitivity analysis is conducted for a crack depth of 12 mm and an aspect ratio of 0.5 by comparing the peak equivalent stress-intensity factors at representative crack-front positions under different mesh sizes, as shown in Figure 10. The results show that the equivalent stress-intensity factors approach stable values as the mesh is refined. When the mesh size is reduced to 7 mm or smaller, only minor variations are observed, indicating that the results are essentially converged. Considering both computational accuracy and efficiency, a mesh size of 5 mm is adopted for the main structure, with local refinement to approximately 0.1 mm near the crack front.
Figure 10.
Variation in the peak equivalent stress-intensity factor with mesh size at representative crack-front angles.
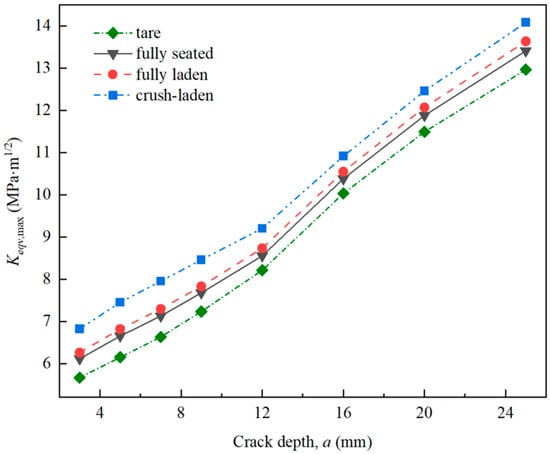
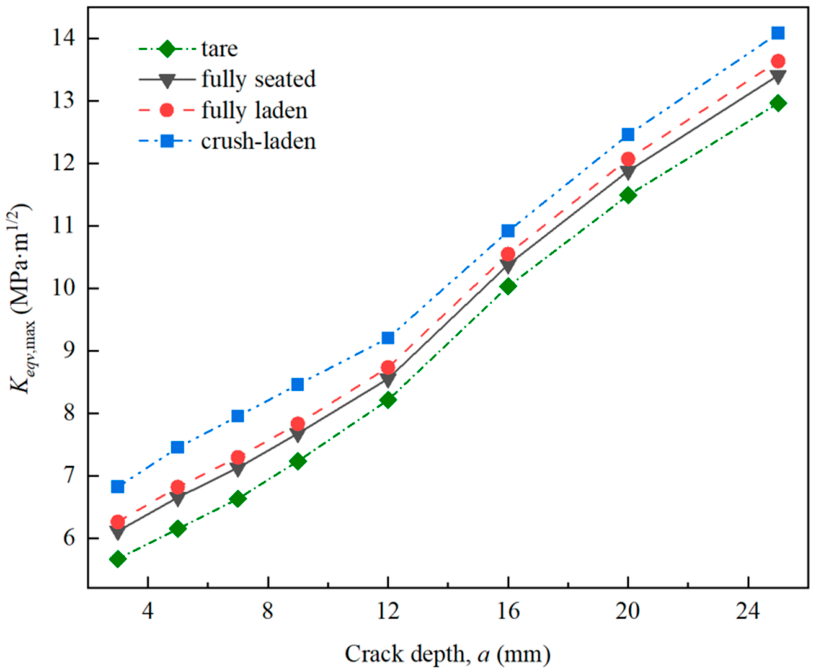
Figure 11 presents the evolution of Keqv,max with crack depth for ρ = 0.5. Under all four loading conditions, Keqv,max increases monotonically with crack depth. Zou et al. [55] report a similar trend for the mixed-mode equivalent stress-intensity factor range in full-scale railway axles. At a given crack depth, Keqv,max increases with vehicle loading from the tare condition to the fully seated, fully laden and crush-laden conditions.
Figure 11.
Variation of the maximum equivalent stress-intensity factor with crack depth under different vehicle-loading conditions.
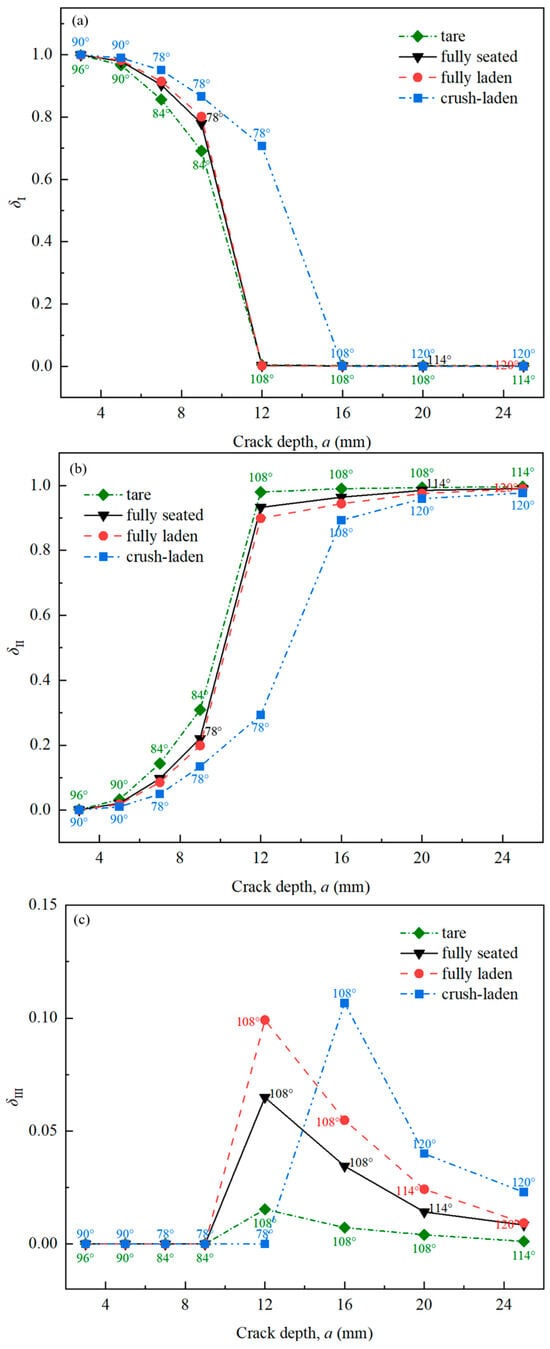
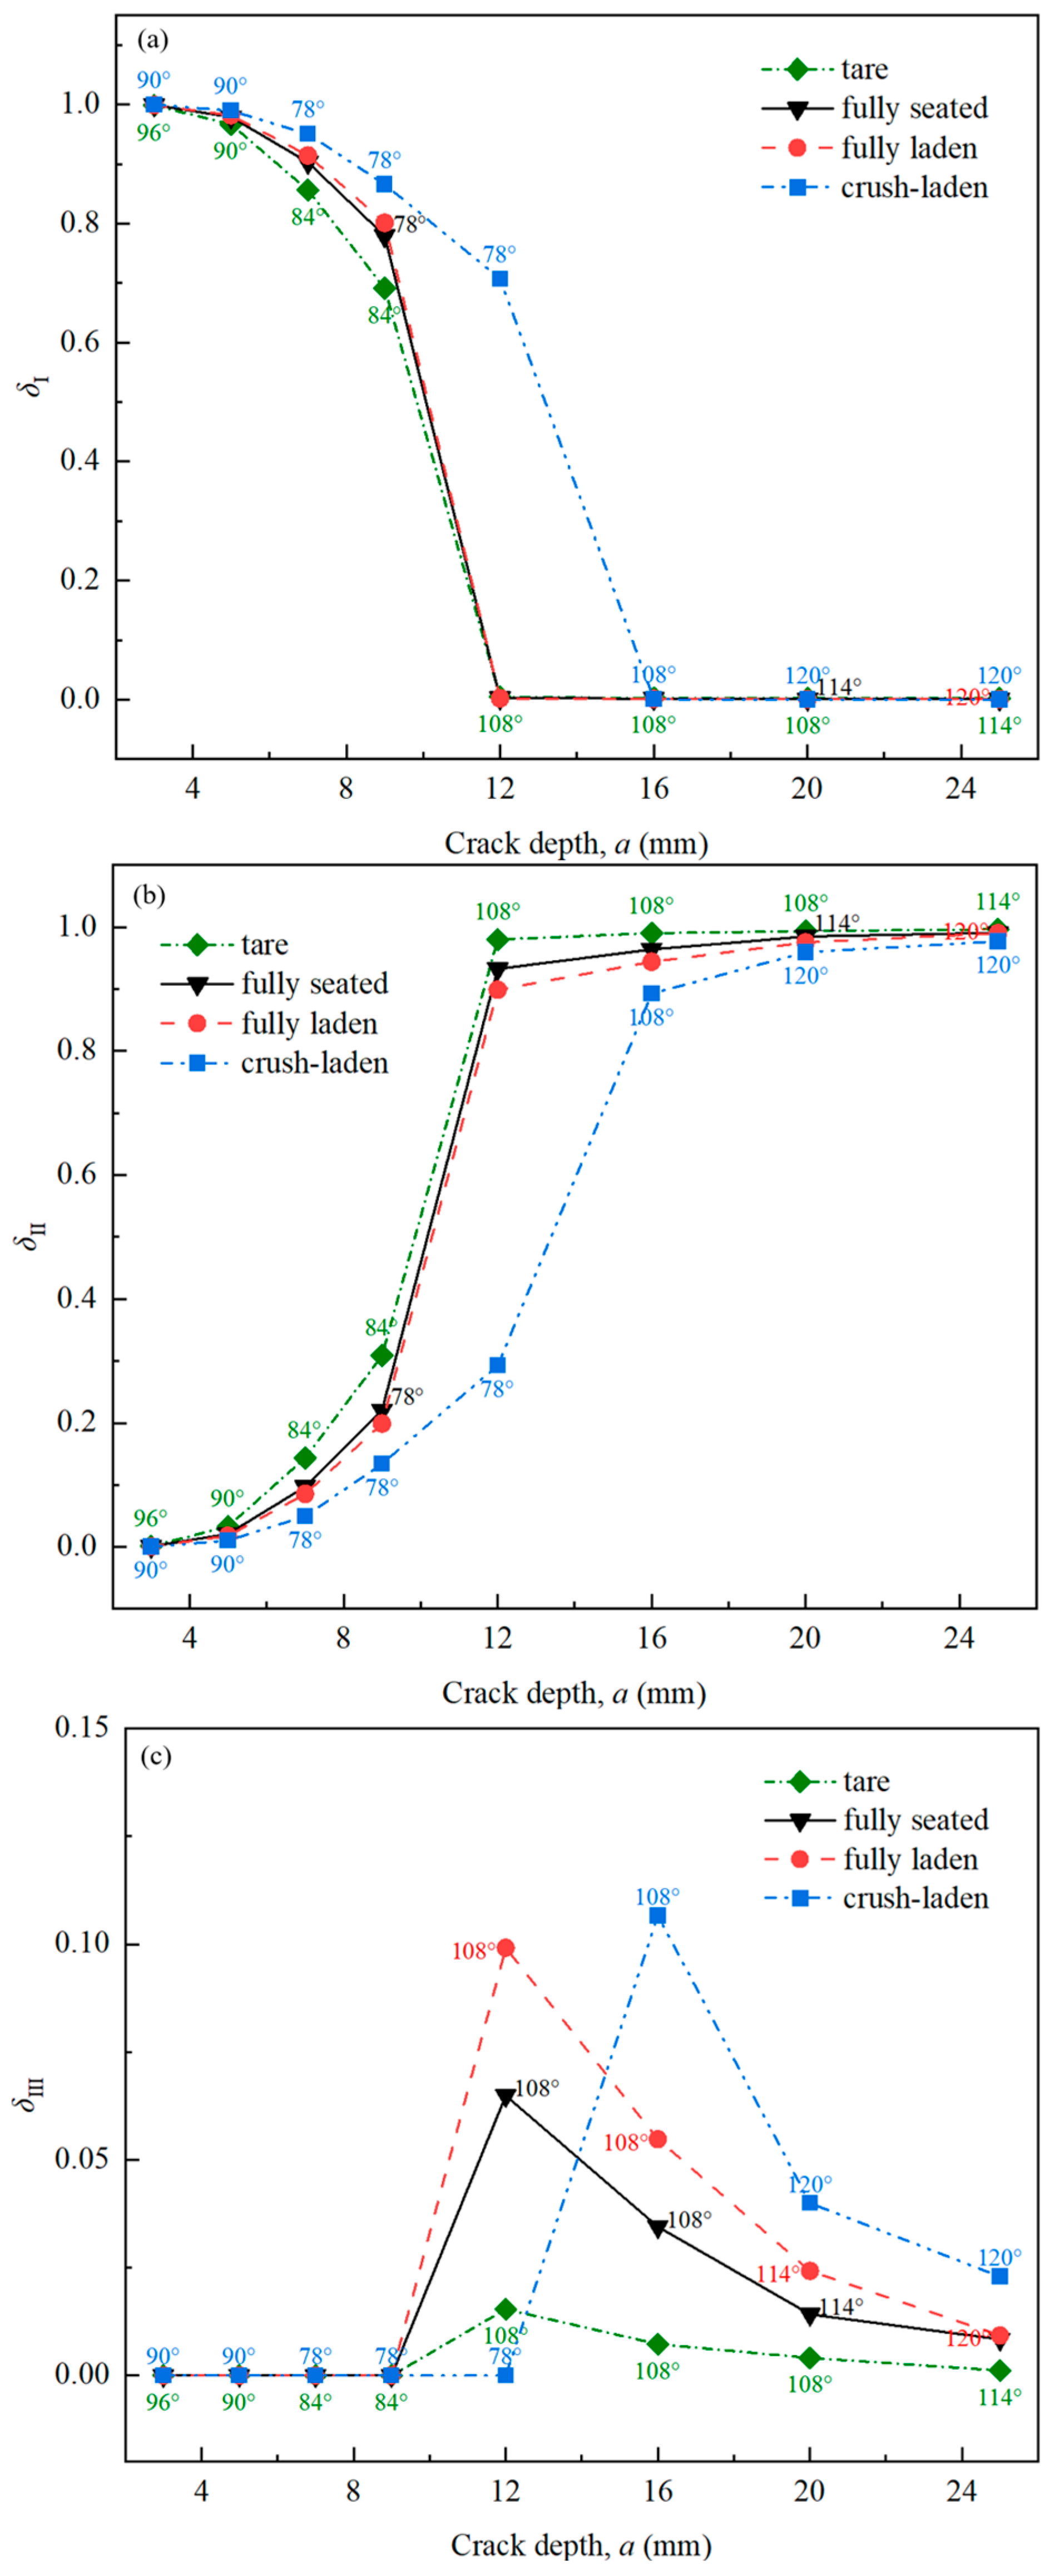
The corresponding Mode I, Mode II and Mode III stress-intensity factors are denoted by , , and , respectively. Their contribution coefficients are defined as , , and , where v is Poisson’s ratio. The coefficients satisfy δI + δII + δIII = 1. The dominant fracture mode is identified by the largest contribution coefficient at the critical crack-front position. The angles marked in Figure 12 denote the critical crack-front position θ∗.
Figure 12.
Contribution coefficients of the three fracture modes and critical crack-front positions as functions of crack depth under different vehicle-loading conditions: (a) δI; (b) δII; (c) δIII.
Figure 12 shows that Mode I is dominant during the early stage of crack propagation. At the same crack depth, the Mode I contribution generally increases with vehicle loading. As the crack deepens, the dominant fracture mode changes from Mode I to Mode II. This transition occurs earlier under the tare, fully seated and fully laden conditions, whereas Mode I remains dominant over a larger crack-depth range under the crush-laden condition. This transition is accompanied by a change in the critical crack-front angle, from approximately 84° to 108° under the tare condition and from approximately 78° to 108° under the other three loading conditions.
The Mode III contribution exhibits a local maximum near the transition between Mode I and Mode II dominance, rather than a monotonic variation with crack depth or vehicle loading. Under the tare, fully seated and fully laden conditions, the Mode III peaks occur at an earlier evaluated crack depth, with maximum contribution coefficients of approximately 0.015, 0.065 and 0.099, respectively. Under the crush-laden condition, the peak shifts to a larger crack depth, and reaches approximately 0.107. Thus, increased vehicle loading delays the transition from Mode I to Mode II dominance, and shifts the associated Mode III peak towards a larger crack depth.
Overall, Mode I dominates during the early stage of crack propagation, whereas Mode II dominates after the transition. Mode III remains secondary under all loading conditions, and becomes most pronounced near the transition between the two dominant fracture modes.
3.5. Fatigue Crack-Growth Life
The rainflow-counted equivalent-SIF cycles are introduced into the crack-growth model described in Section 2.4. The number of load-block repetitions required for the crack to reach the next prescribed depth is then determined. After each propagation stage, the crack depth and surface half-length are updated, while maintaining the prescribed aspect ratio. This procedure is continued until the crack depth reaches 25 mm.
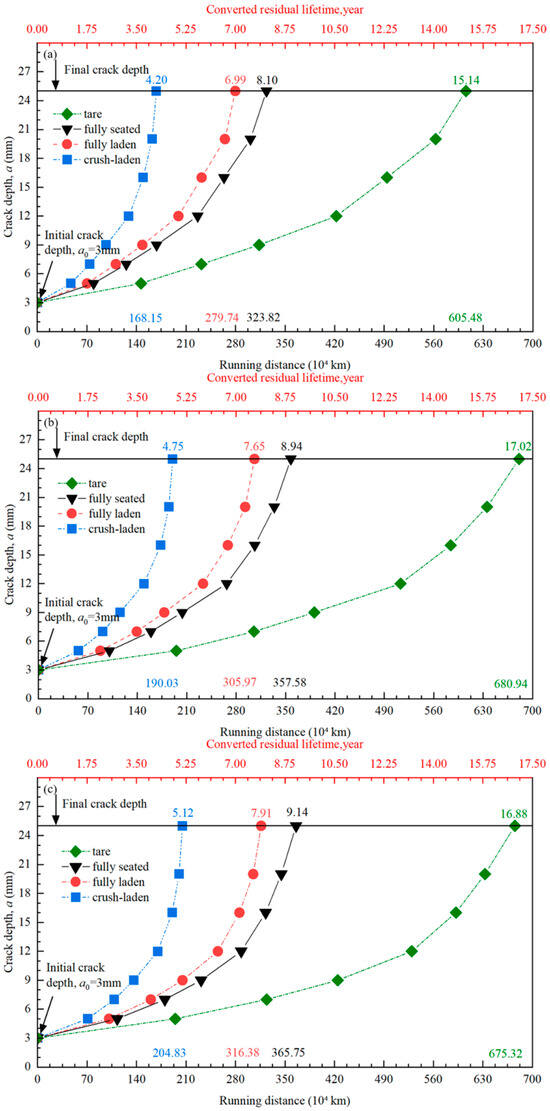
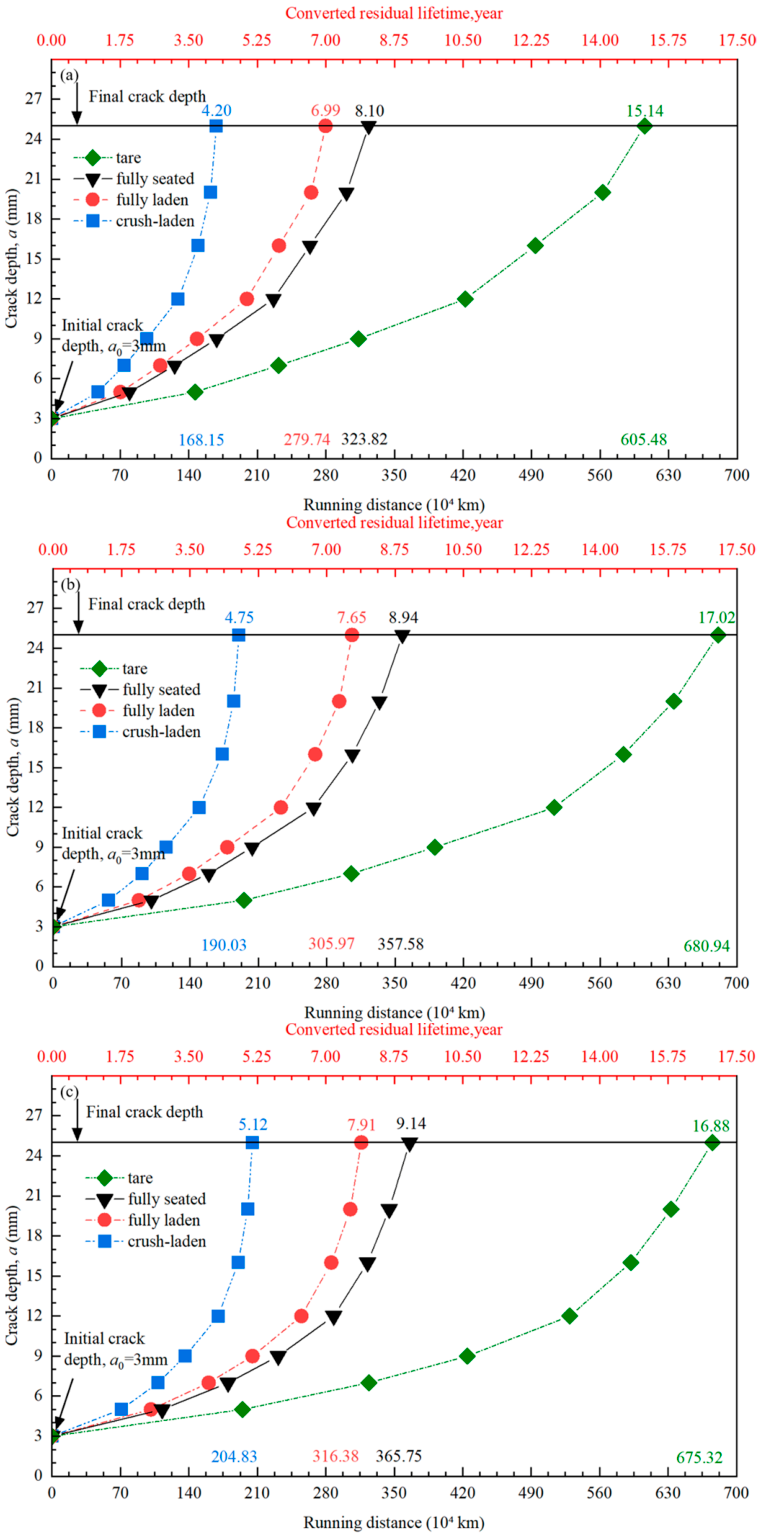
Figure 13 shows the evolution of crack depth with running distance for the four vehicle-loading conditions and crack aspect ratios. The slope of each curve increases with crack depth, indicating an increasing crack-growth rate. At a given crack depth, a higher vehicle-loading condition corresponds to a shorter running distance, demonstrating that the increase in vehicle loading accelerates fatigue crack growth. The same loading dependence is observed for all three aspect ratios.
Figure 13.
Crack depth as a function of running distance under different vehicle-loading conditions: (a) ρ = 0.5; (b) ρ = 0.6; and (c) ρ = 0.7.
For ρ = 0.5, the running distances required for the crack to propagate from 3 to 25 mm are 605.48 × 10⁴, 323.82 × 10⁴, 279.74 × 10⁴, and 168.15 × 10⁴ km under the tare, fully seated, fully laden, and crush-laden conditions, respectively. The corresponding values are 680.94 × 10⁴, 357.58 × 10⁴, 305.97 × 10⁴, and 190.03 × 10⁴ km for ρ = 0.6, and 675.32 × 10⁴, 365.75 × 10⁴, 316.38 × 10⁴, and 204.83 × 10⁴ km for ρ = 0.7.
3.6. Accumulated Rainflow Matrices of the Equivalent Stress-Intensity Factor
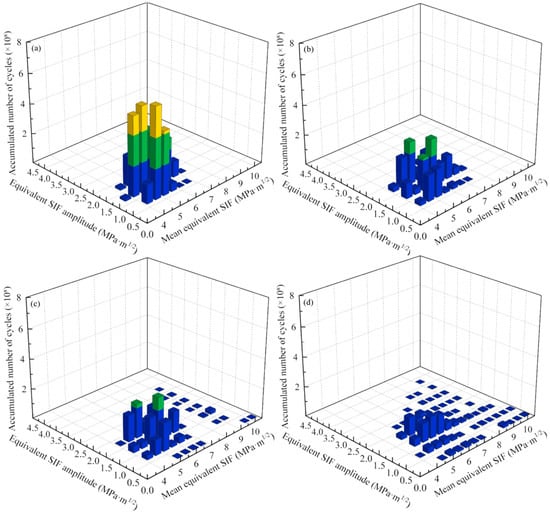
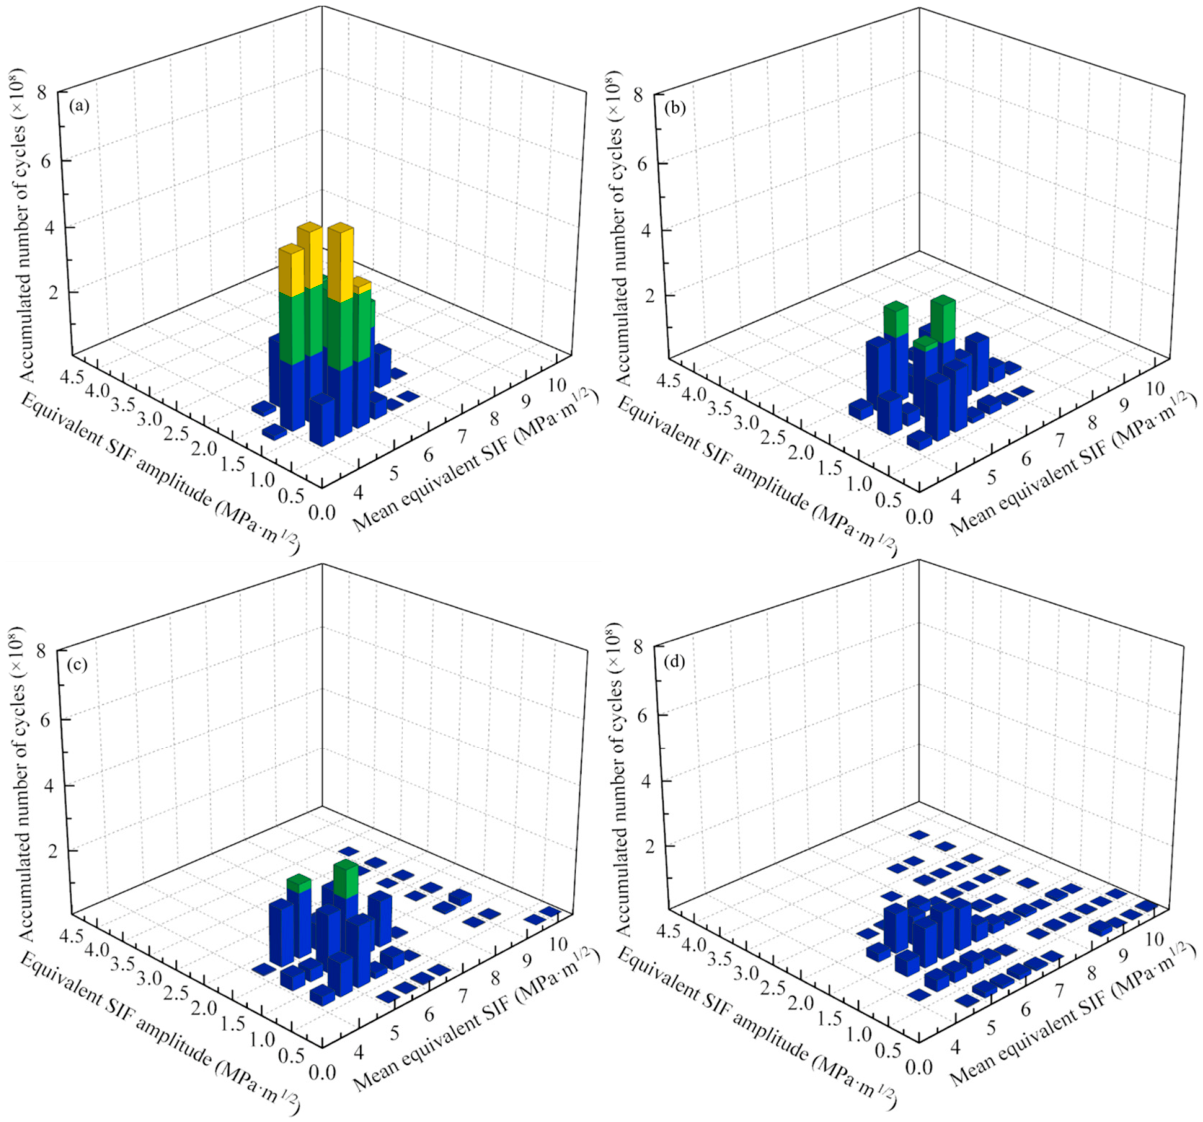
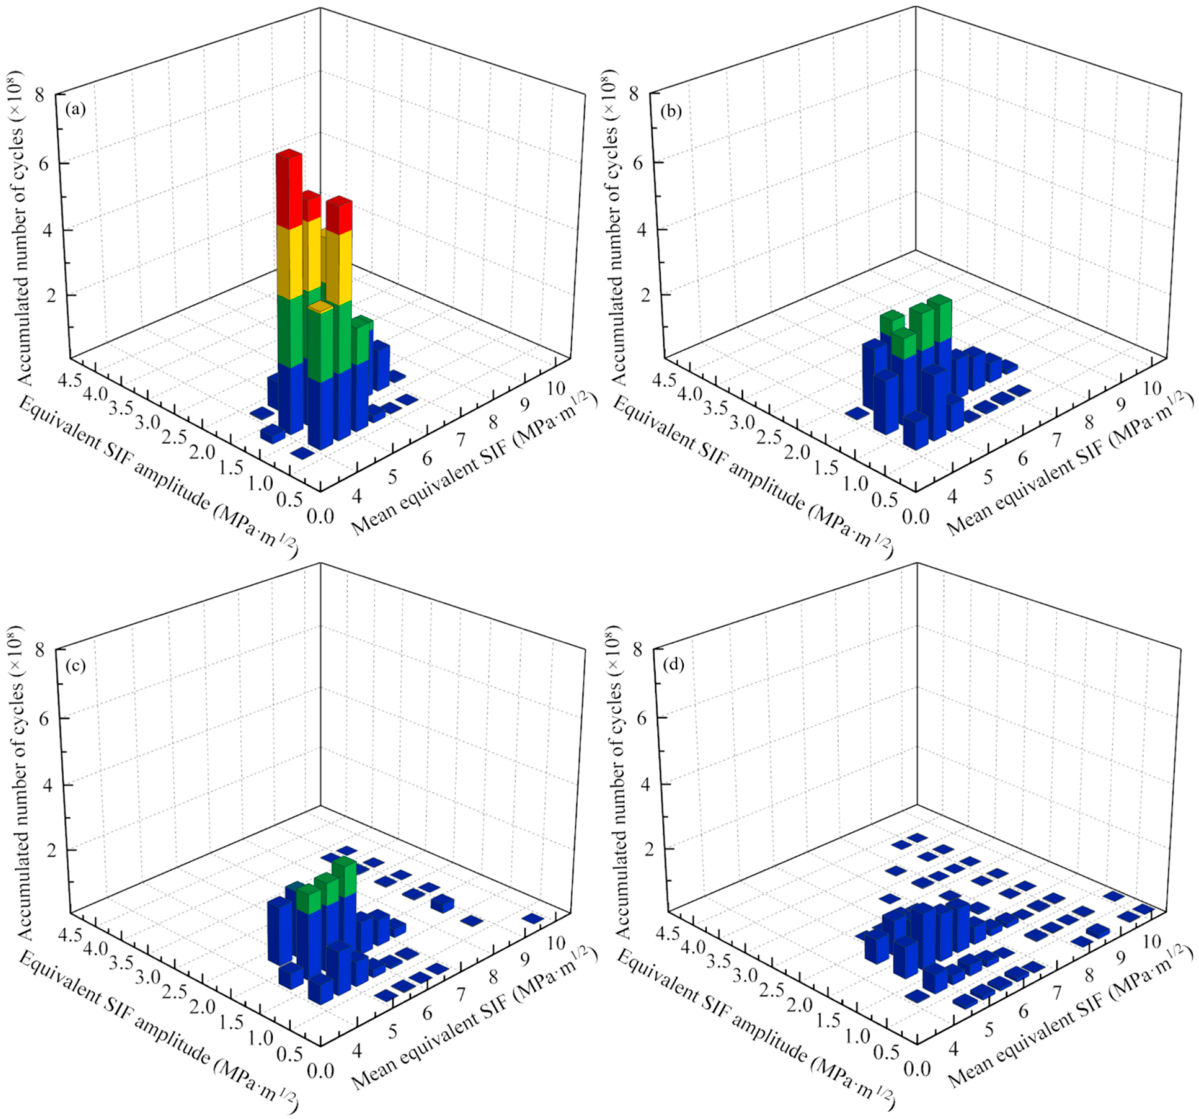
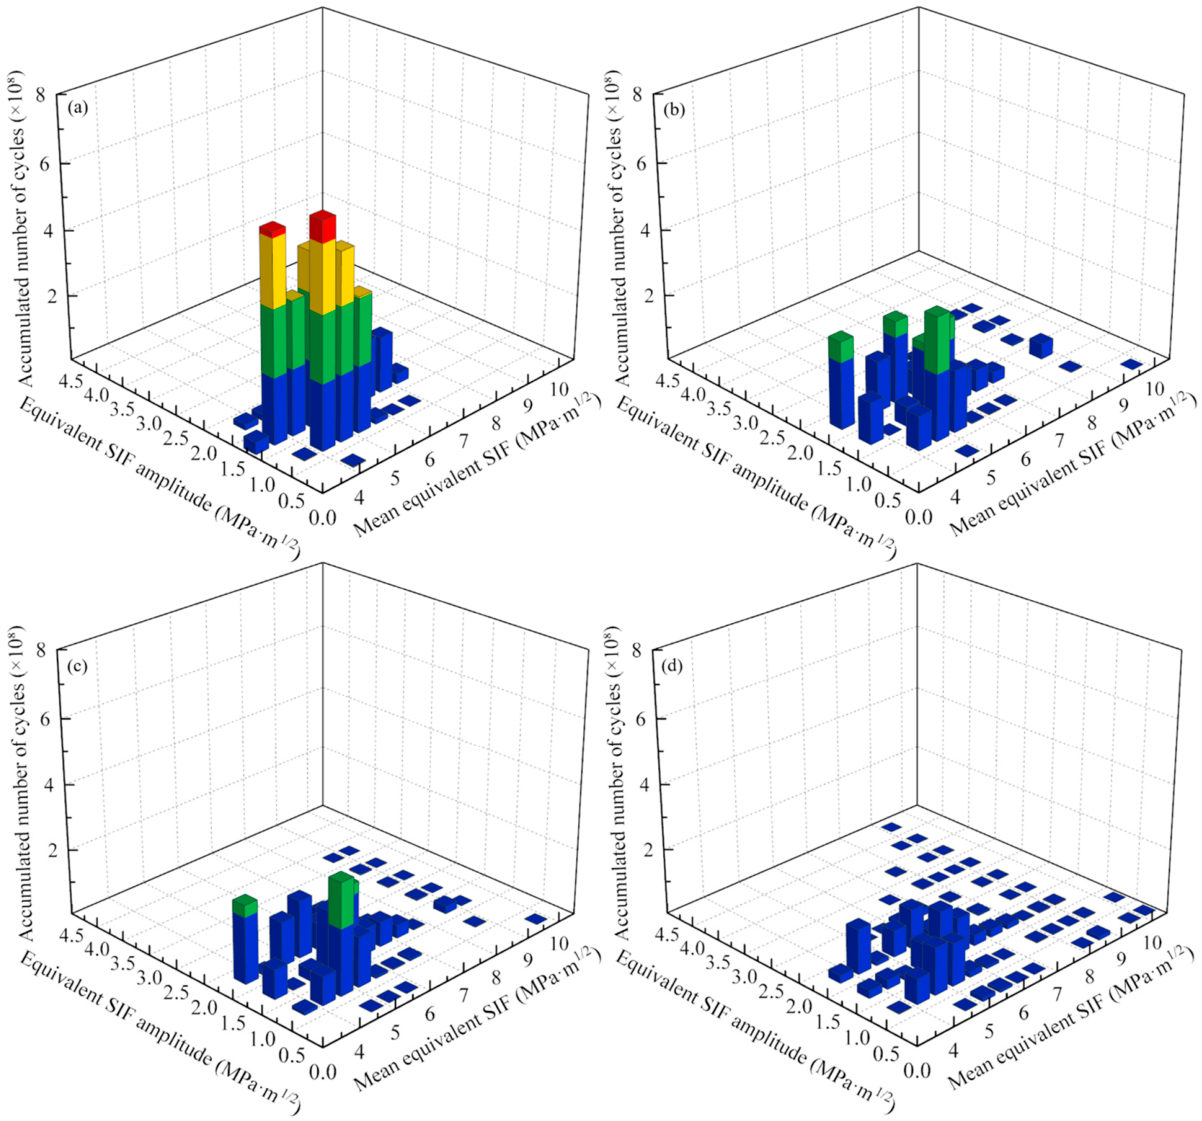
At each crack-growth stage, the equivalent SIF history is decomposed into individual cycles, using rainflow counting. For each cycle, the mean equivalent SIF and equivalent SIF amplitude are defined as Keqv,m = (Keqvcy,max + Keqvcy,min)/2 and Keqv,a = (Keqvcy,max − Keqvcy,min)/2 = ΔKeqv/2, respectively. Here, Keqv,m represents the mean equivalent-SIF level of a cycle, whereas Keqv,a denotes its amplitude and is directly related to the equivalent-SIF range ΔKeqv used in the crack-growth model.
Figure 14, Figure 15 and Figure 16 present the results for ρ = 0.5, 0.6, and 0.7, respectively, under the four vehicle-loading conditions. The two matrix axes correspond to Keqv,m and Keqv,a, while the vertical axis represents the accumulated cycle count in each bin. Identical bin intervals and plotting scales are used for the four loading conditions at each crack aspect ratio.
Figure 14.
Accumulated rainflow matrices of the equivalent SIF for ρ = 0.5: (a) tare; (b) fully seated; (c) fully laden; and (d) crush-laden.
Figure 15.
Accumulated rainflow matrices of the equivalent SIF for ρ = 0.6: (a) tare; (b) fully seated; (c) fully laden; and (d) crush-laden.
Figure 16.
Accumulated rainflow matrices of the equivalent SIF for ρ = 0.7: (a) tare; (b) fully seated; (c) fully laden; and (d) crush-laden.
For ρ = 0.5, the occupied region of the matrix extends towards larger values of Keqv,m and Keqv,a as the vehicle loading increases. Under the tare condition, the nonzero cycles extend to approximately 7.25 MPa ⋅ m1/2 in Keqv,m and 2.25 MPa ⋅ m1/2 in Keqv,a. Under the fully seated condition, the upper limit of Keqv,m increases to approximately 7.75 MPa ⋅ m1/2. Under the fully laden condition, the corresponding upper limits increase to approximately 10.25 MPa ⋅ m1/2 and 3.25 MPa ⋅ m1/2, respectively. Under the crush-laden condition, the upper limit of Keqv,a further increases, to approximately 3.75 MPa ⋅ m1/2. For ρ = 0.6, the accumulated rainflow matrices exhibit a similar loading dependence. The occupied region progressively extends towards higher mean equivalent SIFs and larger equivalent SIF amplitudes from the tare condition to the fully seated, fully laden and crush-laden conditions. For ρ = 0.7, the same variation is observed. The upper limit of Keqv,a reaches approximately 4.25 MPa ⋅ m1/2 under the crush-laden condition, exceeding those obtained for the other two crack aspect ratios.
Across the three crack aspect ratios, increasing vehicle loading extends the occupied region of the accumulated rainflow matrices towards higher Keqv,m and Keqv,a. This variation is consistent with the increase in Keqv,max observed in Section 3.4, demonstrating that vehicle loading increases both the maximum equivalent SIF and the range of variable-amplitude equivalent SIF cycles throughout crack propagation.
4. Discussion
Changes in vehicle loading lead to a pronounced disproportionate amplification of the fatigue response. As shown in Figure 7, Figure 8 and Figure 9, increasing vehicle loading not only alters the fluctuations of the dynamic loads, but also increases the number of local stress cycles with larger stress amplitudes and higher tensile mean stresses. Following Goodman correction and evaluation using the bilinear S − N relation, these cycles make greater contributions to accumulated fatigue damage. Therefore, the amplification of local fatigue damage with increasing vehicle loading is closely related to the load-cycle distribution and the nonlinear stress-life relationship involved in damage accumulation. This explains the substantial difference between the increase in fatigue damage shown in Figure 8 and the corresponding change in car body mass. Similar amplification is observed at different high-damage nodes.
For cracked axles, the effect of vehicle loading is also influenced by crack geometry and the distribution of local crack-driving forces. The variations in the maximum equivalent stress-intensity factor and fracture mode contributions shown in Figure 11 and Figure 12 are closely related. Increasing vehicle loading raises the equivalent stress-intensity factor, shortens crack-growth life, and delays the transition from Mode I to Mode II dominance. Since the dominant fracture mode in this study is determined from the contribution coefficients at the critical crack-front position, the transition in the dominant mode reflects a change in the relative contributions of the local crack-driving force components, rather than a change in the actual crack-propagation direction. Furthermore, the self-similar crack-growth assumption with a fixed aspect ratio adopted in Section 2.4 maintains consistent crack geometries across vehicle-loading conditions. The consistent vehicle-loading trends observed for the three prescribed aspect ratios in Figure 13, Figure 14, Figure 15 and Figure 16 indicate that the loading effect exhibits similar characteristics within the investigated range of crack geometries, providing a basis for comparing crack growth under different vehicle-loading conditions.
Previous axle-fatigue and crack-growth studies generally employ prescribed or measured load histories [9,10,19,20,21,22,23]. In the present study, the load histories are obtained from vehicle dynamic simulations under different loading conditions, establishing a direct relationship between vehicle loading, local stress-cycle distributions, fatigue damage, mixed-mode fracture behaviour, and crack-growth life. These results clarify the influence of vehicle loading on axle fatigue and crack propagation under identical operating conditions. The absolute maximum principal-stress criterion is employed to evaluate axle-fatigue damage under different vehicle-loading conditions. Kashyzadeh and Ghorbani [56] demonstrated that the selection of fatigue criteria affects predictions under non-proportional multiaxial loading. Differences in stress-cycle identification and fatigue-damage characterization among different methods may further influence the predicted fatigue damage and allowable fatigue life of the uncracked axle. Therefore, developing multiaxial cycle counting and equivalent stress-assessment methods consistent with the bilinear S − N relation for EA4T steel, and validating their applicability through experiments, represents an important direction for further research on axle-fatigue damage and allowable fatigue life.
For crack-growth prediction, the equivalent stress-intensity factor range and its corresponding cycle ratio are incorporated into the NASGRO-type relation using published EA4T material parameters. The application of these parameters under mixed-mode loading assumes that the equivalent stress-intensity factor adequately represents the combined crack-driving force. The resulting crack-growth lives are used to compare the effects of different vehicle-loading conditions.
In addition to the crack-growth model and material parameters, the predicted crack-growth life is also affected by the representation of service loading. Pokorný et al. (2014) [57] showed that a greater contribution from high-amplitude load cycles leads to faster crack growth and shorter residual life. In our study, repeating the 5000 m tare load block gives the longest predicted crack-growth life, while repeating the crush-laden block gives the shortest. For operation combining the four investigated loading conditions on the same track, the predicted life would lie between these two values, within the present model. Therefore, repeating a less severe load block may overestimate crack-growth life, whereas repeating a more severe block may underestimate it.
Regarding load-sequence effects, Maierhofer et al. [23] demonstrated that variable-amplitude loading can cause crack-growth retardation in railway axles. Since our NASGRO-type calculation does not account for such load interactions, neglecting retardation may overestimate crack-growth rates and underestimate crack-growth life.
5. Conclusions
This study combines vehicle dynamic analysis, damage assessment, and fracture mechanics to investigate the effect of vehicle loading on railway axle fatigue. The primary-suspension-force histories obtained under the tare, fully seated, fully laden, and crush-laden conditions are applied to the wheelset structural model to calculate the local axle-stress histories and fatigue damage, and to identify the fatigue-critical location. A semi-elliptical surface crack is subsequently introduced at this location, to calculate the mixed-mode stress-intensity factors and crack-growth life. The main conclusions are as follows.
- Increasing vehicle loading leads to a consistent increase in the fluctuations of the longitudinal, lateral, and vertical primary-suspension forces across all four loading conditions. The standard deviations increase monotonically with vehicle loading, reaching 2.86, 2.88, and 2.71 times their respective tare values under the crush-laden condition. In contrast, the magnitude of the mean vertical force increases by only 18.9%.
- The fatigue-critical location remains at the root of the transition groove adjacent to the wheel seat under all four loading conditions. Increasing vehicle loading shifts the local stress cycles towards larger amplitudes and higher tensile mean stresses. The maximum fatigue damage under the fully seated, fully laden and crush-laden conditions increases to 9.24, 19.93, and 102.07 times that under the tare condition, respectively.
- The maximum equivalent stress-intensity factor increases with vehicle loading and crack depth. Mode I provides the dominant contribution to the equivalent stress-intensity factor during early crack propagation, whereas Mode II becomes dominant as the crack deepens. Increasing vehicle loading extends the crack-depth range over which Mode I remains dominant. The Mode III contribution remains secondary, and reaches a local maximum near the change between the dominant Mode I and Mode II contributions.
- Increasing vehicle loading consistently reduces the predicted crack-growth life for all three prescribed crack aspect ratios. Relative to the tare condition, the predicted life decreases by 45.8–47.5%, 53.2–55.1%, and 69.7–72.2% under the fully seated, fully laden, and crush-laden conditions, respectively.
Overall, relatively small increases in car body mass lead to substantially larger increases in fatigue damage and reductions in crack-growth life. Vehicle loading should, therefore, be explicitly considered in the fatigue-integrity and continued service assessment of high-speed railway axles.
Author Contributions
Conceptualization, R.W.; methodology, Y.L., Y.H. and R.W.; software, Y.L. and Y.H.; validation, Y.L.; formal analysis, Y.L. and Y.H.; investigation, Y.H.; resources, D.C. and P.A.; data curation, Y.L. and Y.H.; writing—original draft preparation, Y.H.; writing—review and editing, R.W., D.C. and P.A.; visualization, Y.H.; supervision, R.W., D.C. and P.A.; project administration, R.W.; funding acquisition, R.W. All authors have read and agreed to the published version of the manuscript.
Funding
This work was supported by the Hebei Provincial Natural Science Foundation for Young Scientists (A2026210040), the Science and Technology Research Project of the Hebei Provincial Department of Education (QN2026089 and CXZX2026065), the Yanzhao Golden Platform Talent Program of Hebei Province for Backbone Talents (B2026005012), the Hebei Province Yanzhao Golden Terrace Talent Attraction Program for Outstanding Talents (A2024004), and the Hebei Province’s Full-time Recruitment of High-level Talent Research Project (2024HBQZYCXY014).
Data Availability Statement
The data presented in this study are available from the corresponding author upon reasonable request.
Conflicts of Interest
The authors declare no conflicts of interest.
References
- Smith, R.A.; Hillmansen, S. A Brief Historical Overview of the Fatigue of Railway Axles. Proc. Inst. Mech. Eng. Part F J. Rail Rapid Transit 2004, 218, 267–277. [Google Scholar] [CrossRef] [Scilit]
- Zerbst, U.; Klinger, C.; Klingbeil, D. Structural Assessment of Railway Axles—A Critical Review. Eng. Fail. Anal. 2013, 35, 54–65. [Google Scholar] [CrossRef] [Scilit]
- Zhao, H.; Liao, D.; Gao, J.; Zhu, S.; Liu, L.; Han, J.; Li, S. Damage Tolerance Assessment of Heavy-Duty Freight Railway Axles with Artificial Defects. Chin. J. Mech. Eng. 2025, 38, 57. [Google Scholar] [CrossRef] [Scilit]
- Pourheidar, A.; Regazzi, D.; Cervello, S.; Foletti, S.; Beretta, S. Fretting Fatigue Analysis of Full-Scale Railway Axles in Presence of Artificial Micro-Notches. Tribol. Int. 2020, 150, 106383. [Google Scholar] [CrossRef] [Scilit]
- Hu, F.; Wu, S.; Xin, X.; Guo, F.; Ren, Z. Determination of the Critical Defect and Fatigue Life of High-Speed Railway Axles under Variable Amplitude Loads. Int. J. Fatigue 2023, 168, 107446. [Google Scholar] [CrossRef] [Scilit]
- Lundén, R.; Vernersson, T.; Ekberg, A. Railway Axle Design: To Be Based on Fatigue Initiation or Crack Propagation? Proc. Inst. Mech. Eng. Part F J. Rail Rapid Transit 2010, 224, 445–453. [Google Scholar] [CrossRef] [Scilit]
- He, X.; Zeng, Q.; Xu, M.; Wang, L.; Yu, J.; Ban, X. Study on the Mechanism of the Influence of Passenger Load on the Vibration Characteristics of Railway Vehicles Based on Modal Characteristics. Int. J. Precis. Eng. Manuf. 2024, 25, 2285–2297. [Google Scholar] [CrossRef] [Scilit]
- Gao, X.; Yang, L. Effect of Passenger Uncertainty on the Inertial Property and Stability of a Railway Vehicle. J. Braz. Soc. Mech. Sci. Eng. 2024, 46, 626. [Google Scholar] [CrossRef] [Scilit]
- Náhlík, L.; Pokorný, P.; Ševčík, M.; Fajkoš, R.; Matušek, P.; Hutař, P. Fatigue Lifetime Estimation of Railway Axles. Eng. Fail. Anal. 2017, 73, 139–157. [Google Scholar] [CrossRef] [Scilit]
- Song, Y.; Wu, P.; Qi, Y.; Li, H.; Wu, C. Experimental Study on the Residual Life of High Speed Trains Axles Considering Initial Defects. Eng. Fail. Anal. 2025, 168, 109078. [Google Scholar] [CrossRef] [Scilit]
- Zeng, D.; Dong, Y.; Zhao, H.; Guan, M.; Ren, M.; Li, X.; Zhang, J.; Lu, L. Investigation on Fretting Fatigue Crack Initiation of Scale Press-Fitted Railway Axle Containing Axial Defects. Tribol. Int. 2026, 216, 111581. [Google Scholar] [CrossRef] [Scilit]
- Hirakawa, K.; Kubota, M. On the Fatigue Design Method for High-Speed Railway Axles. Proc. Inst. Mech. Eng. Part F J. Rail Rapid Transit 2001, 215, 73–82. [Google Scholar] [CrossRef] [Scilit]
- Madia, M.; Beretta, S.; Zerbst, U. An Investigation on the Influence of Rotary Bending and Press Fitting on Stress Intensity Factors and Fatigue Crack Growth in Railway Axles. Eng. Fract. Mech. 2008, 75, 1906–1920. [Google Scholar] [CrossRef] [Scilit]
- Shu, Y.; Liu, Z.; Yang, G. Finite Element Simulation of Fretting Wear on Railway Axle Press-Fit Specimens. Tribol. Int. 2023, 178, 108024. [Google Scholar] [CrossRef] [Scilit]
- Maglio, M.; Kabo, E.; Ekberg, A. Railway Wheelset Fatigue Life Estimation Based on Field Tests. Fatigue Fract. Eng. Mater. Struct. 2022, 45, 2443–2456. [Google Scholar] [CrossRef] [Scilit]
- Luo, J.; Wang, S.; Liu, X.; Geng, S. Fatigue Life Prediction of Train Wheel Shaft Based on Load Spectrum Characteristics. Adv. Mech. Eng. 2021, 13, 1687814021992153. [Google Scholar] [CrossRef] [Scilit]
- Yan, R.-G.; Wang, W.-J.; Ding, R.; Zeng, Y.-M.; Shan, W.; Yin, Y.; Wang, X.-S. Research on Size Effects in Fracture Properties and Residual Life Prediction for High-Speed Train Axles. Theor. Appl. Fract. Mech. 2024, 134, 104715. [Google Scholar] [CrossRef] [Scilit]
- Grandt, A.F., Jr. Introduction to Damage Tolerance Analysis Methodology. In Damage Tolerance of Metallic Structures: Analysis Methods and Applications; Chang, J.B., Rudd, J.L., Eds.; ASTM STP; ASTM International: Philadelphia, PA, USA, 1984; pp. 3–24. [Google Scholar] [CrossRef] [Scilit]
- Beretta, S.; Carboni, M.; Cantini, S.; Ghidini, A. Application of Fatigue Crack Growth Algorithms to Railway Axles and Comparison of Two Steel Grades. Proc. Inst. Mech. Eng. Part F J. Rail Rapid Transit 2004, 218, 317–326. [Google Scholar] [CrossRef] [Scilit]
- Pokorný, P.; Hutař, P.; Náhlík, L. Residual Fatigue Lifetime Estimation of Railway Axles for Various Loading Spectra. Theor. Appl. Fract. Mech. 2016, 82, 25–32. [Google Scholar] [CrossRef] [Scilit]
- Pourheidar, A.; Patriarca, L.; Beretta, S.; Regazzi, D. Investigation of Fatigue Crack Growth in Full-Scale Railway Axles Subjected to Service Load Spectra: Experiments and Predictive Models. Metals 2021, 11, 1427. [Google Scholar] [CrossRef] [Scilit]
- Xu, T.; Lu, L.; Zeng, D.; Zou, L. Fretting Fatigue Crack Growth Simulation and Residual Life Assessment of Railway Press-Fitted Axle. Eng. Fract. Mech. 2023, 286, 109290. [Google Scholar] [CrossRef] [Scilit]
- Maierhofer, J.; Gänser, H.-P.; Simunek, D.; Leitner, M.; Pippan, R.; Luke, M. Fatigue Crack Growth Model Including Load Sequence Effects—Model Development and Calibration for Railway Axle Steels. Int. J. Fatigue 2020, 132, 105377. [Google Scholar] [CrossRef] [Scilit]
- Citarella, R.; Giannella, V.; Lepore, M.; Dhondt, G. Dual Boundary Element Method and Finite Element Method for Mixed-mode Crack Propagation Simulations in a Cracked Hollow Shaft. Fatigue Fract. Eng. Mater. Struct. 2018, 41, 84–98. [Google Scholar] [CrossRef] [Scilit]
- Madia, M.; Beretta, S.; Schödel, M.; Zerbst, U.; Luke, M.; Varfolomeev, I. Stress Intensity Factor Solutions for Cracks in Railway Axles. Eng. Fract. Mech. 2011, 78, 764–792. [Google Scholar] [CrossRef] [Scilit]
- Wu, X.; Rakheja, S.; Ahmed, A.K.W.; Chi, M. Influence of a Flexible Wheelset on the Dynamic Responses of a High-Speed Railway Car Due to a Wheel Flat. Proc. Inst. Mech. Eng. Part F J. Rail Rapid Transit 2018, 232, 1033–1048. [Google Scholar] [CrossRef] [Scilit]
- Guan, T.; Deng, X.; Wang, J. Dynamic Response of Axle Box Bearing for High-Speed Train Considering Wheelset Flexibility and Polygonal Wear. Sci. Rep. 2023, 13, 22680. [Google Scholar] [CrossRef] [Scilit] [PubMed]
- Dong, Y.; Cao, S. The Generation and Evolution of High-Order Wheel Polygonal Wear from the Effects of Wheelset Rotation. Lubricants 2024, 12, 313. [Google Scholar] [CrossRef] [Scilit]
- Kalker, J.J. A Fast Algorithm for the Simplified Theory of Rolling Contact. Veh. Syst. Dyn. 1982, 11, 1–13. [Google Scholar] [CrossRef] [Scilit]
- He, Z.; Wang, R.; Yin, Z.; Sun, T.; Lyu, H. Hydraulic Electromechanical Regenerative Damper in Vehicle–Track Dynamics: Power Regeneration and Wheel Wear for High-Speed Train. Lubricants 2025, 13, 424. [Google Scholar] [CrossRef] [Scilit]
- Sichani, M.S.; Enblom, R.; Berg, M. A Fast Wheel–Rail Contact Model for Application to Damage Analysis in Vehicle Dynamics Simulation. Wear 2016, 366–367, 123–130. [Google Scholar] [CrossRef] [Scilit]
- Pagaimo, J.; Millan, P.; Ambrósio, J. Flexible Multibody Formulation Using Finite Elements with 3 DoF per Node with Application in Railway Dynamics. Multibody Syst. Dyn. 2023, 58, 83–112. [Google Scholar] [CrossRef] [Scilit]
- Chen, X.; Wang, J.; Lu, L.; Zou, L.; Xu, T.; Dong, Y.; Zhao, H.; Zeng, D. Effect of Interference Magnitude on Fretting Wear and Fatigue Strength of Scaled Press-Fitted Railway Axles. Wear 2024, 546–547, 205347. [Google Scholar] [CrossRef] [Scilit]
- Simo, J.C.; Laursen, T.A. An Augmented Lagrangian Treatment of Contact Problems Involving Friction. Comput. Struct. 1992, 42, 97–116. [Google Scholar] [CrossRef] [Scilit]
- Izard, E.; García-Martín, R.; Rodríguez-Martín, M.; Lorenzo, M. Finite Element Analysis of Friction-Induced Stress Concentrations in Press Fits with Chamfer Hubs. Lubricants 2025, 13, 231. [Google Scholar] [CrossRef] [Scilit]
- ASTM E1049-85(2023); Standard Practices for Cycle Counting in Fatigue Analysis. ASTM International: West Conshohocken, PA, USA, 2023. [Google Scholar] [CrossRef] [Scilit]
- Guo, H.; Li, X.; Liu, X. An Analysis Method for Fatigue Life of Rail Vehicle Axles Considering Rotation Effect of Wheelset. Adv. Mech. Eng. 2022, 14, 16878132221127834. [Google Scholar] [CrossRef] [Scilit]
- Filippini, M.; Luke, M.; Varfolomeev, I.; Regazzi, D.; Beretta, S. Fatigue Strength Assessment of Railway Axles Considering Small-Scale Tests and Damage Calculations. Procedia Struct. Integr. 2017, 4, 11–18. [Google Scholar] [CrossRef] [Scilit]
- Beretta, S.; Regazzi, D. Probabilistic Fatigue Assessment for Railway Axles and Derivation of a Simple Format for Damage Calculations. Int. J. Fatigue 2016, 86, 13–23. [Google Scholar] [CrossRef] [Scilit]
- Miner, M.A. Cumulative Damage in Fatigue. J. Appl. Mech. 1945, 12, A159–A164. [Google Scholar] [CrossRef] [Scilit]
- Gosz, M.; Moran, B. An Interaction Energy Integral Method for Computation of Mixed-Mode Stress Intensity Factors along Non-Planar Crack Fronts in Three Dimensions. Eng. Fract. Mech. 2002, 69, 299–319. [Google Scholar] [CrossRef] [Scilit]
- de Freitas, M.; François, D. Analysis of Fatigue Crack Growth in Rotary Bend Specimens and Railway Axles. Fatigue Fract. Eng. Mater. Struct. 1995, 18, 171–178. [Google Scholar] [CrossRef] [Scilit]
- Besuner, P.M. The Influence Function Method for Fracture Mechanics and Residual Fatigue Life Analysis of Cracked Components under Complex Stress Fields. Nucl. Eng. Des. 1977, 43, 115–154. [Google Scholar] [CrossRef] [Scilit]
- Tichoň, D.; Vojtek, T.; Dlhý, P.; Pokorný, P.; Náhlík, L.; Fernández-Canteli, A.; Fajkoš, R.; Peter, O.; Hutař, P. Stochastic Assessment of Residual Fatigue Life of Railway Axles Considering Relevant Critical Factors. Railw. Eng. Sci. 2026, 34, 1–24. [Google Scholar] [CrossRef] [Scilit]
- Tanaka, K. Fatigue Crack Propagation from a Crack Inclined to the Cyclic Tensile Axis. Eng. Fract. Mech. 1974, 6, 493–507. [Google Scholar] [CrossRef] [Scilit]
- Dirik, H.; Yalçinkaya, T. Crack Path and Life Prediction under Mixed Mode Cyclic Variable Amplitude Loading through XFEM. Int. J. Fatigue 2018, 114, 34–50. [Google Scholar] [CrossRef] [Scilit]
- Newman, J.C., Jr. A Crack Opening Stress Equation for Fatigue Crack Growth. Int. J. Fract. 1984, 24, R131–R135. [Google Scholar] [CrossRef] [Scilit]
- Wang, R.; Allen, P.; Song, Y.; Wang, Z. Modelling and Analysis of Power-Regenerating Potential for High-Speed Train Suspensions. Sustainability 2022, 14, 2542. [Google Scholar] [CrossRef] [Scilit]
- GB/T 5599-2019; Specification for Dynamic Performance Assessment and Testing Verification of Rolling Stock. Standardization Administration of China: Beijing, China, 2019.
- Ji, D.; Zhang, J.; Yi, K.; Huang, Y.; Lu, Q.; Zhang, H. Surface Crack Growth Simulation and Residual Life Assessment of High-Speed Train Axles Based on Extended Finite Element Method. Eng. Fail. Anal. 2022, 134, 106043. [Google Scholar] [CrossRef] [Scilit]
- Gong, J.; Wu, X.; Liu, Y.; Chi, M. Research on Load Inversion of Bogie Frame Based on Vibration Acceleration. Electr. Drive Locomot. 2024, 65, 28–37. [Google Scholar] [CrossRef]
- Luo, Y.; Li, G.; Qi, C.; Li, C.; Hu, Y. Assessment Model for Multivariable Fatigue Performance of EA4T Axles Containing Defects. Sci. Rep. 2026, 16, 4894. [Google Scholar] [CrossRef] [Scilit] [PubMed]
- Zou, L.; Zeng, D.; Chen, X.; Li, J.; Zhao, H.; Lu, L. Experimental and Numerical Study on Press-Fitted Railway Axles: Competition between Fretting and Plain Fatigue. Int. J. Fatigue 2024, 179, 108032. [Google Scholar] [CrossRef] [Scilit]
- BS 7910:2019; Guide to Methods for Assessing the Acceptability of Flaws in Metallic Structures. British Standards Institution: London, UK, 2019. [Google Scholar] [CrossRef] [Scilit]
- Zou, L.; Zeng, D.; Li, Y.; Yang, K.; Lu, L.; Yuan, C. Experimental and Numerical Study on Fretting Wear and Fatigue of Full-Scale Railway Axles. Railw. Eng. Sci. 2020, 28, 365–381. [Google Scholar] [CrossRef] [Scilit]
- Kashyzadeh, K.R.; Ghorbani, S. Comparison of Some Selected Time-Domain Fatigue Failure Criteria Dedicated for Multi Input Random Non-Proportional Loading Conditions in Industrial Components. Eng. Fail. Anal. 2023, 143, 106907. [Google Scholar] [CrossRef] [Scilit]
- Pokorný, P.; Náhlík, L.; Hutař, P. Comparison of Different Load Spectra on Residual Fatigue Lifetime of Railway Axle. Procedia Eng. 2014, 74, 313–316. [Google Scholar] [CrossRef] [Scilit]

Disclaimer/Publisher’s Note: The statements, opinions and data contained in all publications are solely those of the individual author(s) and contributor(s) and not of MDPI and/or the editor(s). MDPI and/or the editor(s) disclaim responsibility for any injury to people or property resulting from any ideas, methods, instructions or products referred to in the content. |
© 2026 by the authors. Licensee MDPI, Basel, Switzerland. This article is an open access article distributed under the terms and conditions of the Creative Commons Attribution (CC BY) license.