


Abstract
This study investigated the dry sliding wear behaviour of Al2O3 particulates (2–6 wt.%) in Al6061 metal matrix composites produced by ultrasonic stir casting, examining mechanical and tribological behaviour. We modelled wear rate using machine learning. Optical studies confirmed uniform Al2O3 particle dispersion, minimal agglomeration, and strong interfacial bonding between the Al6061 and Al2O3 phases. With an increase in Al2O3 content, density and hardness increased by 1.3% and 33%, respectively. The Al6061–6 wt.% Al2O3 composite exhibited 40% higher wear resistance than the base alloy in dry-sliding conditions, with sliding distance varying between 0 and 10,000 m and load varying between 0 and 50 N. At lower loads and shorter sliding distances, abrasive wear dominated; as load and sliding distance increased, the dominant wear mechanism shifted to delamination and adhesion wear. Moreover, tribological testing at 6 wt.% reinforcement showed a 40% improvement in dry sliding wear resistance, with applied normal load and sliding distance varying between 10 and 50 N, and 1000 and 10,000 m, respectively. The specific wear rate was subsequently modelled and predicted using K-Nearest Neighbours (KNN), Support Vector Regression (SVR), Artificial Neural Networks (ANNs), Random Forests (RFs), and Gradient Boosting Machines (GBMs). Among these, the RF model achieved the highest accuracy (R2 = 0.946). Based on feature importance analysis, applied normal load and sliding distance are the most influential factors in wear. As a result, in dry-sliding conditions, Al6061-Al2O3 MMCs show a stable wear response, thereby improving dataset homogeneity and model performance. Overall, this study used experimental insights and predictive analytics to predict MMC wear behaviour. By employing ML models, composite design and wear can be optimised. Additionally, feature importance analysis showed that applied normal load and sliding distance best predicted wear rate.
1. Introduction
Compared with basic alloys, composite materials have gained popularity in research over the past few decades due to the growing demand for low-cost, lightweight, high-strength, high-stiffness materials. MMCs comprise particles dispersed throughout a base matrix, such as pure metal or copper, magnesium, zinc, or aluminium alloys. Various ceramic particulates with varying shapes, sizes and properties can reinforce MMCs for industry-specific applications. The particles usually comprise ceramic materials, including TiC, TiO2, ZrB2, Al2O3, SiC, ZnO2, and B4C [1]. MMCs are an alternative to conventional materials because they offer an excellent blend of qualities that standard materials struggle to achieve, such as a lower weight-to-volume ratio, greater strength, improved corrosion and wear resistance, and higher fatigue strength [2]. While MMCs exhibit excellent properties, current manufacturing processes are neither stable nor cost-effective for producing bulk composites with complex component configurations and near-net shapes. Common methods for making MMCs include powder metallurgy [3], liquid-state stir casting [4], squeeze casting [5], combined stir–squeeze casting [6], friction-stir processing [7,8], and ultrasonic-assisted stir casting [9,10,11,12,13]. Researchers have produced composite samples for laboratory testing, and powder metallurgy is the most expensive approach for processing MMCs [14]. However, the stir-casting technique has attracted significant attention as a molten-metal-state processing method because it is straightforward, affordable, and effective for transforming bulk-size composites into intricate near-net components [15]. By incorporating SiC, Al2O3, and graphite as strengtheners and aluminium as the matrix, Kumar et al. [16] explored the stir-casting process and its parameters by varying reinforcement proportions. They showed that the reinforcement type, its fraction, and process constraints all play a significant role in determining MMCs’ physical characteristics.
Aircraft fittings, shafts, and gears are only a few of the many applications for the exceptional mechanical qualities of Al6061 alloy [17]. Wear is common in these parts when two surfaces move relative to each other. Wear-induced material loss can, therefore, cause substantial complications in industrial operations [18]. Consequently, it is crucial to look at the tribological behaviour of Al-based MMCs [19]. Experimental wear studies are well known to take significant time and money. Despite relatively recent advances in materials science, AI, and data-driven machine learning, these tools have already been accepted as reliable across several scientific domains, including biology, chemistry, and medical science [20]. Recent advancements in integrating machine learning (ML) to predict material and tribological properties [21,22,23] have created new opportunities in tribology and materials science.
Recent studies have shown the potential of machine learning (ML) models to predict wear behaviour across various coated and uncoated materials. For instance, in predicting wear loss in ferro-alloy coatings [24], the dataset was small. It lacked environmental and microstructural descriptors, thereby reducing the generalizability of models such as SVMs and GPRs. Similarly, in a wear prediction study of coated magnesium alloys [25], the focus on specific coating methods (plasma and HVOF) and the potential for overfitting in Extreme Learning Machines (ELMs) highlighted the need for more robust, diverse data. In another case, surface roughness prediction during WEDM [26] was constrained by narrow process parameters and material specificity, limiting its transferability to other alloys and conditions. These works, while valuable, underscore common limitations, including data scarcity, narrow input ranges, limited validation under variable conditions, and a lack of model interpretability. This study addresses these challenges by comparing five carefully selected machine learning (ML) algorithms: K-Nearest Neighbour (KNN), Support Vector Regression (SVR), Artificial Neural Network (ANN), Random Forest (RF), and Gradient Boosting Machine (GBM). These models were chosen for their distinct learning strategies and strengths, providing a comprehensive evaluation of predictive performance. KNN provides a simple, instance-based approach effective for small-to-medium datasets; SVR is robust for high-dimensional data and captures nonlinear relationships; ANNs are well-suited for modelling complex, nonlinear interactions; RF offers strong generalisation and interpretability through ensemble averaging; and GBM enhances predictive accuracy through iterative boosting. By utilising this diverse mix of algorithms, this study aims to assess performance across a range of model complexities and assumptions. A broader dataset with varying loads, reinforcement levels, and sliding distances ensures robustness. This study places particular emphasis on regression performance in the lower-wear regime (up to 1000), where accuracy is critical for practical applications. Through this multi-model approach, this study not only strengthens the reliability of wear prediction but also provides valuable insight into algorithm selection for similar tribological applications.
Despite the extensive use of Al6061-Al2O3 metal matrix composites (MMCs) in automotive and aerospace applications because of their favourable strength-to-weight ratio and wear resistance, understanding their tribological behaviour under high-load, long-sliding-distance conditions remains limited. Most existing studies have focused on either experimental wear characterisation or machine learning (ML)-based prediction. However, few works have integrated systematic experimental wear analysis with multiple ML models to establish reliable predictive frameworks. In particular, the literature has not sufficiently addressed the influence of reinforcement content under ultrasonic-assisted fabrication routes or the comparative effectiveness of different ML algorithms for moderate-sized experimental datasets.
In this work, Al6061 alloy and Al6061-Al2O3 composites (2–6 wt.%) were fabricated using ultrasonic-assisted stir casting to ensure improved dispersion of reinforcement particles. We evaluated hardness, density, and tribological performance under normal loads of 10–50 N, with a counter-disc speed of 500 rpm, a sliding velocity of 0.5 m/s, and a sliding distance of 10,000 m. The wear mechanisms were systematically analysed using worn-surface morphology to identify dominant wear modes under varying loading conditions. To address the limitations of purely experimental interpretations and improve predictive capability, five supervised machine learning models, KNN, SVR, an ANN, RF, and GBM, were employed to predict wear rate using experimental data, with reinforcement percentage, applied load, sliding distance, and sliding velocity as input features.
We selected these ML models because the experimental dataset is moderately sized and tribological behaviour is inherently nonlinear. KNN and SVR suit smaller datasets and capture local, nonlinear trends effectively, while an ANN can model complex interactions among multiple wear-influencing parameters. Ensemble-based models, RF and GBM, were included for their robustness against overfitting, their ability to capture feature interactions, and their superior generalisation performance on limited datasets. By integrating experimental wear analysis with multiple ML approaches, this study addresses the existing gap in combined experimental-data-driven wear prediction of Al6061-Al2O3 composites and provides a comparative assessment of ML model suitability for tribological applications.
In this work, Al6061 alloy and Al6061-Al2O3 (2 to 6 wt.%) composites were manufactured using ultrasonic-assisted stir casting. The hardness, density, and tribological performance of the samples were evaluated with an applied normal load of 10–50 N, a counter disc rotation of 500 rpm, and a sliding velocity of 0.5 m/s; for a 10,000 m sliding distance, the wear loss of the composite samples was investigated. The worn surfaces were analytically inspected to identify different wear conditions. The current study further used five distinct machine learning methods, namely, KNN, SVR, ANN, RF, and GBM, to forecast the wear rates using experimental data and the effect of different parameters (percentage of reinforcement, sliding distance, and applied normal load) on wear behaviour. The selection of KNN, SVR, ANN, RF, and GBM for predicting the wear rate of Al6061-Al2O3 composites was based on both the dataset size and the system’s complex, nonlinear physical behaviour. The dataset is moderate in size, making models like KNN and SVR suitable, as they work well on smaller datasets and can capture local patterns (KNN) or nonlinear relationships (SVR) without requiring extensive data. An ANN was included because it can model complex, nonlinear interactions among multiple input features, such as composition, load, sliding distance, and hardness. Ensemble tree-based models, RF and GBM, were selected for their robustness to overfitting, capability to handle feature interactions, and ability to provide feature importance metrics. RF is particularly effective at reducing variance and improving generalisation for small datasets, while GBM sequentially corrects errors to improve predictive accuracy. Collectively, these five models balance interpretability, nonlinearity handling, and predictive robustness, making them well suited to capturing the intricate tribological behaviour of Al6061-Al2O3 composites.
2. Material, Fabrication, and Experiment Details
2.1. Matrix and Reinforcement Details
The Al-Mg-Si alloy, also known as the Al6XXX series, used as the matrix material in this study, was procured from the Mumbai-based firm Bharat Aerospace Metals Ltd. (Mumbai, India). It is a precipitation-hardened aluminium alloy containing its main alloying components, Si and Mg. Sigma-Aldrich Ltd., Bengaluru, India. provided the 50 µm Al2O3 reinforcing material. The nominal particle size of the as-received Al2O3 reinforcement was 50 μm, as specified by the supplier. The particle dimensions observed in the polished composite sections may differ from the nominal feedstock size because SEM provides a two-dimensional representation of particles intersected by the polished surface. Therefore, the SEM-observed particle dimensions are discussed as an apparent particle-size range rather than as the nominal size of the as-received powder. The Al6061 base matrix composition is displayed in Table 1.
Table 1.
Al6061 base matrix chemical constituents.
2.2. Production of Al6061-Al2O3 MMCs
Table 2 lists the characteristics of selected Al6061 matrices and the specified reinforcing Al2O3 particulates. During processing, the CTE difference between the matrix and reinforcement reduces the likelihood of particle dispersion [27]. Using a steel impeller, the molten alloy is mechanically stirred to create a vortex, and the preheated reinforcements are then added to form the composite, which is then solidified.
Table 2.
Characteristics of Al6061 and Al2O3.
The reinforcement particles and the molten matrix must interact chemically to guarantee proper dispersion and bonding. Lower processing temperatures decrease the tendency for bond formation between the reinforcement Al2O3 particles and the matrix Al6061 because the particles are less well wetted by the molten Al [28]. However, higher processing temperatures would hasten the interaction between the alloy matrix and Al2O3, leading to the formation of brittle compounds that might impair the MMCs’ ability to withstand wear, corrosion, and mechanical stresses. Excessive turbulence from higher stirring speeds may increase porosity and cause undesirable gas entrapment in the composite [29].
Utilising ultrasound technology in conjunction with the simple, affordable liquid metallurgy route stir-casting procedure, the Al6061-Al2O3 MMCs were created only after the reinforcement particles were thoroughly wetted by the molten matrix, allowing a sturdy bond to form between the alloy matrix and the particle reinforcement. Consequently, we carefully regulated the furnace temperature and stirrer speed during preparation. To prepare the mixed slurry, we heated the Al6061 alloy to 700 °C in a 250 mm diameter by 250 mm high graphite crucible. To aid degassing, we heated the furnace for 20 min to stabilise the temperature, then degassed using a hexachloroethane (C2Cl6) degassing tablet. Preheated Al2O3 particles were added to the molten alloy at 500 °C, and the mixture was stirred at 250 rpm with a steel-coated impeller. The Al2O3 particles were added and stirred in a pure argon gas atmosphere. After stirring and maintaining the molten composite, including the reinforcement, at 700 °C, a titanium sonic probe was submerged in the mixture and subjected to ultrasonic waves for 5 min. Dissolving larger Al2O3 clusters was the initial objective of this ultrasonic therapy. According to the literature, a 5 min treatment was expected to eliminate any remaining small agglomerates, degas the mixture, and refine the matrix alloy grain size [30,31,32]. The ultrasonic waveguide was linked to an ultrasonic converter with a 20 kHz resonance frequency and 1 kW power output to generate ultrasonic vibrations. A 200 × 200 × 25 mm steel mould heated to 200 °C to facilitate solidification was then carefully filled with the liquid composite. The resulting composites were Al6061-Al2O3 with 0, 2, 4, and 6 wt.% Al2O3.
2.3. Experiment Details
We prepared the test specimens by machining Al6061-Al2O3 metal matrix composites (MMCs) produced by the stir-casting procedure. We assessed the microstructural properties, density, hardness, tensile strength, corrosion resistance, and wear behaviour of these specimens. We used optical microscopy (OM) and scanning electron microscopy (SEM) to examine the microstructure. We etched the samples with Keller’s reagent and polished them with several grades of emery paper to achieve a superior surface finish for microscopy. A TESCAN MIRA SEM at 1000x and 2000× magnification was used to perform further microstructural analysis after microstructural images were taken using a NIKON OM (Model: 150 ECLIPSE, sourced from Tokyo, Japan). X-ray diffraction (XRD) was performed using a Bruker diffractometer (New Delhi, India) over a 2θ range of 20° to 100° at a scan rate of 0.01°/s.
Using the law of mixtures, the theoretical density of the composites was computed and compared with the actual densities derived from the weight-to-volume ratio for different Al6061-Al2O3 ratios. MRB 250 equipment (S. R., Medak, India) was used to perform Brinell hardness testing in accordance with ASTM E10-07a.
Using a fully automated DUCOM TR-20M sourced from Bengaluru, India, pin-on-disc apparatus, dry sliding wear tests were performed in accordance with ASTM G99-95a. We fabricated cylindrical wear specimens from Al6061 alloy and its Al2O3-reinforced composites, measuring 8 mm in diameter and 30 mm in height. We used polished EN31 steel counter discs (60 HRC) with an average surface roughness of around 0.1 µm Ra for wear testing. To ensure consistent contact conditions, we meticulously polished the specimen’s sliding end and the counter disc with abrasive paper and washed them with acetone before testing. We examined the effects of load and reinforcement content on wear behaviour under dry-sliding conditions, with the applied load varying from 10 to 50 N, a constant sliding speed of 0.5 m/s (500 rpm), and a sliding distance of 10,000 m. The wear height loss of the specimens was measured using the LVDT integrated with the DUCOM TR-20M pin-on-disc tribometer. For each experimental condition, five repeated measurements were obtained, and the average wear height loss (Δh) was used for subsequent calculation of wear volume and specific wear rate. To examine wear processes and surface deterioration, the post-test evaluation used SEM images of the worn surfaces. The pin diameter was measured in millimetres, and the corresponding radius was used to calculate wear volume. Sliding distance was expressed in metres to calculate the specific wear rate. The results showed that while Al2O3 reinforcement greatly improved wear resistance by reducing material degradation, abrasive wear, and material softening at higher temperatures, these effects were offset by greater wear loss under higher applied loads.
3. Results and Discussions
After fabricating the Al6061-Al2O3 composites, they were subjected to various density, porosity, hardness, and tribological tests, as well as the base Al6061 alloy. The results are tabulated, graphed, and discussed in detail with references in the subsequent sections.
3.1. SEM and XRD Analysis of Al6061-Al2O3 Composites
Using a TESCAN apparatus (Brno, Czech Republic; model: MIRA; magnifications: 1000× and 2000×), the manufactured samples were examined by SEM. Figure 1a–d shows that the Al6061 matrix contained Al2O3 particle reinforcement in all samples. The SEM scans showed that the ultrasonic-assisted stir-casting method achieved a relatively uniform distribution of Al2O3 reinforcement within the Al6061 matrix, although localised particle clustering and variations in particle size were evident in the examined regions. Based on the SEM micrograph, a slight amount of porosity was observed. However, because Al2O3 particles have a higher density (3.69 g/cm3) than Al (2.7 g/cm3), some clusters of Al2O3 particles were found. Ultrasonication throughout the manufacturing process resulted in a decent bond at the interface between the matrix and Al2O3 particles, with fewer agglomerations, as observed in the SEM images. The SEM micrographs indicate an apparent Al2O3 particle-size range of approximately 2.5–5 μm in the examined regions. The particles were, therefore, not homogeneous in size or spatial distribution. Particle size can be quantitatively determined from calibrated SEM micrographs using image analysis procedures by measuring a statistically representative number of particles. In the present study, the observed particle-size range describes the microstructural condition, while a complete statistical particle-size distribution was not independently established for each reinforcement concentration. The overall porosity in the samples was approximately 1.2–1.5%, reflecting the effectiveness of ultrasonic-assisted stir casting. Al dendrites solidify first, and the solid–liquid contact prevents them from doing so because Al2O3 fillers aggregate in the interdendritic region of MMCs during solidification [33]. Solute concentration is directly correlated with phase growth rate. Solute concentration increases as phase growth rate increases. Adding Al2O3 particles successfully refines the microstructure. Particle size and particle-size distribution can significantly influence the mechanical and tribological behaviour of particulate-reinforced metal matrix composites. The size of the reinforcement particles affects the particle–matrix interfacial area, load transfer, local constraint of plastic deformation, and the tendency for particle pull-out or fracture during sliding. A relatively fine and well-dispersed reinforcement can provide a larger effective interfacial area and more uniformly distributed barriers to dislocation movement, whereas larger particles and localised agglomerates may act as stress concentration sites and may increase the likelihood of particle fracture, debonding, or pull-out under severe sliding conditions. These effects can subsequently influence the formation and removal of wear debris and the development of the tribological contact surface [34]. The mechanical and tribological characteristics of Al6061-Al2O3 MMCs will improve. Another study reported similar results for homogeneous dispersion of reinforcement particulates in the Al6061 matrix, resulting in reduced porosity [35].
Figure 1.
(a–d). Al6061-Al2O3 composite SEM images.
The XRD trend of Al6061-Al2O3 composites with different amounts of reinforcement is shown in Figure 2. Using a Bruker X-ray diffractometer (Karlsruhe, Germany), the XRD data were obtained at a scan rate of 0.01°/s from 20° to 100° (2θ scan angle). The XRD pattern confirms the presence of the Al6061 matrix used in this work. All composites, including Al, Mg, Si, and Al2O3, exhibit characteristic XRD peaks that indicate the presence of the matrix and reinforcing phases (Figure 2). Al and Al2O3 have strong peaks in the XRD graph. All spectra show distinct peaks corresponding to Al (111, 200, 220) and Al2O3 (012, 104, 110) phases. Quantitative analysis of the diffraction peaks indicates that the Al2O3 peak intensity increased from 2 wt.% reinforcement to 6 wt.% reinforcement, confirming the higher incorporation of particles.
Figure 2.
Al6061-MMCs’ XRD.
Additionally, a slight peak shift (~0.1° toward higher 2θ) in Al (111) was observed with increasing Al2O3 content, suggesting lattice strain induced by particle incorporation. The reinforcing content in the matrix alloy confirms the successful creation of the Al6061-Al2O3 composites. In the MMC with 2 weight per cent of reinforcement, the Al2O3 peak height was lower than with 6 weight per cent, and the intensity of the Al-Al2O3 peaks increased as the reinforcement weight percentage increased [36,37]. The XRD patterns of all Al6061-Al2O3 composites show no secondary phase formation or contaminants.
3.2. Density and Porosity of Al6061-Al2O3 Composites
The weight-to-volume ratio data for various Al6061-Al2O3 MMC compositions were compared with calculated MMC densities determined using the mixture rule. The relative density was determined empirically using the Archimedes method, and the law of mixtures was used to calculate the theoretical density and the porosity percentage. Figure 3 presents a conceptual and practical display of the densities under investigation. These numbers are averages from five iterations (trials). The figure shows that the mixing-rule density values are higher than the actual density values. Nonetheless, the two density measurements clearly show that the values increased with increasing Al2O3 content in the Al6061 alloys. The higher-density Al2O3 particles are mixed to achieve the higher density. Figure 3 further shows that the MMC density is higher than that of the bare alloy, consistent with Yang’s results [38]. Al6061’s porosity percentage, the Archimedes principle, and Al2O3 MMCs were examined. Figure 3 illustrates the change in % porosity with an increase in the matrix’s Al2O3 particle content. As the percentage of Al2O3 particles in Al6061 increases, it is clear from Figure 3 that the porosity values also increase. Gas entrapment during initial mixing, shrinkage during hardening, hydrogen evolution, air bubble incorporation into the semi-solid composite, and the formation of air pockets around the Al2O3 particles explain the porosity variations. Consequently, porosity increases with the weight percentage of Al2O3 reinforcement [39,40].
Figure 3.
Density (theoretical and measured) and porosity of Al6061-Al2O3-reinforced MMCs.
3.3. Hardness of Al6061-Al2O3 Composites
According to ASTM E 10-07a, hardness tests were performed, and the average of five measurements was obtained using an MRB 250 Brinell hardness-testing device equipped with a 10 mm diameter hardened steel ball indenter. We applied a load of 250 kgf with a dwell time of 15 s. Strength and wear resistance are directly influenced by hardness, making it a crucial material property. The prepared samples’ Brinell hardness number was ascertained for the Al6061 alloy and its stir-cast Al2O3-filled MMCs. We averaged five measurements from different locations to reduce particle-gathering effects at a single site.
Figure 4 displays the hardness test results. Comparison of the Al2O3-reinforced composites showed that the composite samples were harder than the base alloy. This increase in composite hardness is attributed to the tougher Al2O3 reinforcement in the Al6061 [41]. Because the hard ceramic particles and narrower gaps between them limit dislocation movement, the composite with 6 wt% Al2O3 reinforcement had the highest hardness [42]. Grain refinement, strong adhesion, and superior bonding between the matrix and Al2O3 reinforcement are the primary factors behind the increased hardness of the Al2O3-reinforced composite. The particle-size variation and local particle distribution may also contribute to the measured hardness response. Finer, more uniformly distributed reinforcement can increase the effective matrix–particle interfacial area and provide more uniform barriers to plastic deformation, whereas localised particle clusters may produce spatially heterogeneous deformation behaviour. Therefore, the hardness increase observed with increasing Al2O3 content should be interpreted primarily in terms of reinforcement fraction and strengthening mechanisms, with particle-size distribution acting as an associated microstructural factor [43,44].
Figure 4.
The hardness of Al6061-Al2O3-reinforced MMCs.
Additionally, Al2O3 particles introduce dislocations into the composites during chilling because of the mismatch in thermal expansion coefficients between the reinforcing material and the matrix [45]. Limited dislocation flow, due to particle opposition and dislocation interactions, strengthens the composite. A strong bond between the Al6061 matrix and Al2O3 particles improves hardness and also influences dislocation mobility. The hardness of Al6061-6 weight per cent of Al2O3-reinforced composites is found to rise by 33% in comparison with the basic alloy (Figure 4).
3.4. Tribological Studies of Al6061-Al2O3 Composites
Sliding wear tests were carried out in dry conditions on the composite samples using a fully automated device in accordance with ASTM G99-95a, utilising DUCOM TR-20M equipment. Cylindrical pin-shaped samples measuring 4 mm in radius and 3 cm in height were created using the Al6061 base alloy and its Al6061-Al2O3 MMCs for wear testing. The wear behaviour of the produced alloys and composites in dry-sliding conditions was evaluated with respect to several factors, including the amount of Al2O3 particle reinforcement, distance, time, and applied normal load. Before sliding wear testing, the contact end of the pin specimens and the EN31 disc (60 HRC) were carefully polished with abrasive paper. The test samples’ wear height loss was investigated under applied loads of 10 to 50 N, a 500 rpm counter-disc rotation, and a 0.5 m/s pin sliding speed over 10,000 m. The applied normal load, sliding distance, and percentage of reinforcing particles determine wear loss. As a result, the sliding distance and sliding velocity remain constant while only the load is altered [46,47]. To minimise measurement error and ensure repeatability, we used Al6061 and its composite samples and averaged five samples per test for wear measurements.
The samples’ wear height loss was calculated from the electronic output for different applied normal loads, wt.% of Al2O3 particles, and other LVDT output responses.
The wear response was evaluated from the wear height loss recorded by the LVDT during the dry-sliding test. We obtained five repeated measurements for each experimental condition and used the average wear height loss (Δh) for subsequent calculations. The wear volume (V) was calculated from the cylindrical geometry of the pin according to Equation (1):
where V is the wear volume (mm3), r is the pin radius (mm), and Δh is the LVDT-measured wear height loss (mm). The specific wear rate is then calculated using Equation (2):
where Ks is the specific wear rate [mm3/(N·m)], F is the applied normal load (N), and L is the sliding distance (m). The specific wear rate Ks is the response variable predicted by all five ML models. Wear height loss is treated as the experimentally measured quantity, while wear volume and specific wear rate are derived quantities.
V = πr2Δh
The surface roughness was maintained at 0.1 µm Ra on the average test sample and its counter disc. At a load of 10–50 N, Figure 5a–d show the alloy and its MMCs wear height loss over a sliding distance of 10,000 m. From the observation, it is noted that the wear height loss of MMCs increases with long-distance sliding due to abrasion between the sliding contact surfaces; consequently, the material of the pin softens at greater distances due to a higher temperature rise [48], and more wear loss occurs at the contact point due to heavy deformation. The increased hardness of Al2O3-reinforced composites improved resistance to wear and seizure, reducing wear loss by up to 6%.
Figure 5.
(a–d). Wear height loss of MMCs with a sliding distance of 10,000 m at an applied load of 10 to 50 N and sliding velocity of 0.5 m/s.
The graph demonstrates that load is the key factor affecting it the most. Higher frictional forces lead to increased wear and higher temperatures as the load increases. Increased dry-sliding distance led to higher frictional forces and higher temperatures in the Al6061-Al2O3 MMCs. As a result of sliding, the MMC wear height loss increases, making the Al6061 alloy and its MMCs softer at elevated temperatures than at room temperature. At a 10 N load, Figure 5a–d show that pin height loss decreased gradually as the extent of Al2O3 reinforcement in the matrix increased, an effect attributed to the increased hardness of Al6061-Al2O3 MMCs, as previously investigated. Figure 5 shows that the Al6061-Al2O3 composites had a significantly lower height loss of the pin from dry sliding than the Al6061 base composite, and that this loss decreased as the composite’s Al2O3 filler % increased. This was true for each sliding distance examined. The higher hardness of Al6061-Al2O3 MMCs explains this. MMCs are more resistant to wear and seizure as their hardness rises [49].
The wear rate varies with applied stress according to Archard’s law; however, this effect is notably minimal in composites [50]. Additionally, wear loss is consistently greater for the matrix and MMCs at higher loads. For all loads considered, however, the resistance provided by the composites is greater than that of the matrix. Research shows that higher stress increases delamination, which, in turn, increases matrix height loss in Al6061 and its Al2O3 composites [51]. Scientists have linked increased hardness to a reduced wear rate. The Al6061 alloy had a lower wear resistance than the produced composite, but the latter was still up to 40% more resistant. Increasing the content of reinforced Al2O3 particles improves wear resistance. The particle-size characteristics should also be considered when interpreting the observed wear behaviour. The SEM observations indicate that the reinforcement is not completely homogeneous in size and spatial distribution, and localised particle clusters are present. Particle size can influence the reinforcement’s ability to carry load and resist plastic deformation during sliding. Smaller and more uniformly distributed particles can provide a larger effective particle–matrix interfacial area and more distributed resistance to matrix deformation, whereas larger particles or agglomerated regions may become preferential sites for particle matrix debonding, particle fracture, or pull-out under high contact stresses. Detached particles can then act as third-body abrasives and alter the wear mechanism. Thus, the particle-size distribution may contribute to the differences observed in wear loss among the composites. Nevertheless, because particle size was not independently varied in the present experimental design, its individual contribution cannot be quantitatively separated from the effects of reinforcement content, hardness, load, and sliding distance.
The test results revealed a clear difference in wear performance between the unreinforced Al6061 alloy and its Al2O3-reinforced composites under identical conditions. The base alloy showed higher wear loss, indicating lower wear resistance. In contrast, the reinforced composites exhibited up to a 40% improvement in wear resistance. This enhancement was more pronounced with increased Al2O3 content, as the hard ceramic particles effectively reduced material removal during sliding. The improved performance is attributed to higher surface hardness, better load distribution, and the development of a protective tribo-layer. These findings confirm the effectiveness of Al2O3 reinforcement in enhancing the durability of Al6061 composites for wear-critical applications.
3.5. SEM of Worn-Out Surfaces of Al6061-Al2O3 MMCs
The Al6061-Al2O3 MMCs’ worn-out surface morphologies are depicted in Figure 6a–d under a 50 N applied load. SEM micrographs of the worn surfaces revealed grooves indicative of abrasive wear.
Figure 6.
(a–d). Worn-out surfaces of the Al6061 alloy and its Al2O3 composites at 50 N.
The SEM micrographs reveal pronounced abrasion grooves and extensive material removal, indicating that abrasive wear is the dominant mechanism. The Al6061 matrix (Figure 6a) exhibits deep ploughing grooves, localised plastic deformation, and signs of material softening due to the high temperature generated during sliding. These conditions promote wear debris formation, oxide layer development, and significant surface distortion. In contrast, the composites reinforced with Al2O3 particles exhibit characteristic sliding wear features, including parallel ridges, finer, shallower grooves, and smoother wear tracks (Figure 6b–d). The hard ceramic particles limit excessive material removal and stabilise the worn surface, reducing groove depth and minimising surface roughness for the 6 wt.%. In the Al2O3 MMC (Figure 6d), the grooves are closely spaced due to the combined effects of harder particles and sliding debris, which limit further plastic deformation. Overall, incorporating Al2O3 increases the composite’s hardness, reduces severe wear, and promotes uniform material removal in the sliding direction, thereby improving the wear resistance of the Al6061 matrix under high-load conditions.
Abrasive wear is characterised by parallel grooves and ploughing marks aligned with the sliding direction, driven by the applied normal load and excessive wear. Hard asperities and detached wear debris form these grooves during sliding. The unreinforced Al6061 alloy shows deep grooves, significant plastic deformation, and extensive delamination on the worn surface. These features indicate subsurface crack propagation, delamination, and increased material removal. When reinforced with hard Al2O3 particles, the composite shows shallower grooves and less plastic deformation than the base alloy. Al2O3 particles increase the composite’s hardness and load-bearing capacity, reducing severe wear. Dispersed particles and wear debris may act as third-body abrasives during sliding, leading to micro-cutting and ploughing of the worn surface. Strong interfacial bonding between the aluminium matrix and Al2O3 reinforcement limits particle pull-out and mitigates wear damage. Adding Al2O3 particles increases the composite’s hardness and stabilises the contact surfaces. Consequently, reinforced composites predominantly exhibit mild abrasive wear rather than the delamination observed in the base alloy. The particle-size distribution may additionally influence the morphology of the worn surfaces. Regions with relatively well-dispersed Al2O3 particles can provide localised resistance to plastic flow and reduce the depth of ploughing grooves, whereas clustered or larger particles may experience higher local stresses and be susceptible to debonding or pull-out. Such detached particles can act as third-body abrasives and contribute to micro-cutting and ploughing of the aluminium matrix. Therefore, the finer grooves and reduced surface damage observed in the reinforced composites should be interpreted in conjunction with the observed particle distribution rather than being attributed exclusively to the increase in hardness [52].
Abrasion grooves and heavy-wear areas are evident. Because of the Al2O3 particles, the composites exhibit typical sliding-wear features, such as parallel ridges and finer, shallower grooves (Figure 6d), whereas the worn Al6061 surface shows a few massive grooves and ploughing (Figure 6a). At 50 N, the high temperature softens the pin material. This promotes debris, oxide layer formation, and deformation, resulting in significant plastic distortion and grooves on the worn Al6061 surface. Moving the Al2O3 filler to either side of the groove requires minimal material removal. The wear tracks are smooth due to the composite’s greater hardness. The MMCs with 6 weight per cent Al2O3 filler (Figure 6d) have closely spaced grooves, resulting from tougher particles and debris moving past one another.
3.6. Procedure for Prediction of Specific Wear Rate Using Machine Learning Models
- Objective Definition
To forecast the wear rate of Al6061 metal matrix composites (MMCs) reinforced with Al2O3 particles, this work aims to develop precise, broadly applicable machine learning (ML) models. Low error margins (RMSE; MAE), a high coefficient of determination (R2), and consistent predictions across operating conditions are key performance indicators (KPIs). This well-defined issue statement aims to facilitate improved material design and performance prediction under tribological stress [53]. The machine learning analysis predicted the experimentally calculated specific wear rate of the Al6061-Al2O3 composites. We obtained the specific wear rate from the LVDT-measured average wear height loss by first calculating the wear volume from the cylindrical pin geometry and then normalising it by the applied normal load and sliding distance. The ML models used Al2O3 reinforcement content (wt.%), applied normal load (N), and sliding distance (m) as predictor variables. The response variable was specific wear rate (Ks), expressed in mm3/(N·m). We kept the sliding velocity constant at 0.5 m/s throughout the experiments and, therefore, did not include it as an ML predictor.
- 2.
- Data Collection
Pin-on-disc tests compatible with ASTM G99-95a were used to collect wear data on a tribometer. We systematically varied the following operational parameters: normal load (N), sliding distance (m), and reinforcing content (Al2O3 weight per cent). For statistical validity, we obtained all results from multiple replications of controlled laboratory testing. Across a variety of test conditions, the dataset effectively captured both linear and nonlinear wear characteristics.
- 3.
- Data Preprocessing
For each experimental condition, five repeated LVDT measurements of wear height loss were obtained. The arithmetic mean of the five measurements was used as the representative wear height loss for that condition. This averaged value was converted to wear volume using Equation (1), and the specific wear rate was subsequently calculated using Equation (2). The resulting specific wear rate value constituted the target variable in the ML dataset. To reduce random experimental error, we calculated the average wear height loss after performing each test condition five times and then calculated the specific wear rate from these data for machine learning. Data cleaning involved removing abnormalities verified in the experimental notes and caused by dirt, disruptions, or irregular contact. To ensure comparability across gradient-based and distance-based machine learning models, such as KNN, SVR, and ANN, we standardised the features. We represented test conditions and their corresponding wear-loss output values as structured rows in the final dataset.
- 4.
- Model Selection
Based on their proven effectiveness in materials science, we selected five machine learning models: Random Forest (RF), K-Nearest Neighbours (KNN), Support Vector Regression (SVR), Artificial Neural Networks (ANNs), and Gradient Boosting Machine (GBM). These models range from simple to ensemble-based strategies and balance interpretability and performance. A literature review on their applicability to structured-data regression problems informed their selection.
- 5.
- Model Fitting and Training
We split the dataset into training (70%), validation (15%), and test (15%). We tuned models via hyperparameter optimisation and trained them with appropriate algorithms to achieve strong generalisation. The validation set helped prevent overfitting and fine-tune parameters.
- 6.
- Model Evaluation and Performance
On the test set, we evaluated the model’s performance using the RMSE, MAE, and R2. The RMSE showed predictive consistency, the MAE showed average prediction deviation, and the R2 explained variance. We used cross-validation to reduce bias and ensure generalisation. Only models that met performance standards advanced to final deployment.
- 7.
- Prediction
To forecast wear loss under novel or unknown conditions, we used the trained models. For interpretability, feature importance values showed how sliding distance, load, and reinforcement levels affected wear results. We used confidence intervals to support predictions and guide dependability.
- 8.
- Monitoring Performance and Maintenance
Tools like drift detection libraries will monitor the model’s performance. To ensure continued reliability, the models will be retrained regularly with fresh experimental data.
- 9.
- Feedback Loop
Domain experts and end users will improve the model’s parameters and structure. This iterative cycle facilitates ongoing enhancement and compliance with changing industry requirements [54].
Understanding the wear behaviour of Al6061 MMCs helps determine how input attributes and correlations affect machine learning models. This thorough knowledge helps build machine learning models that effectively predict wear performance across different operating conditions. Insights from wear behaviour data help improve machine learning model predictions of MMCs’ wear rates. Thus, our work used tribological experimentation to develop machine learning methods; Figure 7 presents a detailed flowchart. These figures show how well the model predicts the wear rate. The MAE assesses the mean error magnitude in model predictions, whereas the RMSE calculates the square root of the mean deviation between actual and predicted values. The mean squared error (MSE) measures the average squared difference between actual and predicted values. Lower values indicate more accurate forecasts. These three metrics measure the average difference between planned and actual wear rates. The R2 assesses how well the independent variables (features) explain variation in the dependent variable (wear rate). The R2 ranges from 0 to 1 and is commonly used to assess model performance; higher values indicate a better fit. This study uses the R2 as the main metric to assess and compare model performance. The fitted model is assessed on the test dataset using the MAE, RMSE, MSE, and R2.
Figure 7.
Flowchart of the procedure for wear prediction of Al6061-Al2O3 composites by ML algorithms.
3.6.1. K-Nearest Neighbours (KNN) Framework
A simple and straightforward technique, the K-Nearest Neighbours (KNN) algorithm, has become quite popular. Because the goal variable is included in the dataset, this is a supervised machine learning problem. It applies to both regression and classification problems. The number of neighbours to examine for class prediction or output value estimation is denoted by the letter K in the KNN algorithm. In classification, KNN assigns the most frequent neighbour’s category, whereas in regression, it uses the mean of its neighbours’ target values. KNN, thus, begins by determining the distance between the vector for which a prediction must be made and every other vector for which labels are provided to identify its neighbours. You can use Manhattan, Minkowski, Hamming, or Euclidean distance. The K-number of neighbours is chosen based on how closely they resemble the vector to be predicted. To prevent class ties, it is advisable to use K as an odd integer. The ideal number of neighbours is a difficulty with KNN. Several approaches determine the ideal number of neighbours. The ideal value of K was determined by the sum of squares (SSR). Once the K-nearest neighbours are determined, this method chooses the majority class among the K samples. Several benefits of using the KNN approach are presented. However, this approach has a few drawbacks. Because it calculates the distance between each query sample and every training sample, the KNN algorithm can be slow with large training data. This investigation’s best wear-rate prediction results were obtained with K values of 6 [54].
3.6.2. Support Vector Regression (SVR) Framework
SVR is a supervised learning technique used for regression. The SVR model uses only a portion of the training data, excluding data that fall within a specified range. SVR uses kernel selection and related parameters to address regression issues. This study used the radial basis function (RBF) as the kernel. One advantage of SVR is its ability to operate in high-dimensional spaces, which depends on the input space’s dimensionality. SVR maps input data to higher dimensions nonlinearly using a linear function, as defined by the SVR equation.
3.6.3. Artificial Neural Network (ANN) Framework
An ANN approach replicates the human brain to attain a specific task. These days, it is extensively used to solve various technical tasks. It is a powerful method for forecasting complex engineering data functions and relationships. ANNs include many nodes that mimic human neurons and are arranged in layers. Over 80% of research uses the multilayer backpropagation neural network, the most widely used type. These neural network types include an input layer, an output layer, and one or more hidden layers. Weighted connections link the nodes in each layer to every node in the layer above. Each node’s unique recollection weight is linked to the bias node, which outputs 1. Nodes in the output and hidden layers use an activation function to produce the output to the next layer and an integration function to aggregate data from the previous layer into a single value.
After a random selection process, supervised learning (training) modifies the connection strength (weight) values. Training involves forward and backward pathways. It calculates the difference between the net and real outputs along the forward channel. The backward path, meanwhile, propagates the error to update the weights to reduce errors in the net outputs. For multilayer backpropagation, an effective, efficient, and convergent training technique is the Levenberg–Marquardt learning algorithm.
As explained above, this investigation uses multilayer backpropagation. The input layer has a node for each wear rate effector: applied normal load, sliding distance, and Al2O3 weight (%). The output layer contains a node for the wear rate value. The network also has a single hidden layer. The input signal sum is used as an integrated function, and the Sigmoid function is employed as an activation function for the hidden nodes and output nodes. This ANN is trained using the Levenberg–Marquardt learning technique.
To determine the optimal number of hidden-layer nodes, training is conducted with several node counts (4, 6, 8, and 10). The correlation coefficient (R) and the mean squared error (MSE) between the net output and the actual specific wear rate are used to determine the optimal number of hidden-layer nodes. The standard backpropagation procedure employed training, validation, and test datasets, whereas the leave-one-out strategy used only training and validation sets. Each time, the second process rejected a new subset of the training data [55].
3.6.4. Random Forest (RF) Framework
Decision trees learn and grow using training examples. RF addresses both regression and classification issues. In regression problems, a random forest averages the predictions of all decision trees for the provided test data. The random forest can produce a final forecast. One useful statistical technique for reducing an estimate’s variance is repeated sampling. Repeated sampling reduces the chance of overfitting and the MSE of Random Forest prediction compared with a single decision tree. RF often outperforms most other ML algorithms in its final predictions because of its unique characteristics.
3.6.5. Gradient Boosting Machine (GBM) Framework
Multiple decision trees are combined using the ensemble approach to produce the GBM prediction model. Each decision tree optimises its own arbitrary differentiable loss function and runs on a different subset of the dataset. Each decision tree’s output is then aggregated to provide an effective forecast. GBM can correct past trees’ errors in subsequent trees, just as Random Forest does. The learning rate and the number of boosting stages (n_estimators), two closely related factors, determine GBM model complexity. Model performance is optimised by adjusting both parameters simultaneously.
3.7. Model Performance Evaluation
The input and output target parameters relate to the wear rate, as shown in Figure 8. The wear rate (output variable) is nonlinearly related to composition, applied normal load, and sliding speed. Because of their complex behaviour, the output data of nonlinear systems or functions cannot be readily ascertained from the input data. Several elements contribute to the wear behaviour of Al MMCs, as further verified. Machine learning concepts are better suited to forecasting relationships between multiple input and output features. RF performs best with the lowest MAE (46.56), MSE (3414.55), and RMSE (58.34). It has the highest R2 value (0.946), indicating strong predictive power. GBM and KNN also perform well, with low errors and high R2 values. SVR and ANN show higher MSE and RMSE, suggesting they are less successful at forecasting wear rate for this dataset. RF predicts wear rate best from the input parameters. The high R2 and low errors indicate it captures complex interactions well. Alternatives like KNN and GBR balance accuracy with computational efficiency [56].
Figure 8.
Pairwise relationships between different inputs and target outputs for wear rate prediction of Al6061-Al2O3 composites by ML algorithms.
To improve performance, SVR and ANNs may require feature engineering or hyperparameter tuning. SVRs may be used for both classification and regression. SVR models map structured data in higher-dimensional hyperplanes to predict output components. In higher-dimensional domains, these hyperplanes help SVR handle intricate nonlinear interactions in datasets. These variables are mapped onto hyperplanes using linear, multilayer perceptron, polynomial, sigmoid, radial basis function (RBF), and other kernel functions. A previous study showed that RBF outperforms other kernel functions. K-Nearest Neighbours is a simple method that classifies new cases based on similarity and preserves all examples. In this approach, “k” is the number of nearest data points examined while predicting a new point. Performance depends on choosing an appropriate k based on data type and problem complexity. Research on human neurons led to the development of Artificial Neural Networks. Advanced ANN models may solve complicated problems that statistical methods cannot. Similar data-processing methods allow the algorithm to be trained using the training dataset’s input–output pairs. Neurons change input and output variables for the next layer via transfer functions. Selecting the best hidden layer, neuron size, and transfer function improves the ANN model’s performance. As shown in Figure 8, pairwise relationship plots are commonly made using Seaborn plots (Python Seaborn v0.13.2). They show feature interactions and correlations between input characteristics and the target variable. The histograms in each diagonal subplot show the distributions of the feature and target variables. Feature 1 is discrete. Figure 9a–e present the cumulative frequency.
Figure 9.
(a–e) Accumulated frequency errors chart for wear rate prediction of Al6061-Al2O3 composites by ML algorithms.
The hyperparameters of the ML models used for wear rate prediction were carefully tuned to achieve optimal predictive performance. For KNN, the number of neighbours was set to six with the Euclidean distance metric and uniform weighting. SVR employed a radial basis function (RBF) kernel with C = 100 and ε = 0.1. The ANN had a single hidden layer with eight neurons and was trained using the Levenberg–Marquardt algorithm for 200 epochs with a Sigmoid activation function. Random Forest used 100 trees with a maximum depth of 10, while GBM used a learning rate of 0.05, 150 boosting stages, and a maximum tree depth of three. For model evaluation, the ANN used a 70:15:15 train–validation–test split, with a random seed of 42 to ensure reproducibility. These hyperparameters and validation strategies ensured robust, accurate wear rate predictions while capturing the nonlinear relationships among MMC composition, applied load, sliding distance, and hardness.
3.8. Machine Learning Models for Specific Wear Rate Prediction
The wear rate of Al6061-Al2O3 composites was predicted using five supervised machine learning (ML) models: K-Nearest Neighbours (KNN), Support Vector Regression (SVR), an Artificial Neural Network (ANN), Random Forest (RF), and Gradient Boosting Machine (GBM). These models were selected to capture potentially nonlinear relationships between Al2O3 reinforcement content (wt.%), applied normal load (N), and sliding distance (m), and the calculated specific wear rate (Ks).
3.8.1. K-Nearest Neighbours (KNN) Results
KNN is a simple yet effective supervised learning technique suitable for regression and classification. In regression, the predicted output is the mean of the K-nearest neighbours based on a distance metric. In this study, we chose K = 6 as the optimal number of neighbours, determined through iterative validation. We used the Euclidean distance metric and uniform weighting. KNN effectively captures local patterns in the data, resulting in good performance at moderate wear rates. Its main limitation is computational cost for large datasets, as distances must be calculated for all training points.
3.8.2. Support Vector Regression (SVR) Results
SVR is a robust regression technique that maps input data onto a high-dimensional feature space to handle nonlinear relationships. The radial basis function (RBF) kernel was employed to model the complex wear behaviour of Al6061-Al2O3 composites. The regularisation parameter C = 100 and ε = 0.1 balanced model complexity and error tolerance. SVR leverages support vectors to minimise the effect of outliers, but its performance depends heavily on kernel selection and hyperparameter tuning.
3.8.3. Artificial Neural Network (ANN) Results
ANNs simulate human neural networks to model complex nonlinear relationships. We used a single hidden-layer ANN with eight neurons, determined by optimising across trials with four, six, eight, and 10 neurons. The network used a Sigmoid activation function, and we trained it with the Levenberg–Marquardt learning algorithm for 200 epochs. The input nodes corresponded to MMC composition, applied load, sliding distance, and hardness, while the output node represented wear rate. The network was trained using a training–validation–test split, and performance was evaluated using correlation (R2) and mean squared error (MSE).
3.8.4. Random Forest (RF) Results
RF is an ensemble learning method that aggregates multiple decision trees to reduce variance and improve prediction accuracy. For regression, the final prediction averages the outputs of all trees. The RF model used 100 trees (n_estimators = 100), with a maximum depth of 10. RF outperformed other models on this dataset, achieving the highest R2 and lowest error metrics by capturing complex interactions among input features.
3.8.5. Gradient Boosting Machine (GBM) Results
GBM is another ensemble technique that sequentially trains decision trees, with each tree correcting errors from the previous ones. The model used a learning rate of 0.05, 150 boosting stages (n_estimators), and a maximum tree depth of three. GBM can achieve high predictive accuracy but is sensitive to the learning rate and prone to overfitting. We optimised hyperparameters to balance convergence and generalisation.
3.9. Model Training and Validation
The final dataset used for machine learning analysis consisted of 980 observations. The dataset comprised four Al2O3 reinforcement levels (0, 2, 4, and 6 wt.%), five applied normal loads (10, 20, 30, 40, and 50 N), and 49 sliding-distance observations for each reinforcement–load combination. This resulted in 20 unique composition–load conditions and 980 total observations. For each composition–load condition, the 49 sliding-distance levels were experimentally evaluated using separate specimens. Thus, observations for different sliding distances were not repeated on the same specimen or from a single continuous wear trajectory. For each experimental condition, five repeated measurements were obtained for wear height loss, and the average wear height loss was used to calculate the wear volume and specific wear rate. The calculated specific wear rate was used as the response variable in the ML dataset. To ensure observations corresponding to the same composition–load condition were not split across validation folds, the composition–load combination was used as the grouping variable. The 20 composition load groups were divided into five folds, with all 49 observations belonging to a particular group retained within the same fold. Grouped five-fold cross-validation was subsequently used for model development and evaluation. In each cross-validation iteration, four folds were used for model training, and the remaining fold was held out for evaluation. This process was repeated five times so that each fold served once as the held-out fold. Model-specific hyperparameters were selected using only the training data within each iteration, without using the corresponding held-out fold. The same grouped five-fold cross-validation framework was applied consistently to KNN, SVR, ANN, RF, and GBM. For models requiring feature scaling, scaling parameters were estimated using only the training portion of each fold and subsequently applied to the held-out fold. For models requiring feature scaling, we estimated scaling parameters using only the training portion of each fold and then applied them to the corresponding validation portion. This approach provides a robust performance estimate, particularly for small datasets. For the ANN, we also used a standard training–validation–test split to monitor convergence and avoid overfitting. We assessed model performance using the MAE, MSE, RMSE, and R2, along with visual analysis of predicted vs. actual wear rates. The applicability domain of the developed ML models is limited to the experimentally investigated parameter space, namely, Al2O3 reinforcement contents of 0–6 wt.%, applied normal loads of 10–50 N, the experimentally investigated sliding-distance levels, and a constant sliding velocity of 0.5 m/s. Because this study did not include independent experiments with previously unseen material compositions or operating conditions outside this range, the reported predictive performance represents interpolation within the established experimental domain. Extrapolation beyond these ranges was not experimentally validated.
3.10. Hyperparameter Summary
The optimised hyperparameters used in this study are summarised in Table 3:
Table 3.
Hyperparameters and parameter settings of the KNN, SVR, ANN, RF, and GBM models used for specific wear rate prediction.
3.11. Justification of Model Selection
RF showed the best predictive performance because it handles nonlinear feature interactions, while KNN provided strong local pattern recognition. ANN captured complex relationships but required careful tuning of the number of hidden neurons. SVR performed reasonably well with an RBF kernel but was less accurate than RF. GBM achieved moderate accuracy and could be improved with further tuning. We selected hyperparameters through iterative trials to balance predictive performance and model generalisation.
Features 2 and 3 have a more equal distribution, indicating continuous variables. A right-skewed distribution means most target variable values fall within a narrower range, with some larger outliers. Off-diagonal pairwise scatter plots show feature pairs and feature–target relationships. Feature 3’s strong linear correlation suggests it can predict the target well. A weak or fragmented association between Feature 2 and the target may reduce its predictive power. Feature 1 has categorical or ordinal values relative to the target. RF model enhancement may need encoding or binning. Feature 3’s linear association with the target makes it the most relevant predictor. For a categorical feature, you may need to encode it to improve RF performance. Feature 2 shows no apparent trend with the target, which may reduce forecast accuracy.
The model’s prediction accuracy and stability may be more accurately evaluated using the predicted vs. actual graphs in Figure 10a–e. We can see how well the model performs across different error ranges by looking at the bars in the graph. The KNN, SVR, ANN, and GBM models have narrower absolute error ranges and higher cumulative frequencies than the RF model, suggesting better prediction accuracy and stability.
Figure 10.
(a–e). Regression analysis diagram of model results for ML algorithms’ predictions of the wear rate of Al6061-Al2O3 composites.
Table 4 tabulates the wear rate prediction performance measures for the ML models. The R2 scores for test sets for several ML models range from 0.9232 to 0.946. The MSE and RMSE range from 3414.55 to 12,112.54 and 58.34 to 110.056, respectively, and are noticeably low. These statistical results indicate that the ML prediction models accurately predict the wear rate of aluminium alloys based on tribological and material factors. The RF model, a decision tree-based model, produced the highest R2 value and outperformed the other ML models, achieving 94.6% accuracy.
Table 4.
Effectiveness of the ML models for wear rate prediction.
Furthermore, this model’s MSE and RMSE values were noticeably low (3414.55 and 58.34, respectively). Figure 10d shows the regression analysis of the RF model’s predicted vs. actual wear rate. The actual experimental wear rate data showed significant variation. As shown in Figure 10d, the RF model adequately forecasted the wear rate and captured the data’s intrinsic variability. The ML models developed for this investigation accurately predicted wear rate based on several tribological and material factors.
KNN shows strong predictive performance for wear values up to 1000, with most points clustering close to the ideal fit line (Figure 10a). While some deviation appears near the lower wear values, most predictions remain well aligned, indicating good accuracy in this range. However, a few outliers below the ideal line suggest a slight tendency for under-prediction in certain samples. Overall, KNN provides reliable, consistent results, especially in the low-wear domain.
The SVM model fits reasonably well but shows noticeably more scatter than KNN. Within the 0–1000 wear range, predictions display greater variability, with points dispersed both above and below the ideal line (Figure 10b). This pattern reflects mixed over- and under-predictions, making SVM less consistent and potentially less dependable for precise wear estimation near the lower threshold.
ANN predictions are generally close to the ideal fit line but exhibit slightly higher dispersion (Figure 10c) than both KNN and RF. A noticeable cluster of under-predicted points is observed in the lower-wear range, suggesting a tendency toward conservative estimates in this region. Despite this, the ANN maintains reasonable accuracy, though with a less tight correlation than RF.
RF clearly outperforms other models in predicting wear values up to 1000, as shown in Figure 10d. The predicted points align very tightly with the ideal fit line, showing minimal deviation and strong correlation. This suggests that RF delivers the highest accuracy and consistency for low-wear predictions, making it the most robust and reliable model in this range.
GBM predictions align relatively well with the ideal fit line (Figure 10e) but show slightly more scatter than RF and KNN. While generally effective, the model shows some under- and over-predictions at low wear. This moderate variability indicates that GBM, although capable, is less precise than RF for wear prediction near 1000.
Residual plots, calculated as the difference between predicted and actual wear rates, reveal the distribution and magnitude of prediction errors across the dataset. Figure 11 shows the parity and residual plots comparing the predictive performance of five machine learning models (KNN, SVR, ANN, RF, and GBM) for wear rate prediction. In the parity plot, most predicted values are close to the 45° line, indicating good agreement between the experimental and predicted values. The Random Forest (RF) model aligns best with the ideal line across all values, with a high coefficient of determination (R2 = 0.946) and low error metrics (MAE = 46.56 and RMSE = 58.34) (Table 4). The KNN and GBM models also predict well, with only minor deviations from the ideal line. SVR and ANN have more dispersion, especially in the lower-value region, indicating higher prediction errors. The residual plot confirms these findings: the RF model produces residuals that are symmetrically distributed around zero and of smaller magnitude, indicating stable, unbiased predictions. The ANN and SVR exhibit wider residual distributions, especially at intermediate prediction values, suggesting greater prediction variability. The graphical analysis supports the quantitative results in Table 4 and shows that the Random Forest model predicts wear rate best among machine learning methods.
Figure 11.
Parity and residual plot comparison of KNN, SVR, ANN, RF, and GBM models for wear rate prediction.
For the RF model, residuals are tightly clustered around zero, indicating minimal systematic error and negligible bias. KNN also shows low residuals with slight under-prediction at lower wear values, whereas SVR and the ANN exhibit larger, more scattered residuals, reflecting moderate bias and reduced prediction consistency. GBM demonstrates generally small residuals, though minor over- and under-predictions are observed in specific ranges. Overall, residual and parity analyses confirm that RF provides the most accurate and unbiased predictions [57].
Among all models analysed for wear predictions up to 1000, Random Forest (RF) performs best, showing the tightest correlation and minimal deviation from the ideal fit line. KNN is a close second, with solid performance and generally reliable predictions, though it has a few under-prediction outliers. The ANN and GBM deliver moderate accuracy but with greater dispersion, and the ANN shows some consistent under-prediction in low wear. SVM lags exhibit the greatest scatter and mixed prediction bias, making them less reliable for precise low-range wear estimation.
In practice, for applications that require accurate, consistent wear predictions at the lower end, RF is the most dependable choice. KNN and ANNs can also be considered but may require caution due to occasional under-prediction. SVMs and GBMs’ higher variance might limit their utility in scenarios that require tight precision around low-wear values.
3.11.1. Significance and Benefit of Various Independent Variables
The ML models’ “feature importance” feature enables us to analyse the relative importance of independent variables in predicting the outcome. Features are rated on a scale of 0 to 1, with a total score of 1. A characteristic with a high score is considered very important for predicting the output.
Figure 10a–e present the pairwise interactions between various inputs and target outputs for aluminium MMC wear rate prediction. The composite composition, followed by applied normal load and sliding distance, determines the ranking of contribution scores in predicting wear rate. However, the composite’s hardness, which indirectly influences the composition, is the dominant factor in wear prediction, as shown in earlier sections and graphs. As the reinforcement content increases, the composite’s hardness increases.
Machine learning (ML) models can capture complex, nonlinear relationships among multiple input parameters that affect wear behaviour. Once trained, they enable rapid, cost-effective predictions and reduce the need for extensive experimentation. This capability is especially useful for optimising material design and processing conditions. ML provides valuable data-driven insights that traditional empirical models may miss.
3.11.2. Limitations of ML Models in Wear Prediction
The accuracy of ML models depends heavily on the quality and diversity of the training data, as poor or limited datasets can lead to overfitting and reduce prediction reliability in unseen conditions. Many ML models also act as “black boxes,” offering limited insight into the underlying physical processes, so predictions should be complemented with experimental validation and expert judgment. Given the relatively small experimental dataset in this study, overfitting is a potential concern, particularly with flexible models such as ANNs and GBMs. Overfitting occurs when a model captures noise or specific patterns in the training data that do not generalise to the test data. To mitigate potential overfitting, grouped five-fold cross-validation was applied consistently to KNN, SVR, the ANN, RF, and GBM. The composition–load condition was used as the grouping variable so that observations corresponding to the same composition–load condition remained within the same fold. Hyperparameters were selected using the training data within each cross-validation iteration, while the held-out fold was used exclusively for performance evaluation. We carefully tuned hyperparameters, including the number of hidden neurons, tree depth, and learning rate, to balance model complexity and generalisation. Residual and parity analyses further confirmed that RF provided the most robust predictions with minimal bias. In contrast, ANN and GBM exhibited slightly higher variance, consistent with potential overfitting in smaller datasets [58].
4. Conclusions
This study examined the physical, mechanical, wear, and ML model predictions of Al2O3 particulate-reinforced Al6061 matrix composites and presented the experimental findings. The conclusions can be summed up as follows:
- The Al2O3 particles reinforced in the Al6061 alloy were distributed quite uniformly, with minimal particle agglomeration, as observed in the composites’ OM, SEM, and EDX analyses. XRD tests verified that Al6061 and Al2O3 were present in the fabricated composite samples and that there was a solid interfacial bond between the particles and the Al6061 alloy. The rising Al2O3 concentration in the Al6061 matrix significantly increased the composite’s density and hardness. Although this study was limited to Al2O3 additions up to 6 wt.%, higher contents may reduce plasticity and increase brittleness, which warrants further investigation.
- The manufactured Al6061-6 weight percentage Al2O3 has higher wear resistance than the base material. Increasing the Al2O3 particle content improves wear resistance. SEM images of the worn-out surface show ploughed grooves, indicating abrasive-type wear in the Al6061-Al2O3 MMCs.
- The observed worn-surface features indicate that abrasion, delamination, adhesion, and plastic deformation may contribute to the wear behaviour under different combinations of applied load and sliding distance. The relative contribution of these mechanisms appears to vary with the severity of the sliding conditions; however, these mechanism assignments are interpreted as proposed mechanisms based on the available worn-surface characterisation rather than definitive transitions, since surface characterisation was not performed for every load–sliding distance combination and temperature was not directly measured.
- Five distinct machine learning algorithms were developed using tribological data to forecast wear rate and its dependence on tribological test factors and material. Performance research showed that the ML models accurately predict the wear behaviour of aluminium-based MMCs. The best model for wear rate prediction was RF (R2 = 0.946, MSE = 3414.55, and RMSE = 58.34). Under the dry-sliding conditions investigated, prolonged sliding was associated with increased variation in wear response and features consistent with progression from mild toward more severe wear behaviour. Therefore, in dry sliding, wear rate measurements of aluminium-based alloys show greater variation and more outliers than those of Al6061-Al2O3 MMCs. The dataset’s homogeneity significantly impacts performance metrics.
- Within the experimentally investigated parameter domain, the developed ML models provide a useful predictive framework for estimating specific wear rate and identifying the relative influence of the investigated material and operating parameters. Application of the models to compositions or operating conditions outside this domain requires additional experimental validation.
- The present ML models were developed and validated within the experimentally investigated domain. Although grouped five-fold cross-validation was used to reduce information leakage between related composition–load conditions, this study did not include independent out-of-domain experiments involving unseen reinforcement levels, loads, or sliding-distance ranges. Therefore, the reported prediction accuracy should be interpreted as evidence of interpolation within the established experimental domain rather than extrapolation to unknown conditions. Experimental validation outside the present parameter range is required before applying the models to new compositions or operating conditions.
- Elemental mapping of the worn surfaces was not performed; therefore, possible elemental redistribution, particle pull-out or localised oxidation could not be quantitatively assessed. Future work should incorporate SEM–EDX mapping of representative wear tracks to strengthen the mechanistic interpretation.
- The present study did not include a detailed analysis of how the coefficient of friction evolves with sliding time or distance; incorporating COF with wear measurements would provide additional insight into the tribological mechanisms in future studies.
- Future studies may incorporate additional tribological parameters such as the coefficient of friction and temperature to gain deeper insights into wear mechanisms. Including these factors can enhance the accuracy and robustness of machine learning predictions. Advanced ML techniques, such as hybrid or deep learning models, may also be explored to better capture complex wear behaviour.
Author Contributions
Conceptualisation, S.R.V.M. and V.K.G.B.; formal analysis, R.P., Z.A.A., V.K.G.B., P.R., S.K.M.E., S.K.S. and M.A.; methodology, S.R.V.M., P.R. and V.K.G.B.; writing—original draft, S.R.V.M.; writing—review and editing, R.P., Z.A.A., V.K.G.B., P.R., S.K.M.E., S.K.S. and M.A. All authors have read and agreed to the published version of the manuscript.
Funding
This research received no external funding.
Data Availability Statement
The original contributions presented in this study are included in this article. Further inquiries can be directed to the corresponding author.
Acknowledgments
The authors acknowledge the support and facilities provided by Universiti Teknikal Malaysia Melaka (UTeM), Hang Tuah Jaya, 76100 Durian Tunggal, Melaka, Malaysia, and NIT Andhra Pradesh, Tadepallegudem, for facilitating the experimental work associated with this research.
Conflicts of Interest
Author S R Viswanath Mantha was employed by the company Aqua Exchange Agritech Private Limited. The remaining authors declare that this research was conducted in the absence of any commercial or financial relationships that could be construed as a potential conflict of interest.
References
- Pooja, K.; Tarannum, N.; Chaudhary, P. Metal matrix composites: Revolutionary materials for shaping the future. Discov. Mater. 2025, 5, 35. [Google Scholar] [CrossRef] [Scilit]
- Siddartha, D.E.; Hemaraju; Patil, S.K.; Halundi, S. Tribological behaviour of metal matrix composites. Mater. Today Proc. 2022, 54, 441–443. [Google Scholar] [CrossRef] [Scilit]
- Pu, B.; Lin, X.; Li, B.; Chen, X.; He, C.; Zhao, N. Effect of SiC nanoparticles on the precipitation behavior and mechanical properties of 7075Al alloy. J. Mater. Sci. 2020, 55, 6145–6160. [Google Scholar] [CrossRef] [Scilit]
- Amouri, K.; Kazemi, S.; Momeni, A.; Kazazi, M. Microstructure and mechanical properties of Al nano/micro SiC composites produced by stir casting technique. Mater. Sci. Eng. A 2016, 674, 569–578. [Google Scholar] [CrossRef] [Scilit]
- Soundararajan, R.; Sivasankaran, S.; Babu, N.; Adhithya, G.P.R. Appraisal of tribological properties of A356 with 20% SiC composites under dry sliding condition. J. Braz. Soc. Mech. Sci. Eng. 2020, 42, 123. [Google Scholar] [CrossRef] [Scilit]
- Zhu, J.; Jiang, W.; Li, G.; Guan, F.; Yu, Y.; Fan, Z. Microstructure and mechanical properties of SiCnp/Al6082 aluminum matrix composites prepared by squeeze casting combined with stir casting. J. Mater. Process. Technol. 2020, 283, 116699. [Google Scholar] [CrossRef] [Scilit]
- Maji, P.; Ghosh, S.K.; Nath, R.K.; Karmakar, R. Microstructural, mechanical and wear characteristics of aluminum matrix composites fabricated by friction stir processing. J. Braz. Soc. Mech. Sci. Eng. 2020, 42, 185. [Google Scholar] [CrossRef] [Scilit]
- Premnath, A. Optimization of the Process Parameters on the Mechanical and Wear Properties of Al-SiC Nano-Composites Fabricated by Friction Stir Processing Using Desirability Approach. Silicon 2020, 12, 665–675. [Google Scholar] [CrossRef] [Scilit]
- Poovazhagan, L.; Kalaichelvan, K.; Rajadurai, A. Preparation of SiC Nano-particulates Reinforced Aluminum Matrix Nanocomposites by High Intensity Ultrasonic Cavitation Process. Trans. Indian Inst. Met. 2014, 67, 229–237. [Google Scholar] [CrossRef] [Scilit]
- Wu, S.S.; Yuan, D.; Lü, S.L.; Hu, K. Nano-SiCP particles distribution and mechanical properties of Al-matrix composites prepared by stir casting and ultrasonic treatment. China Foundry 2018, 15, 203–209. [Google Scholar] [CrossRef] [Scilit]
- Prasad Reddy, A.; Vamsi Krishna, P.; Rao, R.N. Tribological Behaviour of Al6061–2SiC-xGr Hybrid Metal Matrix Nanocomposites Fabricated through Ultrasonically Assisted Stir Casting Technique. Silicon 2019, 11, 2853–2871. [Google Scholar] [CrossRef] [Scilit]
- Idrisi, A.H.; Mourad, A.H.I. Conventional stir casting versus ultrasonic assisted stir casting process: Mechanical and physical characteristics of AMCs. J. Alloys Compd. 2019, 805, 502–508. [Google Scholar] [CrossRef] [Scilit]
- Li, Q.; Qiu, F.; Dong, B.X.; Geng, R.; Lv, M.M.; Zhao, Q.L.; Jiang, Q.C. Fabrication, microstructure refinement and strengthening mechanisms of nanosized SiCP/Al composites assisted ultrasonic vibration. Mater. Sci. Eng. A 2018, 735, 310–317. [Google Scholar] [CrossRef] [Scilit]
- Tavoosi, M.; Karimzadeh, F.; Enayati, M.H.; Heidarpour, A. Bulk Al–Zn/ Al2O3 nanocomposite prepared by reactive milling and hot pressing methods. J. Alloys Compd. 2009, 475, 198–201. [Google Scholar] [CrossRef] [Scilit]
- Yuan, D.; Yang, X.; Wu, S.; Lü, S.; Hu, K. Development of high strength and toughness nano SiCp/A356 composites with ultrasonic vibration and squeeze casting. J. Mater. Process. Technol. 2019, 269, 1–9. [Google Scholar] [CrossRef] [Scilit]
- Panwar, N.; Chauhan, A. Fabrication methods of particulate reinforced Aluminium metal matrix composite-A review. Mater. Today Proc. 2018, 5, 5933–5939. [Google Scholar] [CrossRef] [Scilit]
- Al-Salihi, H.A.; Mahmood, A.A.; Alalkawi, H.J. Mechanical and wear behavior of AA7075 aluminum matrix composites reinforced by Al2O3 nanoparticles. Nanocomposites 2019, 5, 67–73. [Google Scholar] [CrossRef] [Scilit]
- Kumar, N.; Gautam, G.; Gautam, R.K.; Mohan, A.; Mohan, S. Wear, friction and profilometer studies of insitu AA5052/ZrB2 composites. Tribol. Int. 2016, 97, 313–326. [Google Scholar] [CrossRef] [Scilit]
- Idusuyi, N.; Olayinka, J.I. Dry sliding wear characteristics of aluminium metal matrix composites: A brief overview. J. Mater. Res. Technol. 2019, 8, 3338–3346. [Google Scholar] [CrossRef] [Scilit]
- Schmidt, J.; Marques, M.R.G.; Botti, S.; Marques, M.A.L. Recent advances and applications of machine learning in solid-state materials science. npj Comput. Mater. 2019, 5, 83. [Google Scholar] [CrossRef] [Scilit]
- Argatov, I.I.; Chai, Y.S. An artificial neural network supported regression model for wear rate. Tribol. Int. 2019, 138, 211–214. [Google Scholar] [CrossRef] [Scilit]
- Mindivan, H.; Yazici, A.E.; Yuzgec, U. Wear maps of the Ti-6Al-4V alloy and a tribo-informatics approach for predicting its wear rate under dry sliding conditions using machine learning algorithms. Next Res. 2025, 2, 100710. [Google Scholar] [CrossRef] [Scilit]
- Hasan, M.S.; Kordijazi, A.; Rohatgi, P.K.; Nosonovsky, M. Triboinformatics approach for friction and wear prediction of Al-Graphite composites using machine learning methods. ASME J. Tribol. 2022, 144, 011701. [Google Scholar] [CrossRef] [Scilit]
- Altay, O.; Gurgenc, T.; Ulas, M.; Özel, C. Prediction of wear loss quantities of ferro-alloy coating using different machine learning algorithms. Friction 2020, 8, 107–114. [Google Scholar] [CrossRef] [Scilit]
- Gurgenc, T.; Altay, O.; Ulas, M.; Ozel, C. Extreme learning machine and support vector regression wear loss predictions for magnesium alloys coated using various spray coating methods. J. Appl. Phys. 2020, 127, 185103. [Google Scholar] [CrossRef] [Scilit]
- Wang, H.; Kumar, R.; Pattanaik, A.; Kumar, R.; Aljaberi, A.S.O.K.; Abass, M.A. Computational methods and artificial intelligence-based modeling of magnesium alloys: A systematic review of machine learning, deep learning, and data-driven design and optimization approaches. Front. Mater. 2025, 12, 1645227. [Google Scholar] [CrossRef] [Scilit]
- Manikandan, R.; Arjunan, T.V.; Akhil, A.R. Studies on microstructural characteristics, mechanical and tribological behaviours of boron carbide and cow dung ash reinforced aluminium (Al 7075) hybrid metal matrix composite. Compos. Part B Eng. 2020, 183, 107668. [Google Scholar] [CrossRef] [Scilit]
- Yang, Y.; Lan, J.; Li, X. Study on bulk Aluminium matrix nanocomposite fabricated by ultrasonic dispersion of nanosized SiC particles in molten Aluminium alloy. Mater. Sci. Eng. A 2004, 380, 378–383. [Google Scholar] [CrossRef] [Scilit]
- Bhowmik, A.; Sen, B.; Beemkumar, N.; Chohan, J.S.; Bains, P.S.; Singh, G.; Kumar, A.V.; Santhosh, A.J. Development and wear resistivity performance of SiC and TiB2 particles reinforced novel aluminium matrix composites. Results Eng. 2024, 24, 102981. [Google Scholar] [CrossRef] [Scilit]
- Su, H.; Gao, W.; Zhang, H.; Liu, H.; Lu, J.; Lu, Z. Optimization of Stirring Parameters Through Numerical Simulation for the Preparation of Aluminium Matrix Composite by Stir Casting Process. J. Manuf. Sci. Eng. 2010, 132, 061007. [Google Scholar] [CrossRef] [Scilit]
- Gao, Q.; Wu, S.; Lü, S.; Xiong, X.; Du, R.; An, P. Improvement of particles distribution of in-situ 5 vol% TiB2 particulates reinforced Al-4.5Cu alloy matrix composites with ultrasonic vibration treatment. J. Alloys Compd. 2017, 692, 1–9. [Google Scholar] [CrossRef] [Scilit]
- Jeyaprakasam, S.; Gnanasekaran, M.; Magibalan, S.; Singh, R.P.; Mohanavel, V.; Kannan, S.; Giri, J.; Ali, M.S.; Barmavatu, P. Tribological, mechanical and microstructure characteristics of hybrid aluminium matrix composite containing titanium carbide (TiC) and graphite particles. J. Mater. Res. Technol. 2024, 33, 5482–5489. [Google Scholar] [CrossRef] [Scilit]
- Özakın, B.; Gültekin, K.; Uğuz, G. Investigation of the Effect of Particle Size on Dispersion Stability and Viscosity in Kaolin Particles-Doped Bio-Based Palm Nanolubricants. Arab. J. Sci. Eng. 2025, 50, 4223–4241. [Google Scholar] [CrossRef] [Scilit]
- Dash, S.S.; Li, D.J.; Zeng, X.Q.; Chen, D.L. Heterogeneous microstructure and deformation behavior of an automotive grade aluminum alloy. J. Alloys Compd. 2021, 870, 159413. [Google Scholar] [CrossRef] [Scilit]
- Zhang, J.J.; Lu, D.M.; Yin, F.X.; Yu, H.; Ji, P.G.; Li, Y.F.; Wang, Q.Z. Microstructure and mechanical properties of high damping Zn-Al eutectoid alloy reinforced by in-situ formed Al2O3 and Al3Zr particles. Trans. Nonferrous Met. Soc. China 2025, 35, 1956–1974. [Google Scholar] [CrossRef] [Scilit]
- Kumar, G.B.V.; Pramod, R.; Venkatesh Chowdary, G.; Surya Vamsi, M.; Jayarami Reddy, K.; Nagaral, M.; Naresh, K. Effects of addition of Titanium Diboride and Graphite Particulate Reinforcements on Physical, Mechanical and Tribological properties of Al6061 Alloy based Hybrid Metal Matrix Composites. Adv. Mater. Process. Technol. 2022, 8, 2259–2276. [Google Scholar] [CrossRef] [Scilit]
- Singla, A.; Singh, Y. Nanosize Al2O3 reinforcement in Si-rich aluminum MMC for enhanced tribological performance in engine components. Proc. Inst. Mech. Eng. Part E J. Process Mech. Eng. 2024, 238, 180–191. [Google Scholar] [CrossRef] [Scilit]
- Reddy, M.P.; Shakoor, R.A.; Gururaja, S.; Huang, X.; Matin, A.; Zhou, Q.; Mohamed, A.M.A. Enhanced performance of nano-sized SiC reinforced Al metal matrix nanocomposites synthesized through microwave sintering and hot extrusion techniques. Prog. Nat. Sci. Mater. Int. 2017, 27, 606–614. [Google Scholar] [CrossRef] [Scilit]
- Yang, L.J. A test methodology for the determination of wear coefficient. Wear 2005, 259, 1453–1461. [Google Scholar] [CrossRef] [Scilit]
- Singh, P.; Mishra, R.K.; Singh, B.; Gupta, V. Mechanical and tribological properties of zinc-aluminium (ZA-27) metal matrix composites: A review. Adv. Mater. Process. Technol. 2025, 11, 73–91. [Google Scholar] [CrossRef] [Scilit]
- Veeresh Kumar, G.B.; Gopinath Reddy, D.; Vineeth Reddy, C.; Sriteja, C.; Pramod, R. Investigation of Mechanical and Tribological Properties of Al6061–TiB2 Metal Matrix Composites. Mater. Perform. Charact. 2020, 9, 139–150. [Google Scholar] [CrossRef] [Scilit]
- Paul, A.; Sreerag, M.; Jishnu, M.; Mohan, S. Mechanical, Tribological and Vibrational Analysis of Al6061-Based Composites Reinforced with Aluminum Oxide and Silicon Carbide. Trans. Indian Inst. Met. 2025, 78, 114. [Google Scholar] [CrossRef] [Scilit]
- Lei, Y.S.; Yan, H.; Wei, Z.F.; Xiong, J.J.; Zhang, P.X.; Wan, J.P.; Wang, Z.L. Effect of hot extrusion on microstructure and tribological behavior of Al2O3 reinforced 7075 aluminum-matrix composites. J. Cent. South Univ. 2021, 28, 2269–2284. [Google Scholar] [CrossRef] [Scilit]
- Viswanath, M.S.R.; Veeresh Kumar, G.B.; Pramod, R.; Rao, C.S.P. Mechanical, Tribological, and Corrosion Studies of Al2O3 Filled Al6061 MMCs with Strengthening Mechanisms. Adv. Eng. Mater. 2025, 27, e2500559. [Google Scholar] [CrossRef] [Scilit]
- Rajeesh, S.; Ravi, K.M.; Balasubramanya, H.S.; Veerachamy, R.K.; Louhichi, B.; Sahu, S.K.; Aman, M. Investigation of Thermal Conductivity Enhancement in Al6061 Alloy Through Controlled Titanium Incorporation: Microstructural Correlation and Thermal–Mechanical Synergy. Metals 2026, 16, 727. [Google Scholar] [CrossRef] [Scilit]
- Danappa, G.T.; Raghavendra, C.R.; Swamy, R.P.; Shivakumar, B.P.; Venkatesh, C. Dry sliding wear behaviour of Al7075/Gr/nano TiO2 MMC using RSM. Mater. Today Proc. 2020, 33, 4697–4703. [Google Scholar]
- Baradeswaran, A.; Elaya Perumal, A. Study on mechanical and wear properties of Al 7075/ Al2O3/graphite hybrid composites. Compos. Part B Eng. 2014, 56, 464–471. [Google Scholar] [CrossRef] [Scilit]
- Mantha, S.R.V.; Kumar, G.B.V.; Pramod, R.; Rao, C.S.P. Investigations on Microstructure, Mechanical, and Wear Properties, with Strengthening Mechanisms of Al6061-CuO Composites. J. Manuf. Mater. Process. 2024, 8, 245. [Google Scholar] [CrossRef] [Scilit]
- Praveen, K.B.; Anil, K.B. Strengthening of mechanical and tribological properties of Al-4.5%Cu matrix alloy with the addition of bamboo leaf ash. Results Phys. 2018, 10, 360–373. [Google Scholar] [CrossRef] [Scilit]
- Hamid, A.A.; Ghosh, P.K.; Jain, S.C.; Ray, S. The influence of porosity and particle content on cast in situ Al (Ti)– Al2O3 (TiO2) composite dry sliding wear. Wear 2008, 265, 14–26. [Google Scholar] [CrossRef] [Scilit]
- Tyagi, R. Synthesis and tribological characterization of in situ cast Al–TiC composites. Wear 2005, 259, 569–576. [Google Scholar] [CrossRef] [Scilit]
- Yang, L.J. Wear coefficient equation for aluminium-based matrix composites against steel disc. Wear 2003, 255, 879–892. [Google Scholar] [CrossRef] [Scilit]
- Basavarajappa, S.; Chandramohan, G.; Mukund, K.; Ashwin, M.; Prabu, M. Dry sliding wear behavior of Al 2219/SiCp-Gr hybrid metal matrix composites. J. Mater. Eng. Perform. 2006, 15, 668–674. [Google Scholar] [CrossRef] [Scilit]
- Raju, R.S.U.; Kottala, R.K.; Varma, B.M.; Krishna, P.; Barmavatu, P. Internet of Things and hybrid models-based interpretation systems for surface roughness estimation. Artif. Intell. Eng. Des. Anal. Manuf. 2024, 38, e11. [Google Scholar] [CrossRef] [Scilit]
- Zhu, C.; Jin, L.; Li, W.; Han, S.; Yan, J. The Prediction of Wear Depth Based on Machine Learning Algorithms. Lubricants 2024, 12, 34. [Google Scholar] [CrossRef] [Scilit]
- Siddeshkumar, N.G.; Manjula, H.M.; Balakrishnan, K.; Pramod, T.C.; Latha Shankar, B.; Khan, A.A.; Pruthvi, H.M.; Santosh Pawan, K.; Nandakumar, M.B.; Prabhu, S.R.; et al. Study on dry sliding wear behavior and machine learning models for wear rate prediction of nano hybrid 2219 MMCs reinforced with n-B4C & MoS2. Results Surf. Interfaces 2025, 20, 100623. [Google Scholar] [CrossRef] [Scilit]
- Veeresh Kumar, G.B.; Pramod, R.; Rao, C.S.P.; Gouda, P.S.S. Artificial Neural Network Prediction on Wear of Al6061 Alloy Metal Matrix Composites Reinforced with- Al2O3. Mater. Today Proc. 2018, 5, 11268–11276. [Google Scholar] [CrossRef] [Scilit]
- Kannaiyan, M.; Govindan, K.; Raghuvaran, J.G.T. Prediction of specific wear rate for LM25/ZrO2 composites using Levenberg–Marquardt backpropagation algorithm. J. Mater. Res. Technol. 2020, 9, 530–538. [Google Scholar] [CrossRef] [Scilit]
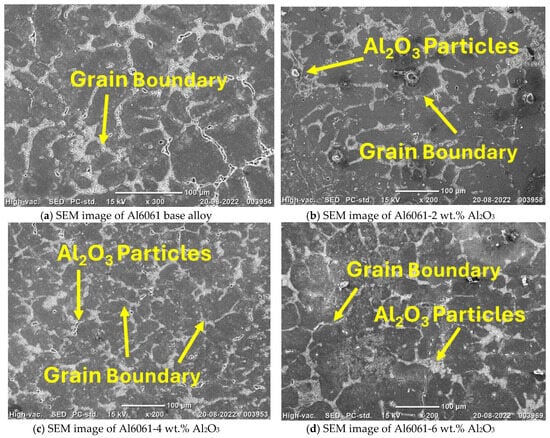
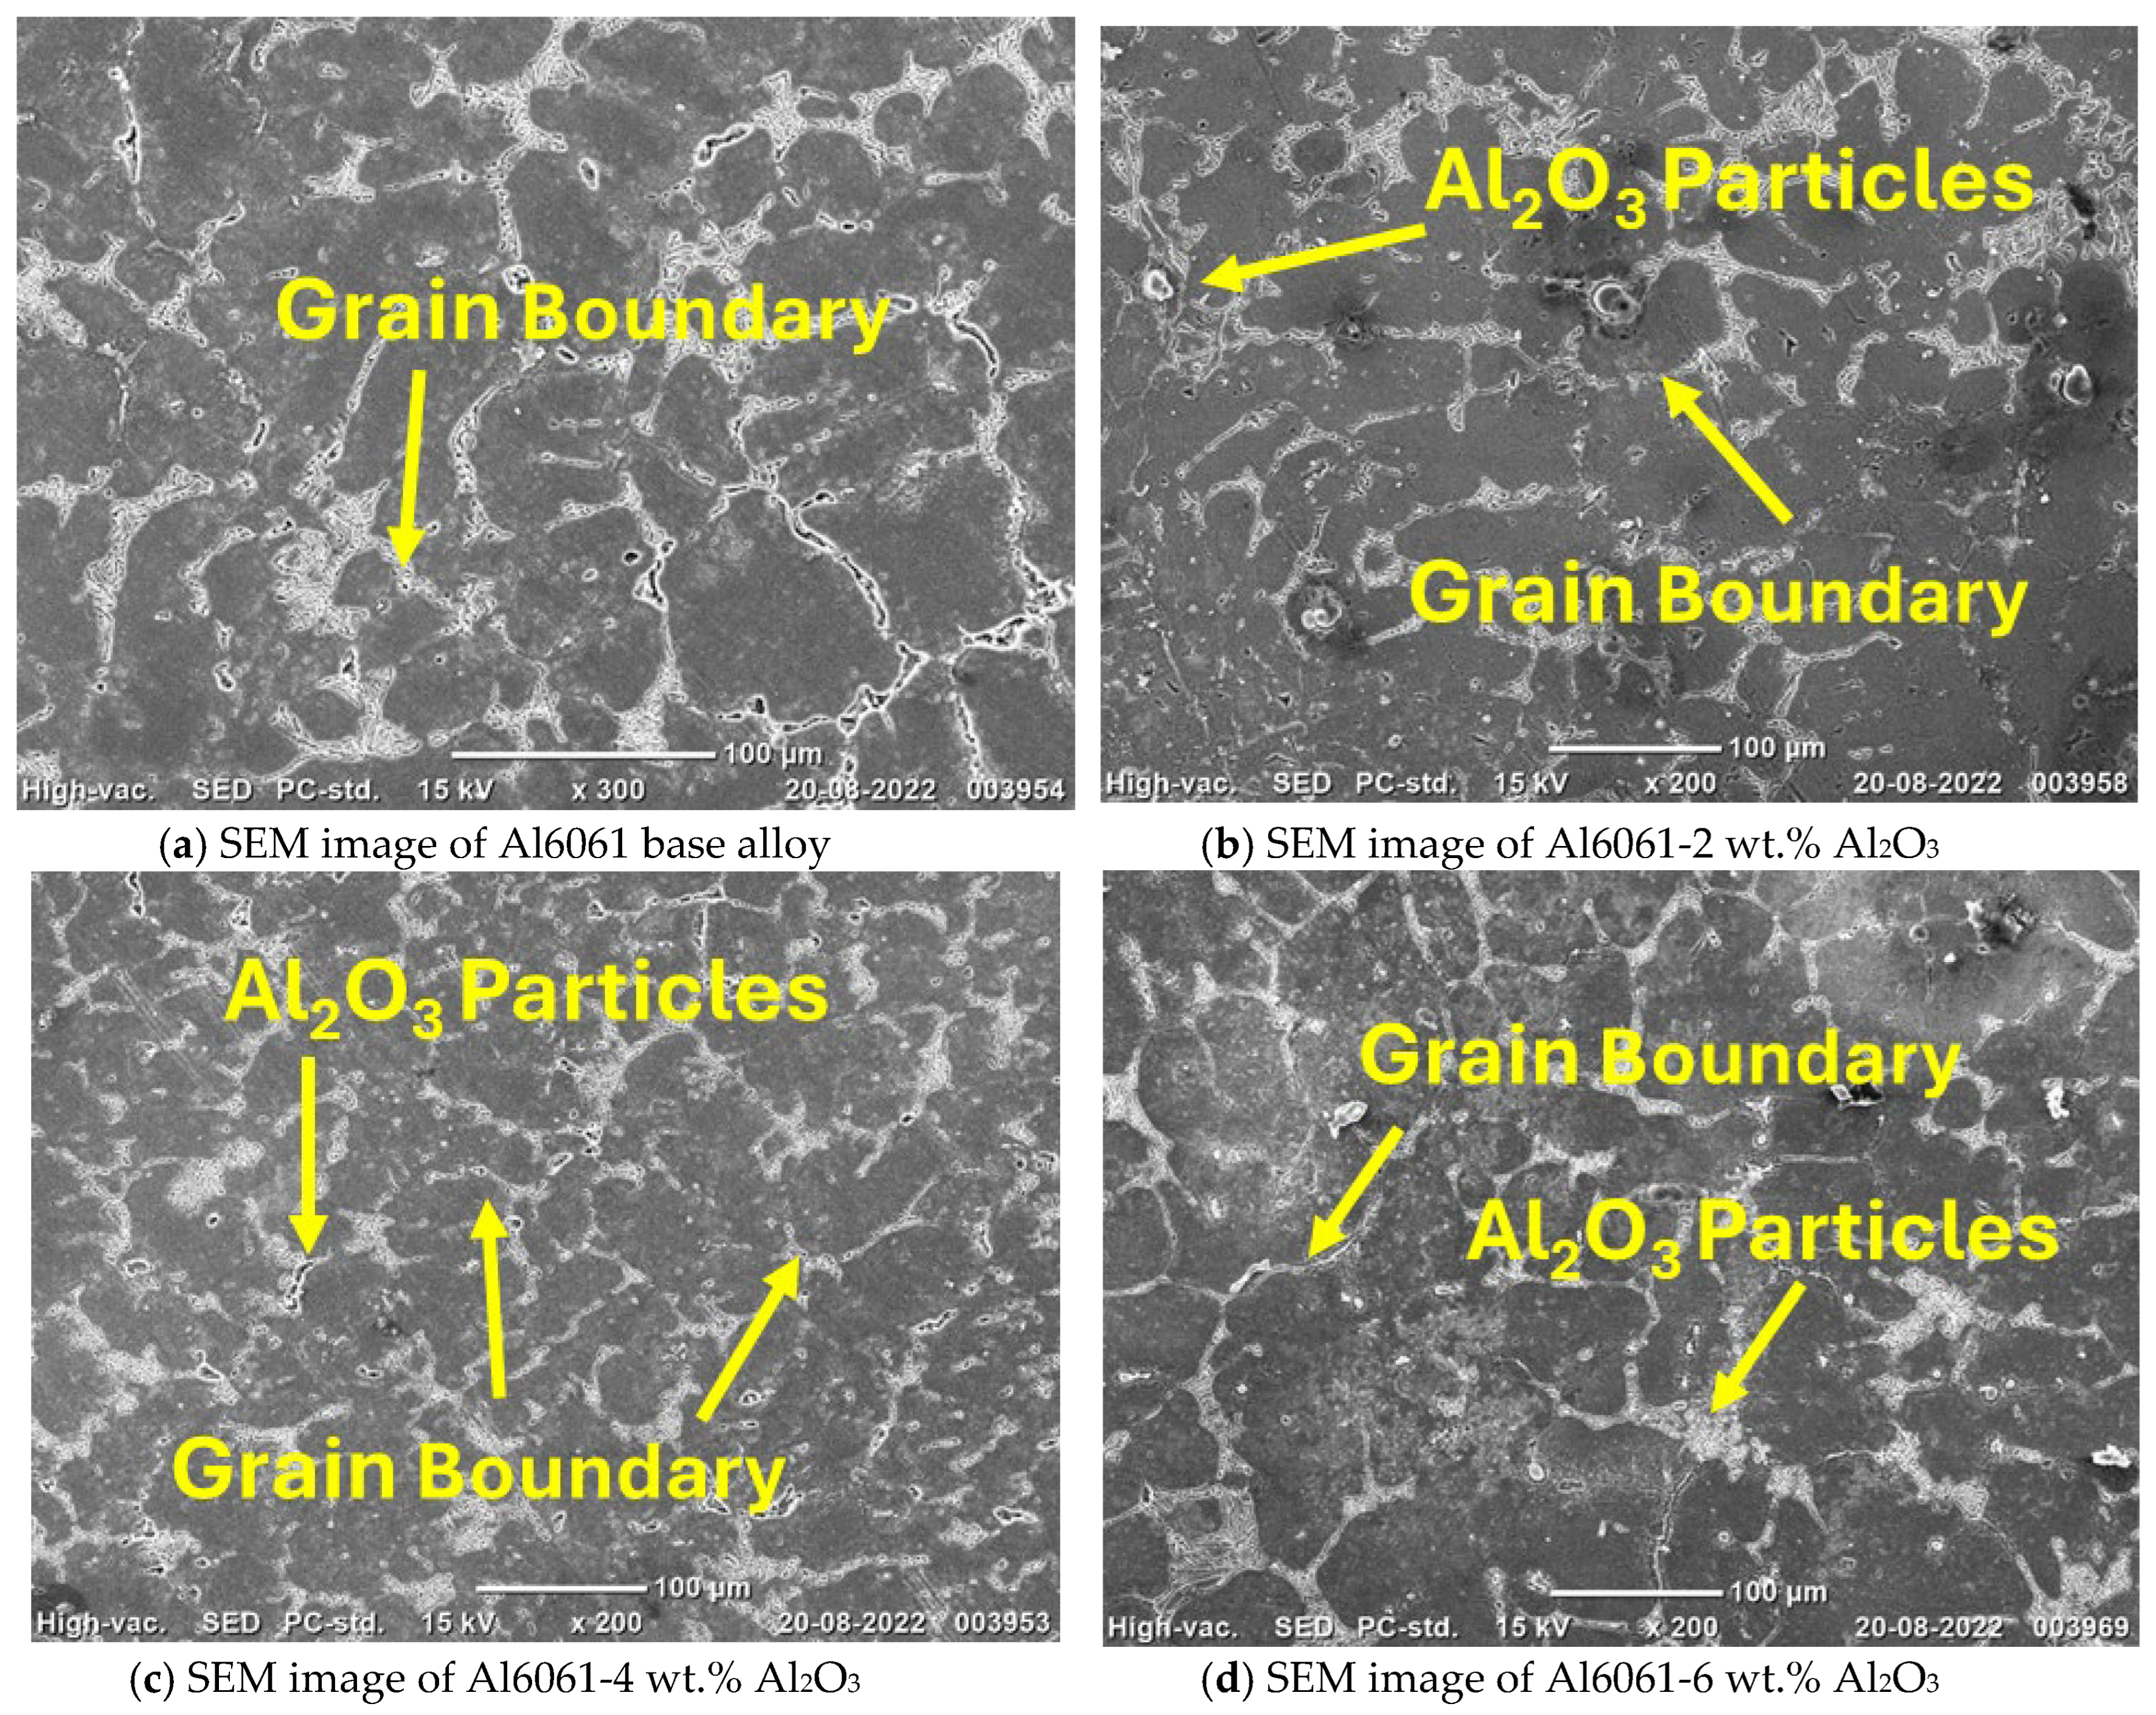
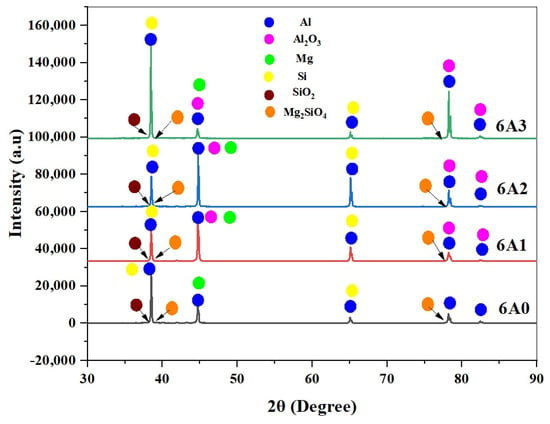
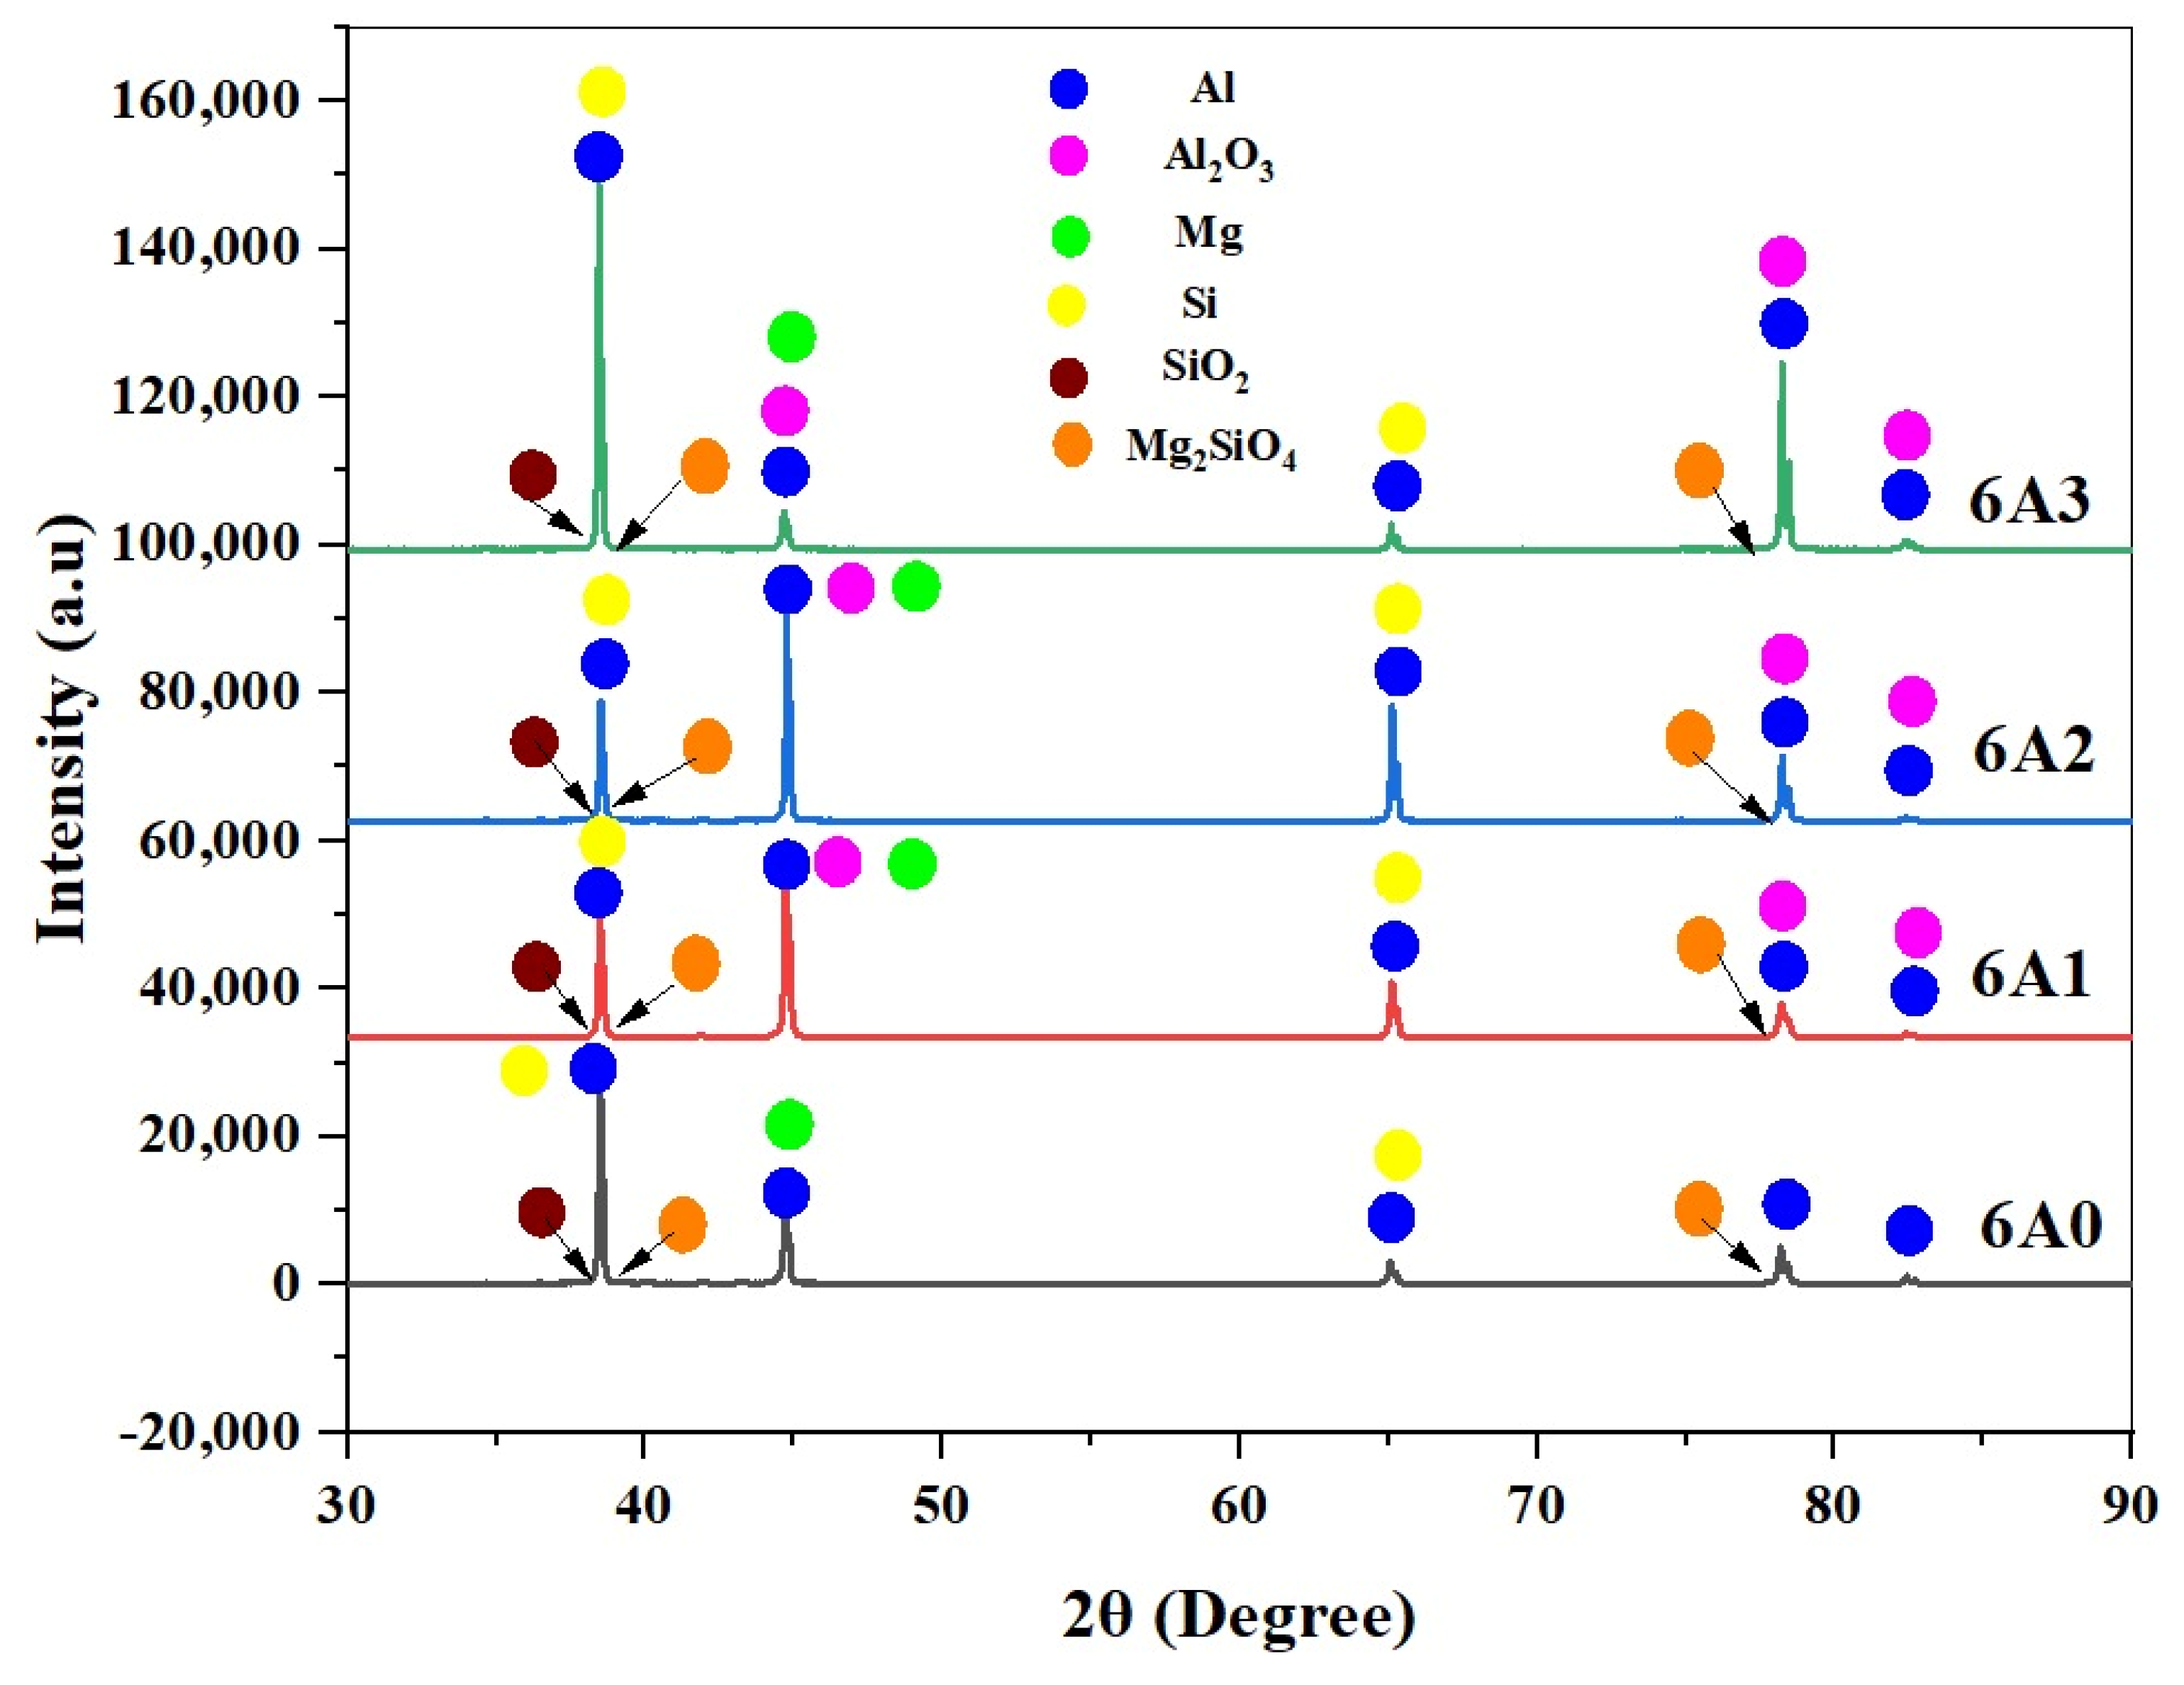
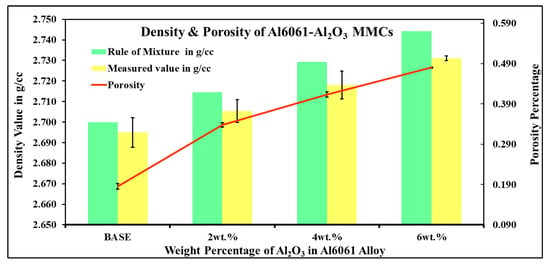
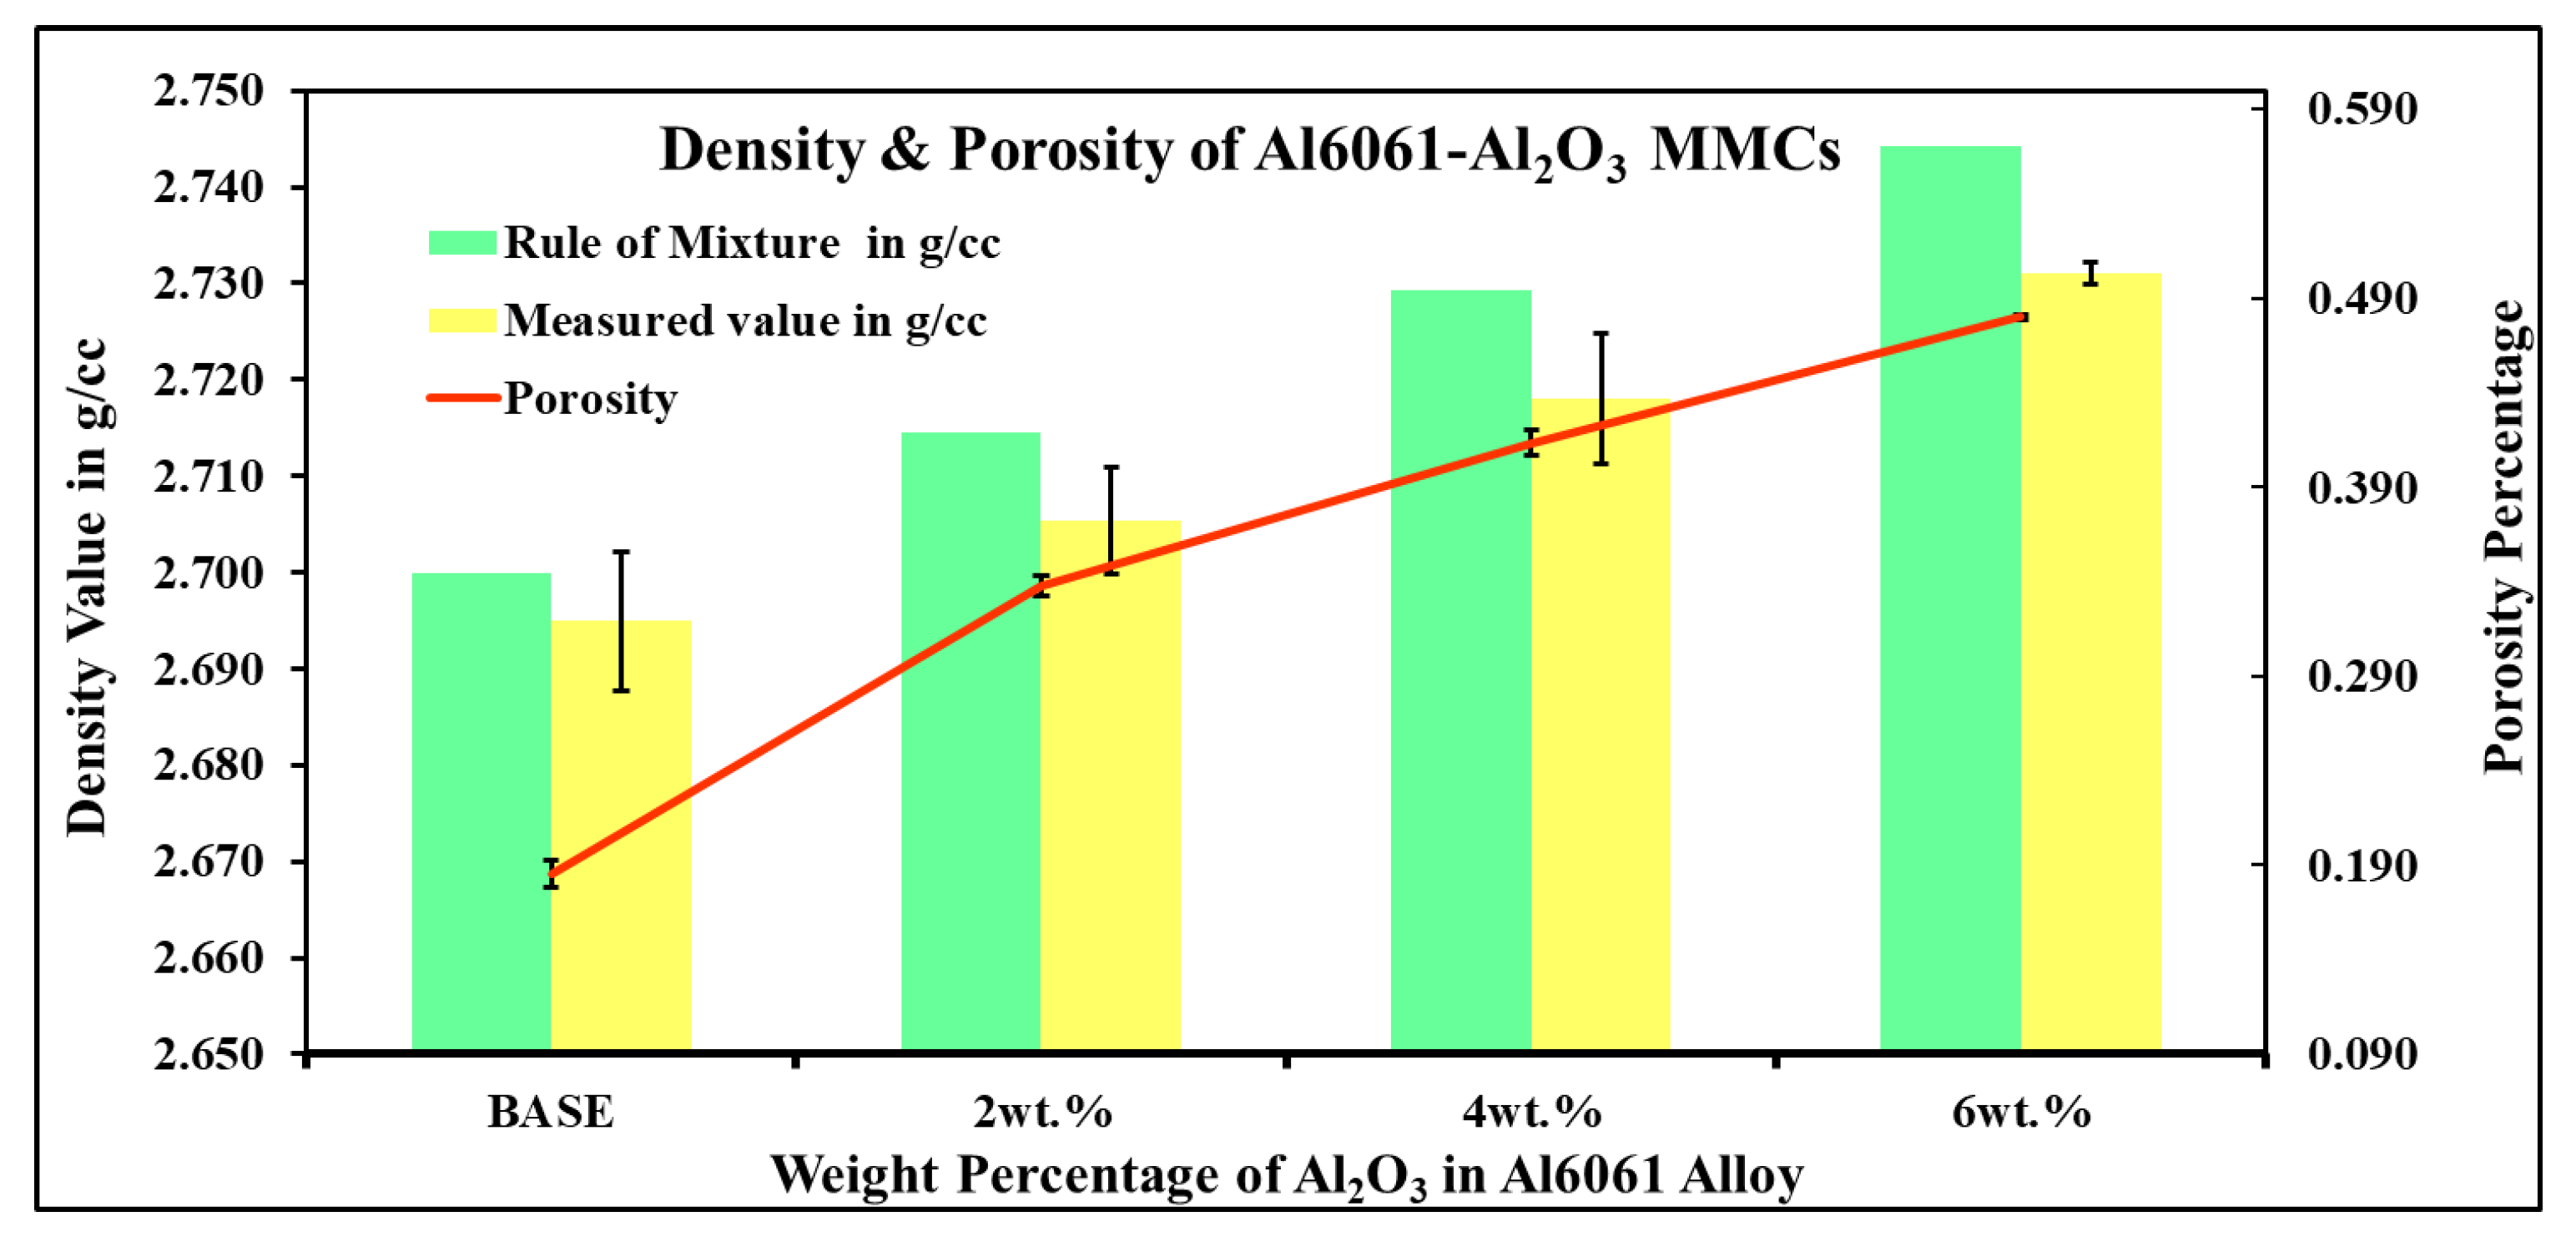
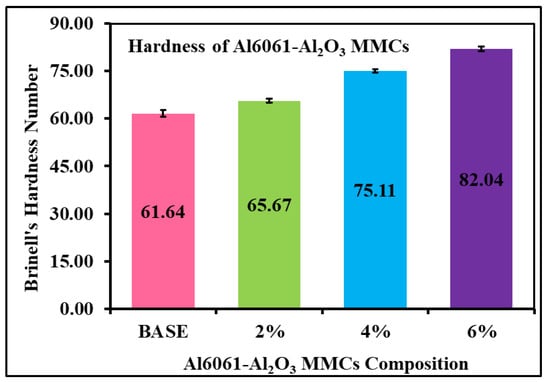
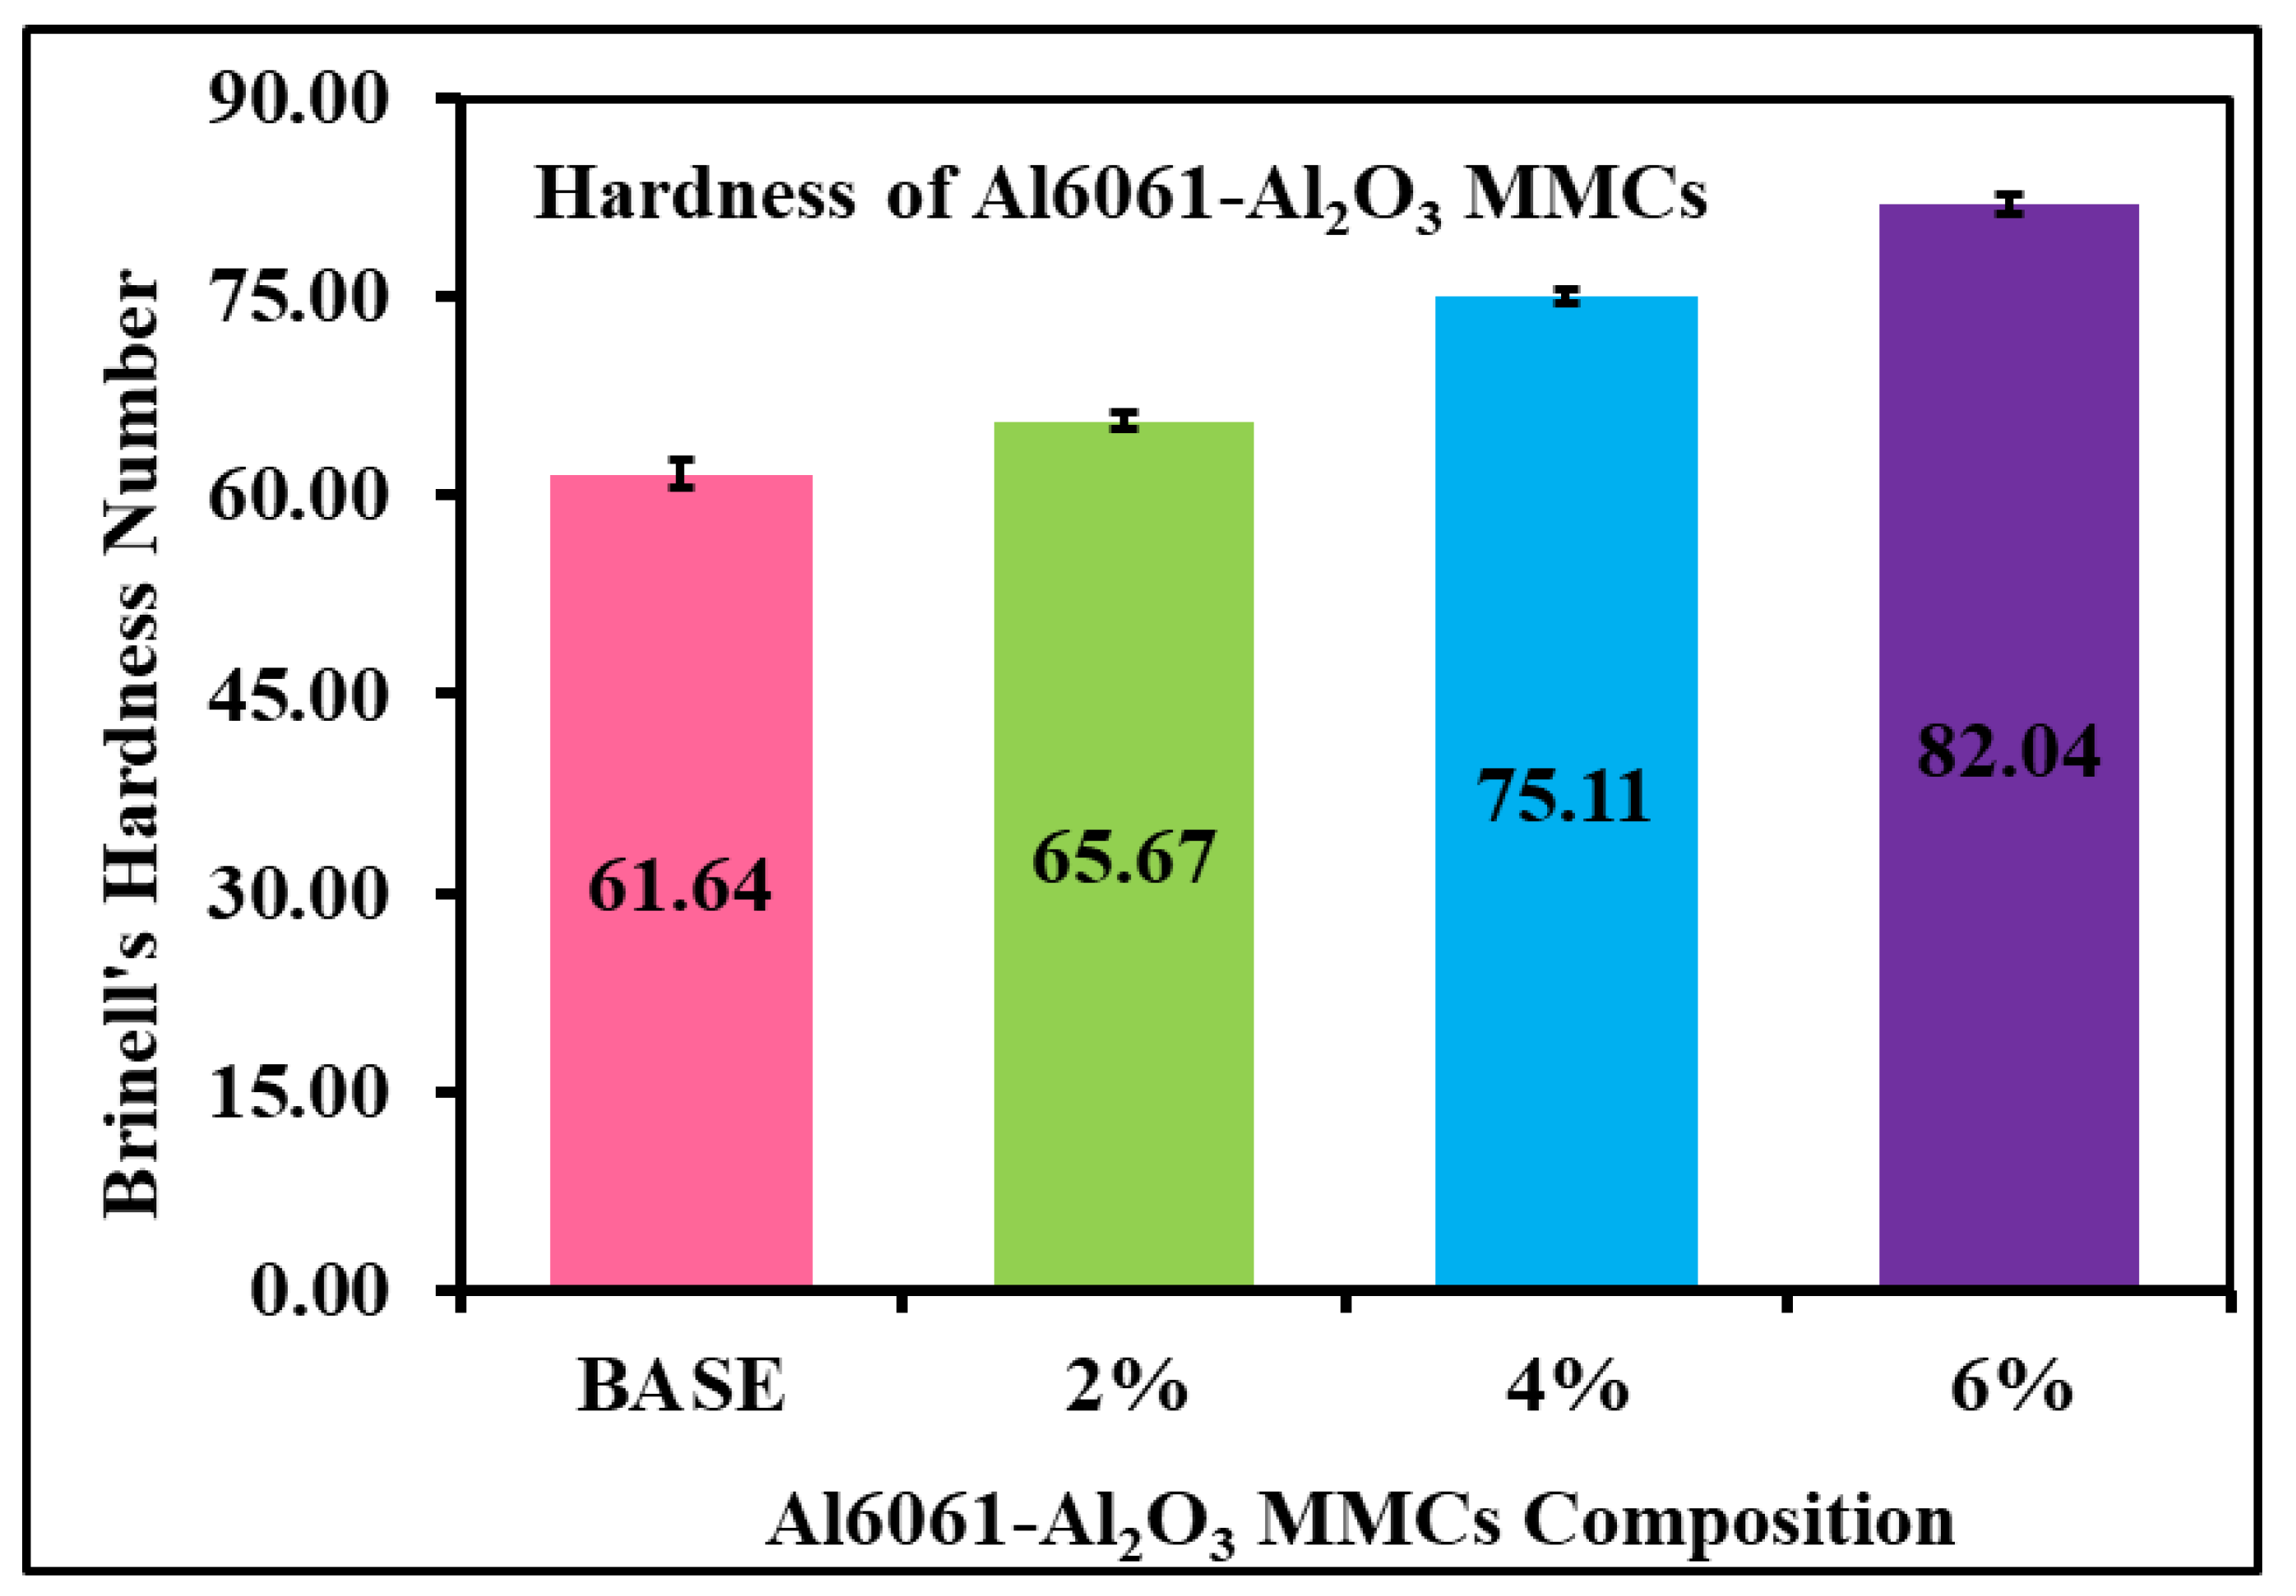
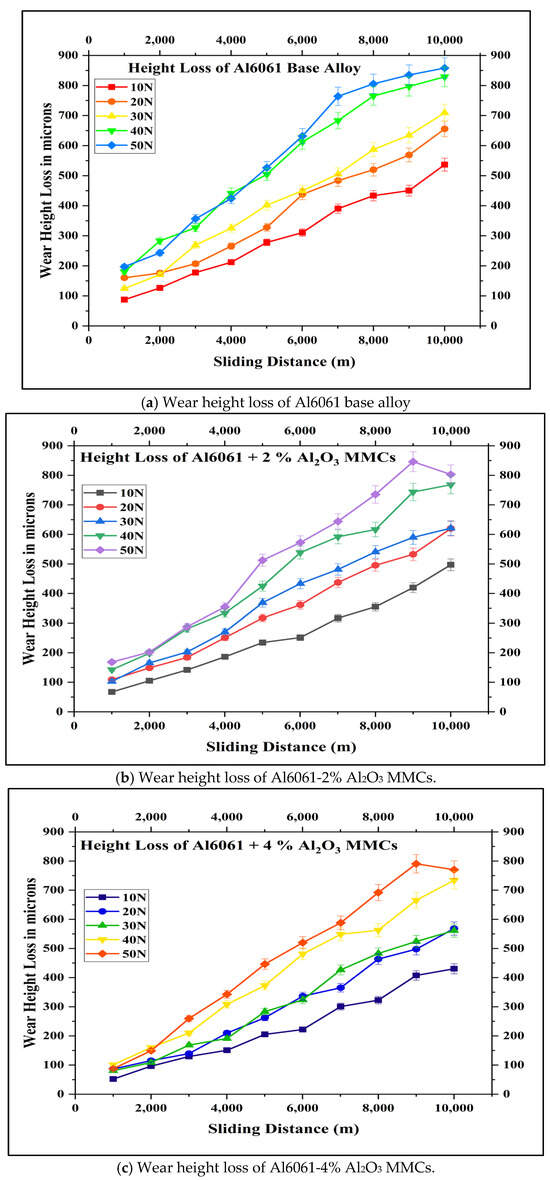
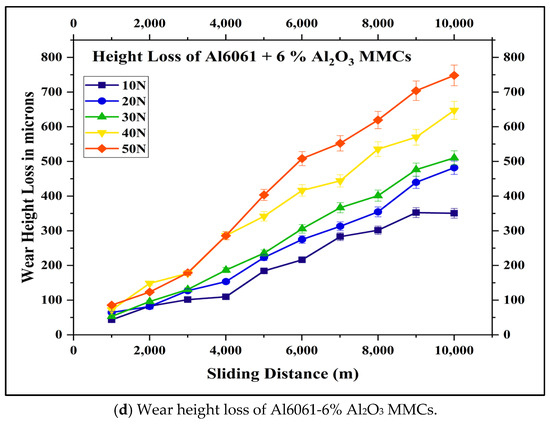
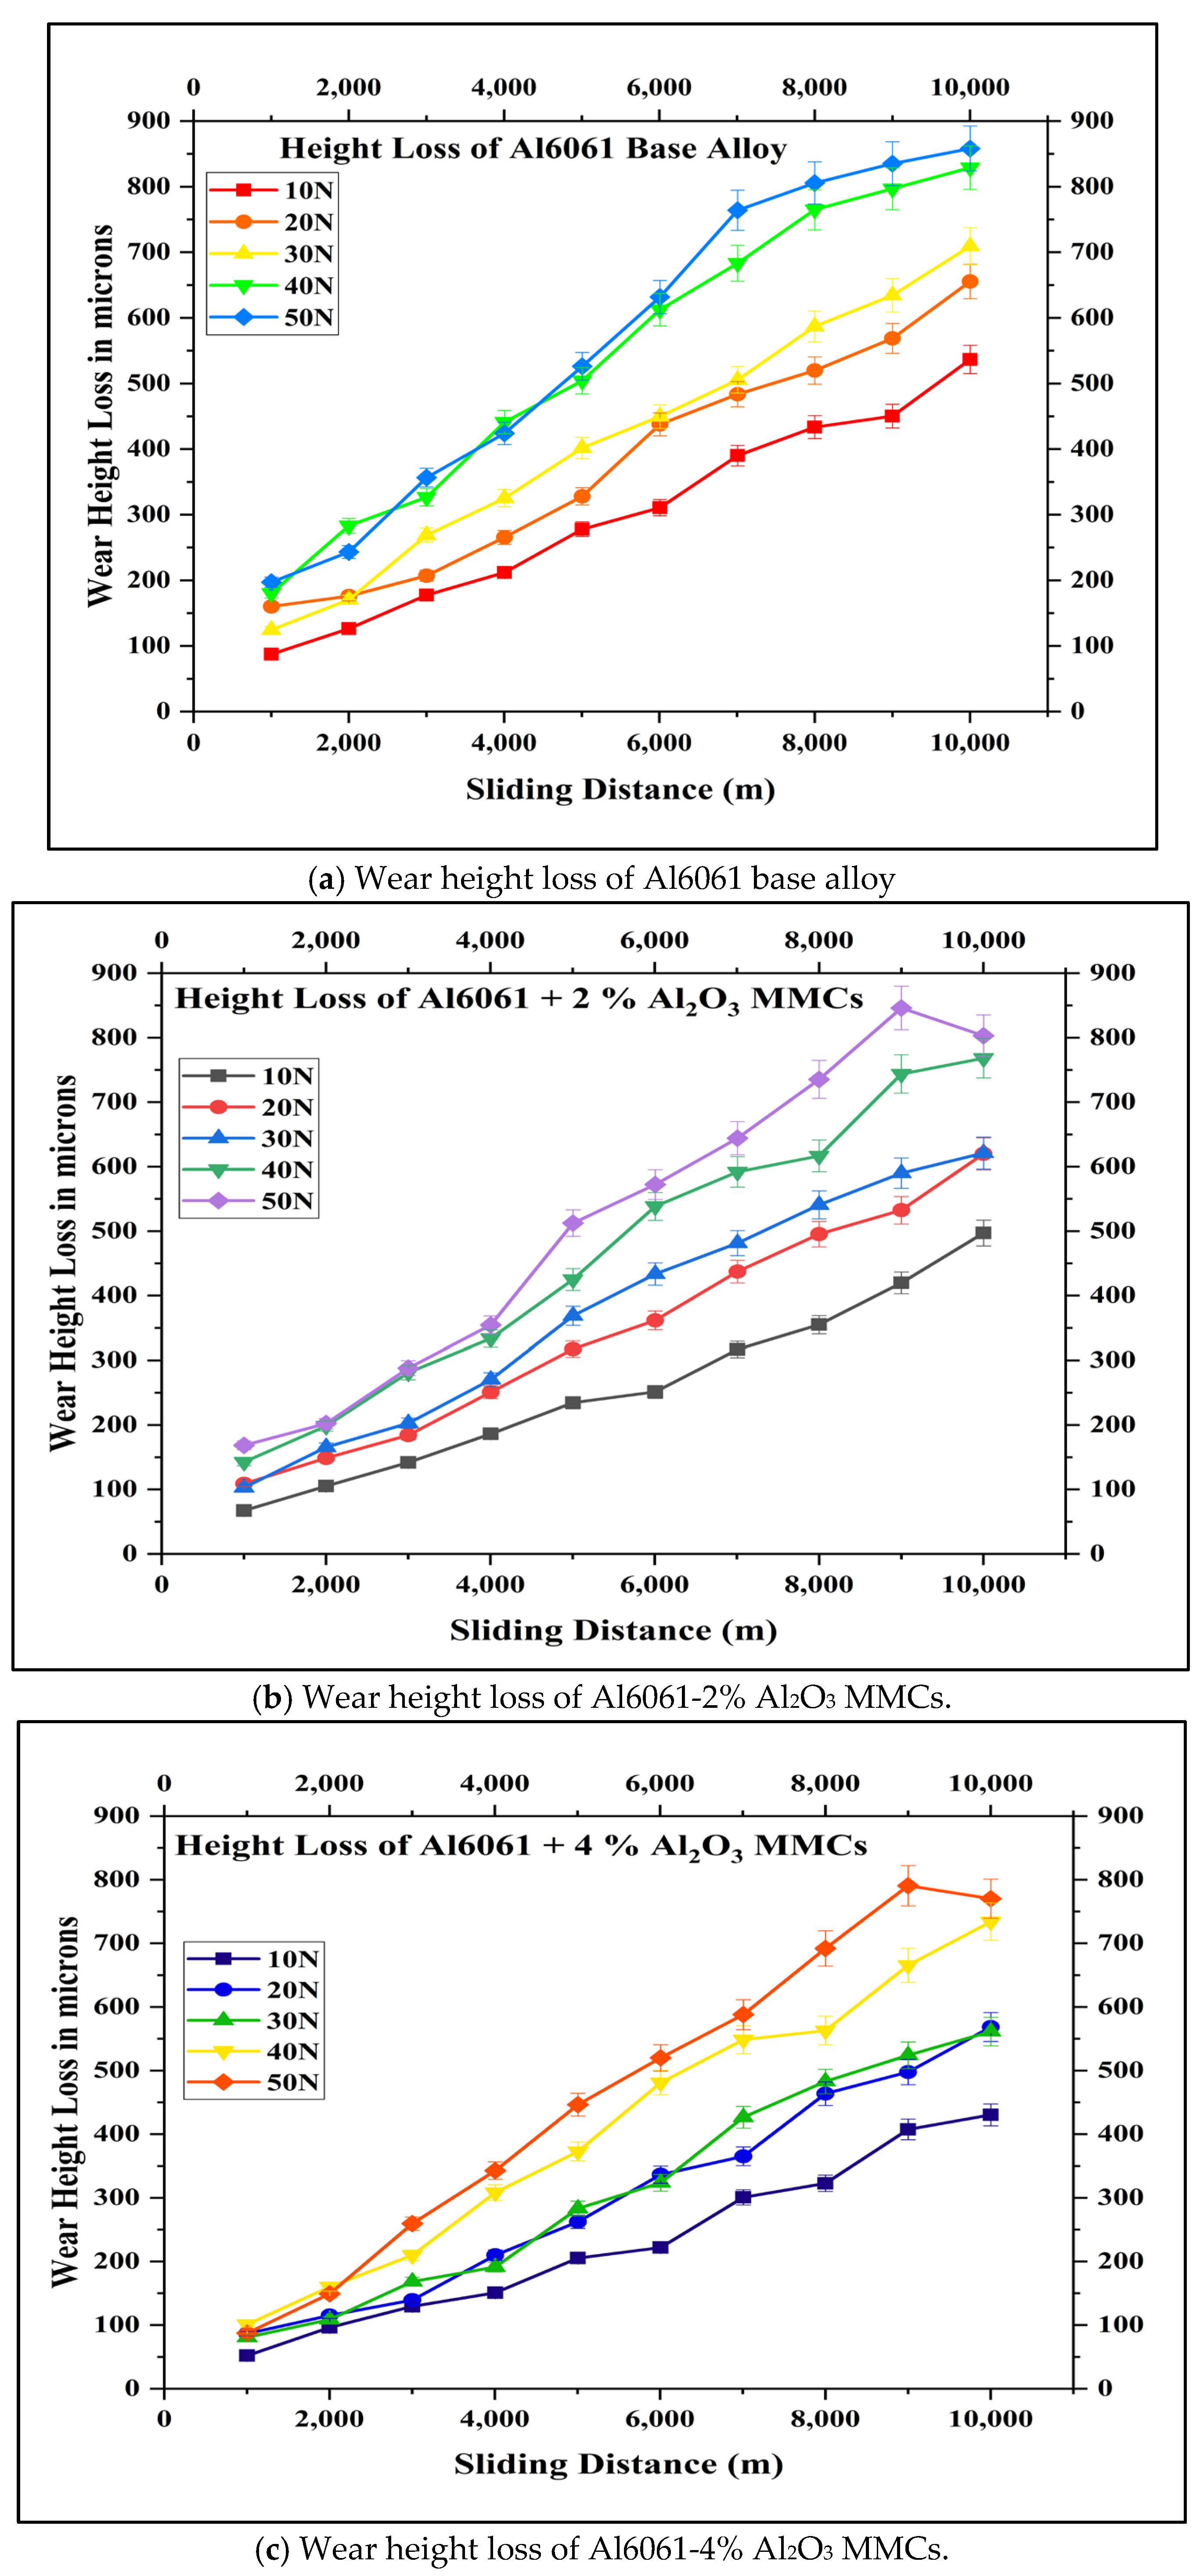
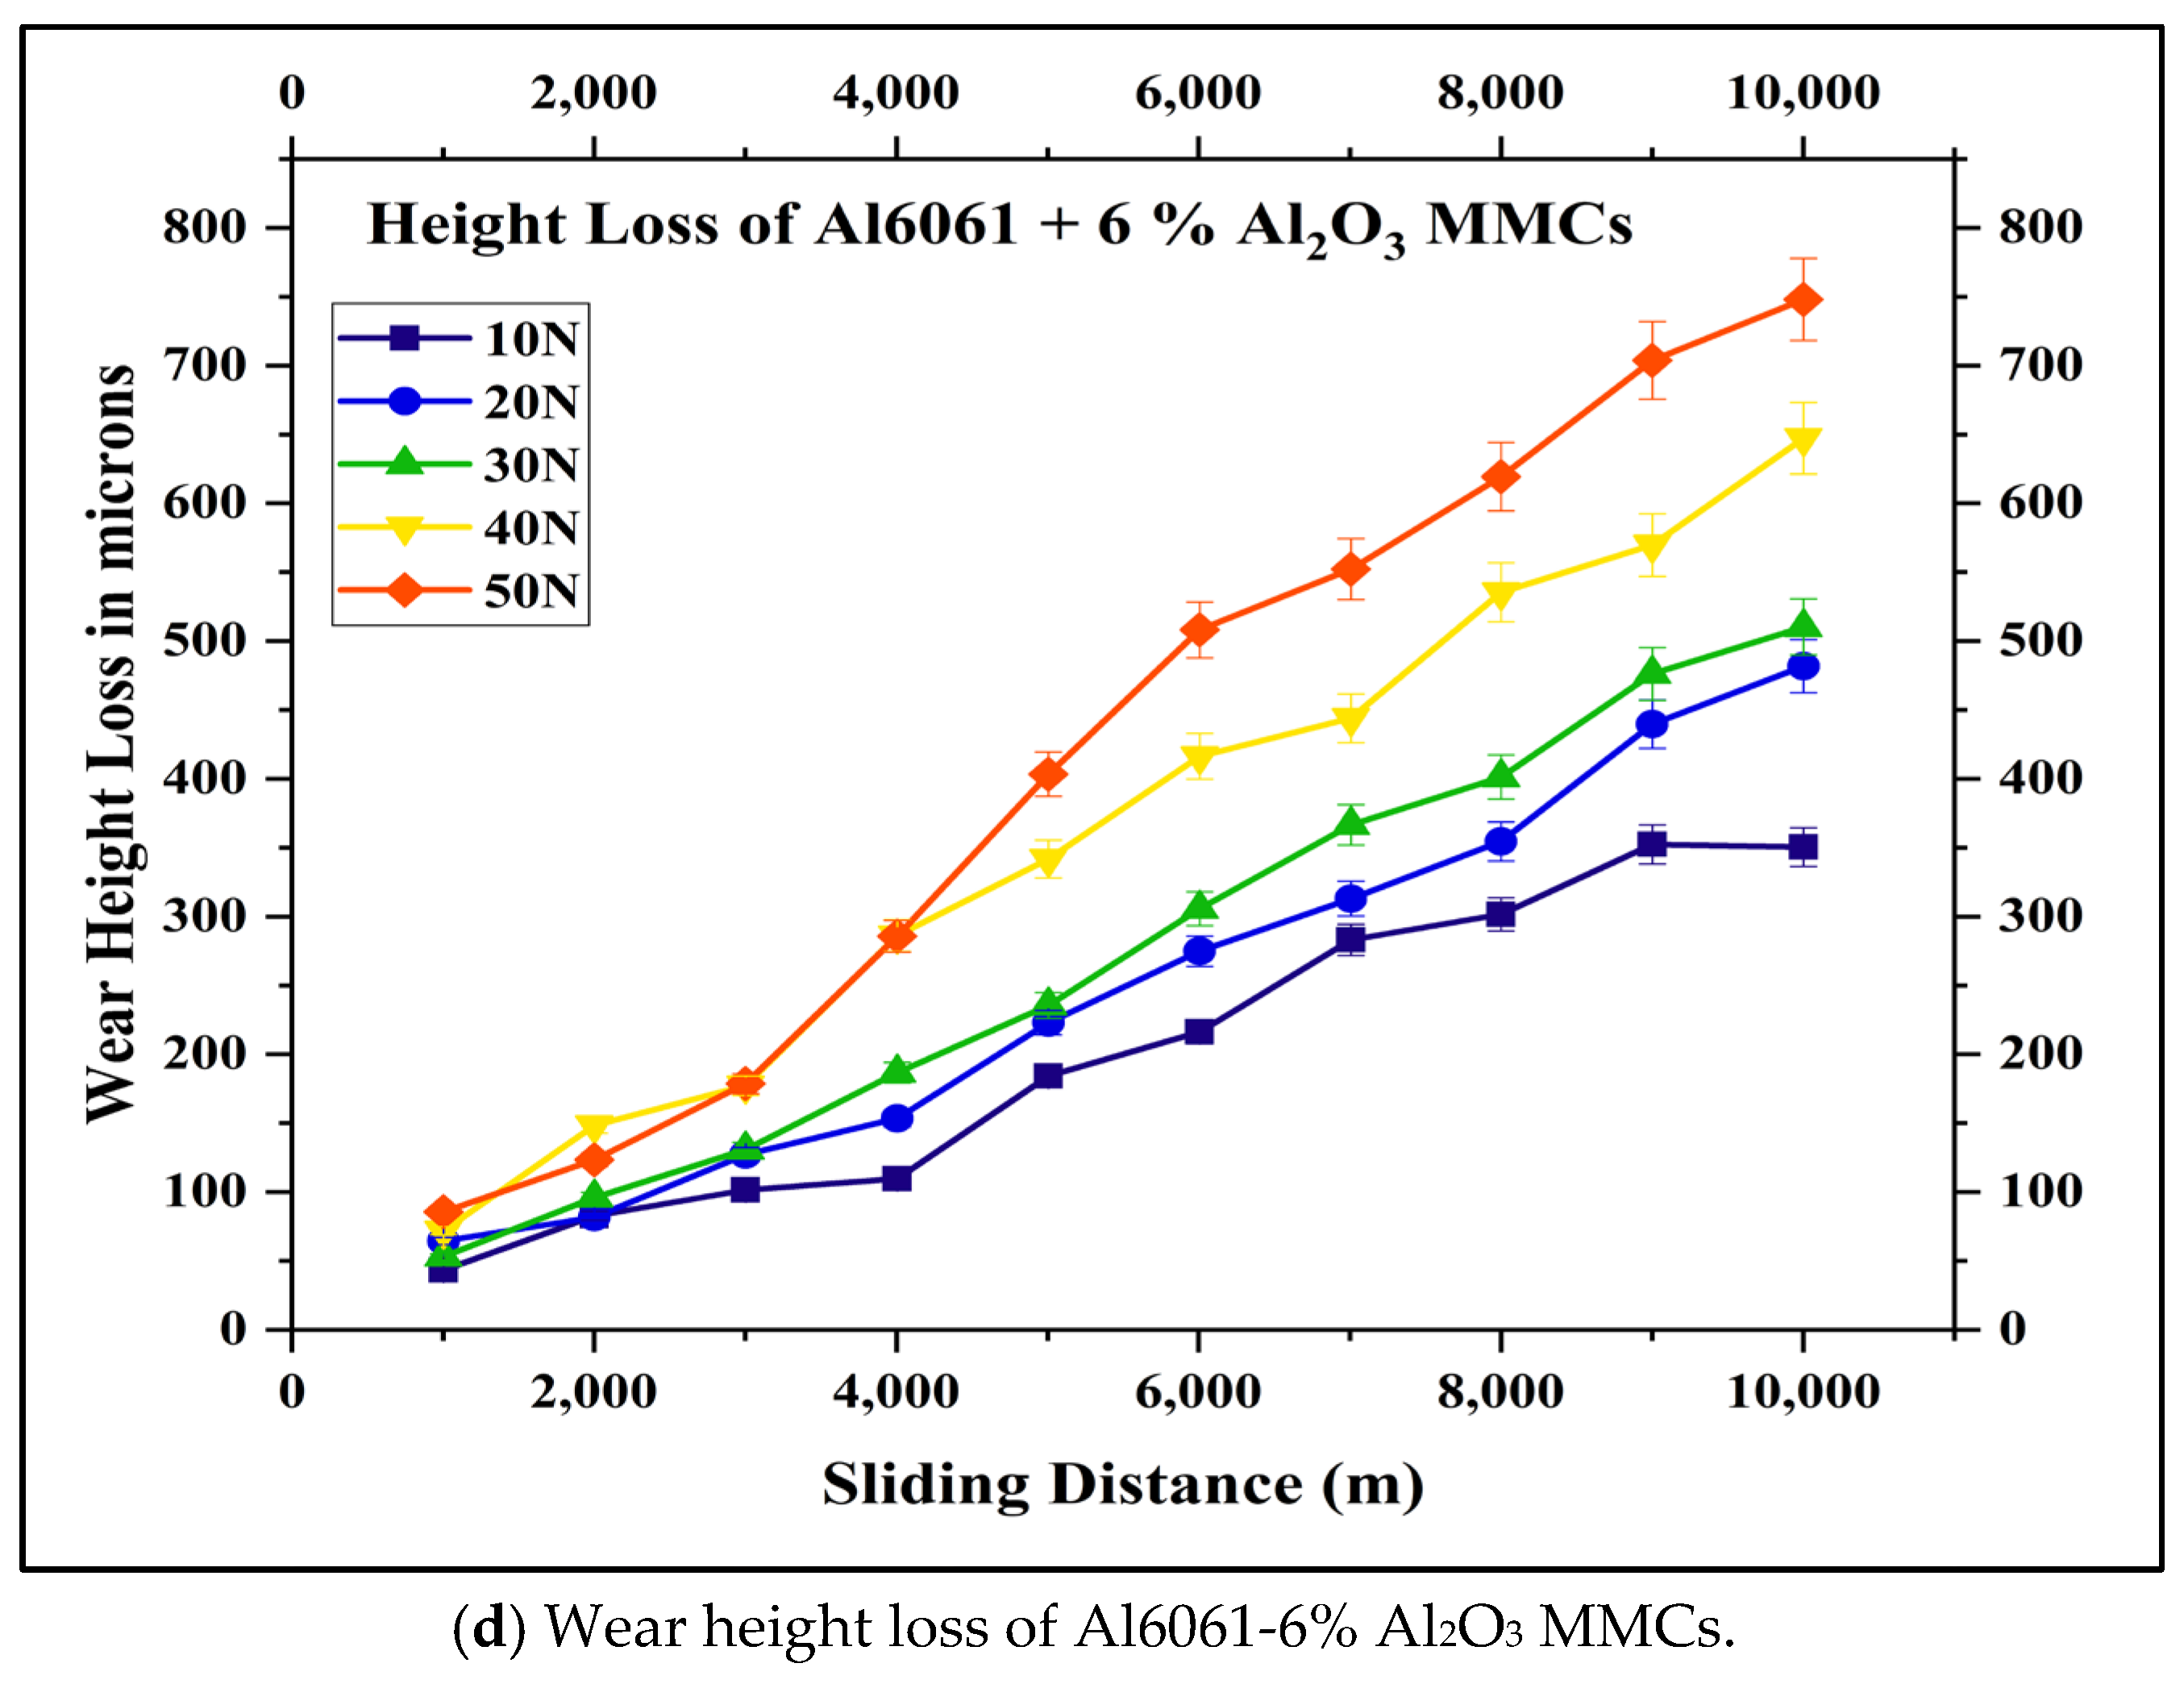
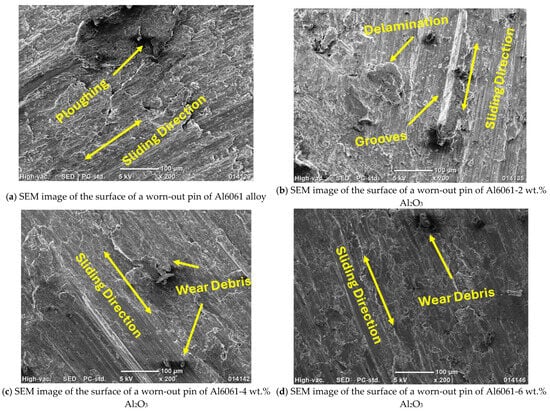
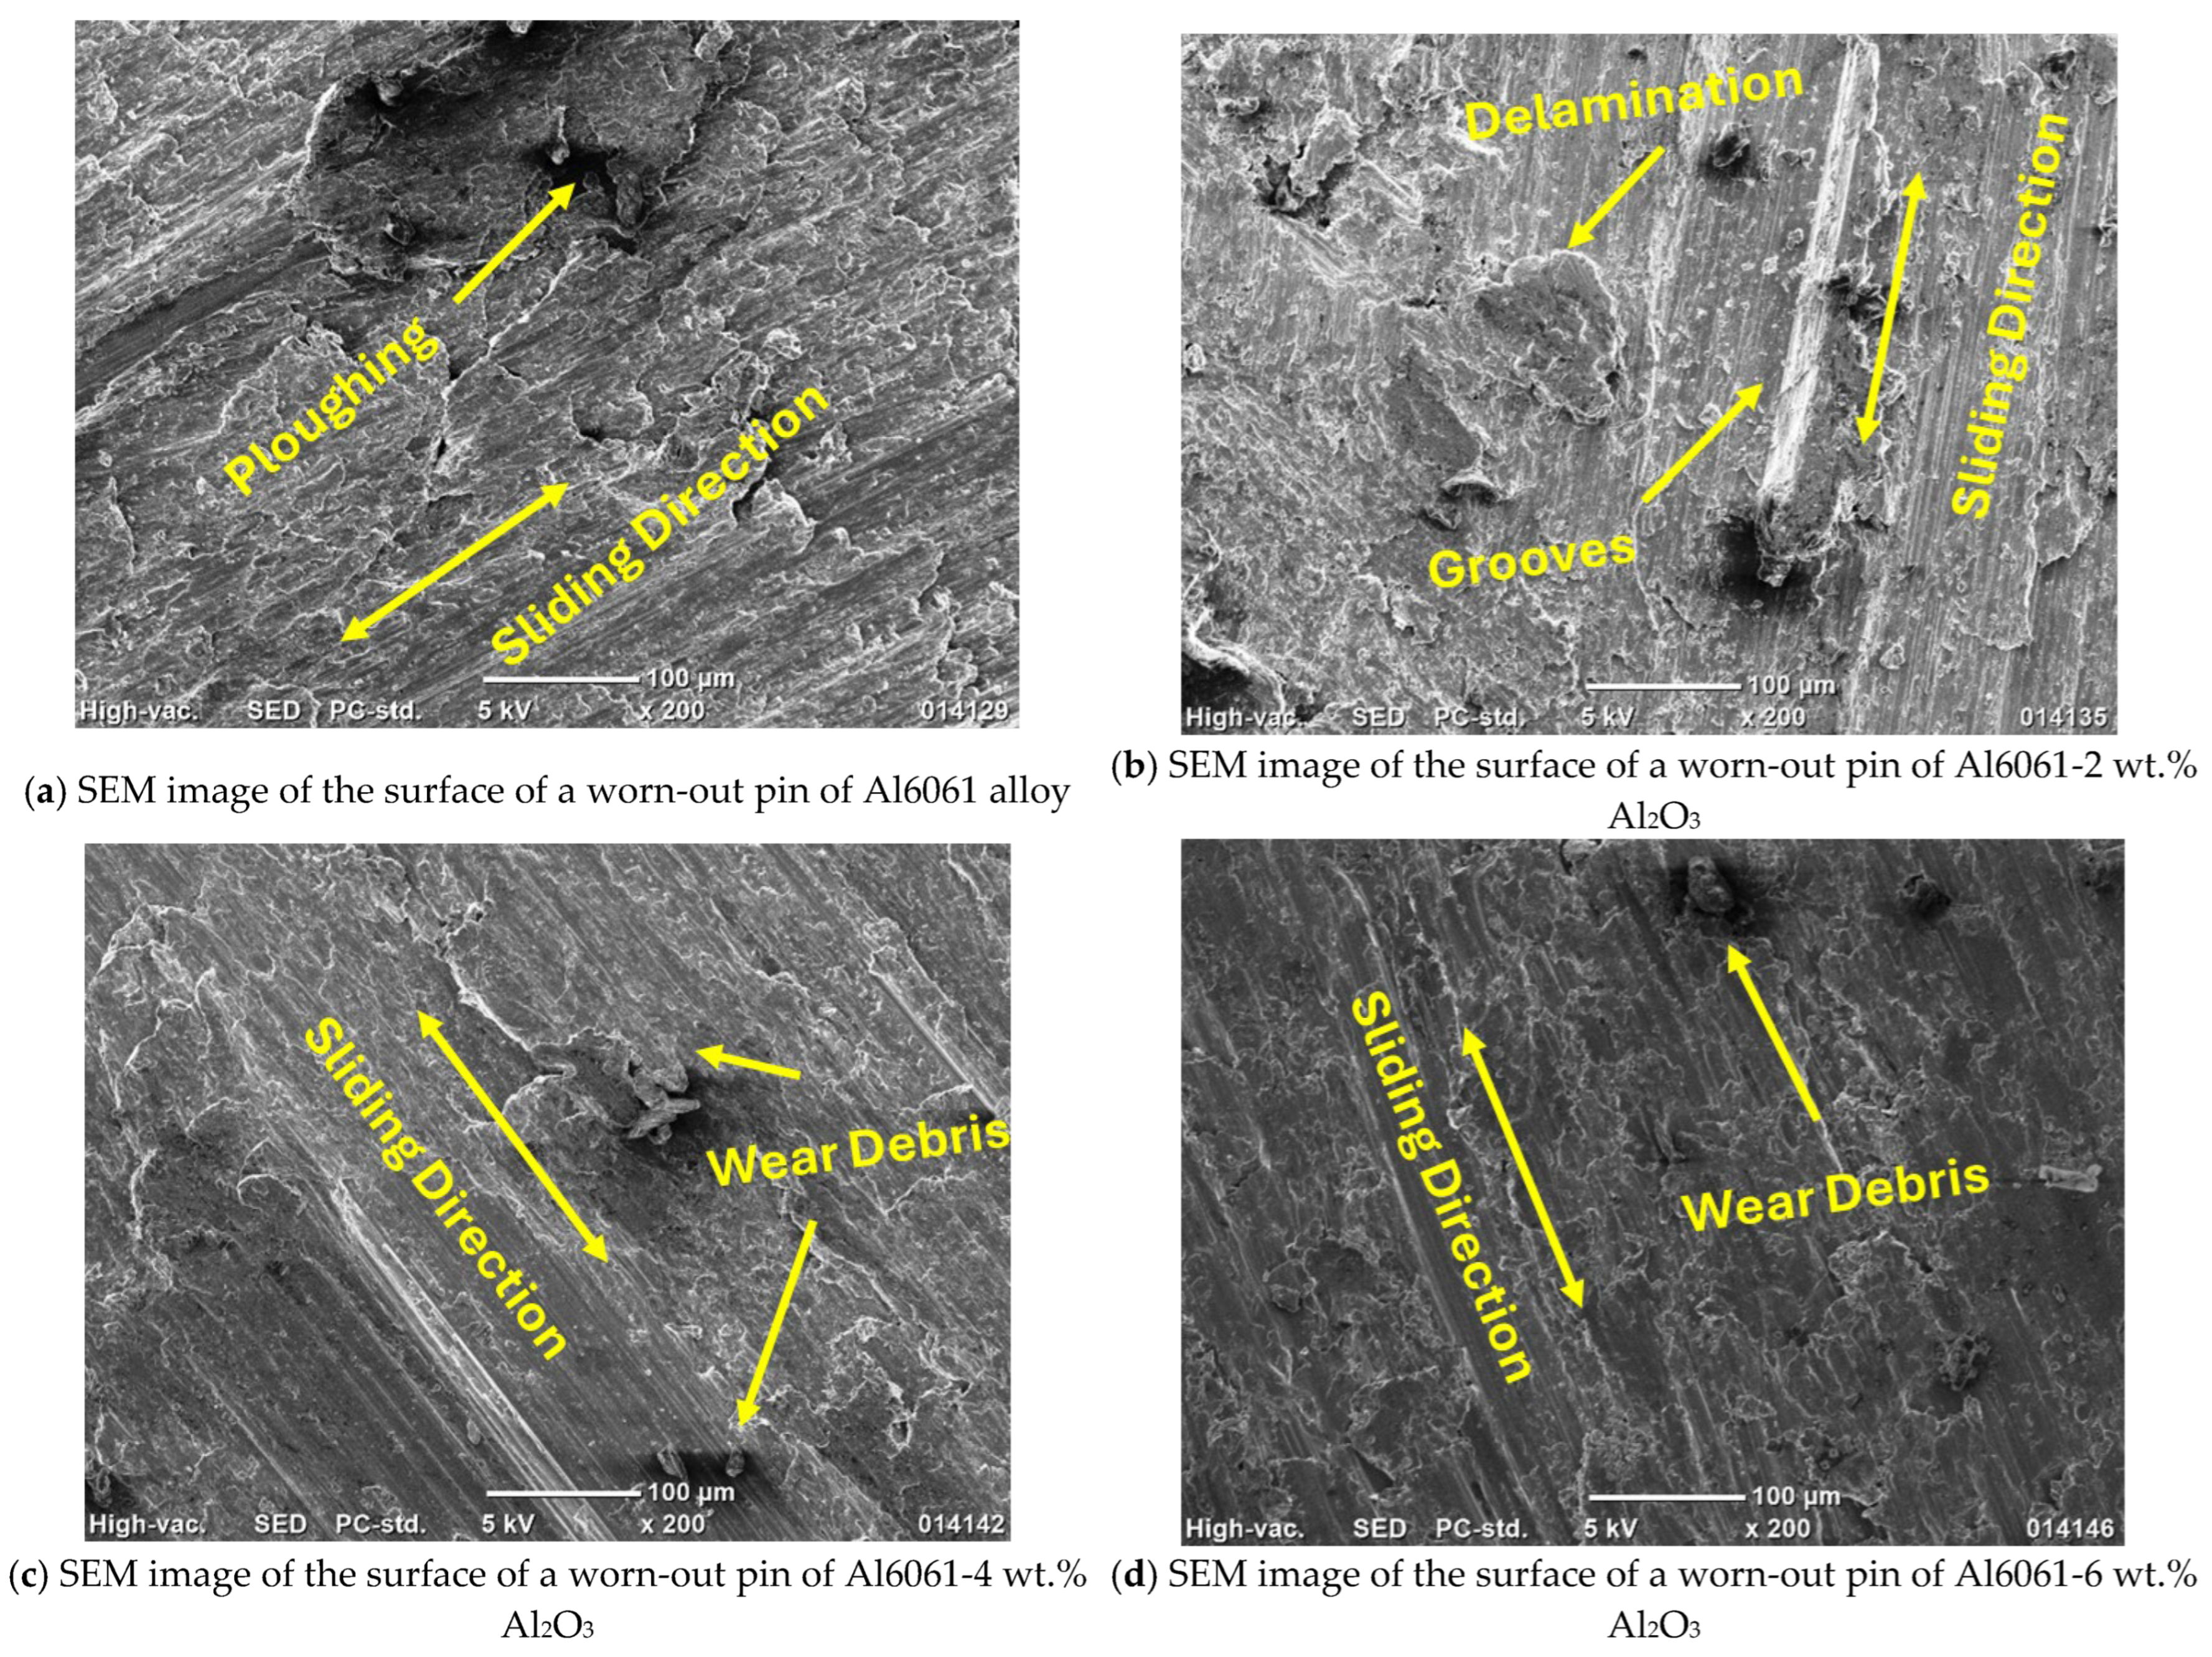
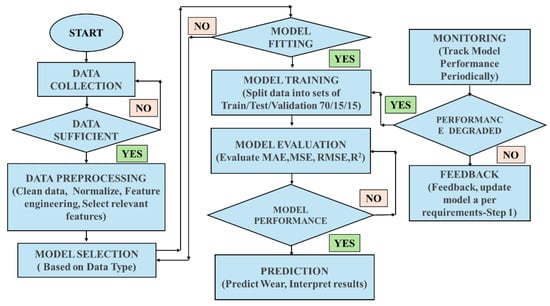
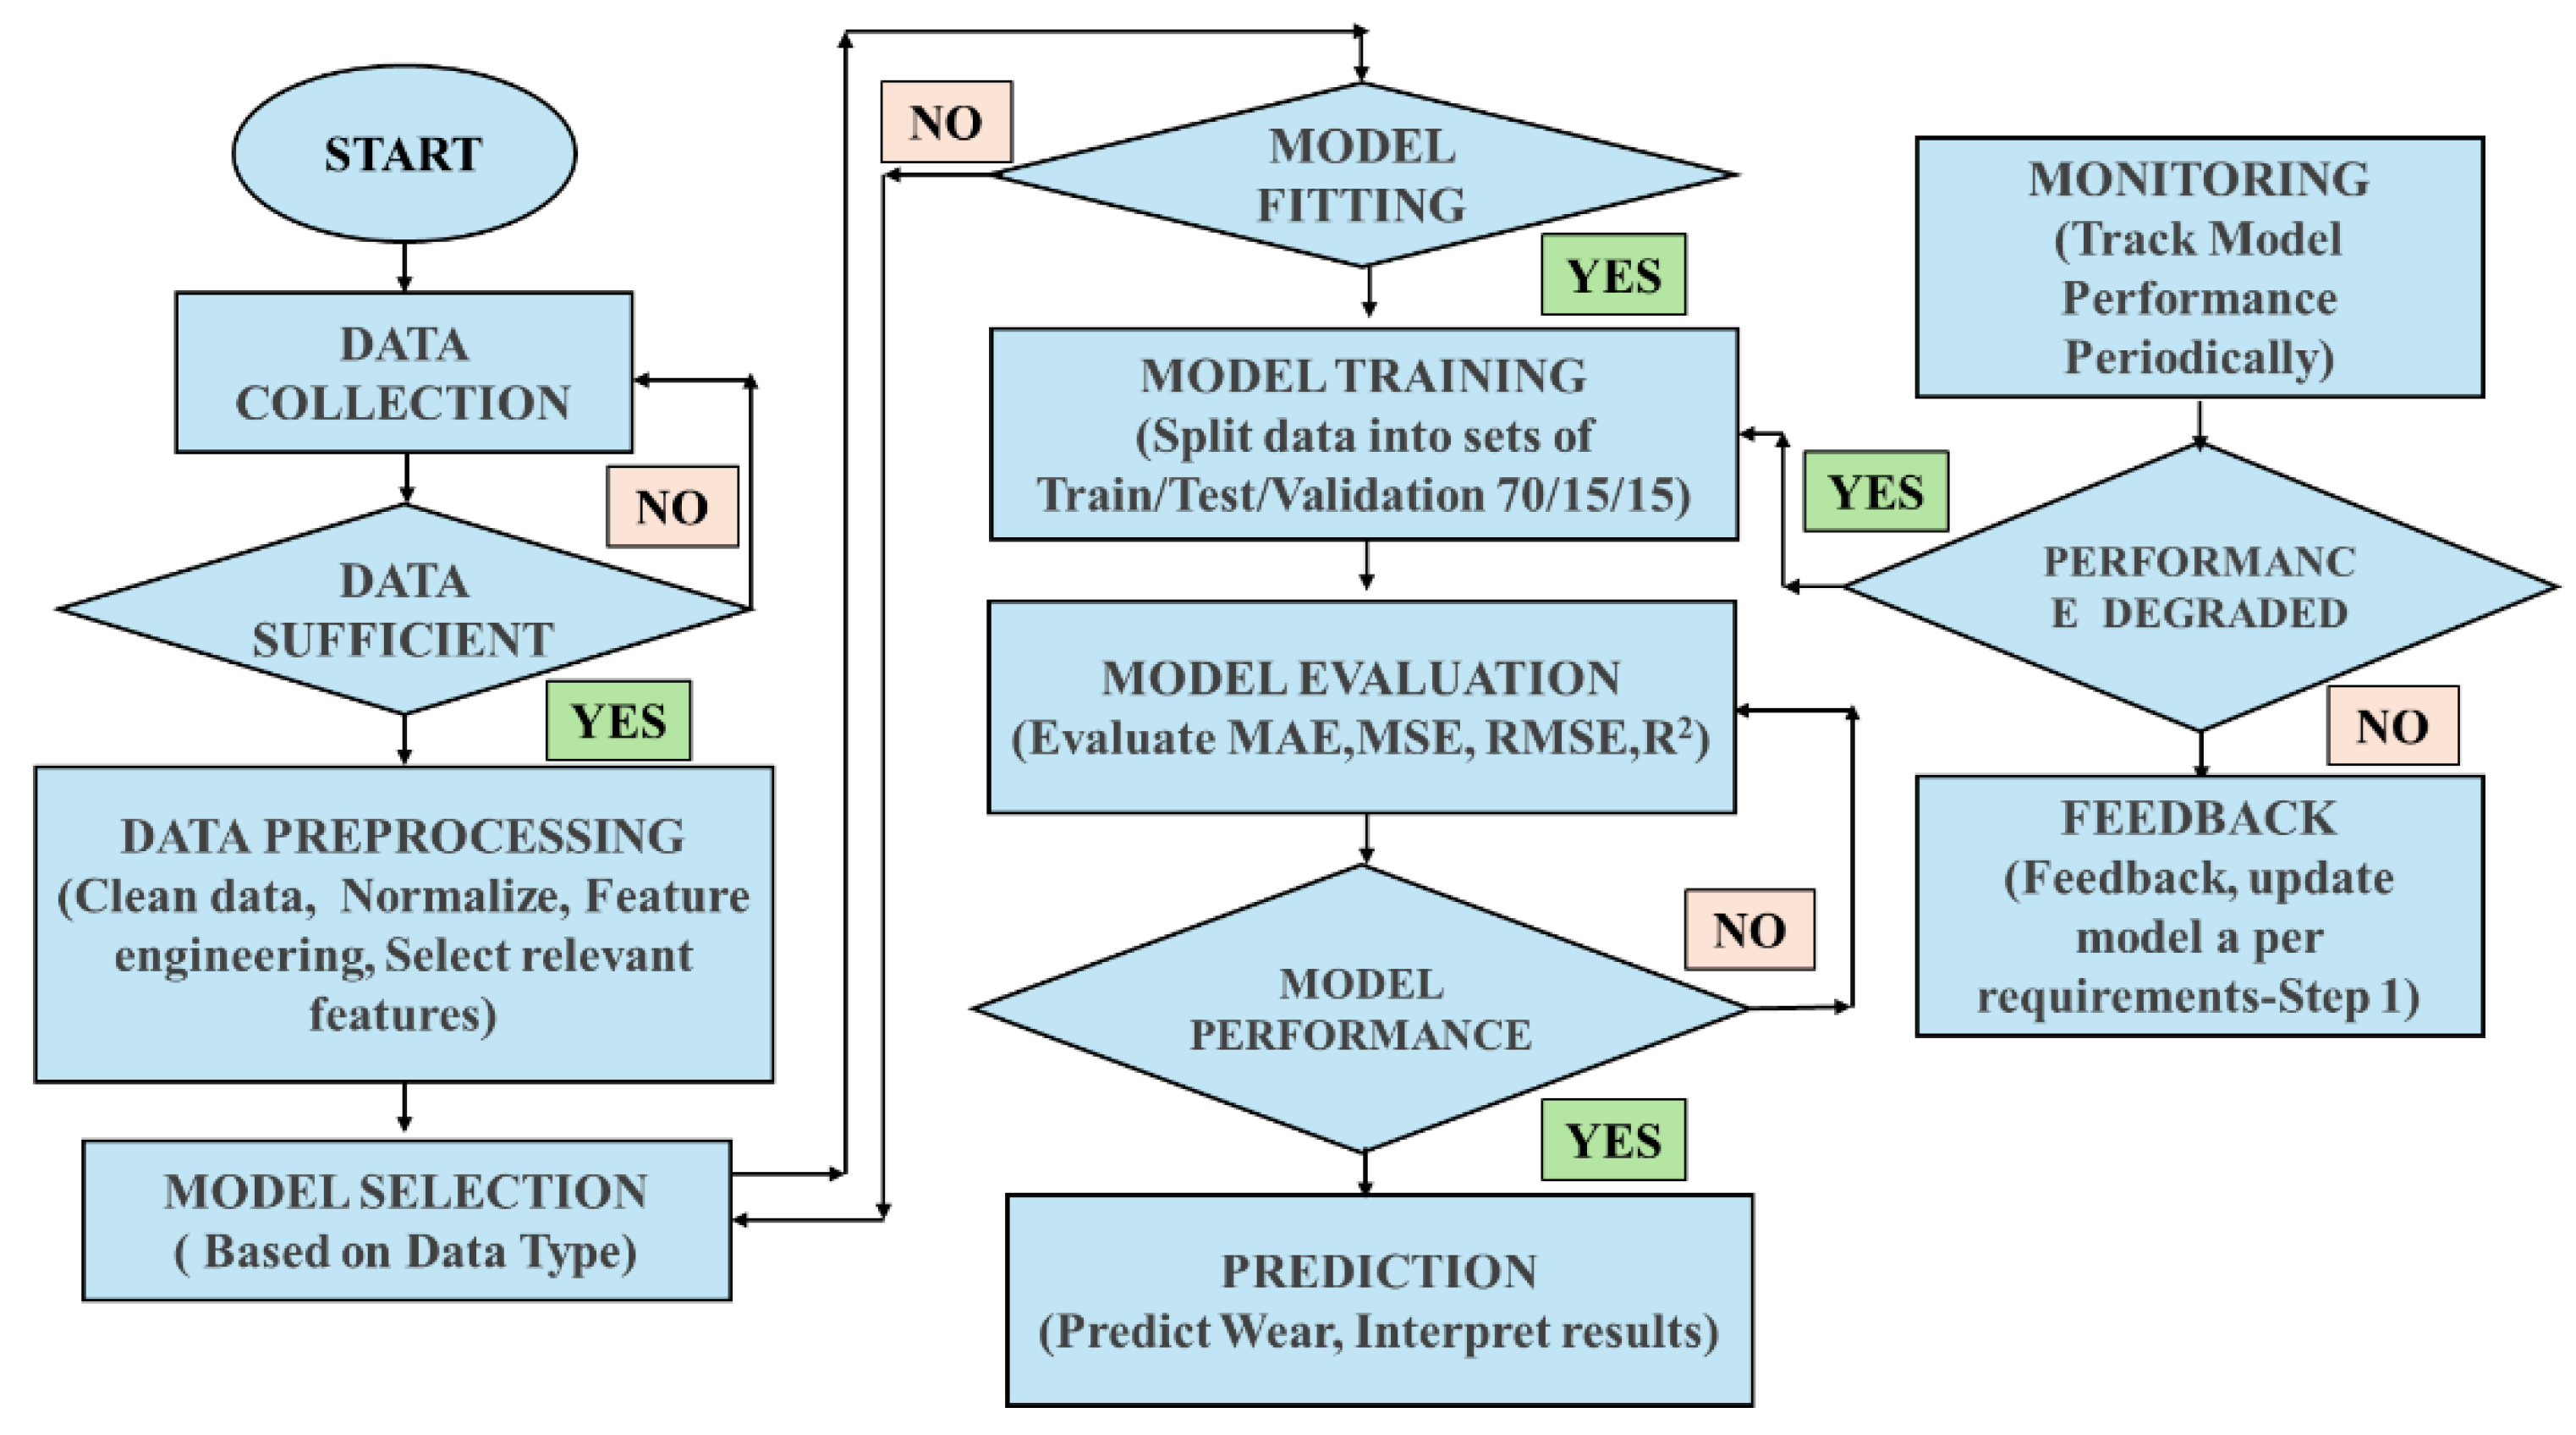
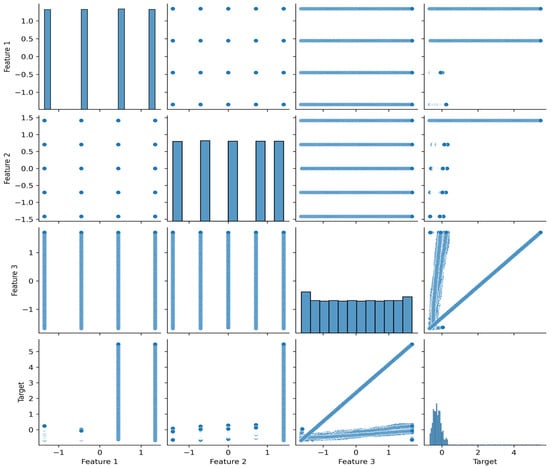
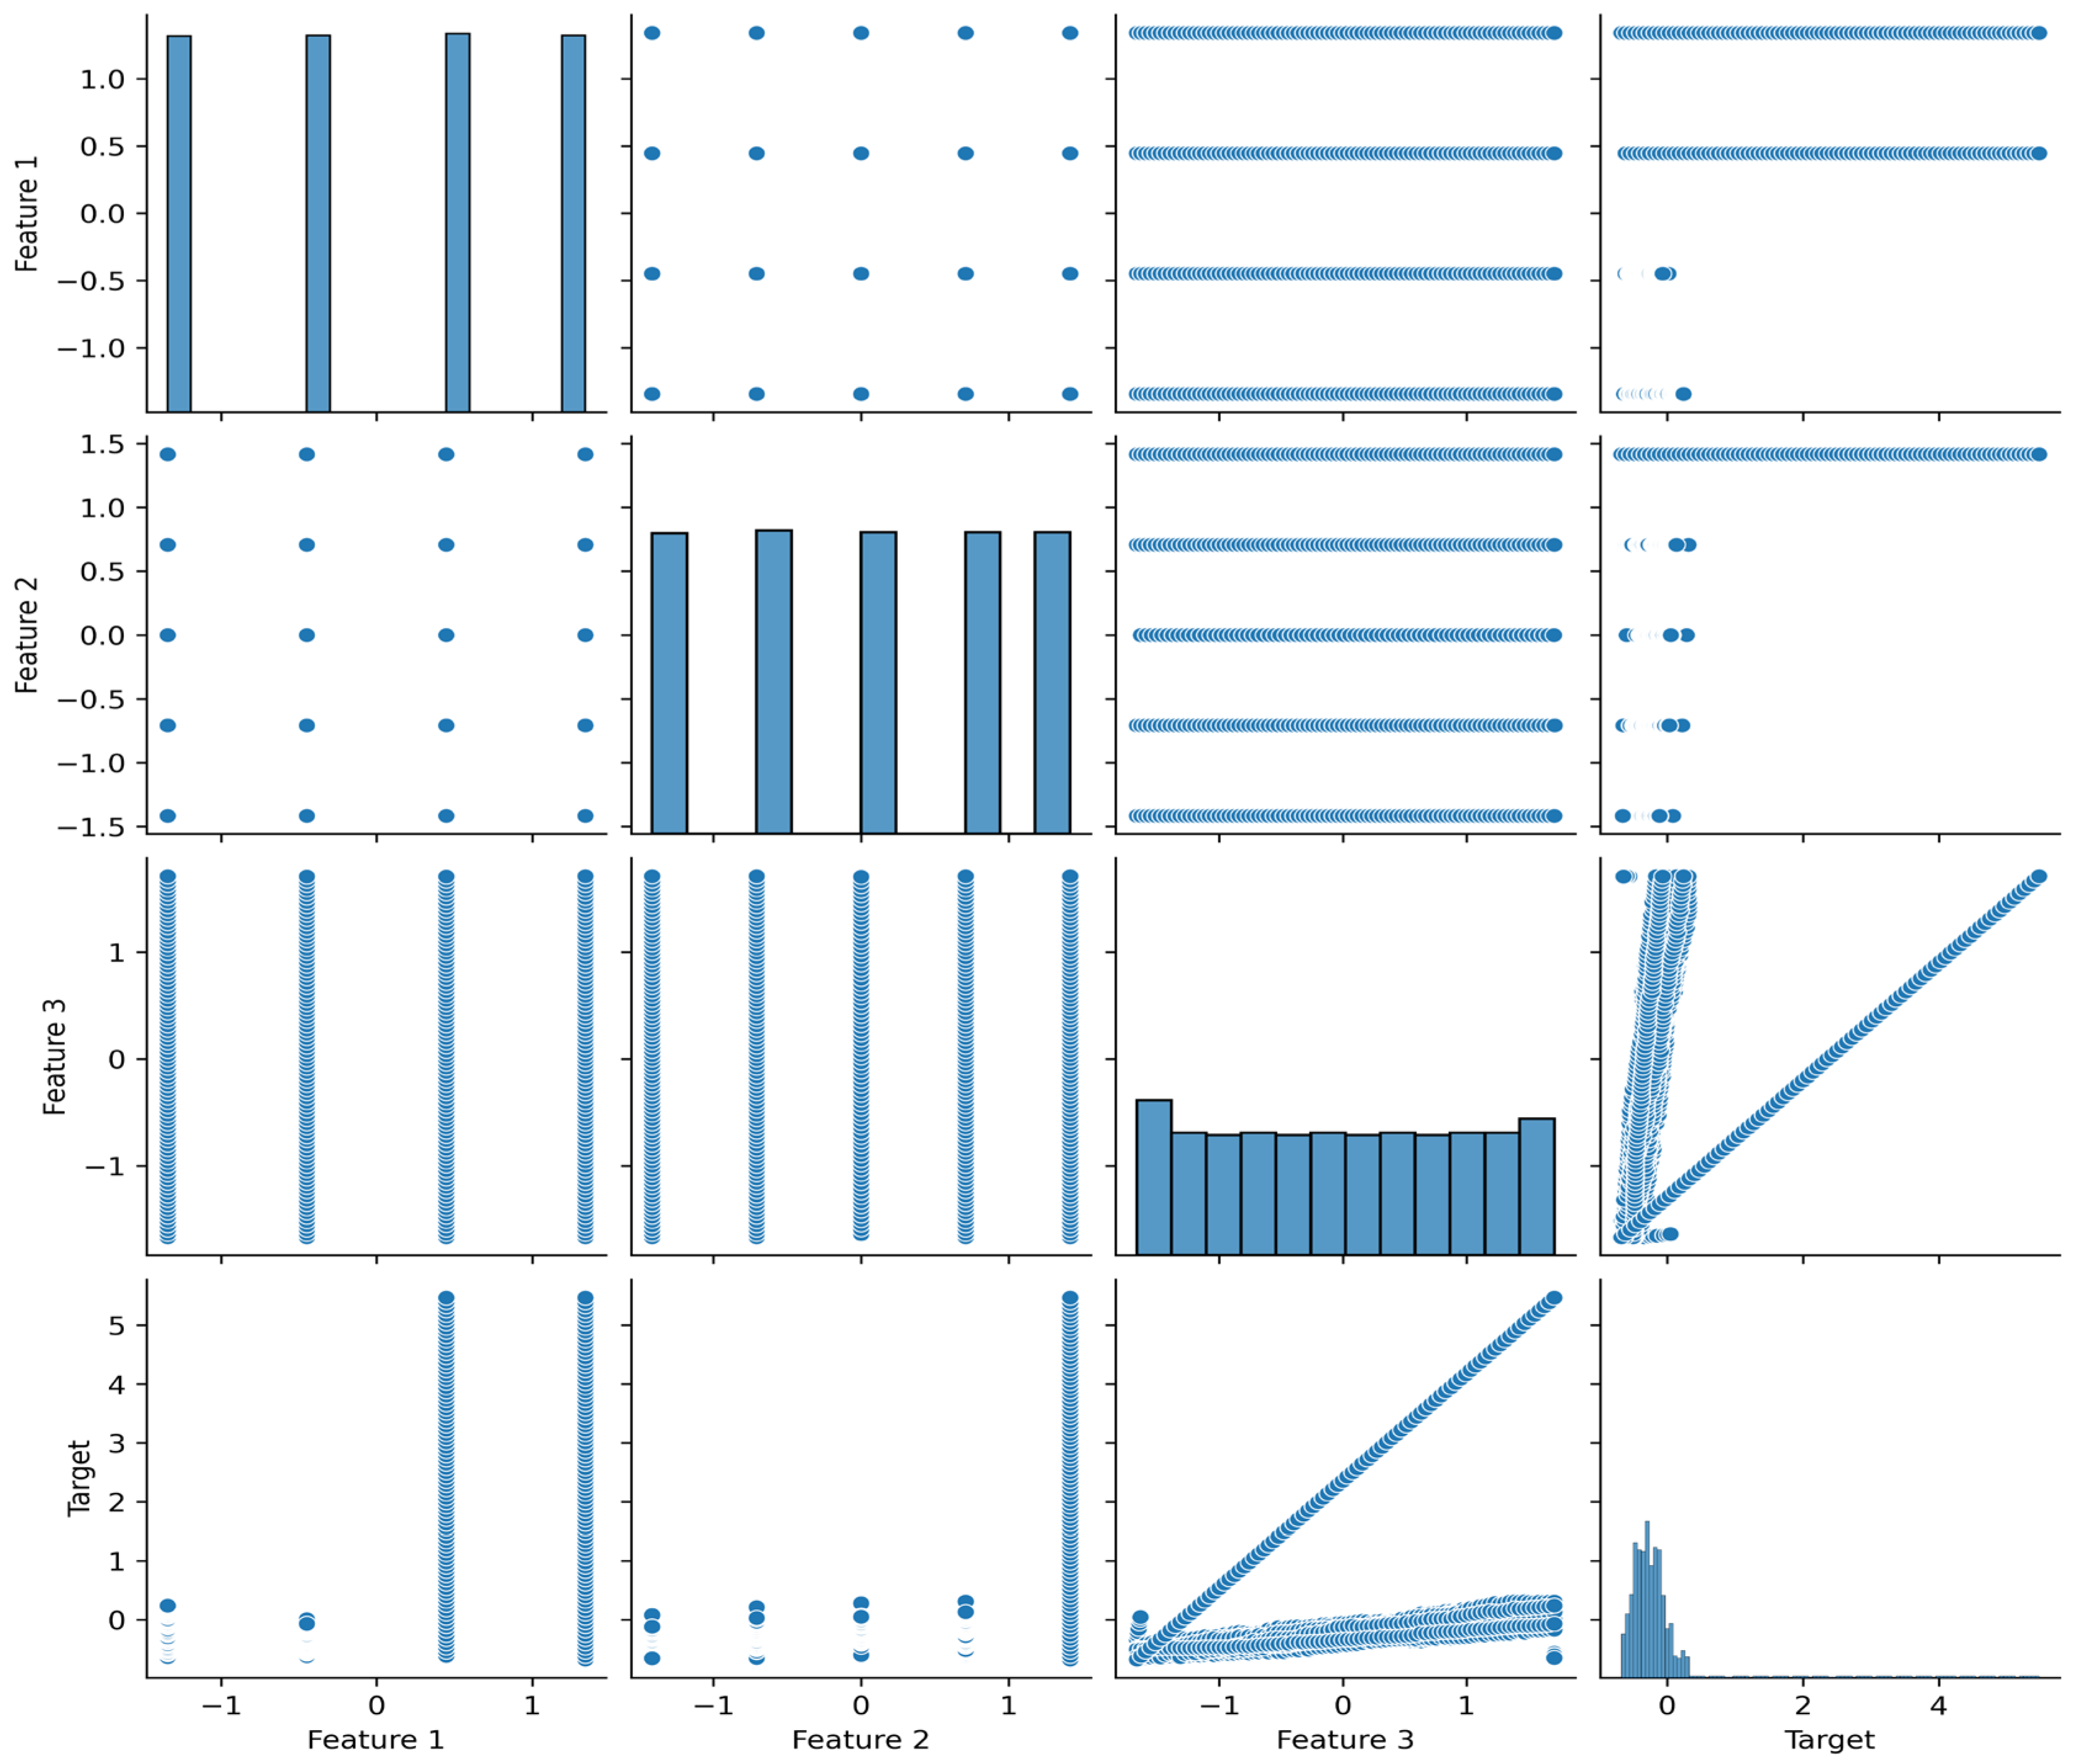
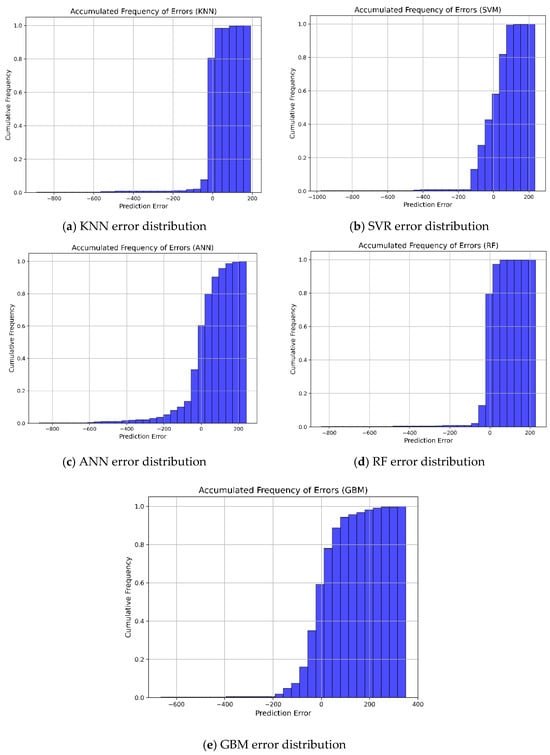
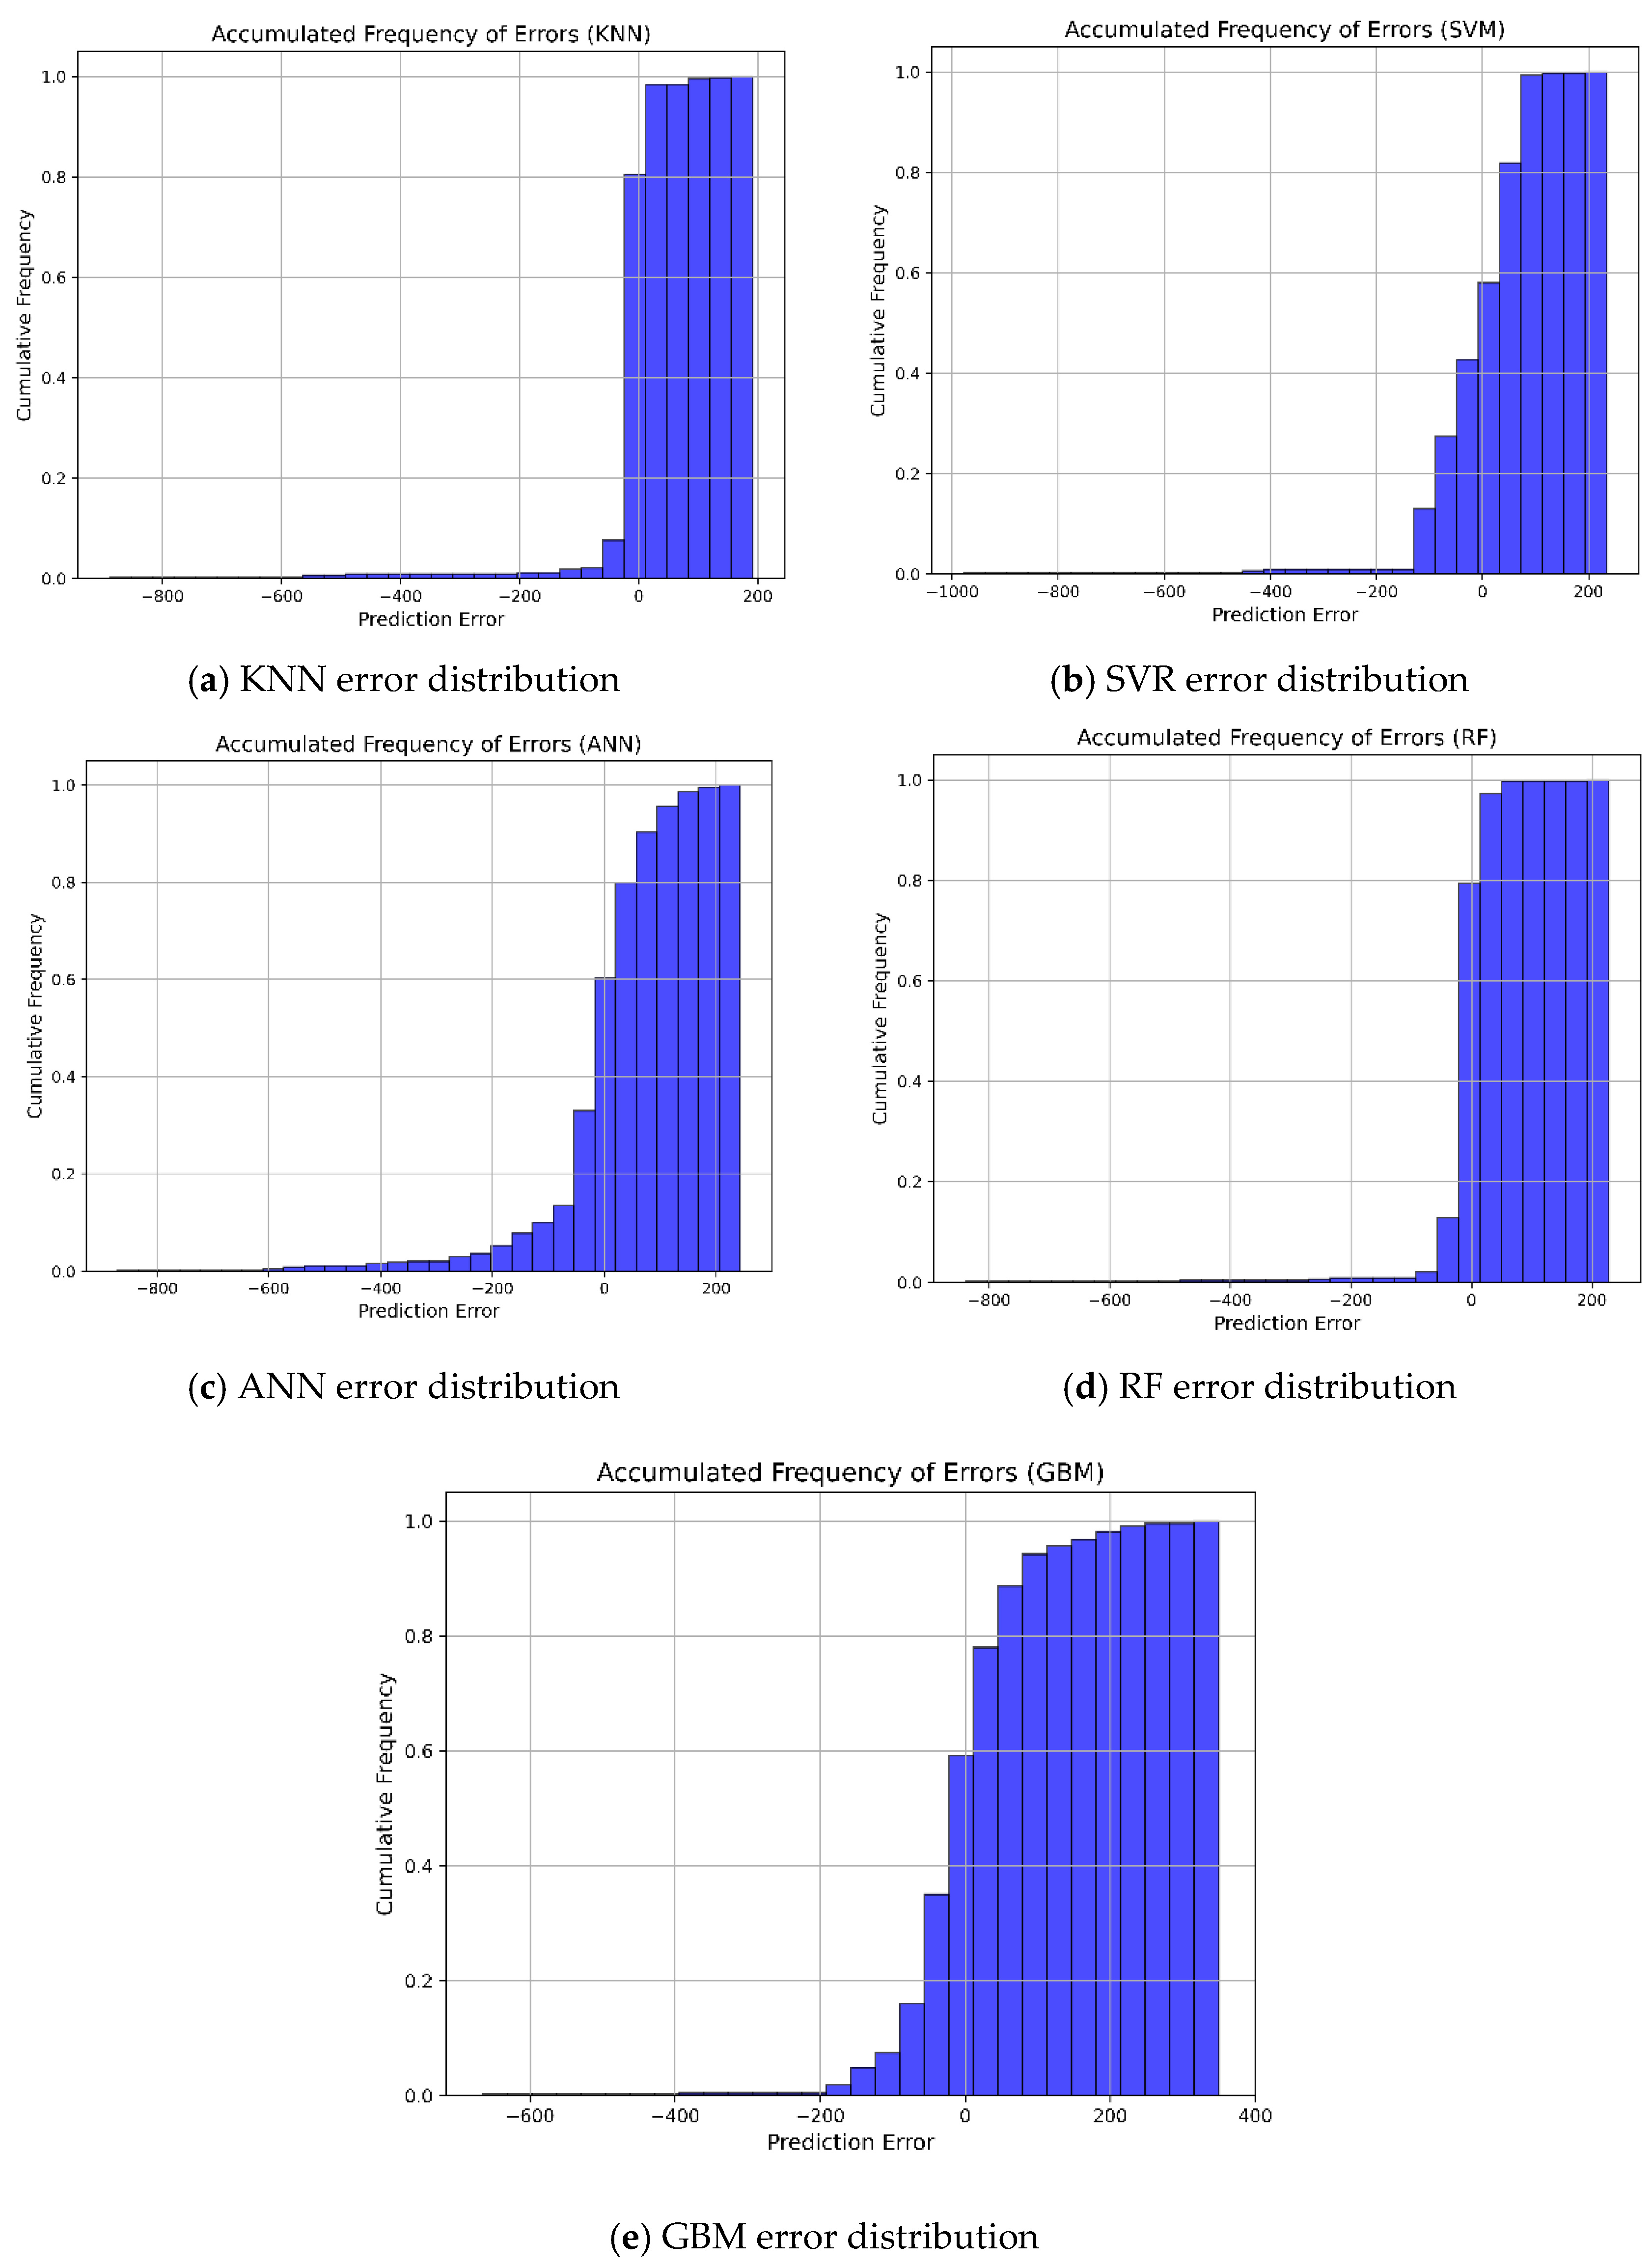
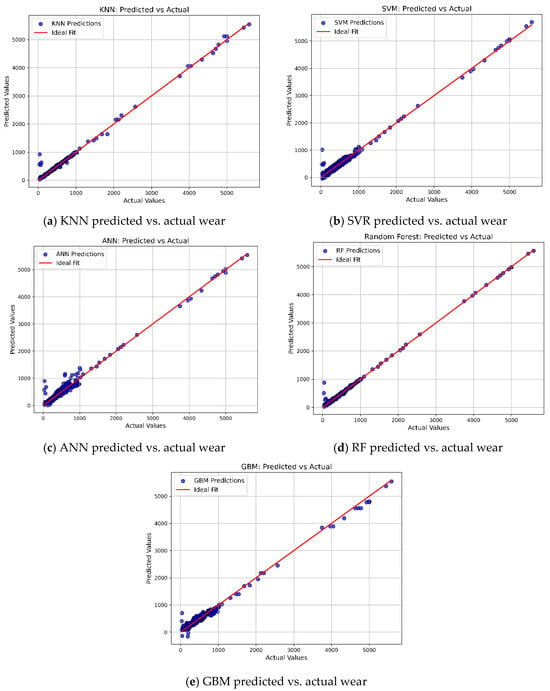
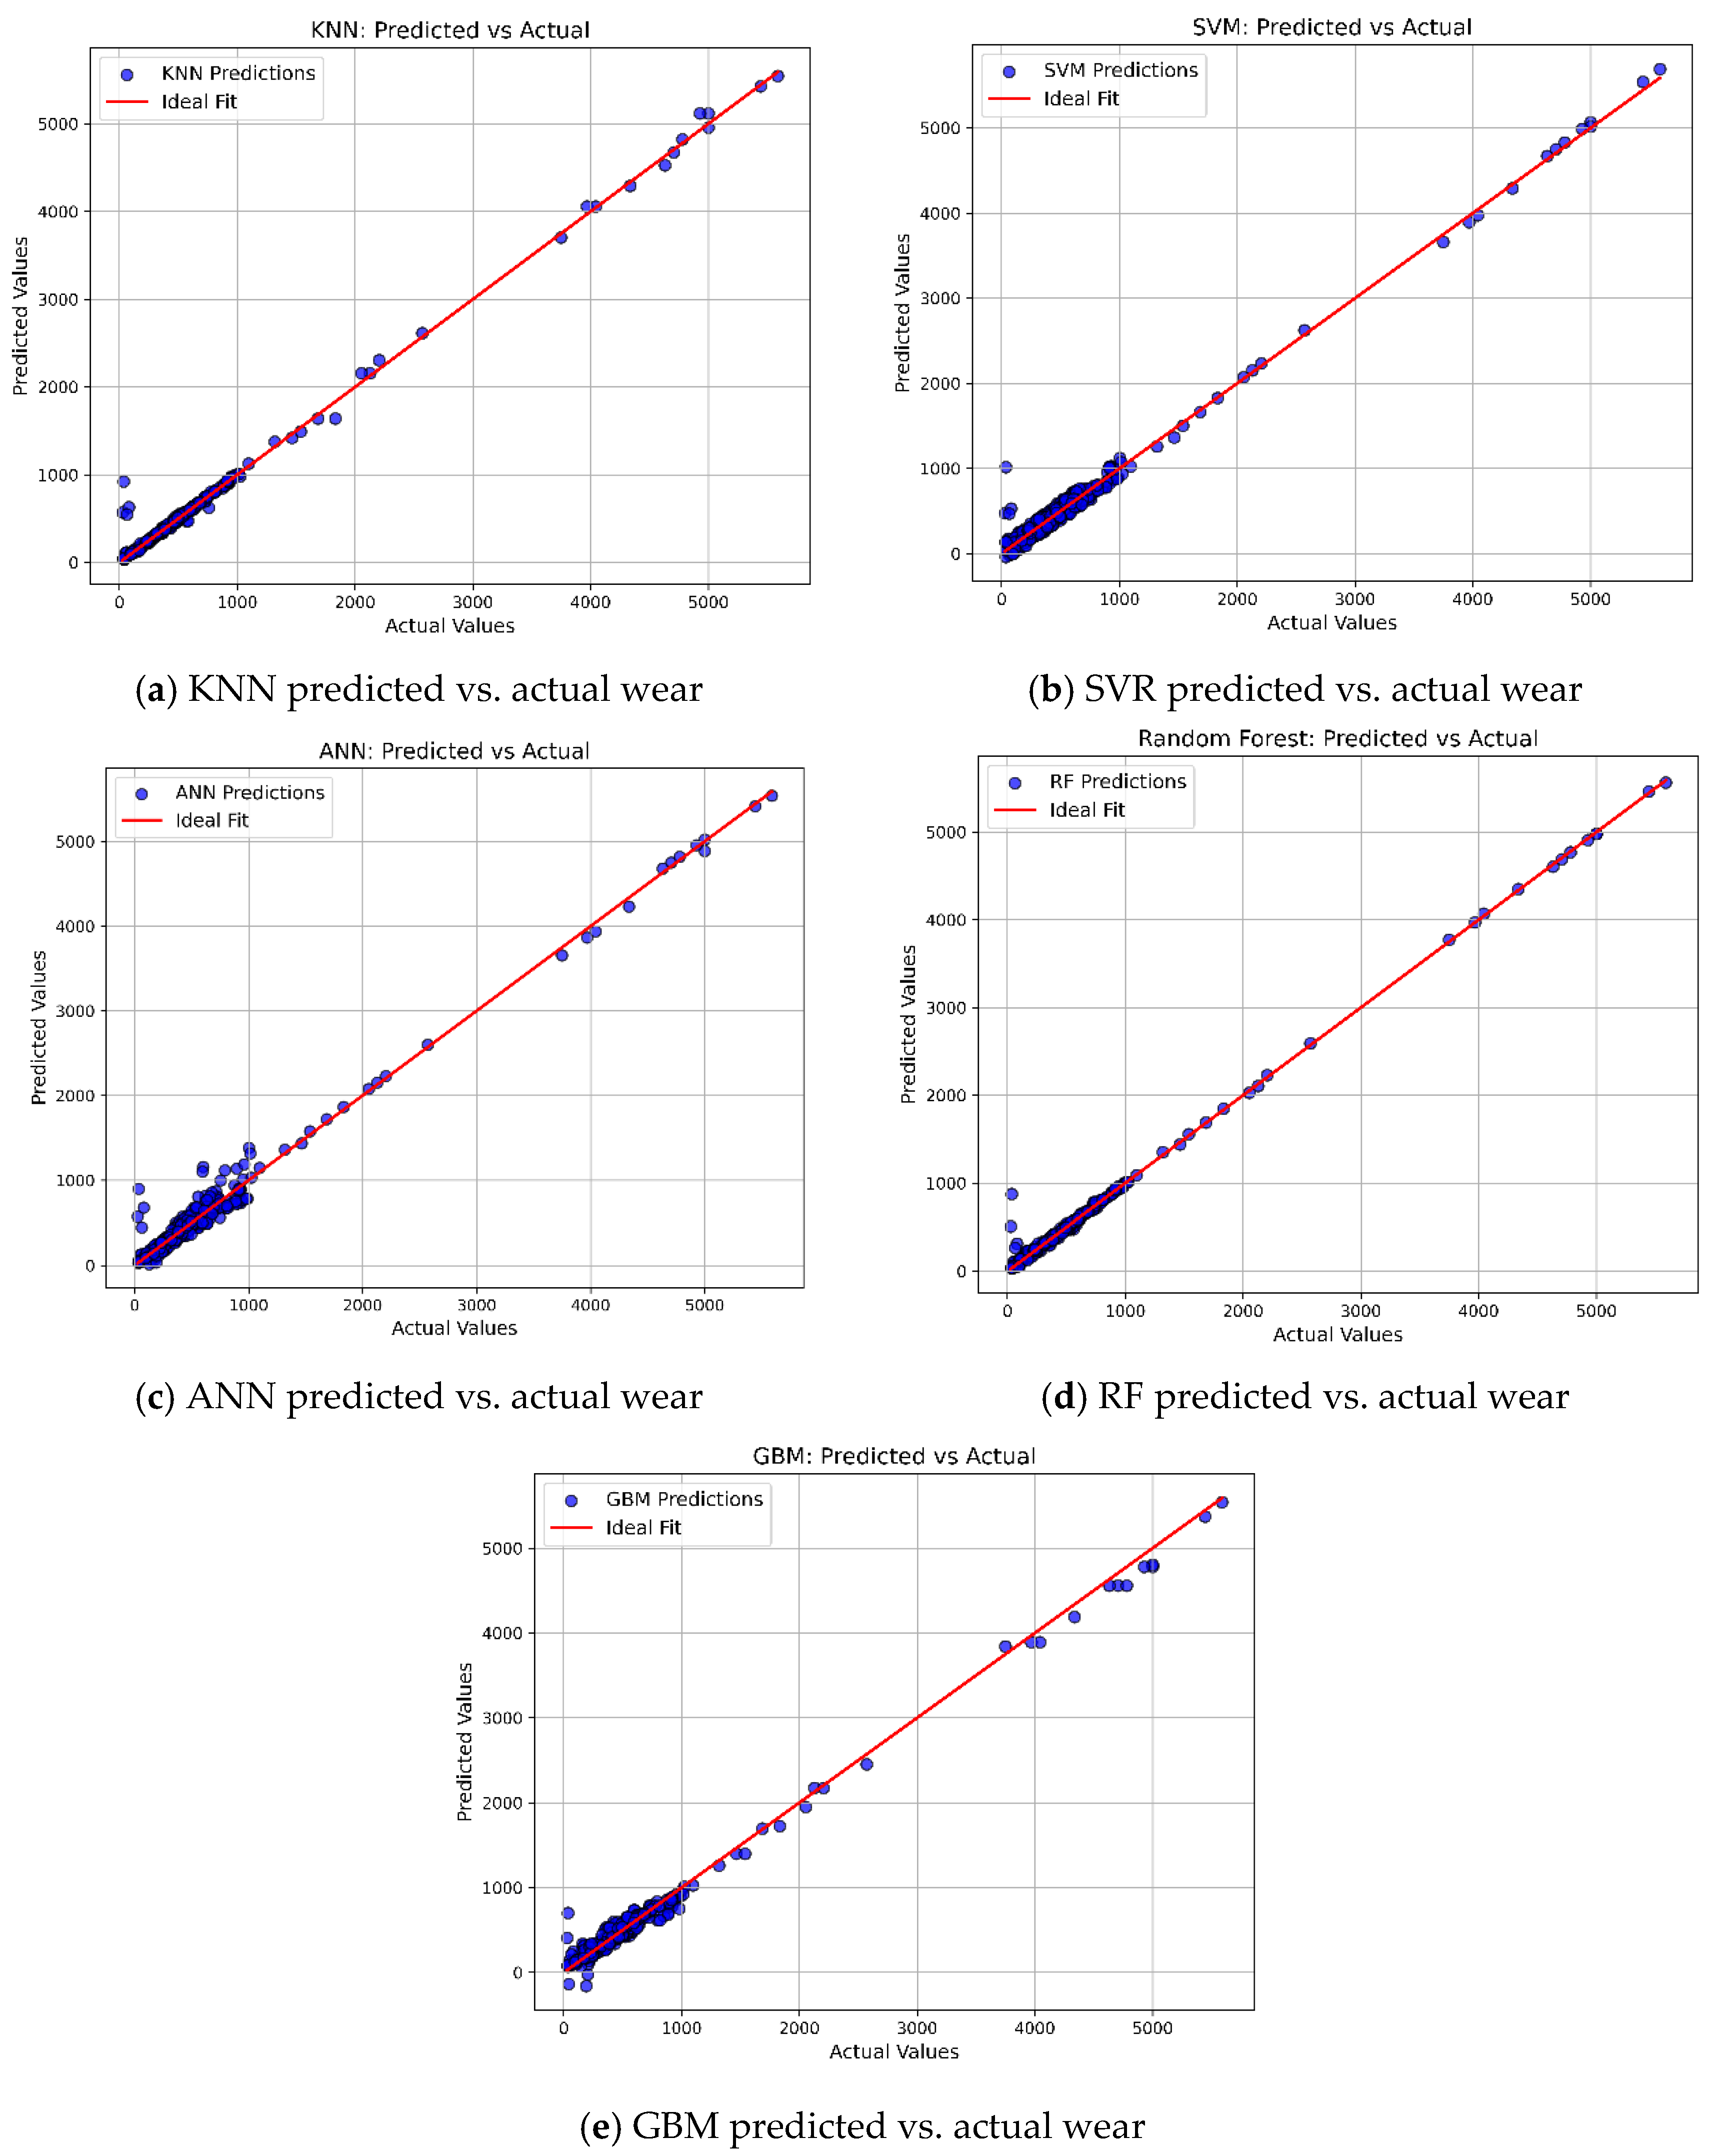
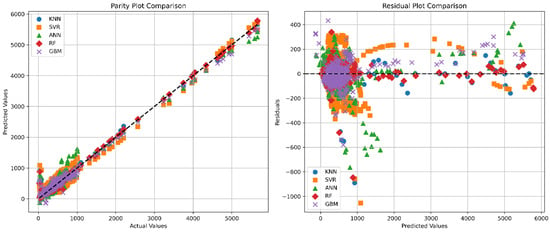
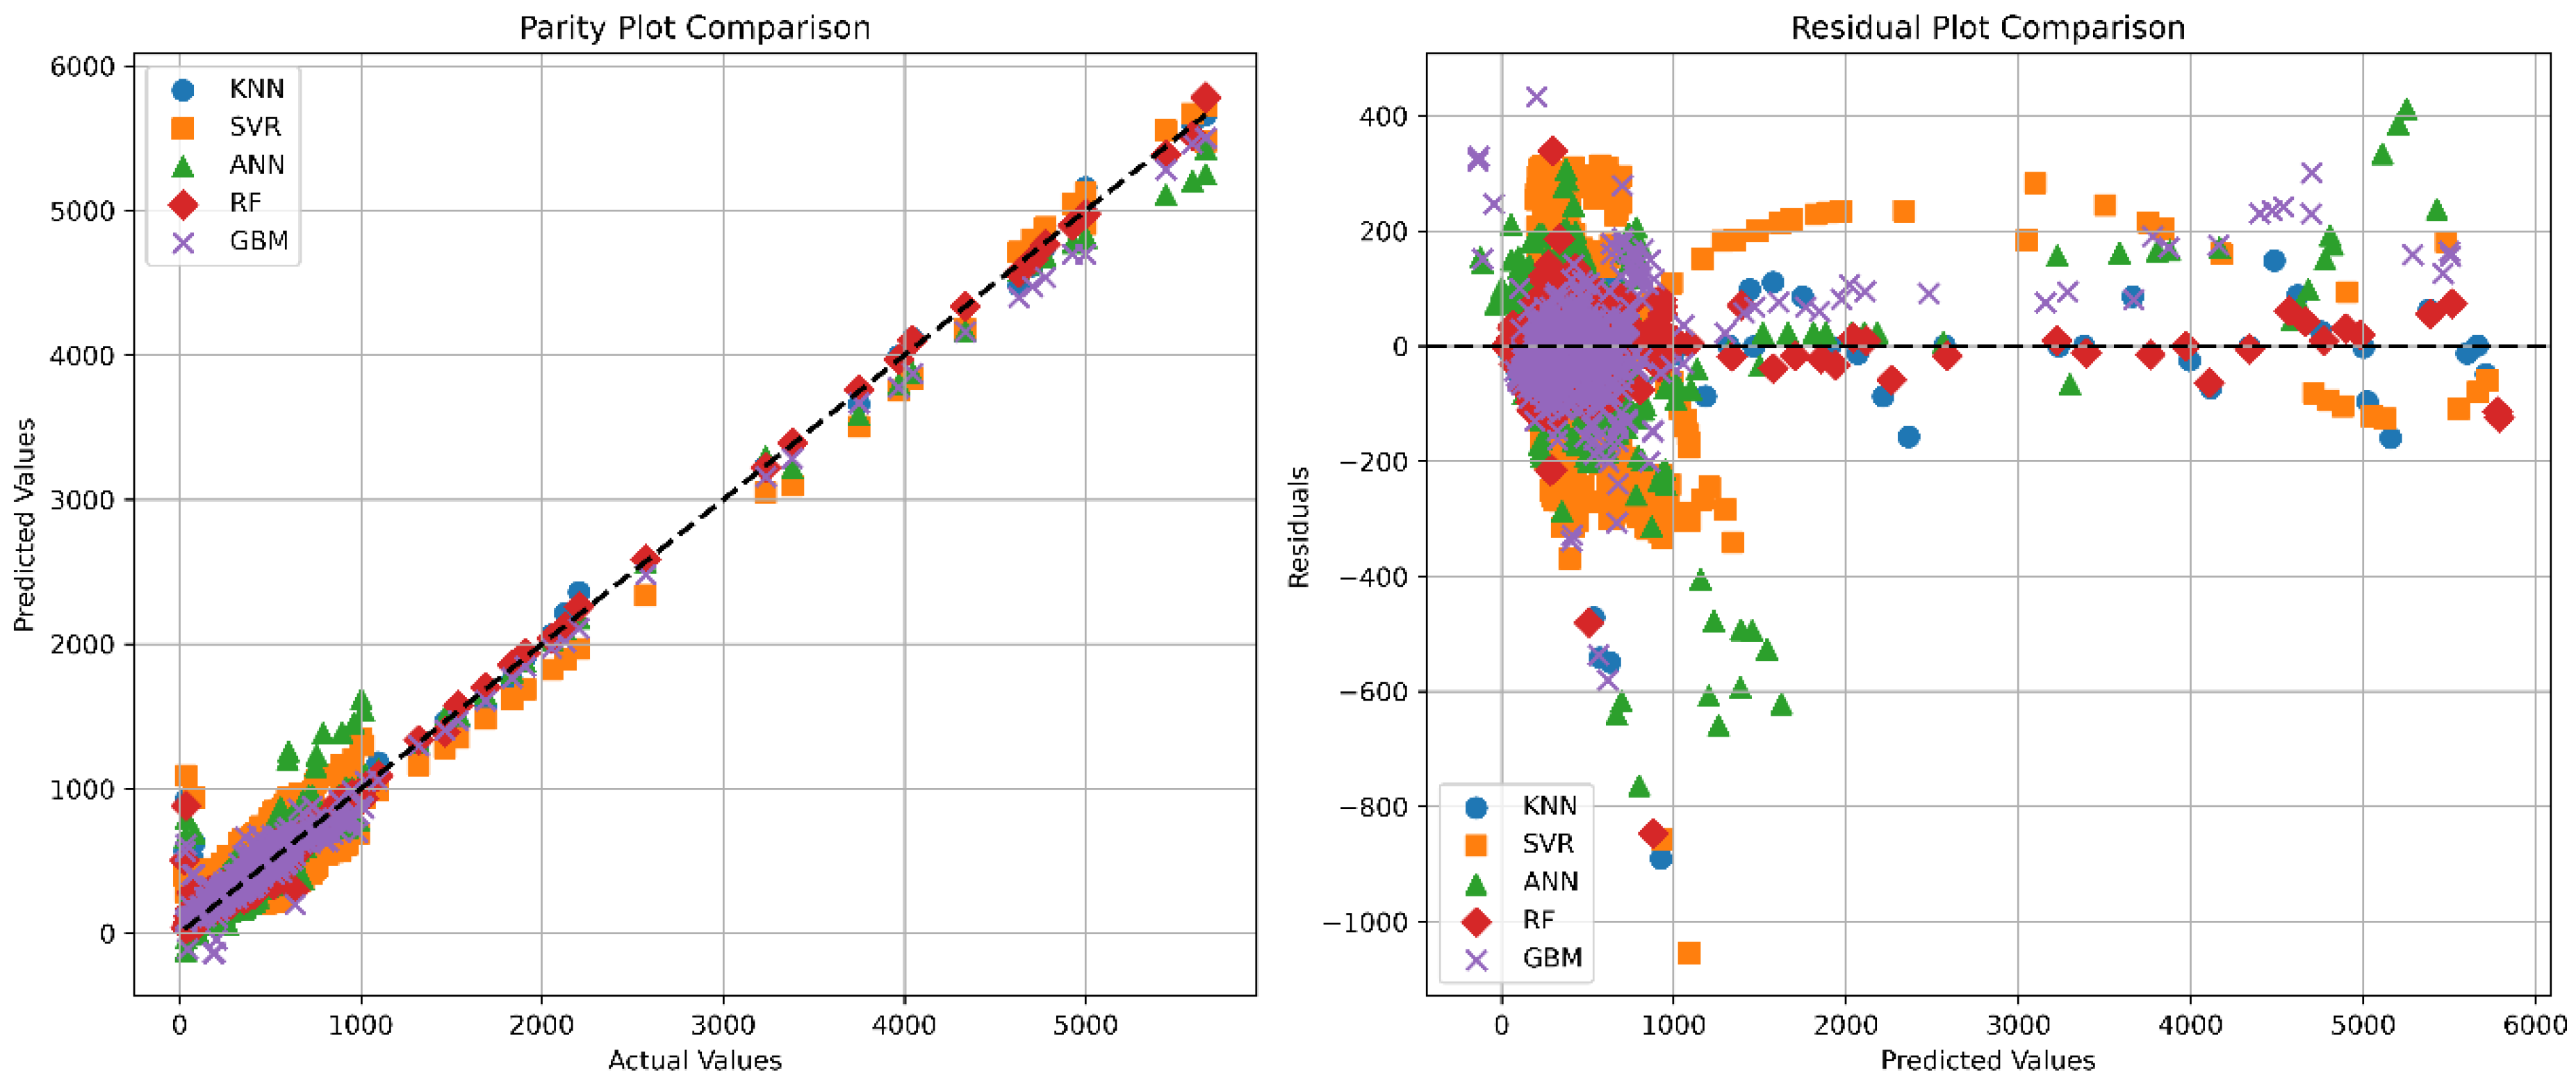

Disclaimer/Publisher’s Note: The statements, opinions and data contained in all publications are solely those of the individual author(s) and contributor(s) and not of MDPI and/or the editor(s). MDPI and/or the editor(s) disclaim responsibility for any injury to people or property resulting from any ideas, methods, instructions or products referred to in the content. |
© 2026 by the authors. Licensee MDPI, Basel, Switzerland. This article is an open access article distributed under the terms and conditions of the Creative Commons Attribution (CC BY) license.