


Abstract
We examine cyclic nuclear reactions in the lead–bismuth (Pb–Bi) system near the s-process termination point. We present a numerical investigation of the isotopic evolution and decay heat generation in an extended 60-isotope nuclear reaction network under continuous 30 keV neutron irradiation (– n cm−2 s−1) using the Chebyshev Rational Approximation Method (CRAM). The network accounts for 88 transitions, utilising a hybrid data approach that combines neutron capture cross-sections from EAF-2010 and TALYS with fundamental decay properties from the ENDF/B-VIII.0. Our simulations reveal two distinct evolutionary regimes. At moderate fluxes (– n cm−2 s−1), the system establishes a steady cyclic loop driven by the -decay of , successfully reproducing the s-process termination isotopic distribution (), characteristic of low-metallicity AGB stars. As the flux exceeds n cm−2 s−1, the classical balance breaks down, propelling mass flow toward heavier trace isotopes and suggesting a potential transition into the intermediate neutron capture (i-process) regime. Heat density calculations demonstrate that while the energy release of the core cycle plateaus near W cm−3, the extended chain drives an energy surge to over W cm−3 at n cm−2 s−1 before the system enters an unstable transient state at extreme fluxes.
1. Introduction
Various mechanisms have been proposed to explain the nucleosynthesis of heavy elements [1,2,3,4,5,6], among which the slow neutron capture process (s-process) is one of the most significant [7]. It involves the sequential capture of neutrons under relatively low flux conditions [1,2,8]. The nuclei involved in the s-process evolve along the valley of -stability, forming isotopes ranging from iron to bismuth. Beyond bismuth, isotopes such as polonium become too short-lived to capture additional neutrons before decaying [9]. Consequently, the s-process effectively terminates at 209Bi, the heaviest stable nuclide achievable via this mechanism [7].
Termination of the s-process does not always result in a stable abundance pattern. In specific stellar environments, 209Bi may capture one or more neutrons, forming unstable isotopes that subsequently undergo a sequence of -decays [7]. These decay chains recycle the material back to stable lead isotopes (206Pb, 207Pb, 208Pb) and to 209Bi, thus establishing a repetitive cycle.
Circulation of material within the lead–bismuth region constitutes a closed nuclear cycle, in which a dynamic equilibrium is established between neutron capture and -decay [7,9]. Such cyclic behavior becomes particularly prominent in some astrophysical systems, e.g., asymptotic giant branch (AGB) stars with masses around and metalicities of approximately , where physical conditions favor the efficient accumulation of lead [7].
The observed spectra of the kilonova GW170817 emerges another direction in modelling the abundance of heavy elements produced during the r-process; see, e.g., [10,11,12] and references therein. Recent non-LTE regime studies suggest that helium may dominate at late epochs [13] with its mass fraction expected from -decays of trans-Pb nuclei and indirect signature of elements production beyond the third r-process peak [14].
Cyclic nuclear processes are also essential in advanced nuclear technologies. In particular, in reactors using a lead–bismuth eutectic (Pb–Bi) as a coolant, a sequential transformation of 209Bi into 210Po occurs via neutron capture followed by -decay and subsequent -decay, ultimately leading to the regeneration of lead and bismuth [15]. This transformation establishes a closed reaction cycle analogous to the recycling mechanism observed in the s-process of nucleosynthesis. However, due to the high radiotoxicity of 210Po, specific removal techniques such as alkaline extraction are employed in Pb–Bi reactor systems [16,17].
The study explores the conceptual foundation for utilising a cyclic nuclear reaction mechanism. Our numerical simulations demonstrate that certain compositions of lead, bismuth, and polonium isotopes remain stable over time under various neutron fluxes, forming a self-sustaining nuclear cycle accompanied by energy release. The outline of the article is the following: in Section 2 we describe the methods used, with Section 2.1 demonstrating the reaction channels and general scheme, Section 2.2 showing a set of basic equations, and Section 2.3 giving the calculation algorithm and the database used. We present calculation results and discuss them in the following Section 3, showing concentrations of isotopes evolving in time under changing neutron flux in Section 3.1, isotope stable composition at saturation in Section 3.2, and corresponding energy release capabilities in Section 3.3. Finally, we summarise the outcome of this study in Section 4.
2. Methods
The evolution of isotopic composition is calculated using the matrix form of the Bateman equations, which accounts for both decay and neutron capture. To compute the matrix exponential, the CRAM method is used, offering high accuracy for large nuclear networks [18]. Additionally, the modeling parameters are described: the nuclear data source, the selected neutron flux values, and the criteria for reaching equilibrium. The method for calculating the heat generation density is also presented.
2.1. Channels and Scheme of the Cyclic Nuclear Reactions
Cyclic nuclear reactions initiated by free neutrons can proceed through multiple channels that differ in the sequence of neutron captures and -decays. However, all possible scenarios share the same total number of elementary events: each cycle involves four neutron captures, two -decays, and one final -decay that returns the system to its original state.
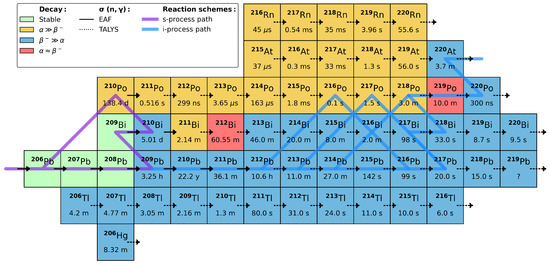
A schematic representation of such transformations for the isotopes of lead (Pb), bismuth (Bi), and polonium (Po) is shown in Figure 1 by semi-transparent purple lines, and was first discussed by Clayton & Rassbach [9] in the context of explaining the termination of the s-process. It was demonstrated that under neutron fluxes ranging between (–) n cm−2 s−1, the formation of isotopes beyond polonium is suppressed due to rapid -decay. Authors were primarily focused on the accumulation of stable lead and bismuth isotopes (green labels). Neutron capture by unstable nuclei (yellow/blue labels) was deliberately excluded from consideration due to their low neutron capture probability and limited nuclear reactions data available at the time. However, a later study [7] demonstrated that recycling through -unstable isotopes beyond 210Bi does occur, despite its contribution to the overall isotopic distribution being shown to be negligible.
Figure 1.
Extended scheme of the cyclic nuclear reactions to search for the equilibrium isotopic concentrations. Label colors indicate dominant -decay (yellow) or -decay (blue) radioisotopes, while stable isotope labels are colored green. Transitions via neutron capture are indicated by arrows, with cross-sections data taken from the experimental EAF 2010 database (solid arrows), otherwise theoretically derived from TALYS code (dotted arrows). The cyclic scheme, as was first discussed in Clayton & Rassbach (1967) [9] in the context of termination of the s-process, is shown by semi-transparent purple lines. Recent studies of the i-process reaction path are indicated by semi-transparent blue lines [19]. A question mark for half-life of 219Pb isotope indicates unconstrained value.
While we examine the same isotopic transformations, our special attention is directed toward the termination region of the s-process, including nuclides that occurred beyond the cyclic scheme. The identification of the equilibrium isotopic composition of the s-process termination elements under various neutron irradiation rates was set as the primary objective, together with the energy yield of the resulting reaction chain to be calculated for the complete reaction network. To evaluate the influence of highly unstable reaction paths on this Pb-Bi-Po region, the reaction network was expanded (Figure 1) by superimposing additional layers that enter the region of the intermediate neutron capture process (i-process), as shown in recent studies; see the review [19] for details.
We use a significantly extended network, illustrated in Figure 1. Unstable isotopes are color-coded to indicate their most probable decay mode, with blue for -decay, and yellow for -decay dominant branching; competing decay ratios are highlighted with red labels. Neutron capture reactions with solid arrows denote transitions based on experimental data from the EAF-2010 database [20], whereas dashed arrows indicate theoretical neutron transitions derived from the TALYS code [21]. To ensure the mathematical completeness of the transition matrix, all pertinent unstable isotopes and minor decay channels, such as the low-probability -decay transition of to , and various other unlikely composite pathways are included in the calculations. This makes the core reaction chain around the termination point evolve freely without false returns from cross branches. The reaction network is artificially truncated at the specific boundary isotopes, , , , , , , and , and a “leakage” of nuclei out of the simulated system is induced by any further neutron capture events, as these isotopes physically continue to absorb neutrons but exit the defined computational domain. In total, the network is built from 60 isotopes and accounts for 88 reactions.
2.2. Basic Equations
A set of basic equations should be provided to model changes in isotope concentration. We make use of the Bateman equation [22]:
where and represent the decay constant and the neutron capture cross-section () of nuclide i, respectively. The terms and correspond to the probabilities of nuclide j transforming into nuclide i through radioactive decay and neutron capture, respectively, while denotes the thermal neutron flux.
Equation (1) can alternatively be expressed in matrix form. Defining as the vector of isotope concentrations, such that , the system of differential equations can be written as follows [23]:
where denotes the burnup matrix, whose coefficients are related to decay processes and neutron capture reactions.
The solution to Equation (2) can be written as
where is the matrix exponential.
The matrix exponential can be calculated using various numerical methods [24,25], with applications in nuclear burnup calculations [23,26]. Among these, the Chebyshev Rational Approximation Method (CRAM) is one of the most efficient and widely used approaches. The CRAM approach uses rational functions to approximate the matrix exponential [18,27,28] and is expressed as:
here, and denote polynomials of degree k, and represents the corresponding rational approximation.
The CRAM is particularly well-suited for solving burnup equations since the eigenvalues of burnup matrices typically lie close to the negative real axis. This spectral property enables CRAM to achieve high numerical accuracy with a relatively small number of terms in the approximation. For instance, the 16th-order CRAM is often used in practical applications involving large isotopic networks over extended periods. In more complex scenarios, higher-order variants, such as 32nd- and 48th-order approximations, are also available and demonstrate an improved precision [28].
2.3. Nuclear Database and Calculation Algorithm
For burnup calculations, fundamental decay data, specifically decay modes, half-life and decay energy required for modeling isotopic transmutations, are adopted directly from the ENDF/B-VIII.01 database [29]. For the core reaction chain comprising , , , and , neutron radiative capture cross-sections are retrieved primarily from the EAF-2010 database, which provides tabulated Maxwellian-averaged cross-sections (MACS)2. However, for the extended reaction network involving highly unstable isotopes beyond this primary group, experimental data are often lacking. In such cases, we utilise theoretical cross-section data generated via the TALYS code3. These theoretical, energy-dependent cross-sections are subsequently averaged over the Maxwell–Boltzmann distribution as shown in [30].
According to the simplified reaction chain (purple lines in Figure 1), the sequential capture of four neutrons followed by a series of - and -decays results in a net energy release. Based on values of mass excesses and nuclear binding energies, the amount of energy released in a single reaction cycle can be roughly estimated as , where is the neutron mass and is the mass of the resulting -particle (helium nucleus).
For the total energy release of the extended reaction scheme (Figure 1), we use the heat density, in units of W cm−3:
where the first term corresponds to the energy produced by - and -decays, and the second accounts for energy generated via neutron capture reactions. We consider only the energy released by radioactive - and -decays, providing the dominant contribution to the total heat output. Therefore, the contribution from neutron capture reactions is omitted in Equation (6).
The heat density (W cm−3) is evaluated at the point when the isotopic composition stabilises. The equilibrium time corresponding to the stable composition (plateau) is defined as the moment indicating that further accumulation of the isotope is negligible, .
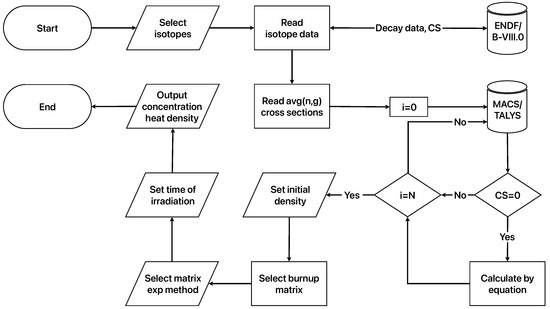
In Figure 2 we provide a diagram for determining the isotopic composition and heat generation using the burnup matrix method. The simulation begins with the irradiation of the lead isotope , which is assigned an initial isotopic number density of %. The numerical modeling is carried out under the assumption of a constant neutron flux over time, taking values between – n cm−2 s−1 with a step of two orders of magnitude. Neutrons with an energy of 30 keV are used for irradiation [7,9]. At this energy, as in the case of thermal neutrons, only two reaction channels dominate in the evaluated nuclear data libraries, namely elastic scattering and radiative capture. To account for the competing spontaneous transmutation pathways, fundamental decay data such as half-lives, decay modes and energy are adopted from the ENDF/B-VIII.0. The simulation proceeds until equilibrium is reached. The resulting concentrations of all produced isotopes are normalised to . Thus, the reported isotopic abundances represent the ratio , where is the number concentration of each respective isotope.
Figure 2.
Block scheme for calculating the isotope composition and heat density generation based on burnup matrix.
3. Results and Discussion
In this section, we analyse the equilibrium composition, its evolution over the various neutron fluxes, and the corresponding heat production both for the core cyclic reaction chain, , , , , and for the complete network. Being realistic with neutron flux range, we nevertheless speculate on some patterns during higher flux regimes ( n cm−2 s−1).
3.1. Time Evolution of the Extended Scheme of Isotopes
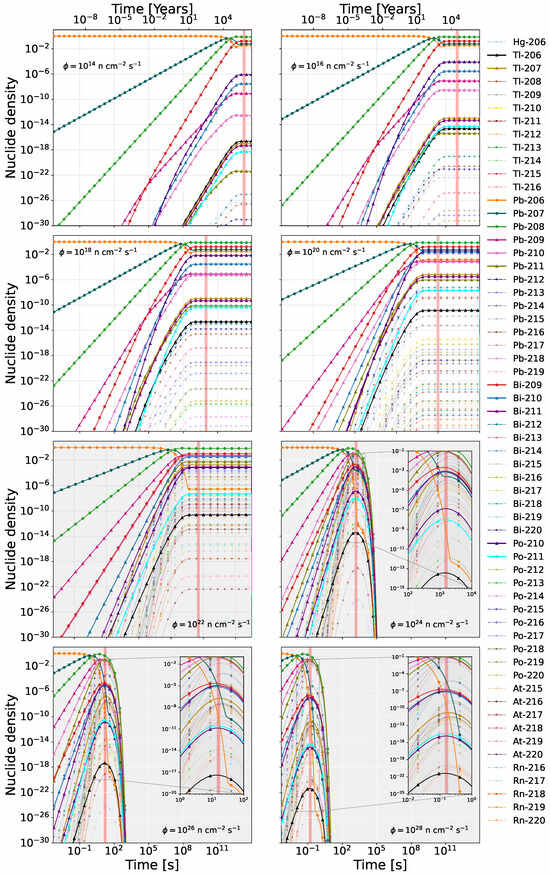
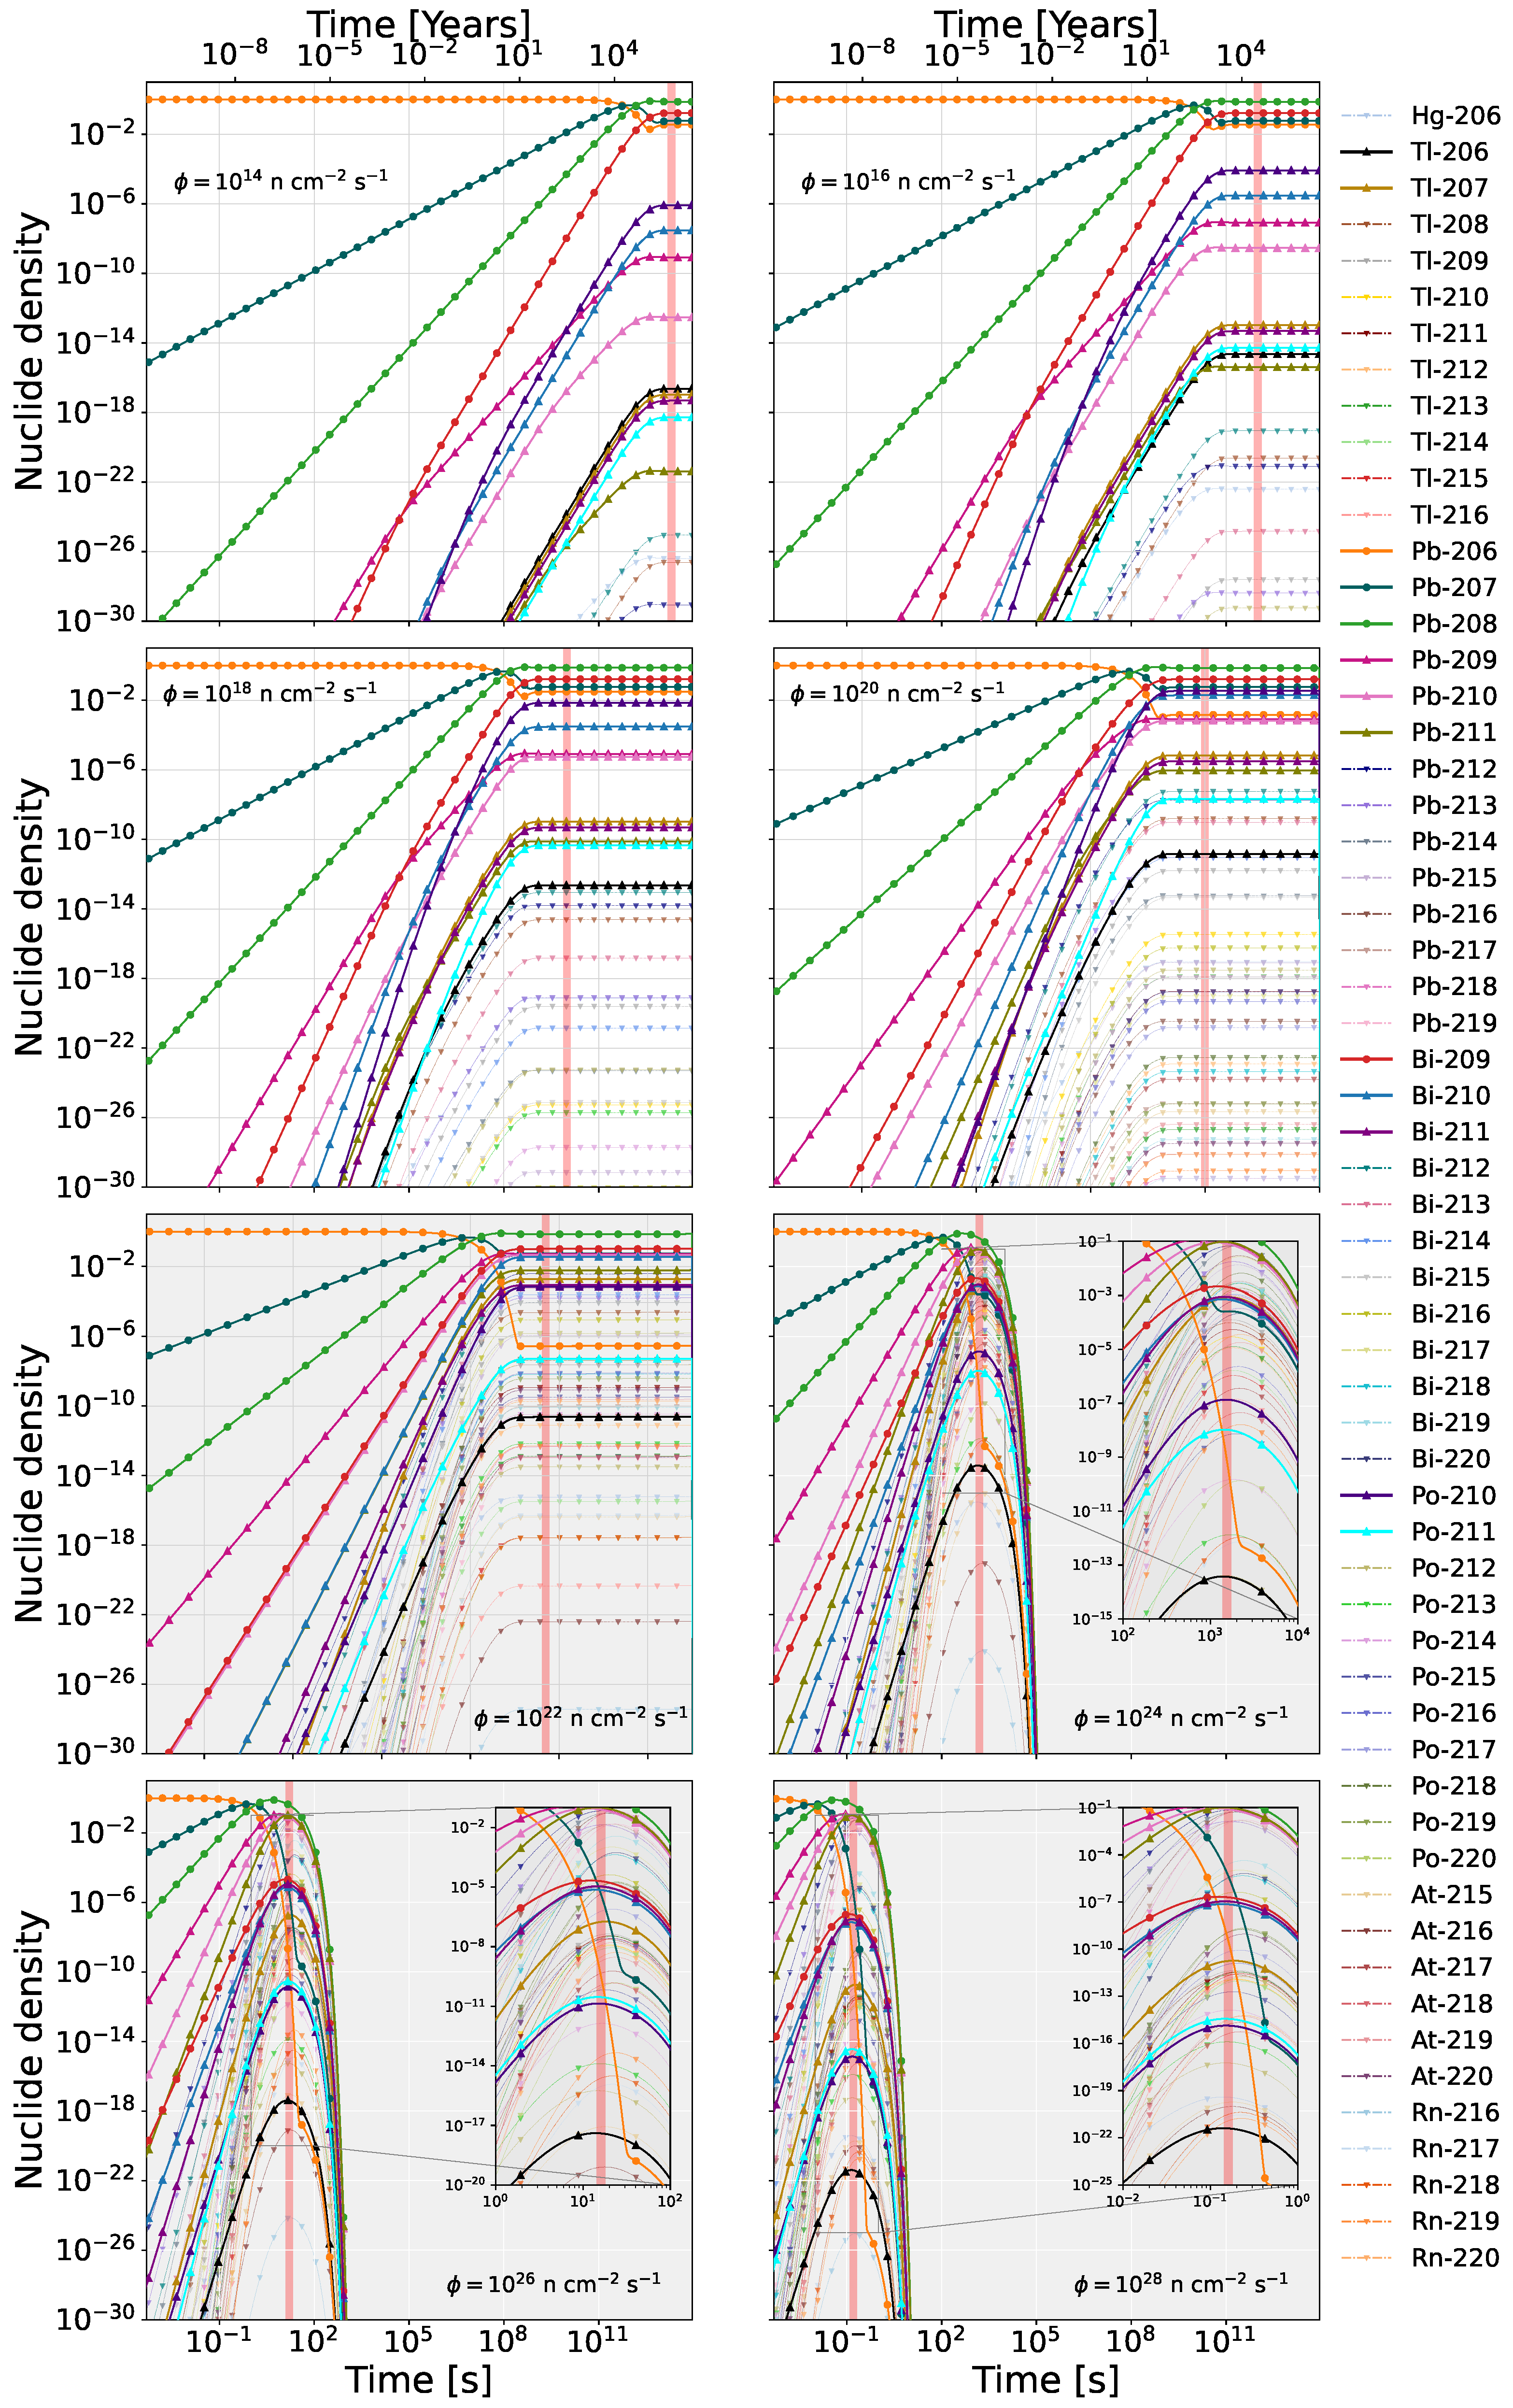
The calculation outcome for the time evolution of isotope concentrations is summarised in Figure 3. Stable nuclides are shown with solid curves, while radionuclides are indicated by dashed curves. The isotope density is a dimensionless quantity normalised to the initial amount of . In particular, the concentration of gradually ceases to a certain minimum level, while the concentrations of the other nuclides increase until they reach their respective saturation. These saturations (vertical semi-transparent red bands) define what is referred to as the “plateau” of stable isotopic composition for each neutron flux mode. The time required to reach a stable isotopic composition decreases with increasing neutron flux, ranging from thousands of years to a few hours. Furthermore, the panels corresponding to extremely high neutron fluxes ( n cm−2 s−1) are highlighted with a gray color, indicating domains where the numerical solution of the matrix exponential exhibits instability. For those regimes where no saturation plateau is observed, the equilibrium cut is set at the peak concentration of 210Po, the latter being the first -radioisotope in a chain with the longest half-life parameter; see Figure 1.
Figure 3.
Time-dependent evolution of the isotopic concentrations for the extended reaction network under varying neutron fluxes. The calculations utilise fundamental decay data from ENDF/B-VIII.0, neutron capture cross-sections from MACS (EAF 2010) for the core isotopes and theoretical TALYS data for the highly unstable region (shaded panels). Due to the absense of a prominent plateau for the unstable region ( n cm−2 s−1), the concentration cuts (vertical semi-transparent red band) were done at maximum number of , the latter being the first -radioisotope in a chain with the longest half-life parameter. Shaded panels indicates unstable higher flux region and its simulation results are a matter of speculation.
The depletion of the initial irradiated isotope (solid orange) becomes more pronounced as the neutron flux rises. Specifically, its equilibrium amount drops by approximately four orders of magnitude while the flux rises from to n cm−2 s−1.
In the flux range of to n cm−2 s−1, the equilibrium concentrations of other stable nuclides exhibit only minor variations. The maximum values are observed at a flux of n cm−2 s−1, reaching 74% for , 5.9% for , and 16.5% for . At the same time, within this flux range, combined concentration of radionuclides at the s-process termination points is found to dominate among all radioactive isotopes. In particular, a maximum concentration of 3.5% is established for at a flux of n cm−2 s−1.
As the flux reaches the transitional threshold of n cm−2 s−1, the concentrations of traditional stable isotopes drop by several orders of magnitude. At this stage, formation of many intermediate isotopes is observed, which are highlighted in a thin translucent color. Notably, in this intermediate flux regime, the concentrations of , , , and level out and become comparable. A similar equalization occurs for the abundances of and . Conversely, the concentrations of and are absolute minimums.
In the extreme flux regime ( to n cm−2 s−1), the isotopic inventory is redefined by the breakout toward heavier masses. becomes the dominant species among radionuclides rapidly growing to a share at the highest flux levels. Intense recycling driven by the high neutron flux causes the equilibrium concentrations of and to level out and stabilize at comparable values. The concentration of remains negligible across all investigated scenarios. The remaining heavier radionuclides (At and Rn isotopes, as well as Po, Bi, Pb isotopes with , Tl with and Hg) actively participate in the rapid neutron-capture and decay processes. However, their individual equilibrium concentrations consistently remain at trace levels and do not significantly contribute to the overall mass balance of the system.
3.2. Isotope Concentration Pattern at the Equilibrium
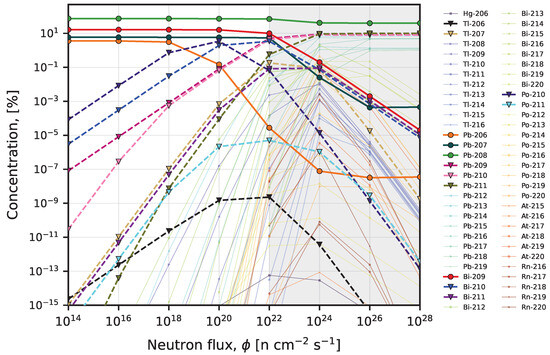
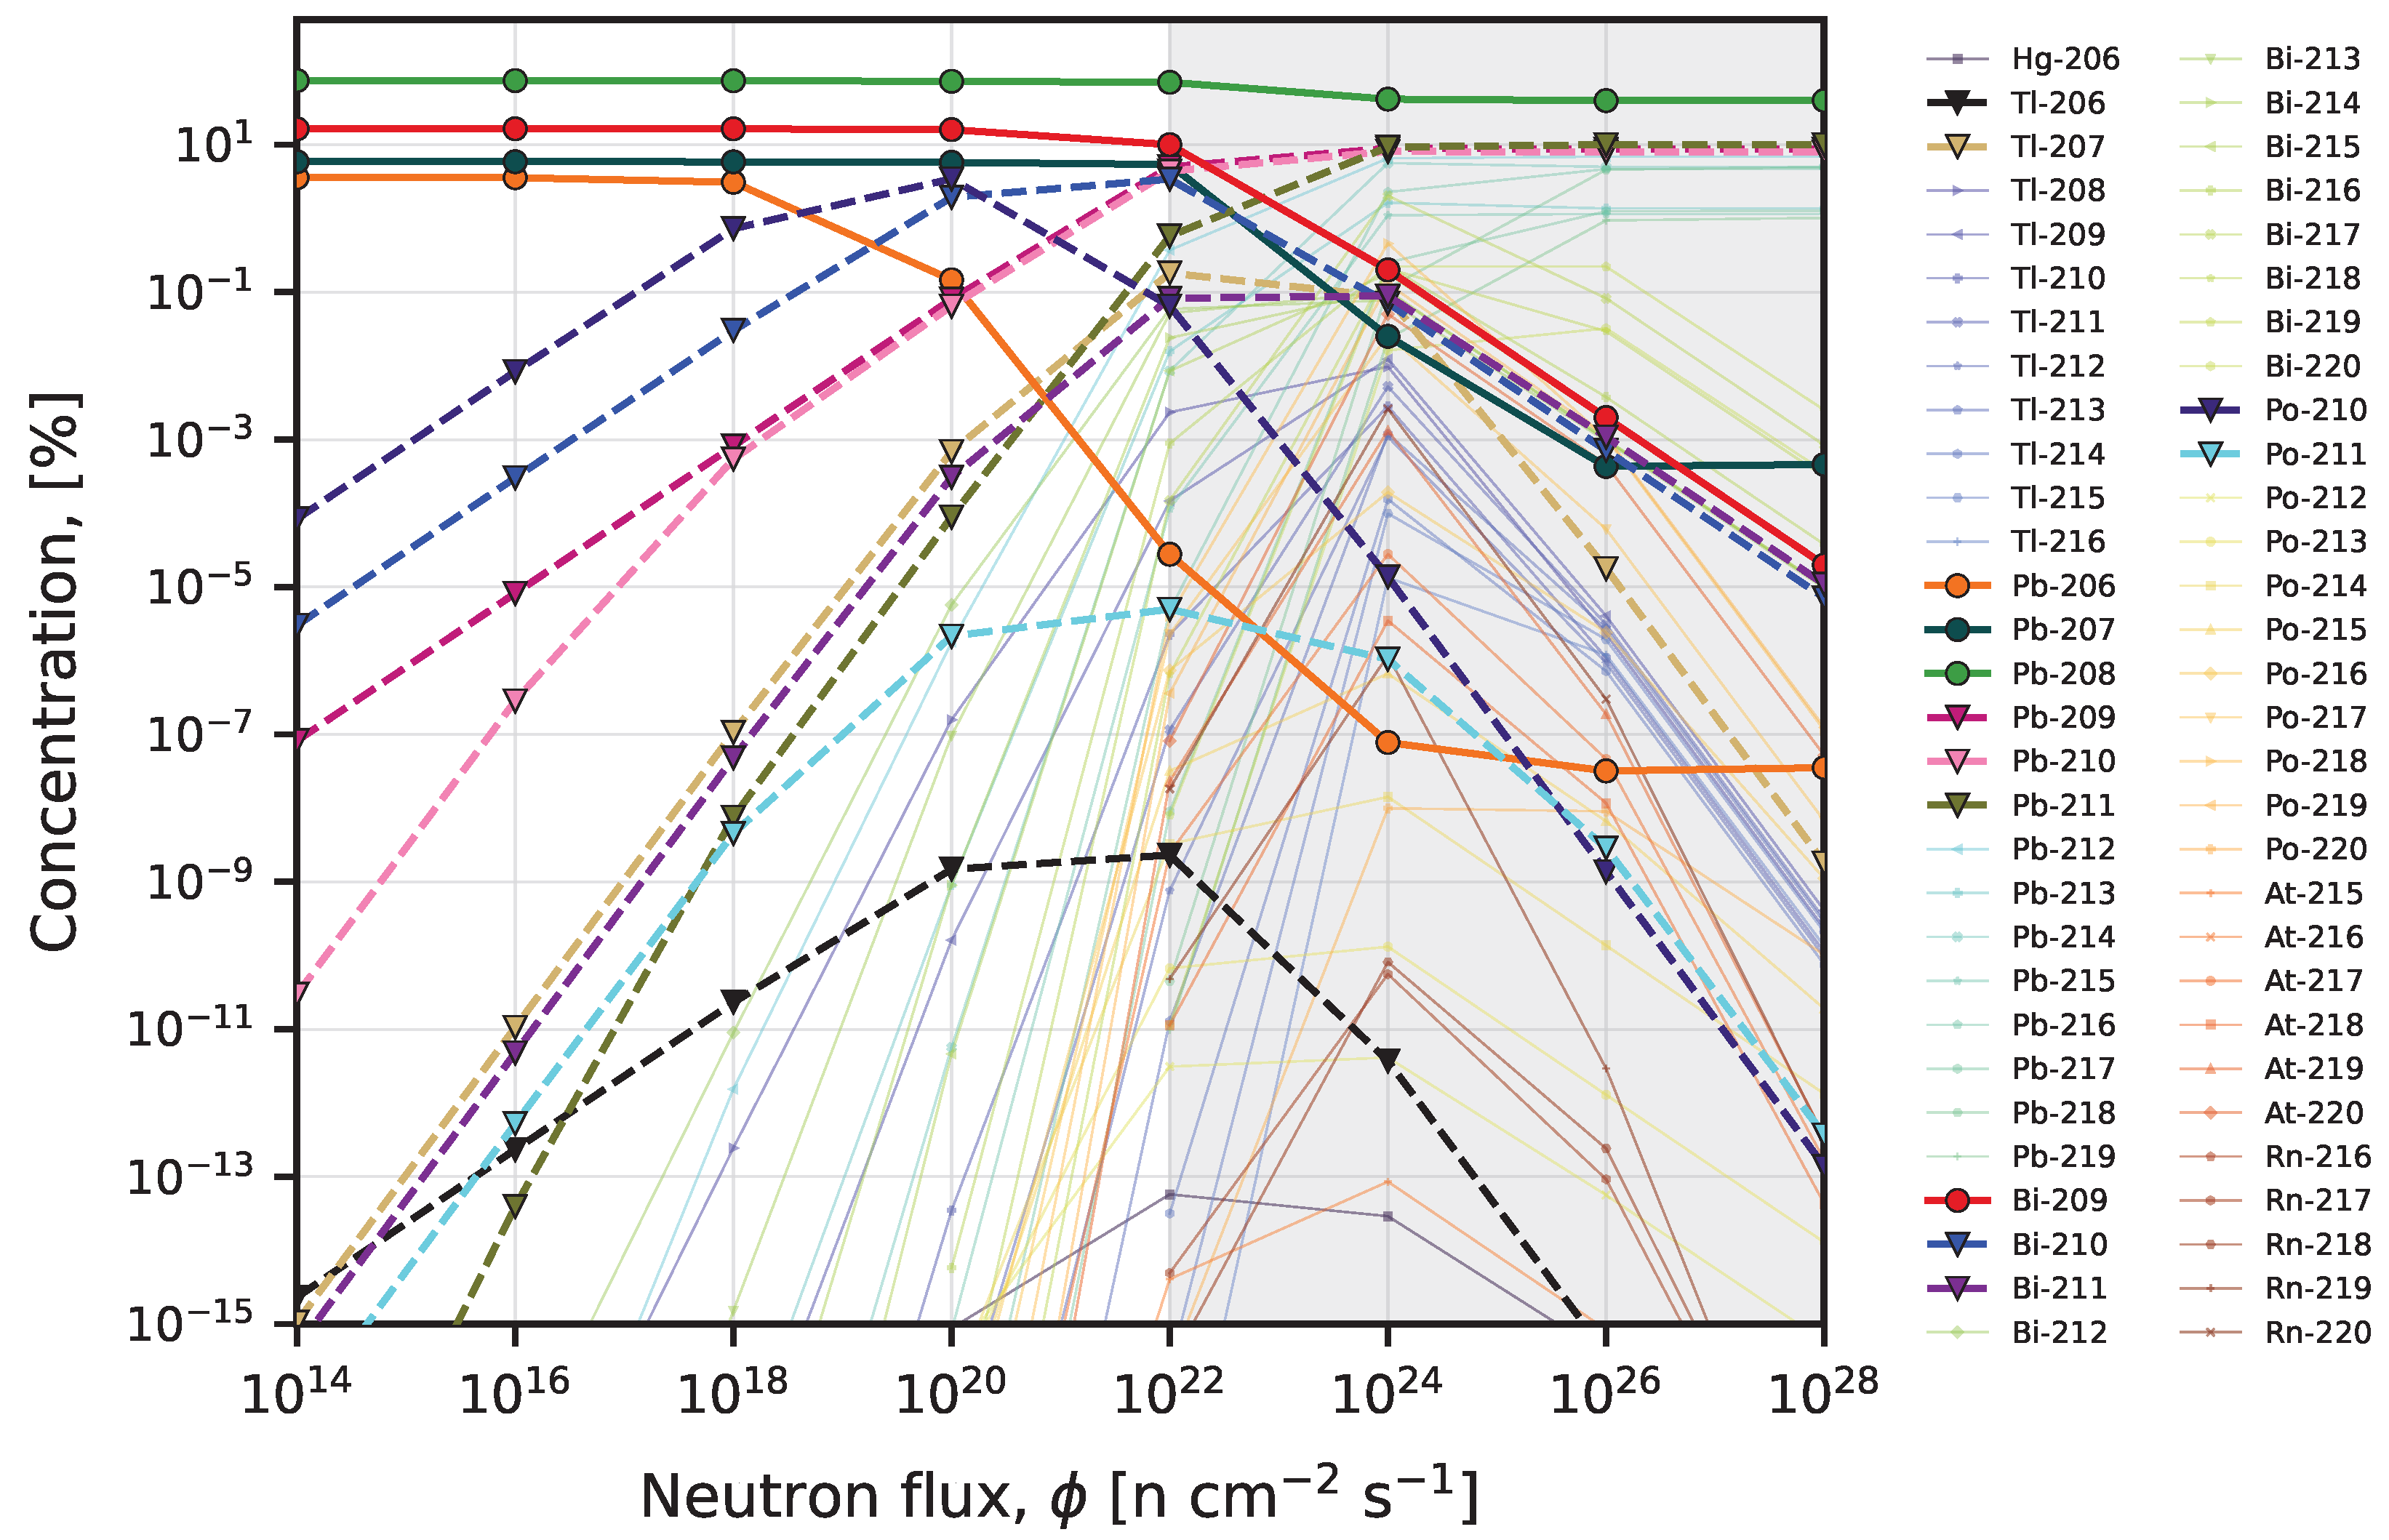
Figure 4 summarises the statistics on the equilibrium composition described in the previous section and is plotted against the range of neutron fluxes used in the calculations. The plot presents the equilibrium patterns of the network with core isotopes, , , , and , being highlighted. A general trend is observed: the total abundance of stable isotopes (solid lines) decreases with increasing neutron flux, while the fraction of generated radionuclides (dashed lines) increases correspondingly. The highly unstable region ( n cm−2 s−1, see Figure 3) is colored in gray to visually denote the shift in the isotope accumulation regime and the predominance of radionuclide production processes (lighter thin lines).
Figure 4.
Composition slices at equilibrium times (vertical semi-transparent red bands in Figure 3) showing isotope abundances for various neutron fluxes. Stable isotopes are indicated by solid lines, and radionuclides are shown in dash-dotted lines. Shaded area after n cm−2 s−1 indicates unstable higher flux region and its simulation results are a matter of speculation.
The isotopic equilibrium dynamics can be analysed by tracking the balance between radiative neutron capture and decay, particularly within the flux range of n cm−2 s−1. As depicted in the corresponding figure, the calculated abundances are visually categorized into the highlighted core isotopes, which drive the primary reaction cycle, and the remaining trace isotopes. Within this interval, the cyclic reaction scheme (shown in Figure 1) is largely maintained, and the overall equilibrium composition is dominated by the high concentrations of , , and . At the lower end of this range, decay processes dominate over neutron capture for the key nuclides. Consequently, makes the largest individual contribution to the stable isotopic mixture, possessing the smallest neutron capture cross-section among the isotopes in the scheme (according to EAF-2010). Concurrently, actively accumulates and effectively closes the cycle by returning to via -decay ( days).
However, as the neutron flux increases, the radiative capture rates gradually begin to rival the natural decay constants, fundamentally shifting the isotopic flow. Specifically, for ( s−1, barn), the capture and decay rates equalise at a corresponding flux of n cm−2 s−1. Similarly, for ( s−1, barn) and ( s−1, barn), this equivalence is reached at and ≈1.64 × 10²² n cm−2 s−1, respectively.
This evolving physical balance directly affects the isotopic ratios, driving a gradual transition from stable isotopes to radionuclides. At lower fluxes (– n cm−2 s−1), the abundance of significantly exceeds that of , maintaining its share at the level of 3.1–3.6%. However, as the flux surpasses the calculated transitional thresholds and reaches n cm−2 s−1, the concentration plummets to 0.15%. It gives way to , which reaches its absolute maximum of 3.45% and clearly prevails over , alongside the actively growing (1.93%). With a further increase to the threshold point of n cm−2 s−1, almost completely burns out (%), and the concentration decreases to 0.065%, while rises to its peak value of 3.42%. Concurrently, an intense and synchronous accumulation of and occurs, with their concentrations leveling out at a substantial 5.00% and 4.38%, respectively. The formation of mass 211 isotopes proceeds less intensively: reaches 0.58%, which is almost seven times higher than the 0.083% share of . Ultimately, this dynamic precedes the unstable high-flux regime (the gray zone, n cm−2 s−1), where the concentrations of all the aforementioned core cycle elements drop sharply due to the breakout toward heavier masses, feeding the inventory of trace isotopes.
It should also be noted that, for the considered fluxes, the amount of stays negligibly small in Figure 4. This is because the -decay branch of is strongly suppressed compared to its -decay, which favors the build-up of heavier bismuth isotopes and prevents the formation of . In contrast, is produced mainly via the -decay of , whose -decay probability is much higher than its -decay channel; consequently, the resulting amount of remains comparatively smaller.
Comparison of the calculated equilibrium concentrations (– n cm−2 s−1) with astrophysical models [31] reveals a structural alignment with the s-process component, which is characterized by the hierarchy . Astrophysically, this specific dominance is a signature of low-metallicity AGB stars [3]. In such environments, the deficit of initial iron seed nuclei ensures a high neutron-to-seed ratio, allowing the nucleosynthesis flow to efficiently bypass intermediate masses and reach the very end of the reaction chain. Notably, our continuous irradiation network demonstrates a higher efficiency in accumulating the terminal nucleus (∼16.5%) compared to standard pulsed models. However, as the neutron flux reaches n cm−2 s−1, this classical distribution breaks down completely, marking the disruption of the standard s-cycle and the system’s transition into the intermediate i-process regime.
The flux range where these kind of transitions occur corresponds to the conditions of the intermediate neutron capture process, the i-process; see [19,32,33]. Under such extreme neutron exposures, the probability of short-lived isotopes capturing an additional neutron before decaying, e.g., via the 211PbPb reaction, becomes highly probable. The activation of these heavier channels could delay the -recycling, propagate the mass flow towards heavier elements, and fundamentally alter both the final isotopic equilibrium and the resulting energy release; see the next section.
3.3. Energy Release During the Cyclic Reaction Chain
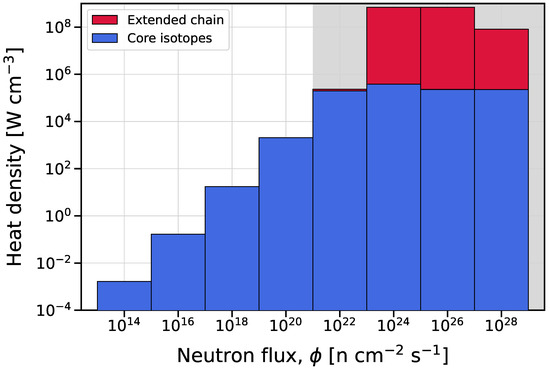
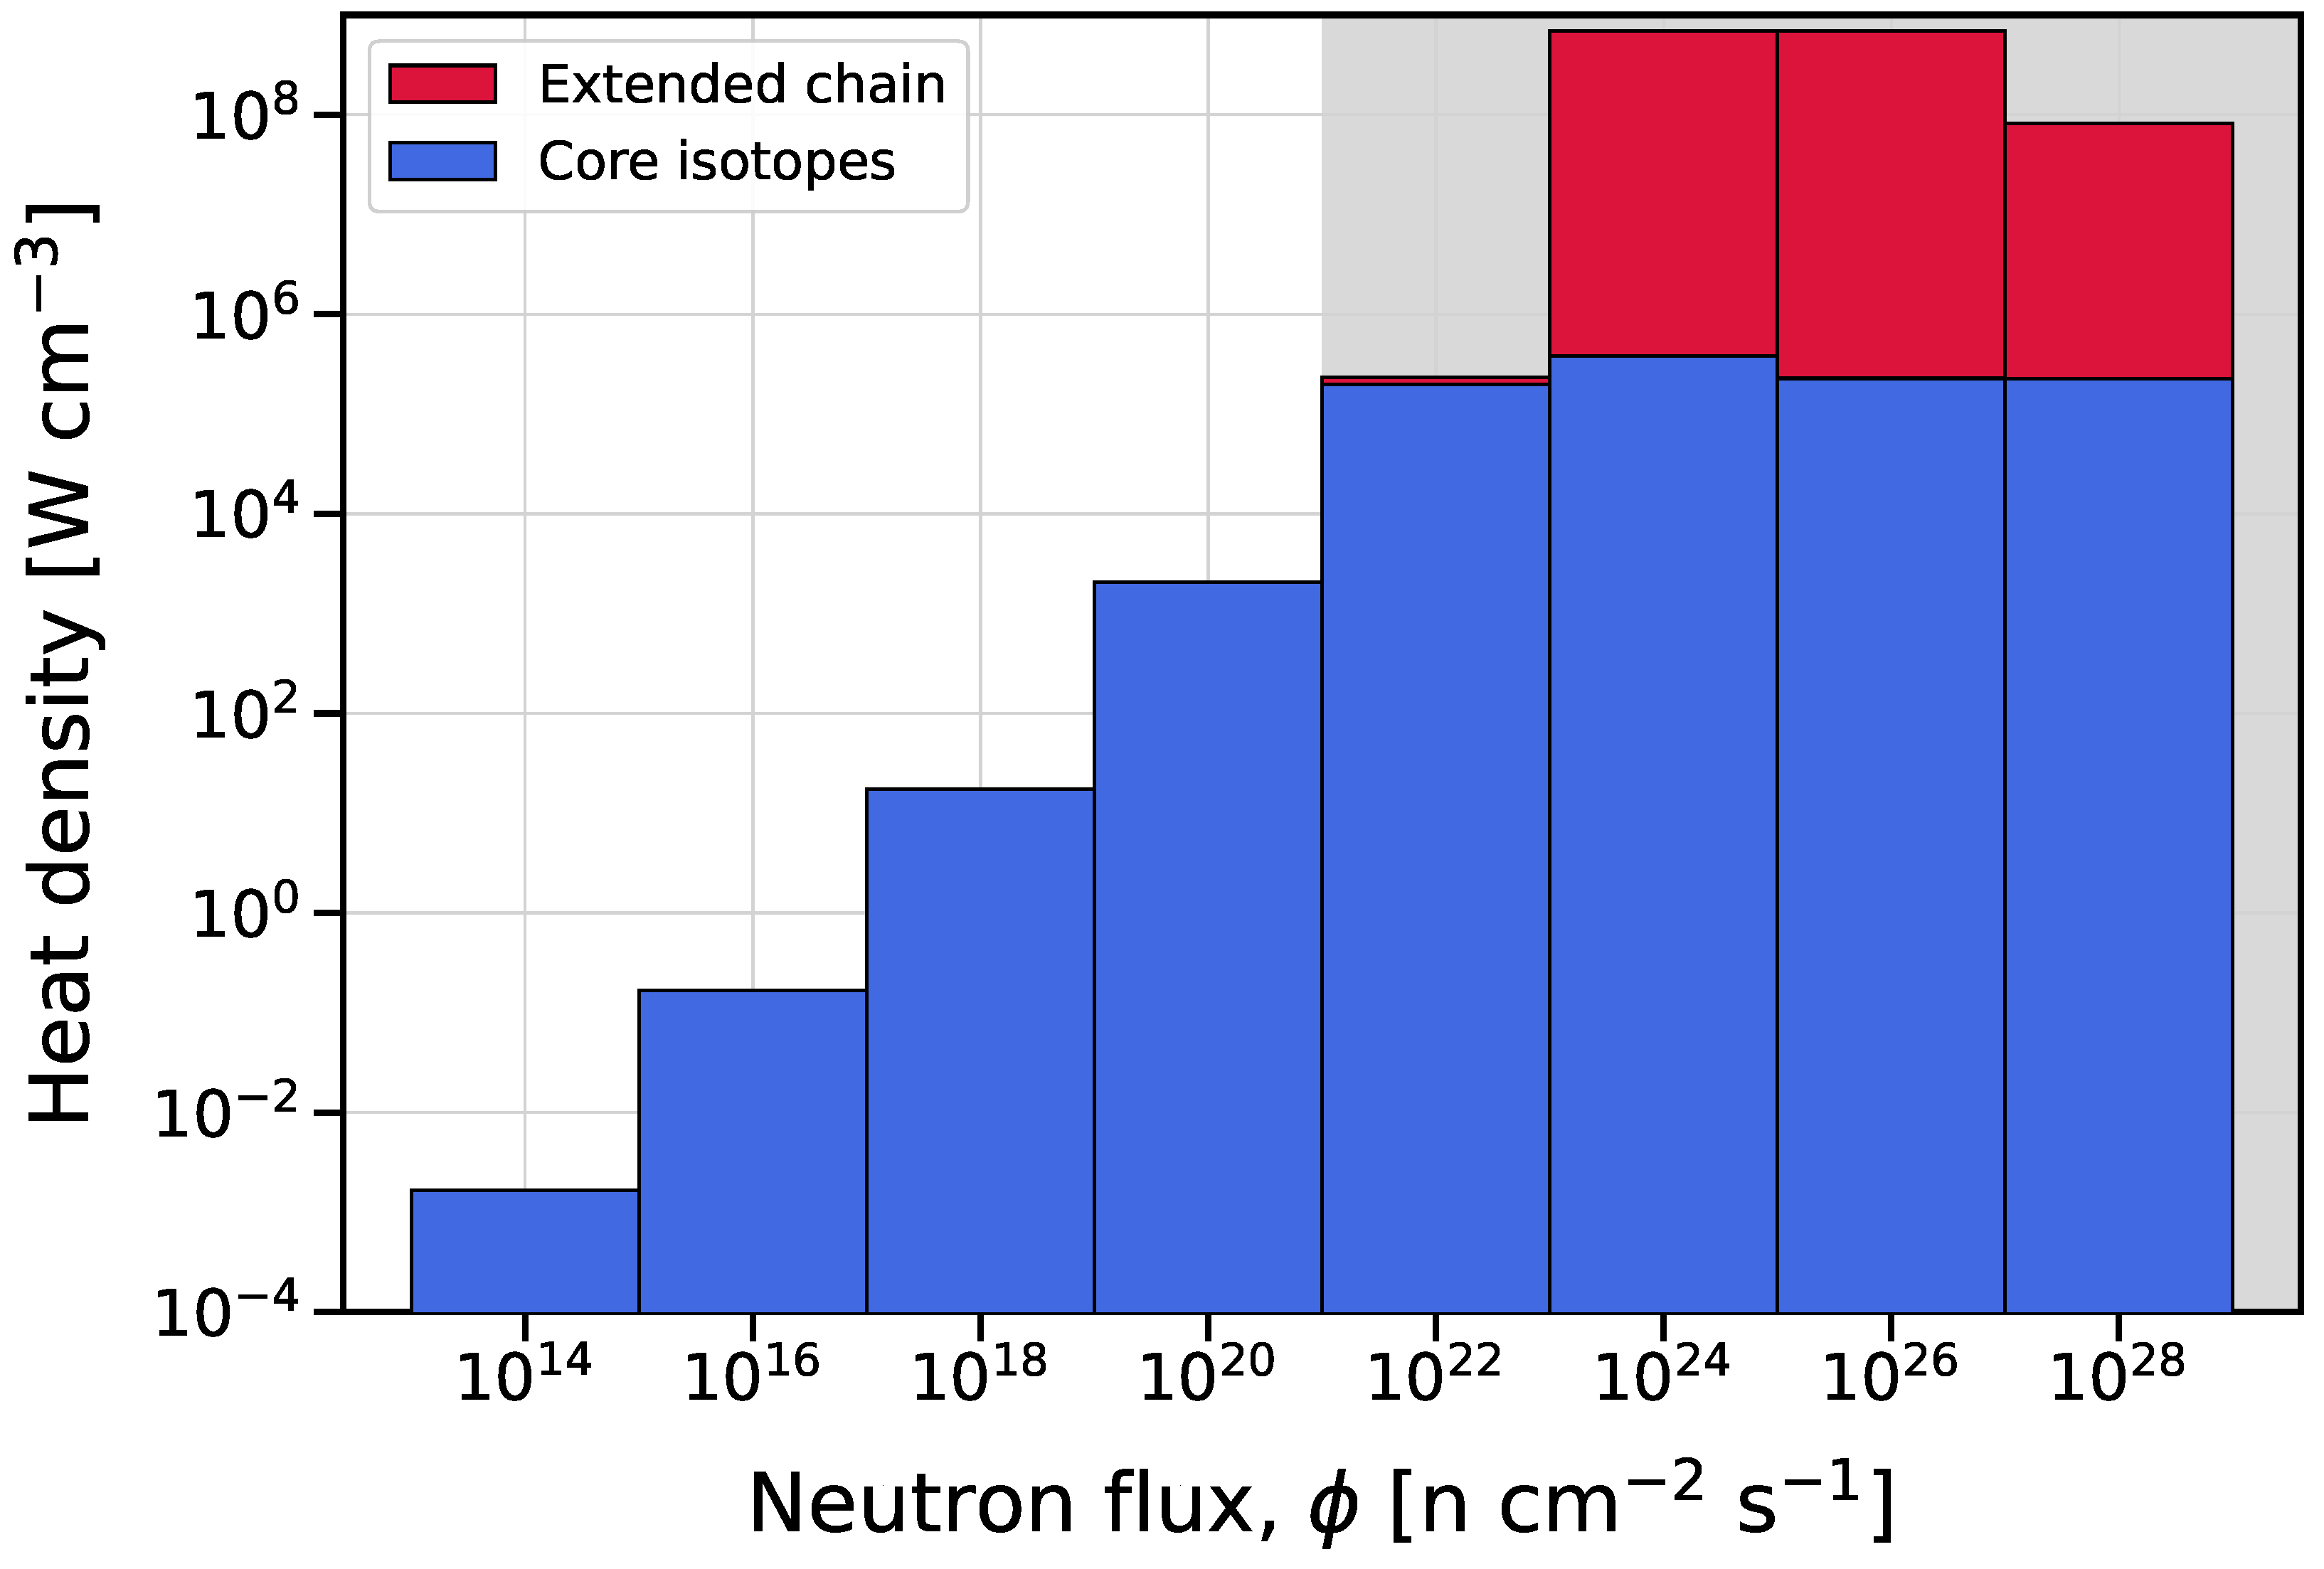
In Figure 5 we show the energy release for the entire network (see Figure 1) at the steady-state plateau, which corresponds to the equilibrium cuts (see Figure 4). The total energy release is determined solely by the contributions from - and -decays, since the energy yielded by reactions is negligibly small in the considered regime. The fundamental nuclear data required for these calculations, specifically the decay constants and decay energies (Q-values), were extracted from the ENDF/B-VIII.0. The absolute nuclear density of each isotope, required for this calculation, is derived by multiplying its calculated relative equilibrium concentration by the initial total atomic density of the target medium.
Figure 5.
Energy release in the cyclic nuclear reaction network at equilibrium isotopic compositions. Neutron capture cross-sections were primarily adopted from the EAF-2010, supplemented by TALYS evaluations for the extended chain. All required decay data were sourced from the ENDF/B-VIII.0; see the text for details. Gray shaded area after n cm−2 s−1 indicates unstable higher flux region.
To evaluate the specific contributions to the system’s thermodynamics, we calculated the energy release separately for the core isotopes (blue bars) and the complete extended chain (red bars), as depicted in the stacked bar chart in Figure 5. The main contribution to the equilibrium heat density at fluxes from to n cm−2 s−1 is overwhelmingly provided by the core isotopes, showing a steady exponential increase. Starting from the minimum at approximately W cm−3, the heat density grows proportionally by roughly two orders of magnitude for every hundredfold increase in flux, reaching ∼10 W cm−3 at n cm−2 s−1 and ∼103 W cm−3 at n cm−2 s−1.
The high-flux regions are highlighted in gray to denote a fundamental shift in the system’s behavior. As the system enters this transitional regime at n cm−2 s−1, the heat density of the core cycle reaches approximately W cm−3 and subsequently plateaus, showing no further significant growth. However, with a further increase in flux (– n cm−2 s−1), we observe a significant rise in the total energy release, surging dramatically to over W cm−3. As demonstrated in the diagram, this massive peak is overwhelmingly dominated by the trace isotopes of the extended chain (red contribution) due to the intense generation and accumulation of highly unstable radionuclides. At the extreme flux of n cm−2 s−1, the calculated energy release of the extended chain exhibits a declining trend. This decrease occurs because the system operates in a highly unstable, transient regime where the broader isotope network fails to reach a true steady plateau, making the extraction of physically meaningful equilibrium radiation-resistant materials unfeasible.
Overall, obtained steady increase and later stabilisation of the core isotopes at evolving fluxes, even in terms of crude estimate of heat generation, could potentially serve as indicators for their valuable contribution to the energy budget of the further mechanisms, such as the i-process and r-process.
4. Summary
In this work, we have performed a numerical investigation of the isotopic evolution and decay heat generation in an extended Pb–Bi–Po cyclic reaction network. By solving the Bateman equations using the Chebyshev Rational Approximation Method (CRAM–16), the continuous neutron irradiation ( keV) of was modeled across a wide flux range from to n cm−2 s−1. The utilization of a 60-isotope network, accounting for 88 transitions and incorporating neutron data from the EAF-2010, TALYS, and decay data ENDF/B-VIII.0 demonstrated that the system’s equilibrium is governed by a dynamic balance between radiative neutron captures and radioactive decays, revealing two distinct evolutionary regimes. At moderate fluxes (– n cm−2 s−1), the cycle is completely dominated by the rapid -decay of , which efficiently recycles the mass flow back to stable lead isotopes. This regime successfully reproduces the well-known strong s-process termination point, characteristic of low-metallicity AGB stars. Conversely, as the flux exceeds the n cm−2 s−1 threshold, this classical stable distribution breaks down. Enhanced neutron capture rates push the mass flow toward heavier nuclides, suggesting a potential transition into the intermediate neutron capture (i-process) regime, as indicated by the highlighted gray zone.
Calculations of the heat generation, evaluated separately for the core cycle and the extended trace isotopes, showed a steady exponential increase with the neutron flux. The energy release of the core cycle reaches a plateau of approximately W cm−3 at n cm−2 s−1. Beyond this threshold (– n cm−2 s−1), the total energy release rises sharply, peaking at over W cm−3 due to the intense generation of highly unstable trace radionuclides from the extended chain. However, at extreme fluxes near n cm−2 s−1, the system enters a highly unstable, transient state where a true equilibrium plateau cannot be reliably defined, leading to a decline in the calculated heat density.
Author Contributions
Conceptualisation, formal analysis, M.A.; methodology, investigation, M.K., R.S. and D.A.; software, data curation, N.K.; visualisation, R.S. and D.A.; validation, resources, supervision, M.K.; writing—original draft preparation, writing—review and editing, M.K., R.S. and Y.A.; project administration, funding acquisition, Y.A. All authors have read and agreed to the published version of the manuscript.
Funding
This research is funded by the Science Committee of the Ministry of Science and Higher Education of the Republic of Kazakhstan (Grant No. AP23488136, Principal Investigator: Yerlan Aimuratov).
Data Availability Statement
The original data presented in the study are openly available in ENDF/B-VIII.0 (https://www-nds.iaea.org/exfor/endf.htm, accessed on 29 March 2026). Neutron radiative capture cross-sections were retrieved from the MACS database (https://www.nndc.bnl.gov/astro/, accessed on accessed on 29 March 2026).
Acknowledgments
We thank the editors and anonymous reviewers for comments and suggestions which helped to improve the presentation of the results.
Conflicts of Interest
The authors declare no conflicts of interest. The funders had no role in the design of the study; in the collection, analyses, or interpretation of data; in the writing of the manuscript; or in the decision to publish the results.
Notes
| 1 | https://www-nds.iaea.org/exfor/endf.htm, accessed on 29 March 2026. |
| 2 | https://www.nndc.bnl.gov/astro/, accessed on 29 March 2026. |
| 3 | https://nds.iaea.org/talys/, accessed on 29 March 2026. |
References
- Suess, H.E.; Urey, H.C. Abundances of the Elements. Rev. Mod. Phys. 1956, 28, 53–74. [Google Scholar] [CrossRef] [Scilit]
- Burbidge, E.M.; Burbidge, G.R.; Fowler, W.A.; Hoyle, F. Synthesis of the Elements in Stars. Rev. Mod. Phys. 1957, 29, 547–650. [Google Scholar] [CrossRef] [Scilit]
- Käppeler, F.; Gallino, R.; Bisterzo, S.; Aoki, W. The s process: Nuclear physics, stellar models, and observations. Rev. Mod. Phys. 2011, 83, 157–194. [Google Scholar] [CrossRef] [Scilit]
- Holmbeck, E.M.; Sprouse, T.M.; Mumpower, M.R. Nucleosynthesis and observation of the heaviest elements. Eur. Phys. J. A 2023, 59, 28. [Google Scholar] [CrossRef] [Scilit]
- Pian, E. Kilonova Emission and Heavy Element Nucleosynthesis. Universe 2023, 9, 105. [Google Scholar] [CrossRef] [Scilit]
- Van Eck, S.; Shetye, S.; Siess, L. Insights into AGB Nucleosynthesis Thanks to Spectroscopic Abundance Measurements in Intrinsic and Extrinsic Stars. Universe 2022, 8, 220. [Google Scholar] [CrossRef] [Scilit]
- Ratzel, U.; Arlandini, C.; Käppeler, F.; Couture, A.; Wiescher, M.; Reifarth, R.; Gallino, R.; Mengoni, A.; Travaglio, C. Nucleosynthesis at the termination point of the s process. Phys. Rev. C—Nuclear Phys. 2004, 70, 065803. [Google Scholar] [CrossRef] [Scilit]
- Clayton, D.D. The Role of Radioactive Isotopes in Astrophysics. In Astronomy with Radioactivities; Diehl, R., Hartmann, D.H., Prantzos, N., Eds.; Lecture Notes in Physics; Springer: Berlin/Heidelberg, Germany, 2011; Volume 812, pp. 25–82. [Google Scholar] [CrossRef] [Scilit]
- Clayton, D.D.; Rassbach, M.E. Termination of the s-process. Astrophys. J. 1967, 148, 69. [Google Scholar] [CrossRef] [Scilit]
- Vieira, N.; Ruan, J.J.; Haggard, D.; Ford, N.; Drout, M.R.; Fernández, R.; Badnell, N.R. Spectroscopic r-Process Abundance Retrieval for Kilonovae. I. The Inferred Abundance Pattern of Early Emission from GW170817. Astrophys. J. 2023, 944, 123. [Google Scholar] [CrossRef] [Scilit]
- Vieira, N.; Ruan, J.J.; Haggard, D.; Ford, N.M.; Drout, M.R.; Fernández, R. Spectroscopic r-process Abundance Retrieval for Kilonovae. II. Lanthanides in the Inferred Abundance Patterns of Multicomponent Ejecta from the GW170817 Kilonova. Astrophys. J. 2024, 962, 33. [Google Scholar] [CrossRef] [Scilit]
- Vieira, N.; Ruan, J.J.; Haggard, D.; Drout, M.R.; Fernández, R. Spectroscopic r-process Abundance Retrieval for Kilonovae. III. Linking Spectral and Light-curve Modeling of the GW170817 Kilonova. Astrophys. J. 2026, 997, 92. [Google Scholar] [CrossRef] [Scilit]
- Arya, A.; Damgaard, R.; Sneppen, A.; Dougan, D.J.; Sim, S.A.; Ballance, C.P.; Watson, D. Strontium and helium in the kilonova AT2017gfo: Origin of the 1μm feature constrained via NLTE calculations. arXiv 2026, arXiv:2604.05812. [Google Scholar] [CrossRef] [Scilit]
- Chiba, K.; Tanaka, M.; Wanajo, S.; Fujibayashi, S.; Kawaguchi, K.; Hotokezaka, K. Non-LTE Ionization Modeling for Helium and Strontium in Neutron Star Merger Ejecta. arXiv 2026, arXiv:2604.05703. [Google Scholar] [CrossRef] [Scilit]
- Toshinsky, G.; Petrochenko, V. Modular Lead-Bismuth Fast Reactors in Nuclear Power. Sustainability 2012, 4, 2293–2316. [Google Scholar] [CrossRef] [Scilit]
- Loewen, E. Investigation of polonium removal systems for lead-bismuth cooled FBRS. Prog. Nucl. Energy 2005, 47, 586–595. [Google Scholar] [CrossRef] [Scilit]
- Obara, T.; Miura, T.; Fujita, Y.; Ando, Y.; Sekimoto, H. Preliminary study of the removal of polonium contamination by neutron-irradiated lead-bismuth eutectic. Ann. Nucl. Energy 2003, 30, 497–502. [Google Scholar] [CrossRef] [Scilit]
- Pusa, M. Numerical Methods for Nuclear Fuel Burnup Calculations: CRAM. Nucl. Sci. Eng. 2010, 164, 140–150. [Google Scholar] [CrossRef] [Scilit]
- Wiedeking, M.; Goriely, S.; Guttormsen, M.; Herwig, F.; Larsen, A.C.; Liddick, S.N.; Mücher, D.; Richard, A.L.; Siem, S.; Spyrou, A. Unlocking i-process nucleosynthesis by bridging stellar and nuclear physics. Nat. Rev. Phys. 2025, 7, 696–712. [Google Scholar] [CrossRef] [Scilit]
- Pritychenko, B.; Mughaghab, S.; Sonzogni, A. Calculations of Maxwellian-averaged cross sections and astrophysical reaction rates using the ENDF/B-VII.0, JEFF-3.1, JENDL-3.3, and ENDF/B-VI.8 evaluated nuclear reaction data libraries. At. Data Nucl. Data Tables 2010, 96, 645–748. [Google Scholar] [CrossRef] [Scilit]
- Koning, A.; Hilaire, S.; Goriely, S. TALYS: Modeling of nuclear reactions. Eur. Phys. J. A 2023, 59, 131. [Google Scholar] [CrossRef] [Scilit]
- Cruz-López, C.A.; Espinosa-Paredes, G. Fractional radioactive decay law and Bateman equations. Nucl. Eng. Technol. 2022, 54, 275–282. [Google Scholar] [CrossRef] [Scilit]
- Kawamoto, Y.; Chiba, G.; Tsuji, M.; Narabayashi, T. Numerical solution of matrix exponential in burn-up equation using mini-max polynomial approximation. Ann. Nucl. Energy 2015, 80, 219–224. [Google Scholar] [CrossRef] [Scilit]
- Moler, C.; van Loan, C. Nineteen Dubious Ways to Compute the Exponential of a Matrix, Twenty-Five Years Later. SIAM Rev. 2003, 45, 3–49. [Google Scholar] [CrossRef] [Scilit]
- Golub, G.H.; Van Loan, C.F. Matrix Computations, 4th ed.; Johns Hopkins University Press: Philadelphia, PA, USA, 2013. [Google Scholar]
- Oh, H.S.; Yang, W.S. Comparison of matrix exponential methods for fuel burnup calculations. J. Korean Nucl. Soc. 1999, 31, 172–181. [Google Scholar]
- Pusa, M. Rational Approximations to the Matrix Exponential in Burnup Calculations. Nucl. Sci. Eng. 2011, 169, 155–167. [Google Scholar] [CrossRef] [Scilit]
- Pusa, M. Higher-Order Chebyshev Rational Approximation Method and Application to Burnup Equations. Nucl. Sci. Eng. 2016, 182, 297–318. [Google Scholar] [CrossRef] [Scilit]
- Brown, D.A.; Chadwick, M.B.; Capote, R.; Kahler, A.C.; Trkov, A.; Herman, M.W.; Sonzogni, A.A.; Danon, Y.; Carlson, A.D.; Dunn, M.; et al. ENDF/B-VIII.0: The 8th Major Release of the Nuclear Reaction Data Library with CIELO-project Cross Sections, New Standards and Thermal Scattering Data. Nucl. Data Sheets 2018, 148, 1–142. [Google Scholar] [CrossRef] [Scilit]
- Hughes, D.; Schwartz, R. Neutron Cross Sections; Number No. 1 in BNL (Series); Brookhaven National Laboratory: Upton, NY, USA, 1958. [Google Scholar]
- Prantzos, N.; Abia, C.; Cristallo, S.; Limongi, M.; Chieffi, A. Chemical evolution with rotating massive star yields II. A new assessment of the solar s- and r-process components. Mon. Not. R. Astron. Soc. 2020, 491, 1832–1850. [Google Scholar] [CrossRef] [Scilit]
- Choplin, A.; Goriely, S.; Siess, L.; Martinet, S. Synthesis of actinides and short-lived radionuclides during i-process nucleosynthesis in AGB stars. Eur. Phys. J. A 2025, 61, 68. [Google Scholar] [CrossRef] [Scilit]
- Riyas, A.M.; Karinkuzhi, D.; Van Eck, S.; Choplin, A.; Goriely, S.; Siess, L.; Keerthy, M.V.; Jorissen, A.; Merle, T. Abundance of heavy r-process elements in CEMP-rs stars: The role of the i-process. arXiv 2025, arXiv:2510.13339. [Google Scholar] [CrossRef] [Scilit]
Disclaimer/Publisher’s Note: The statements, opinions and data contained in all publications are solely those of the individual author(s) and contributor(s) and not of MDPI and/or the editor(s). MDPI and/or the editor(s) disclaim responsibility for any injury to people or property resulting from any ideas, methods, instructions or products referred to in the content. |
© 2026 by the authors. Licensee MDPI, Basel, Switzerland. This article is an open access article distributed under the terms and conditions of the Creative Commons Attribution (CC BY) license.