


Abstract
We review the jet kinematics of HBL blazars based on results of the MOJAVE survey, which obtained images of active galactic nuclei with the Very Long Baseline Array (VLBA) at 15 GHz, and the VLBA-BU-BLAZAR program as well as its successor BEAM-ME program, which have observed -ray blazars at 43 GHz. We present and discuss recent kinematic behavior and polarization properties of the parsec-scale jets of three typical HBL sources over the 2020–2025 period. We outline current physical implications for reconciling the high-energy characteristics of HBL sources with their parsec-scale jet properties.
1. Introduction
Active galactic nuclei (AGN) are the centers of galaxies where supermassive black holes (BHs) are accreting gas at a high rate from their surroundings. In 5–10% of AGN, jets of high-energy particles and magnetic fields are observed to be propelled into interstellar space by the BH system. It is still challenging to explain why such jets are weak or absent in the other AGN. Blazars are the most extreme variety of AGN with jets, in terms of both luminosity and variability. Blazars emit profusely over the entire electromagnetic spectrum from radio wavelengths to very high-energy -rays (E > 100 GeV, VHE). They are dominated by nonthermal emission, which causes blazars to be the most prominent sources in the sky outside the plane of the Milky Way at microwave and -ray frequencies.
The spectral energy distribution (SED) of blazars has two humps. The first hump covers the frequencies from radio waves to soft X-rays. The emission at these frequencies is thought to be produced via the synchrotron mechanism. Depending on the position of the peak of this hump, , blazars are separated into low- (∼5 × 10¹²–1014 Hz; LSP), intermediate- (–5 × 10¹⁵ Hz; ISP), and high-synchrotron-peak (∼5 × 10¹⁵–1017 Hz; HSP) subclasses. There is also a separation of blazars based on the luminosity of the broad-line region. Blazars with strong and broad emission lines in their optical spectra form a subclass of flat-spectrum radio quasars (FSRQs), while blazars with weak or absent optical emission lines belong to the subclass of BL Lacertae-type objects (BLs). All HSP blazars are BLs, and the majority of them are VHE sources that vary on very short (minutes) timescales at TeV energies (e.g., [1]). They are classified as HBLs. In addition, several HBLs have been identified as likely sources of cosmic neutrinos, (e.g., [2]). The observed very short-variability timescales of HBLs at high energies represent a puzzle for any emission mechanism currently considered for explaining -ray emission in blazars, since this requires a very high Doppler factor of 50 or even 100 [1].
Blazars possess highly relativistic jets with apparent speeds up to ∼40c [3] and even ∼70c [4], which requires very high Lorentz, , and Doppler, , factors for their flows. The factors are derived based on apparent speeds and viewing angles of jet axes. Apparent speeds are determined by the proper motion of disturbances with respect to the VLBI core, which is assumed to be a stationary feature of the jets, while different methods are used to estimate viewing angles (e.g, [5,6]). However, HBLs do not display ultra-fast moving disturbances in the jets. According to early VLBI studies that included HBLs [7,8], their jets have low apparent speeds of ∼0.1–, which imply a modest Doppler factor. Therefore, this inconsistency between high energy emission and radio jet properties of HBLs presents a difficult problem in blazar physics called the “Doppler crisis” (e.g., [9]).
In Section 2 of this paper, we discuss more recent studies of apparent speeds in parsec-scale jets of HBL blazars; in Section 3, we present polarization properties of jets of several prominent HBLs; and, in Section 4, we offer possible solutions to the Doppler crisis, along with future observations that can potentially help to resolve the crisis. Throughout this paper, we use cosmological parameters = 0.27, = 0.73, and = 71 km s−1 Mpc−1 [10].
2. Apparent Speeds in Parsec-Scale Jets of HBLs
We use results from two AGN surveys that have been studying properties of AGN jets for more than a decade. These are the MOJAVE (Monitoring Of Jets in Active galactic nuclei with VLBA Experiments, https://www.cv.nrao.edu/MOJAVE/, accessed on 8 April 2026) survey, and the VLBA-BU-BLAZAR program and and its continuation, BEAM-ME (Blazars Entering the Astrophysical Multi-Messenger Era, https://www.bu.edu/blazars/BEAM-ME.html, accessed on 8 April 2026). Both studies perform observations with the Very Long Baseline Array (VLBA) of the National Radio Astronomy Observatory (NRAO). The MOJAVE survey provides total and polarized intensity images at 15 GHz of more than 200 AGN of different classes. The VLBA-BU-BLAZAR/BEAM-ME project images 38/35 -ray blazars at 43 GHz. Both samples include some HBL blazars. The data reduction procedures can be found in [11] for the MOJAVE data and in [3] for the VLBA-BU-BLAZAR project.
2.1. Apparent Speeds at 15 GHz and 43 GHz
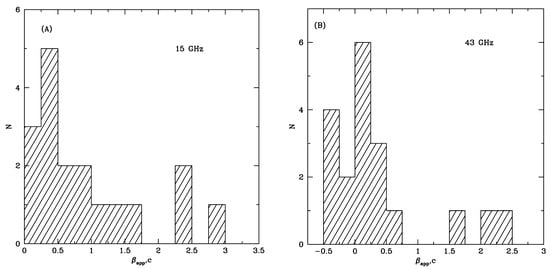
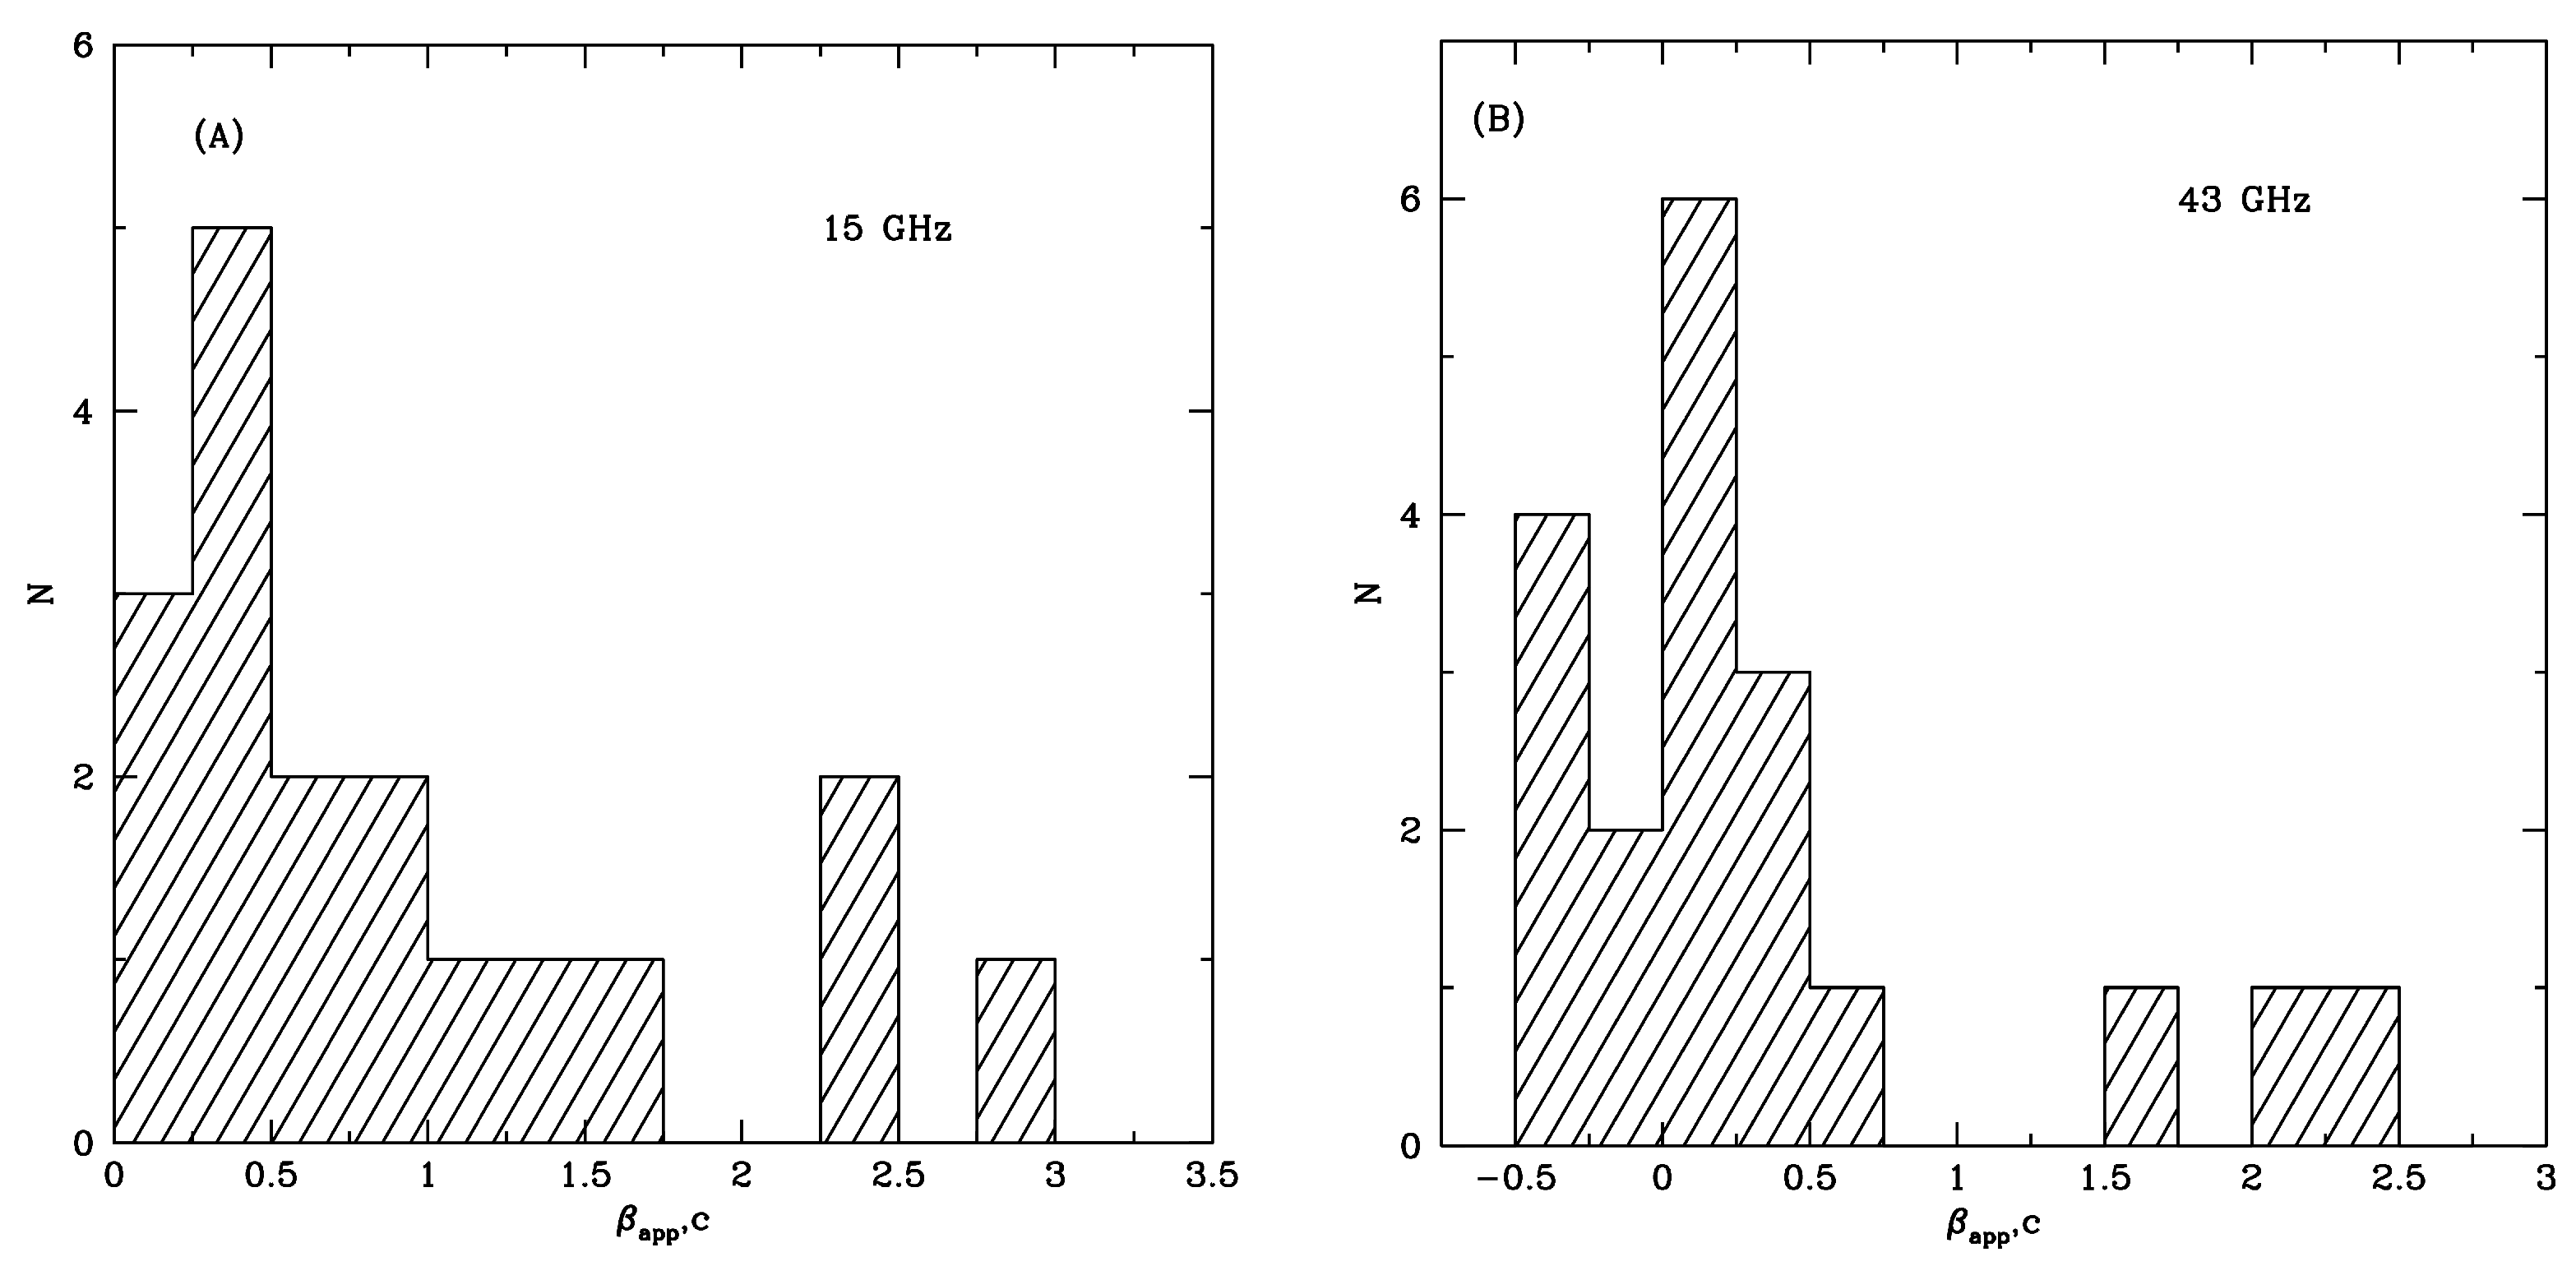
The MOJAVE sample contains the largest number of HBL blazars with analyzed parsec-scale jet properties. Lister et al. [4] reported on 24 HBLs, obtaining apparent speeds for 19. For four additional sources, the proper motion was measured but the redshift was unknown, and, for one source (PG 1553+113), no knots were detected in the jet except the core. Figure 1A plots a distribution of the maximum apparent speeds, , found in these 19 HBLs. We use a bin size of 0.25c, which corresponds to the average uncertainty of . Despite only the maximum apparent speed being chosen for each source, the peak of the distribution is located at = 0.25–0.5c. Since the distribution of apparent speeds is built from counts of discrete events, the count () in each bin typically follows Poisson statistics. This gives an uncertainty for each bin of , so that, for the peak of the distribution, the uncertainty is ±2. The highest apparent speeds, and , are detected in the blazars 1420+240 (OQ 240) and 1ES 0806+524, respectively, although these speeds are lower than reported by [8] for PKS 2155−304 at 15 GHz.
Figure 1.
Distributions of apparent speeds in parsec-scale jets of HBLs: (A) maximum apparent speed of each jet observed in the MOJAVE sample at 15 GHz according to [4]; (B) apparent speeds of all knots (except the core, A0) detected in three HBLs (Mrk 421, Mrk 501, and 1ES 1959+65) at 43 GHz according to [12]; negative implies motion toward the core.
The VLBA-BU-BLAZAR/BEAM-ME program has only three HBLs in the sample: Mrk 421, Mrk 501, and 1ES 1959+65. However, the observations have been performed monthly, starting from 2010 February (Mrk 421), 2011 September (Mrk 501), and 2017 September (1ES 1959+65), and are still ongoing, while MOJAVE data provide a maximum of 4–5 epochs per year for a source, with 1–2 observations per year after 2017. Therefore, it makes sense to examine all detected knots in the VLBA-BU-BLAZAR/BEAM-ME program in anticipation of obtaining a full range of apparent speeds in individual HBLs. Figure 1B gives the distribution of apparent speeds of all detected knots in the jets of these three HBLs over the 2010–2020 time range according to results listed in [12], plus apparent speeds of features classified as quasi-stationary by [12]. Note that Weaver et al. [12] have found three stationary features in Mrk 421, five in Mrk 501, and four in 1ES 1959+65, in addition to the core. All of these features have a proper motion less than 2 of the respective uncertainties, and 6 out of 12 quasi-stationary knots have negative apparent speeds, which refers to relative motion toward the VLBI core. The Kolmogorov–Smirnov test gives a probability of 84% that the distributions of apparent speeds at 15 GHz and 43 GHz are the same (KS = 0.174). The highest apparent speeds, and , measured in the jet of Mrk 421 in 2016 at 43 GHz, are similar to the highest apparent speeds found for the HBLs in the MOJAVE survey.
2.2. Recent Results from the BEAM-ME Program
We have analyzed the total intensity images at 43 GHz of Mrk 421, Mrk 501, and 1ES 1959+65, observed in the BEAM-ME program from August 2020 to August 2025. We have obtained 50 images of each source during this period. Fully calibrated data can be found on the BEAM-ME website (see above). We modeled the images by circular Gaussians in the manner described in [3]. As a result, each image is represented by several components (knots). Each knot is characterized by the following parameters: S—flux density in mJy, R—distance from the core in milli-arcseconds (mas), —position angle with respect to the core in degrees, a—FWHM size in mas. Uncertainties of parameters are calculated according to [12].
We have used the component characteristics indicated above to identify knots across epochs. We find three subluminal (J1, J2, and J3) and three superluminal (K1, K2, and K3) knots in the Mrk 421 jet, five subluminal (J1, J2, J3, J4, and J5) and three superluminal (K1, K2, and K3) knots in the Mrk 501 jet, and four subluminal (J1, K1, K2, and K3) knots in the 1ES 1959+65 jet, in addition to the core. Table 1 lists the main parameters of knots: 1—name of source; 2—knot designation; 3—N, number of epochs when knot was detected; 4—<S>, average flux density; 5—<R>, average distance from the core; 6—<>, average position angle with respect to the core; 7—<a>—average FWHM size; 8—, proper motion; 9—, apparent speed; 10—, time of ejection. All values are given with their 1 standard deviations. Based on values of and standard deviations, we have classified knots as (1) quasi-stationary if , and designate such knots by the letter J, and (2) moving if , designated by K. In addition, a quasi-stationary knot should be identified over at least 10 epochs. Multiple quasi-stationary knots in the jet make the identification of moving knots challenging. A moving feature should show progressive motion and be identified outside quasi-stationary features over at least three epochs.
Table 1.
Parameters of jet knots.
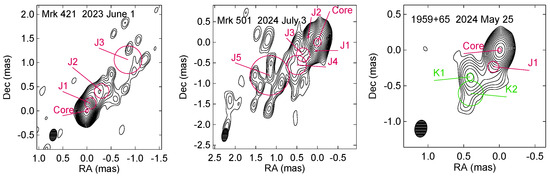
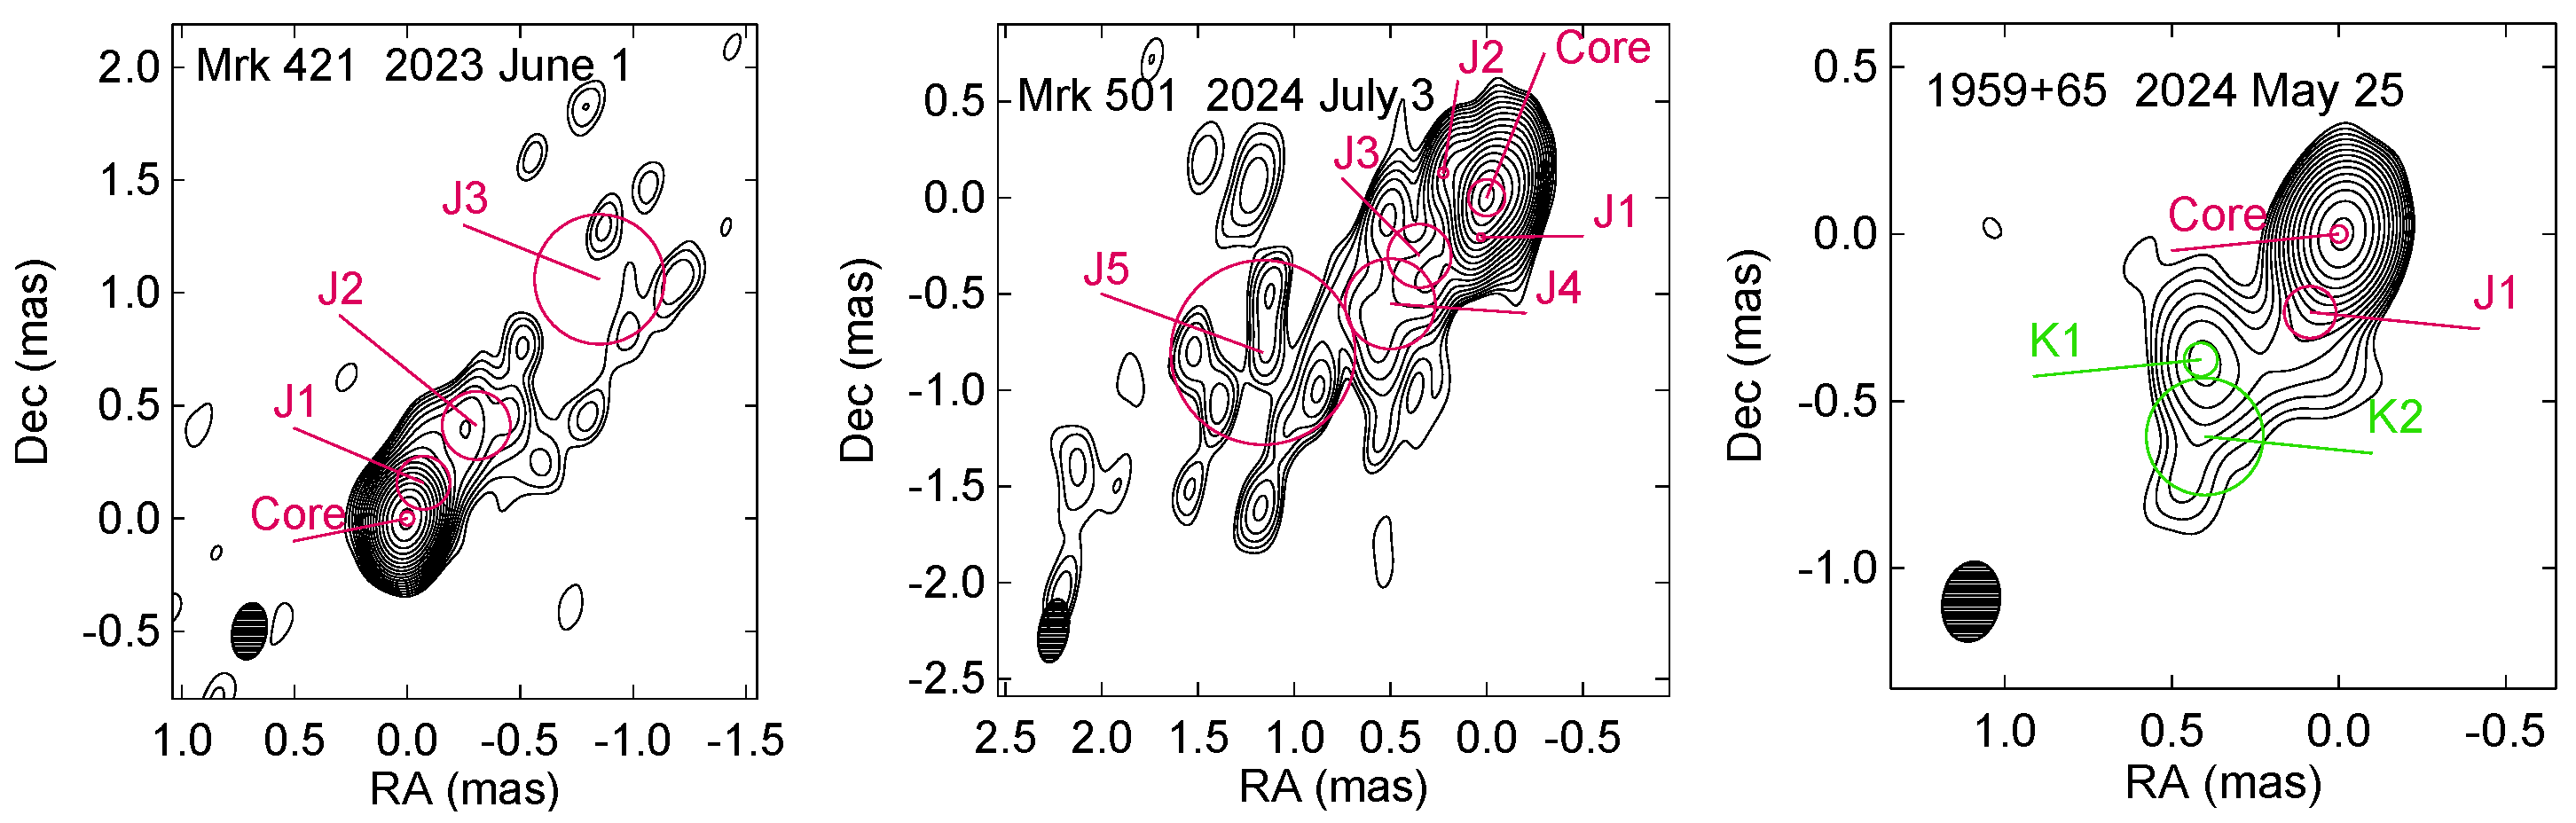
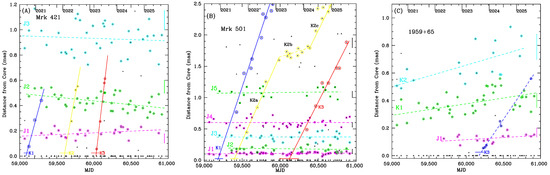
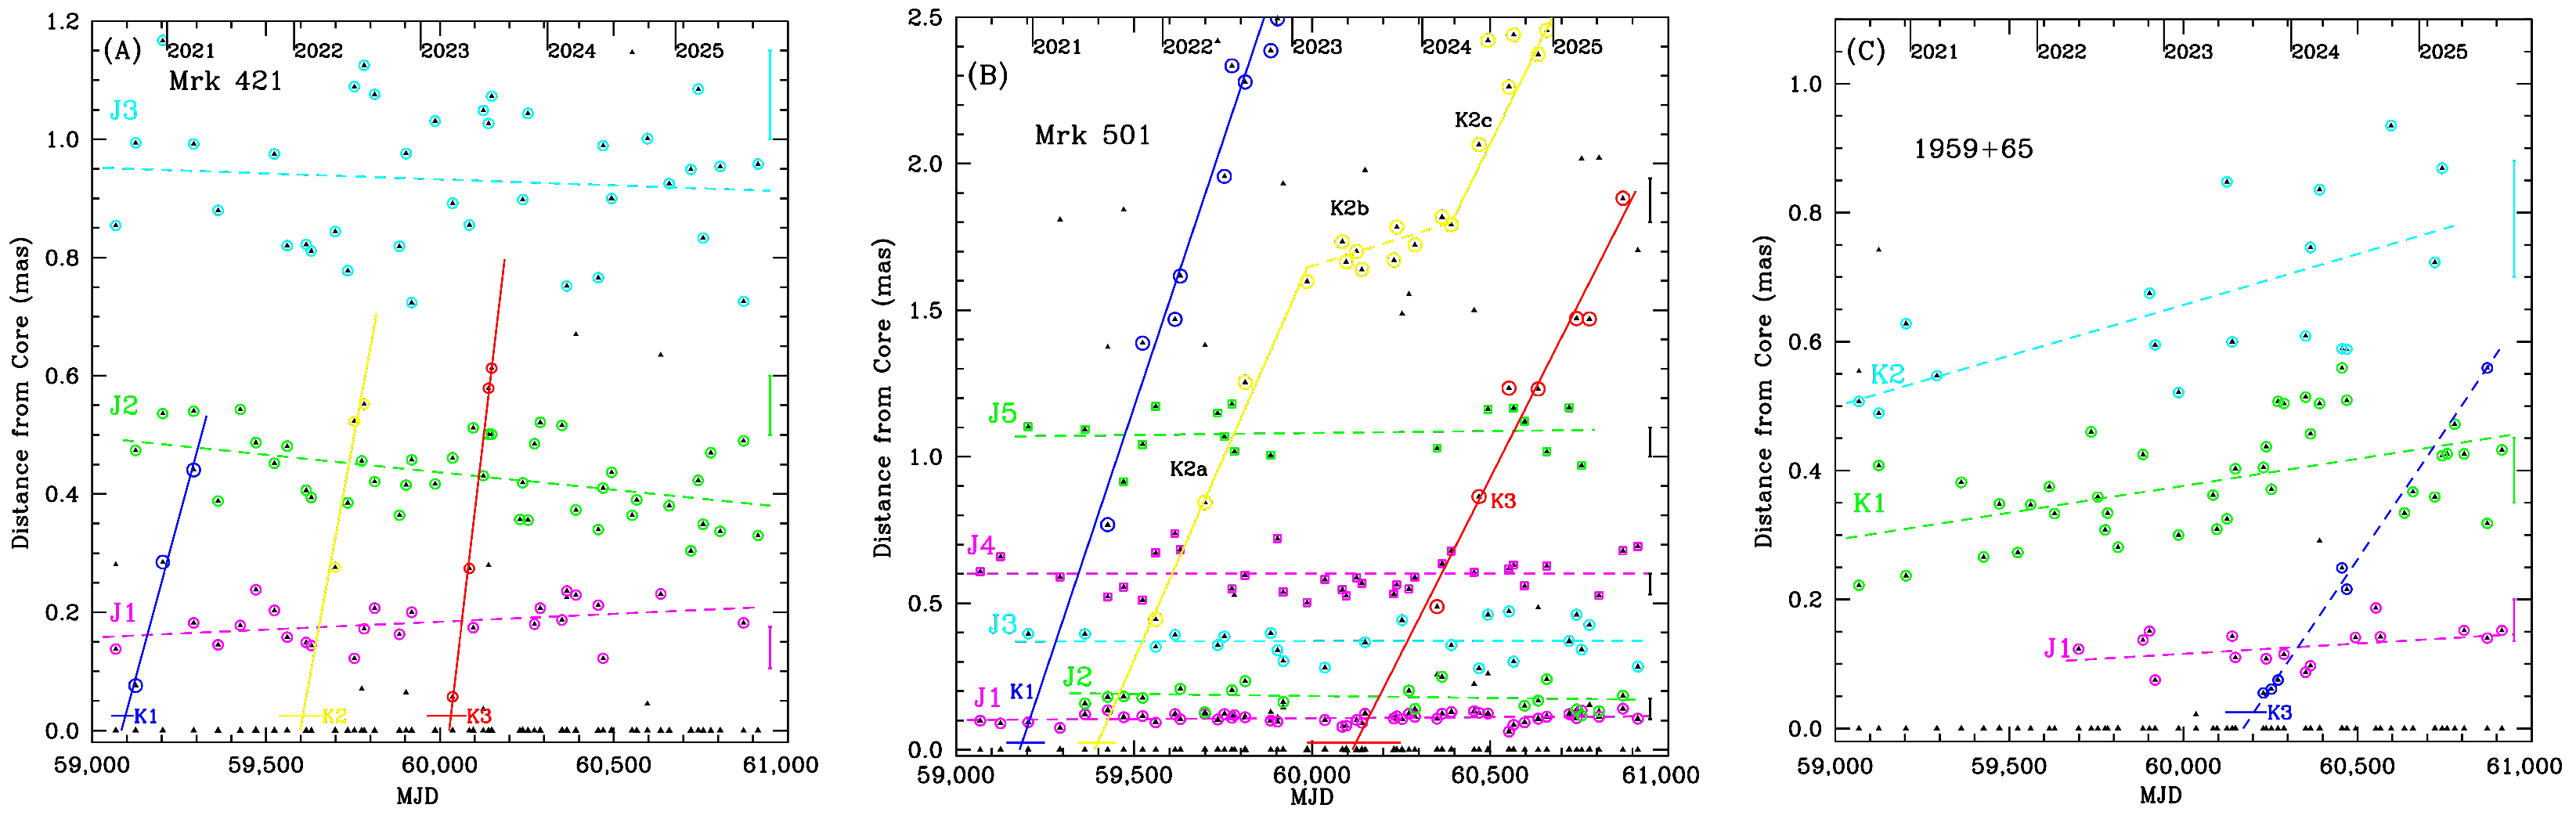
Figure 2 shows one image of each source where all features classified as quasi-stationary components are marked, while Figure 3 gives the separation of knots from the core versus time. According to Table 1, the core is the brightest and most compact feature in the jet, except in Mrk 501. The feature J1 closest to the core in Mrk 501 is significantly more compact than the core, and its intensity is comparable to that of the core. Table 1 and Figure 3 show that the quasi-stationary features in all three objects are very stable with respect to R and , except knot J2 in the jet of Mrk 501. Although knot J2 has a stable distance from the core, its position angle changes over a very wide range, from to , which could result from the presence of a ring-like diffuse structure around the core, with the brightness of different parts of the ring changing with time. Note that the quasi-stationary features in the Mrk 421 and Mrk 501 jets can be associated with those reported in [12]. However, the structure of the 1ES 1959+65 jet is different from that presented in [12], where four quasi-stationary features, –, are found in addition to the core. We attribute the difference to the small number of epochs (only six) for 1ES 1959+65 in [12].
Figure 2.
Total intensity images of Mrk 421 (left), Mrk 501 (middle), and 1ES 1959+65 (right) at 43 GHz. Mrk421: the peak of the total intensity is 312 mJy/beam, the restoring beam is 0.24 × 0.15 mas2 along PA = −10° (plotted in the left bottom corner), contours start at 0.354% of the peak and continue by a factor of up to 90.5%. Mrk 501: the peak of the total intensity is 444 mJy/beam, the beam is 0.33 × 0.15 mas2 along PA = −10°, contours start at 0.5% of the peak and continue in factors of up to 90.5%. 1ES 1959+65: the peak of the total intensity is 206 mJy/beam, the beam is 0.24 × 0.17 mas2 along PA = −10°, contours start at 1.0% of the peak and continue by a factor of up to 90.5%. The red circles on the images indicate stationary features; for the 1ES 1959+65 image, two moving knots, K1 and K2, are also marked by green circles.
Figure 3.
Separation of knots from the core for (A) Mrk 421, (B) Mrk 501, and (C) 1ES 1959+65. Black solid triangles plot all knots detected in the jet; open circles/squares of the same color mark a knot identified over different epochs, with a dashed line of the same color representing motion of the knot with 1c, while a solid line is used in the case of a superluminal speed of the knot; the vertical segments on the right side of each plot show average 1 uncertainties of measured distances, which increases with distance from the core.
We have detected 9 moving knots in these three HBLs, with ranging from to . These speeds agree very well with the distributions shown in Figure 1, with slightly higher maximum speeds than those observed previously for Mrk 421 and Mrk 501. We have detected knot K2 in the Mrk 501 jet, which executes a complicated trajectory. Using a piece-wise linear fitting method, as described in [12], we have found that the motion of the knot can be separated into three different parts (K2a, K2b, and K2c), with the fastest speed ∼2c near the core, followed by a deceleration to a subluminal speed at ∼1.7 mas from the core and a subsequent acceleration to ∼1c beyond 2 mas. This is difficult to attribute to jet curvature because the position angles of knots Ka, Kb, and Kc agree with each other very well (see Table 1); however, we measure them in projection on the sky plane. Nevertheless, this can be an indication of a change in due to an interaction with either the quasi-stationary features or the external medium.
As seen in Table 1, some moving components, especially with a superluminal speed, are detected only at 3–4 epochs and are rather diffuse. To increase confidence in their existence in the jets, we provide in Table 2 results of the modeling of images for each epoch when such knots were detected (K1–K3 for Mrk 421, K3 for Mrk 501, and K3 for 1950+650) along with the rms noise of each image and a reduced value between the model and the data. The columns in Table 2 are as follows: 1—name of source; 2—knot designation; 3—epoch of the observation; 4—S, flux density; 5—R, distance from the core; 6—, position angle with respect to the core; 7—a—FWHM size; 8—rms noise level; 9—reduced . The uncertainties of model parameters are calculated according to [12], as mentioned above. Although, at some epochs, the flux density of a knot is similar to its uncertainty, all knots have SN ratio ≥ 5 with respect to an image noise level and indicates a reasonably good agreement between the model and the data at all epochs.
Table 2.
Results of modeling for selected moving knots.
We use the value of <> of the brightest quasi-stationary knot detected at the majority of epochs to estimate the innermost projected jet direction. In the case of Mrk 421, this is knot J2, which gives . For Mrk 501, we employ knot J1, which gives , and for 1ES 1959+65 knot J1 implies = 138 ± . For all three sources, these values agree within the 1 standard deviation with those reported by [12].
3. Polarization Properties of Parsec-Scale Jets in HBLs
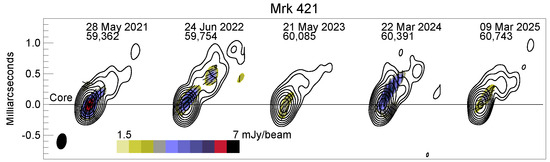
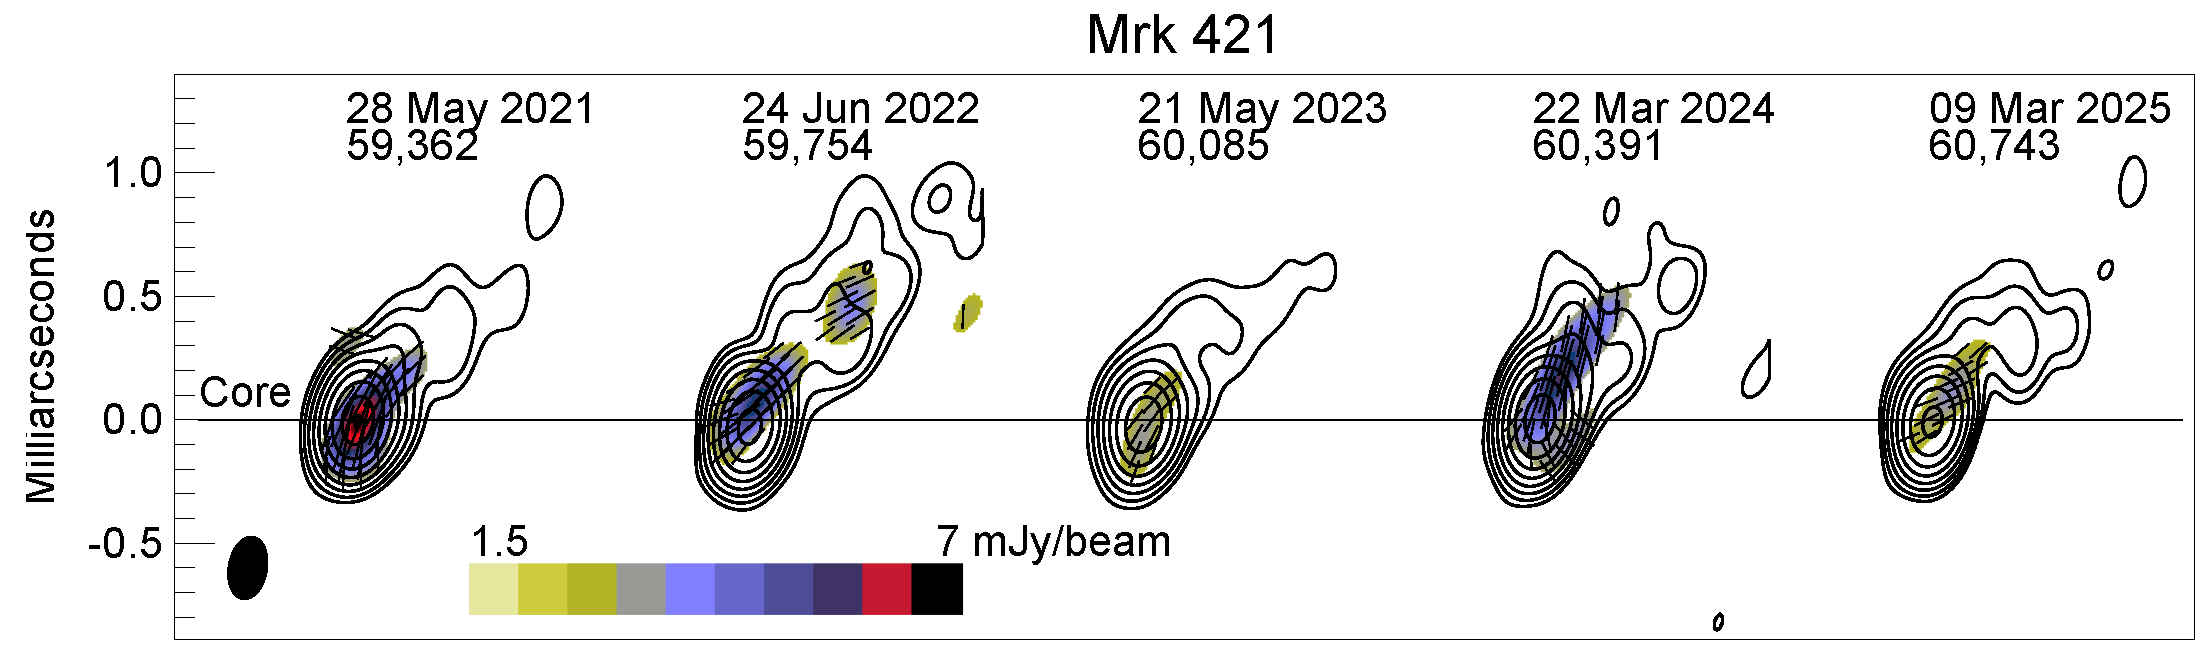
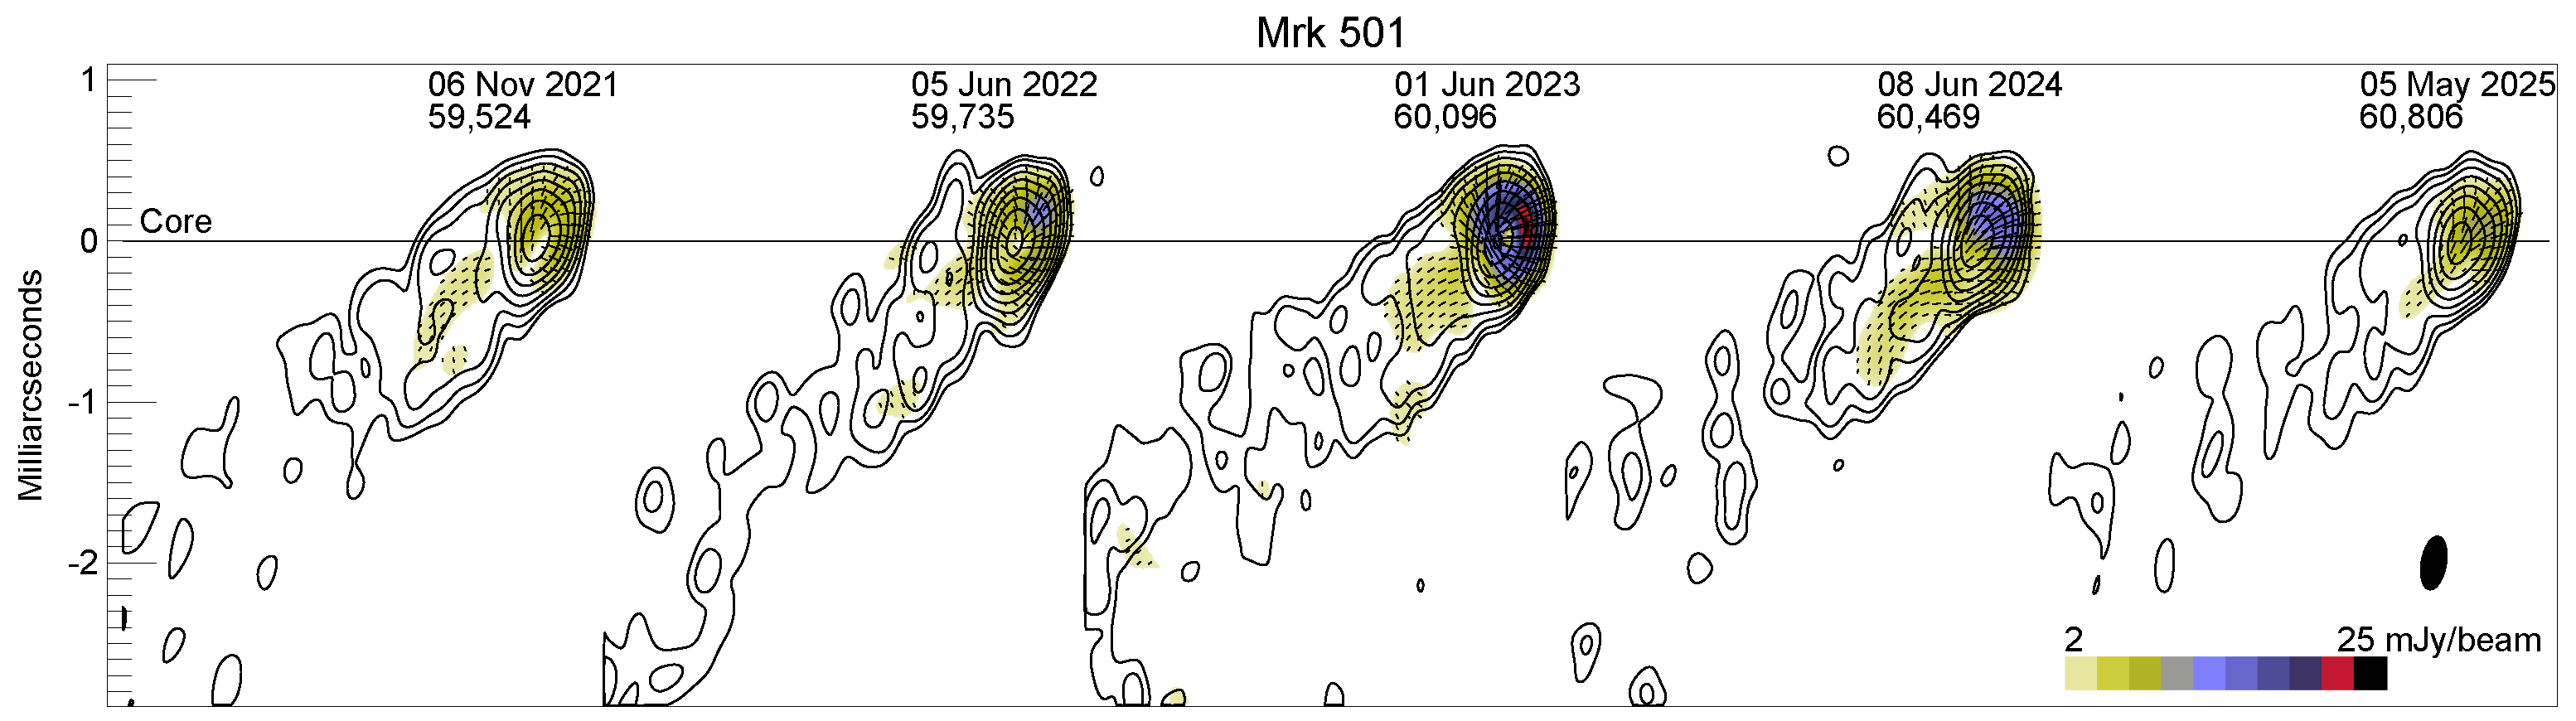
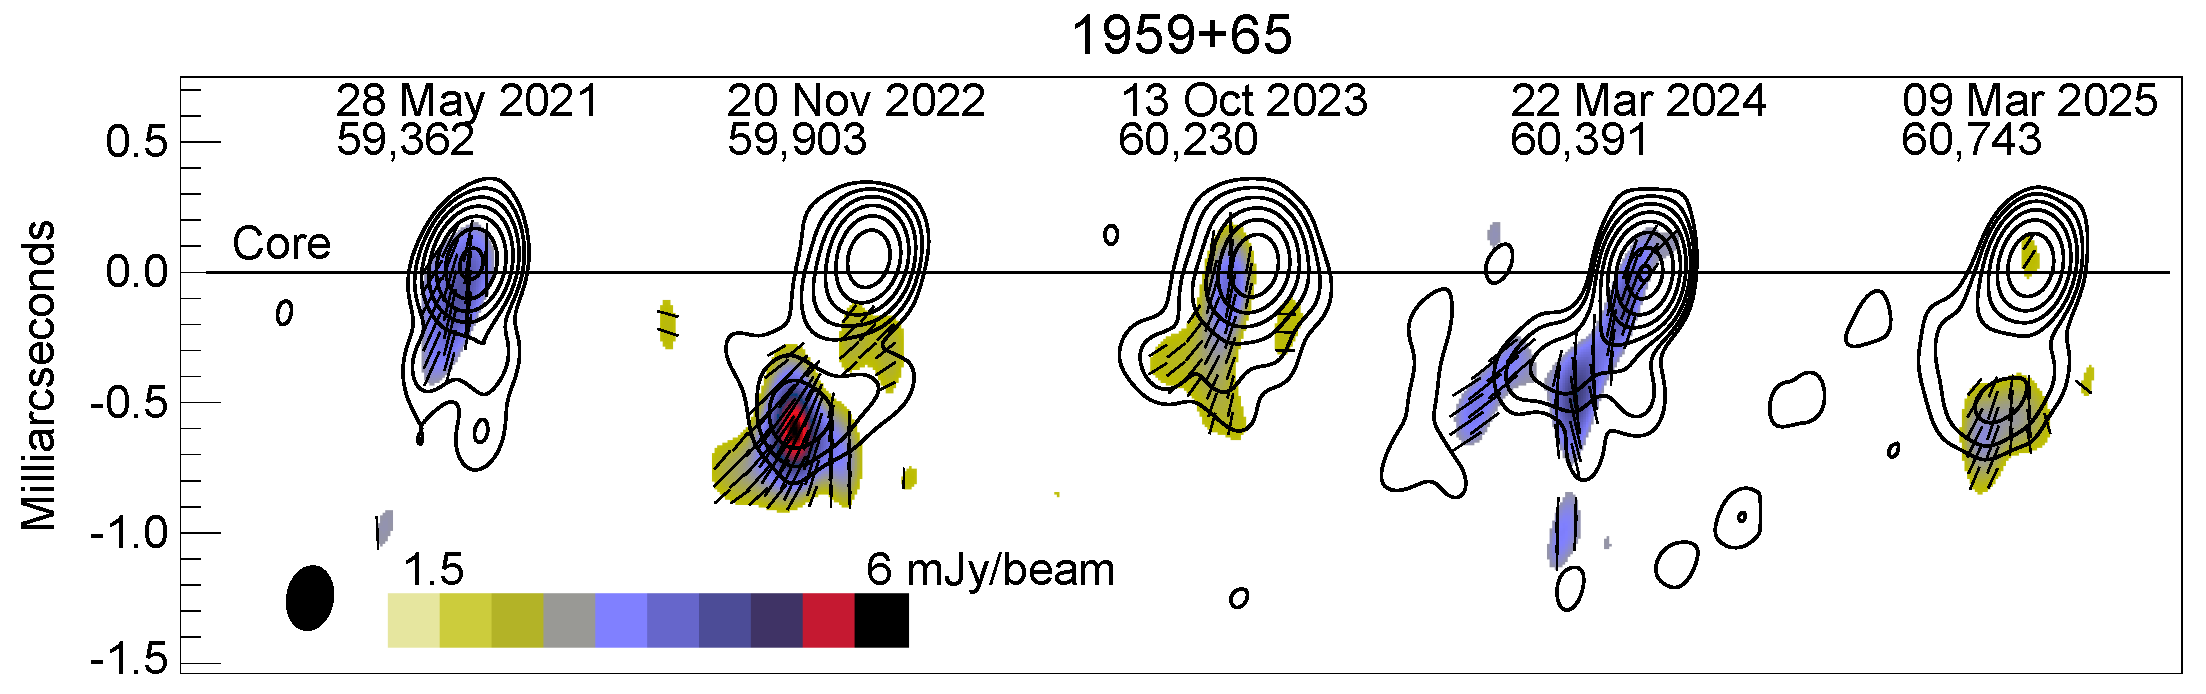
The BEAM-ME program provides images in three Stokes parameters: I, Q, and U. A description of the data calibration to produce polarized intensity images can be found in [3]. As in the case of I images discussed above, we use the software Difmap [13] version 2.5b, which employs the CLEAN method (e.g., [14]), to produce Q and U images. Figure 4, Figure 5 and Figure 6 show selected sequences of total and polarized intensity images for Mrk 421, Mrk 501, and 1ES 1959+65, respectively. We have chosen one image from each year of the BEAM-ME program to represent the general polarization behavior in the HBL jets at 43 GHz.
Figure 4.
Sequence of total (contours) and polarized (color scale) intensity images of Mrk 421, with one image for each year of observations; the global total intensity peak is 316 mJy/beam; the size of the beam is 0.24 × 0.15 mas2 along PA = −10°, plotted in the left bottom corner. Contours start at 0.5% of the peak and continue by a factor of 2 up to 64% plus 98%; black line segments within the images indicate direction of the polarization E-vector.
Figure 5.
Sequence of total (contours) and polarized (color scale) intensity images of Mrk 501, with one image for each year of observations; the global total intensity peak is 361 mJy/beam; the size of the beam is 0.24 × 0.15 mas2 along PA = −10°, plotted in the right bottom corner. Contours start at 0.25% of the peak and continue by a factor of 2 up to 64% plus 98%; black linear segments within the images indicate direction of the polarization E-vector.
Figure 6.
Sequence of the total (contours) and polarized (color scale) intensity images of 1ES 1959+65, with one image for each year of observations; the global total intensity peak is 218 mJy/beam; the size of the beam is 0.24 × 0.17 mas2 along PA = −10°, plotted in the left bottom corner. Contours start at 1% of the peak and continue by a factor of 2 up to 64% plus 98%; black linear segments within the images indicate direction of the polarization E-vector.
Figure 4 and Figure 5 reveal that the cores of Mrk 421 and Mrk 501 have the highest polarized intensity. EVPAs in the core of Mrk 421 are usually along the jet, while EVPAs in the core of Mrk 501 have a rather radial structure. However, in both sources, polarization in the extended jet, if detected, has a direction along the jet.
Although for a number of epochs we cannot detect the polarized flux in 1ES 1959+65 over the noise level, Figure 6 shows that the polarization tends to align with the jet direction and knot K2 can sometimes have a polarized flux higher than, or similar to, the core.
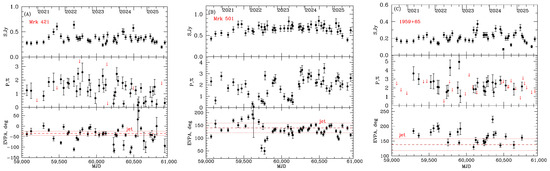
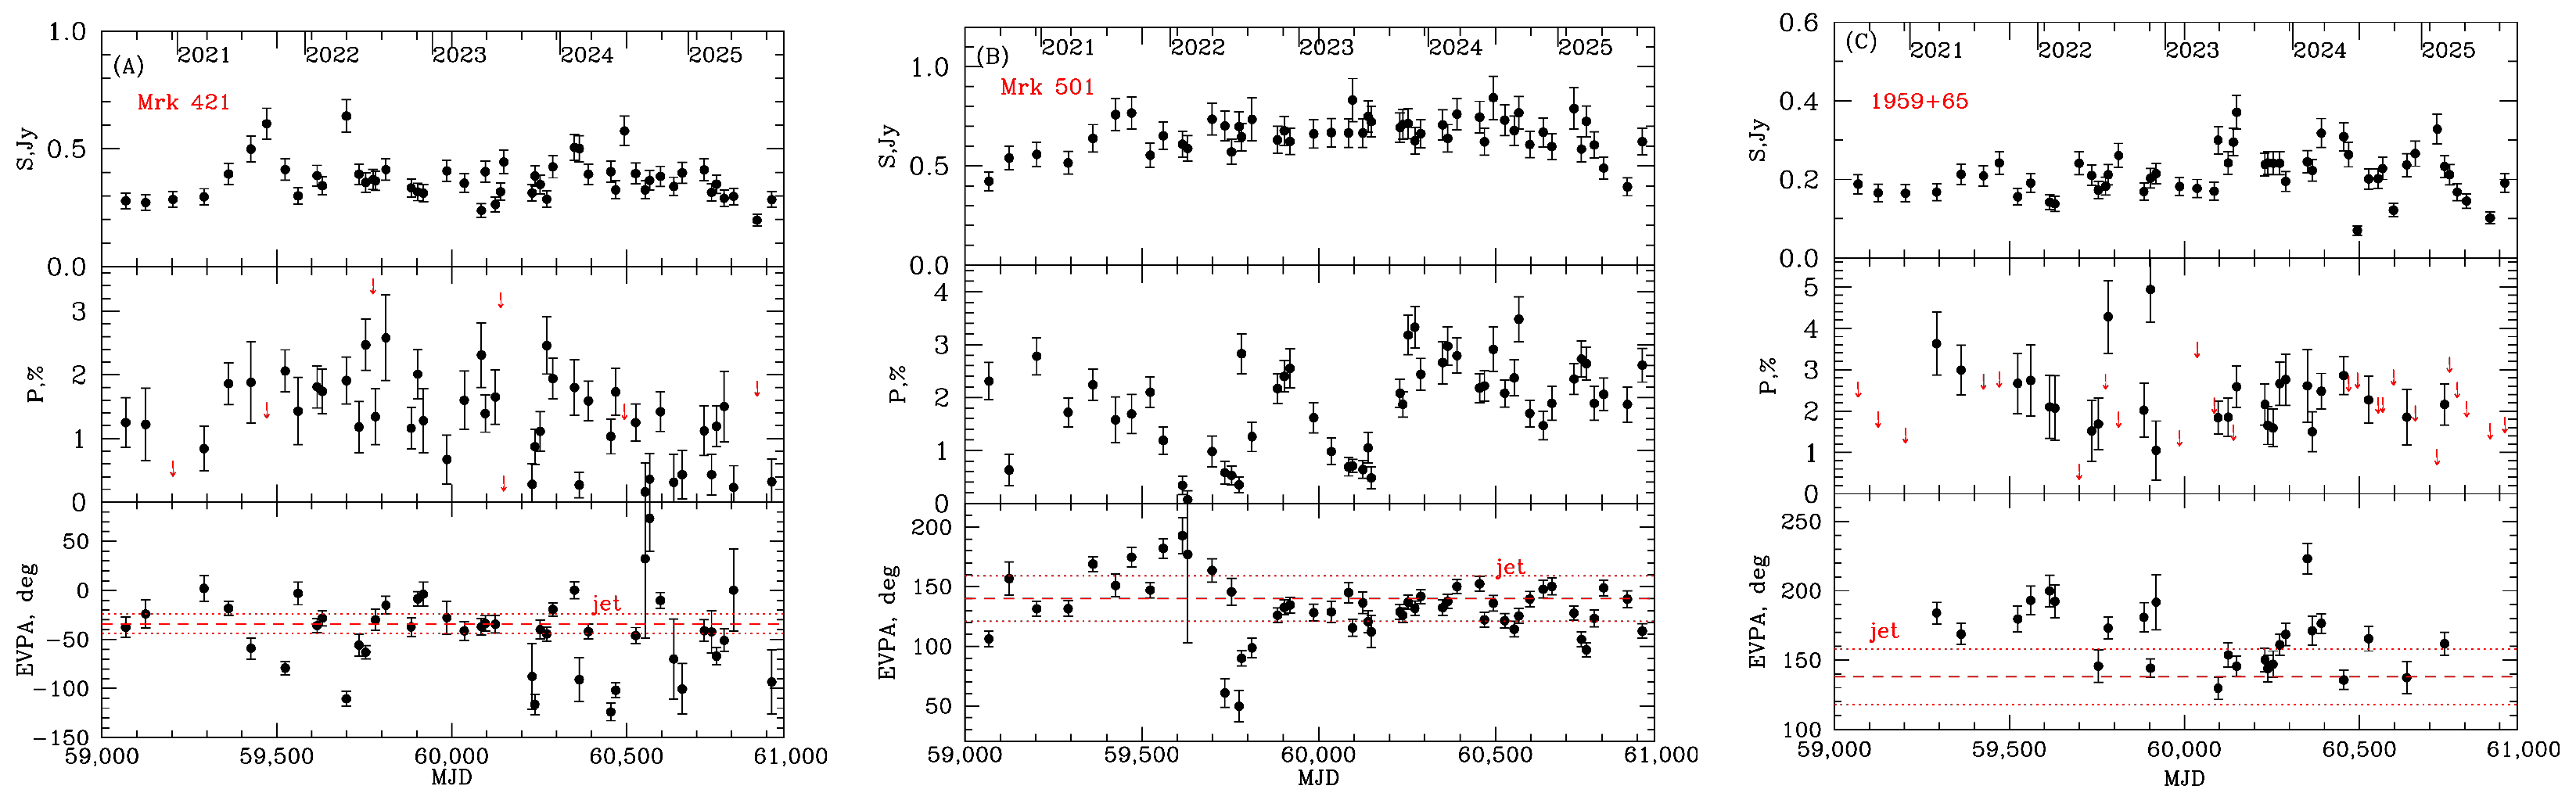
We have calculated the flux density S (I Stokes parameter) and Q and U Stokes parameters integrated over the image at each epoch. This was done by summing I, Q, and U models produced by the CLEAN method. As a result, we have obtained the flux density , the degree of polarization , and position angle of polarization EVPA = 0.5. Uncertainties in P and EVPA have been estimated by the propagation of values of the noise level of I, Q, and U images through the formulas indicated above. Figure 7 presents the behavior of , P, and EVPA with time.
Figure 7.
Total intensity, , degree of polarization, P, and position angle of polarization, EVPA, integrated over 43 GHz images versus time for (A) Mrk 421, (B) Mrk 501, and (C) 1ES 1959+65. The red dashed line in the bottom panel of each figure indicates position angle of the inner jet with its 1 uncertainty shown by red dotted lines. In the case of Mrk 421 and 1ES 1959+65, the degree of polarization has only upper limits at some epochs, which are plotted by red arrows.
Figure 7 shows that the HBLs have rather moderate flux density variability in the jet at 43 GHz, with occasional flares having amplitudes that do not exceed a factor of 2. The degree of polarization undergoes stronger variability; e.g., while Mrk 501 has an almost stable flux density over 5 yr, the degree of polarization executes several well-defined flares. All three HBLs have a similar range of p values, from ∼0.5% to ∼4%, with a typical value of p∼2%. Mrk 501 has the most stable EVPA close to the jet direction, which indicates that even though the core has a radial structure of E-vectors, the strongest polarization has an EVPA along the jet direction. The majority of EVPAs in Mrk 421 align also with the jet direction. This result, along with the finding by [15] that in HBLs optical EVPAs tend to concentrate around preferred directions close to the parsec-scale jet direction, imply that the structure of the magnetic field in optical emission regions of HBLs is similar to that in parsec-scale jets. Note also that the median optical degrees of polarization of HBLs [15] concentrate around lower values, as in the case of p values in the parsec-scale jet at 43 GHz (see Figure 7).
4. Discussion
The analysis of the kinematics of recent well-sampled VLBA data at 43 GHz of three HBLs agrees very well with the previous results of jet kinematics of these sources (e.g., [4,7,8,12]). We find that (i) jets of the sources are strongly core-dominated both in total and polarized flux density, with a number of stationary or subluminal features downstream of the core; (ii) the apparent speed of moving knots does not exceed ; (iii) the sources exhibit a significantly higher amplitude and shorter timescale of variability in the fractional polarization than the total flux density; (iv) there is a typical value of the fractional polarization of ∼2%; (v) EVPAs integrated over images tend to align with the parsec-scale jet direction, and even better alignment is seen in the extended jet if its polarized flux is detected; (vi) items iv and v imply a complex structure of the magnetic field in HBLs consisting of an ordered—most likely helical—component and a turbulent one, the relative contribution of which changes with time; (vii) the EVPA behavior at 43 GHz is similar to that of optical emission regions [15], which suggests a similarity of the magnetic field structure in optical and radio emission regions.
The main problem with HBLs is their low, mostly subluminal, apparent speeds in parsec-scale jets despite the high luminosity and short timescales of variability at TeV energies that require high Doppler factors. This problem has been studied by the blazar community for decades. Different approaches have been proposed to reconcile the “Doppler crisis”:
- Piner & Edwards [8] suggested that “the absence of shocks or plasmoids in the parsec scale jets of HSP BLLacs with a high apparent speed which can be associated with high-energy flares can be explained by the dissipation of such features before they separate from the core on the VLBI images. This implies the loss of a substantial amount of bulk kinetic energy on parsec scales and requires a higher efficiency than is typically assumed for internal shock scenarios.” Our analysis confirms low apparent speeds in the HBLs, so it is possible that these sources experience significant losses of kinetic energy upstream from the VLBI core.
- Jorstad et al. [3] used the product of the Lorentz factor, , and intrinsic opening angle of the jet , which can be approximated by a constant value, 0.2 according to [5,16,17], to estimate for Mrk 421. Such a relationship is expected also in standard theories of the formation, acceleration, and collimation of relativistic jets, e.g., [18]. The authors adopted an intrinsic opening angle of the jet equal to the average value for the BLs subclass in their sample. A comparison between and the observed projected opening angle of Mrk 421 allowed them to estimate the viewing angle of the jet to be ∼1°, which resulted in a Doppler factor 24. A similar value of has been used in the modeling of SEDs of Mrk 421 in quiescent states, e.g., [19].
- Georganopoulos & Kazanas [20] examined the possibility that the relativistic flows in HBLs decelerate. They assumed that HBLs have different speeds of the jet flow, with a faster speed in the middle and a slow outer speed. They suggested that a bulk Lorentz factor 15 decelerates to values corresponding to observed subluminal speeds. This could also solve the problem of the source of seed photons for producing rays due to upstream Compton scattering, since the upstream energetic electrons from the fast flow “see” the synchrotron seed photons originating in the slow part of the flow to be relativistically beamed. Such a deceleration appears to be in agreement with the BLs-FR I unification. In fact, Jorstad et al. [3] have reported a significant deceleration of the BL jets in their sample in the vicinity of the VLBI core at 43 GHz. However, the moving knots discussed here are not observed to decelerate on parsec scales (except for knot K2 in Mrk 501), although deceleration could occur when a knot enters the VLBI core.
- The favored explanation of a low apparent speed in jets of HBLs is that the jet is stratified such that it consists of a central ultra-fast spine surrounded by a sheath with lower (e.g., [9,20]), as mentioned in the previous item. Indeed, VLBI images of many HBLs show a limb-brightened morphology, e.g., Mrk 501 [21], Mrk 421 [22], 0502+675, and 1722+119 [23]. The data discussed here favors this interpretation, because it can explain not only low apparent speeds in HBL jets, but also the moderate 43 GHz flux density variability in contrast with the strong variability at TeV energies. Strong support for this interpretation comes also from the recent results of X-ray polarization observations by the Imaging X-ray Polarimetry Explorer (IXPE). The IXPE observations of Mrk 421 [24] showed a rotation of EVPA at 2–8 keV across 5 days in June 2022 at a rate of ∼85° per day, while the degree of polarization was stable, = 10% ± 1%. Simultaneous polarization observations at optical, infrared, and millimeter wavelengths do not exhibit rotations. The X-ray results were interpreted as the result of a localized shock propagating along a magnetic field with a helical structure located in the jet spine where the X-ray emission dominates, while the emission at longer wavelengths originates mostly in a sheath surrounding the spine. The optical to X-ray SEDs of HBLs have been observed to rise steeply with frequency on the low-energy end in a number of sources. Katarzynski et al. [25] have interpreted this to imply that the energy distribution of relativistic electrons in the spine has a high minimum value, 104. A recent paper [26] has studied the evolution of SEDs of Mrk 421 during a dramatic outburst in April 2013. The authors used a structured jet model with a fast flow of 100 and a slower part with 30. They estimated = 4.3 in the fast jet. Electrons with such energies radiate mostly at optical to X-ray energies; hence, the spine of an HBL jet should not radiate strongly at radio wavelengths. A structured jet should be more turbulent near the boundary between the spine and sheath, owing to the Kelvin–Helmholtz instability. Most likely, the spine and sheath each have their own magnetic field geometry, with the spine having an underlying helical field (with some turbulence) and the sheath being mostly turbulent. This is consistent with a moderate degree of polarization, 2%, which we observe in HBL jets, and multi-wavelength polarization observations from X-rays to radio wavelengths of HBLs, which show (e.g., [27]). The latter suggests that the magnetic field becomes more turbulent with wavelength, which can be interpreted within a structured jet model with the size of the emission region increasing with wavelength.
Currently, the solution to the Doppler crisis in HBLs is still unsettled. Simultaneous multi-wavelength polarization observations from X-rays to radio wavelengths of a statistically significant sample of HBLs will be a significant factor in solving the problem. However, the most direct solution to the crisis should come from observations of HBLs by the Event Horizon Telescope (EHT) at 230 GHz and 345 GHz, which provides a resolution of ∼20 as or better. Such observations will allow us to resolve an HBL jet in the transverse direction, as well as to determine the jet apparent speed in the vicinity of the black hole.
Author Contributions
S.G.J., A.P.M., and J.L.G.: data reduction; S.G.J.: writing—original draft preparation; S.G.J., A.P.M., and J.L.G.: reviewing and editing the final version. All authors have read and agreed to the published version of the manuscript.
Funding
The research at Boston University was supported in part by several NASA Fermi Guest Investigator grants, the latest of which is 80NSSC23K1508.
Data Availability Statement
The VLBA data at 43 GHz are available at our website https://www.bu.edu/blazars/BEAM-ME.html (accessed on 8 April 2026).
Acknowledgments
The VLBA is an instrument of the National Radio Astronomy Observatory. The National Radio Astronomy Observatory is a facility of the National Science Foundation, operated by Associated Universities, Inc. This research has made use of data from the MOJAVE database that is maintained by the MOJAVE team.
Conflicts of Interest
The authors declare no conflicts of interest.
References
- Aharonian, F.; Akhperjanian, A.G.; Bazer-Bachi, A.R.; Behera, B.; Beilicke, M.; Benbow, W.; Berge, D.; Bernlöhr, K.; Boisson, C.; Bolz, O.; et al. An Exceptional Very High Energy Gamma-Ray Flare of PKS 2155−304. Astrophys. J. 2007, 664, L71–L74. [Google Scholar] [CrossRef] [Scilit]
- Aartsen, M.G. et al. [IceCube Collaboration] Multimessenger observations of a flaring blazar coincident with high-energy neutrino IceCube-170922A. Science 2018, 361, 1378. [Google Scholar] [CrossRef] [Scilit]
- Jorstad, S.G.; Marscher, A.P.; Morozova, D.A.; Troitsky, I.S.; Agudo, I.; Casadio, C.; Foord, A.; Gómez, J.L.; MacDonald, N.R.; Molina, S.N.; et al. Kinematics of Parsec-scale Jets of Gamma-Ray Blazars at 43 GHz within the VLBA-BU-BLAZAR Program. Astrophys. J. 2017, 846, 98. [Google Scholar] [CrossRef] [Scilit]
- Lister, M.L.; Homan, D.C.; Kellermann, K.I.; Kovalev, Y.Y.; Pushkarev, A.B.; Ros, E.; Savolainen, T. Monitoring of Jets in Active Galactic Nuclei with VLBA Experiments. XVIII. Kinematics and Inner Jet Evolution of Bright Radio-loud Active Galaxies. Astrophys. J. 2021, 923, 30. [Google Scholar] [CrossRef] [Scilit]
- Jorstad, S.G.; Marscher, A.P.; Lister, M.L.; Stirling, A.M.; Cawthorne, T.V.; Gear, W.K.; Gómez, J.L.; Stevens, J.A.; Smith, P.S.; Forster, J.R.; et al. Polarimetric Observations of 15 Active Galactic Nuclei at High Frequencies: Jet Kinematics from Bimonthly Monitoring with the Very Long Baseline Array. Astron. J. 2005, 130, 1418. [Google Scholar] [CrossRef] [Scilit]
- Hovatta, T.; Valtaoja, E.; Tornikoski, M.; Lähteenmäki, A. Doppler factors, Lorentz factors and viewing angles for quasars, BL Lacertae objects and radio galaxies. Astron. Astrophys. 2009, 494, 527. [Google Scholar] [CrossRef] [Scilit]
- Kellermann, K.I.; Lister, M.L.; Homan, D.C.; Vermeulen, R.C.; Cohen, M.H.; Ros, E.; Kadler, M.; Zensus, J.A.; Kovalev, Y.Y. Sub-Milliarcsecond Imaging of Quasars and Active Galactic Nuclei. III. Kinematics of Parsec-scale Radio Jets. Astrophys. J. 2004, 609, 539–563. [Google Scholar] [CrossRef] [Scilit]
- Piner, B.G.; Edwards, P.G. The Parsec-Scale Structure and Jet Motions of the TeV Blazars 1ES 1959+650, PKS 2155−304, and 1ES 2344+514. Astrophys. J. 2004, 600, 115–126. [Google Scholar] [CrossRef] [Scilit]
- Ghisellini, G.; Tavecchio, F.; Chiaberge, M. Structured jets in TeV BL Lac objects and radiogalaxies. Implications for the observed properties. Astron. Astrophys. 2005, 432, 401. [Google Scholar] [CrossRef] [Scilit]
- Komatsu, E.; Dunkley, J.; Nolta, M.R.; Bennett, C.L.; Gold, B.; Hinshaw, G.; Jarosik, N.; Larson, D.; Limon, M.; Page, L.; et al. Five-Year Wilkinson Microwave Anisotropy Probe Observations: Cosmological Interpretation. Astrophys. J. 2009, 180, 330–376. [Google Scholar] [CrossRef] [Scilit]
- Lister, M.L.; Aller, M.F.; Aller, H.D.; Homan, D.C.; Kellermann, K.I.; Kovalev, Y.Y.; Pushkarev, A.B.; Richards, J.L.; Ros, E.; Savolainen, T. MOJAVE. X. Parsec-scale Jet Orientation Variations and Superluminal Motion in Active Galactic Nuclei. Astron. J. 2013, 146, 120. [Google Scholar] [CrossRef] [Scilit]
- Weaver, Z.R.; Jorstad, S.G.; Marscher, A.P.; Morozova, D.A.; Troitsky, I.S.; Agudo, I.; Gómez, J.L.; Lähteenmäki, A.; Tammi, J.; Tornikoski, M. Kinematics of Parsec-scale Jets of Gamma-Ray Blazars at 43 GHz during 10 yr of the VLBA-BU-BLAZAR Program. Astrophys. J. Suppl. Ser. 2022, 260, 12. [Google Scholar] [CrossRef] [Scilit]
- Shepherd, M.C. Astronomical Data 1488 Analysis Software and Systems VI; Hunt, G., Payne, H.E., Eds.; ASP: San Francisco, CA, USA, 1997; Volume 125, p. 77. [Google Scholar]
- Cornwell, T.; Braun, R.; Briggs, D.S. Synthesis Imaging in Radio Astronomy II; Taylor, G.B., Carilli, C.L., Perley, R.A., Eds.; ASP: San Francisco, CA, USA, 1999; Volume 151. [Google Scholar]
- Angelakis, E.; Hovatta, T.; Blinov, D.; Pavlidou, V.; Kiehlmann, S.; Myserlis, I.; Böttcher, M.; Mao, P.; Panopoulou, G.V.; Liodakis, I.; et al. RoboPol: The optical polarization of gamma-ray-loud and gamma-ray-quiet blazars. Mon. Not. R. Astron. Soc. 2016, 463, 3365. [Google Scholar] [CrossRef] [Scilit]
- Pushkarev, A.B.; Kovalev, Y.Y.; Lister, M.L.; Savolainen, T. Jet opening angles and gamma-ray brightness of AGN. Astron. Astrophys. 2009, 507, L33. [Google Scholar] [CrossRef] [Scilit]
- Clausen-Brown, E.; Savolainen, T.; Pushkarev, A.B.; Kovalev, Y.Y.; Zensus, J.A. Causal connection in parsec-scale relativistic jets: Results from the MOJAVE VLBI survey. Astron. Astrophys. 2013, 558, A144. [Google Scholar] [CrossRef] [Scilit]
- Blandford, R.D.; Königl, A. Relativistic jets as compact radio sources. Astrophys. J. 1979, 232, 34. [Google Scholar] [CrossRef] [Scilit] [PubMed]
- Abdo, A.A.; Ackermann, M.; Ajello, M.; Baldini, L.; Ballet, J.; Barbiellini, G.; Bastieri, D.; Bechtol, K.; Bellazzini, R.; Berenji, B.; et al. Fermi Large Area Telescope Observations of Markarian 421: The Missing Piece of its Spectral Energy Distribution. Astrophys. J. 2011, 736, 131. [Google Scholar] [CrossRef] [Scilit]
- Georganopoulos, M.; Kazanas, D. Decelerating Flows in TeV Blazars: A Resolution to the BL Lacertae-FR I Unification Problem. Astrophys. J. 2003, 594, L27. [Google Scholar] [CrossRef] [Scilit]
- Giroletti, M.; Giovannini, G.; Feretti, L.; Cotton, W.D.; Edwards, P.G.; Lara, L.; Marscher, A.P.; Mattox, J.R.; Piner, B.G.; Venturi, T. Parsec-Scale Properties of Markarian 501. Astrophys. J. 2004, 600, 127. [Google Scholar] [CrossRef] [Scilit]
- Giroletti, M.; Giovannini, G.; Taylor, G.B.; Falomo, R. A Sample of Low-Redshift BL Lacertae Objects. II. EVN and MERLIN Data and Multiwavelength Analysis. Astrophys. J. 2006, 646, 801. [Google Scholar] [CrossRef] [Scilit]
- Piner, B.G.; Edwards, P.G. First-epoch VLBA Imaging of 20 New TeV Blazars. Astrophys. J. 2014, 797, 25. [Google Scholar] [CrossRef] [Scilit]
- Di Gesu, L.; Marshall, H.L.; Ehlert, S.R.; Kim, D.E.; Donnarumma, I.; Tavecchio, F.; Liodakis, I.; Kiehlmann, S.; Agudo, I.; Jorstad, S.G.; et al. Discovery of X-ray polarization angle rotation in the jet from blazar Mrk 421. Nat. Astron. 2023, 7, 1245. [Google Scholar] [CrossRef] [Scilit]
- Katarzynski, K.; Ghisellini, G.; Tavecchio, F.; Gracia, J.; Maraschi, L. Hard TeV spectra of blazars and the constraints to the infrared intergalactic background. Mon. Not. R. Astron. Soc. 2006, 368, L52–L56. [Google Scholar] [CrossRef] [Scilit]
- Abe, K.; Abe, S.; Abhir, J.; Abhishek, A.; Aguasca-Cabot, I.; Agudo, T.; Aniello, S.; Ansoldi, L.A.; Antonelli, A.; Arbet Engels, C.; et al. Time-dependent Modeling of the Subhour Spectral Evolution during the 2013 Outburst of Mrk 421. Astrophys. J. 2026, 998, 6. [Google Scholar] [CrossRef] [Scilit]
- Liodakis, I.; Marscher, A.P.; Agudo, I.; Berdyugin, A.V.; Bernardos, M.I.; Bonnoli, G.; Borman, G.A.; Casadio, C.; Casanova, V.; Cavazzuti, E.; et al. Polarized blazar X-rays imply particle acceleration in shocks. Nature 2022, 611, 677. [Google Scholar] [CrossRef] [Scilit] [PubMed]

Disclaimer/Publisher’s Note: The statements, opinions and data contained in all publications are solely those of the individual author(s) and contributor(s) and not of MDPI and/or the editor(s). MDPI and/or the editor(s) disclaim responsibility for any injury to people or property resulting from any ideas, methods, instructions or products referred to in the content. |
© 2026 by the authors. Licensee MDPI, Basel, Switzerland. This article is an open access article distributed under the terms and conditions of the Creative Commons Attribution (CC BY) license.