


Abstract
Background/Objectives: Systemic sclerosis (SSc) is a heterogeneous autoimmune disease whose activity and severity remain difficult to assess. Although haematological inflammatory indices such as the Systemic Immune-Inflammation Index (SII), neutrophil-to-lymphocyte ratio (NLR), platelet-to-lymphocyte ratio (PLR), and monocyte-to-lymphocyte ratio (MLR) have been investigated in several inflammatory conditions, data in SSc remain limited. This study aimed to assess their clinical utility as markers of disease activity and severity. Methods: This cross-sectional correlational study included patients diagnosed with SSc who were evaluated for haematological and inflammatory markers, including SII, PLR, NLR, MLR, platelet distribution width (PDW), plateletcrit (PCT), and C-reactive protein (CRP), in relation to disease phenotype, organ involvement, and disease activity, as assessed by a modified European Scleroderma Trials and Research Activity Index (EUSTAR-AI). Group comparisons were performed using independent-samples t-tests on log-transformed data, with multivariable adjustment for age, sex, disease duration, phenotype and immunosuppressive and glucocorticoid therapy, while Pearson and Spearman correlations, linear regression and receiver operating characteristic (ROC) analyses (with DeLong comparisons of the areas under the curve, AUC) were used to evaluate associations and discriminative performance; multiplicity was addressed with the Benjamini–Hochberg procedure. Results: A total of 159 patients with SSc were included. Patients with diffuse cutaneous SSc (dcSSc) exhibited significantly higher SII, NLR, and MLR values than those with limited cutaneous disease. SII and NLR were also significantly elevated in patients with interstitial lung disease (ILD) and pulmonary arterial hypertension (PAH). Active disease was associated with higher levels of all major inflammatory indices, while SII and NLR showed significant correlations with pulmonary function parameters, the modified Rodnan Skin Score (mRSS), and the EUSTAR-AI score. In the ROC analysis of SII alone, SII showed moderate discrimination of active disease (AUC = 0.72, 95% CI 0.63–0.80), not significantly different from NLR (0.67) or CRP (0.75). In multivariable regression, SII remained associated with EUSTAR-AI but not with mRSS. After adjustment for age, sex, disease duration, phenotype and treatment, SII remained higher in dcSSc and active disease, whereas the associations with ILD and PAH were no longer significant. Conclusions: SII and NLR were associated with disease activity, the diffuse cutaneous phenotype and, in unadjusted analyses, pulmonary involvement in SSc. SII was independently associated with EUSTAR-AI, but its discriminative ability was moderate and not superior to that of NLR or CRP. These indices may serve as exploratory adjuncts to established activity measures; prospective validation is needed.
1. Introduction
Systemic Sclerosis (SSc) is a multisystemic condition with autoimmune pathology, characterised by inflammation, progressive fibrosis and vascular involvement. The disease is associated with diverse clinical manifestations, including skin changes and pulmonary, cardiac, and renal complications. This variability in the presentation of SSc makes it difficult to assess and monitor its activity and severity, and new tools are needed in order to choose proper therapeutic approaches and quantify the prognosis of the disease.
In previous decades, the systemic immune-inflammation index (SII), neutrophil/lymphocyte ratio (NLR), thrombocyte/lymphocyte ratio (PLR), and monocyte/lymphocyte ratio (MLR) were studied as markers of inflammation and prognosis in autoimmune and neoplastic diseases [1,2,3,4]. However, for SSc, only a few data exist, some of which focus on SII. Current research studies the evolution of this marker in systemic lupus erythematosus, rheumatoid arthritis or other inflammatory conditions [5,6].
The aim of this study is to establish the clinical value of these haematological markers (SII, NLR, PLR, MLR) in monitoring the activity and severity of SSc. Specific objectives include assessing their values across different disease phenotypes, their association with complications, and investigating correlations between index values and functional respiratory test results or clinical scores, such as the European Scleroderma Trials and Research (EUSTAR-AI) and the modified Rodnan Skin Score (mRSS). Moreover, the study aims to estimate the predictive value of these markers for identifying patients at high risk and the subgroups that would benefit from supplementary investigations to optimise disease management.
2. Materials and Methods
2.1. Study Design and Population
This cross-sectional correlational study included 159 patients diagnosed with SSc who were admitted to the Rheumatology Department of Sfanta Maria Hospital in Bucharest, for stage-specific clinical and paraclinical assessments over 12 months (July 2023 to July 2024). Data were extracted from the medical records and the EUSTAR database. The initial cohort of 173 patients was reduced to 159 after applying the exclusion criteria.
2.2. Inclusion and Exclusion Criteria
The inclusion criteria consisted of:
- Patients aged over 18
- Diagnosis of SSc, according to the American College of Rheumatology (ACR)/European League Against Rheumatism (EULAR) 2013, respectively (Very Early Diagnosis of Systemic Sclerosis) VEDOSS criteria. Patients fulfilling only the VEDOSS criteria (n = 4), patients with SSc sine scleroderma (n = 2) and patients with an overlap syndrome (n = 11) were retained in the cohort and in the unadjusted analyses of the whole group. The comparison of clinical phenotypes was restricted to the 153 patients with dcSSc or lcSSc, and VEDOSS-only and sine scleroderma patients were therefore not included in the models adjusted for phenotype. A sensitivity analysis excluding VEDOSS-only and overlap patients is reported in Supplementary Tables S1–S11.
Exclusion criteria
- Acute infectious intercurrences
- Side effects of medication
- Patients admitted for acute systemic manifestations of SSc, such as sclerodermic renal crisis, lung involvement or heart failure.
2.3. Data Collection
From the EUSTAR database and the patients’ medical records, demographic, anamnestic, clinical, and paraclinical data were extracted. The EUSTAR-AI score was calculated. Demographic data comprised gender and age, with age recorded in years. Anamnestic data included the time from the onset of SSc, with disease duration recorded in months, together with risk factors such as smoking and ethanol consumption. Clinical data comprised the SSc type, treatments received, comorbidities, and organ and skin involvement, the latter quantified using the modified Rodnan skin score (mRSS, range 0–51). In each patient, the mRSS was assessed by a single, specifically trained evaluator. ILD was diagnosed on high-resolution computed tomography (HRCT) of the chest. PAH was confirmed by right heart catheterisation, with a mean pulmonary arterial pressure >20 mmHg. Active digital ulcers were defined as lesions with a loss of skin integrity extending beyond the epidermis and involving the basement membrane. Paraclinical data included functional and inflammatory parameters, specific antibodies, the haemogram, and the capillaroscopy pattern; inflammatory markers, specific antibodies. Haemogram values were recorded in standard units (haemoglobin in g/dL, CRP in mg/L, ESR in mm/h, and cell counts in cells/μL), while the capillaroscopy pattern was recoded into three categories. From the leucocyte formula, four haematological indices were calculated—NLR, PLR, MLR, and SII. NLR = neutrophils/lymphocytes, PLR = platelets/lymphocytes, MLR = monocytes/lymphocytes and SII = platelets × neutrophils/lymphocytes. Finally, a composite score, the EUSTAR-AI, was derived, adapted for the lack of data on skin worsening in the last 4 weeks by using information from the last 12 months instead. The score comprised the six items of the revised EUSTAR-AI [7]: mRSS > 18, skin worsening, digital ulcers/necrosis, tendon friction rubs, DLCO < 70% predicted and CRP > 1 mg/dL (>10 mg/L); disease was classified as active when the score was ≥2.5. Items with missing data (mRSS >18, n = 14; skin worsening, n = 16; DLCO, n = 28; tendon friction rubs, n = 14; CRP, n = 5; 38 patients with at least one missing item) were scored as zero. Because the 12-month window can only classify more patients as having skin worsening than the 4-week window, 25 patients scored 1.5 points for this item. The index used here is therefore a modified EUSTAR-AI, which departs from the published index [7] in two respects (Supplementary Table S9): skin worsening was assessed over the previous 12 months instead of the previous 4 weeks, and items with missing data were scored as zero. All other items were scored as published: mRSS > 18 (1.5 points), digital ulcers (1.5 points), tendon friction rubs (2.25 points; recorded in 145 patients and present in 7), CRP > 1 mg/dL (2.25 points; 28 of 154 patients) and DLCO < 70% predicted (1.0 point). With the published cut-off of ≥2.5, which has not been validated for the modified score, 52 patients were classified as having active disease and 107 as having inactive disease. Blood counts, inflammatory markers, pulmonary function tests, mRSS and EUSTAR-AI items were obtained at the same hospital admission (maximum interval between assessments: 30 days).
2.4. Statistical Analysis
For data analysis, Microsoft Excel and IBM SPSS 26 were used. Descriptive statistics were calculated for the population and reported as mean ± standard deviation or median [interquartile range (IQR)] and frequencies. Correlations were obtained using Pearson “r” coefficients for variables with a normal distribution and Spearman “rho” coefficients for those without this type of distribution. Normality was assessed using the Kolmogorov-Smirnov test, along with histogram and quantile plots. The statistical significance threshold was p < 0.05. To assess the impact of using a 12-month instead of a 4-week window for skin worsening, the skin-worsening item was omitted from the score (threshold unchanged) and the main analyses were repeated; a second sensitivity analysis was restricted to the 121 patients with complete EUSTAR-AI items (Supplementary Table S6). To differentiate active from inactive disease, the EUSTAR-AI value of 2.5, identified by Valentini et al., was used as a threshold for score validation [7]. The results table presented missing data in a maximum of 18.2% per variable, so the technique of multiple imputation with ten imputations was used. A pilot analysis for missing information fraction estimation (FMI) was performed, yielding a value of ~0.02. According to Paul von Hippel’s formula: [8]. The number of needed inputs for a variation coefficient of the standard error (CV(SE)) equal to 0.05 is 1–2. As a result, the selected value provides additional stability to the estimates. For comparisons between groups, the independent-samples t-test was used. The variables with asymmetric distributions were log-transformed to improve normality before applying this test. Further, the means and 95% confidence intervals (CIs) were transformed again, and the resulting geometric means and confidence intervals for the group ratio were reported. Unadjusted comparisons were complemented by multivariable linear regression of the log-transformed index on group status, adjusted for age, sex, disease duration, immunosuppressive therapy, glucocorticoid therapy and, except for the phenotype comparison, clinical phenotype (heteroscedasticity-robust HC3 standard errors). Because analysis contained 25 comparisons, the Benjamini–Hochberg false-discovery-rate procedure was applied (q-values); unadjusted p-values should be regarded as exploratory. AUCs and their 95% CIs were estimated with the DeLong method, correlated ROC curves were compared with the DeLong test, and the optimal cut-off was defined by the maximal Youden index (sensitivity + specificity − 1). The incremental value of SII, NLR and CRP was assessed by adding log2-transformed values to a baseline logistic model (age, sex, disease duration, phenotype, immunosuppressive and glucocorticoid therapy) and applying likelihood-ratio tests. These additional analyses were performed in Python 3.4 on observed data. In the full log2-SII linear models (Table 8), the capillaroscopy pattern was entered as an ordinal variable (early = 1, active = 2, late = 3; mixed patterns were assigned to the more advanced pattern). The logistic models were validated internally by bootstrap resampling (1000 replicates, Harrell’s optimism correction), which provided optimism-corrected AUCs and calibration slopes (Table 9). In summary, missing data were handled in three ways, identified for each analysis together with the number of patients analysed in Supplementary Table S10: (i) multiple imputation (ten imputed datasets, pooled estimates) for the group comparisons according to phenotype, ILD, PAH and digital ulcers in Table 4 (n = 159; n = 115 for the PAH comparison), the correlations with DLCO, FVC and mRSS in Table 5 and the mRSS regression models in Table 7; (ii) observed data without imputation (complete cases for the variables of each analysis) for all analyses involving the EUSTAR-AI (the comparison according to disease activity in Table 4, the correlations with the EUSTAR-AI in Table 5, the regression models in Table 6 and Table 8, the ROC analyses and the logistic models in Table 9) and for the adjusted and multiplicity-corrected comparisons, the sensitivity analyses and the comparison of dependent correlations (Supplementary Tables S5–S8 and S11); and (iii) scoring of missing EUSTAR-AI items as zero when the activity score was calculated (38 patients). Data were missing for DLCO in 29 patients (18.2%; the DLCO item of the score could still be scored in one of them), FVC in 20 (12.6%), mRSS in 14 (8.8%) and CRP in 5 (3.1%).
2.5. Ethical Considerations
The information used was obtained retrospectively from medical records, in accordance with confidentiality requirements and personal data regulations. Informed consent was obtained from patients through standard clinical procedures, and their use for research purposes was approved by the institution’s ethics committee.
3. Results
3.1. Descriptive Statistics
The study group included 159 patients diagnosed with SSc, predominantly females (88.7%), with a mean disease duration of 60 months. Most of the patients had localised cutaneous form (51.6%); we also observed two cases of sine scleroderma, and four patients fulfilled only the VEDOSS criteria. We also identified 11 patients with overlap syndrome. These characteristics are detailed in Table 1.
Table 1.
Characteristics of the group.
The most frequently associated pathologies were: dyslipidaemia (42.8%), followed by hypertension (35.2%), atherosclerosis (21.4%), osteoporosis (18.9%), and autoimmune thyroiditis (13.8%). In the study group, smoking status was recorded for 119 patients, of whom 22 (18.5%) were active smokers, and 23 (19.3%) were ex-smokers. Alcohol consumption was recorded for 45 patients (28.3%), of whom 40 denied alcohol consumption, 4 reported current consumption, and 1 reported former consumption.
Most of the patients (71.1%) were receiving an immunosuppressive agent; 20.8% were receiving glucocorticoids. Antifibrotic therapy was identified in 9 subjects, whereas endothelin-1 antagonist therapy was administered to 21 patients. Anticoagulation was prescribed in 9.4% of the patients and antiaggregants in 47.8%.
Visceral involvement was predominantly represented by interstitial lung disease and upper gastrointestinal involvement. Vascular complications, including previous and active digital ulcers, were also frequently observed among patients with SSc (Table 2).
Table 2.
Organ involvement in the study group.
Table 3 presents descriptive values for biological variables and clinical scores subsequently used in the inferential analyses.
Table 3.
Descriptive values for biological variables and clinical scores.
3.2. Inferential Statistics
3.2.1. Differences of Haematological Indices Based on Specific Disease Characteristics
Significant statistical differences were observed between lcSSc and dcSSc, which were transformed using logarithms (lg): lg NLR-MD = 0.085, lg MLR-MD = 0.074; p < 0.05, as detailed in Supplementary Table S1. The logarithmic values were reconverted and reported as geometric means, along with confidence intervals and ratios of means between groups. Thus, SII was 37% higher in patients with the dcSSc phenotype than in those with lcSSc, while NLR and MLR were 21% and 18% higher, respectively, in the same group. Detailed information is presented in Table 4. No statistically significant differences were identified for the other variables, namely PLR and CRP (p = 0.092 and p = 0.053).
Table 4.
Geometric mean ratios of haematological and inflammatory markers according to clinical phenotype, organ involvement and disease activity.
Among patients with and without ILD, statistically significant differences in haematological and inflammatory indices were observed for only two markers: SII and NLR, both of which were higher in the ILD group. Following back-transformation, SII values were found to be 33% higher, and NLR values 24% higher in patients with ILD. No statistically significant differences were identified for the remaining markers between the two groups, as seen in Table 4 and Supplementary Table S2.
A comparison between the groups with and without PAH identified significantly higher levels in the first sample for the following markers: SII − lg SII MD = 0.15, 95% CI: [0.001, 0.29], p = 0.048; NLR − lgNLR MD = 0. 13, 95% CI: [0.004, 0.25], MLR − lgMLR MD = 0.12, 95% CI: [0.003, 0.23], and CRP − lgCRP MD = 0.28, 95% CI: [0.01–0.54]. Thus, when converted back to the original scale, the values are 41% higher for SII, 34% for NLR, 32% for MLR, and 90% higher for CRP in patients with PAH. For PLR, no significant difference was identified between the two samples (GM ratio 1.25, p = 0.061 on the imputed data; in observed data, GM ratio 1.29, 95% CI 1.00–1.66, pooled-variance t-test p = 0.052, Welch’s t-test p = 0.14, Mann–Whitney test p = 0.12). The detailed results of the t-test and the values obtained after transforming the logarithmic values are presented in Table 4 and Supplementary Table S3. These findings are based on only 15 patients with PAH and 100 patients without PAH; the differences were not significant with Welch’s t-test (e.g., SII p = 0.16) or the Mann–Whitney test (SII p = 0.10), and should be regarded as exploratory.
No significant differences in any inflammatory or haematological index were found between patients with and without active digital ulcers (n = 15), as shown in Table 4.
A comparative analysis of the 52 patients with active disease and the 107 patients without active disease revealed significant differences in most inflammatory and haematological markers. The SII index was higher in patients with active disease (GM = 1225.0) compared to those without (GM = 733.4), with a geometric mean ratio of 1.67 (95% CI: [1.37, 2.04], p < 0.001). NLR and PLR were also elevated in the same group (NLR: 3.92 vs. 2.82, ratio 1.39; PLR: 228.7 vs. 178.1, ratio 1.28), with MLR following a similar pattern, showing higher values in patients with active disease (0.47 vs. 0.38, ratio 1.26). CRP was significantly higher in the sample with active disease (8.54 vs. 3.46, ratio 2.47) (Table 4 and Table S4). NLR (p < 0.001), MLR (p = 0.007), PLR (p = 0.001), and CRP (p < 0.001) were all significantly higher in active disease.
Because Table 4 contains 25 comparisons, the Benjamini–Hochberg procedure was applied. Eight comparisons remained significant at a false-discovery rate of 5%: SII in dcSSc (q = 0.010) and ILD (q = 0.021), NLR in ILD (q = 0.044), and SII (q < 0.001), NLR (q = 0.003), MLR (q = 0.026), PLR (q = 0.006) and CRP (q < 0.001) in active disease. The remaining nominally significant results did not meet this criterion, including all comparisons for PAH (q = 0.083–0.095) and NLR and MLR in dcSSc (q = 0.078 and 0.083) (Supplementary Table S5). After multivariable adjustment for age, sex, disease duration, immunosuppressive and glucocorticoid therapy (and, except for the phenotype comparison, phenotype), SII remained higher in dcSSc (adjusted GM ratio 1.27, 95% CI 1.04–1.55, p = 0.020) and in active disease (1.48, 1.16–1.88, p = 0.002), as did NLR (1.30, 1.05–1.62, p = 0.019), PLR (1.21, 1.02–1.44, p = 0.029) and CRP (2.44, 1.44–4.13, p < 0.001) in active disease, whereas the associations with ILD (SII: 1.09, 0.87–1.37, p = 0.47) and PAH (SII: 1.40, 0.82–2.40, p = 0.22) were no longer significant; MLR was not significantly associated with any outcome after adjustment, and NLR and PLR with no outcome other than disease activity (Supplementary Table S5). These adjusted p-values were not corrected for multiplicity (after correction, only SII and CRP in active disease remained significant, both q = 0.021). Glucocorticoid and immunosuppressive therapy were not significantly associated with SII (GM ratios 1.21, p = 0.13 and 1.18, p = 0.15) or NLR (1.14, p = 0.23 and 1.10, p = 0.35).
3.2.2. Comparison of Normally Distributed Haematological Markers According to Clinical Phenotype, Organ Involvement and Disease Activity
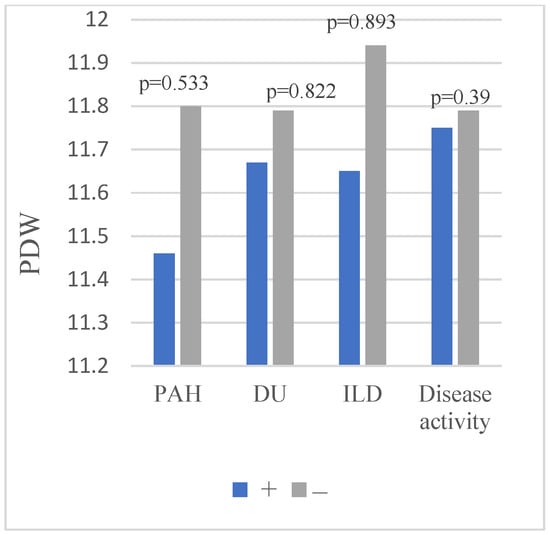
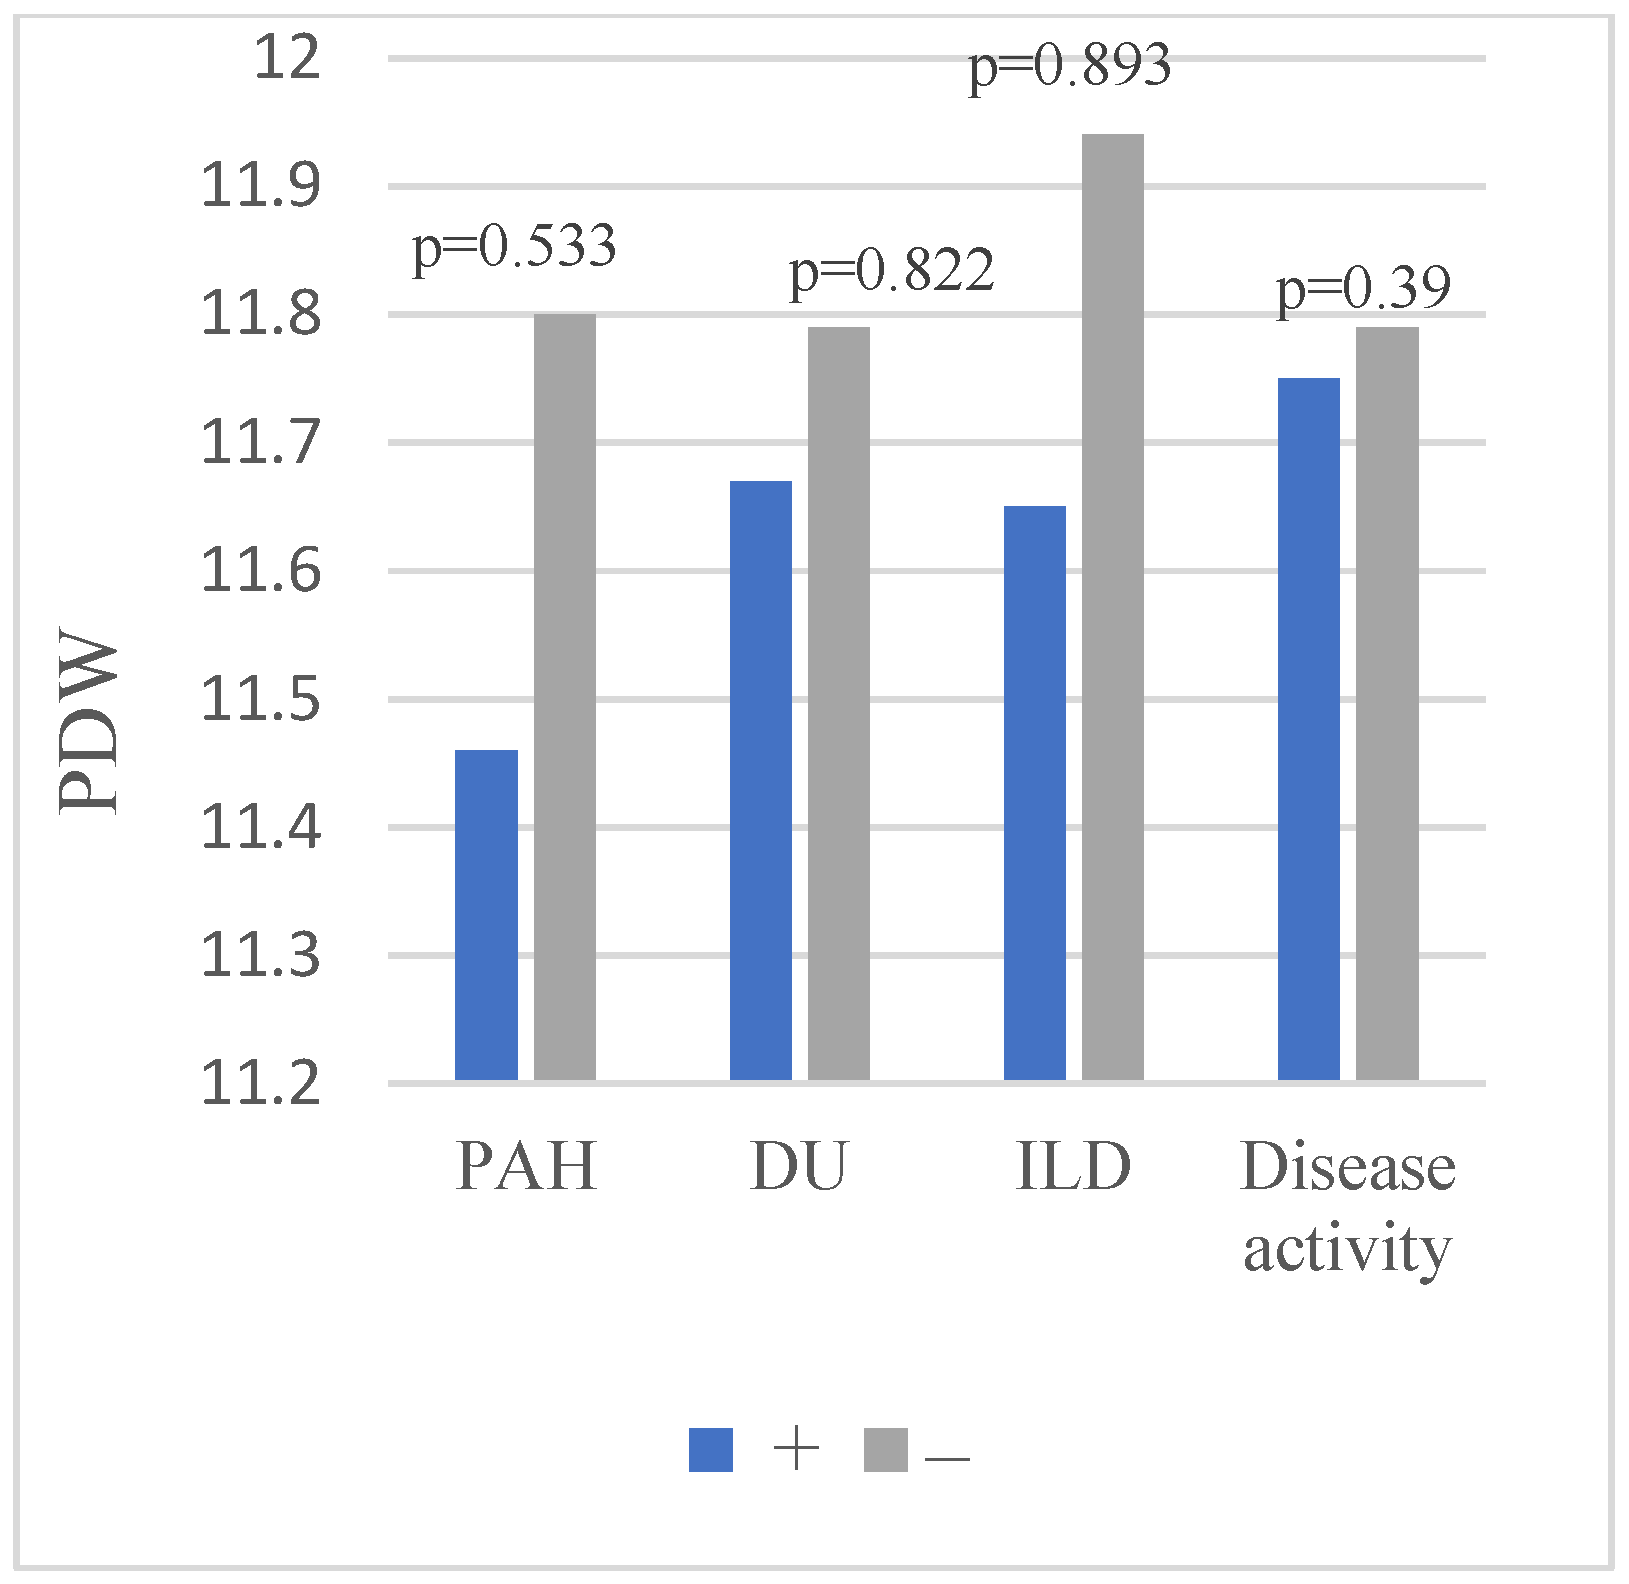
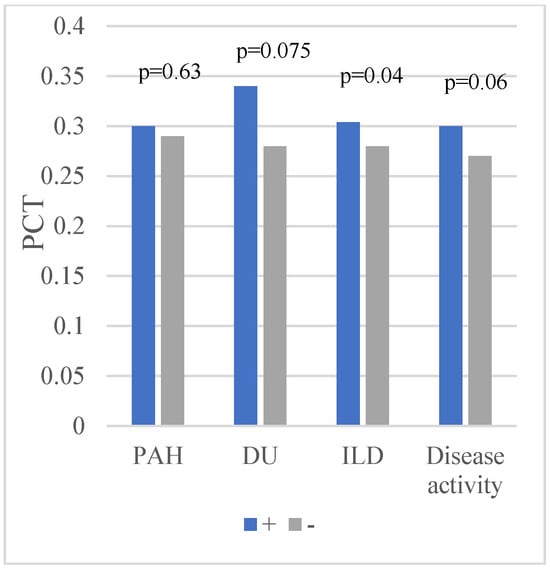
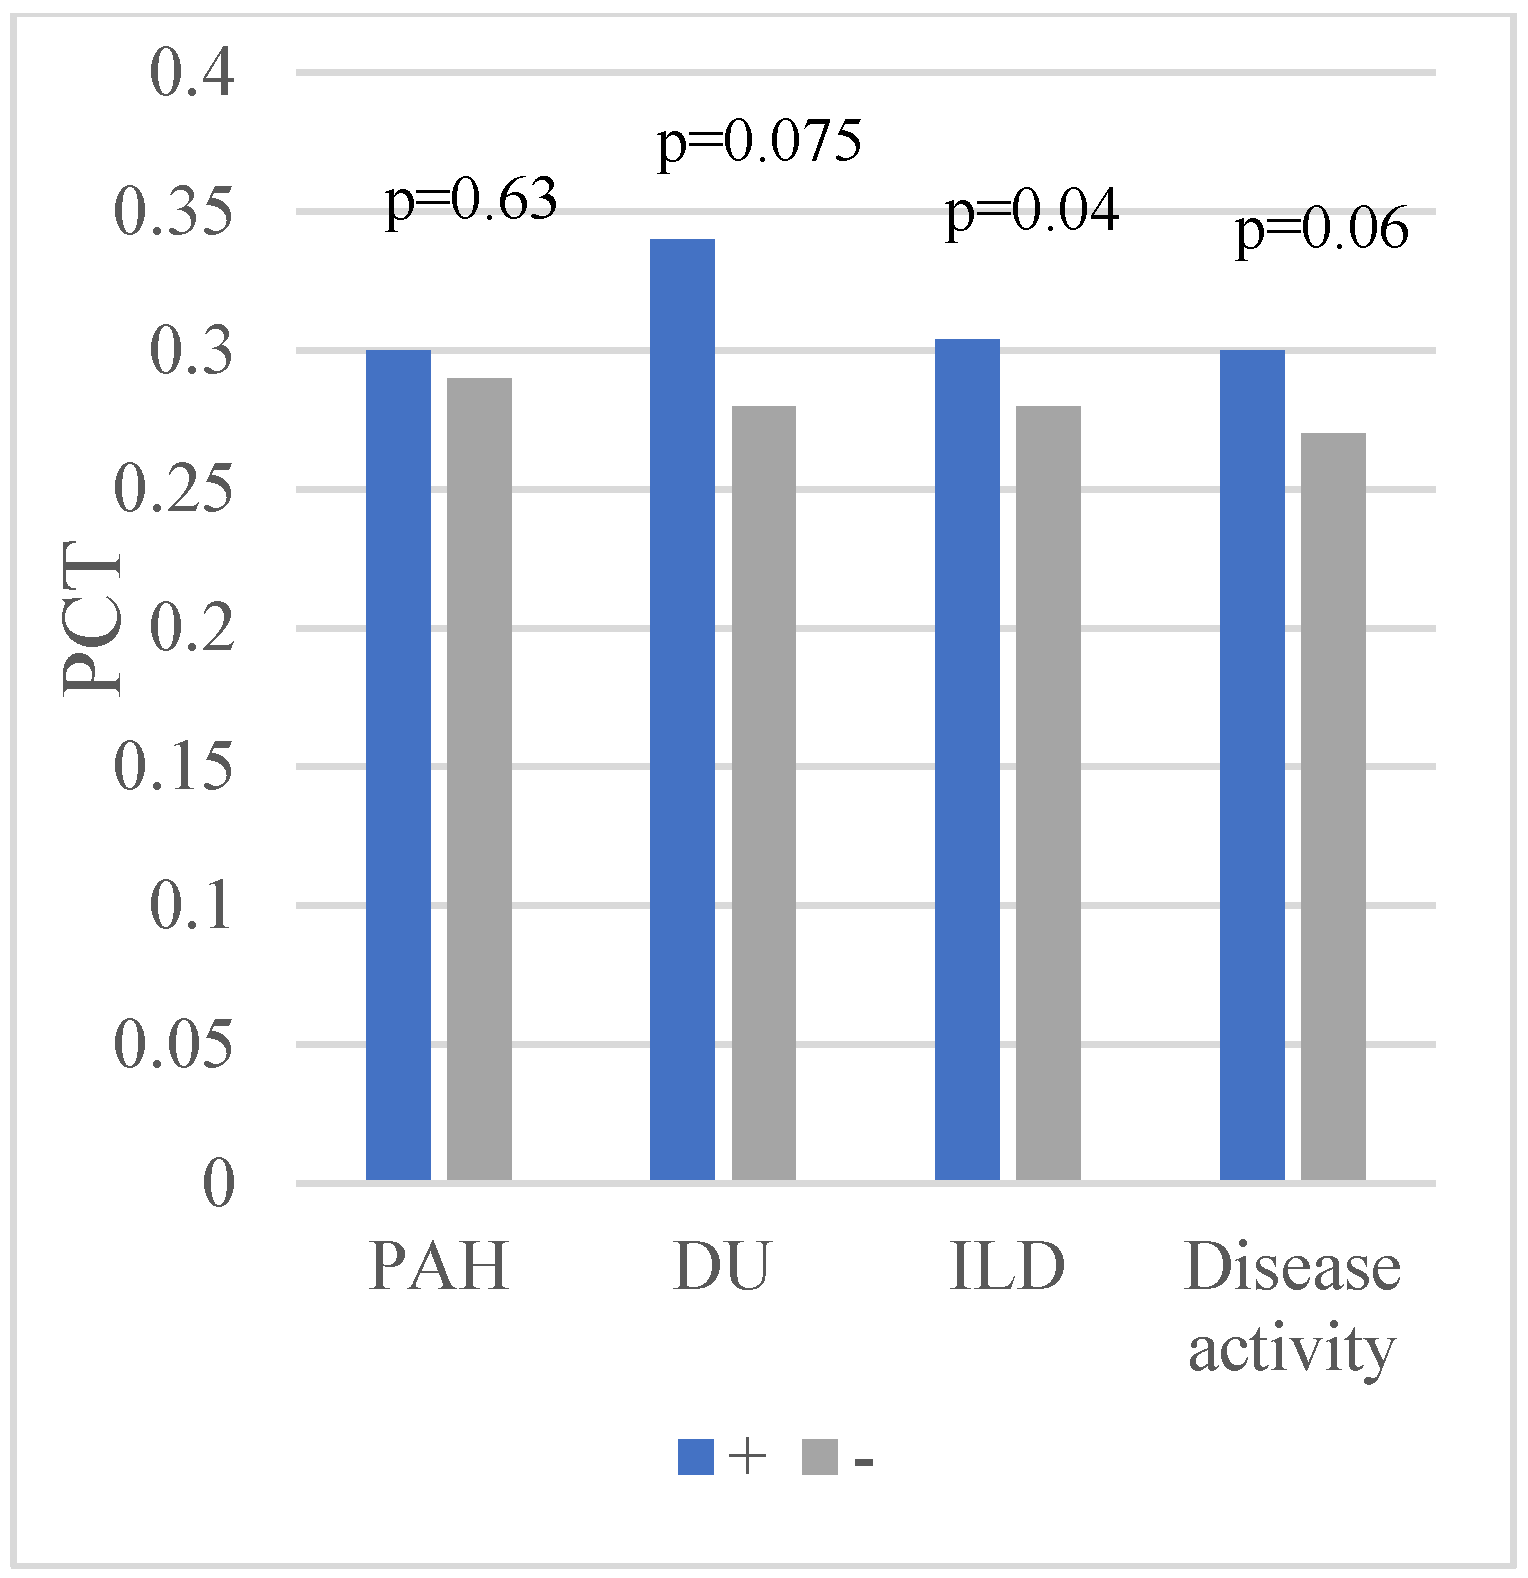
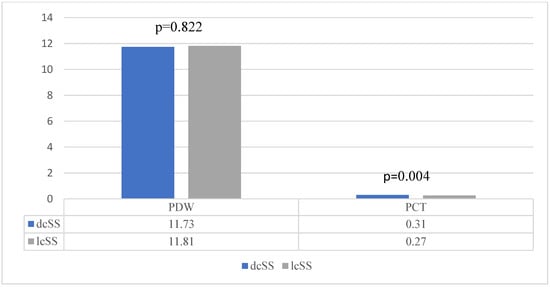
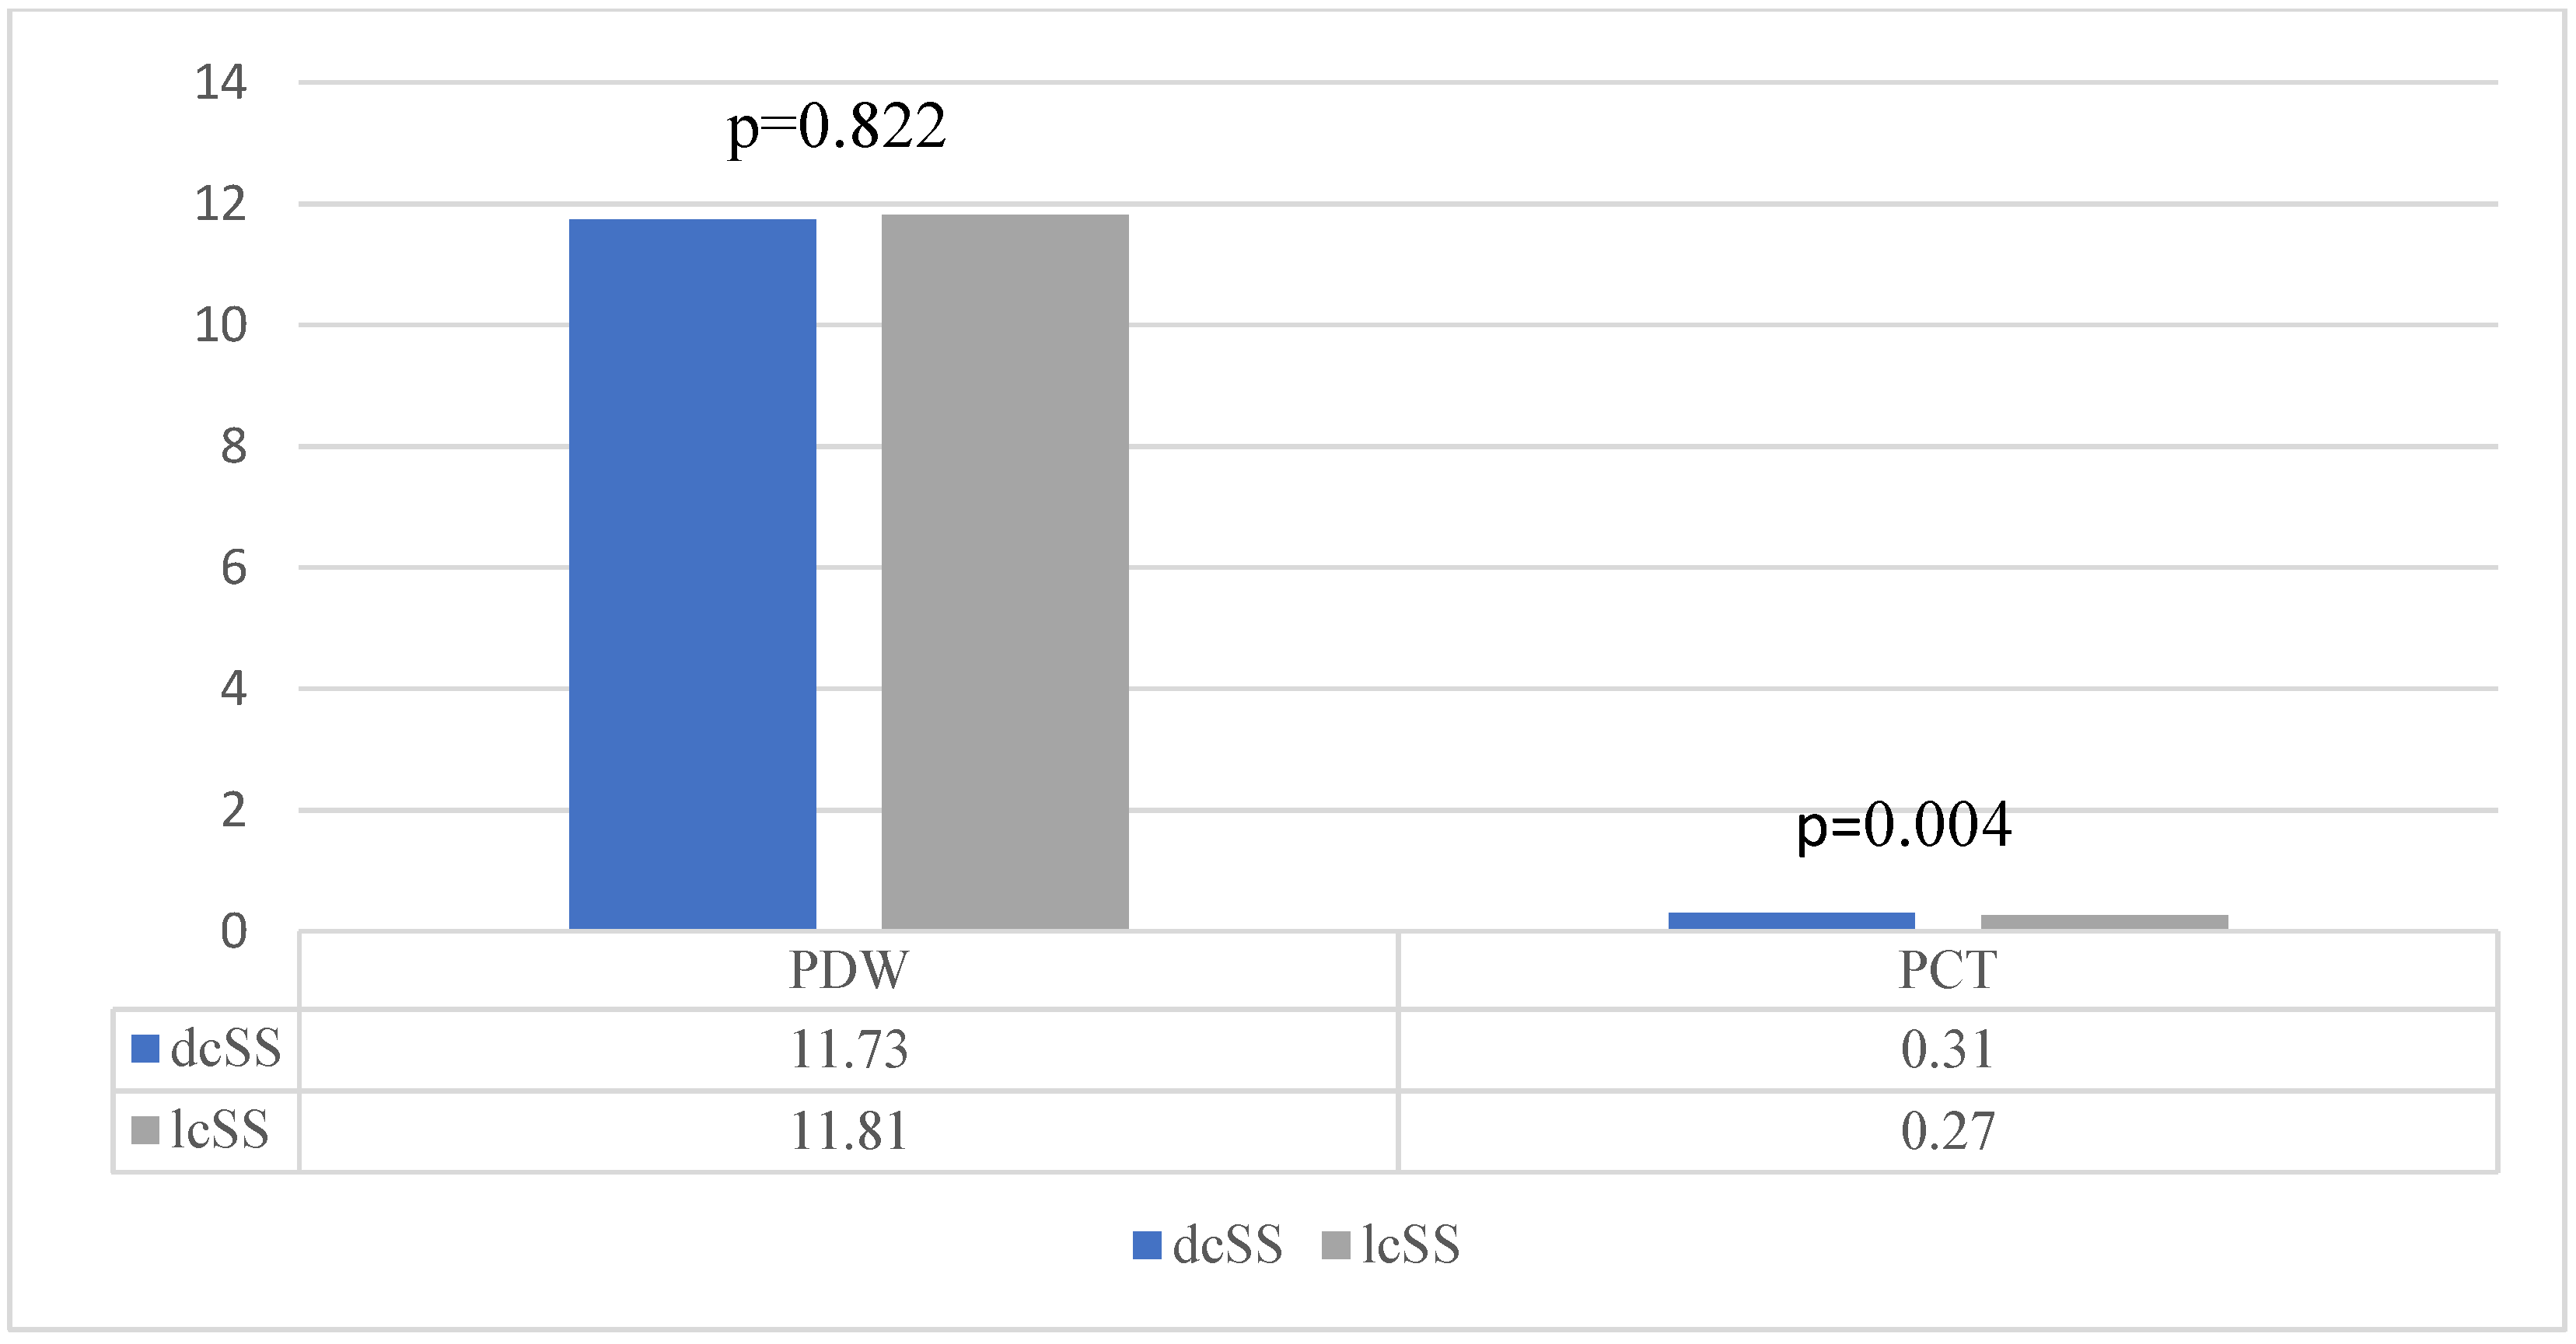
For the PDW and PCT indices, which exhibit approximately normal distributions, a significant difference in PCT was observed between the groups with and without ILD following application of the t-test (mean 0.304% in the ILD+ group, compared to 0.28% in the group without ILD; Cohen’s d = 0.31, small to moderate effect). Furthermore, statistical significance was also observed between those with the dcSS and lcSS clinical phenotypes for the same parameter (mean 0.31% versus 0.27%, Cohen’s d = 0.57, indicating a moderate effect). PCT was also higher in patients with active disease than with inactive disease (mean 0.33% versus 0.28%, p < 0.001, Cohen’s d = 0.68). In comparisons between the other subgroups, no significant differences were identified in PCT values. Similarly, no statistically significant differences were found in PDW values across groups. These can be observed in Figure 1, Figure 2 and Figure 3.
Figure 1.
PDW—comparisons across subgroups.
Figure 2.
PCT—comparisons across subgroups.
Figure 3.
Differences across clinical phenotype groups regarding PDW and PCT.
3.3. Correlations with Organ Involvement and Disease Activity
SII and NLR were significantly negatively correlated with DLCO and FVC (SII: r = −0.309, p = 0.001 and r = −0.278, p = 0.001; NLR: r = −0.303, p = 0.001 and r = −0.253, p = 0.002, respectively), and positively correlated with mRSS and EUSTAR-AI (r = 0.183–0.407, p < 0.05). Spearman correlations confirmed these trends. PLR and MLR showed more modest correlations, while CRP exhibited moderately significant correlations with mRSS and EUSTAR-AI. For PDW and PCT, which reported approximately normal distributions, only Pearson correlations were computed, indicating a moderate positive association between PCT and skin and activity scores. PDW showed only a weak negative correlation with DLCO (r = −0.173, p = 0.036) and no significant correlation with the other variables. Detailed results are shown in Table 5. The coefficients for DLCO, FVC and mRSS in Table 5 were obtained on the imputed data, whereas those in Supplementary Table S7 are complete-case estimates (n = 129–159) and therefore differ. For PLR and FVC, the Pearson coefficient was not significant on the imputed data (r = −0.147, p = 0.081) but was significant in complete cases (r = −0.221, p = 0.009, n = 139); the Spearman coefficient, which is primary for PLR, was not significant in either analysis (ρ = −0.091, p = 0.285 and ρ = −0.130, p = 0.128), so PLR is not considered to be associated with FVC. Because Pearson coefficients are sensitive to the right-skewed distribution of SII, NLR, PLR, MLR and CRP, the Spearman coefficients should be regarded as primary for these variables. Several correlates (mRSS, DLCO, acute-phase reactants) are also items of the EUSTAR-AI, which may inflate the correlations with the score (incorporation bias). After omitting the acute-phase item from the score, the Spearman correlation of SII with EUSTAR-AI remained significant (ρ = 0.32, p < 0.001; CRP: ρ = 0.24, p = 0.002), whereas with the complete score the correlation of CRP (ρ = 0.55) was stronger than that of SII (ρ = 0.35 in the same patients; Williams test p = 0.020), as expected for an item of the score, and the correlations of SII and PCT did not differ (p = 0.12; Spearman coefficients), so SII cannot be considered superior to these markers (Supplementary Table S7).
Table 5.
Correlations.
3.4. Regression Analysis
Linear regression was performed with the EUSTAR-AI (disease activity) and the mRSS (skin severity) as dependent variables and SII, age, sex, disease duration, phenotype, immunosuppressive and glucocorticoid therapy and the capillaroscopy pattern as candidate predictors. In the univariate models, SII was statistically significant (p < 0.001 for EUSTAR-AI and p = 0.008 for mRSS). In the multivariable models, SII remained independently associated with the EUSTAR-AI (p < 0.001) but not with the mRSS (p = 0.225); the association of SII with skin severity was therefore not independent of age, sex, phenotype, glucocorticoid therapy and capillaroscopy pattern (Table 6 for the EUSTAR-AI and Table 7 for the mRSS). In a full model including all covariates (complete cases; n = 116 for the EUSTAR-AI and n = 115 for the mRSS; Table 8), each doubling of SII was associated with a 0.57-point higher EUSTAR-AI (95% CI 0.26–0.89, p < 0.001) but not with the mRSS (β = 0.60, 95% CI −1.18 to 2.37, p = 0.51; without capillaroscopy, n = 136: β = 1.46, 95% CI −0.04 to 2.95, p = 0.056). Because the EUSTAR-AI includes the mRSS, DLCO and acute-phase items, its association with SII partly reflects shared components. These models, which include SII, age, sex, disease duration, phenotype, the presence or absence of immunosuppressive therapy and glucocorticoid therapy, and the capillaroscopy pattern, explain approximately 37% of the variance in the EUSTAR-AI score (R2 = 0.370 for the multivariable model in Table 6), and 38.6% of the mRSS score (R2 ranging from 0.316 to 0.415). Regarding capillaroscopy, its appearance is statistically significantly associated (p = 0.005) only with the mRSS score, a significance that is maintained in the adjusted model (p = 0.006). The regression results can be seen in detail in Table 6 and Table 7.
Table 6.
Uni- and multivariate regressions for EUSTAR-AI score.
Table 7.
Uni- and multivariate regressions for mRSS score.
Table 8.
Full multivariable linear regression models of the EUSTAR-AI and the mRSS including log2-transformed SII.
3.5. Predictive Role of SII for Disease Activity Assessed by the EUSTAR Activity Index
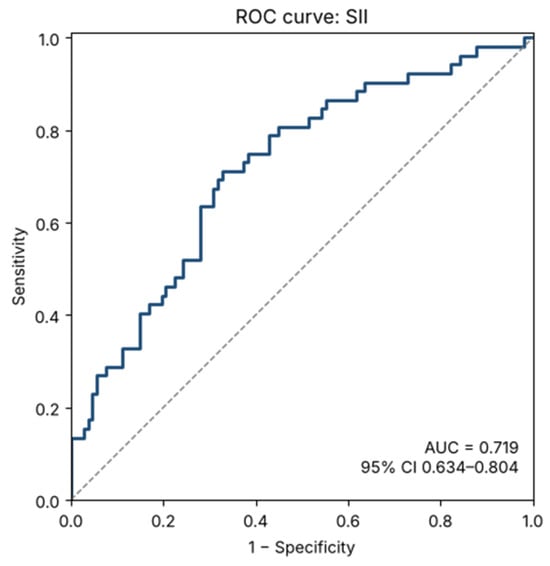
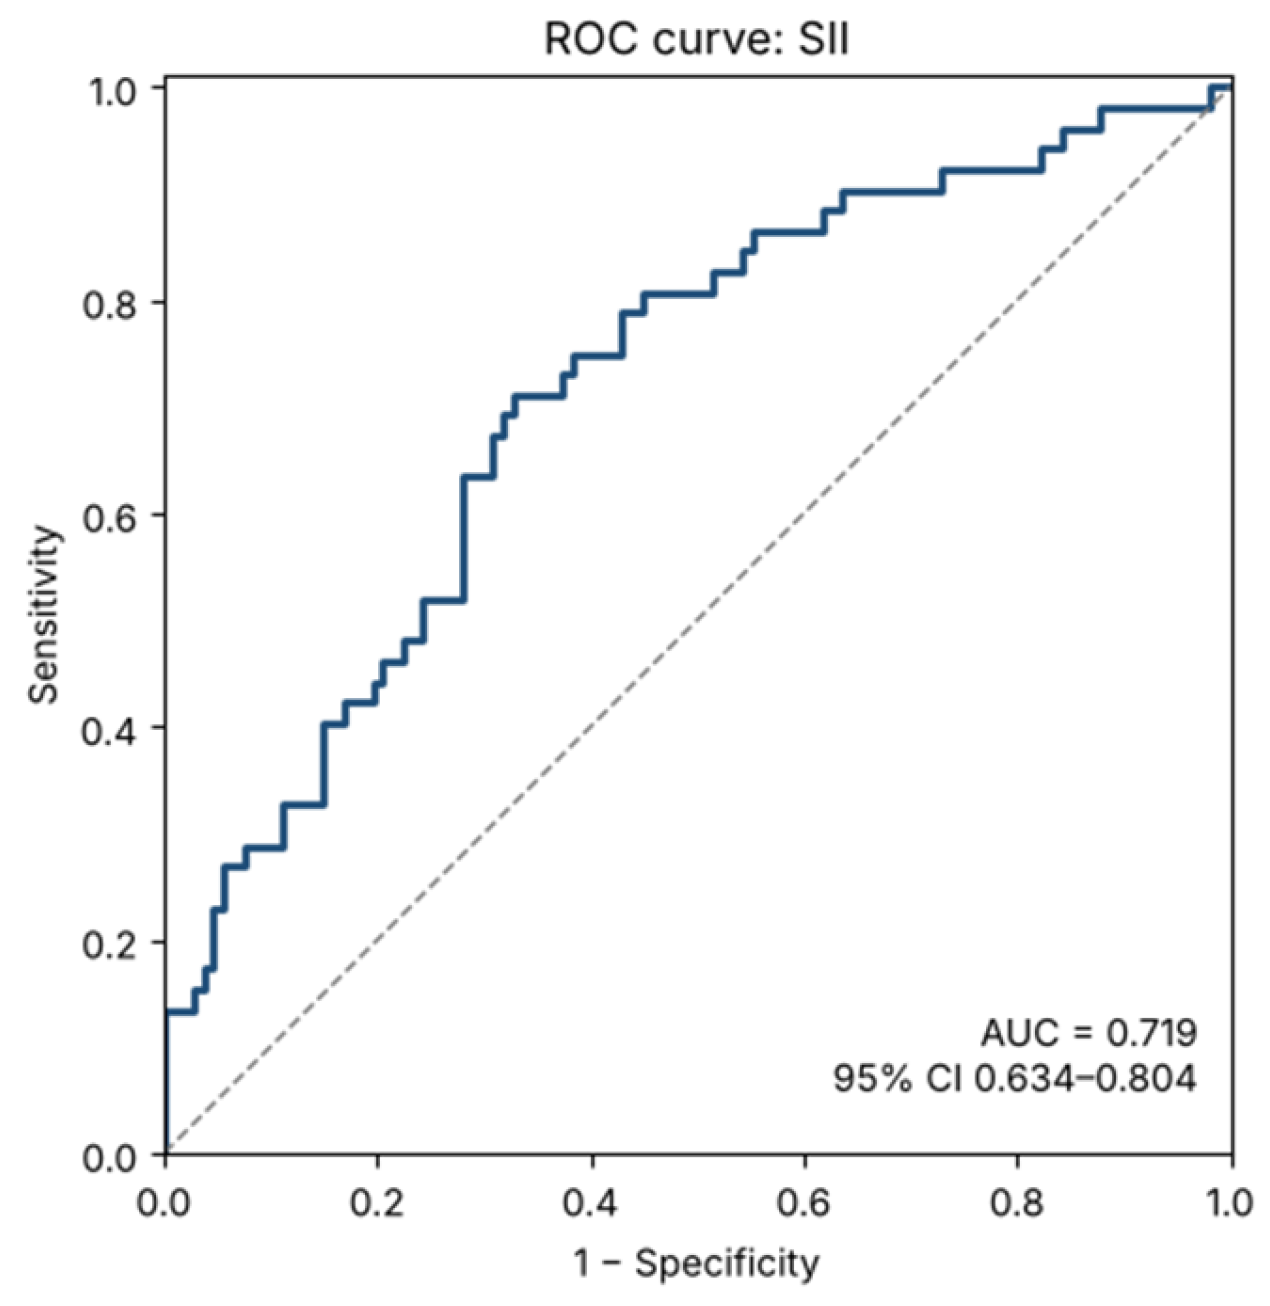
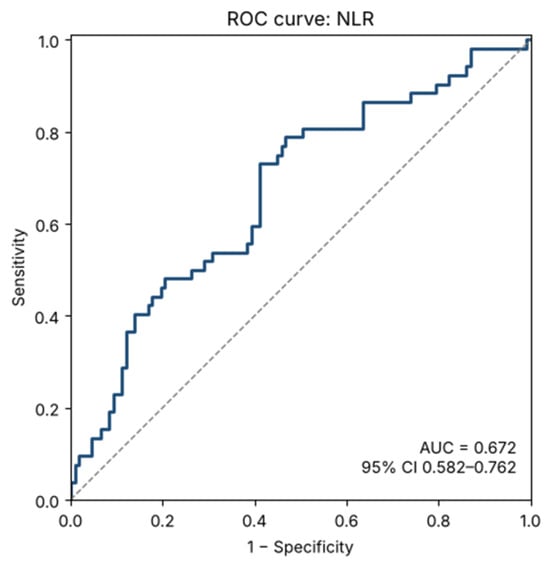
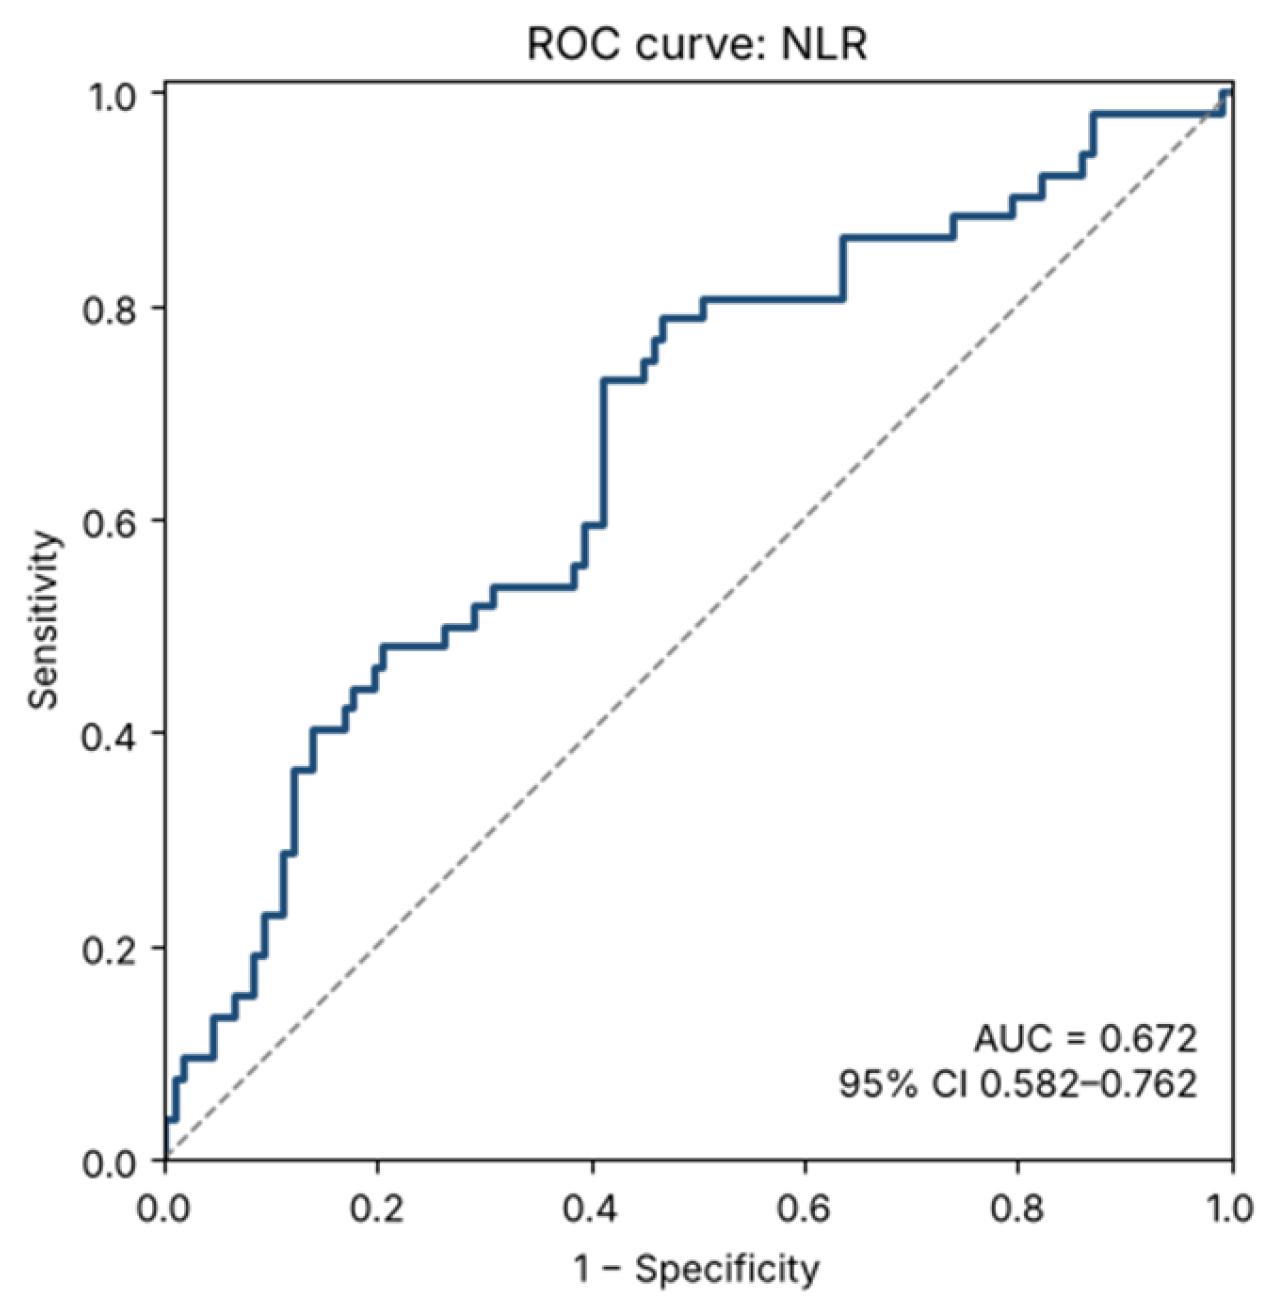
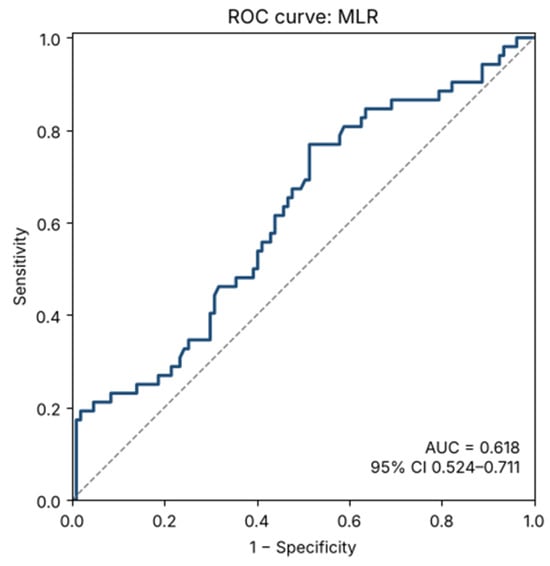
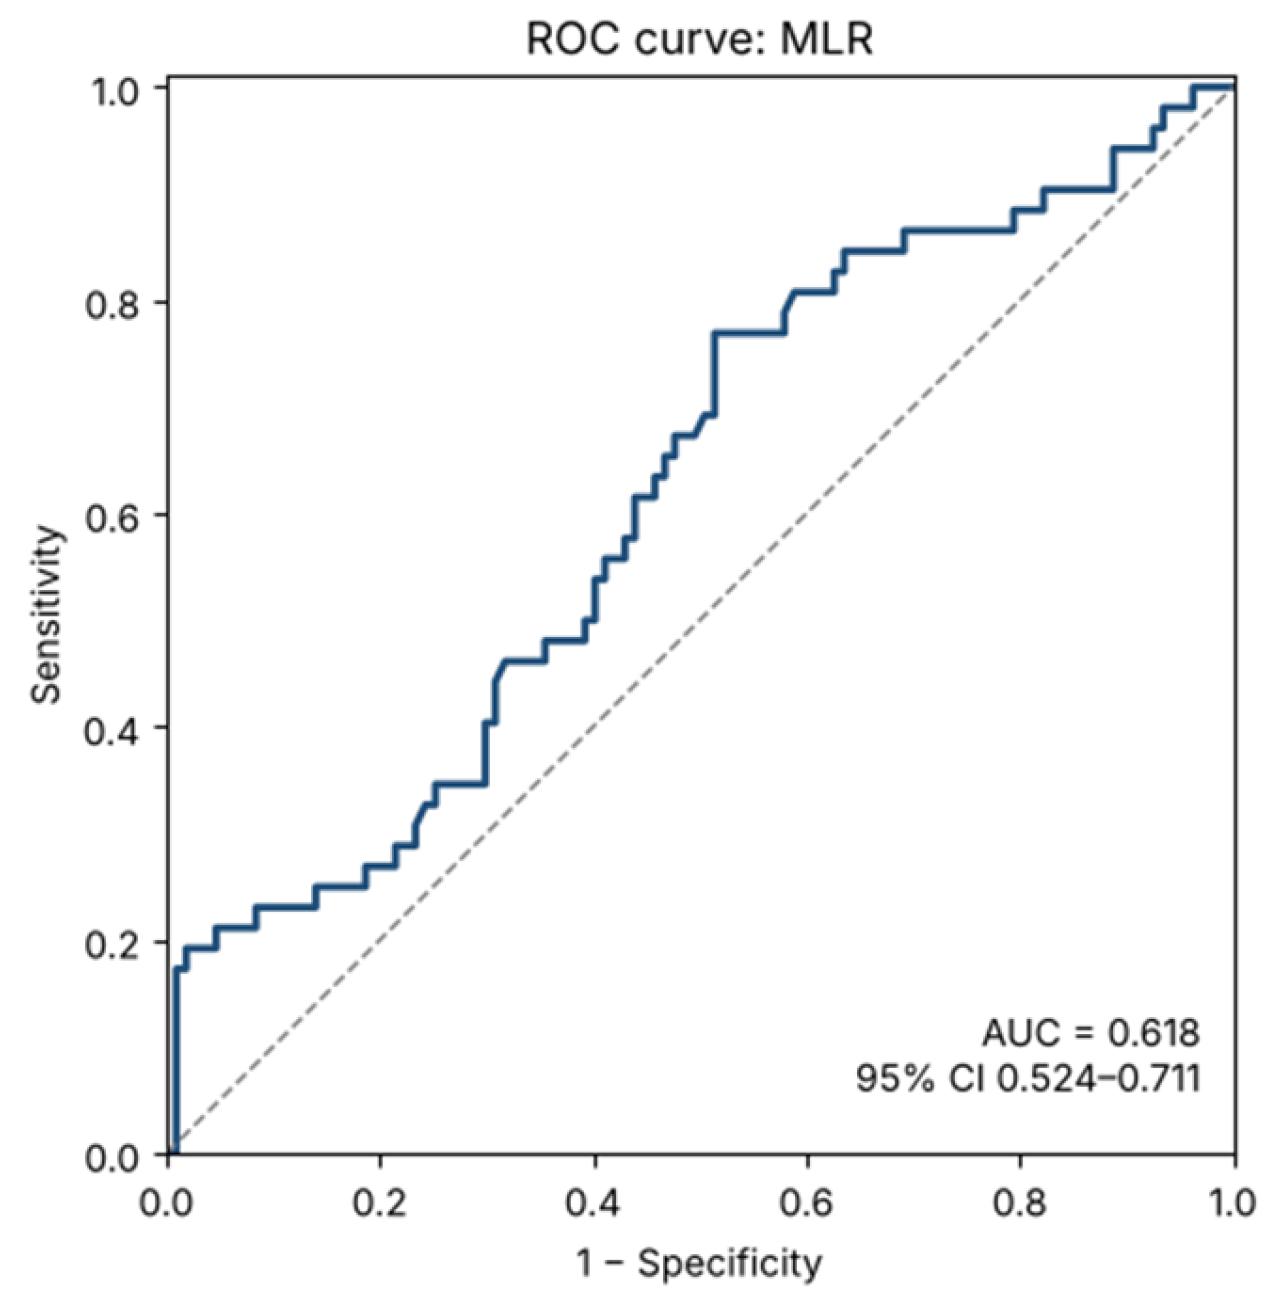
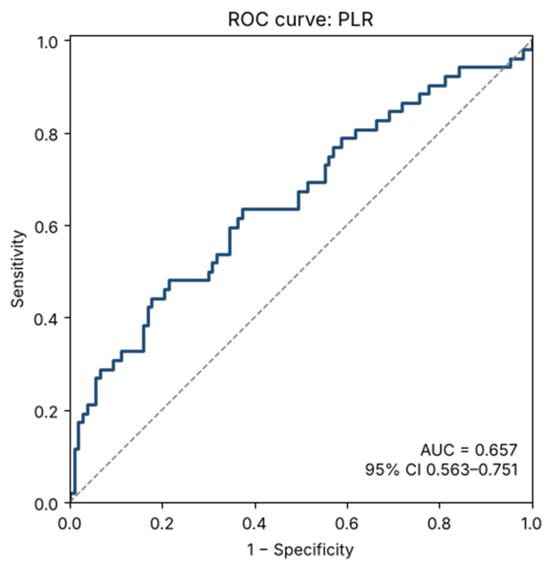
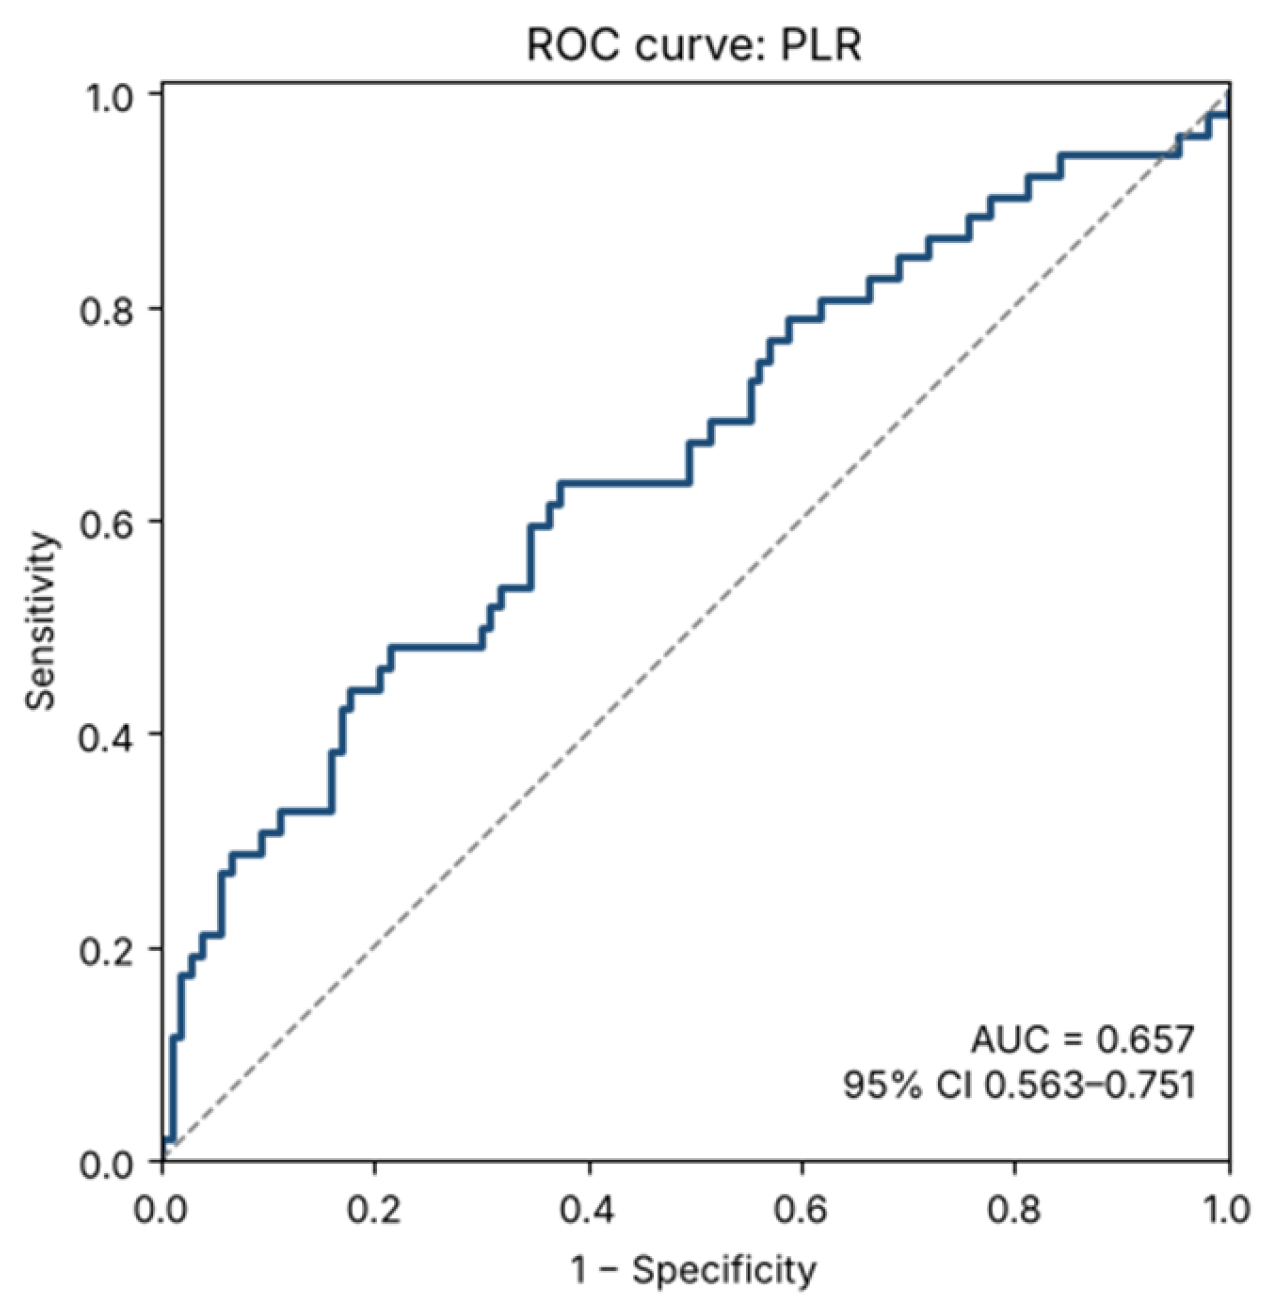
Receiver operating characteristic (ROC) curve analysis was performed to evaluate the ability of SII to predict disease activity (52 patients with active and 107 with inactive disease; n = 154 for CRP and n = 158 for PCT). SII demonstrated an area under the curve (AUC) of 0.719 (95% CI: 0.634–0.804), indicating moderate discriminative performance (a univariable ROC analysis of SII alone, not a multivariable model). Similarly, NLR, MLR, and PLR yielded AUC values above 0.5, specifically 0.67 (95% CI 0.58–0.76), 0.62 (0.52–0.71) and 0.66 (0.56–0.75), respectively (p < 0.001, p = 0.014 and p = 0.001), whereas the AUCs of CRP and PCT were 0.75 (0.67–0.84) and 0.66 (0.57–0.75).
For SII, the optimal cut-off value was identified using the Youden index (0.38), corresponding to a sensitivity of 71.2% and a specificity of 67.3% at an SII value of 871.7 (true positives 37, false negatives 15, true negatives 72, false positives 35). ROC curves for the four parameters are presented in Figure 4, Figure 5, Figure 6 and Figure 7, respectively.
Figure 4.
Receiver operating characteristic (ROC) curve for the Systemic Immune-Inflammation Index (SII) in predicting active disease.
Figure 5.
Receiver operating characteristic (ROC) curve for the neutrophil-to-lymphocyte ratio (NLR) in predicting active disease.
Figure 6.
Receiver operating characteristic (ROC) curve for the monocyte-to-lymphocyte ratio (MLR) in predicting active disease.
Figure 7.
Receiver operating characteristic (ROC) curve for the platelet-to-lymphocyte ratio (PLR) in predicting active disease.
Paired comparison of the correlated ROC curves (DeLong test) showed that the AUC of SII did not differ significantly from those of NLR (difference 0.047, p = 0.052), CRP (p = 0.51) or PCT (p = 0.27), but was higher than those of MLR (difference 0.101, p = 0.011) and PLR (difference 0.062, p = 0.039). SII therefore cannot be considered superior to NLR or CRP. In a baseline model with age, sex, disease duration, phenotype and immunosuppressive and glucocorticoid therapy (AUC 0.78, n = 142; 49 active and 93 inactive patients), adding log2-SII improved model fit (AUC 0.82, likelihood-ratio p = 0.002), as did CRP (AUC 0.85, p < 0.001) and NLR (AUC 0.81, p = 0.012); SII added information to a model already containing CRP (p = 0.027) but not clearly to one already containing NLR (p = 0.053). Improved model fit should be distinguished from improved discrimination: the apparent AUC increased by 0.033 with SII (from 0.784 to 0.817) and by 0.069 with CRP, with overlapping confidence intervals (Table 9), so the gain in discrimination with SII was small. After internal bootstrap validation, the optimism-corrected AUC was 0.746 for the baseline model, 0.778 with SII and 0.820 with CRP (corrected gain with SII 0.031), and calibration slopes of 0.77–0.80 indicated moderate overfitting. CRP, mRSS and DLCO are items of the EUSTAR-AI, which favours the comparators in this analysis. After exclusion of VEDOSS-only and overlap patients (n = 144), SII remained higher in active disease (GM ratio 1.53, 95% CI 1.26–1.87, p < 0.001; AUC 0.70; Supplementary Table S11). When the skin-worsening item was omitted (8 of 52 patients reclassified as inactive), the AUC of SII was 0.73 (95% CI 0.65–0.82) and that of NLR 0.69 (0.59–0.78) (Supplementary Table S6).
Table 9.
Incremental value of SII, NLR, CRP and PCT added to a baseline logistic regression model for active disease (modified EUSTAR-AI ≥ 2.5), with internal bootstrap validation.
4. Discussion
The present study evaluated the relationship between haematological indices and disease characteristics in patients with SSc. Significant differences in haematological inflammatory markers were observed across disease subtypes, organ involvement and disease activity. The main findings showed that SII and NLR were higher in subgroups with lung involvement (PAH and ILD), in the diffuse SSc phenotype, and in patients with high disease activity. Moderate negative correlations were observed between inflammatory indices (SII and NLR) and pulmonary function (DLCO and FVC). NLR, SII and CRP were positively correlated with EUSTAR-AI and mRSS score. The mRSS was also correlated with the capillaroscopy pattern. Their discriminative ability for disease activity was, however, moderate (AUC 0.67–0.72), and SII was not superior to NLR or CRP. MLR was elevated in patients with dcSSc and PAH, but not in those with ILD, with modest statistical significance. PLR was significantly higher in active disease (p = 0.001) and correlated with mRSS and EUSTAR-AI (Table 5), but did not differ significantly according to phenotype, ILD, PAH or digital ulcers. After adjustment for treatment and clinical covariates, the associations of SII with the dcSSc phenotype and of SII, NLR, PLR and CRP with disease activity persisted, whereas those with ILD and PAH were no longer significant.
Chronic inflammation, immune dysregulation, microvascular damage and progressive fibrosis are the main components of the pathophysiological mechanism of SSc, with immune activation and vascular injury reflected in haematological and inflammatory biomarkers.
NLR reflects two complementary mechanisms: increased neutrophil counts suggest activation of innate immunity and the release of enzymes, reactive oxygen species (ROS), and neutrophil extracellular traps (NETs), while lymphopenia may indicate lymphocyte exhaustion or sequestration, possibly due to migration into inflamed tissues or increased destruction [9]. In SSc, where inflammation is often subclinical, high NLR values may suggest an intense autoimmune process and could correlate with disease severity. The NLR in the healthy population was 2.00 (±1.05), whereas higher levels, such as NLR > 2.8 and SII > 500, are associated with systemic, clinically silent inflammation and early-stage ILD [10]. For SSc, an NLR cut-off of 1.9 is considered predictive of severe disease with multiple organ involvement [11].
PLR incorporates platelet involvement into the inflammatory response, highlighting the link between coagulation and inflammation. Elevated values reflect reactive thrombocytosis induced by inflammatory cytokines, particularly IL6, together with reduced lymphocyte counts. Platelets contribute to inflammation and fibrosis by releasing proinflammatory and pro-fibrotic mediators such as PDGF and TGF-beta [12,13]. PLR, as a composite index, demonstrated a modest capacity to discriminate between different levels of activity and, although numerically higher in patients with pulmonary hypertension, the difference was not significant (p = 0.061).
MLR reflects the balance between monocytes and lymphocytes, highlighting the role of monocyte-macrophage activation in chronic inflammation and fibrosis. In SSc, elevated values may indicate enhanced innate immune activation together with lymphocyte depletion, suggesting a shift towards a pro-inflammatory, macrophage-driven immune response. MLR is a potentially useful marker with a limited role, showing higher values in dcSSc. In patients with pulmonary hypertension, the difference was modest and of borderline significance.
SII integrates neutrophil, platelet, and lymphocyte counts simultaneously, reflecting innate-immune activation, platelet-mediated activation and lymphocyte suppression [1,5,6]. SII may indicate enhanced inflammatory and vascular activity, potentially contributing to disease progression and more severe clinical manifestations. The SII value in the healthy population was 569.73 (±326.67), and levels >500 are associated with systemic unexpressed clinical inflammation and early-stage ILD [10].
CRP levels were significantly higher in patients with PAH (GM ratio 1.90, p = 0.037) and in those with active disease (GM ratio 2.47, p < 0.001), supporting the role of inflammation in these forms of SSc. The PAH result was based on 15 patients and did not survive correction for multiple testing, and CRP is itself a component of the EUSTAR-AI, so its association with activity is partly built-in; further research is necessary.
In the studied group, patients with dcSSc exhibited an inflammatory profile that differed from that of patients with localised SSc. In dcSSc, higher values of SII, NLR and, to a lesser extent, MLR were noted in our study. These findings may reflect the intensity of inflammation and more extensive tissue involvement in dcSSc, being consistent with previous studies reporting increased systemic inflammation and more severe visceral involvement in dcSSc [14,15,16,17,18,19]. In contrast, in their study, Hammoda et al. did not note significant differences compared with a healthy control group [20].
ILD is one of the most severe complications of SSc and is linked with inflammation and fibrosis processes. NLR was significantly higher in unadjusted comparisons of patients with ILD and PAH, suggesting an association between systemic inflammation and pulmonary involvement in SSc; however, these associations were no longer significant after adjustment for age, sex, disease duration, phenotype and treatment, and the PAH finding rests on 15 patients. Previous studies have similarly reported elevated NLR in patients with ILD, potentially explained by neutrophil activation and NET formation, which promote fibroblast proliferation, endothelial injury and pulmonary fibrosis by releasing reactive oxygen species, pro-inflammatory cytokines, and profibrotic mediators [18,21,22,23,24,25,26]. However, conflicting data have also been reported, with some studies failing to demonstrate these associations or suggesting impaired NET production in SSc neutrophils. NET formation may contribute to pulmonary fibrosis through increased HMGB1 and IL-17A production, alveolar epithelial injury, endothelial dysfunction, and enhanced vascular permeability, all of which promote inflammatory and fibrotic remodelling in SSc-associated ILD [9,27]. These mechanisms may explain the elevated NLR observed in patients with pulmonary involvement, although conflicting findings have also been reported, including studies suggesting reduced NET production in SSc neutrophils [28].
In unadjusted analyses, NLR and SII were higher in patients with PAH and ILD, and both indices showed moderate negative correlations with pulmonary function parameters, particularly DLCO and FVC, suggesting an association between systemic inflammation and the severity of pulmonary involvement in SSc. These findings are consistent with previous studies reporting increased neutrophil activation in patients with pulmonary complications, potentially mediated by NET formation, endothelial injury, platelet activation, and vascular damage [29,30,31]. Given their accessibility and association with pulmonary manifestations, NLR and SII may be of interest as exploratory markers of pulmonary involvement, but their value for identifying patients at risk of severe disease remains to be shown [29,30,31]. Moreover, Tezcan et al. observed a cut-off value of 2.2 for NLR in predicting PH in patients with SSc, with a sensitivity of 76.5% and a specificity of 54.5% [19].
Although previous studies have reported higher NLR, MLR and PLR values in patients with digital ulcers, our study did not identify significant differences in any of the evaluated haematological indices between patients with and without these vascular lesions [20,23,29,30]. These discrepancies may be related to differences in study populations, ulcer severity, biological variability, or ongoing treatment. With only 15 patients with active digital ulcers, the study was underpowered to detect modest differences, so this negative finding should not be interpreted as evidence of the absence of an association.
NLR and SII showed modest but significant positive correlations with the mRSS; however, SII was associated with the mRSS in univariate analysis only (p = 0.008) and not after adjustment for age, sex, phenotype, glucocorticoid therapy and capillaroscopy (p = 0.225), whereas it remained independently associated with the EUSTAR-AI (p < 0.001).
Although some previous studies did not identify significant associations between NLR and MRSS, other data suggest that elevated inflammatory markers may be associated with progressive skin fibrosis over time [18,23,31]. Additionally, capillaroscopic abnormalities, particularly the late pattern, have also been associated with higher mRSS values and more severe fibrotic disease [32].
The interpretation of haematological inflammatory indices should also take into account the potential influence of comorbidities and ongoing treatment. Conditions such as cardiovascular disease, diabetes mellitus, chronic infections, and other inflammatory responses, as well as haematological parameters, could affect the accuracy of these biomarkers as indicators of disease activity. Consequently, the observed associations should be interpreted in light of each patient’s clinical context and therapeutic background.
From a clinical perspective, readily available haematological indices such as SII, NLR, and PLR may be low-cost adjuncts for identifying patients with an increased inflammatory burden; their moderate discriminative ability (AUC 0.67–0.72), however, does not support their use as stand-alone markers of disease activity or of organ involvement. They are low-cost and routinely available for the assessment and follow-up of patients with SSc.
The study identified relevant information, but it also has some limitations. The absence of a comparison with a healthy control group does not allow for an absolute increase in marker values analysis in SSc patients. Moreover, even if the sample size were large enough, it would still be insufficient to detect significant differences within smaller subgroups, such as patients with digital ulcers or those diagnosed according to VEDOSS criteria. The study’s cross-sectional observational design limits the evaluation of the relationships between indices and disease activity and severity. Being non-specific, the markers could be influenced by other inflammatory conditions, medication or behaviour such as smoking, limiting the interpretation related to SSc. Moreover, to assess disease activity, we adapted the EUSTAR-AI score because of the lack of data on the progression of skin lesions, an important aspect to consider when comparing with the current literature
Several additional limitations deserve mention. First, the EUSTAR-AI was modified (12-month instead of 4-week window for skin worsening), and the 2.5 cut-off was validated for the original index; omitting the skin-worsening item reclassified 8 of 52 active patients as inactive without changing the main findings, but the modified score has not been validated. Items with missing data (38 patients) were scored as zero, which may have under-classified disease activity; the association of SII with active disease was also present in the 121 patients with complete items (GM ratio 1.57, p < 0.001). Second, the EUSTAR-AI includes acute-phase reactants, the mRSS and DLCO, which are also analysed as correlates of the indices (incorporation bias). Third, the cut-off value was derived and evaluated in the same sample and has not been validated externally. Internal bootstrap validation of the logistic models showed an optimism of about 0.04 in the AUC and calibration slopes of about 0.78, so their performance would be somewhat lower in new patients. Fourth, numerous comparisons were performed; only part of the nominally significant results survived correction for multiple testing, and subgroup analyses (e.g., PAH, n = 15) were underpowered. Fifth, 71% of the patients received immunosuppressive agents and 21% glucocorticoids, which may influence blood counts; although adjusted analyses were performed, residual confounding cannot be excluded. Sixth, the cohort included four patients fulfilling only the VEDOSS criteria and 11 patients with an overlap syndrome, whose inflammatory profile may differ from that of established SSc; excluding them did not change the main finding, but these subgroups were too small to be analysed separately. Finally, haematological, functional and clinical assessments were obtained at the same hospital admission within a 30-day window.
The results of the study suggest that haematological and inflammatory indices, particularly SII and NLR, are associated with disease activity and severity in SSc. However, to confirm the obtained data, future multicentre controlled longitudinal studies with a large sample size are needed to enable generalisations and to detail differences between disease phenotypes, the particularities of organ involvement and reference values of SII, NLR, MLR or PLR for SSc. Moreover, investigating correlations with immunological supplementary markers, such as proinflammatory cytokines or profibrotic molecules, could clarify biological mechanisms and the roles of neutrophils, monocytes and lymphocytes in disease pathogenesis. These research directions could consolidate the practical role of SII, NLR and other indices as useful markers for monitoring disease activity.
5. Conclusions
In this cross-sectional cohort, SII and NLR were higher in patients with active disease and in the diffuse cutaneous phenotype and, in unadjusted analyses, in patients with ILD and PAH. After adjustment, SII remained associated with disease activity (EUSTAR-AI) and the diffuse phenotype, but not independently with skin severity (mRSS), ILD or PAH. The discriminative ability of SII for active disease was moderate (AUC 0.72) and not superior to that of NLR or CRP, whereas PLR and MLR showed weaker and less consistent associations. These readily available and inexpensive indices may serve as exploratory adjuncts to, but not substitutes for, established activity measures. Prospective studies with validated activity scoring are needed to confirm their value in monitoring disease evolution and activity.
Supplementary Materials
The following supporting information can be downloaded at https://www.mdpi.com/article/10.3390/diagnostics16223904/s1, Supplementary Table S1: Differences of haematological indices based on disease subsets; Supplementary Table S2: Differences of haematological indices based on lung involvement; Supplementary Table S3: Differences of haematological indices based on pulmonary arterial hypertension; Supplementary Table S4: Differences of haematological indices based on disease activity; Supplementary Table S5: Multivariable-adjusted and multiplicity-corrected comparisons; Supplementary Table S6: Sensitivity analyses of EUSTAR-AI classification and ROC analyses; Supplementary Table S7: Correlations with EUSTAR-AI after omitting acute-phase item and comparison of dependent correlations; Supplementary Table S8: Regression models and incremental value; Supplementary Table S9: Departures of the modified EUSTAR-AI from the published index; Supplementary Table S10: Handling of missing data and number of patients in each analysis; Supplementary Table S11: Sensitivity analyses.
Author Contributions
Conceptualization, M.L.G. and D.M.; methodology, A.E.M.; software, A.E.M.; validation, A.R.B. and D.M.; formal analysis, A.E.M.; investigation, D.-A.M., V.C.B., D.O.B., F.B., C.O.C., I.S., S.D.-I., A.B., M.-M.N., C.L.C., M.A. and V.V.; resources, A.E.M.; data curation, V.C.B.; writing—original draft preparation, A.E.M.; writing—review and editing, M.L.G. and D.M.; visualization, D.-A.M., A.R.B., I.S. and V.C.B.; supervision, M.L.G.; project administration, M.L.G. All authors have read and agreed to the published version of the manuscript.
Funding
Carol Davila University of Medicine and Pharmacy—Publish not perish Programme.
Institutional Review Board Statement
The study was conducted in accordance with the Declaration of Helsinki and approved by the Ethics Committee of Sfanta Maria Clinical Hospital 10854/4 June 2024.
Informed Consent Statement
Informed consent was obtained from all subjects involved in the study.
Data Availability Statement
The data presented in this study are available on request from the corresponding author due to institutional policies governing the security and confidentiality of patient databases at Sfanta Maria Clinical Hospital.
Acknowledgments
We thank the patients for their willingness to share their clinical data and experiences. Their involvement is vital for the advancement of diagnosis and management in the field of rare autoimmune diseases. Publication of this paper was supported by the University of Medicine and Pharmacy Carol Davila, through the institutional program Publish not Perish.
Conflicts of Interest
The authors declare no conflicts of interest.
Abbreviations
The following abbreviations are used in this manuscript:
| ACR | American College of Rheumatology |
| CV (SE) | variation coefficient of standard error |
| dcSSc | diffuse cutaneous systemic sclerosis |
| df | degrees of freedom |
| DU | digital ulcers |
| EULAR | European League Against Rheumatism |
| EUSTAR-AI | European Scleroderma Trials and Research |
| FMI | fraction estimation was performed |
| FVC | forced vital capacity |
| ILD | interstitial lung disease |
| IQR | Interquartile range |
| MLR | monocyte/lymphocyte ratio |
| mRSS | modified Rodnan score |
| NLR | neutrophil/lymphocyte ratio |
| p | p-value |
| PAH | Pulmonary Arterial Hypertension |
| PCT | plateletcrit |
| PDW | platelet distribution width |
| PDW | platelet-derived width, |
| PLR | platelet/lymphocyte ratio |
| RA | Rheumatoid Arthritis |
| ROC | Receiver operating characteristic |
| rho | Spearman coefficient |
| SLE | Systemic Lupus Erythematosus |
| SSc | Systemic Sclerosis |
| SII | Systemic Immune-Inflammation Index, |
| t | t-test value, |
| DLCO | Diffusing Capacity of the Lungs for Carbon Monoxide |
| VEDOSS | Very Early Diagnosis of Systemic Sclerosis |
References
- Zhang, Y.; Chen, B.; Wang, L.; Wang, R.; Yang, X. Systemic immune-inflammation index is a promising noninvasive marker to predict survival of lung cancer: A meta-analysis. Medicine 2019, 98, e13788. [Google Scholar] [CrossRef] [Scilit] [PubMed]
- Papachristodoulou, E.; Kakoullis, L.; Christophi, C.; Psarelis, S.; Hajiroussos, V.; Parperis, K. The relationship of neutrophil-to-lymphocyte ratio with health-related quality of life, depression, and disease activity in SLE: A cross-sectional study. Rheumatol. Int. 2023, 43, 1841–1848. [Google Scholar] [CrossRef] [Scilit] [PubMed]
- Masoumi, M.; Bozorgi, M.; Nourmohammadi, Z.; Mousavi, M.J.; Shariati, A.; Karami, J. Evaluation of hematological markers as prognostic tools in rheumatoid arthritis. BMC Rheumatol. 2024, 8, 75. [Google Scholar] [CrossRef] [Scilit] [PubMed]
- Li, Y.; Liu, J.; Hu, Y.; Cong, C.; Chen, Y.; Fang, Y. The neutrophil-to-lymphocyte ratio in rheumatoid arthritis: The dual perspectives from literature and clinic. Medicine 2025, 104, e44554. [Google Scholar] [CrossRef] [Scilit] [PubMed]
- Lee, Y.H.; Song, G.G. Systemic immune-inflammation index and systemic inflammation response index in systemic lupus erythematosus: A meta-analysis. Z. Rheumatol. 2025, 85, 409–415. [Google Scholar] [CrossRef] [Scilit] [PubMed]
- Dervisevic, A.; Fajkic, A.; Jahic, E.; Dervisevic, L.; Ajanovic, Z.; Ademovic, E.; Zaciragic, A. Systemic Immune-inflammation Index in Evaluation of Inflammation in Rheumatoid Arthritis Patients. Medeni. Med. J. 2024, 39, 183–191. [Google Scholar] [CrossRef] [Scilit] [PubMed]
- Valentini, G.; Iudici, M.; Walker, U.A.; Jaeger, V.K.; Baron, M.; Carreira, P.; Czirják, L.; Denton, C.P.; Distler, O.; Hachulla, E.; et al. The European Scleroderma Trials and Research group (EUSTAR) task force for the development of revised activity criteria for systemic sclerosis: Derivation and validation of a preliminarily revised EUSTAR activity index. Ann. Rheum. Dis. 2017, 76, 270–276. [Google Scholar] [CrossRef] [Scilit] [PubMed]
- von Hippel, P.T. How Many Imputations Do You Need? A Two-stage Calculation Using a Quadratic Rule. Sociol. Methods Res. 2020, 49, 699–718. [Google Scholar] [CrossRef] [Scilit] [PubMed]
- Yan, S.; Li, M.; Liu, B.; Ma, Z.; Yang, Q. Neutrophil extracellular traps and pulmonary fibrosis: An update. J. Inflamm. 2023, 20, 2. [Google Scholar] [CrossRef] [Scilit] [PubMed]
- Ruta, V.M.; Man, A.M.; Alexescu, T.G.; Motoc, N.S.; Tarmure, S.; Ungur, R.A.; Todea, D.A.; Coste, S.C.; Valean, D.; Pop, M.C. Neutrophil-to-Lymphocyte Ratio and Systemic Immune-Inflammation Index—Biomarkers in Interstitial Lung Disease. Medicina 2020, 56, 381. [Google Scholar] [CrossRef] [Scilit] [PubMed]
- Nejatifar, F.; Mirbolouk, N.; Masooleh, I.S.; Kazemnejad, E.; Ghavidel-Parsa, B.; Ghanbari, A.M.; Zayeni, H. Association between neutrophil/lymphocyte ratio and disease severity in scleroderma patients. Heliyon 2023, 9, e20576. [Google Scholar] [CrossRef] [Scilit] [PubMed]
- Manfredi, A.A.; Ramirez, G.A.; Godino, C.; Capobianco, A.; Monno, A.; Franchini, S.; Tombetti, E.; Corradetti, S.; Distler, J.H.W.; Bianchi, M.E.; et al. Platelet Phagocytosis via P-selectin Glycoprotein Ligand 1 and Accumulation of Microparticles in Systemic Sclerosis. Arthritis Rheumatol. 2022, 74, 318–328. [Google Scholar] [CrossRef] [Scilit] [PubMed]
- Ramirez, G.A.; Franchini, S.; Rovere-Querini, P.; Sabbadini, M.G.; Manfredi, A.A.; Maugeri, N. The role of platelets in the pathogenesis of systemic sclerosis. Front Immunol. 2012, 3, 29071. [Google Scholar] [CrossRef] [Scilit] [PubMed]
- Ghosh, S.; Tanna, D.; Telang, K.; Dhuria, S.; Gupta, R. Clinical and autoantibody profiles of systemic sclerosis patients: A cross-sectional study from North India. Indian J. Dermatol. Venereol. Leprol. 2024, 90, 440–446. [Google Scholar] [CrossRef] [Scilit] [PubMed]
- Steen, V.D.; Medsger, T.A. Severe organ involvement in systemic sclerosis with diffuse scleroderma. Arthritis Rheum. 2000, 43, 2437–2444. [Google Scholar] [CrossRef] [Scilit] [PubMed]
- Walker, U.A.; Tyndall, A.; Czirják, L.; Denton, C.; Farge-Bancel, D.; Kowal-Bielecka, O.; Müller-Ladner, U.; Bocelli-Tyndall, C.; Matucci-Cerinic, M. Clinical risk assessment of organ manifestations in systemic sclerosis: A report from the EULAR Scleroderma Trials And Research group database. Ann. Rheum. Dis. 2007, 66, 754–763. [Google Scholar] [CrossRef] [Scilit] [PubMed]
- Wareing, N.; Mohan, V.; Taherian, R.; Volkmann, E.R.; Lyons, M.A.; Wilhalme, H.; Roth, M.D.; Estrada-Y-Martin, R.M.; Skaug, B.; Mayes, M.D.; et al. Blood Neutrophil Count and Neutrophil-to-Lymphocyte Ratio for Prediction of Disease Progression and Mortality in Two Independent Systemic Sclerosis Cohorts. Arthritis Care Res. 2023, 75, 648–656. [Google Scholar] [CrossRef] [Scilit] [PubMed]
- Sakr, B.R.; Rabea, R.E.; ElHamid, S. Value of hematological parameters as biomarkers of disease manifestations and severity in systemic sclerosis. Egypt. Rheumatol. 2021, 43, 159–165. [Google Scholar] [CrossRef] [Scilit]
- Tezcan, D.; Turan, Ç.; Yılmaz, S.; Sivrikaya, A.; Gülcemal, S.; Limon, M.; Ecer, B. What do simple hematological parameters tell us in patients with systemic sclerosis? Acta Dermatovenerol. Alp. Pannonica Adriat. 2020, 29, 101–107. [Google Scholar] [CrossRef] [Scilit]
- Hammoda, R.; El-Gharbawy, N.; Khalifa, A.; Moharram, A.A.; Elziaty, R.A. Neutrophil-to-lymphocyte ratio: Association with microcirculatory changes detected by nailfold capillaroscopy in scleroderma patients and its relation to disease severity. Egypt. Rheumatol. Rehabil. 2025, 52, 4. [Google Scholar] [CrossRef] [Scilit]
- Chikhoune, L.; Brousseau, T.; Morell-Dubois, S.; Farhat, M.M.; Maillard, H.; Ledoult, E.; Lambert, M.; Yelnik, C.; Sanges, S.; Sobanski, V.; et al. Association between routine laboratory parameters and the severity and progression of systemic sclerosis. J. Clin. Med. 2022, 11, 5087. [Google Scholar] [CrossRef] [Scilit] [PubMed]
- Atilla, N.; Yıldırım Çetin, G.; Balkarlı, A. Association of neutrophil/lymphocyte ratio with the degree ofinterstitial lung disease in systemic sclerosis. Turk. J. Med. Sci. 2016, 46, 1871–1874. [Google Scholar] [CrossRef] [Scilit] [PubMed]
- Kim, A.; Kim, Y.; Kim, G.-T.; Ahn, E.; So, M.W.; Sohn, D.H.; Lee, S.-G. Platelet-to-lymphocyte ratio and neutrophil-to-lymphocyte ratio as potential makers for digital ulcers and interstitial lung disease in patients with systemic sclerosis: Cross-sectional analysis of data from a prospective cohort study. Rheumatol. Int. 2020, 40, 1071–1079. [Google Scholar] [CrossRef] [Scilit] [PubMed]
- Li, H.; Zhang, X.; Yu, L.; Shang, J.; Fan, J.; Feng, X.; Zhang, R.; Ren, J.; Guo, Q.; Duan, X. Comparing clinical characteristics of systemic sclerosis with or without interstitial lung disease: A cross-sectional study from a single center of the Chinese Rheumatism Data Center. Front Med. 2022, 9, 1061738. [Google Scholar] [CrossRef] [Scilit] [PubMed]
- Zinellu, A.; Mangoni, A.A. The association between the neutrophil-to-lymphocyte ratio, platelet-to-lymphocyte ratio, and monocyte-to-lymphocyte ratio and systemic sclerosis and its complications: A systematic review and meta-analysis. Front Immunol. 2024, 15, 1395993. [Google Scholar] [CrossRef] [Scilit] [PubMed]
- Antoine, M.H.; Mlika, M. Interstitial Lung Disease. In StatPearls; StatPearls Publishing: Treasure Island, FL, USA, 2025. [Google Scholar]
- Luo, J.; Xie, Z.; Duan, L. The Phenotypes and Functions of Neutrophils in Systemic Sclerosis. Biomolecules 2024, 14, 1054. [Google Scholar] [CrossRef] [Scilit] [PubMed]
- Impellizzieri, D.; Egholm, C.; Valaperti, A.; Distler, O.; Boyman, O. Patients with systemic sclerosis show phenotypic and functional defects in neutrophils. Allergy 2022, 77, 1274–1284. [Google Scholar] [CrossRef] [Scilit] [PubMed]
- Yayla, M.E.; İlgen, U.; Okatan, İ.E.; UsluYurteri, E.; Torgutalp, M.; Dinçer, A.B.K.; Gülöksüz, E.G.A.; Sezer, S.; Turgay, T.M.; Kınıklı, G.; et al. Association of simple hematological parameters with disease manifestations, activity, and severity in patients with systemic sclerosis. Clin. Rheumatol. 2020, 39, 77–83. [Google Scholar] [CrossRef] [Scilit] [PubMed]
- Sarhan, S.A.; El-Meligui, Y.M. Significance of platelets to lymphocytes and platelets to haemoglobin ratios in patients with systemic sclerosis. Reumatol. Clin. 2023, 19, 12–17. [Google Scholar] [CrossRef] [Scilit] [PubMed]
- El-Husseiny, P.N.; ElAdle, S.; Eesa, N.N.; Gheita, T.A. Clinical significance of the lipid profile, neutrophil-lymphocyte ratio (Nlr) and platelet-lymphocyte ratio (plr) in different rheumatic disease patients. Romanian J. Rheumatol. 2023, 32, 184–195. [Google Scholar] [CrossRef] [Scilit]
- Avouac, J.; Vallucci, M.; Smith, V.; Senet, P.; Ruiz, B.; Sulli, A.; Pizzorni, C.; Frances, C.; Chiocchia, G.; Cutolo, M.; et al. Correlations between angiogenic factors and capillaroscopic patterns in systemic sclerosis. Arthritis Res. Ther. 2013, 15, R55. [Google Scholar] [CrossRef] [Scilit] [PubMed]

Disclaimer/Publisher’s Note: The statements, opinions and data contained in all publications are solely those of the individual author(s) and contributor(s) and not of MDPI and/or the editor(s). MDPI and/or the editor(s) disclaim responsibility for any injury to people or property resulting from any ideas, methods, instructions or products referred to in the content. |
© 2026 by the authors. Licensee MDPI, Basel, Switzerland. This article is an open access article distributed under the terms and conditions of the Creative Commons Attribution (CC BY) license.