


Abstract
Water scarcity is a major environmental constraint limiting rice production, particularly as climate variability increases the frequency and severity of water deficits. Therefore, developing high-yielding and drought-tolerant genotypes is essential for sustaining rice productivity. Exploring genetic variability and combining ability among parental genotypes is crucial for accelerating the breeding of resilient genotypes. This study characterized the molecular variations of thirteen local and exotic rice parental genotypes and evaluated their combining ability, inheritance patterns, and responses to water deficit. SSR-based molecular profiling revealed noticeable genetic variation among the parental genotypes. The parents were utilized to generate 30 F1 hybrids through line × tester mating design. The parents and their crosses were evaluated under well-watered and water-deficit regimes. Water-deficit stress substantially shortened days to heading and reduced plant height and flag leaf area. It also decreased relative water content, chlorophyll content, yield components, and grain yield per plant. In contrast, leaf rolling increased under water deficit conditions. Line × tester analysis showed that the non-additive gene effects accounted for most of the genetic variation and predominantly governed the inheritance of grain yield and all evaluated traits under both irrigation regimes. L1 and L3 were favorable general combiners for earliness. L6 and L7 emerged as superior combiners for reducing plant height. L2 and L10 showed favorable general combining ability for grain yield and several yield-related traits under water deficit conditions. The crosses L5 × T1, L2 × T2, L7 × T2, L10 × T2, L3 × T3, and L5 × T3 exhibited desirable specific combining ability effects for improving grain yield under normal and water-deficit conditions. Among them, L10 × T2, L3 × T3, L2 × T2, and L5 × T3 had high grain yield coupled with favorable yield-based drought-tolerance indices. Grain yield under water deficit was positively associated with relative water content, chlorophyll content, number of panicles/plant, fertility percentage, and 1000-grain weight. The identified parents and crosses represent promising breeding materials for enhancing rice grain yield under water-limited conditions.
1. Introduction
Rice (Oryza sativa L.) plays a central role in global food systems [1]. It provides a substantial share of the dietary energy consumed by populations in Asia, Africa, and other rice-producing regions [2]. Maintaining rice production has become increasingly difficult as rising temperatures, irregular rainfall, and competition for freshwater intensify pressure on irrigated agriculture [3]. Rice is particularly vulnerable to water restrictions because it requires adequate soil moisture throughout its development [4]. The magnitude of drought-induced damage varies with stress intensity, duration, and growth stage [5]. Limited water availability during vegetative growth restricts leaf expansion, tillering, and biomass accumulation [6]. Stress around flowering increases spikelet sterility and reduces grain formation [7]. Yield losses can therefore become severe when drought coincides with the reproductive and grain-filling stages [8].
Rice plants respond to water deficit through a combination of morphological, physiological, and developmental adjustments [9]. An earlier heading allows some genotypes to complete reproduction before the water shortage becomes severe [10]. Maintaining leaf water status and chlorophyll content can support photosynthetic activity under stress. Leaf rolling reduces exposed leaf area and water loss [11]. Drought can additionally reduce plant height, flag leaf area, panicle development, fertility, and grain weight [12]. These responses are genetically complex and often vary across genetic backgrounds.
Drought escape, drought avoidance, and physiological drought tolerance represent distinct mechanisms of adaptation to water limitation [13]. Drought escape involves completing sensitive developmental stages before severe water deficit develops [14]. Drought avoidance involves maintaining tissue hydration through enhanced water acquisition or reduced water loss, whereas physiological drought tolerance involves sustaining metabolic and cellular functions despite tissue dehydration [15]. These mechanisms cannot be distinguished from yield performance or yield-based indices alone. Overall genotypic performance can be assessed under contrasting irrigation regimes using agronomic and physiological traits as complementary indicators of response [16]. The imposed reduction in irrigation frequency and water input provides a basis for evaluating performance under restricted irrigation, but does not independently establish drought avoidance or physiological drought tolerance.
Parent selection is a critical step in rice breeding for adaptation to limited water supply [17]. Combining ability analysis is a powerful statistical tool to evaluate the performance of parents in hybrid combinations [18]. General combining ability shows how parents pass favorable alleles to their crosses [19]. Specific combining ability describes how an individual cross deviates from the performance expected from its parents [20]. The relative contributions of these effects also indicate the importance of additive and non-additive gene action [21]. Additive effects favor direct selection and accumulation of favorable alleles [22]. Substantial non-additive effects support hybridization followed by selection in later segregating generations [23]. The line × tester design allows assessment of several parental lines across a common set of testers without requiring all possible pairwise crosses [24]. Evaluating these effects under contrasting water regimes is particularly important. Because the breeding value of a parent or cross may change when water availability declines.
Molecular characterization complements field-based evaluation [25]. Simple sequence repeat (SSR) markers are reproducible and distributed throughout the rice genome [26]. Accordingly, SSRs are suitable for describing genetic relationships within breeding materials. Their multiallelic nature can reveal variation not evident from agronomic observations. Molecular diversity estimates can help identify closely related materials [27]. This helps select genetically differentiated combinations for crossing [28]. Nevertheless, molecular divergence should not replace combining ability or field performance [29]. Molecular characterization provides informative interpretation alongside agronomic and physiological analyses [30]. SSR-based diversity and combining ability analyses address complementary aspects of parental selection [31]. Molecular markers characterize relationships among parents at the sampled loci, whereas GCA and SCA quantify their contributions to the performance of the evaluated crosses [32]. Genetic distance at SSR loci does not necessarily reflect divergence at genes controlling yield or water-deficit responses and therefore cannot be assumed to predict heterosis or hybrid superiority. Molecular relationships provide context for interpreting the combining ability and field evaluations, while the prioritization of promising crosses relies primarily on observed productivity and agronomic performance under the imposed irrigation regimes [33]. Drought-tolerance indices offer an additional way to compare genotypes across contrasting water conditions [34]. Indices based on yield under stress and non-stress conditions can distinguish genotypes that maintain acceptable productivity under water deficit [35]. Multivariate procedures such as principal component analysis, heatmaps, and hierarchical clustering can strengthen interpretation [36]. These approaches are especially useful when evaluating numerous physiological and yield-related variables.
The present study examined thirteen rice parents comprising ten lines and three testers and their 30 F1 crosses under well-watered and water-deficit conditions. The specific objectives were to: (i) characterize molecular variation among the parental genotypes using SSR markers; (ii) quantify the effects of water deficit on morphological, physiological, and yield-related traits; (iii) estimate the general and specific combining abilities of the parents and crosses under each water regime; (iv) assess the relative importance of additive and non-additive genetic effects; (v) identify parental lines and cross combinations combining favorable yield performance with drought-adaptive traits. Drought-tolerance indices and multivariate analyses were also used to classify the evaluated materials. This can also help to clarify the relationships between grain yield and its associated traits under contrasting water availability.
2. Materials and Methods
2.1. Plant Materials
Thirteen rice genotypes were selected as parents for the line × tester crossing scheme (Table S1). The parents comprised ten diverse rice lines namely; GZ 10739-1-1-2-2 (L1), GZ 10933-4-1-2-1 (L2), GZ 9865-2-1-1-2 (L3), GZ 10778-10-2-2-1 (L4), GZ 8452-6-1-3-2 (L5), GZ 10739-1-3-2-3 (L6), ELGA 9 (L7), IRAT 112 (L8), IRRI 148 (L9), and ELGA 5 (L10). In addition, three Egyptian rice cultivars; Giza 177 (T1), Giza 178 (T2), and Giza 179 (T3) were used as testers. The parental genotypes originated from Egypt, Côte d’Ivoire, and the Philippines, representing diverse genetic backgrounds. The utilized parental genotypes were selected to represent contrasting agronomic characteristics and breeding backgrounds (Table S1). The lines and testers were included to examine variation in parental contributions and combining ability. Selection of the parental genotypes considered agronomic traits, pedigree information, and geographical origin, with the latter treated as background information rather than evidence of genetic divergence. SSR analysis was therefore used to characterize molecular relationships independently at the sampled loci. The selected parents represent a targeted breeding set rather than a representative sample of rice genetic diversity.
2.2. SSR Genotyping and Molecular Diversity Analysis
Young leaf tissue was collected from three-week-old seedlings of each parent. Approximately 50 mg of fresh tissue was used to isolate genomic DNA using the cetyltrimethylammonium bromide method described by Doyle [37]. We assessed DNA concentration and purity using the NanoDrop ND-1000 Spectrophotometer (Thermo Fisher Scientific, Wilmington, DE, USA). The extracted DNA was subsequently diluted to a working concentration of 20 ng/μL. Twelve SSR markers, previously validated for assessing genetic diversity in rice, were screened across the thirteen parental genotypes to assess their polymorphism. Table S2 lists primer names, nucleotide sequences, and annealing temperatures. Each polymerase chain reaction contained 10 μL of 2× DreamTaq PCR Master Mix, 1 μL of genomic DNA, and each primer at a final concentration of 0.5 μM. Amplification was performed with an initial denaturation step at 94 °C for 2 min. This was followed by 35 cycles consisting of denaturation at 94 °C for 50 s. Then, primer annealing at 50–55 °C for 30 s, followed by extension at 72 °C for 30 s. A final extension was conducted at 72 °C for 7 min. The amplification products were separated on 1.5% agarose gels, and fragment sizes were estimated against a DNA size marker. Only clearly resolved and reproducible fragments were scored, whereas ambiguous or poorly resolved bands were excluded. Each distinct fragment was treated as an independent biallelic marker and scored as 1 (presence) or 0 (absence), generating a binary marker matrix. Thus, SSR-derived fragments were analyzed using a dominant binary framework loci. The resulting matrix was used to estimate genetic diversity parameters, including the effective number of alleles (Ne) and polymorphic information content (PIC), using a binary-marker framework. The SSR analysis was intended to assess comparative genetic variation among parental genotypes rather than comprehensive genome-wide diversity. The polymorphic information content of marker was estimated as:
where Pij is the frequency of the ith allele at marker j, and n is the number of alleles detected at that locus [38]. Pairwise genetic relationships among the parents were estimated using the Jaccard coefficient in PAST software (PAleontological STatistics version 2.17). The resulting matrix was analyzed using the unweighted pair-group method in MVSP version 3.1. The generated dendrogram was used to visualize molecular relationships among the parental genotypes.
2.3. Experimental Site
The field evaluation was conducted at the Experimental Farm of Sakha Agricultural Research Station, Agricultural Research Center, Egypt (31°15′ N, 30°47′ E). No rainfall occurred during the experimental growing season. The 2024 crossing season and the 2025 field-evaluation season were characterized by warm conditions, with pronounced daily fluctuations in maximum temperature and a gradual seasonal increase in minimum temperature, followed by a decline toward the end of each season (Figure 1). Maximum temperatures frequently exceeded 35 °C. Minimum temperatures were generally lower early in the season and higher during the middle and later periods. Relative humidity fluctuated throughout both seasons, particularly during the early period. The soil was classified as clay, and its particle-size distribution, pH, electrical conductivity, organic matter content, and nutrient characteristics are presented in Table S3.
Figure 1.
Daily variation in air temperature, relative humidity, and solar radiation at the experimental site during the 2024 and 2025 rice-growing seasons.
2.4. Production of F1 Crosses
The parental genotypes were crossed during the 2024 rice-growing season. Ten lines and three testers were established on three sowing dates separated by 10-day intervals. Seedlings were transplanted 30 days after sowing into three 5-m rows for each parent, with 20 cm between rows and 20 cm between hills. At flowering, the ten lines were crossed with the three testers, producing 30 F1 combinations. Bulk emasculation was conducted following Butany [39]. Selected female panicles were exposed to water maintained at 42–44 °C for 10 min. Then hand-pollinated with freshly collected pollen from the assigned male parent was applied. Protected crossed panicles were labeled until maturity. The developed F1 seeds were harvested separately for each parental combination.
2.5. Field Evaluation and Water Regimes
The 13 parents and 30 F1 crosses were evaluated during the 2025 growing season. Two field experiments were established. One under well-watered conditions and the other under water deficit. Within each experiment, the 43 genotypes were arranged in a randomized complete block design with three replications. Seeds were sown in the nursery on 10 May 2025, and 30-day-old seedlings were transplanted individually into the field. Each experimental unit consisted of two rows, each 5.0 m long, with 20 × 20 cm spacing between rows and hills. Differential irrigation treatments began 15 days after transplanting and continued until crop maturity. The well-watered experiment was irrigated at four-day intervals. In the water-deficit experiment, irrigation was supplied at 12-day intervals without maintaining standing water. The amount of irrigation water delivered to each experiment was monitored using a flow meter. Total seasonal water application was 13,020 m3/ha under the well-watered regime and 8286 m3/ha under the water-deficit regime. The physical and chemical characteristics of the experimental soil are presented in Table S3. Soil water content and soil water potential were not monitored; therefore, irrigation scheduling and water input characterize the imposed management regimes but do not quantify the temporal intensity of soil water deficit. Nitrogen was supplied at 165 kg N/ha as urea (46% N). It was divided into three applications. During crop establishment, phosphorus was applied at 37 kg P2O5/ha as calcium superphosphate (15% P2O5). Potassium was added at 50 kg K2O/ha as potassium sulfate (48% K2O). Zinc sulfate was applied at 24 kg/ha.
2.6. Trait Measurements
2.6.1. Physiological Traits
Leaf rolling (LR) was visually assessed under both water regimes using 0–9 scale described by De Datta et al. [40]. Lower scores indicating flatter leaves and higher scores indicating more pronounced rolling. Observations were made between 11:00 and 12:00 h. Each flag leaf was assigned a single score based on its overall degree of rolling. The scores of the ten plants were averaged to obtain the plot-level value. Relative water content (RWC; %) was measured at flowering according to Barrs and Weatherley [41]. Fresh leaf weight was recorded immediately after sampling. The same tissue was then hydrated to obtain turgid weight and oven-dried to determine dry weight. Relative water content was calculated as:
where FW, TW, and DW represent fresh, turgid, and dry weights, respectively. Leaf chlorophyll content (CHLC) was measured at flowering using a SPAD-502 m ((Model: SPAD-502, Minolta Sensing Ltd., Hangzhou, Japan). Readings (SPAD units) were taken from middle of the fully expanded flag leaves of ten representative plants in each plot. Three readings were taken at separate positions around the midpoint of each leaf blade, avoiding the midrib. These readings represented within-leaf technical measurements and were averaged to obtain one value per plant. The values from the ten plants were subsequently averaged to obtain the plot mean used in the statistical analysis.
RWC = ((FW − DW)/(TW − DW)) × 100
Flag leaf area (FLA; cm2) was measured at flowering in ten representative plants per plot. Leaf length and maximum width were recorded, and leaf area was estimated according to Yoshida and Hara [42]. Leaf area (cm2) was estimated as:
using a fixed correction factor of K = 0.75 for all parental genotypes and F1 hybrids. This coefficient falls within the range reported for rice, although it may vary depending on the growth stage [43].
FLA = K × leaf length (cm) × leaf width (cm)
2.6.2. Agronomic Traits
Days to 50% heading (DTH) was recorded for each plot as the number of days from transplanting until approximately half of the plants had fully exerted panicles. Plant height (PLH; cm) was measured at maturity from the soil surface to the tip of the main panicle. At maturity, ten representative plants were selected from each experimental unit to determine yield-related traits. The number of panicles per plant (NPP) was determined by counting all fertile panicles on each sampled plant. Panicle length (PLT; cm) was measured from the base of the panicle to its terminal point. Panicle weight (PWE; g) was recorded after the harvested panicles were air-dried. Fertility percentage (FER; %) was estimated as the number of filled grains divided by the total number of filled and unfilled grains. The 1000-grain weight (TGW; g) was determined from a representative sample of 1000 filled grains from each plot. Grain yield per plant (GYP; g) was calculated from the grain harvested from each sampled plant and adjusted to a moisture content of 14%.
2.7. Drought Tolerance Indices
Grain yield per plant under well-watered and water-deficit conditions was used to calculate drought-response indices for each genotype. The following symbolization was used: Yp and Ys are the yields of an individual genotype under well-watered and water-deficit conditions, respectively. Ȳs and Ȳp are the corresponding means across all genotypes [44,45,46,47,48,49].
Tolerance (TOL) =Yp − Ys
Higher values of MP, GMP, HM, STI, YI, YSI, and RSI were interpreted as favorable, whereas lower TOL and SSI values indicated reduced yield sensitivity to water deficit.
2.8. Statistical Analysis
Data from each water regime were analyzed using analysis of variance for a randomized complete block design. The two irrigation experiments were analyzed separately. The genotype sum of squares was partitioned into parents, crosses, and the contrast between parents and crosses. The variation among crosses was further divided into lines, testers, and line × tester interaction. Combining ability analysis was conducted separately for well-watered and water-deficit regimes following Kempthorne [50]. General combining ability effects were estimated for each line and tester. Specific combining ability effects were calculated for each cross. Favorable GCA or SCA effects detected under both regimes indicate consistency within the two separate analyses rather than statistically demonstrated across irrigation regimes. Additive and dominance variance components and broad- and narrow-sense heritability were estimated according to the line × tester procedure described by Kempthorne [50]. Mid-parent heterosis (MPH) and better-parent heterosis (BPH) were calculated under both water regimes. Mid-parent heterosis (MPH) and better-parent heterosis (BPH) were calculated separately within each irrigation regime as:
where F1 is the cross mean [MP = (P1 + P2)/2], and P1 and P2 are the corresponding parental means under the same irrigation regime. BP represents the parent with the more desirable mean: the lower value for days to heading, plant height, and leaf rolling, and the higher value for the remaining traits. Negative heterosis was considered desirable for earlier heading, reduced plant height, and lower leaf rolling. Positive heterosis was considered desirable for flag leaf area, relative water content, chlorophyll content, and yield-related traits. Significance was assessed using t-tests of the differences F1 − MP and F1 − BP, with standard errors √[3MSE/(2r)] and √(2MSE/r), respectively. Where MSE is the residual mean square from the corresponding irrigation-regime ANOVA. Tests used the associated residual degrees of freedom, with significance declared at p < 0.05 and p < 0.01.
MPH (%) = [(F1 − MP)/MP] × 100,
BPH (%) = [(F1 − BP)/BP] × 100,
Principal component analysis and Hierarchical clustering were performed using the packages of ggplot2, FactoMineR, factoextra, and ggrepel in R software (version 4.6.1). Heatmaps were generated for the two water regimes using the pheatmap, Gplots, and tibble packages. Pearson correlation coefficients were calculated separately within each irrigation regime to examine associations among the measured traits. Phenotypic relationships among the measured traits were examined within each water regime using packages ggpubr, tidyverse, Hmisc, and corrplot.
3. Results
3.1. Molecular Variation Among Parental Genotypes
Twelve SSR markers generated clear and reproducible polymorphic profiles across the thirteen parental genotypes. The banding profiles for the tested SSR markers are shown in Figure S1. Collectively, the polymorphic markers detected 32 alleles, with two to four alleles per locus and an average of 2.67 alleles per locus (Table 1). The marker RM1261 generated the most alleles. RM321, RM263, RM555, RM242, and RM201 each produced two bands, reflecting the occurrence of two alleles. The effective number of alleles ranged from 1.55 for RM201, RM555, and RM2263 to 2.97 for RM1261. Major allele frequencies varied from 0.46 to 0.77, with an overall mean of 0.63. Marker informativeness differed considerably among loci. PIC values ranged from 0.29 (RM201, RM555, and RM2263) to 0.60 (RM1261). The average across polymorphic markers was 0.43. Pairwise genetic distances among the parents ranged from 0.15 to 0.96 (Table 2). The closest relationships were recorded for L4–L9, L2–L7, L2–L3, and T2–T3. L1–L6 and L3–L6 were the most divergent pairs. The UPGMA dendrogram separated the parental material into two principal clusters (Figure 2). The first Cluster (I) comprised T1, L6, L4, L9, and L5. Within this cluster, T1, L6, and L4 formed one subgroup. In contrast, L5 and L9 formed another subgroup. The second Cluster (II) contained the remaining eight parents and was divided into three subgroups. L1, L2, L3, and L7 occurred together in the first subgroup. T2 and T3 formed the second subgroup, whereas L8 and L10 constituted the third.
Table 1.
Allelic diversity and informativeness parameters of the polymorphic SSR markers used to characterize the parental rice genotypes.
Table 2.
Pairwise SSR-based genetic distances among the thirteen parental rice genotypes.
Figure 2.
UPGMA dendrogram of the thirteen parental rice genotypes based on Jaccard genetic distances derived from SSR markers.
3.2. Analysis of Variance
Genotypes mean squares were significant for all the measured traits under both water regimes (Table 3). The parental genotypes differed significantly for most traits. However, their variation in leaf rolling under well-watered conditions was not significant. Variation among the evaluated crosses was significant for all traits in both environments. Parents vs. crosses mean squares were significant for all traits, except panicle length under well-watered conditions and chlorophyll content under water-deficit conditions. Partitioning the variation among crosses revealed significant line effects for all traits under both water regimes. Tester effects were significant for all traits except leaf rolling and panicle weight under well-watered conditions and for flag leaf area and chlorophyll content under water-deficit conditions. The line × tester interaction was significant for all traits. This demonstrates that the relative performance of individual crosses depended on the particular combination of female and male parents.
Table 3.
Analysis of variance and line × tester mean squares for the measured traits under well-watered (N) and water-deficit (S) conditions.
3.3. Effect of Water Deficit and Genotypic Performance
The following comparisons summarize the observed differences between the two irrigation experiments. Reducing irrigation water affected all evaluated characteristics (Figure 3). The mean number of days to heading decreased from 101.4 days under well-watered conditions to 95.9 days under water deficit. L3 and T3 were consistently among the earliest parents. Among the crosses, L1 × T3, L3 × T2, and L4 × T3 were the earliest under well-watered conditions (Table 4). L3 × T2, L9 × T1, and L1 × T3 were the earliest under water deficit. Mean plant height declined from 104.6 to 90.6 cm. L1, L2, L9, and T3 were among the shorter parents. Meanwhile, the crosses L7 × T1 and L6 × T3 produced comparatively short plants in both regimes. In contrast, L6 × T2 and L8 × T2 produced the tallest plants (Table 4). Leaf rolling responded in the opposite direction to the remaining traits. Its mean score increased from 2.26 under well-watered conditions to 4.97 under water deficit. L1 and L2 maintained relatively low scores as parents. L2 × T2 and L10 × T1 were among the crosses with limited rolling. Under water deficit, the highest scores were observed in L9, L6, L7 × T1, and L1 × T1. Flag leaf area was reduced by 17.2%, from 29.6 to 24.5 cm2. L5, L8, and T2 had relatively large flag leaves under both treatments. L3 × T3, L2 × T2, L1 × T2, and L10 × T3 ranked highly under well-watered conditions. Under water deficit, L4 × T1, L3 × T2, L5 × T3, and L3 × T3 recorded the largest leaf area. Relative water content decreased from 85.5 to 71.8%. L2, L5, and T2 maintained high values across both water regimes. Under water deficit, the L2 × T1, L3 × T3, and L10 × T2 crosses retained the highest leaf water content. Chlorophyll content declined from 43.7 to 38.4 SPAD units. L2 and L5 were the leading parents under water deficit. L3 × T3, L6 × T2, and L1 × T2 maintained comparatively high SPAD readings (Table 4).
Figure 3.
Distribution of morphological, physiological, and yield-related traits across the 43 rice genotypes under well-watered and water-deficit regimes. Comparisons between irrigation regimes are descriptive. DTH, days to 50% heading (A); PLH, plant height (B); LR, leaf rolling (C); FLA, flag leaf area (D); RWC, relative water content (E); CHLC, chlorophyll content (F); NPP, number of panicles per plant (G); PLT, panicle length (H); PWE, panicle weight (I); FER, fertility percentage (J); TGW, 1000-grain weight; (K) and GYP, grain yield per plant (L). ** indicate p < 0.01.
Table 4.
Mean performance of the parental lines, testers, and their crosses for morphological and physiological traits under normal (N) and water deficit (S) conditions.
The number of panicles per plant fell from 18.7 to 14.4. The highest panicle number was assigned for the parents L2, L6 and T3, and the crosses L3 × T3, L4 × T3, and L10 × T2 under normal conditions. Under water deficit, L3, L5, and T3 had the highest parental means. L10 × T2, L3 × T3, and L10 × T3 produced the highest panicle numbers among the crosses (Table 5). Mean panicle length decreased from 21.5 to 18.5 cm. Under water deficit, L2, L3, T3, L3 × T3, L10 × T3, and L5 × T2 produced the longest panicles. Panicle weight exhibited the greatest proportional decline among the yield components. It decreased from 4.2 to 2.8 g. L2, L10, and T3, together with L3 × T3, L10 × T2, and L5 × T3, maintained relatively heavy panicles weight under both irrigation regimes. Fertility percentage decreased from 89.1 to 76.6%. L9 as well as L3 × T3, L10 × T2 and L5 × T3 hybrids exhibited the highest fertility percentage under both conditions, and 1000-grain weight declined from 26.5 to 22.7 g. L2, L5, and L10 were among the parents with the heaviest grains. The crosses L3 × T3, L5 × T3, L2 × T2 and L6 × T1 under well-watered conditions, and L5 × T3, L3 × T3, L10 × T2, and L9 × T3 under water deficit had the highest 1000-grain weight (Table 5). Average grain yield decreased from 43.4 to 33.1 g/plant. L2, L10, and T3 were the highest-yielding parents across the two treatments. The crosses L3 × T3, L10 × T2, L2 × T2, and L5 × T3 consistently produced the highest grain yield under both well-watered and water-deficit conditions (Table 5).
Table 5.
Mean performance of the parental lines, testers, and their crosses for yield-related traits under normal (N) and water deficit (S) conditions.
3.4. Classification Based on Drought-Tolerance Indices
The drought-tolerance indices revealed considerable variation among the 43 genotypes (Table S4). TOL values varied from 5.00 to 16.67. The productivity-based indices ranged from 33.17 to 43.04 for MP, 32.37 to 42.88 for GMP, 31.52 to 42.73 for HM, 0.555 to 0.973 for STI, and 0.777 to 1.192 for YI. T3 recorded the highest MP, GMP, HM, STI, and YI values. This indicates high productivity across both water regimes. By contrast, L8 had the lowest yield reduction, TOL, and SSI values and the highest YSI and RSI values. This indicates a strong ability to retain its yield under water deficit. These contrasting responses showed that the same genotype did not always express high productivity and low stress susceptibility. Therefore, we considered all indices jointly in the hierarchical classification. Hierarchical clustering based on the standardized drought-tolerance indices separated the 43 genotypes into four groups (Figure 4). Group A comprised L10 × T2, L3 × T3, L2 × T2, L5 × T3, L1 × T2, L2 × T3, L2, T2, and T3. These genotypes had relatively high STI, GMP, MP, HM, and YI values, identifying them as the most productive group across the two water regimes. Group B included L7, L8, L9, L4 × T2, L3 × T2, L9 × T1, L8 × T2, L7 × T3, L10 × T1, and L8 × T3. This group had low SSI and TOL values and favorable YSI and RSI values. This indicates limited proportional yield loss under water deficit. Group C comprised L6 × T1, L6 × T2, L6 × T3, L10 × T3, L4 × T3, L7 × T2, L1 × T3, L4 × T1, L8 × T1, L9 × T3, and L10. These genotypes showed intermediate values for most productivity and susceptibility indices. Therefore, they were classified as moderately responsive to water deficit. Group D contained L9 × T2, L7 × T1, L5 × T2, L5 × T1, L1 × T1, L2 × T1, L3 × T1, L4, L5, L1, L6, L3, and T1. These genotypes combined high SSI and TOL values with low productivity-based indices. This indicates the least favorable overall response to water limitation.
Figure 4.
Hierarchical clustering of the 43 rice genotypes based on their standardized drought-tolerance indices.
Principal component analysis of the nine drought-response indices provided an integrated representation of productivity and yield retention across the two irrigation regimes (Figure S2). The first and second principal components explained 66.76% and 33.17% of the total variation respectively. MP, GMP, HM, and STI had similarly oriented vectors, indicating close positive associations. YI was also positively associated with these indices. YSI and RSI exhibited nearly overlapping vectors, consistent with their common emphasis on proportional yield retention. TOL and SSI were closely associated and oriented oppositely to YSI and RSI, reflecting the inverse relationship between yield sensitivity and yield retention. The distribution of genotypes in the biplot complemented the hierarchical classification. T3, T2, L2, L10 × T2, L3 × T3, L2 × T2, and L5 × T3 occupied the positive side of PC1 and were associated with favorable productivity-based indices. L2 × T1 and L3 × T1 were positioned toward the sensitivity indices, whereas L8 and L7 had strongly negative PC2 scores, consistent with their favorable yield-retention indices. Together, these analyses distinguished the productive response represented by Group A from the comparatively strong proportional yield retention represented by Group B. The high proportion of variation captured by the first two components also reflects the mathematical relationships among indices derived from the same two yield measurements.
3.5. Trait-Based Heatmap Clustering
The heatmaps revealed substantial changes in trait expression and genotype grouping between the two water regimes (Figure 5). Under well-watered conditions, L3 × T3, L10 × T2, L5 × T3, L2 × T2, L2, and T3 formed a distinct high-performing cluster. These genotypes combined high panicle weight, fertility, 1000-grain weight, and grain yield. A second, larger cluster showed intermediate expression for most traits. The third cluster was characterized by smaller flag leaves, lower relative water and chlorophyll contents, fewer panicles, lighter grains, and reduced grain yield. Under water deficit, T3, L5 × T3, L10 × T2, L3 × T3, L2 × T2, and L2 remained together in the most favorable cluster. Their classification was associated with comparatively high relative water content, chlorophyll content, yield components, and grain yield. The second cluster showed intermediate performance across most variables. Genotypes in the third cluster generally had lower agronomic and physiological values and more pronounced leaf rolling, reflecting a less favorable response to restricted irrigation.
Figure 5.
Heatmaps with hierarchical clustering of standardized trait profiles for 43 rice genotypes under (A) well-watered and (B) water-deficit conditions. Red and blue represent higher and lower standardized values, respectively. DTH, days to 50% heading; PLH, plant height; LR, leaf rolling; FLA, flag leaf area; RWC, relative water content; CHLC, chlorophyll content; NPP, number of panicles per plant; PLT, panicle length; PWE, panicle weight; FER, fertility percentage; TGW, 1000-grain weight; and GYP, grain yield per plant.
3.6. General Combining Ability
Estimated GCA effects differed among parents and between water regimes (Table 6). Negative effects were considered desirable for days to heading, plant height, and leaf rolling. In contrast, positive effects were preferred for the remaining traits. L1 and L3 had significant and negative GCA effects for days to heading under well-watered and water- deficit conditions. L1, L6, and L7 exhibited the highest significant and negative GCA effects towards dwarfness. For leaf rolling, L10 had a desirable GCA effect under water deficit, and L3 produced favorable effects across both environments. L3 and L4 were favorable combiners for flag leaf area under both treatments. Positive and significant GCA effects were detected for relative water content by L2, L3, L6, and L10 across the two regimes. L6 and L10 also had positive and significant GCA effects for chlorophyll content under both treatments. L2 and L3 showed additional favorable GCA effects under water deficit. L1 and L2 were the best general combiners for number of panicles/plant, L7 for panicle length, and L2, L3, and L10 for panicle weight under both irrigation regimes. Furthermore, L1, L2, L3, and L10 had the greatest GCA effects for fertility percentage under both conditions. Desirable GCA effects for 1000-grain weight were associated with L2, L3, L4, and L10. For grain yield per plant, L1 and L6 were favorable combiners under well-watered conditions, whereas L2 and L10 showed the highest positive and significant GCA effects under both water regimes. This identifies them as promising lines for improving grain yield under restricted and adequate water supply. Among the testers, T2 contributed favorably to reduced leaf rolling and to increased relative water content, panicle length, and grain yield under water deficit. T3 had desirable effects for days to heading, plant height, panicle number, fertility, 1000-grain weight, and grain yield under both treatments. It also contributed positively to flag leaf area, relative water content, and chlorophyll content under well-watered conditions.
Table 6.
General combining ability effects of the parental lines and testers for the evaluated traits under normal (N) and water deficit (S) conditions.
3.7. Specific Combining Ability
SCA effects varied markedly among crosses and traits (Table 7). The crosses L5 × T1, L6 × T1, L9 × T1, L3 × T2, L7 × T2, L4 × T3, and L10 × T3 had significant and negative effects for days to heading under both treatments. Significantly negative SCA effects for plant height under water deficit were observed in the hybrids L3 × T1, L7 × T1, L5 × T2, L6 × T2, L6 × T3, and L8 × T3. Similarly, L2 × T2 and L5 × T3 had the most favorable negative SCA effects for leaf rolling under water deficit. Several crosses combined favorable SCA effects for the physiological traits. L2 × T2, L3 × T2, L3 × T3, L5 × T3, L8 × T1, L9 × T1, and L6 × T3 contributed positively to flag leaf area across both regimes. L1 × T1, L1 × T2, L4 × T2, L8 × T2, L10 × T2, and L5 × T3 had favorable effects for relative water content. Under water deficit, L8 × T1, L9 × T1, L4 × T2, L3 × T3, L5 × T3, and L7 × T3 had positive SCA effects for chlorophyll content. For yield components, L7 × T2, L10 × T2, L3 × T3, and L4 × T3 had the highest SCA effects for number of panicles/plant under both water regimes (Table 8). L6 × T1, L8 × T1, L3 × T3, and L10 × T3 had favorable SCA effects for panicle length, while L1 × T1, L8 × T2, L10 × T2, L3 × T3, L5 × T3, and L7 × T3 had the highest positive SCA effects for panicle weight. The hybrids L1 × T1, L6 × T1, L2 × T2, L7 × T2, L10 × T2, L3 × T3, L5 × T3, and L9 × T3 across both conditions were identified as good specific combiners for enhancing 1000-grain weight. Six crosses, L5 × T1, L2 × T2, L7 × T2, L10 × T2, L3 × T3, and L5 × T3, showed significant and positive SCA effects for grain yield under both irrigation treatments.
Table 7.
Specific combining ability effects of the F1 crosses for the morphological and physiological traits under normal (N) and water deficit (S) conditions.
Table 8.
Specific combining ability effects of the F1 crosses for the yield-related traits under normal (N) and water deficit (S) conditions.
3.8. Mid-Parent and Better-Parent Heterosis
Heterosis estimates differed among crosses, traits, and water regimes (Table S5). L3 × T2 expressed the strongest negative mid-parent heterosis for days to heading. However, none of the crosses surpassed the earlier parent in the desired direction. Several combinations showed negative heterosis for plant height, including L3 × T1, L7 × T1, L5 × T2, L6 × T2, L6 × T3, L7 × T3, and L8 × T3. Several crosses showed positive mid-parent or better-parent heterosis for flag leaf area, relative water content, and chlorophyll content. However, the identity and magnitude of the leading combinations differed between water regimes. L3 × T3 was among the promising crosses for these physiological traits and also expressed favorable heterosis for fertility and 1000-grain weight (Table S6). For grain yield per plant, several combinations exhibited significant heterotic responses in one or both environments. L5 × T1, L6 × T1, and L3 × T3 were among the crosses that maintained favorable mid-parent heterosis for grain yield across both water regimes. Moreover, L1 × T1 under normal condition and L6 × T1 under both conditions recorded the uppermost positive heterotic effects relative to better-parent.
3.9. Genetic Variance Components and Heritability
Dominance variance exceeded additive variance for all traits under both irrigation regimes (Table 9). The difference was particularly pronounced for relative water content, plant height, fertility, grain yield, and several yield components. Broad-sense heritability ranged from 23.89% for leaf rolling under well-watered conditions to 95.59% for fertility under water deficit. Values exceeded 74% for relative water content, flag leaf area, panicle number, panicle weight, fertility, 1000-grain weight, and grain yield in at least one regime. In contrast, chlorophyll content had broad-sense estimates of 44.19% and 67.84% under well-watered and water-deficit conditions, respectively. Leaf rolling had corresponding estimates of 23.89% and 43.36%. Narrow-sense heritability was low for all traits, ranging from 0.02% for plant height under water deficit to 3.45% for plant height under well-watered conditions. Grain yield estimates were 2.55% under well-watered conditions and 1.31% under water deficit.
Table 9.
Genetic variance components and heritability estimates for the evaluated traits under normal (N) and water deficit (S) conditions.
3.10. Principal Component Analysis
The first two principal components explained 73.66% of the standardized phenotypic variation (Figure 6). PC1 accounted for 65.63%. PC2 explained an additional 8.03%. The two water regimes were clearly separated along PC1. Plant height, flag leaf area, relative water content, chlorophyll content, panicle number, panicle length, panicle weight, fertility, 1000-grain weight, and grain yield were aligned with the positive side of PC1. Genotype observations from the well-watered regime were generally positioned in the same direction. Leaf rolling was oriented toward the negative side of PC1 and was associated more closely with observations from the water-deficit regime. Grain yield contributed most to PC1 (11.7%), followed by chlorophyll content (10.4%) and fertility (9.6%). Days to heading dominated PC2, accounting for 78.4% of its trait contribution. The next largest contributions to PC2 were from 1000-grain weight and fertility, at 8.0 and 7.5%, respectively.
Figure 6.
Principal component analysis of the evaluated rice genotypes and traits across the two water regimes. (A) PCA biplot illustrating the distribution of genotype × water-regime combinations and their relationships with the measured traits; (B) proportion of total variation explained by individual principal components; and (C,D) contributions of the evaluated traits to PC1 and PC2, respectively. DTH, days to 50% heading; PLH, plant height; LR, leaf rolling; FLA, flag leaf area; RWC, relative water content; CHLC, chlorophyll content; NPP, number of panicles per plant; PLT, panicle length; PWE, panicle weight; FER, fertility percentage; TGW, 1000-grain weight; and GYP, grain yield per plant.
3.11. Phenotypic Correlations
Trait relationships differed between irrigation regimes (Figure 7). Under well-watered conditions, grain yield per plant was positively correlated with panicle number, panicle weight, fertility, 1000-grain weight, flag leaf area, and chlorophyll content. Chlorophyll content was positively associated with relative water content and 1000-grain weight. Relative water content was positively related to panicle weight. Leaf rolling was negatively associated with grain yield, chlorophyll content, relative water content, panicle weight, and 1000-grain weight. Under water deficit, grain yield retained positive relationships with panicle number, panicle length, panicle weight, fertility, 1000-grain weight, flag leaf area, relative water content, and chlorophyll content. Relative water content was positively correlated with chlorophyll content, and panicle weight was positively related to fertility, relative water content, and chlorophyll content. Negative correlations were detected between grain yield and both days to heading and leaf rolling. Leaf rolling was also inversely associated with chlorophyll content and panicle weight.
Figure 7.
Pearson correlation patterns among the measured traits under (A) well-watered and (B) water-deficit conditions. Cell colors represent the direction and magnitude of the correlation coefficients, ranging from red (negative associations) to blue (positive associations). DTH, days to 50% heading; PLH, plant height; LR, leaf rolling; FLA, flag leaf area; RWC, relative water content; CHLC, chlorophyll content; NPP, number of panicles per plant; PLT, panicle length; PWE, panicle weight; FER, fertility percentage; TGW, 1000-grain weight; and GYP, grain yield per plant.
4. Discussion
The significant differences among parents, crosses, and line × tester combinations show that the evaluated material contained sufficient variation. This variability is vital to identify useful sources of adaptation to limited water supply. Water deficit altered all measured traits. But the magnitude and direction of response varied among genotypes. This variation is fundamental to breeding progress. Selection requires both adequate genetic diversity and reliable differences to maintain reproductive performance under stress. Similar genotype-dependent responses have been reported in rice populations evaluated under favorable and water-limited [8,35,51].
The SSR analysis provided an independent description of diversity among the thirteen parents. The 12 polymorphic markers detected an average of 2.67 alleles per locus. The mean PIC value was 0.43. According to commonly used PIC classifications. This value indicates moderate rather than high marker informativeness. The number of alleles was comparable to that reported in several rice collections [52,53,54]. However, it was lower than values reported in studies using larger populations or more extensive marker panels [55,56,57]. Such differences are expected because estimates of molecular diversity depend on population size and genetic background, as well as the number of markers and the genomic distribution of the selected loci. Therefore, interpret the molecular results in the present study as evidence of useful differentiation within the parental set rather than as a comprehensive representation of rice diversity. The UPGMA analysis separated the parents into two main groups and placed the closely related testers T2 and T3 within the same subgroup. This differentiation may help avoid redundant parental combinations and identify crosses involving contrasting genetic backgrounds. Several high-performing crosses, including L10 × T2, L2 × T2, and L5 × T3, involved parents separated by relatively large molecular distances. Genetic divergence alone cannot establish whether the contrasting alleles affect drought response or productivity [58].
The imposed water-deficit regime reduced seasonal irrigation from 13,020 to 8286 m3/ha. This treatment decreased grain yield per plant from 43.4 to 33.1 g. Panicle weight showed the largest proportional reduction among the yield components. It was followed by panicle number and 1000-grain weight. These changes indicate that restricted irrigation affected both the establishment of reproductive sinks and the subsequent supply of assimilates to developing grains. Water shortage can limit leaf expansion, stomatal conductance, and carbon assimilation. It can also limit panicle development, pollination, and grain filling. This results in fewer productive panicles, greater spikelet sterility, and lighter grains. Heading occurred approximately 5.5 days earlier under water deficit. Accelerated development may help some genotypes complete sensitive reproductive stages before the available soil moisture declines further. However, early heading should not automatically be regarded as an indicator of drought tolerance. A shortened crop duration may also limit biomass accumulation and yield potential. Its breeding value depends on whether earliness is accompanied by satisfactory fertility and grain production. The early-heading lines L1 and L3 are therefore most useful when combined with parents that contribute favorable yield components and water-status traits. Plant height and flag leaf area significantly decreased under water-deficit conditions. Reduced cell expansion under low water potential probably contributed to both responses. A smaller canopy may lower transpiration demand. But excessive leaf area loss can limit light interception and assimilate production. The reduction in relative water content from 85.5 to 71.8%. This confirmed that the deficit treatment affected plant water status. Chlorophyll content also declined. This reduction suggests that water limitation impaired the maintenance of photosynthetically active leaf tissue. Previous studies have identified relative water content and chlorophyll retention as useful indicators of physiological performance in drought-affected rice [59,60]. Leaf rolling increased from 2.26 under well-watered conditions to 3.97 under water deficit and was negatively correlated with grain yield and chlorophyll content. These associations indicate that greater rolling generally accompanied poorer performance under the imposed irrigation conditions. However, the adaptive significance of rolling depends on its duration, reversibility, and relationship with plant water status. Moderate, reversible rolling may reduce exposed leaf area and radiation load, potentially limiting water loss [61,62]. Conversely, persistent rolling accompanied by low relative water content, declining chlorophyll content, and reduced fertility and yield is more consistent with impaired performance under water deficit. No universal visual score separates adaptive rolling from dehydration injury, and rolling severity alone cannot establish tissue damage. In breeding selection, this trait should therefore be assessed at comparable developmental stages, at standardized times of day and intervals after irrigation, preferably through repeated observations during stress and recovery. Scores should be interpreted alongside relative water content, chlorophyll content, fertility, and grain yield.
Drought-tolerance indices distinguished two desirable but biologically different response patterns. These contrasting responses arise from the mathematical definitions of the indices. MP, GMP, HM, and STI emphasize productivity across both irrigation regimes, whereas YI describes relative productivity under water deficit. In contrast, TOL measures absolute yield loss, SSI expresses proportional yield loss relative to the overall stress intensity, and YSI and RSI emphasize proportional yield retention. Consequently, genotypes with modest yields under both regimes may exhibit favorable sensitivity or retention indices without achieving high productivity. These indices therefore describe complementary aspects of yield response and should be considered alongside actual yield. The genotypes assigned to Group A, particularly L10 × T2, L3 × T3, L2 × T2, and L5 × T3, showed high values for productivity-based indices (MP, GMP, HM, STI, and YI). These crosses combined high yield under favorable conditions with comparatively strong performance under water deficit. In contrast, Group B was characterized primarily by low SSI and TOL, along with favorable yield-stability indices. Low proportional yield loss can indicate stress stability. Still, it does not necessarily indicate high productivity, as a genotype with modest yields under both regimes may also have a low TOL value. Consequently, Group A provides the most relevant material when the breeding objective is to combine yield potential with performance under water limitation. Group B may contain useful sources of yield stability or specific adaptive traits. Previous drought-screening studies have also shown the value of combining several indices rather than relying on a single measure [63,64,65]. The heatmap supported the classification obtained from the yield-based indices. L10 × T2, L3 × T3, L2 × T2, and L5 × T3 remained within the favorable cluster under both water regimes. Under water deficit, this group combined higher grain yield with better relative water content, chlorophyll retention, fertility, and grain weight. Its performance suggests that yield maintenance resulted from the joint expression of several physiological and reproductive characteristics rather than from a single tolerance mechanism. These combinations should receive priority in subsequent field evaluation.
The GCA results distinguished parents who consistently transmitted desirable traits to their progeny. L1 and L3 were valuable sources of earliness, whereas L6 and L7 contributed to shorter plant stature. Reduced height may improve lodging resistance, although it should be combined with sufficient biomass and panicle production to avoid compromising yield. L2 and L10 were favorable general combiners for grain yield and several associated traits under water deficit. They also positively contributed to relative water content, chlorophyll content, panicle weight, fertility, and grain weight. This confirms their value as donors of both physiological and yield-related traits. Among the testers, T3 had favorable effects on grain yield and several yield components under both water regimes. T2 contributed positively to reduced leaf rolling, relative water content, panicle length, and grain yield under water deficit. The SCA analysis further identified L5 × T1, L2 × T2, L7 × T2, L10 × T2, L3 × T3, and L5 × T3 as favorable combinations for grain yield across both water regimes. These crosses, L10 × T2, L3 × T3, L2 × T2, and L5 × T3, were also grouped within the leading drought-index and heatmap clusters. Agreement among their observed performance, SCA effects, and multivariate classification supports their advancement in the breeding program. Strong SCA effects were observed in crosses involving parents with different GCA levels. This indicates that parental GCA alone cannot reliably predict an individual cross’s performance. These responses may arise from dominance, epistasis, or complementation between parental alleles. However, the present mating design does not allow these mechanisms to be separated. The heterosis results further demonstrated that some F1 combinations exceeded their parental averages for physiological and yield-related characteristics. L3 × T3 showed favorable responses for several traits, including water status, fertility, grain weight, and yield. L5 × T1 and L6 × T1 also exhibited favorable yield heterosis under both water regimes. For a self-pollinated crop such as rice, these crosses may be useful either as candidates for hybrid development, where an appropriate seed-production system is available, or as sources for selecting superior segregants in subsequent generations. From a practical breeding perspective, absolute yield under the target growing conditions should carry greater weight than better-parent heterosis when prioritizing promising crosses. Better-parent heterosis quantifies the relative advantage of a cross over its superior parent, but a large percentage can arise from low parental yields without translating into competitive productivity. Conversely, a cross involving highly productive parents may achieve high yield while expressing only modest heterosis. Accordingly, L10 × T2, L3 × T3, L2 × T2, and L5 × T3 were prioritized primarily for their high observed yields under both irrigation regimes, supported by favorable SCA effects and drought-response indices. Their potential for commercial hybrid development would require further confirmation of superiority over appropriate commercial checks, yield consistency, grain quality, and seed-production feasibility.
Dominance variance exceeded additive variance for all traits under both irrigation treatments, and narrow-sense heritability estimates were low. These results indicate that the non-additive effects play a greater role in regulating the inheritance of these traits. A similar predominance of non-additive variation has been reported for several agronomic and physiological traits in rice [66,67,68]. Other investigations, however, have detected more substantial additive control [69,70,71]. This emphasizes that the relative importance of genetic effects depends on the parents, environments, traits, and mating design. High broad-sense heritability for many traits indicates that genetic differences accounted for a large proportion of the observed variation within the present experiments. This should not be interpreted as evidence that early-generation selection will necessarily be effective because broad-sense heritability includes both additive and non-additive components. The very low narrow-sense estimates imply limited expected response to direct selection in the early segregating generations. Selection may become more informative after additional recombination and inbreeding allow favorable allele combinations to be fixed. Crosses combined high mean performance with favorable SCA such as L10 × T2, L3 × T3, L2 × T2, and L5 × T3.
The PCA explained a large proportion of the phenotypic variation and clearly separated the two water regimes. Grain yield, chlorophyll content, fertility, relative water content, panicle number, panicle weight, and grain weight were oriented in a similar direction, whereas leaf rolling was positioned oppositely. The correlation analysis supported this pattern. Under water deficit, higher grain yield was associated with improved water status, chlorophyll retention, panicle formation, fertility, and grain weight. These relationships suggest a coordinated phenotype in which the maintenance of vegetative function supports reproductive success. Relative water content, chlorophyll content, panicle number, fertility, and 1000-grain weight may therefore be considered complementary selection criteria. Leaf rolling may also assist in visual screening but should be interpreted alongside water status and yield. Moderate rolling can reflect an adaptive response, whereas severe rolling may indicate tissue dehydration.
5. Conclusions
The evaluated rice parental genotypes exhibited molecular differentiation and phenotypic variation under the two irrigation regimes. The parental lines L1 and L3 were identified as an effective combiner for developing early maturing genotypes. L2 and L10 were favorable general combiners for improving grain yield and its associated traits under both irrigation regimes. Genetic parameter estimates suggested a predominance of the non-additive effects in controlling the inheritance of all the studied traits. The crosses L10 × T2, L3 × T3, L2 × T2, and L5 × T3 were prioritized for their observed high grain yield, supported by favorable SCA effects, and superior performance for yield-based drought-tolerance indices. These hybrids could serve as valuable genetic resources for developing desirable segregants and improving rice grain yield under water-deficit conditions. Multi-environment validation across locations and seasons is required before broader breeding recommendations can be made.
Supplementary Materials
The following supporting information can be downloaded at: https://www.mdpi.com/article/10.3390/life16111855/s1, Table S1. The code, name, pedigree, and origin of the parental rice genotypes used in this study; Table S2. Characteristics of 12 SSR markers, their chromosomal location, motif, annealing temperature, and fragment size; Table S3. Mechanical and chemical analysis of the experimental site in both seasons; Table S4. Drought-tolerance indices of 43 rice genotypes evaluated under well-watered and water-deficit conditions; Table S5. Heterosis relative to mid-parent (MP) and better-parent (BP) for morphological and physiological traits under normal (N) and water deficit (S) conditions; Table S6. Heterosis relative to mid-parent (MP) and better-parent (BP) for yield-related traits under normal (N) and water deficit (S) conditions; Figure S1. Agarose gel electrophoresis profiles generated by all applied SSR markers across the thirteen parental rice genotypes. M, 50-bp DNA ladder; Figure S2. Principal component biplot of 43 rice genotypes based on nine drought-response indices calculated from grain yield under well-watered and water-deficit conditions. Points represent genotypes, and arrows represent index loadings. MP, mean productivity; GMP, geometric mean productivity; HM, harmonic mean; YI, yield index; TOL, tolerance; SSI, stress susceptibility index; STI, stress tolerance index; YSI, yield stability index; and RSI, relative stress index.
Author Contributions
Conceptualization, R.M.S., H.A.F., M.M.A.O., M.M.E., M.I.G., E.M. and M.R.; methodology, R.M.S., M.M.A.O., M.M.E. and M.I.G.; software, H.A.F., E.M. and M.R.; validation, R.M.S., H.A.F., E.M. and M.R.; formal analysis, M.M.A.O., M.M.E. and M.I.G.; investigation, R.M.S., M.M.A.O., M.M.E. and M.I.G.; resources, H.A.F., E.M. and M.R.; data curation, R.M.S., H.A.F., M.M.A.O., M.M.E., M.I.G., E.M. and M.R.; writing—original draft preparation, R.M.S., H.A.F., M.M.A.O., M.M.E., M.I.G., E.M. and M.R.; writing—review and editing, R.M.S., H.A.F., M.M.A.O., M.M.E., M.I.G., E.M. and M.R.; visualization, R.M.S., H.A.F., M.M.A.O., M.M.E., M.I.G., E.M. and M.R.; supervision, H.A.F., M.I.G. and M.R.; project administration, R.M.S., H.A.F. and M.R.; funding acquisition, R.M.S. and M.R. All authors have read and agreed to the published version of the manuscript.
Funding
The Researchers would like to thank the Deanship of Graduate Studies and Scientific Research at Qassim University (https://www.qu.edu.sa) for financial support (QU-APC-2026).
Institutional Review Board Statement
Not applicable.
Informed Consent Statement
Not applicable.
Data Availability Statement
The data supporting the findings of this study were provided to the journal. They form part of an ongoing rice-breeding program and are being used in continuing analyses. However, the datasets are available from the corresponding author upon request.
Acknowledgments
The researchers would like to thank the Deanship of Graduate Studies and Scientific Research at Qassim University (https://www.qu.edu.sa) for financial support (QU-APC-2026).
Conflicts of Interest
The authors declare no conflicts of interest.
Abbreviations
The following abbreviations are used in this manuscript:
| ANOVA | Analysis of variance |
| BPH | Better-parent heterosis |
| CHLC | Chlorophyll content |
| CTAB | Cetyltrimethylammonium bromide |
| DNA | Deoxyribonucleic acid |
| DTH | Days to 50% heading |
| DW | Dry weight |
| F1 | First filial generation |
| FER | Fertility percentage |
| FLA | Flag leaf area |
| FW | Fresh weight |
| GCA | General combining ability |
| GMP | Geometric mean productivity |
| GYP | Grain yield per plant |
| HM | Harmonic mean |
| L | Line |
| LR | Leaf rolling |
| MP | Mean productivity |
| MPH | Mid-parent heterosis |
| MVSP | Multivariate Statistical Package |
| Na | Observed number of alleles |
| Ne | Effective number of alleles |
| NPP | Number of panicles per plant |
References
- Kou, S.; Ci, Z.; Liu, W.; Wu, Z.; Peng, H.; Yuan, P.; Jiang, C.; Li, H.; Mansour, E.; Huang, P. Conservation and sustainable development of rice landraces for enhancing resilience to climate change, with a case study of ‘Pantiange Heigu’in China. Life 2026, 16, 143. [Google Scholar] [CrossRef] [Scilit] [PubMed]
- Kou, S.; Zhu, Z.; Huang, P.; Wu, Z.; Yang, X.; Jiang, C.; Liu, W.; Mansour, E.; Yuan, P. Development of disease-resistant, stable high-yielding, and high-quality rice variety “Yunjing-60” through double-cropping acceleration and intensive multi-environment selection in mid-altitude regions. BMC Plant Biol. 2026, 26, 985. [Google Scholar] [CrossRef] [Scilit] [PubMed]
- Kou, S.; Yuan, P.; Huang, P.; Liu, W.; Jiang, C.; Li, H.; Al Aboud, N.M.; Wu, Z.; Mansour, E. Harnessing climate-adaptive breeding to accelerate tolerance to extreme temperatures in rice. Front. Sustain. Food Syst. 2026, 10, 1759448. [Google Scholar] [CrossRef] [Scilit]
- Fukai, S.; Mitchell, J. Genotypic adaptation to soil water deficit in rice-a comparison of desirable traits for aerobic production and lowland drought resistance. Crop Environ. 2025, 4, 23–37. [Google Scholar] [CrossRef] [Scilit]
- Ali, S.; Mir, R.A.; Haque, M.A.; Danishuddin; Almalki, M.A.; Alfredan, M.; Khalifa, A.; Mahmoudi, H.; Shahid, M.; Tyagi, A. Exploring physiological and molecular dynamics of drought stress responses in plants: Challenges and future directions. Front. Plant Sci. 2025, 16, 1565635. [Google Scholar] [CrossRef] [Scilit] [PubMed]
- Hassan, M.A.; Dahu, N.; Hongning, T.; Qian, Z.; Yueming, Y.; Yiru, L.; Shimei, W. Drought stress in rice: Morpho-physiological and molecular responses and marker-assisted breeding. Front. Plant Sci. 2023, 14, 1215371. [Google Scholar] [CrossRef] [Scilit] [PubMed]
- Aslam, M.M.; Rashid, M.A.R.; Siddiqui, M.A.; Khan, M.T.; Farhat, F.; Yasmeen, S.; Khan, I.A.; Raja, S.; Rasool, F.; Sial, M.A. Recent insights into signaling responses to cope drought stress in rice. Rice Sci. 2022, 29, 105–117. [Google Scholar] [CrossRef] [Scilit]
- Gaballah, M.M.; Ghazy, M.I.; Abd El Salam, K.; Abou El-Soud, G.M.; Marei, A.M.; Alomran, M.M.; Alwutayd, K.M.; Mansour, E. Assessing productivity and quality potential of promising newly developed rice lines under water deficit and well-watered conditions. Pak. J. Bot. 2024, 56, 2107–2116. [Google Scholar] [CrossRef] [Scilit] [PubMed]
- Kumar, A.; Sengar, R.; Pathak, R.K.; Singh, A.K. Integrated approaches to develop drought-tolerant rice: Demand of era for global food security. J. Plant Growth Regul. 2023, 42, 96–120. [Google Scholar] [CrossRef] [Scilit]
- Jagadish, S.; Murty, M.; Quick, W.P. Rice responses to rising temperatures–challenges, perspectives and future directions. Plant Cell Environ. 2015, 38, 1686–1698. [Google Scholar] [CrossRef] [Scilit] [PubMed]
- Latif, A.; Ying, S.; Cuixia, P.; Ali, N. Rice curled its leaves either adaxially or abaxially to combat drought stress. Rice Sci. 2023, 30, 405–416. [Google Scholar] [CrossRef] [Scilit]
- Jarin, A.S.; Islam, M.M.; Rahat, A.; Ahmed, S.; Ghosh, P.; Murata, Y. Drought stress tolerance in rice: Physiological and biochemical insights. Int. J. Plant Biol. 2024, 15, 692–718. [Google Scholar] [CrossRef] [Scilit]
- Morsi, N.A.; Hashem, O.S.; El-Hady, M.A.A.; Abd-Elkrem, Y.M.; El-Temsah, M.E.; Galal, E.G.; Gad, K.I.; Boudiar, R.; Silvar, C.; El-Hendawy, S. Assessing drought tolerance of newly developed tissue-cultured canola genotypes under varying irrigation regimes. Agronomy 2023, 13, 836. [Google Scholar] [CrossRef] [Scilit]
- Sagar, S.; Ramamoorthy, P.; Ramalingam, S.; Muthurajan, R.; Natarajan, S.; Doraiswamy, U.; Subramanian, S. Drought’s physiological footprint: Implications for crop improvement in rice. Mol. Biol. Rep. 2025, 52, 298. [Google Scholar] [CrossRef] [Scilit] [PubMed]
- Desoky, E.S.M.; Alharbi, K.; Rady, M.M.; Elnahal, A.S.; Selem, E.; Arnaout, S.M.; Mansour, E. Physiological, biochemical, anatomical, and agronomic responses of sesame to exogenously applied polyamines under different irrigation regimes. Agronomy 2023, 13, 875. [Google Scholar] [CrossRef] [Scilit]
- Mousa, A.M.; Ali, A.M.-G.; Omar, A.E.; Alharbi, K.; Abd El-Moneim, D.; Mansour, E.; Elmorsy, R.S. Physiological, agronomic, and grain quality responses of diverse rice genotypes to various irrigation regimes under aerobic cultivation conditions. Life 2024, 14, 370. [Google Scholar] [CrossRef] [Scilit] [PubMed]
- Hu, B.; Wang, W.; Chen, J.; Liu, Y.; Chu, C. Genetic improvement toward nitrogen-use efficiency in rice: Lessons and perspectives. Mol. Plant 2023, 16, 64–74. [Google Scholar] [CrossRef] [Scilit] [PubMed]
- Salem, T.; Rabie, H.; Mowafy, S.; Eissa, A.; Mansour, E. Combining ability and genetic components of Egyptian cotton for earliness, yield, and fiber quality traits. SABRAO J. Breed. Genet. 2020, 52, 369. [Google Scholar]
- Olajide, T.; Bello, O.; Afolabi, M.; Ige, S. Dissecting heterotic patterns and combining ability for grain yield and nutritional composition in extra-early quality protein maize hybrids. Plant Breed. 2026, 145, 283–297. [Google Scholar] [CrossRef] [Scilit]
- Ssempiira, J.B.; Sserumaga, J.P.; Obua, T.; Kiggundu, M.; Namazzi, C.; Galinya, H.; Ayesiga, S.B.; Ntwatwa, D.; Mwesigwa, R.; Matovu, M. Combining ability analysis and gene action underlying nutritional quality traits for silage from tropical maize germplasm. Euphytica 2026, 222, 58. [Google Scholar] [CrossRef] [Scilit]
- Kamara, M.M.; Rehan, M.; Mohamed, A.M.; El Mantawy, R.F.; Kheir, A.M.; Abd El-Moneim, D.; Safhi, F.A.; ALshamrani, S.M.; Hafez, E.M.; Behiry, S.I. Genetic potential and inheritance patterns of physiological, agronomic and quality traits in bread wheat under normal and water deficit conditions. Plants 2022, 11, 952. [Google Scholar] [CrossRef] [Scilit] [PubMed]
- Ahmed, K.; Ahmed, M.; Rasool, G.; Lashari, A. Dissecting genetic insights and combining abilities into growth and productivity of bread wheat under rainfed environments. Sci. Rep. 2026, 16, 21165. [Google Scholar] [CrossRef] [Scilit] [PubMed]
- Reddy, B.S.; Baskheti, D.C.; Pandey, I.D.; Chaudhary, D.; Ali, S.O.A.; Raish, M.; Ashraf, S. Harnessing genetic diversity and heterosis in basmati rice for biofortification and yield improvement. J. Crop Sci. Biotechnol. 2025, 28, 475–496. [Google Scholar] [CrossRef] [Scilit]
- Sultan, M.; Abdel-Moneam, M.; El-Mansy, Y.; El-Morshidy, H.S. Estimating of heterosis and combining ability for some Egyptian cotton genotypes using line x tester mating design. J. Plant Prod. 2018, 9, 1121–1127. [Google Scholar] [CrossRef] [Scilit]
- Anwar, G.M.; Mostafa, S.H.; Zayed, E.M.; Shamseldin, S.A.; Omar, A.E.; Safhi, F.A.; Al Aboud, N.M.; Abd El-Moneim, D.; Mansour, E. Assessing molecular and agronomic diversity in flax genotypes based on SCoT marker profiling, fibre yield contributing characters, and seed yield-related traits. Not. Bot. Horti Agrobot. Cluj-Napoca 2025, 53, 14381. [Google Scholar] [CrossRef] [Scilit]
- Verma, H.; Borah, J.; Sarma, R. Variability assessment for root and drought tolerance traits and genetic diversity analysis of rice germplasm using SSR markers. Sci. Rep. 2019, 9, 16513. [Google Scholar] [CrossRef] [Scilit] [PubMed]
- Galal, A.A.; Safhi, F.A.; Al Aboud, N.M.; Aljabri, M.; Kucher, D.E.; Kamara, M.M.; El-Mogy, M.M.; Ibrahim, O.M.; El-Moneim, D.A.; Hassanin, A.A. Molecular diversity and genetic potential of new maize inbred lines across varying sowing conditions in arid environment. Sci. Rep. 2025, 15, 2809. [Google Scholar] [CrossRef] [Scilit] [PubMed]
- Ezzat, M.; Alotaibi, N.; Soliman, S.; Sultan, M.; Kamara, M.; Abd El-Moneim, D. Molecular and agro-morphological diversity assessment of some bread wheat genotypes and their crosses for drought tolerance. PeerJ 2024, 12, e18104. [Google Scholar] [CrossRef] [Scilit] [PubMed]
- Kamara, M.M.; Mansour, E.; Khalaf, A.E.; Eid, M.A.; Hassanin, A.A.; Abdelghany, A.M.; Kheir, A.M.; Galal, A.A.; Behiry, S.I.; Silvar, C. Molecular diversity and combining ability in newly developed maize inbred lines under low-nitrogen conditions. Life 2024, 14, 641. [Google Scholar] [CrossRef] [Scilit] [PubMed]
- Angidi, S.; Madankar, K.; Tehseen, M.M.; Bhatla, A. Advanced high-throughput phenotyping techniques for managing abiotic stress in agricultural crops—A comprehensive review. Crops 2025, 5, 8. [Google Scholar] [CrossRef] [Scilit]
- Sakran, R.M.; Ghazy, M.I.; Rehan, M.; Alsohim, A.S.; Mansour, E. Molecular genetic diversity and combining ability for some physiological and agronomic traits in rice under well-watered and water-deficit conditions. Plants 2022, 11, 702. [Google Scholar] [CrossRef] [Scilit] [PubMed]
- Kamara, M.M.; Ghazy, N.A.; Mansour, E.; Elsharkawy, M.M.; Kheir, A.M.; Ibrahim, K.M. Molecular genetic diversity and line× tester analysis for resistance to late wilt disease and grain yield in maize. Agronomy 2021, 11, 898. [Google Scholar] [CrossRef] [Scilit]
- Galal, A.A.; Safhi, F.A.; El-Hity, M.A.; Kamara, M.M.; Gamal El-Din, E.M.; Rehan, M.; Farid, M.; Behiry, S.I.; El-Soda, M.; Mansour, E. Molecular genetic diversity of local and exotic durum wheat genotypes and their combining ability for agronomic traits under water deficit and well-watered conditions. Life 2023, 13, 2293. [Google Scholar] [CrossRef] [Scilit] [PubMed]
- Sakran, R.M.; Ghazy, M.I.; Gaballah, M.M.; Hussein, F.A.; Aamer, S.M.; Ghazy, H.A.; Lamlom, S.F.; Abdelghany, A.M. Genetic variability in physiological and agronomic traits of newly developed rice lines under well-watered and water-deficit conditions. BMC Plant Biol. 2025, 25, 1291. [Google Scholar] [CrossRef] [Scilit] [PubMed]
- Gaballah, M.M.; Ghoneim, A.M.; Rehman, H.U.; Shehab, M.M.; Ghazy, M.I.; El-Iraqi, A.S.; Mohamed, A.E.; Waqas, M.; Shamsudin, N.A.A.; Chen, Y. Evaluation of morpho-physiological traits in rice genotypes for adaptation under irrigated and water-limited environments. Agronomy 2022, 12, 1868. [Google Scholar] [CrossRef] [Scilit]
- Abdelsalam, K.M.; Shaalan, A.M.; AbouEl-Soud, G.M.; El-Dalil, M.A.; Marei, A.M.; El-Moneim, D.A.; El-Banna, A.A.; Lamlom, S.F.; Abdelghany, A.M. Comprehensive quality profiling and multivariate analysis of rice (Oryza sativa L.) cultivars: Integrating physical, cooking, nutritional, and micronutrient characteristics for enhanced varietal selection. BMC Plant Biol. 2025, 25, 492. [Google Scholar] [CrossRef] [Scilit] [PubMed]
- Doyle, J.J. A rapid total DNA preparation procedure for fresh plant tissue. Focus 1990, 12, 13–15. [Google Scholar]
- Botstein, D.; White, R.L.; Skolnick, M.; Davis, R.W. Construction of a genetic linkage map in man using restriction fragment length polymorphisms. Am. J. Hum. Genet. 1980, 32, 314. [Google Scholar] [PubMed]
- Butany, W.T. Mass emasculation in rice. Rice News Teller 1961, 9, 9–13. [Google Scholar]
- De Datta, S.K.; Malabuyoc, J.A.; Aragon, E.L. A field screening technique for evaluating rice germplasm for drought tolerance during the vegetative stage. Field Crops Res. 1988, 19, 123–134. [Google Scholar] [CrossRef] [Scilit]
- Barrs, H.D.; Weatherley, P.E. A re-examination of the relative turgidity technique for estimating water deficits in leaves. Aust. J. Biol. Sci. 1962, 15, 413–428. [Google Scholar] [CrossRef] [Scilit]
- Yoshida, S.; Hara, T. Effects of air temperature and light on grain filling of an indica and a japonica rice (Oryza sativa L.) under controlled environmental conditions. Soil Sci. Plant Nutr. 1977, 23, 93–107. [Google Scholar] [CrossRef] [Scilit]
- Yoshida, S. Fundamentals of Rice Crop Science; International Rice Research Institute: Los Baños, Philippines, 1981; p. 269. [Google Scholar]
- Rosielle, A.A.; Hamblin, J. Theoretical aspects of selection for yield in stress and non-stress environment 1. Crop Sci. 1981, 21, 943–946. [Google Scholar] [CrossRef] [Scilit]
- Fernandez, G.C.J. Effective selection criteria for assessing plant stress tolerance. In Proceedings of the International Symposium on Adaptation of Vegetables and Other Food Crops in Temperature and Water Stress, Shanhua, Taiwan, 13–16 August 1992; pp. 257–270. [Google Scholar]
- Bidinger, F.; Mahalakshmi, V.; Rao, G.D.P. Assessment of drought resistance in pearl millet (Pennisetum americanum L.) Leeke). II. Estimation of genotype response to stress. Aust. J. Agric. Res. 1987, 38, 49–59. [Google Scholar] [CrossRef] [Scilit]
- Gavuzzi, P.; Rizza, F.; Palumbo, M.; Campanile, R.G.; Ricciardi, G.L.; Borghi, B. Evaluation of field and laboratory predictors of drought and heat tolerance in winter cereals. Can. J. Plant Sci. 1997, 77, 523–531. [Google Scholar] [CrossRef] [Scilit]
- Fischer, R.; Maurer, R. Drought resistance in spring wheat cultivars. I. Grain yield responses. Aust. J. Agric. Res. 1978, 29, 897–912. [Google Scholar] [CrossRef] [Scilit]
- Bouslama, M.; Schapaugh, W., Jr. Stress tolerance in soybeans. I. Evaluation of three screening techniques for heat and drought tolerance 1. Crop Sci. 1984, 24, 933–937. [Google Scholar] [CrossRef] [Scilit]
- Kempthorne, O. An Introduction to Genetic Statistics; John Wiley & Sons: Hoboken, NJ, USA, 1957. [Google Scholar]
- Tseng, F.-Y.; Chang, M.-H.; Jian, J.-Y.; Tsai, Y.-C. Physiological and molecular characterization of the drought tolerance-related QTL qDTY12. 1 in Japonica rice. Rice 2026, 19, 1. [Google Scholar] [CrossRef] [Scilit] [PubMed]
- Seelam, R.T.; Puram, V.R.R.; Nallamothu, V.; Injeti, S.K.; Madhunapantula, V.P. Unlocking the potential of rice for thermotolerance using simple sequence repeat (SSR) marker-based assessment of genetic variability and population structure. Genet. Resour. Crop Evol. 2025, 72, 947–963. [Google Scholar] [CrossRef] [Scilit]
- Balakrishnan, C.; Kumar, A.; Raj, R.; Verma, V.K.; Touthang, L.; Kumar, R.; Rai, M.; Das, S.P.; Mishra, V.K. Exploring genetic diversity, population structure and stability for yield related traits in rice germplasm of northeastern India. Genet. Resour. Crop Evol. 2025, 72, 2631–2651. [Google Scholar] [CrossRef] [Scilit]
- Shamsuddoha, M.; Siddika, A.; Kamal, A.S.M.M.; Mohiuddin, S.J.; Rashid, M.-O.; Latif, M.A.; Haque, M.A. Combining ability and molecular marker approach for developing early maturing high yielding hybrid rice. Sci. Rep. 2026, 16, 18259. [Google Scholar] [CrossRef] [Scilit] [PubMed]
- Mukta, S.; Bappy, M.N.I.; Bhuiyan, J.; Zohora, F.T.; Afrin, D. Assessment of genetic diversity in Bangladeshi rice (Oryza sativa L.) varieties utilizing SSR markers. Gene Rep. 2024, 37, 102051. [Google Scholar] [CrossRef] [Scilit]
- Salem, K.F.M.; Safhi, F.A.; Alwutayd, K.M.; Abozahra, M.S.; Almohisen, I.A.A.; Alsharari, S.F.; Gangwar, P.; Rady, A.M.S.; Hendawy, M.F.A.; Ibrahim, A.A. Analysis of genetic diversity, population structure and phylogenetic relationships of rice (Oryza sativa L.) cultivars using simple sequence repeat (SSR) markers. Genet. Resour. Crop Evol. 2024, 71, 2213–2227. [Google Scholar] [CrossRef] [Scilit]
- Saha, S.; Rashid, M.M.; Khatun, R.; Sams-Al Safin, M.; Jui, S.; Turin, M.T.S.; Arifuzzaman, M. Genetic diversity and identification of blast resistance genes through SSR markers in Bangladeshi aromatic rice (Oryza sativa L.) landraces. Ecol. Genet. Genom. 2026, 39, 100481. [Google Scholar] [CrossRef] [Scilit]
- Xia, H.; Luo, Z.; Xiong, J.; Ma, X.; Lou, Q.; Wei, H.; Qiu, J.; Yang, H.; Liu, G.; Fan, L. Bi-directional selection in upland rice leads to its adaptive differentiation from lowland rice in drought resistance and productivity. Mol. Plant 2019, 12, 170–184. [Google Scholar] [CrossRef] [Scilit] [PubMed]
- Zhang, K.; Han, X.; Fu, Y.; Khan, Z.; Zhang, B.; Bi, J.; Hu, L.; Luo, L. Biochar coating promoted rice growth under drought stress through modulating photosynthetic apparatus, chloroplast ultrastructure, stomatal traits and ROS homeostasis. Plant Physiol. Biochem. 2024, 216, 109145. [Google Scholar] [CrossRef] [Scilit] [PubMed]
- Bilge, U.; Dogan, S.; Eren, A.; Habib, Y.; Faizan, M. Mechanistic insights on physiological, biochemical, and metabolite profiling of Oryza sativa grown under drought stress: A strategic coping mechanism of silicon oxide nanoparticles treatment. J. Plant Growth Regul. 2025, 45, 6504–6522. [Google Scholar] [CrossRef] [Scilit]
- Wang, X.; Huang, J.; Peng, S.; Xiong, D. Leaf rolling precedes stomatal closure in rice (Oryza sativa) under drought conditions. J. Exp. Bot. 2023, 74, 6650–6661. [Google Scholar] [CrossRef] [Scilit] [PubMed]
- Vennam, R.R.; Chandel, A.K.; Haak, D.C.; Oakes, J.; Balota, M. Leaf wilting as a phenotypic indicator of heat and drought stress in crops: An overview of physiological mechanisms and machine learning applications. Discov. Agric. 2026, 4, 32. [Google Scholar] [CrossRef] [Scilit]
- Sabouri, A.; Dadras, A.R.; Azari, M.; Saberi Kouchesfahani, A.; Taslimi, M.; Jalalifar, R. Screening of rice drought-tolerant lines by introducing a new composite selection index and competitive with multivariate methods. Sci. Rep. 2022, 12, 2163. [Google Scholar] [CrossRef] [Scilit] [PubMed]
- Hallajian, M.T.; Ebadi, A.A.; Kordrostami, M. Advancing rice breeding for drought tolerance: A comprehensive study of traditional and mutant lines through agronomic performance and drought tolerance indices. BMC Plant Biol. 2024, 24, 1087. [Google Scholar] [CrossRef] [Scilit] [PubMed]
- Tushar, M.; Kumaresan, D.; Manonmani, S.; Suresh, R.; Manikanda, N.; Sritharan, N. Multi-trait selection indices for identifying elite rice genotypes in rice breeding programs. Plant Sci. Today 2025, 12, 1–14. [Google Scholar] [CrossRef] [Scilit]
- Abd-El-Aty, M.S.; Abo-Youssef, M.I.; Bahgt, M.M.; Ibrahim, O.M.; Faltakh, H.; Nouri, H.; Korany, S.M.; Alsherif, E.A.; AbdElgawad, H.; El-Tahan, A.M. Mode of gene action and heterosis for physiological, biochemical, and agronomic traits in some diverse rice genotypes under normal and drought conditions. Front. Plant Sci. 2023, 14, 1108977. [Google Scholar] [CrossRef] [Scilit] [PubMed]
- Bayoumi, A.-E.T.; El-Badawy, M.; El-Hosary, A.; Abo Yousef, M. Genetic effects and combining ability for agronomic and yield traits clustered with biochemical profiling of rice (Oryza sativa L.) under optimal and water deficit conditions. Ann. Agric. Sci. Moshtohor 2025, 63, 32–49. [Google Scholar] [CrossRef] [Scilit]
- ElSherbiny, H.A.; Negm, M.E.; Hamad, H.S.; Abo-Marzoka, E.A.; El-Sharnobi, D.E.; Bassuony, N.N.; ElKholy, N.K.; Safhi, F.A.; Alshaya, D.S.; Al Aboud, N.M. Dissecting genetic variability and character associations of physiological, biochemical, agronomic, and yield traits in rice genotypes under salinity stress. Plant Soil Environ. 2026, 72, 102–121. [Google Scholar] [CrossRef] [Scilit]
- Hassan, H.M.; Hadifa, A.A.; El-Leithy, S.A.; Batool, M.; Sherif, A.; Al-Ashkar, I.; Ueda, A.; Rahman, M.A.; Hossain, M.A.; Elsabagh, A. Variable level of genetic dominance controls important agronomic traits in rice populations under water deficit condition. PeerJ 2023, 11, e14833. [Google Scholar] [CrossRef] [Scilit] [PubMed]
- Modarresi, M. Genetic variability, heritability and genetic advance in Iranian local rice genotypes for yield, and some agronomic traits. Reprod. Breed. 2026, 6, 9–20. [Google Scholar] [CrossRef] [Scilit]
- Faysal, A.S.M.; Ali, L.; Azam, M.G.; Sarker, U.; Ercisli, S.; Golokhvast, K.S.; Marc, R.A. Genetic variability, character association, and path coefficient analysis in transplant Aman rice genotypes. Plants 2022, 11, 2952. [Google Scholar] [CrossRef] [Scilit] [PubMed]
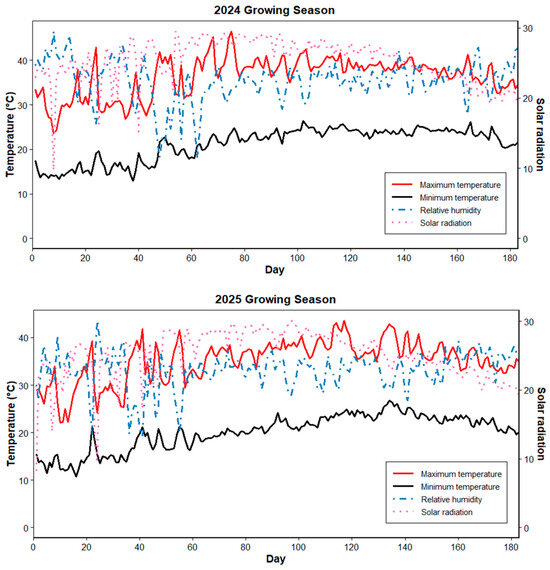
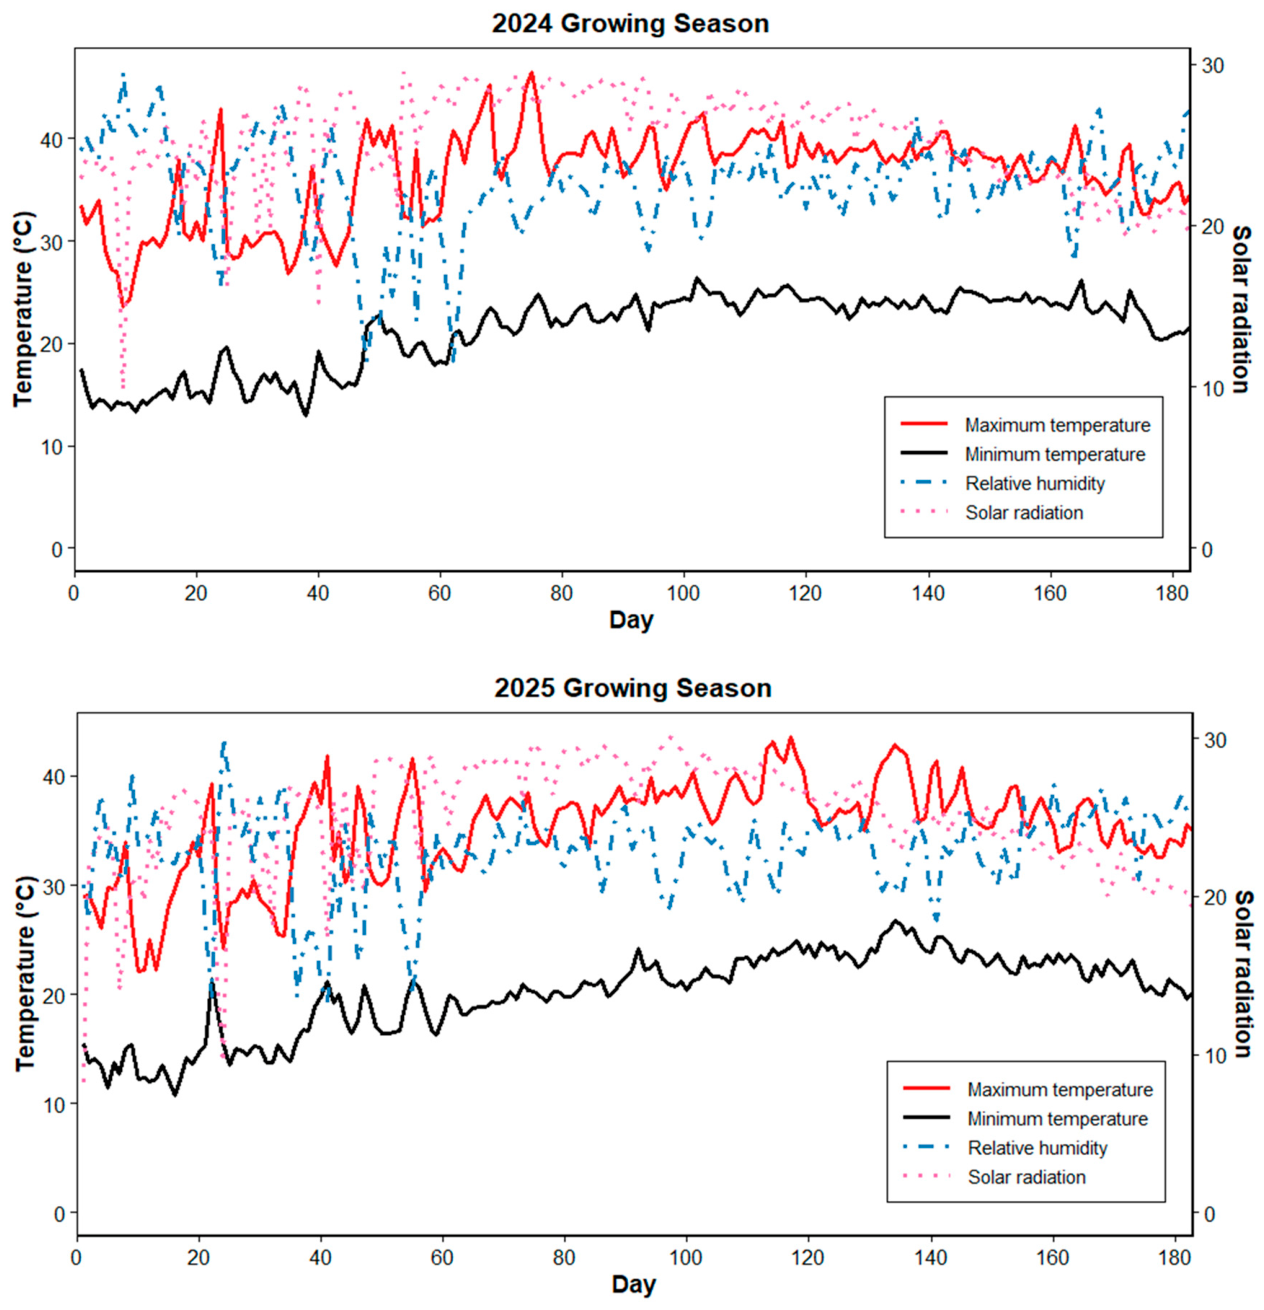
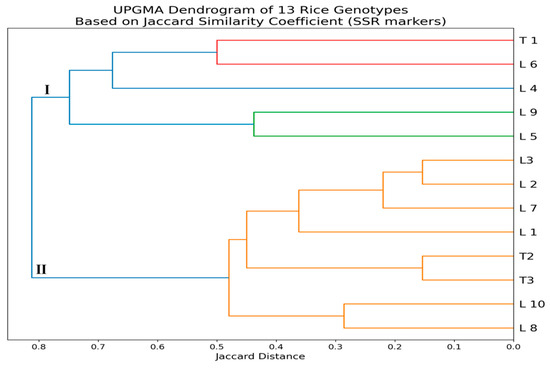
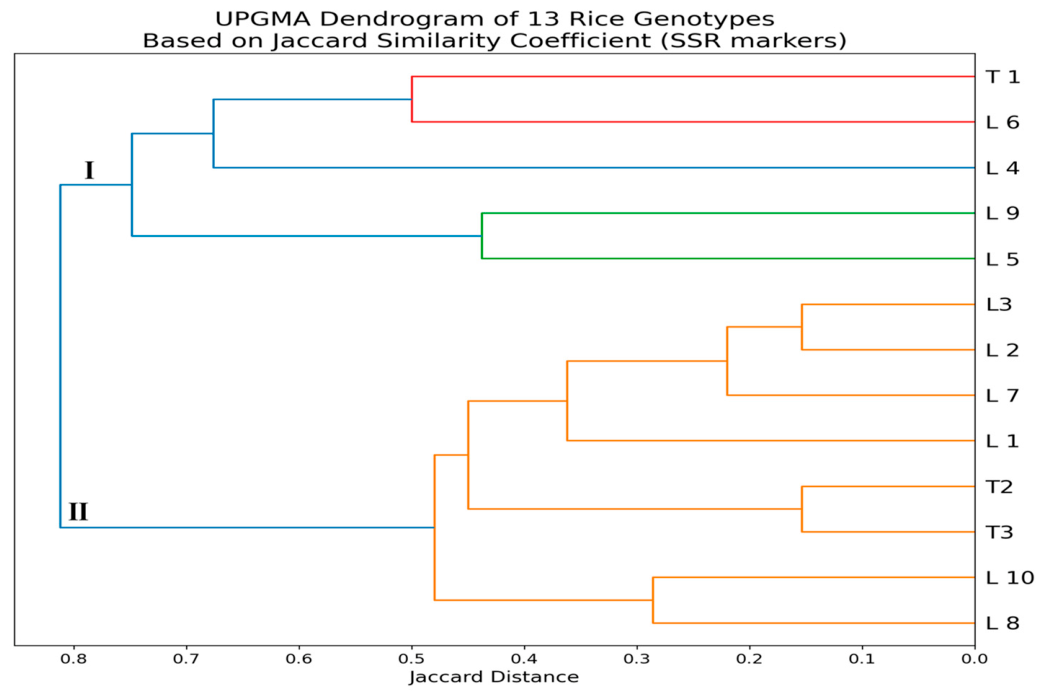
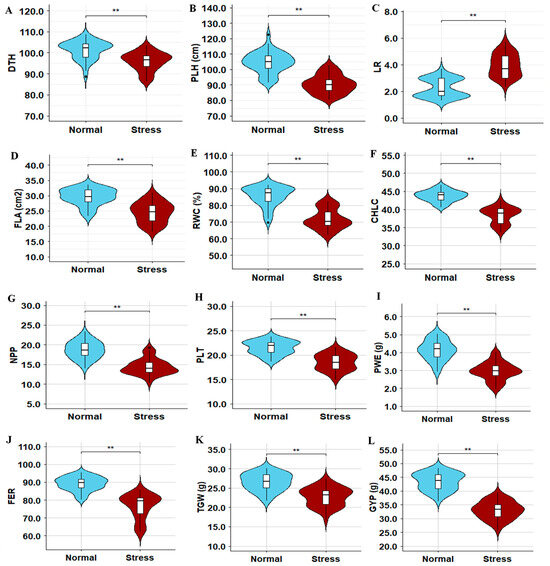
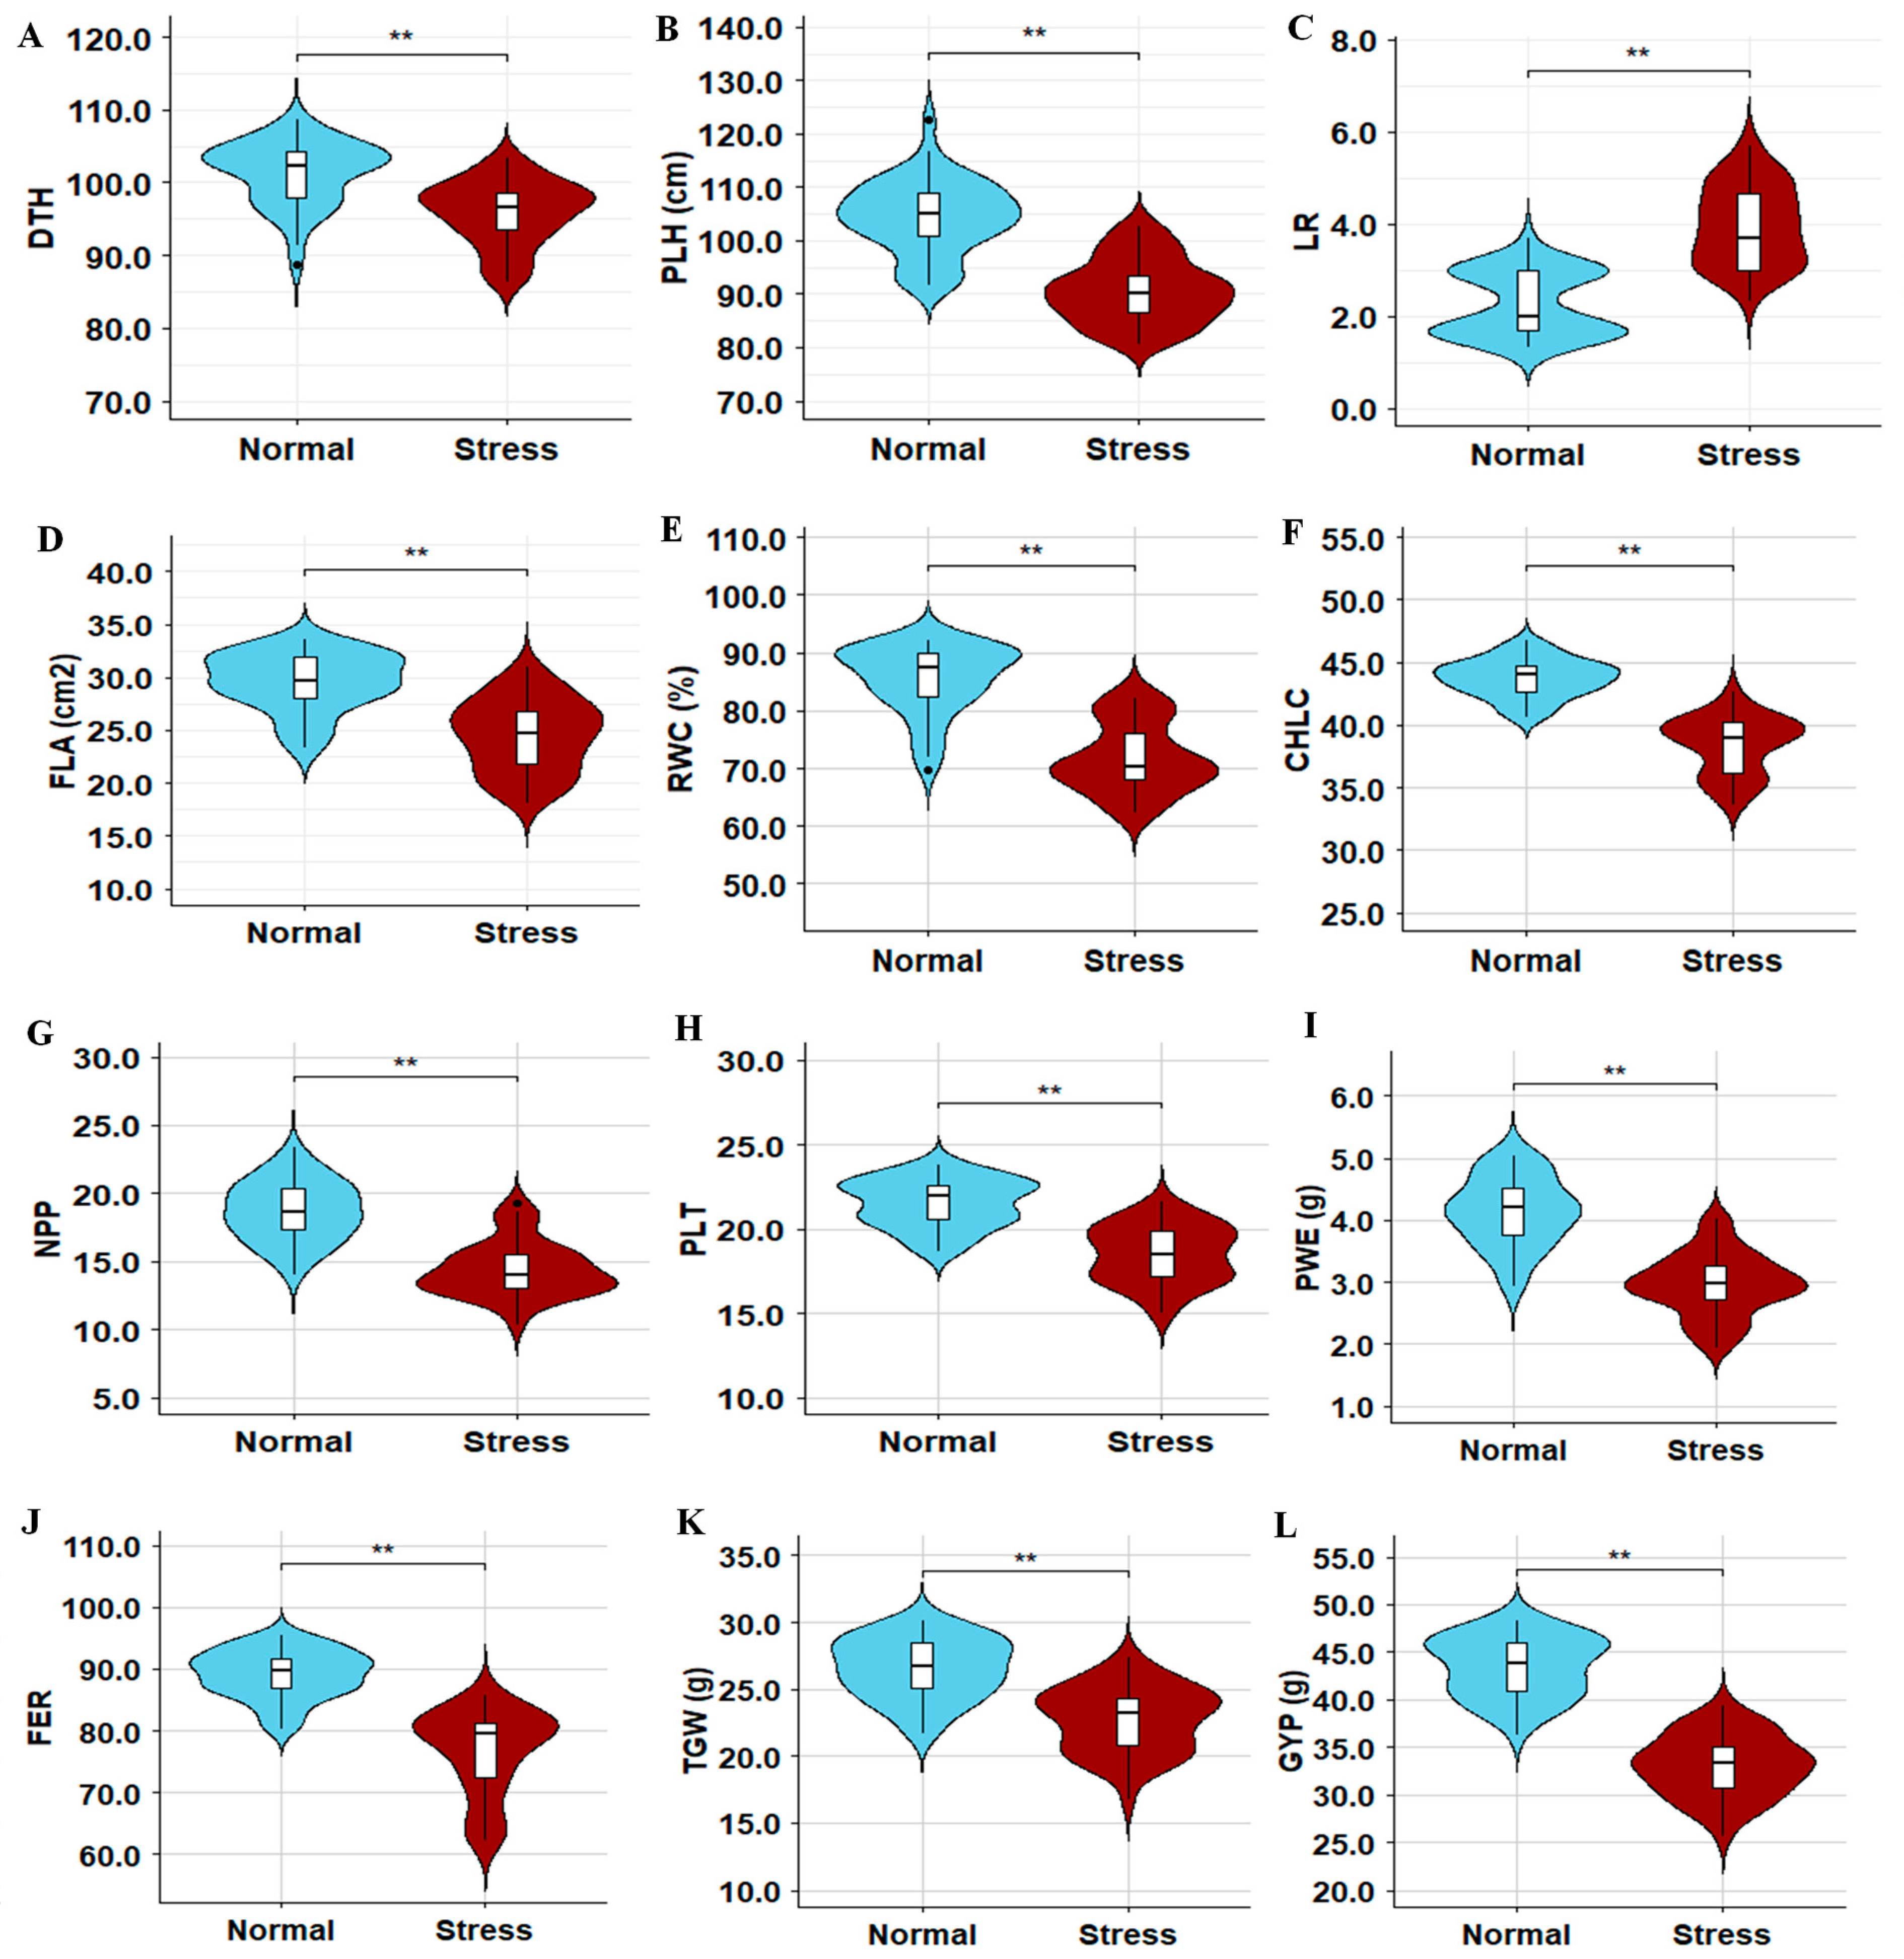
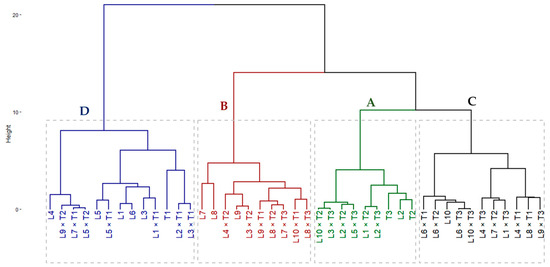
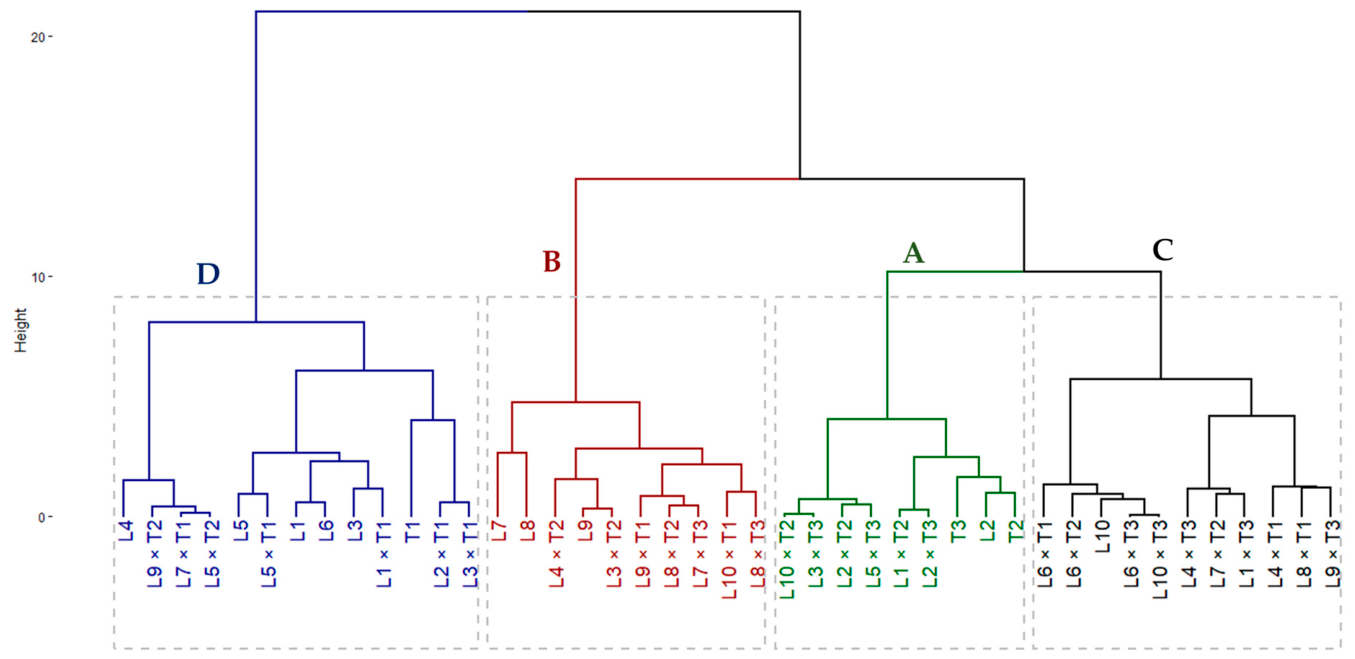
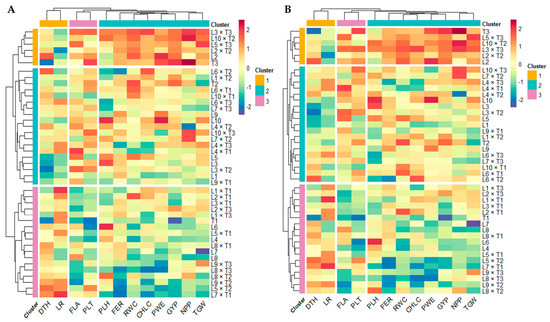
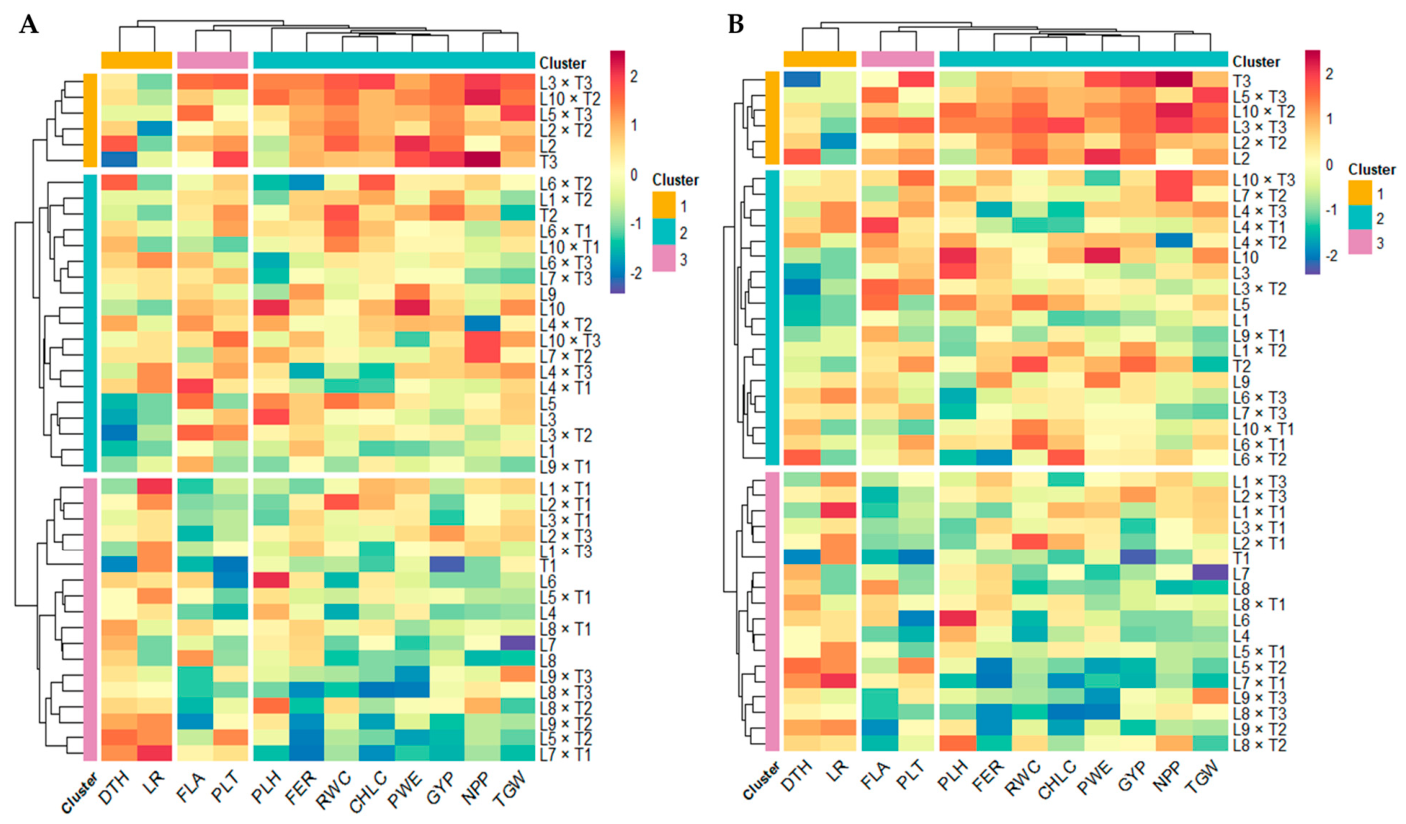
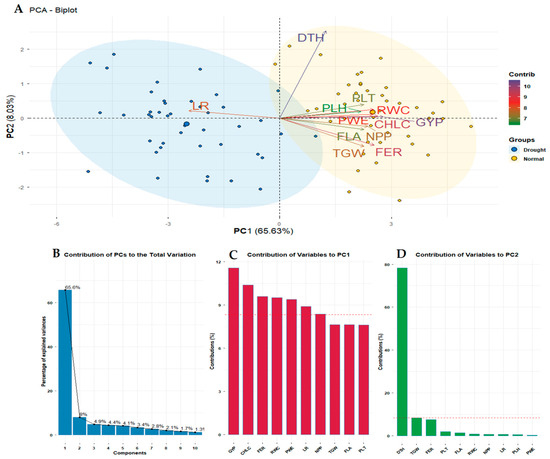
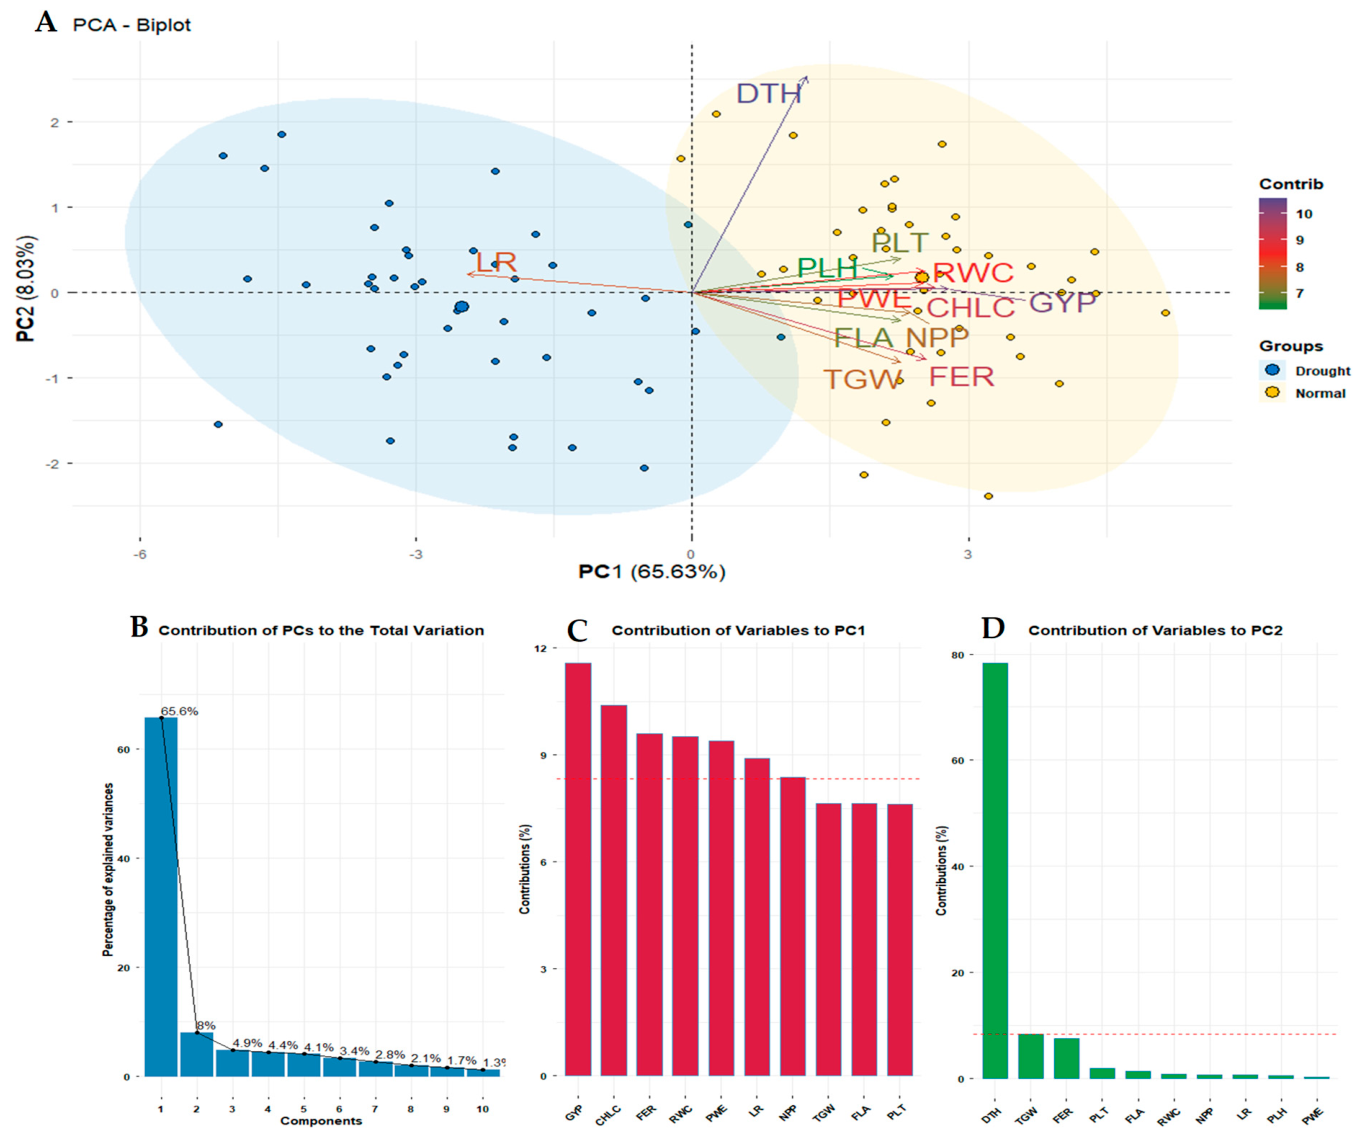
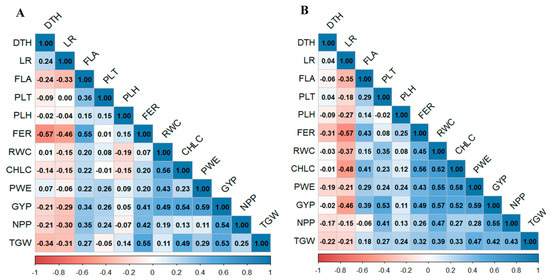
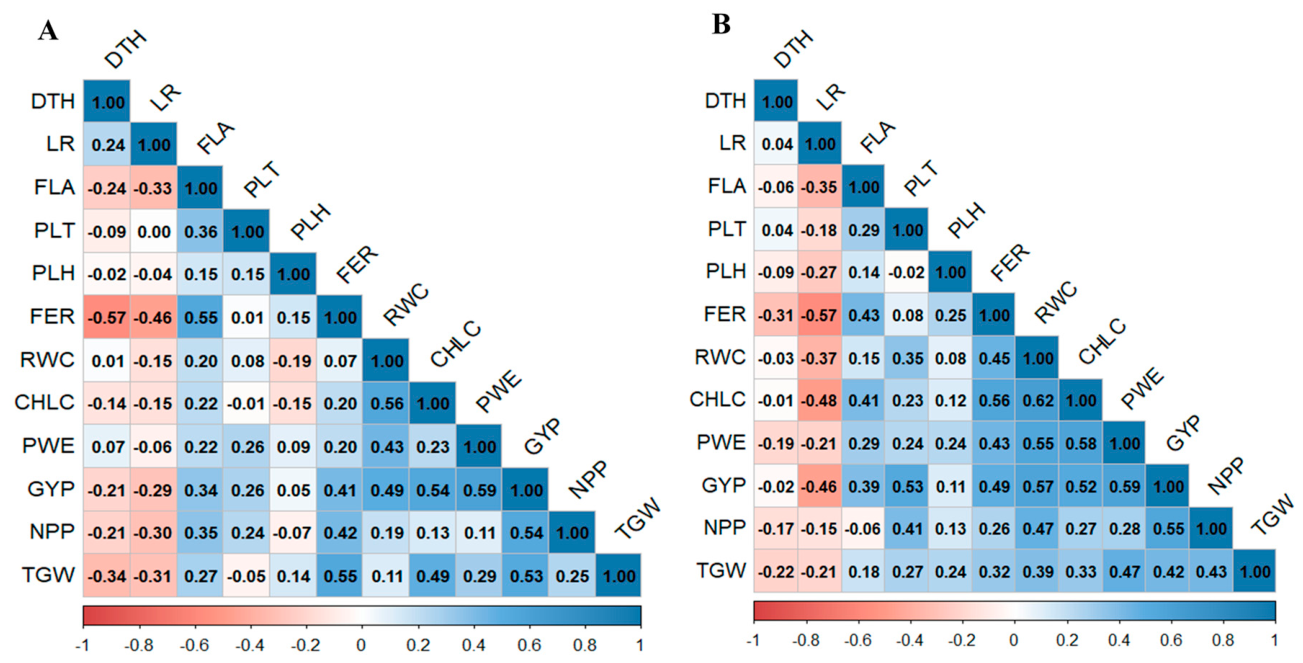

Disclaimer/Publisher’s Note: The statements, opinions and data contained in all publications are solely those of the individual author(s) and contributor(s) and not of MDPI and/or the editor(s). MDPI and/or the editor(s) disclaim responsibility for any injury to people or property resulting from any ideas, methods, instructions or products referred to in the content. |
© 2026 by the authors. Licensee MDPI, Basel, Switzerland. This article is an open access article distributed under the terms and conditions of the Creative Commons Attribution (CC BY) license.