


Abstract
Background: The Prognostic Nutritional Index (PNI), derived from serum albumin and peripheral lymphocyte count, may reflect immunonutritional status in patients with community-acquired pneumonia (CAP). This study evaluated the association between admission PNI and 30-day mortality and compared its discriminatory performance with the Pneumonia Severity Index (PSI) and CURB-65. Methods: This retrospective single-center cohort included 214 adults hospitalized with CAP between January 2025 and June 2026. Demographic, clinical, and laboratory data obtained at admission were analyzed. Thirty-day all-cause mortality was the primary outcome. Receiver operating characteristic analysis and multivariable logistic regression were performed. Results: Thirty-day mortality occurred in 61 patients (28.5%). PNI was significantly lower in non-survivors than survivors (34.5 ± 5.6 vs. 39.1 ± 6.4; p < 0.001). PNI showed moderate discrimination for 30-day mortality (AUC 0.713, 95% CI 0.637–0.789), with a numerically higher AUC than PSI (0.656) and CURB-65 (0.670); however, pairwise differences were not statistically significant. A cohort-derived exploratory PNI cutoff of ≤36.6 yielded 70.5% sensitivity and 67.3% specificity. In multivariable analysis, continuous PNI remained independently associated with mortality (OR 0.869 per one-unit increase, 95% CI 0.814–0.927; p < 0.001). Adding PNI significantly improved discrimination compared with PSI alone (AUC 0.740 vs. 0.656; p = 0.034) and CURB-65 alone (AUC 0.771 vs. 0.670; p = 0.001). Conclusions: Lower admission PNI was independently associated with 30-day mortality and demonstrated moderate discrimination in hospitalized patients with CAP. Although PNI alone did not significantly outperform PSI or CURB-65, adding PNI significantly improved the discriminatory performance of both established severity scores, supporting its potential incremental prognostic value.
1. Introduction
Community-acquired pneumonia (CAP) is a common infectious disease that accounts for a substantial burden of morbidity and mortality among adults and is characterized by a wide spectrum of clinical severity. Accurate identification of patients at high risk of adverse outcomes at the time of hospital presentation is critical for determining the appropriate level of care, treatment intensity, and clinical monitoring. This need has prompted the development of objective and reproducible prognostic models for CAP. The Pneumonia Severity Index (PSI), developed by Fine et al. [1], was designed to stratify adults with CAP into five risk classes according to their risk of 30-day mortality and has been validated in independent patient cohorts.
PSI is a comprehensive prognostic model that incorporates demographic characteristics, comorbidities, physical examination findings, and laboratory and radiographic variables [1]. In contrast, Lim et al. [2] developed the CURB-65 score using a limited number of readily available variables at the initial hospital assessment, including confusion, blood urea, respiratory rate, blood pressure, and age ≥ 65 years. Increasing scores are associated with progressively higher 30-day mortality risk [2]. Although the prognostic value of both scores has been validated across different CAP cohorts, Bradley et al. [3] reported that their ability to discriminate mortality may vary according to the clinical setting and patient population. These findings have increased interest in readily available biomarkers that may provide prognostic information reflecting the host response to infection. Indeed, a recent intensive care unit cohort of patients with CAP demonstrated that assessment of the fibrinogen-to-albumin ratio, in conjunction with established clinical scores may improve prognostic discrimination [4].
Systemic inflammation and immune dysfunction are important biological processes associated with the clinical course of CAP, and indices derived from routine peripheral blood parameters have been investigated as indirect markers of the host response. Alterations in hematologic indices, such as the neutrophil-to-lymphocyte ratio (NLR), platelet-to-lymphocyte ratio, and monocyte-to-lymphocyte ratio, have been reported in patients with CAP; in particular, NLR has been shown to be associated with C-reactive protein (CRP), procalcitonin, length of hospital stay, and PSI [5]. The Prognostic Nutritional Index (PNI) combines serum albumin and peripheral lymphocyte count into a single composite measure and can be readily calculated from routinely available laboratory data [6,7]. However, in the setting of acute infection, serum albumin is influenced not only by nutritional status but also by systemic inflammation, capillary leakage, hydration status, hepatic synthesis, and underlying illness. Therefore, in patients with CAP, PNI may be more appropriately interpreted as an immunonutritional composite marker reflecting overlapping nutritional, inflammatory, and immune-related processes rather than as a direct measure of nutritional status alone.
Evidence supporting an association between lower PNI and adverse outcomes in pneumonia has expanded in recent years. De Rose et al. [6] demonstrated that a low PNI was independently associated with mortality in patients with community-acquired bacterial pneumonia. Wang et al. [7] similarly reported an inverse association between PNI and mortality among patients with CAP admitted to the intensive care unit and found that PNI demonstrated greater discriminatory performance than CURB-65 in their cohort. More recently, Ding et al. [8], in a multicenter retrospective cohort of 635 hospitalized patients with pneumonia, reported that increasing PNI was independently associated with lower 30-day and 90-day mortality and observed an AUC of approximately 0.70 for 30-day mortality. Collectively, these findings indicate that the association between PNI and mortality in pneumonia is increasingly established across different clinical settings.
Accordingly, the principal contribution of the present study is not simply to determine whether lower PNI is associated with mortality, but to evaluate PNI within the same hospitalized CAP cohort and against the same 30-day outcome as PSI and CURB-65. This design enables both formal comparison of discriminatory performance and assessment of whether PNI provides additional prognostic information when incorporated with established pneumonia severity scores.
This study aimed to evaluate the association between admission PNI and 30-day all-cause mortality in adults hospitalized with CAP, formally compare its discriminatory performance with PSI and CURB-65, and assess the incremental prognostic contribution of PNI when added to these established severity scores. We hypothesized that lower PNI values would be associated with higher 30-day mortality.
2. Materials and Methods
2.1. Study Design and Patient Population
This single-center, retrospective observational cohort study included adult patients hospitalized with a diagnosis of CAP at Recep Tayyip Erdogan University Faculty of Medicine Training and Research Hospital between 1 January 2025, and 30 June 2026. Consecutive adult patients aged ≥18 years who were hospitalized with CAP during the study period were screened for inclusion, and their electronic medical records were retrospectively reviewed.
2.2. Definition of Cap and Patient Selection
CAP was defined as the presence of a newly developed pulmonary infiltrate on chest radiography or chest computed tomography, together with at least one of the following clinical or laboratory findings: new-onset cough, sputum production, or dyspnea; a peripheral white blood cell count of >10 × 103/µL or <4 × 10³/µL; or a body temperature of >38.0 °C [9,10].
Patients were eligible for inclusion if they met the diagnostic criteria, were aged ≥18 years, had sufficient clinical and laboratory data to evaluate the PSI, CURB-65, and PNI at presentation, and had available 30-day follow-up data from the time of presentation. Patients with missing clinical or laboratory data, those receiving immunosuppressive therapy, pregnant patients, and those diagnosed with hospital-acquired pneumonia were excluded from the study.
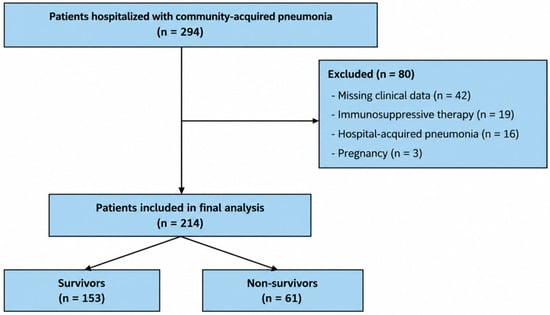
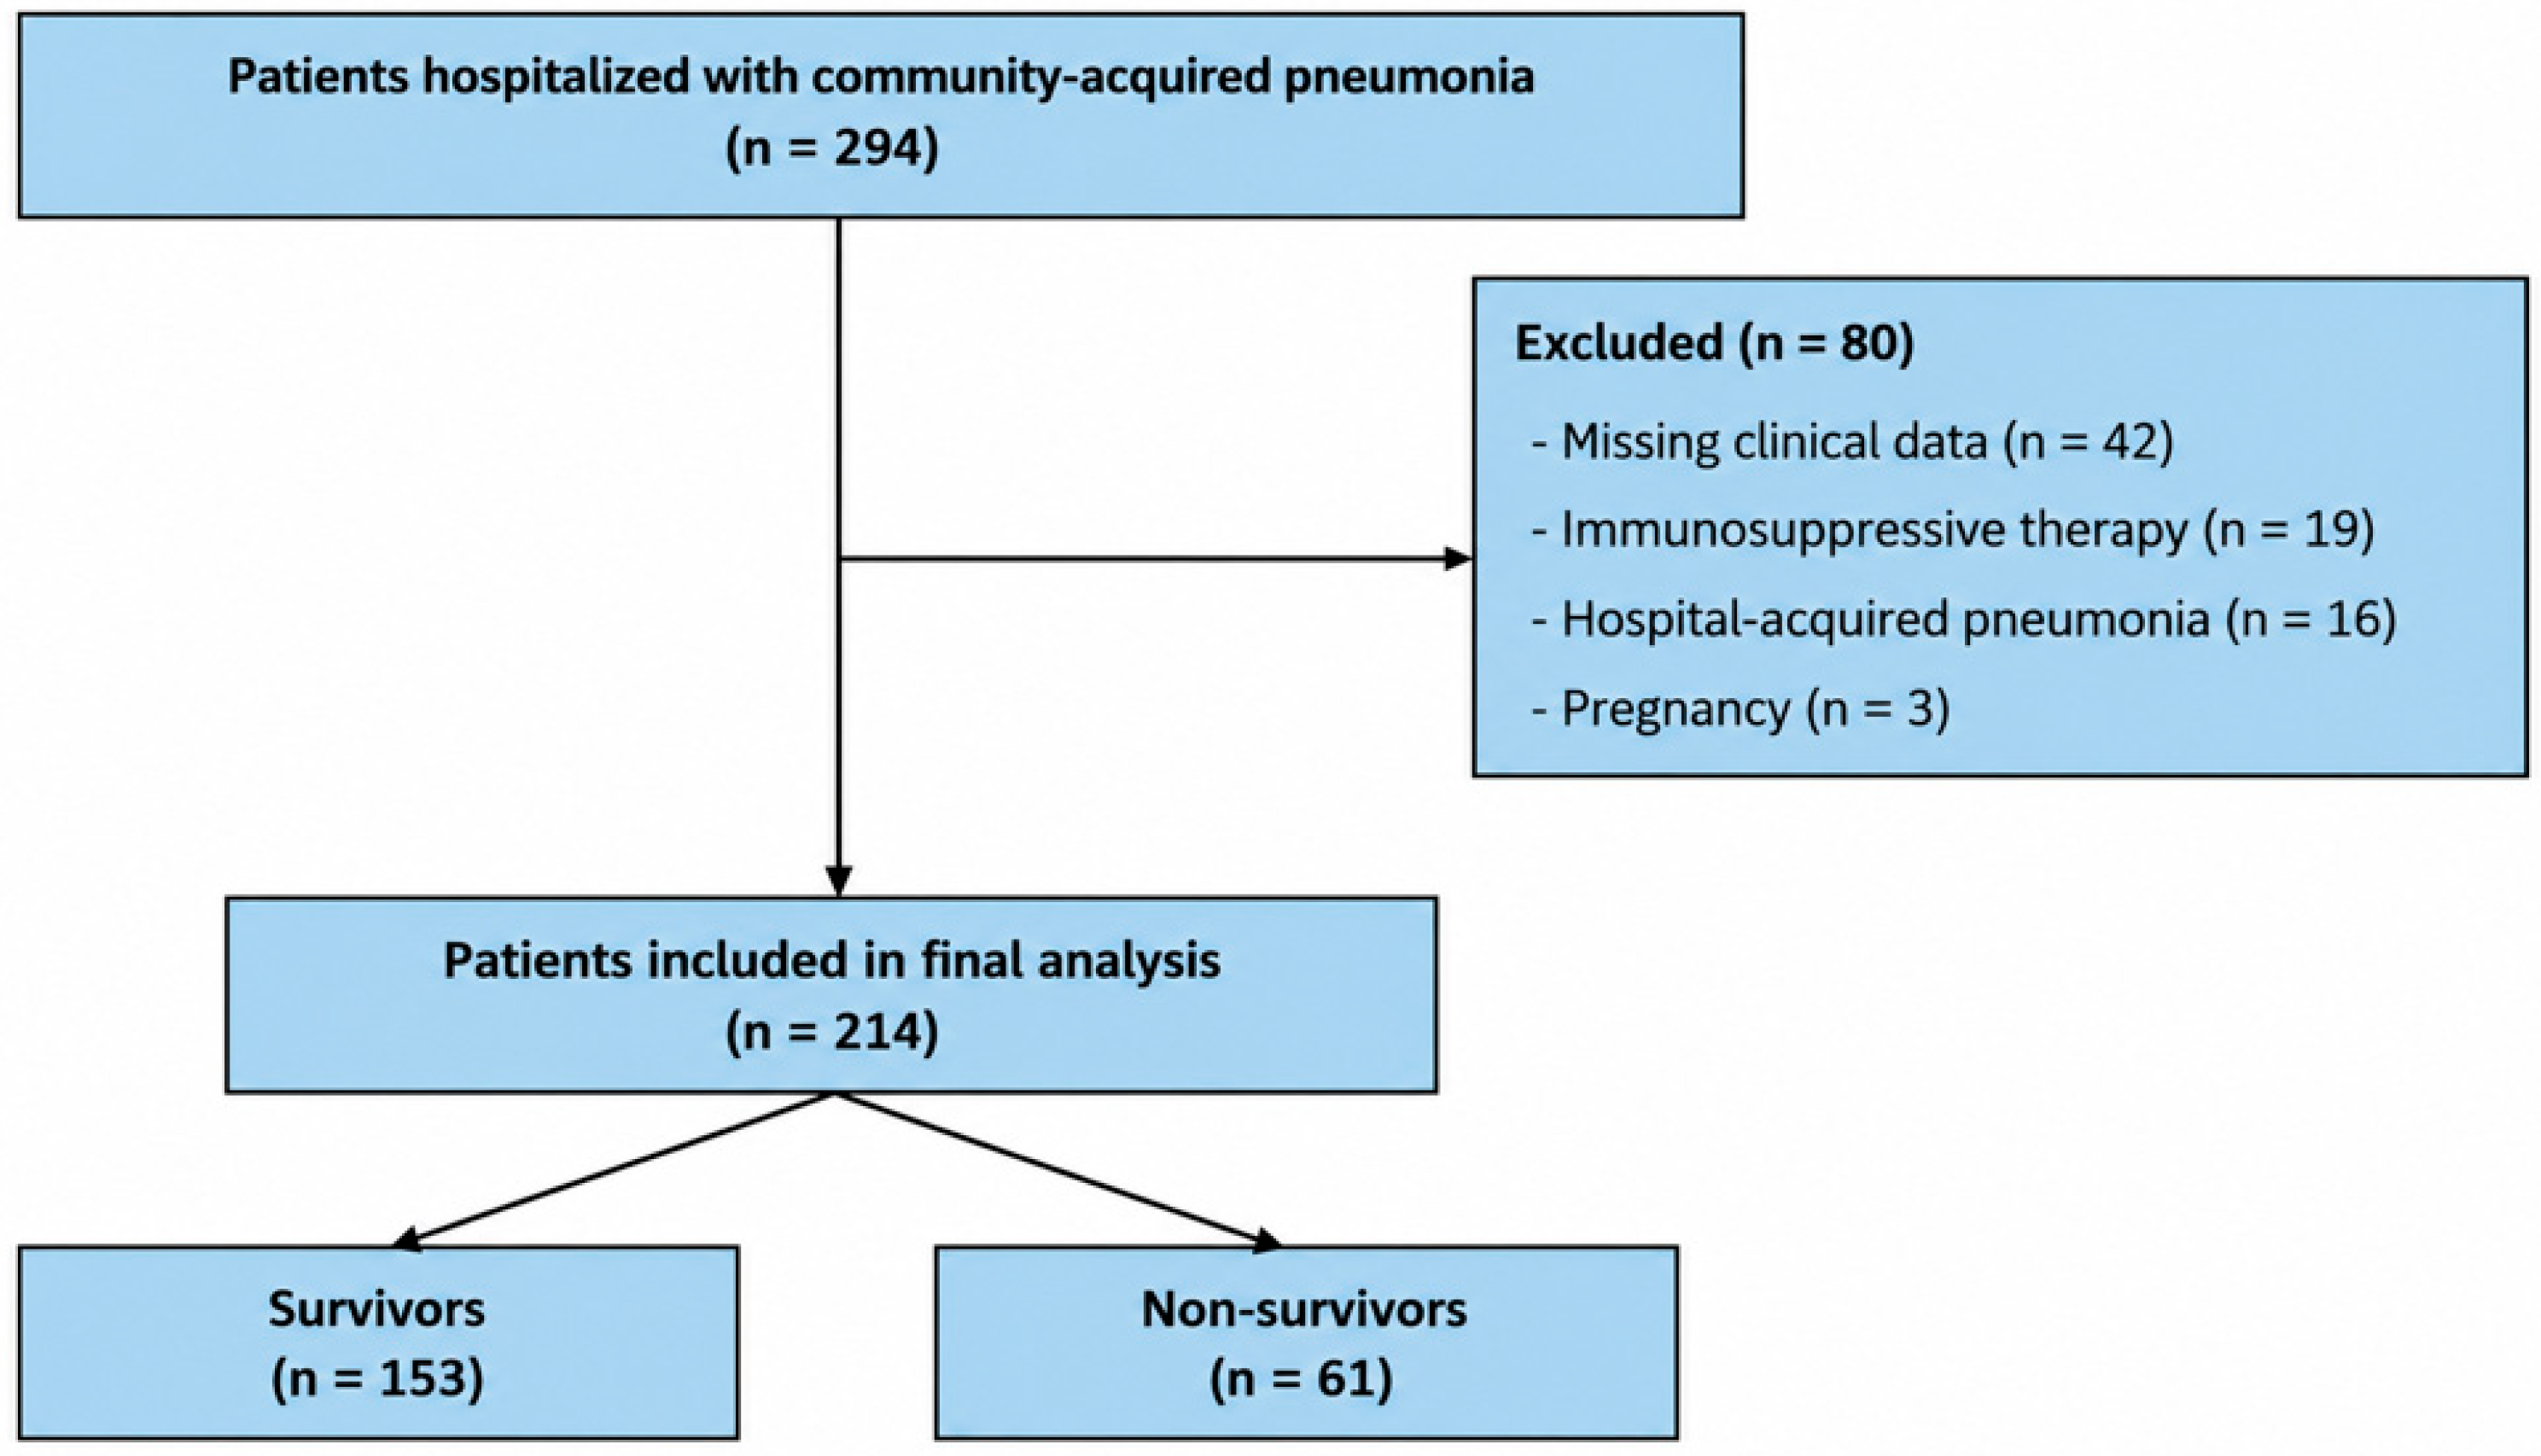
During the study period, 294 potentially eligible patients were screened. A total of 80 patients were excluded because of incomplete clinical or laboratory data (n = 42), immunosuppressive therapy (n = 19), hospital-acquired pneumonia (n = 16), or pregnancy (n = 3). The 42 patients excluded because of missing data had incomplete information in the hospital information system, mainly involving albumin, complete blood count/lymphocyte measurements, CRP, and/or PSI or CURB-65 records, which prevented complete assessment of the principal study variables. No patient was excluded because of unavailable 30-day mortality status.
In the final cohort of 214 patients, PNI, PSI, CURB-65, and 30-day vital status were available for all patients. Some ancillary laboratory and arterial blood gas variables were not available in every patient because these tests were not uniformly obtained in routine clinical care; analyses involving these variables were based on the available observations.
2.3. Collection of Clinical and Laboratory Data
Demographic characteristics, smoking status, vital signs at presentation, comorbidities, and length of hospital stay were obtained from electronic medical records. Admission to the intensive care unit (ICU) during hospitalization was also recorded as an indicator of the level of care required. The recorded comorbidities included hypertension, diabetes mellitus, coronary artery disease, congestive heart failure, chronic obstructive pulmonary disease, dementia, cancer, cerebrovascular disease, atrial fibrillation, and chronic kidney disease. Cancer was defined as the presence of a malignancy diagnosis recorded in the hospital information system.
Systolic and diastolic blood pressure, heart rate, respiratory rate, and body temperature measured at presentation were recorded. Hematologic parameters included hemoglobin, leukocyte, neutrophil, lymphocyte, and platelet counts and red cell distribution width (RDW). Biochemical parameters included creatinine, urea, CRP, total protein, albumin, alanine aminotransferase, aspartate aminotransferase, lactate dehydrogenase, sodium, potassium, and troponin levels. Arterial blood gas measurements included pH, partial pressure of carbon dioxide, partial pressure of oxygen, oxygen saturation, and lactate levels.
For all prognostic assessments, the first clinical and laboratory measurements obtained at hospital presentation were used.
2.4. Calculation of Pneumonia Severity Scores
Pneumonia severity at hospital presentation was assessed using the PSI and CURB-65.
PSI scores recorded in the hospital information system during the index hospitalization were retrieved for the study. These scores had been determined according to the original PSI model described by Fine et al. [1], which incorporates demographic characteristics, comorbidities, physical examination findings, and laboratory and radiographic variables. The original model stratifies patients with CAP into five risk classes according to their risk of 30-day mortality.
The CURB-65 score was calculated according to the criteria described by Lim et al. [2], based on confusion, serum urea level, respiratory rate, blood pressure, and age of ≥65 years. Serum urea values were obtained from the hospital laboratory information system and recorded in mg/dL; a urea concentration > 42 mg/dL, corresponding approximately to >7 mmol/L, fulfilled the urea criterion. One point was assigned for each criterion, yielding a total score ranging from 0 to 5.
2.5. Prognostic Nutritional Index
PNI was calculated using the serum albumin level and peripheral lymphocyte count obtained at hospital presentation. PNI was calculated using the following formula:
PNI = [10 × serum albumin (g/dL)] + [0.005 × total lymphocyte count (/µL)].
Serum albumin values were recorded in g/L in the hospital laboratory system and converted to g/dL before calculation of PNI.
This calculation method was consistent with that used in previous studies evaluating the prognostic value of PNI in patients with CAP [6,7].
2.6. Outcome
The primary outcome was all-cause mortality occurring within 30 days of hospital presentation. Thirty-day mortality was defined as death from any cause occurring within 30 days of the index CAP presentation, irrespective of whether the patient remained hospitalized or had been discharged. Vital status at day 30, including deaths occurring after hospital discharge, was verified through the death notification system available within the hospital information system. The patients were categorized into two groups according to their 30-day vital status: those who died and those who survived. Demographic, clinical, and laboratory characteristics at presentation, as well as PNI, PSI, and CURB-65 values, were compared between the two groups.
2.7. Statistical Analysis
All statistical analyses, including the additional analyses performed during revision, were conducted using IBM SPSS Statistics version 27 (IBM Corp., Armonk, NY, USA). The normality of continuous variables was assessed using the Kolmogorov–Smirnov test. Normally distributed continuous variables were presented as mean ± standard deviation, whereas non-normally distributed variables were presented as median and interquartile range. Categorical variables were expressed as number and percentage.
For comparisons between patients who died and those who survived, the independent-samples t test was used for normally distributed continuous variables, and the Mann–Whitney U test was used for non-normally distributed continuous variables. Categorical variables were compared using the chi-square test. Associations between PNI and PSI and CURB-65 were assessed using Pearson correlation analysis.
The ability of PNI, PSI, and CURB-65 to discriminate 30-day mortality was evaluated using receiver operating characteristic (ROC) curve analysis. The areas under the curve (AUCs) and 95% confidence intervals (CIs) were calculated. For PNI, lower values were considered the positive test direction for mortality. Because PNI, PSI, and CURB-65 were evaluated in the same patients, pairwise comparisons of their correlated ROC curves were performed using DeLong’s method (PNI vs. PSI, PNI vs. CURB-65, and PSI vs. CURB-65).
The optimal PNI cutoff value was determined as the point at which the Youden index (sensitivity + specificity − 1) was maximized. Because the cutoff was derived and evaluated within the same cohort, it was considered a cohort-derived exploratory threshold. In contrast, the thresholds of PSI > 90 and CURB-65 ≥ 2 were not derived from ROC analysis but were prespecified clinical risk thresholds based on the literature [1,2]. Sensitivity, specificity, positive predictive value, and negative predictive value were calculated for each threshold with their corresponding 95% CIs.
The revised Youden analysis identified PNI ≤ 36.6 as the cohort-derived exploratory cutoff; patients were therefore secondarily categorized as PNI ≤ 36.6 or PNI > 36.6. In addition, the distribution of PNI was divided into four quartiles (Q1–Q4), and 30-day mortality rates across the quartiles were evaluated descriptively.
Univariable logistic regression analyses were performed to identify the factors associated with mortality. In the primary multivariable logistic regression analysis, PNI was modeled as a continuous variable to avoid reliance on a cutoff derived from the same cohort. The model included age, diastolic blood pressure, respiratory rate, urea level, continuous PNI, presence of cancer, and RDW. These covariates were selected to represent clinically relevant prognostic factors and variables associated with mortality in the initial analyses while limiting model complexity relative to the number of mortality events. The cohort-derived PNI cutoff was additionally evaluated in a secondary exploratory multivariable model.
The functional relationship between continuous PNI and 30-day mortality was further examined using restricted cubic spline analysis, including assessment of nonlinearity.
To evaluate the incremental prognostic contribution of PNI beyond established pneumonia severity scores, separate logistic regression models combining continuous PNI with PSI and continuous PNI with CURB-65 were constructed. Discrimination of the combined models was assessed using AUCs with 95% CIs and compared with the corresponding score-alone models using paired DeLong tests. Model performance was additionally assessed using the Brier score and calibration.
Internal validation was performed using 1000 bootstrap resamples to estimate optimism-corrected discrimination and calibration for the principal multivariable model and the combined PSI + PNI and CURB-65 + PNI models.
Regression results were reported as ORs with 95% CIs. All statistical tests were two-sided, and p < 0.05 was considered statistically significant.
3. Results
During the study period, 294 patients hospitalized for CAP were evaluated. A total of 214 patients were included in the final analysis (Figure 1). The mean age of the patients was 71.7 ± 14.7 years, with 141 (65.9%) of them being men and 73 (34.1%) women. During the 30-day follow-up period, 61 patients (28.5%) died, whereas 153 (71.5%) survived. Complete 30-day vital status was available for all patients included in the final cohort.
Figure 1.
Flowchart of patient selection and study inclusion.
3.1. Clinical and Laboratory Characteristics
Patients who died were significantly older than survivors (77.7 ± 10.7 vs. 69.3 ± 15.5 years, p < 0.001) and had a longer hospital stay [14 (7.5–25.5) vs. 8 (6–12) days, p < 0.001]. PSI (144.7 ± 35.1 vs. 126.0 ± 36.9, p < 0.001) and CURB-65 (3.03 ± 0.89 vs. 2.38 ± 1.00, p < 0.001) scores were significantly higher among patients who died. In addition, diastolic blood pressure was lower (67.3 ± 13.3 vs. 72.3 ± 10.7 mmHg, p = 0.005), whereas respiratory rate was higher (22.5 ± 4.2 vs. 21.1 ± 3.7 breaths/min, p = 0.013) among patients who died. No significant between-group differences were observed in sex, smoking status, systolic blood pressure, heart rate, or body temperature (Table 1).
Table 1.
Clinical and laboratory characteristics of patients who died and survivors.
Overall, 78 of 214 patients (36.4%) required ICU admission during hospitalization. ICU admission was more frequent among patients who died than among survivors [51/61 (83.6%) vs. 27/153 (17.6%), p < 0.001].
Regarding comorbidities, cancer was significantly more common among patients who died than among survivors (38% vs. 14%, p < 0.001). The prevalence of dementia was also higher in the mortality group (18% vs. 8%, p = 0.046). No significant between-group differences were observed for the other comorbidities assessed.
Laboratory evaluation showed that patients who died had lower hemoglobin levels (11.1 ± 2.3 vs. 11.8 ± 2.1, p = 0.016), lower lymphocyte counts [750 (510–1210) vs. 1070 (650–1490)/µL, p = 0.010], and higher RDW values (16.6 ± 2.8 vs. 15.5 ± 2.5, p = 0.002). Urea levels were higher in the mortality group [66 (44–102) vs. 49 (39–70) mg/dL, p = 0.002], whereas total protein (62 ± 8 vs. 65 ± 8, p = 0.020) and albumin (30 ± 5 vs. 33 ± 5, p < 0.001) levels were lower. No significant between-group differences were observed for most of the other biochemical and arterial blood gas parameters assessed (Table 1).
3.2. Discriminative Performance for Mortality
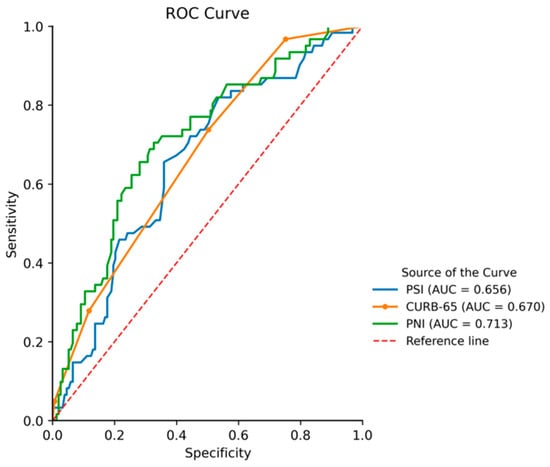
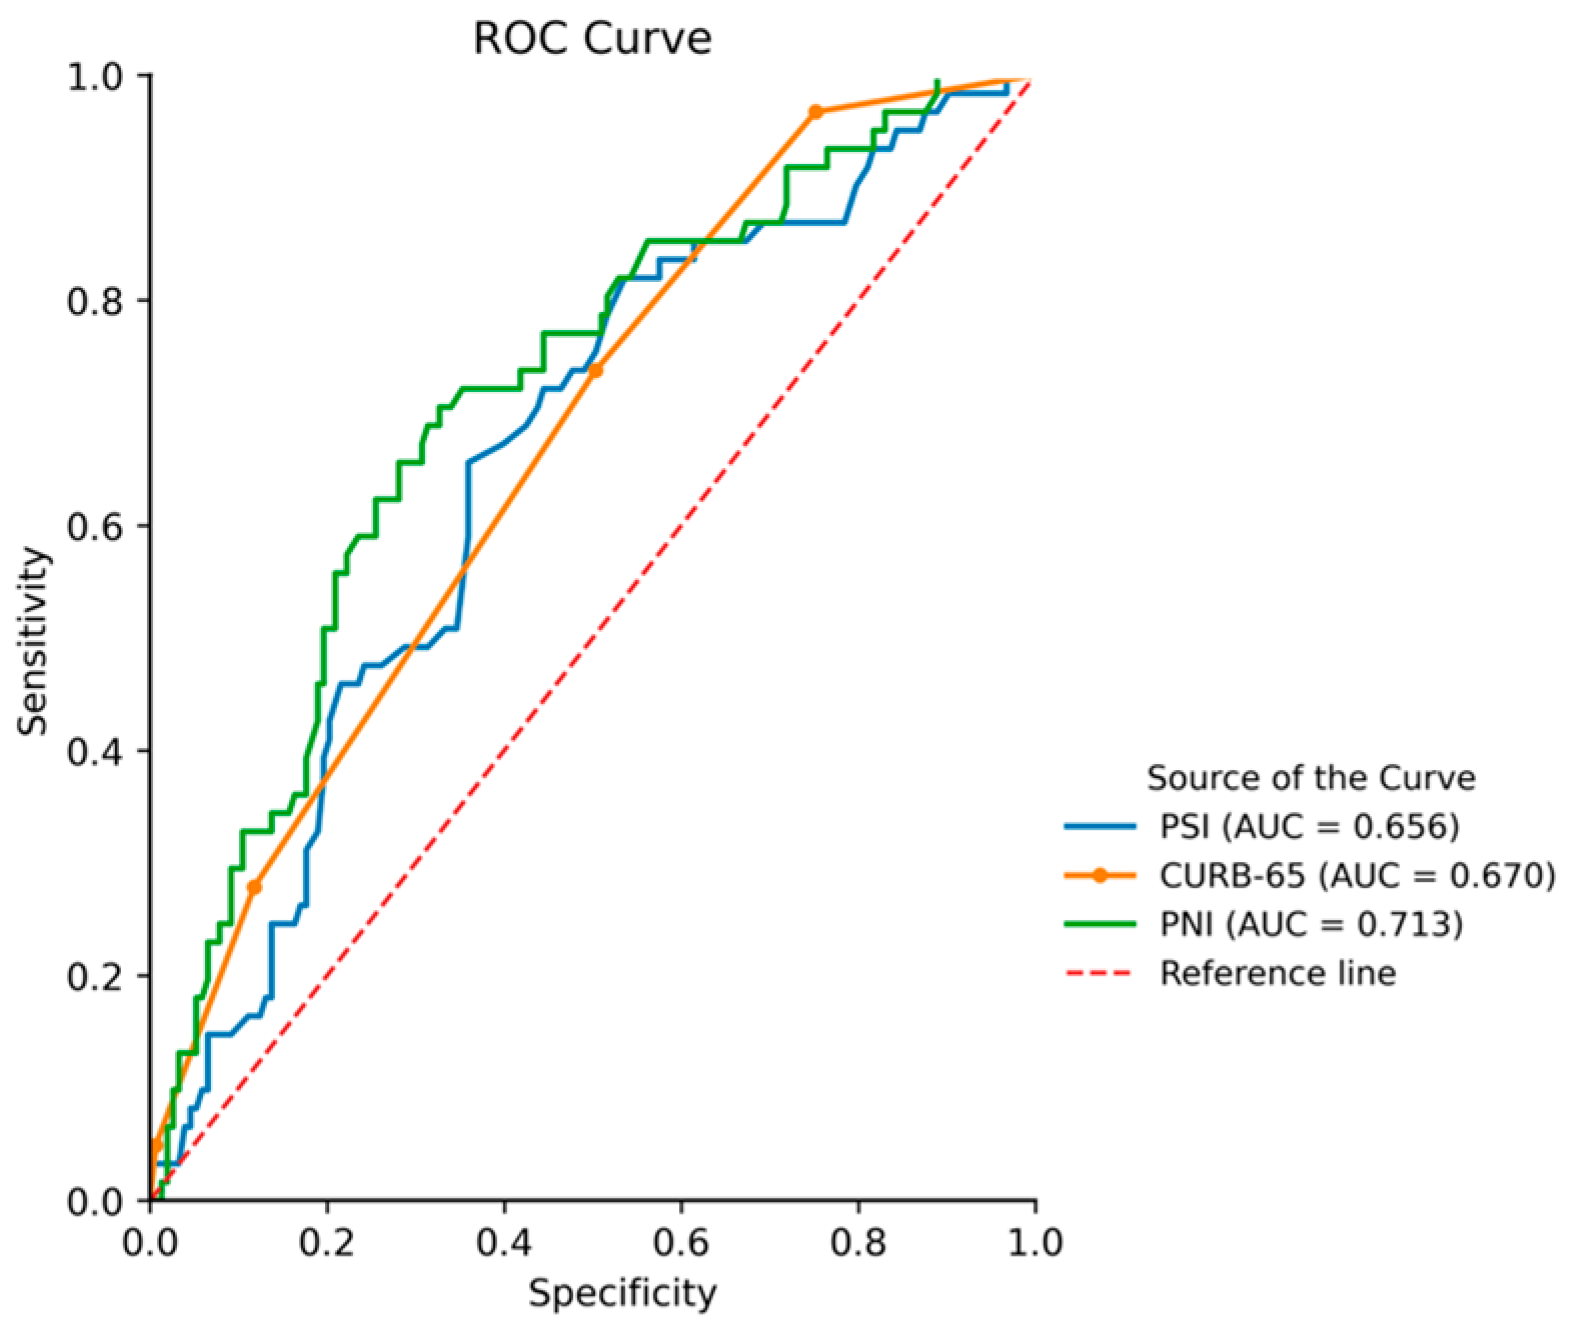
In ROC analysis, PSI, CURB-65, and PNI all demonstrated significant discrimination of 30-day mortality. The AUC was 0.656 (95% CI, 0.576–0.735) for PSI, 0.670 (95% CI, 0.598–0.742) for CURB-65, and 0.713 (95% CI, 0.637–0.789) for PNI. Among the three parameters, PNI had the numerically highest AUC (Figure 2, Table 2). However, paired DeLong comparisons showed no statistically significant differences between PNI and PSI (ΔAUC = 0.058, p = 0.321), PNI and CURB-65 (ΔAUC = 0.043, p = 0.434), or PSI and CURB-65 (ΔAUC = −0.015, p = 0.710).
Figure 2.
Receiver operating characteristic curves of PNI, PSI, and CURB-65 for 30-day mortality.
Table 2.
Discriminative performance of PNI, PSI, and CURB-65 for 30-day mortality and pairwise comparison of ROC curves.
The optimal PNI cutoff was 36.6, determined at the point of maximum Youden index. Because this threshold was derived from the same cohort, it was considered exploratory. The PSI > 90 and CURB-65 ≥ 2 thresholds were not derived from ROC analysis but were used as prespecified clinical risk thresholds based on the literature [1,2].
Using PNI ≤ 36.6 as the exploratory cutoff, the sensitivity, specificity, positive predictive value, and negative predictive value for predicting 30-day mortality were 70.5% (95% CI, 57.4–81.5), 67.3% (95% CI, 59.3–74.7), 46.2% (95% CI, 35.8–56.9), and 85.1% (95% CI, 77.5–90.9), respectively; for PSI > 90, these values were 93.4% (95% CI, 84.1–98.2), 16.3% (95% CI, 10.9–23.2), 30.8% (95% CI, 24.2–38.0), and 86.2% (95% CI, 68.3–96.1), respectively; for CURB-65 ≥ 2, they were 96.7% (95% CI, 88.7–99.6), 24.8% (95% CI, 18.2–32.5), 33.9% (95% CI, 26.9–41.5), and 95.0% (95% CI, 83.1–99.4), respectively (Table 3).
Table 3.
Performance of PNI, PSI, and CURB-65 cutoffs for 30-day mortality prediction.
3.3. PNI and 30-Day Mortality
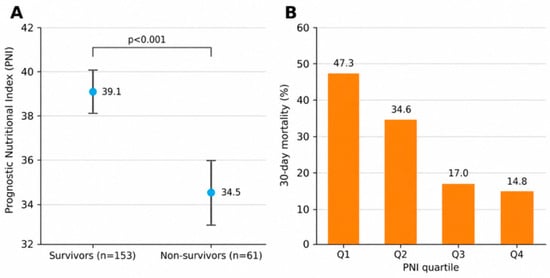
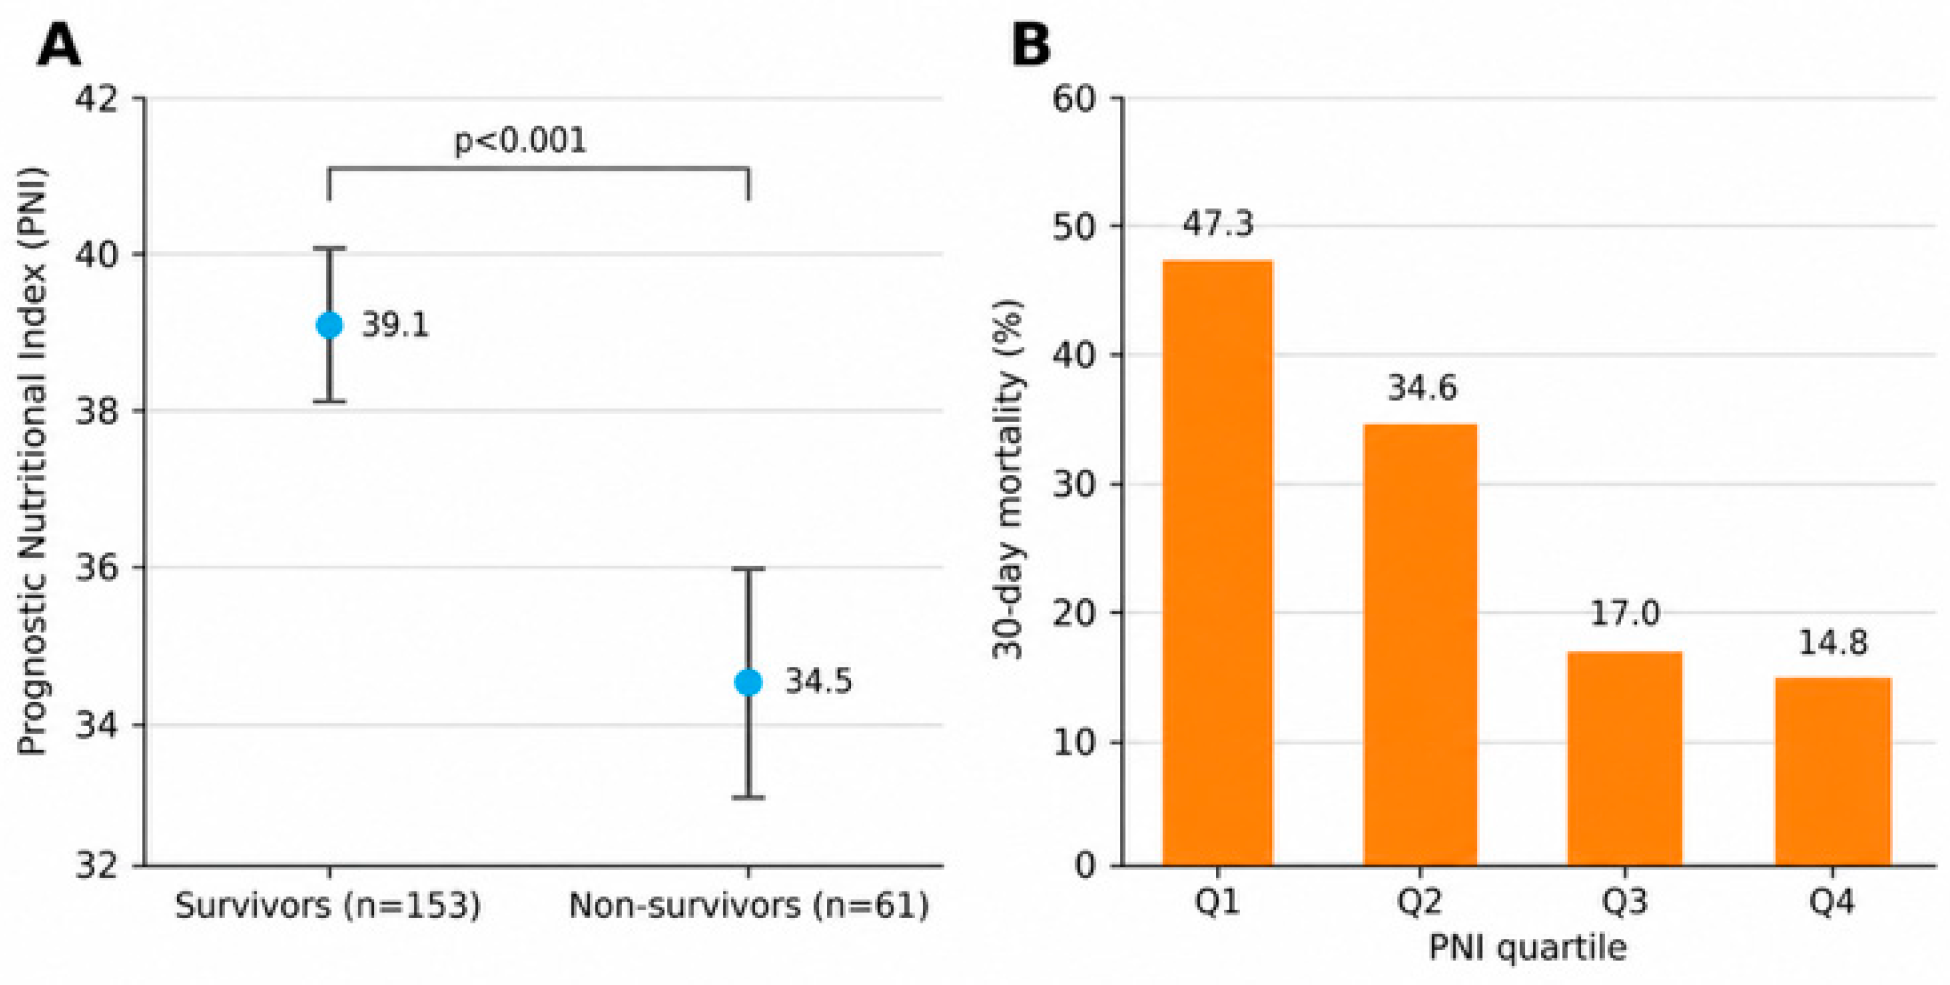
PNI, the primary biomarker of interest in this study, was significantly lower in patients who died than in survivors (34.5 ± 5.6 vs. 39.1 ± 6.4, p < 0.001) (Figure 3A).
Figure 3.
(A) PNI values according to 30-day survival status. Error bars represent 95% confidence intervals. (B) Thirty-day mortality rates across PNI quartiles.
Among the 93 patients with a PNI ≤ 36.6, 43 (46.2%) died within 30 days, compared with 18 (14.9%) of the 121 patients with PNI > 36.6. Thus, mortality was higher among patients below the cohort-derived exploratory PNI threshold.
PNI was also evaluated after stratification into four quartiles. The mean PNI was 29.7 ± 3.6 (minimum–maximum, 16.7–33.5) among 55 patients in the first quartile, 35.6 ± 1.2 (33.8–37.9) among 52 patients in the second quartile, 40.3 ± 1.2 (37.9–42.3) among 53 patients in the third quartile, and 45.6 ± 3.2 (42.4–54.6) among 54 patients in the fourth quartile. The corresponding 30-day mortality rates were 26/55 (47.3%) in Q1, 18/52 (34.6%) in Q2, 9/53 (17.0%) in Q3, and 8/54 (14.8%) in Q4. A descriptive decrease in mortality was observed across increasing PNI quartiles (Figure 3B). This quartile analysis was descriptive and unadjusted.
3.4. Mortality According to PSI and CURB-65 Risk Classes
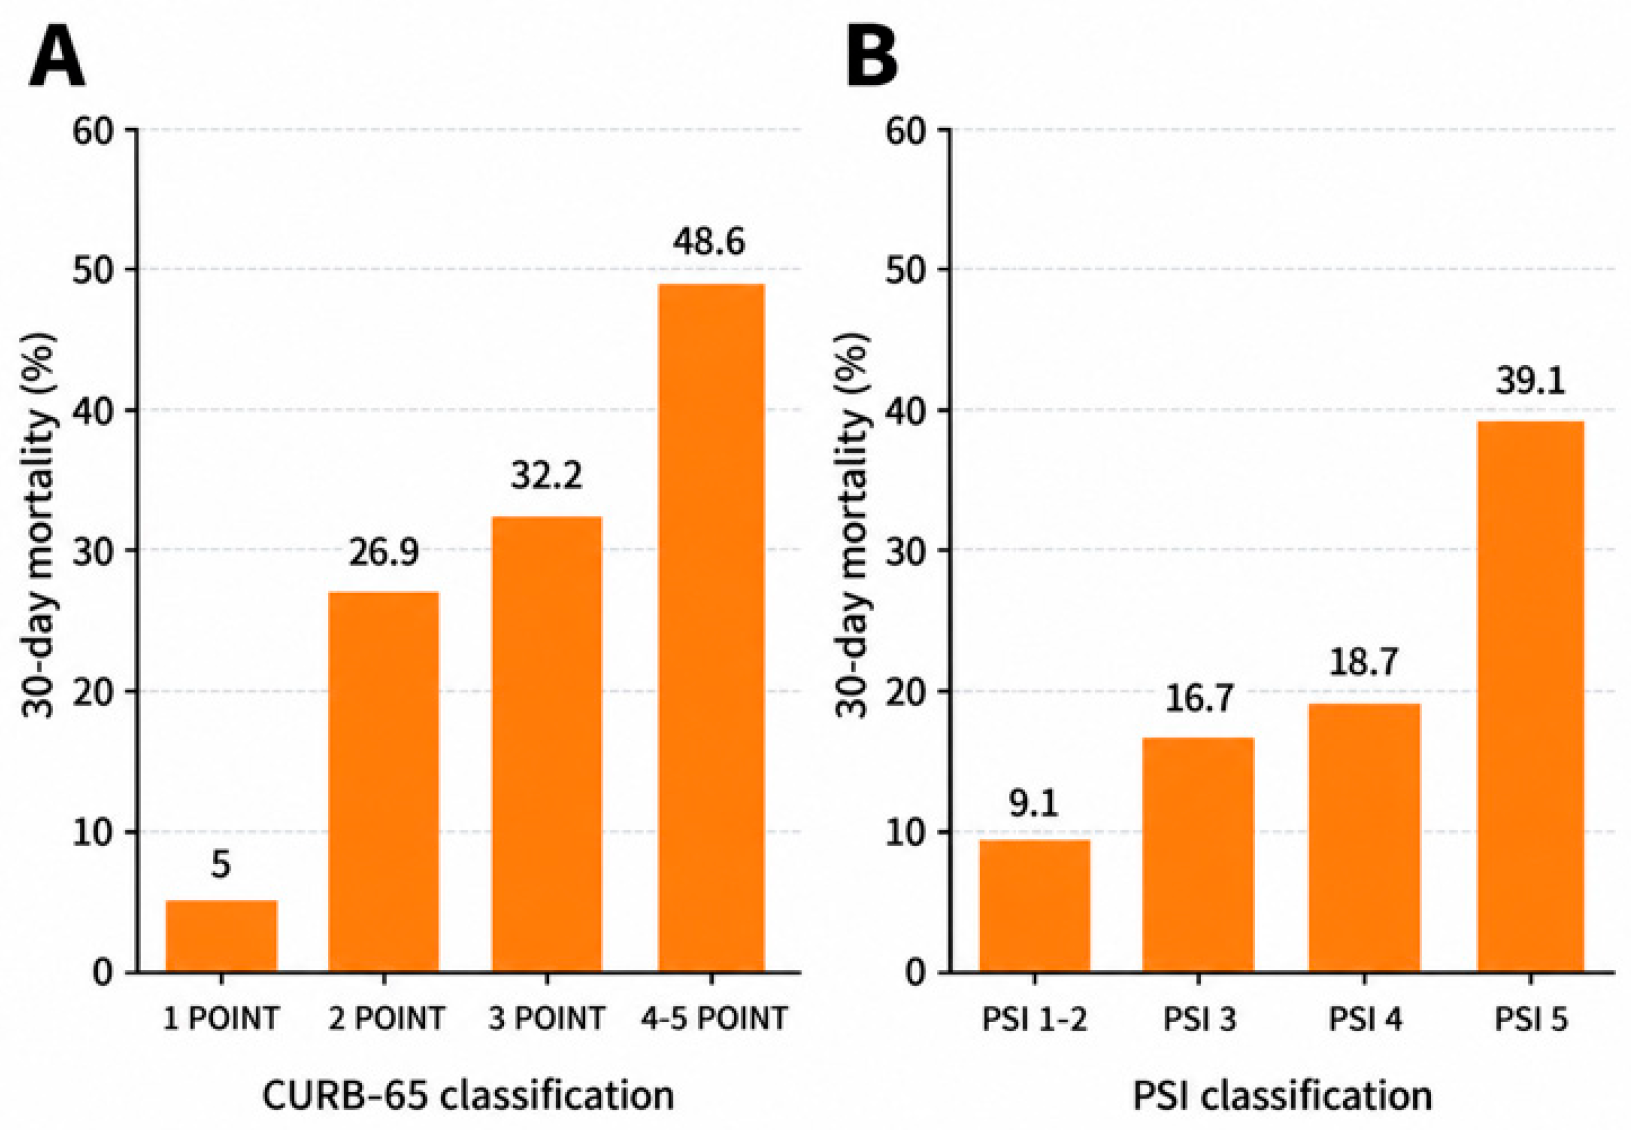
Thirty-day mortality rates were also evaluated according to the PSI and CURB-65 risk classes. According to the CURB-65 classification, mortality rates were 5.0%, 26.9%, 32.2%, and 48.6% for scores of 1, 2, 3, and 4–5, respectively (Figure 4A). According to the PSI risk classification, mortality rates were 9.1%, 16.7%, 18.7%, and 39.1% in risk classes I-II, III, IV, and V, respectively (Figure 4B). Mortality rates increased progressively across higher risk classes for both clinical risk scores.
Figure 4.
(A) Thirty-day mortality according to CURB-65 score categories. (B) Thirty-day mortality according to PSI risk classes.
3.5. Association Between PNI and Pneumonia Severity Scores
A weak negative correlation was observed between PNI and CURB-65 (r = −0.187, p = 0.006). No significant correlation was found between PNI and PSI (r = −0.102, p = 0.137). In contrast, PSI and CURB-65 were positively correlated (r = 0.609, p < 0.001).
3.6. Factors Associated with Mortality
In univariable logistic regression analysis, older age, lower diastolic blood pressure, higher respiratory rate, higher PSI and CURB-65 scores, lower PNI, presence of cancer, lower hemoglobin and albumin levels, and higher urea and RDW levels were associated with mortality. When PNI was analyzed as a continuous variable, each one-unit increase in PNI was associated with lower odds of mortality (OR, 0.887; 95% CI, 0.841–0.936; p < 0.001). A PNI of ≤36.6 was associated with higher odds of mortality (OR, 4.92; 95% CI, 2.58–9.39; p < 0.001) (Table 4).
Table 4.
Univariable logistic regression analysis of factors associated with 30-day mortality.
In the primary multivariable logistic regression model, PNI was entered as a continuous variable. Older age (OR, 1.049; 95% CI, 1.016–1.084; p = 0.004), higher urea level (OR, 1.011; 95% CI, 1.002–1.019; p = 0.011), lower PNI (OR per one-unit increase, 0.869; 95% CI, 0.814–0.927; p < 0.001), and presence of cancer (OR, 4.44; 95% CI, 1.96–10.09; p < 0.001) were independently associated with 30-day mortality. Diastolic blood pressure, respiratory rate, and RDW were not statistically significant in the adjusted model (Table 5). The apparent AUC of the primary multivariable model was 0.826 (95% CI, 0.769–0.884), with a Brier score of 0.147. After 1000 bootstrap resamples, the optimism-corrected AUC was 0.801 and the optimism-corrected calibration slope was 0.863.
Table 5.
Multivariable logistic regression analysis of factors associated with 30-day mortality.
In a secondary exploratory model using the cohort-derived cutoff, PNI ≤ 36.6 remained associated with higher odds of 30-day mortality (adjusted OR, 4.73; 95% CI, 2.25–9.96; p < 0.001).
3.7. Incremental Prognostic Performance of PNI
To assess whether PNI provided prognostic information beyond the established severity scores, combined models were constructed using continuous PNI. Addition of PNI to PSI increased the AUC from 0.656 to 0.740 (95% CI for the combined model, 0.670–0.810), and the improvement in discrimination was significant by paired DeLong testing (p = 0.034). The Brier score decreased from 0.194 for PSI alone to 0.176 for PSI + PNI. Addition of PNI to the PSI model was also supported by the likelihood-ratio test (p < 0.001).
Similarly, addition of PNI to CURB-65 increased the AUC from 0.670 to 0.771 (95% CI for the combined model, 0.705–0.838; paired DeLong p = 0.001). The Brier score decreased from 0.187 for CURB-65 alone to 0.170 for CURB-65 + PNI, and the likelihood-ratio test for the addition of PNI was significant (p < 0.001).
Internal validation with 1000 bootstrap resamples yielded optimism-corrected AUCs of 0.733 for PSI + PNI and 0.766 for CURB-65 + PNI. The corresponding optimism-corrected calibration slopes were 0.967 and 0.981, with calibration intercepts close to zero (−0.003 and 0.006, respectively). These findings indicate improved discrimination after addition of PNI within the present cohort.
4. Discussion
This study evaluated the association between PNI calculated at hospital presentation and 30-day mortality in hospitalized patients with CAP and compared the discriminative performance of PNI with that of PSI and CURB-65. The main findings of the study can be summarized in four points:
- (a)
- 30-day mortality was 28.5%, and patients who died had lower PNI and higher PSI and CURB-65 scores.
- (b)
- Mortality showed a descriptive decrease across increasing PNI quartiles, from 47.3% in Q1 to 14.8% in Q4, and was higher among patients with PNI ≤ 36.6 than among those with PNI > 36.6.
- (c)
- PNI demonstrated moderate discrimination for 30-day mortality and had the numerically highest AUC among the three individual measures, although formal pairwise comparisons with PSI and CURB-65 were not statistically significant; continuous PNI remained independently associated with mortality in the primary multivariable analysis.
- (d)
- Older age, higher serum urea levels, and cancer were additional independent factors associated with mortality, and adding PNI to PSI or CURB-65 significantly improved discrimination within this cohort.
A principal finding of our study was the independent association between lower PNI and 30-day mortality. PNI was significantly lower in patients who died than in survivors (34.5 ± 5.6 vs. 39.1 ± 6.4; p < 0.001). This finding is consistent with an expanding body of evidence evaluating PNI in pneumonia and CAP. De Rose et al. [6] demonstrated that low PNI was associated with mortality in patients hospitalized for community-acquired bacterial pneumonia and that this association remained significant after adjustment for age and comorbidity burden. Similarly, in a cohort of 1608 patients admitted to the intensive care unit, PNI was inversely and independently associated with both 30-day and 90-day mortality [7]. More recently, Ding et al. [8], in a multicenter cohort of hospitalized patients with pneumonia, also demonstrated an inverse association between PNI and short-term mortality, with discriminatory performance of a magnitude similar to that observed in the present cohort. Although patient characteristics and clinical settings differed between studies, the consistency of the direction of these findings indicates that the association between lower PNI and adverse outcomes in pneumonia is increasingly well established. Accordingly, the contribution of the present study should be viewed primarily as independent confirmation in a new cohort, together with formal same-cohort comparison with PSI and CURB-65 and assessment of the incremental discriminatory contribution of PNI.
Evaluation of PNI according to quartiles provided further insight into this association. In our study, 30-day mortality decreased from 47.3% in Q1 to 34.6% in Q2, 17.0% in Q3, and 14.8% in Q4. Previously, Wang et al. [7] stratified PNI into quartiles and reported 30-day mortality rates of 55.14%, 29.95%, 23.44%, and 15.10% from Q1 to Q4, respectively. Similarly, in the adjusted Cox regression models from that study, the hazard of 30-day mortality decreased progressively across higher PNI quartiles when the lowest quartile was used as the reference. Because the quartile boundaries and patient populations differed between the two studies, direct comparison of mortality rates is not appropriate. Nevertheless, the observation of a graded decline in mortality with increasing PNI levels in both cohorts is noteworthy. However, because an adjusted trend model was not applied to the quartiles in our study, this finding should be interpreted as descriptive.
The association between PNI and mortality was further supported by ROC analysis. In our study, the AUC was 0.713 for PNI, compared with 0.656 for PSI and 0.670 for CURB-65. Wang et al. [7] reported an AUC of 0.71 for PNI in predicting 30-day mortality, indicating a similar level of discriminative performance for PNI in two independent cohorts. Ramirez and File [11] emphasized that PSI and CURB-65 remain central to short-term mortality risk assessment, while noting that their performance may vary according to the clinical context. In a systematic review and meta-analysis of 23 prospective studies involving 22,753 patients, Loke et al. [12] reported that PSI had higher sensitivity, whereas CURB-65 had higher specificity, and that both scores had high negative predictive values, particularly for identifying patients at low risk of death. In an analysis of 13,874 patients, Barlas et al. [13] reported area under the receiver operating characteristic curve values of 0.80 for PSI and 0.77 for CURB-65, further demonstrating that the two scores have distinct performance characteristics. An independent validation study by Ewig et al. [14] also supported the clinical value of both the CURB-based approach and PSI for mortality risk stratification.
In our cohort, PNI had the numerically highest AUC; however, paired DeLong testing showed no statistically significant difference between PNI and PSI (p = 0.321) or between PNI and CURB-65 (p = 0.434). Thus, the present data do not support statistical superiority of PNI as a stand-alone prognostic measure. Importantly, however, adding PNI to PSI increased the AUC from 0.656 to 0.740 (p = 0.034), whereas adding PNI to CURB-65 increased the AUC from 0.670 to 0.771 (p = 0.001). The corresponding decreases in Brier scores were also consistent with improved overall predictive performance. These findings support incremental discriminatory information from PNI when incorporated with established severity scores within the present cohort, although external validation is required before clinical utility can be inferred.
The PNI cutoff of 36.6 identified by ROC analysis is also noteworthy from the perspective of clinical risk stratification. Among the 93 patients with PNI ≤ 36.6, 43 (46.2%) died within 30 days, compared with 18 (14.9%) of the 121 patients with PNI > 36.6. For PNI ≤ 36.6, sensitivity was 70.5%, specificity was 67.3%, positive predictive value was 46.2%, and negative predictive value was 85.1%. Previously, Wang et al. [7] reported a PNI cutoff of 31.55 for 30-day mortality among patients with CAP admitted to the intensive care unit. Differences in patient selection, the spectrum of clinical severity, and the distribution of PNI values may contribute to the variation in cutoff values across studies. Accordingly, the value of 36.6 identified in our study should be considered a cohort-derived exploratory threshold rather than an established clinical cutoff. Because the threshold was derived and evaluated in the same dataset, its performance may be optimistic and requires independent validation.
In the primary multivariable analysis, PNI was retained as a continuous variable to avoid reliance on the cohort-derived cutoff. Each one-unit increase in PNI was associated with lower odds of 30-day mortality (OR, 0.869; 95% CI, 0.814–0.927; p < 0.001) after adjustment for age, diastolic blood pressure, respiratory rate, urea, cancer, and RDW. Older age, higher urea levels, and cancer also remained independently associated with mortality. Restricted cubic spline analysis showed no evidence of a significant nonlinear relationship (p for nonlinearity = 0.677), supporting the use of PNI as a continuous linear term in the primary model. In particular, our findings regarding age and malignancy were consistent with the data from large CAP cohorts. In a study by Luna et al. [15] involving 6205 patients with CAP from 80 hospitals in 17 countries, 508 patients (8.2%) died within 30 days. In their cohort, malignant disease, congestive heart failure, cerebrovascular disease, renal disease, diabetes, and age ≥ 80 years were independently associated with mortality [15]. The inclusion of urea and age as core components of CURB-65 [2] and of age and neoplastic disease in PSI risk stratification [1] further supports the consistency of our findings with the established prognostic framework for CAP. The persistence of the association between continuous PNI and mortality after adjustment for these factors supports its prognostic relevance, although the observational design does not establish causality or clinical utility.
The potential biological basis for the prognostic significance of PNI in CAP lies in its combination of serum albumin and peripheral lymphocyte count within a single index. In our study, both albumin and lymphocyte levels were lower among patients who died. In a prospective multicenter study of 366 patients by Zhao et al. [16], serum albumin was independently associated with 30-day survival. In addition, they reported that albumin ≤ 30 g/L was associated with a higher risk of mortality, and albumin alone had an AUC of 0.762 for 30-day mortality [16]. Moreover, adding albumin to PSI or CURB-65 improved the prognostic performance of these scores. Regarding the lymphocyte component, Bermejo-Martin et al. [17] demonstrated in large derivation and validation cohorts that marked lymphopenia at presentation was independently associated with 30-day mortality.
Because albumin is a major component of PNI, we additionally examined whether PNI provided greater discrimination than albumin alone in the present cohort. Albumin alone yielded an AUC of 0.703 (95% CI, 0.627–0.780), compared with 0.713 for PNI, and the difference was not statistically significant (paired DeLong p = 0.664). Thus, our data do not demonstrate that PNI is superior to albumin alone, and a substantial component of the prognostic signal may be attributable to serum albumin. Nevertheless, PNI combines albumin with peripheral lymphocyte count and thereby integrates two biologically distinct components of the host response in a simple composite index.
Importantly, PNI should not be interpreted as a direct measure of nutritional status during acute pneumonia. Serum albumin is influenced by systemic inflammation, capillary leakage, hydration status, hepatic synthesis, comorbid illness, and nutritional state, while lymphocyte count is also affected by the acute immune response. PNI in this setting may therefore be more appropriately regarded as an immunonutritional composite marker reflecting overlapping nutritional, inflammatory, immune-related, and disease-severity processes.
The findings regarding the correlation between PNI and established pneumonia severity scores are also relevant in this context. PNI showed only a weak negative correlation with CURB-65 (r = −0.187, p = 0.006), whereas no significant association was observed between PNI and PSI (r = −0.102, p = 0.137). In contrast, PSI and CURB-65 showed a more pronounced positive correlation (r = 0.609, p < 0.001). These findings suggest that PNI does not simply represent a biochemical counterpart of conventional pneumonia severity scores. However, it is important to emphasize that a low correlation, by itself, does not establish incremental prognostic value. In a prospective study of 453 patients with CAP, Menéndez et al. [18] directly examined this issue through model comparisons and demonstrated that adding CRP to PSI significantly increased the AUC from 0.80 to 0.85 and adding CRP to CURB-65 increased the AUC from 0.82 to 0.85. Using a similar model-comparison framework in the present study, we found that adding PNI significantly improved discrimination compared with PSI alone and CURB-65 alone. These findings provide direct evidence of incremental discriminatory value within this cohort; however, they remain internally derived and require external validation.
The relatively high mortality observed in the present study also deserves consideration. Thirty-day mortality was 28.5%, 185 of 214 patients (86.4%) had PSI > 90, 174 (81.3%) had CURB-65 ≥ 2, and 78 (36.4%) required ICU admission. Thus, the study population represented a relatively high-risk subset of hospitalized patients with CAP. This case mix may partly explain why the AUCs of PSI and CURB-65 were lower than those reported in some previous validation cohorts and may limit the generalizability of our findings to lower-risk hospitalized or outpatient populations. In addition, although the difference in mean PNI between survivors and non-survivors was statistically significant, both groups had relatively low mean PNI values. This may reflect the substantial burden of acute illness and comorbidity in the overall cohort and highlights the importance of distinguishing statistical significance from the magnitude and clinical interpretation of between-group differences.
From a clinical perspective, an important advantage of PNI is that it can be readily calculated from routinely available albumin and lymphocyte measurements. However, PNI should not be regarded as a fixed patient characteristic. Because albumin and lymphocyte levels may change during acute illness, the trajectory of PNI over time may provide information beyond that obtained from a single baseline measurement. Therefore, a single PNI measurement should be interpreted within the broader clinical context rather than in isolation. Whether serial PNI measurements provide incremental prognostic information beyond the baseline value in CAP warrants further investigation.
Our study has several strengths. Evaluating PNI, PSI, and CURB-65 within the same patient cohort and against the same 30-day outcome allowed different prognostic approaches to be examined within a common clinical context. Formal paired ROC comparisons allowed the discriminatory performance of the three measures to be compared appropriately, while the PSI + PNI and CURB-65 + PNI models enabled direct assessment of the incremental discriminatory contribution of PNI. Continuous PNI was used in the primary adjusted analysis, reducing dependence on a cohort-derived cutoff, and restricted cubic spline analysis provided no evidence against a linear relationship. In addition, bootstrap internal validation was used to quantify model optimism and assess the stability of discrimination and calibration. The cutoff and quartile analyses were retained as secondary exploratory and descriptive analyses, respectively.
Limitations
This study has several limitations. First, its retrospective, single-center design makes it susceptible to selection bias and unmeasured confounding and limits the external validity of the findings. In addition, exclusion of 42 patients because of incomplete clinical or laboratory data may have introduced complete-case selection bias and may have contributed to enrichment of the cohort with more severely ill patients undergoing more extensive clinical evaluation. Second, although the primary and combined models underwent bootstrap internal validation, the sample size and number of mortality events were relatively limited, and external validation was not available. Third, the PNI cutoff of 36.6 was derived and evaluated within the same cohort, and should therefore be regarded as exploratory until independently validated. Fourth, the relatively high mortality rate and high proportion of patients with elevated PSI and CURB-65 scores indicate that the cohort represented a high-risk hospitalized CAP population, which may limit generalizability to lower-risk patients. Fifth, PNI was assessed only at presentation, and serial measurements were not available. Finally, although mortality decreased across increasing PNI quartiles, no adjusted trend analysis was performed for the quartile categories. Therefore, these findings require validation in independent, preferably multicenter, prospective cohorts using formal comparisons of prognostic models.
5. Conclusions
In the present study, lower PNI at hospital presentation was independently associated with 30-day mortality among hospitalized patients with CAP, with continuous PNI remaining significant in the primary multivariable analysis. The descriptive decrease in mortality across PNI quartiles and the moderate discriminatory performance of PNI for 30-day mortality support its potential role as an immunonutritional marker for prognostic risk assessment in CAP. PNI alone did not significantly outperform PSI or CURB-65; however, adding PNI significantly improved discrimination compared with either score alone within this cohort. These findings support the potential incremental prognostic value of PNI as an immunonutritional composite marker, although external validation in larger, preferably multicenter prospective cohorts is required before routine clinical application.
Author Contributions
All authors contributed to the study conception and design. E.S.T., A.G., N.O. and O.T. researched literature and conceived the study. E.S.T., A.G., O.T. and S.O. were involved in protocol development, gaining ethical approval, patient recruitment and data analysis. E.S.T., A.G., N.O. and U.S. wrote the first draft of the manuscript. All authors reviewed and edited the manuscript and approved the final version of the manuscript. All authors have read and agreed to the published version of the manuscript.
Funding
The Recep Tayyip Erdogan University Development Foundation provided funding for the open-access publishing of this study (Grant number: 0202600100040746).
Institutional Review Board Statement
This study was performed in line with the principles of the Declaration of Helsinki. Approval for the study was granted by the Ethics Committee of Recep Tayyip Erdogan University. The ethics committee approval number is 2026/302 (17 July 2026).
Informed Consent Statement
Due to the retrospective design of our study, informed consent was not obtained from the patients.
Data Availability Statement
All data generated or analyzed during this study are included in this article. The data will be available upon reasonable request (contact persons: omer.topaloglu@erdogan.edu.tr).
Conflicts of Interest
The authors declare that they have no known competing financial interests or personal relationships that could have appeared to influence the work reported in this paper.
References
- Fine, M.J.; Auble, T.E.; Yealy, D.M.; Hanusa, B.H.; Weissfeld, L.A.; Singer, D.E.; Coley, C.M.; Marrie, T.J.; Kapoor, W.N. A prediction rule to identify low-risk patients with community-acquired pneumonia. N. Engl. J. Med. 1997, 336, 243–250. [Google Scholar] [CrossRef] [Scilit] [PubMed]
- Lim, W.S.; van der Eerden, M.M.; Laing, R.; Boersma, W.G.; Karalus, N.; Town, G.I.; Lewis, S.A.; Macfarlane, J.T. Defining community acquired pneumonia severity on presentation to hospital: An international derivation and validation study. Thorax 2003, 58, 377–382. [Google Scholar] [CrossRef] [Scilit] [PubMed]
- Bradley, J.; Sbaih, N.; Chandler, T.R.; Furmanek, S.; Ramirez, J.A.; Cavallazzi, R. Pneumonia Severity Index and CURB-65 Score Are Good Predictors of Mortality in Hospitalized Patients with SARS-CoV-2 Community-Acquired Pneumonia. Chest 2022, 161, 927–936. [Google Scholar] [CrossRef] [Scilit] [PubMed]
- Unal Cetin, E.; Kurtkulagi, O.; Kamis, F.; Das, M.; Simsek, E.; Cetin, A.U.; Beyazit, Y. Advancing ICU mortality prediction in community-acquired pneumonia: Combining fibrinogen-to-albumin ratio, CT severity score, PSI, and CURB-65. Biomol. Biomed. 2025, 25, 2083–2091. [Google Scholar] [CrossRef] [Scilit] [PubMed]
- Huang, Y.; Liu, A.; Liang, L.; Jiang, J.; Luo, H.; Deng, W.; Lin, G.; Wu, M.; Li, T.; Jiang, Y. Diagnostic value of blood parameters for community-acquired pneumonia. Int. Immunopharmacol. 2018, 64, 10–15. [Google Scholar] [CrossRef] [Scilit] [PubMed]
- De Rose, L.; Sorge, J.; Blackwell, B.; Benjamin, M.; Mohamed, A.; Roverts, T.; Szpunar, S.; Saravolatz, L.D. Determining if the prognostic nutritional index can predict outcomes in community acquired bacterial pneumonia. Respir. Med. 2024, 226, 107626. [Google Scholar] [CrossRef] [Scilit] [PubMed]
- Wang, G.; Wang, N.; Liu, T.; Ji, W.; Sun, J.; Lv, L.; Yu, X.; Cheng, X.; Li, M.; Hu, T.; et al. Association between prognostic nutritional index and mortality risk in patients with community-acquired pneumonia: A retrospective study. BMC Pulm. Med. 2024, 24, 555. [Google Scholar] [CrossRef] [Scilit] [PubMed]
- Ding, Z.; He, Y.; Guo, X.; Feng, R.; Ren, G.; Deng, L.; Zhou, C.; Tang, H.; Li, Z.; Zhou, C.; et al. Prognostic nutritional index and mortality in pneumonia: A retrospective cohort study in China. Front. Nutr. 2025, 12, 1660457. [Google Scholar] [CrossRef] [Scilit] [PubMed]
- Niederman, M.S.; Mandell, L.A.; Anzueto, A.; Bass, J.B.; Broughton, W.A.; Campbell, G.D.; Dean, N.; File, T.; Fine, M.J.; Gross, P.A.; et al. Guidelines for the management of adults with community-acquired pneumonia. Diagnosis, assessment of severity, antimicrobial therapy, and prevention. Am. J. Respir. Crit. Care Med. 2001, 163, 1730–1754. [Google Scholar] [CrossRef] [Scilit] [PubMed]
- Jones, B.E.; Ramirez, J.A.; Oren, E.; Soni, N.J.; Sullivan, L.R.; Restrepo, M.I.; Musher, D.M.; Erstad, B.L.; Pickens, C.; Vaughn, V.M.; et al. Diagnosis and Management of Community-acquired Pneumonia: An Official American Thoracic Society Clinical Practice Guideline. Am. J. Respir. Crit. Care Med. 2026, 212, 24–44. [Google Scholar] [CrossRef] [Scilit] [PubMed]
- Ramirez, J.A.; File, T.M. How to assess survival prognosis in patients hospitalized for community-acquired pneumonia in 2024? Curr. Opin. Crit. Care 2024, 30, 399–405. [Google Scholar] [CrossRef] [Scilit] [PubMed]
- Loke, Y.K.; Kwok, C.S.; Niruban, A.; Myint, P.K. Value of severity scales in predicting mortality from community-acquired pneumonia: Systematic review and meta-analysis. Thorax 2010, 65, 884–890. [Google Scholar] [CrossRef] [Scilit] [PubMed]
- Barlas, R.S.; Clark, A.B.; Loke, Y.K.; Kwok, C.S.; Angus, D.C.; Uranga, A.; Espana, P.P.; Eurich, D.T.; Huang, D.T.; Man, S.Y.; et al. Comparison of the prognostic performance of the CURB-65 and a modified version of the pneumonia severity index designed to identify high-risk patients using the International Community-Acquired Pneumonia Collaboration Cohort. Respir. Med. 2022, 200, 106884. [Google Scholar] [CrossRef] [Scilit] [PubMed]
- Ewig, S.; de Roux, A.; Bauer, T.; Garcia, E.; Mensa, J.; Niederman, M.; Torres, A. Validation of predictive rules and indices of severity for community acquired pneumonia. Thorax 2004, 59, 421–427. [Google Scholar] [CrossRef] [Scilit] [PubMed]
- Luna, C.M.; Palma, I.; Niederman, M.S.; Membriani, E.; Giovini, V.; Wiemken, T.L.; Peyrani, P.; Ramirez, J. The Impact of Age and Comorbidities on the Mortality of Patients of Different Age Groups Admitted with Community-acquired Pneumonia. Ann. Am. Thorac. Soc. 2016, 13, 1519–1526. [Google Scholar] [CrossRef] [Scilit] [PubMed]
- Zhao, L.; Bao, J.; Shang, Y.; Zhang, Y.; Yin, L.; Yu, Y.; Xie, Y.; Chen, L.; Zheng, Y.; Xu, Y.; et al. The prognostic value of serum albumin levels and respiratory rate for community-acquired pneumonia: A prospective, multi-center study. PLoS ONE 2021, 16, e0248002. [Google Scholar] [CrossRef] [Scilit] [PubMed]
- Bermejo-Martin, J.F.; Cilloniz, C.; Mendez, R.; Almansa, R.; Gabarrus, A.; Ceccato, A.; Torres, A.; Menendez, R.; Group, N. Lymphopenic Community Acquired Pneumonia (L-CAP), an Immunological Phenotype Associated with Higher Risk of Mortality. eBioMedicine 2017, 24, 231–236. [Google Scholar] [CrossRef] [Scilit] [PubMed]
- Menendez, R.; Martinez, R.; Reyes, S.; Mensa, J.; Filella, X.; Marcos, M.A.; Martinez, A.; Esquinas, C.; Ramirez, P.; Torres, A. Biomarkers improve mortality prediction by prognostic scales in community-acquired pneumonia. Thorax 2009, 64, 587–591. [Google Scholar] [CrossRef] [Scilit] [PubMed]

Disclaimer/Publisher’s Note: The statements, opinions and data contained in all publications are solely those of the individual author(s) and contributor(s) and not of MDPI and/or the editor(s). MDPI and/or the editor(s) disclaim responsibility for any injury to people or property resulting from any ideas, methods, instructions or products referred to in the content. |
© 2026 by the authors. Licensee MDPI, Basel, Switzerland. This article is an open access article distributed under the terms and conditions of the Creative Commons Attribution (CC BY) license.