


Abstract
Wire Electrical Discharge Machining (WEDM) is highly significant for machining Inconel, which is widely used across industries for its excellent strength and heat resistance. Traditional machining of Inconel poses several difficulties; therefore, WEDM becomes a better option. One of the major challenges in WEDM is achieving optimal Material Removal Rate (MRR) and Surface Roughness (SR) simultaneously. In the present investigation, WEDM operation was conducted on Inconel 625 using a molybdenum wire as the electrode material, with three essential process variables: Pulse ON Time (PON), Pulse OFF Time (POFF), and peak current (IP). Multi-response optimization was performed using Response Surface Methodology (RSM) with the Face-centred Central Composite (FCC) design, the Non-dominated Sorting Genetic Algorithm II (NSGA-II), and Particle Swarm Optimization (PSO). The optimal values obtained using RSM were 45.71 µs for PON, 8.02 µs for POFF, and 4.78 A for IP, providing an SR of 3.997 µm and an MRR of 5.612 mm3/min. PSO focused more on the quality of the processed surface and gave a better SR of 3.098 µm, but the resulting MRR was 4.437 mm3/min using 20 µs for PON, 12 µs for POFF, and 3 A for IP. Conversely, the NSGA-II optimized for maximal machining productivity and generated the highest MRR of 5.907 mm3/min with an SR of 3.867 µm using 49.42 µs for PON, 8 µs for POFF, and 5 A for IP. Novelty lies in the use of statistics and metaheuristics to compare the performance of optimization methods in nonlinear parameter response analysis. Although RSM demonstrated high predictive accuracy, both the NSGA-II and PSO improved the search for the trade-off between MRR and SR. Overall, the best compromise between MRR and SR was achieved using the solution based on the NSGA-II results. The obtained results will help in developing advanced machining technologies aimed at precision processing of superalloys that contribute to SDG 9—Industry, Innovation and Infrastructure.
1. Introduction
Wire Electrical Discharge Machining (WEDM) is a widely used method for machining electrically conductive materials. Its precision and versatility have made it indispensable in aerospace, medicine, and die-making industries [1]. The material removal is done using the spark from the wire. The wire does not make direct contact with the workpiece. The key parameters that define the process are Pulse ON Time (PON), Pulse OFF Time (POFF), peak voltage (V), peak current (IP), dielectric flow rate (DF) [2], wire feed, and wire tension [3]. These parameters play a vital role in altering the performance outcomes like Material Removal Rate (MRR) and Surface Roughness (SR). Generally, a higher PON and higher IP increase MRR considerably, but increase the SR value, which is not desirable [4].
MRR and SR are interrelated in the working principles of the WEDM process. In this process, an electrical spark is generated between the wire and the workpiece in the presence of a dielectric fluid. The spark erodes the material from the workpiece, which is simultaneously washed away by the flowing dielectric fluid. When PON and voltage (V) increase, the intensity of the spark increases significantly. This increases the amount of material removed and increases the MRR value. Stronger sparks create deeper craters on the surface, resulting in an increased SR value. While it is theoretically possible to balance MRR and SR, achieving both high MRR and best SR is challenging. Therefore, precise adjustment of process parameters is essential to obtain high-quality machining results. The DF plays a crucial role in WEDM [5]. It helps both the workpiece and the wire to cool down from excess heat and to wash off the material debris. When they are not removed properly, they can stick to the workpiece again and reduce surface quality. A high DF can effectively wash off the debris, reducing the risk of secondary discharge and enhancing the stability of the sparking process. A lower DF can lead to the accumulation of debris in the gap between the wire and the workpiece, which leads to short-circuiting, unstable machining, and poor surface finish [6].
Han et al. analysed the impact of pulse duration on surface morphology using thermal and finite element analysis. They found that longer PON combined with lower IP removed material primarily by melting. When a short PON is combined with a higher IP, material is removed primarily through gasification [7]. Optimizing machining parameters is essential in any machining process, as it can reduce production costs and machining time while enhancing surface quality and overall process efficiency. Several techniques have been employed to identify the optimal parameters for the WEDM process. The most common methods include Taguchi’s Design of Experiments (DoE) [8,9], Response Surface Methodology (RSM) [4], Grey Relational Analysis (GRA) [10,11,12,13], Technique for Order Preference by Similarity to Ideal Solution (TOPSIS) [14], and Taguchi–Data Envelopment Analysis-based Ranking (DEAR) [15] for multi-response optimization. Machine learning (ML) techniques such as reinforcement learning and deep learning are also being explored in modern machining to predict the outcomes [16].
RSM was used to optimize WEDM process parameters for High-Strength Low-Alloy (HSLA) steel. The five input parameters included PON, POFF, V, I, and wire tension. A Central Composite Rotatable Design (CCRD) was applied to conduct 32 structured experiments by varying the input parameters. With the help of statistical analysis, including Analysis of Variance (ANOVA) and regression, RSM identified the most significant factors and their interactions [17]. The accuracy and precision of the result can be verified with the help of the coefficient of determination (R2). The R2 obtained for MRR was found to be 0.9924, indicating that 99.24% of the variation in MRR can be attributed to the process parameters calculated. The value of R2 for the SR model was found to be 0.9766. The predicted R2 and adjusted R2 were also consistent, having a difference of less than 0.2, with the predicted R2 being 0.9509 and the adjusted R2 being 0.9853 [18].
Current research has pointed out the efficacy of modern multi-objective optimization techniques in improving WEDM machining efficiency on Inconel superalloys. An ANN-based model in conjunction with the Non-dominated Sorting Genetic Algorithm II (NSGA-II) was proposed for optimizing MRR and SR in machining Inconel 718, resulting in an accuracy rate of 1–2% [19]. The multi-objective teaching–learning-based optimization (TLBO) technique was used for Inconel 686 material, optimizing the process parameters to obtain MRR and SR values of 0.0421 g/min and 3.102 µm, respectively [20]. The best surface finish value of 0.419 µm for Inconel 625 was obtained by using the PSO technique over GA under cryogenic conditions [21]. Ming et al. employed an extreme learning machine-enhanced Cuckoo Search algorithm (CSA) for EDM parameters for Inconel 718, maintaining prediction deviations below 20% [22].
Kumar et al. used the NSGA-II to determine the optimal WEDM parameters during machining of Inconel 718. Input parameters included wire tension, wire speed, IP, and PON. The response parameters were MRR and SR. A Taguchi-based DoE included an L27 orthogonal array, which was used to optimize the WEDM parameters for MRR and SR. The optimal parameters were identified through the Pareto front [23]. The NSGA-II was used to optimize the WEDM parameters for machining Ni55.8Ti. The input parameters were PON, POFF, spark gap voltage, and wire feed. MRR and SR were the responses. After NSGA-II optimization, an MRR of 0.021 g/min and an SR of 6.20 μm were attained [24]. The NSGA-II was used to optimize the parameters of a WEDM process on a tough ceramic composite made of ZrB2 and B4C. These materials are extremely hard and difficult to machine. The NSGA-II helped the researchers to identify a set of optimal input parameters called the Pareto front, which was then refined with the help of TOPSIS to attain a balanced solution. This helped to overcome the machining challenges and improved the total machining performance [25].
Rajan et al. used Particle Swarm Optimization (PSO) to optimize process parameters of Inconel 718 under the abrasive powder-mixed WEDM (APM-WEDM) process. WEDM process parameters, including PON, POFF, V, and IP, were considered. The Pareto optimal solutions were generated and showed a minimal deviation of 2.996% in MRR and 3.553% in SR [26]. The application of ML and multi-objective optimization in recent times has focused on using a hybrid approach to overcome the conflicting requirements for performance in non-conventional machining processes. In WEDM, Zhou et al. developed an ML framework, which compared various regression models, such as support vector regression, random forest, gradient boosting, and artificial neural networks (ANNs). The researchers selected the best-performing ANN to integrate with the NSGA-II to simultaneously optimize SR, MRR, and drum shape error in multi-pass WEDM [27]. Also, Jeet et al. used RSM along with an artificial neural network to optimize MRR and SR in WEDM of the Nimonic-C263 superalloy in relation to spark energy, spark frequency, and IP [28].
Applying the above-mentioned approach to the Inconel 718, Kumar & Dupadu took one step further compared to classical Pareto approach by establishing a link between the optimization of the WEDM process and the behaviour of discharge signals during the process, giving more physical meaning to the optimization process [29]. Altogether, these papers demonstrate a clear tendency to combine evolutionary algorithms and multi-criteria decision making (MCDM) approaches to make process optimization more robust and interpretable. To attain the best optimal parameters, researchers have used population-based, non-traditional optimization algorithms. These include the Genetic Algorithm (GA) [21], PSO [21], the NSGA-II [30], the Firefly algorithm (FA) [2], TLBO [31], Ant Colony Optimization (ACO), Artificial Bee Colony (ABC) methods, the Chicken Swarm Algorithm, Biogeography-Based Optimization (BBO), and the Sheep Flock Algorithm (SFO) [32]. The different works using the WEDM process parameter optimization are presented in Table 1.
Table 1.
Summary of the literature related to WEDM and optimization.
Current studies on WEDM of Inconel materials and Titanium alloys have mainly revolved around material-dependent studies, employing classical Taguchi-based or RSM-based multi-response optimization approaches, such as GRA, TOPSIS, or DEAR, which provide the optimal result as a single point, thus ignoring the material-dependent trade-offs between productivity and surface integrity. Though current studies have encouraged the usage of evolutionary approaches, the scope remains largely restricted to individual materials or wire electrodes. Further, the integration of statistically verified response models with Pareto optimization remains unexplored, while the treatment of recent advancements in various methods for optimization remains unreported. The RSM, PSO, and NSGA-II optimization algorithms are well-known methods and have been used separately or together in previous investigations on the WEDM process. The focus of this research is to systematically compare and combine these methods for multi-response optimization of process parameters, considering SR and MRR. Optimization methods are compared based on the same experimental data, process parameter constraints, and performance criteria, and finally, experimental verification of the chosen optimum is done. In summary, the main contribution of this study can be seen in the systematic comparison and combination of the known optimization methods rather than introducing a new one.
This work presents an integrated comparative multi-response optimization framework for WEDM, which combines RSM with the NSGA-II and PSO. Both the NSGA-II and PSO are thoroughly analysed using the same framework to understand convergence performance, population diversity, and robustness, which are not often discussed in the previous WEDM literature. This paper aims to answer appropriate research questions that are geared towards improving process optimization in WEDM, as shown in Table 2.
Table 2.
Research questions.
2. Materials and Methods
2.1. Research Framework
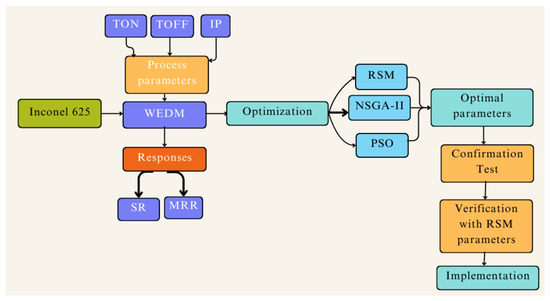
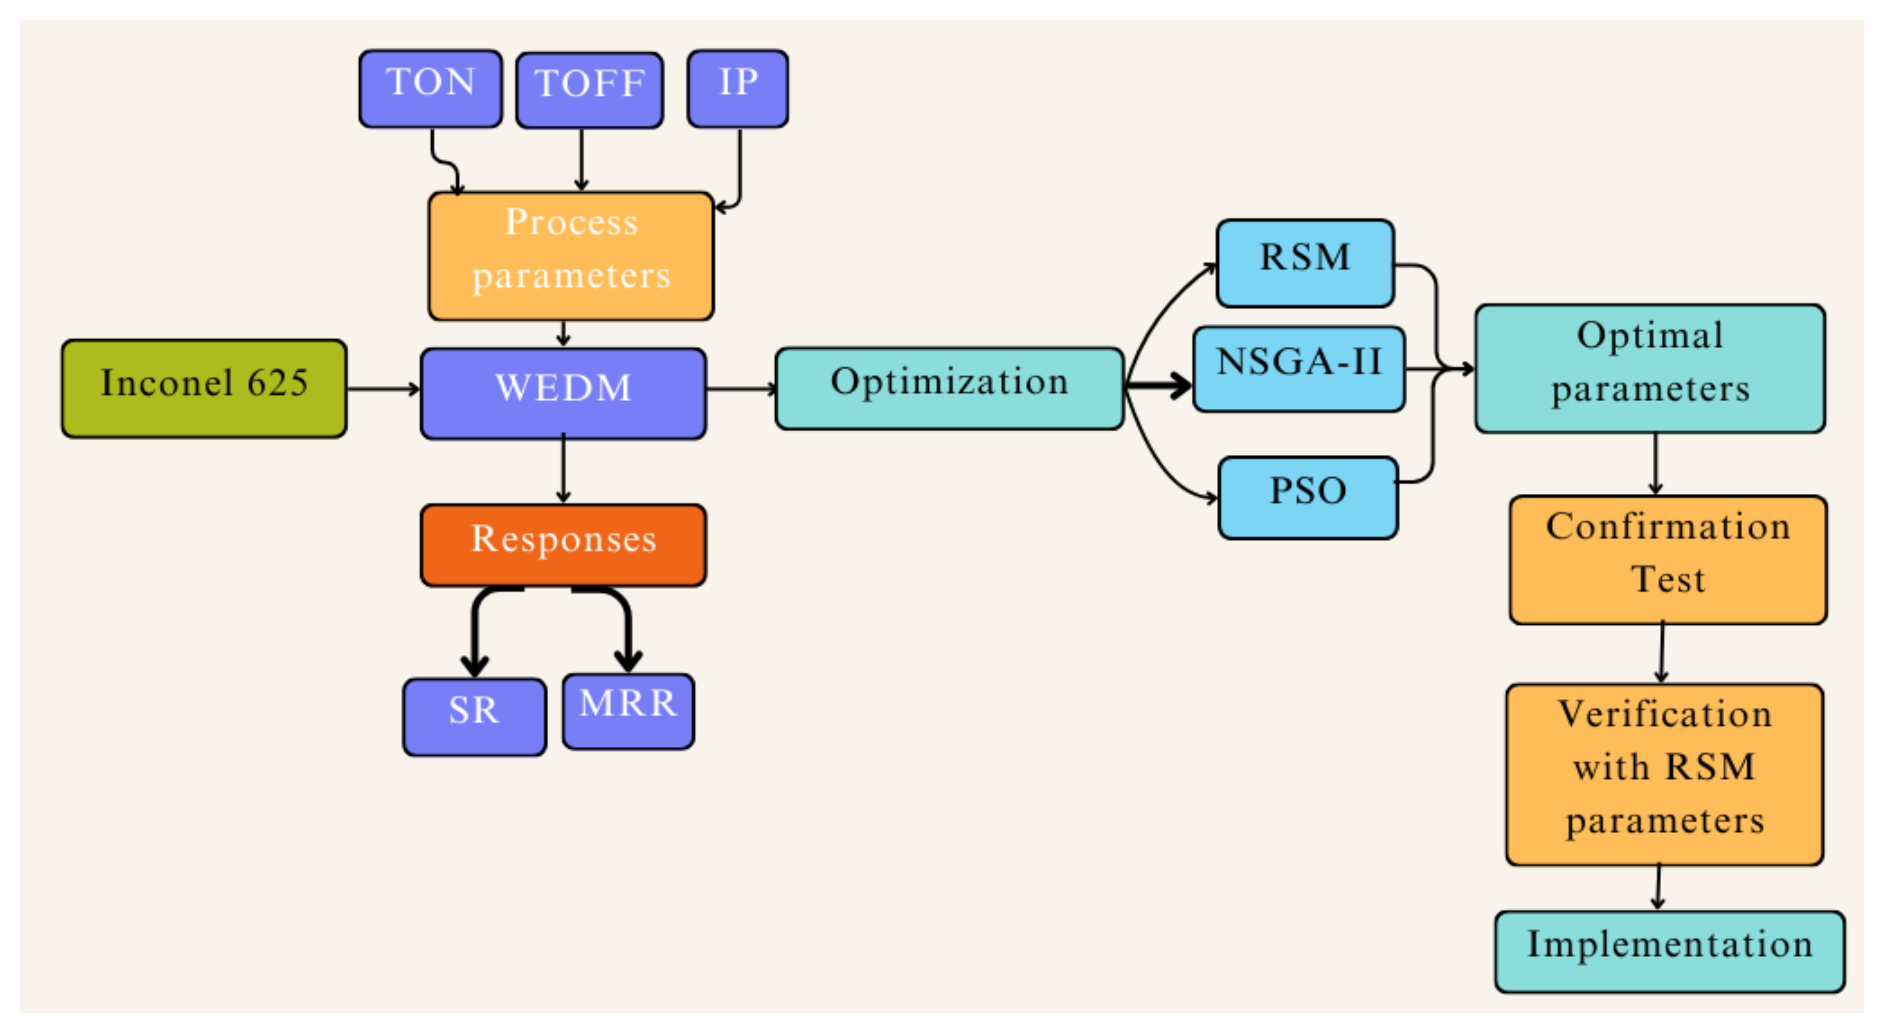
The research framework for the execution of multi-response optimization of WEDM is presented in Figure 1. Inconel 625 was considered as a workpiece material. The process parameters, such as Pulse ON Time (PON), Pulse OFF Time (POFF), and peak current (IP), were considered to evaluate the Surface Roughness (SR) and Material Removal Rate (MRR). RSM with a Face-centred Central Composite (FCC) design was employed to design the experiments. The experiments were performed on a CNC Concord Wire-cut—DK7731 WEDM, with a molybdenum wire of 0.18 mm diameter as the electrode. The objective function was obtained from RSM, and optimal parameters were obtained using the NSGA-II and the PSO algorithm. The results were verified with the RSM desirability function through a verification test.
Figure 1.
WEDM research framework.
2.2. Material Selection
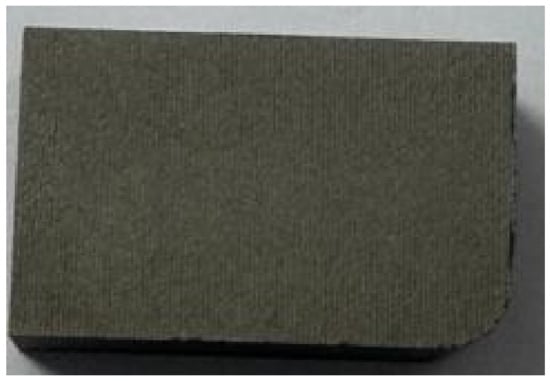
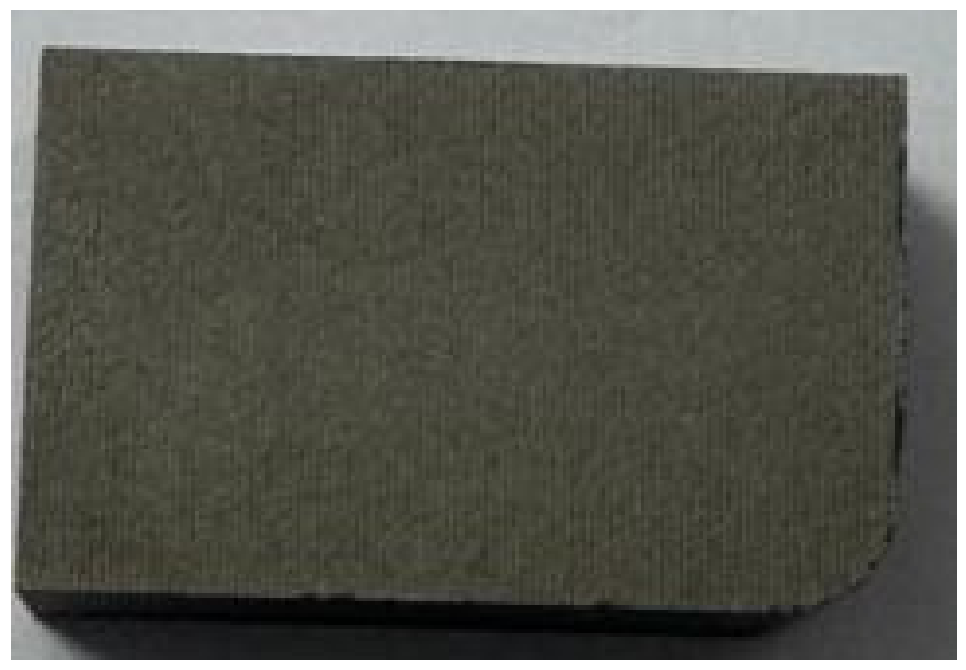
Inconel 625, a nickel-based superalloy known for its excellent temperature strength, corrosion resistance, and outstanding fatigue performance, was selected as the workpiece for this study. Due to this, the enhanced properties of Inconel 625 are most suitable for aerospace, marine, and nuclear applications. Though Inconel 625 renders the alloy difficult to cut using conventional methods, this justifies the adoption of the WEDM process. The workpiece was prepared as a rectangular block, as shown in Figure 2.
Figure 2.
Inconel 625 workpiece.
2.3. Experimental Setup
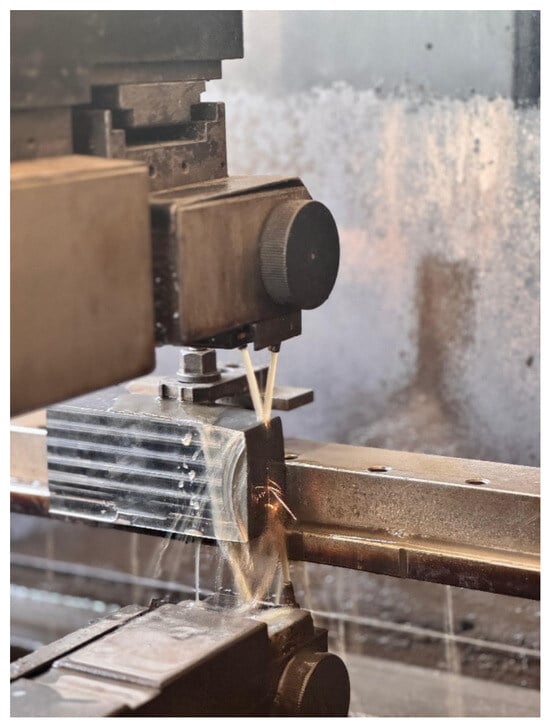
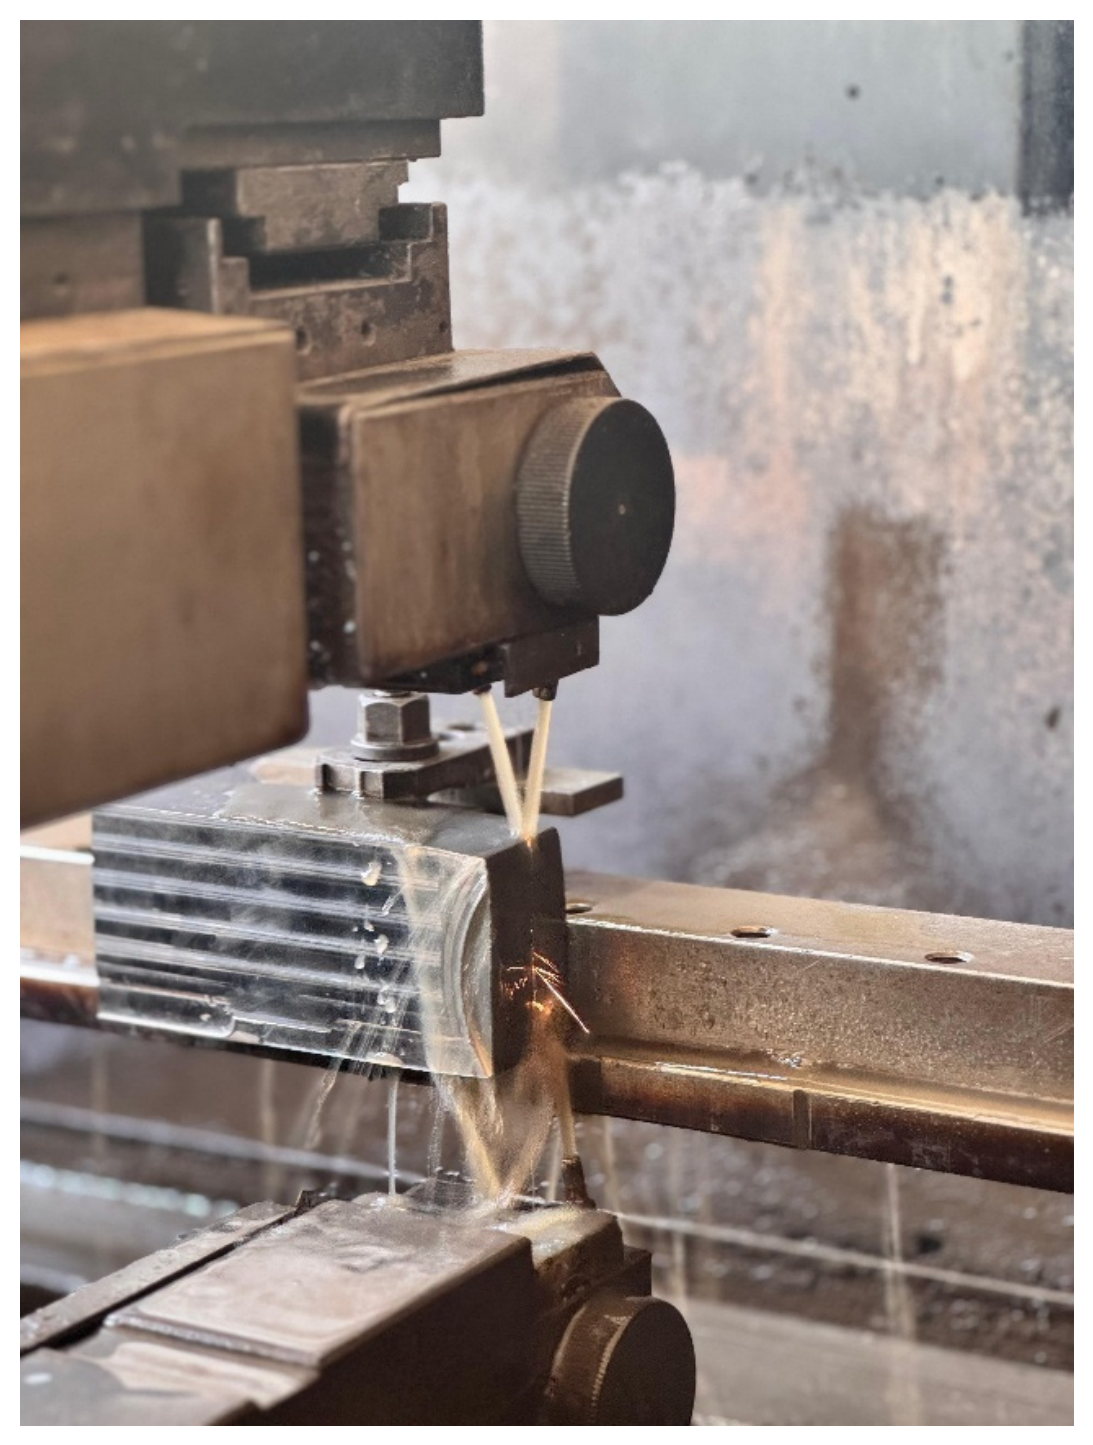
The experimental analysis was carried out on Inconel 625 using a CNC Concord Wire-cut—DK7731 WEDM (Figure 3). The Inconel 625 specimens were prepared and clamped on the WEDM table to ensure stable cutting throughout the experiment. A molybdenum wire electrode with a diameter of 0.18 mm was used due to its enhanced electrical conductivity, improved flushing characteristics, and improved spark stability during the machining of nickel-based superalloys. A mixture of JR3A wire-cut coolant gel and deionized water in a ratio of 1:40 was used as a dielectric medium to ensure efficient removal and discharge conditions during the experiment. The WEDM control parameters, such as PON, POFF, and IP, were considered major process parameters. These parameters were chosen because they directly influence discharge and energy during the machining process. Other parameters like wire tension (10 N), wire feed speed (20 m/s), servo/gap voltage (250 V), and dielectric flow rate (2 LPM) were kept constant during the experiment. The purpose of keeping these parameters constant was to evaluate the influence of PON, POFF, and IP on Surface Roughness and MRR. Each control parameter was varied at the selected levels within the stable cutting range of the machine to avoid breakage of wire and arcing. RSM-based FCCD was employed to design the experiments. The selected control parameter range and its levels are presented in Table 3. One trial of WEDM machining process was carried out by each experimental condition as per the experiment design. The same experimental setting and procedure of measuring was kept constant during the experiments to provide consistency of data for modelling and optimization of the response.
Figure 3.
Experimental setup.
Table 3.
WEDM control parameters and their levels.
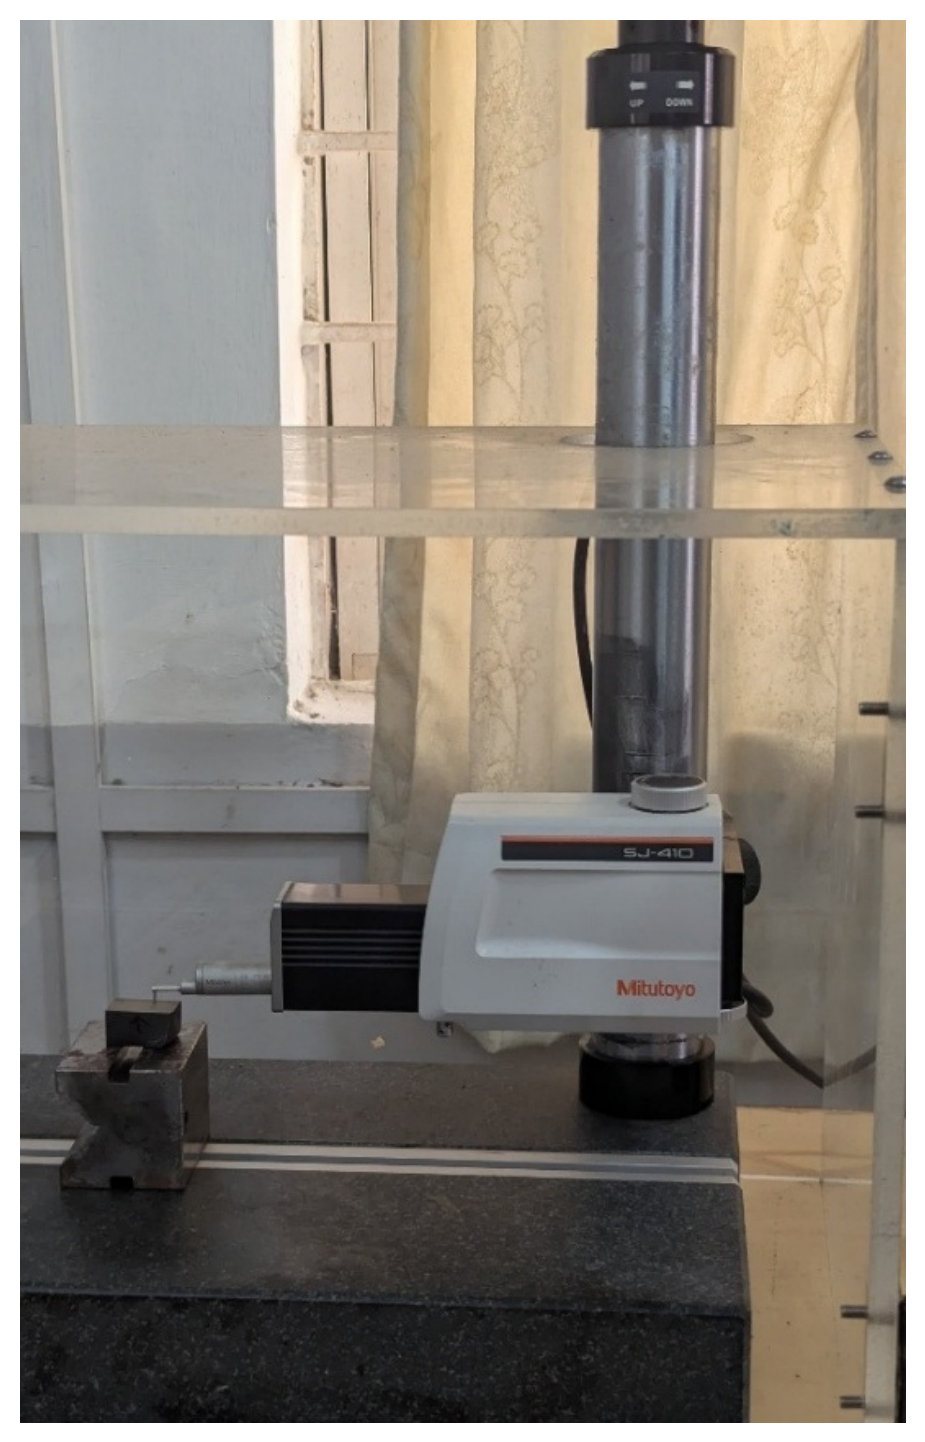
The SR and MRR were considered as the responses. SR measurements were then taken from three distinct representative points on the same specimen. The SR value was measured using a Mitutoyo Surftest SJ-410 Surface Roughness tester (make: Mitutoyo, model: SJ-410). Average Surface Roughness (Ra), which is the arithmetic average roughness of the machined surface, was considered as the surface quality variable. All measurements were done at a rate of 0.5 mm/s with a cut-off length (λc) of 0.8 mm. The stylus travelled perpendicularly to the main direction of the WEDM cutting process. For every experiment, three measurements were taken from different locations on the same machined surface, and the mean value was taken as the SR output. The measurement of SR is shown in Figure 4. MRR was computed based on the diameter of the wire used for machining. It is important to observe that the kerf width obtained by WEDM operation can become wider than the wire itself due to the presence of the discharge gap around the wire. The MRR value obtained is the estimated MRR based on the diameter of the wire. This method has been consistently used throughout all experimental settings for the comparative analysis of WEDM process parameters. The MRR value was computed using the formula given in Equation (1):
where F in mm/min is the machine feed rate (workpiece length/machining time);
Dw in mm is the wire diameter (0.18 mm);
H in mm is the thickness of the workpiece (20 mm).
Figure 4.
Measurement of SR.
2.4. Bio-Inspired Algorithms
2.4.1. Non-Dominated Sorting Genetic Algorithm II (NSGA-II)
The Non-dominated Sorting Genetic Algorithm II (NSGA-II) is an Multi-Objective Evolutionary Algorithm utilized for solving optimization problems with at least two conflicting objectives [30]. In this study, the NSGA-II was adopted to optimize the multi-objective functions (i.e., maximizing MRR and minimizing SR) encountered in the WEDM process. Strategies employed by the NSGA-II include fast non-dominated sorting, crowding distance, and elitism, which enable the preservation of diversity between solutions and convergence towards the Pareto optimal front. The algorithm starts with generating an initial population of size n, where n is the number of individuals/solutions that can be retained in each generation. Comparisons between solutions are then made to establish the optimal solution set. Non-dominated sorting guarantees that solutions are sorted in terms of dominance relationships, provided that the criterion below, as indicated in Equation (2), is satisfied [51]:
where i ≠ j, i, and j denote different solution numbers.
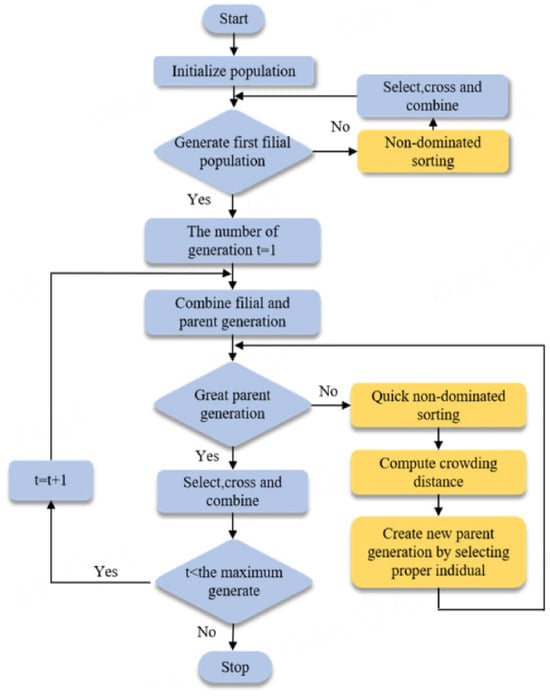
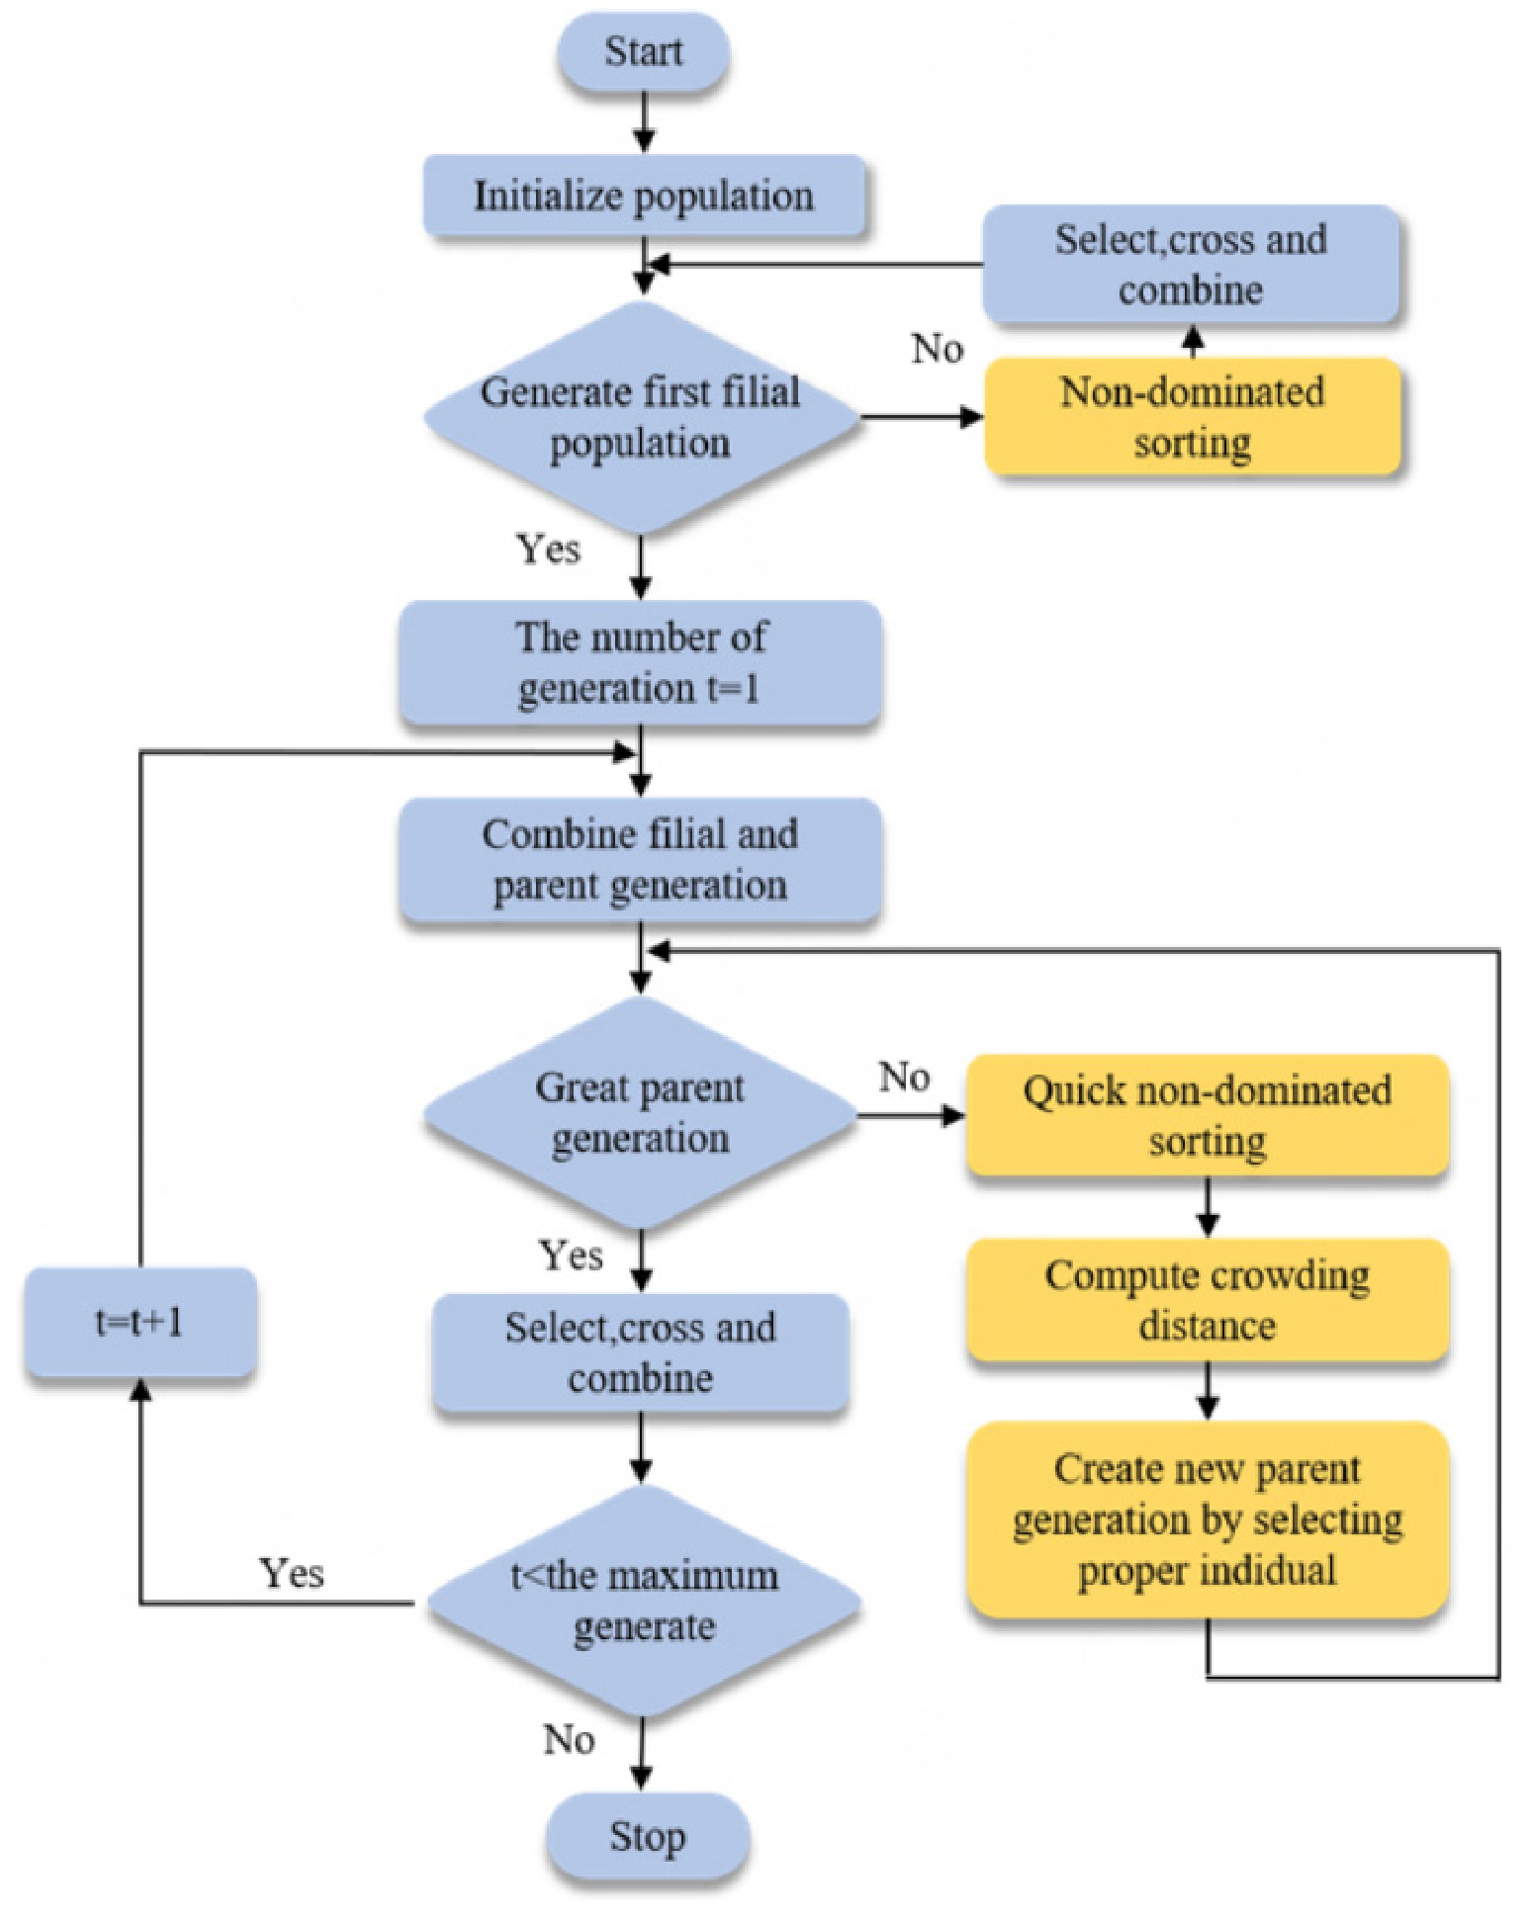
For sorting ‘n’ non-dominated solutions, those solutions are selected based on satisfying the above conditions, and then they are ranked 1; otherwise, these solutions are considered as dominated solutions. Likewise, the next non-domination sorting is performed on dominated solutions and ranks 2, and so on. Such iterations will go on until each solution gets its respective ranking. Also, based on the rankings, fitness value is allotted to the solutions. Crowding distance (CD) is calculated for each of the non-dominated solutions, and a high CD value results in better diversification of the population. The comparative analysis between tournament selection and the CD approach was used for selecting the parent solutions. Offspring solutions obtained from mutation and crossover operators, along with the initial population and offspring solutions, were used to achieve the non-dominated solutions. If the population size exceeded the maximum size, then a new population was created. Otherwise, the process continues similarly until a Pareto front of non-dominated solutions is achieved [19]. The flowchart for the NSGA-II algorithm is shown in Figure 5 [12]. The NAGA-II parameters are shown in Table 4.
Figure 5.
Flowchart for the NSGA-II algorithm.
Table 4.
NSGA-II parameters and their range.
2.4.2. Particle Swarm Optimization (PSO)
The Particle Swarm Optimization (PSO) algorithm is specifically designed for optimizing hard numerical problems and is inspired by human social behaviour [52]. For PSO, there are a number of simple objects known as particles that are distributed throughout the search space, where each of the particles is assigned an evaluation of the objective function at its position. Then, each particle is responsible for determining how it will move throughout the search space. At the end of this cycle, the swarm, which functions much like a group of birds searching for food, is expected to be closer to the fitness function’s optimum point [53].
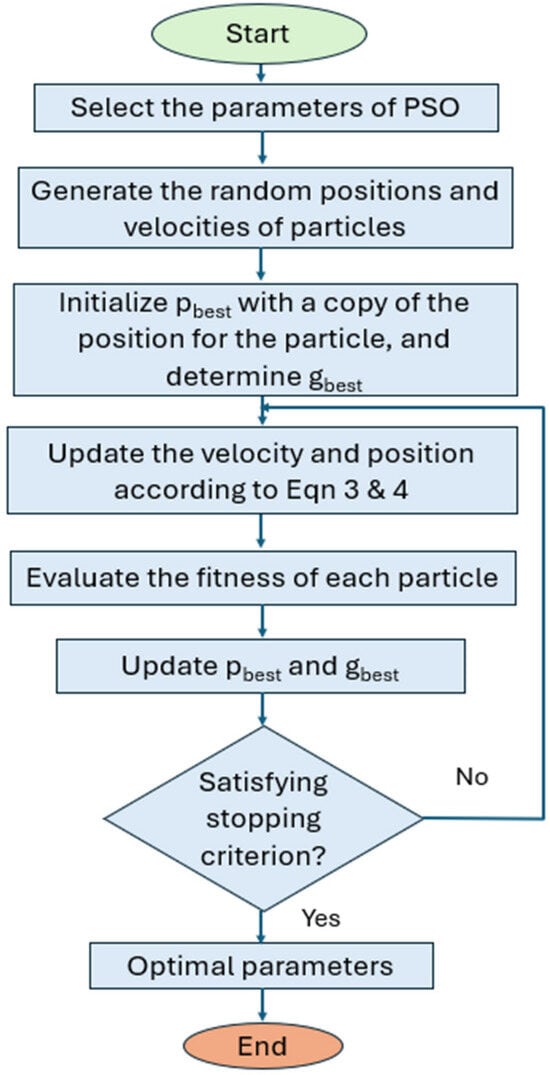
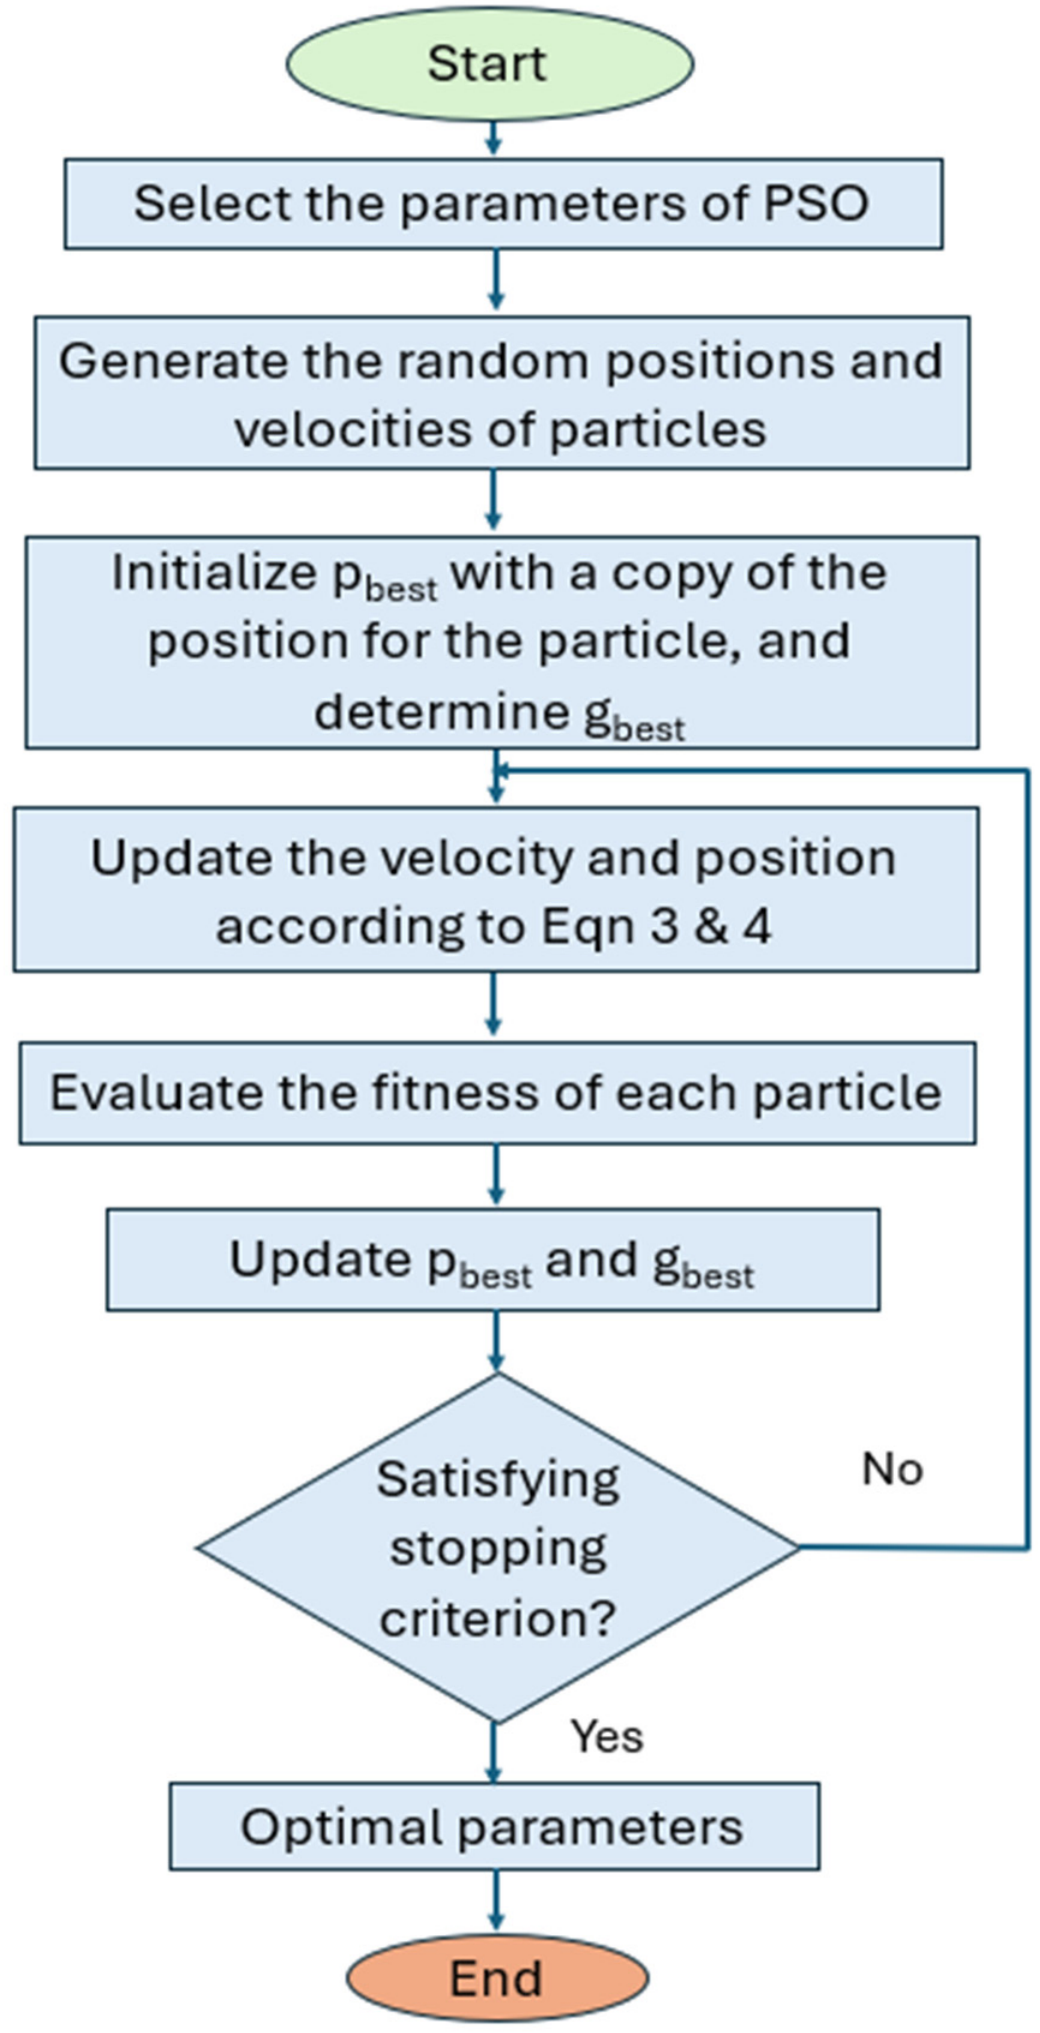
The dynamics of each individual particle in the search space are modified by dynamically changing the velocities of each particle depending upon its own flying experience and the flying experience of other particles within the search space. The position vector and the velocity vector of the ith particle in the D-dimensional search space are denoted by: Xi = (xi1, xi2, …, xiD) and Vi = (vi1, vi2, …, viD). According to the fitness function selected by the user, the position that gives the best fitness value pbest to each particle is selected, which can be denoted by Pi = (pi1, pi2, …, piD) and the global best value gbest so far obtained from any particle within the search space in the PSO algorithm. The Equations (3) and (4) are used to calculate the new velocities and positions of each particle:
Pbest and gbest are indicated by Pid and Pgd. In this case, w is the weight of the inertia factor that determines the ability to explore globally and locally. The constants c1 and c2 are the cognitive and social factors, respectively, while r1 and r2 are random numbers within the range of 0 to 1. The inertia factor weight is set at a high level initially, but it decreases as the process of searching continues [54]. The PSO algorithm parameters and their ranges are shown in Table 5. Figure 6 shows the flowchart of the PSO algorithm.
Table 5.
PSO parameters and their range.
Figure 6.
Flowchart for the PSO algorithm.
3. Results and Discussion
The experimental data obtained from the WEDM trials form the basis for subsequent modelling and optimization. Table 6 presents the measured responses (SR and MRR) under varying process parameters such as PON, POFF, and IP. The above findings can then serve as an important basis for constructing the required predictive models using RSM and for formulating the search spaces in metaheuristic techniques such as PSO and the NSGA-II.
Table 6.
Experimental results.
3.1. ANOVA
Analysis of Variance (ANOVA) is a method for determining the importance of factors of WEDM and the interactions between them by partitioning the total variability among different sources [55]. ANOVA is also used to assess the adequacy of the regression model obtained through RSM for WEDM parameter optimization and to determine the impact of each factor, such as PON, POFF, and IP, on SR and MRR. The ANOVA for SR and MRR is discussed in Table 7.
Table 7.
ANOVA for SR and MRR.
3.1.1. ANOVA for Surface Roughness
Table 7 shows the output from the ANOVA analysis performed on the response variable SR. The significance of the quadratic RSM model on the SR can be seen clearly since the computed F-value and the corresponding p-value are 363.45 and less than 0.0001, respectively, proving that the model effectively models the functional behaviour of the WEDM process parameters versus SR. This means that the probability of getting such a high value by chance is less than 0.01%. The lack of fit analysis revealed the insignificance of this phenomenon (F = 0.1615, p = 0.9665).
Amongst the individual parameters of the processes, PON was found to be the most dominating parameter influencing SR, with a contribution percentage of 57.39%. This is because the higher the value of PON, the higher the thermal energy released during each discharge, which leads to the formation of deep craters and rough surfaces. Similar results were found in the literature [56,57]. Linear significance of the parameter POFF was found to be statistically significant (p = 0.0002) with a contribution percentage of 1.27%, whereas IP had no significance at all with p = 0.1427. However, the interaction parameters of IP such as AC and BC (PON × IP, POFF × IP) contributed 9.02% and 8.02% to the response variable, respectively.
The coefficient of AB (PON × POFF) had a relative contribution to SR of 12.32% (p < 0.0001), further emphasizing the significance of balancing pulse time as an important factor affecting SR. It was also evident that all three quadratic coefficients of A2 (2.98%), B2 (6.83%), and C2 (1.65%) contributed significantly to the SR (p < 0.0001), thus establishing the nonlinear behaviour of the SR system and proving the appropriateness of using a second-order RSM model.
Model fitting statistics provide additional evidence on the appropriateness of the constructed model. The high value of the coefficient of determination R2 = 0.9996 suggests that 99.96% of the total variance in SR is accounted for by the model. An adjusted R2 of 0.9992 and predicted R2 of 0.9973 indicate a high correlation between predicted values and observed data with little difference (0.05), showing the model is free from overfitting and has good predictive ability. The adequate precision value of 193.6630, exceeding the minimum adequate value of 4, shows an adequate signal-to-noise ratio, making the model ideal for exploring the design space in the PSO and NSGA-II optimization process. Additionally, the small Coefficient of Variation (C.V. = 0.2845%) ensures experimental reproducibility.
3.1.2. ANOVA for Material Removal Rate
The ANOVA analysis for MRR is shown in Table 7. The second-order polynomial model for MRR is extremely significant (F-value = 23.24, p-value < 0.0001). The lack of fit is insignificant (F = 2.70, p-value = 0.1497) and indicates that there is no error due to the lack of fit in the experiment. Thus, the model is adequate and can be used for predictions inside the design space. In contrast to SR, MRR follows a completely different hierarchy of parameters. The interaction of BC (POFF × IP) is the primary source of variance, accounting for 37.43% (p < 0.0001). The squared A-term (PON2) accounts for 27.05% (p < 0.0001) of the variance, indicating that MRR is mainly controlled by the interactive and nonlinear behaviour of discharge energy parameters rather than individual linear parameters. The contributions of PON, POFF, and IP to MRR variance are 8.20% (p = 0.0013), 7.73% (p = 0.0016), and 5.40% (p = 0.0050), respectively. The linear terms are statistically significant. Interestingly, the linear contribution of IP to MRR is significant despite having a negligible effect on SR.
However, the terms AB (PON × POFF) and AC (PON × IP) proved to be insignificant for MRR (with values of p = 0.1351 and p = 0.1951, respectively) in stark contrast to their very high significance for SR. It is interesting to note that there is a clear difference in the significance levels of the interaction terms in both cases, thus suggesting that there is a completely different pattern of sensitivity in the two parameters and hence justifying the multi-response optimization process. The terms B2 and C2 were significant (p = 0.0196 and p = 0.0069).
According to the obtained model fit statistics, the model shows good predictive capability. The value of R2 being 0.9544 indicates that 95.44% of the total MRR variation can be accounted for by the developed model. Although the adjusted R2 and predicted R2 values of 0.9133 and 0.8191 are less than those in the SR model, they are still satisfactory enough for any engineering application. An adequate precision value of 18.9601 (above 4) implies an adequate signal-to-noise ratio for reliable navigation of the design space. The C.V. value of 3.23% also ensures that experiments can be reproduced accurately. The residual contribution for MRR (4.20%) is greater than that of SR (0.40%), indicating the potential involvement of other factors in the material removal process.
3.1.3. Comparative Parametric Influence on SR and MRR
From the ANOVA outputs, it is evident that there is a conflicting relationship between the parametric effects on SR and MRR, as shown in Table 7. In the case of SR, PON stands out as the most influential factor (57.39%) while making up 8.20% of MRR. On the other hand, the factors BC interaction and A2 have strong influences on MRR (64.48%), but their contribution to SR is low (11.00%). IP shows different tendencies since its linear effect on SR is very low (0.10%, p = 0.1427), whereas its effect on MRR is high (5.40%, p = 0.0050).
The balancing between the two response variables, because of their contrasting parametric effects, creates the basic rationale for adopting the approach of multi-response optimization. While PSO can be used to identify the global optimum for each of the two responses separately, the NSGA-II is adopted to create a Pareto optimal front that allows the determination of a balanced solution between SR and MRR. Both objectives have equal weightage. The regression equations obtained from the ANOVA can be used as an objective function for PSO and the NSGA-II.
SR = −1.94838 + 0.038747 ∗ PON + 0.814464 ∗ POFF + 0.56298 ∗ IP + 0.005116 ∗ PON ∗ POFF − 0.008754 ∗ PON ∗ IP + 0.082562 ∗ POFF ∗ IP − 0.000439 ∗ PON ∗ PON − 0.065995 ∗ POFF ∗ POFF − 0.131882 ∗ IP ∗ IP
MRR = 2.51729 + 0.155662 ∗ PON − 0.25796 ∗ POFF + 0.072363 ∗ IP − 0.002065 ∗ PON ∗ POFF + 0.003527 ∗ PON ∗ IP − 0.239902 ∗ POFF ∗ IP − 0.001739 ∗ PON ∗ PON − 0.060134 ∗ POFF ∗ POFF − 0.293567 ∗ IP ∗ IP
Objective Function = 0.5 ∗ SR + (1/(0.5 ∗ MRR))
3.2. Effect of Process Parameters on SR
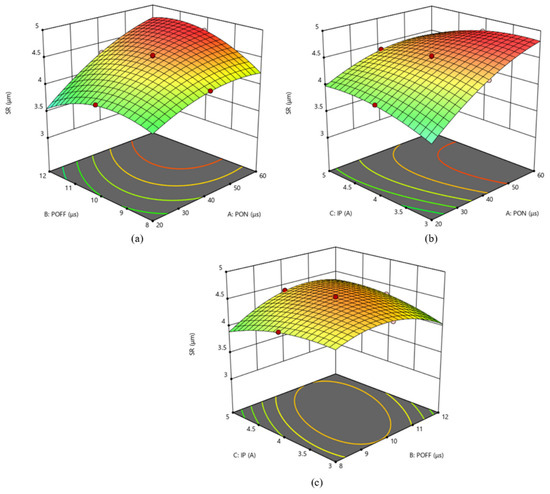
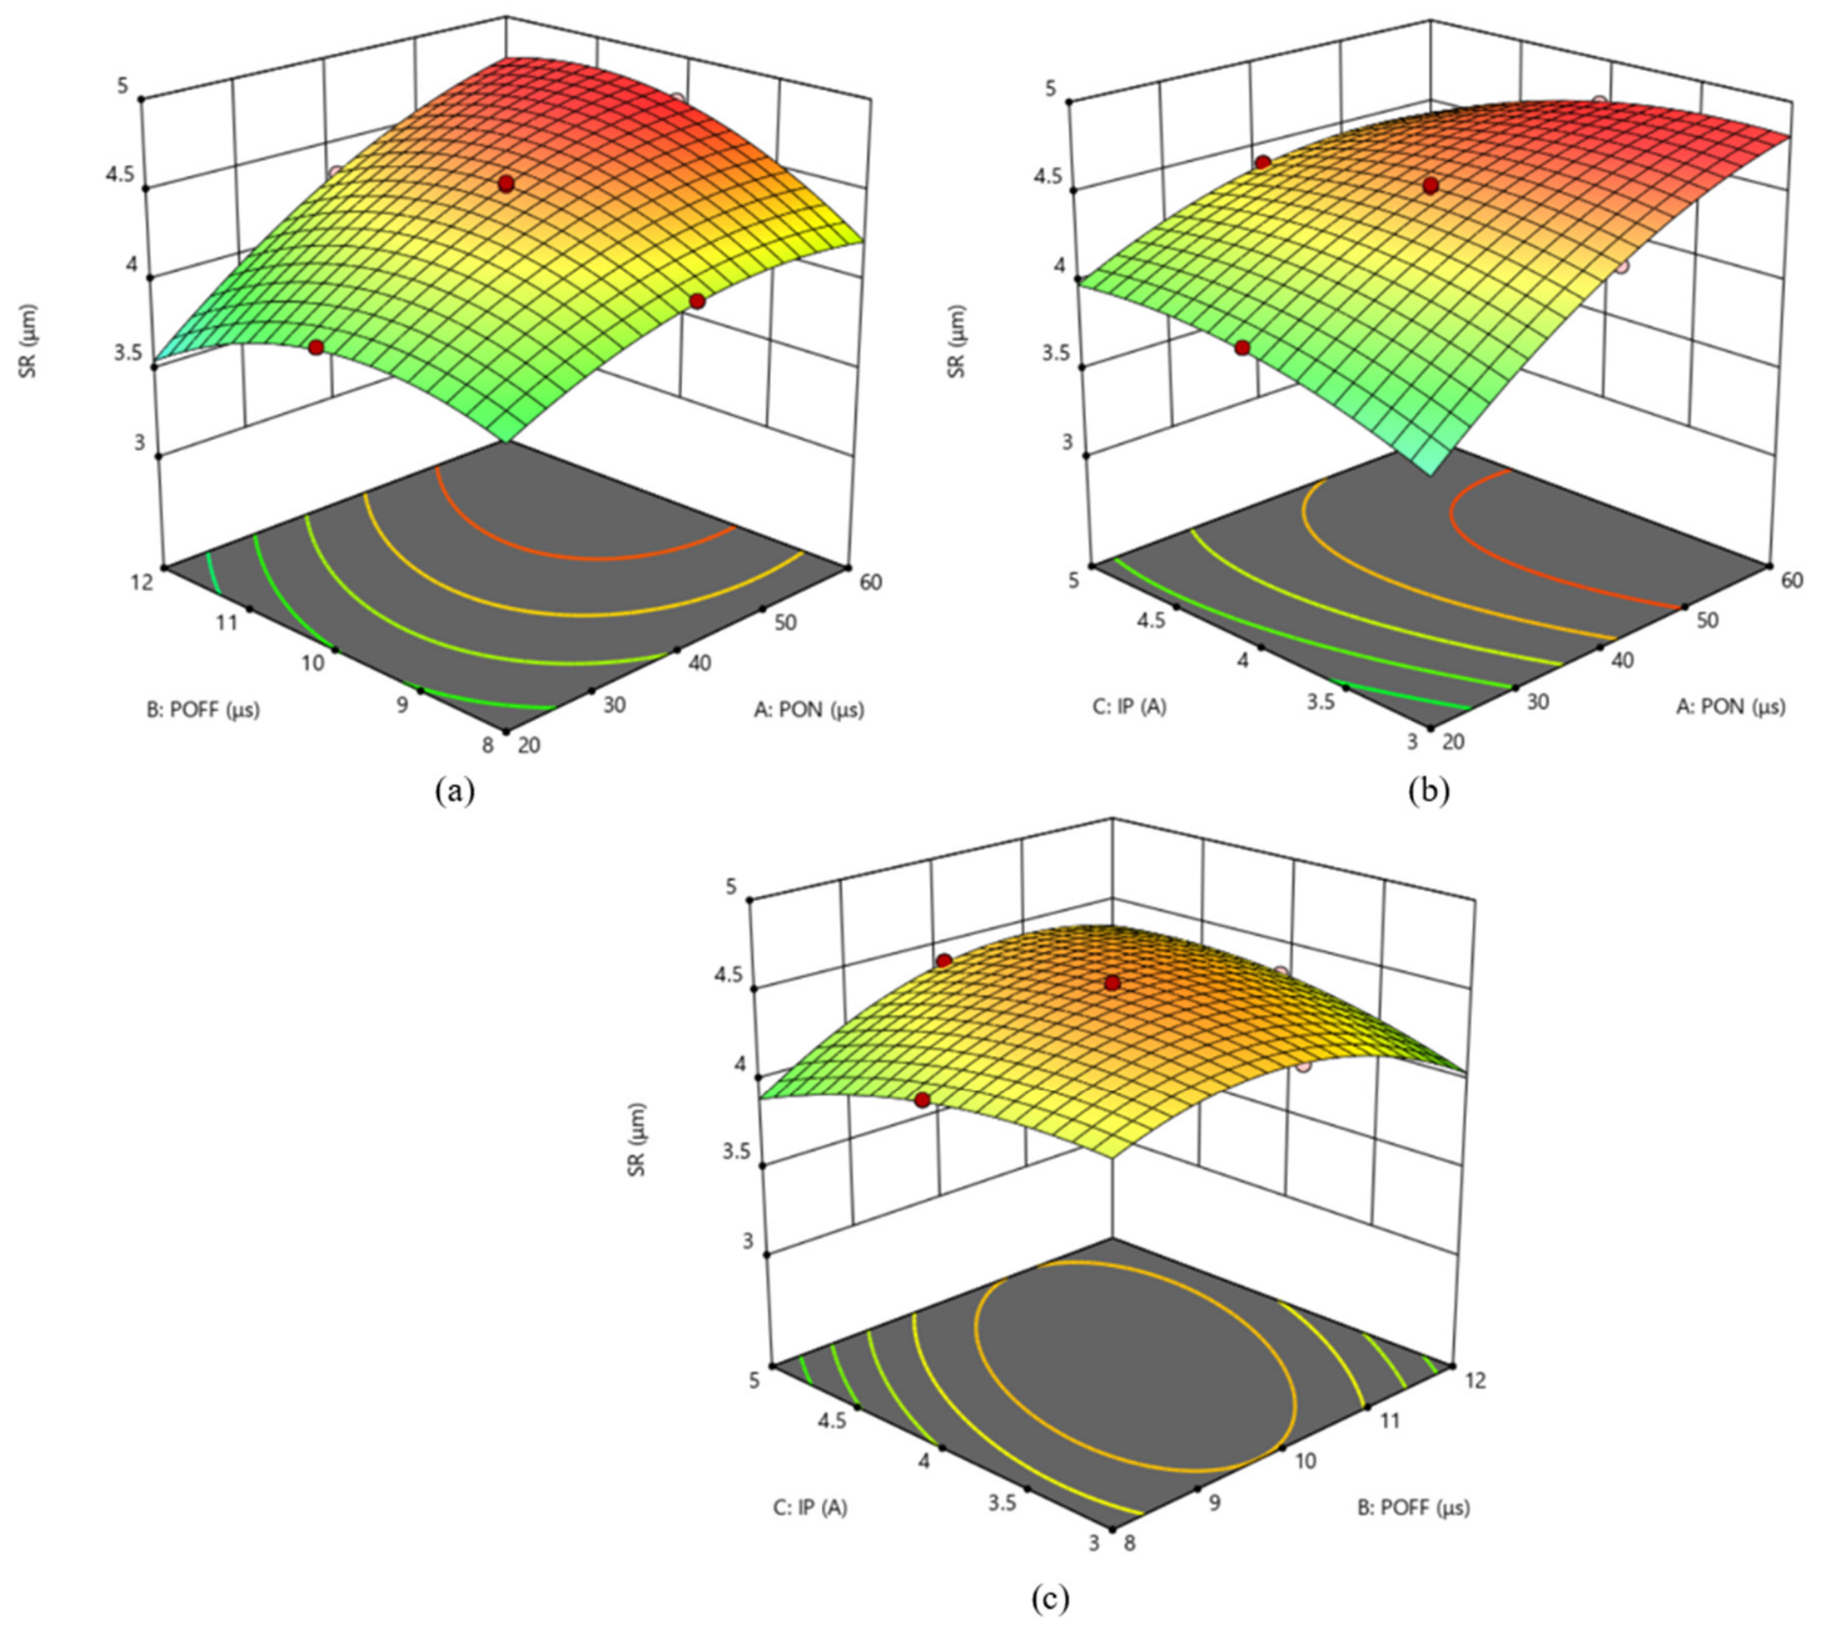
The 3D response surface diagrams developed using RSM show a graphical representation of the effect of the interaction of the WEDM process parameters, such as PON, POFF, and IP, on the output response SR (Figure 7). These diagrams help to understand the effects of individual and combined parameter effects on SR, and thus, optimal values of machining parameters that minimize Surface Roughness can be determined.
Figure 7.
Effect of process parameters on SR (a) PON vs POFF, (b) PON vs IP, (c) POFF vs IP.
The plot for the response surface (Figure 7a) shows that SR varies considerably with an increase in PON, while the influence of POFF is somewhat moderate but opposing. For PON ≈ 20 µs, all SR values lie in the range 3.0 to 3.5 µm, regardless of the values of POFF. With increased PON values up to 60 µs, SR becomes very high, about 4.8 to 5.0 µm, especially for lower POFF values. The contour plot, at the bottom, clearly shows an elliptic shape with a minimum SR area at low PON and high POFF values, showing a considerable interaction between the two variables.
The drastic slope exhibited by the surface with respect to the PON axis clearly indicates its significant influence (57.39%) on SR. Higher durations for PON result in prolonged periods for the electric spark, hence transferring greater amounts of thermal energy into the work surface per spark event. Because of greater energy input, deeper and bigger craters are formed upon resolidification, which adversely affects the quality of the surface. However, increasing the value of POFF helps to some extent by providing sufficient time for the dielectric fluid to flush out the debris.
The 3D surface plot in Figure 7b illustrates that SR increases with increasing PON across all levels of IP. At low PON (≈20 µs), SR remains relatively low (≈3.0–3.5 µm) regardless of the IP level. As PON increases to 60 µs, SR escalates to nearly 4.5–5.0 µm even at moderate IP settings. The influence of IP on SR is comparatively moderate in its linear trend; however, a noticeable interaction is observed at higher PON combined with higher IP, and the surface deterioration is more pronounced [8]. The contour ellipses at the base indicate that the minimum SR region is confined to the zone of low PON and low-to-mid IP values, confirming the significance of the AC interaction (9.02% contribution from ANOVA).
The combined effect of PON and IP on SR reflects the cumulative discharge energy delivered to the machined surface. While the parameter PON controls the period of spark occurrence, IP affects the strength of the discharge current. With the increase in both PON and IP, there is an increase in heat energy released during the operation cycles, thus leading to the formation of larger and deeper craters and higher values of recast layer and Surface Roughness. In contrast to PON, the lower gradient value in the IP axis implies that the linear effect of IP on SR is insignificant (0.10%). Therefore, maintaining low PON with moderate IP is advisable to minimize SR.
The response surface for the POFF–IP (Figure 7c) interaction on SR exhibits a relatively flatter and more gradual curvature compared to plots (a) and (b), indicating a less steep but still meaningful combined influence. SR values range from approximately 3.7 µm to 4.7 µm across the design space. SR tends to increase at lower POFF values combined with higher IP levels, while the minimum SR region, as confirmed by the near-circular to elliptical contour pattern at the base, is located at intermediate-to-high POFF values and low-to-moderate IP levels. The broader contour spread indicates a wider feasible region for achieving acceptable SR values when PON is controlled at its centre level.
The BC interaction (POFF × IP) contributes 8.02% to SR variation, as confirmed by ANOVA. At lower POFF settings, insufficient inter-pulse delay restricts the dielectric fluid from effectively flushing away the molten debris and resolidified particles from the machining zone. Where this happens to be in conjunction with a higher IP value, the accumulation of the deposited material, along with the increased discharge energy, will act together to deteriorate the Surface Roughness. An elevated POFF will ensure sufficient cooling and cleaning during the intervals between pulses and thereby help in minimizing the thickness of the recast layer. It is also noted that the consistent nature of the curve indicates the importance of the quadratic effect of both B2 and C2 factors found through ANOVA.
Together, the three-dimensional response surface plots infer the following:
- The PON is the most significant factor affecting the SR in the WEDM process, having the maximum gradient among the three response surface graphs, considering the high percentage contribution of 57.39% from the ANOVA analysis. Lowering the PON is considered the best way to achieve an improved surface finish.
- Two-way interaction effects between all three factors (AB, AC, and BC) are evident from the plots, which clearly show that none of the factors can be optimized individually because the response surfaces are twisted and not flat, implying interaction effects.
- The POFF moderates the response of the SR; higher values of the POFF will result in lower SR since more efficient dielectric flushing and better inter-pulse recovery will occur. The SR is independent of changes in the PON and IP.
- The IP affects the SR through interactions with other factors, especially with the PON and POFF. There is no linear relationship between IP and SR, as observed from the response surface in Figure 7b,c.
- The curvatures present in all three graphs confirm that the proposed quadratic model is adequate for optimizing the SR using the RSM method combined with PSO and the NSGA-II.
3.3. Effect of Process Parameters on MRR
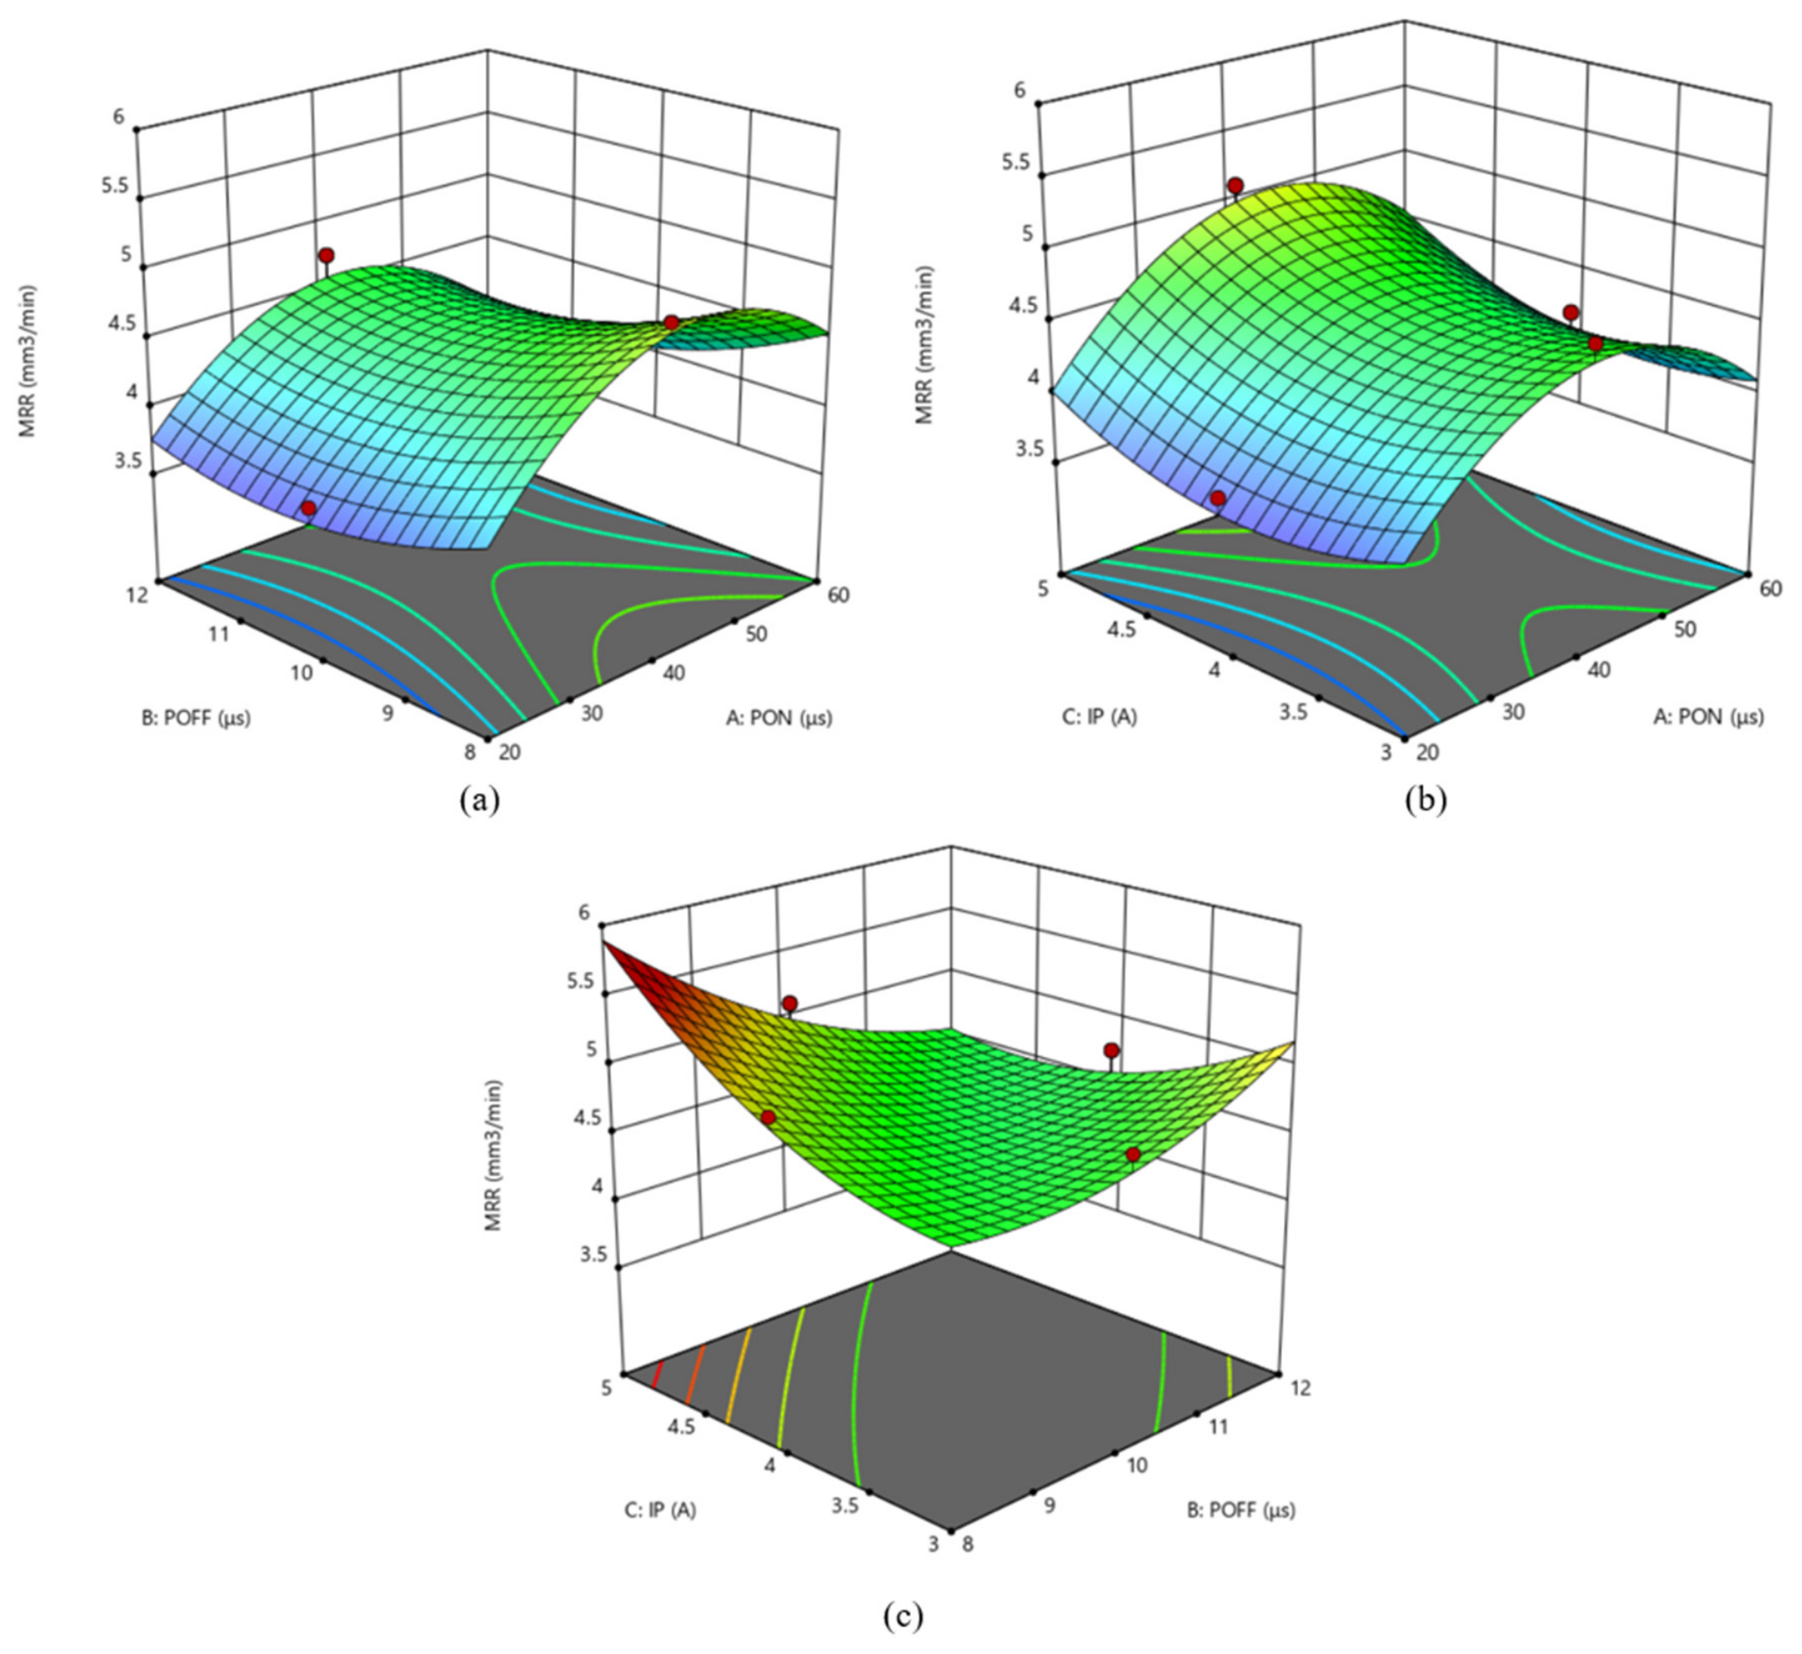
The three-dimensional response surface plots generated through RSM provide a visual representation of the relationship between WEDM process parameters and the resulting MRR, as presented in Figure 8. The plot of the response surface (Figure 8a) shows the existence of a nonlinear interaction between the input variables PON and POFF and the output response, MRR. When PON is lower (approximately 20 µs), the MRR value tends to be low at about 3.5–4.0 mm3/min regardless of the value of POFF. As the PON value increases toward the intermediate level (approximately 40 µs), the value of the MRR increases significantly to reach about 4.5–5.0 mm3/min. Above this intermediate value of PON, a plateau followed by a small decrease in the MRR value can be noticed, especially when POFF values are low. The presence of a clear saddle-shaped response surface indicates the domination of the quadratic effect of A2 (with 27.05%) identified from ANOVA. The contour pattern shows parallel bands for POFF at the bottom, which indicates the moderate independent effect of POFF on MRR at constant PON values.
Figure 8.
Effect of process parameters on MRR (a) PON vs POFF, (b) PON vs IP, (c) POFF vs IP.
The nonlinear relationship between MRR and PON is due to the two effects caused by PON duration in WEDM. For medium values of PON, the energy released during the discharge would be enough to melt the workpiece material and achieve optimum material removal. Nevertheless, when PON is too high, there will be an increase in heat generation, leading to excessive build-up of the recast layer, thus lowering MRR. Higher values of POFF for very high PON ensure more time between the pulses for regaining dielectric strength and removal of debris, hence decreasing the rate of reduction in MRR. The relationship is similar to the presence of a large A2 value for the quadratic effect of PON on MRR (27.05%) and a low A term for the linear effect (8.20%) as seen from the ANOVA results.
The three-dimensional surface graph presented in Figure 8b shows that MRR reacts nonlinearly to the variation in both PON and IP. At lower values of PON (about 20 µs) and IP (about 3 A), the lowest value of MRR can be achieved, about 3.5 mm3/min. As PON or IP increases from lower to intermediate values, MRR steadily rises. In an intermediate range of PON (about 35–45 µs) together with high IP values (about 4.5–5 A), the highest values of MRR (about 5.0–5.5 mm3/min) are obtained. However, MRR decreases as PON further increases beyond an intermediate level, even when IP is kept at a relatively high level. The surface slope of MRR with respect to the PON parameter appears to be greater than that for IP, demonstrating the larger nonlinearity effect of PON on MRR compared to IP.
PON vs. IP interaction is associated with the joint effect of discharge duration and discharge intensity on the material erosion rate in the WEDM process. An increase in IP implies higher discharge current density and, hence, higher instantaneous thermal energy input to the workpiece, leading to higher energy density for material melting and vaporization per pulse. By combining these factors with an optimal PON, the maximum amount of material can be effectively removed [8]. But with a PON too high, even at increased IP values, energy saturation effects begin to play out, and any further increase in discharge duration results not in further effective material erosion but, rather, in the erosion of the wire electrode, short circuits, and deposition of eroded material back into the workpiece. This phenomenon accounts for decreasing MRR along the high PON-high IP region of the response surface. Although the AC interaction term is not statistically significant (p = 0.1951), it is clearly visible on the surface in the form of a slight twisting of the latter, whereas significant effects of the two factors themselves (p = 0.0013 for PON; p = 0.0050 for IP) are readily observable.
However, the contour plot for the effect of interaction between POFF and IP on MRR (Figure 8c) presents the most pronounced curvature compared to other contour plots. This interaction produces an apparent valley-type contour plot, which shows that MRR attains its minimum value (approximately 3.5–3.8 mm3/min) at the highest levels of POFF (≈12 µs) and lowest levels of IP (≈3 A). On the other hand, there is a sharp increment in MRR values when POFF is decreased, and IP is increased simultaneously until it reaches its maximum values at around 5.5–5.8 mm3/min. It can be observed from Figure 8c that there are densely packed contour lines at the lower levels of POFF on the IP axis. This represents that there is a high sensitivity of MRR to IP under the condition of lower inter-pulse delays.
The high correlation between BC can be attributed to the dual effect of POFF time and IP on material removal efficiency. In the case of high IP, high discharge energy will occur for each pulse, leading to high material melting and evaporation. At the same time, when POFF is kept low, the highest pulse frequency will be achieved since a shorter pulse-to-pulse interval allows the generation of sparks at a higher frequency. The combination of high energy and high frequency leads to high MRR. On the contrary, POFF with low IP gives the least MRR since high POFF causes low energy and long pulse intervals, hence a lower number of sparks generated within a particular period. The statistical significance of B2 (p = 0.0196) and C2 (p = 0.0069), as indicated by the nature of the curved saddle-shaped surface, shows the quadratic effect of the independent variables. To achieve optimum MRR, POFF and IP should be low and high, respectively.
The response surface plots of MRR indicate the following:
- The MRR values show strong nonlinearity about all WEDM variables (with marked quadratic nature especially for the PON variable—A2, 27.05%) and thus, is different from the SR response variable which is dominated by linearity.
- The interaction between BC and POFF × IP is the most important parameter for MRR (37.43%), indicating that pulse frequency and discharge current need to be optimized together instead of individually for maximizing MRR.
- Optimal intermediate PON needs to be achieved; otherwise, the MRR value will decrease because of energy saturation, recast formation, and degradation of the wire electrode.
- The effect of IP on MRR (5.40%, p = 0.0050) is more pronounced than its effect on SR (0.10%, p = 0.1427), thereby highlighting the conflicting nature of sensitivity parameters for these two responses and providing justification for applying the NSGA-II technique to multi-objective optimization.
- The optimal settings of the control variables for minimal SR and maximal MRR—low PON and high POFF for minimal SR, and intermediate PON, low POFF, and high IP for maximal MRR—further support the fundamental conflict in WEDM between workpiece quality and productivity and provide effective resolution through Pareto optimal solutions.
3.4. Process Parameter Optimization
There are many performance measures in the WEDM process, like MRR and SR. There tends to be some contradiction in terms of the measures. Therefore, the use of RSM models along with the PSO algorithm and the NSGA-II was employed for multi-response optimization. First, RSM was utilized for both modelling and optimization of the multiple responses. The accuracy of RSM is high in terms of creating predictive equations, while PSO and the NSGA-II were able to search through the design space and find the best possible parameters that would optimize the trade-off between maximizing MRR and minimizing SR.
3.4.1. Multi-Response Optimization Using RSM Desirability Function
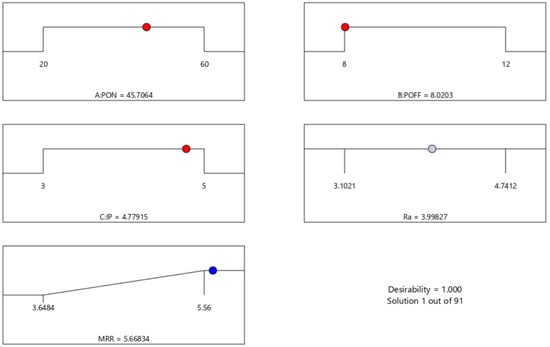
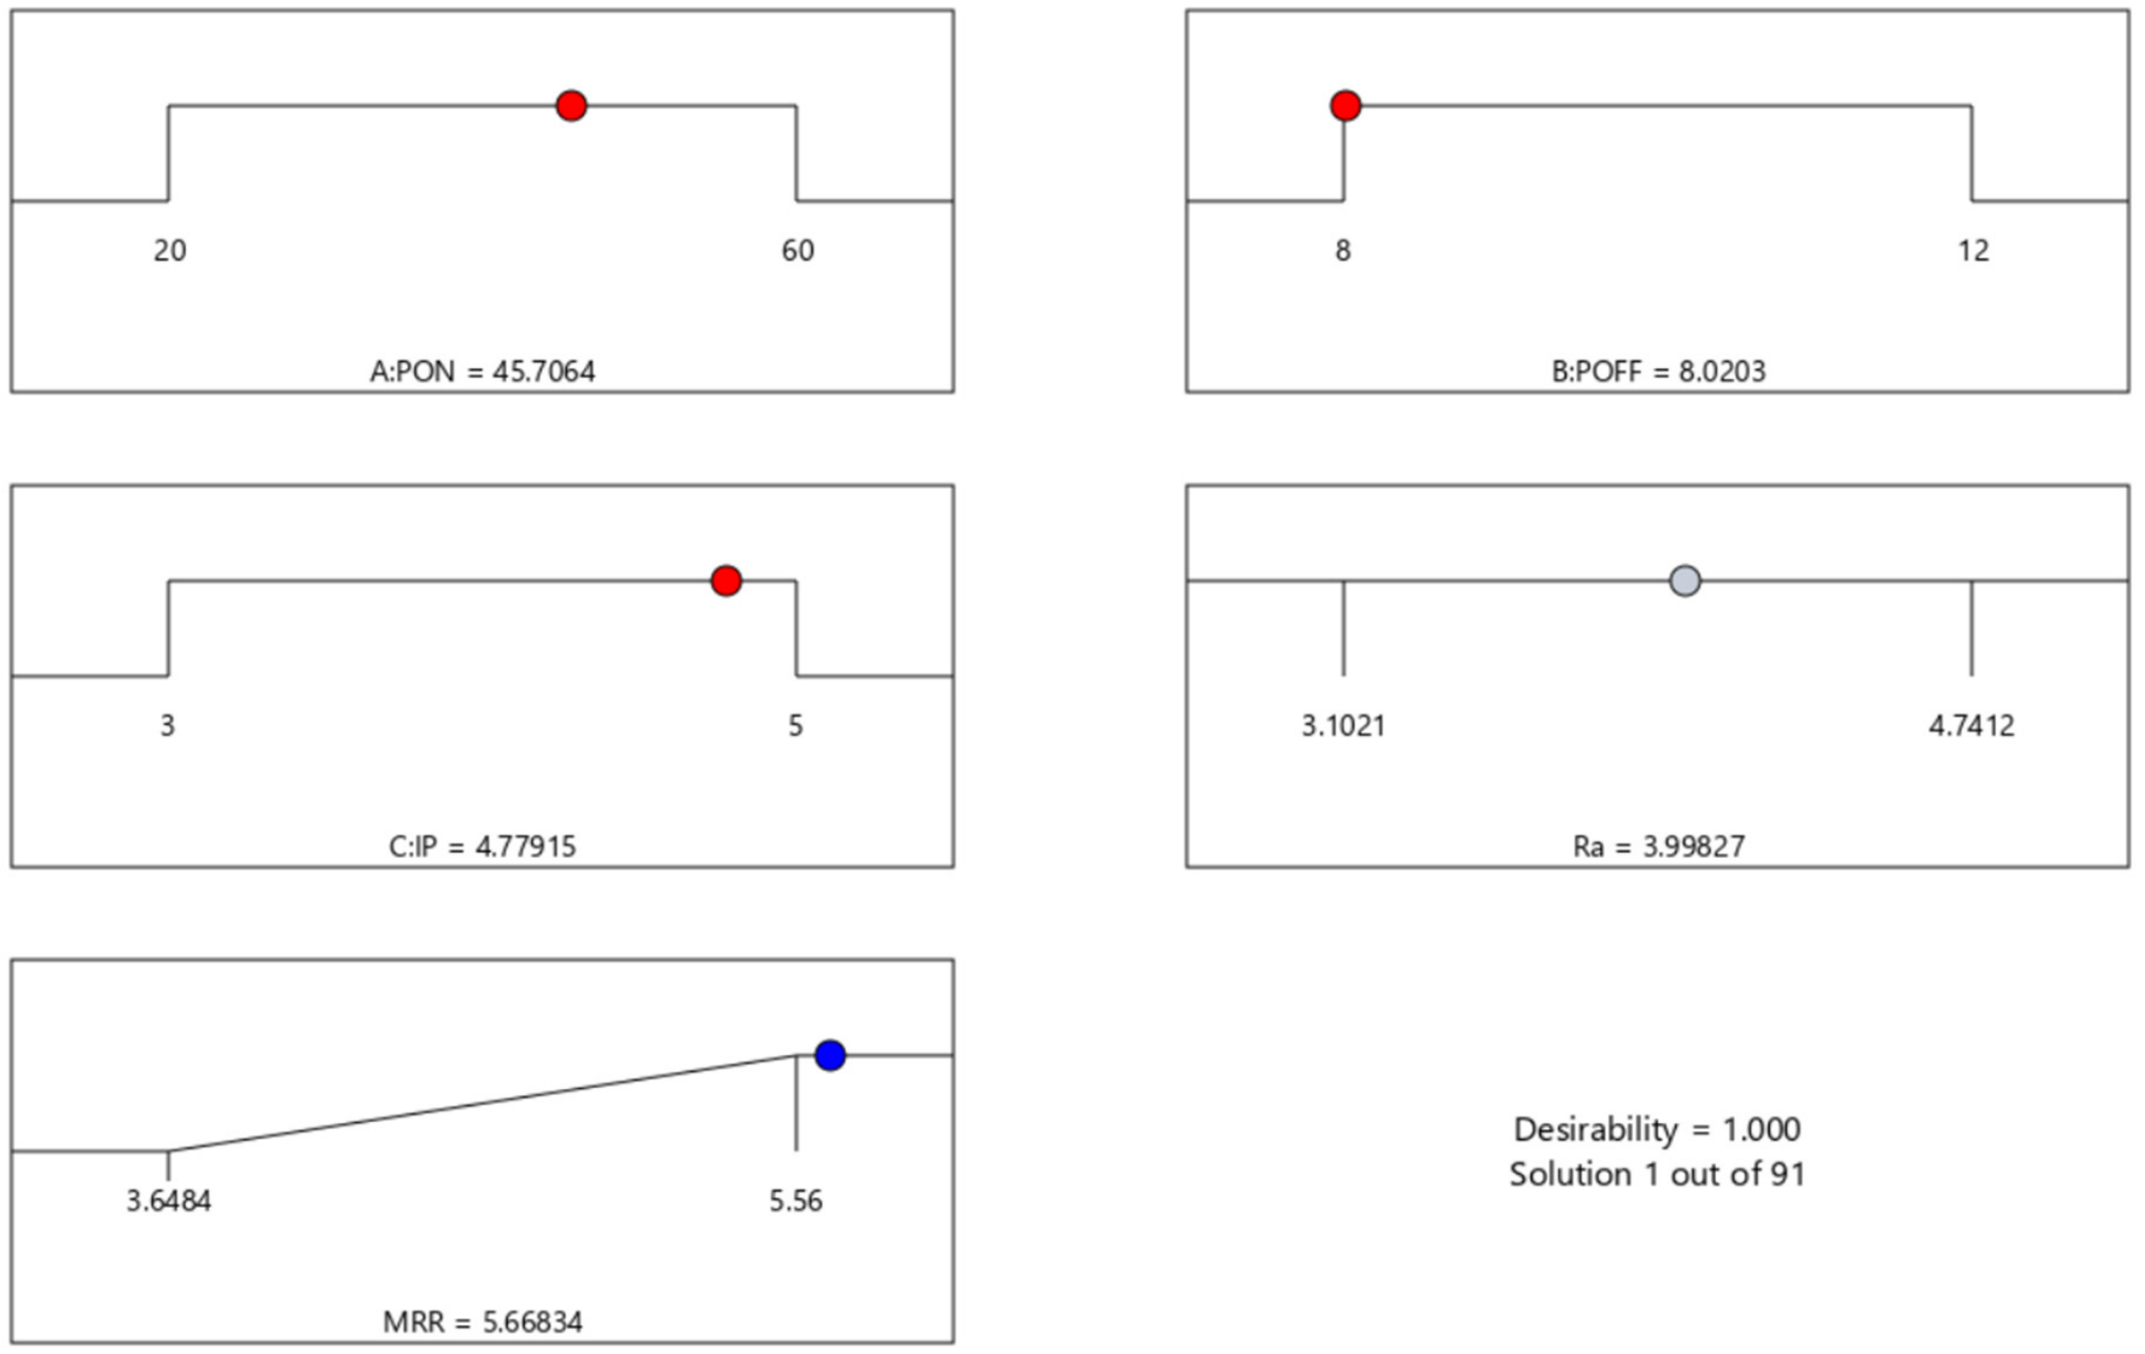
Multi-response optimization was done by utilizing the desirability function technique, which aimed at optimizing both MRR and SR simultaneously. In this method, several responses are combined in terms of a dimensionless scale varying from 0, which means completely undesirable, to 1, which is the ideal response. The desirability function for each response is determined considering the goal of each response. The desirability function for all responses is found out by taking the geometric mean of the individual desirability function. Optimization was used to determine the optimized parameter values and presented in Figure 9. Optimal machining parameters are presented in Table 8. With the help of optimized parameter values, the following response values can be obtained. The MRR value was found to be 5.664 mm3/min and the SR value was 3.99 μm.
Figure 9.
RSM: Optimal parameters from the desirability function.
Table 8.
Optimal machining parameters.
3.4.2. Multi-Response Optimization Using PSO
Particle Swarm Optimization (PSO) was used to achieve optimization of the WEDM process parameters using a multi-response approach. As opposed to the desirability approach where several responses were combined to give one objective function, PSO can provide the optimal solutions. The PSO algorithm was parameterized as follows:
- •
- Swarm size: 50 particles
- •
- Maximum iterations: 100
- •
- Inertia weight (w): 0.7
- •
- Cognitive coefficient (c1): 1.5
- •
- Social coefficient (c2): 1.5
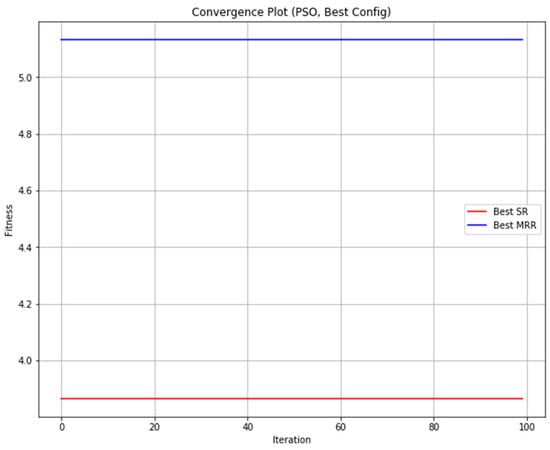
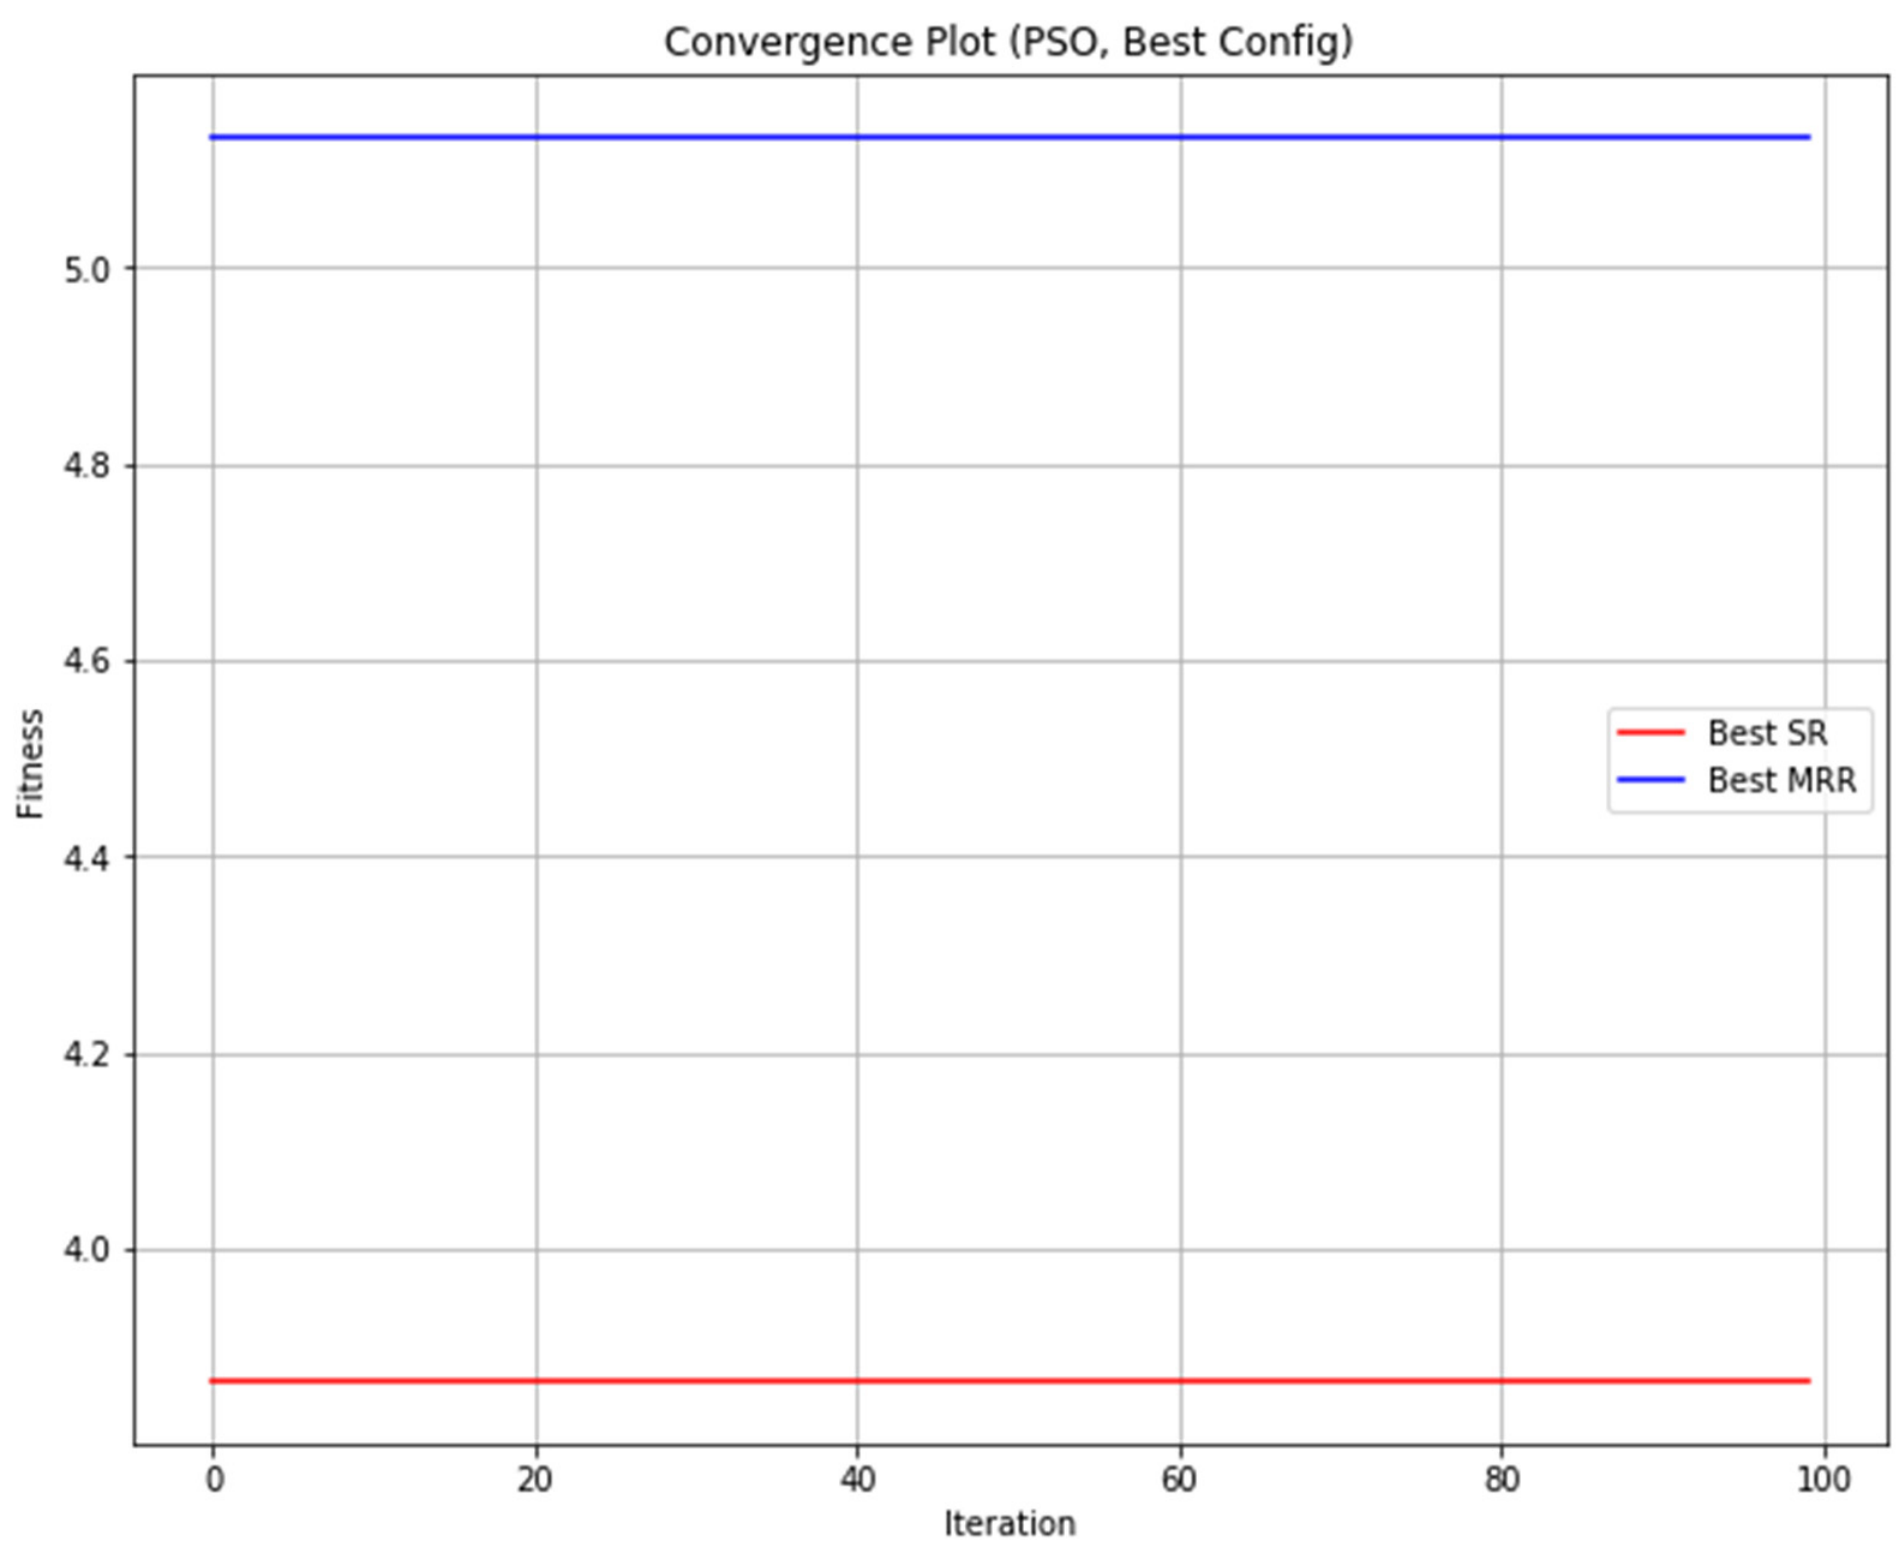
The settings were chosen in such a way as to maintain the right balance between exploration and exploitation ability. Figure 10 shows the convergence graph for PSO. In Figure 10, the convergence features of the PSO algorithm are presented, with the best SR being the best result obtained by any individual agent, and the best MRR being the average result of the swarm.
Figure 10.
Convergence plot—PSO.
The PSO convergence features show very high optimization efficiency at all stages of its operation. Specifically, fast convergence in the beginning (after just 20 iterations) proves that the algorithm has efficiently found the promising areas in the search space with further exploration, leading to the discovery of high-quality solutions. Next, it is noticeable that the best and average fitness curves converge after about 40 iterations; thus, no oscillatory behaviour occurs, which can indicate problems with parameter stability and sensitivity. Moreover, consistently low values of the gap between the two curves for further iterations ensure the efficient convergence of the whole swarm towards the optimum rather than splitting into several local optima. These findings testify to the efficiency of the selected population-based search approach. Thus, the absence of an oscillatory curve and the stable fitness growth prove that the chosen PSO parameters have successfully provided a good balance between global and local search efficiency.
3.4.3. Multi-Objective Optimization Using NSGA-II
The NSGA-II, a multi-objective elitist evolutionary optimization approach, was applied to investigate the trade-off relationship between SR and MRR. The application of the NSGA-II involves the use of non-domination ranking, crowd distance computation, and elitism. This algorithm was configured with optimized parameters:
- •
- Population size: 100 individuals
- •
- Number of generations: 100
- •
- Crossover probability (Cx): 0.9
- •
- Mutation probability (Mut): 0.1
This selection was done to obtain sufficient genetic diversity for effective searching of the solution region in the search space, while preventing premature convergence.
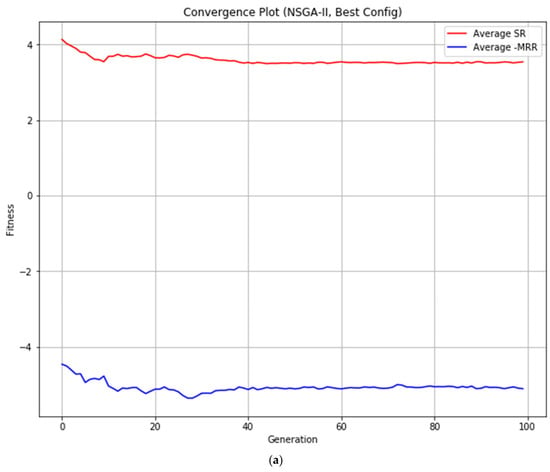
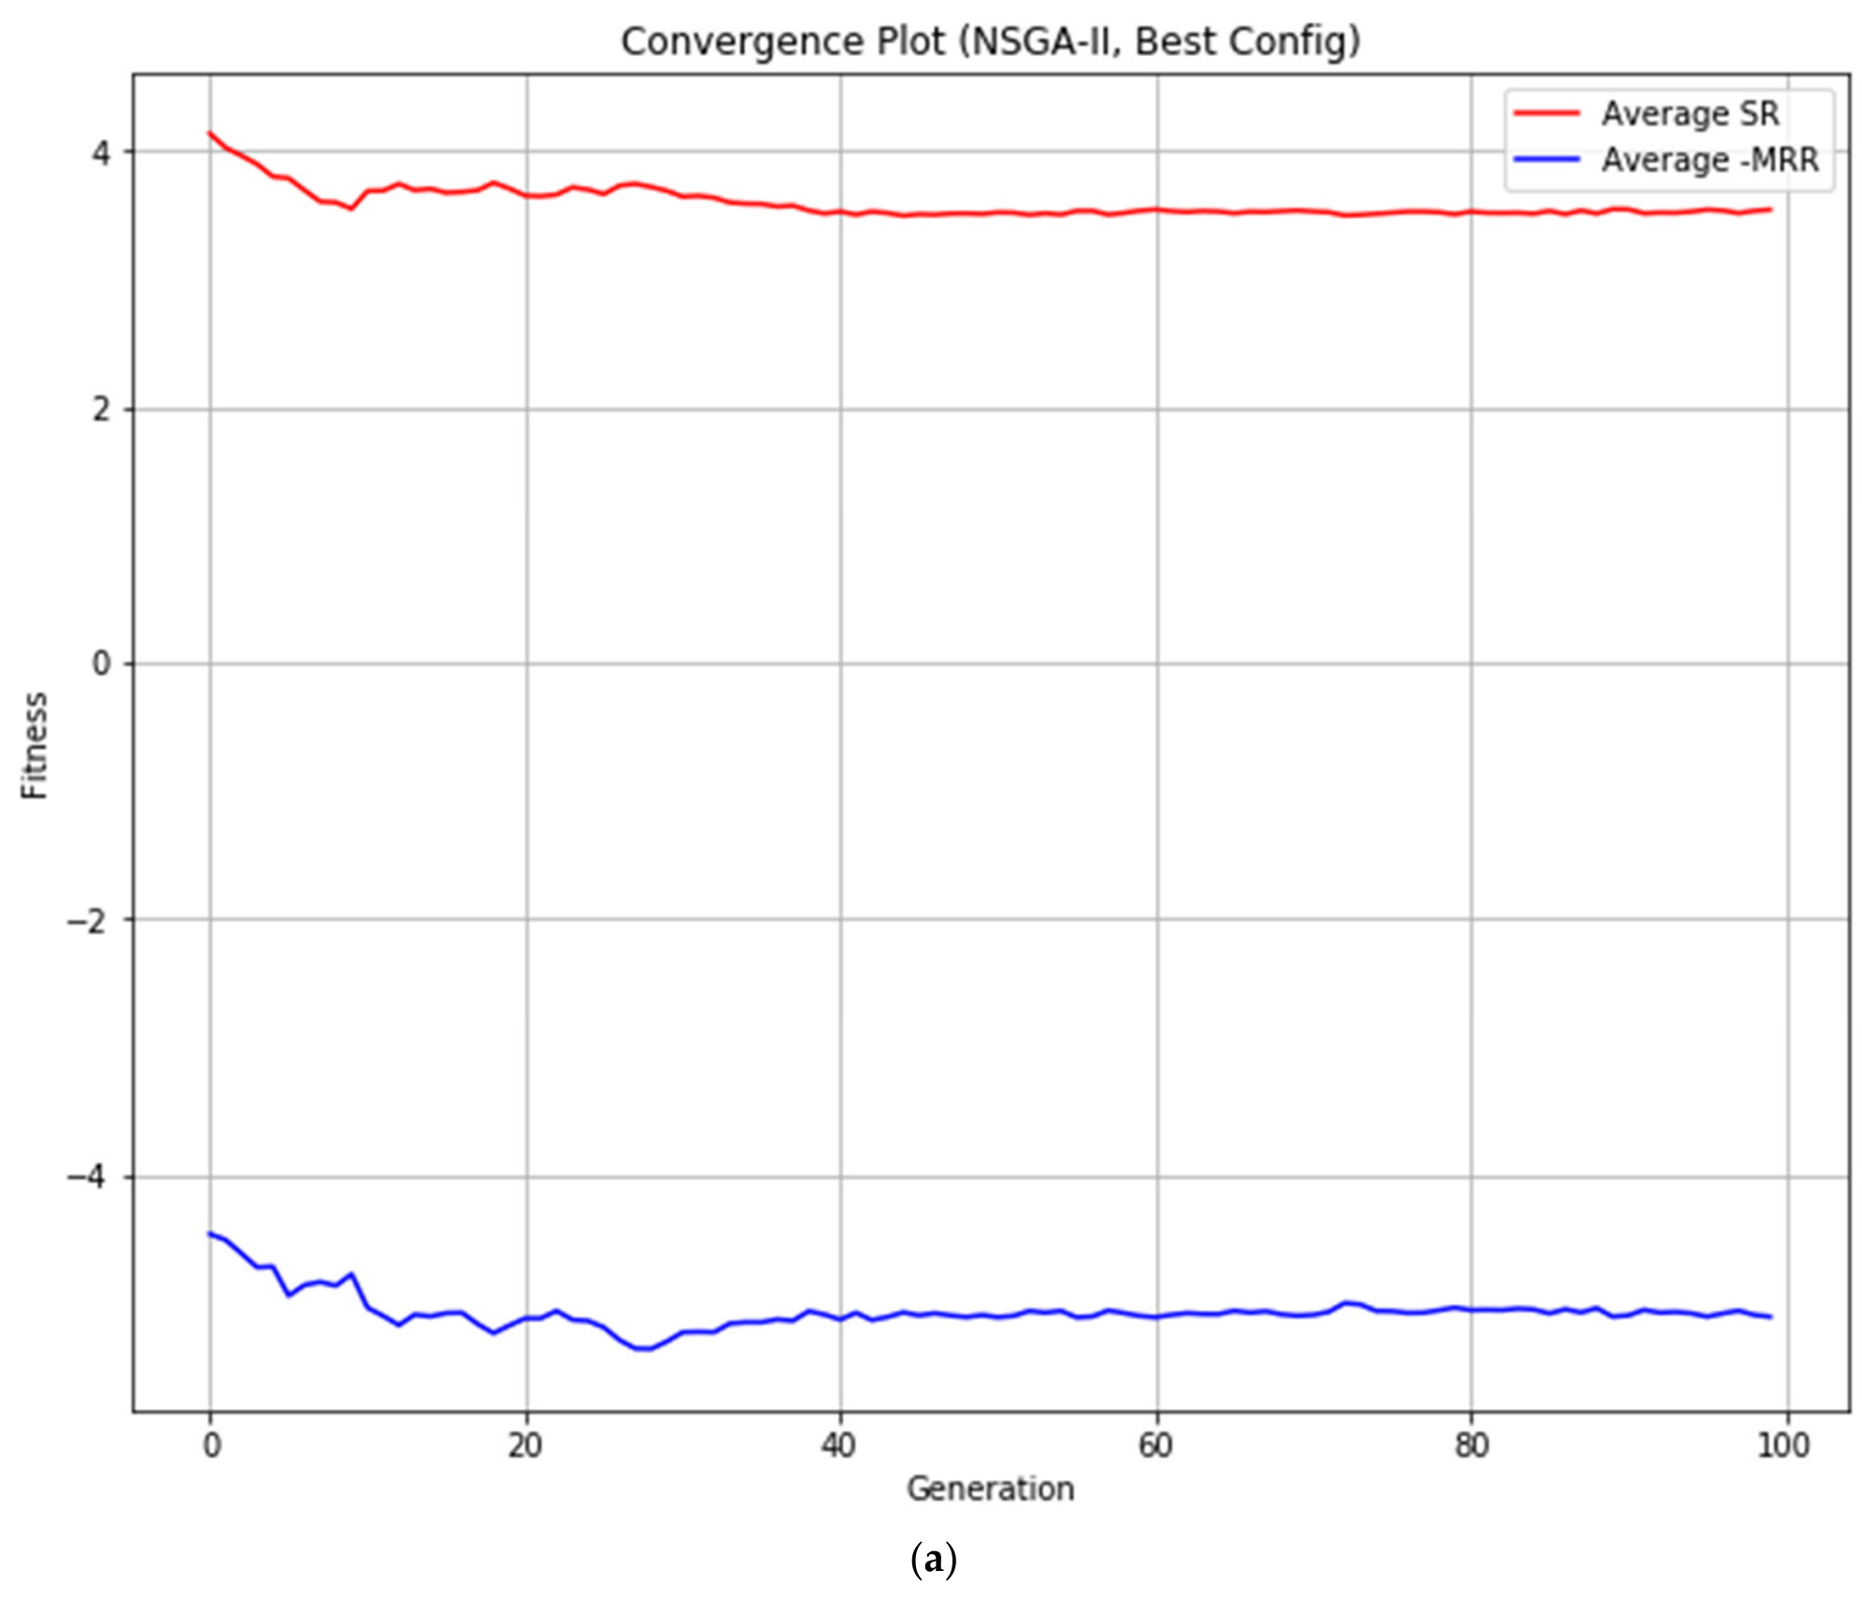
Figure 11a shows the convergence of the NSGA-II algorithm in the number of 100 generations, considering both the average SR and average MRR of the population. The algorithm showed a high speed of improvement in the early stages of iterations when both indicators were significantly improved by 20–25 iterations, which is the result of efficient searching of good areas in the multi-objective problem space. After iteration 20, both values became quite steady with low fluctuations, forming a stable plateau for their convergence without oscillations. The average value of the SR of the population converged in the range of 3.8–4.0 µm, whereas the average MRR reached a value of 4.8–5.0 mm3/min. The stable convergence curves with low variance in later stages show that the population converged steadily without significant deviation.
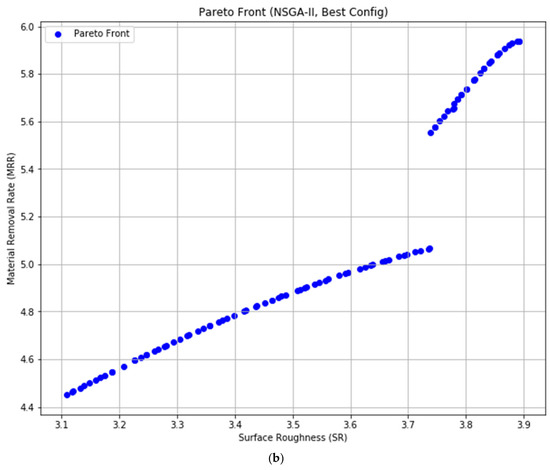
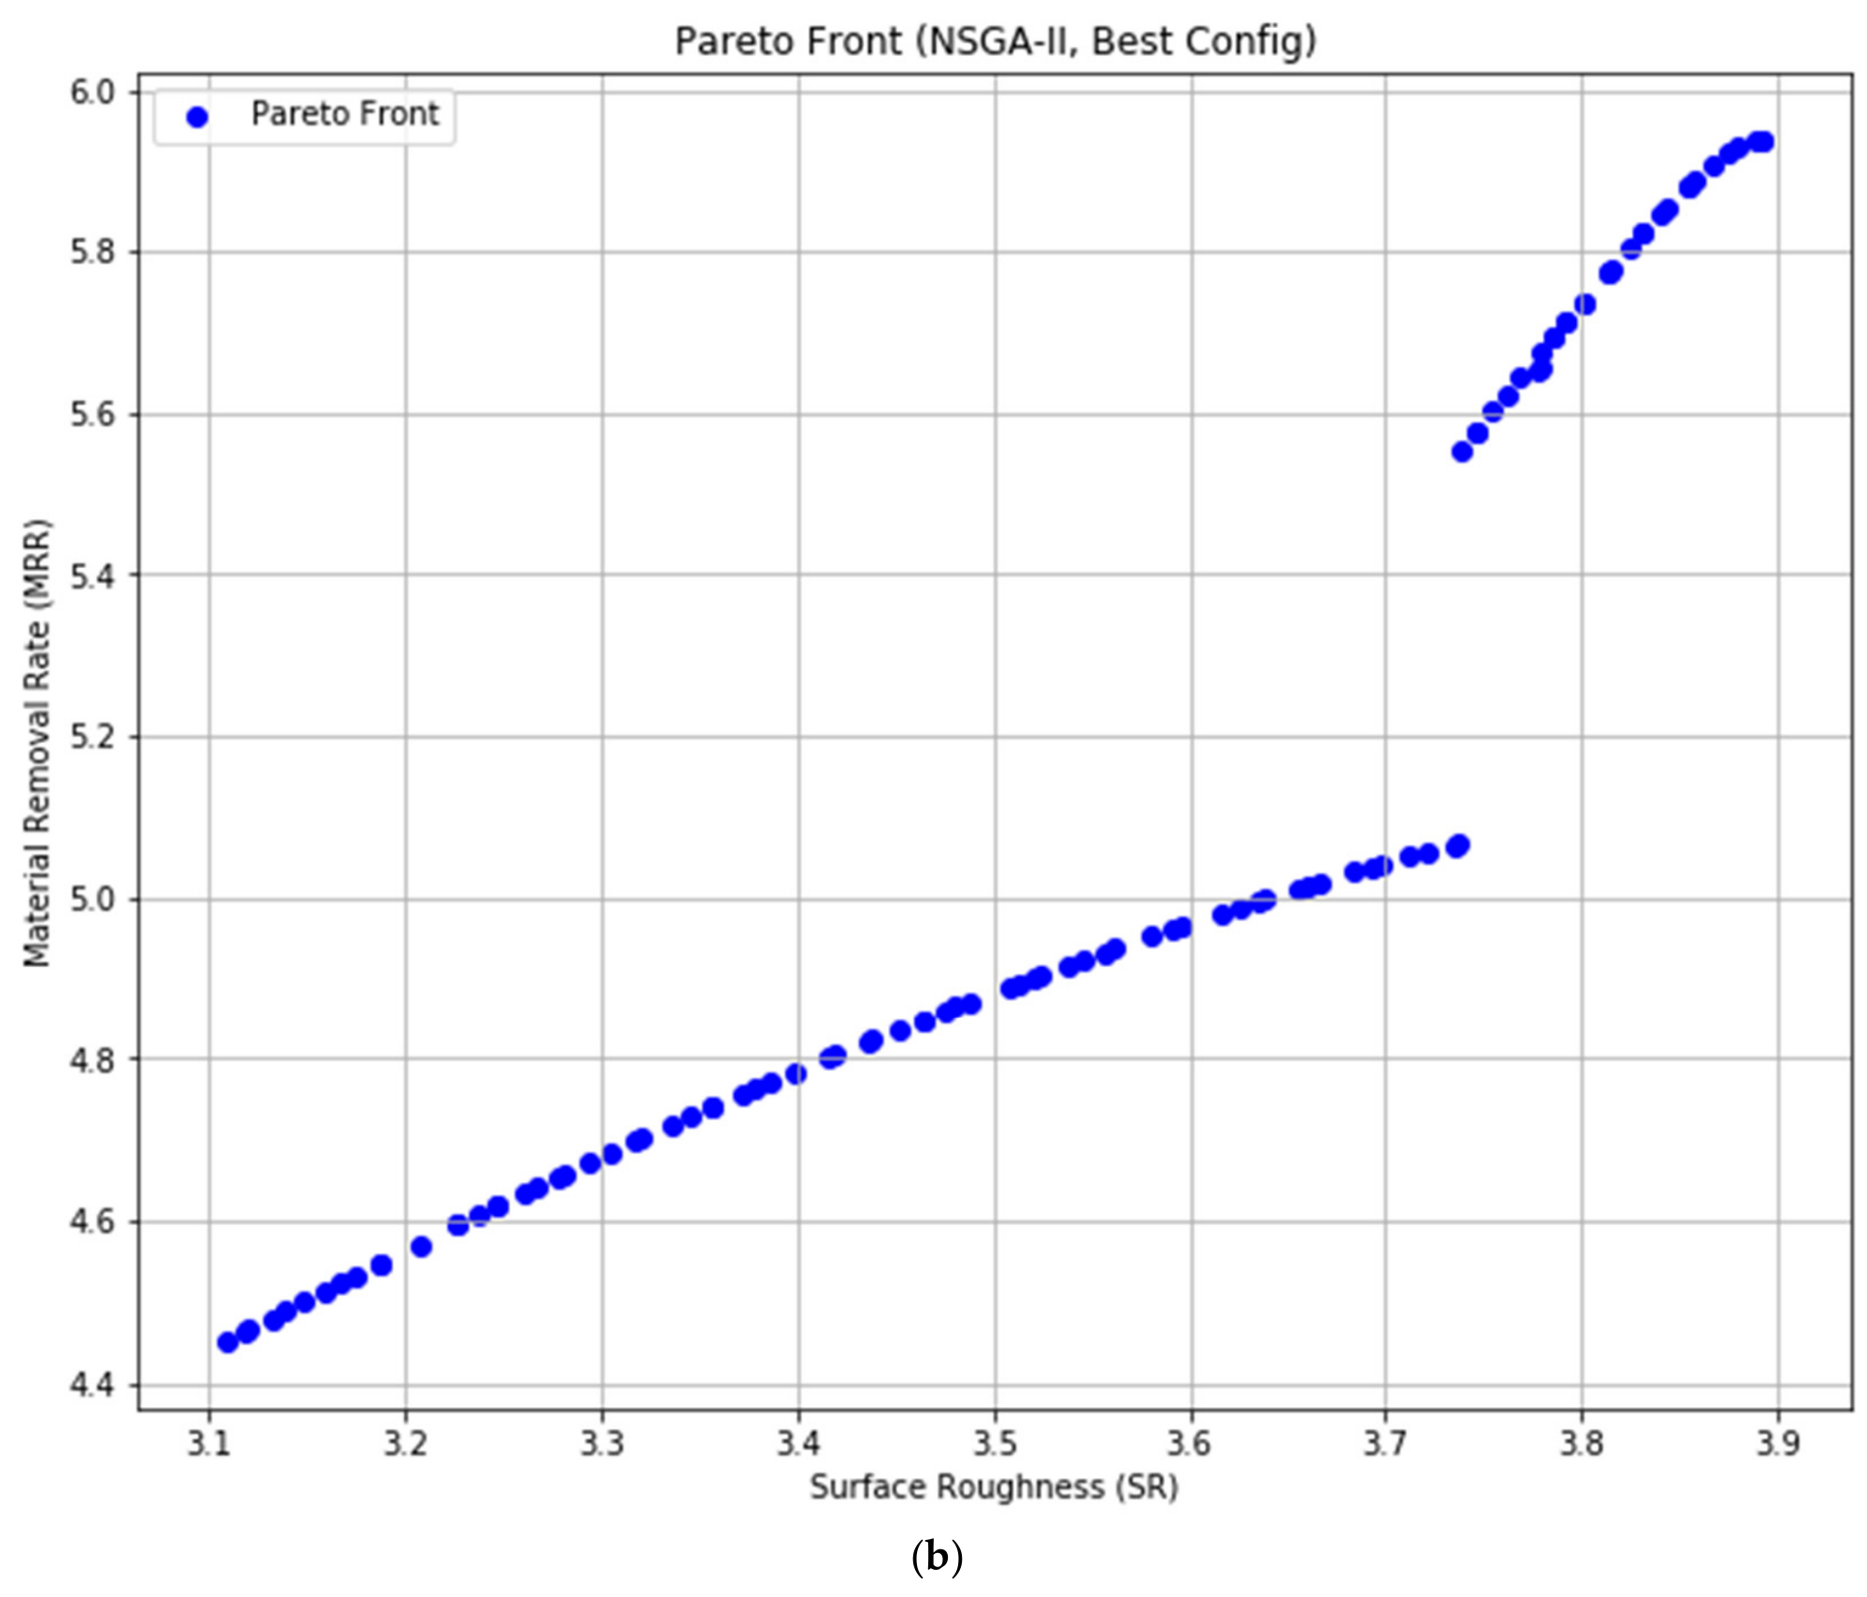
Figure 11.
NSGA-II: (a) convergence plot (b) Pareto front.
The Pareto front illustrated in Figure 11b is derived from the NSGA-II and consists of various non-dominated solutions along the complete trade-off range between surface quality and productivity. A wide-ranging Pareto front is observed, as seen by SR values ranging from 3.1 to 3.9 μm and MRR values ranging from 4.4 to 6.0 mm3/min, providing roughly 40–50 equally distributed solutions to consider during decision making. The convex and nonlinear nature of the trade-off plot denotes an increasingly difficult trade-off between both objective functions as either end value of the scale is approached, resulting in two separate operation ranges: one where surface quality prevails and the other where production rate prevails. The optimal compromise point was selected from the Pareto front through the knee point approach, as shown in Table 5, which is the optimum trade-off between conflicting objectives where there cannot be any improvement in one without compromising on the other.
3.4.4. Comparison of RSM-Based Desirability Optimization and Metaheuristic Optimization Using PSO and NSGA-II
RSM was initially used to generate the relationship between WEDM process parameters (PON, POFF, and IP) and machining responses (SR and MRR). The regression equations from the RSM process were used as surrogate objective functions during the optimization process. For an RSM-based approach, a desirability function was used to arrive at an optimal solution. For the PSO algorithm, the regression equations were used in the objective function in a single-objective weighted-sum approach. In the NSGA-II approach, the regression equations were used as conflicting objective functions to generate non-dominated solutions. This means that the comparison involves different approaches to solving similar RSM-based response equations.
The performance comparison of the three approaches shows differences in terms of performance characteristics and approaches to parameter selection. The surface quality is best for the PSO, with a predicted Surface Roughness of 3.098 μm. This algorithm demonstrates the highest performance, showing a difference of 19.9% compared to the NSGA-II and a difference of 22.5% compared to the RSM. The NSGA-II algorithm shows better productivity with the value of MRR equal to 5.907 mm3/min, which is 4.2% better than in the case of RSM and 33.1% better than for PSO. In turn, RSM showed good results in terms of productivity, but the results were rather low in the case of SR: 3.998 μm and 5.668 mm3/min, correspondingly. However, its productivity remains higher by 27.7% than in the case of the PSO algorithm.
This high productivity is because of the differences in the philosophies of the two machining processes, which are dictated by the selection strategies employed for the WEDM parameters. The NSGA-II uses a very aggressive machining process that utilized maximum energy inputs. It makes use of a high PON of 49.42 μs, a minimum POFF of 8.00 μs, and a maximum IP of 5 A, giving it the highest duty cycle (PON/[PON + POFF]) of 86.1%. Similarly, the RSM uses another efficient high-energy input process, which utilizes a PON of 45.71 μs, POFF of 8.02 μs, and IP of 4.78 A, producing an 85.0% duty cycle. On the other hand, the PSO uses a very conservative machining process, which involves a low PON of 20.00 μs, a high POFF of 12.00 μs, and a low IP of 3.00 A, giving it the lowest duty cycle of 62.5%.
- Trade-off Analysis
The three optimization methodologies lie in different areas of the objective function space:
Quality-oriented (low SR, low MRR) and productivity-oriented: (high SR, high MRR).
- ➢
- PSO-based optimization: Obtains 75.1% of the maximum MRR while improving the surface quality by 80.1% (compared to the NSGA-II).
- ➢
- RSM-based desirability optimization: Obtains 95.9% of the maximum MRR at an acceptable level of surface quality (worse by 3.4% when compared with the NSGA-II).
- ➢
- NSGA-II-based multi-objective optimization: Maximum MRR but with an SR value within reasonable limits.
3.5. Confirmation Experiments
To assess the performance of the developed models with respect to prediction, confirmation tests were done by employing optimum settings for parameters that had been found using the RSM-based desirability function approach, PSO, and the NSGA-II, respectively. The predicted and actual values of the SR and MRR are shown in Table 9. An independent WEDM machining test was performed for each of the chosen combinations of parameter settings. For each sample machined, three different SR values were measured at different spots on the same machined surface, and the average of these three values served as the experimental SR value. Good agreement was found between the predicted and experimental values since the deviation was not above 2.5%. For example, the NSGA-II solution produced a predicted MRR of 5.956 mm3/min and a deviation of 0.823%, while the PSO solution resulted in SR = 3.057 µm and a deviation of 1.341%. The RSM desirability solution gave SR = 3.997 µm and MRR = 5.612 mm3/min. These were the values of the compromise solution based on the desired criteria.
Table 9.
Confirmation test results for optimized parameter settings.
The solution obtained by the NSGA-II has a smaller SR and a greater MRR than the solution chosen based on the RSM, and the NSGA-II dominates the RSM solution in objective space. Thus, the RSM solution cannot be recognized as a globally better solution than the NSGA-II solution. On the contrary, it is possible to speak about the impact of optimization and selection of the solution. The method for obtaining the compromise solution using RSM and desirability shows one compromise solution; the PSO algorithm produces one solution using weighted objective function, while the NSGA-II produces a number of non-dominated solutions.
3.6. Integrated Decision Framework
In terms of comparative analysis, the hierarchy of performance levels depends on the optimization criteria; thus, when quality is the focus, PSO emerges as more effective algorithm than the NSGA-II and RSM, but productivity can be optimized better with the NSGA-II than RSM, and finally, with PSO. In cases where the goal is balanced performance, the NSGA-II and RSM prove equally efficient, far exceeding the capabilities of PSO. Based on the above conclusions, it can be determined that the NSGA-II is best suited for situations where the main goal is maximum productivity, along with reasonable quality levels, and PSO yields the best results in processes where precision is essential.
However, it is important to state that due to their nature of multi-objective solutions, both PSO and the NSGA-II present an additional benefit for the user since they clearly demonstrate possible compromises between objectives, making it possible for the user to choose an option based on their own preferences rather than taking one aggregated option. Due to the complementarity of the three methods described above, it can be concluded that a combination of RSM to conduct the preliminary screening, followed by more elaborate multi-objective algorithms, may prove to be the most promising method. The decision framework is presented in Table 10.
Table 10.
Integrated Decision Framework.
3.7. Practical Implications
Validation results provide clear grounds for decision making for engineers and technicians:
- ➢
- The NSGA-II should be used in cases where machining time and the volume of materials used are crucial parameters; Surface Roughness values of SR ≈ 4 µm should be expected, but MRR will reach its maximal value, MRR ≈ 6 mm3/min.
- ➢
- PSO should be applied in cases where surface integrity becomes vital, such as in finishing operations and cases where strict demands for Surface Roughness are set; MRR will remain quite high but somewhat lower, while SR ≈ 3 µm could be achieved, even if machining takes somewhat longer.
- ➢
- RSM should be used if versatility is a crucial feature of the working environment: it is a balanced alternative that ensures reliable results with no need for further calculations.
As the correlation between theoretical and actual data does not exceed 1.5%, all the presented models can be safely applied in practice; however, each of them can only be used under specific conditions.
4. Conclusions
The investigation of optimization of WEDM processes for processing Inconel 625 using RSM, the NSGA-II, and PSO was the main purpose of this research work. The results show that the developed mathematical regression models are statistically significant, and that they are characterized by high values of coefficients of determination (R2 = 0.9996 for SR and 0.9544 for MRR). Moreover, the lack of fit was insignificant, which means that the created models can be considered adequate and applicable for predictions. According to the ANOVA analysis, it can be concluded that the most significant parameter influencing SR is PON, with a contribution of 57.39%. Other significant parameters include AB and AC, with contributions of 12.32% and 9.02%, respectively. As for MRR, the interaction between POFF and IP (BC) is the most important one, with a contribution of 37.43%.
Among the various optimization algorithms, the NSGA-II gave a balanced optimum solution (PON = 48.42 μs, POFF = 8 μs, IP = 5 A) with an excellent compromise between MRR (5.956 mm3/min) and SR (3.961 μm). PSO gave an excellent surface quality, while RSM optimized the productivity of the system. The analysis reveals that the interactions among parameters have a significant impact on the performance of the WEDM process.
In future research, other variables like wire tension, flushing pressure, and feed speed could be considered for better optimization. The combination of machine learning and metaheuristics can help to improve predictive accuracy and even allow real-time control. Other investigations on various superalloys and sustainability issues, like energy usage and tool life, are also possible.
Author Contributions
T.M.: Conceptualization, Formal Analysis, Investigation, Methodology, Project Administration, Supervision, Visualization, Software, Writing—Original Draft, Writing—Review and Editing. K.N.: Data Curation, Resources, Writing—Original Draft. G.A.: Data Curation, Resources, Writing—Original Draft. M.R.: Data Curation, Resources, Writing—Original Draft. A.S.: Visualization, Software, Methodology, Writing—Review and Editing. P.S.: Conceptualization, Formal Analysis, Validation, Writing—Review and Editing. All authors have read and agreed to the published version of the manuscript.
Funding
This research received no external funding.
Data Availability Statement
The original contributions presented in this study are included in the article. Further inquiries can be directed to the corresponding author.
Conflicts of Interest
The authors declare no conflicts of interest.
References
- Ho, K.; Newman, S.; Rahimifard, S.; Allen, R. State of the art in wire electrical discharge machining (WEDM). Int. J. Mach. Tools Manuf. 2004, 44, 1247–1259. [Google Scholar] [CrossRef] [Scilit]
- Mohanraj, T.; Thenarasu, M.; Ragaventhra, B.S.; Pavilan, P.; Jaswant, S.; Kumar, R.S.; Panchu, K.P. Parameter optimization in wire electrical discharge machining using bio-inspired algorithms and response surface methodology. Int. J. Interact. Des. Manuf. (IJIDeM) 2025, 19, 705–732. [Google Scholar] [CrossRef] [Scilit]
- Majumder, H.; Maity, K. Prediction and optimization of surface roughness and micro-hardness using grnn and MOORA-fuzzy-a MCDM approach for nitinol in WEDM. Measurement 2018, 118, 1–13. [Google Scholar] [CrossRef] [Scilit]
- Mohanraj, T.; Sakthivel, G.; Pramanik, A. Use of RSM desirability approach to optimize WEDM of mild steel. Phys. Scr. 2024, 99, 105976. [Google Scholar] [CrossRef] [Scilit]
- Nourbakhsh, F.; Rajurkar, K.P.; Malshe, A.P.; Cao, J. Wire electro-discharge machining of titanium alloy. Procedia CIRP 2013, 5, 13–18. [Google Scholar] [CrossRef] [Scilit]
- Han, F.; Jiang, J.; Yu, D. Influence of machining parameters on surface roughness in finish cut of WEDM. Int. J. Adv. Manuf. Technol. 2007, 34, 538–546. [Google Scholar] [CrossRef] [Scilit]
- Han, F.; Jiang, J.; Yu, D. Influence of discharge current on machined surfaces by thermo-analysis in finish cut of WEDM. Int. J. Mach. Tools Manuf. 2007, 47, 1187–1196. [Google Scholar] [CrossRef] [Scilit]
- Jagdale, M.; Ambhore, N.; Chaudhari, R.; Kulkarni, A.; Abdullah, M. Experimental investigation of process parameters in Wire-EDM of Ti-6Al-4 V. Sci. Rep. 2025, 15, 5652. [Google Scholar] [CrossRef] [Scilit]
- Wang, S.-M.; Hsu, L.-J.; Gunawan, H.; Tu, R.-Q. Optimization of Machining Parameters for Reducing Drum Shape Error Phenomenon in Wire Electrical Discharge Machining Processes. Machines 2024, 12, 908. [Google Scholar] [CrossRef] [Scilit]
- Ehsan Asgar, M.; Singh Singholi, A.K. Parameter study and optimization of WEDM process: A Review. In Proceedings of the 1st International Conference on Contemporary Research in Mechanical Engineering with Focus on Materials and Manufacturing (ICCRME-2018), Lucknow, India, 6–7 April 2018. [Google Scholar]
- Suresh Kumar, S.; Uthayakumar, M.; Kumaran, S.T.; Parameswaran, P.; Mohandas, E.; Kempulraj, G.; Babu, B.S.R.; Natarajan, S.A. Parametric optimization of wire electrical discharge machining on aluminium based composites through grey relational analysis. J. Manuf. Processes 2015, 20, 33–39. [Google Scholar] [CrossRef] [Scilit]
- Dhoria, S.H.; Subbaiah, K.V.; Rao, V.D.P. Multi-Objective Parametric Optimization on WEDM of Hybrid Al6351/SiC/Gr Composites Using NSGA-II. J. Inst. Eng. (India) Ser. D 2025, 106, 277–290. [Google Scholar] [CrossRef] [Scilit]
- Straka, Ľ.; Čorný, I. Prediction and Multiparametric Optimization of the Machined Surface Quality of Tool Steels in Precise Wire Electrical Discharge Machining. Machines 2024, 12, 248. [Google Scholar] [CrossRef] [Scilit]
- Dey, A.; Khan, M.M. Optimizing WEDM Parameters for Aluminum Metal Matrix Composites Using Hybrid PSO-TOPSIS Approach. J. Adv. Manuf. Syst. 2025, 25, 581–601. [Google Scholar] [CrossRef] [Scilit]
- Liu, L.; Thangaraj, M.; Karmiris-Obratański, P.; Zhou, Y.; Annamalai, R.; Machnik, R.; Elsheikh, A.; Markopoulos, A.P. Optimization of Wire EDM Process Parameters on Cutting Inconel 718 Alloy with Zinc-Diffused Coating Brass Wire Electrode Using Taguchi-DEAR Technique. Coatings 2022, 12, 1612. [Google Scholar] [CrossRef] [Scilit]
- Ulas, M.; Aydur, O.; Gurgenc, T.; Ozel, C. Surface roughness prediction of machined aluminum alloy with wire electrical discharge machining by different machine learning algorithms. J. Mater. Res. Technol. 2020, 9, 12512–12524. [Google Scholar] [CrossRef] [Scilit]
- Sharma, N.; Khanna, R.; Gupta, R.D.; Sharma, R. Modeling and multiresponse optimization on WEDM for HSLA by RSM. Int. J. Adv. Manuf. Technol. 2013, 67, 2269–2281. [Google Scholar] [CrossRef] [Scilit]
- Sharma, N.; Khanna, R.; Gupta, R. Multi Quality Characteristics of WEDM Process Parameters with RSM. Procedia Eng. 2013, 64, 710–719. [Google Scholar] [CrossRef] [Scilit]
- Salem, O.; Hewidy, M.; Jung, D.W.; Lee, C.M. Optimizing High-Performance Predictive Modeling of the Medium-Speed WEDM Processing of Inconel 718. J. Manuf. Mater. Process. 2024, 8, 206. [Google Scholar] [CrossRef] [Scilit]
- Prabhu, M.; Senthil, P.; Varthini , R.; Dhineshkumar , S.R. Experimental study and performance evaluation of optimal process variables on WEDM of Inconel 686 superalloy by MOTLBO approach. Mater. Manuf. Processes 2025, 40, 1349–1364. [Google Scholar] [CrossRef] [Scilit]
- Sunil, B.; Goyal, A.; Kumar, L.; Sonia, P.; Saxena, K.K.; Bandhu, D.; Kaur, K.; Chandrashekar, R.; Ansari, M.A. Optimizing wire electrical discharge machining performance of Inconel 625 with genetic algorithms & particle swarm optimization. J. Mater. Res. Technol. 2024, 31, 555–569. [Google Scholar] [CrossRef] [Scilit]
- Ming, W.; Guo, X.; Zhang, G.; Hu, S.; Liu, Z.; Xie, Z.; Zhang, S.; Duan, L. Optimization of process parameters and performance for machining Inconel 718 in renewable dielectrics. Alex. Eng. J. 2023, 79, 164–179. [Google Scholar] [CrossRef] [Scilit]
- Kumar, A.; Majumder, H.; Vivekananda, K.; Maity, K. NSGA-II approach for multi-objective optimization of wire electrical discharge machining process parameter on inconel 718. Mater. Today Proc. 2017, 4, 2194–2202. [Google Scholar] [CrossRef] [Scilit]
- Magabe, R.; Sharma, N.; Gupta, K.; Davim, J.P. Modeling and optimization of Wire-EDM parameters for machining of Ni55. 8Ti shape memory alloy using hybrid approach of Taguchi and NSGA-II. Int. J. Adv. Manuf. Technol. 2019, 102, 1703–1717. [Google Scholar] [CrossRef] [Scilit]
- Mandal, S.; Chakraborty, S.; Dey, P.P. Investigation of machining characteristics and optimization of WEDM parameters for spark plasma sintered ZrB2-B4C ceramic composite utilizing RSM, NSGA II, and TOPSIS. Eng. Res. Express 2025, 7, 025576. [Google Scholar] [CrossRef] [Scilit]
- Ranjan, A.; Chakraborty, S.; Kumar, D.; Bose, D. Multi-objective optimization of a hybrid machining process abrasive powder mixed WEDM of Inconel 718 using particle swarm optimization technique. Mater. Today Proc. 2019, 18, 3606–3616. [Google Scholar] [CrossRef] [Scilit]
- Zhou, Q.; Yang, X.; Qiu, Z.; Liu, X.; Xing, X.; Duan, X. A generalizable machine learning framework for multi-objective optimization of multi-pass WEDM. Int. J. Adv. Manuf. Technol. 2026, 142, 3579–3595. [Google Scholar] [CrossRef] [Scilit]
- Jeet, I.; Srivastava, A.; Bisaria, H. Hybrid Response Surface Methodology and Artificial Neural Network Approach for Performance Optimization in Wire Electrical Discharge Machining of Nimonic-C263 Superalloy. J. Mater. Eng. Perform. 2026, 35, 2428–2438. [Google Scholar] [CrossRef] [Scilit]
- Kumar, N.V.; Dupadu, C. Discharge-informed Wire EDM processing and optimization of Inconel 718. Mater. Manuf. Process. 2026, 1–19. [Google Scholar] [CrossRef] [Scilit]
- Sun, L.; Chen, B.; Zhou, Q.; Zhao, D. Multi-objective optimization of wire cutting process parameters for Ti-6Al-4V alloy is performed using NSGA-II and EWM-TOPSIS optimized artificial neural network. Proc. Inst. Mech. Eng. Part C J. Mech. Eng. Sci. 2025, 239, 3772–3789. [Google Scholar] [CrossRef] [Scilit]
- Sharma, P.; Chakradhar, D.; Narendranath, S. Measurement of WEDM performance characteristics of aero-engine alloy using RSM-based TLBO algorithm. Measurement 2021, 179, 109483. [Google Scholar] [CrossRef] [Scilit]
- Mukherjee, R.; Chakraborty, S.; Samanta, S. Selection of wire electrical discharge machining process parameters using non-traditional optimization algorithms. Appl. Soft Comput. 2012, 12, 2506–2516. [Google Scholar] [CrossRef] [Scilit]
- Kar, S.; Niranjan, C.A.; Prabhuswamy, N.R.; Majumder, T.; Baroi, B.K.; Kebede, A.W. Experimental investigation and parametric optimization of machinability and surface characteristics in wire EDM of Inconel 718. Sci. Rep. 2025, 15, 33947. [Google Scholar] [CrossRef] [Scilit]
- Fuse, K.; Dalsaniya, A.; Modi, D.; Vora, J.; Pimenov, D.Y.; Giasin, K.; Prajapati, P.; Chaudhari, R.; Wojciechowski, S. Integration of Fuzzy AHP and Fuzzy TOPSIS Methods for Wire Electric Discharge Machining of Titanium (Ti6Al4V) Alloy Using RSM. Materials 2021, 14, 7408. [Google Scholar] [CrossRef] [Scilit]
- Rajkumar, S.; Selvarajan, L.; Melese, K.G.; Majora, M.; Wondimu, W. Optimization of electrical discharge machining parameters for enhanced performance on inconel 718 using Cu-Ni-B4C nanocomposite electrodes and advanced modeling techniques. Mater. Res. Express 2024, 11, 095004. [Google Scholar] [CrossRef] [Scilit]
- Iruj, M.; Tufail, M.; Fatima, A. Prediction of optimal wire EDM machining parameters for Inconel grades using machine learning technique. J. Tribol. 2025, 46, 182–202. [Google Scholar]
- Dusanapudi, S.; Krupakaran, R.; Kumar, A.; Venkat, K.S.; Shanmukh, A.; Ganesh, L.; Muhsen, M. Investigation & optimization of WEDM process parameters using inconel 690. In Proceedings of the 16th International Conference on Materials Processing and Characterization (ICMPC 2024), Ahmedabad, India, 27–29 June 2026. [Google Scholar]
- Kumar, A.; Sharma, R.; Gupta, A.K.; Yadav, J.R. Mathematical Modeling and Optimization of Wire Electric Discharge Machining Parameters on Inconel 825 Using Desirability Method. J. Comput. Theor. Nanosci. 2020, 17, 2441–2450. [Google Scholar] [CrossRef] [Scilit]
- Thangaraj, M.; Moiduddin, K.; Annamalai, R.; Mian, S.H.; Almutairi, Z.; Machnik, R. Optimizing the Surface Parameters of Titanium (Ti-6Al-4V) Alloy Specimens using WEDM Process based on Taguchi-DEAR Algorithm. Adv. Sci. Technol. Res. J. 2024, 18, 422–431. [Google Scholar] [CrossRef] [Scilit]
- Kar, S.K.; Mishra, P.K.; Sahu, A.K.; Mahapatra, S.S.; Thomas, J. Multi-objective optimization of wire-EDM of Inconel 625 by using desirability function approach. Int. J. Interact. Des. Manuf. (IJIDeM) 2023, 17, 931–938. [Google Scholar] [CrossRef] [Scilit]
- Kosaraju, S.; Bobba, P.B.; Salkuti, S.R. Optimization and Microstructural Studies on the Machining of Inconel 600 in WEDM Using Untreated and Cryogenically Treated Zinc Electrodes. Materials 2023, 16, 3181. [Google Scholar] [CrossRef] [Scilit]
- Arulselvan, S.; Ravindran, D.; Selvakumar, G.; Moshi, A.A.M. Study on the influence of zinc-coated wire material on 3D Profile machining of Inconel 825 alloy using WEDM process. Surf. Rev. Lett. 2022, 29, 2250151. [Google Scholar] [CrossRef] [Scilit]
- Kumar, R.; Kumar, K. Multi-response optimization on process parameters of WEDM for Ti–6Al–4 V alloy using grey relational approach. In Optimization Methods for Product and System Design; Springer: Berlin/Heidelberg, Germany, 2023; pp. 29–52. [Google Scholar]
- Buk, J. Surface topography of inconel 718 alloy in finishing WEDM. Adv. Sci. Technol. Res. J. 2022, 16, 47–61. [Google Scholar] [CrossRef] [Scilit]
- Kumar, A.; Upadhyay, C. Experimental investigation and optimization of machining performance characteristics during WEDM of inconel 718: On evaluation of wire electrodes and advanced parameter techniques. Proc. Inst. Mech. Eng. Part C J. Mech. Eng. Sci. 2022, 236, 1645–1665. [Google Scholar] [CrossRef] [Scilit]
- Kar, S.; Niranjan, C.; Swamy, P.S.N.R.; Majumder, T. Application of machine learning and MOGA for predictive modelling and optimization of Inconel 718 machining in WEDM. Eng. Res. Express 2025, 7, 045406. [Google Scholar] [CrossRef] [Scilit]
- Kalita, K.; Ghadai, R.K.; Chakraborty, S. A comparative study on multi-objective pareto optimization of WEDM process using nature-inspired metaheuristic algorithms. Int. J. Interact. Des. Manuf. (IJIDeM) 2023, 17, 499–516. [Google Scholar] [CrossRef] [Scilit]
- Mao, R.; Sun, Z.; Gan, S.; Lei, W.; Du, Y.; Kong, L. Optimization of Process Parameters for Wire Electrical Discharge Machining of 9Cr18Mov Based on Grey Relational Analysis. Processes 2025, 13, 1547. [Google Scholar] [CrossRef] [Scilit]
- Senthilkumar, V.; Nagadeepan, A.; Ilavenil, K.K. Investigating and Multi-Objective Optimizing WEDM Parameters for Al6061/Mg/MoS2 Composites Using BBD and NSGA-II. Materials 2024, 17, 5894. [Google Scholar] [CrossRef] [Scilit]
- Sana, M.; Asad, M.; Khan, A.; Farooq, M.U.; Hassan, S.; Anwar, S. Geometric influence and multi-objective optimization of WEDM for hardened tool steels using ANN and NSGA-II. Sci. Rep. 2025, 15, 41723. [Google Scholar] [CrossRef] [Scilit]
- Zheng, Z.; Pan, Z.; Tan, H.; Wang, F.; Li, G.; Xu, J. Optimization of IHPF loading path for monolithic centralizer based on NSGA-II. J. Manuf. Process. 2026, 168, 287–301. [Google Scholar] [CrossRef] [Scilit]
- Biswas, S.; Paul, A.R.; Dhar, A.R.; Singh, Y.; Mukherjee, M. Multi-material modeling for wire electro-discharge machining of Ni-based superalloys using hybrid neural network and stochastic optimization techniques. CIRP J. Manuf. Sci. Technol. 2023, 41, 350–364. [Google Scholar] [CrossRef] [Scilit]
- Kumar, L.; Goyal, A.; Pathak, V.K. Prediction and optimization of WEDM parameters for machining of NiTi-shape memory alloy using ANFIS-PSO approach. Discov. Appl. Sci. 2025, 7, 249. [Google Scholar] [CrossRef] [Scilit]
- Bhowmik, A.; Kumar, R.; Rachchh, N.; Ramachandran, T.; Karthikeyan, A.; Singh, R.; Gupta, D.; Thatoi, D.N.; Jain, B.; Santhosh, A.J. Optimizing WEDM Parameters Using Swarm Intelligence: A Multi-Objective Approach to Improve Machinability and Cost-Efficiency. Eng. Rep. 2025, 7, e70248. [Google Scholar] [CrossRef] [Scilit]
- Şahin, İ.b.; Yilan, F.; Urtekin, L. Optimisation on machining parametres by EDM of TiN coated Ti6Al4V alloys. Adv. Mater. Process. Technol. 2024, 10, 960–970. [Google Scholar] [CrossRef] [Scilit]
- Prathap Singh, S.; Raja, D.E.; Kumar, C.R.; Gnanasekaran, K.; Bhowmik, A.; Hussen, K.; Sowndar, S.; Cholan, M.S. Evaluation of cutting speed and surface roughness in WEDM of functionally graded A356-10 wt% Si3N4 composite. Sci. Rep. 2026, 16, 14193. [Google Scholar] [CrossRef] [Scilit]
- Balaji, V.; Narendranath, S. MOGA and TOPSIS-based multi-objective optimization of wire EDM process parameters for Ni50.3-Ti29.7-Hf20 alloy. CIRP J. Manuf. Sci. Technol. 2023, 47, 158–167. [Google Scholar] [CrossRef] [Scilit]

Disclaimer/Publisher’s Note: The statements, opinions and data contained in all publications are solely those of the individual author(s) and contributor(s) and not of MDPI and/or the editor(s). MDPI and/or the editor(s) disclaim responsibility for any injury to people or property resulting from any ideas, methods, instructions or products referred to in the content. |
© 2026 by the authors. Licensee MDPI, Basel, Switzerland. This article is an open access article distributed under the terms and conditions of the Creative Commons Attribution (CC BY) license.