


Abstract
Rapid transfer of large cryogenic models between ambient and cryogenic environments causes severe thermal shocks to the dry air system, threatening dew-point stability and equipment safety. Using CFD, this study builds a 1:1 model of a cryogenic transport isolation system, including the dry hall, model carrier, temperature-conditioning room, and test section plenum. Three scenarios are analyzed: static suspension, descent to the temperature-conditioning room, and descent to the test section plenum. The effects of descent speed (1.2 vs. 2.5 m/min) and makeup air flow (0–12,500 m3/h) on temperature distribution and cable safety are examined. Results show that after 10 min of static suspension, the carrier interior averages 192 K with strong stratification and a minimum of 170 K. During descent, higher speed and larger air flow improve thermal retention. At 2.5 m/min and 10,000 m3/h, cable-adjacent gas stays above −60 °C. For the plenum, descent-matched displacement ventilation (e.g., 6000 m3/h for 1.2 m/min) keeps both the cable and the plug-in unit safe. Including the cable thermal capacity gives a smaller actual temperature drop than conservative gas-temperature estimates. This work provides numerical guidance for dry system design, operation optimization, and cryogenic protection during rapid model transfer.
1. Introduction
With the rapid development of cryogenic experimental facilities such as superconducting test devices, and space simulators, the efficient and safe transfer of cryogenic models between ambient-temperature assembly areas and cryogenic test sections has become a key factor limiting overall system performance [1,2,3,4]. During such transfer, the model itself is typically maintained at around 110 K, while the surrounding environment must be kept under strict dry conditions (dew point ≤ −60 °C) to prevent frost or condensation from damaging the model surface and degrading measurement accuracy [1,5,6,7,8,9]. However, during transfer and descent, the cryogenic model releases a large amount of cold energy into the surroundings, creating a strong thermal shock that can cause sharp local temperature drops and dew-point excursions, and may even threaten the mechanical properties and operational reliability of critical components such as steel cables and plug-in units [1,10].
A number of studies have been carried out on cryogenic model transfer technology. Price and Schimanski described in detail the development of cryogenic model handling techniques, covering model exchange in the test section, remote operation, and testing under cryogenic conditions [8]. Chen et al. [1] systematically reviewed key technical issues of cryogenic wind tunnel model access systems and proposed future directions. In the area of numerical simulation and reliability analysis of critical components, computational fluid dynamics (CFD) and finite element analysis (FEA) have been widely used for thermal performance prediction and structural safety assessment of cryogenic systems [11,12,13,14]. Johnson et al. pointed out that CFD models can evaluate heat transfer processes in cryogenic storage and transport systems in detail, and can be used to analyze the thermal diffusion induced by local heat sources inside cryogenic tanks [15]. For large liquid-hydrogen tanks, high-fidelity CFD simulations can capture the time-dependent flow and temperature fields driven by thermodynamics, revealing how natural convection affects heat distribution and how thermal stratification develops [16]. Similar numerical methods have been applied to cryogenic wind tunnel diffusers [17] and storage tank reliability [18]. Recent advances in cryogenic facility design have addressed a range of thermal management challenges. Li et al. [19] proposed an inclined-exit vent stack design to mitigate the settlement hazard of cryogenic plumes from cryogenic wind tunnels, achieving up to 15.9% energy savings through improved plume dispersion. Huang et al. [20] investigated real-gas effects in cryogenic transonic wind tunnel design, providing essential thermodynamic data for nitrogen in the 100–323 K range. These studies collectively highlight the growing attention to thermal protection and operational safety in cryogenic engineering systems. However, most of these numerical studies have been performed on closed tanks or stationary equipment with static boundary conditions and computational domains, and have seldom addressed the transient thermal shock caused by model movement across multiple functional spaces or the effect on displacement ventilation in open spaces. Likewise, component reliability analyses have mostly been conducted for static or quasi-static loading on fixed equipment; there is still no systematic assessment of the combined thermal impact of dynamic movement during cryogenic model transfer on critical components such as steel cables and plug-in units. Recent studies on heat transfer through multilayer walls have highlighted the importance of localized thermal effects near structural features such as hat-stringers, where insufficient insulation thickness can significantly degrade thermal performance [21]. While these studies focus on conduction-dominated heat transfer in stationary structures rather than the transient convective environment of the present work, they underscore the broader relevance of understanding localized thermal behaviour in complex thermal protection systems. In contrast to these earlier studies, which focused on static or quasi-steady configurations, the present work employs dynamic mesh techniques to capture the transient thermal response during active model descent. This approach, combined with the systematic examination of the interplay between carrier motion and displacement ventilation, represents a departure from previous investigations that treated the cryogenic source and the surrounding flow field as stationary.
In summary, existing research has largely concentrated on top-level design of cryogenic engineering systems, static or quasi-static temperature field analysis, and thermo-structural evaluation of stationary equipment. The transient thermal shock arising from the interaction between a moving model and the dry air system while crossing multiple functional spaces has received little attention [22]. In particular, the transient thermal response under different combinations of make-up air strategies and model descent speeds remains unclear, and the synergy between model motion and displacement ventilation has not been systematically explored. While specific airflow rates can be specified for a given facility, a dimensionless criterion based on the velocity ratio between ventilation and carrier descent would provide a more transferable design guideline. Therefore, based on an actual cryogenic engineering transport isolation system, this paper establishes a 1:1 three-dimensional geometric model using actual engineering parameters. Using transient CFD with dynamic mesh techniques, we systematically investigate the thermal effects under three typical operating conditions: static suspension of the model carrier in the dry hall, descent into the temperature-conditioning room, and descent into the test section plenum. By comparing temperature distributions, monitoring point temperatures, and the thermal environment of the steel cable under different descent speeds and make-up air flow rates, we reveal the generation and evolution mechanisms of thermal shock. The results provide theoretical support for operational parameter optimization, improvement of dry system design, and equipment safety assessment in cryogenic engineering.
2. System Layout and Simplification
2.1. System Composition
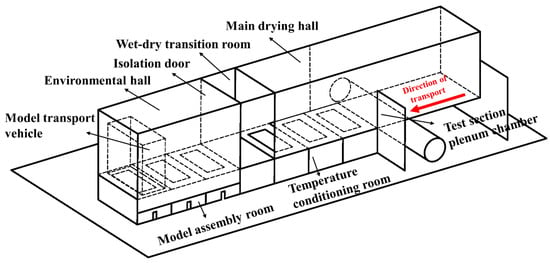
The cryogenic model transport isolation system (Figure 1) enables rapid transfer of large cryogenic models between ambient and cryogenic environments while maintaining a dew point ≤ −60 °C to prevent frosting. The two-story layout comprises: Upper level (front to back): ambient hall, wet-dry transition room, and dry hall, each 25 m high × 22 m wide, separated by 20 m × 20 m isolation doors. Both the transition room and dry hall have lower inlets and upper returns for displacement ventilation. Rails carry the model carrier and plenum cover carrier. Lower level (front to back): model assembly room (below ambient hall), temperature-conditioning and inspection room (~400 m3, below dry hall), and test section plenum (~8000 m3, operating from 110 K to 323 K). The plenum contains a sealed low-temperature test chamber closed by a cover.
Figure 1.
Structural layout of the cryogenic model transport isolation system.
2.2. Cryogenic Model Carrier Transfer Procedure
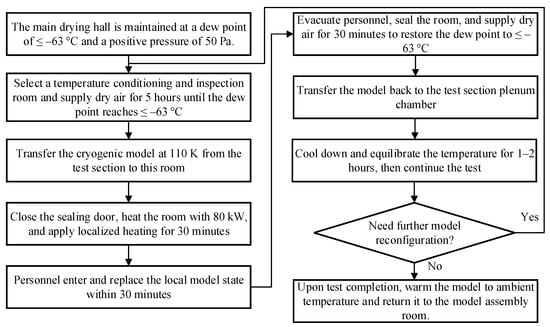
The cryogenic rapid cycling procedure (Figure 2) transfers the still-cryogenic model (~110 K) from the plenum to a prepared temperature-conditioning room for local part replacement without full warm-up and then returns it to the plenum.
Figure 2.
Flowchart of the cryogenic rapid cycling mode.
2.3. Theoretical Analysis and Simplification Principles
To establish a reliable numerical model, three physical aspects are examined:
(1) Steel cable heat transfer
For a 20 mm diameter steel cable (λ = 20 W/(m·K), h = 20 W/(m2·K)), the Biot number based on radius is Bi = h·r/λ = 0.01 (<0.05), indicating a negligible internal temperature gradient [23,24]. Moreover, resolving the cable geometry would significantly degrade mesh quality. Thus, the cable structure is omitted.
(2) Natural convection induced by the cold carrier wall
For a vertical height of 5 m at a characteristic temperature of 200 K, the Grashof number is Gr ≈ 2 × 10¹³ (>2 × 10¹⁰), confirming turbulent natural convection [25,26]. Consequently, a turbulence model with refined near-wall mesh is required.
(3) Surface radiation
With an emissivity ε = 0.07 (polished stainless steel), the radiative heat flux is approximately 36.1 W/m2, which is two orders of magnitude lower than the convective flux (~3660 W/m2) [27,28]. This 36.1 W/m2 represents an upper-bound estimate based on the maximum temperature difference between the cryogenic surfaces (110 K) and the surrounding walls (300 K). As the transient process proceeds and the surrounding structures cool, the radiative flux decreases further. The convective flux, by contrast, is continuously sustained by the natural convection driven by the cold surfaces and remains the dominant heat transfer mechanism throughout the descent. Radiation is therefore neglected, although surfaces should be kept clean to maintain low emissivity.
Based on the above analysis, the simulations omit the steel cable geometry and radiative heat transfer, but fully account for coupled forced and natural convection using a turbulence model with a refined mesh near the carrier surface. The realizable k-ε model with enhanced wall treatment is adopted for all simulations, as it offers well-validated performance for buoyancy-driven turbulent flows in large enclosed spaces while maintaining computational efficiency for the transient dynamic-mesh computations required in this study. The fixed model surface temperature of 110 K is justified by the large thermal mass of the cryogenic model, which remains essentially constant during the short transfer period [15,16]. The adiabatic wall assumption for all other surfaces is supported by the high-performance polyurethane insulation of the facility (Section 2.1), making heat transfer through the structural walls negligible compared with the convective flux from the cryogenic model [17,18]. We acknowledge that this assumption represents an idealization; in reality, some heat leakage through structural elements may occur. However, given the short duration of the descent events (7–16 min) and the low thermal conductivity of the polyurethane insulation, the thermal penetration depth during the transient is small, and the adiabatic treatment is considered appropriate for the present engineering design study.
3. Physical Model and Operating Condition Design
The cryogenic model transport isolation system comprises three main functional spaces relevant to the present simulations: the dry hall (upper level), the temperature-conditioning room (lower level, directly below the dry hall), and the test section plenum (lower level, to the rear of the conditioning room). The model carrier is initially suspended in the dry hall and then descends vertically through an opening into either the conditioning room or the plenum. Accordingly, three computational domains are constructed for the three scenarios: (1) the carrier interior for the static suspension case, (2) the carrier interior and the conditioning room for the descent-to-conditioning-room case, and (3) the carrier interior, the plenum, and the wind tunnel for the descent-to-plenum case. The following subsections describe the geometry, mesh, and boundary conditions for each scenario in detail. Based on Section 2, three typical operating conditions are simulated: static suspension of the model carrier in the dry hall, descent into the temperature-conditioning room, and descent into the test section plenum.
3.1. Geometric Modeling and Mesh Generation
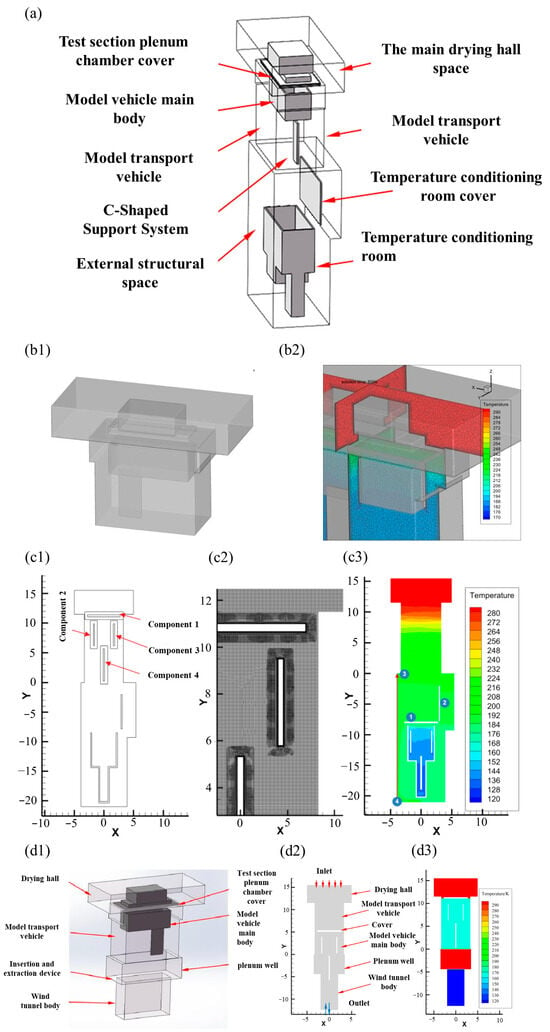
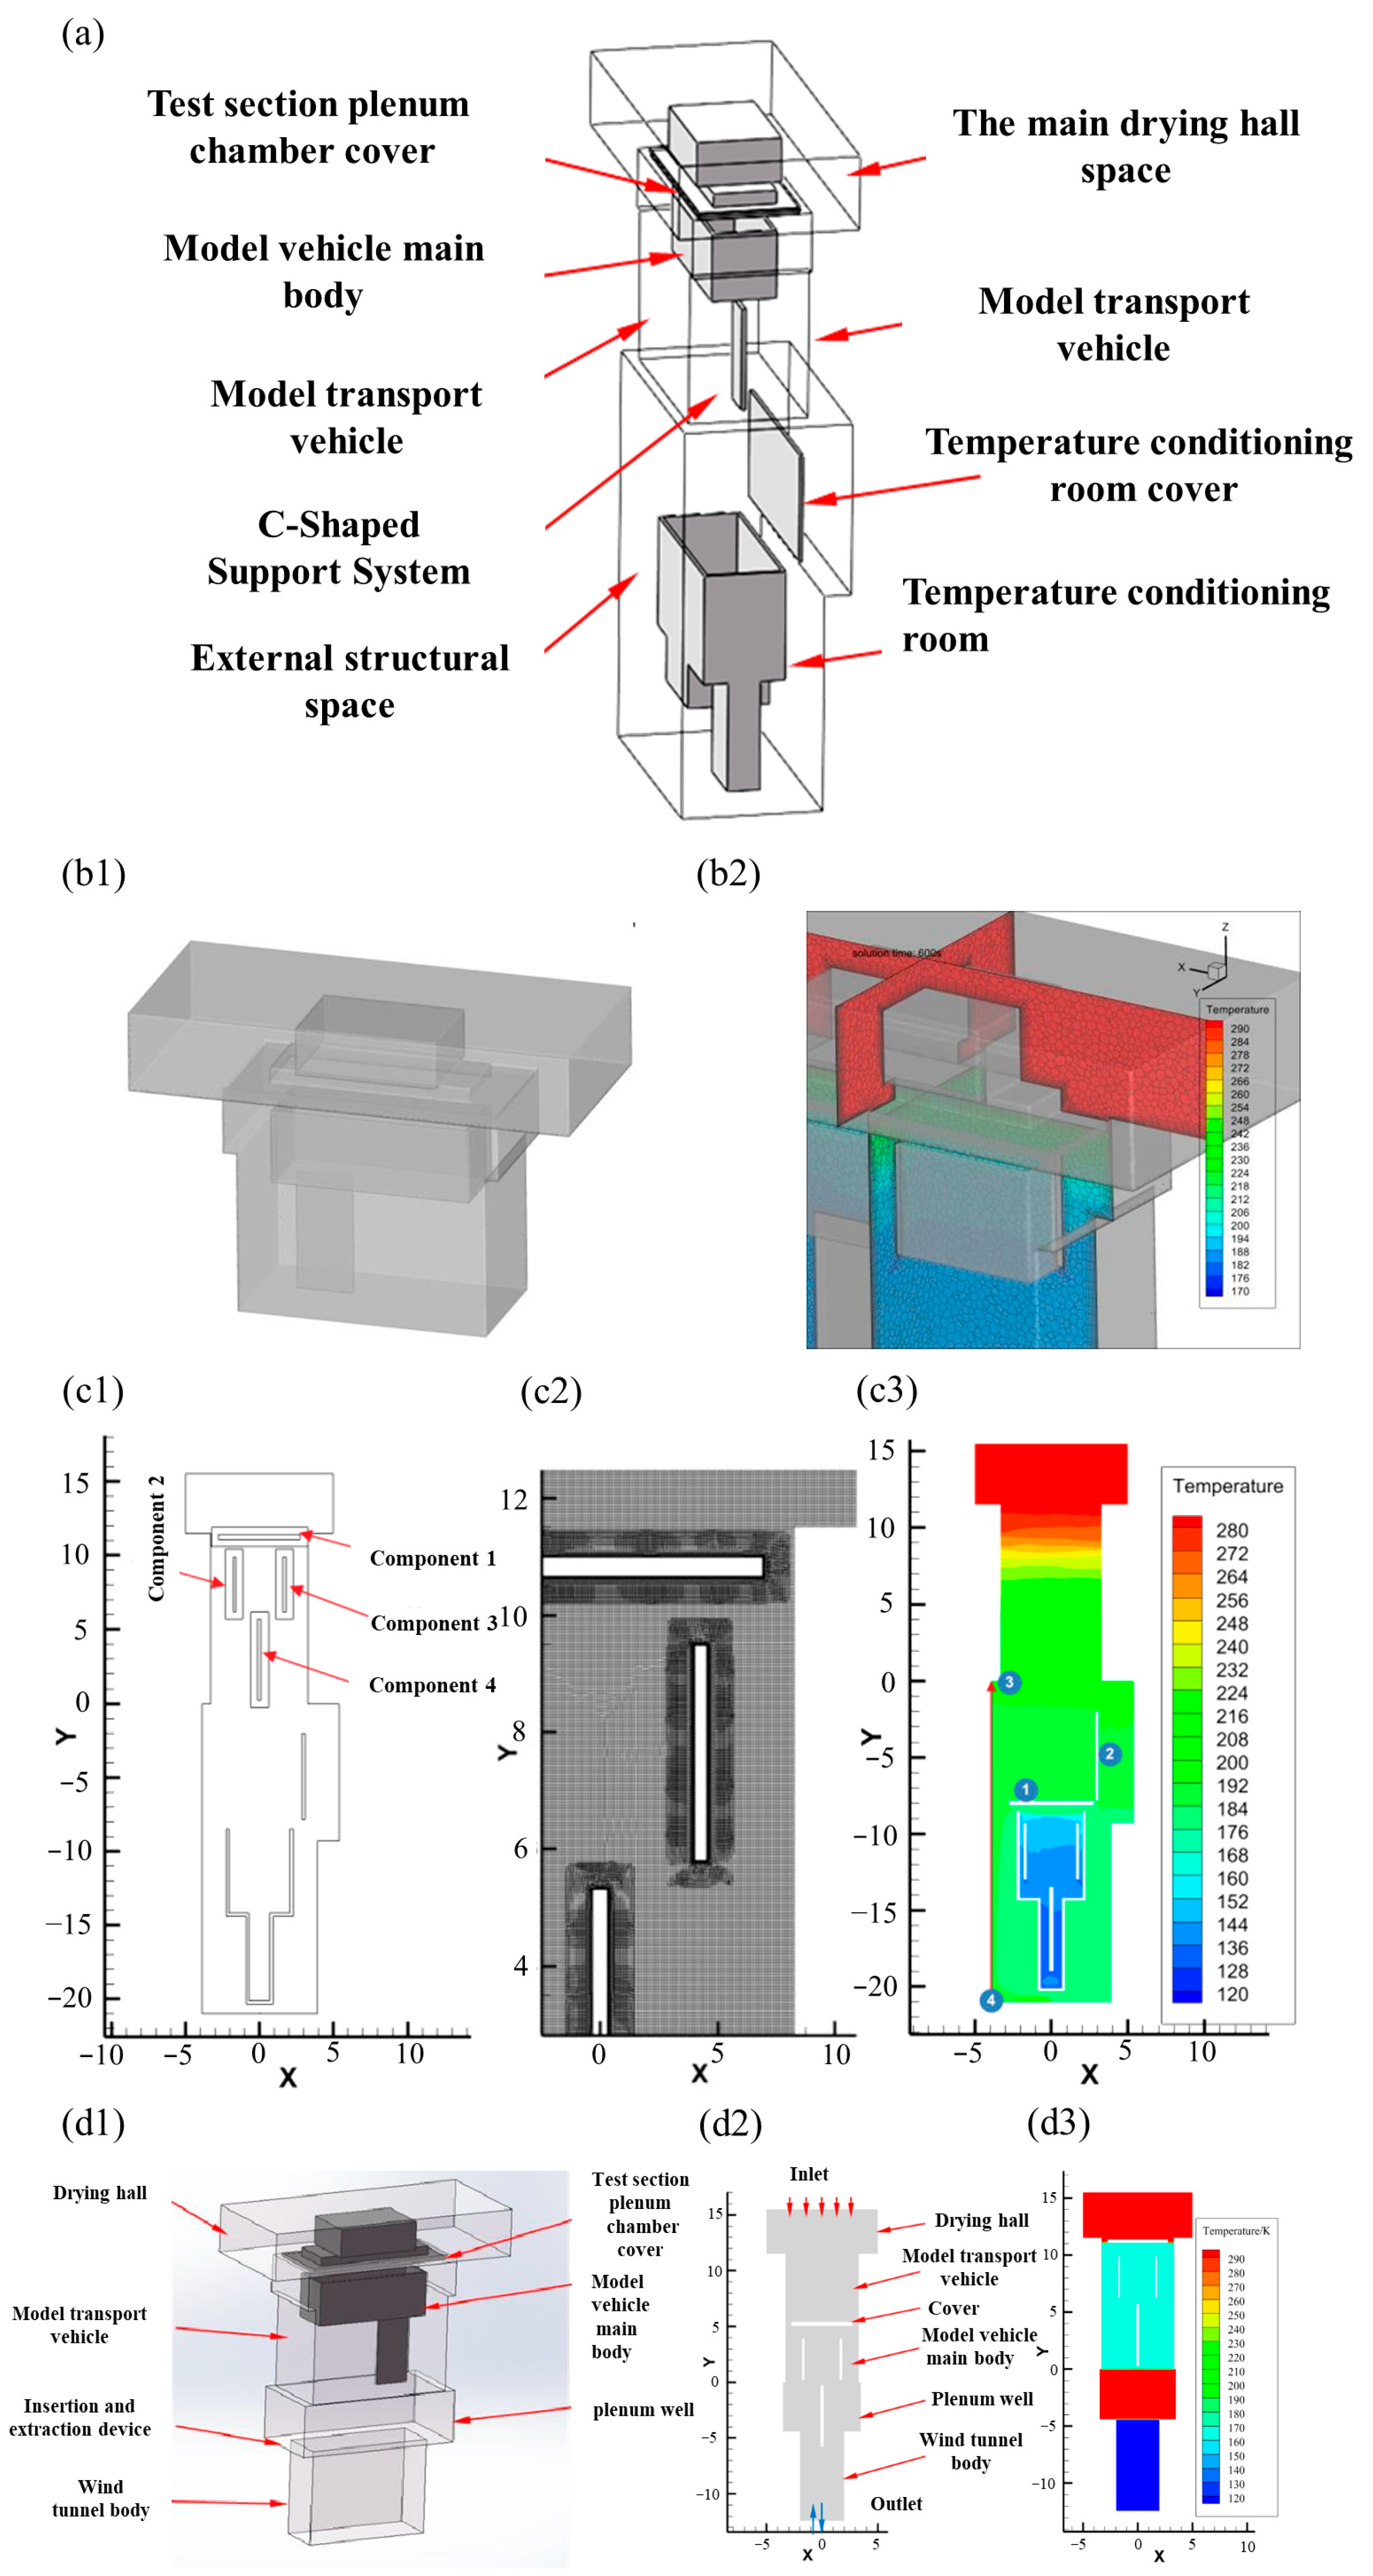
Based on the theoretical analyses presented in Section 2.3, the following geometric modeling and boundary condition simplifications are adopted. A 1:1 three-dimensional geometric model was constructed (Figure 3), including part of the dry hall, the carrier interior, the conditioning room, and the plenum. The dry hall is represented by the region above the carrier cover; the carrier interior is a rectangular channel of dimensions 12.4 m × 6.6 m in plan view; the conditioning room is a volume of approximately 400 m3 located directly below the carrier; and the plenum is a larger volume of approximately 8000 m3 located to the rear of the conditioning room. The vertical descent path from the dry hall to the lower spaces passes through a rectangular opening in the floor, as shown in Figure 3a. The cryogenic model is simplified as a rectangular box with equivalent surface area and volume; its surface temperature is fixed at 110 K due to its large thermal mass. Only the fluid region inside the carrier is meshed, and the carrier body itself is simplified. As shown in Figure 3a, when the carrier moves above the conditioning room, the bottom isolation door opens and the model is lowered vertically. For the transfer process (Figure 3(b1,b2)), the carrier remains sealed, and no moving mesh is involved. Mesh independence was systematically evaluated prior to the production runs. For the three-dimensional static suspension case, four unstructured polyhedral meshes ranging from 0.6 to 1.8 million cells were tested; the adopted 1.14 million-cell mesh featured ten prism layers near solid walls to ensure a y+ < 5. For the two-dimensional descent cases, the chosen meshes comprised 121,000 hexahedral cells for the temperature-conditioning room and 300,000 cells for the plenum. The steady-state solver employed convergence criteria of 10−4 for all scaled residuals (except 10−6 for energy), and the transient simulations used a fixed time step of 0.1 s, which was verified to adequately resolve the temporal temperature evolution. Additional details of the grid independence study are provided in the Supplementary Materials. Because full 3D simulation of the conditioning room would be computationally expensive, a two-dimensional mid-section model (depth 12.4 m) is adopted for the descent cases (Figure 3(c1–c3)). The validity of this simplification is supported by the three-dimensional static suspension results (Figure 4), which show that the temperature field inside the carrier is dominated by vertical stratification with limited spanwise variation. Additional three-dimensional dynamic mesh simulations for the descent cases confirmed that the monitoring point temperatures and the overall thermal response obtained from the 2D model are consistent with the 3D results. Dynamic mesh techniques (layering and local remeshing) are used to handle vertical descent, with the model motion prescribed by a user-defined function (UDF). The layering method is applied in the gap between the carrier and the side walls, where the mesh deformation is predominantly one-dimensional; cell layers are merged or created as the carrier moves. Local remeshing is activated in regions where the geometry changes are more irregular, such as around the bottom opening of the carrier, to replace highly skewed or stretched cells with new ones of acceptable quality. For the two-dimensional descent cases, an overset mesh approach is used to avoid excessive cell regeneration; the component mesh moves inside a stationary background mesh, with flow variables interpolated across the mesh interface at each time step. The computational time per case varied with mesh size and total simulation duration: approximately 18 h for the 3D static suspension case (1.14 million cells), 6–8 h for the 2D descent-into-conditioning-room cases (~121,000 cells), and 10–14 h for the 2D descent-into-plenum cases (~300,000 cells). Descent into the plenum (Figure 3(d1–d3)) requires additional considerations: temperatures near the steel cable and the plug-in unit. A top-in bottom-out displacement ventilation is employed: hot air enters from the dry hall, while cold air exits to the wind tunnel. The computational domain includes four regions: the dry hall above the carrier, the carrier interior, the plenum, and the wind tunnel. The carrier interior channel measures 12.4 m × 6.6 m, and the model descends 11.07 m within the carrier and then another 4 m into the plenum. As indicated in Figure 3(d3), the initial temperature inside the carrier is set to 170 K (based on static suspension results), and that inside the plenum is set to 110 K.
Figure 3.
Three-dimensional model and partial mesh division: (a) overall model of the model carrier descending into the temperature-conditioning room, showing the dry hall (upper), the carrier interior (centre), and the conditioning room (lower), with the vertical descent path indicated by the arrow; (b1,b2) model carrier transfer process in the dry hall, with the carrier sealed and no mesh motion; (c1–c3) model carrier descending into the temperature-conditioning room, showing the 2D mid-section simplification (c1), the nested mesh arrangement (c2), and the monitoring point locations (c3); (d1–d3) model carrier descending into the test section plenum, showing the 3D view (d1), the 2D mid-section model (d2), and the monitoring point locations (d3).
Figure 4.
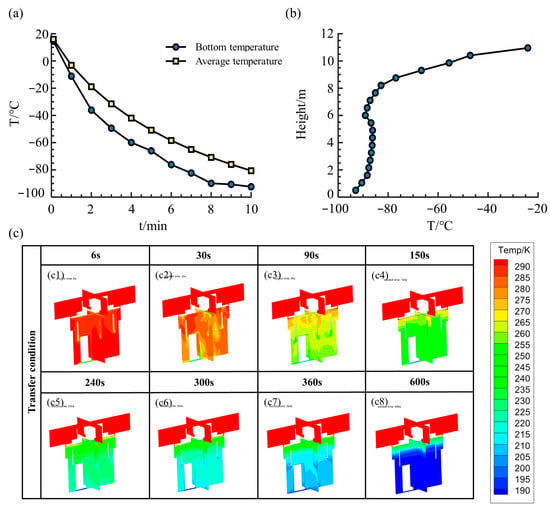
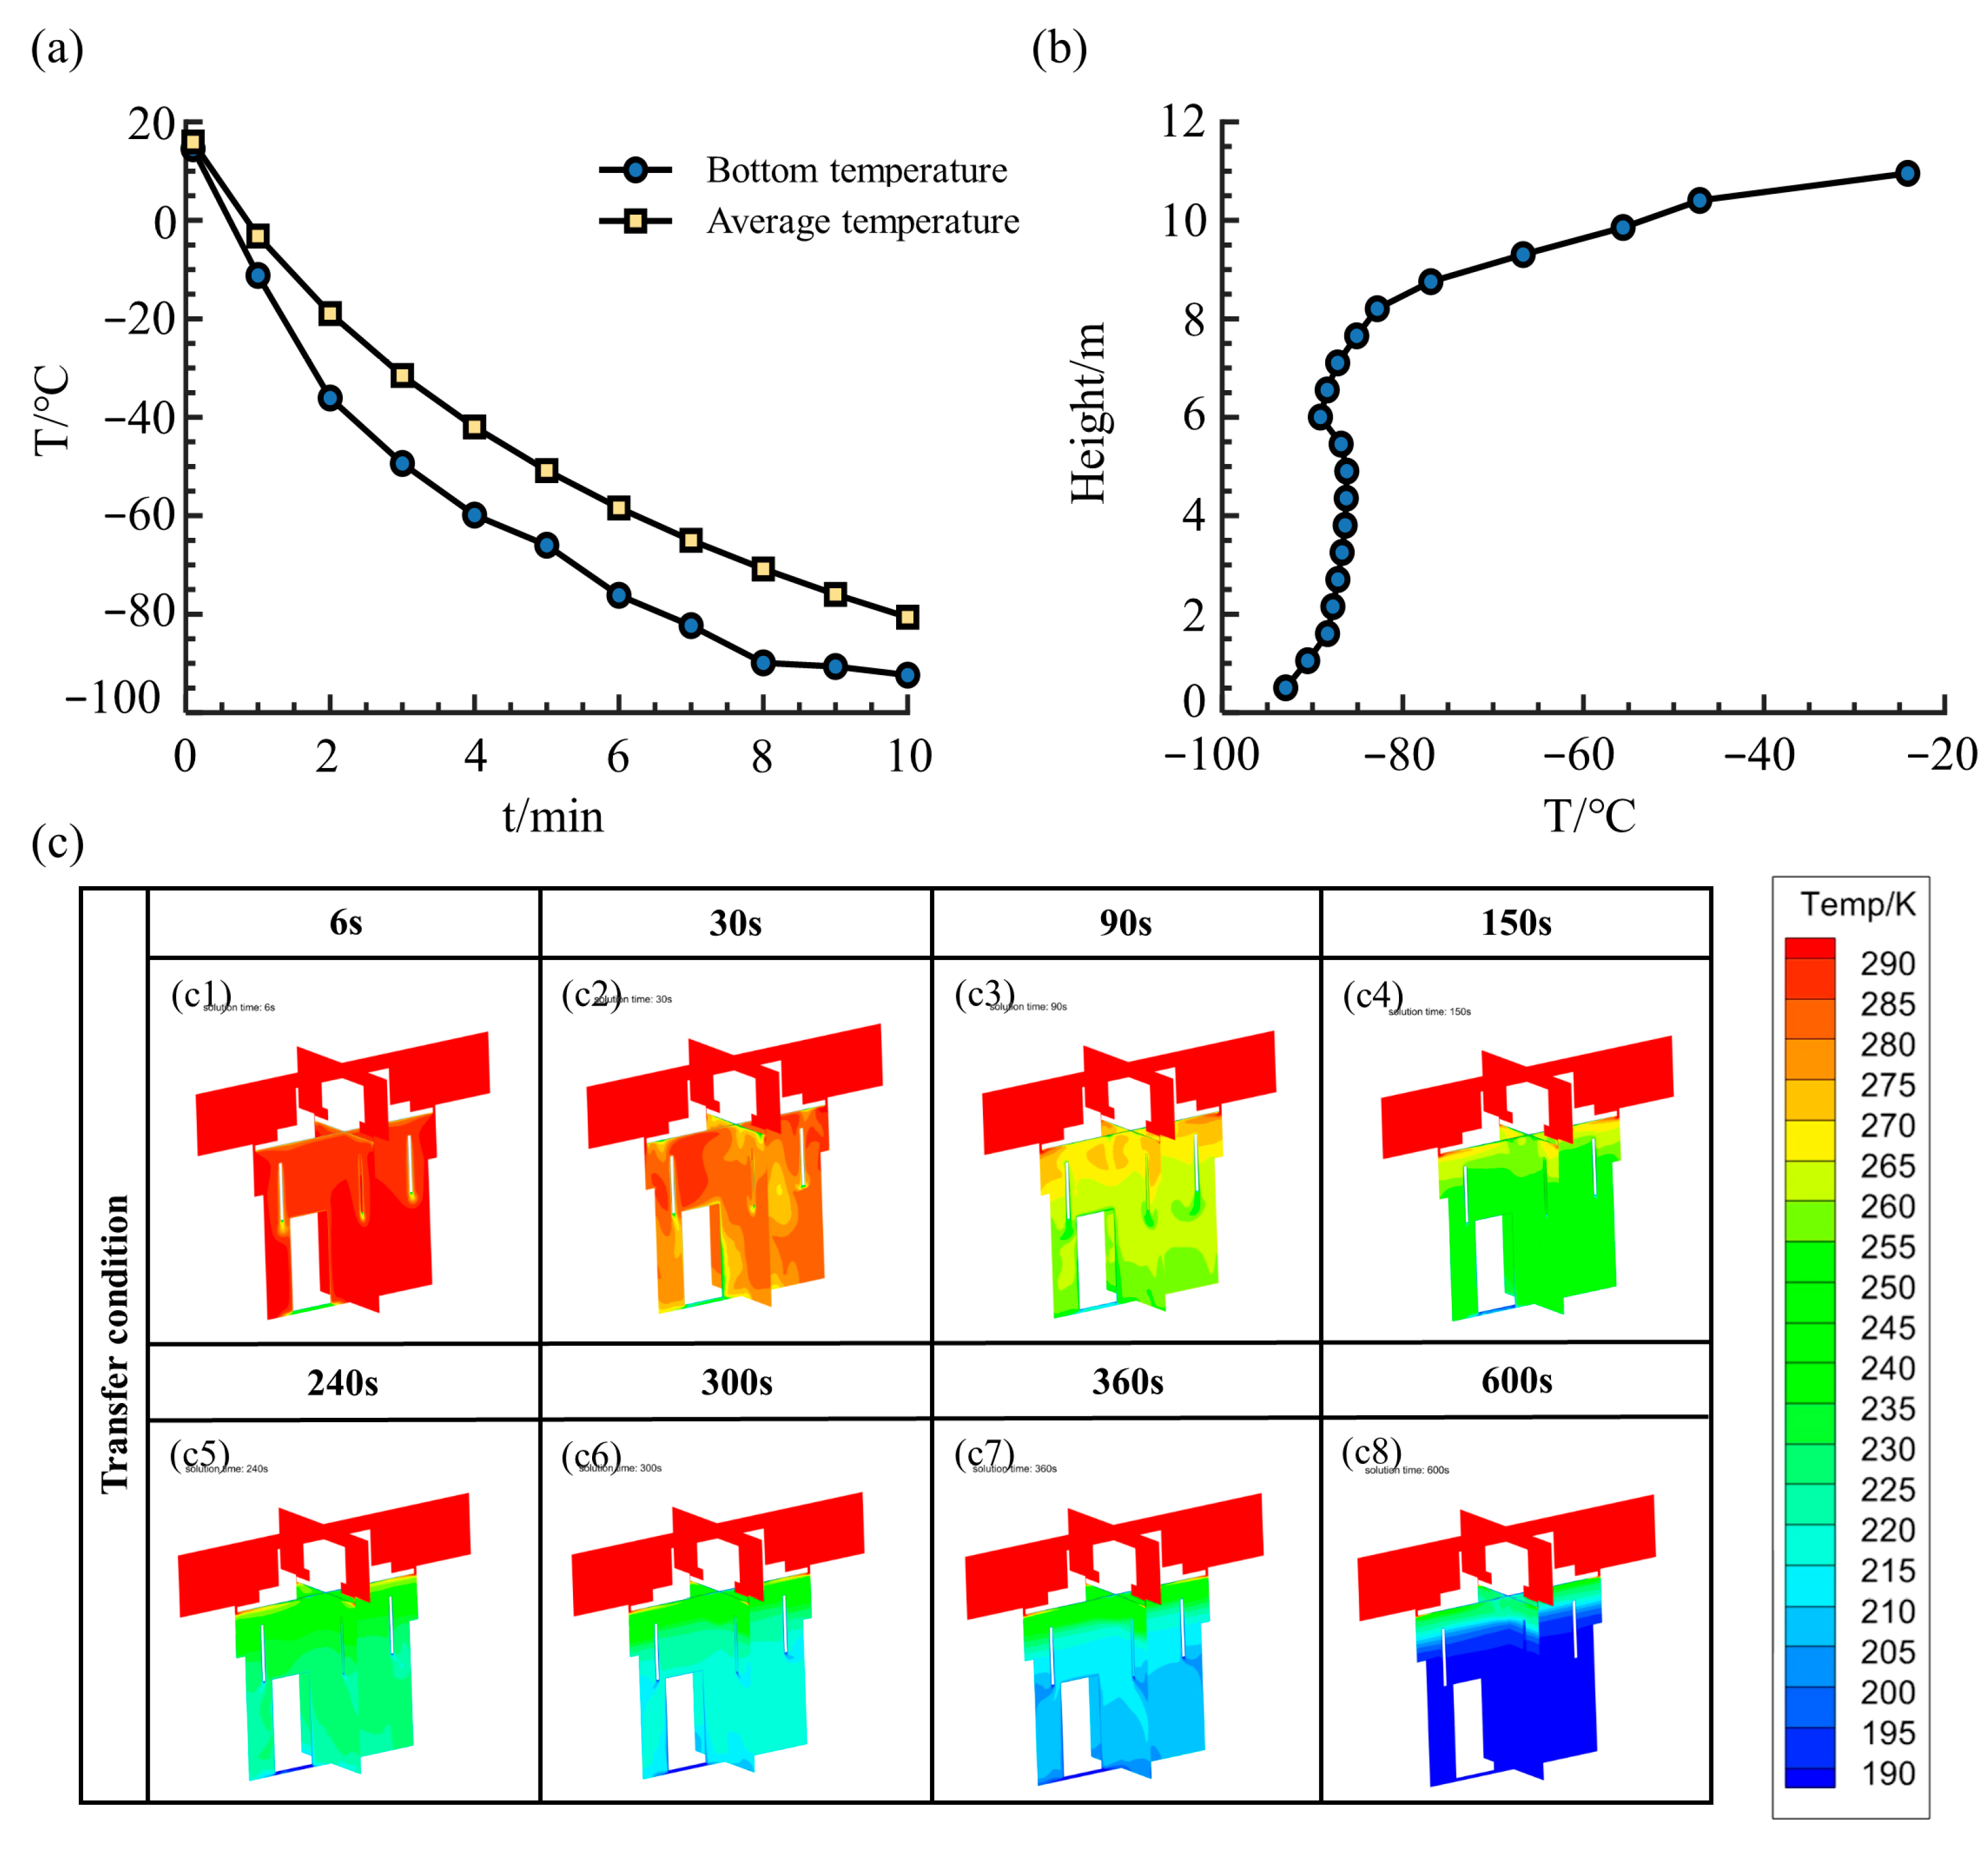
Thermal effects under static suspension conditions: (a) gas temperature variation over time; (b) temperature variation with height after transfer; (c1–c8) temperature distribution on the model carrier at 6 s, 30 s, 90 s, 150 s, 240 s, 300 s, 360 s and 60 s.
3.2. Boundary Conditions and Solver Settings
3.2.1. Model Carrier Transfer Process in the Dry Hall
The hall temperature is maintained at 293.15 K, and the top surface of the domain is set as a pressure outlet to allow free inflow or outflow as the carrier interior is open to the dry hall through the top. The bottom surface of the model carrier cover and the carrier sidewalls are prescribed as cryogenic isothermal surfaces at 110 K to represent the cold surfaces of the cryogenic model and its enclosure, while all other walls are assumed adiabatic because the thermal insulation of the facility makes heat transfer through the structural walls negligible. The initial temperature of the fluid domain is 293.15 K. A fixed time step of 0.1 s is used, and the total simulation time is 10 min. Because buoyancy forces dominate, the pressure discretization scheme is set to Body Force Weighted. An unstructured mesh is used, and the discretization schemes are second-order upwind. The realizable k-ε model with enhanced wall treatment is selected as the turbulence closure, consistent with the analysis in Section 2.3. This model has been widely validated for natural-convection-dominated flows in large enclosures and provides a robust balance between predictive accuracy and computational cost for the present transient simulations. The detailed solver settings are given in Table 1. All simulations were performed using ANSYS Fluent 2020. The convergence criteria and mesh details are as described in Section 3.1. Convergence within each time step was further ensured by tracking key physical quantities at selected monitoring points until they reached stable values.
Table 1.
Solver settings for the model carrier transfer process.
3.2.2. Model Carrier Descent into the Temperature-Conditioning Room
The air inlets located at the bottom of the external structural space are defined as velocity inlets, where the inlet velocity is determined by the prescribed air flow rate and the inlet air temperature is 293.15 K to model the makeup air supplied from the dry hall through the displacement ventilation system. The upper surface connected to the hall is set as a pressure outlet with zero static pressure and a backflow temperature of 293.15 K to allow air to exit freely to the dry hall while preventing reverse flow of cold air from the conditioning room. The bottom of the model carrier cover and the carrier surfaces are maintained at a cryogenic temperature of 110 K, while all other walls are treated as adiabatic.
The solver settings are the same as for the transfer process (Table 1). During the solution, four monitoring points are selected to record temperature variation over time, with positions shown in Figure 3(c3): Points P1 (moving with the carrier, above its cover) and P2 (fixed behind the conditioning room cover) both monitor the temperature near the steel cable. Points P3 and P4 are located at the top and bottom of the external structural space, respectively, to track wall temperatures for cryogenic protection assessment of the civil structure.
Monitoring points P3 and P4 are used to monitor the temperature near the walls of the external structural space, providing a reference for cryogenic protection of the civil structure. After the model carrier completes its descent, the wall temperature distribution is extracted along the line connecting P3 and P4 to reflect the temperature stratification.
3.2.3. Model Carrier Descent into the Test Section Plenum
The upper surface connected to the hall is specified as a velocity inlet, with the inlet velocity determined by the prescribed air flow rate and the inlet air temperature set to 293.15 K to supply warm air from the dry hall in a top-in, bottom-out displacement ventilation configuration. The lower surface connected to the wind tunnel is defined as a pressure outlet, with zero static pressure and a backflow temperature of 110 K to allow the cold air to exit into the wind tunnel, as occurs in the actual facility. The bottom of the model carrier cover and the carrier surfaces are maintained at a cryogenic temperature of 110 K, while all other walls are assumed adiabatic. The solver settings are the same as in Table 1. Key monitoring points: near the plug-in unit at the plenum station (point 4 in Figure 3(d3)) and near the model carrier steel cable (point 1 in Figure 3(d3)). The boundary conditions applied in each of the three scenarios are summarized in Table 2 for clarity and quick reference.
Table 2.
The boundary conditions for all three scenarios.
3.3. Operating Condition Design for Dynamic Descent
3.3.1. Model Carrier Descent into the Temperature-Conditioning Room
According to design requirements, the model carrier adopts two descent speeds: average descent speed of 1.2 m/min and maximum descent speed of 2.5 m/min. The makeup air flow rate from the dry hall to the temperature-conditioning room takes three values: 0 m3/h, 2500 m3/h, and 10,000 m3/h, all with an inlet air temperature of 293.15 K. A total of five operating conditions are designed, as shown in Table 3.
Table 3.
Operating condition configurations for model carrier descent into the temperature-conditioning room.
In actual transfer operations, delays due to scheduling or malfunctions may cause the transfer time to exceed 10 min. To provide a conservative assessment of the thermal protection capability of the external structural space, the temperature inside the model carrier insulation layer is taken as 110 K in the most extreme scenario. This assumption is physically realisable: the 250-ton model carrier is cooled to approximately 110 K by gaseous nitrogen during normal operation, and in the event of prolonged delays, the insulation layer could approach this temperature. While thermal inertia and mixing effects would in practice prevent the entire interior from reaching 110 K instantaneously, this conservative scenario is designed to evaluate the worst-case cold release and to inform the design of backup protection measures. To address this, the steel plate cladding on the surfaces of the temperature-conditioning room and its cover is additionally considered a thermal storage layer, and solid heat conduction is included in the computational domain to investigate the cryogenic resistance of the external structural space under extreme conditions.
Case 6 considers an extreme scenario with a makeup air flow rate of 2500 m3/h and a descent speed of 2.5 m/min. The initial temperature inside the model carrier is set to 110 K, representing the most severe condition. In addition, solid heat conduction within the steel cladding of the temperature-conditioning room and its cover is included in the computational model.
3.3.2. Model Carrier Descent into the Test Section Plenum
Based on the parameters of the model carrier lifting device, the model carrier also adopts two descent speeds: 1.2 m/min and 2.5 m/min. According to the air supply capacity of the dry system, the air flow rate from the hall to the plenum takes two values: no air supply (0 m3/h) and the maximum value of 10,000 m3/h. According to the principle of displacement ventilation, when the air velocity around the model carrier exceeds the descent speed of the model carrier, the model remains in warm air throughout the descent. The matching air flow rate is calculated as: model carrier descent speed × channel cross-sectional area. When the model carrier descends at 1.2 m/min, the corresponding matching air flow rate is approximately 6000 m3/h; when descending at 2.5 m/min, the matching air flow rate is approximately 12,500 m3/h. Therefore, these two matching air flow rate conditions are added to the calculations. A total of six operating conditions are designed, as shown in Table 4.
Table 4.
Operating condition configurations for model carrier descent into the test section plenum.
4. Results and Discussion
4.1. Thermal Effects of the Model Carrier Transfer Process in the Dry Hall (Static Suspension Condition)
Figure 4a shows the time histories of the average temperature inside the model carrier and the temperature at its bottom. After 10 min of transfer, the average temperature inside the carrier drops to about 192 K (−81 °C). Figure 4b presents the gas temperature variation with height near the model carrier wall after the transfer. A clear thermal stratification is observed inside the carrier. The temperature contours in Figure 4c also show significant stratification, and most regions in contact with the model are below the average temperature. The lowest temperature inside the carrier is approximately 170 K (−103 °C). This strong stratification arises because the cryogenic model surface generates negatively buoyant cold air that sinks to the bottom of the carrier interior. The cold layer deepens progressively as the cold air accumulates, while warmer air remains trapped near the top due to the stable density gradient. This reverse stratification—cold at the bottom and warm at the top—is characteristic of buoyancy-driven flow adjacent to a cold surface in a confined space. For design safety, the initial temperature inside the model carrier is uniformly taken as 170 K in all subsequent calculations of the dynamic descent conditions.
4.2. Thermal Shock Effects During Dynamic Descent
4.2.1. Model Carrier Descent into the Temperature-Conditioning Room
(1) Cases 1–2 (model carrier descent speed of 1.2 m/min)
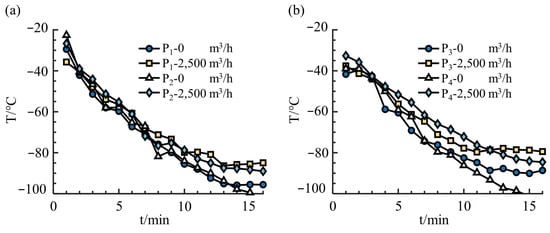
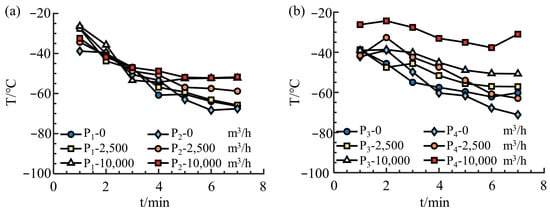
In Cases 1 (no makeup air) and 2 (makeup air flow rate of 2500 m3/h, 20 °C air), the model carrier descent speed is 1.2 m/min in both cases. From the temperature curves shown in Figure 5, it can be seen that the 2500 m3/h warm air raises the temperature inside the space to some extent, but the increase is limited. The limited protection is explained by the buoyancy-driven flow structure: the cold air generated by the descending model is denser than the surrounding warm air and sinks rapidly to the bottom of the external structural space. With only 2500 m3/h of makeup air, the upward displacement flow driven by the warm air supply is insufficient to overcome the downward buoyancy flux from the cold model. Consequently, the cold layer accumulates and the stratification interface remains low, leaving the steel cable—located above the carrier cover—exposed to cryogenic temperatures. This indicates that a small amount of makeup air in the external structural space provides insufficient protection for critical components; larger air flow rates or targeted protection for cryogenic-sensitive parts should be considered.
Figure 5.
Temperatures at monitoring points during model carrier descent into the temperature−conditioning room (Cases 1 and 2): (a) P1 and P2; (b) P3 and P4.
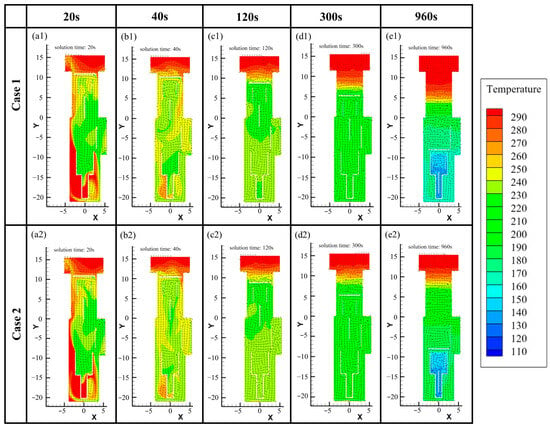
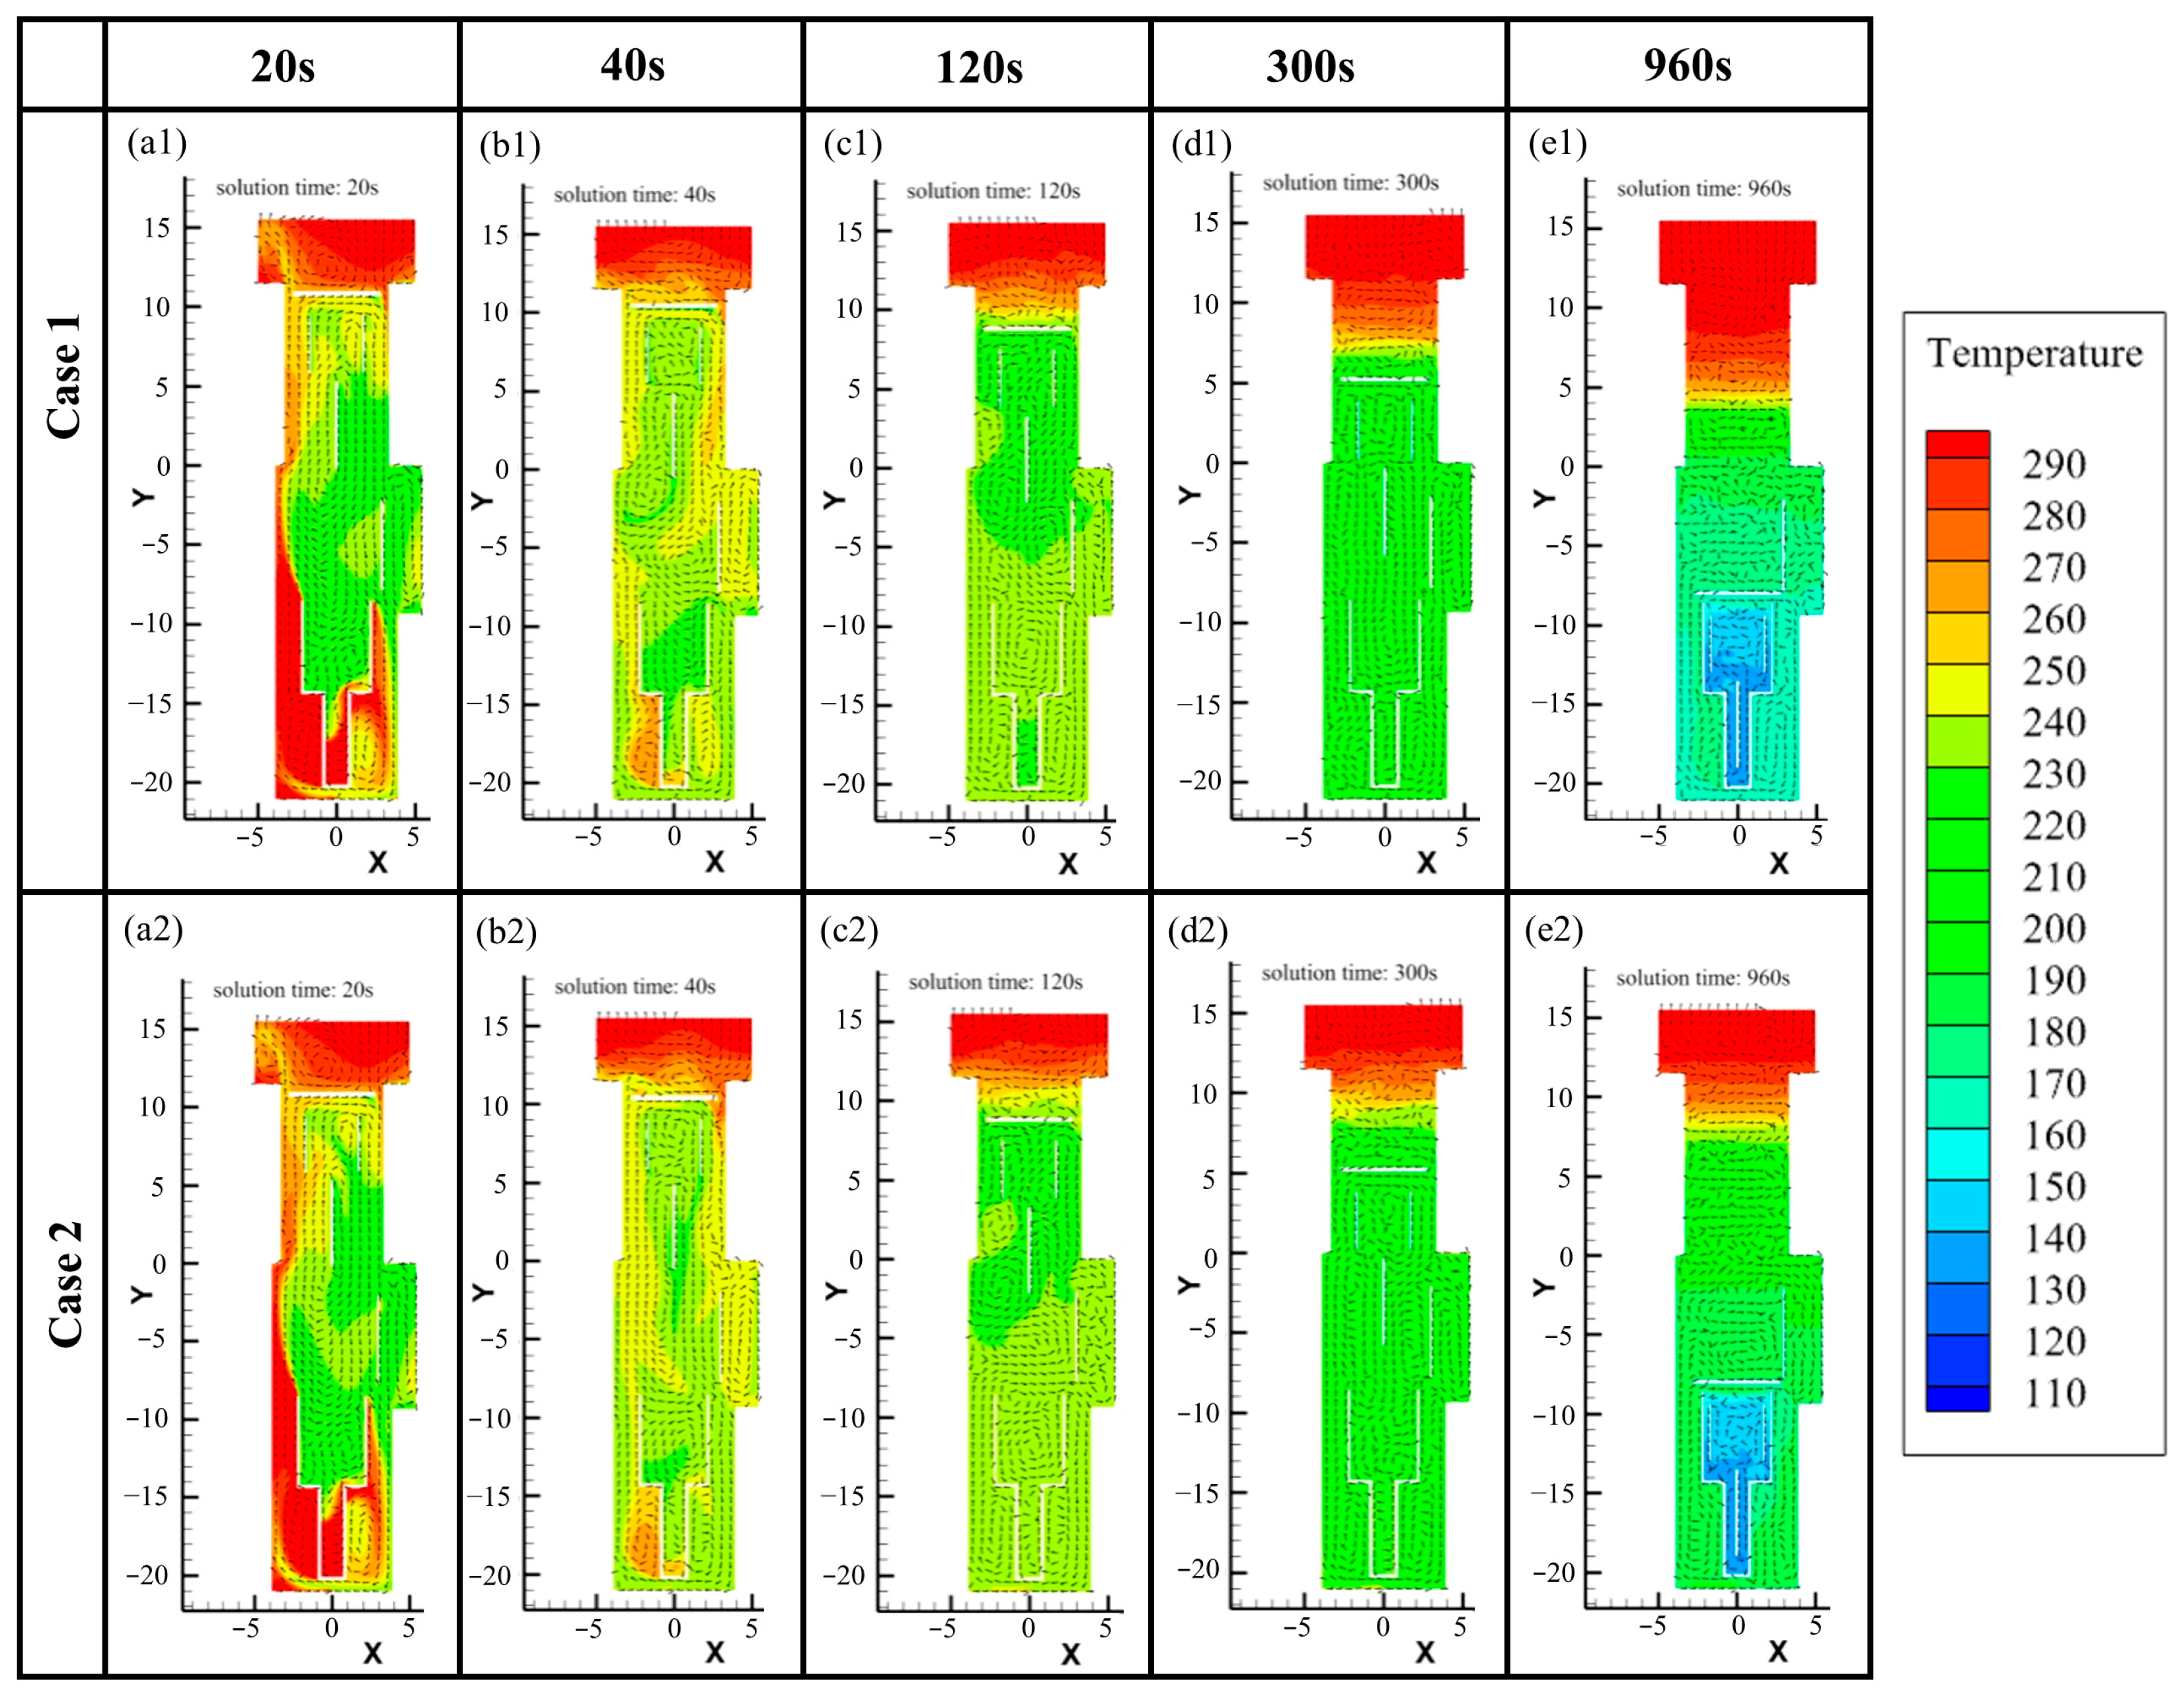
The temperature contours in Figure 6 visually illustrate the temperature evolution during the model carrier descent. Figure 6 shows that cold air sinks quickly, and with only 2500 m3/h of makeup air, the stratification interface remains low, causing the steel cable temperature to drop below −80 °C. The mechanical strength and fatigue strength of the model carrier spreader cannot be guaranteed below −60 °C, posing a risk of damage. Therefore, ventilating the space for protection is necessary; however, from the current simulation results, a makeup air flow of only 2500 m3/h at a descent speed of 1.2 m/min provides limited protection.
Figure 6.
Temperature contours of the model carrier descending into the temperature-conditioning room for Case 1 (a1–e1) and Case 2 (a2–e2), recorded at 20 s, 40 s, 120 s, 300 s, and 960 s.
(2) Cases 3–5 (model carrier descent speed of 2.5 m/min)
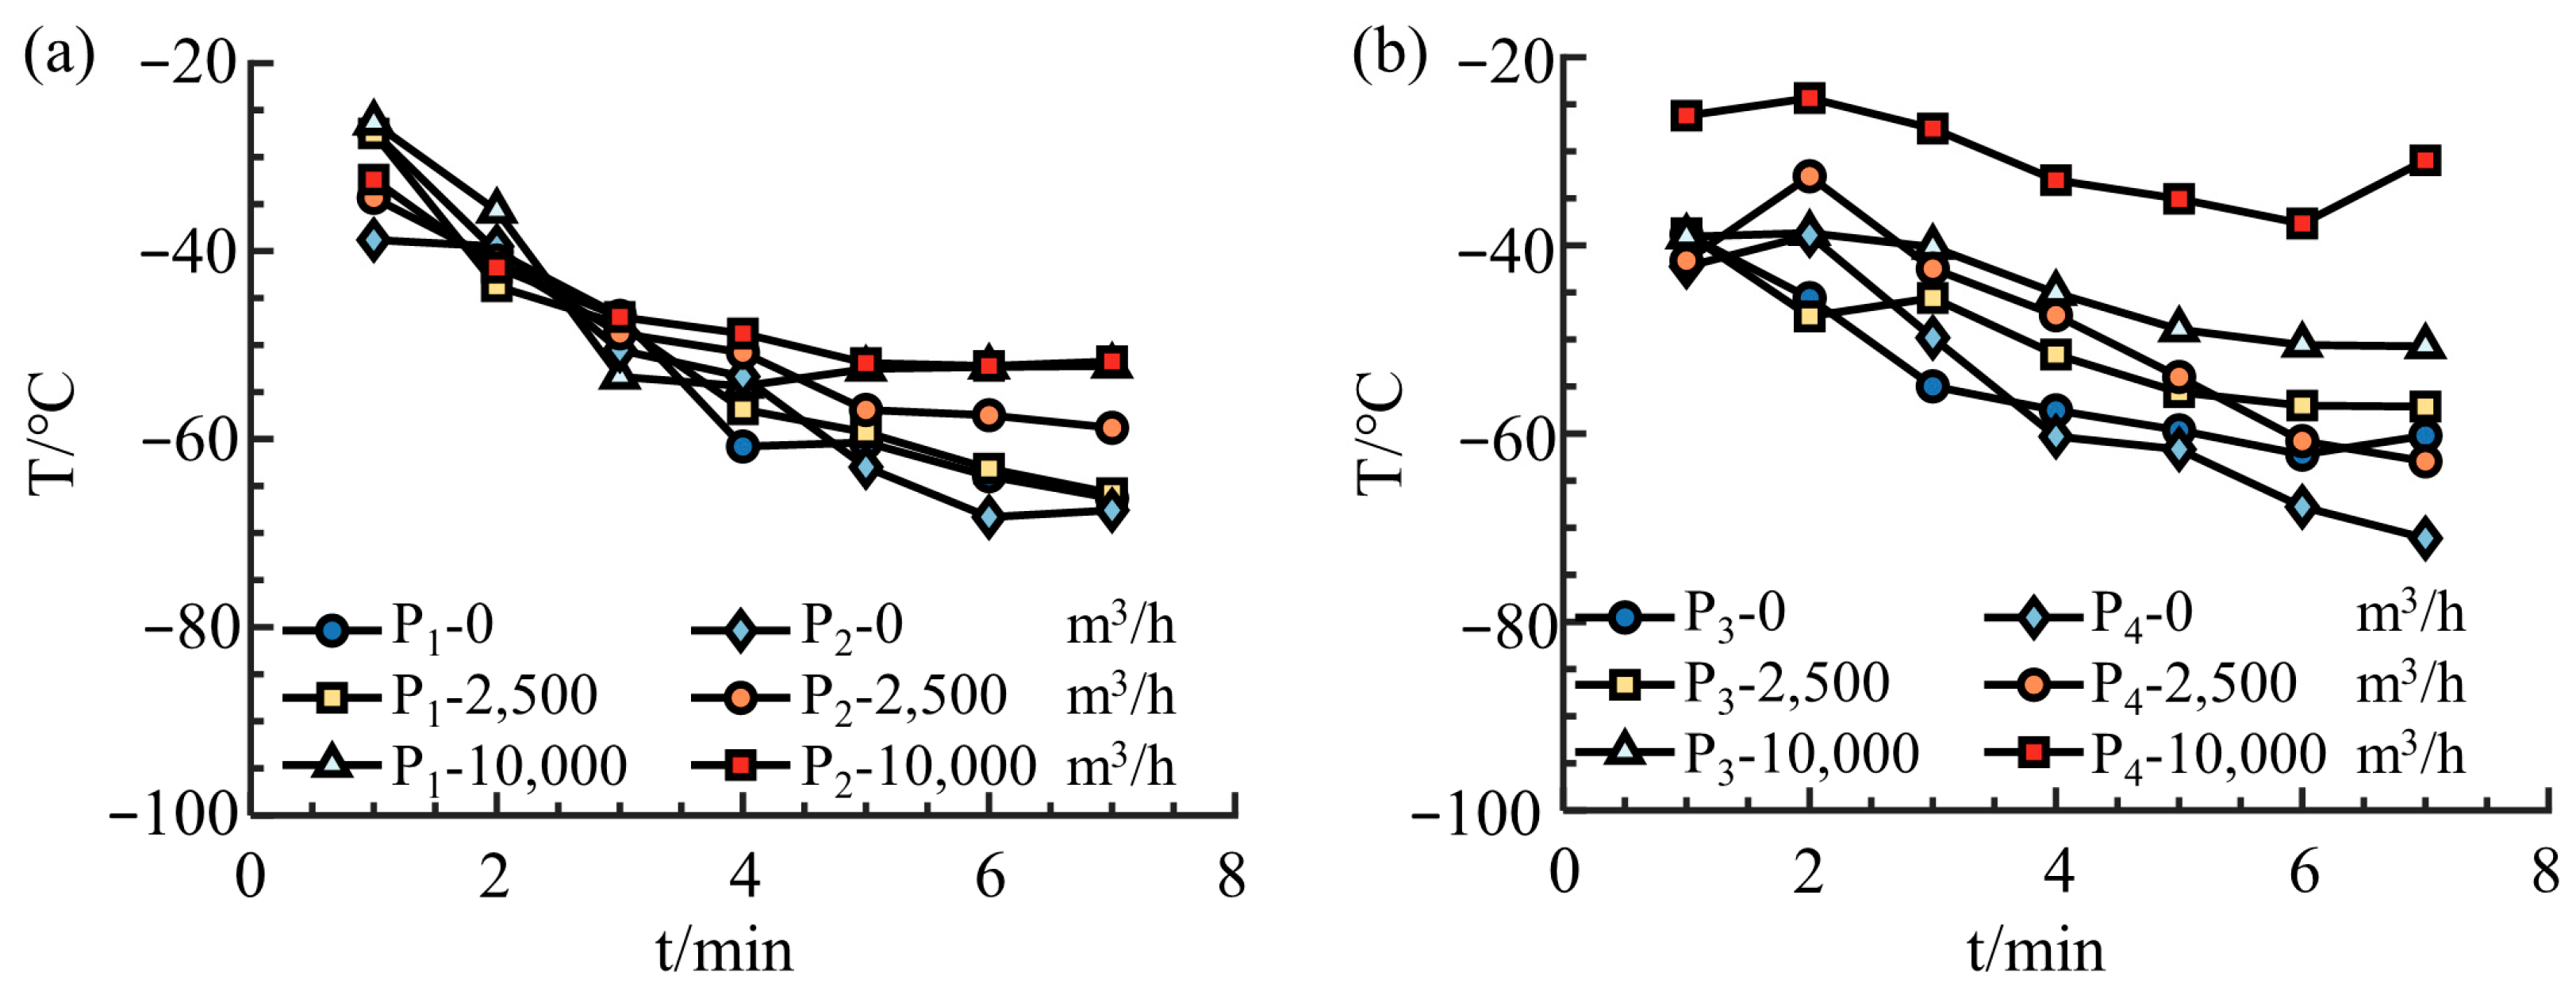
In Cases 3 to 5, the descent speed of the model carrier is increased to 2.5 m/min, reducing the descent time from about 16 min to approximately 7 min 40 s. The three cases correspond to makeup air flow rates of 0, 2500, and 10,000 m3/h, respectively. Because the residence time of the model carrier in the external structural space is significantly shortened, the heat absorption period is reduced, and the temperature inside the external structural space rises markedly. Comparing Figure 7 with Figure 5 shows that for the same makeup air flow rate, increasing the descent speed raises the temperature inside the external structural space by about 25 °C.
Figure 7.
Temperatures at monitoring points during model carrier descent into the temperatureconditioning room (Cases 3–5): (a) P1 and P2; (b) P3 and P4.
When the bottom makeup air flow reaches 10,000 m3/h, the temperature near the steel cable increases by about 20 °C compared with the no-makeup case, and the gas temperature near the cable after descent is approximately −60 °C, which is adopted as the conservative safety limit for carbon-steel wire ropes [29,30]. This indicates that the combination of fast descent (2.5 m/min) and a large makeup air flow (10,000 m3/h) can effectively protect the steel cable.
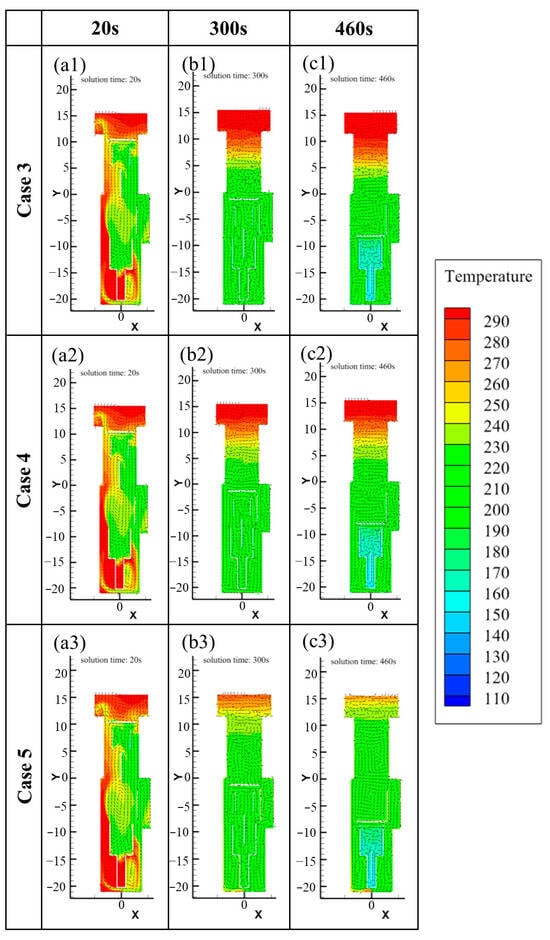
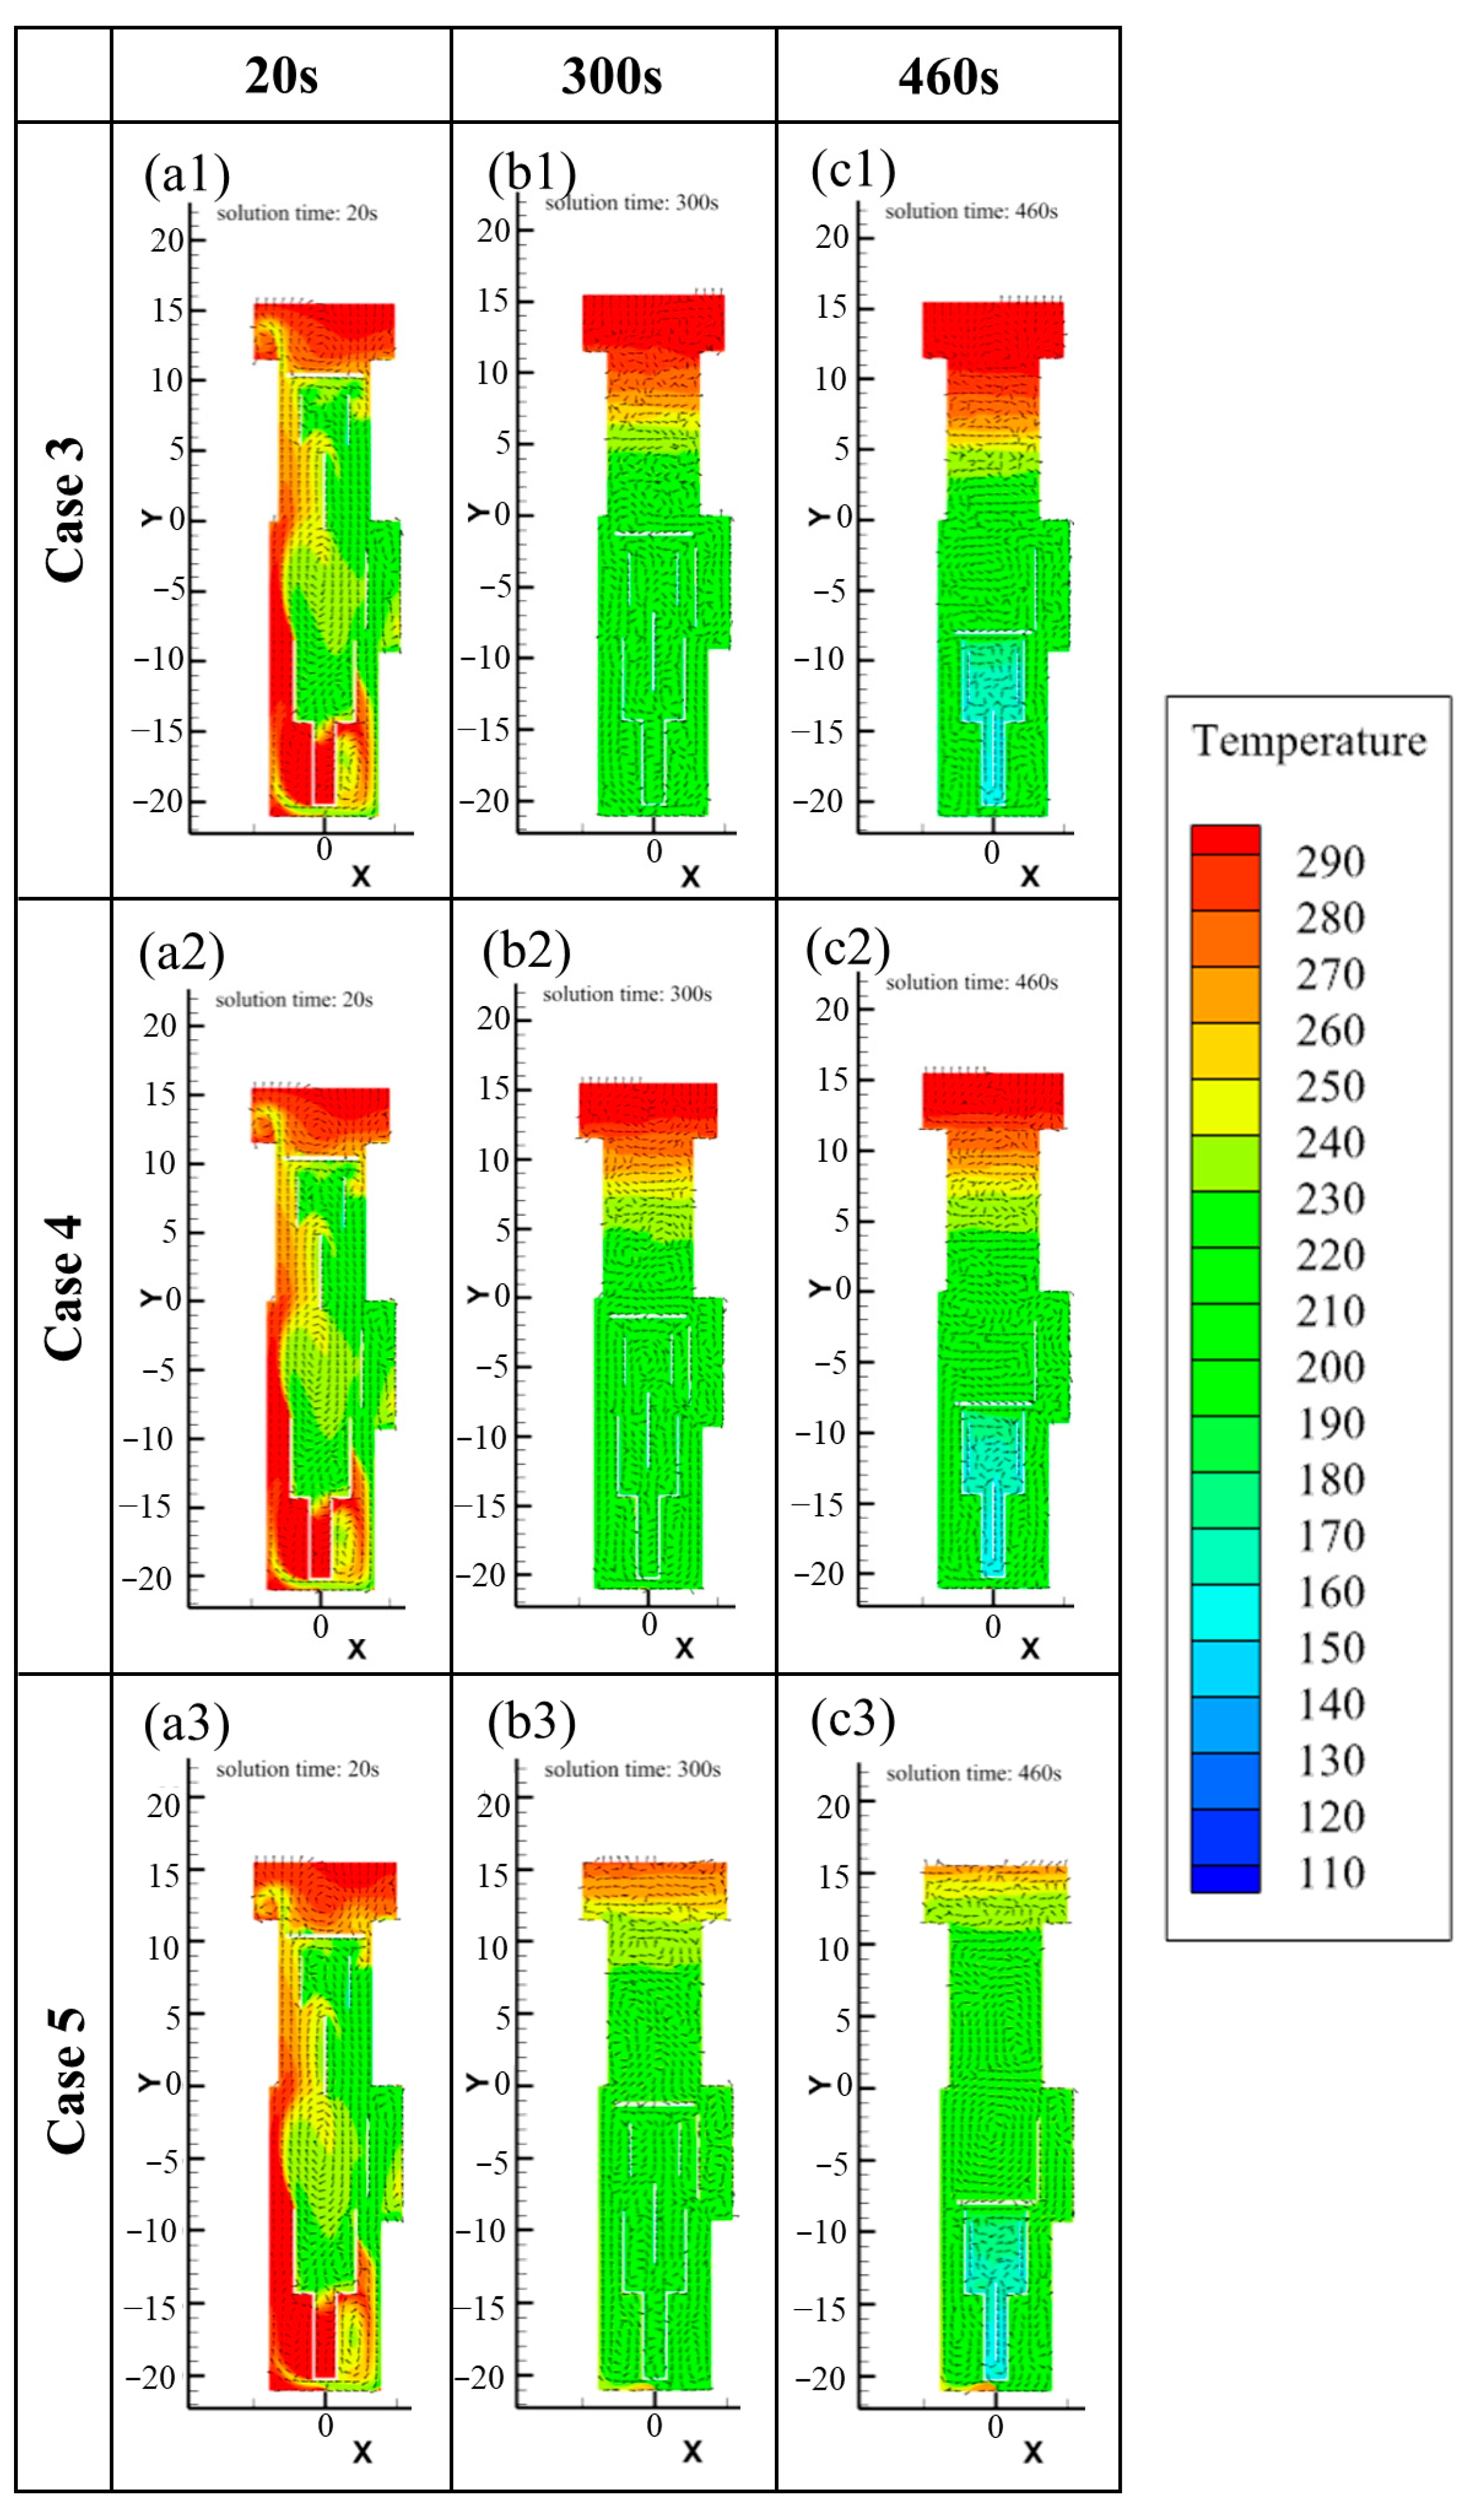
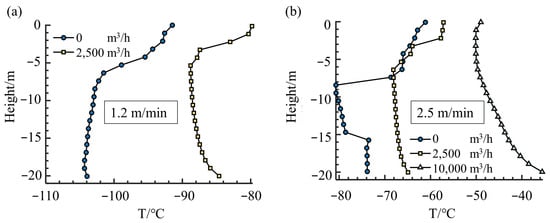
The temperature contours in Figure 8 further confirm the above conclusions. Considering the results of Cases 3–5 together with Figure 9, it can be seen that without makeup air protection, the steel cable faces a high risk of cryogenic damage. To maintain the cable temperature above −60 °C, the preferred strategy is a descent speed of 2.5 m/min combined with a makeup air flow of 10,000 m3/h.
Figure 8.
Temperature contours of the model carrier descending into the temperatureconditioning room (Cases 3–5) at 20 s, 300 s, and 460 s: (a1–c1) case 3; (a2−c2) case 4; (a3−c3) case 5.
Figure 9.
Temperature along the monitoring line after model carrier descent: (a) Descent speed of 1.2 m/min; (b) Descent speed of 2.5 m/min.
(3) Case 6 (extreme initial condition and solid thermal storage)
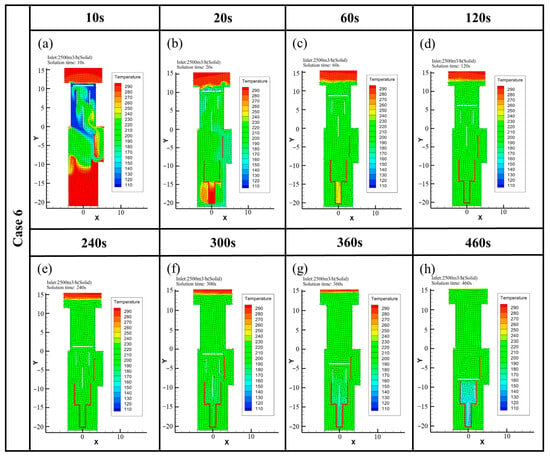
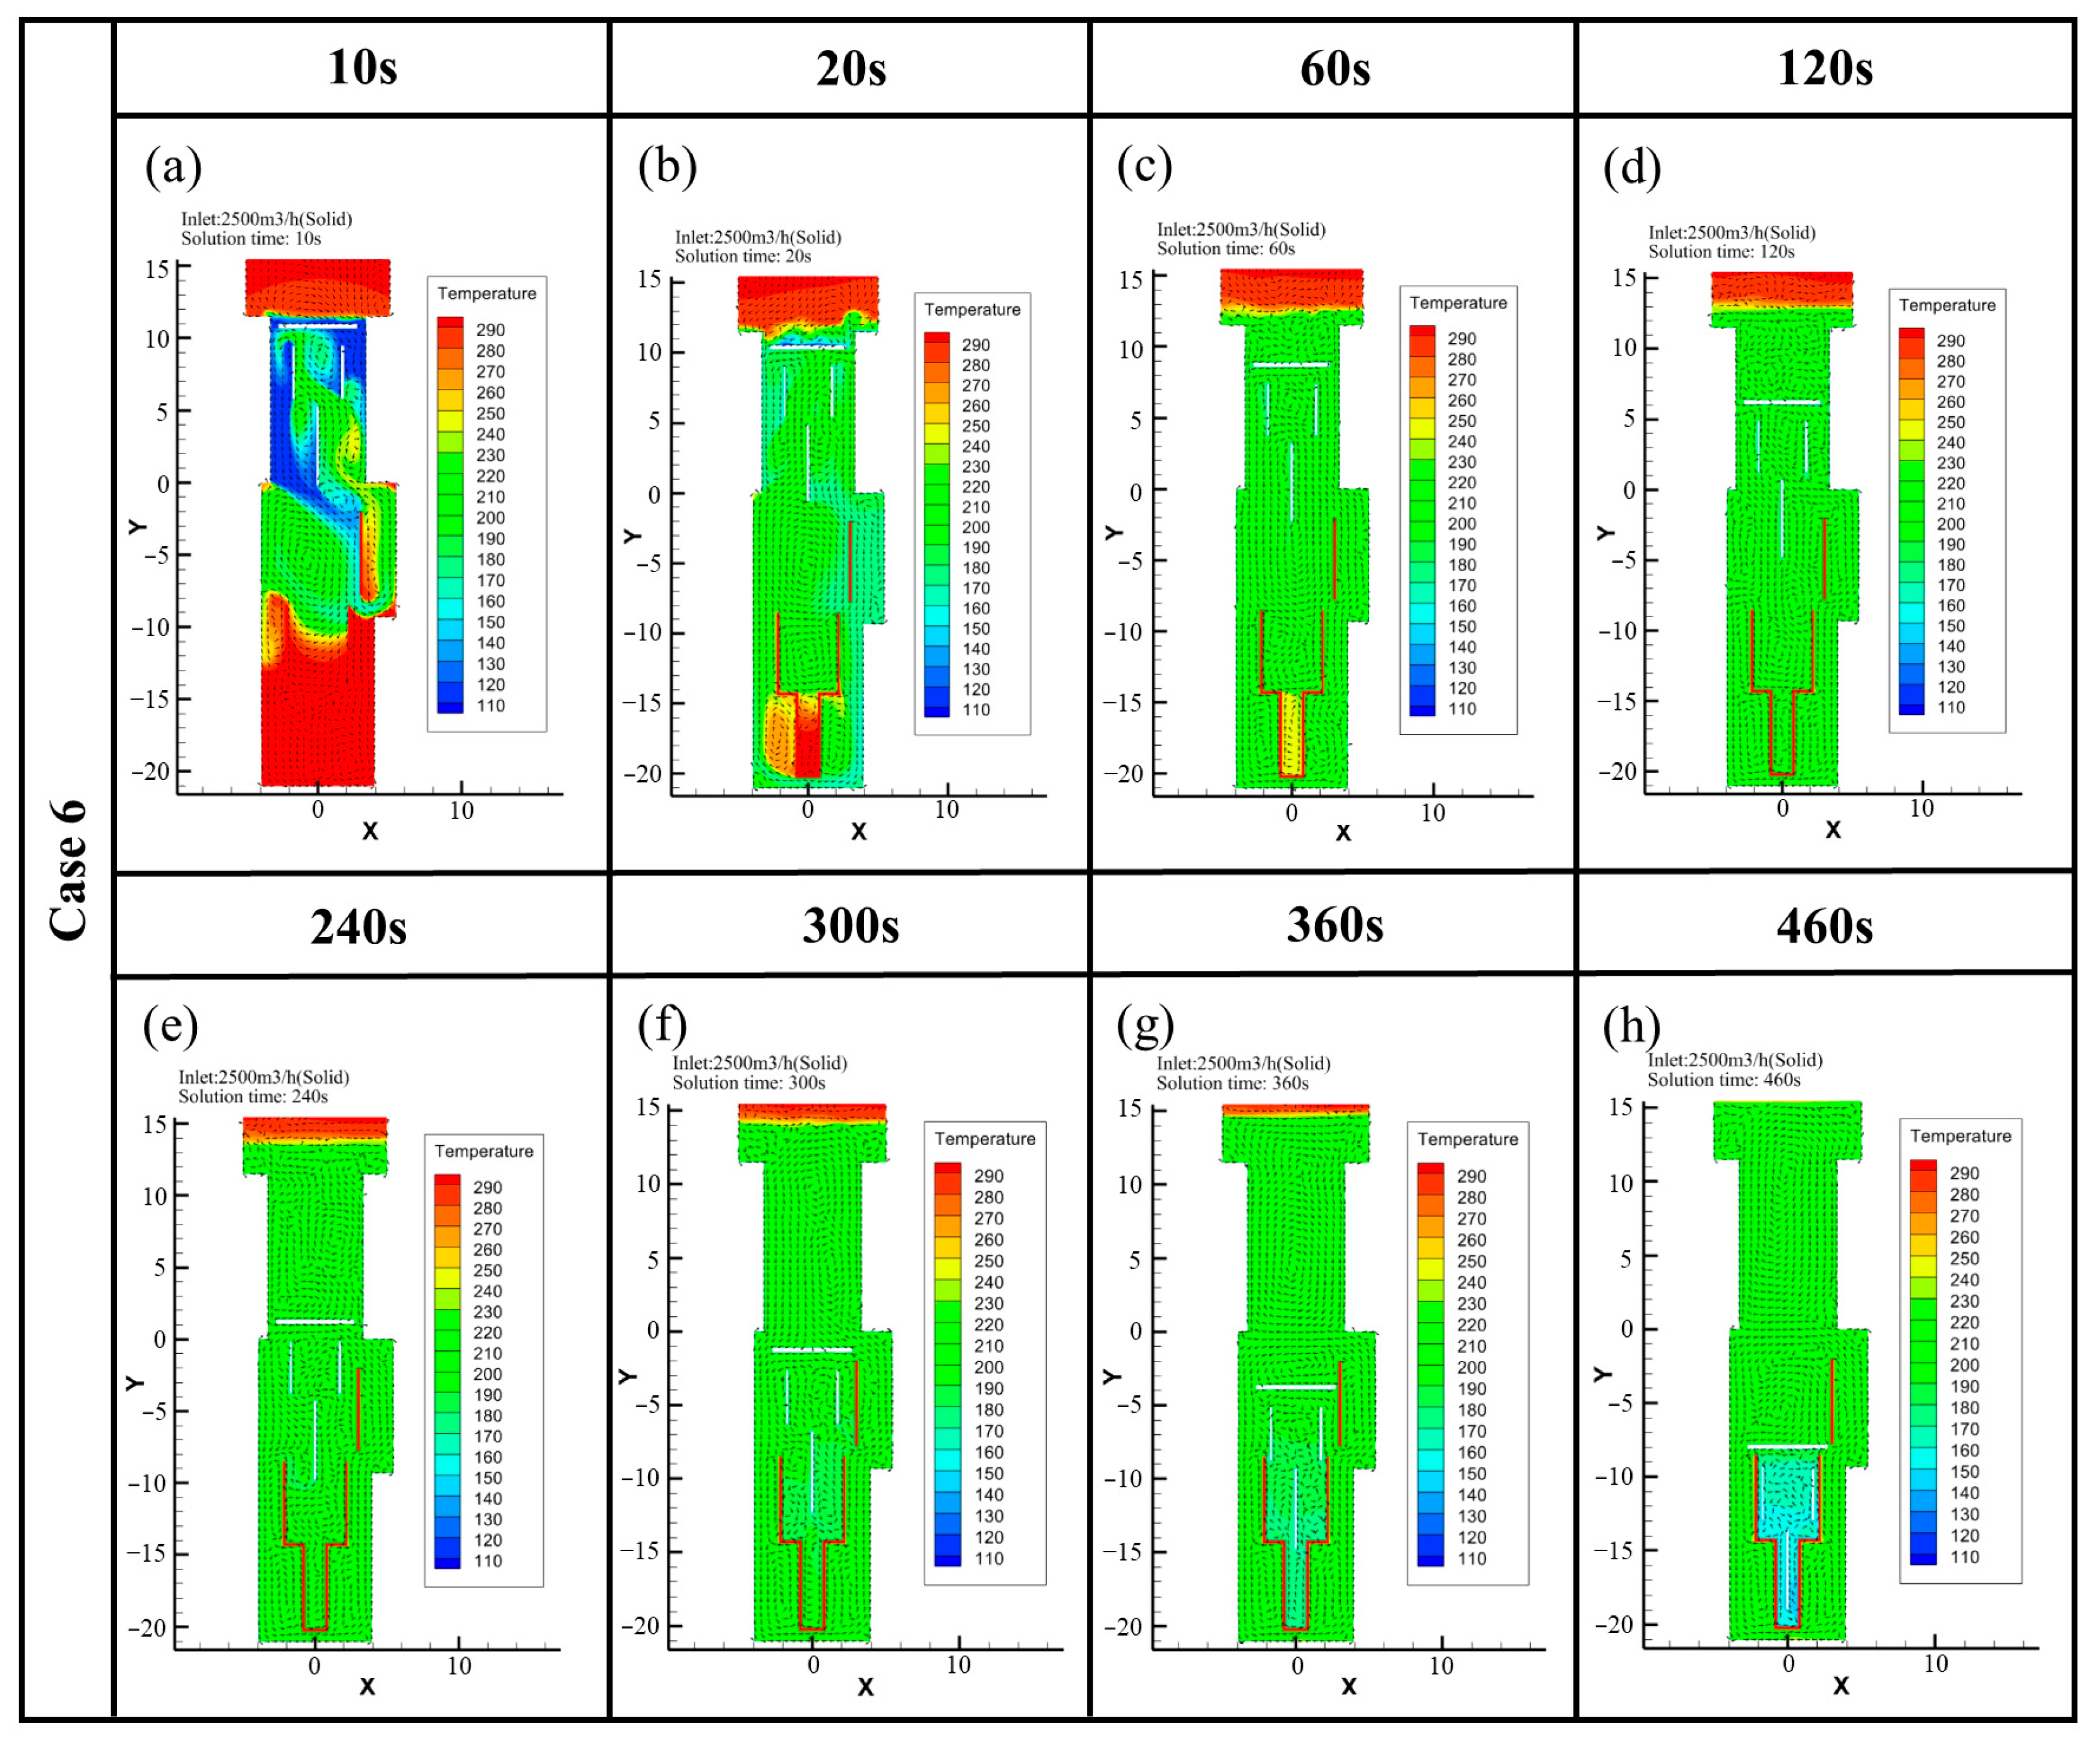
Case 6 considers the effects of extreme initial conditions and solid structure thermal storage: model carrier descent speed of 2.5 m/min, makeup air flow rate to the external structure of 2500 m3/h, initial temperature inside the carrier set to 110 K (extreme case), and the thermal storage capacity of the steel structure of the temperature-conditioning room and its cover is included in a fluid-solid coupled heat transfer calculation.
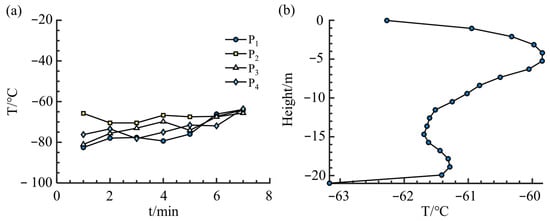
Figure 10 and Figure 11 show the temperature-time curves and temperature contours at various locations in the space. Over time, the temperature shows an overall upward trend. This indicates that using steel plates for thermal storage can raise the temperature inside the external structure to some extent.
Figure 10.
Temperatures at monitoring points during model carrier descent into the temperature-conditioning room (Case 6): (a) Temporal evolution of gas temperature adjacent to the steel cable; (b) Postdescent vertical distribution of gas temperature adjacent to the wall.
Figure 11.
Temperature contours of the model carrier descending into the temperature−conditioning room (Case 6) at 10 s, 20 s, 60 s, 120 s, 240 s, 300 s, 360 s, and 460 s (panels (a–h), respectively).
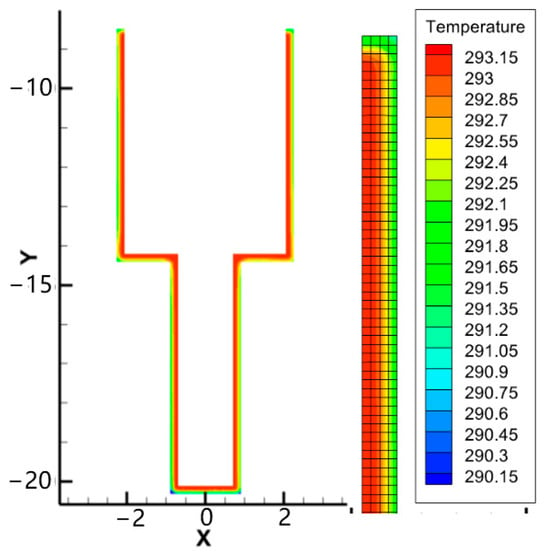
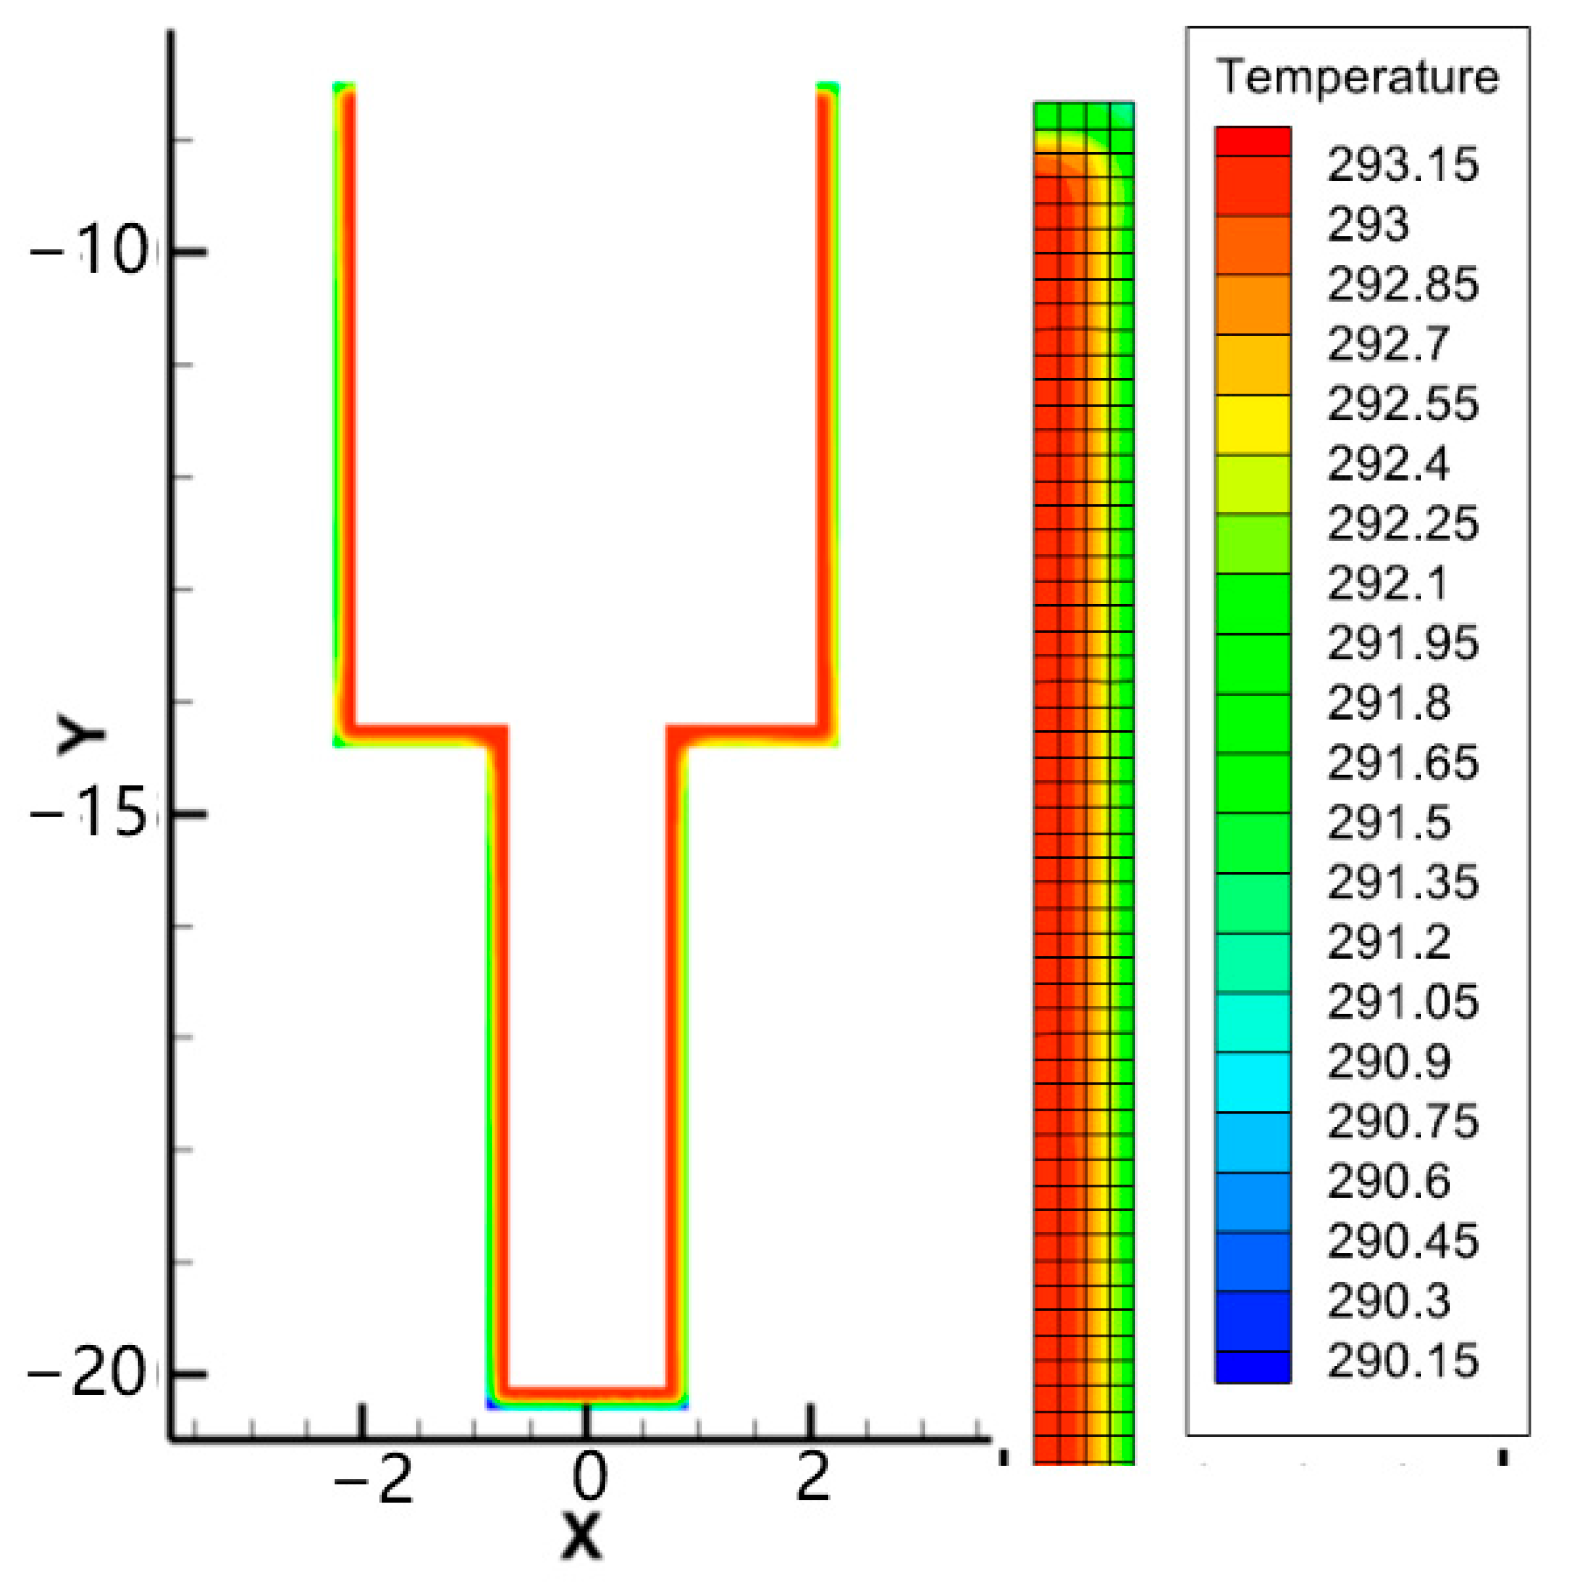
However, as shown by the internal temperature distribution of the steel plate in Figure 12, the rate of heat transfer from the interior of the steel plate to the outside is very limited.
Figure 12.
Internal temperature of the steel structure after the model carrier descends into the temperature-conditioning room.
4.2.2. Model Carrier Descent into the Test Section Plenum
(1) Cases 1–3 (Model Carrier Descent Speed of 1.2 m/min)
In Cases 1, 2, and 3, the model carrier descends at 1.2 m/min in all three cases. The makeup air flow rates are 0, 6000, and 10,000 m3/h, respectively. Figure 13 shows the corresponding temperature curves, from which the following observations can be made:
Figure 13.
Temperatures at monitoring points during model carrier descent into the test section plenum (Cases 1–3): (a) temperature near the plug-in unit at the plenum station; (b) temperature near the model carrier steel cable.
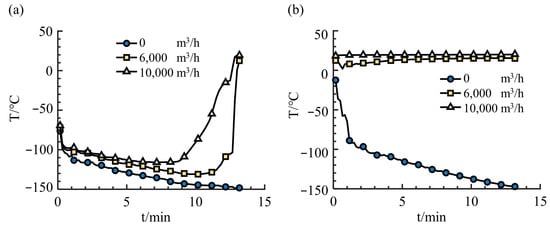
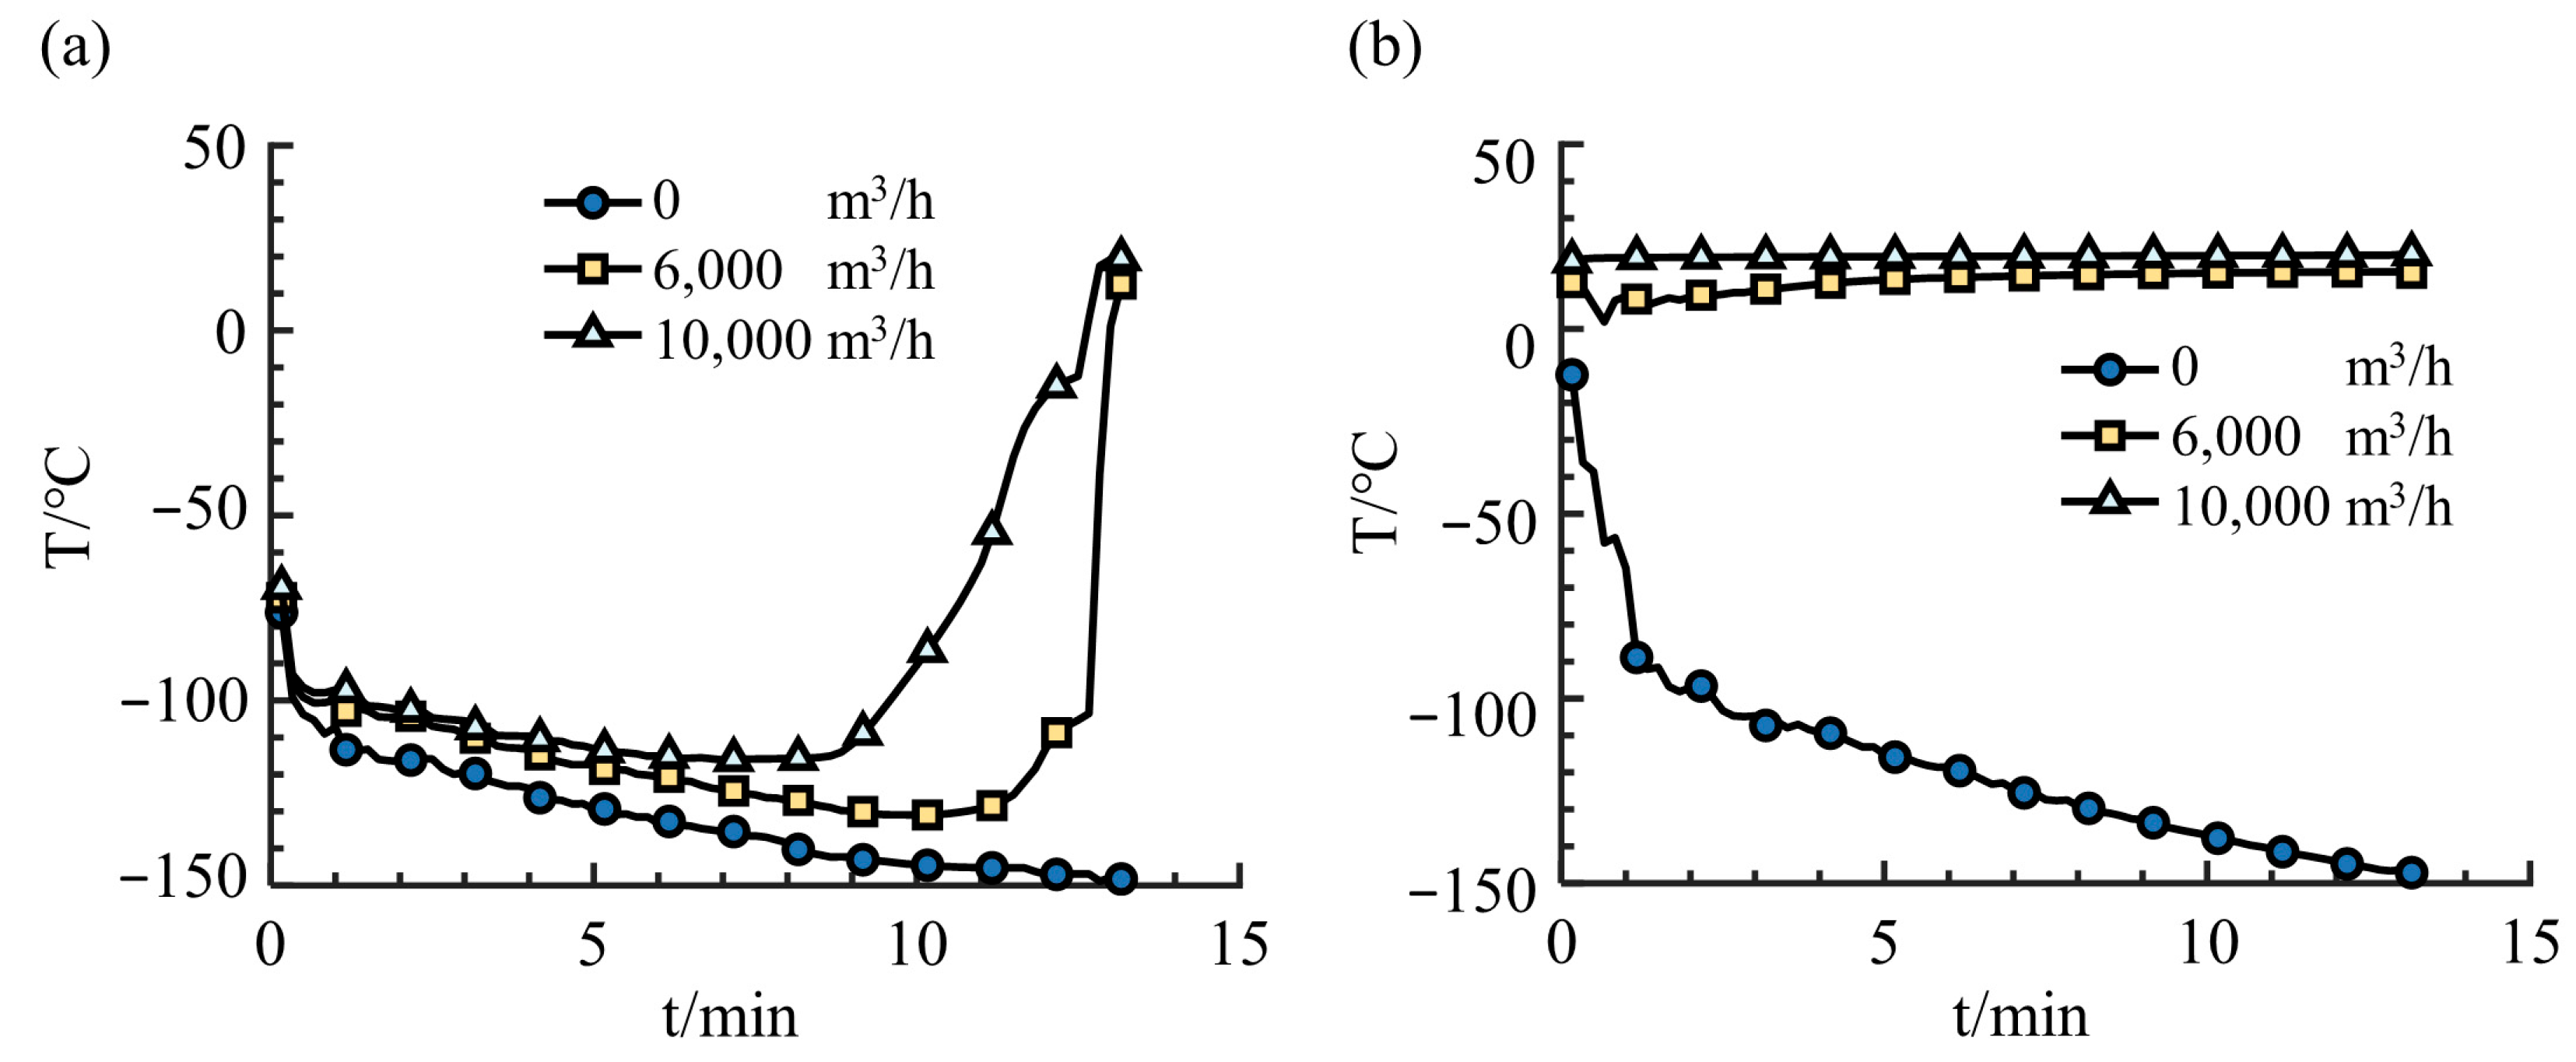
In Case 1 (no makeup air), the steel cable is quickly overtaken by the cold descending flow, dropping to about −100 °C in 2 min. This severely impairs the cable’s mechanical properties, underscoring the need for proper airflow organization.
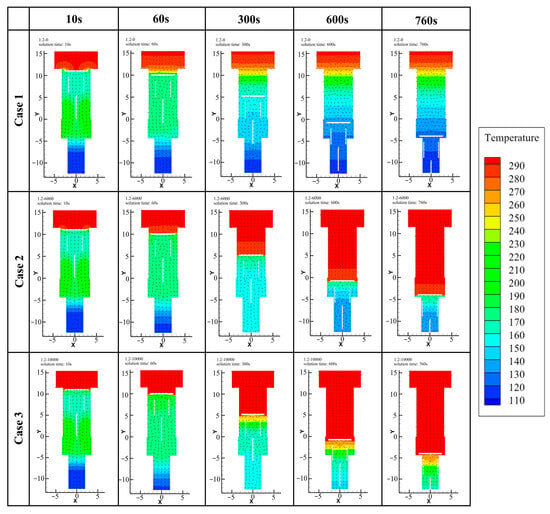
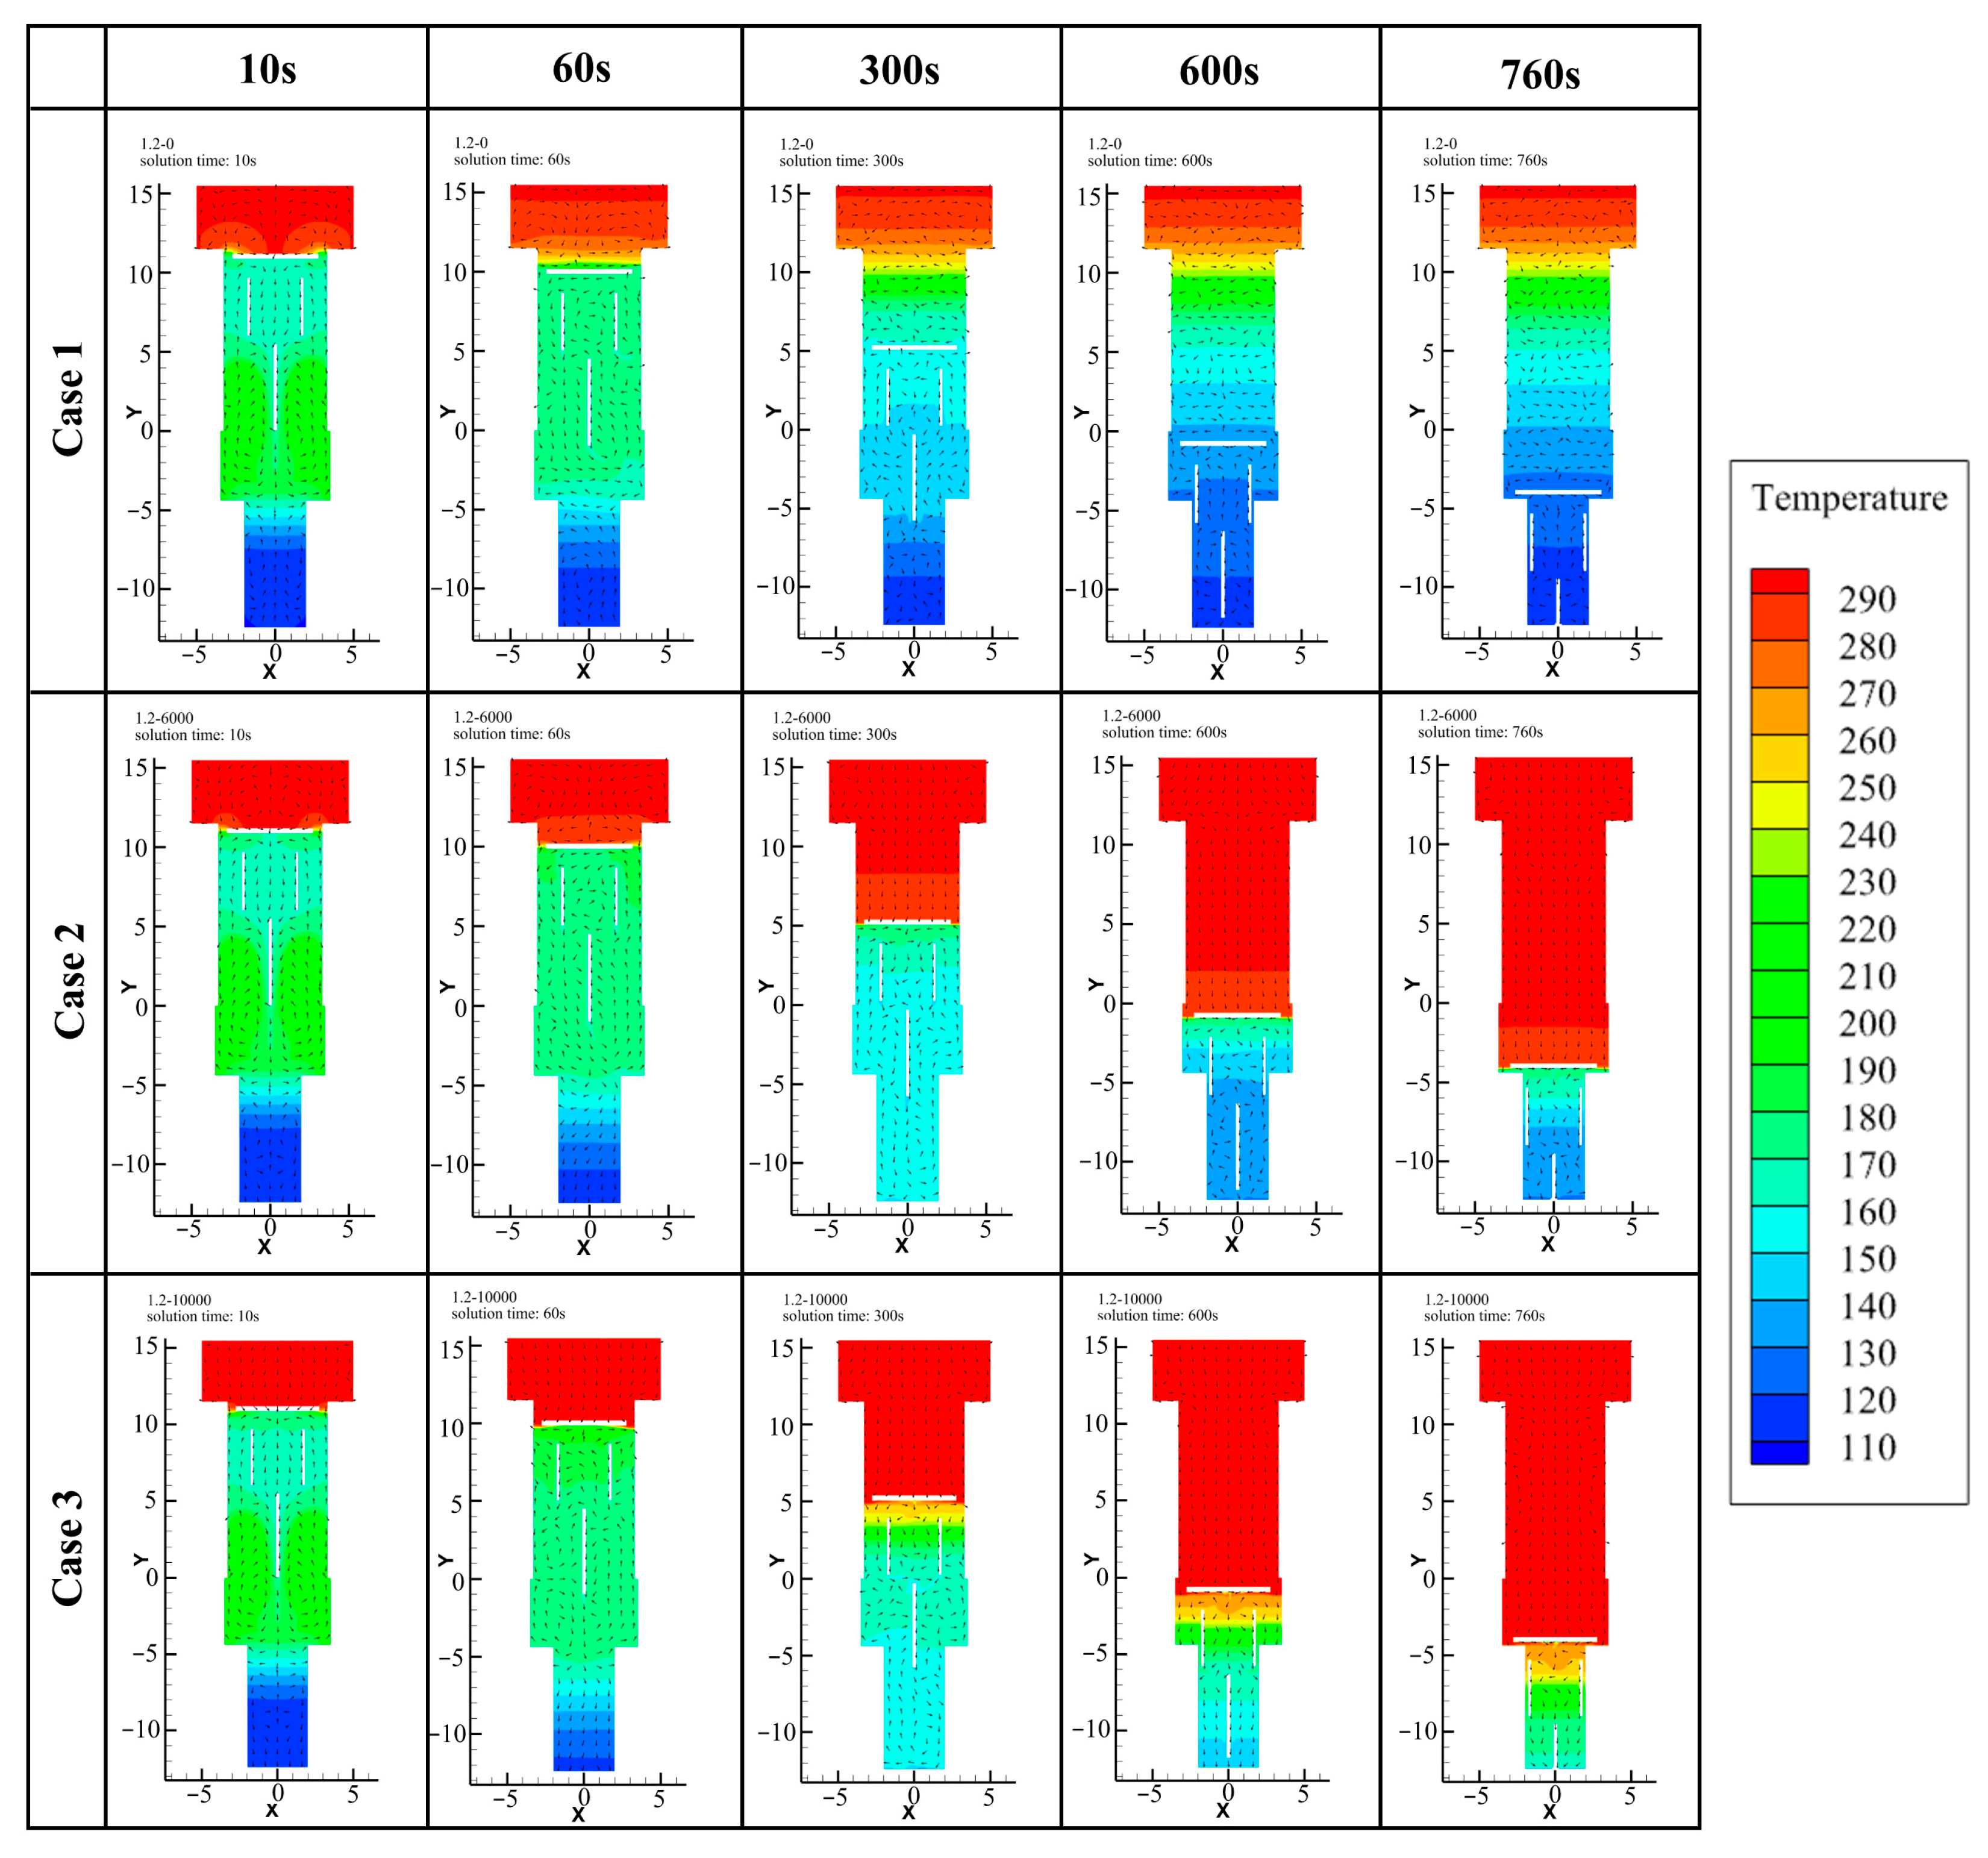
In Cases 2 and 3, after a brief fluctuation due to the non-uniform initial temperature distribution, the steel cable stays in warm air above 0 °C throughout the descent. Figure 14 shows that matching the airflow rate to the descent speed (6000 m3/h) makes the downward air velocity higher than the carrier speed, thereby keeping the area above the carrier cover in a safe temperature range at all times. The underlying mechanism is as follows. In a displacement ventilation system, the supplied air forms a moving front that displaces the existing air in the space. When the downward velocity of the supplied warm air exceeds the descent speed of the cold model, the warm air front reaches the carrier cover before the cold air layer can accumulate above it. The cold air generated by the model is continuously swept downward and removed through the bottom outlet, preventing the stratification interface from rising above the carrier cover. This is analogous to the operation of a thermal plume in conventional displacement ventilation, where the plume flow rate must balance the supply flow rate to maintain stable two-layer stratification [22]. Here, the plume is a negatively buoyant cold plume, and the matching condition requires the ventilation velocity to exceed the plume descent velocity.
Figure 14.
Temperature contours of the model carrier descending into the test section plenum (Cases 1–3).
In Case 1, once the model carrier has completed its descent, the plenum temperature is about −150 °C with pronounced thermal stratification. Without makeup air or proper airflow management, the plug-in unit would take a long time to warm back to a safe temperature. In Cases 2 and 3, however, the plug-in unit at the plenum bottom recovers to a safe temperature immediately after descent, and it experiences the cryogenic environment for only about 15 min.
(2) Cases 4–6 (model carrier descent speed of 2.5 m/min)
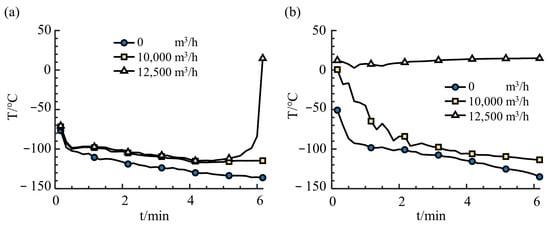
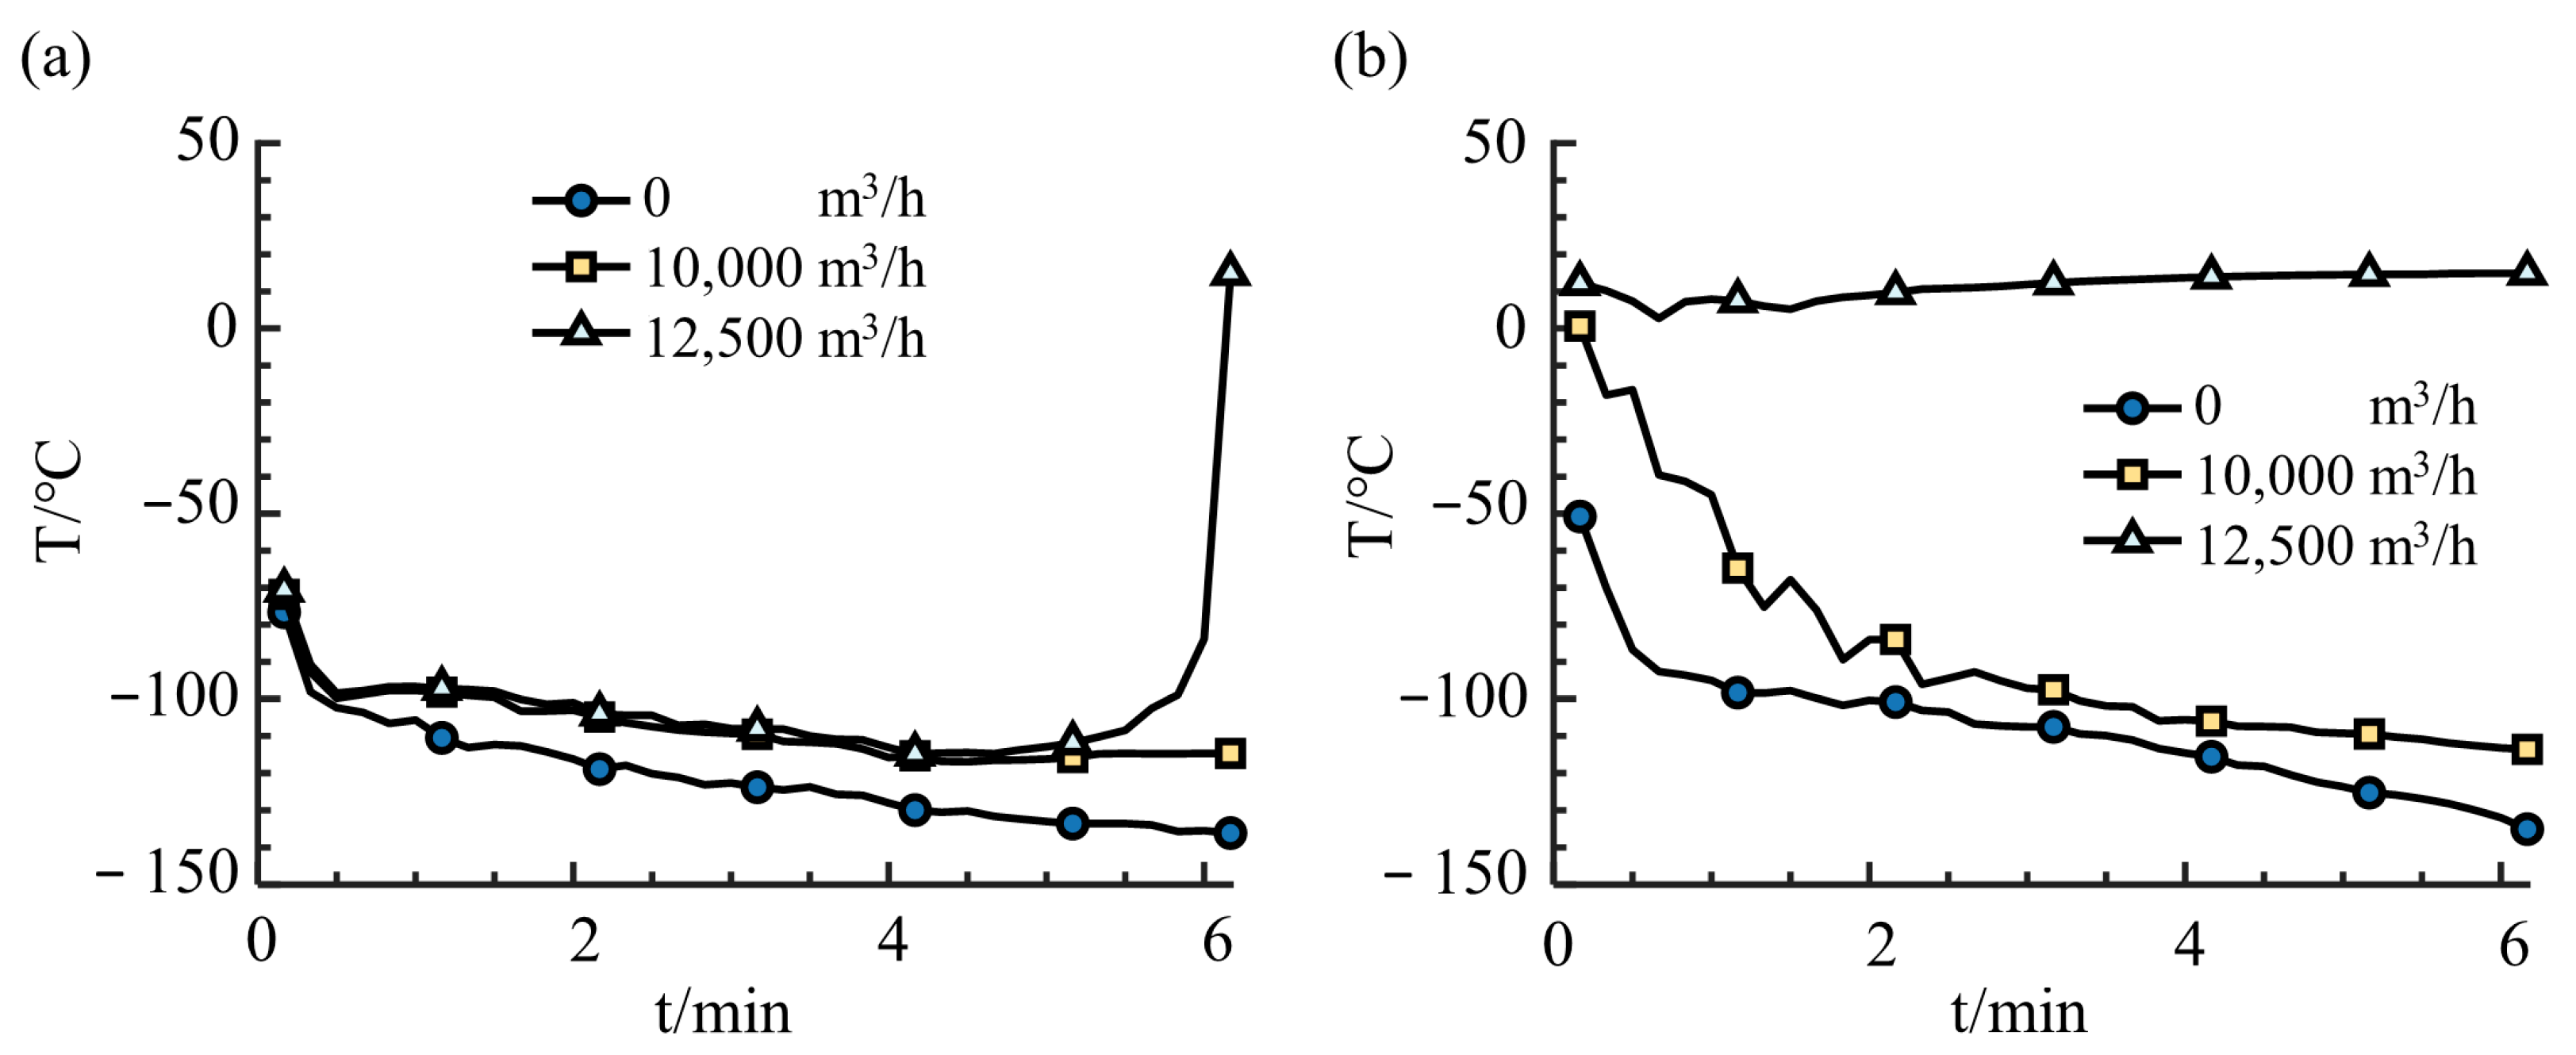
For a descent speed of 2.5 m/min, three makeup air flow rates are examined: 0 m3/h (Case 4), 10,000 m3/h (Case 5), and the matched rate of 12,500 m3/h (Case 6). Figure 15 presents the corresponding temperature histories.
Figure 15.
Temperatures at monitoring points during model carrier descent into the test section plenum (Cases 4–6): (a) temperature near the plug-in unit at the plenum station; (b) temperature near the model carrier steel cable.
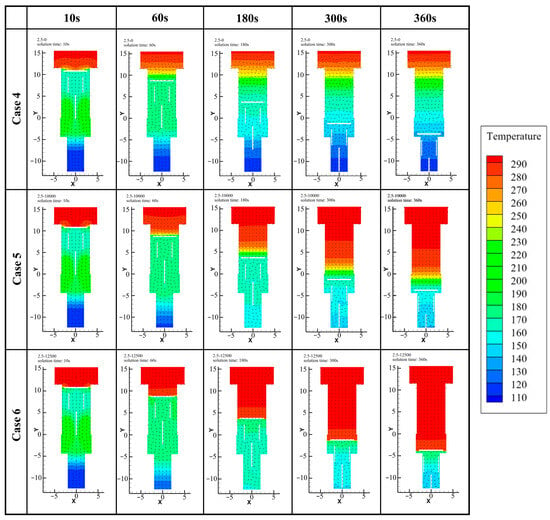
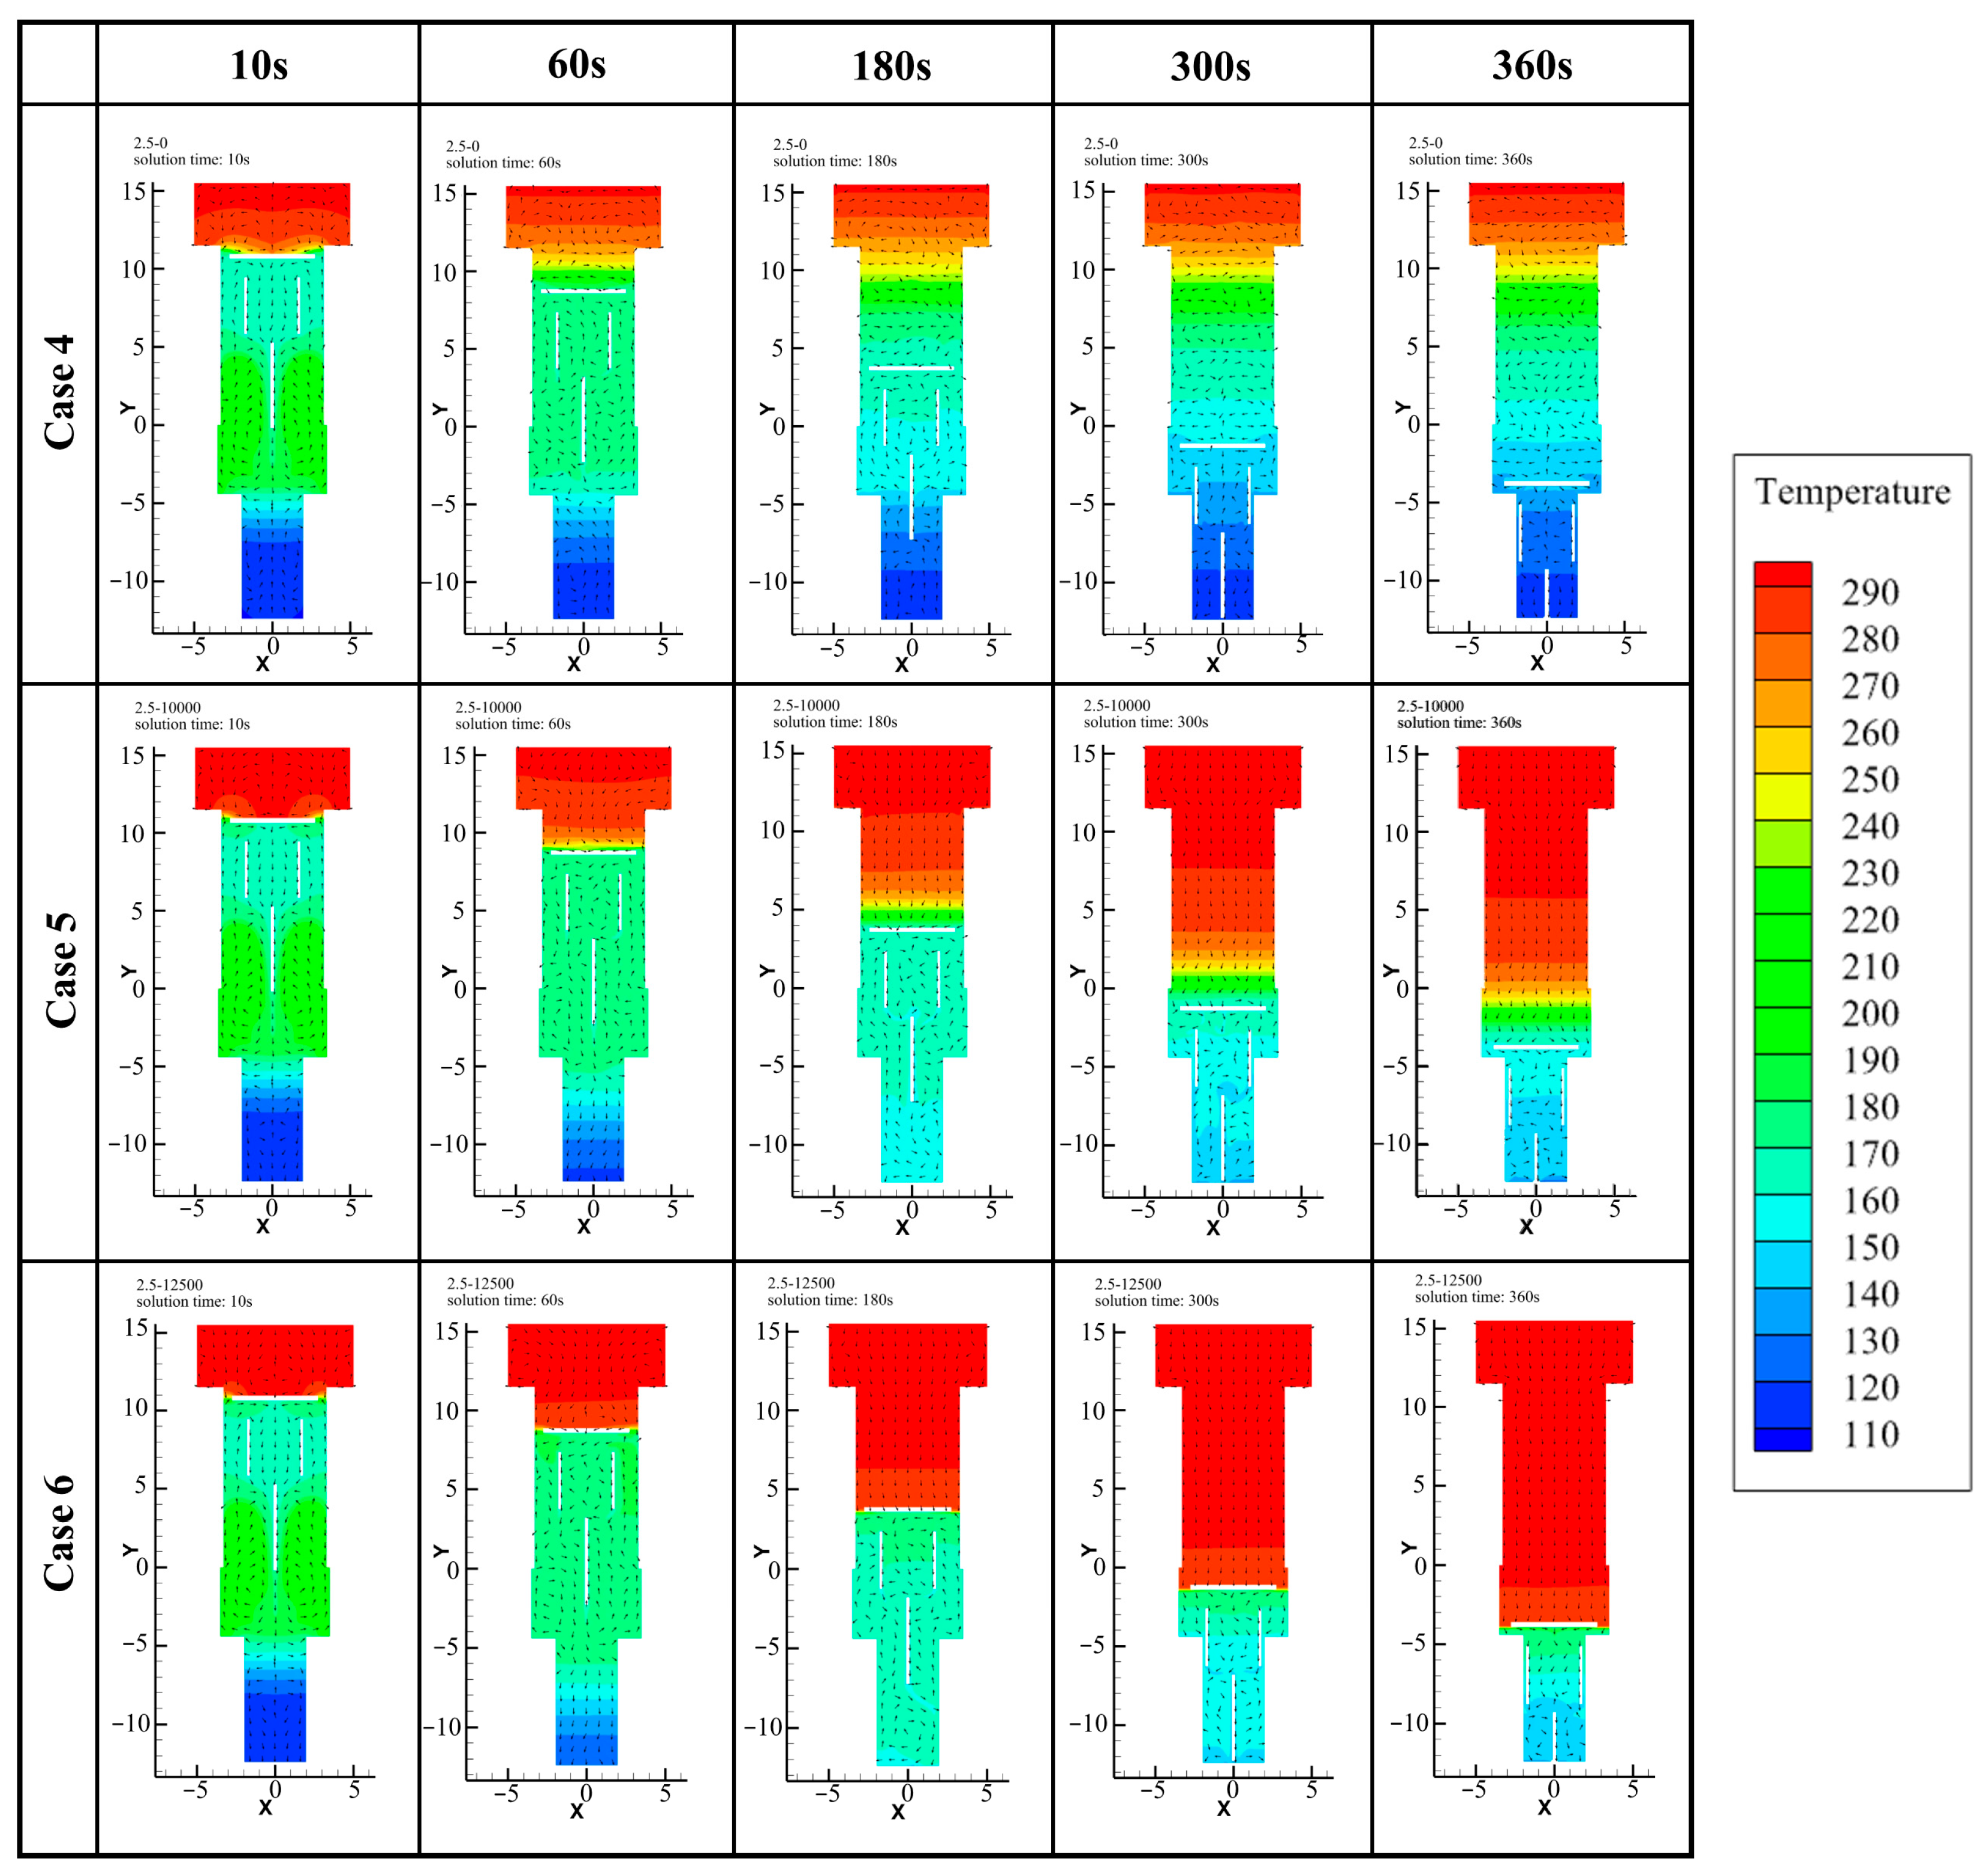
In Case 4, the steel cable remains continuously immersed in cold air, similar to Case 1. In Case 5, even the maximum design flow of 10,000 m3/h fails to prevent the cable temperature from dropping to about −100 °C, indicating that this flow rate cannot match the 2.5 m/min descent speed. In Case 6, the channel air velocity slightly exceeds the carrier descent speed, keeping the area above the model in a safe temperature range throughout, as observed in Case 2.
Thus, the airflow rate should be set so that the channel air velocity exceeds the carrier descent speed. When this matching condition cannot be met, reducing the descent speed offers a practical alternative. Figure 16 shows the temperature distributions for Cases 4–6, highlighting the differences among the three scenarios.
Figure 16.
Temperature contours of the model carrier descending into the test section plenum (Cases 4–6).
4.3. Heat Transfer Analysis of the Steel Cable
In the preceding simulations, the cable temperature was equated to the surrounding air temperature—a conservative approach. In reality, the cable has considerable heat capacity, so its temperature drop is slower. In this section, the surface heat transfer coefficient is estimated from the air velocity and temperature near the cable, and the transient temperature variation inside the cable is then solved.
4.3.1. Airflow Velocity Across the Steel Cable
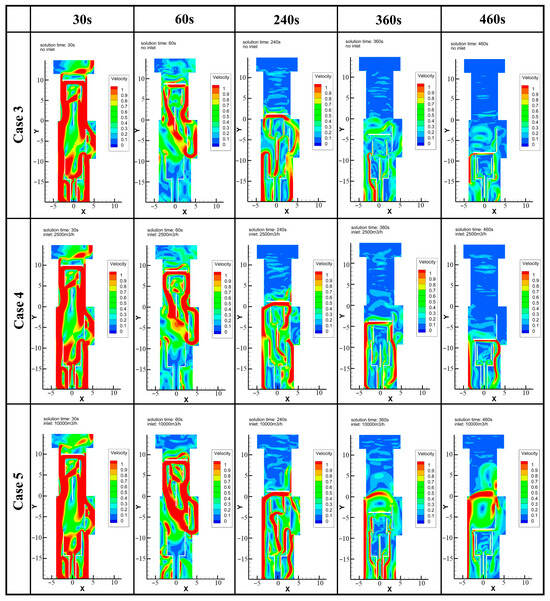
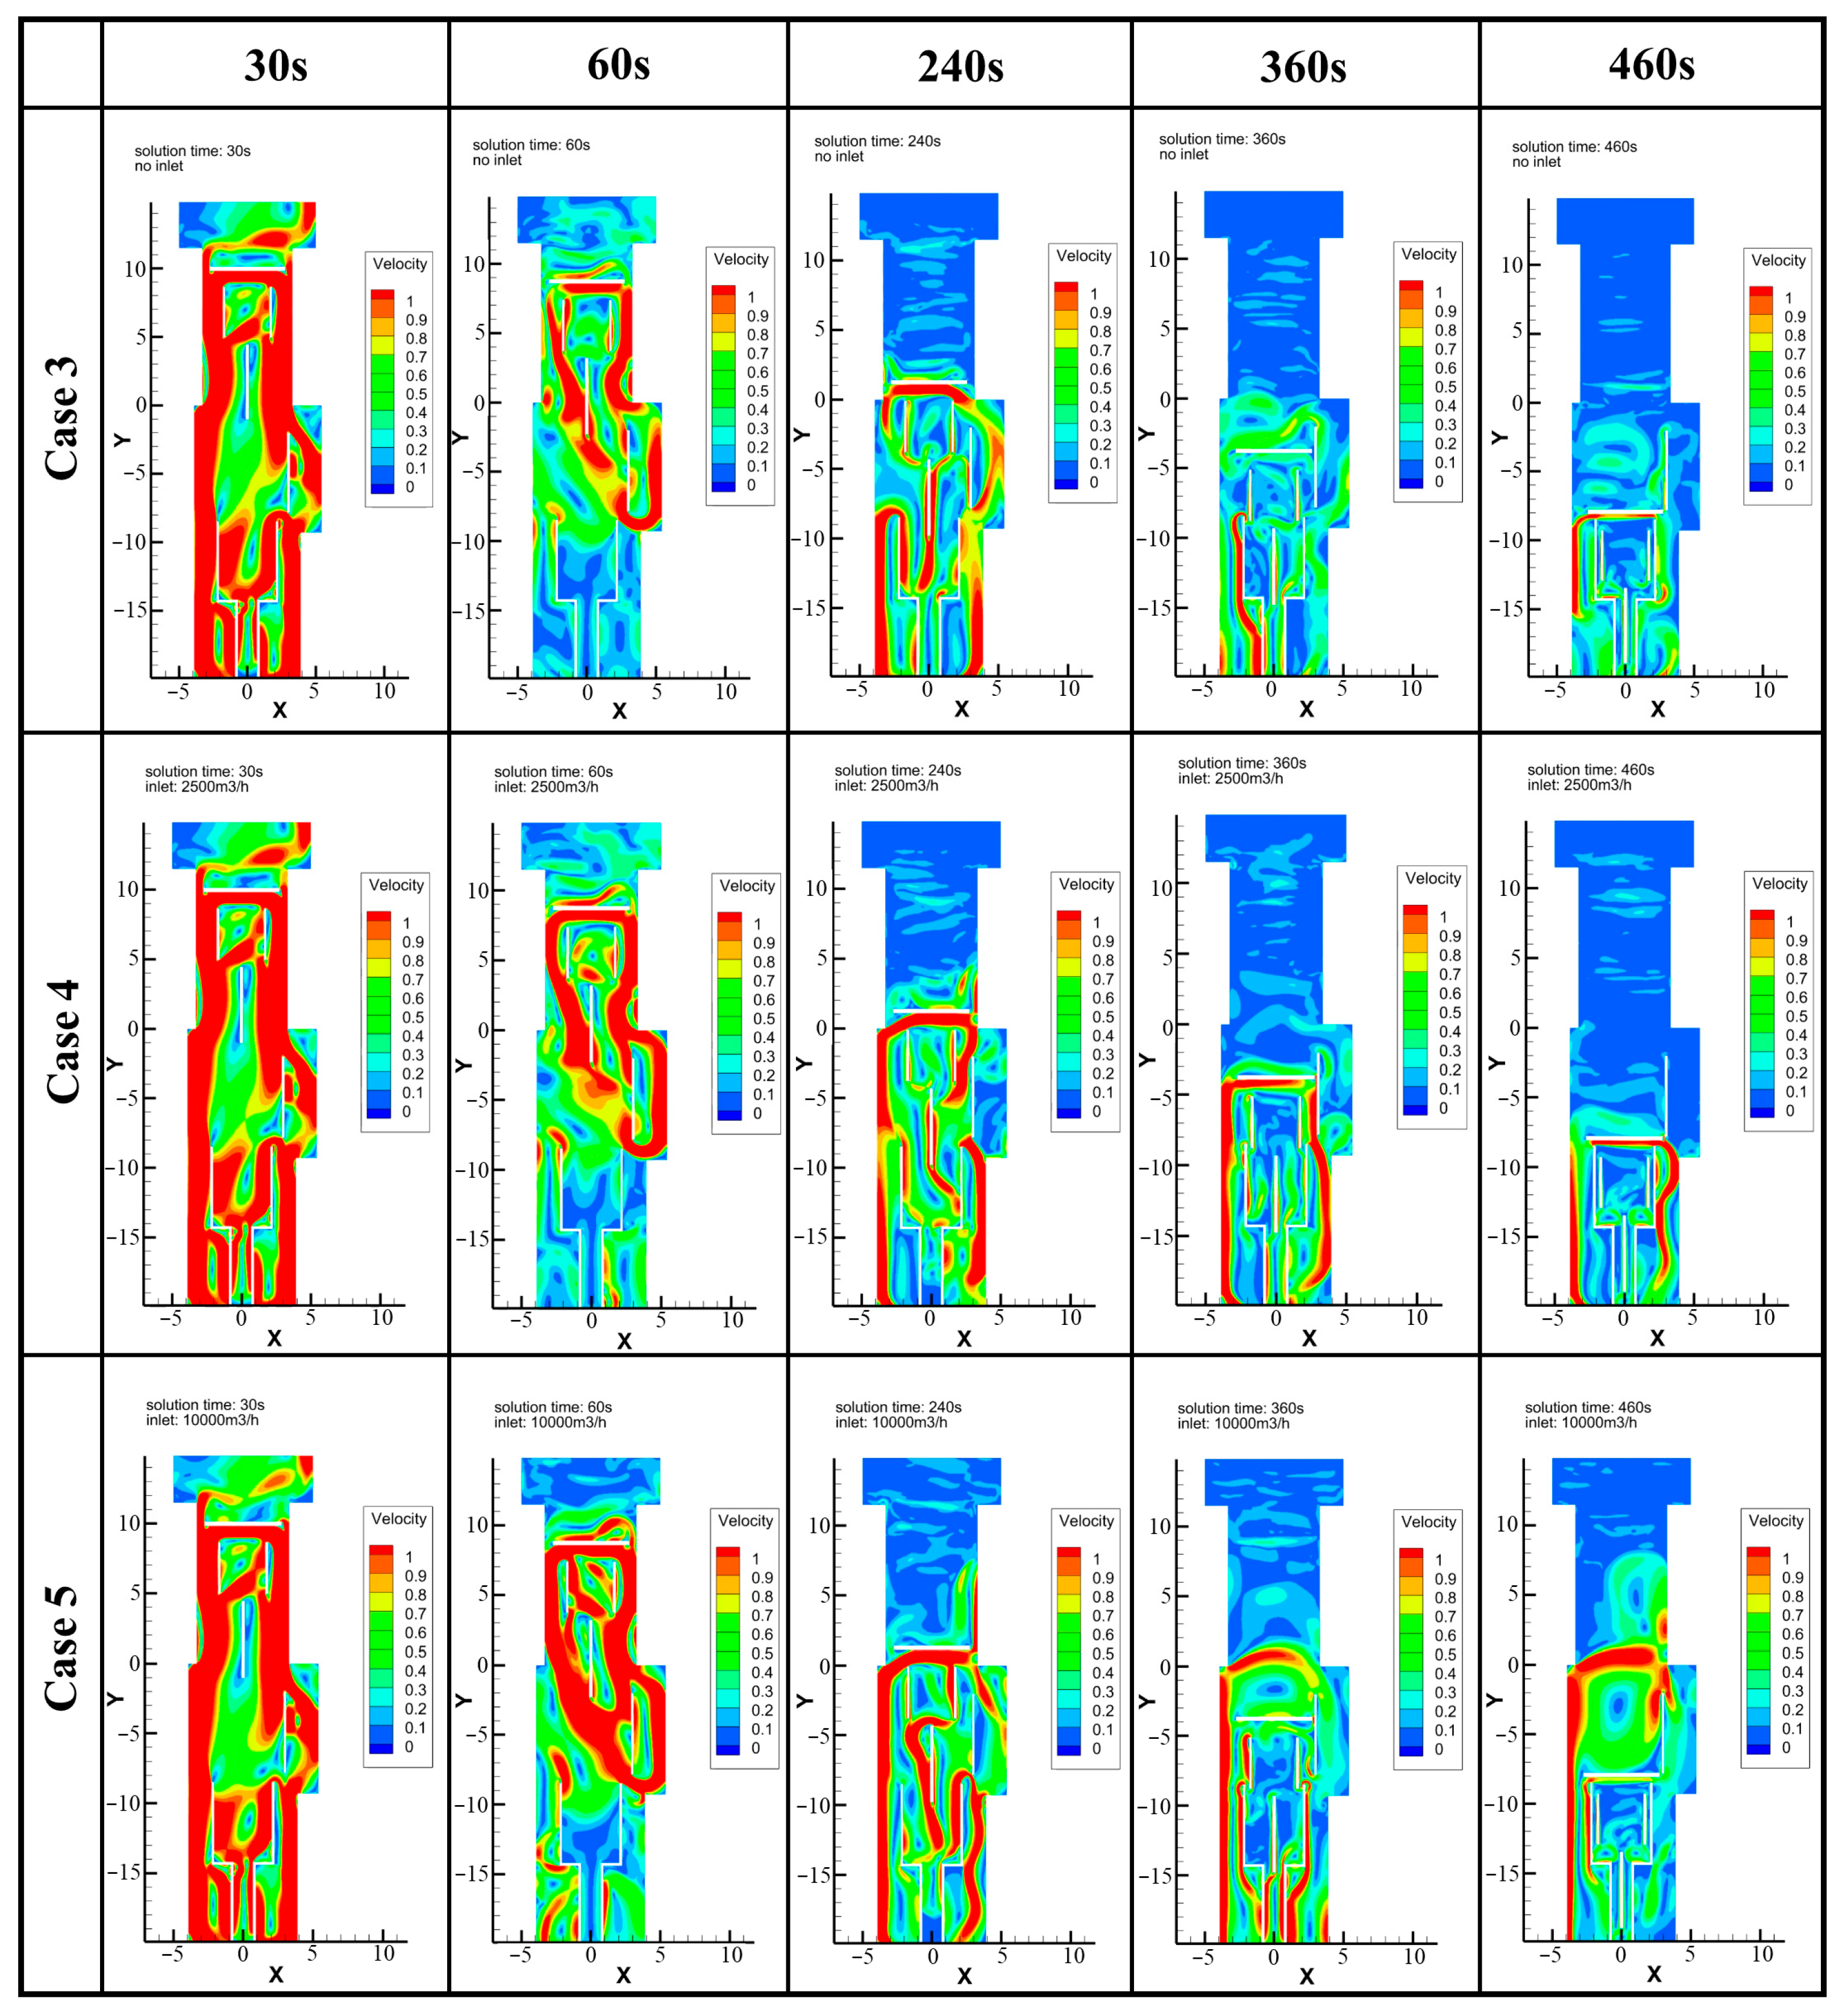
For the model carrier descent into the plenum, the steel cable can remain in ambient-temperature air throughout. However, during descent into the temperature-conditioning room, the cable inevitably comes into contact with cold air, so the analysis focuses on the latter process. The flow field near the steel cable during descent is obtained from the preceding simulations (Figure 17). The airflow velocity near the steel cable generally does not exceed 1 m/s. This relatively low velocity is a consequence of the buoyancy-driven nature of the flow: the cold air descends primarily under gravitational forces rather than being driven by high-momentum jets. The region near the model carrier cover, where the velocity is higher and the temperature lower, is the key area requiring protection.
Figure 17.
Velocity field during model carrier descent into the temperature-conditioning room (Cases 3–5).
4.3.2. Heat Transfer Coefficient and Cable Temperature Drop
From the flow field (Figure 17), the cross-flow velocity over the steel cable does not exceed 1 m/s. Using the Churchill correlation for cross-flow over a cylinder, the surface heat transfer coefficient is estimated as h ≈ 20 W/(m2·K) [31,32,33]. With Bi = 0.01, the lumped capacitance method applies. The validity of this approach is confirmed by the analytical and finite element solutions presented in the Supplementary Materials (Section S5.3), which yield nearly identical temperature predictions and show that the temperature gradient within the cable is negligible.
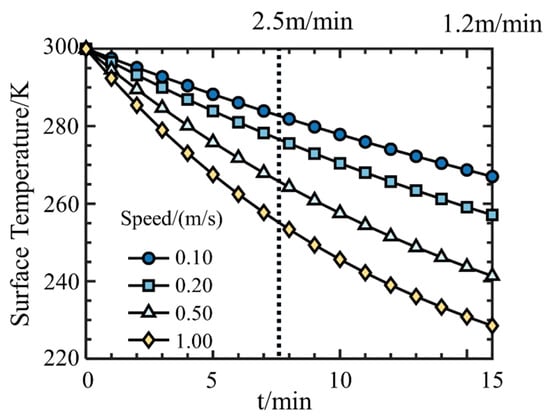
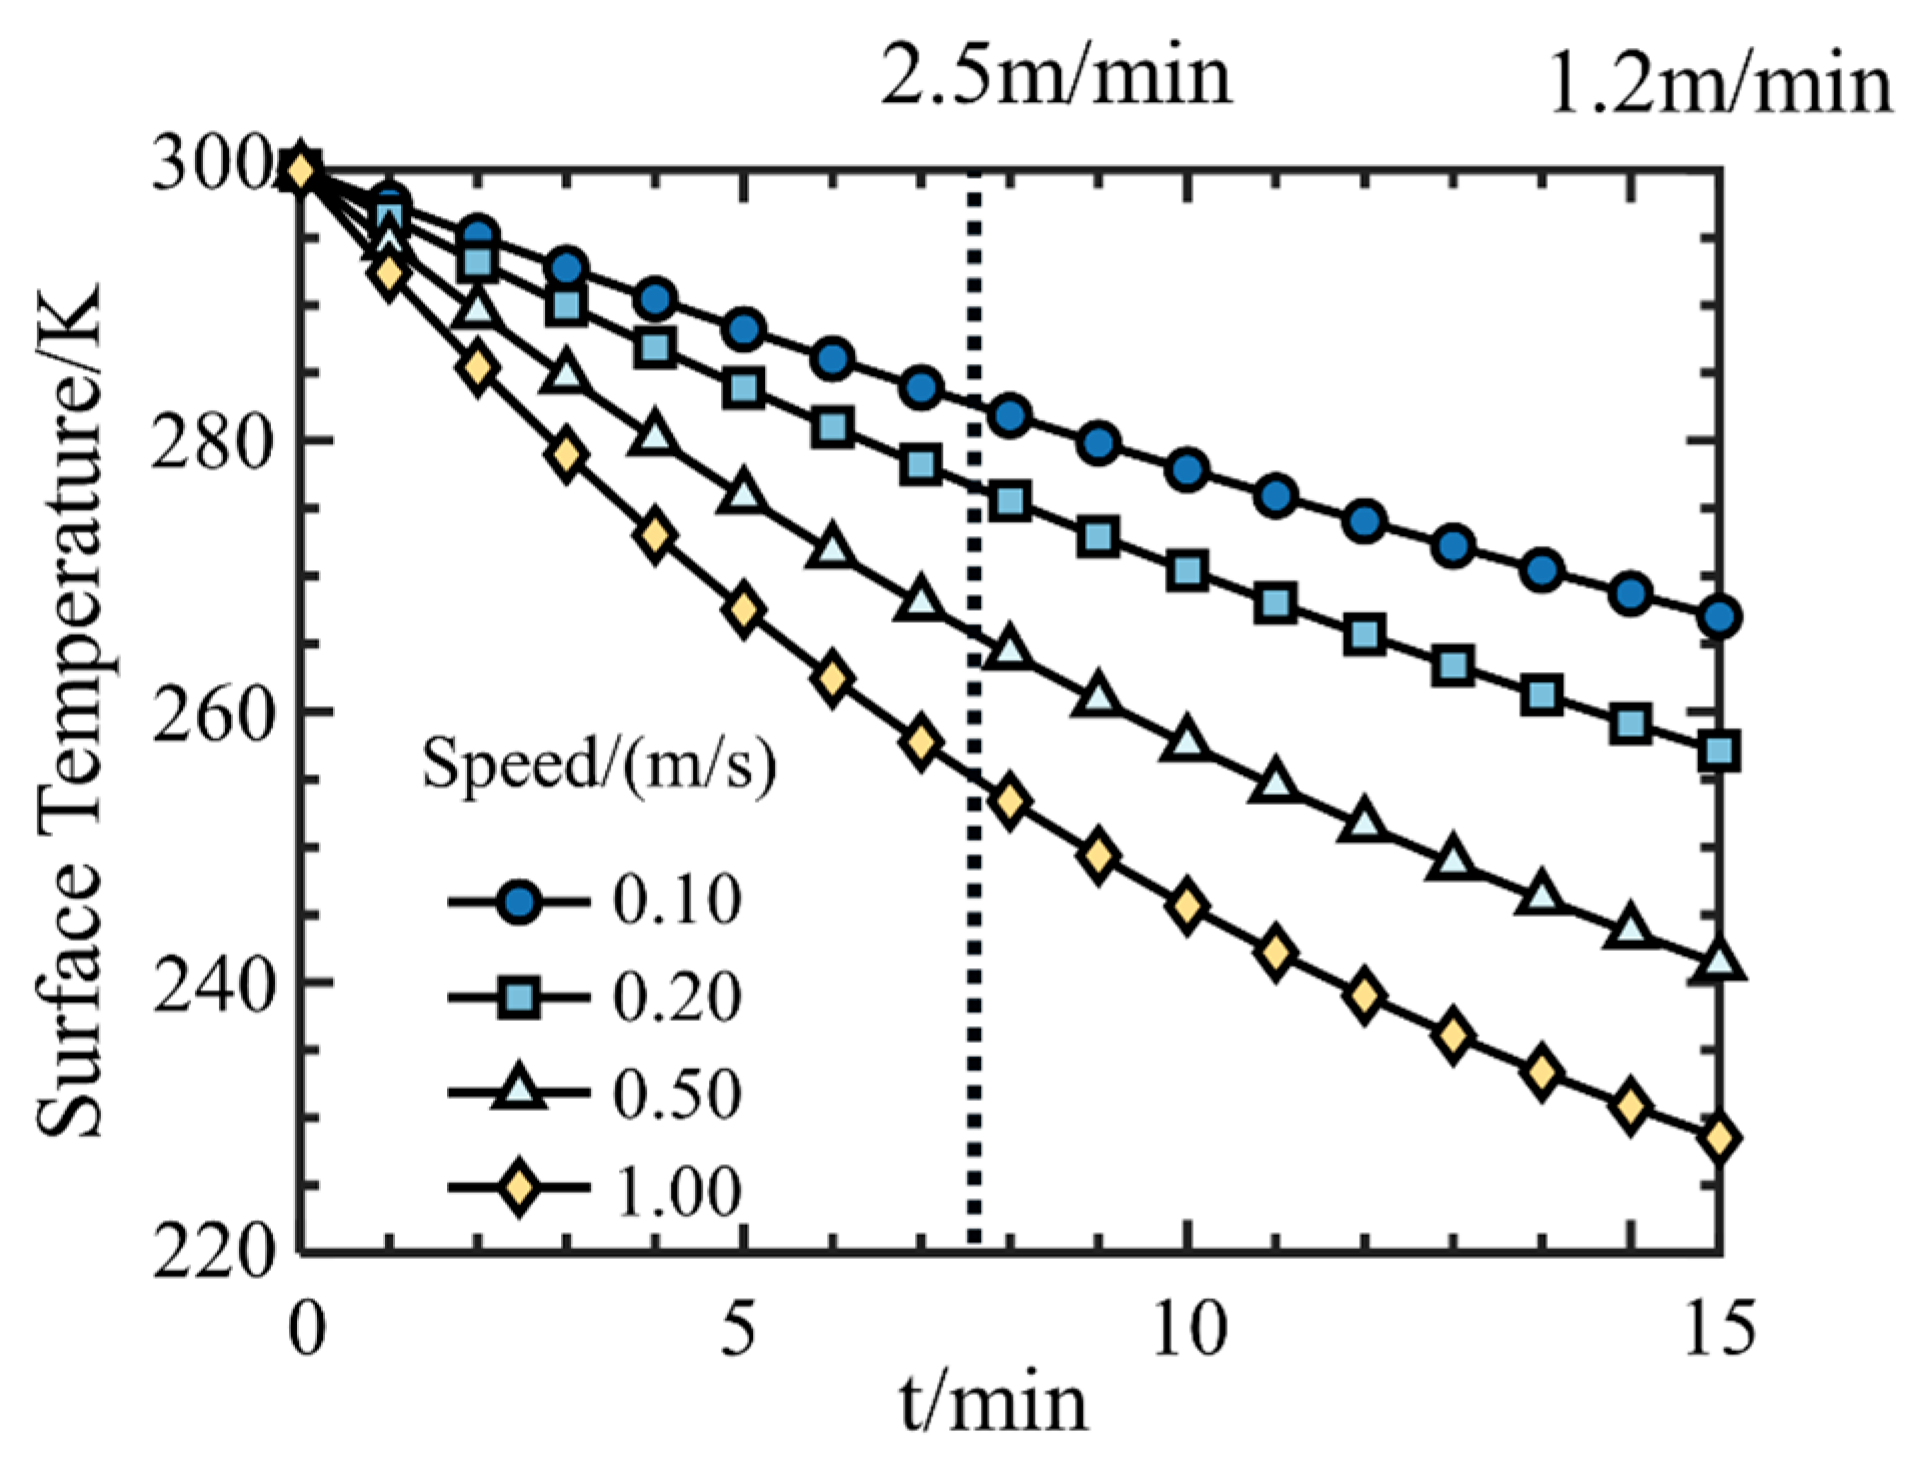
For a steel cable (d = 20 mm, ρ = 7800 kg/m3, cp = 460 J/(kg·K)) exposed to 200 K air, solving the transient heat conduction gives the temperature evolution shown in Figure 18. The minimum surface temperature during the fast descent (2.5 m/min, ~7.7 min) is approximately −20 °C—much higher than the −100 °C obtained by directly equating cable temperature to the surrounding gas. Considering recovery after descent, the internal cable temperature will not fall below −40 °C. Therefore, the buffering effect of the cable’s own heat capacity should be taken into account in engineering assessments.
Figure 18.
Temperature drop curves of the steel cable at different external flow velocities.
5. Conclusions
This study numerically investigated the transient thermal shock effects on the dry air system during cryogenic model carrier transfer and descent. A 1:1 CFD model was established based on an actual engineering system, covering three scenarios: static suspension in the dry hall, descent into the temperature-conditioning room, and descent into the test section plenum. Complementary heat transfer analysis of the steel cable was also conducted. The main findings are as follows:
(1) Under static suspension, the average temperature inside the model carrier drops to about 192 K after 10 min, with a minimum of approximately 170 K. This provides a conservative extreme initial temperature setting for dynamic descent simulations.
(2) When descending into the temperature-conditioning room, descent speed has a decisive influence. Increasing the speed from 1.2 m/min to 2.5 m/min raises the space temperature by about 25 °C for the same makeup air flow. A small makeup flow (2500 m3/h) is insufficient to protect the steel cable. With 2.5 m/min and 10,000 m3/h, the cable-adjacent gas stays above −60 °C [29,30], meeting safety requirements. Solid thermal storage (Case 6) offers limited mitigation unless enhanced with fins.
(3) When descending into the test section plenum, displacement ventilation matched to the descent speed is highly effective. At 1.2 m/min with 6000 m3/h, or at 2.5 m/min with 12,500 m3/h, the air velocity in the channel slightly exceeds the carrier descent speed, keeping the region above the carrier above 0 °C. Both the steel cable and the plug-in unit remain safe. Insufficient makeup air (e.g., 10,000 m3/h at 2.5 m/min) allows the cable to drop to about −100 °C, posing a risk.
(4) The steel cable heat transfer analysis shows that equating cable temperature to ambient air is overly conservative. Under typical conditions (cross-flow velocity ≤ 1 m/s, ambient ~200 K), the cable surface temperature during fast descent is no lower than −20 °C—much higher than the −100 °C obtained from gas-temperature equivalence. The buffering effect of cable heat capacity should therefore be fully considered in engineering assessments.
The thermal shock phenomenon investigated in this study is governed by the interplay between buoyancy-driven cold plumes from the cryogenic model surface and the displacement ventilation flow supplied from the dry hall. The stable reverse stratification—cold air accumulating at lower levels—poses the primary threat to critical components located above the carrier. Effective protection requires the ventilation velocity to exceed the carrier descent speed, ensuring that the warm air front reaches the carrier cover before the cold layer can rise to that level. Based on these findings, a descent speed of 2.5 m/min with makeup air ≥ 10,000 m3/h is recommended for the investigated facility, with priority given to descent-matched displacement ventilation. It should be noted that the velocity ratio Vair/Vcarrier > 1 discussed above is a facility-specific indicator. In the present system, effective protection was achieved at a ratio of approximately 16 for both descent speeds, as derived from the actual airflow cross-sectional area and the required ventilation rates. However, this value is likely influenced by multiple factors including carrier geometry, buoyancy strength of the cold plume, and ventilation configuration. Deriving a generally applicable criterion would require broader parametric studies and experimental validation, which we identify as a priority for future research. Nevertheless, the design principle that the ventilation velocity must overcome the plume descent velocity, rather than merely matching the carrier’s geometric speed, is expected to be transferable to similar cryogenic transfer systems.
Supplementary Materials
The following supporting information can be downloaded at: https://www.mdpi.com/article/10.3390/machines14080859/s1, Figure S1: Comparison of heat transfer coefficients calculated by two heat transfer correlations; Figure S2: Time history of the internal temperature field of the steel cable; Table S1: Physical properties of the steel cable; Supplementary Materials (including datasets and additional figures) are provided as separate files with this manuscript.
Author Contributions
Conceptualization, L.F. and X.H.; Data curation, Y.H., F.Z., M.L. and J.H.; Funding acquisition, X.H. and L.F.; Investigation, Y.H., F.Z., B.W., L.F. and J.H.; Methodology, Y.H., L.F. and M.L.; Project administration, L.F. and X.H.; Resources, Y.H., L.F. and J.H.; Supervision, L.F. and X.H.; Validation, Y.H. and F.Z.; Visualization, Y.H., F.Z. and M.L.; Writing—original draft, Y.H., F.Z., L.F. and J.H.; Writing—review and editing, Y.H., F.Z., B.W., L.F. and X.H. All authors have read and agreed to the published version of the manuscript.
Funding
The APC was funded by the China Aerodynamics Research and Development Center.
Data Availability Statement
The original contributions presented in this study are included in the article. Further inquiries can be directed to the corresponding author.
Conflicts of Interest
The authors declare no conflicts of interest.
References
- Chen, J.; Liu, B.; Chen, W.; Liao, D.; Lai, H. Key technology for model access system in cryogenic wind tunnel. J. Exp. Fluid Mech. 2022, 36, 37–43. [Google Scholar] [CrossRef]
- Green, J.; Quest, J. A short history of the European Transonic Wind Tunnel ETW. Prog. Aerosp. Sci. 2011, 47, 319–368. [Google Scholar] [CrossRef] [Scilit]
- Fehrs, M.; Helm, S. Transonic High Reynolds Number Transition Model Validation Based on ETW Cryogenic Wind Tunnel Data. In Proceedings of the AIAA Scitech 2025 Forum; AIAA: Reston, VA, USA, 2025. [Google Scholar]
- Hou, J.X.; Xie, J.L.; Pan, X.; Chen, J.Y. Numerical investigation of the operating conditions affecting nitrogen condensation on a three-dimensional wing in the cryogenic wind tunnel. Eng. Appl. Comput. Fluid Mech. 2024, 18, 2387055. [Google Scholar] [CrossRef] [Scilit]
- Hou, J.X.; Xiao, X.; Xie, J.L.; Chen, J.Y. Numerical investigation of nitrogen spontaneous condensation over airfoils in cryogenic wind tunnel. Case Stud. Therm. Eng. 2024, 59, 104524. [Google Scholar] [CrossRef] [Scilit]
- Gao, Y.; Lai, T.; Yang, S.; Yan, S.; Liu, M.; Hou, Y. Experimental study of frosting characteristics of trace water vapor under cryogenic wind tunnel conditions. Appl. Therm. Eng. 2024, 241, 122354. [Google Scholar] [CrossRef] [Scilit]
- Wang, J.; Wang, J.; Xie, L.Z.; Peng, F.S.; Shi, L.Y. Analysis of frost layer growth behavior on cryogenic surfaces in ultralow dew point environments by experimental tests and numerical simulations. Int. Commun. Heat Mass Transf. 2024, 154, 107415. [Google Scholar] [CrossRef] [Scilit]
- Price, I.; Schimanski, D. Development of testing techniques and cryogenic model handling at ETW. In Proceedings of the Advanced Measurement and Ground Testing Conference, New Orleans, LA, USA, 17–20 June 1996; p. 2256. [Google Scholar]
- Goodyer, M.J. The cryogenic wind tunnel. Prog. Aerosp. Sci. 1992, 29, 193–220. [Google Scholar] [CrossRef] [Scilit]
- Peng, Y.; Wang, G.; Zhu, Z.; Chang, X.; Lu, H.; Tang, W.; Jiang, F.; Chen, G. Effect of low temperature on tribological characteristics and wear mechanism of wire rope. Tribol. Int. 2021, 164, 107231. [Google Scholar] [CrossRef] [Scilit]
- Huerta, F.; Vesovic, V. CFD modelling of the isobaric evaporation of cryogenic liquids in storage tanks. Int. J. Heat Mass Transf. 2021, 176, 121419. [Google Scholar] [CrossRef] [Scilit]
- Huerta, F.; Vesovic, V. CFD modelling of the non-isobaric evaporation of cryogenic liquids in storage tanks. Appl. Energy 2024, 356, 122420. [Google Scholar] [CrossRef] [Scilit]
- Wan, C.C.; Zhu, S.L.; Shi, C.Y.; Bao, S.R.; Zhi, X.Q.; Qiu, L.M.; Wang, K. Numerical simulation on pressure evolution process of liquid hydrogen storage tank with active cryogenic cooling. Int. J. Refrig. 2023, 150, 47–58. [Google Scholar] [CrossRef] [Scilit]
- Niu, W.C.; Ju, Y.L. System design and experimental verification of an internal insulation panel system for large-scale cryogenic wind tunnel. Cryogenics 2021, 115, 103279. [Google Scholar] [CrossRef] [Scilit]
- Johnson, W.; Balasubramaniam, R.; Grotenrath, R. Analysis of heat transfer from a local heat source at cryogenic temperatures. IOP Conf. Ser. Mater. Sci. Eng. 2022, 1240, 012013. [Google Scholar] [CrossRef] [Scilit]
- Mahony, C.P.; Marchetta, J.G.; Swanger, A.M. Simulations of large-scale zero boiloff, densification, and solidification of hydrogen. Results Eng. 2025, 25, 104182. [Google Scholar] [CrossRef] [Scilit]
- Zhang, Z.; Chen, Z.; Nie, X.; Yao, C. Thermodynamic characteristic analysis of the cryogenic wind tunnel diffuser section based on fluid-thermal-structural coupling. J. Exp. Fluid Mech. 2016, 30, 18–25. [Google Scholar]
- Orozco, S.; Zamora, C.L.R.; Hossain, M.A.; Choudhuri, A. FEA-Based Thermo-Structural Modeling of Cryogenic Storage Tanks in Liquid Propulsion Systems. Aerospace 2025, 12, 479. [Google Scholar] [CrossRef] [Scilit]
- Li, J.; Wang, K.; Gu, C.; Qiu, L. Exhaust process of cryogenic nitrogen gas from a cryogenic wind tunnel with an inclined exit. J. Zhejiang Univ.-Sci. A 2023, 24, 419–431. [Google Scholar] [CrossRef] [Scilit]
- Huang, Z.; Wang, N.; Shi, Z.; Liao, D. Real-gas effects research associated with cryogenic transonic wind tunnel. J. Natl. Univ. Def. Technol. 2023, 45, 110–116. [Google Scholar]
- Brazhenko, V.; Qiu, Y.B.; Cai, J.C.; Wang, D.Y. Thermal Evaluation of Multilayer Wall with a Hat-Stringer in Aircraft Design. Stroj. Vestn.-J. Mech. Eng. 2022, 68, 635–641. [Google Scholar] [CrossRef] [Scilit]
- Lin, Z.; Chow, T.T.; Fong, K.F.; Wang, Q.W.; Li, Y. Comparison of performances of displacement and mixing ventilations. Part I: Thermal comfort. Int. J. Refrig. 2005, 28, 276–287. [Google Scholar] [CrossRef] [Scilit]
- Hernández-Jiménez, F.; Pérez-Alvarez, R.; López-Quesada, G.; García-Gutiérrez, L.M. Effect of Biot number on the thermocline evolution of a packed bed TES system. J. Energy Storage 2025, 110, 115272. [Google Scholar] [CrossRef] [Scilit]
- Valencia-Santana, J.; Ramos-Martín, A.; Henríquez-Concepción, V. Upgrading the dynamic mathematical model of temperature sensors in gaseous media for low Biot number (Bi < 0.1). Measurement 2024, 237, 115185. [Google Scholar] [CrossRef] [Scilit]
- Ke, J.H.; Williamson, N.; Armfield, S.W.; Komiya, A.; Norris, S.E. High Grashof number turbulent natural convection on an infinite vertical wall. J. Fluid Mech. 2021, 929, A15. [Google Scholar] [CrossRef] [Scilit]
- Shah, N.A.; Animasaun, I.L.; Ibraheem, R.O.; Babatunde, H.A.; Sandeep, N.; Pop, I. Scrutinization of the effects of Grashof number on the flow of different fluids driven by convection over various surfaces. J. Mol. Liq. 2018, 249, 980–990. [Google Scholar] [CrossRef] [Scilit]
- Brykina, I.G.; Egorova, L.A. Approximation Formulas for the Radiative Heat Flux at High Velocities. Fluid Dyn. 2019, 54, 562–574. [Google Scholar] [CrossRef] [Scilit]
- Krasuski, A.; Wischhusen, S.; Ozóg, P.; Kowalski, W. CFD-modeling of the radiative heat flux from CO/CO2 steel mill’s converter. Fuel 2026, 405, 136538. [Google Scholar] [CrossRef] [Scilit]
- Xie, J.; Zhao, X.Q.; Yan, J.B. Mechanical properties of high strength steel strand at low temperatures: Tests and analysis. Constr. Build. Mater. 2018, 189, 1076–1092. [Google Scholar] [CrossRef] [Scilit]
- Bekaert. Use of Steel Wire Rope in Low Temperatures. Available online: https://ropes.bekaert.com/us/en/home/knowledge-center/podcasts/use-of-steel-wire-rope-in-low-temperatures (accessed on 26 July 2026).
- Lienhard, J.H. Heat Transfer in Flat-Plate Boundary Layers: A Correlation for Laminar, Transitional, and Turbulent Flow. J. Heat Transf.-Trans. Asme 2020, 142, 061805. [Google Scholar] [CrossRef] [Scilit]
- Le, P.M.; Papavassiliou, D.V. On temperature prediction at low Re turbulent flows using the Churchill turbulent heat flux correlation. Int. J. Heat Mass Transf. 2006, 49, 3681–3690. [Google Scholar] [CrossRef] [Scilit]
- Taler, D.; Taler, J. Prediction of heat transfer correlations in a low-loaded plate-fin-and-tube heat exchanger based on flow-thermal tests. Appl. Therm. Eng. 2019, 148, 641–649. [Google Scholar] [CrossRef] [Scilit]

Disclaimer/Publisher’s Note: The statements, opinions and data contained in all publications are solely those of the individual author(s) and contributor(s) and not of MDPI and/or the editor(s). MDPI and/or the editor(s) disclaim responsibility for any injury to people or property resulting from any ideas, methods, instructions or products referred to in the content. |
© 2026 by the authors. Licensee MDPI, Basel, Switzerland. This article is an open access article distributed under the terms and conditions of the Creative Commons Attribution (CC BY) license.