


Abstract
Anti-friction bearings are fundamental components in rotating machinery. Any bearing fault appearing during operation could lead to catastrophic damages and failures without proper maintenance. Numerous methods have been developed for bearing fault detection to reduce maintenance costs and avoid unscheduled downtime. However, once a bearing fault is detected, assessing defect severity may be of more critical concern to industries, as it determines the urgency of interventions such as replacement scheduling and maintenance strategies. This paper presents an efficient estimation method for bearing fault severity using vibration-based input parameters and machine learning. Based on modal characteristics, key input parameters, the vibration amplitudes at the bearing fault frequencies and their harmonics, are extracted from acceleration envelope spectra for their close correlations with physical defect conditions. The nonlinearity between these spectral parameters and bearing fault severity is revealed with experimental observations and is represented using artificial neural networks. The model is validated on experimental vibration data measured from a bearing rig, covering various defect scenarios of different sizes and shapes. The classification criteria of bearing fault severity levels, ranging from healthy to severe, are formulated based on physical defect sizes with maintenance recommendations. Robust and accurate fault severity estimation is achieved across three bearing datasets collected under different operating conditions. The proposed method addresses both fault detection and degradation assessment for anti-friction bearings using simple vibration-based parameters based on rotor and bearing dynamics, providing a practical framework for predictive maintenance in industrial applications.
1. Introduction
Anti-friction bearings are key components in rotating machinery such as wind turbines, electrical motors, generators, and aircraft engines. Any faults developed in the bearings are likely to lead to catastrophic machine failures. Hence, the early detection for such fault/faults in the bearing is essential to carry out the required maintenance on time. In condition-based monitoring (CBM), bearings have long been a crucial focus as their performance plays a significant part in the system’s reliability and safety. A wide range of fault detection and diagnosis techniques have been developed. For example, vibration-based condition monitoring (VCM) uses rotor dynamic concepts and applies signal demodulation techniques to extract fault characteristic frequencies (FCFs) from bearing resonance responses [1]. Envelope analysis is one of the methods for this purpose. Based on demodulation, the fault frequencies are enhanced in an envelope spectrum to effectively recognise bearing faults and identify the exact fault type and location (i.e., an inner-race fault, outer-race fault, cage fault, or rolling-element fault) [2,3]. Other signal processing methods can also be used for identification of modulated bearing defect frequencies. Here, envelope analysis is used.
However, in industrial practice, mere fault detection is insufficient. Beyond healthy or faulty, the optimal residual time before replacement may be a more critical concern to the industry. Once a bearing defect is detected, maintenance planning necessitates a clear understanding of defect severity to determine the optimal timing for replacement. In many cases, an early-stage or minor defect may be tolerable with regular monitoring if it does not significantly impact performance (e.g., operating under low speeds and loads or in a non-critical system), whereas a severe defect could lead to catastrophic failure and compromise operational safety if not promptly maintained. Without intervention, a single localised fault could develop into a distributed fault exhibiting different and complex characteristics [4]. Hence, defect severity is crucial information for predictive maintenance. The quantification of fault severity offers valuable insights into decision-making regarding maintenance intervention, safety assurance, and cost optimisation [5,6].
In a broad sense, bearing fault severity is associated with the degree of a fault, such as the physical defect size or the position in a bearing degradation path. The degradation process of a bearing can be intractable due to the influence of numerous factors, such as inappropriate installation, misalignment, lubrication issues, operational speeds and loads, etc. Instead of directly assessing bearing defect severity, there are many research studies that attempt to predict the remaining useful life (RUL) of bearings with a data-driven strategy [7,8]. Relying on historical lifecycle data, the bearing end-of-life can be predicted from the current operation time using condition measurements and machine learning (ML) models [9]. However, despite the RUL estimates, the physical defect conditions in between, such as the defect size and its progression, are unknown. There can be cases where RUL prediction is made too late to allow sufficient time for replacement, particularly when the defect reaches a severe stage. Specifically, physics-based models were used to track bearing spall severity based on oil debris monitoring, strain gauge and vibration measurements for understanding the spall propagation mechanism [10]. On this basis, quantitative fault diagnosis may be achieved through bearing degradation assessment, which can be categorised into two approaches: fault size estimation and fault severity estimation [11]. Fault size estimation quantifies defect dimensions to provide a physical measure of defect condition or degradation rate. For example, the spall length of an angular contact ball bearing was estimated in [12] based on mass loss via oil debris data. With physical defect sizes, more reliable RUL could be predicted to support effective maintenance planning. In vibration-based condition monitoring, signal processing approaches have been extensively explored to estimate bearing spall sizes by determining the time interval between the entry and exit of the defect zone [13,14]. For this purpose, typical impact vibrations are identified from a few experimental and natural bearing defects in mainly ball bearings [13,14,15,16]. For instance, singular spectrum analysis is used for filtering vibration data for determining the fault entry and impact time [17]. Instead of estimating physical defect dimensions, fault severity estimation methods attempt to provide quantitative assessments of the bearing degradation state. This can be realised by constructing a numeric indicator that reflects the degradation process. For instance, the severity assessment index developed based on signal randomness is found monotonically increase with the width of a few experimental ball-bearing defects [18]. These studies were attempted only using a few experiments and multiple defects were not tested simultaneously. The vibration evaluation criteria outlined in the international standard, ISO 20816-1 [19], divide machine vibration into four acceptance zones based on vibration velocity magnitude, i.e., the vibration of newly commissioned machines, acceptable for long-term operation, unsatisfactory for long-term continuous operation, and sufficiently severe to cause damage. Similarly, the bearing degradation index based on fuzzy c-means clustering is utilised to classify bearing fault severity levels, including the normal state, slight degradation state, and severe degradation state [20]. An accuracy of 98% is obtained for degradation severity classification using the vibration samples from bearing lifecycle datasets [20]. However, it should be noted that the degradation index constructed based on the distance from mere healthy bearing vibration data might not effectively reflect actual defect sizes. It is because the actual defect conditions are not known. Various machine learning techniques, such as support vector machines [21] and deep neural networks [22,23], have been applied to unveil bearing degradation dynamics and predict bearing fault severity. Instead of using raw measurement data as input, dependable features or parameters are extracted from the time domain signals, e.g., kurtosis [21], the frequency domain signal—e.g., vibration spectra [23]—or time-frequency domain signals such as Wigner–Ville transformation [15]. The raw vibration data [22] time domain parameters [21] and spectrum data [23] may reflect the behaviour of rotor and other machine dynamics in addition to the bearing vibration. These features do not directly reflect bearing dynamics only and hence it is difficult to rely on these methods for practical applications. Therefore, a standardised method is needed that can estimate the damage severity caused by bearing defects using only bearing dynamics-based vibration parameters by removing the effect of rotor and other machine component vibrations from the measured vibration data.
The present study presents an ML model for bearing fault severity classification based on the vibration-based parameters extracted from acceleration envelope spectra. The envelope spectrum, if applied appropriately based on the rotor and bearing dynamics, is an effective tool for bearing fault detection [2]. But it does not directly provide quantitative insights into the defect size. Considering the correlation between vibration envelope spectra and physical defect conditions, an artificial neural network (ANN) model is used to unveil bearing fault severity from the acceleration amplitudes at different bearing fault characteristic frequencies (FCFs). For model validation, a series of bearing fault experiments were conducted on a bearing rig at different fault severities. Nonlinear behaviours in the vibration amplitudes at fault frequencies are found across different defect sizes. The severity of bearing faults is categorised into five levels, i.e., healthy, minor, medium, high, and severe. For demonstration, the evaluation criteria of bearing fault severity are formulated according to the surface area of the defect. The proposed methodology is validated on three experimental bearing vibration datasets measured under varying operating speeds. Excellent prediction accuracy is obtained, which reinforces its practical viability towards industrial implementation. The main contributions of this work can be summarised as follows:
- (1)
- The vibration-based input parameters (FCFs) directly related to bearing defects are used based on the rotor dynamics concept. Hence, this process eliminates the machine dynamics from other machine components and unknown noises in the measured vibration acceleration signals.
- (2)
- A simple and efficient ANN-based ML model is used for bearing fault severity identification. The purpose of the ML model, unlike any manual and conventional approaches, is to efficiently handle datasets and correlate bearing vibration responses with fault severity. Other ML methods can also be explored but here ANN-based ML is used to demonstrate the objectives of this research study.
- (3)
- The evaluation criteria for assessing defect severity are formulated based on the physical defect areas. The bearing defect severity levels can be defined based on the industrial requirements. Estimating bearing defect size is the main challenge within industries to schedule the replacement of the defective bearing.
- (4)
- The application of the proposed method to measured vibration data from the roller bearing rig demonstrates excellent classification accuracy across different severity levels. The results highlight the effectiveness of the selected parameters for bearing fault severity assessment to support predictive maintenance planning beyond fault detection.
It is important to note that the research studies on the RUL estimation seen in the literature are generally carried out based on high vibrations without knowing the exact bearing defect severity at every stage of defect propagation. Hence, the RUL estimation may not be a useful maintenance activity unless it is correlated with damage severity. There are a few studies which have also attempted to relate vibration data with the bearing defect severity classification but the input vibration data are not selected based on the rotor and bearing dynamics. Hence, the proposed methodology is a viable approach which predicts the severity zone of bearing faults. This is expected to support industrial maintenance activity to plan the replacement of defective bearings based on defect severity.
2. Methodology
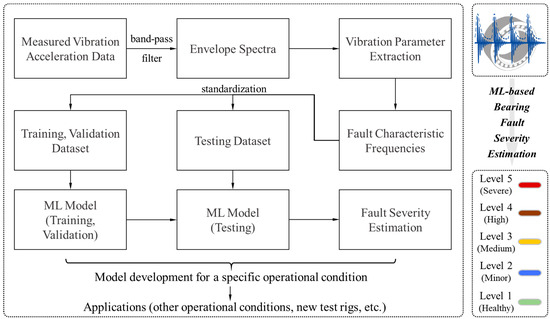
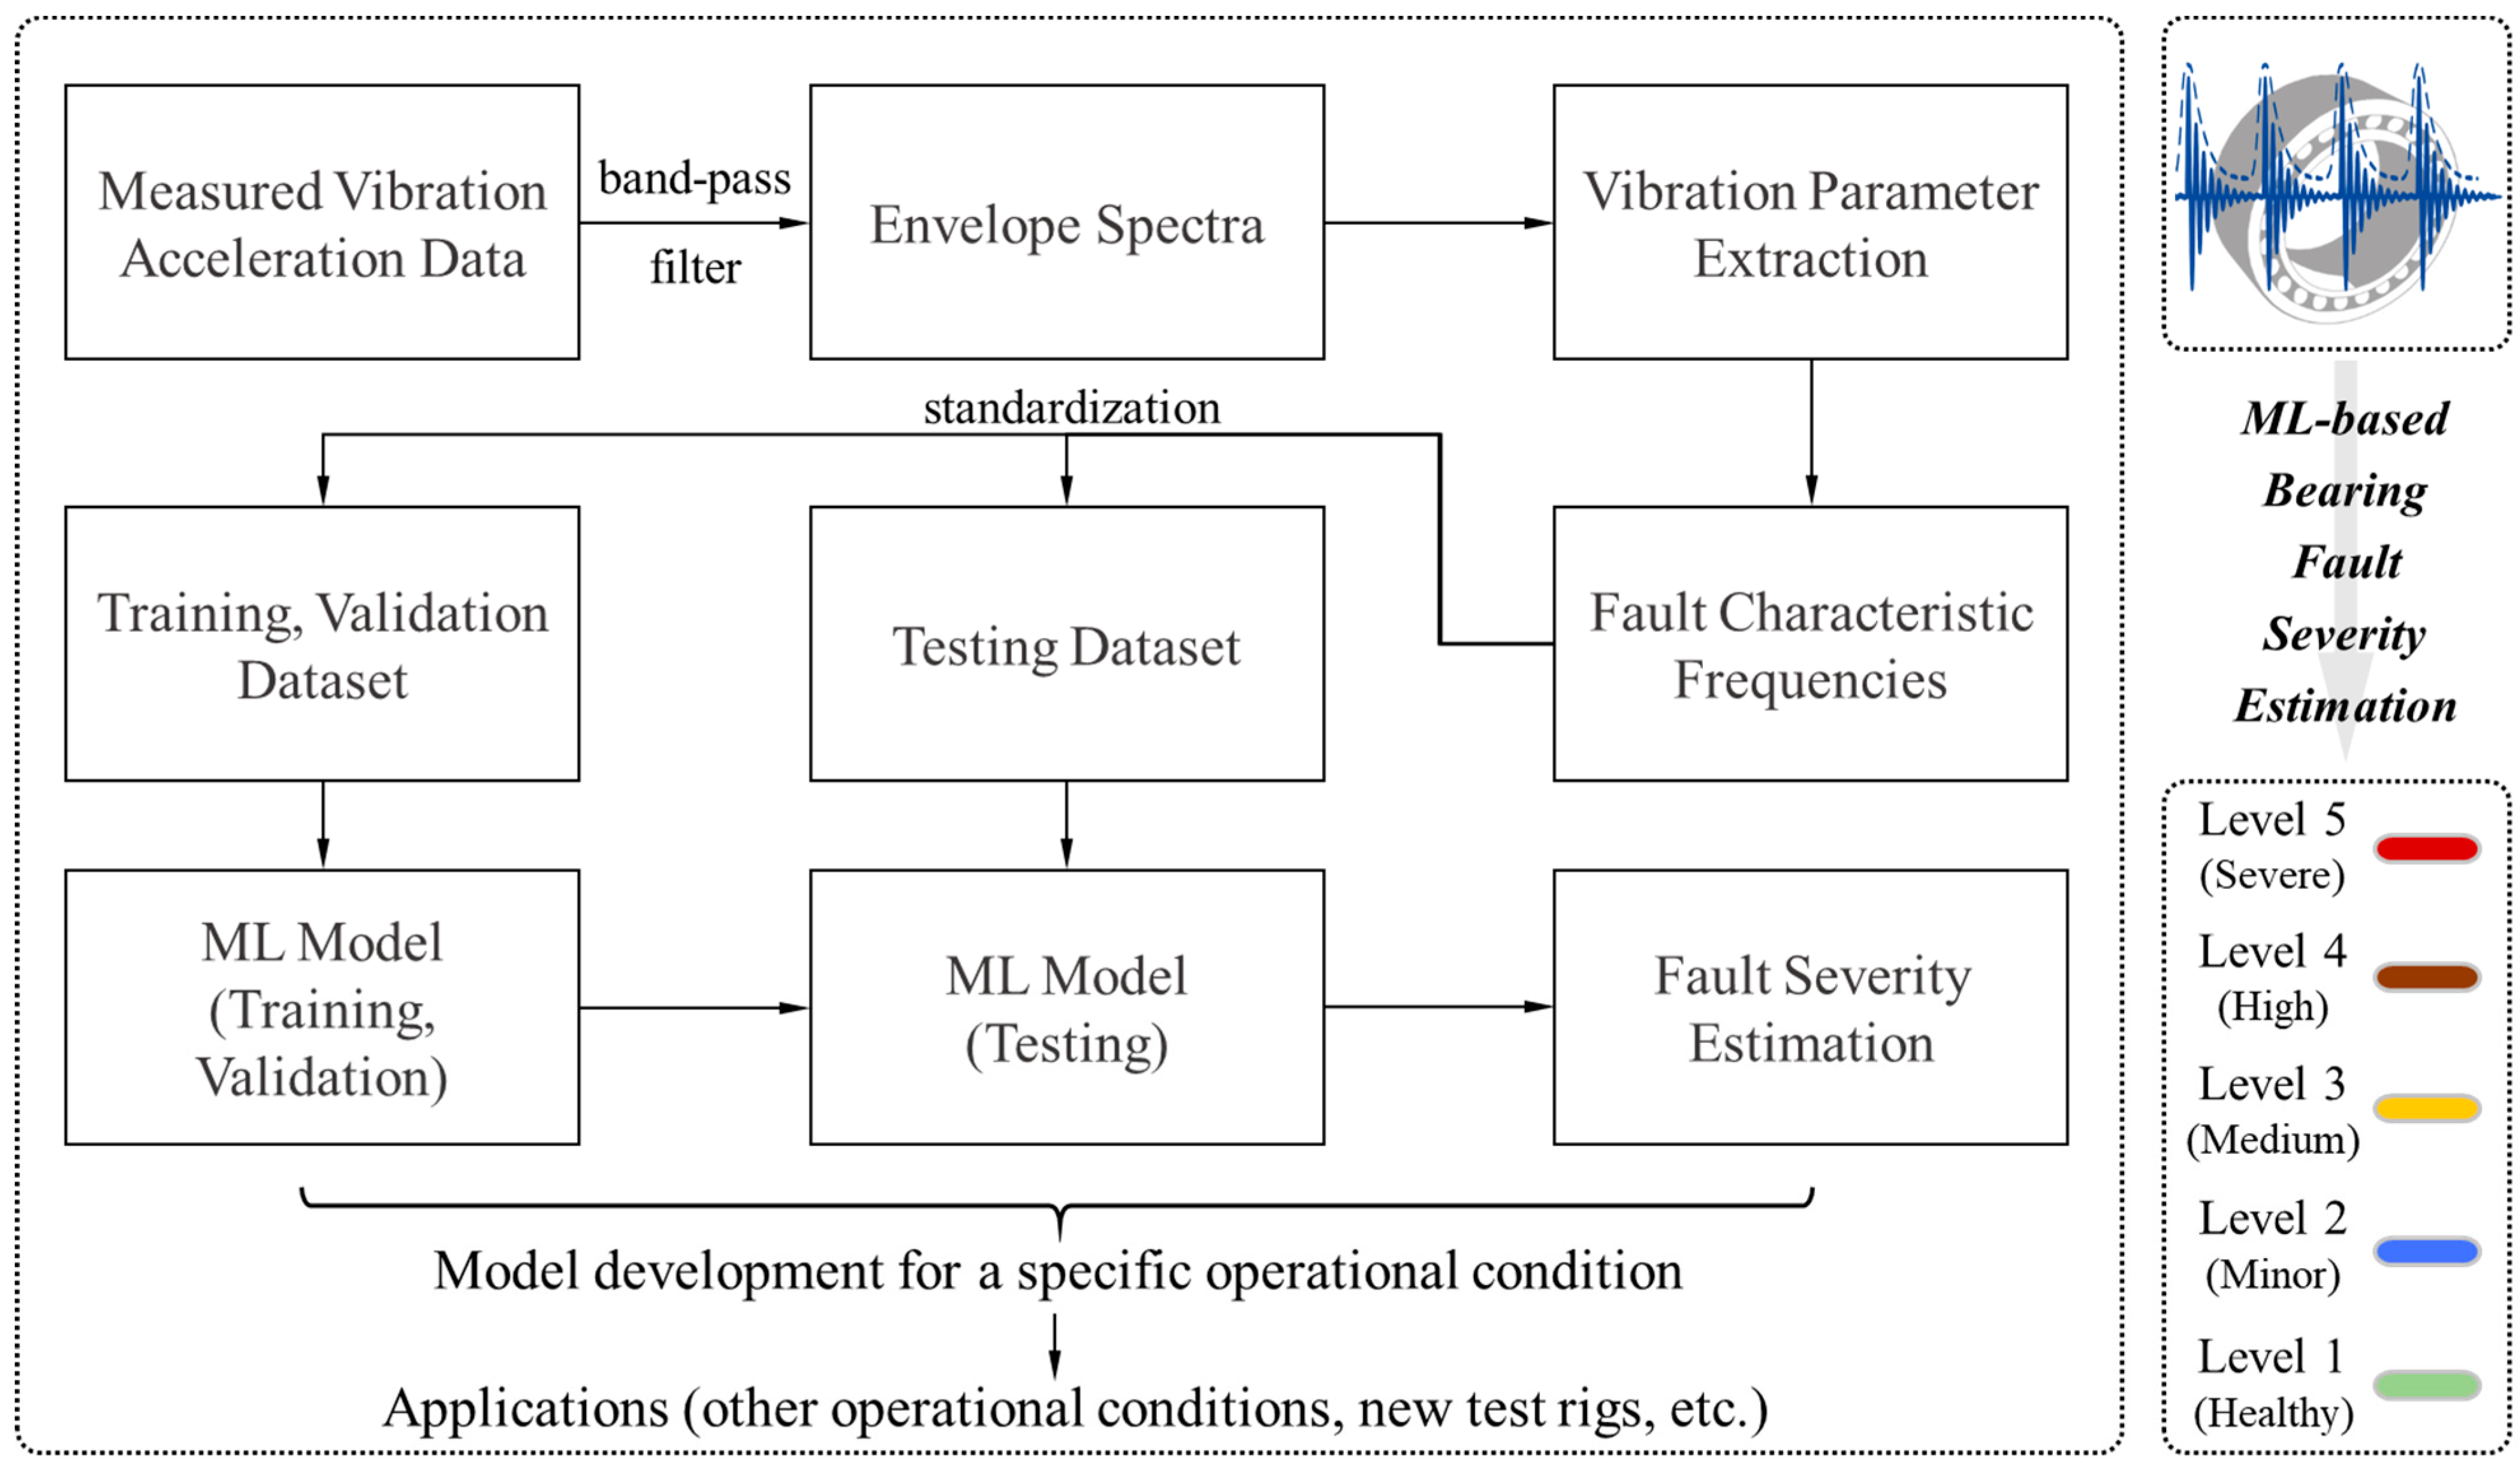
The ML model for bearing defect severity estimation is proposed using vibration-based input parameters and artificial neural networks. The model is used based on measured vibration acceleration signals from a bearing rig in laboratory setups. Defect-related parameters are selected as input for the ANN to assess the severity level. The proposed method can be summarised in Figure 1 based on the following steps: (1) first, the envelope spectra of the vibration acceleration signals with different defect severities are computed for bearing fault identification. (2) Second, the acceleration amplitudes at the bearing fault characteristic frequencies are extracted from the envelope spectra as input parameters. (3) Then, datasets are prepared based on the severity evaluation criteria relating to physical defect sizes. (4) Lastly, the ANN model fitted on the training data can be applied to the new data for testing. The purpose of the ML model, unlike any manual and conventional approaches, is to efficiently handle datasets and correlate bearing vibration responses with fault severity. Based on the ML model, bearing defect severity can be estimated from measured vibration data for other operational conditions or new bearing rigs. The exact implementation procedure can be applied without changing the ANN-based ML model and the input parameters.
Figure 1.
The flowchart of the ML model for bearing fault severity estimation.
2.1. Envelope Spectrum
When a defect develops in an anti-friction bearing, metal-to-metal impacts are usually generated as bearing components pass the defect during shaft rotations. The fault characteristic frequencies are modulated with the resonance response of the bearing assembly. Thus, amplitude demodulation is required to extract the defect-related frequencies from the measured acceleration signals. To this end, envelope analysis is performed.
First, the measured acceleration signal is band-pass filtered as per the bearing resonance band. Based on rotor dynamics, the filtration step attempts to preserve only the bearing response while reducing the rotor-related low-frequency components [1,2]. Let be the filtered acceleration signal; its envelope signal can be given by the magnitude of the analytical signal.
where stands for the Hilbert Transformation and j is the imaginary unit [2]. The fast Fourier transform (FFT) of the envelope signal leads to the envelope spectrum (ES), which efficiently reveals any spectral components at the fault frequencies (or FCFs) if a defect initiates in the bearing.
To mitigate random noise interferences, it is preferable to compute the averaged envelope spectrum (AES) derived based on the concept of power spectral density, as given by [2]
where represents the AES obtained by averaging envelope signal segments, and and denote the complex ES and its conjugate of the i-th envelope segment , respectively. Each data segment comprises N FFT points, where . The frequency index can be given by (), with representing the sampling rate.
2.2. Vibration-Based Input Parameters
Next, the selection of vibration-based input parameters for the defect severity estimation model is discussed. Due to the close relevance to actual machine conditions, vibration-based parameters have been widely applied with ML models in various VCM applications, such as fault detection and diagnosis in rotating machines [24,25]. The purpose of this strategy is to provide simple yet effective metrics based on rotor dynamics for industrial implementations.
For bearing condition monitoring, envelope analysis is important for its close relation to actual defect conditions. The AES was initially applied as the input of the ML model for predicting bearing remaining useful life from an envelope spectrum [9]. The implicit yet crucial relationship between envelope spectra and bearing life was explored, while the dimensionality of input parameters can be highly dependent on the spectral range of interest and the sampling rate, thereby leading to high computation costs. Apparent nonlinear behaviours were observed within the bearings’ lifetime with variations across different bearings of the same model and under the same operational conditions [9].
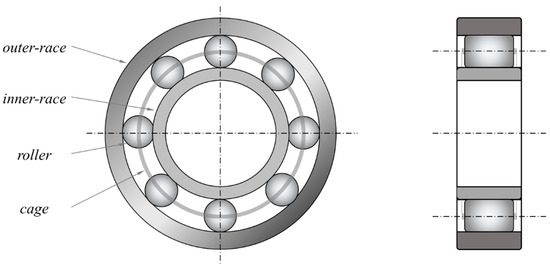
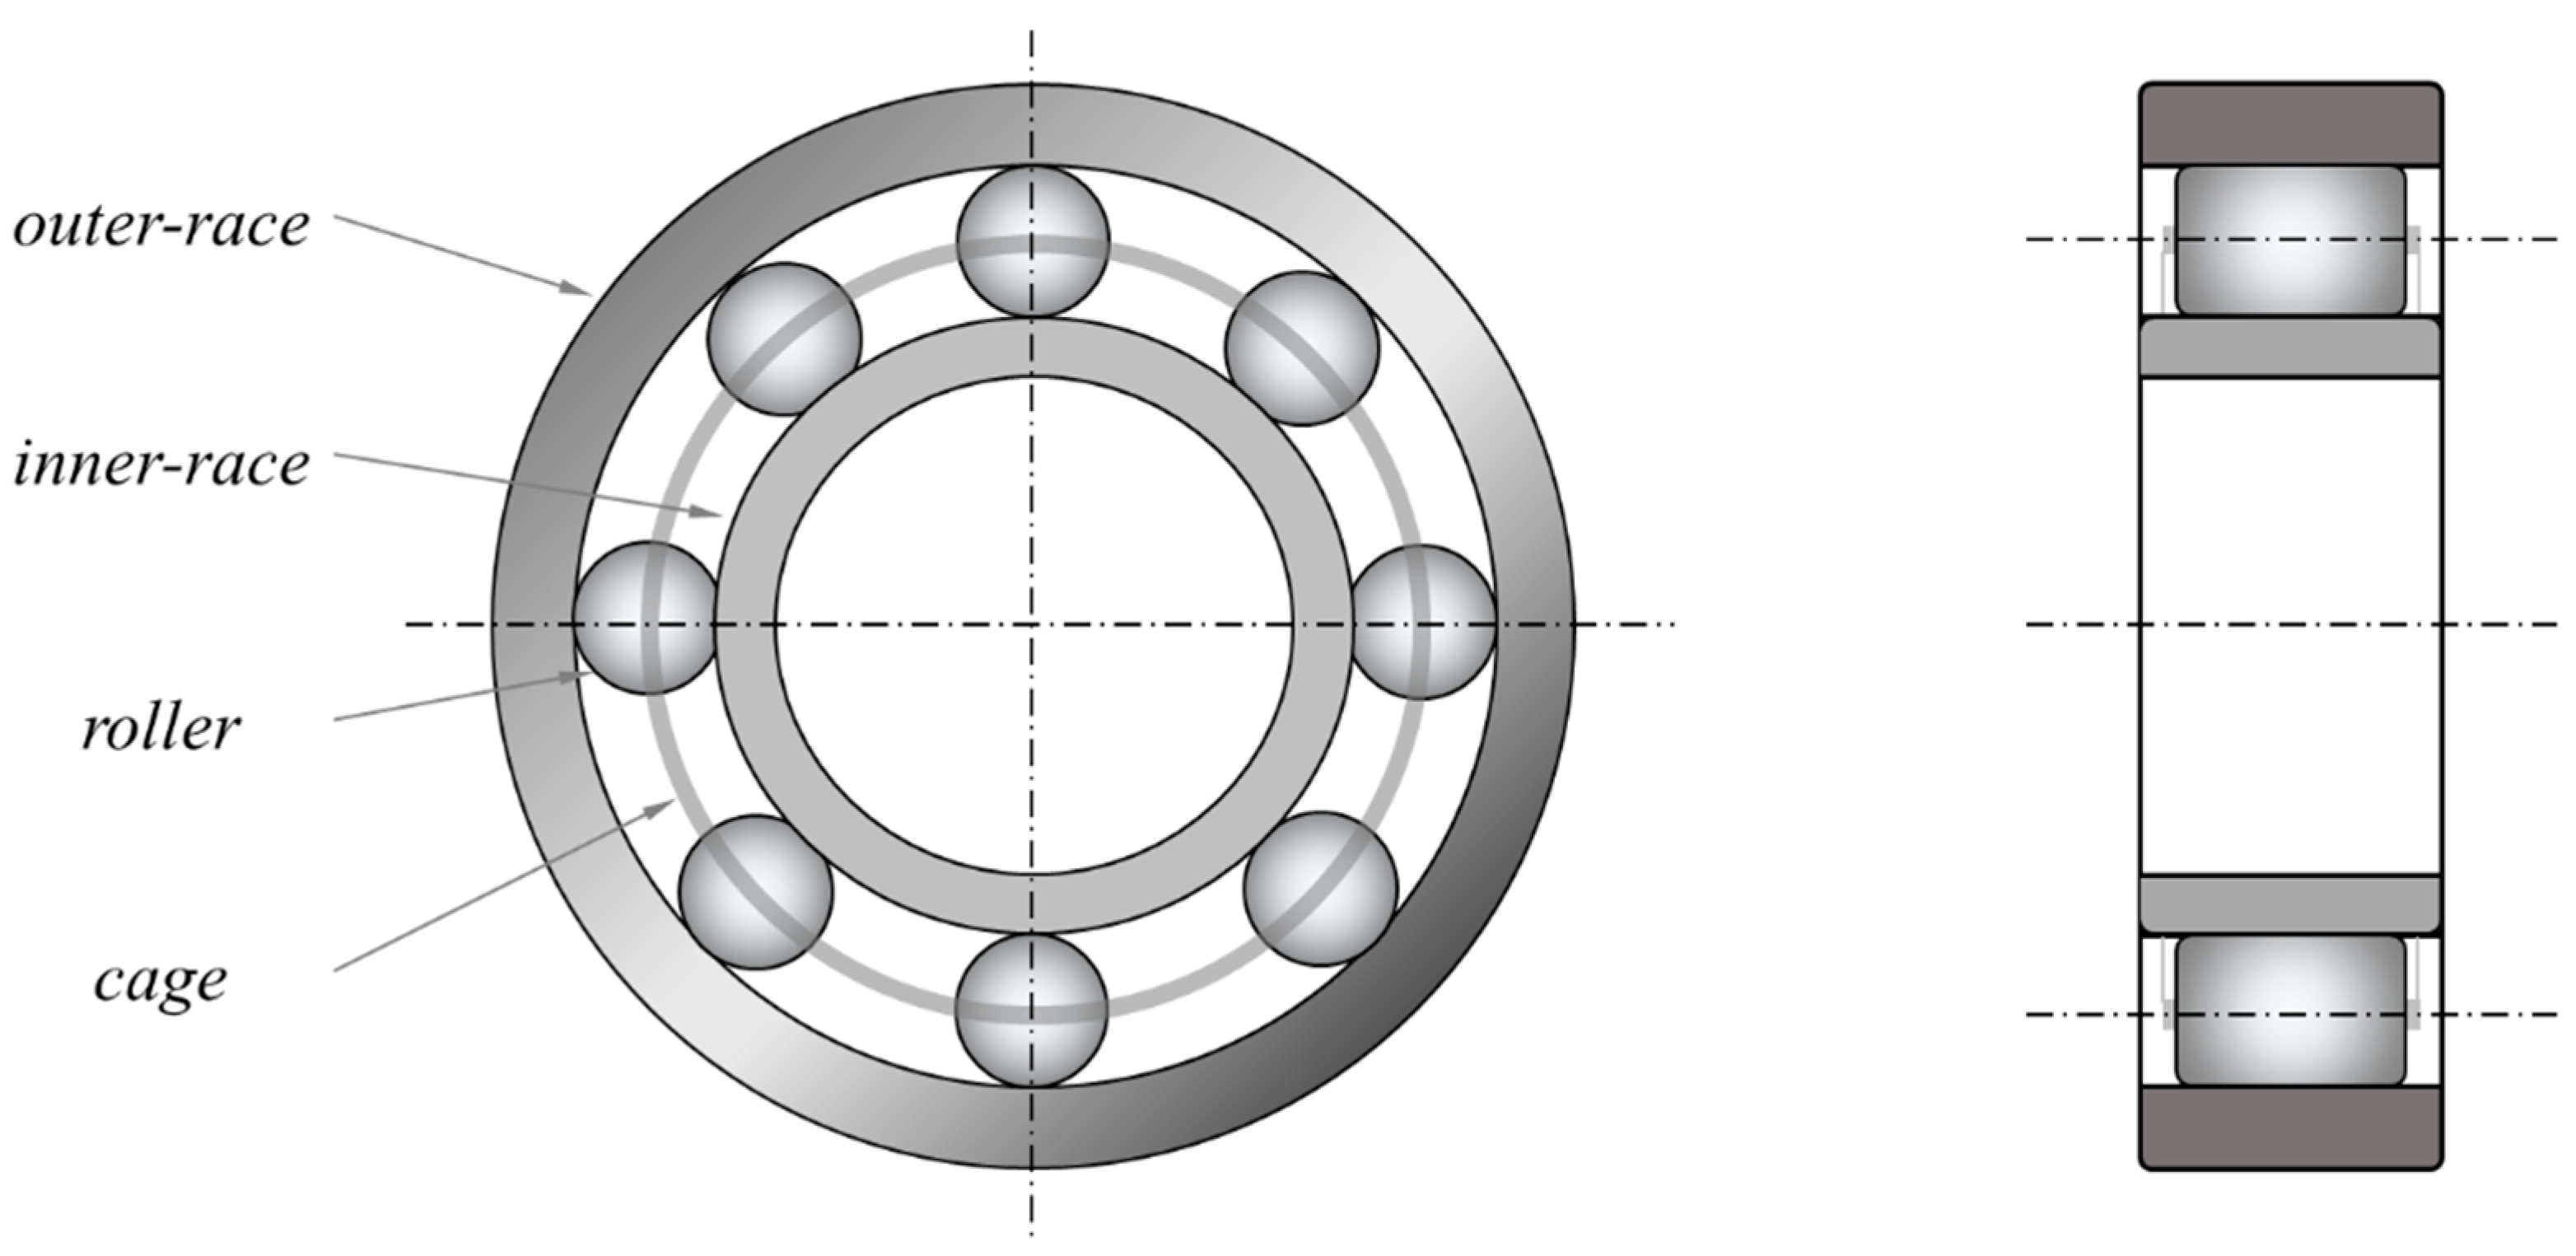
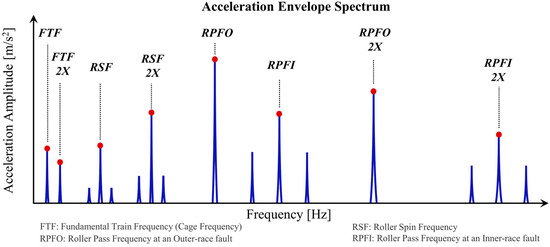
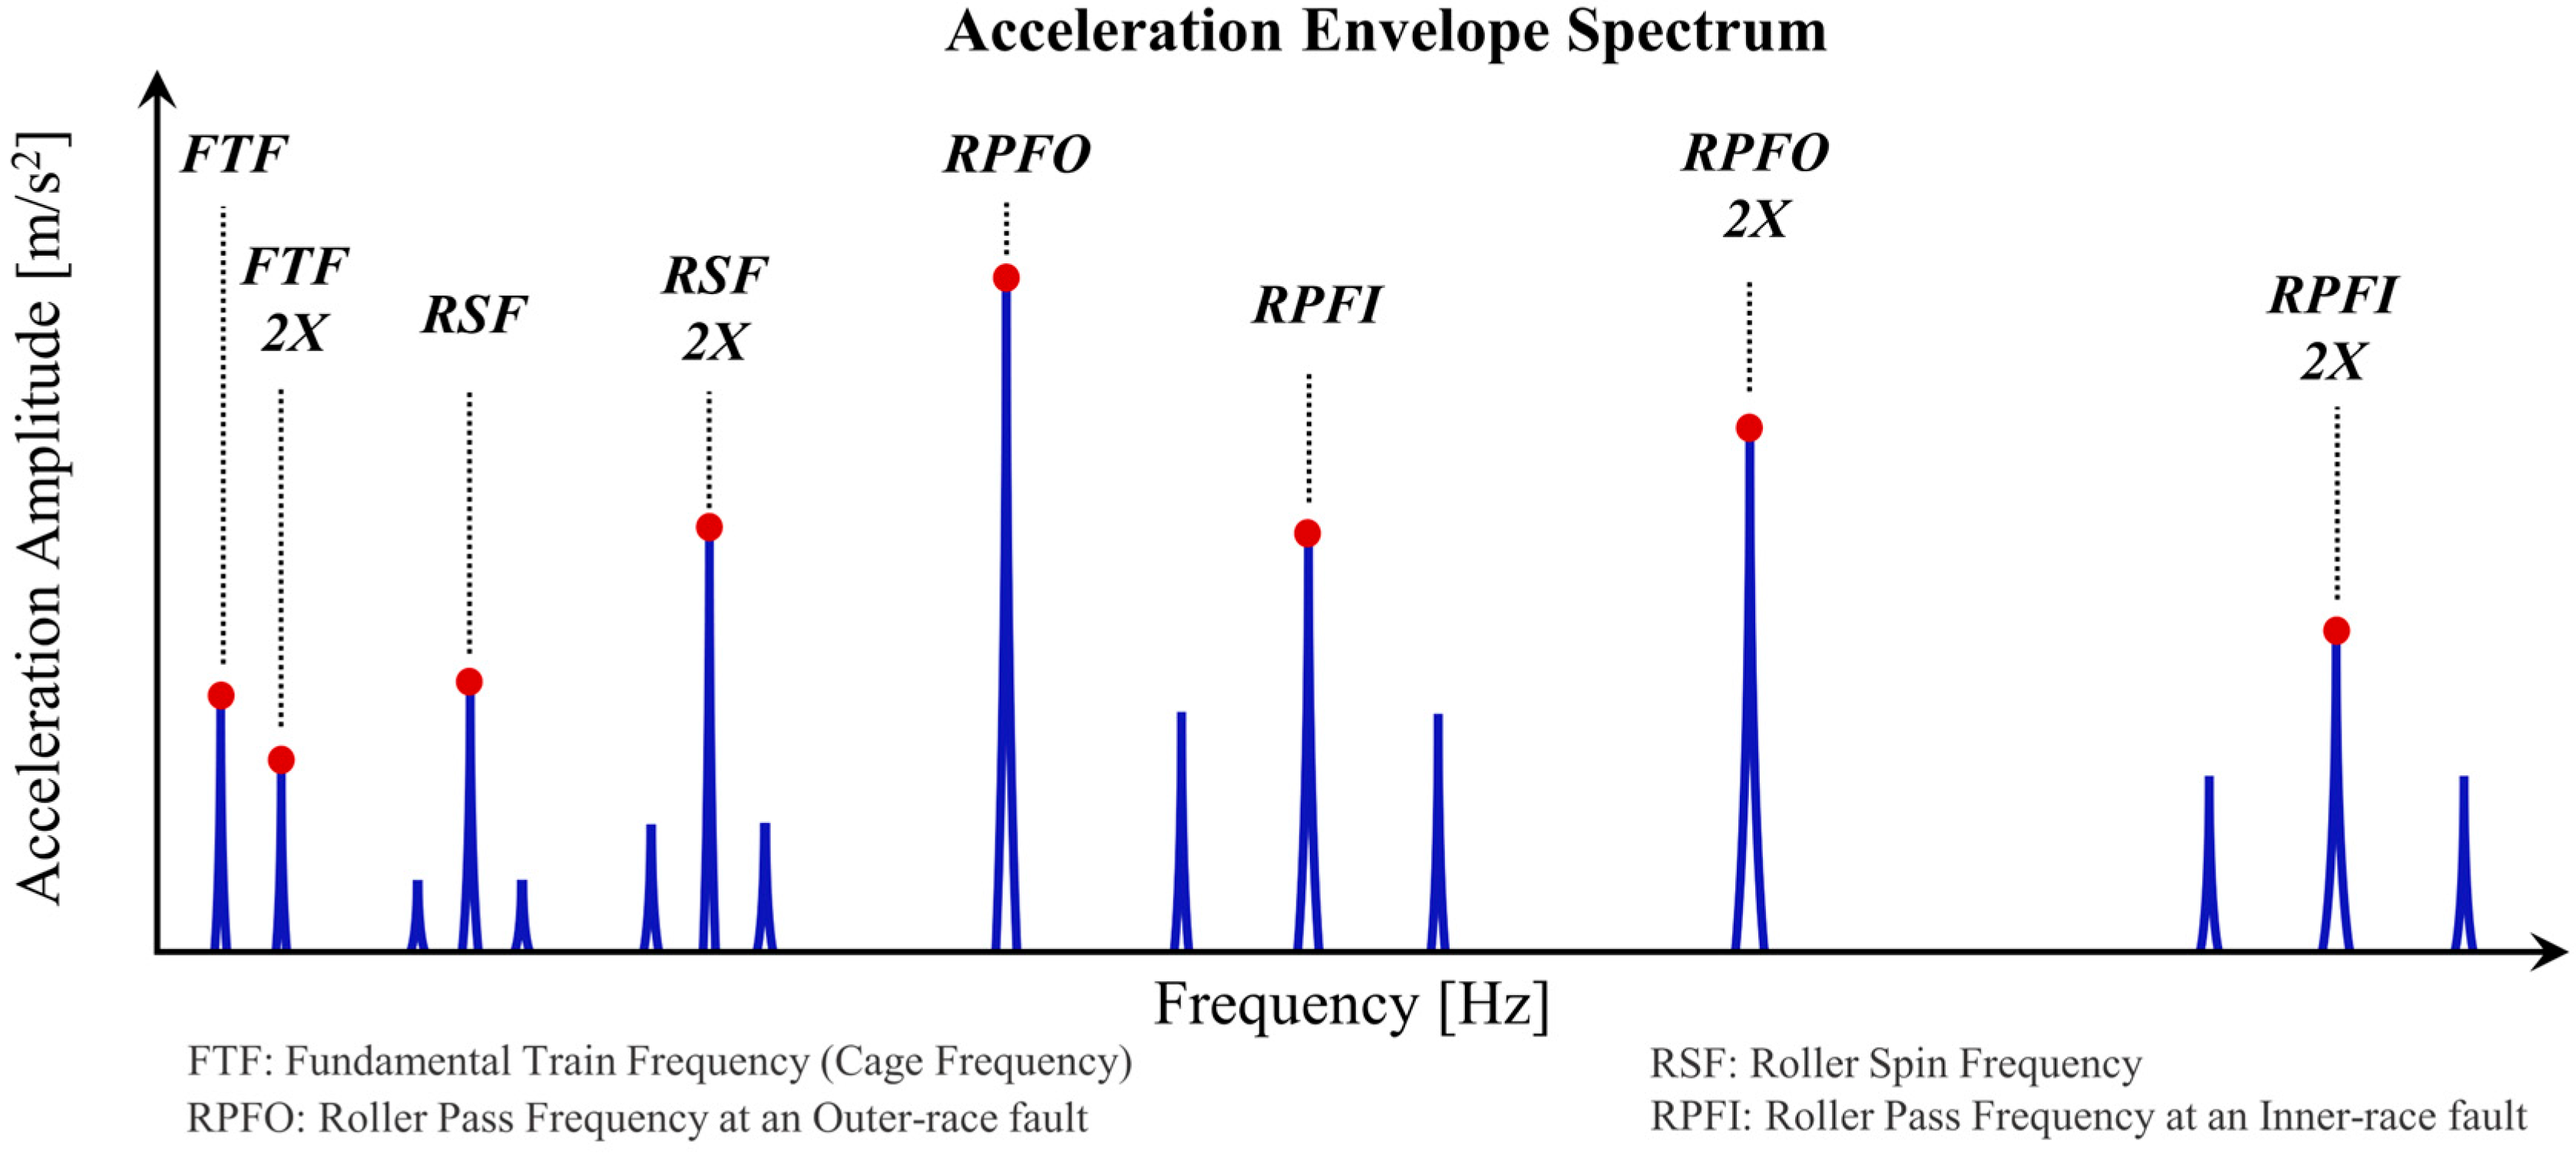
In this work, further improvements and applications are explored by extracting the defect frequencies from envelope spectra to predict the severity level of bearing defects. Based on the defective bearing components (i.e., cage, rolling elements, inner race, and outer race, as in Figure 2), the defect frequencies, also known as fault characteristic frequencies (FCFs), can be computed using bearing dimensions and the shaft rotation speed. For example, four FCFs can be obtained for a roller bearing, namely fundamental train frequency (FTF), roller spin frequency (RSF), roller pass frequency at an outer-race fault (RPFO), and roller pass frequency at an inner-race fault (RPFI). As shown in Figure 3, due to amplitude demodulation, different bearing faults correspond to various FCF peaks in an envelope spectrum. Specifically, the inner-race fault exhibits a distinctive spectral pattern with modulation sidebands. This is because of the defect’s rotation during shaft operation. The roller fault also shows similar phenomena due to the movement of the roller itself, where the RSF 2 is usually more dominant since the defective roller makes contact with both the inner race and outer race during a single rotation.
Figure 2.
A simple schematic diagram of a roller bearing.
Figure 3.
The input parameters (marked by red dots) based on bearing fault characteristic frequencies extracted from an envelope spectrum.
The acceleration amplitudes of these FCFs are hence used as input parameters, considering their direct correlation with the physical occurrence of bearing defects. To ensure the reliability of input parameters, these FCFs are obtained from envelope analysis and experimental modal analysis based on rotor dynamics theory (see Section 4 for further illustration). The harmonics at their second multiples are also utilised as they reflect the modulation effects in bearing vibration signals, providing an enhanced representation of fault features. The presence of 3rd and higher-order harmonics of the FCFs is generally not found to be dominant or to stand out from the background noise in the envelope spectra in most experimental cases. Hence, the FCFs and their second harmonics together provide reliable metrics against random measurement noises with physical interpretability. Their sensitivity to the change in defect severity is also observed based on the experimental validation on a bearing rig (see Section 4.4). Therefore, eight vibration-based frequency domain parameters from the AES are used to formulate the input vector for the severity estimation model.
where represents the input vector for the i-th vibration acceleration sample measured from the selected bearing and . The parameter values can be computed from the AES as per Equation (2). For I vibration measurement samples, the input data can be arranged as
Compared to the direct use of envelope spectra, the input dimensionality is sufficiently reduced. Before feeding into the ML model, the input parameters are standardised into a consistent range (with their mean at zero and standard deviation at one) to avoid numerical instability and accelerate the learning process.
2.3. Bearing Fault Severity Levels
The vibration-based parameters are labelled with their corresponding severity levels to generate datasets for developing the ML-based fault severity model. This study provides a general guideline for the measurement and evaluation of bearing defect size and severity. Table 1 summarises the classification of bearing fault severity with the physical evaluations and maintenance suggestions.
Table 1.
Classification of bearing fault severity levels.
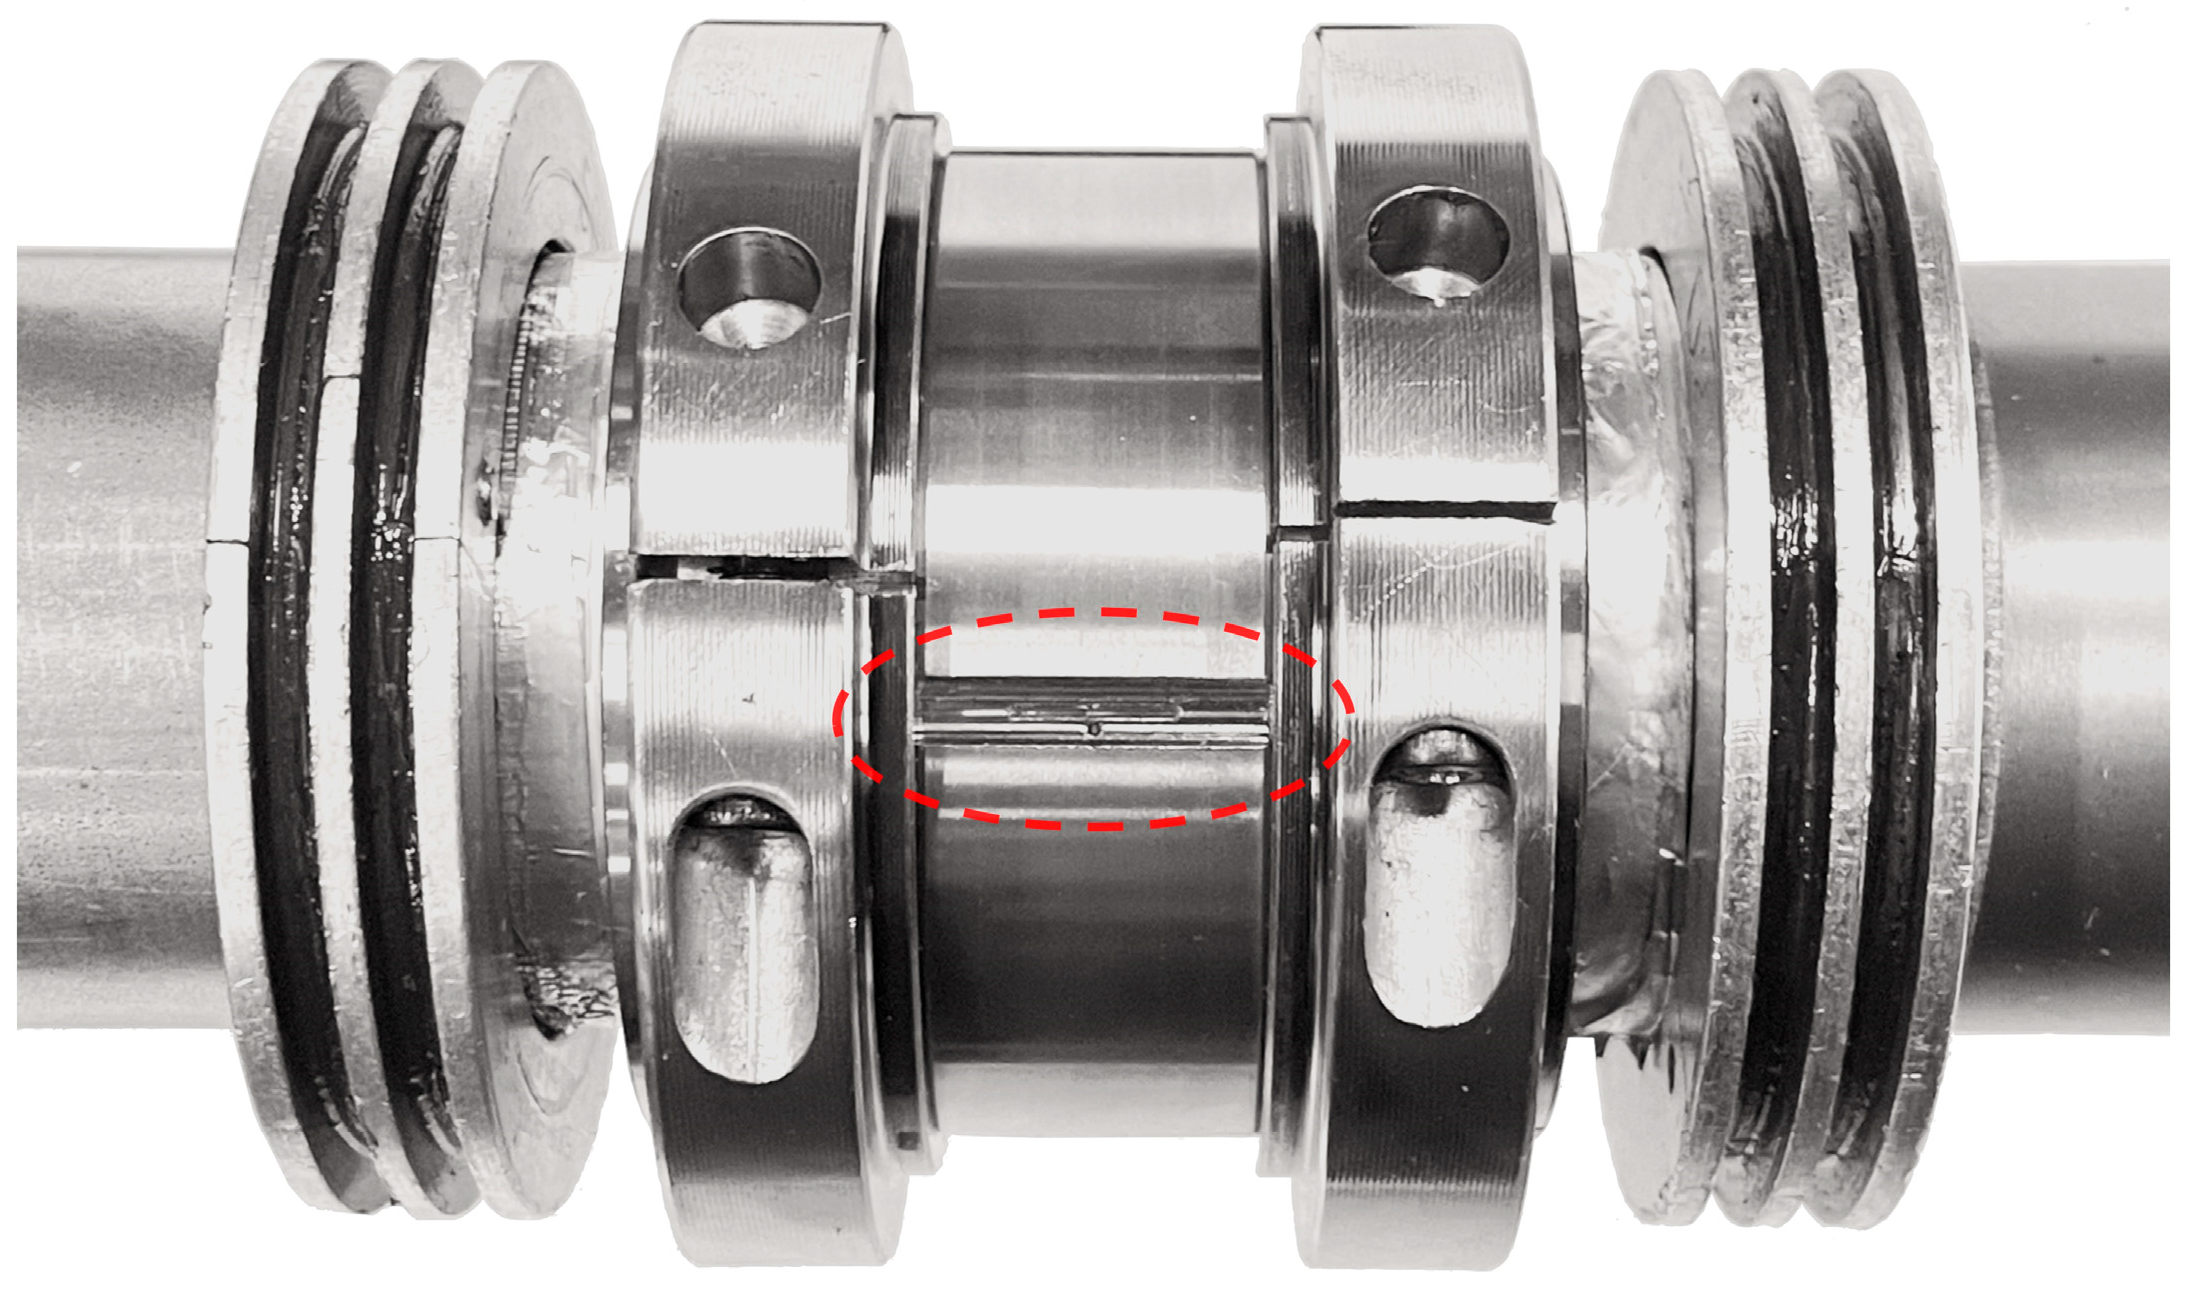
Hence, the measured vibration data can be categorised into different severity levels based on the surface area of each bearing defect. For example, an experimentally seeded inner-race defect is shown in Figure 4. An area of about 80.40 mm2 is removed from the inner-race surface, leading to repetitive impact loadings during the shaft rotation. The boundaries of the defect area for each severity level are further provided in Section 3.2 for demonstration. Note that the classification of the bearing fault severity depends upon industrial requirements and can be redefined as per specific applications.
Figure 4.
An example inner-race defect of 4 mm width, 20.10 mm length, and 1 mm depth.
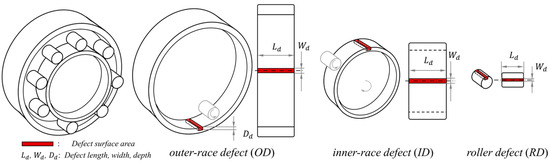
Using rectangular-shaped slots as examples, the dimensions of different bearing defects can be depicted as shown in the schematic diagram in Figure 5. On this basis, the surface area of a line defect or a circle defect can be estimated using the following equation:
where and denote the width and length of a line defect, and is the radius of a circle point defect.
Figure 5.
Schematics of faulty bearing components with illustrative defect dimensions in a projected view for estimating physical defect sizes using area.
2.4. Machine Learning Model for Fault Severity Estimation
Artificial neural networks (ANNs), or multi-layer perceptron (MLP), are proved to be powerful in modelling complex, nonlinear relationships with adaptive feature learning capability for diverse ML tasks, where the learned model can be implemented on unseen data for predicting multi-response output [26]. In this work, the model of bearing fault severity estimation is developed using ANN. The main idea of this work is to enable fault severity assessment from the selected vibration-based parameters. The purpose of the ML model is to handle the nonlinearity within bearing vibration responses and to simplify the severity assessment procedure for industrial applications.
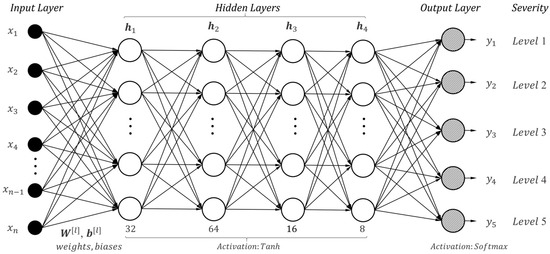
The estimation of fault severity level is formulated as a multi-class classification task with an unknown many-to-one mapping. To this end, the ANN is structured with an input layer corresponding to the standardised input parameters, i.e., the envelope acceleration amplitudes of the bearing FCFs and harmonics, four hidden layers with optimised neuron configurations, and an output layer representing a predicted severity level. Note that eight pertinent input parameters, including FTF, RSF, RPFO, RPFI and their second harmonics, are carefully selected based on rotor dynamic principles to characterise bearing defect conditions; a six-layer ANN is utilised rather than a deeper or more sophisticated neural network. The use of physically meaningful input parameters and a shallow network minimises the need for learning high-level features directly from raw vibration data. It not only enhances interpretability but also reduces computational costs and mitigates the risk of overfitting.
As shown in Figure 6, the ANN is characterised by four fully connected hidden layers with the hyper-parameters and setups tuned via grid search cross validation (GSCV). Based on the training set, the network hyper-parameters, including the number of neurons, activation functions, learning rate, mini-batch size, iteration number, and network optimiser, are tuned with five-fold cross validation. That is, 20% of the training data is held out in turn as a validation set for evaluating the average performance of a specific ANN setup. Based on the GSCV, the ANN with the optimised network configuration can be determined and further applied to unseen data for testing. Specifically, the number of neurons in the hidden layers ( to ) is 32, 64, 16, and 8. Among different activation functions, the hyperbolic tangent activation function (tanh) is found to be the most suitable for each hidden layer, which enables the network to capture the nonlinear relationships between the vibration-based input parameters and the bearing fault severity output. The output layer utilises five neurons with the softmax activation function to generate probabilistic estimates across five severity levels: healthy, minor, medium, high and severe.
Figure 6.
The ANN architecture (after hyper-parameter tuning) for estimating bearing fault severity levels using FCF-based input parameters.
To ensure the generalisation performance of the network, the dataset is randomly split into the training set (64%), validation set (16%), and testing set (20%). The ML model is fitted on the training set with a loss function to gauge its learning progress. The performance on the validation set provides a basis for determining the end of training and fine-tuning hyper-parameters. The testing set is used to evaluate the generalisation performance of the learned network on new data samples. During training, the loss function based on the categorical cross-entropy is utilised to measure classification performance. The weights and biases of the network are adjusted through error backpropagation with the mini-batch gradient descent algorithm for minimising the classification error. After hyper-parameter tuning, the adaptive momentum estimation (Adam) optimiser is used with a learning rate of 10−3 and a mini-batch size of 32. An early stopping strategy based on the minimum validation loss with a patience of 200 iterations without improvement is used to stop the training and avoid overfitting. For performance assessment, an accuracy metric based on the recall rate is used against costly false negatives (e.g., any undetected faults), ensuring estimation robustness across different fault severity levels, as given by the following equation:
where is the number of correct classifications and is the number of total samples.
On the above basis, the trained ANN model with the optimised network parameters could be applied to new testing data under the same operational conditions for fault severity estimation. For other operational conditions or different bearing rigs, the same implementation procedure applies with the same ANN model and input parameters.
3. Experimental Rig and Bearing Defect Samples
The proposed method is further validated using measured vibration data from a roller bearing test rig. A series of bearing fault scenarios with varying defect sizes are developed. Here, the specifications of the bearing rig and the conducted vibration experiments are discussed. The classification criteria of bearing fault severity are provided based on the area of the defect.
3.1. Experimental Rig
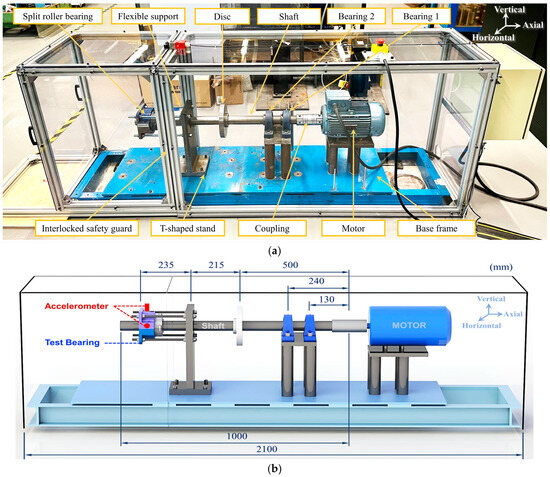
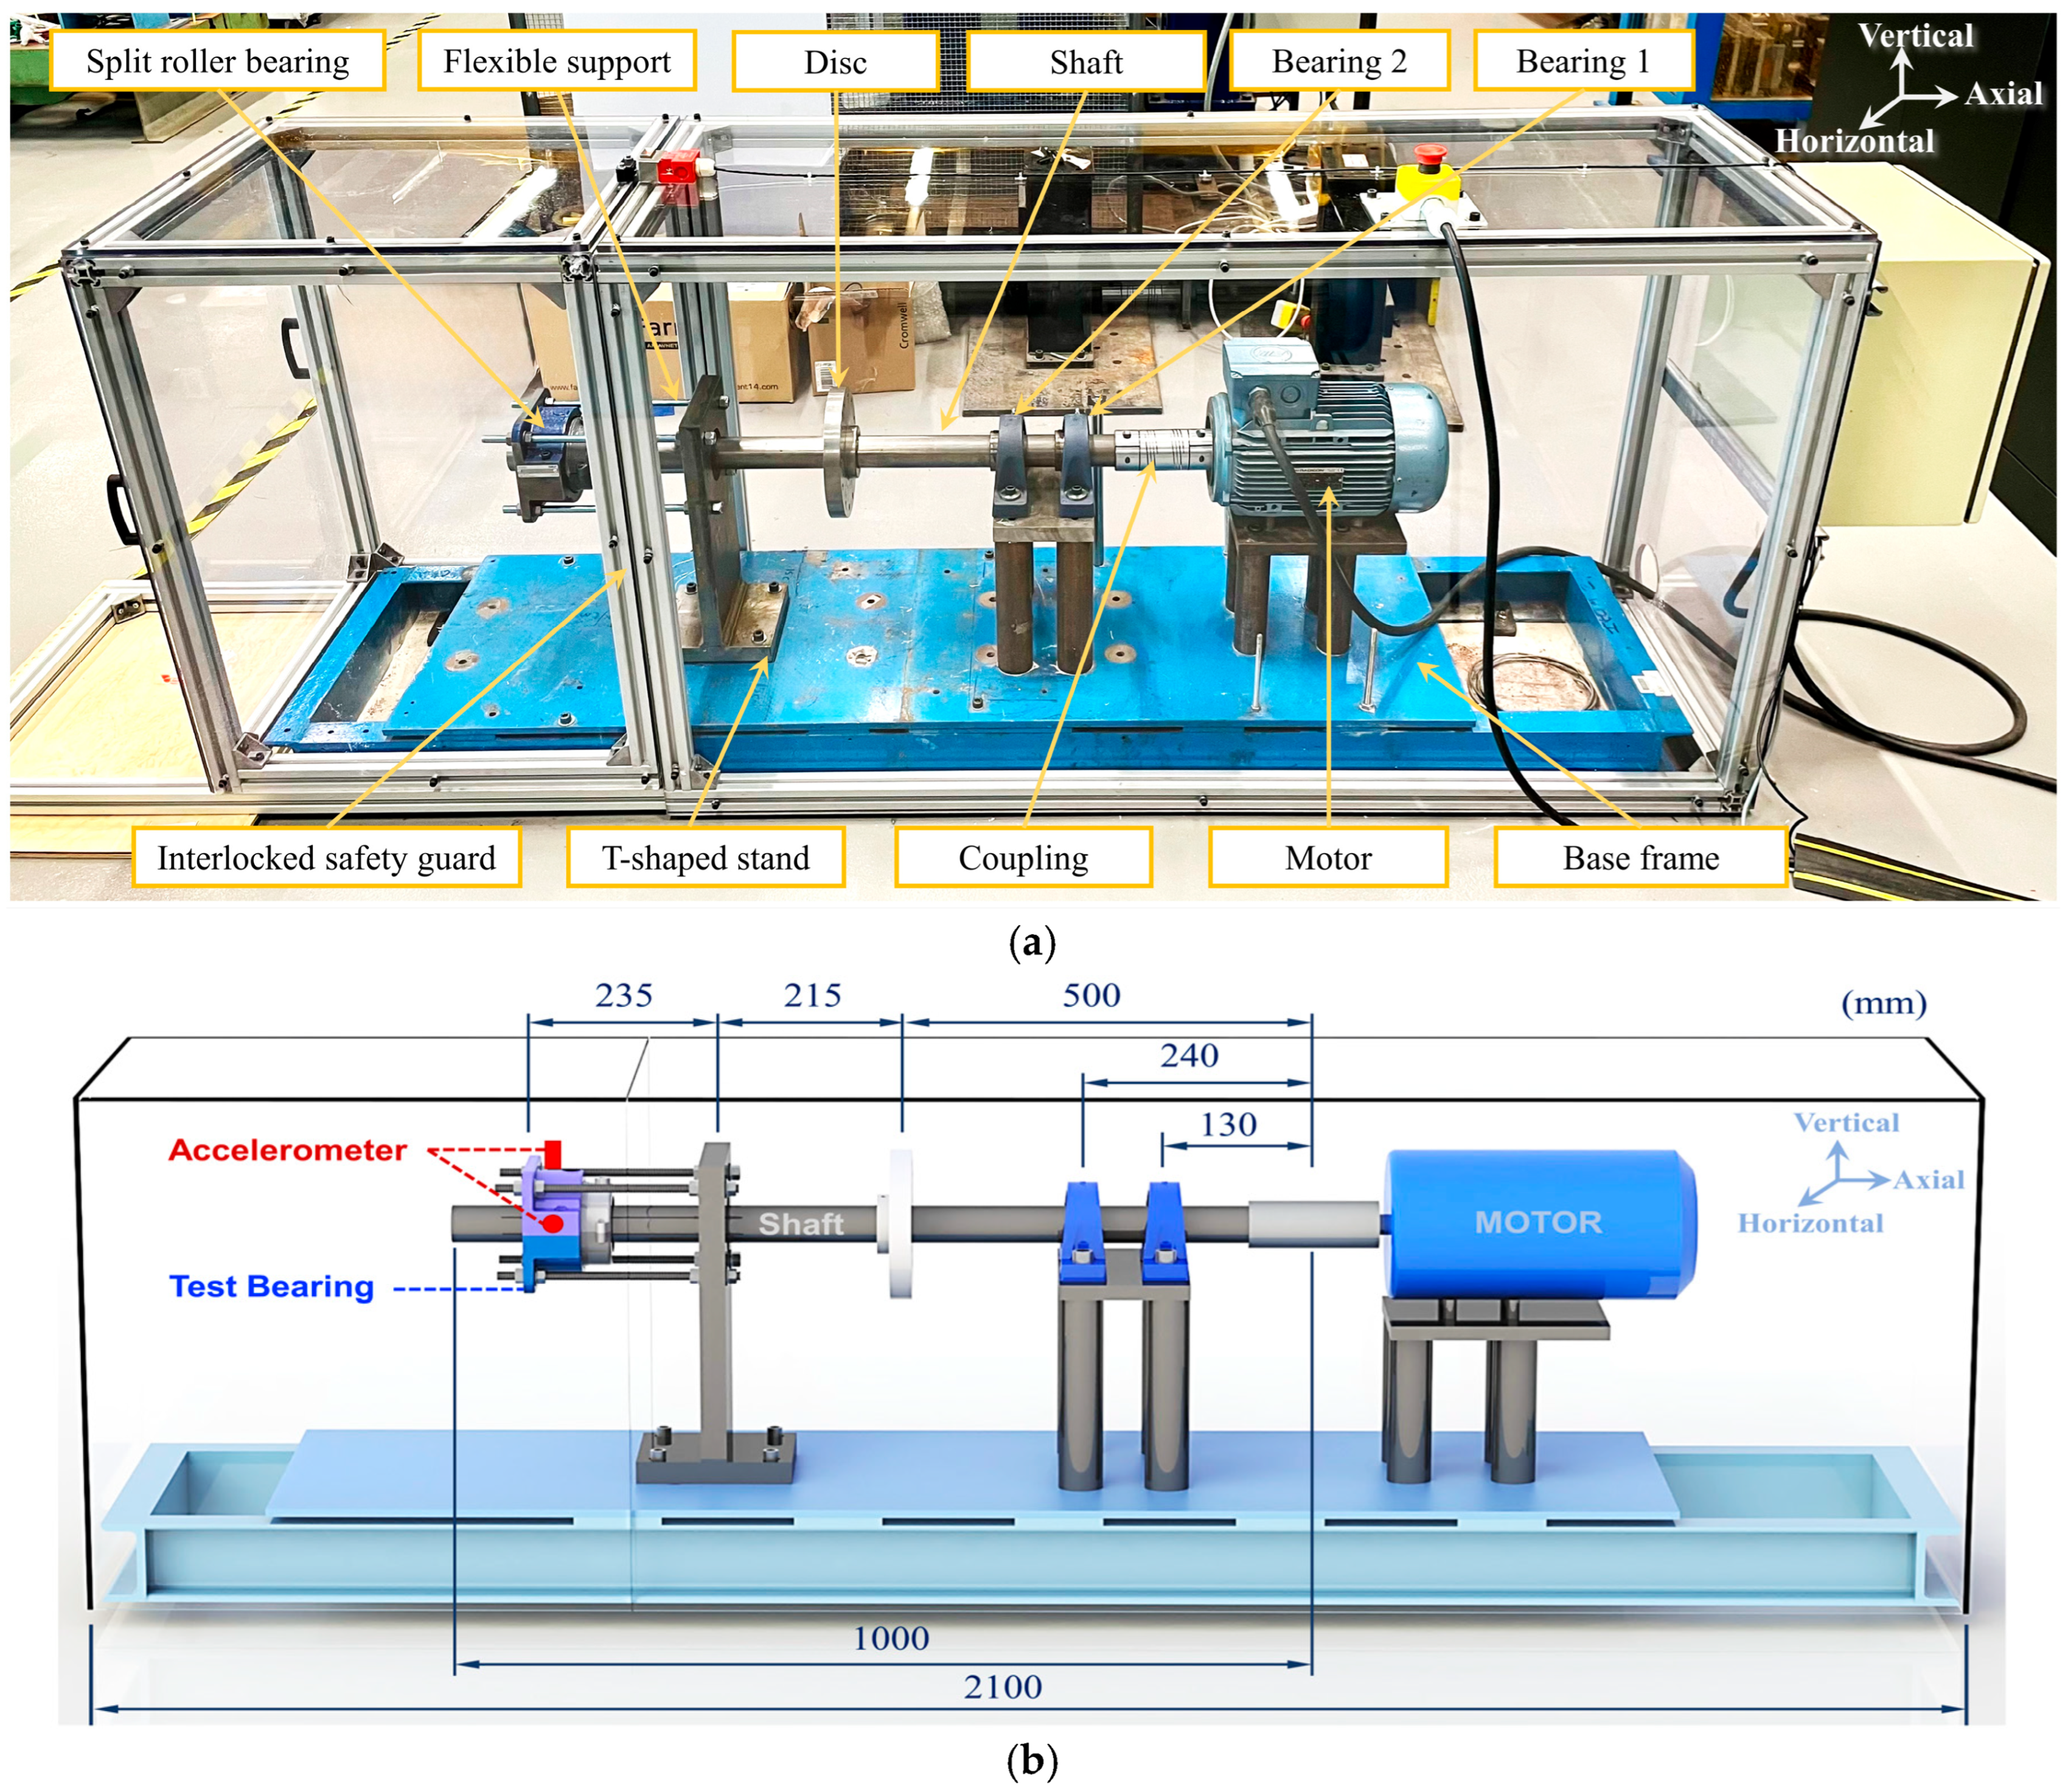
The experimental bearing rig developed by the Dynamics Lab of the University of Manchester is used for model validation [27]. As shown in Figure 7a, the rig mainly consists of a steel shaft (50 mm in diameter), an induction motor drive, two support bearings, a balancing disc, and a test bearing with a square flange housing and flexible support. For vibration testing, the test bearing utilises a split roller bearing for ease in rig assembly and developing multiple defect scenarios at various severity levels. The operation speed of the bearing rig can be controlled using a variable frequency drive. The acceleration vibration signals of the test bearing are measured from the accelerometers mounted on the bearing housing using studs, as shown in Figure 7b. The accelerometers have a sensitivity of 100 mV/g and a frequency range of up to 10 kHz is used here.
Figure 7.
The experimental rig with a split roller bearing [27] used for developing multiple bearing fault scenarios at various severity levels: (a) mechanical setup; (b) a schematic diagram specifying rig dimensions and sensor locations for vibration testing.
3.2. The Test Bearing and Defects of Various Severities
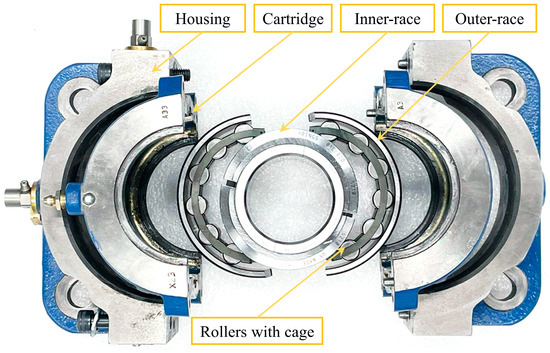
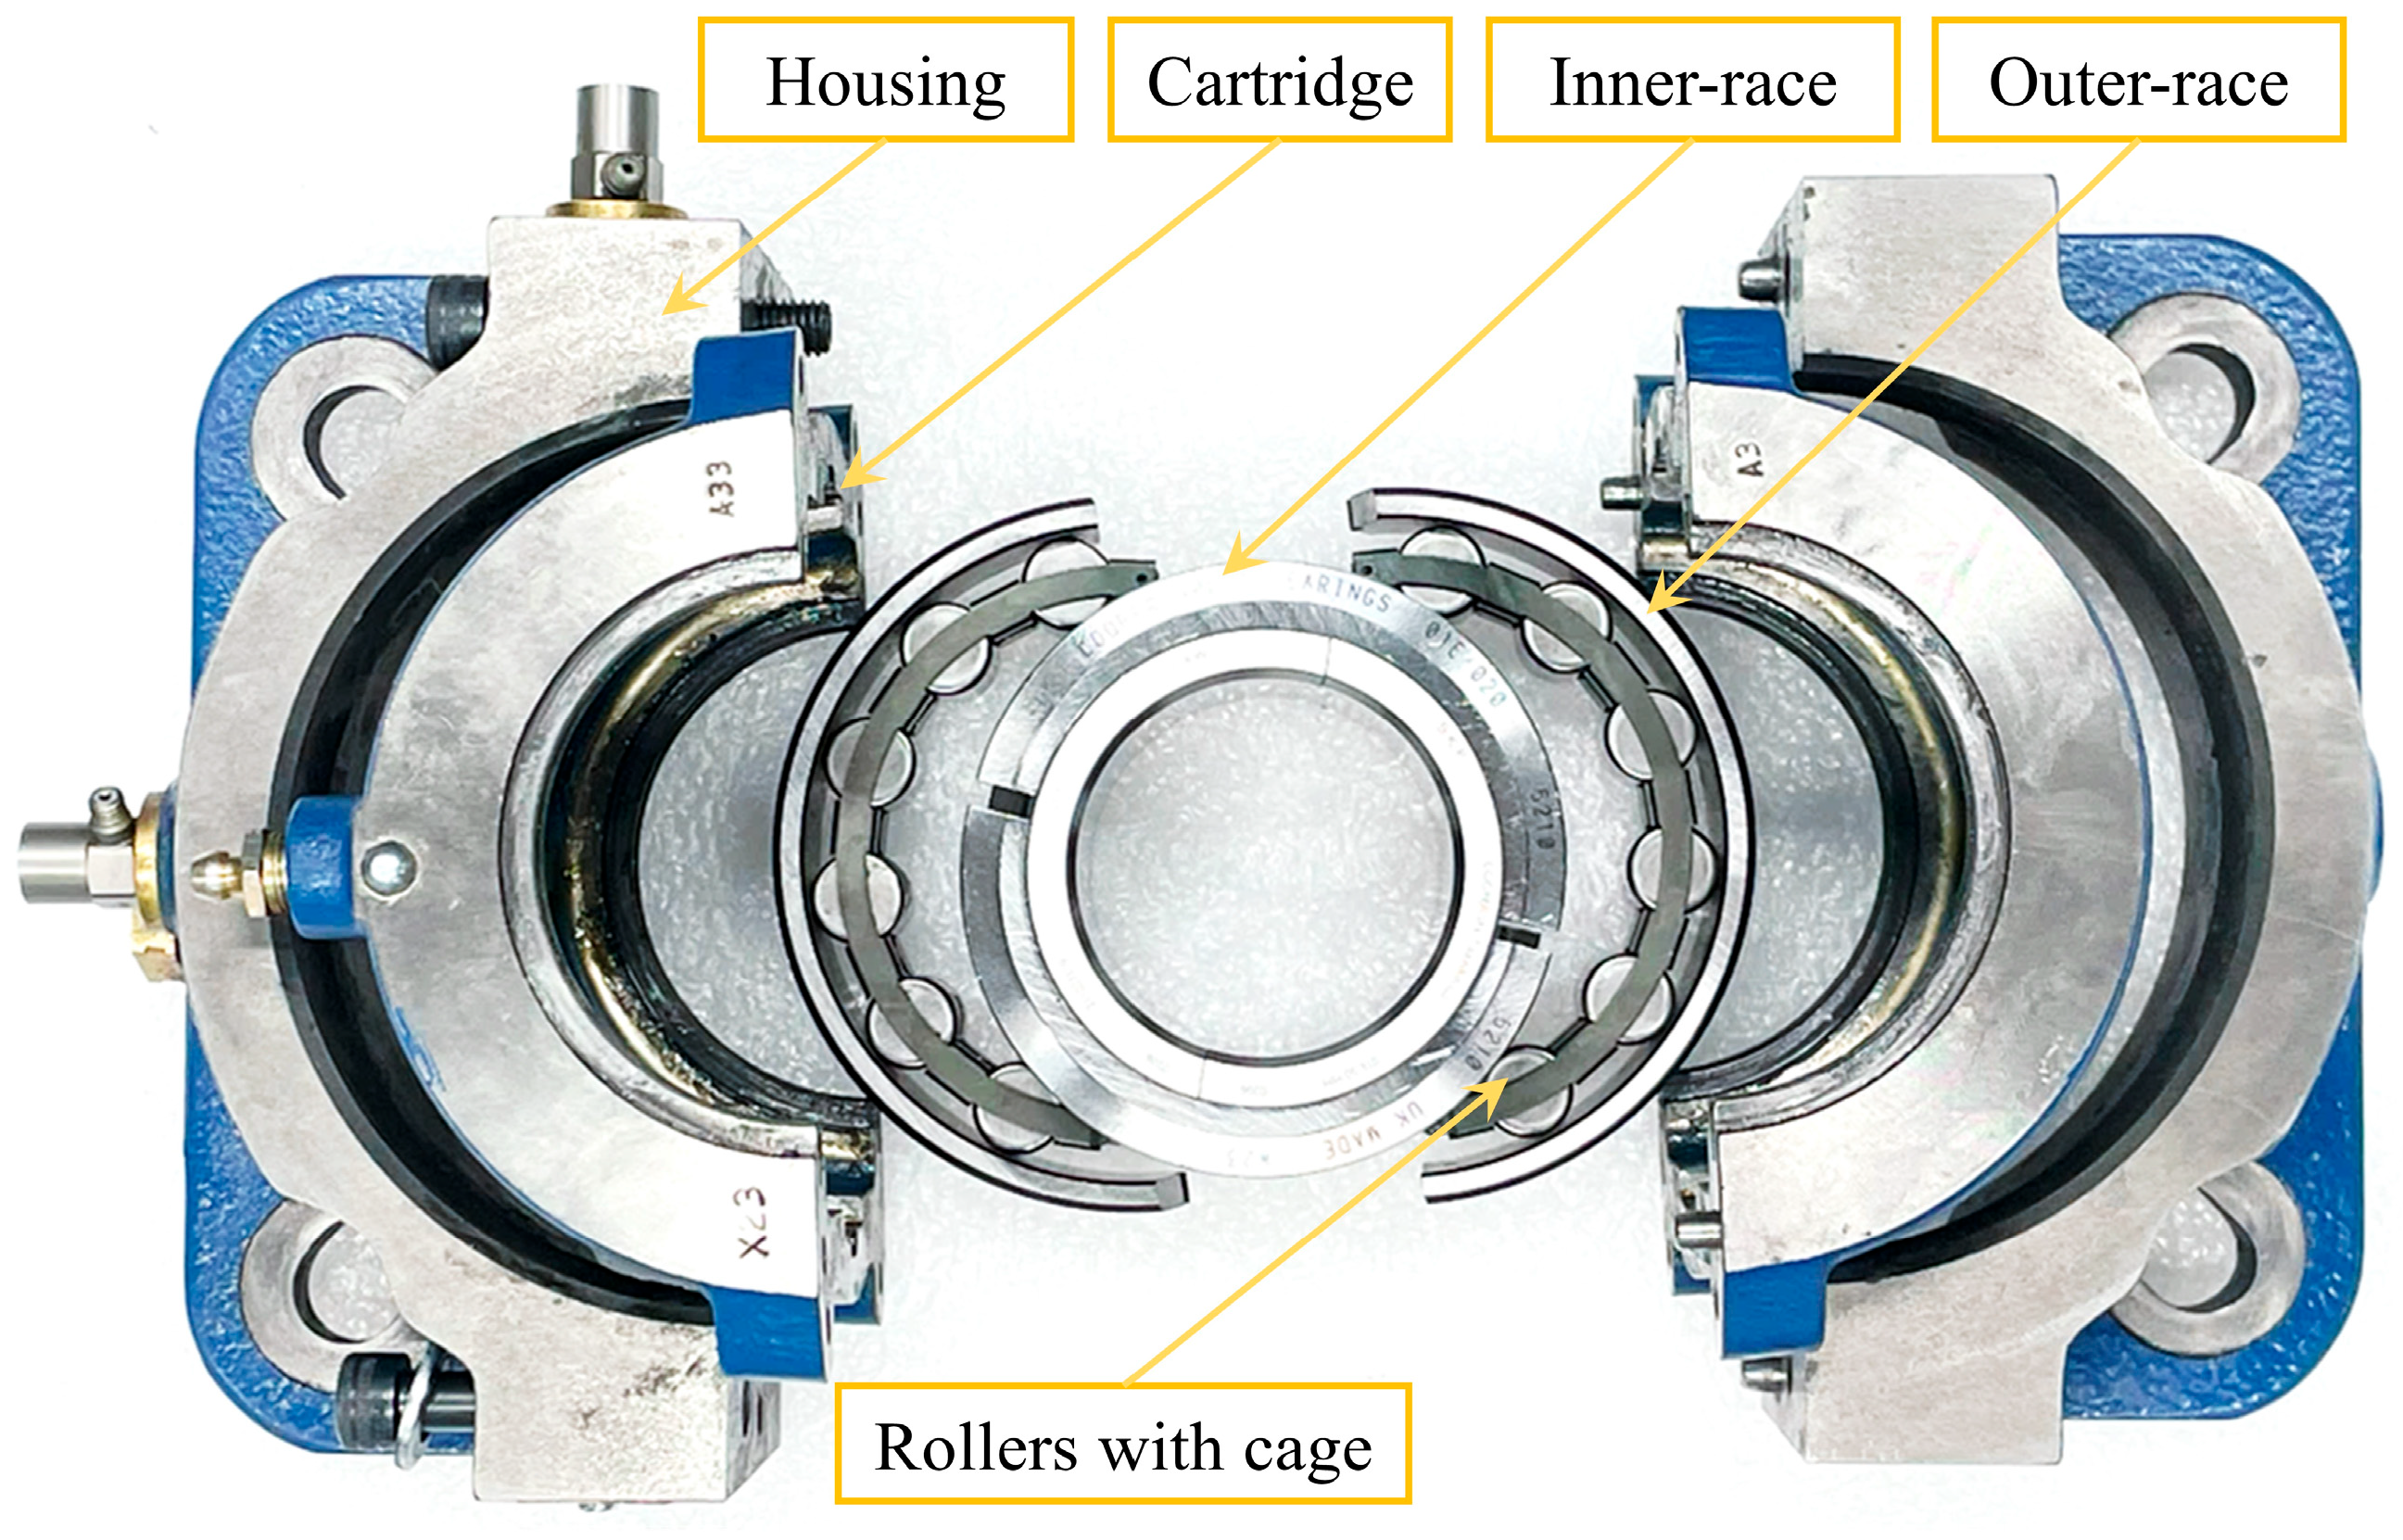
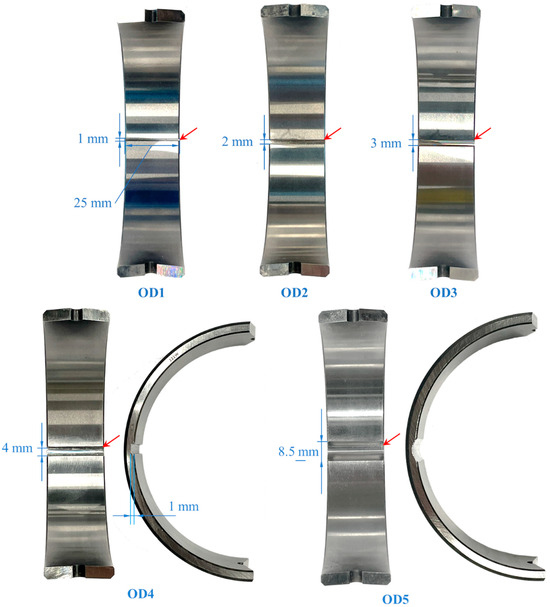
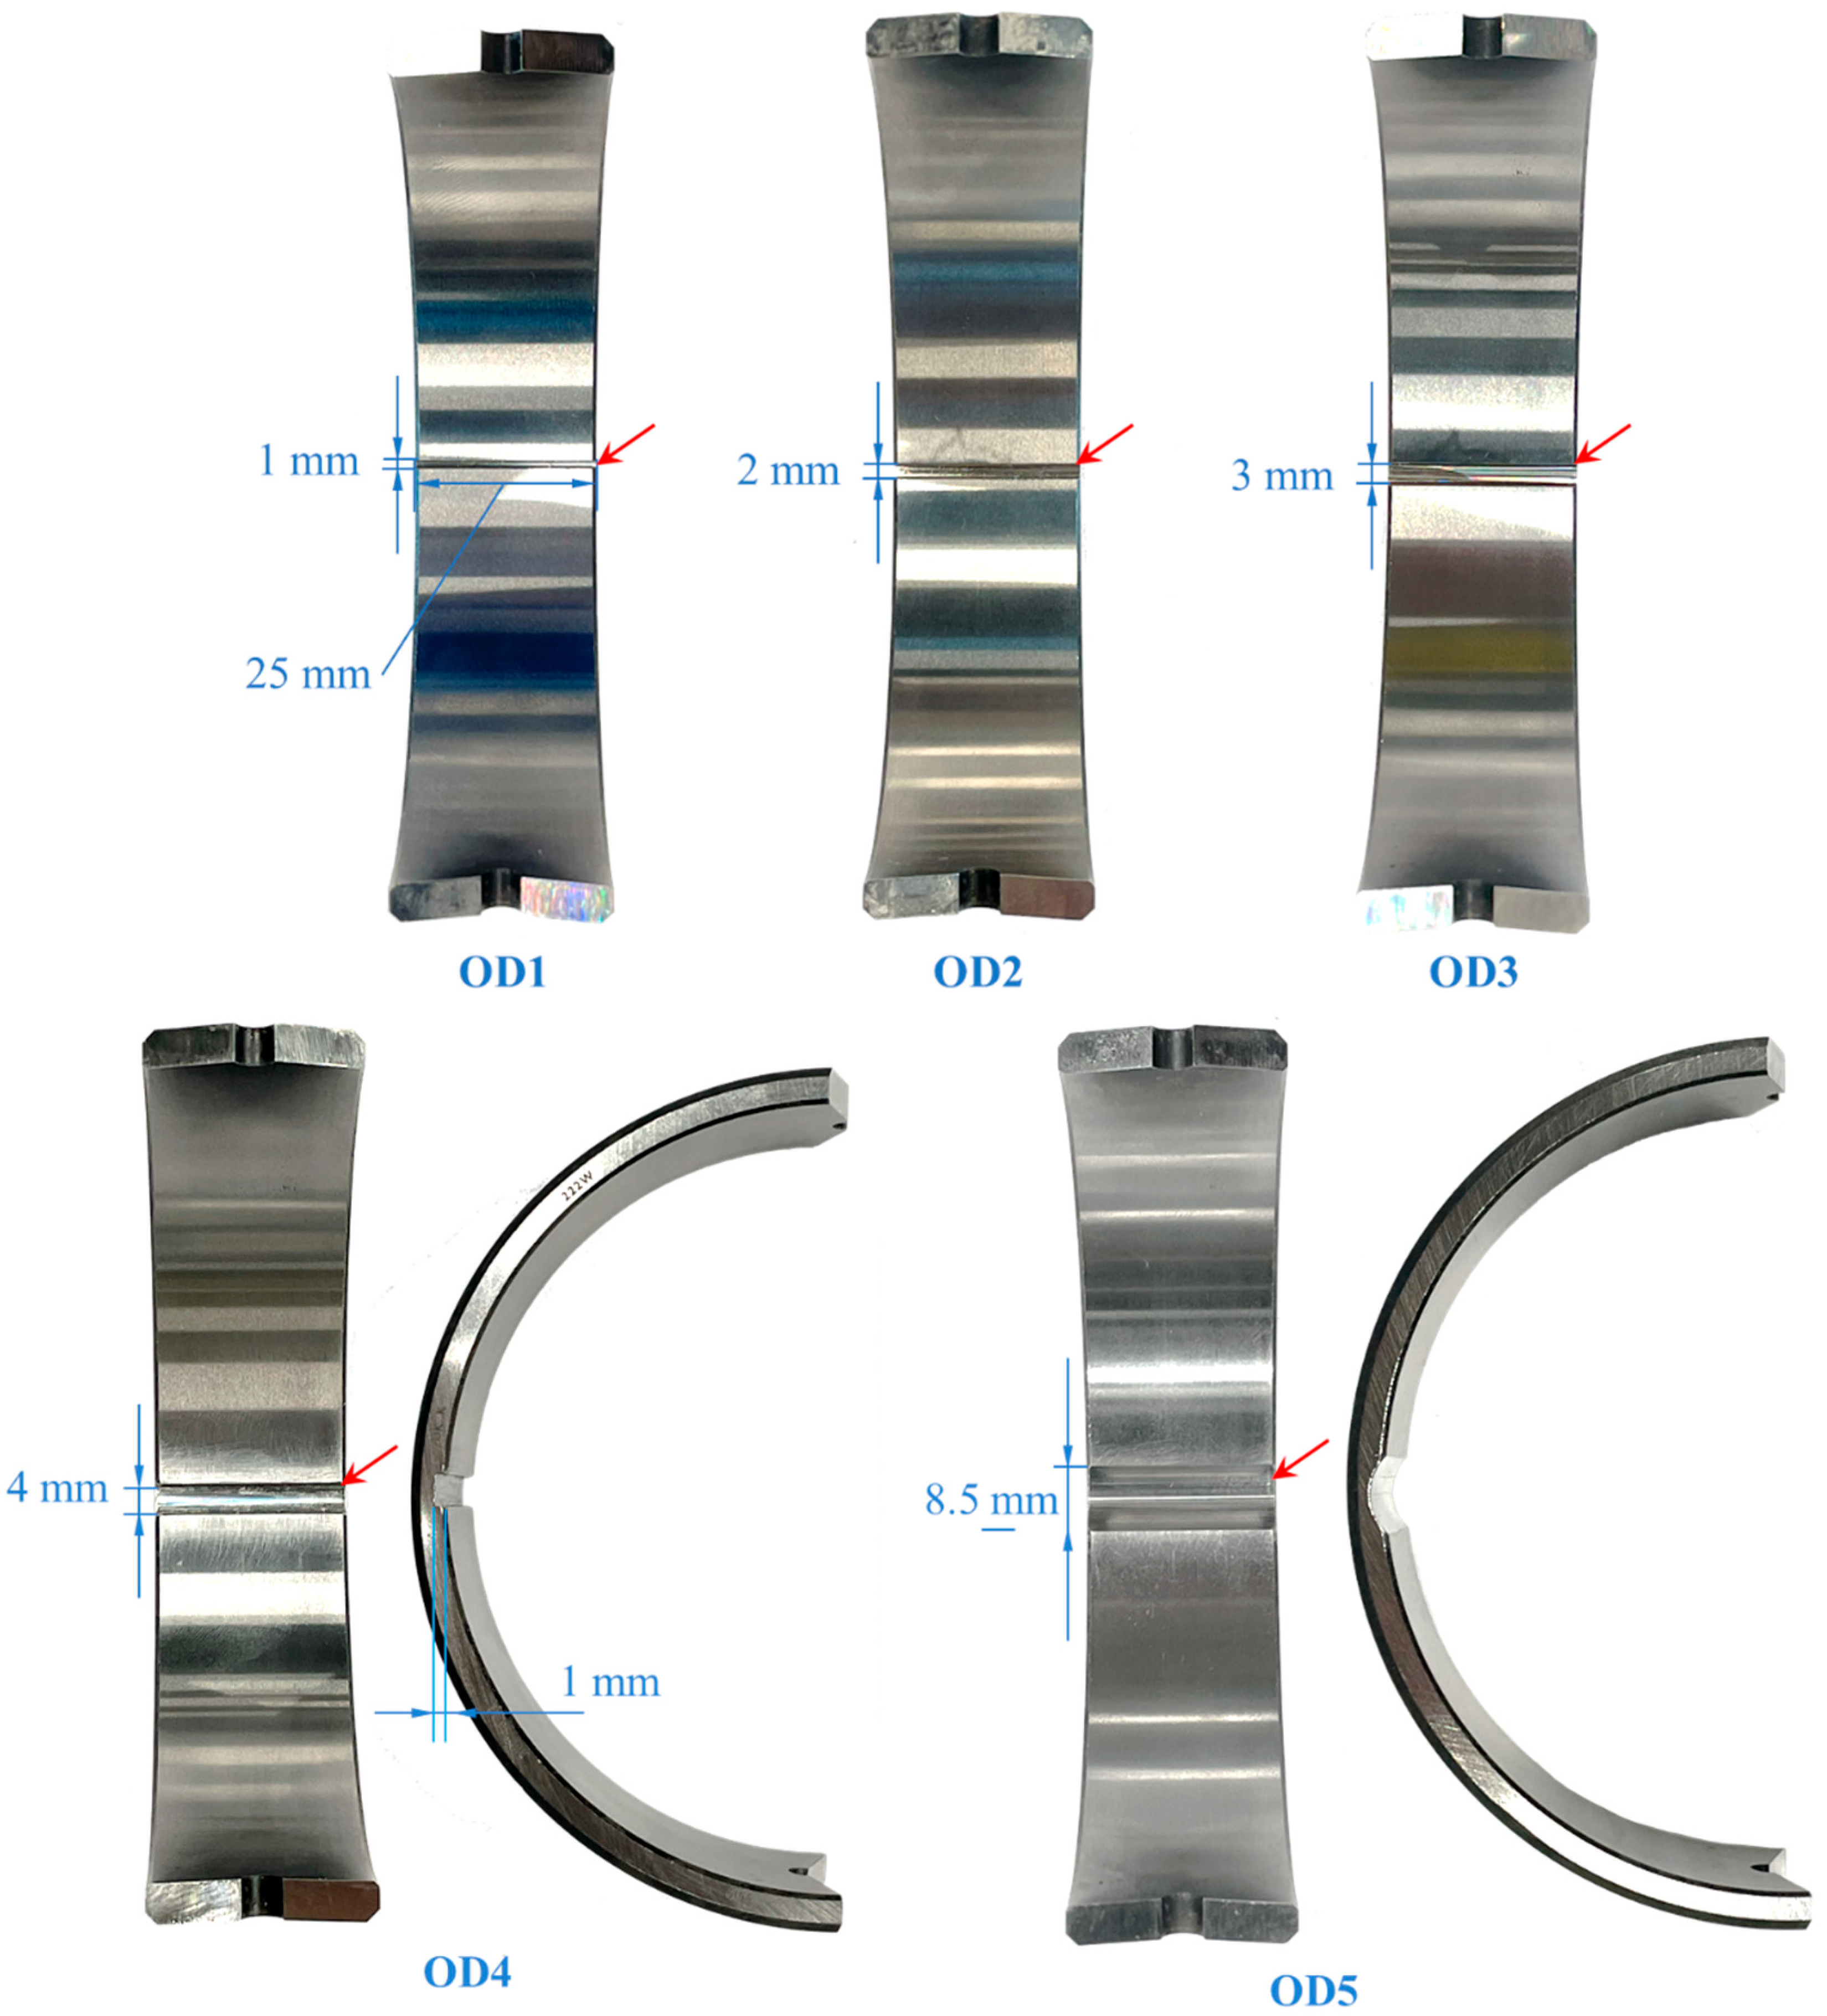
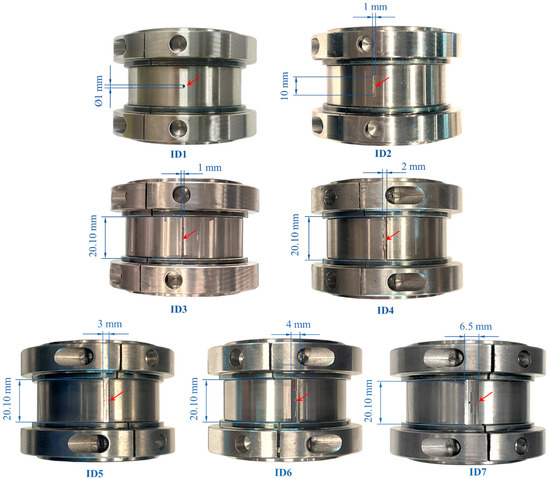
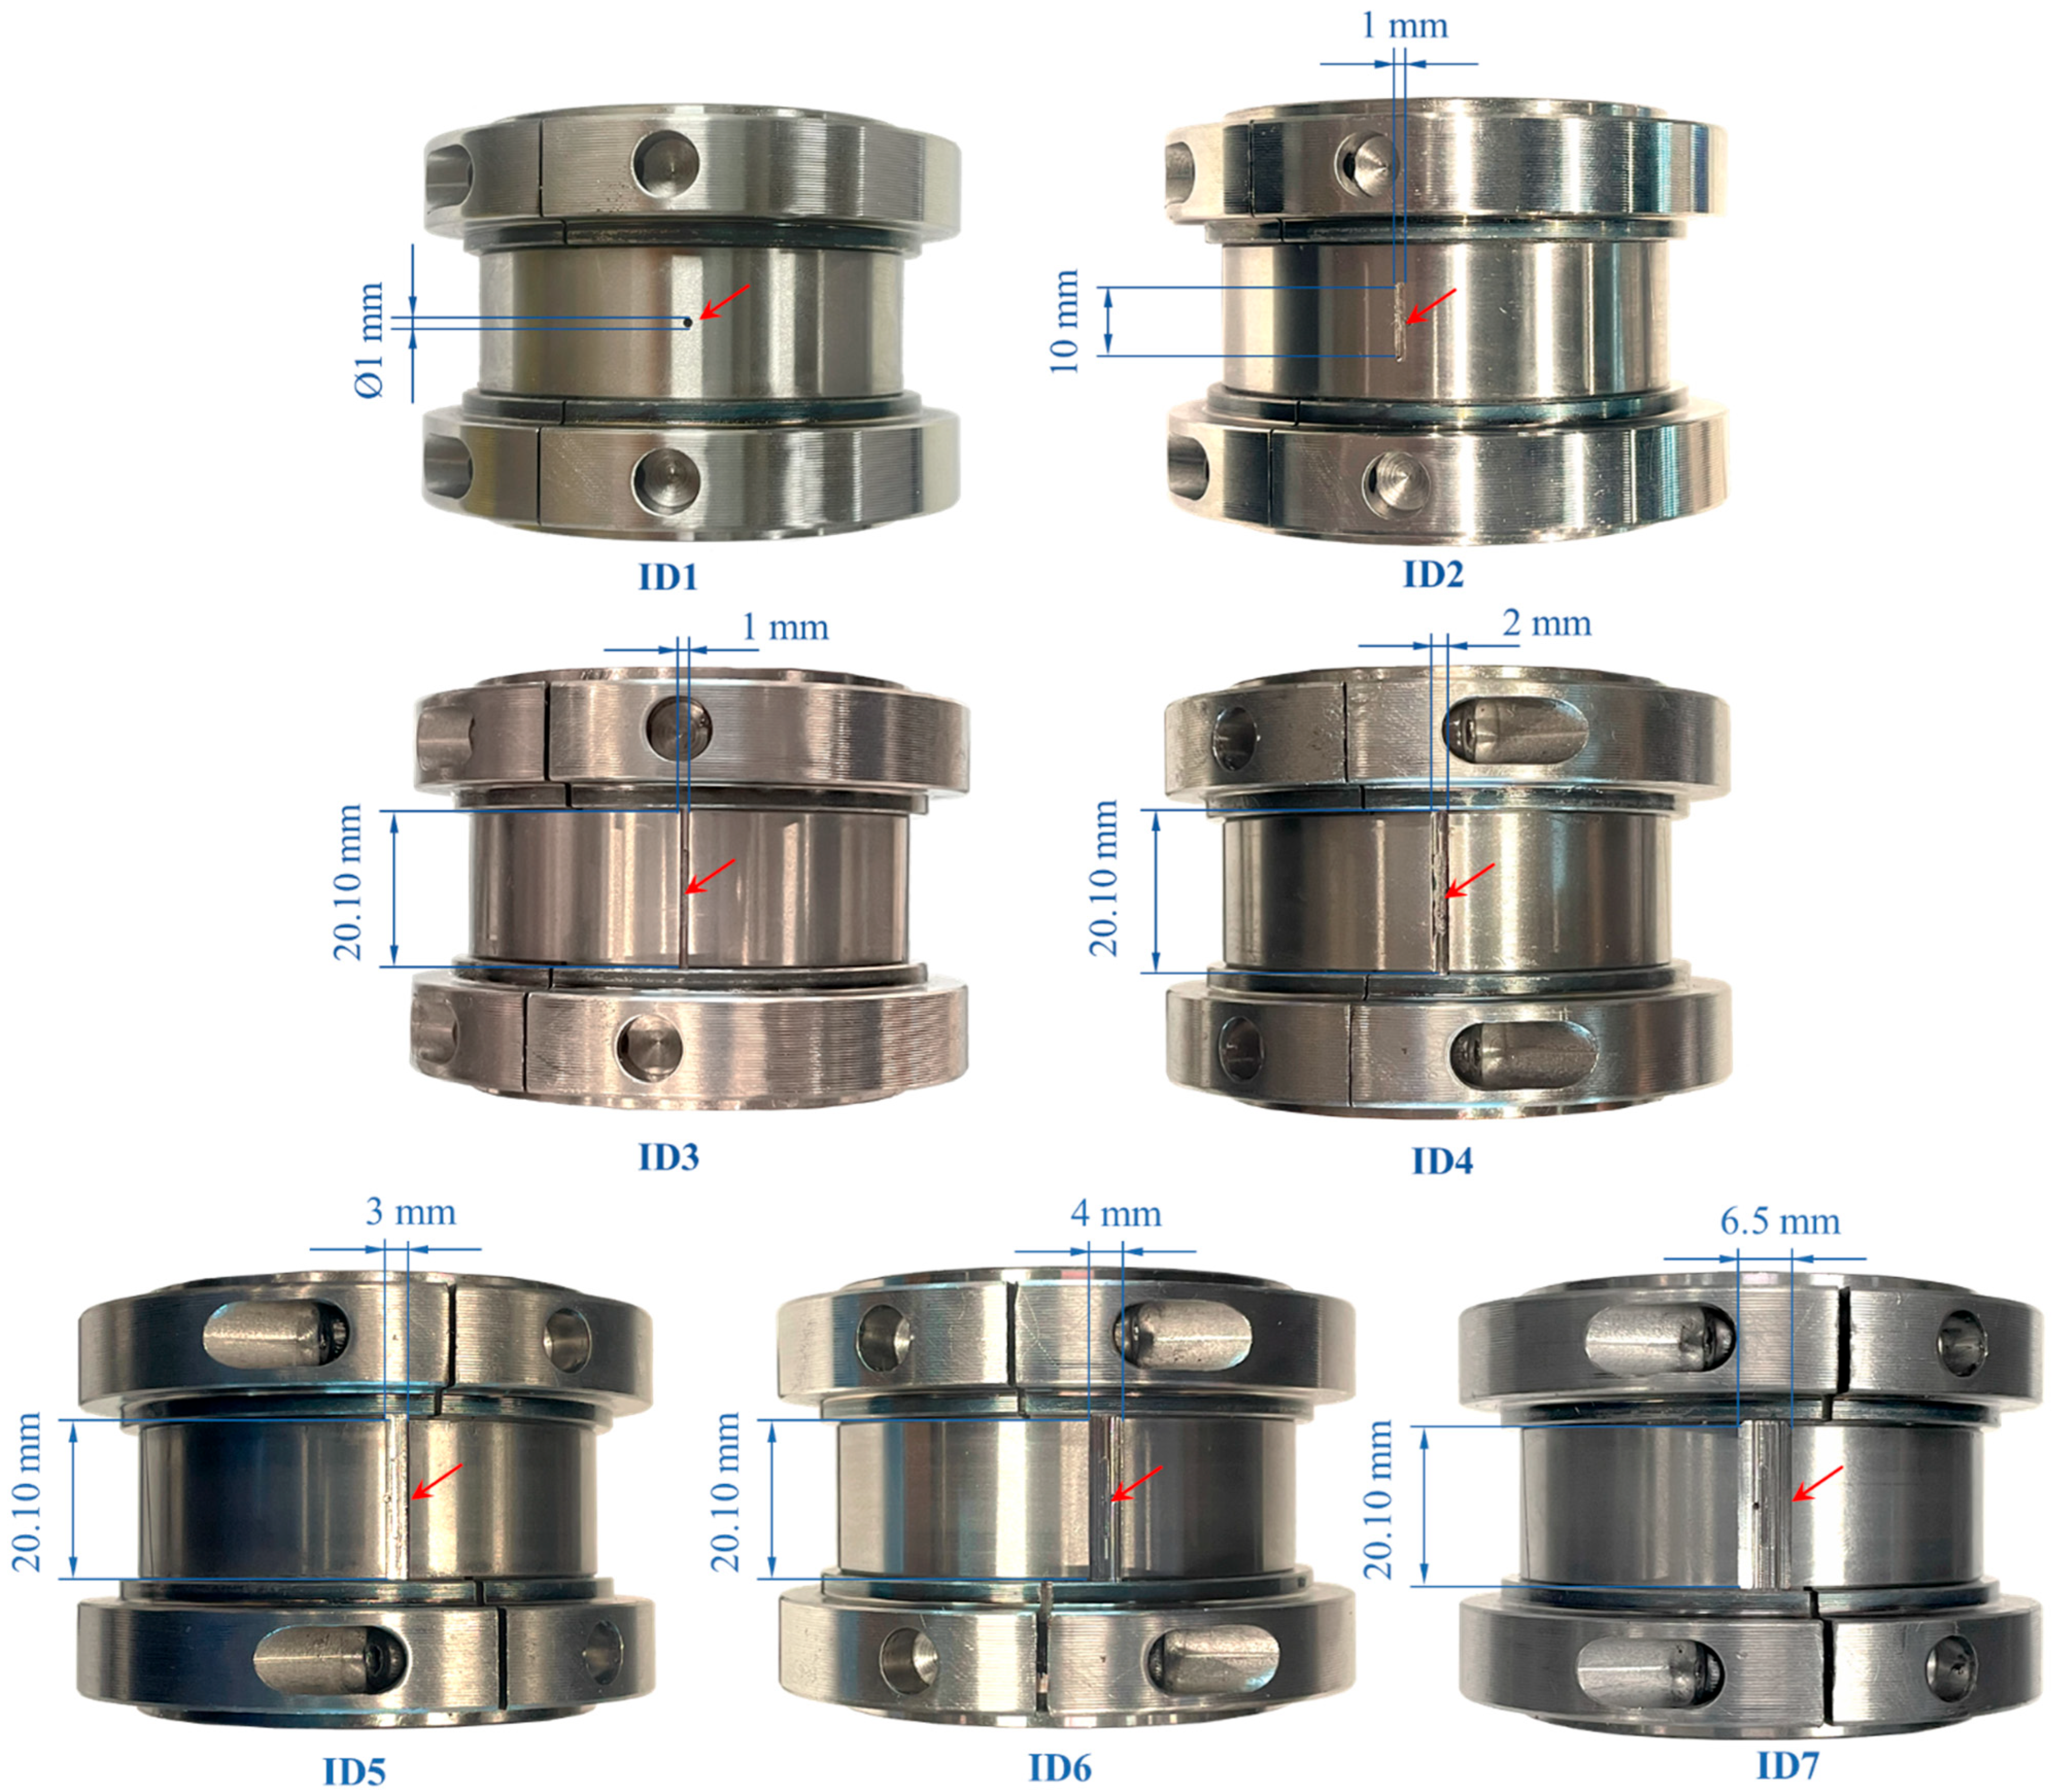
As shown in Figure 8 [27], the test bearing consists of the inner race, outer race, rollers and cages held by a cartridge and a square flange housing. To simulate bearing defects of various severities, a series of defects are designed on different bearing components. A total of 22 experiments listed in Table 2 are conducted regarding different defect scenarios, which are generated via computer numerical controlled (CNC) milling. These 22 experiments with healthy and different defect scenarios and severities are purposefully designed for this study. The location and dimension of each defect are also specified in Table 2. The physical specifications of the roller defects, outer-race defects, and inner-race defects are further presented in Figure 9, Figure 10 and Figure 11. Regarding the defect shape, a line defect refers to a rectangular straight slot on the bearing component, while a widened defect with smooth edges is denoted as a smooth defect, as shown in Figure 10. The experimentally simulated defects may or may not observed in the natural defection propagation in a bearing during machine normal operation. While the current experiments include defects in individual bearing components and their combinations such that the study could evaluate all possible combinations of defects. In reality, even with irregular shapes, varying orientations, and different propagation patterns of defects in different components of a bearing, the total defective surface area is expected to represent the proposed severity levels. One can define its own bearing severity levels or limits based on practical applications.
Figure 8.
The test bearing and its splitable components [27].
Table 2.
The specifications of different bearing defect scenarios.
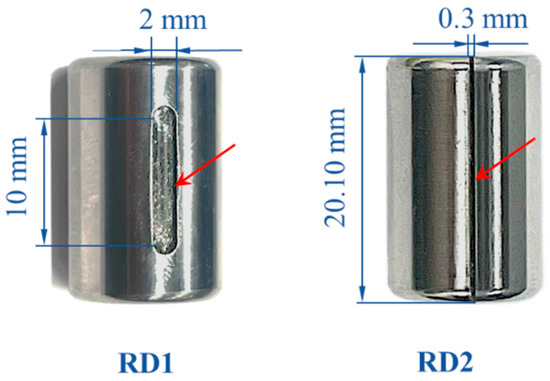
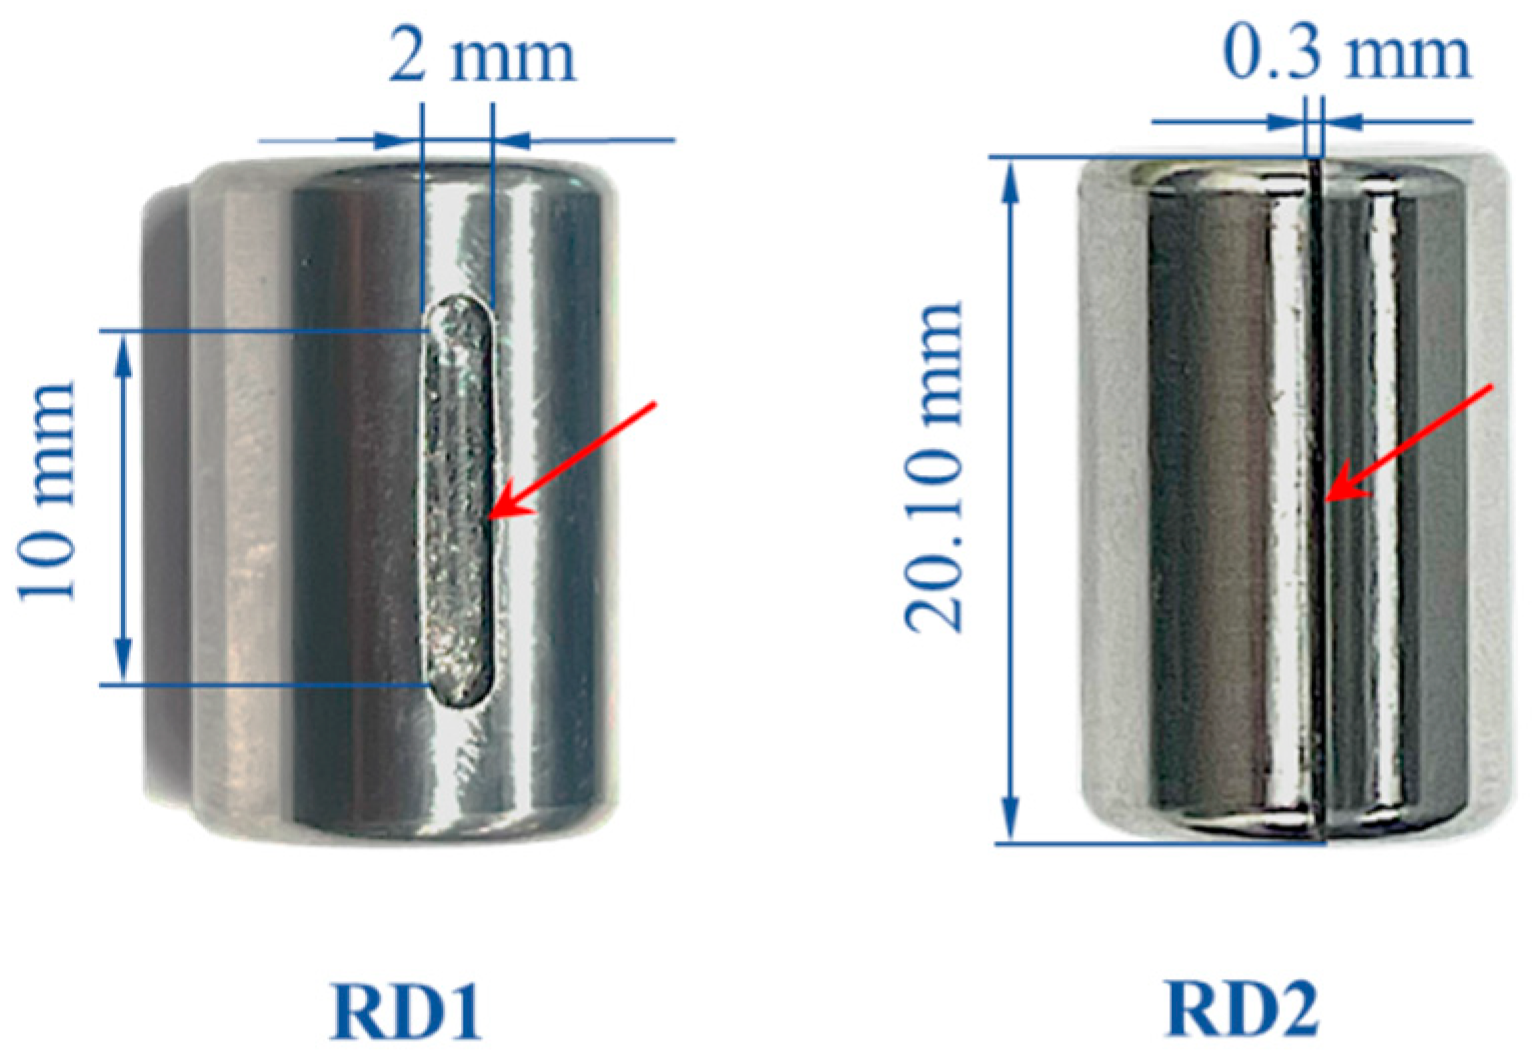
Figure 9.
Roller defects (as marked by red arrows).
Figure 10.
Outer-race defects (as marked by red arrows).
Figure 11.
Inner-race defects (as marked by red arrows).
For demonstration purposes, the bearing defects are classified into five severity levels according to the surface areas of the defects, as shown in Table 3. Note that if the presence of a defect in the bearing does not affect its rotor dynamic behaviour and does not cause any metal-to-metal impact which excites resonance of the bearing assembly, then the bearing is considered to be healthy [2,27]. Such defects are expected to be independent of applied loads, multi-shaft assembly, machine speeds, etc. In this situation, the surface-to-surface contact among inner race, rollers, and outer race does not generate metal-to-metal (MtM) impulsive loads during shaft rotation with the bearing assembly, and therefore it does not cause bearing resonance. Hence, the bearing defect frequencies are not excited and there is no amplitude modulation within the bearing resonance frequency band [2,27]. This is also evident when such defects are tested under different rotor unbalance conditions, shaft misalignments and at five different speeds under balance disc loads and bearing self-loads [27]. Therefore, the machine performance is not impacted by such bearing defects. This is typically observed for roller bearings and hence roller bearings are typically suitable for heavy duty machinery. This is the reason why the roller defect RD1 and inner-race defects ID1 and ID2 are considered healthy in Table 3. These cases may not have an impact on the required function of the bearing. They are further validated in the earlier study [27] and are also shown in Section 4.2. Therefore, these cases are considered as “healthy with zero defect area”. This highlights the importance of rotor dynamics theory on vibration-based bearing fault detection for any machines [2]. Here, the dataset is divided into five severity categories for the development of the ML model. However, the classification entirely depends upon industry requirements and can be redefined for their own purposes.
Table 3.
Classification of the defects into five severity levels.
The acceleration vibration signals are collected using a data acquisition module with a sampling rate of 25.6 kHz. Multiple vibration samples are collected, each lasting for 20 s. For each bearing defect scenario, multiple shaft rotation speeds were operated to capture vibration samples under different dynamics. Based on the shaft rotation speed and bearing geometry, the fault characteristic frequencies of different bearing defects can be calculated based on rotational dynamics using the kinematic equations [2], which are summarised in Table 4. Experimental data are extensively collected at three different rotating speeds such that the machine vibration behaviours are different; in this way, the proposed methodology can be tested and validated for various operating conditions.
Table 4.
Dimensions of the test bearing and the bearing fault characteristic frequencies based on the experimental shaft speed.
4. Envelope Analysis
This section presents the envelope spectra of different bearing fault severities. The bearing resonance band is first identified based on the hammer test to ensure effective demodulation in the envelope analysis. The envelope spectra of the vibration datasets measured under different operating conditions are examined. A non-monotonic pattern is observed in the FCF amplitudes across different bearing defect sizes.
4.1. Identification of Bearing Resonance Band
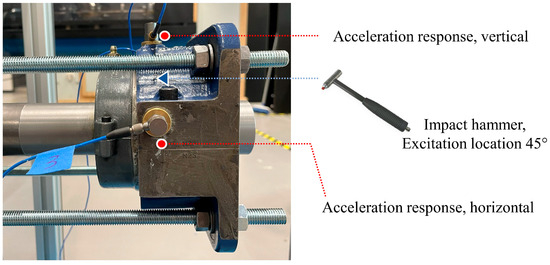
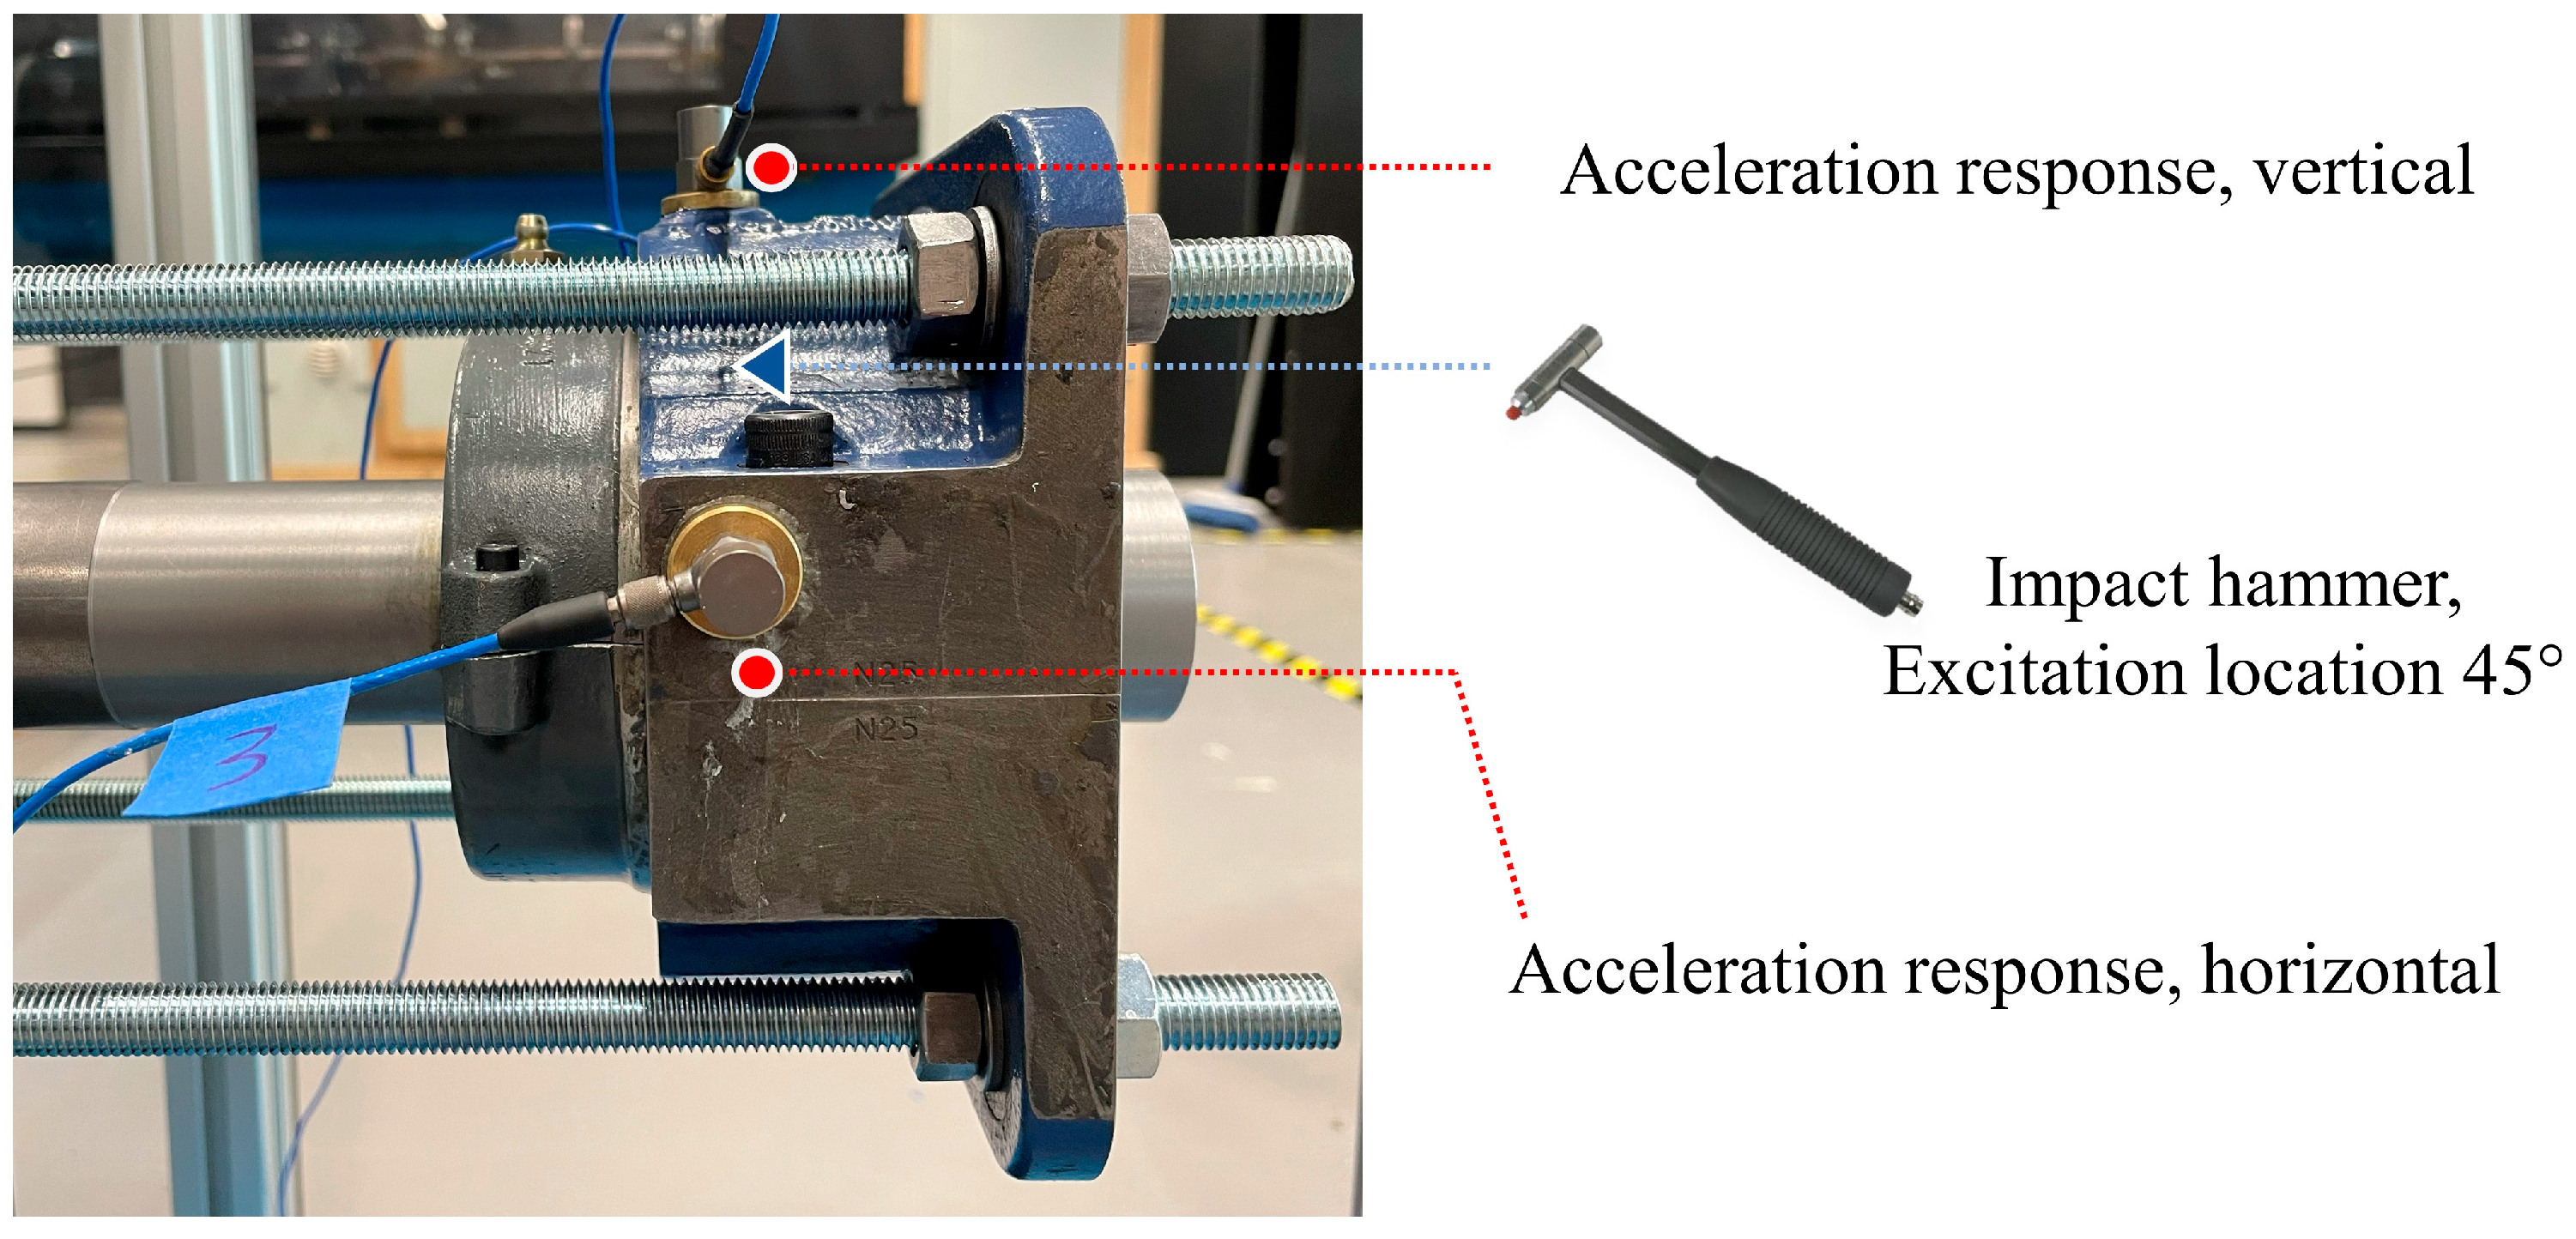
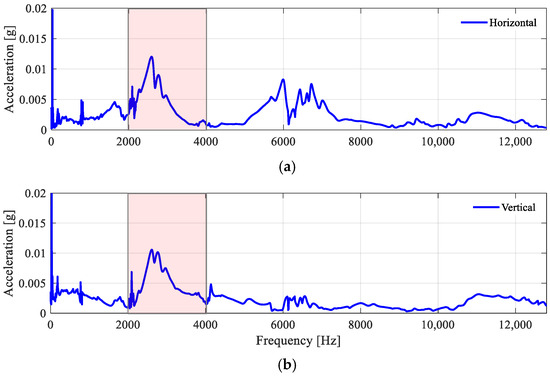
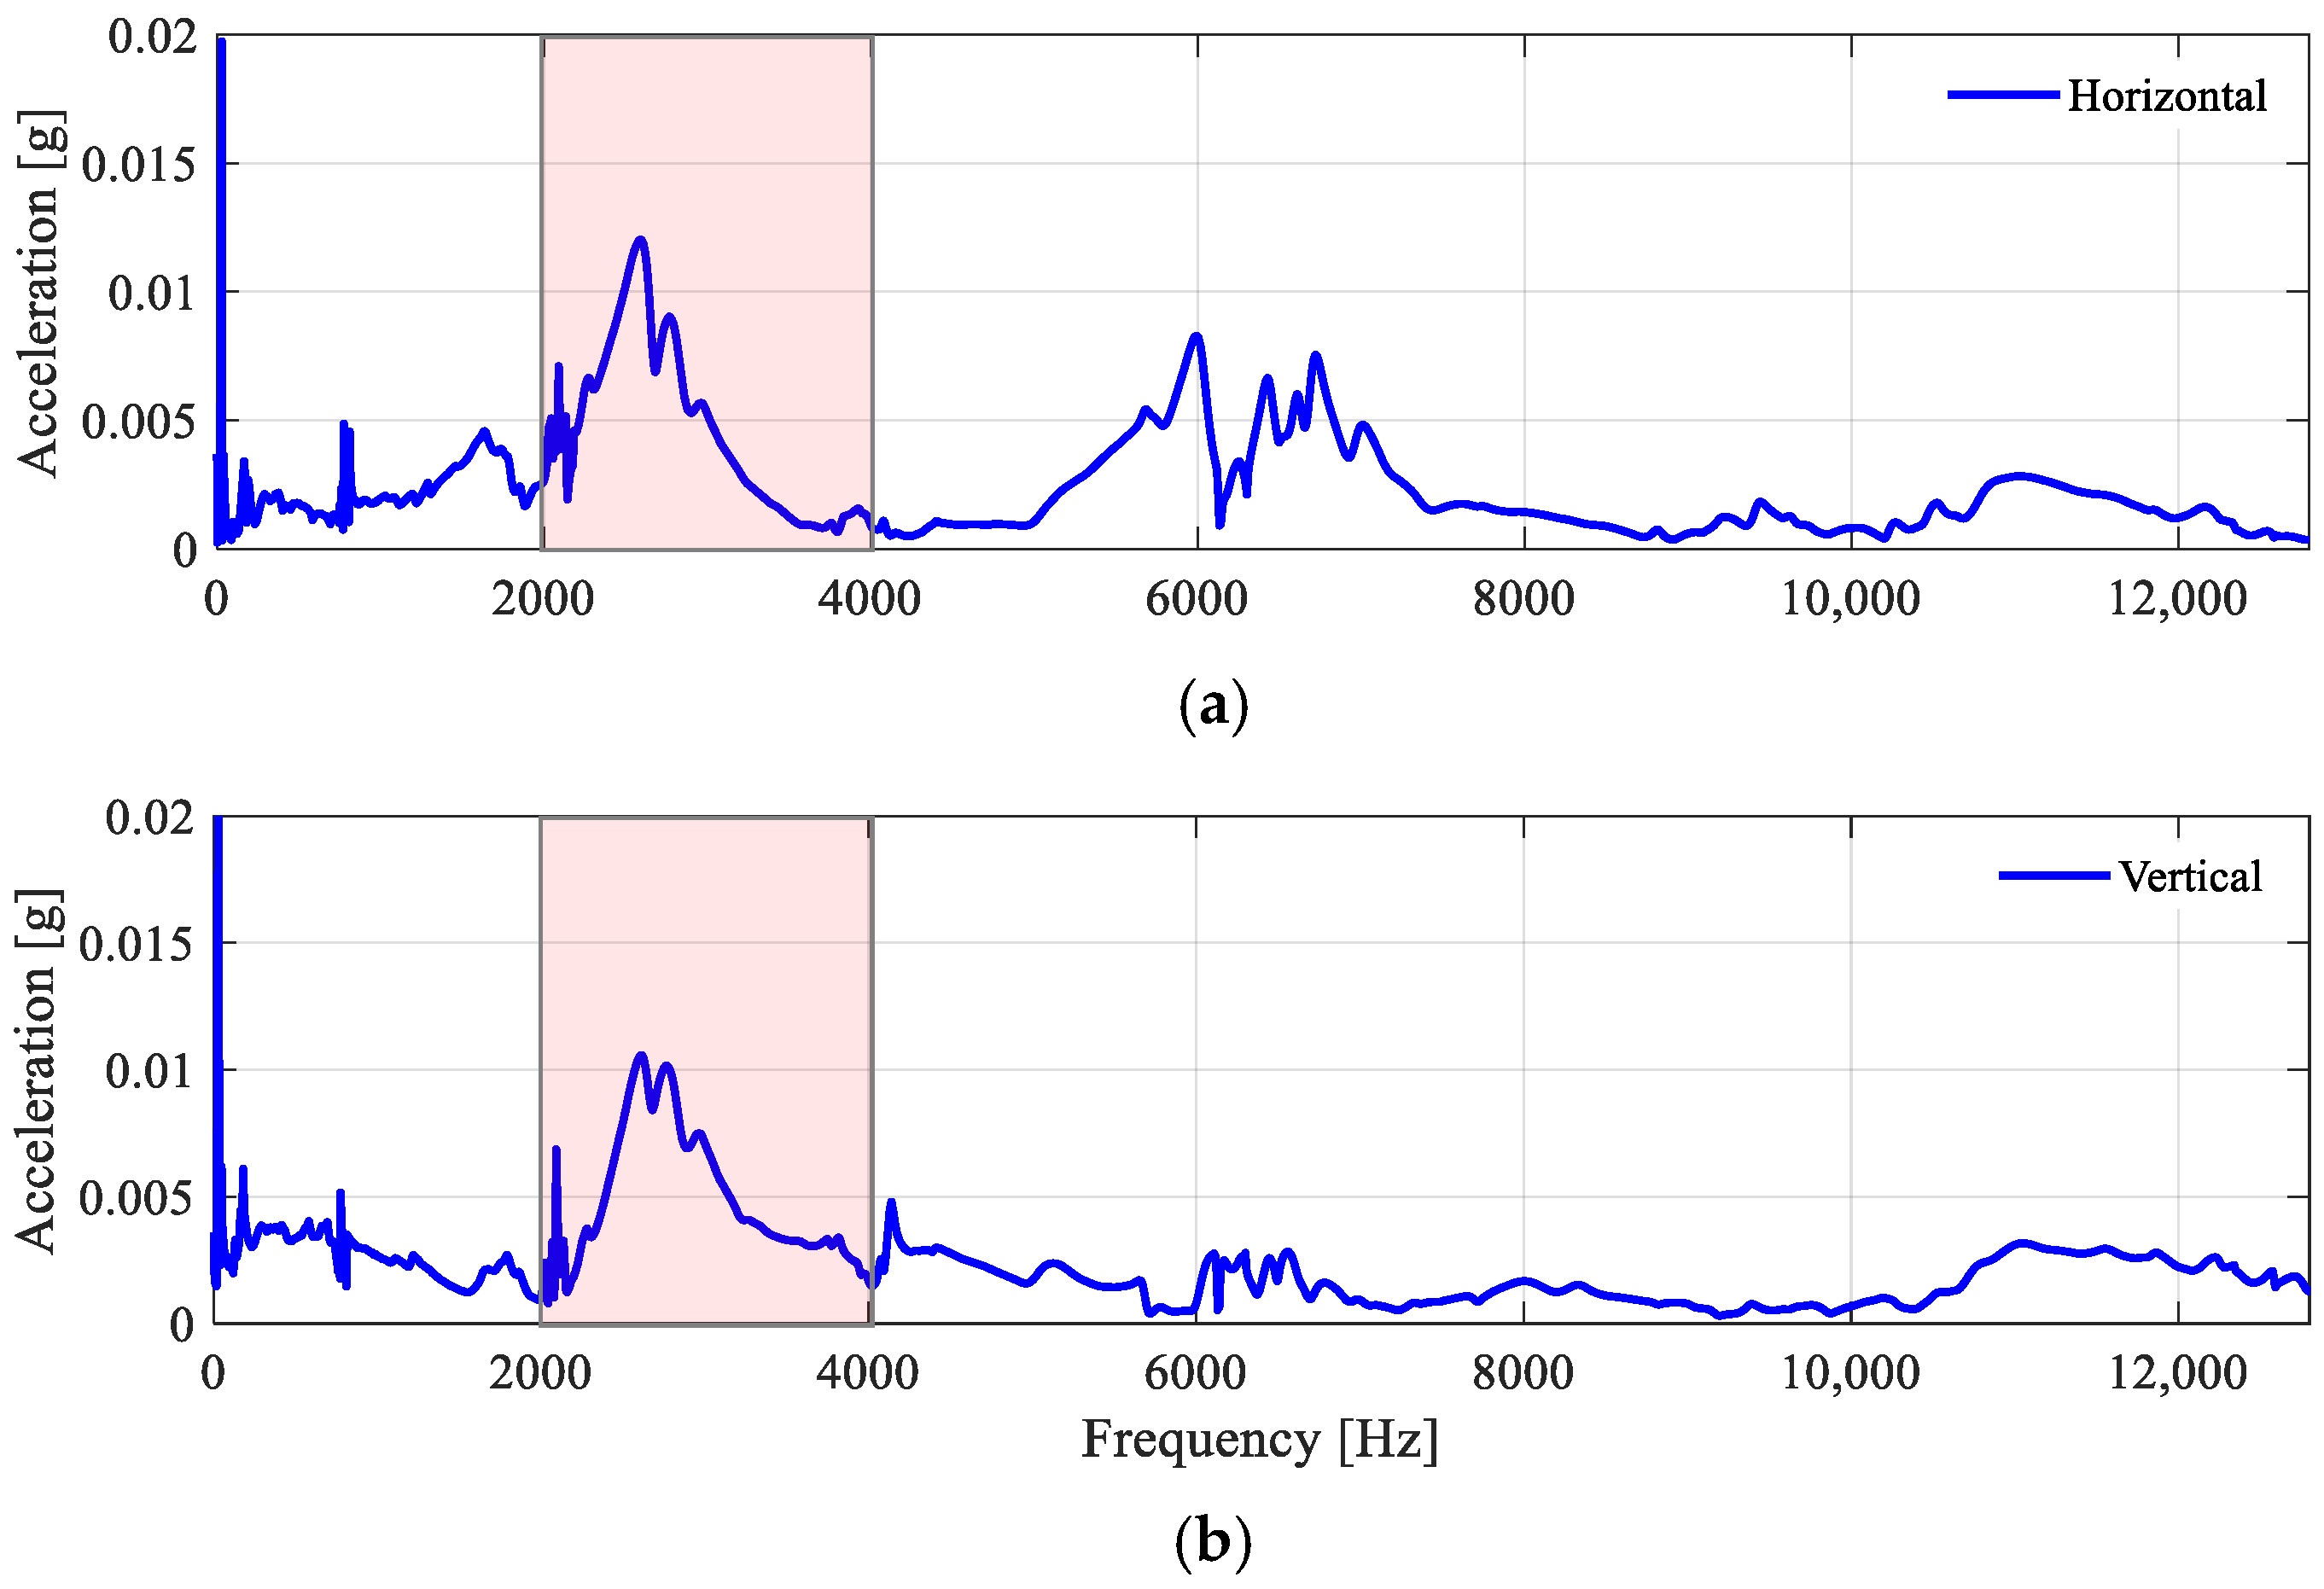
As a defect develops in an anti-friction bearing, the associated fault characteristic frequencies are often modulated with the resonance response of the bearing assembly. Thus, it is crucial to identify the bearing resonance bands for demodulating the vibration signals and detecting bearing faults. For this reason, a hammer test was conducted on the test bearing to determine the resonance frequency bands of the bearing assembly. As presented in Figure 12, the impact hammer with an in-built force transducer was used to impose external excitations on the bearing assembly. The vibration responses were measured using two accelerometers mounted on the flange housing from the vertical and horizontal directions. As shown in Figure 13, a common bearing resonance band from about 2 to 4 kHz can be determined from both acceleration spectra measured under hammer excitations.
Figure 12.
The impact hammer with an in-build force transducer and the accelerometers used to identify bearing resonance bands.
Figure 13.
Measured acceleration spectra of the bearing assembly when excited using the impact hammer, with a common bearing resonance band from 2 to 4 kHz in both directions (as marked in red): (a) horizontal; (b) vertical.
4.2. Envelope Spectra of Dataset 1
Based on the identified bearing resonance band, the envelope spectrum is computed for each vibration measurement to extract the defect-related parameters (bearing FCFs) as per Section 2.1. Figure 14, Figure 15 and Figure 16 present the vertical envelope spectra for all defect scenarios under the shaft speed at 720 RPM (12 Hz). All the AES are computed using FFT points () with five averaging () and a frequency resolution of 0.0977 Hz.
Figure 14.
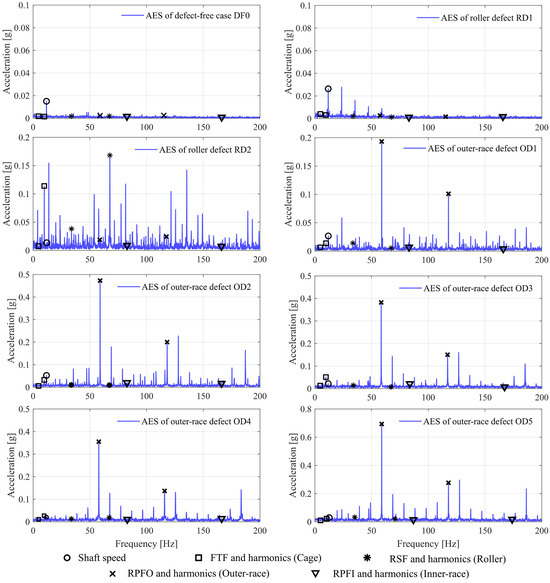
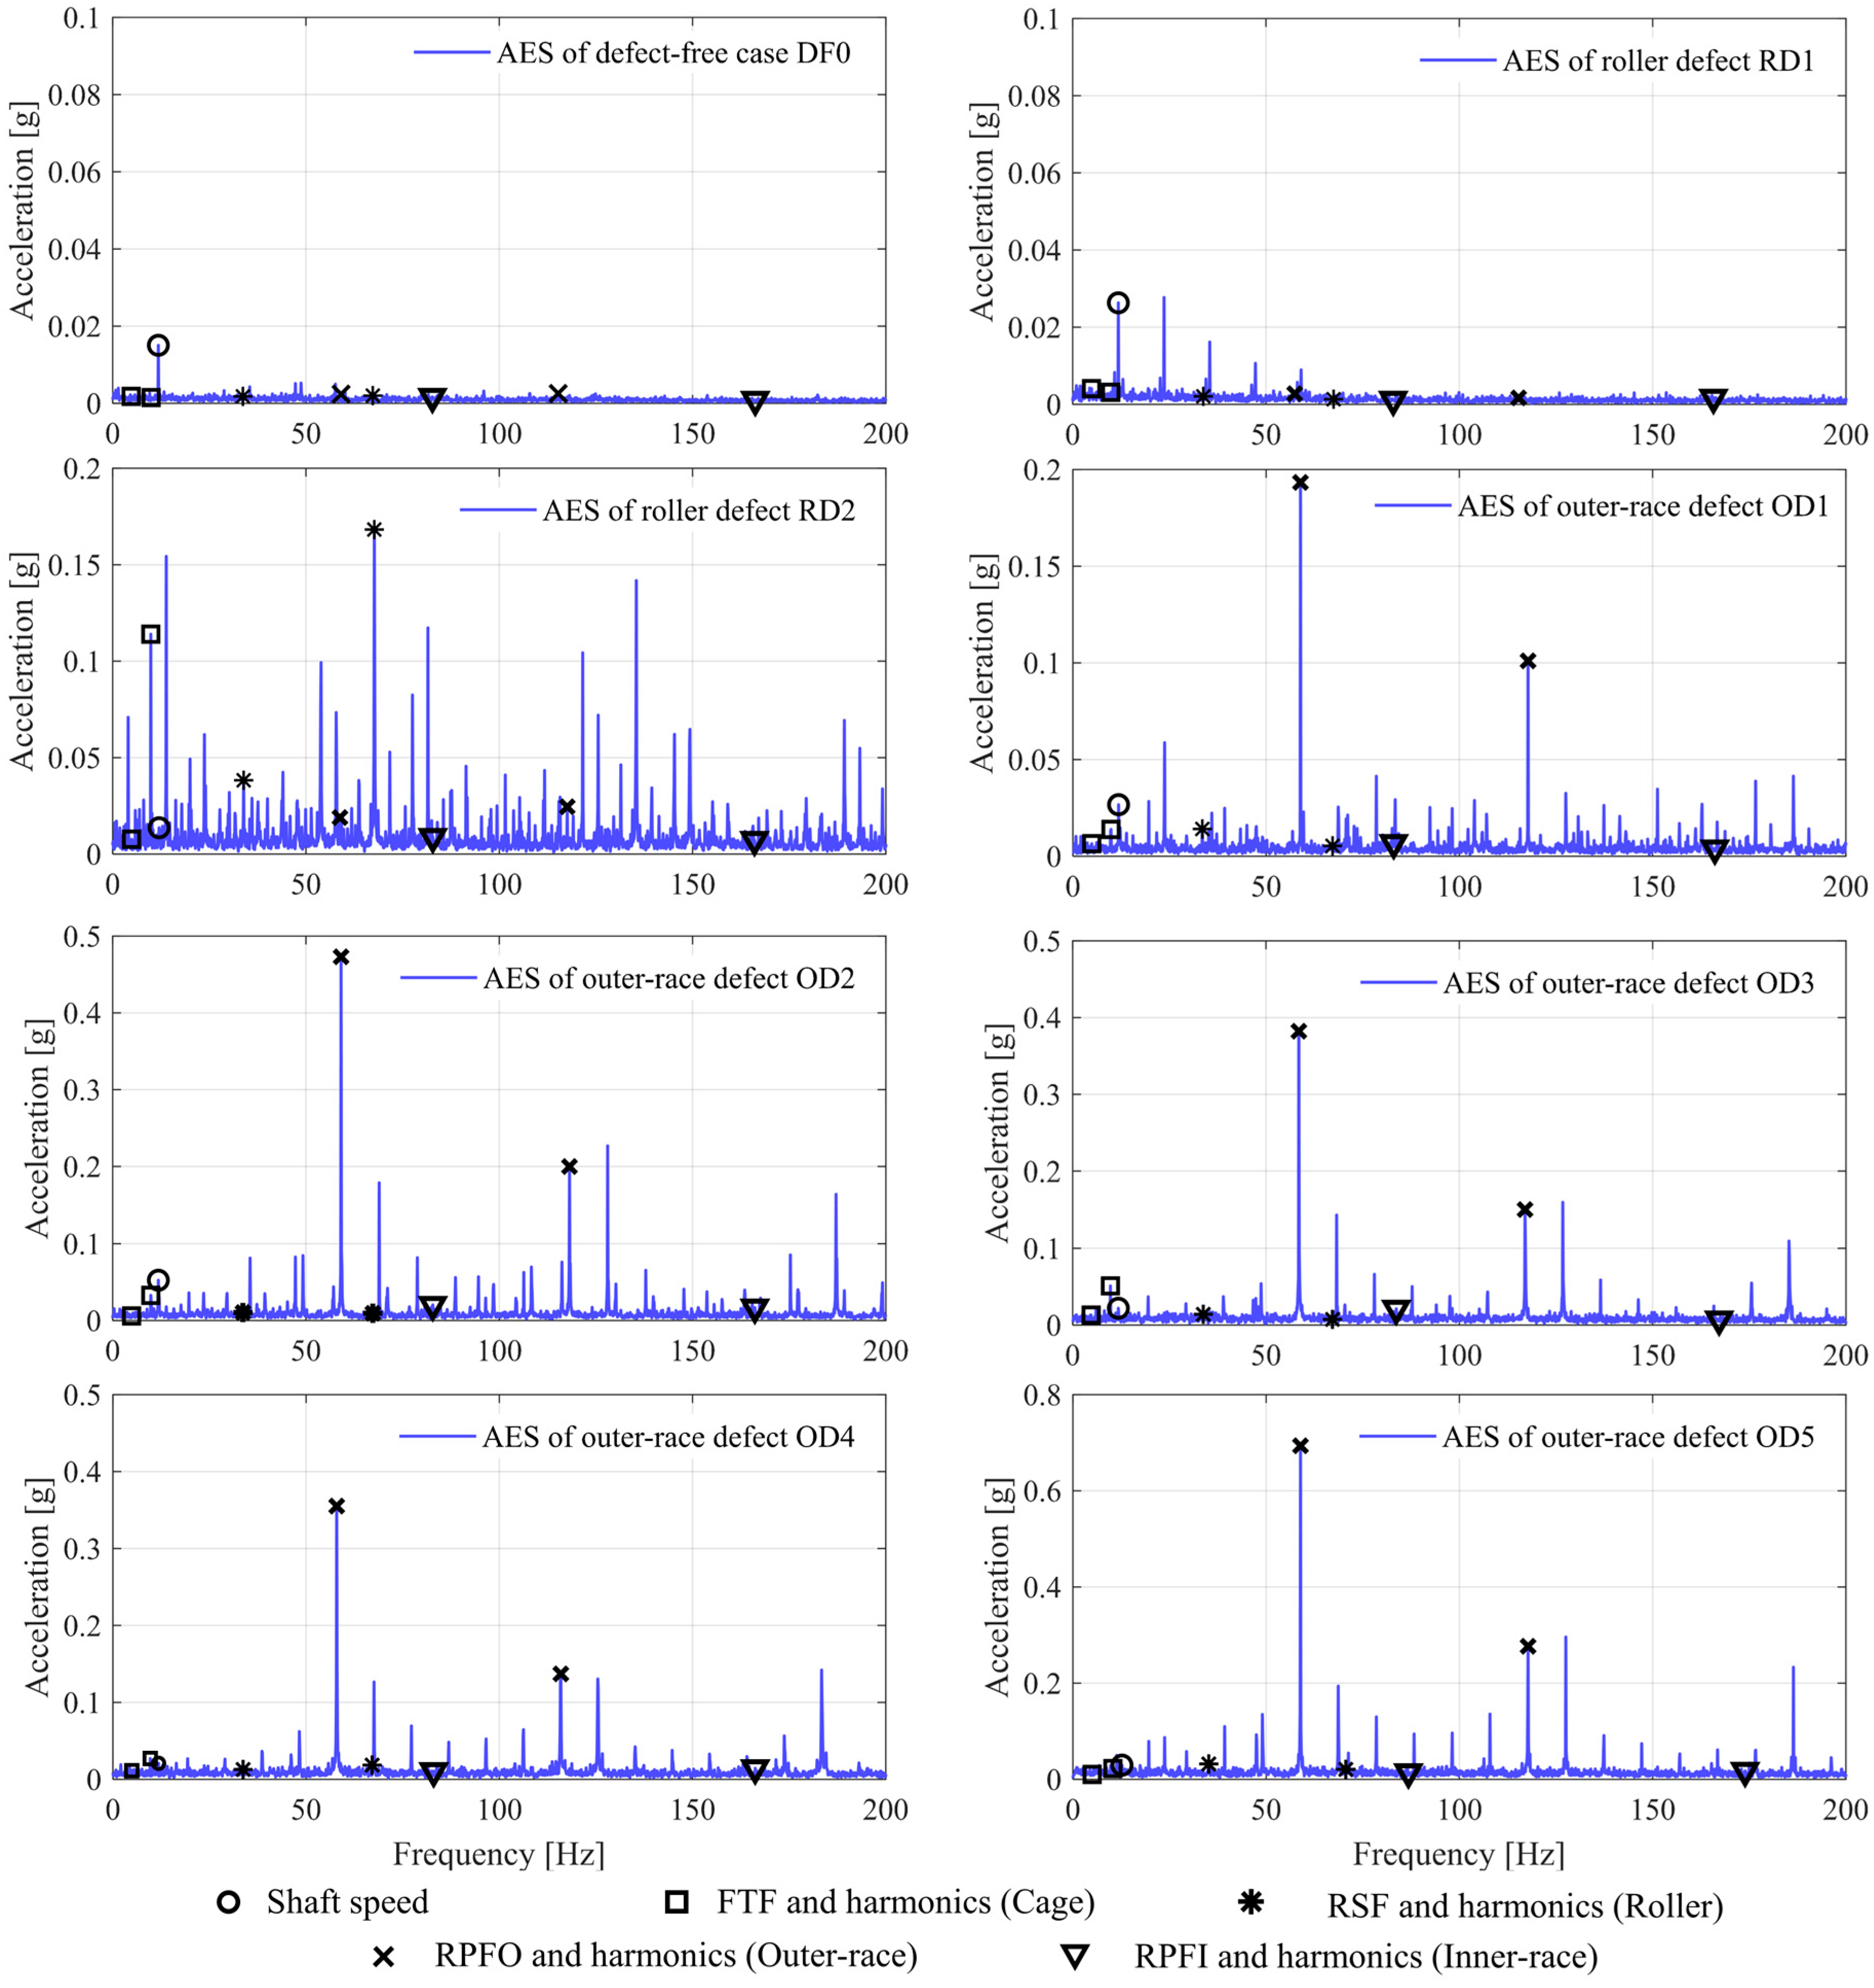
The vertical envelope spectra at 720 RPM of the defect-free case (DF0), roller defect cases (RD1, RD2), and outer-race defect cases (OD1 to OD5), exhibiting clear roller-fault frequencies in RD2 and outer-race fault frequencies in OD1 to OD5.
Figure 15.
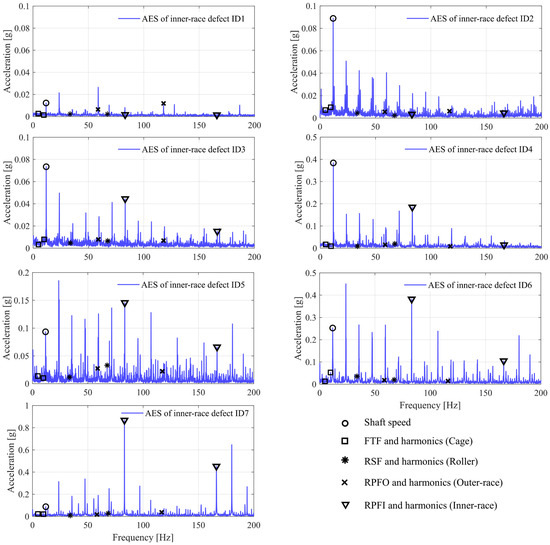
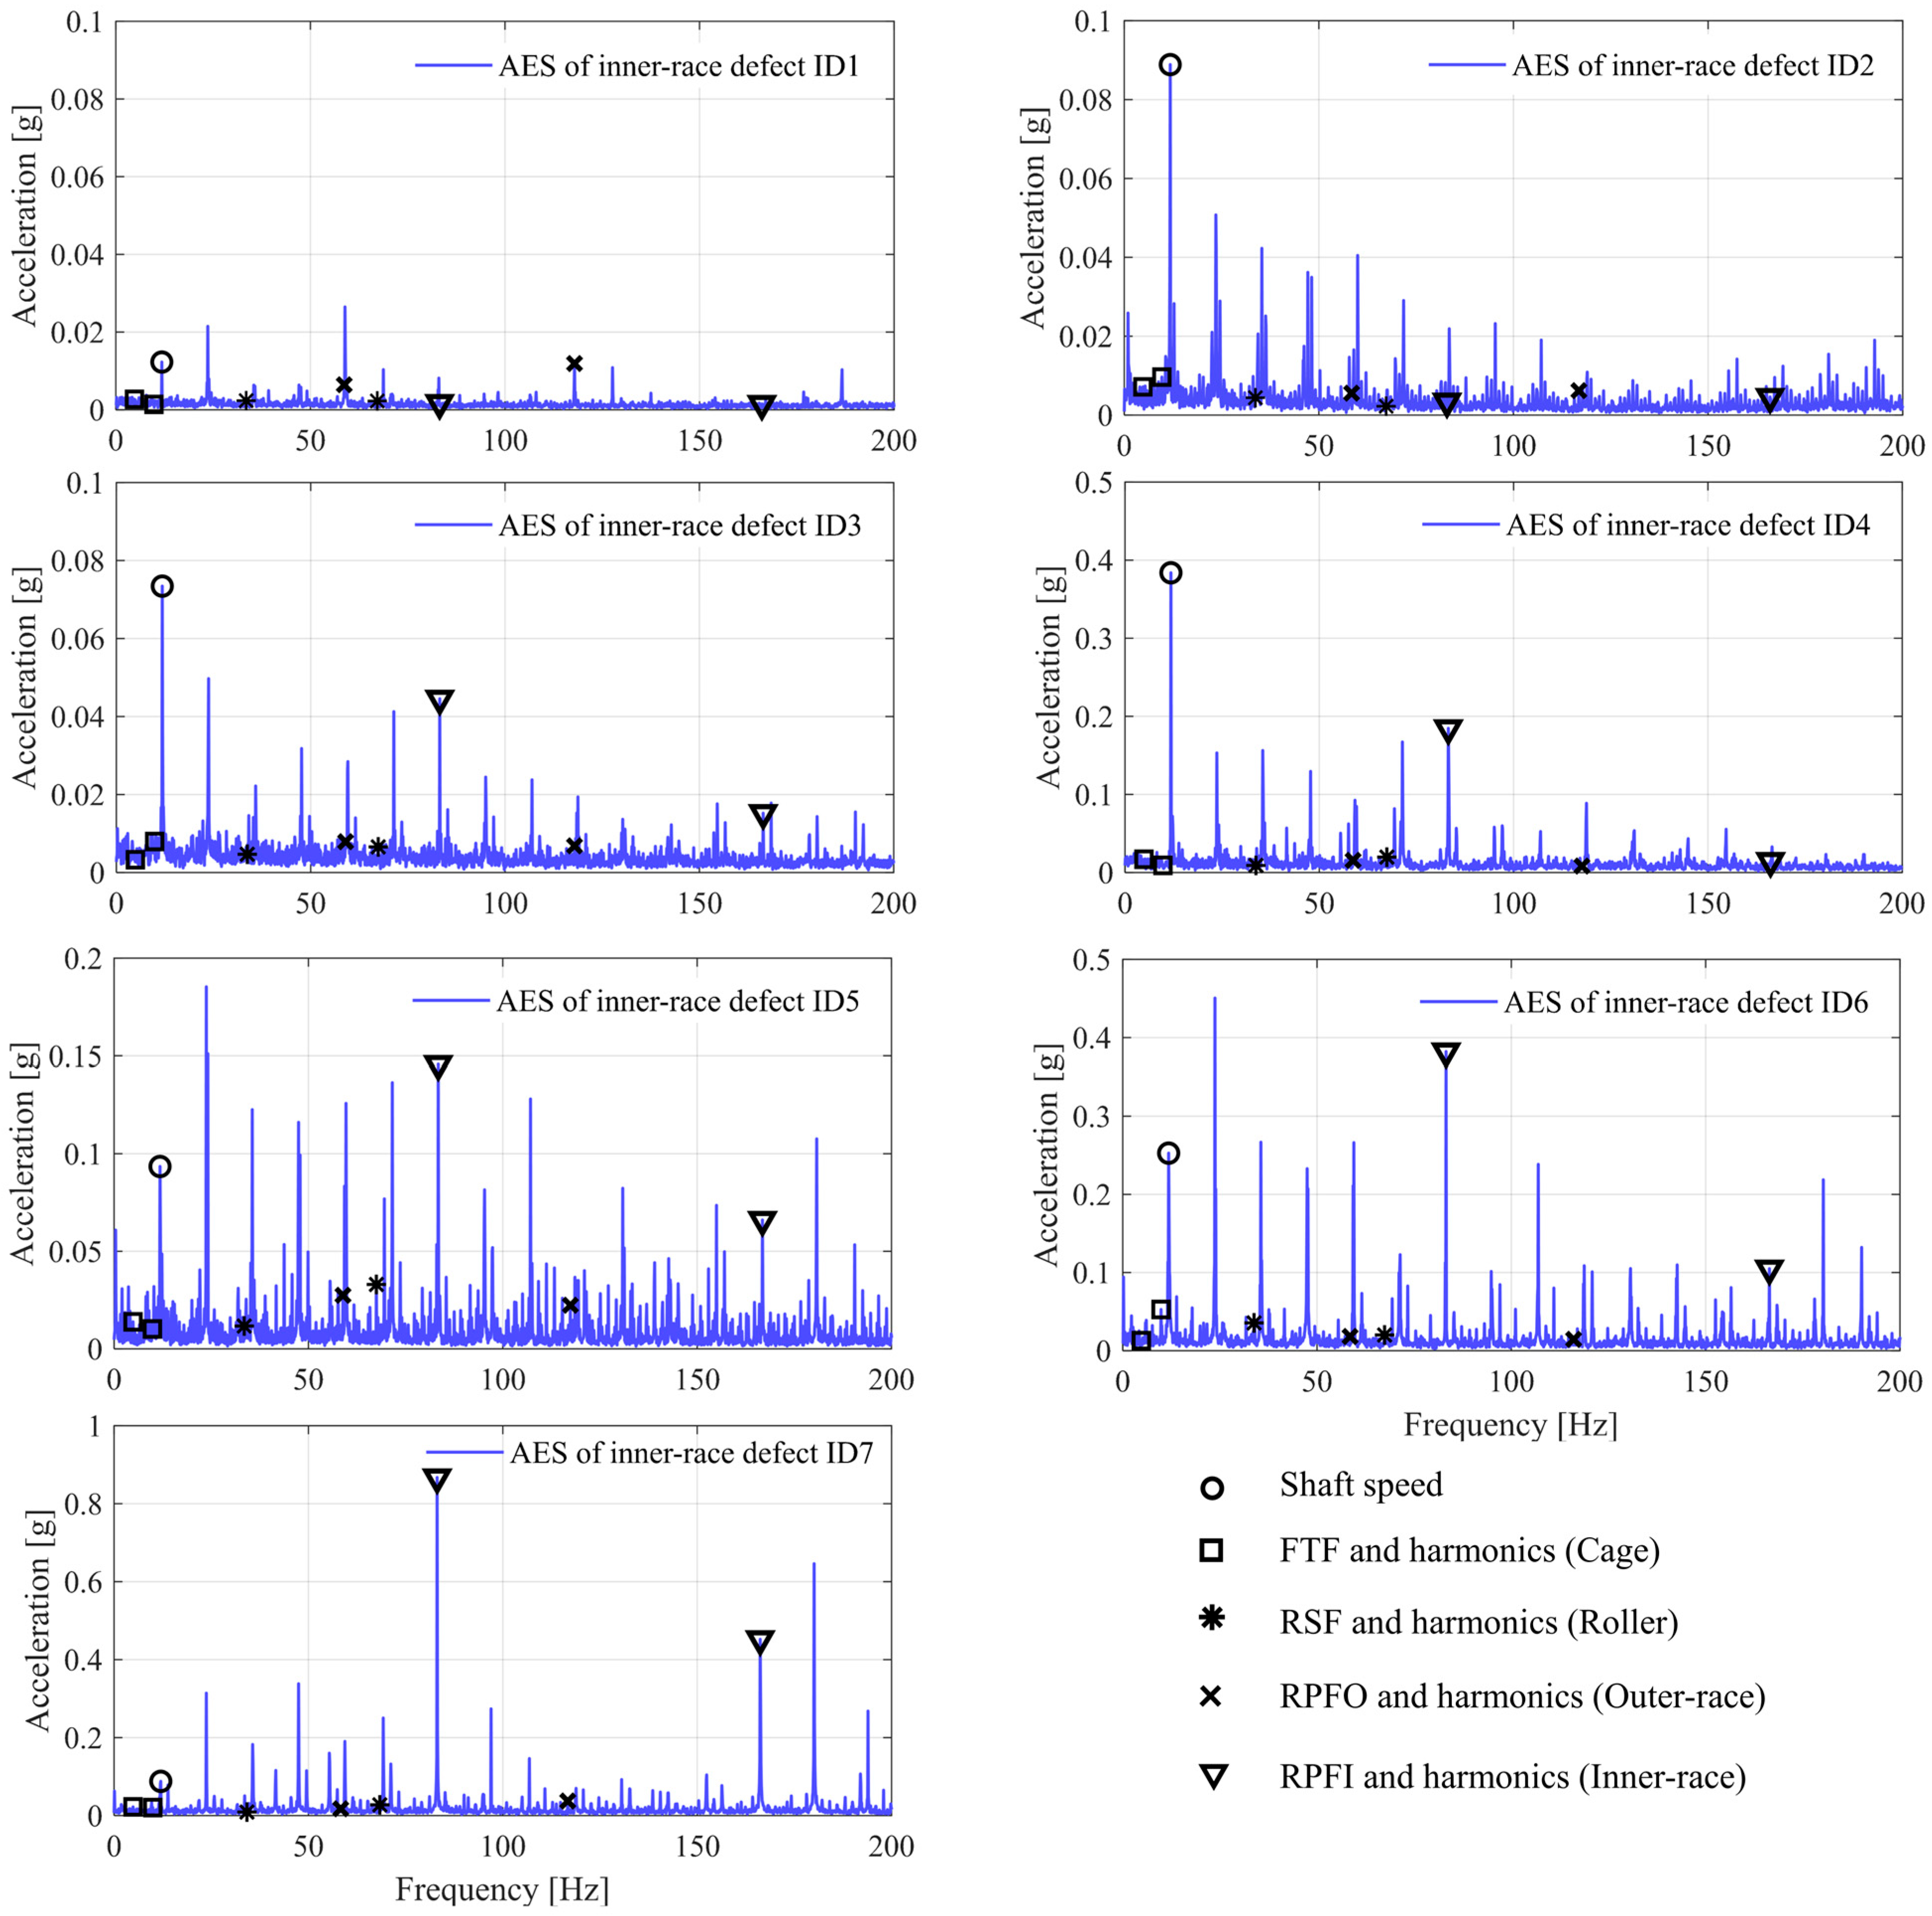
The vertical envelope spectra at 720 RPM of the inner-race defect cases ID1 to ID7, with the inner-race fault frequencies detected from ID3 to ID7, with acceleration amplitudes reducing from ID4 to ID5.
Figure 16.
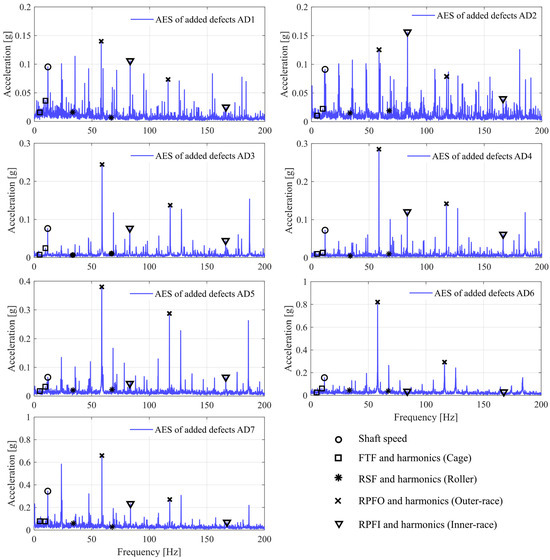
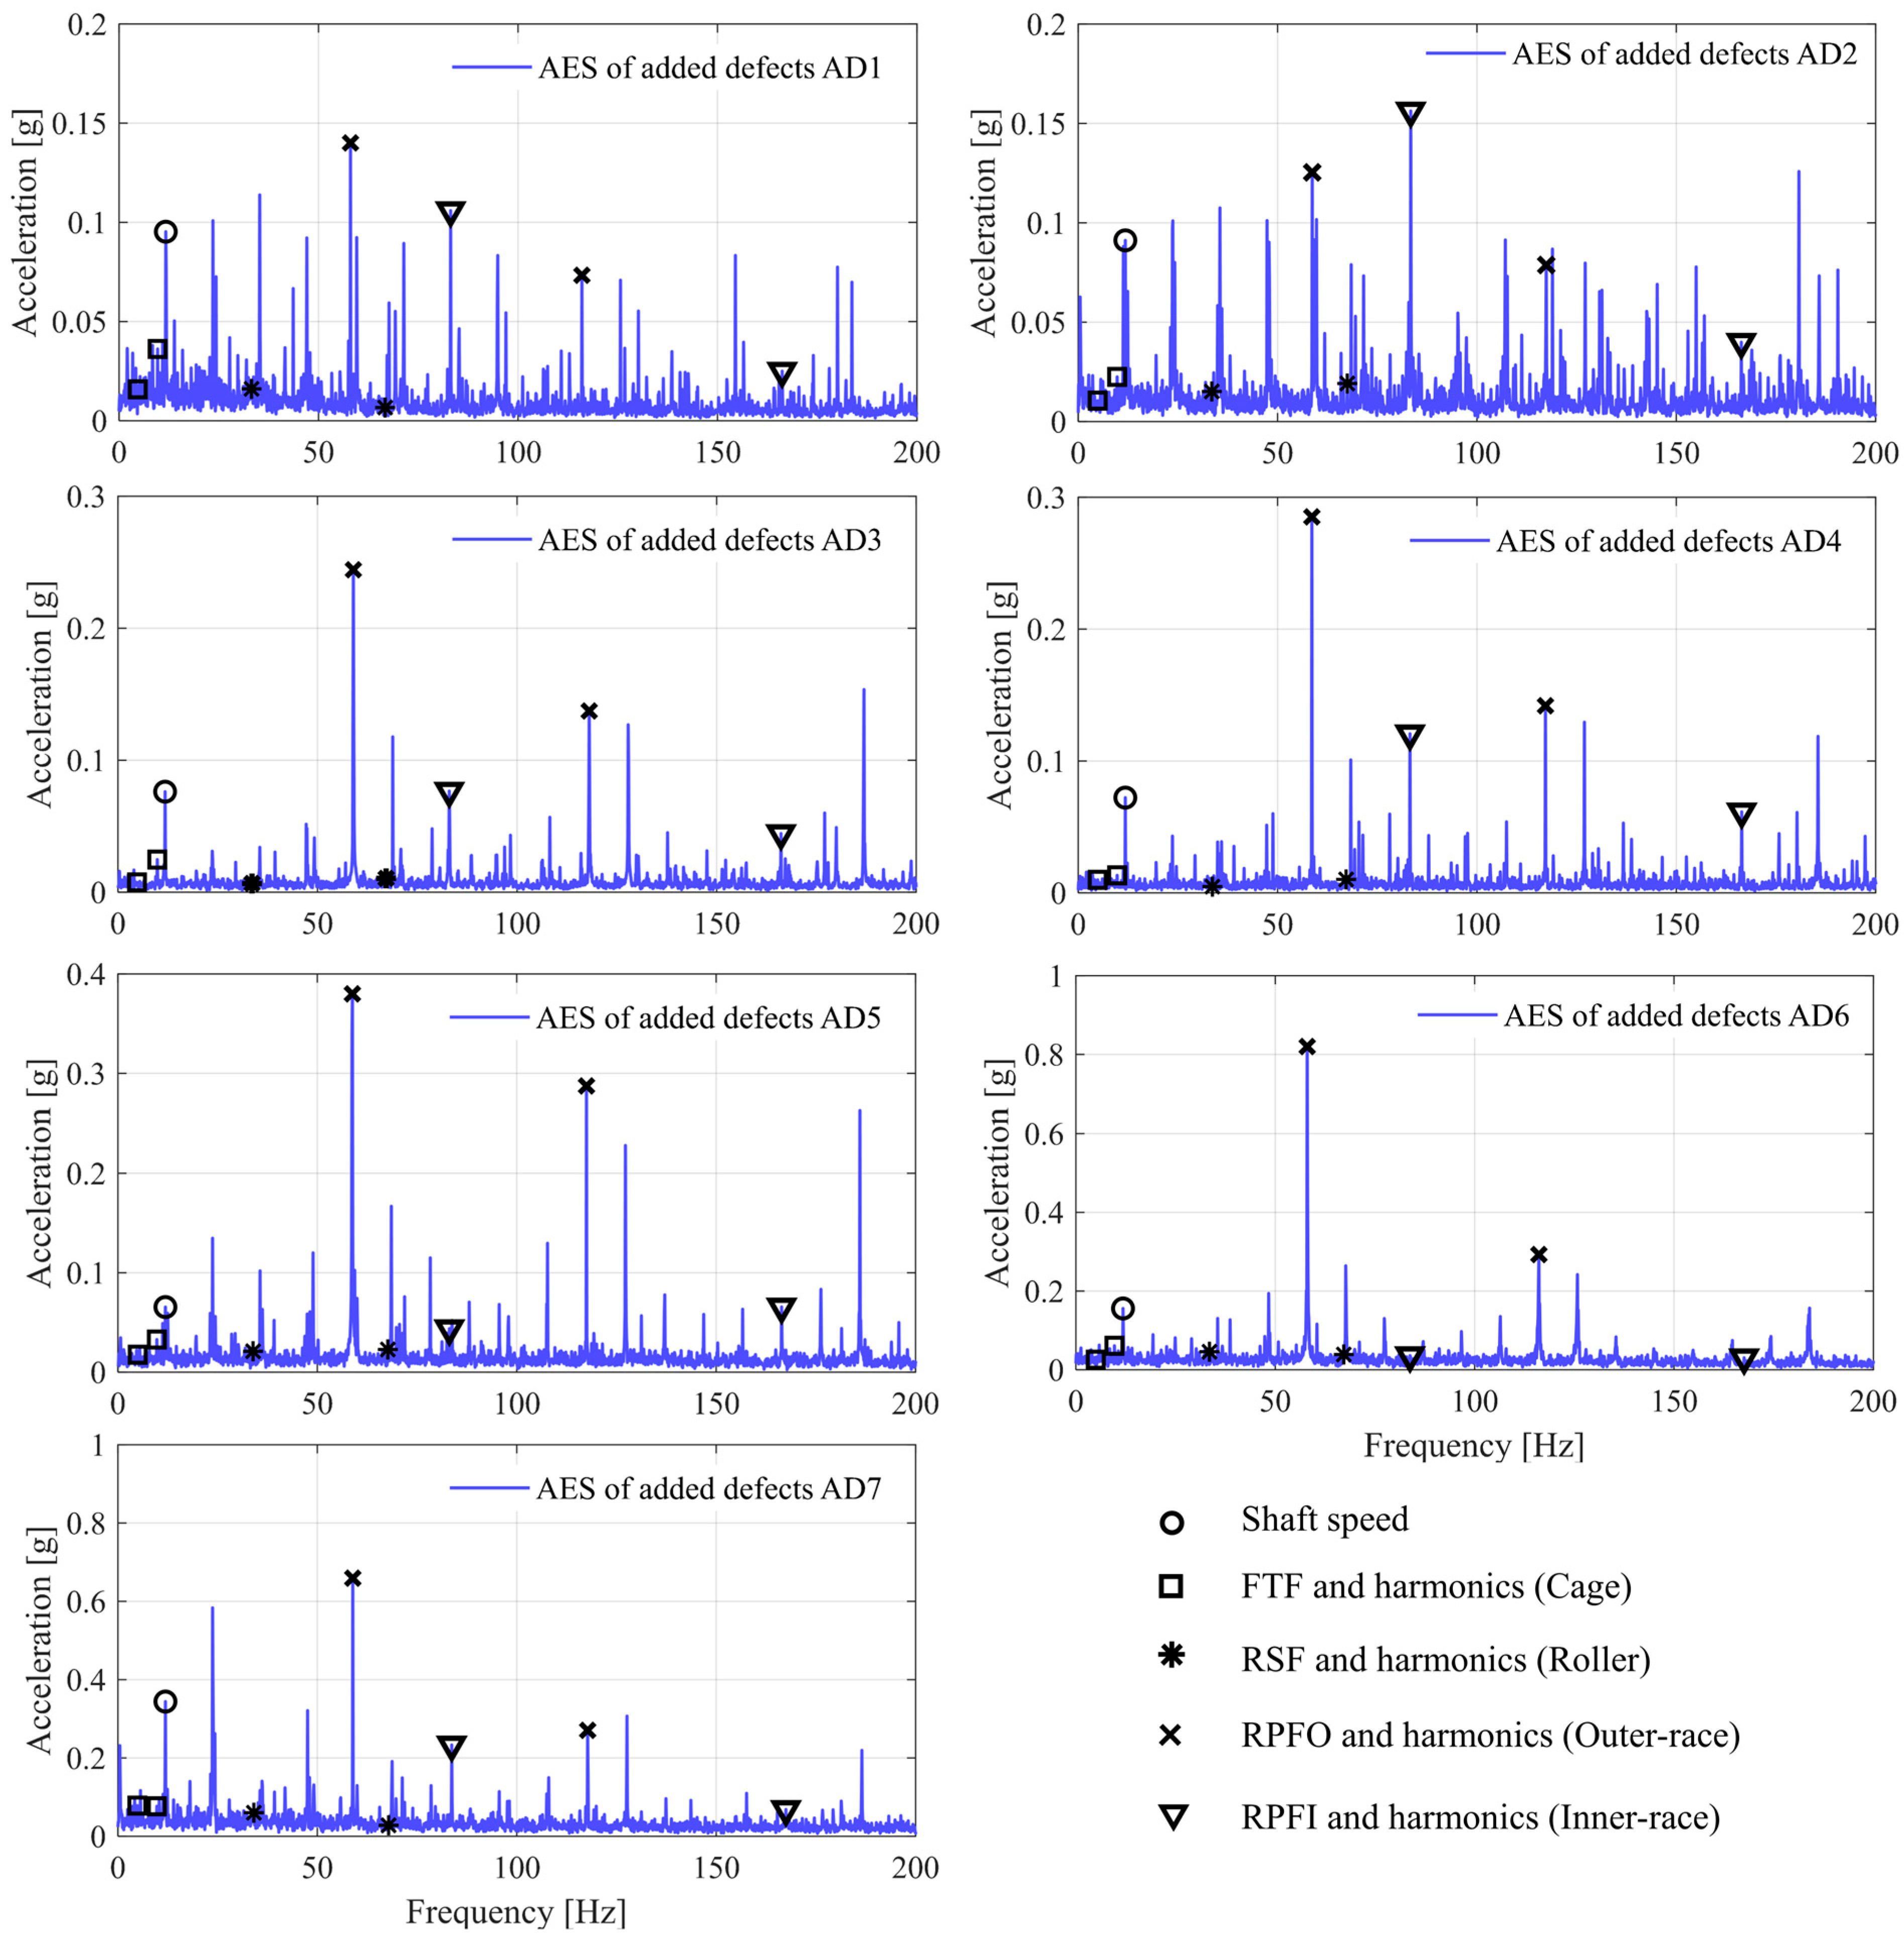
The vertical envelope spectra at 720 RPM of the added defect cases AD1 to AD7.
From Figure 14, it can be seen that the AES of the defect-free case (DF0) is characterised by a spectral peak at the shaft rotation frequency of around 12 Hz, while other bearing fault frequencies are invisible. For the roller defects, only RD2 with full length and 0.3 mm width (refer to Table 2 and Figure 9) is detected with clear roller-fault frequencies at RSF and its second harmonic, RSF 2. All the outer-race defects are effectively captured by envelope analysis with prominent outer-race fault frequencies at RPFO and RPFO 2.
However, the roller defect RD1 with 2 mm width (refer to Table 2 and Figure 9) is not captured by envelope analysis, and its AES is dominated by the shaft speed component and its sub-harmonics without the presence of roller defect frequencies. This indicates that the defect RD1 does not excite impact loadings and resonance responses of the test bearing. Thus, no defect frequencies are captured in the envelope spectrum.
Similar observations are obtained for the inner-race defects ID1 (1 mm circle point defect) and ID2 (1 mm slotted line defect; refer to Table 2 and Figure 15). As shown in Figure 15, the envelope spectra of ID1 and ID2 are mainly dominated by the shaft speed component and its higher harmonics, while the inner-race defect frequency at RPFI is not identified. This suggests that impact loadings are not generated by the inner-race defects ID1 and ID2. Hence, the severity levels of DF0, RD1, ID1, and ID2 are categorised as healthy.
On the other hand, apparent fault frequencies at RPFI and RPFI 2 are detected in the AES of the inner-race defect cases from ID3 to ID7. Furthermore, it is noted that the acceleration amplitude decreases from ID4 to ID5, despite the increase in the defect sizes. This indicates that the vibration amplitudes of the defect frequencies do not linearly correlate with the defect severity. Therefore, the ANN model is proposed to handle the nonlinearity in the bearing degradation dynamics.
As for the added defect scenarios, apparent outer-race defect frequencies (at RPFO and RPFO 2) and inner-race defect frequencies (at RPFI and RPFI 2) can be observed from the corresponding AES, as shown in Figure 16. The outer-race fault features are likely more dominant than the inner-race fault features.
4.3. Envelope Spectra of Datasets 2 and 3
Other operational conditions were also conducted for different defect scenarios listed in Table 3 at the shaft speed of 360 RPM (Dataset 2) and 1320 RPM (Dataset 3). These two rotating speeds are expected to show different machine vibration behaviour compared to the speed at 720 RPM.
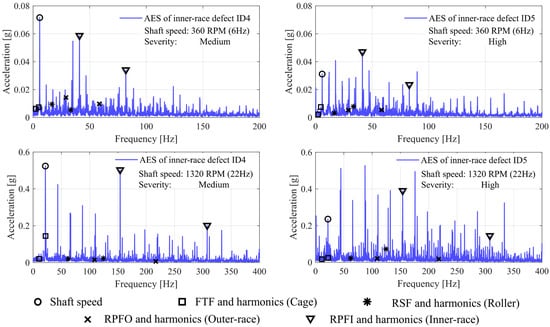
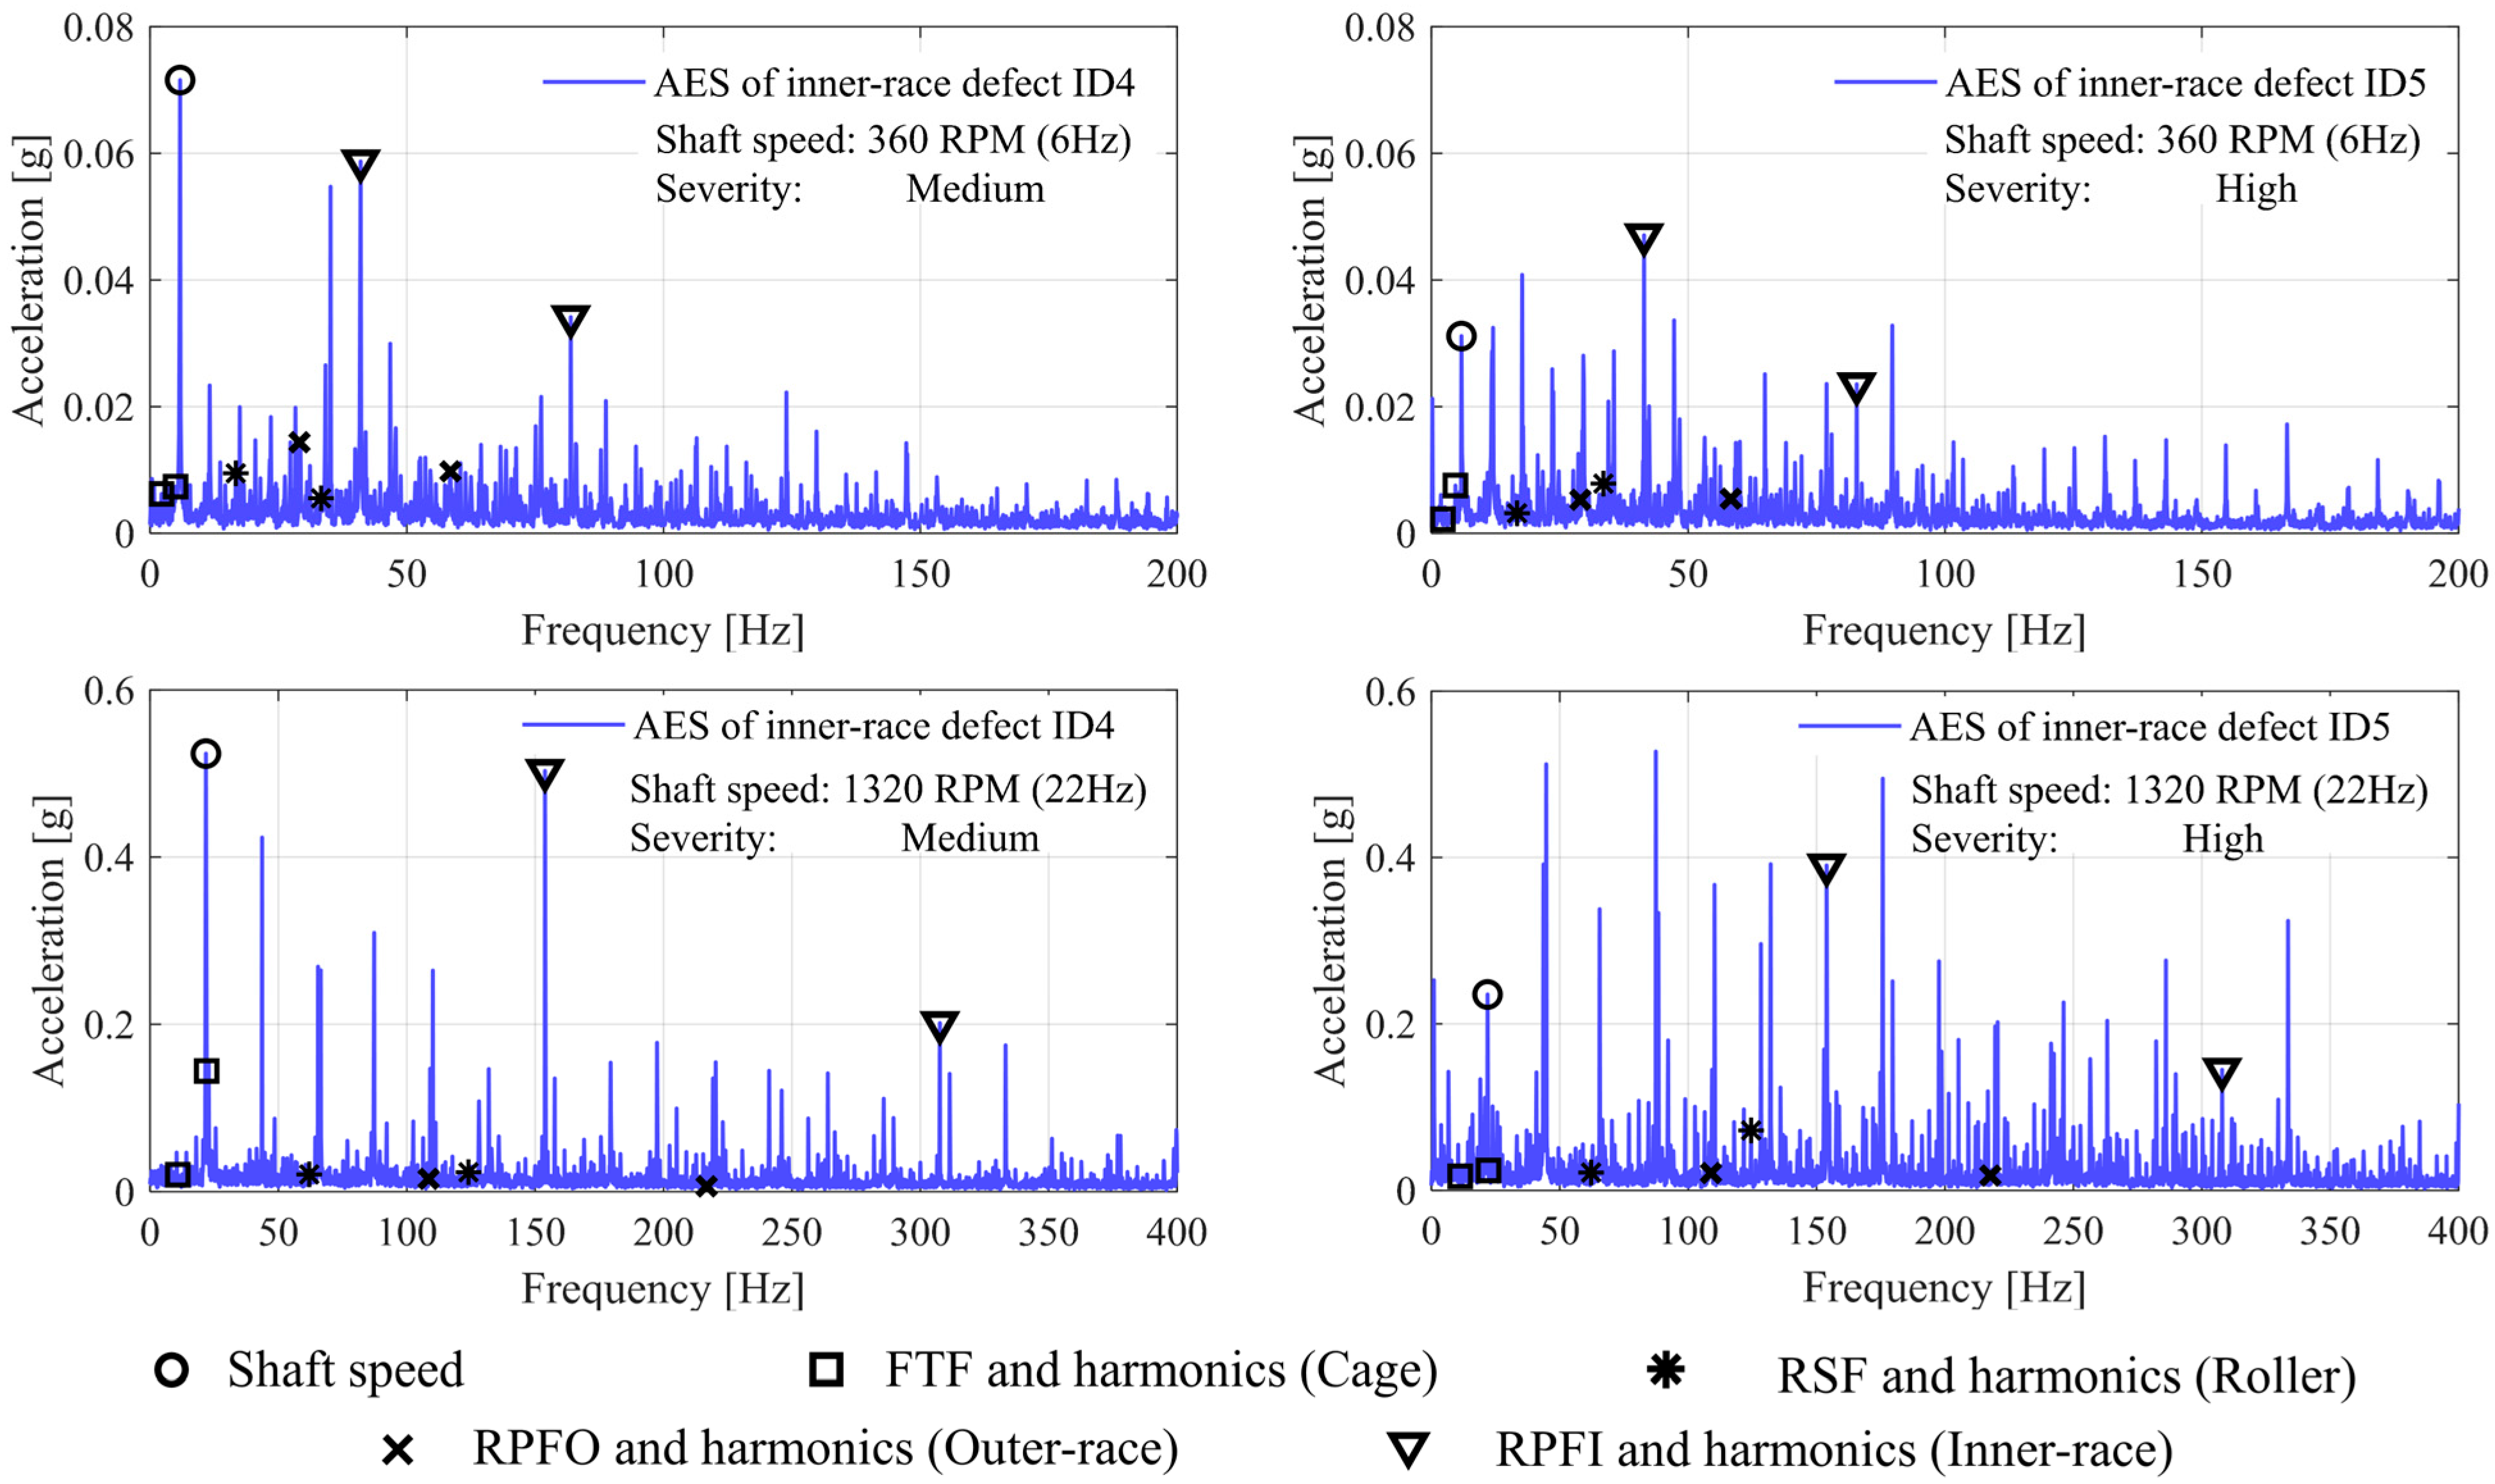
Figure 17 presents the envelope spectra of two inner-race defects, ID4 and ID5, under different operating conditions. Note that the inner-race defects ID4 and ID5 are classified as ‘medium’ and ‘high’ severity, respectively. Reduced acceleration vibration amplitudes at the inner-race fault frequencies are observed from their envelope spectra. This phenomenon is observed across three different operation conditions (shaft speeds at 360 RPM, 720 RPM, and 1320 RPM), which highlights the nonlinearity between the FCF amplitudes and bearing defect severity.
Figure 17.
Typical vertical envelope spectra of ID4 and ID5 under other operating conditions, showing reducing acceleration amplitudes at the inner-race fault frequencies from ID4 (medium severity) to ID5 (high severity) for both conditions.
4.4. Nonlinearity in FCF Amplitudes and Defect Severity
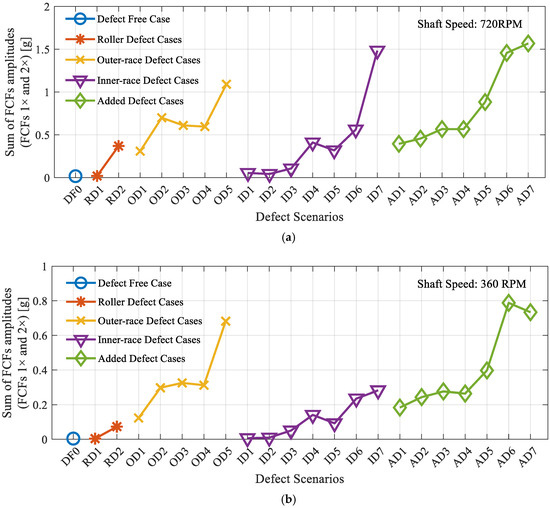
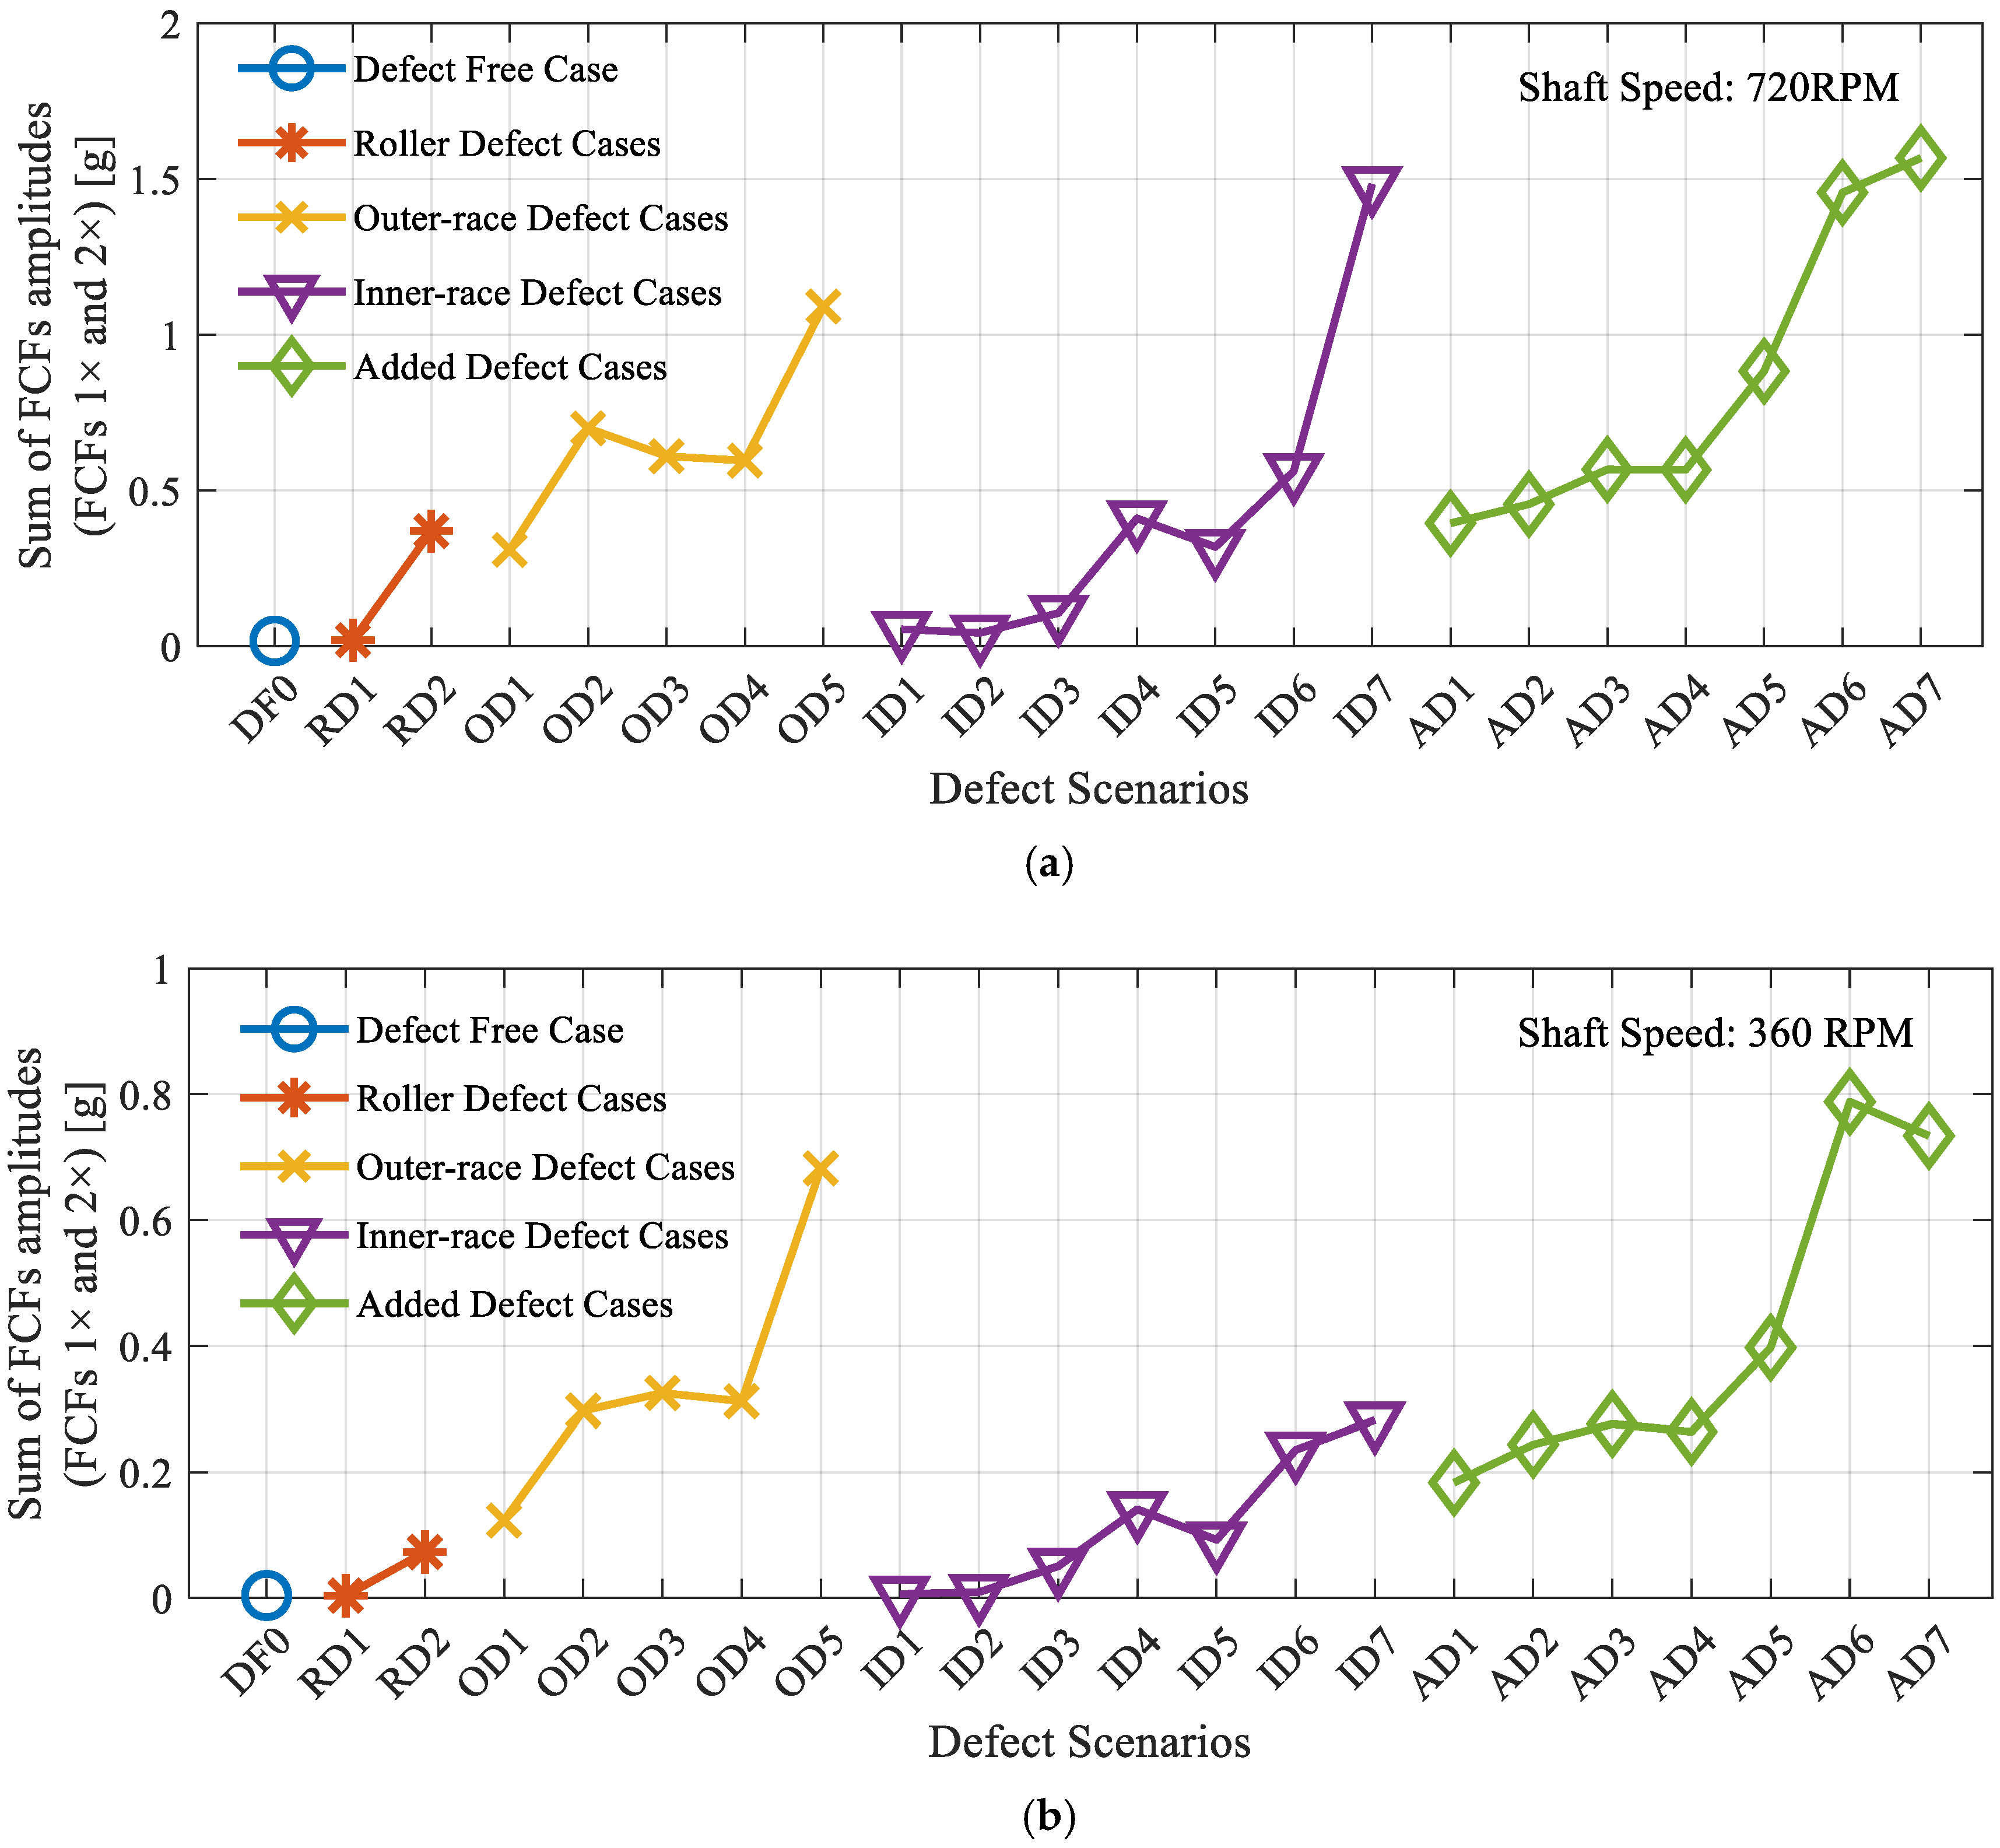
The relationship between the fault frequency amplitudes and defect sizes is shown in Figure 18. The result is obtained by summing all FCF amplitudes (refer to Equation (3)). It is shown that the increase in defect severity does not necessarily result in increasing vibration amplitudes. Although the FCF amplitudes rise initially as the defect size enlarges, an amplitude reduction is observed beyond a certain defect size. The deviation from a monotonic trend indicates the complex interactions among bearing defect propagation and contact mechanics, which necessitates the development of nonlinear data-driven methods to accurately assess bearing fault severity.
Figure 18.
Summation of the FCF amplitudes with respect to different bearing fault scenarios, exhibiting a nonlinear and non-monotonic pattern as defect size increases: (a) machine operating conditions at 720 RPM and (b) 360 RPM.
5. Results of Fault Severity Estimation
To implement the proposed method for fault severity estimation, experimental datasets based on bearing FCF amplitudes are arranged according to the operating condition. The analysis begins with the results and observations from testing the data measured at a shaft speed of 720 RPM. Further validations are performed for other operating conditions to assess the robustness of the ML model.
5.1. Experimental Data Samples
Based on the measured vibration acceleration data, the vibration amplitudes at the defect frequencies are extracted from the envelope spectra using Equations (1)–(4). These vibration-based parameters are standardised as input vectors to the proposed ML model for defect severity estimation. It should be noted that the present study does not focus on the optimisation of the ML model. Rather, the ANN-based model is used solely as a data-driven correlation technique to process the experimental data and estimate bearing defect severity. For model fitting, the data samples of various defect scenarios are labelled with the corresponding defect severities according to the severity classifications in Table 3. For performance validation, the input parameter samples are generated for three different operating conditions, i.e., the shaft rotation speeds at 360 RPM, 720 RPM, and 1320 RPM, resulting in three datasets, i.e., Datasets 1 to 3, as summarised in Table 5.
Table 5.
Experimental data samples at different operating conditions.
5.2. Operating Condition 1 (Shaft Speed at 720 RPM)
For Condition 1, the parameter dataset is randomly split into independent subsets for training (64%), validating (16%), and testing (20%). After training for 500 iterations, the classification performance of the ANN model on the training set, validation set, and testing set is shown in Table 6. Table 7 summarises the accuracy for bearing fault severity estimation across five severity levels on the testing set.
Table 6.
Accuracy of fault severity estimation (%) of the ML model.
Table 7.
Testing accuracy across different severity levels of the ML model under Condition 1 (720 RPM).
It is seen that the ANN model obtains 100% accuracy (Equation (6)) for all severity categories using the selected FCF-based input parameters for severity estimation. The accuracy ensures that no faults go undetected. The rotor dynamics-based vibration parameters that reflect bearing conditions are considered in the ML model to guarantee 100% diagnosis. It is important for any industrial applications to ensure that the prediction is accurate in order to make decisions on the maintenance activity. The performance suggests that the specified input parameters based on bearing fault frequencies are representative of the defect severity and exhibit excellent performance in severity assessment when combined with the ANN. The proposed method not only detects bearing faults but also provides a direct estimation of the fault severity. Based on fault severity, crucial insights into the time before replacement can be estimated, aiding effective maintenance planning to avoid unscheduled downtime.
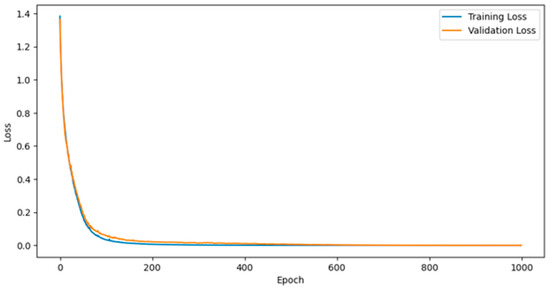
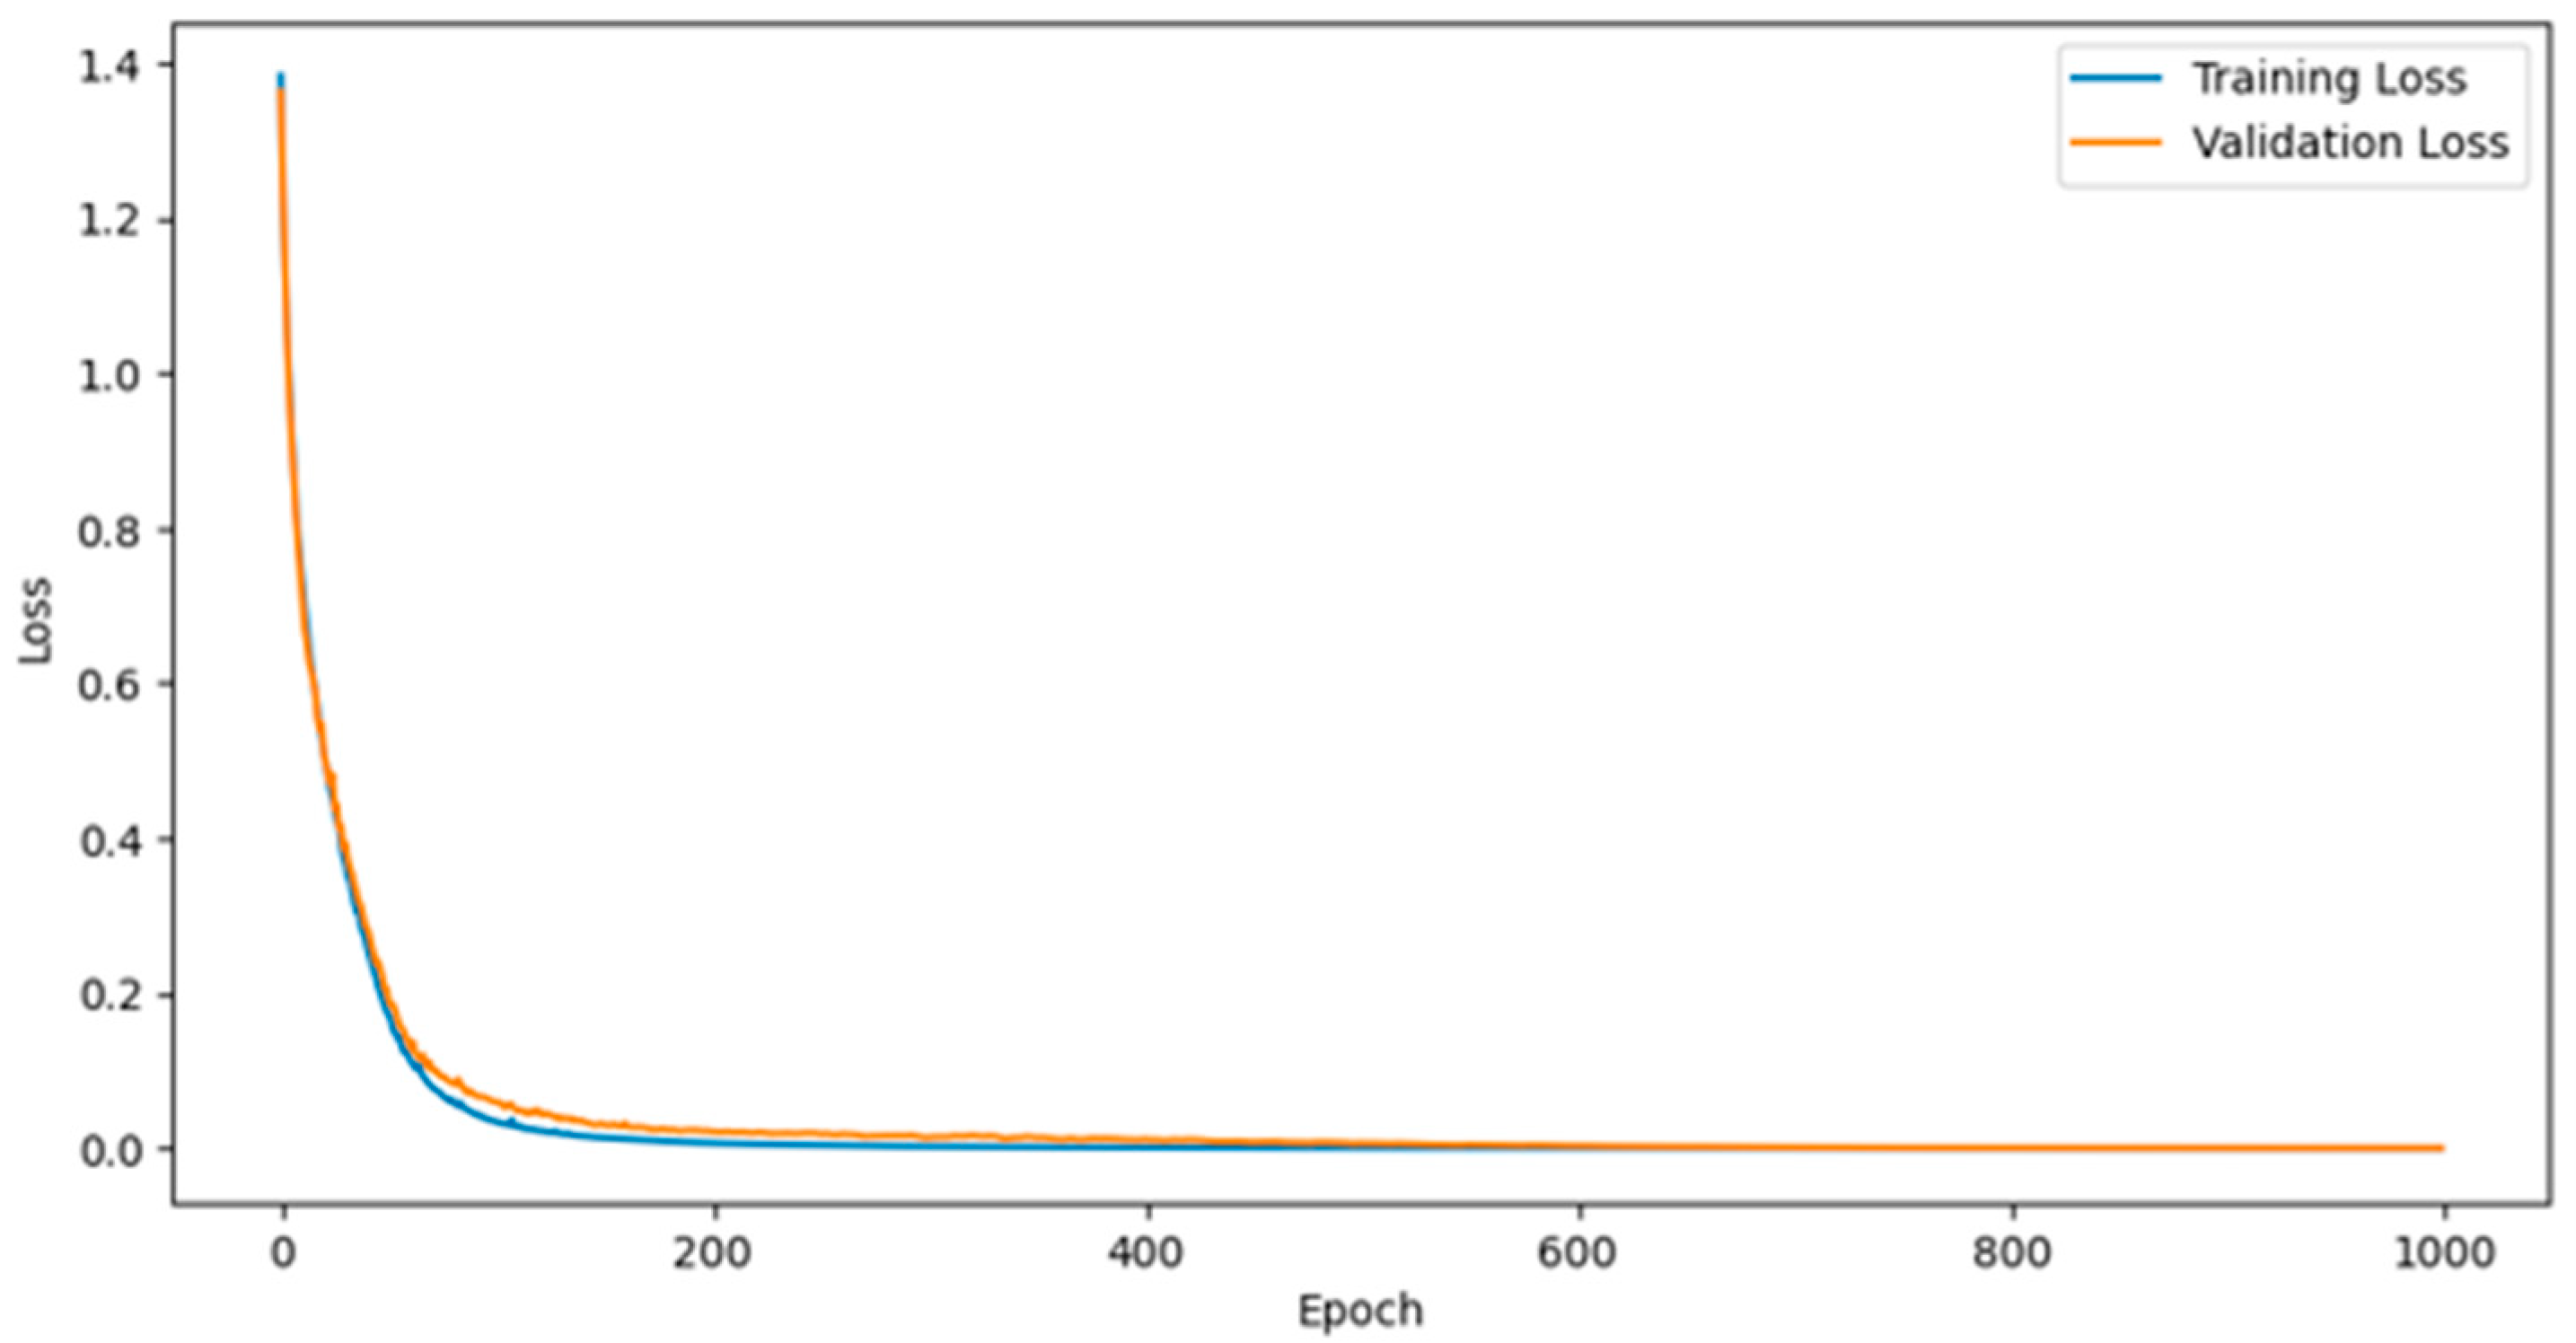
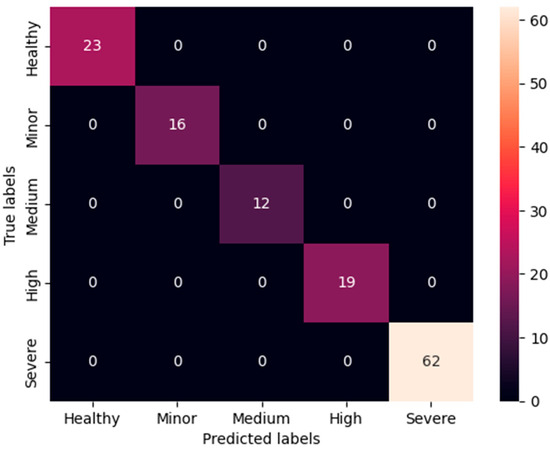
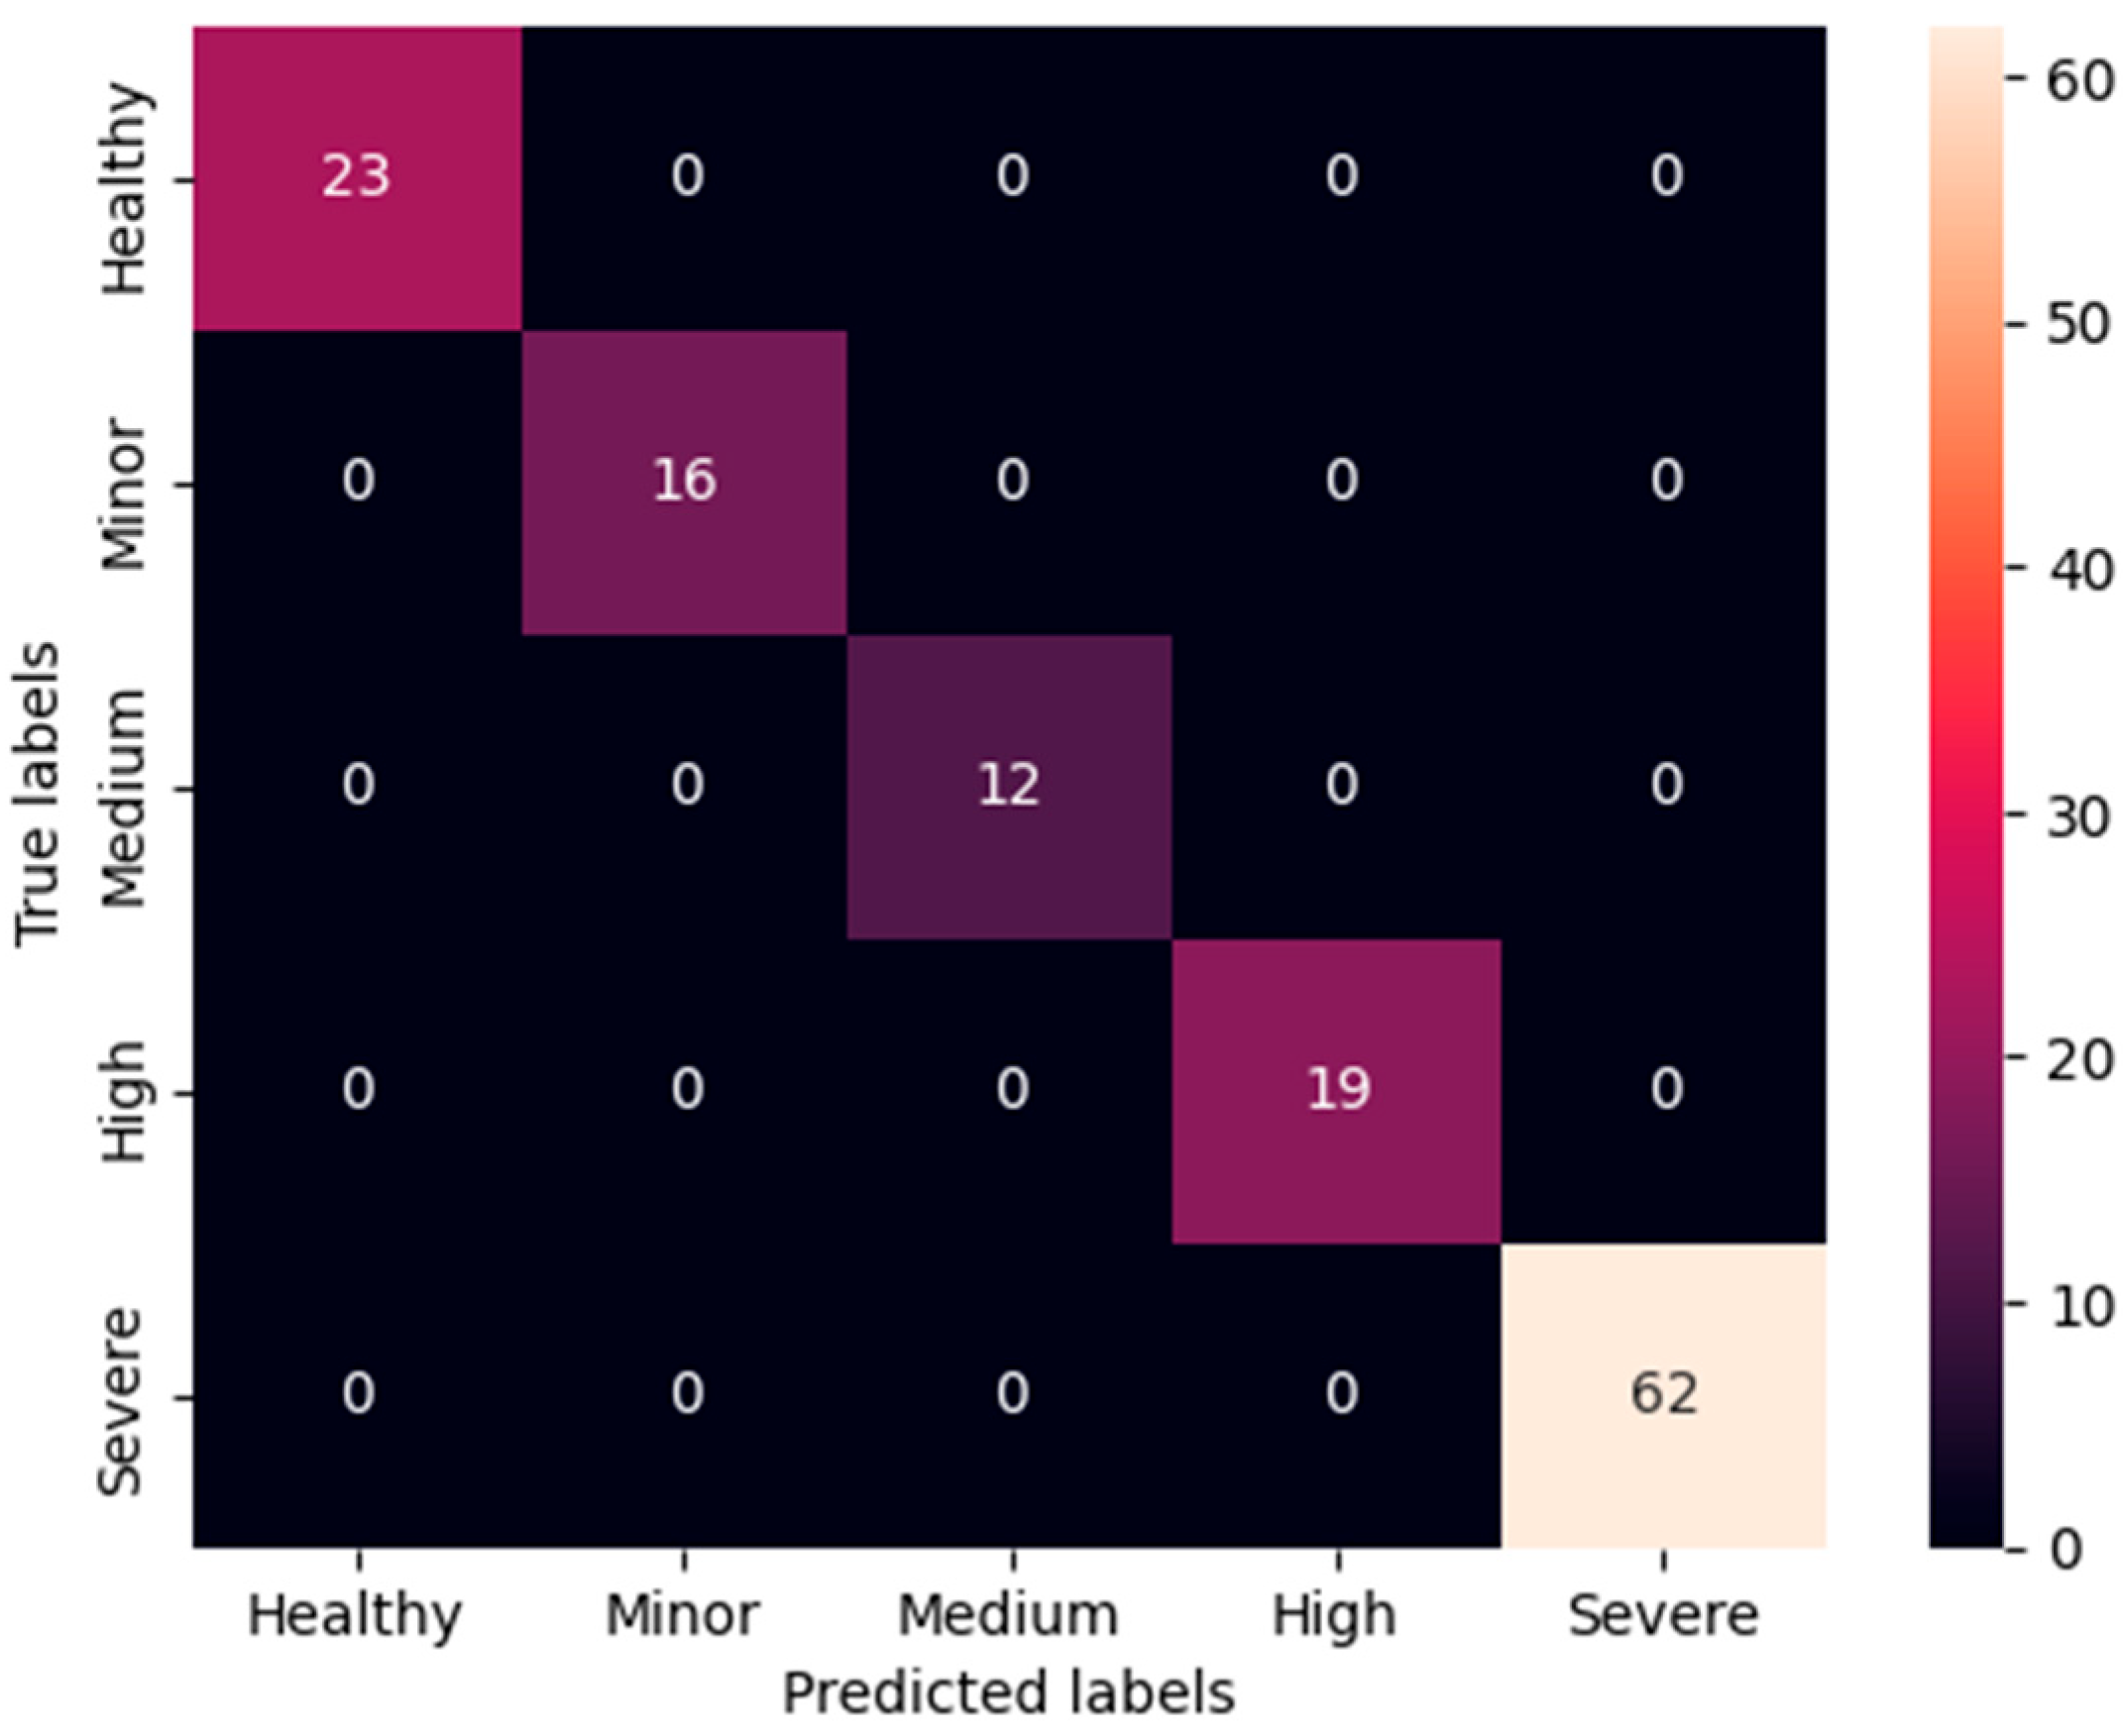
To substantiate the performance of the presented method, multiple strategies have been adopted. First, an early stopping strategy has been implemented to avoid overfitting. The network training process is shown in Figure 19 based on the training loss and validation loss. With a small learning rate, the network was trained using mini batches for around 1000 iterations, with both the training loss and validation loss gradually reducing to a small value, where no abrupt increase in the validation loss is observed with a decreasing training loss. On the other hand, as shown in Figure 20 and Table 8, the confusion matrix and the classification report further illustrate the network performance on the testing set. It is seen that the trained network obtains 100% precision and recall rates, with similar performance regarding the F1-score and accuracy metrics.
Figure 19.
The network training loss and validation loss with respect to training iteration.
Figure 20.
The confusion matrix on the testing set (for 720 RPM).
Table 8.
The classification report on the testing set (for 720 RPM).
Second, other implementation strategies are utilised to ensure the robustness and validity of the proposed method. These involve the selection of key input parameters based on the rotor dynamics concept (as detailed in Section 2.2 and Section 4), parameter standardisation, and sample randomisation of the training, validation, and testing sets. Furthermore, the network parameters are also carefully selected based on grid search cross-validation. Thus, repeatable performance is obtained by the trained network on three medium experimental datasets.
Admittedly, the inherent complexity of the fault severity estimation problem is reduced by carefully selecting a set of standardised parameters based on rotor dynamics. Note that the extraction of bearing FCF from envelope analysis should be guided by the bearing system’s resonance band, which has been identified via experimental modal analysis (see Section 4.1). Also, the demonstrated nonlinearity of the FCF amplitude with bearing defect size necessitates the use of a fine-tuned artificial neural network, which may outperform traditional machine learning frameworks in capturing the latent nonlinear relationships between condition monitoring measurements and fault severity.
5.3. Further Validations at Other Operating Conditions
For further validation, the same ANN model is applied to Dataset 2 and Dataset 3 under other operational conditions without any change in the vibration-based input parameters. The rig was operated under the shaft speed of 360 RPM (6 Hz) for Condition 2 and 1320 RPM (22 Hz) for Condition 3. The dynamic behaviour of the bearing rig is expected to be different from that of Condition 1 at the shaft speed of 720 RPM (12 Hz) due to the residual unbalance and misalignment response. Here again, the parameter dataset is randomly split into independent subsets for training (64%), validating (16%), and testing (20%). Thus, the same ML model is applied to Dataset 2 with a total of 660 samples across five severity levels (see Table 7). The result of defect severity estimation on the testing set is summarised in Table 9, which shows the ML model is 100% accurate for healthy bearings and the bearing defects at various severity levels. Similarly, the test performance of the same ML model on Dataset 3 with a higher machine operation speed is listed in Table 10. Excellent accuracy for fault severity estimation is also obtained.
Table 9.
Testing accuracy across different severity levels of the ML model under Condition 2 (360 RPM).
Table 10.
Testing accuracy across different severity levels of the ML model under Condition 3 (1320 RPM).
The results show that the method is capable of assessing the severity levels of bearing defects based on vibration-based input parameters, even when applied to a different operating condition. The capability to evaluate bearing fault severity allows one to estimate the time taken for replacement and schedule predictive maintenance.
Based on the experimental applications, the proposed method achieves excellent accuracy in fault severity estimation without requiring any modifications to its input parameters and network structure. This highlights the effectiveness of the selected parameters based on rotor and bearing dynamics and their advantage in the standardisation of bearing severity assessment methodology. These parameters are generally not affected by the presence of noises in the measured vibration signals if signal processing is carried out properly. It is also important to note that the mode for the fault development in the bearing may be related to the temperature, loads, lubricant deficiency, etc., but the dynamics response is expected to be based on the rotor dynamics. The vibration-based input parameters are selected based on rotor dynamics to reveal actual bearing faults, ensuring that the ML process remains physically meaningful. Therefore, the proposed method can be seamlessly applied to any machine with anti-friction bearings. It is also a generalised methodology for bearing defect severity estimation for roller bearings. The trained ANN model is expected to work for identical bearings in any other identical machines under the same operation conditions. However, if applied to different bearings, the ANN model should be trained initially using the corresponding input parameters defined in the proposed method, without any change in methodology itself.
6. Conclusions
If any fault is detected in any anti-friction bearings, the bearing fault severity information is essential information to trigger maintenance activities, compared to the RUL estimation without knowing the defect severity. Hence, this study presents a methodology for anti-friction bearing fault severity estimation based on vibration-based input parameters. These parameters are derived from only bearing resonance responses following rotor dynamic principles to ensure that they are physically meaningful and related to the bearing health. Since the measured vibrations on any bearing pedestals inherently reflect machine dynamics at the measurement location, raw vibration signals contain responses from the bearings, rotor and other machine components. Therefore, bearing resonance band identification and envelope analysis are performed to extract fault-related information and provide a clearer understanding of bearing health conditions. The presence of bearing fault characteristic frequencies and their harmonics in the envelope spectrum confirms the existence of bearing fault(s). The spectral amplitudes of envelope vibration acceleration at these fault frequencies are essential parameters that correspond to physical bearing defects. Hence, these rotor dynamics-based parameters form the foundation of the proposed method and are used with the ANN model for bearing fault severity estimation.
Using multiple roller bearing defects of various severities, the proposed method is applied to measured vibration data from an experimental bearing rig. Based on physical defect areas, the classification criteria for bearing fault severity are formulated with maintenance recommendations. It has been observed that the vibration amplitudes at bearing fault characteristic frequencies are nonlinearly changing with bearing defect sizes (severity levels). Despite that, the presented model effectively captures the nonlinear relationships between the envelope spectral parameters and actual fault severity levels. High accuracy across multiple experimental datasets is obtained, confirming the reliability and robustness of the proposed methodology under different operating conditions.
The simple ML model offers significant advantages by enabling precise fault severity assessment for anti-friction bearings with the use of appropriate vibration parameters based on rotor dynamics. Based on the practical severity assessment criteria and the input parameters pertinent to bearing resonance responses, the proposed method addresses both bearing fault detection and severity estimation. The bearing defect severity estimation is much needed information for the reliable predictive maintenance tool for optimising replacement schedules and supporting maintenance decisions.
The proposed mythology is based on the bearing dynamics concept with a machine learning model. This is an important step towards addressing the issue of estimating bearing defect severity to support maintenance schedule. Further research is planned on a few different rotating rigs with different bearings and varying operating conditions. The related work is potential for industrial implementation and will further strengthen the reliability of the proposed methodology.
Author Contributions
Conceptualization, methodology, software, writing—original draft preparation, H.W.; Validation, H.W. and K.A.; Writing—review and editing, supervision, J.K.S. and L.Z. All authors have read and agreed to the published version of the manuscript.
Funding
This research received no external funding.
Data Availability Statement
The data presented in this study are available upon request from the corresponding author.
Acknowledgments
The first author would like to thank The University of Manchester and the China Scholarship Council for their joint support on the doctoral programme. The authors sincerely appreciate the support from Research IT Services at The University of Manchester for facilitating access to the Computational Shared Facility (CSF3).
Conflicts of Interest
The authors declare no conflicts of interest.
References
- Randall, R.B. Vibration-Based Condition Monitoring: Industrial, Automotive And Aerospace Applications, 2nd ed.; Wiley: Hoboken, NJ, USA, 2021. [Google Scholar]
- Sinha, J.K. Industrial Approaches in Vibration-Based Condition Monitoring; CRC Press: Boca Raton, FL, USA, 2020. [Google Scholar]
- Randall, R.B.; Antoni, J. Rolling Element Bearing Diagnostics—A Tutorial. Mech. Syst. Signal Process. 2011, 25, 485–520. [Google Scholar] [CrossRef] [Scilit]
- Afshar, M.; Heydarzadeh, M.; Akin, B. A Comprehensive Investigation of Fault Signatures and Spectrum Analysis of Vibration Signals in Distributed Bearing Faults. IEEE Trans. Ind. Appl. 2025, 61, 515–526. [Google Scholar] [CrossRef] [Scilit]
- Martins, D.H.C.S.S.; de Lima, A.A.; Gutiérrez, R.H.R.; Pestana-Viana, D.; Netto, S.L.; Vaz, L.A.P.; da Silva, E.A.B.; Haddad, D.B. Improved Variational Mode Decomposition for Combined Imbalance-and-Misalignment Fault Recognition and Severity Quantification. Eng. Appl. Artif. Intell. 2023, 124, 106516. [Google Scholar] [CrossRef] [Scilit]
- Parvin, F.; Faiz, J.; Qi, Y.; Kalhor, A.; Akin, B. A Comprehensive Interturn Fault Severity Diagnosis Method for Permanent Magnet Synchronous Motors Based on Transformer Neural Networks. IEEE Trans. Ind. Inform. 2023, 19, 10923–10933. [Google Scholar] [CrossRef] [Scilit]
- Nemani, V.; Biggio, L.; Huan, X.; Hu, Z.; Fink, O.; Tran, A.; Wang, Y.; Zhang, X.; Hu, C. Uncertainty Quantification in Machine Learning for Engineering Design and Health Prognostics: A Tutorial. Mech. Syst. Signal Process. 2023, 205, 110796. [Google Scholar] [CrossRef] [Scilit]
- Fink, O.; Wang, Q.; Svensén, M.; Dersin, P.; Lee, W.J.; Ducoffe, M. Potential, Challenges and Future Directions for Deep Learning in Prognostics and Health Management Applications. Eng. Appl. Artif. Intell. 2020, 92, 103678. [Google Scholar] [CrossRef] [Scilit]
- Wen, H.; Zhang, L.; Sinha, J.K. From Envelope Spectra to Bearing Remaining Useful Life: An Intelligent Vibration-Based Prediction Model with Quantified Uncertainty. Sensors 2024, 24, 7257. [Google Scholar] [CrossRef] [Scilit] [PubMed]
- Ohana, R.; Matania, O.; Talan, A.; Klein, R.; Bortman, J. A New Holistic Approach to Investigating and Estimating Rolling Bearing RUL Based on Physical Grounds. Struct. Health Monit. 2025, 25, 2703–2715. [Google Scholar] [CrossRef] [Scilit]
- Cerrada, M.; Sánchez, R.V.; Li, C.; Pacheco, F.; Cabrera, D.; Valente de Oliveira, J.; Vásquez, R.E. A Review on Data-Driven Fault Severity Assessment in Rolling Bearings. Mech. Syst. Signal Process. 2018, 99, 169–196. [Google Scholar] [CrossRef] [Scilit]
- Madar, E.; Galiki, O.; Klein, R.; Bortman, J.; Nickell, J.; Kirsch, M. A New Model for Bearing Spall Size Estimation Based on Oil Debris. Eng. Fail. Anal. 2022, 134, 106011. [Google Scholar] [CrossRef] [Scilit]
- Sawalhi, N.; Randall, R.B. Vibration Response of Spalled Rolling Element Bearings: Observations, Simulations and Signal Processing Techniques to Track the Spall Size. Mech. Syst. Signal Process. 2011, 25, 846–870. [Google Scholar] [CrossRef] [Scilit]
- Luo, M.; Guo, Y.; Wu, X.; Na, J. An Analytical Model for Estimating Spalled Zone Size of Rolling Element Bearing Based on Dual-Impulse Time Separation. J. Sound Vib. 2019, 453, 87–102. [Google Scholar] [CrossRef] [Scilit]
- Zhang, H.; Borghesani, P.; Randall, R.B.; Peng, Z. A Benchmark of Measurement Approaches to Track the Natural Evolution of Spall Severity in Rolling Element Bearings. Mech. Syst. Signal Process. 2022, 166, 108466. [Google Scholar] [CrossRef] [Scilit]
- Zhang, C.; Zhang, L. Spall Size Estimation for Wind Turbine Pitch Bearings: Observation, Signal Processing Method and Experiments. Struct. Health Monit. 2024, 24, 590–601. [Google Scholar] [CrossRef] [Scilit]
- Patel, D.V.; Bhojawala, V.M.; Patel, K.M. Size Estimation of Spall-like Fault on Rolling Element Bearing Using an Integrated Approach Incorporating Total Variation Regularization and Singular Spectrum Analysis. Meas. Sci. Technol. 2023, 34, 035601. [Google Scholar] [CrossRef] [Scilit]
- Dang, P.F.; Yang, Z.X.; Wen, B.G.; Wang, M.G.; Han, Q.K. Fault Severity Assessment of Rolling Bearing Based on Optimized Multi-Dictionaries Matching Pursuit and Lempel–Ziv Complexity. ISA Trans. 2021, 116, 191–202. [Google Scholar] [CrossRef] [Scilit] [PubMed]
- ISO 20816-1:2016; Mechanical Vibration—Measurement and Evaluation of Machine Vibration—Part 1: General Guidelines. International Organization for Standardization (ISO): Geneva, Switzerland, 2016.
- Qingjun, T.; Jianzhong, H. Bearing Performance Degradation Assessment Based on Information-Theoretic Metric Learning and Fuzzy c-Means Clustering. Meas. Sci. Technol. 2020, 31, 075001. [Google Scholar] [CrossRef] [Scilit]
- Sharma, A.; Amarnath, M.; Kankar, P.K. Feature Extraction and Fault Severity Classification in Ball Bearings. JVC/J. Vib. Control 2016, 22, 176–192. [Google Scholar] [CrossRef] [Scilit]
- Abdeljaber, O.; Sassi, S.; Avci, O.; Kiranyaz, S.; Ibrahim, A.A.; Gabbouj, M. Fault Detection and Severity Identification of Ball Bearings by Online Condition Monitoring. IEEE Trans. Ind. Electron. 2019, 66, 8136–8147. [Google Scholar] [CrossRef] [Scilit]
- Dong, S.; Wen, G.; Lei, Z.; Zhang, Z. Transfer Learning for Bearing Performance Degradation Assessment Based on Deep Hierarchical Features. ISA Trans. 2021, 108, 343–355. [Google Scholar] [CrossRef] [Scilit] [PubMed]
- Hoang, D.T.; Kang, H.J. A Survey on Deep Learning Based Bearing Fault Diagnosis. Neurocomputing 2019, 335, 327–335. [Google Scholar] [CrossRef] [Scilit]
- Chen, Y.; Rao, M.; Feng, K.; Zuo, M.J. Physics-Informed LSTM Hyperparameters Selection for Gearbox Fault Detection. Mech. Syst. Signal Process. 2022, 171, 108907. [Google Scholar] [CrossRef] [Scilit]
- Der, O.; Basar, G.; Mert, İ.; Yıldırım, E. Comparative Machine Learning for Multi-Response Quality Prediction in CO2 Laser Cutting of Polypropylene. Mater. Test. 2026, 68, 1311–1328. [Google Scholar] [CrossRef] [Scilit]
- Wen, H.; Almutairi, K.; Sinha, J.K.; Zhang, L. The Effect of Defect Size and Location in Roller Bearing Fault Detection: Experimental Insights for Vibration-Based Diagnosis. Sensors 2025, 25, 4917. [Google Scholar] [CrossRef] [Scilit] [PubMed]

Disclaimer/Publisher’s Note: The statements, opinions and data contained in all publications are solely those of the individual author(s) and contributor(s) and not of MDPI and/or the editor(s). MDPI and/or the editor(s) disclaim responsibility for any injury to people or property resulting from any ideas, methods, instructions or products referred to in the content. |
© 2026 by the authors. Licensee MDPI, Basel, Switzerland. This article is an open access article distributed under the terms and conditions of the Creative Commons Attribution (CC BY) license.