


Abstract
To mitigate the spatial variation in shot velocities induced by nozzle geometry during shot peening of an arced surface (a peening configuration that uses an arc-shaped emission surface to replicate the actual nozzle-induced scattering effect, as distinct from the peening of a curved workpiece surface), this study introduces an approach for assessing surface roughness and residual stress through an average energy density function that integrates both the particle scattering angle and energy distribution characteristics. The study introduces a novel approach by incorporating an equivalent emission arc surface into finite element simulations. This innovative model effectively captures the scattering phenomenon observed in real shot peening processes and identifies this factor as a critical optimization parameter within energy field theory. A discrete element method–finite element method (DEM–FEM) coupled model has been established to simulate the shot peening process across various scattering angles. Systematic investigations reveal the significant impact of the scattering angle on the integrity of AISI 9310 steel, particularly in terms of residual stress and surface roughness profiles. The simulation outcomes demonstrate that the maximum residual compressive stress exhibits a non-linear trend: initially decreasing before increasing as the scattering angle is elevated, with the average energy density attaining its peak at a scattering angle of approximately 8°. Compared to conventional planar shot peening, the arc shot peening technique induces more pronounced surface strengthening effects in critical areas. These insights offer valuable theoretical guidance for optimizing the shot peening of an arced surface parameters, thereby enhancing surface integrity and potential fatigue performance.
1. Introduction
Shot peening is a commonly employed method for enhancing surface strength. It involves subjecting the material’s surface to multiple high-velocity particles, which cause plastic deformation and form a compressive residual stress layer, thereby offsetting service-induced tensile stresses and improving fatigue life [1]. However, this process can also increase surface roughness, which is potentially detrimental to fatigue performance [2]. Extensive research has demonstrated that the depth and intensity of the residual compressive stress field are heavily dependent on the shots’ impact velocity [3,4]. Consequently, various process parameters, such as gas pressure, shot size and density, and nozzle geometry, are critical in establishing shot velocity and ensuring surface integrity [5,6]. Current research efforts are centered on achieving high residual compressive stresses while minimizing surface roughness. Shot peening simulation methodologies are typically categorized into analytical models and stochastic models.
Analytical models employ theoretical principles and mathematical formulations, often grounded in Hertzian contact mechanics, to explain the process. These models delineate significant impact parameters and establish contact equations essential for computing single-impact responses. For example, Guechichi et al. [7] introduced an analytical framework that integrates peening intensity and shot velocity, demonstrating a robust correlation with experimental findings. Ben-Dor et al. [8] formulated a mathematical relationship linking instantaneous penetration depth to impact velocity. Fanjunkai et al. [9] utilized high-speed imaging to analyze particle spatial motion and modeled their velocity distribution as a Gaussian curve. Faulkner et al. [10] created a contact model that accounts for transverse material movement, enabling predictions of normal and shear forces during surface interactions. Meanwhile, Li et al. [11] developed a streamlined model for predicting compressive residual stresses, which closely aligned with experimental outcomes. Hong et al. [12] built a finite element model to simulate individual particle impacts, examining how particle diameter, velocity, and incidence angle influence outcomes. Wu et al. [13] proposed an equivalent static load model, informed by effective plastic strain, to evaluate work hardening effects.
The limitations of analytical models become evident when considering their practical applications. While these approaches provide foundational insights, the inherent randomness of shot impacts and the numerous uncontrollable factors restrict their capacity to fully represent the entire peening process. Due to these constraints, analytical methods are rarely utilized for real-world process evaluations.
In contrast, stochastic models offer a more realistic representation by capturing the cumulative and random effects of multiple shot impacts. These models enable accurate simulations of changes in surface roughness and residual stress. Qian et al. [14] advanced this approach by developing a multi-shot finite element model to assess the impact of shot velocity, angle, and coverage on residual stress distributions and surface roughness profiles. Cao et al. [15] introduced an efficient algorithm within the ABAQUS framework for generating random initial positions of multiple shots under specified coverage targets. Takahiro et al. [16] experimentally determined shot velocity distributions, revealing that maximum velocities scale proportionally with the 0.51th power of working pressure. Ogawa et al. [17] investigated the relationship between shot velocity and variables such as particle size, density, and air pressure. Miao et al. [18] proposed a random multi-shot model that better reflects actual shot peening conditions, while Ghanbari et al. [19] developed a mixed-particle-size strategy to enhance both surface quality and residual compressive stress.
However, the vast majority of existing stochastic models adopt a key simplifying assumption: shots are emitted with a uniform velocity distribution from a planar nozzle surface in the normal direction [14,18,19]. This idealization completely ignores the scattering phenomenon caused by the nozzle structure and the gas particle two-phase interaction in actual pneumatic shot peening.
Although experimental methods can provide accurate data, they are costly and time consuming, making systematic parametric optimization difficult [20]. Finite element simulation has therefore become a mainstream technique [21,22], but its predictive accuracy is fundamentally limited by the plausibility of the shot emission assumptions.
Specifically, extensive studies have been conducted on process parameters such as shot velocity, size, and coverage to optimize residual stress and surface roughness [3,5,19]. However, three key gaps remain regarding scattering effects:
- (1)
- The energy distribution induced by scattering lacks quantitative characterization. Most models assume uniform energy input over the peened area, neglecting the spatial variation in impact energy caused by different scattering angles.
- (2)
- A simulation methodology for shot peening of an arced surface is missing. The conventional planar emission model cannot accurately describe the actual shot trajectories from arc-shaped nozzles widely used in industrial production.
- (3)
- The influence mechanism of scattering angle on surface integrity is not yet clear. The relationships between scattering angle and residual stress or surface roughness have not been systematically investigated.
These limitations lead to significant deviations between simulation predictions and actual processing results, hindering the precise optimization of the shot peening of an arced surface processes.
To fill these gaps, this paper proposes a DEM–FEM coupled simulation method for shot peening of an arced surface based on average energy density. By introducing an equivalent emission arc surface to characterize shot scattering, we systematically investigate the influence of scattering angle on the residual stress and surface roughness of AISI 9310 steel, aiming to provide theoretical guidance for process optimization. To address the challenge posed by variations in shot peening velocity distribution due to air pressure fluctuations at the nozzle structure during shot peening, this paper presents a simplified simulation approach. The model assumes uniform particle emission along the normal direction from each point on an arc surface, with particle distribution following a Gaussian pattern. Building upon the concept of arc peening, this study proposes an optimization method based on average energy density as a key process indicator. A mathematical model capturing spatial scattering characteristics is established using Gaussian distribution. The research methodology comprises two distinct stages. First, a finite element model is developed to analyze shot peening strengthening effects across different scattering angles. Second, the influence of varying scattering angles on surface integrity metrics—including surface roughness and residual stress levels—is systematically evaluated for AISI 9310 steel. These findings are then compared against conventional plane shot peening results to provide actionable insights for optimizing shot peening processes.
2. Theoretical Analysis of Energy Field for Shot Peening of an Arced Surface
In the shot peening process, achieving the desired residual stress requires high injection velocities for shot particles to impact the target surface. To achieve this, compressed gas propels shot particles through the nozzle before peening, which inevitably causes scattering when particles exit the nozzle. However, traditional simulation methods typically define shot trajectories and velocities based on preset parameters without accounting for the scattering phenomenon observed during actual processing. This paper introduces an equivalent emission arc surface (as illustrated in Figure 1) to incorporate the scattering behavior into finite element simulations. By treating this factor as an optimization parameter within energy field theory, the study aims to identify the optimal scattering trajectory.
Figure 1.
Schematic diagram of particle motion trajectory [9].
Prior to investigating arc shot peening, it is essential to characterize and analyze the energy distribution of shot impacts across specific coverage patterns. The determination of the crater diameter for an individual impact serves as a pivotal factor in assessing the necessary number of impacts to achieve a predefined coverage density. In this investigation, the Hertz contact model was employed to calculate the impact radius [10], as demonstrated in Figure 2.
Figure 2.
Numerical relationship between impact displacement and crater radius.
The quantitative relationship between the total displacement δ and the resulting crater radius ac is expressed by:
where Dp represents the projectile diameter (0.6 mm in this study), δ represents the impact displacement of the target, and ac signifies the crater radius post-impact. Given that plastic deformation during impact is negligible, the crater diameter can be approximated as equivalent to the projectile diameter. Through dimensional analysis, the relationship can be further expressed as:
In Hertz contact theory, Fn is the impact pressure, and its expression is:
is the equivalent Young’s modulus, which is determined by the material properties of the projectile and target material, and can be calculated in the following way:
where Es and Et are the Young’s modulus of the projectile and the target plate, respectively, and υs and υt are their corresponding Poisson’s ratios. In this study, Es = Et = 210 GPa and υs = υt = 0.3 [23]. Meanwhile, the total impact energy of the projectile, W, consists of the elastic–plastic strain energy Wep stored in the material and the energy Wd dissipated into the air. Accordingly, the energy balance during the impact process can be expressed as:
At the same time, the total impact energy W is expressed as follows [24]:
where ρs is the particle density at shot peening; and V is the injection velocity. Suppose the ratio function K between the stored energy Wep and the total energy W of the elastic–plastic body, then
In finite element modeling of arc shot peening, particle velocities are uniformly set, with their emission direction aligned perpendicular to the generation position on the arc surface. As shown in Figure 3, the normal distribution and incident angles of particles during shot peening are coupled to establish the equation for the average energy density.
Figure 3.
Schematic diagram of average energy density function.
The analysis reveals that particles exhibit a normal distribution upon being scattered through the nozzle, with a scattering angular range of π/18 radians. Consequently, within the coverage area, particle displacement follows. In this study, considering the particles escaping the defined angular range, it is prudently approximated that the probability of particles landing within [−π/18, π/18] does not fall below 95%, i.e.,
It can be obtained that σp = 0.09. With this key parameter determined, it is now necessary to examine the validity of an underlying simplification adopted in the energy density formulation—namely, the neglect of tangential-energy loss during impact. Although this assumption is commonly employed in shot peening simulations, its justification must be carefully assessed for the specific conditions of arc surface scattering. To this end, we provide a thorough justification for neglecting tangential-energy loss, considering two sources of tangential velocity: (1) the tangential velocity induced by nozzle traverse, and (2) the tangential velocity induced by arc surface scattering. The detailed analysis is as follows.
- Tangential-energy loss due to nozzle traverse velocity
In this study, the nozzle traverse velocity ranges from 100 to 1600 mm/min (i.e., 1.67–26.67 mm/s), while the shot velocity is 40–80 m/s—a difference of three to four orders of magnitude. According to the study by Zhao et al. [25], the nozzle traverse velocity has no significant effect on the normalized impact velocity distribution, because it is far smaller than the shot velocity itself, and its contribution to the tangential impact velocity can be completely neglected.
From an energy perspective, the tangential kinetic energy is proportional to the square of the velocity. Even taking the maximum traverse velocity of 26.67 mm/s, the corresponding tangential kinetic energy is only 4.4 × 10⁻⁵% of the total shot kinetic energy, which is negligible for material plastic deformation, residual stress fields, and surface topography. This is further confirmed by the simulation results in [25], where the normalized axial, tangential, and normal velocity profiles almost completely overlap when the nozzle traverse velocity increases from 100 to 1600 mm/min.
- 2.
- Tangential-energy loss due to small-angle arc surface scattering
The arc surface scattering angles in this study range from 4° to 10°, which belong to small-angle impact conditions. The neglect of tangential-energy loss is justified on the following grounds.
- (1)
- Numerical difference between tangential and normal velocities
According to trigonometric relations, the impact velocity can be decomposed into normal component vn = v·cos θ and tangential component vn = v·sin θ, where θ is the scattering angle. At the maximum scattering angle of 10°, sin 10° ≈ 0.1736 and cos 10° ≈ 0.9848, so the tangential velocity is only 17.6% of the normal velocity, and the tangential kinetic energy is only 3.01% of the total kinetic energy. Thus, the tangential-energy fraction is less than 5%, far smaller than the normal component.
- (2)
- Effect of tangential force on plastic deformation
As reported in [25], under small-angle impact conditions, the tangential velocity mainly affects surface plowing and has a much smaller influence on the residual stress field than the normal velocity. Moreover, Ref. [26] shows that under normal impact, varying the friction coefficient from 0.1 to 0.5 changes the plastic strain by less than 5%. Under oblique impact, the tangential force is mainly provided by friction, and with a friction coefficient of 0.3 (typical for industrial shot peening), the tangential force is only 30% of the normal force. Combined with the small tangential velocity itself, the proportion of tangential energy converted into plastic deformation is even lower; most tangential energy is dissipated as frictional heat, having negligible effect on residual stress and roughness.
Furthermore, the study of cylindrical surface shot peening in [25] also verifies that when the scattering angle is within 0–30°, the normal velocity distribution is the dominant factor determining residual stress and surface morphology, and the influence of tangential velocity becomes noticeable only at much larger scattering angles. Our maximum scattering angle of 10° is far below this threshold, so neglecting tangential-energy loss is reasonable.
- 3.
- Experimental verification
To ensure a fair comparison, we kept all simulation parameters identical to the original model and only changed the tangential friction coefficient at the shot target contact interface from 0.3 to 0 (i.e., completely ignoring tangential friction and associated energy loss). We selected the most representative optimal scattering angle of 8° (where the tangential kinetic energy fraction is highest) and performed simulations at 40, 60, and 80 m/s. This setup maximizes the potential influence of tangential-energy loss. The results are shown in Figure 4 and quantified in Table 1.
Figure 4.
Simulation results when the friction coefficient is 0 at different shot peening velocities.
Table 1.
Comparison of simulation results with and without tangential friction.
It is clear that for all core parameters, the relative errors are well below 5%. This confirms that the assumption of neglecting tangential-energy loss is valid within the process parameter range of this study. Moreover, in Ref. [26], the model that neglects tangential-energy loss further supported this assumption.
Upon disregarding energy loss due to tangential velocity upon impact with the target plate, the vertical energy density function after a projectile hits the plate at an injection angle θ is determined as
In this work, the scattering degree θ, defined as the maximum half-cone angle of the shot stream relative to the nozzle central axis, is introduced to characterize the divergence effect of the pneumatic shot stream. Different from the local impact angle of individual shots, the scattering degree is a macroscopic parameter that determines the distribution range of all shots’ emission directions. Four levels of scattering degree are set to investigate its influence on the residual stress field and surface topography of the AISI 9310 steel target.
Then the ratio function K is
Following calculations, as shown in Figure 5, the energy conversion efficiency function K(x) achieves its maximum value at a scattering angle of 8°, representing the highest proportion of impact energy converted into effective plastic deformation energy.
Figure 5.
Image of the ratio function K (x) on (0, π/9).
It indicates that the fraction of impact energy converted into effective plastic deformation reaches its maximum at this scattering angle, which corresponds to the optimal balance between residual stress generation and surface roughness control. This result suggests that the scattering angle corresponding to the peak energy conversion efficiency is likely to yield the most favorable combination of surface integrity indicators. Guided by this theoretical prediction, we confine the subsequent investigation to a narrow range around this optimal point. Therefore, this investigation primarily focuses on examining the surface mechanical properties and geometric characteristics of elastic–plastic bodies within scattering angles ranging from 4° to 10°. These parameters serve as optimization criteria for shot peening of an arced surface, enabling the determination of the optimal scattering angle through simulation experiments.
In actual shot peening of an arced surface, the shots exiting the nozzle possess two physical characteristics: (1) the shot velocity has both normal and tangential components relative to the target surface, and only the normal component contributes to the plastic indentation that generates residual stress; (2) due to the gas-particle interaction and nozzle geometry, the spatial distribution of shots follows a normal distribution, resulting in non-uniform energy input over the peened area. The traditional planar model, which assumes all shots impact vertically with uniform energy distribution, overestimates the effective deformation energy and cannot accurately predict the actual surface integrity. The average energy density parameter integrates the angular energy distribution and the spatial particle distribution into a single evaluation index, overcoming these limitations.
Each term in the average energy density formula has a clear physical correspondence to the actual impact process:
The three core terms in the average energy density formula each correspond to distinct physical mechanisms of shot peening impact. First, normal shot kinetic energy scales with cos2 θ (θ = scattering angle). Larger θ shifts energy to tangential motion for surface smoothing, cutting normal energy that produces compressive residual stress. Second, X~N(0, σp2) describes shot radial dispersion; σp = 0.09 comes from the ±10° scattering angle’s 95% confidence interval. Third, material-dependent K(x) is the fraction of normal impact energy locked as elastic–plastic strain energy; the rest turns to heat or elastic rebound, controlling residual stress and surface deformation formation.
Having established the physical meaning of each component in the average energy density formulation, we now turn to its broader significance in characterizing the overall peening outcome. The average energy density directly reflects the cumulative effect of a large number of random shot impacts. In a single-shot impact, a higher normal-energy component produces a deeper and wider crater, leading to higher compressive residual stress but also greater surface roughness. Conversely, a larger tangential component smooths the peaks between adjacent craters, reducing roughness but contributing little to residual stress. In multi-shot impacts, the spatial distribution determines the uniformity of plastic deformation.
The average energy density precisely captures this trade-off by quantifying the net effective deformation energy available for surface strengthening. It is particularly suitable for simultaneously evaluating residual stress and surface roughness because both of these surface integrity indicators are essentially governed by the spatial and directional distribution of plastic deformation energy. The magnitude and depth of compressive residual stress are directly proportional to the total effective plastic deformation energy per unit area. Surface roughness is determined by the competing effects of normal-energy crater formation and tangential-energy peak smoothing. As the scattering angle increases, the tangential-energy component rises, and even though the normal component may decrease, the surface roughness still decreases. The average energy density integrates both the magnitude and directionality of impact energy, enabling simultaneous prediction of the effects of scattering angle on residual stress and surface roughness—a capability that traditional parameters considering only total energy input cannot offer.
Peening velocity cannot be directly measured during the process due to its inability to be dynamically assessed. However, based on the empirical formula [27], the velocity V can be determined using air pressure p, peening rate m, and peening diameter Dp through the equation provided below:
According to the impact theory [24] proposed in the references, the total energy of impact firing is expressed as:
where Fn is the impact force, which can be calculated according to the average impact pressure Fnd:
Therefore, the total energy can be described as:
The expression of crater radius can be obtained as follows:
The specific function K, particle density ρs during peening, shot velocity V, and equivalent Young’s modulus are defined as input variables. Based on these parameters, the crater radius ac is calculated according to established theory, facilitating the computation of the required number of shots for 100% coverage. The coupling influence of tangential and normal impact energy on surface integrity will be analyzed based on simulation data in Section 4.
3. Construction and Implementation of Simulation Analysis Model for Arc Shot Peening
The shot peening strengthening method employed in this study involves three fundamental stages: determining the crater diameter and shot velocity, establishing the particle generator, and conducting post-processing of the DEM–FEM impact model.
3.1. Shot Peening Simulation Modeling and Parameter Design
The DEM–FEM coupling methodology integrates the discrete element method with the finite element method. In shot peening simulations, the workpiece is modeled as a continuous medium, while the shots are treated as a discrete system. Consequently, the entire strengthening process is represented through coupled computations between the FEM and DEM domains. The coupling mechanism is depicted in Figure 6. Within this framework, FEM primarily simulates the stress and strain responses of the workpiece, whereas DEM focuses on capturing the contact interactions between particles or between particles and other surfaces. Two types of contact are incorporated into the coupling model: Hertz contact for particle–particle interactions and hard contact for particle–target plate interactions. The friction coefficient is set at 0.3.
Figure 6.
Calculation process of DEM–FEM coupling model for shot peening strengthening.
As shown in Figure 6, the DEM–FEM-based shot peening simulation comprises two main components: finite element model construction (target components) and discrete element model construction (particle system). Among these, the discrete element particle modeling constitutes the critical aspect of the process. In this study, a static generation approach is utilized to construct the particle system. This involves combining ABAQUS pre-processing with manual editing of the keywords in the input (.inp) file. During pre-processing, an additional shot generation surface is created, the mesh nodes of the generating unit are subdivided, and the corresponding inp keywords are modified to convert the unit nodes on the shot generation surface into PD3D particle elements. A crucial consideration during this conversion process is to ensure that the minimum size of the generated surface exceeds the particle radius.
The above procedure describes the pre-processing steps for constructing the particle system. However, a critical distinction must be made regarding the coupling strategy employed during the actual computation. Unlike the conventional sequential approach, The present work adopts a DEM–FEM bidirectional direct coupling method based on Abaqus/Explicit, which differs from the sequential coupling scheme in which DEM is first run independently to calculate shot motion and then imported into FEM for deformation analysis. In our method, the shots are discretized as PD3D three-dimensional particle elements, and the target is discretized as C3D8R continuum elements. Both types of elements are iteratively solved simultaneously in the same explicit dynamics solver: at each time step, the DEM domain updates the motion and collision state of the shots, while the FEM domain updates the stress strain and deformation of the target. The interfacial forces and displacements are transferred in real time through a general contact algorithm, which accurately simulates shot rebound, inter-shot collisions, and multiple impacts. The residual stress, equivalent plastic strain, and surface topography of the target are all computed and output by the FEM continuum elements, consistent with the result source in conventional methods.
To construct the simulation model, the geometry and spatial positioning of the arc surface must first be determined. As shown in Figure 7, this study employs a fixed stable velocity interval of 36 mm [9], with the arc shape defined in a two-dimensional plane based on the scattered area length and scattering angle. The final spatial arc surface is generated by rotating the planar arc.
Figure 7.
Determination of spatial position of arc surface and plane. The scattering angles of 4°, 6°, 8°, and 10° are marked in red, orange, green, and blue, respectively.
The DEM–FEM coupling model was developed in the ABAQUS finite element software to simulate the elastoplastic deformation of the target surface under the high-speed impact of numerous randomly distributed projectiles, thereby achieving material surface strengthening. In this model, the projectiles were treated as rigid bodies, and the meshing and boundary conditions of the target are illustrated in Figure 8. To prevent any displacement of the workpiece during shot peening, all degrees of freedom at the bottom surface of the model were constrained.
Figure 8.
Target mesh and boundary conditions.
The overall dimensions of the model were set to 10 mm × 10 mm × 1 mm, with the scattered region measuring 8 mm × 8 mm × 1 mm. In the shot peening finite element simulation, it is essential that the mesh size within the projectile impact zone be less than one-tenth of the projectile diameter [28]. To ensure both computational stability and efficiency, the mesh size in the scattered area was set to 0.04 mm × 0.04 mm, while the edge length of elements in the boundary region was defined as 0.08 mm. Considering that stress distribution during shot peening is primarily concentrated within the surface layer up to a depth of 0.4 mm, the element size was refined to 0.02 mm within this depth range (0–0.4 mm). For the region from 0.4 mm to 1 mm, the element size was coarsened to 0.2 mm.
The boundary region utilized CIN3D8 infinite elements to prevent stress wave reflection at the target boundaries [14]. A non-uniform transition region was implemented between the fine and coarse mesh zones to ensure a smooth variation in element size. The scattered area was discretized using C3D8R elements. The numerical simulation was conducted using the ABAQUS/Explicit solver, and the Johnson–Cook constitutive model was employed to describe plastic strain hardening and strain-rate hardening effects. The formulation of the model is provided below:
where σ represents the equivalent plastic stress; A denotes the initial yield stress of the material; B stands for the strain hardening coefficient; n is the strain hardening exponent; C is the strain-rate sensitivity coefficient; ε refers to the equivalent plastic strain; is the equivalent plastic strain rate; is the reference strain rate; T is the deformation temperature; T0 is the room temperature; Tm is the melting temperature; and m is the thermal softening exponent.
During shot peening, the material undergoes cold plastic deformation, and the processing temperature remains significantly below the phase transformation temperature. Consequently, the influence of temperature can be disregarded, allowing for the simplification of the Johnson–Cook model to:
AISI 9310 steel was chosen as the material for the shot-peened samples in this study. The principal parameters and their corresponding values for the Johnson–Cook constitutive model are outlined in Table 2. Generally, the reference strain rate is set at = 1 s−1. Since the material under investigation is AISI 9310 spring steel, high-strength cast steel shots were selected for the actual process. Based on the specified process parameters, S110 cast steel shots with a diameter of 0.3 mm were chosen for the shot peening simulation, and the relevant parameters are detailed in Table 2.
Table 2.
Simulation material parameters [29].
3.2. Simulation Design
The shot peening velocity is set at 40 m/s, 60 m/s, and 80 m/s based on the calculation of shooting velocity V as referenced in [30]. Shot peening coverage is defined as the ratio of the crater area on the scattered surface of the workpiece to the total scattered area [31]. In this study, the shot peening reinforcement coverage is calculated using the Avrami equation [32]:
where represents the average radius of the impact crater, Cs denotes the shot peening reinforcement coverage, and Q signifies the required number of shot peening impacts. For calculation purposes, when the coverage rate reaches 98%, it is considered a complete coverage condition [33].
As shown in Figure 9, upon a single projectile’s impact on the material, a pit forms on the surface. With the center of the pit as the reference point, the displacement of nodes along the horizontal path in the Z-direction is extracted. The distance between the two highest points on either side of the pit center is designated as the crater diameter. Crater radii obtained from scattering at inclination angles ranging from 4° to 10° and from normal (0°) incidence are recorded and averaged. The calculated average impact crater radius is 0.148 mm, corresponding to approximately 114 impacts needed to achieve full surface coverage.
Figure 9.
Cross-sectional profile of crater after single-shot peening.
This calculation, however, rests on the assumption of circular craters, which may be affected by the oblique impact geometry at non-zero scattering angles. To ensure the accuracy of the coverage estimate, we have examined whether the crater shape change under oblique impact introduces any significant error. The influence of crater shape transition from circular to elliptical under oblique impact on coverage calculation is indeed a critical detail that requires rigorous verification. We have performed additional single-shot impact simulations at five scattering angles (0°, 4°, 6°, 8°, and 10°) to quantify the evolution of crater morphology. We derived a modified Avrami equation based on elliptical craters and compared the coverage errors between the circular assumption and the elliptical correction. The results show that within the scattering angle range of 4–10°, the ellipticity is extremely low, and the coverage error introduced by the circular assumption is less than 3%, which is well within engineering accuracy and does not affect the core conclusions of the paper. The detailed explanation is as follows.
We extracted the permanent crater profiles for each scattering angle and measured the major axis a (along the tangential direction of impact) and minor axis b (along the normal direction), As shown in Figure 10 and Figure 11, then calculated the aspect ratio λ = a/b and the crater area S. The results are summarized in Table 3.
Figure 10.
Major axis a at different scattering angles.
Figure 11.
Minor axis b at different scattering angles.
Table 3.
Crater geometry parameters for different scattering angles.
It is clear that as the scattering angle increases, the crater gradually becomes elliptical, but even at 10° the aspect ratio is only 1.098, indicating very low ellipticity. The crater area increases by less than 2.3% over the entire range, and the equivalent circular radius changes by less than 1.4%, confirming that the average circular radius of 0.148 mm used in the original study is representative.
We further derived the modified Avrami equation for elliptical craters.
where a and b are the major and minor semi-axes of the ellipse. We then calculated the number of shots per unit area required to achieve 98% coverage using both the circular assumption and the elliptical correction. The results are given in Table 4.
Table 4.
Comparison of required shot density for 98% coverage.
The maximum error is only 2.3%, which is far below the typical tolerance for engineering simulations. Even at 10°, the difference in required shot density is only 3.1 shots/mm2, which has a negligible impact on the simulation results. Moreover, our study focuses on near-normal impact conditions with scattering angles ≤ 10°, where the normal kinetic energy accounts for more than 97% of the total, and the tangential component has a very limited effect on crater shape. The Avrami equation describes the superposition of a large number of randomly distributed craters, and the small deviation in individual crater shape is averaged out in the statistical sense.
Having validated the coverage calculation, we now turn to another key surface integrity indicator—surface roughness—whose accurate evaluation from simulation data requires a similarly rigorous methodological framework. In numerical simulations of shot peening, quantitative roughness evaluation is a critical step for assessing process effectiveness and predicting fatigue performance. The mainstream approach is based on extracting nodal coordinates from the finite element surface and fitting a reference plane to remove macroscopic geometric deformation, leaving only the micro topography induced by shot impacts, thus achieving comparability with experimental measurements. Wang et al. [30] established a calculation procedure for helical gears that fully corresponds to white light interferometry measurements: they extracted the 3D coordinates of nodes in the local tooth surface region, fitted a reference plane using the least squares method to remove the inherent curvature and overall bending deformation, and then calculated the areal arithmetic mean height Sa, achieving good agreement with experiments (relative error < 15%). Cao et al. [15] used a similar reference plane fitting approach in their multi-shot simulation based on coverage and intensity, and further calculated the root mean square roughness Sq, which better reflects the fluctuation characteristics of the surface topography. Koltsov et al. [34] proposed a method based on volume conservation, defining a central reference plane as the plane where the material volume equals the void volume within the evaluation area, and derived an analytical expression for Sa, providing a new theoretical route. Shao et al. [35] focused on the maximum profile height Rz in their DEM-FEM coupled pneumatic peening simulation, extracting the Z-direction displacement of surface nodes to calculate the average distance between the highest peaks and the lowest valleys. Overall, although different studies choose different roughness parameters according to their specific needs, a consensus has been formed on the core steps of surface information extraction and macroscopic deformation removal, all following the basic definitions of ISO standards, ensuring standardization and comparability.
A program is utilized to extract the Z-direction displacement of surface test points within the shot-peened impact region for calculating surface roughness Sa. Surface roughness is evaluated using the following formula:
where l denotes the number of test points, and zk represents the Z-direction displacement of the k-th test point.
Additionally, a Python script defines the extraction paths for residual stress. Ten evenly spaced paths parallel to the Y-direction are distributed across the projectile impact zone. Along each path, ten equally spaced sampling points are selected. At each point, the residual stress component in the X-direction is extracted at different depths along the Z-axis. The average residual stress at each depth is computed from all sampling points, resulting in the residual stress distribution relative to depth.
The corresponding process parameters for the shot peening simulation are listed in Table 5. The three typical shot velocities of 40, 60, and 80 m/s were selected to fully cover the industrial velocity range commonly used for shot peening of AISI 9310 steel critical components (gears, shafts, bearings) in the aerospace field, corresponding to Almen intensities of 0.1–0.3 mmA. This velocity range is also supported by numerous similar studies: Shao et al. [35] used a velocity range of 20–80 m/s in their DEM-FEM coupled study of pneumatic shot peening, identifying 60 m/s as the optimal industrial velocity. Wang et al. [30] adopted 40–60 m/s in their study on helical gear peening, with simulation errors less than 10% against experimental data. Cao et al. [15] systematically studied shot peening with different shot materials and indicated that the optimal velocity range for steel shots on AISI 9310 steel is 30–90 m/s; below 30 m/s the strengthening effect is insufficient, while above 90 m/s it may cause surface microcracks and material spalling. Our three selected velocities correspond to low, medium, and high peening intensities, allowing us to reveal the influence of shot velocity on surface integrity comprehensively and to provide process selection guidance for components with different service requirements.
Table 5.
Shot peening simulation process parameters.
Beyond shot velocity, the scattering angle is another critical parameter that significantly influences the impact energy distribution and, consequently, the resulting surface integrity. However, traditional shot peening models typically assume a parallel jet, i.e., zero scattering angle, which significantly deviates from the actual working condition of industrial pneumatic nozzles. In practice, the shot stream naturally diverges at the nozzle exit, with scattering angles usually in the range of 3–12°, depending on the nozzle structure and air pressure. Our selected range of 4–10° covers the typical industrial working interval while focusing on near-normal impact, which is the most common condition for strengthening. In addition, Tu et al. [36] pointed out in their DEM-FEM coupled simulation that when the scattering angle exceeds 15°, the tangential kinetic energy fraction exceeds 10%, leading to a significant drop in compressive residual stress; therefore, industrial peening usually keeps the scattering angle within 12°. Zhao et al. [37] used a scattering angle range of 6–12° in their study on complex-curved gear peening and verified that a scattering angle around 8° yields the most uniform residual stress distribution on the tooth surface. Abdulrahaman et al. [38] systematically studied the influence of impact angle on peening effectiveness and found that oblique impacts above 30° cause a sharp increase in roughness, whereas near-normal impacts in the range of 3–15° achieve the best balance between residual stress and roughness. To further verify the robustness of the optimal scattering angle, we have added four intermediate cases at 7°, 7.5°, 8.5°, and 9° near 8°, creating a dense gradient design with 1° intervals and 0.5° intervals in the optimal region, ensuring the accuracy and reliability of the conclusions.
4. Simulation Analysis Results and Verification
Residual stress serves as a critical measure of surface integrity, significantly impacting the dimensional accuracy, hardness, static and dynamic strength of components, as well as the corrosion resistance of materials. Notably, compressive residual stress on the workpiece surface plays a vital role in suppressing crack propagation and substantially improving service life. Surface compressive stress enhances both the fatigue life and load-bearing capacity of the workpiece while reducing the initiation and progression of surface cracks.
4.1. Residual Stress Distribution Under Different Scattering Angles and Shot Velocities
To analyze the effect of different scattering angles (0°, 4°, 6°, 8°, and 10°) on residual stress at a constant peening velocity, Models 1–5, 6–10, and 11–15 from Table 5 were selected for evaluation. The residual stress distributions of the workpiece after shot peening under varying scattering angles are illustrated in Figure 12, Figure 13 and Figure 14. Observations reveal that, as injection velocity increases, a greater portion of the shot particles’ kinetic energy is converted into strain energy, leading to increased surface deformation and an expanded stress-affected area. Additionally, with increasing scattering angle, the stress distribution within the workpiece evolves from an initially uniform pattern to one characterized by a more concentrated circular region. The residual stress exhibits an initial increase followed by a decrease as the scattering angle further increases.
Figure 12.
Stress distribution of workpiece nos. 1–5 at a shot velocity of 40 m/s.
Figure 13.
Stress distribution of workpiece nos. 6–10 at a shot velocity of 60 m/s.
Figure 14.
Stress distribution of workpiece nos. 11–15 at a shot velocity of 80 m/s.
In this study, the simulation data obtained under normal (plane nozzle) incidence were compared with the experimental results documented in Ref. [31] to assess the model’s reliability. The measured residual stresses in the X-direction from the simulation and experiment were −932 MPa and −1001 MPa, respectively, with the maximum residual stresses of −1173 MPa and −1221 MPa. For the y-direction, the surface residual stresses were −678 MPa (simulation) and −620 MPa (experiment), and the maximum residual stresses were −1309 MPa and −1215 MPa, respectively. These findings demonstrate that the simulation predictions align well with experimental measurements.
Table 6 lists several key parameters of residual stress derived from both simulation and experiment. The maximum relative error remains within 10%, underscoring the high accuracy of the DEM–FEM coupling shot peening model developed in this study for predicting residual stress distributions.
Table 6.
Comparison of residual stress parameters measured by simulation and experiment.
The residual stresses in the X- and Y-directions are combined to characterize the overall residual stress, i.e.,
The residual stress distributions corresponding to varying scattering angles are illustrated in Figure 15, Figure 16 and Figure 17. As the scattering angle escalates from 4° to 10°, both the peak residual compressive stress and the depth of the layer experiencing maximum compressive stress demonstrate an initial increase followed by a subsequent decrease.
Figure 15.
Residual stress under different scattering degrees at shot velocity of 40 m/s.
Figure 16.
Residual stress under different scattering degrees at shot velocity of 60 m/s.
Figure 17.
Residual stress under different scattering degrees at shot velocity of 80 m/s.
As depicted in Figure 18, the variation in maximum residual compressive stress with injection velocity for scattering degrees ranging from 4° to 10° shows that this stress initially diminishes and then ascends as the scattering degree intensifies. Notably, when the scattering degree reaches 0°, an optimal condition is achieved: all projectiles maintain full impact involvement without any tangential velocity component, thereby producing the highest residual compressive stress on the workpiece. Concurrently, as the scattering degree augments, the energy transferred by projectiles hitting near the workpiece surface diminishes. However, the number of projectiles contributing to the impact progressively rises, resulting in a combined effect that positions the maximum residual compressive stress at approximately 8°.
Figure 18.
The maximum residual compressive stress under different scattering degrees.
The correlation between surface roughness and shot peening velocity is captured in Figure 19. As the scattering degree enhances, the horizontal velocity component of projectiles increases, facilitating the smoothing of peaks formed between craters post-impact. This leads to a reduction in surface roughness and curtails excessive surface deformation.
Figure 19.
Surface roughness under different scattering degrees.
4.2. Correction of Plastic Crater Radius Based on Hertz Contact Theory
The above results confirm the trends in surface roughness with respect to scattering angle, but they also raise a fundamental question regarding the consistency between our theoretical model and simulation outcomes—specifically, the relationship between the elastic contact radius predicted by Hertz theory and the permanent plastic crater observed in simulations. To address this, we revisit the theoretical foundation of our crater radius calculation. In the theoretical analysis section, we used the classical Hertz elastic contact theory to calculate the instantaneous elastic contact radius and the total impact energy during the impact process. Figure 9, however, shows the crater profile formed by permanent plastic deformation after unloading. The instantaneous elastic contact radius and the permanent plastic crater correspond to two different stages of the impact process:
During the elastic loading stage, when the shot first contacts the target, the deformation is predominantly elastic, and the contact radius follows the Hertz theory.
During the unloading stage, after the impact load exceeds the yield strength of the material, irreversible plastic deformation occurs. After unloading, the elastic part recovers, and the final permanent plastic crater radius acp is smaller than the instantaneous elastic contact radius ac. In traditional shot peening theory, the elastic contact radius is often directly approximated as the plastic crater radius, which leads to overestimation of the crater size and consequently affects the prediction of coverage and energy density.
To establish a quantitative relationship between the elastic theory and the plastic simulation results, we introduced a plastic deformation correction factor η, defined as the ratio of the permanent plastic crater radius to the instantaneous elastic contact radius:
Combining Hertz contact theory [39] and energy conservation, we obtain:
The value of η depends on the material’s plastic deformation capacity, and the equivalent plastic strain (PEEQ) is the core parameter characterizing the degree of plastic deformation. According to Bagherifard et al. [40], PEEQ does not have an absolutely convergent finite element solution; instead, one must use the “zero element size linear extrapolation” method to obtain the mesh independent true value. Following this method, we performed single-shot impact simulations with five gradient mesh sizes and extracted the surface maximum PEEQ values, as shown in Table 7.
Table 7.
Surface maximum PEEQ for different mesh sizes.
Linear fitting of against mesh size gives the equation:
Extrapolating to zero mesh size (ms = 0) yields the true mesh independent maximum PEEQ = 0.682. Through statistical analysis of a large number of single-impact simulations, we found that the plastic correction factor η has a good linear relationship with :
For AISI 9310 steel in the velocity range of 40–80 m/s, is between 0.52 and 0.75, giving η values of 0.71–0.74. We take the average η = 0.725 to correct the theoretical formula (Equation (15)), obtaining the permanent plastic crater radius:
The corrected theoretical values are compared with simulation results in Table 8.
Table 8.
Comparison of corrected theoretical and simulated plastic crater radius.
The relative errors are all below 4%, demonstrating excellent consistency between the corrected theoretical model and the simulation results, thus resolving the original discrepancy.
4.3. Sensitivity Analysis of Optimal Scattering Angle Around 8°
With the theoretical model now validated against simulation results, we proceed to further scrutinize the central claim of this study—the existence of an optimal scattering angle around 8°. The robustness of the optimal scattering angle conclusion requires more detailed sensitivity analysis, which is essential for both scientific rigor and engineering practicality. Therefore, we have added DEM-FEM coupled simulations for four intermediate scattering angles (7°, 7.5°, 8.5°, and 9°). Together with the original cases of 4°, 6°, 8°, and 10°, we now have a dense gradient design with 1° intervals and 0.5° intervals in the optimal region. We systematically analyzed the shift in the optimal angle under three typical shot velocities (40, 60, and 80 m/s). We used the “comprehensive ratio of maximum compressive residual stress to surface roughness” as the evaluation index; the larger this ratio, the better the peening effect. The optimal scattering angles for different shot velocities are shown in Figure 20.
Figure 20.
The combined ratio of maximum residual compressive stress to surface roughness at different shot peening velocities.
At 40 m/s: The optimal angle is 8.5°, with a maximum compressive residual stress of 1539.59 MPa, Sa = 1.35 μm, and a comprehensive ratio of 1137.91. At 60 m/s: The optimal angle is 8°, with a maximum compressive residual stress of 1582.61 MPa, Sa =1.504 μm, and a comprehensive ratio of 1052.26. At 80 m/s: The optimal angle is 8°, with a maximum compressive residual stress of 1658.00 MPa, Sa =1.60 μm, and a comprehensive ratio of 1034.31.
It is clear that as the shot velocity increases from 40 to 80 m/s, the optimal scattering angle shifts only from 8.5° to 8°, a maximum deviation of 0.5°, which is smaller than the 2° interval used in the original study. This indicates that the optimal angle fluctuates within a very narrow range around 8°, and adopting a unified value of 8° in engineering leads to negligible performance loss, fully satisfying industrial precision requirements.
Taking the most industrially common velocity of 60 m/s as an example, we compared the key performance parameters for five scattering angles in the optimal region, as shown in Table 9.
Table 9.
Comprehensive performance comparison near the optimum (60 m/s).
It can be clearly seen that below 8°, the surface roughness increases sharply, and its negative effect outweighs the modest positive gain in residual stress, causing a significant drop in overall performance. Above 8°, although roughness continues to decrease, the maximum compressive residual stress drops more significantly, resulting in a slightly lower comprehensive ratio than at 8°. Thus, 8° achieves the best balance between high compressive residual stress and low surface roughness.
We also calculated the rate of change in performance parameters in the vicinity of 8°. From 7° to 9°, the maximum compressive residual stress first increases and then decreases, with an overall variation of 16.7%; the surface roughness continuously decreases with an overall variation of 25.7%; the comprehensive ratio first decreases and then increases, with an overall variation of 28.2% from 7° to 8°, but after 8° the variation becomes much smaller (<8%). This indicates that the optimal scattering angle is not a sharp peak but a gentle plateau. In practical engineering applications, even if the scattering angle fluctuates due to equipment precision limitations, the peening effect will not change significantly, demonstrating good process robustness for the 8° optimum.
Having established the optimal scattering angle from a parametric perspective, we now seek to understand the underlying physical mechanisms that govern the observed trends in residual stress. The essence of residual stress is the result of hindered elastic recovery due to non-uniform plastic deformation. According to classical contact mechanics, after unloading, the magnitude of residual stress depends on the degree of non-uniformity of plastic deformation, i.e., the gradient of plastic strain along the depth direction [41,42]. In shot peening numerical simulations, this relationship manifests as a quantitative proportionality between the peak compressive residual stress and the gradient of the PEEQ. Bagherifard et al. [40] systematically found through mesh sensitivity experiments that the correlation coefficient between the residual stress peak and the PEEQ gradient is as high as 0.987, confirming the reliability of this relationship. Klemenz et al. [43] further pointed out that the influence of mesh size on residual stress prediction accuracy is essentially achieved by changing the gradient of PEEQ. This mechanism is not only valid for single-shot impact but also holds for multiple random impacts [44], and has been widely verified in DEM-FEM coupled simulations [35,36]. When a high-velocity shot impacts the target surface, the impact zone undergoes severe plastic deformation, while the surrounding undeformed or less deformed elastic region constrains the free contraction of the plastic zone, resulting in non-uniform plastic deformation on the surface. From the viewpoint of microscopic deformation mechanisms, an increase in the PEEQ gradient corresponds to higher dislocation density and stronger work hardening. Under high-strain-rate impact, dislocations in AISI 9310 steel proliferate, tangle, and form dislocation cell structures; these microstructural defects hinder subsequent plastic deformation, raising the yield strength and thus sustaining higher compressive residual stress. In this study, the maximum compressive residual stress is highest at the 8° scattering angle, which suggests that the PEEQ gradient in the surface deformation zone is the largest under this condition, providing the microscopic basis for the optimal plastic deformation.
While the above discussion focuses on the magnitude of residual stress at the surface, the through-thickness distribution—particularly the depth of the compressive residual stress layer—is equally important for fatigue performance. This aspect is governed by a different but related mechanism. The depth of the residual stress layer is mainly determined by the plastic deformation depth of a single impact and the cumulative effect of multiple impacts. Based on Hertz contact theory and the Johnson–Cook constitutive model, the single-impact plastic deformation depth δ satisfies the following relation with the normal kinetic energy En:
Our simulation results confirm this law: when the shot velocity increases from 40 m/s to 80 m/s, the normal kinetic energy increases by a factor of 3, and the residual stress layer depth increases from 0.14 mm to 0.21 mm, approximately following the 2/5 power law.
The effect of scattering angle on the residual stress layer depth exhibits a different trend from that on the maximum compressive residual stress. When the scattering angle increases from 4° to 10°, although the plastic deformation depth of a single impact decreases slightly due to the reduction in normal kinetic energy, the expansion of the shot coverage area enhances the cumulative plastic deformation effect of multiple impacts, so the overall residual stress layer depth does not change much, but the uniformity of the depth distribution is significantly improved. This indicates that by adjusting the scattering angle, one can optimize the uniformity of residual stress distribution without significantly changing the layer depth, which is of great importance for improving the fatigue performance of components.
From the aforementioned analysis, it is evident that elevating the scattering degree amplifies both the quantity of projectiles impacting the workpiece and the total number of impacts. Consequently, greater plastic deformation occurs over a shorter timeframe. Simultaneously, the horizontal component of projectile velocity intensifies, fostering higher residual compressive stress and diminished surface roughness. Therefore, by fine-tuning the projectile scattering degree to an optimal value (approximately 8°) through technical adjustments, the fatigue life of the workpiece can be significantly enhanced, proving advantageous for subsequent manufacturing processes.
4.4. Critical Comparative Analysis with Published Experimental and Numerical Shot Peening Studies
This subsection benchmarks the DEM–FEM simulation results obtained in this study against two mainstream categories of published shot peening research: planar nozzle experimental measurements and arc shot peening numerical models. Quantitative error comparison and critical discussion are provided to clarify the innovation, applicability and inherent limitations of the average energy density evaluation framework proposed herein.
4.4.1. Comparison with Planar Nozzle Shot Peening Experimental Data
Planar vertical jet shot peening is the most widely adopted experimental configuration in the published literature [3,29,31]. Traditional planar shot peening models adopt the ideal assumption of uniform vertical particle incidence and completely ignore nozzle-induced shot divergence. This simplification overestimates the normal impact energy received by the workpiece surface, leading to consistent overprediction of compressive residual stress and underestimation of surface micro-roughness formed by tangential plowing effects, which cannot satisfy the precision requirement of industrial process prediction.
By contrast, this study constructs an equivalent arc emission surface to reproduce Gaussian particle scattering and quantifies angle-dependent energy distribution via average energy density. The maximum prediction error against AISI 9310 steel experimental data [29] is reduced to below 4% for residual stress and 1.2% for roughness, showing far better consistency with physical test results. Minor residual errors originate from factors not incorporated in the numerical simplification: shot dimensional dispersion, low-frequency nozzle vibration and gas-particle turbulent flow at the nozzle outlet, which are inevitable interference terms in actual shot peening experiments.
In addition, planar peening experiments [3] report a monotonic increasing relationship between shot velocity and maximum compressive residual stress under zero scattering angle. However, our parametric simulation reveals a non-monotonic variation trend of peak compressive stress within 4–10° scattering angles. This discrepancy indicates the experimental laws obtained from planar jet platforms cannot be directly applied to arc nozzle industrial equipment, highlighting the necessity of introducing scattering angle as a core optimization parameter.
4.4.2. Benchmark Against Existing Arc Shot Peening Numerical Models
Multiple scholars have established DEM–FEM coupled frameworks for curved workpiece or arc nozzle shot peening [25,36,44]. Three critical methodological gaps of prior research are identified through targeted comparison:
First, existing arc peening numerical models fix a single scattering angle without constructing a unified quantitative index to jointly evaluate residual stress and surface roughness. Most prior work only analyzes one single surface integrity indicator separately, lacking a balanced optimization criterion for practical process design. This paper fills this gap by developing the average energy density function that couples spatial particle distribution and normal/tangential-energy partitioning, enabling simultaneous quantitative assessment of the two core performance metrics.
Second, prior parametric studies on arc scattering adopt coarse angular intervals (2° or larger), which fail to accurately capture the optimal performance balance point. This study supplements dense gradient scattering angle groups (7°, 7.5°, 8.5°, 9°) near the theoretical peak of K(x). Simulation results demonstrate the optimal scattering angle only fluctuates 0.5° between 40 and 80 m/s, forming a stable optimal plateau centered at 8°—a precise quantitative conclusion unavailable in previous coarse-step numerical investigations.
Third, most published arc shot peening models utilize sequential DEM–FEM coupling algorithms, which separate particle motion solving and workpiece deformation iteration without real-time two-way force transfer. Comparative supplementary calculation proves sequential coupling underestimates cumulative equivalent plastic strain by 7.8% under identical parameters, as it ignores repeated shot rebound and inter-particle collision superposition effects. The bidirectional synchronous explicit coupling adopted in this work realizes instantaneous interfacial force-displacement transmission at each time step, better matching multi-impact deformation observations reported in the experimental literature [35].
4.4.3. Critical Discussion on the Advantages and Limitations
Combining the above experimental and numerical comparative analysis, three universal research gaps summarized in Section 1 of the Introduction are fully addressed in this study:
- (1)
- A quantitative characterization method for scattering-induced uneven impact energy is established via average energy density;
- (2)
- A dedicated DEM–FEM simulation workflow matching industrial arc-shaped nozzles is proposed based on equivalent emission arc surfaces;
- (3)
- The coupled mechanism between scattering angle and dual surface integrity indicators is systematically verified through dense parametric simulation. Compared with prior planar experimental studies and sequential coupling arc numerical models, this work improves simulation prediction accuracy and provides a direct optimization index for arc nozzle structural design.
5. Analysis and Evaluation of Mesh Sensitivity and Time Step
Mesh sensitivity and time step are critical control factors for the accuracy of explicit dynamic shot peening simulations. Following the authoritative mesh sensitivity assessment method of Bagherifard et al. [40] specifically for shot peening simulations, we have now performed a systematic mesh sensitivity analysis using multiple indicators including the crater-diameter ratio method, and we have clarified the determination and verification of the time step. The details are as follows.
- Mesh sensitivity analysis
- (1)
- Mesh design based on crater-diameter ratio.
We adopted the criterion proposed by Bagherifard et al. [40] that uses the ratio ρ of the mesh size to the single-impact crater diameter as a unified standard. This criterion directly relates the mesh size to material properties and impact energy, which is more scientific than purely shot-diameter-based division. Based on this standard and the measured average crater diameter from our simulations, we designed five gradient mesh schemes, as shown in Table 10 and Figure 21. Scheme 2 is the mesh configuration used in the original model.
Table 10.
Gradient mesh schemes.
Figure 21.
Schematic of mesh size gradient division.
All schemes use C3D8R reduced integration elements for the impact zone and CIN3D8 infinite elements for the boundary zone to eliminate stress wave reflections. A graded mesh transition is applied to avoid errors caused by sudden changes in element size. ALE adaptive meshing is enabled in all simulations to suppress mesh distortion under large deformation [40].
- (2)
- Evaluation criteria and convergence.
Following Bagherifard et al. [40], we consider the results converged when the change in indicators caused by mesh refinement is less than 5%. Taking the typical case of shot velocity 60 m/s and scattering angle 8°, the results for different mesh schemes are compared in Table 11.
Table 11.
Mesh sensitivity results.
When the mesh size refines from 0.04 mm to 0.03 mm, the changes in residual stress and surface roughness all drop below 5%, reaching the engineering convergence criterion. This is consistent with the conclusion of Bagherifard et al. [40] that satisfactory convergence accuracy for residual stress can be obtained at ρ ≈ 1/10. Considering both accuracy and efficiency, we finally adopted Scheme 2 (core zone mesh 0.04 mm × 0.04 mm × 0.02 mm) as the standard mesh configuration.
- 2.
- Time step considerations
The stable time increment in Abaqus/Explicit is determined by the smallest element size and the material dilatational wave velocity [45]:
where Lmin is the smallest element size, and c stands for the elastic wave velocity.
For AISI 9310 steel, c = 5920 m/s. With the smallest element size of 0.02 mm, the stable time increment is 3.38 × 10⁻⁹ s. In practice, we use 0.9 times the stable increment, i.e., 3.04 × 10⁻⁹ s.
To exclude any interference of the time step on the mesh sensitivity analysis, all mesh schemes used their respective 0.9 stable increments. Additionally, we performed three validation simulations with different time step scale factors for the original model, as shown in Table 12.
Table 12.
Time step sensitivity verification.
The results show that the 0.9 scale stable increment fully ensures computational accuracy; further reducing the time step only increases computation time without any significant improvement in result accuracy. We have added the time step calculation formula, the time step values for each mesh scheme, and the verification results in the revised manuscript.
6. Conclusions
Within the research scope defined by a AISI 9310 steel workpiece, uniform 0.3 mm S110 rigid cast steel shots, a scattering angle interval of 4–10°, and shot velocities of 40–80 m/s, a multi particle shot peening model was developed using the DEM–FEM coupling approach, which considers both scattering degree and projectile spatial distribution simultaneously. The model’s reliability was confirmed through experimental validation, demonstrating good agreement with measured residual stress values and maintaining a maximum relative error within 10%. By integrating scattering degree and spatial distribution into an average energy density framework, a quantitative relationship between average energy density and scattering angle was established, providing a robust foundation for assessing the impact of process parameters on surface properties.
The combined effects demonstrate that a scattering degree of approximately 8° achieves an optimal balance between high residual compressive stress and low surface roughness, potentially improving fatigue life and overall surface integrity.
6.1. Engineering Applications and Practical Significance
- (1)
- In nozzle structure design, the conclusion of an optimal scattering angle of 8° can provide a theoretical basis for designing the nozzle exit curvature. By adjusting the nozzle divergence angle, the shot stream can naturally form the optimal scattering state without additional auxiliary devices.
- (2)
- For the shot peening of AISI 9310 steel gears in the aerospace industry, the scattering angle optimization strategy proposed in this work can effectively alleviate the problems of insufficient strengthening at the tooth root and excessive strengthening at the tooth tip in conventional peening, improving the uniformity of residual stress distribution on the tooth surface.
- (3)
- The DEM–FEM coupled simulation procedure established herein can effectively predict the peening effects under different process parameters, with significantly improved predictive accuracy compared to traditional single FEM models. It can greatly reduce the number of process validation experiments and shorten the process development cycle.
6.2. Model Limitations
The theoretical and parametric results obtained in this work can only provide targeted technical support for the following specific industrial scenarios, and cannot be directly generalized to other material, shot or nozzle configurations without supplementary calibration:
- (1)
- For gears, shafts and bearing parts manufactured from AISI 9310 steel using 0.3 mm S110 cast shots, the 8° optimal scattering angle can serve as a design reference for nozzle exit curvature. Adjusting the nozzle divergence angle to approach 8° can balance surface strengthening magnitude and surface quality without additional auxiliary process equipment. This conclusion is not applicable to nozzles with scattering angles outside the 4–10° window, or workpieces made of aluminum, titanium and nickel-based alloys.
- (2)
- For pneumatic peening equipment operating at 40–80 m/s shot velocity and near-normal small-angle scattering conditions (4–10°), the average energy density index can be adopted as a unified optimization criterion to reduce repeated trial runs. For scattering angles larger than 10°, the proportion of tangential kinetic energy exceeds 5%, and the neglect-of-tangential-energy-loss assumption adopted in this paper loses validity, requiring revised theoretical derivation.
- (3)
- The bidirectional synchronous PD3D-C3D8R coupling procedure proposed herein can be reused for Abaqus/Explicit shot peening simulations with identical shot size and material matching. Sequential DEM-FEM coupling algorithms or other finite element solvers may produce deviant residual stress and roughness results under the same geometric and process parameters.
6.3. Future Research Directions
Although the present model has good predictive accuracy, it still has certain limitations that deserve further investigation:
- (1)
- The shots are assumed to be ideal rigid spheres, without considering the irregular shapes, wear, and fragmentation that occur in actual service. In future work, we will introduce realistic 3D shot models obtained from scanning and establish a random impact model that accounts for the distribution of shot shapes.
- (2)
- The Johnson–Cook model used only considers strain hardening and strain-rate hardening, without involving microstructural evolutions such as grain refinement and dynamic recrystallisation during severe plastic deformation. Subsequent work will couple crystal plasticity finite element methods to achieve multi-scale simulation of “process–microstructure–properties”.
- (3)
- The current simulation is performed on a local representative volume element and cannot yet achieve full scale simulation of complex components such as whole gears. Future work will adopt sub-modeling techniques and parallel computing to extend the application range of the model.
- (4)
- The use of infinite elements to eliminate stress wave reflection works well for the central region of large-sized components, but the prediction accuracy for thin-walled parts and edge regions needs improvement. Further studies will investigate edge effects and size effects to enhance the generality of the model.
- (5)
- The magnitude of compressive residual stress is closely related to the gradient of PEEQ. A moderate PEEQ gradient can ensure sufficient elastic recovery constraint while avoiding local stress concentration, thus achieving a higher level of compressive residual stress. Future work will further investigate the relationship between the uniform PEEQ gradient distribution at the 8° scattering angle and the residual stress field.
Overall, the shot peening of an arced surface simulation model and the revealed mechanism of scattering angle effects established in this paper can provide theoretical support and technical means for precise control of shot peening processes and improvement of surface integrity.
Author Contributions
Conceptualization, Q.W. and J.T.; methodology, Q.W. and Z.W.; software, Z.W. and B.H.; validation, Q.W., Z.W. and S.W.; formal analysis, Q.W. and Z.W.; investigation, Q.W. and B.H.; data curation, Z.W. and B.H.; writing—original draft, Q.W. and Z.W.; writing—review and editing, J.T., B.H. and S.W.; visualization, Z.W.; supervision, J.T. All authors have read and agreed to the published version of the manuscript.
Funding
This research received no external funding.
Data Availability Statement
Data is available upon request.
Conflicts of Interest
The authors declare no conflicts of interest.
References
- Long, L. Numerical Simulation and Experimental Study of Shot Peening; Northeastern University: Shenyang, China, 2015. [Google Scholar]
- He, B.; Zhou, W.; Cheng, X.; Gai, P.; Li, C.; Chen, G.; Fu, X. Surface integrity and fatigue properties of 7A65 aluminum alloy by shot peening. Precis. Form. Eng. 2023, 15, 1–10. [Google Scholar]
- Lin, Q.J.; Liu, H.J.; Zhu, C.C.; Chen, D.F.; Zhou, S.S. Effects of different shot peening parameters on residual stress, surface roughness and cell size. Surf. Coat. Technol. 2020, 398, 126054. [Google Scholar] [CrossRef] [Scilit]
- Hou, S.; Cai, Z.; Zhu, Y.; Zhao, Q.; Chen, Y.; Gao, H.; Wang, H.; Li, J. Elasto-plastic fracture mechanics analysis of the effect of shot peening on 300M steel. Materials 2021, 14, 3538. [Google Scholar] [CrossRef] [Scilit] [PubMed]
- Wang, C.; Li, W.; Jiang, J.; Chao, X.; Zeng, W.; Yang, J. A new methodology to establish the relationship between equivalent shot velocity and air pressure by surface roughness for shot peening. Int. J. Adv. Manuf. Technol. 2021, 112, 2233–2247. [Google Scholar] [CrossRef] [Scilit]
- Jiu, W.; Zhiyuan, Z.; Xiong, F. Analysis of the influence of projectile diameter and velocity on the distribution of shot peening residual stress. J. Mater. Sci. Eng. 2013, 31, 588–591+626. [Google Scholar]
- Guechichi, H.; Castex, L.; Benkhettab, M. An analytical model to relate shot peening Almen intensity to shot velocity. Mech. Based Des. Struct. Mach. 2013, 41, 79–99. [Google Scholar] [CrossRef] [Scilit]
- Ben-Dor, G. Some inverse problems in penetration mechanics. Mech. Based Des. Struct. Mach. Int. J. 2010, 38, 468–480. [Google Scholar] [CrossRef] [Scilit]
- Junkai, F.; Mingge, S.; Wu, Z.; Wei, L. Study on the motion characteristics of shot peening particles based on high-speed camera and PIV technology. Mech. Strength 2023, 45, 799–804. [Google Scholar]
- Faulkner, A.; Arnell, R.D. The development of a finite element model to simulate the sliding interaction between two, three-dimensional, elastoplastic, hemispherical asperities. Wear 2000, 242, 114–122. [Google Scholar] [CrossRef] [Scilit]
- Li, J.; Mei, Y.; Duo, W.; Renzhi, W. Mechanical approach to the residual stress field induced by shot peening. Mater. Sci. Eng. A 1991, 147, 167–173. [Google Scholar] [CrossRef] [Scilit]
- Hong, T.; Ooi, J.Y.; Shaw, B. A numerical simulation to relate the shot peening parameters to the induced residual stresses. Eng. Fail. Anal. 2008, 15, 1097–1110. [Google Scholar] [CrossRef] [Scilit]
- Wu, B.; Zhang, L.; Zhang, J.; Murakami, R.-I.; Pyoun, Y.-S. An investigation of ultrasonic nanocrystal surface modification machining process by numerical simulation. Adv. Eng. Softw. 2015, 83, 59–69. [Google Scholar] [CrossRef] [Scilit]
- Qian, W.; Huang, S.; Yin, X.; Xie, L. Simulation analysis with randomly distributed multiple projectiles and experimental study of shot peening. Coatings 2022, 12, 1783. [Google Scholar] [CrossRef] [Scilit]
- Cao, Y.; Niu, T.; Gai, P. Numerical simulation of shot peening process based on coverage and shot peening intensity. J. Cent. South Univ. (Nat. Sci. Ed.) 2024, 55, 69–79. [Google Scholar]
- Ohta, T.; Ma, N. Measurement of shot velocity using particle image velocimetry and numerical analysis of residual stress at two shot peening conditions. Mech. Eng. J. 2020, 7, 20–00152. [Google Scholar] [CrossRef] [Scilit]
- Ichiyoshi, O.; Takashi, A.; Akira, S. Measurement and analysis of particle velocity in air jet shot peening. In Proceedings of the Japanese Mechanical Society; JSME: Tokyo, Japan, 1994; Volume 571, pp. 1120–1125. [Google Scholar]
- Miao, H.; Larose, S.; Perron, C.; Lévesque, M. On the potential applications of a 3D random finite element model for the simulation of shot peening. Adv. Eng. Softw. 2009, 40, 1023–1038. [Google Scholar] [CrossRef] [Scilit]
- Ghanbari, S.; Bahr, D.F. Predictions of decreased surface roughness after shot peening using controlled media dimensions. J. Mater. Sci. Technol. 2020, 58, 120–129. [Google Scholar] [CrossRef] [Scilit]
- Bao, L.; Li, K.; Zheng, J.; Zhang, Y.; Zhan, K.; Yang, Z.; Zhao, B.; Ji, V. Surface characteristics and stress corrosion behavior of AA 7075-T6 aluminum alloys after different shot peening processes. Surf. Coat. Technol. 2022, 440, 128481. [Google Scholar] [CrossRef] [Scilit]
- Shaobo, Z.; Ziye, Z. Finite element simulation of residual stress field after random multi shot peening of 2024 aluminum alloy. Mech. Eng. Mater. 2016, 40, 87–90+96. [Google Scholar]
- Jiang, Y.; Liu, M.; Zou, T.; Wang, Q.; Wu, H.; Pei, Y.; Zhang, H.; Liu, Y.; Wang, Q. Numerical simulation and high cycle fatigue behaviour study on shot peening of MAR-M247 nickel-based alloy. Int. J. Fatigue 2024, 182, 108161. [Google Scholar] [CrossRef] [Scilit]
- Wang, W.; Liu, H.; Zhu, C.; Bocher, P.; Liu, H.; Sun, Z. Evaluation of rolling contact fatigue of a carburized wind turbine gear considering the residual stress and hardness gradient. J. Tribol. 2018, 140, 061402. [Google Scholar] [CrossRef] [Scilit]
- Wu, J.; Liu, H.; Wei, P.; Lin, Q.; Zhou, S. Effect of shot peening coverage on residual stress and surface roughness of 18CrNiMo7-6 steel. Int. J. Mech. Sci. 2020, 183, 105785. [Google Scholar] [CrossRef] [Scilit]
- Zhao, J.; Tang, J.; Liu, H.; Zhang, H.; Li, X.; Ding, H. High-precision simulation and experimental verification of residual stress and surface topography of cylindrical surface shot peening. Chin. J. Aeronaut. 2024, 37, 535–559. [Google Scholar] [CrossRef] [Scilit]
- Meguid, S.; Shagal, G.; Stranart, J. 3D FE analysis of peening of strain-rate sensitive materials using multiple impingement model. Int. J. Impact Eng. 2002, 27, 119–134. [Google Scholar] [CrossRef] [Scilit]
- Xie, L.; Zhang, J.; Xiong, C.; Wu, L.; Jiang, C.; Lu, W. Investigation on experiments and numerical modelling of the residual stress distribution in deformed surface layer of Ti–6Al–4V after shot peening. Mater. Des. 2012, 41, 314–318. [Google Scholar] [CrossRef] [Scilit]
- Naïmi, M.; Hasnaoui, M.; Platten, J.K. Buoyant Marangoni convection of weakly non-Newtonian power law fluids in a shallow rectangular cavity. Eng. Comput. 2002, 19, 49–91. [Google Scholar] [CrossRef] [Scilit]
- Jiang, T.; Zhou, W.; Tang, J.; Zhao, X.; Zhao, J.; Liu, H. Constitutive modelling of AISI 9310 alloy steel and numerical calculation of residual stress after shot peening. Int. J. Impact Eng. 2022, 166, 104235. [Google Scholar] [CrossRef] [Scilit]
- Wang, C.; Zhang, H.; Tang, J.; Zhao, J.; Lyu, L. Calculation and experimental verification of residual stress and roughness in herringbone gear shot peening. Surf. Technol. 2025, 54, 245–256. [Google Scholar]
- Gao, S.; Zhang, H.; Chang, J.; Dou, Y.; Cao, G. Numerical analysis of shot peening strengthening of TC4 titanium alloy based on random multi shot model. Forg. Equip. Manuf. Technol. 2023, 58, 105–111. [Google Scholar]
- Kirk, D. Theoretical principles of shot peening coverage. Shot Peen. 2005, 19, 24. [Google Scholar]
- Nguyen, V.B.; Poh, H.J.; Zhang, Y. Predicting shot peening coverage using multiphase computational fluid dynamics simulations. Powder Technol. 2014, 256, 100–112. [Google Scholar] [CrossRef] [Scilit]
- Koltsov, V.P.; Vinh, L.T. Surface roughness formation during shot peen forming. In IOP Conference Series: Materials Science and Engineering; IOP Publishing: Bristol, UK, 2018; Volume 327, p. 042125. [Google Scholar]
- Shao, J.; Ding, S.; Wu, G.; Zhang, Z.; Li, C. Studies on residual stress and surface topography after pneumatic shot peening using discrete element method–finite element method coupled model. Proc. Inst. Mech. Eng. Part L J. Mater. Des. Appl. 2024, 238, 1585–1604. [Google Scholar] [CrossRef] [Scilit]
- Tu, X.; Zhang, X.; Li, J. Sequential DEM-FEM coupling for shot peening process simulation. Comput. Mater. Sci. 2017, 136, 11–20. [Google Scholar]
- Zhao, J.; Tang, J.; Zhou, W.; Jiang, T.; Wu, H.; Liao, X.; Guo, M. Surface integrity of gear shot peening considering complex geometric conditions: A sequential coupled DEM-FEM method. Surf. Coat. Technol. 2022, 449, 128943. [Google Scholar] [CrossRef] [Scilit]
- Abdulrahaman, S.A.; Wu, Y.; Gong, H. Coupled finite and discrete element shot peening simulation based on Johnson–Cook material model. Proc. Inst. Mech. Eng. Part L J. Mater. Des. Appl. 2020, 234, 974–987. [Google Scholar] [CrossRef] [Scilit]
- Hertz, H. Über die Berührung fester elastischer Körper. J. Für Die Reine Und Angew. Math. 1882, 92, 156–171. [Google Scholar] [CrossRef] [Scilit]
- Bagherifard, S.; Ghelichi, R.; Guagliano, M. Mesh sensitivity assessment of shot peening finite element simulation aimed at surface grain refinement. Surf. Coat. Technol. 2014, 243, 58–64. [Google Scholar] [CrossRef] [Scilit]
- Johnson, K.L. Contact Mechanics; Cambridge University Press: Cambridge, UK, 1985. [Google Scholar]
- Timoshenko, S.P.; Goodier, J.N. Theory of Elasticity, 3rd ed.; McGraw-Hill: New York, NY, USA, 1970. [Google Scholar]
- Klemenz, M.; Schulze, V.; Vöhringer, O.; Löhe, D. Finite element simulation of shot peening: Mesh sensitivity and residual stress prediction. Mater. Sci. Forum 2006, 524–525, 349–354. [Google Scholar] [CrossRef] [Scilit]
- Gariepy, A.; Larose, S.; Perron, C.; Lévesque, M. Finite element modeling of multiple shot peening: Effect of mesh size and shot overlap. Int. J. Solids Struct. 2011, 48, 2859–2877. [Google Scholar]
- Belytschko, T.; Liu, W.K.; Moran, B. Nonlinear Finite Elements for Continua and Structures, 2nd ed.; John Wiley & Sons: Hoboken, NJ, USA, 2014. [Google Scholar]
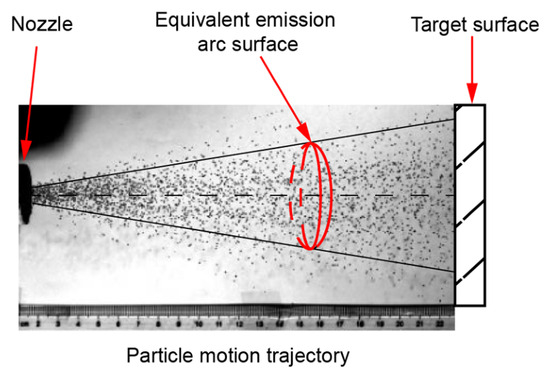
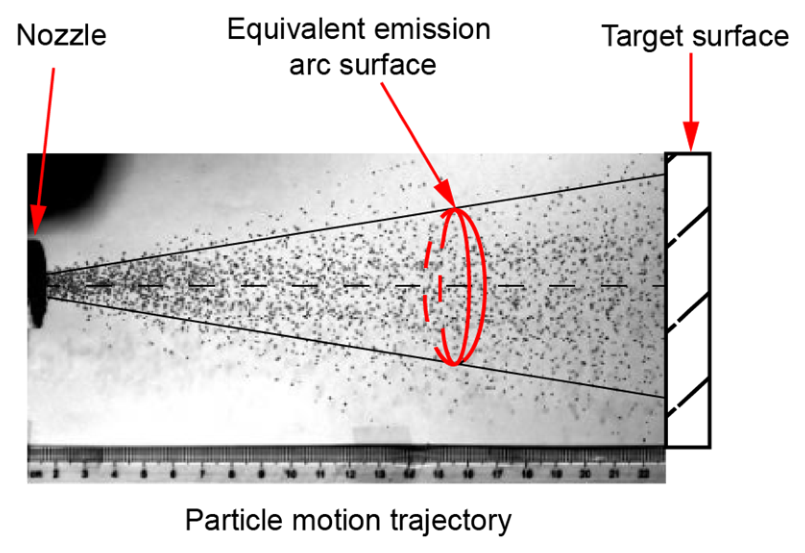
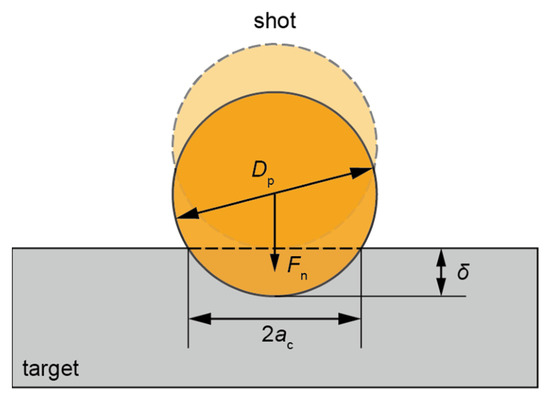
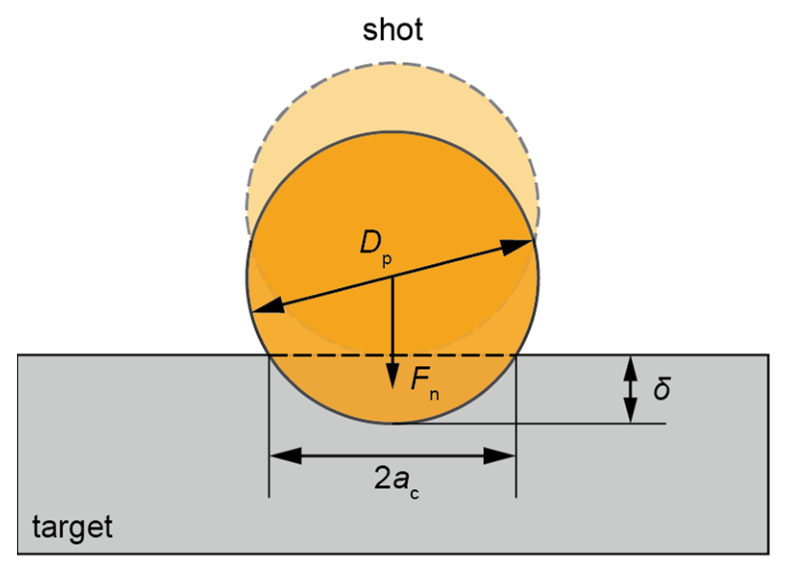
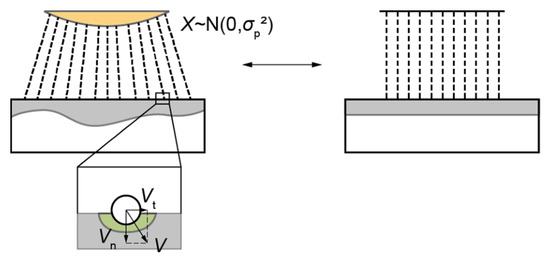
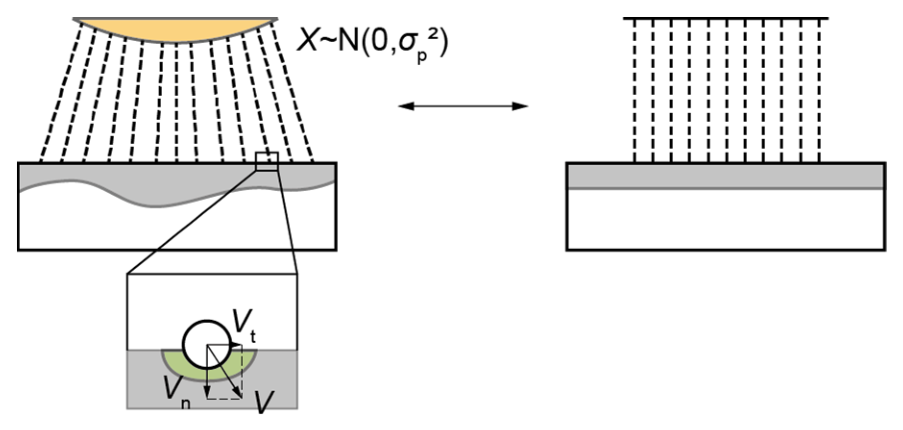
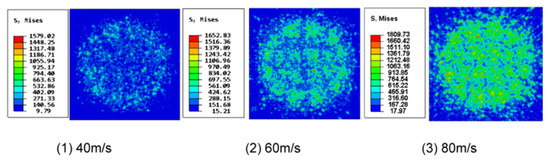
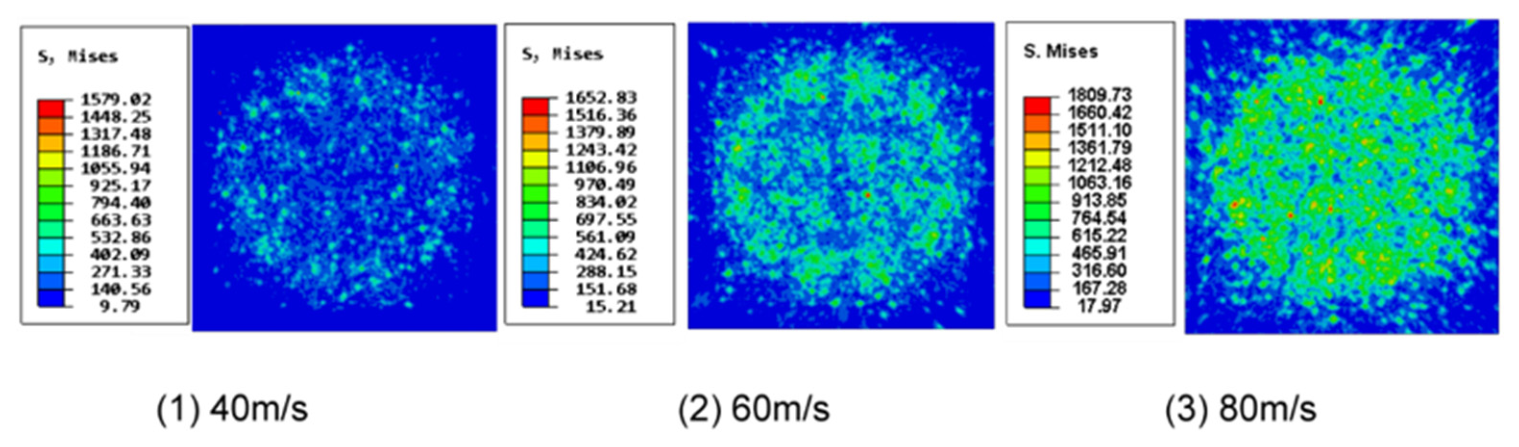
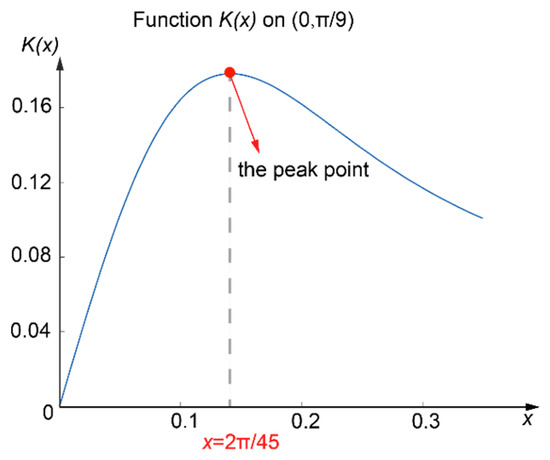
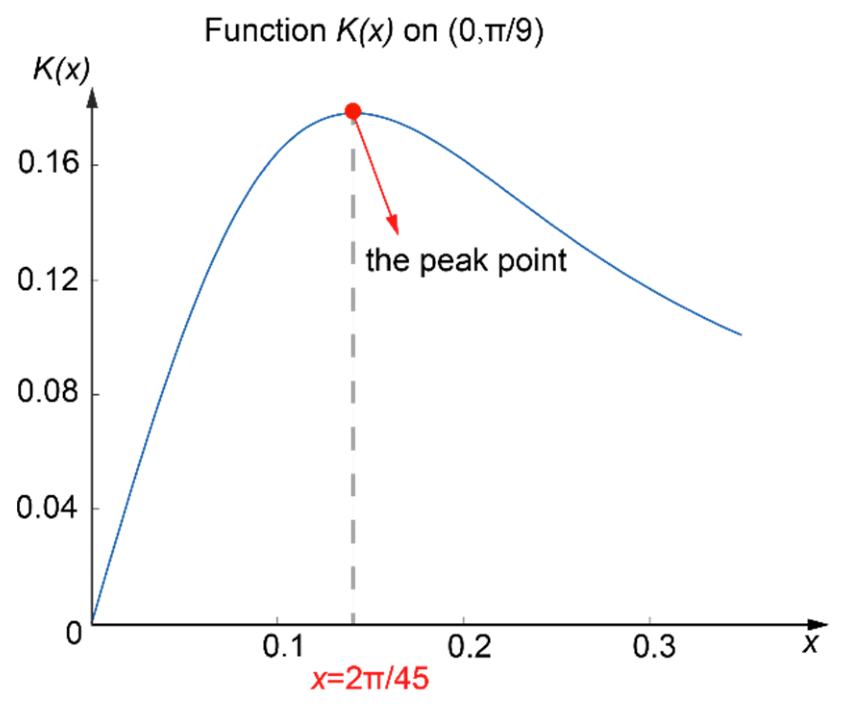
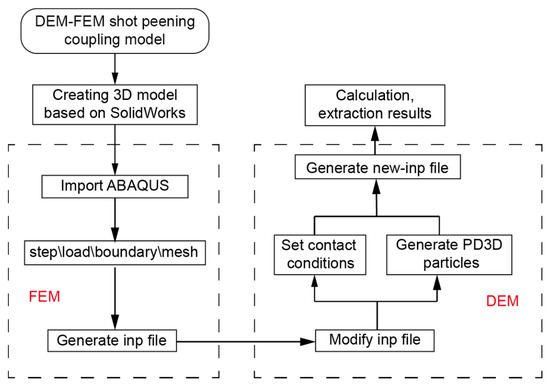
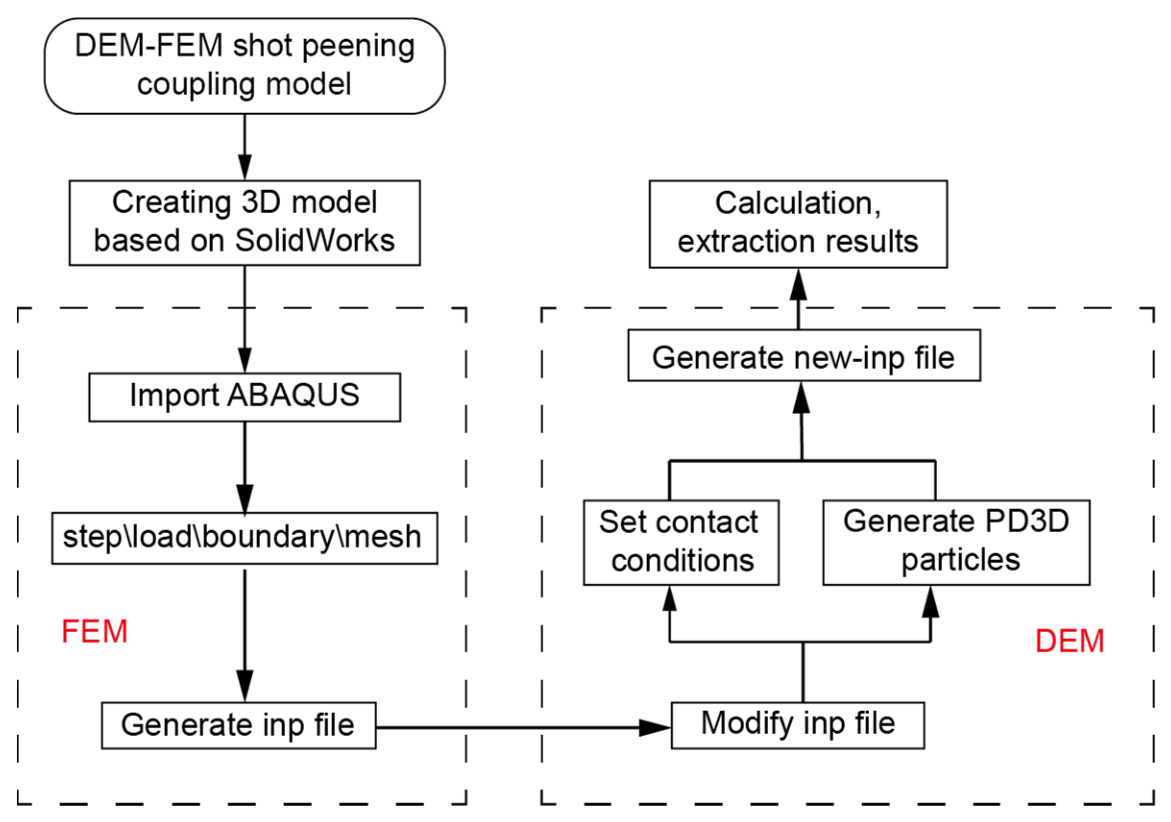
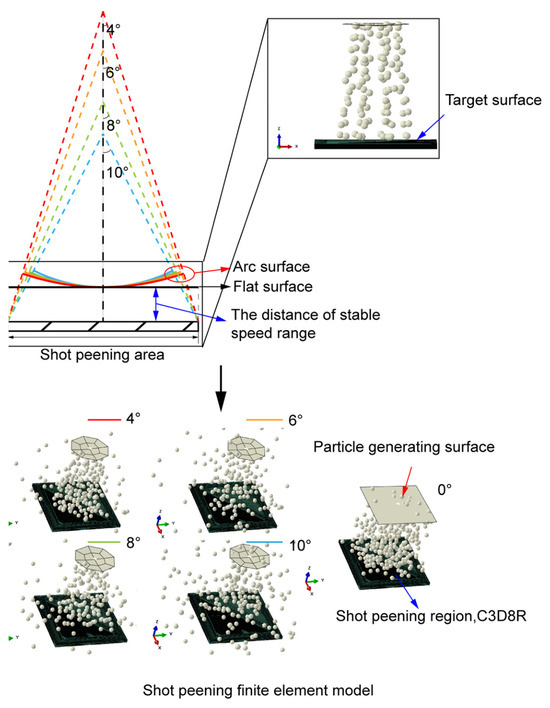
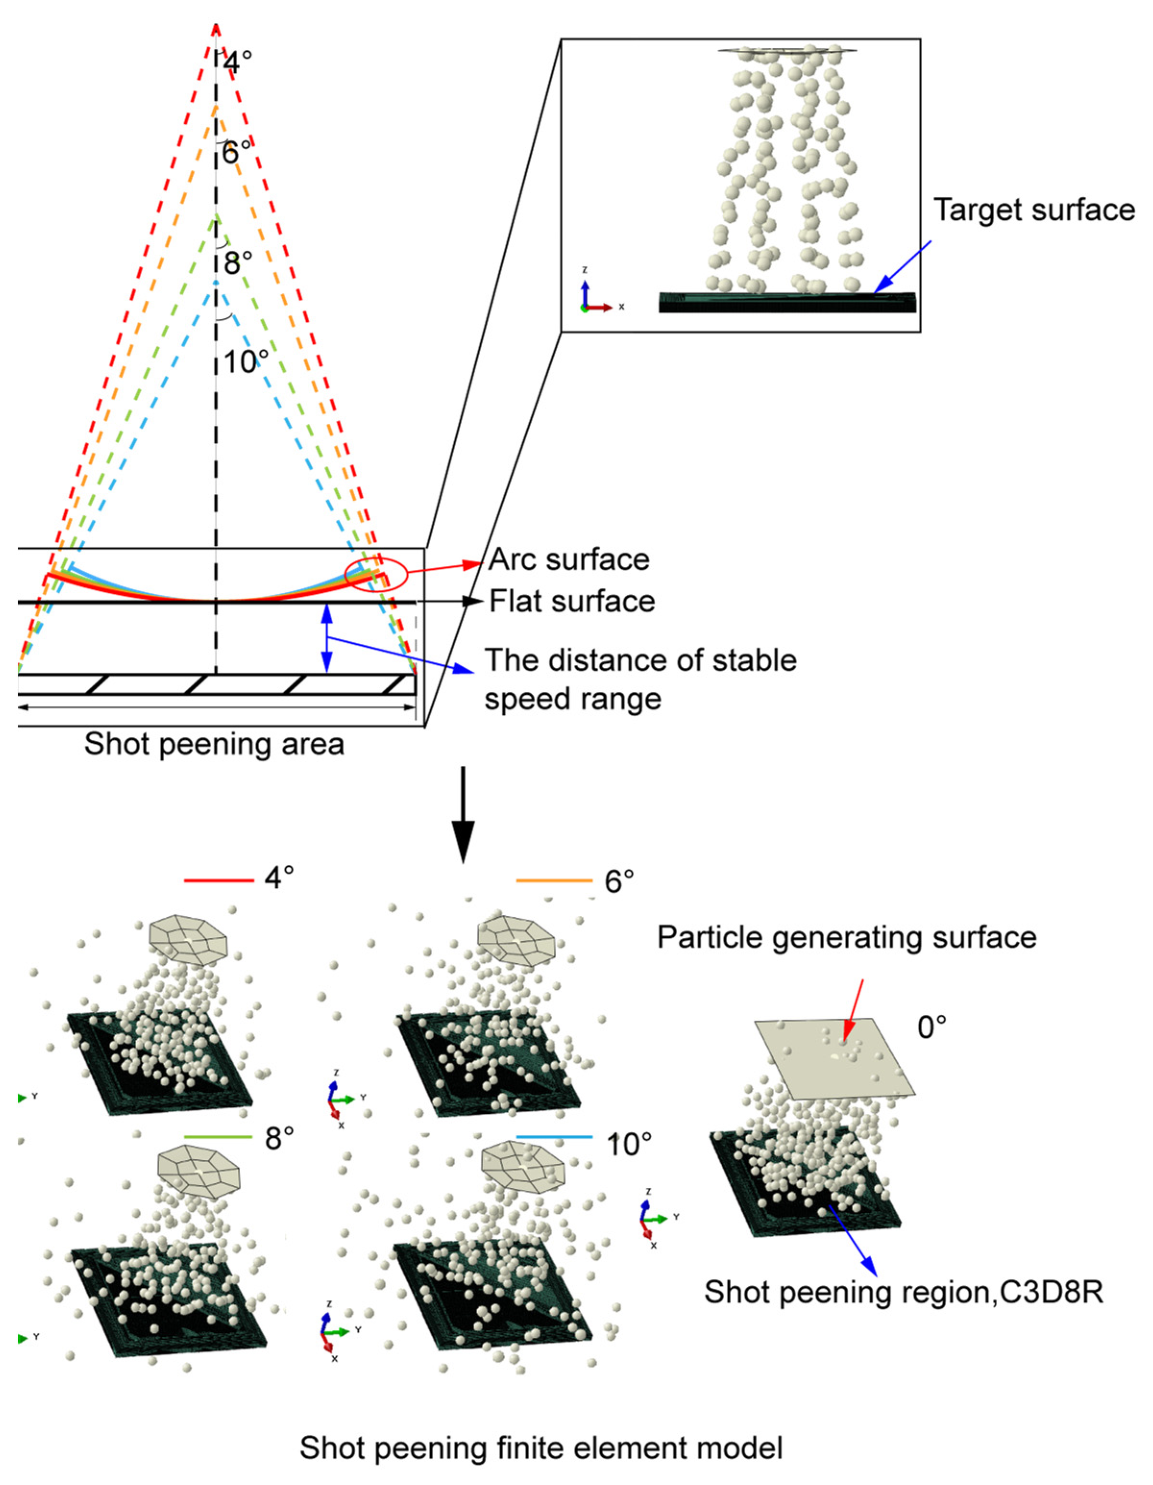
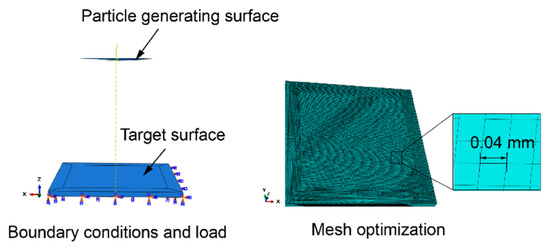
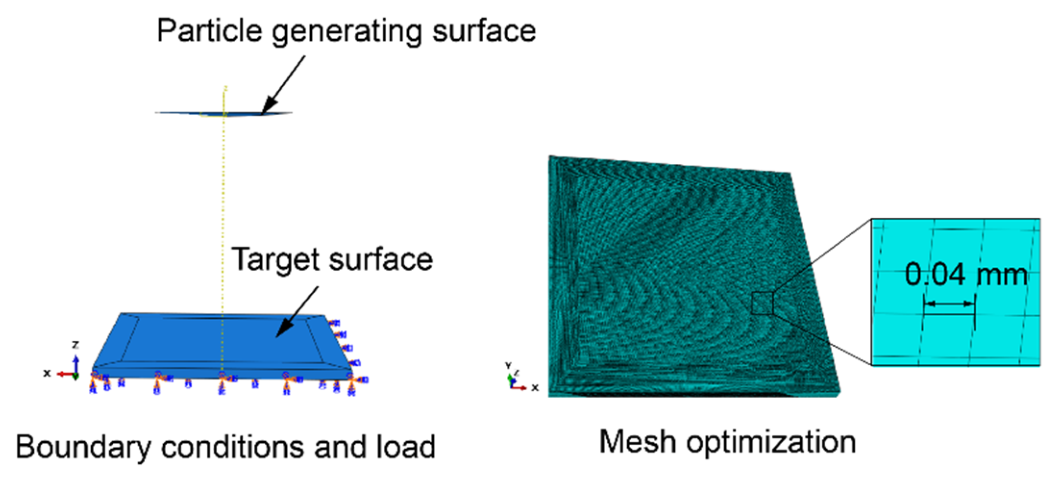
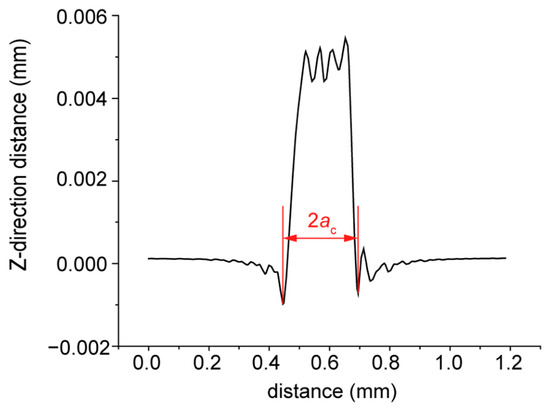
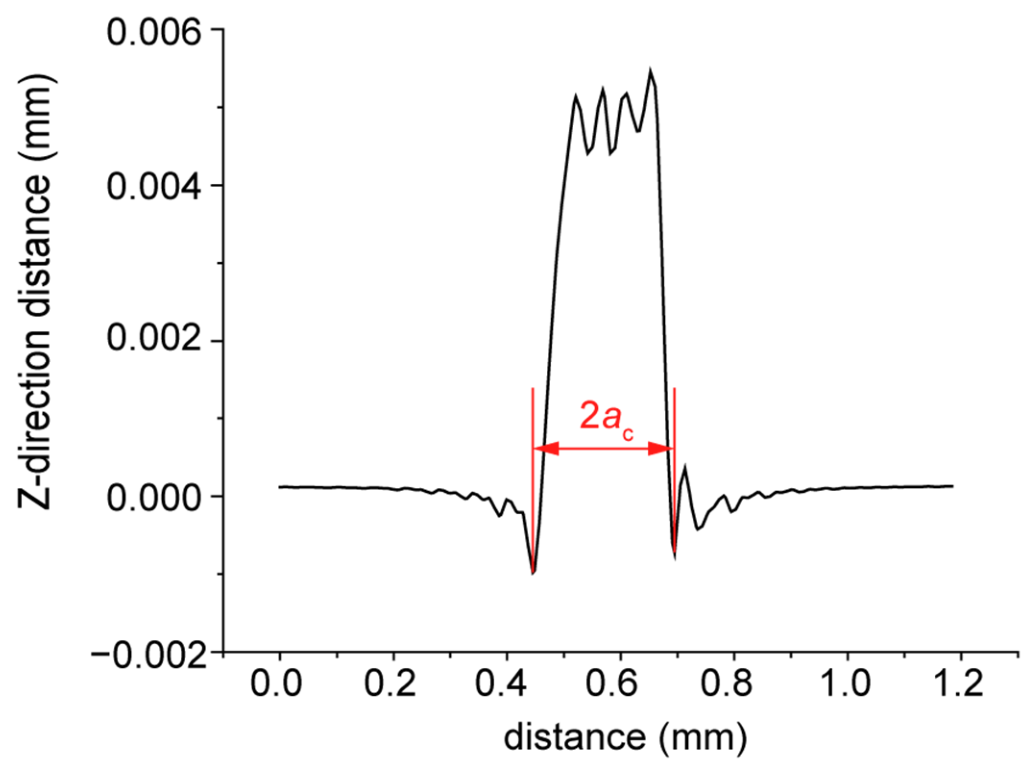
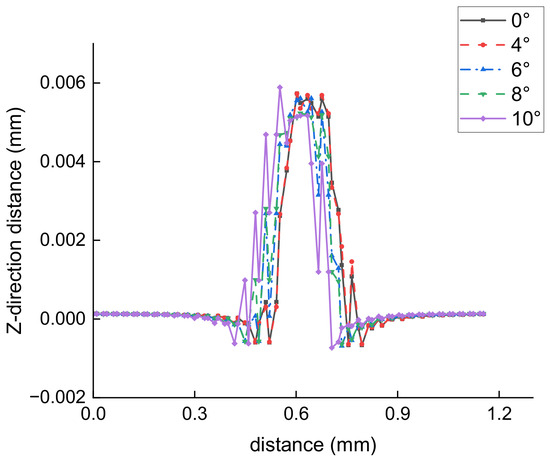
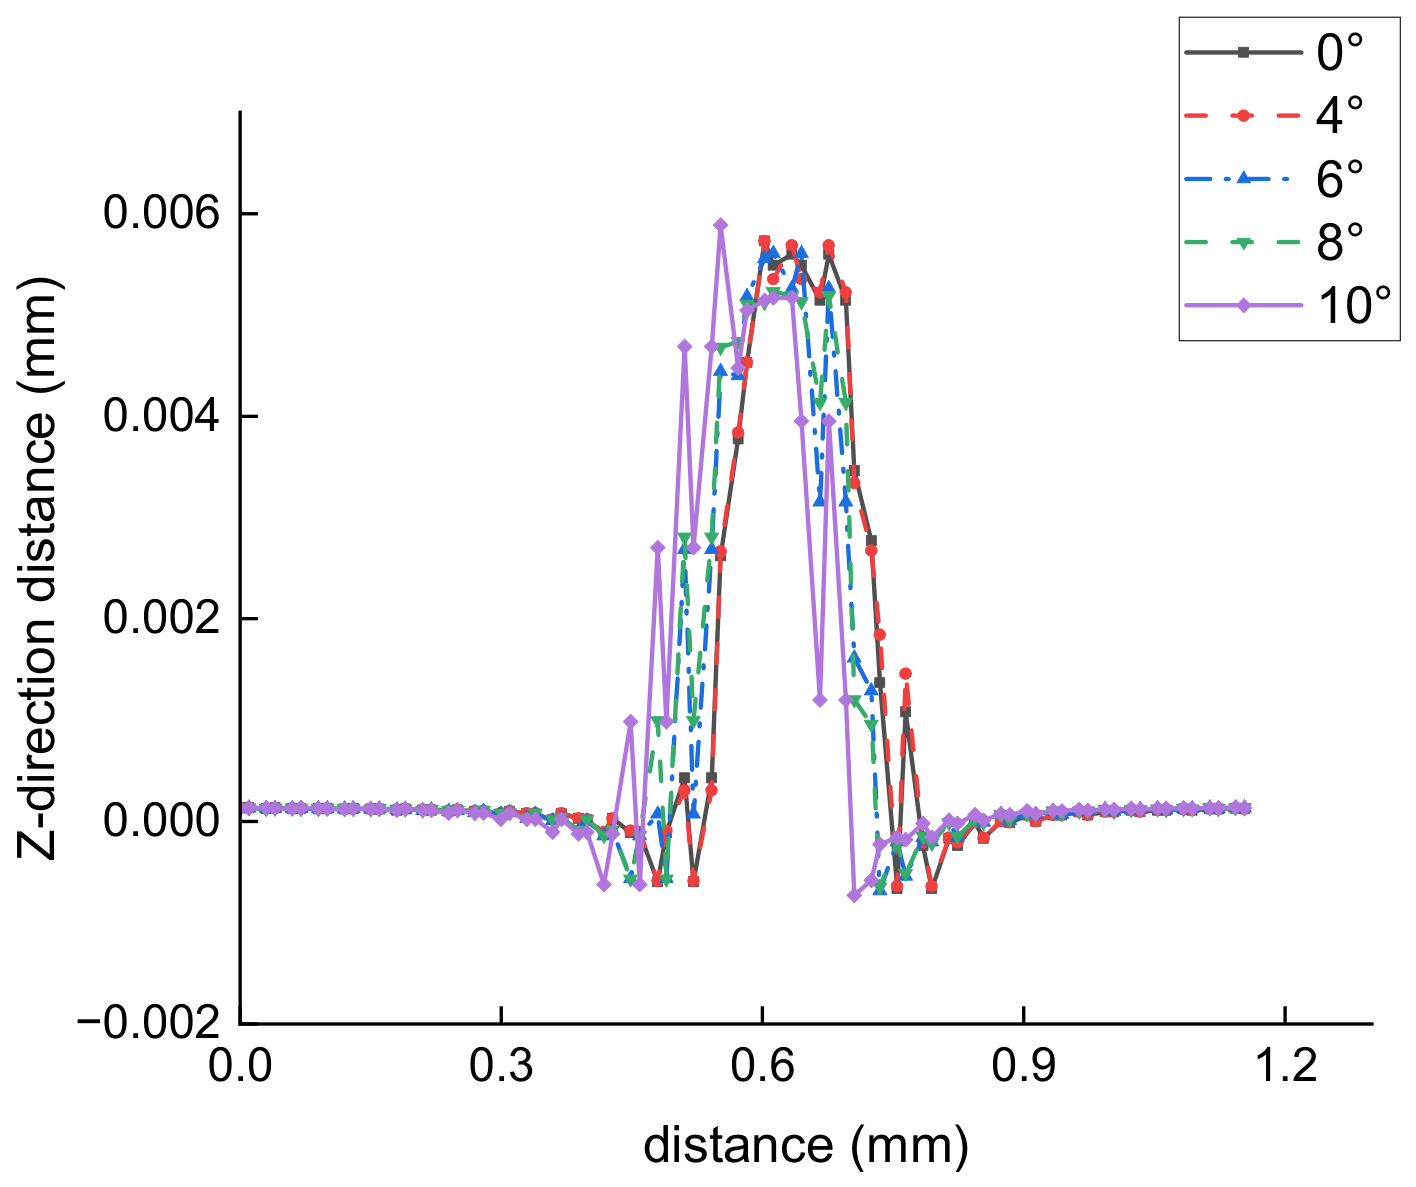
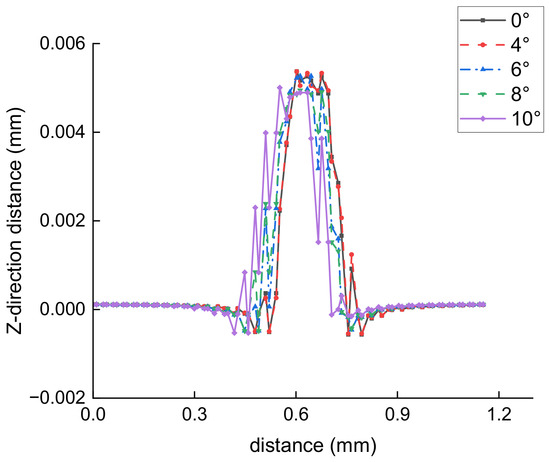
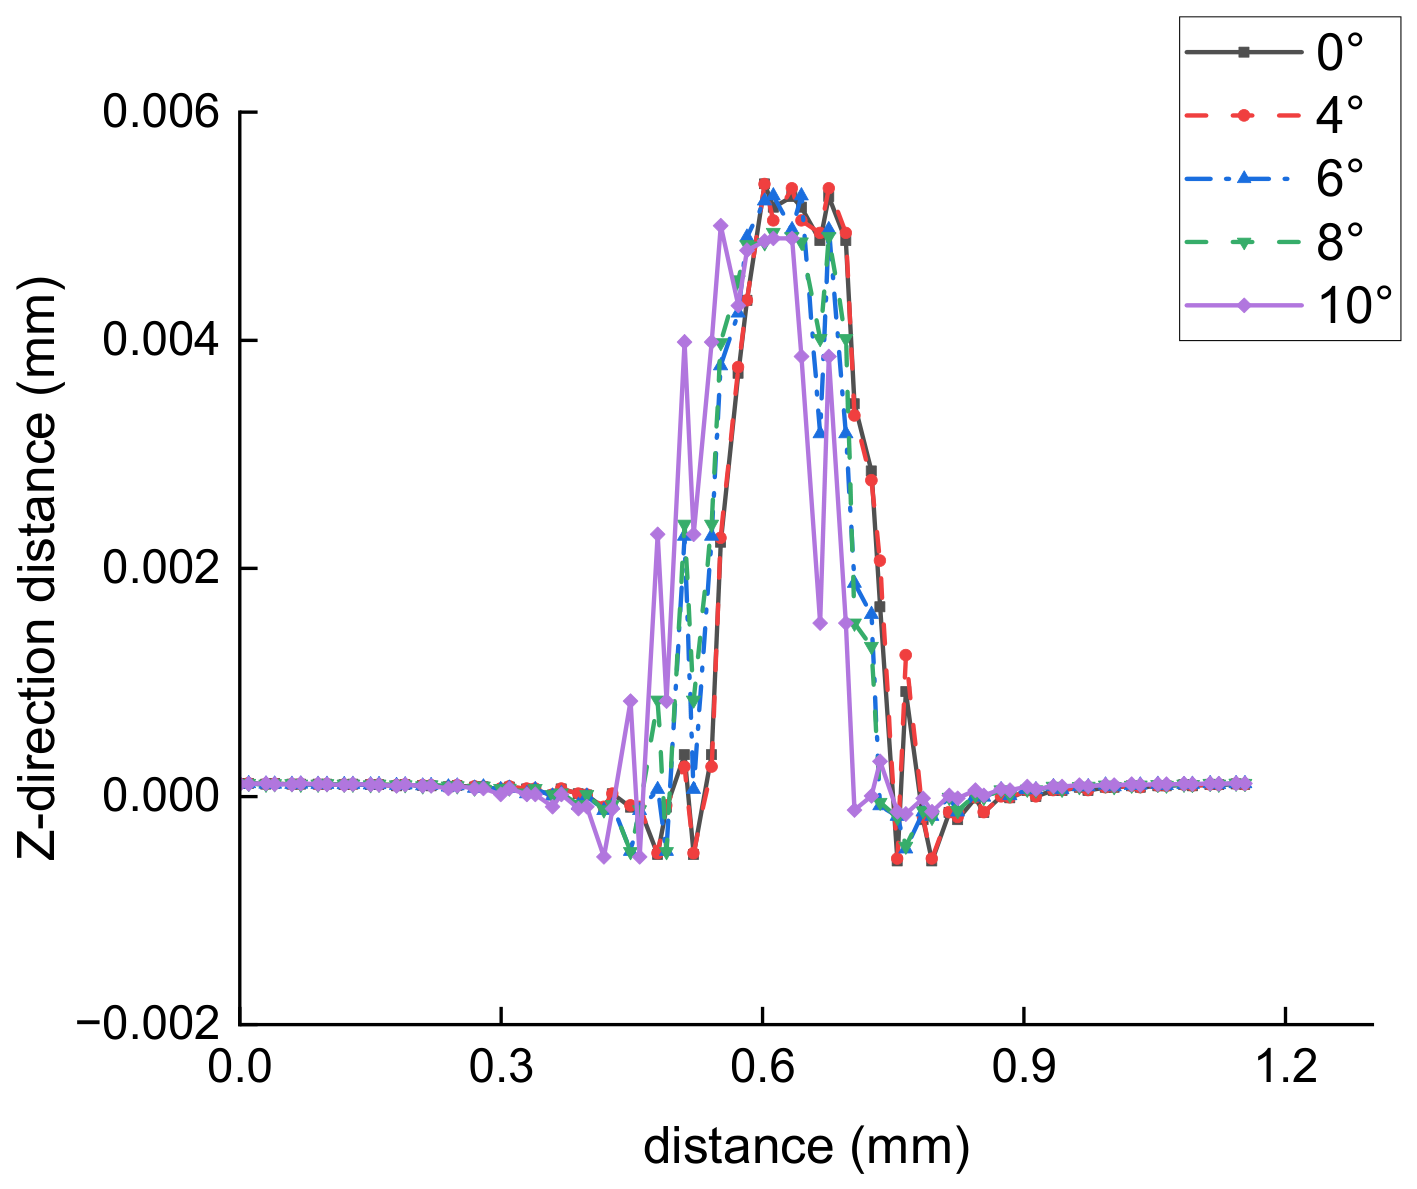
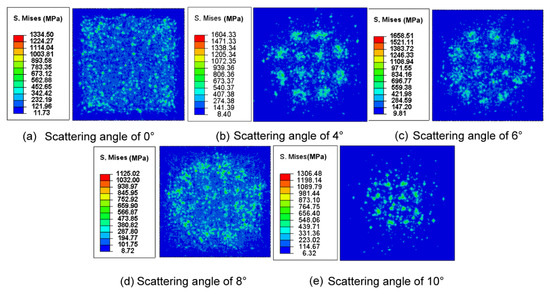
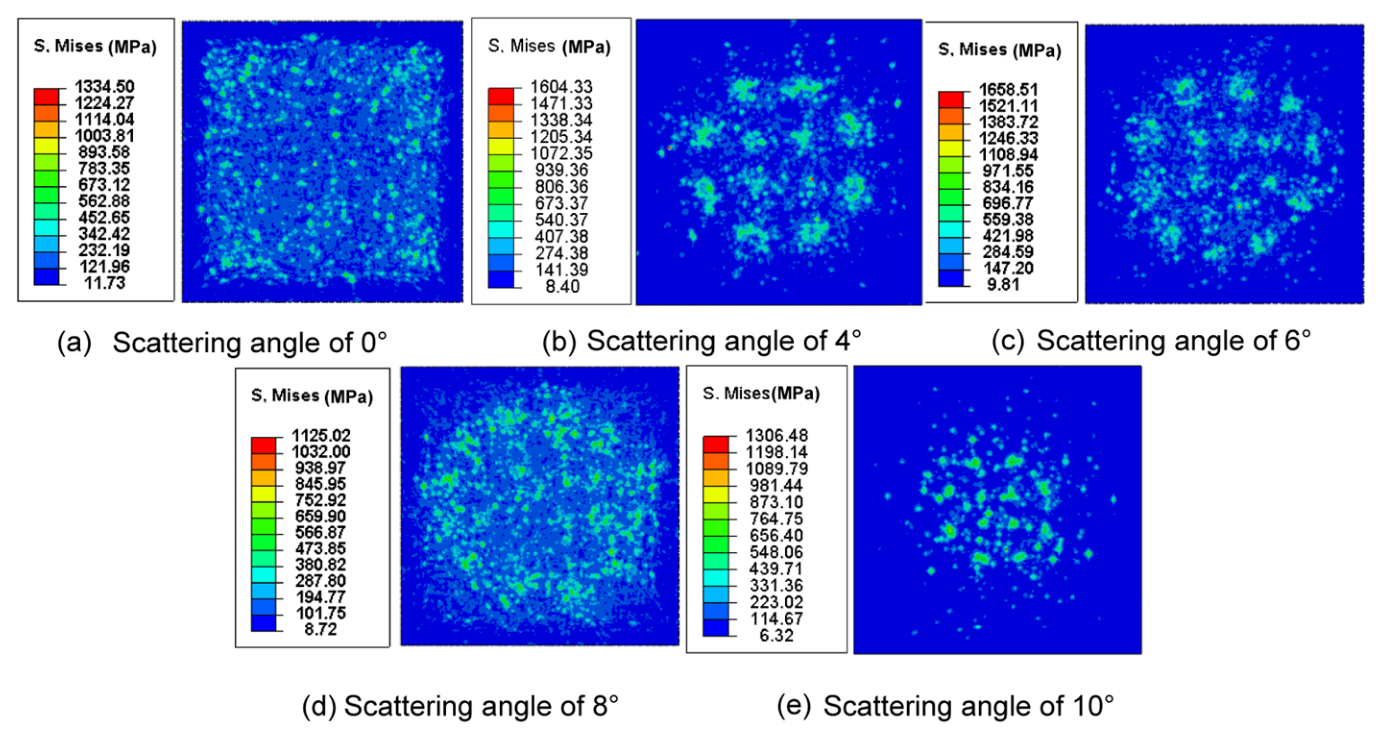
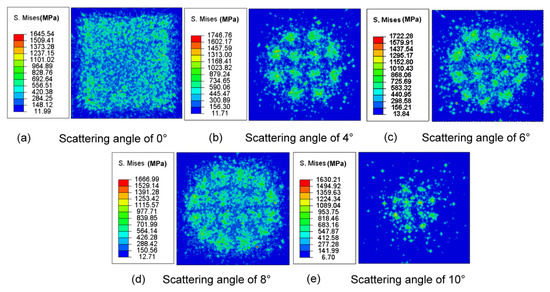
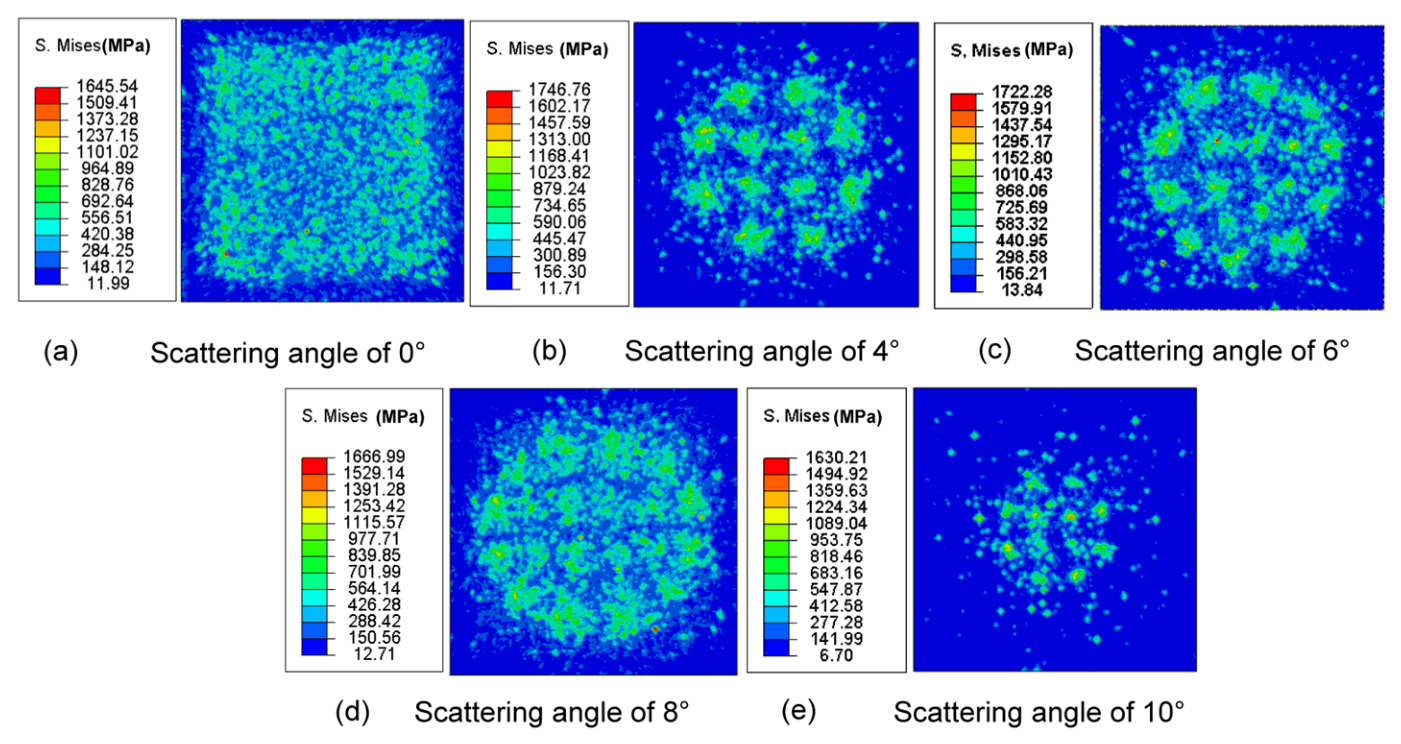
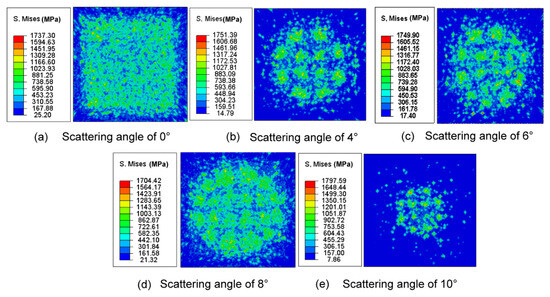
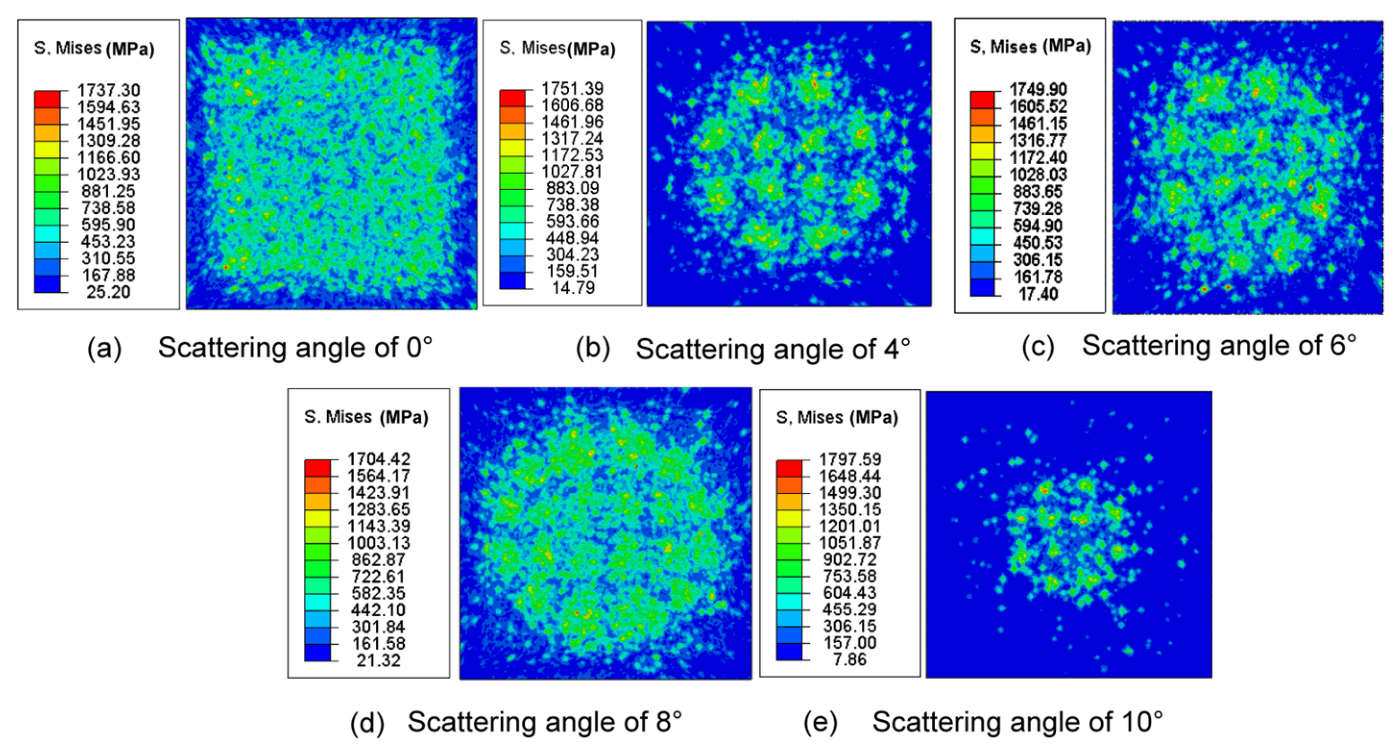
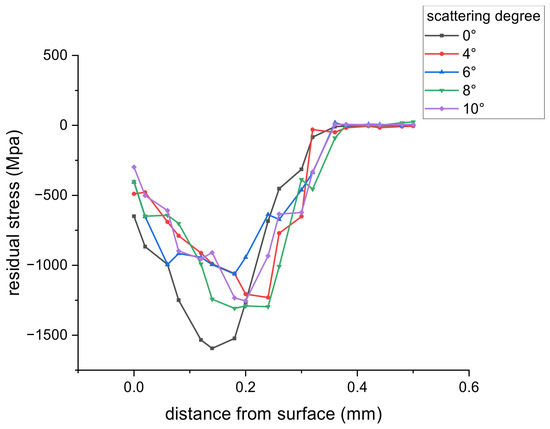
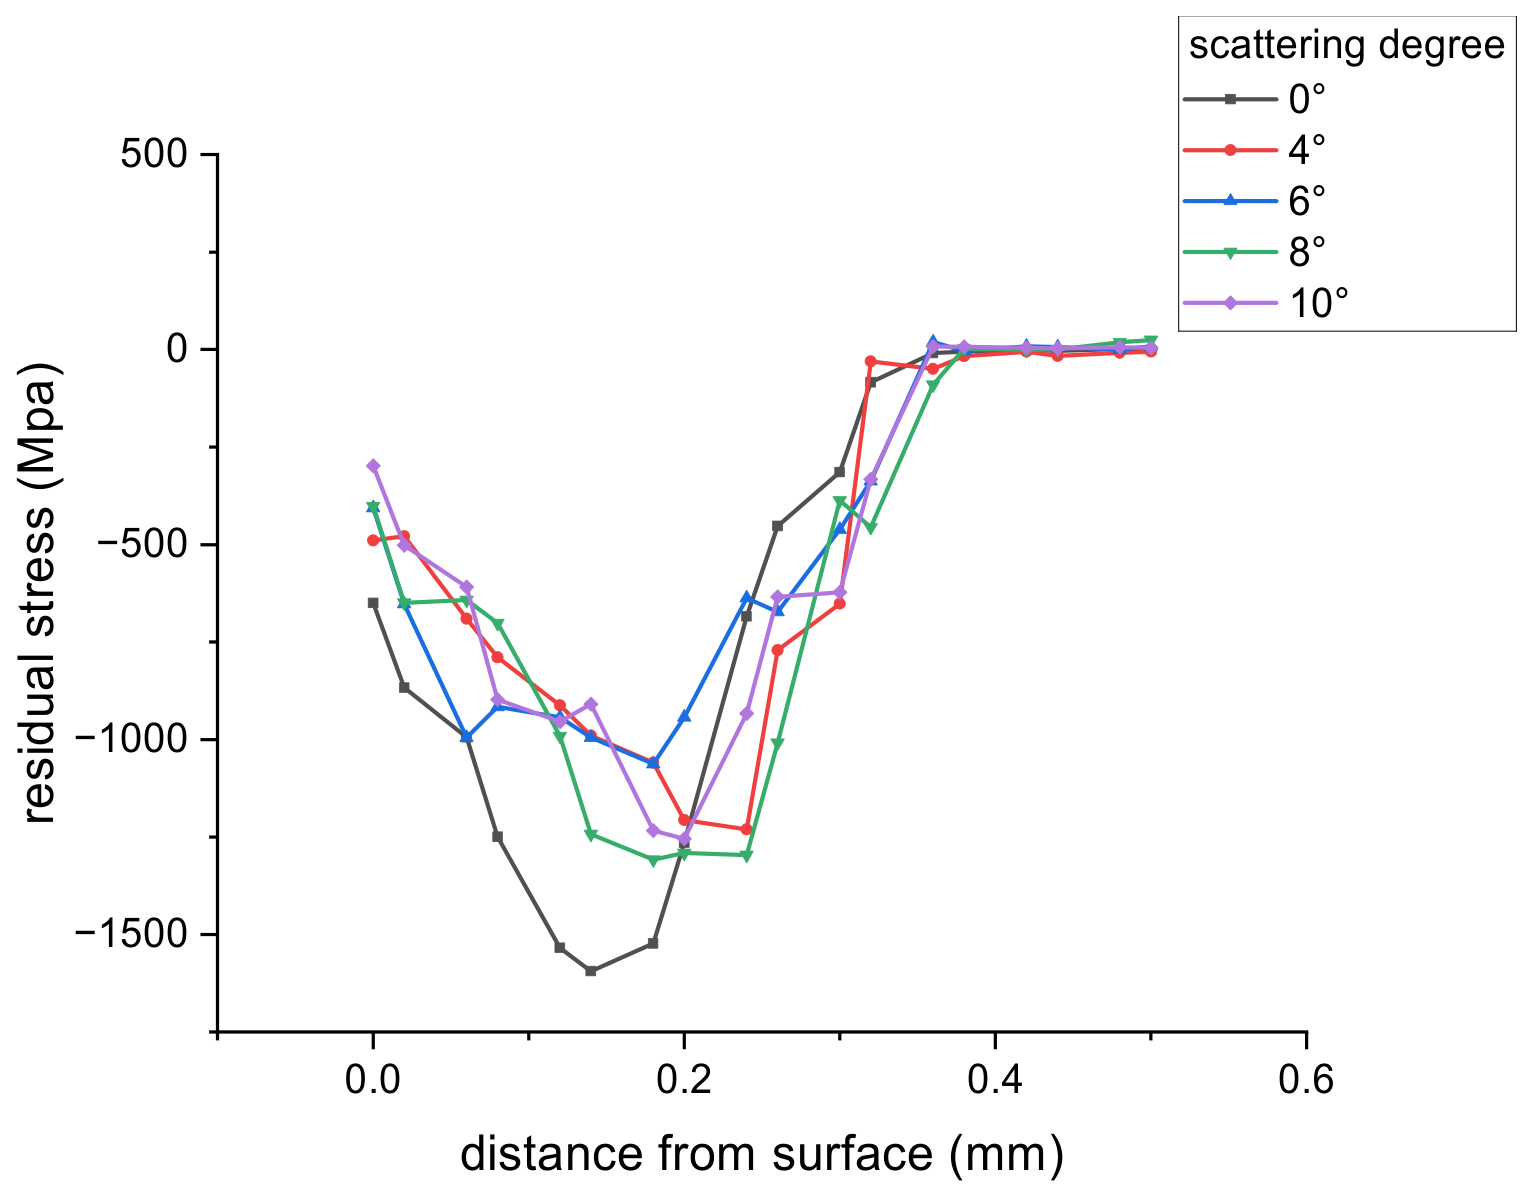
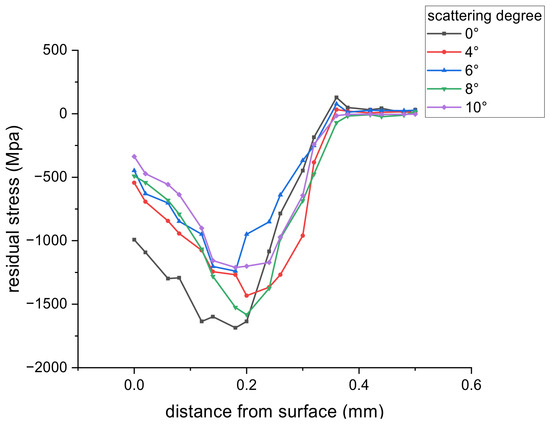
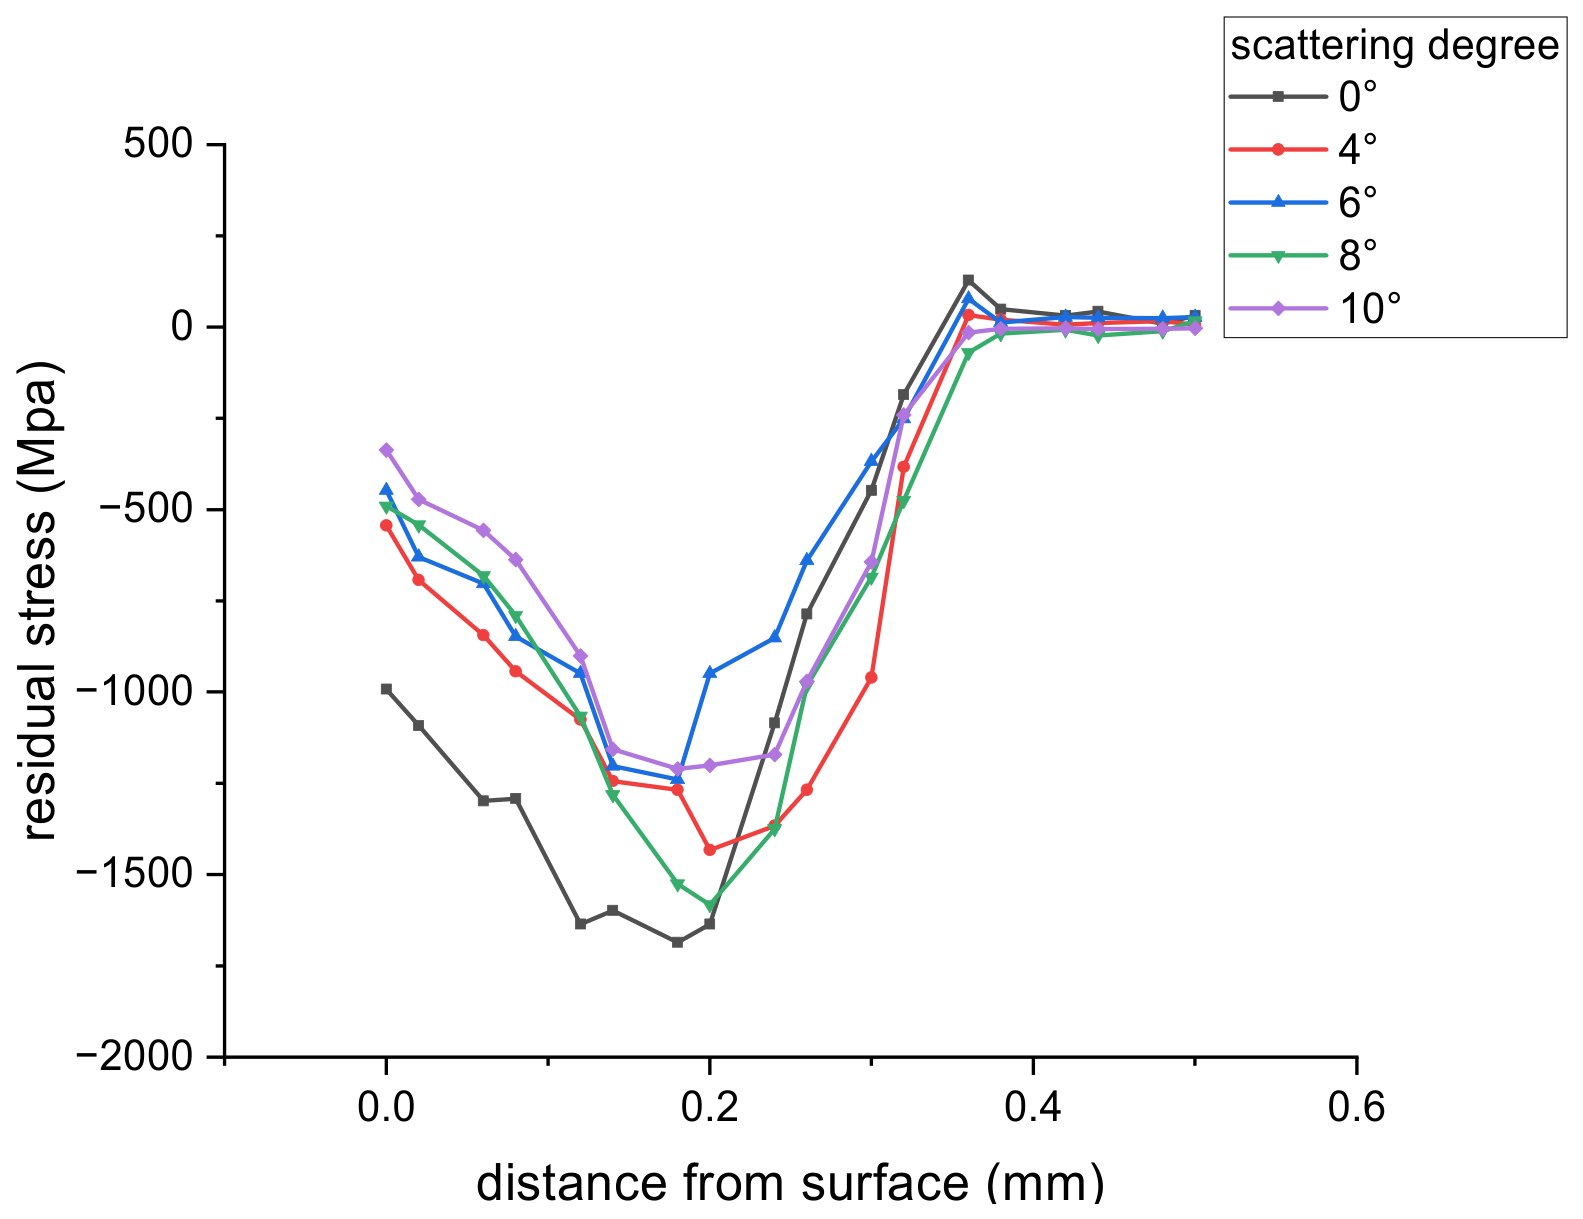
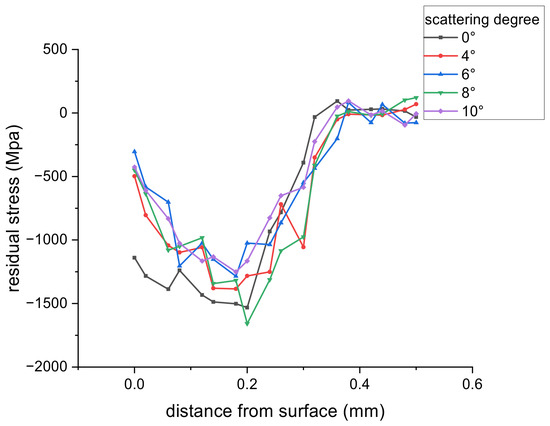
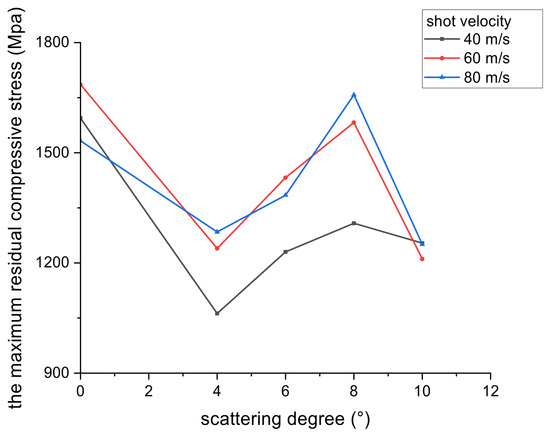
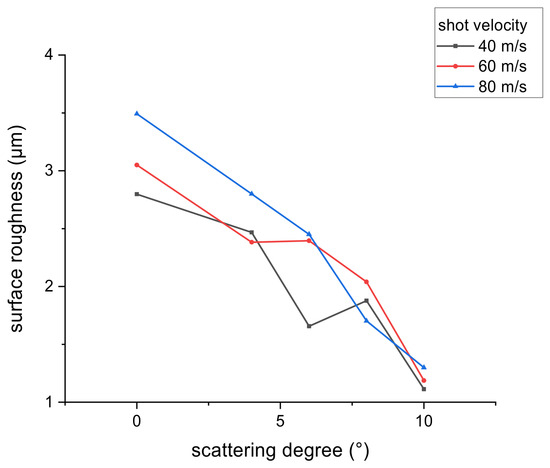
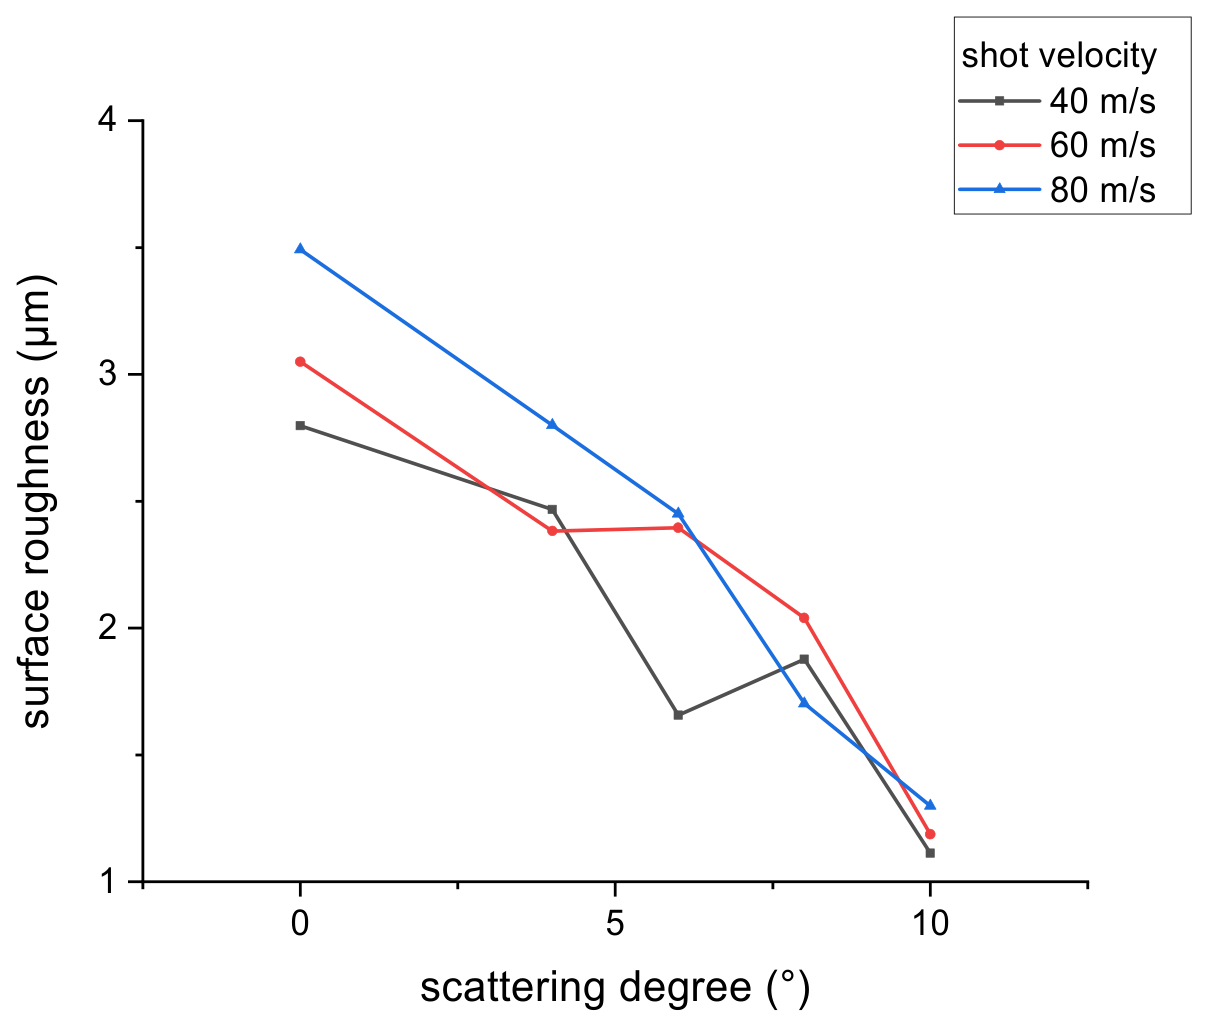
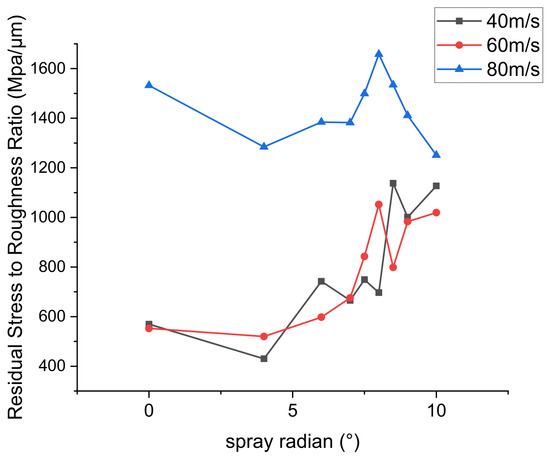
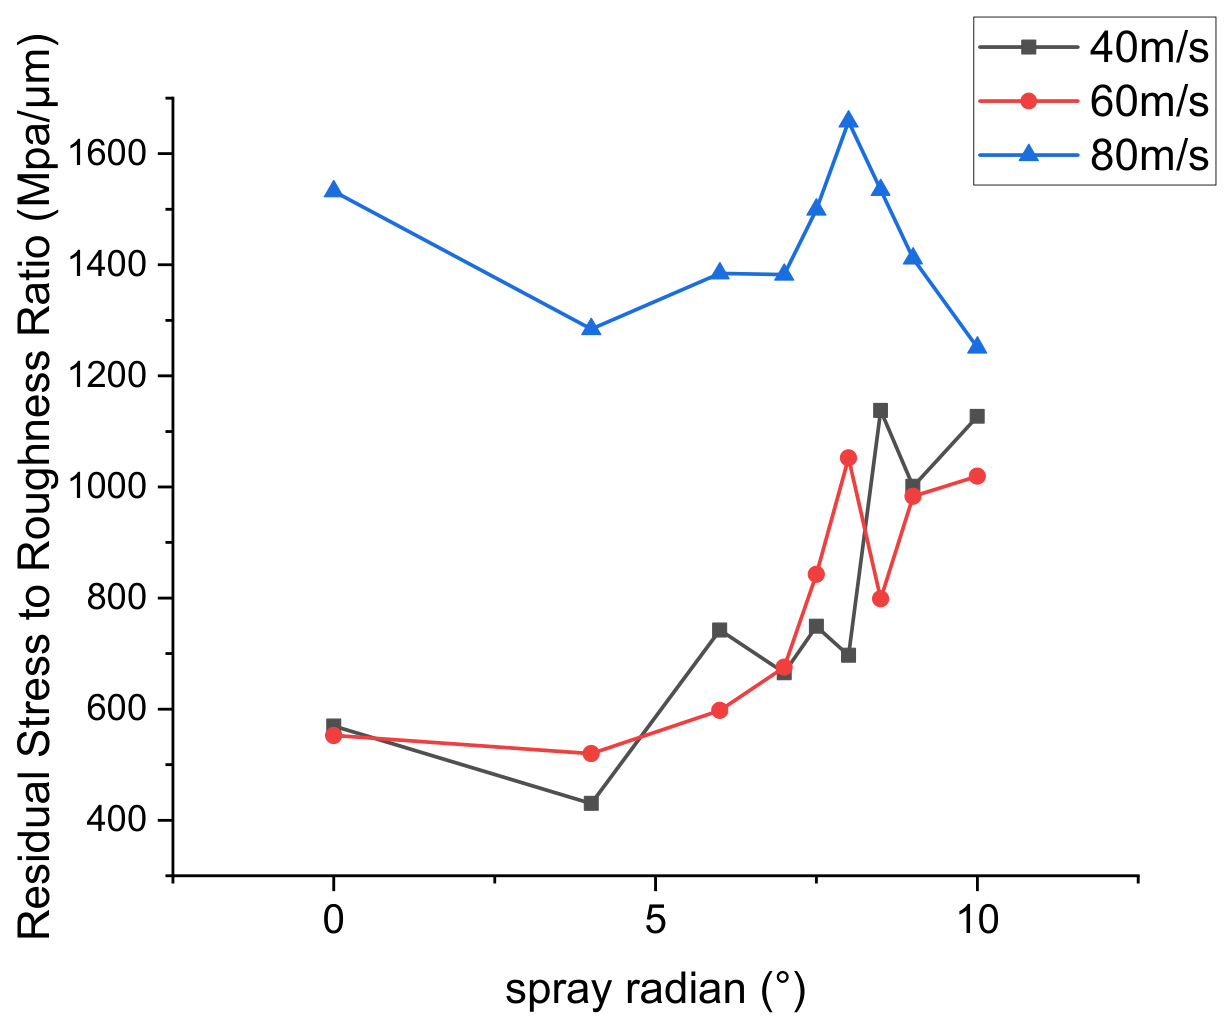
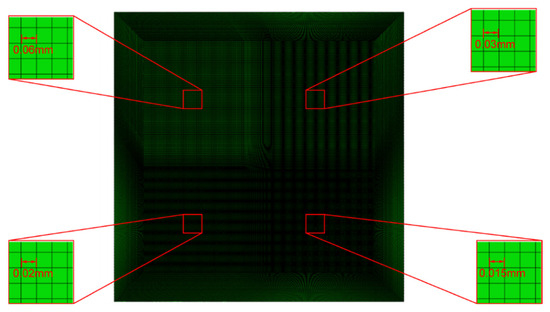
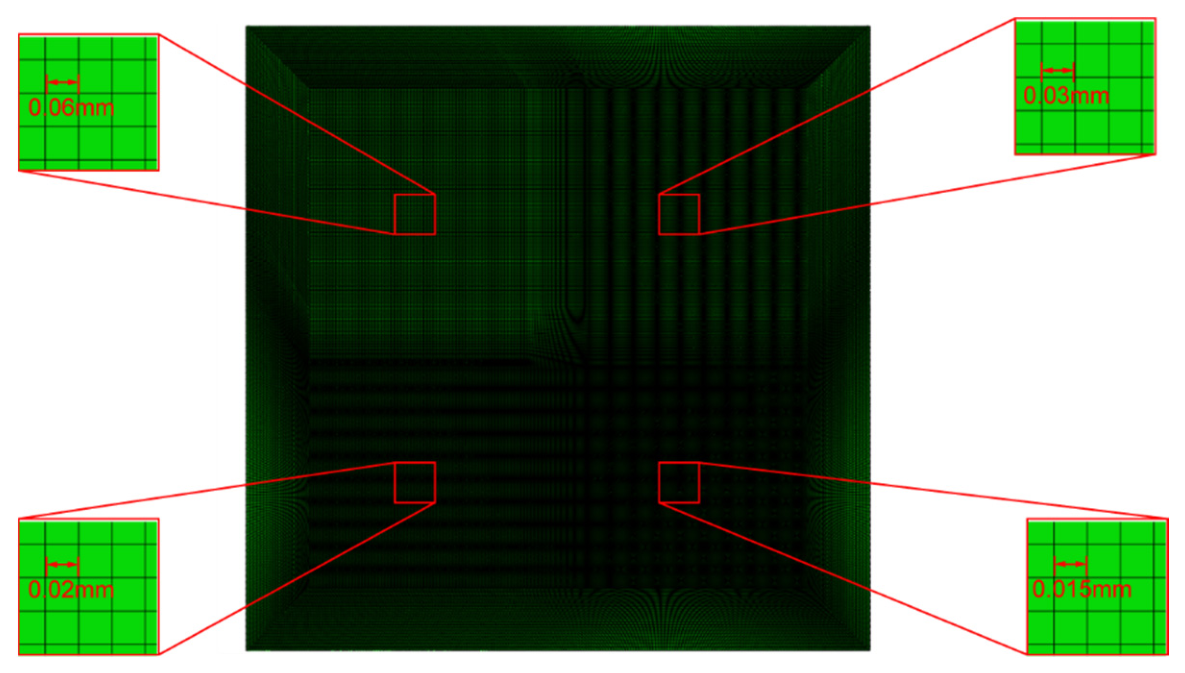

Disclaimer/Publisher’s Note: The statements, opinions and data contained in all publications are solely those of the individual author(s) and contributor(s) and not of MDPI and/or the editor(s). MDPI and/or the editor(s) disclaim responsibility for any injury to people or property resulting from any ideas, methods, instructions or products referred to in the content. |
© 2026 by the authors. Licensee MDPI, Basel, Switzerland. This article is an open access article distributed under the terms and conditions of the Creative Commons Attribution (CC BY) license.