


Abstract
The internal flow of a semi-open axial flow fan is highly three-dimensional and unsteady due to the absence of a confined passage. The evolution of complex vortical structures, such as the tip leakage vortex (TLV) and corner separation vortex (CSV), remains poorly understood. This study used high-resolution particle image velocimetry (PIV) to conduct multi-region, multi-view measurements of the flow field in a semi-open fan for an outdoor air conditioning unit. The generation, development, and breakdown of the TLV were analyzed, revealing transient nonuniform flow and wake evolution. Dynamic mode decomposition (DMD) was applied to extract dominant frequencies and spatial modes. The results show that the TLV has a dominant frequency of 98.5 Hz (2.19 times the rotational frequency), accounting for 88.5% of the total energy, and exhibits periodic shedding and asymmetric breakdown. The CSV dominates at 16.44 Hz, slightly above blade rotation, and interacts with the TLV. In the wake region, the dominant frequency is 248.45 Hz, arising from the nonlinear superposition of TLV harmonics, the CSV frequency, and the blade passing frequency. This study provides an experimental basis and a low-dimensional coherent structure model for internal flow diagnostics and the structural optimization of semi-open axial flow fans.
1. Introduction
Outdoor air conditioning units commonly employ semi-open axial flow fans [1] without external shrouds or guide vanes. The absence of confining flow passage boundaries leads to the formation of pronounced leakage vortices [2] in the tip clearance region. The flow field of a semi-open axial flow fan is subject to the combined effects of protective grilles, wall obstructions, and varying outdoor wind speeds. Consequently, it exhibits significant three-dimensionality and strong unsteady fluctuations, which hinder the analysis of complex flow behaviors and the optimization of fan performance. Conventional contact-based, single-point measurement techniques, such as Pitot tubes [3] and hot-wire anemometers [4], not only introduce flow field distortion due to probe interference but also fail to resolve the high-frequency spatiotemporal evolution of vortex structures in the tip clearance region and the near wake. Particle image velocimetry (PIV) is a non-intrusive, high-spatial-resolution diagnostic technique for global flow fields [5]. It enables the acquisition of high-accuracy instantaneous two-dimensional or three-dimensional velocity vector distributions while preserving the original flow field. Furthermore, high-fidelity flow field snapshots acquired by PIV enable the application of data-driven modal analyses, such as proper orthogonal decomposition (POD) [6,7,8] and dynamic mode decomposition (DMD) [9,10,11]. These techniques can extract the dominant coherent structures from highly turbulent and complex flows. The modal energy contributions and frequency characteristics derived from these decomposition methods quantitatively characterize the internal turbulent structures of the axial flow fan [12]. These results provide indispensable empirical support for elucidating the low-dimensional evolution features [13] of turbulence, assessing flow instability, and optimizing blade geometries. Therefore, conducting PIV flow field measurements and coherent structure analysis for semi-open axial flow fans is of significant importance for flow physics diagnosis and the implementation of advanced flow control strategies.
PIV experimental techniques have been widely adopted to investigate the complex internal flow in axial fans, resulting in substantial insights into core issues such as instability evolution, jet development, and tip leakage. In the context of instability dynamics, Hribernik et al. [14] employed phase-resolved PIV [15] to measure the angle-resolved flow field within the rotor passage under rotating stall conditions. The integration of low-frequency PIV systems with advanced data post-processing methods enables accurate measurement of high-frequency, unsteady flow phenomena such as rotating stall. This approach offers an economical and efficient means of advancing the understanding of rotating stall flow mechanisms [16]. When an axial fan operates away from its design condition, a complex structure comprising alternating high-momentum jet regions and low-momentum wake regions develops within the blade passage. Hofer et al. [17] conducted three-dimensional reconstruction of the free jet field in a small-scale axial flow fan using high-resolution 2.5D PIV [18] volumetric scanning. Their results demonstrated that the jet from the small-scale fan exhibits pronounced rotating-jet characteristics, with diffusion and rotation rates that decay nonlinearly along the streamwise direction. The velocity profiles in the jet core region deviate markedly from classical free-jet theory. Tip clearance flow constitutes a major source of flow losses and is a primary cause of hazardous conditions such as stall and surge in axial fans. Dellacasagrande et al. [19] applied two-dimensional PIV measurements in the meridional plane upstream of the annular fan rotor tip clearance. Under moderate load conditions, the leakage flow displays periodic radial oscillations [20] that are independent of the blade passing frequency. Furthermore, the migration of these non-periodic, large-scale coherent structures across different radial positions [21] significantly enhances turbulent momentum transport.
In the downstream region, the turbulent flow characteristics have also been extensively investigated. Čantrak et al. [22] conducted experimental measurements of turbulent swirling flow in the duct downstream of an axial fan using high-speed stereoscopic PIV and performed a comprehensive analysis of the anisotropic turbulent state based on invariant mapping theory. The study found that, under swirling effects, the near-wall region of the duct exhibits significant turbulent anisotropy. A strong dynamic correlation exists between the periodic oscillation of the vortex core and the axial migration of the minimum total-velocity location [23]. On the issue of tip leakage vortex behavior, Yu et al. [24] performed phase-averaged measurements of the internal and surrounding flow fields of an axial fan using a high-resolution stereoscopic PIV system, obtaining three-dimensional flow structures inside and outside the rotor passage. The results revealed a strong tip leakage vortex in the tip clearance region, which undergoes intense mixing with the main flow during downstream transport and exhibits significant circumferential non-uniformity [25] in both trajectory and intensity. Nevertheless, the flow field in the tip region of semi-open axial impellers possesses even more complex vortical structures, and few studies have conducted detailed experimental investigations of the tip vortex, tip leakage vortex, leading edge separation vortex, and related structures.
The flow structure of a semi-open axial flow fan, unconstrained by a closed casing, exhibits pronounced three-dimensionality and strong unsteady fluctuations [26]. The core flow phenomena include complex vortical structures in the tip region [27], periodic wake evolution [28], and flow instability under off-design conditions [29]. Liang et al. [30] employed large eddy simulation [8] to reveal that the flow field in the tip region of an open axial fan rotor consists of the tip vortex, leading edge separation vortex, and tip leakage vortex. The interaction among these three vortices gives rise to complex tip-flow phenomena, with the tip leakage vortex being dominant. Xie et al. [31] elucidated the evolutionary process of the tip vortex from its generation at the blade leading edge to its development and dissipation downstream. They showed that, over time, the tip vortex extends to the rotor outlet region along an oblique line opposite to the direction of rotation. Jung et al. [32] numerically obtained the total pressure loss distribution at the impeller outlet of an open axial flow fan, where the wake region accounts for 11.8% of the loss, the tip region 69.7%, and the hub region 18.5%. As it moves along the suction surface, the tip vortex continuously absorbs energy and intensifies, eventually detaching from the surface and entering the shroud region. During interaction with the shroud, the tip vortex is further stretched and squeezed, ultimately impacting and breaking up against the pressure surface of the downstream blade [33]. In the trailing-edge tip region covered by the shroud, a tip leakage vortex analogous to that in closed axial flow fans is formed [34], with its vortex scale and intensity comparable to those of the tip vortex [35,36]. Consequently, the tip leakage vortex not only weakens the work capacity of the tip region, causing significant aerodynamic losses, but also has a substantial impact on the aeroacoustic characteristics during fan operation [37]. Nevertheless, the mechanisms underlying the unsteady evolution and the low-dimensional coherent structures of the tip leakage vortex in semi-open axial flow fans remain to be further investigated.
This study addresses two specific questions regarding the internal flow of a semi-open axial flow fan: (i) what are the dominant evolution modes and characteristic frequencies of the tip leakage vortex in the absence of a confining shroud, and (ii) how does the TLV interact with the CSV within the blade passage, and what are their combined effects on the downstream turbulent wake? High-resolution PIV measurements are conducted across multiple regions and viewing angles to capture transient flow structures (Figure 1). DMD is subsequently applied to extract low-dimensional spatial modes and frequency characteristics from the acquired snapshots. This combined experimental and modal analysis approach quantitatively characterizes the periodic shedding behavior of the TLV, the coupling mechanisms between the TLV and CSV, and the spectral composition of the wake turbulence. The findings provide a physically grounded basis for flow diagnosis and blade design optimization of semi-open axial flow fans used in outdoor air conditioning units. The remainder of this paper is organized as follows: Section 2 describes the PIV measurement methodology for the semi-open axial flow fan, Section 3 presents the transient flow field analysis based on PIV, and Section 4 discusses the coherent structure analysis. Finally, the main conclusions of this study are summarized in Section 5.
Figure 1.
PIV visualization and internal flow analysis method for the flow field of a semi-open axial flow fan.
2. PIV Measurement Method for a Semi-Open Axial Flow Fan
The PIV experimental platform established in this study integrates a comprehensive measurement system incorporating high-precision optical, mechanical, electrical, and computational technologies. The system consists of four core subsystems: a light-source subsystem, an imaging subsystem, a synchronization-control subsystem, and a data-acquisition-and-processing subsystem. Figure 2a illustrates the working principle of the PIV system. The light source system employs a high-energy dual-pulse laser. An optical lens group shapes the laser beam into a light sheet with adjustable thickness to illuminate the target measurement plane within the flow field. The imaging system is equipped with a high-resolution, high-frame-rate scientific-grade CMOS camera. It precisely captures images of tracer particles illuminated by the light sheet. The synchronization control system coordinates the timing of laser pulses and camera exposure with nanosecond-level precision. This ensures accurate displacement calculation. The data acquisition and processing system integrates specialized control software. It is responsible for system control, image acquisition, and real-time processing of large-volume data. Advanced cross-correlation algorithms and GPU acceleration techniques are employed to rapidly compute the velocity field and derived physical quantities from raw particle images. Figure 2b shows the PIV test platform built in this study and the on-site test arrangement.
Figure 2.
Working principle and setup of the PIV system in this study: (a) Schematic diagram of the working principle of the PIV system; (b) On-site photo of the PIV test platform built in this study.
2.1. PIV System Configuration and Experimental Protocol
- (1)
- High-precision image acquisition
The imaging system is equipped with two high-resolution scientific-grade CMOS high-speed cameras (model: SM-CCDB29M4). The resolution reaches at least 6600 × 4400 pixels, and the pixel size is as small as 5 μm. These specifications ensure high-signal-to-noise ratio particle images across both large fields of view and microscopic scales. The high-speed cameras offer a fast acquisition rate, resulting in good temporal continuity of the captured flow field. This capability allows effective imaging of the high-velocity regions associated with local tip leakage vortices. In PIV mode, the minimum exposure time interval is ≤600 ns. The full-resolution acquisition rate is 4.7 frames per second. In framing mode, the maximum acquisition rate reaches 16 frames per second. The system is equipped with an NIKON 50 mm/F1.4 professional optical lens and a 100 mm/F2.8 macro lens. These lenses enable the acquisition of local flow fields in small regions.
- (2)
- High-energy laser system
The PIV system employs two high-energy, high-frequency dual-pulse lasers as light sources (model: SM-LASER-BM500-10). The high-energy laser has a wavelength of 532 nm and a pulse energy of ≥2 × 1000 mJ. This provides sufficient illumination for large-scale flow field measurements. The high-frequency laser has a repetition rate of 0.2–10 kHz. It delivers high-repetition-rate pulsed light to capture high-frequency unsteady vortex dynamics. The laser beam is guided through a high-precision integrated beam transmission system and an adjustable light-sheet optics module. This forms a light sheet with a thickness of ≤1 mm and a maximum divergence angle of ≥75°. The light sheet can precisely illuminate the target measurement plane from the tip region to the main flow area. The laser sheet optics allow independent adjustment of the light-sheet length, thickness, and divergence angle. Depending on the test scenario of the internal flow field, a long light sheet with a small divergence angle can be selected. This configuration focuses illumination on the tip leakage flow region.
Before laser operation, the laser chiller must be turned on first. The chiller temperature should stabilize at 21 °C ± 0.2 °C. The laser temperatures should stabilize at 45 °C ± 0.1 °C, 45 °C ± 0.1 °C, and 28 °C ± 0.1 °C, respectively, before the laser power supply is switched on. The maximum laser current is 31 A, and the minimum current for laser emission is 8 A. During testing, the energy outputs of the two laser paths are not perfectly identical. Therefore, the brightness of the captured images should be monitored, and the current of one path may need to be increased by approximately 0.5 A, as appropriate.
- (3)
- Precise synchronization and tracer particle seeding
The synchronous controller serves as the timing core of the system. Its time accuracy reaches ≤0.25 ns. This ensures nanosecond-level strict synchronization between laser pulses and camera exposure, enabling high-precision instantaneous velocity measurements. The particle generator provides water-based and DEHS oil-based tracer particles with high flow rates and stable concentrations. These particles cover a wide velocity range from low-speed flows up to 500 m/s. The system allows flexible switching according to experimental requirements. This ensures good particle-tracking fidelity and consistent scattering intensity across different flow regimes, including low-speed leakage flows and high-speed main flows.
- (4)
- Intelligent calibration, control, and advanced data processing
The robotic assistance system consists of two high-precision collaborative robots (with a repeated positioning accuracy of ±0.05 mm). One robot carries the camera, and the other carries the laser light-sheet module. Through custom software, fully automatic joint calibration and scanning measurements of the optical path and imaging perspective are achieved. This greatly improves experimental efficiency and positioning accuracy in complex spatial configurations. The integrated software platform for system control and post-processing manages all experimental hardware. It also incorporates powerful post-processing algorithms for complex flows. In addition to standard cross-correlation analysis, the platform supports GPU acceleration, which significantly enhances computational efficiency. The platform also includes a continuous light-sheet system for flow visualization, a helium bubble generator for seeding in large-scale spaces, complete calibration targets, optical adjustment mechanisms, and a workstation.
The PIV experimental platform established in this study focuses on the processing and analysis of tip leakage vortices. It provides a functionally comprehensive and technically advanced fluid mechanics experimental platform capable of accurately capturing leakage flows. The specific procedure for the PIV experiments on the semi-open axial flow fan used in air conditioning units is shown in Figure 3. To accurately capture and quantify the multi-scale vortex structures within the fan, the positions of the laser and camera were adjusted and tested before image acquisition.
Figure 3.
Flowchart of the 2D2C PIV experimental acquisition and analysis, comprising three parts: pre-PIV imaging preparation, imaging recording, and data post-processing.
For the overall flow field structure of the fan, non-intrusive water mist or helium bubbles were used as tracers. Single-shot coverage achieves a maximum area of 2500 mm × 1000 mm (2D2C), enabling observation of the entire fan or large-scale vortex structures. To precisely capture the transient generation, evolution, and breakdown of the leakage vortex within the tip clearance (typically <5 mm), the system is equipped with a high-frequency acquisition module. The maximum acquisition rate reaches 160,000 frames per second. Combined with a minimum light-sheet thickness of 1 mm, this configuration resolves high-frequency flow details within a microscopic field of view of 20 mm × 20 mm. This provides a wealth of refined flow field data to elucidate the complex, unsteady internal flow mechanisms.
Depending on the test scenario of the internal flow field, a long light sheet with a small divergence angle can be selected. This configuration focuses illumination on the tip leakage flow region. Before laser operation, the laser chiller must be turned on first. The chiller temperature should stabilize at 21 °C ± 0.2 °C. The laser temperatures should stabilize at 45 °C ± 0.1 °C, 45 °C ± 0.1 °C, and 28 °C ± 0.1 °C, respectively, before the laser power supply is switched on. The maximum laser current is 31 A, and the minimum current for laser emission is 8 A. During testing, the energy outputs of the two laser paths are not perfectly identical. Therefore, the brightness of the captured images should be monitored, and the current of one path may need to be increased by approximately 0.5 A, as appropriate.
The experimental procedure for PIV measurements on the semi-open axial flow fan is depicted in the flowchart in Figure 3 and is summarized as follows. Before data acquisition, the laser sheet position and camera viewing angle were precisely aligned according to the measurement planes defined in Section 2.3. The laser chiller was activated and allowed to reach thermal equilibrium at 21 °C ± 0.2 °C before the laser power supply was engaged. Tracer particles, either water-based or DEHS oil-based, were introduced into the flow field at a controlled concentration to achieve uniform particle distribution and sufficient scattering intensity. The synchronization controller was programmed to trigger the dual-pulse lasers and camera exposure with a timing accuracy of ≤0.25 ns, and a series of image pairs was recorded at each measurement plane. For each operating condition, at least 500 instantaneous image pairs were collected to ensure statistical convergence of the mean velocity field and turbulence statistics. Following acquisition, the raw particle images were processed using a multi-pass cross-correlation algorithm with progressively decreasing interrogation window sizes (from 64 × 64 to 16 × 16 pixels, with 50% overlap), resulting in final velocity vectors with a spatial resolution of approximately 0.5 mm. Vector validation and outlier removal were conducted using a local median filter.
2.2. Optical Modification and Specimen Preparation
This study provides a clear, unobstructed optical path for the laser light sheet to ensure accurate measurement of the internal flow field using particle image velocimetry. Given the compact structure and complex components of the outdoor air conditioning unit, the test fan was specifically modified to provide optical access (Figure 4). First, the housing was treated to improve light transmission. The original fan housing was made of metal, which could not transmit laser light. Therefore, a transparent housing was custom-manufactured from high-transmittance acrylic panels. The transmittance of this housing at 532 nm exceeds 99%. This minimizes the attenuation of laser energy during incidence and ensures adequate illumination of tracer particles within the measurement region.
Figure 4.
Experimental prototype and pre-piv imaging preparation.
Second, surface reflection was suppressed. The motor support and the blades are the main internal components along the laser incidence path. Their metallic surfaces tend to generate strong reflected light, which creates background noise and interferes with particle image acquisition. To address this, a black matte paint was uniformly sprayed onto the surfaces of these components. This effectively reduces the surface reflectivity to below 5% and significantly suppresses stray light interference with camera imaging.
Finally, after the above optical modifications and component treatments, the experimental model meets the optical requirements for PIV measurements while maintaining the original aerodynamic integrity. Commissioning results demonstrate that this optical path design yields clear particle images. This provides a reliable experimental basis for subsequent flow field measurements and vortex-structure analysis.
2.3. Measurement Area Calibration
This study aimed to accurately capture the complex three-dimensional unsteady flow structures within a semi-open axial fan system. Accordingly, the measurement regions and viewing angles for particle image velocimetry (PIV) were systematically designed based on the fan geometry and flow characteristics, as shown in Figure 5. The measurement scheme followed the principles of zonal measurement and multi-view complementarity. The internal flow field was divided into three regions: the inlet, guide vane, and outlet regions. Flow field acquisitions were conducted from four key orientations, enabling refined observation of the core vortex structures, including the tip vortex, leading edge separation vortex, and tip leakage vortex.
Figure 5.
PIV visualization and internal flow analysis method for the flow field of a semi-open axial flow fan.
The inlet region measurements focused on the upstream flow patterns of the impeller. The flow field in this region was influenced by the inlet grille of the outdoor unit and the heat exchanger wake, exhibiting significant non-uniform inflow characteristics. The measurement plane was set as a meridional plane parallel to the impeller rotation axis. It mainly captured the inflow angle, the degree of inflow distortion, and their influence on the impeller inflow conditions. The guide vane region measurements constituted the core observation area, with particular attention paid to the leakage flow near the tip clearance. The measurement plane was arranged perpendicular to the impeller axis, covering the entire tip region from the blade leading edge to the trailing edge. By shifting the laser sheet radially, instantaneous velocity fields at different blade span sections were obtained. These were used to resolve the generation location, development trajectory, and interaction mechanisms of the tip vortex with the leakage flow. The outlet region measurements were intended to reveal the wake flow and vortex dissipation characteristics. The measurement plane also adopted a cross-sectional layout perpendicular to the axis. It mainly observed the wake width, velocity deficit, and turbulence intensity distribution downstream of the blade trailing edge, and assessed the evolution and decay of the vortex structures in the outlet section.
Based on the above imaging plan and the zonal flow characteristics within the fan, three measurement orientations were designed to acquire refined measurements of key flow features in the inlet, guide vane, and outlet regions, as shown in Figure 5. Orientation 1 was the inlet-region measurement. The laser sheet was aligned with the fan meridional plane, making it coplanar with the impeller rotation axis. The camera was placed at the side of the inlet, with its optical axis perpendicular to the laser sheet plane, and imaging was conducted through the high-transparency acrylic casing. This orientation mainly captured the velocity distribution and distortion characteristics of the non-uniform inflow in the inlet section. Orientation 2 was the guide vane region—tip passage measurement. To resolve the complex vortex structures in the tip region, an oblique-view imaging scheme was adopted. Both the laser sheet and the camera optical axis was adjusted to form a 45° angle with the meridional plane and to be perpendicular to each other. This arrangement effectively captured the generation and evolution of the tip vortex and tip leakage vortex inside the blade passage. Orientation 3 was the guide vane region—outlet cross-section measurement. The laser sheet was arranged parallel to the impeller outlet plane, and the camera was positioned for orthogonal front-view imaging. This orientation was used to acquire instantaneous velocity fields at the outlet cross-section of the guide vane region, with a focus on analyzing wake flow, vorticity distribution, and turbulence characteristics.
A pre-test flow visualization using a continuous-wave laser was performed before formal PIV acquisition to align the laser sheet with the targeted vortex structures. By tracing the streak lines of seeded particles, we identified the core trajectory of the tip leakage vortex and the accumulation region of the corner separation vortex. The light-sheet positions for the three orientations were then adjusted to ensure the measurement planes intersected the characteristic regions and to avoid optical obstructions from the motor support and the downstream components. This approach ensures that the captured velocity fields represent the dominant coherent structures rather than arbitrary flow cross-sections.
The primary source of measurement uncertainty in the current PIV system is the sub-pixel interpolation algorithm used in cross-correlation analysis. A standard Gaussian peak-fitting routine provides a displacement resolution of approximately 0.1 pixels. In high-velocity mainstream regions, where particle image displacements are typically 8–12 pixels, the relative velocity error is estimated at ±1–2%. In low-velocity vortex-core and near-wall regions, with displacements of about 3–5 pixels, the relative error increases to ±2–3%. To reduce random errors, all instantaneous velocity fields and DMD analyses used over 500 snapshots, ensuring statistical convergence of the dominant frequencies and spatial modes. The timing controller’s synchronization accuracy (≤0.25 ns) and the robotic positioning system’s repeatability (±0.05 mm) further support the reliability of the data.
Through combined multi-zone and multi-view measurements, a comprehensive capture of the three-dimensional unsteady flow field inside the semi-open axial fan was achieved. This not only ensured the completeness of the flow field information but also enabled spatial resolution and dynamic tracking of key vortex structures, such as the tip vortex and leakage vortex. The experimental design provided high-confidence data to reveal the mechanisms of flow loss and locate aeroacoustic noise sources.
3. PIV Transient Flow Field Analysis
A thorough understanding of the flow field structure in an axial fan is a crucial step toward revealing internal flow mechanisms [38], evaluating energy-loss sources, and guiding optimal design. Based on flow field data from PIV experiments, the spatial evolution of complex flow phenomena, including the tip leakage vortex, corner separation, wake development, and secondary flow, is visually demonstrated. The generation, transport, and dissipation characteristics of the vortex systems at 900 r/min are revealed.
3.1. Analysis of Tip Leakage Vortex Flow Evolution
Based on PIV measurements, the flow field data of the inlet region at Orientation 1 (Figure 5) were acquired. Figure 6 systematically reveals the complete process of the generation, development, splitting, and periodic evolution of the tip leakage vortex within one blade passing period [39]. As the blade enters the imaging field of view along the clockwise direction (Figure 6a), the pressure surface vigorously pushes and accelerates the fluid. Mechanical energy is efficiently converted into kinetic energy, leading to a pronounced increase in velocity on the pressure side. Due to the tip clearance, the pressure difference between the pressure and suction sides drives the fluid over the blade tip, forming a leakage flow. In region A, located above the blade tip and to the upper right, a low-speed recirculation zone forms, providing the necessary vorticity accumulation and initial disturbance conditions for the inception of the tip leakage vortex. In region B, away from the blade tip, the flow is strongly entrained by the high-speed main flow within the blade passage. The external fluid is rapidly replenished and undergoes a sharp directional deflection, exhibiting a distinct cross-flow inflow characteristic.
Figure 6.
PIV velocity flow fields of tip clearance leakage vortex generation and development: (a) Analysis start point, t = 0 s; (b) t = Δt; (c) t = 2Δt; (d) t = 3Δt; (e) t = 4Δt; (f) t = 5Δt; (g) t = 6Δt; (h) Analysis end point and periodic evolution cycle start point, t = 7Δt.
After the blade rotates approximately 15° (Figure 6b, Δt = 2.78 μs), the low-speed region A migrates in the direction opposite to the blade rotation and adheres closely to the blade tip. This phenomenon indicates the formation of the initial tip leakage vortex, with the vortex core beginning to concentrate. As the blade continues to rotate from 15° to 30° (Figure 6c,d), the tip leakage vortex becomes fully developed. The leakage vortex structure is distinct, and its intensity is concentrated. Meanwhile, a large high-speed flow region is induced beneath the vortex body. This high-speed fluid adheres closely to the blade pressure surface, follows the blade rotation, and is discharged from the blade passage in an orderly manner.
When the blade has rotated approximately 75° and is about to exit the imaging field of view (Figure 6e), the leakage vortex shows a distinct tendency to split. The low-speed fluid above the vortex and the high-speed fluid below it form an intense shear layer that continuously squeezes and stretches the vortex. The vortex elongates along the tangential direction of rotation, and signs of tangential breakup appear. By the time the blade rotates to approximately 90° (Figure 6f), the leakage vortex completely splits into two sub-vortices, A1 and A2, located above and below, with unequal distribution areas. Due to the combined influence of the wide distribution of the high-speed region below and the high-speed rotation effect of the blade, the sub-vortex A2, which is closer to the blade, occupies a larger distribution area.
As the blade rotates further (Figure 6g), sub-vortex A2 is continuously entrained into the high-speed main flow within the blade passage, gradually dissipating and shrinking markedly in its distribution area. Meanwhile, sub-vortex A1 receives increased vorticity replenishment, and its area expands progressively. By the time the next blade enters the imaging field of view (Figure 6h), sub-vortex A1 has fully evolved into a large-scale vortex structure. The vortex morphology resembles the extensive low-speed region A above the blade tip in Figure 6a. The low-speed recirculation conditions characteristic of the initial leakage vortex generation are re-established. Thereby, a complete periodic evolution cycle of the tip leakage vortex is accomplished.
The PIV velocity data were imported into Tecplot for Q-criterion [40,41,42] vortex analysis (Figure 7), aiming to fully elucidate the generation, development, and splitting behavior of the tip leakage vortex. The numbering in Figure 7 is consistent with that in Figure 6. The low-Q-criterion regions (shown in blue) correspond to the laser-occluded areas, i.e., the blade illustrated in Figure 7a.
Figure 7.
Q-criterion contours of tip clearance leakage flow: (a) Analysis start point, t = 0 s; (b) t = Δt; (c) t = 2Δt; (d) t = 3Δt; (e) t = 4Δt; (f) t = 5Δt; (g) t = 6Δt; (h) Analysis end point and periodic evolution cycle start point, t = 7Δt.
At the initial stage of tip leakage vortex formation (Figure 7b), a concentrated vortex core with a high Q-value appears immediately in the blade tip region. This high-Q-criterion region is precisely where the leakage flow, after rushing over the tip clearance from the pressure surface at high speed, undergoes shear-induced roll-up with the main flow, leading to rapid vorticity accumulation. The leakage vortex exhibits strong rotation-dominated characteristics from the very beginning of its formation. At the same instant, in region B near the blade passage outlet, vortices can be observed having shed and flowing downstream. These vortices are low-Q-criterion vortex structures that survived from the previous cycle and were transported downstream by the main flow. The evolution of the tip leakage vortex thus demonstrates distinct temporal inheritance and circumferential propagation characteristics. During the development of the tip leakage vortex, the system tends to evolve from a single, concentrated vortex to a counter-rotating vortex pair. The dashed-outlined region in Figure 7c identifies an initial, small-scale counter-rotating vortex pair structure. This vortex pair is most likely the result of the interaction between the main leakage vortex and either the tip corner vortex or an endwall-induced secondary vortex. As shown in Figure 7d, this vortex pair structure expands into a large-scale system, covering a broader area above the blade tip. In the fully developed stage, the leakage vortex not only intensifies and expands in scale but also induces and entrains the surrounding fluid. The accompanying counter-rotating vortex also grows significantly, forming a complex configuration in which dual counter-rotating vortices coexist.
As the blade continues to rotate, the fluid within the passage is continuously discharged. A pronounced squeezing effect between low-Q-criterion vortices and high-Q-criterion vortices appears in the flow field. This squeezing action stretches the high-Q-criterion vortex core (Figure 7e), forming a narrow, elongated shedding and splitting pattern along the tangential direction of rotation. This splitting is not a simple diffusion of vorticity but rather the tearing and reconnection of vortex filaments induced by intense shear between the low-Q-criterion fluid carried by the high-speed main flow and the high-Q-criterion vortex core. The Q-criterion clearly reveals this gradient-driven breakup process.
Figure 7f shows that, after splitting, sub-vortex A2 closely follows the blade rotation and is entrained into the adjacent blade passage under the constraint of blade passage suction. As a vortex structure located near the blade pressure surface, A2 is rapidly transported downstream under strong shear and high-speed advection. In contrast, sub-vortex A1 lingers in the region above the blade tip, where it is subjected to the periodic disturbance induced by the rotation of the next blade. In region B, as shown in Figure 7g and Figure 7h, A1 gradually evolves under the squeezing and entrainment effects of the pressure field at the leading edge of the next blade, re-aggregates, and develops into a new vortex cluster of considerable size and intensity. The generation of this vortex cluster precisely provides the low-speed recirculation zone and an initial vorticity source for the inception of the tip leakage vortex in the next cycle, forming a closed loop with the extensive low-speed vortex region A in the PIV analysis shown in Figure 6a.
3.2. Analysis of Non-Uniform Flow in the Blade Passage
The PIV flow field data in the guide vane region-tip passage measurement area (Orientation 2 in Figure 5) were acquired. At a temporal resolution of Δt = 3.71 μs, Figure 8 captures in detail the transient evolution of the non-uniform flow inside the blade passage during a blade rotation of approximately 20°. This viewing angle places the tip leakage vortex and the hub corner separation vortex within the same spatial framework.
Figure 8.
PIV velocity flow fields of blade passage flow: (a) Analysis start point, t = 0 s; (b) t = Δt; (c) t = 2Δt; (d) t = 3Δt; (e) t = 4Δt; (f) t = 5Δt.
When the blade just enters the imaging area (Figure 8a), the flow field near the pressure surface exhibits a distinct three-layer zonal structure. As the radius increases, the first layer of flow is closely attached to the hub. Due to the influence of the endwall boundary layer and the accumulation of low-energy fluid in the corner region, the flow direction gradually deflects toward the hub. The second (middle) layer extends along the blade tangential direction and inclines toward the blade passage outlet, forming the core part of the main flow. However, this layer is blocked and squeezed by the tip leakage vortex at its upper end, generating a strong secondary flow. A small-area vortex, A, is induced beneath the leakage vortex, marking that the penetrating disturbance of the leakage vortex into the main flow has begun to substantially divide the blade passage. The third layer of flow is located near the blade tip and flows out directly along the blade passage direction at high speed. Meanwhile, the flow on the suction surface side is generally in a favorable pressure-gradient accelerating state. A distinct low-pressure region forms, entraining the fluid on the pressure surface side.
A large-scale flow separation appears near the pressure surface in Figure 8b. This separation is not an isolated event; rather, it results from the combined effect of the pressure disturbance induced by the downstream development of the tip leakage vortex and the low-momentum fluid accumulated in the hub corner region. The separation region extensively disturbs the flow in the adjacent blade passage, creating a significant blockage effect and compresses the effective flow area. In the hub region of the suction surface, a corner separation vortex co-rotating with the impeller can be clearly captured. This vortex is a typical detrimental vortex structure in axial impeller endwalls. It is usually formed when the secondary flow, driven by the cross-passage pressure gradient on the endwall, converges and rolls up in the suction surface–hub corner. As time progresses (Figure 8c,d), this corner separation vortex migrates along the direction of impeller rotation. Its vortex core maintains a relatively stable rotation direction within the suction surface–hub corner region, whereas its scale and intensity evolve as it is convected downstream by the main flow. Meanwhile, the vortex near the center of the blade passage also moves downstream with the main flow. When this vortex encounters the squeezing effect of the tip leakage vortex (Figure 8e), its body undergoes significant deformation. It is compressed radially and stretched tangentially, exhibiting asymmetric distortion. This deformation process essentially reflects the mutual shearing and spatial competition between two counter-rotating vortex systems, i.e., the induced fields of the tip leakage vortex and the corner separation vortex. The deformed low-energy fluid is ultimately expelled from the impeller along the outflow direction of the blade passage.
When the imaging area covers the flow of the entire blade passage (Figure 8f), the flow field returns to a three-zone structure similar to that in Figure 8a. However, the flow directions in each zone have been significantly reorganized. The flow marked by number 1 is continuously influenced by the corner separation vortex. Its direction is noticeably deflected, deviating from the main flow direction and tilting toward the hub. This portion of fluid contributes little to the effective flow rate due to blockage and mixing losses. The flows marked by numbers 2 and 3 denote two flow separations distributed along the impeller tangential direction, representing the manifestation of the separation region near the pressure surface at different radial positions within the blade passage. The flow marked by number 4 is directly deflected by the squeezing effect of the tip leakage vortex. Its trajectory bends toward the suction surface, indicating that the blockage effect of the leakage vortex has extended across the entire blade span. Only the flow represented by number 5 maintains an orderly outflow along the blade passage direction, constituting the effective flow discharged from the impeller. Its radial extent is relatively narrow, precisely reflecting the significant contraction of the effective flow area of the blade passage under the dual blockage of the tip leakage vortex and the corner separation vortex.
3.3. Evolution Characteristics of Wake Flow
Based on the PIV flow field data in the guide vane region—outlet cross-section measurement area (Orientation 3 in Figure 5), Figure 9 presents the multi-dimensional characteristics of the wake flow field from the impeller outlet to the downstream grille. Figure 9a,b display two consecutive instantaneous velocity fields with Δt = 3.71 μs. After being driven by the impeller, the airflow exits and forms a distinct wake structure at the outlet cross-section. The boundary-layer detachment from the blade trailing edge, low-energy fluid from the tip leakage vortex, and the corner separation fluid converge to form a low-velocity deficit region. After being straightened by the downstream grille, the flow field exhibits significant asymmetric flow division. The wake is divided into upper and lower regions with markedly different flow characteristics, reflecting the distinct loss mechanisms on the blade tip and hub sides. Within the wake region, a large number of discretely distributed vortices are generated along the flow direction. These vortices are rolled up due to instability in the wake shear layer, and, over time, they evolve into intermittent, highly unsteady vortex structures that exhibit the typical characteristics of a turbulent wake.
Figure 9.
PIV velocity flow fields and mean fields of wake: (a) Analysis start point, t = 0 s; (b) t = Δt; (c) Mean velocity field; (d) Mean vorticity field; (e) Mean Q-criterion field.
The time-averaged velocity field (Figure 9c) provides a clearer time-averaged framework. The averaged field confirms that the velocity difference between the two asymmetric regions is statistically stable. In the upper region (near the hub side), vortex A is present, and its intensity is significantly stronger than that of vortex B in the lower region. The streamwise position of vortex A is closer to the impeller outlet cross-section, indicating that the loss source it represents is more concentrated and has a shorter mixing distance.
The vorticity field (Figure 9d) further reveals the possible origins of each vortex. Vortex A in the upper part exhibits relatively high vorticity intensity, and, considering its geometric position near the blade tip region, it originates primarily from the tip leakage vortex and its subsequent downstream transport. After leaving the tip clearance, the highly concentrated vorticity carried by the leakage vortex continues to exhibit significant swirling characteristics through diffusion and stretching. Vortices B and C are located in the mid-passage region closer to the suction surface. Their vorticity characteristics are more similar to those of typical main-flow instability separation vortices. Vortex D corresponds to the downstream signature of the hub corner separation vortex, and its position coincides with the path along which the corner separation vortex migrates along the endwall. Its vorticity intensity and scale are relatively small, reflecting the attenuating effect of endwall frictional dissipation.
The Q-criterion contour (Figure 9e) provides stricter discrimination for vortex identification. The positive-Q-criterion regions identify rotation-dominated regions of the vortex core. The Q-value intensity of vortex A in the upper part is significantly higher than that of the vortices in the lower part, further supporting its identification as originating from the tip leakage vortex. As a concentrated vortex system driven by the pressure difference between the pressure and suction surfaces, the leakage vortex possesses a strong rotating core. The upper and lower groups of vortices are approximately symmetrically distributed, which is related to the splitting effect of the flow-straightening grille and the geometric symmetry of the outlet cross-section. The leakage vortex is driven by the high pressure difference across the entire blade and exhibits a high vorticity concentration, whereas the corner separation vortex forms from the accumulation of the endwall boundary layer [43] and has a relatively diffuse vortex core.
4. Coherent Structure Analysis
The PIV transient flow field data allow direct observation of the periodic evolution of the tip leakage vortex, the formation and squeezing of the counter-rotating vortex pair within the blade passage, and the asymmetric distribution of the wake deficit region at the outlet cross-section. However, these instantaneous snapshots essentially represent superimposed projections of turbulent full-scale fluctuations and background noise in physical space. The highly nonlinear, multiscale coupling of the flow field causes the dominant large-scale coherent structures to be closely mixed with random small-scale fluctuations in the original variable space. This makes it difficult to reliably identify the dynamic modes governing the flow evolution from a single or a few instantaneous images. Therefore, dynamic mode decomposition is employed to extract coherent structures from the PIV transient flow field, providing a quantitative basis for further elucidating the unsteady flow-loss mechanisms arising from multi-vortex coupling within the impeller.
DMD can be viewed as a finite-dimensional approximation of the Koopman operator [44,45,46]. Consider a discrete-time dynamical system for which a sequence of snapshot data [x0, x1, …, xn] is observed. Assume that the snapshots evolve approximately under an unknown linear operator A:
Two data matrices offset by one time step, X = [x0, x1, …, xn−1] and X′ = [x1, x2, …, xn], approximate the relationship between them via a linear operator A (i.e., X′ ≈ AX). Singular value decomposition [47] is applied to matrix X with a low-rank truncation at rank r (i.e., X ≈ UrΣrVr*). Projecting A onto the subspace spanned by Ur yields a low-dimensional approximate matrix :
The approximate matrix captures the action of matrix A on the dominant proper orthogonal decomposition (POD) modes, thereby avoiding the need to handle large n × n matrices. The eigendecomposition of is computed as W = WΛ, where Λ = diag(λ1, …, λr) and W is the eigenvector matrix [w1, w2, …, wr]. The DMD modes are defined as:
Each column Φj corresponds to an eigenvalue λj and satisfies the approximate eigenrelation AΦj ≈ λjΦj. λj is the eigenvalue of the DMD mode, describing the dynamic behavior of the corresponding mode. Combining the modes and eigenvalues, the snapshot at any time instant can be expanded as:
where b = (b1, …, br)T is the modal amplitude at the initial time.
To ensure the reliability of the dynamic mode decomposition (DMD) results and to substantiate the conclusions derived from the modal analysis, three validation checks were conducted: spectral resolution, statistical convergence, and spatial resolution. The total sampling duration (T = N × Δt = 500 × 0.213 s ≈ 106.5 s) provides a frequency resolution of approximately 1/T ≈ 0.009 Hz. This resolution is sufficient to distinguish the dominant frequencies of interest, such as 98.5 Hz and 16.44 Hz (Section 4.1), as well as their higher harmonics. For spatial resolution, the local microscopic field of view (FOV) of 20 mm × 20 mm, combined with the camera resolution and a final interrogation window size of 32 × 32 pixels with 50% overlap, results in a vector spacing of approximately 0.096 mm. This spacing is significantly smaller than the estimated vortex core diameter (2–3 mm), ensuring adequate resolution of the velocity gradients within the tip leakage vortex. In terms of noise suppression, the overall velocity error remains within ±1–3%. The high-quality particle image velocimetry (PIV) data provide a sufficient signal-to-noise ratio for subsequent DMD analysis.
4.1. Coherent Structure Analysis of the Tip Leakage Vortex
Based on the transient flow fields in the tip clearance region acquired from PIV Orientation 1 (Figure 5), DMD was performed on a flow field snapshot matrix with a size of 2666 × 500. Figure 10a shows that the modes appear in conjugate pairs, with each pair sharing the same energy but opposite frequencies. The first ten modes with the highest energy were analyzed in detail, and the spatial distributions of the real and imaginary parts of the dominant modes are shown in Figure 10b.
Figure 10.
Coherent structures and frequency distribution of the tip leakage vortex: (a) Modal energy distribution corresponding to the DMD mode frequencies; (b) Spatial distribution of the DMD modes, where the upper and lower panels show the real and imaginary parts of the DMD modes, respectively, and the energy decreases from left to right.
DMD Mode Φ1 accounting for the largest share of the total energy, accounting for about 88.5%. The characteristic frequency of Mode Φ1 is f = 98.5 Hz, and its spatial structure consists of two pairs of symmetrically distributed vortex clusters [48]. Vortex A near the pressure surface represents the concentrated vorticity of the blade passage main flow, which is driven by the pressure difference across the tip clearance and migrates toward the suction surface side in region B. Vorticity shedding and separation occur in the direction of region C. This spatial evolution path is highly consistent with the generation and shedding trajectory of the tip leakage vortex observed in the PIV time-averaged field and instantaneous snapshots. The vortex shedding frequency [49] (fTLV = 98.5 Hz) is approximately 2.19 times the blade passing frequency (fBPF = 45 Hz), indicating that about two complete leakage vortex generation–shedding cycles occur within one blade passing period (120°). From the initial formation of the leakage vortex in Figure 6a to the splitting tendency shown in Figure 6e, and then to the re-expansion of sub-vortex A1 in Figure 6g, which evolves into the large-scale low-speed region of the next cycle, the temporal sequence clearly exhibits a characteristic frequency that is a multiple of the blade passing frequency. The spatially symmetric vortex pair structure of DMD Mode 1 is precisely the low-dimensional representation of this dominant-frequency periodic shedding in spectral space.
The second-highest-energy mode (3.1% of the total energy), Mode Φ3, corresponds to the second harmonic of the tip leakage vortex (approximately 197 Hz). Its spatial distribution exhibits an antisymmetric structure along the blade passage outflow direction, and the radial distribution of the main flow also displays antisymmetric features. This harmonic mode reflects the asymmetric evolution of the leakage vortex over one fundamental period (as shown in Figure 6e–g). The leakage vortex splits into asymmetric sub-vortices A1 and A2; the differences in their spatial scales, vorticity intensities, and migration directions constitute the physical origin of the second harmonic. The appearance of the antisymmetric structure indicates that the periodic development of the leakage vortex is not a simple linear oscillation but rather contains a significant dipole component. This is closely associated with the asymmetric distortion induced by the shearing effect of the main flow in the blade passage and the squeezing between the upper low-speed and lower high-speed fluids.
Mode Φ5 (energy contribution: 3.09%) captures the macroscopic coherent structures of the blade-passage turbulence, with a frequency lower than that of the main leakage vortex mode. Its spatial mode exhibits an antisymmetric distribution along the flow direction, corresponding to shear-layer oscillations between the main flow and the secondary flow induced by the leakage vortex within the blade passage. In conjunction with the three-layer zonal structure of the blade passage flow and the blockage effect of the large-scale separation on the pressure surface side shown in Figure 8, the antisymmetric structure of Mode Φ5 can be interpreted as alternating high- and low-speed streaks spanning the blade passage in the radial direction. Mode Φ7 (energy contribution: 1.21%) represents the high-frequency turbulent structures within the blade passage. Its frequency scale corresponds to the turbulent fluctuations accumulated over a complete rotation cycle (360°) of the three blades. This mode integrates the composite turbulent effects resulting from the shedding of the leakage vortex, the migration of the corner separation vortex, and the mixing of multi-scale vortex clusters within the blade passage. In physical space, this mode may correspond to the small-scale vortex groups that undergo squeezing deformation and dissipate along the flow direction, as shown in Figure 8d,e. Its high-frequency characteristics reflect the energy contributions from the roll-up of intense shear layers and near-wall turbulent bursts within the blade passage.
Mode Φ10 (energy contribution 0.89%) reveals the shedding direction structure of the third harmonic (approximately 295.5 Hz) of the tip leakage vortex. Its spatial distribution extends along the direction indicated by the yellow dashed line in the figure, forming a certain angle with the main shedding direction of Mode Φ1. This higher-order harmonic reveals the nonlinear three-wave interaction occurring during the periodic shedding of the leakage vortex. The fundamental vortex shedding and the second-harmonic distortion generate higher-order frequency components through phase coupling. Although the third-harmonic mode has a relatively low energy contribution, it provides an important dynamic contribution to the fine modulation of the periodic morphology of the leakage vortex and to the excitation of high-frequency wake fluctuations. This corresponds one-to-one to the higher-frequency secondary vortex shedding process during the transition from vortex splitting to reconstruction, as shown in Figure 6f–h.
4.2. Coherent Structures in Non-Uniform Blade Passage Flow
Based on the time series of the blade passage flow field acquired from PIV Orientation 2 (Figure 5), DMD was performed on the flow field snapshot matrix with a size of 3969 × 500 (Figure 11). Figure 11a shows that the energy proportions of the first ten modes are 52.8%, 15.6%, 7.8%, 3.7%, and 2.1%, respectively.
Figure 11.
Coherent structures and energy distribution of blade passage flow. Upper panels: real parts of the DMD modes; lower panels: imaginary parts of the DMD modes: (a) Modal energy distribution corresponding to the DMD mode frequencies; (b) DMD mode with the largest energy; (c) DMD mode with the second-largest energy; (d) DMD mode with the third-largest energy; (e) DMD mode with the fourth-largest energy; (f) DMD mode with the fifth-largest energy.
Figure 11b presents the DMD mode with the largest energy proportion (characteristic frequency f = 97.99 Hz), which is highly consistent with the dominant frequency of the tip leakage vortex (98.5 Hz) extracted from Orientation 1. This further confirms the absolute dominance of the tip leakage vortex in the blade passage flow field. The high-amplitude region is concentrated near the tip clearance, forming a vortex shedding region with its core on the suction surface. Its spatial morphology is consistent with the characteristics of the high-Q-value vortex core at the blade tip and its evolution into a counter-rotating vortex pair structure identified by the Q-criterion in Figure 7b–d. The leakage vortex rolls up due to the pressure difference across the tip clearance, and its vorticity is highly concentrated at the suction surface and the blade tip. The amplitude gradient of the real part clearly delineates the spatial boundary and the direction of intensity decay of the leakage vortex core. The spatial distribution of the imaginary part reveals the coupled origin of the leakage vortex generation. The vorticity originates not only from the jet shear at the tip clearance but also from the secondary flow induced by the hub corner separation vortex. The generation of the tip leakage vortex is not an isolated leakage flow behavior; rather, it is a product of the mutual entrainment and phase coupling among three flows: the blade passage main flow, the tip leakage flow, and the hub corner secondary flow.
Figure 11c corresponds to the large-scale vortex shedding mode associated with one full impeller revolution (360°). Its real part exhibits streak structures of large-scale vortices along the tangential direction, encompassing the traces of periodic transport and shedding of the main flow vortex, the tip leakage vortex, and the corner separation vortex. The imaginary part focuses on the antisymmetric spatial structure of the corner separation vortex at the hub, which precisely corresponds to the physical process captured by the Q-criterion in Figure 7c,d, showing the evolution from a small-scale counter-rotating vortex pair to a large-scale one. After the corner separation vortex rolls up at the suction surface and hub corner, the induced secondary flow and the main flow form a counter-rotating vortex pair. The antisymmetric distribution of the DMD imaginary part is exactly the complex amplitude representation of this vortex pair structure in the modal space.
Figure 11d shows the second-harmonic mode of the tip leakage vortex (f = 196.59 Hz). The spatial distribution of its real part clearly delineates the shear layer boundaries between the tip leakage vortex and the corner separation vortex, as well as between these two and the main flow. This boundary divides the blade passage into three flow zones along the blade rotation direction. The hub corner flow is deflected toward the hub due to entrainment by the corner separation vortex. The tangential main flow in the mid-passage and the flow in the tip leakage-vortex influence zone near the blade tip accelerate in the direction of the blade passage outflow. This three-zone structure corresponds one-to-one to the three-layer zonal flow on the pressure surface side observed in Figure 8a,f. The second-harmonic leakage vortex undergoes asymmetric evolution within one fundamental period, as shown in Figure 7e,f, where the high-Q-value vortex core is squeezed and stretched by low-Q-value fluid, splitting into sub-vortices A1 and A2 of unequal size. This asymmetry excites the second harmonic, which is captured in Mode 3 as an antisymmetric oscillation along the shear layer boundary.
Figure 11e captures the dominant frequency mode of the hub corner separation vortex, with a frequency of f = 16.44 Hz. This frequency is close to but slightly higher than the frequency corresponding to one impeller revolution (15 Hz). The corner separation vortex completes one coherent shedding slightly earlier than the blade passing frequency within one full blade rotation cycle. As the main flow in the blade passage is expelled at high speed, the corner separation vortex, under the combined effects of a strong adverse pressure gradient and endwall friction, is the first to detach from the suction surface and hub corner region, resulting in a shedding phenomenon with a frequency slightly higher than the rotational frequency. In the spatial mode, regions A and B mark the secondary flow entrainment path from the main flow into the hub corner region. This entrainment provides a continuous supply of low-momentum fluid to the corner separation vortex, enabling it to maintain a coherent structure along the rotation axis. This entrainment-and-shedding cycle corroborates the physical process observed in Figure 7g,h, where sub-vortex A1 gradually accumulates in region B and develops into a vortex cluster of considerable size. The periodic shedding of the corner separation vortex provides the low-speed recirculation zone and initial vorticity for the inception of the tip leakage vortex in the next cycle.
Figure 11f shows a mode whose frequency is composed of a combination of the corner separation vortex frequency and the blade rotation frequency. This frequency occurs before the impeller rotates through 120° (corresponding to 45 Hz), revealing the asymmetric accelerated evolution of the corner separation vortex within a fundamental period. Within one blade passing period, the corner separation vortex undergoes a complete cycle of formation, development, and ultimate disruption of the main flow. During its development stage, it entrains and blocks the region from the suction surface to the hub corner, thereby reducing the effective flow area. During its disruption stage, it vigorously mixes with the main flow and breaks into turbulent structures of various scales. These fragmented turbulent clusters constitute an important source of high-frequency turbulent energy in the blade passage.
4.3. Coherent Structures in Wake Flow
Figure 12 presents the DMD results based on the time series of the wake flow field at the outlet cross-section acquired from PIV Orientation 3 (Figure 5). Figure 12a shows that the energy proportions of the first ten modes are 4.1%, 3.9%, 3.3%, 2.8%, and 2.5%, respectively. Compared with the tip leakage and blade passage flows, the energy distribution among the DMD modes here is more uniform. The DMD mode with the highest energy (Figure 12b) has a frequency of f = 248.45 Hz. This frequency can be interpreted as the nonlinear superposition of the second harmonic of the tip leakage vortex dominant frequency (fTLV = 98.5 Hz, i.e., 197 Hz), the corner separation vortex frequency (fCSV = 16.44 Hz), and the blade passing frequency (fBPF = 45 Hz). The dominant coherent structure in the outlet wake is not a linear continuation of a single vortex system but rather a composite mode formed by the full coupling of the two dominant upstream vortex systems with the blade passing effect in the wake. Near the grille outlet (regions A and B), local small-scale vortices exhibit asymmetric coherent structures, reflecting the intensity asymmetry and phase difference between the high-frequency component of the tip leakage vortex and the low-frequency component of the corner separation vortex in the near-field wake. Along the wake development and flow direction, the small-scale vortices gradually merge, roll up, and evolve into large-scale vortices, forming a large-scale antisymmetric vortex shedding coherent structure in regions C and D. This spatial evolution from near-field small scales to far-field large scales represents a classical Kármán vortex street mechanism driven by wake shear layer instability and vortex pairing and merging, operating under the composite frequency modulation.
Figure 12.
Coherent structures and energy distribution of turbulent wake, upper: real part of DMD mode, lower: imaginary part of DMD mode: (a) Modal energy distribution corresponding to DMD mode frequencies; (b) DMD mode with the largest energy; (c) DMD mode with the second-largest energy; (d) DMD mode with the third-largest energy; (e) DMD mode with the fourth-largest energy; (f) DMD mode with the fifth-largest energy.
The mode with the second-highest energy (Figure 12c) has a frequency of f = 186.34 Hz. Its frequency composition can be decomposed as the sum of the tip leakage vortex dominant frequency (fTLV = 98.5 Hz) and twice the blade passing frequency (2 × fBPF = 90 Hz). This mode characterizes the coupling effect between the coherent shedding of the tip leakage vortex and the periodic blade sweep. The spatial structure shows that small-scale vortices still accumulate near the grille outlet and develop in the flow direction. The wake development is governed by the joint frequency action of the tip leakage vortex frequency and the blade rotation frequency. The harmonic component of the blade rotation frequency provides a modulation envelope for the periodic shedding of the leakage vortex. The proximity of the two frequencies (98.5 Hz and 90 Hz differ by only about 9%) leads to a beat frequency effect, which manifests as periodic expansion and contraction of the spanwise vortex intensity in the wake.
Figure 12d presents the characteristics of the coherent structure with a frequency of f = 124.22 Hz. This frequency can be decomposed as the sum of the tip leakage vortex frequency (fTLV = 98.5 Hz) and the blade passing frequency (fBPF = 45 Hz), minus the corner separation vortex frequency (fCSV = 16.44 Hz). The blade rotation promotes the generation and development of the tip leakage vortex (providing a positive frequency contribution), whereas the corner separation vortex acts as a reverse frequency coupling component. In the spatial distribution of the imaginary part, staggered phase jumps of the coherent structure along the radial direction can be observed. The negative modulation by the corner separation vortex causes the vortex shedding events associated with the leakage vortex in the wake to be delayed or attenuated in time, reflecting an antagonistic relationship between the two vortex systems during wake evolution.
The coherent structure shown in Figure 12e has a frequency of f = 62.11 Hz, which can be decomposed as the sum of the blade passing frequency and the corner separation vortex frequency. This mode directly characterizes the nonlinear interference between the corner separation vortex and the blade rotation effect. In conjunction with the spatial evolution characteristics of the corner separation vortex within the blade passage when the blade rotates approximately 120°, as shown in Figure 8d, this frequency exactly corresponds to the coherent variation in the corner separation vortex over the time scale of approximately 120° blade rotation. Within this interval, the corner separation vortex undergoes formation, development, and nonlinear interference with the main flow, ultimately disrupting the main flow and generating turbulent structures of various scales.
Figure 12f presents the spatial distribution pattern of a high-frequency coherent structure (f = 559.0 Hz). Its frequency can be decomposed as the superposition of the second harmonic of the tip leakage vortex (2fTLV = 197 Hz) and the modal frequency shown in Figure 12d (f = 62.11 Hz). The actual frequency is even higher, possibly incorporating additional higher-order harmonic components. The time scale corresponding to this high-frequency mode is an extremely short period of approximately 9.7° of blade rotation. The higher harmonics of the tip leakage vortex, the low-frequency oscillation of the corner separation vortex, and the blade rotation effect are mutually entangled and strongly nonlinearly coupled, forming highly complex turbulence patterns. The spatial distribution exhibits fragmented and irregular small-scale vortex clusters without distinct large-scale organizational features. This frequency has entered the inertial subrange, where turbulent energy is transferred from low-frequency coherent structures to high-frequency dissipation scales through the vortex energy cascade.
5. Conclusions
This study conducted PIV internal flow measurements and coherent structure analysis on a semi-open axial fan in an outdoor air conditioning unit, elucidating the low-dimensional characteristics of the tip leakage vortex, the corner separation vortex, and the turbulent wake. The main conclusions are as follows:
- (1)
- The tip leakage vortex undergoes a complete cycle of generation, development, asymmetric splitting, and reconstruction within one blade passing period. The leakage vortex splits into two sub-vortices of unequal scale and intensity. The sub-vortex closer to the blade is rapidly entrained and dissipated by the high-speed main flow in the blade passage. The other sub-vortex, lingering in the blade tip region, gradually expands under the squeezing effect of the leading edge of the next blade, re-evolving into a low-speed recirculation zone and providing the initial vorticity for the inception of the leakage vortex in the next cycle. A three-layer zonal structure appears on the pressure surface side within the blade passage. The flow near the hub region is deflected toward the hub under the influence of the corner separation vortex. The mid-passage region is dominated by the tangential rotating main flow, while the region near the blade tip forms a high-speed outflow channel due to blockage by the leakage vortex. After being divided by the grille, the wake flow field forms upper and lower asymmetric velocity deficit regions, in which the vorticity intensity and Q-criterion value on the blade tip side are significantly higher than those on the hub side.
- (2)
- The tip leakage vortex divides the upper blade passage flow through blockage and shear, while the hub corner separation vortex, rolled up by the endwall secondary flow, blocks the suction surface and the hub corner region. Together, they cause a reduction in the effective flow area of the blade passage and flow deflection. Higher-order frequency components are generated through phase coupling between the fundamental vortex shedding and the second-harmonic distortion, and their fine modulation of the periodic morphology of the leakage vortex and excitation of high-frequency wake fluctuations cannot be ignored. The coherent structures of the outlet wake turbulence exhibit clear spectral stratification and nonlinear coupling characteristics. The low-frequency modes capture the nonlinear interference between the corner separation vortex and blade rotation, while the high-frequency modes characterize the high-frequency turbulent dissipation under the strong nonlinear coupling of multiple vortex systems.
- (3)
- The energy of the tip leakage vortex is absolutely dominant in the tip clearance region, with the dominant mode accounting for up to 88.5% of the total modal energy. The tip leakage vortex frequency is 98.5 Hz, and the symmetric vortex pair spatial distribution indicates that the periodic shedding of the leakage vortex is the primary source of blade passage disturbance. The dominant frequency of the corner separation vortex is 16.44 Hz, completing one coherent shedding slightly earlier than the blade within one revolution cycle. The modal energy distribution of the coherent structures in the wake region is significantly more uniform, with the first five modes accounting for between 2.5% and 4.1% of the total energy. The dominant mode frequency is 248.45 Hz, formed by the nonlinear superposition of the leakage vortex harmonic, the corner separation vortex frequency, and the blade passing frequency. Spatially, it exhibits an evolution from near-field small-scale asymmetric vortex clusters to far-field large-scale antisymmetric vortex streets. Other modal frequencies, such as 186.34 Hz and 124.22 Hz, all correspond to combinations of different vortex system frequencies, indicating that the wake turbulence is a composite coherent field driven by the coupling of multiple upstream vortex systems.
Several limitations of this study should be acknowledged. First, the experimental measurements are limited to a single operating condition (900 r/min) and a specific fan geometry. Therefore, the generalizability of the observed coherent structures to other rotational speeds or blade designs has yet to be established. Second, the PIV measurements are inherently two-dimensional (2D2C), which may not fully capture the three-dimensional characteristics of the tip leakage vortex and its interaction with the corner separation vortex. Third, although the DMD analysis effectively extracts the dominant coherent structures, the modal decomposition is based on a linear approximation of the Koopman operator and may not fully resolve strongly nonlinear transient events. Future research will expand the current framework to a broader range of operating conditions and utilize volumetric PIV techniques to achieve a more comprehensive three-dimensional characterization of the flow dynamics.
Author Contributions
Conceptualization, B.L. and Q.X.; methodology, J.W.; software, B.L.; validation, B.L., Q.X. and Y.H.; formal analysis, Q.X.; investigation, B.L.; resources, J.W.; data curation, B.L.; writing—original draft preparation, B.L.; writing—review and editing, B.L.; visualization, J.W.; supervision, J.W.; project administration, Y.H.; funding acquisition, Q.X. All authors have read and agreed to the published version of the manuscript.
Funding
This research was supported by the Hunan Provincial Natural Science Foundation of China (2026JJ60187) and the National Key Research and Development Program of China (2023YFC3708405).
Data Availability Statement
The data that support the findings of this study are available from the corresponding author upon reasonable request.
Acknowledgments
The authors appreciate all other scholars for their advice and assistance in improving this article.
Conflicts of Interest
Author Bin Li was employed by the company Xiaomi Intelligent Home Appliances (Wuhan). Author Yougen Huang was employed by the company Ningbo Fotile Kitchenware. The remaining authors declare that the research was conducted in the absence of any commercial or financial relationships that could be construed as a potential conflict of interest.
Abbreviations
The following abbreviations are used in this manuscript:
| TLV | Tip leakage vortex |
| CSV | Corner separation vortex |
| PIV | Particle image velocimetry |
| DMD | Dynamic mode decomposition |
| POD | proper orthogonal decomposition |
References
- Xu, C.; Mao, Y.; Hu, Z. Tonal and broadband noise control of an axial-flow fan with metal foams: Design and experimental validation. Appl. Acoust. 2017, 127, 346–353. [Google Scholar] [CrossRef] [Scilit]
- Yang, F.; Wu, Y.; Chen, Z.; Spence, S.; Li, B. The unsteadiness of tip leakage vortex breakdown and its role in rotating instability. Phys. Fluids 2023, 35, 107108. [Google Scholar] [CrossRef] [Scilit]
- Bailey, S.C.C.; Hultmark, M.; Monty, J.P.; Alfredsson, P.H.; Chong, M.S.; Duncan, R.D.; Fransson, J.H.; Hutchins, N.; Marusic, I.; McKeon, B.J.; et al. Obtaining accurate mean velocity measurements in high Reynolds number turbulent boundary layers using Pitot tubes. J. Fluid Mech. 2013, 715, 642–670. [Google Scholar] [CrossRef] [Scilit]
- Hutchins, N.; Choi, K.S. Accurate measurements of local skin friction coefficient using hot-wire anemometry. Prog. Aerosp. Sci. 2002, 38, 421–446. [Google Scholar] [CrossRef] [Scilit]
- Wang, H.; Liu, Y.; Wang, S. Dense velocity reconstruction from particle image velocimetry/particle tracking velocimetry using a physics-informed neural network. Phys. Fluids 2022, 34, 017116. [Google Scholar]
- Xiao, Q.; Zeng, D.; Yu, Z.; Zou, S.; Liu, Z. Study on rapid prediction of flow field in a knudsen compressor based on multi-fidelity reduced-order models. Int. J. Hydrogen Energy 2024, 86, 519–529. [Google Scholar]
- Nekkanti, A.; Schmidt, O.T. Gappy spectral proper orthogonal decomposition. J. Comput. Phys. 2023, 478, 111950. [Google Scholar] [CrossRef] [Scilit]
- Lu, Y.; Wang, T.; Zhao, C.; Zhu, Y.; Jia, X.; Zhang, L.; Shi, F.; Jiang, C. An efficient design method of indoor ventilation parameters for high-speed trains using improved proper orthogonal decomposition reconstruction. J. Build. Eng. 2023, 71, 106600. [Google Scholar] [CrossRef] [Scilit]
- Xiao, Q.; Jiang, B.; Yang, X.; Ding, Y.; Wang, J. Reduced-order model and attractor identification for large eddy simulation of squirrel cage fan. Phys. Fluids 2023, 35, 115115. [Google Scholar] [CrossRef] [Scilit]
- Schmid, P.J. Dynamic mode decomposition and its variants. Annu. Rev. Fluid Mech. 2022, 54, 225–254. [Google Scholar] [CrossRef] [Scilit]
- Colbrook, M.J.; Li, Q.; Raut, R.V.; Townsend, A. Beyond expectations: Residual dynamic mode decomposition and variance for stochastic dynamical systems. Nonlinear Dyn. 2024, 112, 2037–2061. [Google Scholar]
- Ding, Y.; Wang, J.; Jiang, B.; Xiao, Q.; Yang, X.; Wu, L.; Xie, B. Numerical investigation of the effect of blade distortion laws on the corner flow separation of the axial-flow fan. Aerosp. Sci. Technol. 2023, 138, 108296. [Google Scholar] [CrossRef] [Scilit]
- Williams, J.J.; Nicolaou, Z.G.; Kutz, J.N.; Brunton, S.L. Data-driven discovery of a new Ginzburg-Landau reduced-order model for vortex shedding. Phys. Rev. Fluids 2026, 11, 034401. [Google Scholar] [CrossRef] [Scilit]
- Hribernik, A.; Bombek, G.; Fike, M. Phase-resolved PIV for investigating rotating stall within an axial fan. Flow Meas. Instrum. 2019, 70, 101659. [Google Scholar] [CrossRef] [Scilit]
- Mishra, B.K.; Panigrahi, P.K. Spatiotemporal structure of flow field by a dielectric-barrier-discharge plasma actuator using phase-resolved particle image velocimetry. Phys. Fluids 2024, 36, 117137. [Google Scholar]
- Zhang, Y.; Zhang, Y.; Wu, Y. A review of rotating stall in reversible pump turbine. Proc. Inst. Mech. Eng. Part C J. Mech. Eng. Sci. 2017, 231, 1181–1204. [Google Scholar]
- Hofer, D.; Krieger, M.; Kirchhofer, M. High-resolution 2.5 D particle image velocimetry measurements of the flow fields generated by small fans. J. Fluids Eng. 2021, 143, 121101. [Google Scholar]
- Wang, H.P.; Gao, Q.; Wang, S.Z.; Li, Y.H.; Wang, Z.Y.; Wang, J.J. Error reduction for time-resolved PIV data based on Navier–Stokes equations. Exp. Fluids 2018, 59, 149. [Google Scholar]
- Dellacasagrande, M.; Canepa, E.; Cattanei, A.; Moradi, M. Characterization of unsteady leakage flow in an axial fan. Int. J. Turbomach. Propuls. Power 2023, 8, 34. [Google Scholar] [CrossRef] [Scilit]
- Zhu, P.; Liu, Y.; Kong, X.; Yue, B.; Chen, H.; Liu, C. Experimental and numerical investigation on leakage flow, bristle deflections, and oscillation characteristics of brush seals. Phys. Fluids 2025, 37, 015163. [Google Scholar] [CrossRef] [Scilit]
- Nakariakov, V.M.; Anfinogentov, S.A.; Antolin, P.; Jain, R.; Kolotkov, D.Y.; Kupriyanova, E.G.; Li, D.; Magyar, N.; Nisticò, G.; Pascoe, D.J.; et al. Kink oscillations of coronal loops. Space Sci. Rev. 2021, 217, 73. [Google Scholar] [CrossRef] [Scilit]
- Čantrak, D.S.; Janković, N.Z. Turbulence structure and dynamics investigation of turbulent swirl flow in pipe using high-speed stereo PIV data. Energies 2022, 15, 5417. [Google Scholar] [CrossRef] [Scilit]
- Gong, B.; Feng, C.; Chen, W.; Li, N.; Ouyang, X.; Yin, J.; Wang, D. Experimental on spatial-temporal evolution characteristics of the blade tip cavitation in a mixed flow waterjet pump. Appl. Ocean Res. 2024, 149, 103993. [Google Scholar] [CrossRef] [Scilit]
- Yu-Cheong, I.; Kobayashi, T.; Saga, T.; Itoh, T. Stereoscopic PIV measurements of flow in and around axial flow fan. J. Vis. 2002, 5, 51–57. [Google Scholar] [CrossRef] [Scilit]
- Ji, L.; Pu, W.; Li, W.; Shi, W.; Tian, F.; Yang, Y.; Agarwal, R. Flow instability in mixed-flow/axial-flow pump: A review of relationship between tip leakage flow distortion and rotating stall. Proc. Inst. Mech. Eng. Part A J. Power Energy 2025, 239, 225–253. [Google Scholar]
- Li, B.; Lu, Q.; Jiang, B.; Yang, J.; Wang, J.; Xie, J. Effects of outer edge bending on the aerodynamic and noise characters of axial fan for air conditioners. Processes 2022, 10, 686. [Google Scholar] [CrossRef] [Scilit]
- Hou, J.; Liu, Y. Evolution of unsteady vortex structures in the tip region of an axial compressor rotor. Phys. Fluids 2023, 35, 045107. [Google Scholar] [CrossRef] [Scilit]
- Duan, F.; Wang, J.J. Passive bionic motion of a flexible film in the wake of a circular cylinder: Chaos and periodicity, flow–structure interactions and energy evolution. J. Fluid Mech. 2024, 986, A29. [Google Scholar] [CrossRef] [Scilit]
- Yang, Y.; Li, W.; Shi, W.; Ping, Y.; Yang, Y.; Wang, L. Numerical investigation on the unstable flow at off-design condition in a mixed-flow pump. Proc. Inst. Mech. Eng. Part A J. Power Energy 2019, 233, 849–865. [Google Scholar] [CrossRef] [Scilit]
- Liang, Z.; Wang, J.; Wang, W.; Jiang, B.; Ding, Y.; Qin, W. Numerical and experimental investigations of axial flow fan with bionic forked trailing edge. Machines 2023, 11, 155. [Google Scholar] [CrossRef] [Scilit]
- Xie, J.; Wang, X.; Wu, G.; Wu, K. Visualization and experiment of tip vortex phenomenon in cooling fan using digital particle image velocimetry. J. Therm. Sci. 2004, 13, 321–327. [Google Scholar] [CrossRef] [Scilit]
- Jung, J.H.; Joo, W.G. The effect of the entrance hub geometry on the efficiency in an axial flow fan. Int. J. Refrig. 2019, 101, 90–97. [Google Scholar] [CrossRef] [Scilit]
- Ye, Q.; Wang, Y.; Shao, X. Dynamics of cavitating tip vortex. J. Fluid Mech. 2023, 967, A30. [Google Scholar] [CrossRef] [Scilit]
- Shi, L.; Mao, R.; Ma, H.; Wang, T. Flow structure and vortex dynamics of blade surface transitional flow in the near-tip region of a compressor cascade. Phys. Fluids 2023, 35, 094102. [Google Scholar] [CrossRef] [Scilit]
- Jung, J.H.; Joo, W.G. Effect of tip clearance, winglets, and shroud height on the tip leakage in axial flow fans. Int. J. Refrig. 2018, 93, 195–204. [Google Scholar] [CrossRef] [Scilit]
- Baba, S.; Ben-Gida, H.; Deng, G.C.; Moreau, S.; Stalnov, O.; Lavoie, P. Noise-generation mechanisms of a wing-tip vortex at moderate angle of attack. J. Fluid Mech. 2026, 1026, A18. [Google Scholar]
- Luo, B.; Chu, W.; Zhang, H. Tip leakage flow and aeroacoustics analysis of a low-speed axial fan. Aerosp. Sci. Technol. 2020, 98, 105700. [Google Scholar] [CrossRef] [Scilit]
- Hickey, J.; Zhao, W.; Persoons, T. Experimental and numerical investigation of winglet designs for optimized performance of small axial fans. Appl. Acoust. 2025, 231, 110448. [Google Scholar] [CrossRef] [Scilit]
- Xiao, Q.; Wang, J.; Yang, X.; Ding, Y.; Jiang, B. An Empirical noise model of centrifugal fans with different volute tongues based on Langevin regression. J. Build. Eng. 2023, 79, 107876. [Google Scholar] [CrossRef] [Scilit]
- Zhan, J.M.; Li, Y.T.; Wai, W.H.O.; Hu, W.Q. Comparison between the Q criterion and Rortex in the application of an in-stream structure. Phys. Fluids 2019, 31, 121701. [Google Scholar] [CrossRef] [Scilit]
- Kumar, V.; Mondal, S.; Datta, A.; Agrawal, A. Experimental and numerical investigation of a novel heatsink using Q criterion analysis. Int. J. Therm. Sci. 2026, 219, 110243. [Google Scholar] [CrossRef] [Scilit]
- Ogawa, S.; Yoshinaga, S.; Agulles, L.M.; Sasaki, D. Non-reactive flow simulation of wall regression effects in a star-grain solid rocket motor. Sci. Technol. Energ. Mater. 2026, 87, 19–26. [Google Scholar]
- Li, R.; Gao, L.; Ma, C.; Lin, S.; Zhao, L. Corner separation dynamics in a high-speed compressor cascade based on detached-eddy simulation. Aerosp. Sci. Technol. 2020, 99, 105730. [Google Scholar]
- Otto, S.E.; Rowley, C.W. Koopman operators for estimation and control of dynamical systems. Annu. Rev. Control Robot. Auton. Syst. 2021, 4, 59–87. [Google Scholar] [CrossRef] [Scilit]
- Mezić, I. Analysis of fluid flows via spectral properties of the Koopman operator. Annu. Rev. Fluid Mech. 2013, 45, 357–378. [Google Scholar] [CrossRef] [Scilit]
- Bevanda, P.; Sosnowski, S.; Hirche, S. Koopman operator dynamical models: Learning, analysis and control. Annu. Rev. Control 2021, 52, 197–212. [Google Scholar] [CrossRef] [Scilit]
- Xiao, Q.; Wang, J.; Jiang, B.; Ding, Y.; Yang, X. Study on nonlinear correlation in modal coefficients of the bionic airfoil. Machines 2023, 11, 88. [Google Scholar] [CrossRef] [Scilit]
- Bansal, M.S.; Yarusevych, S. Experimental study of flow through a cluster of three equally spaced cylinders. Exp. Therm. Fluid Sci. 2017, 80, 203–217. [Google Scholar] [CrossRef] [Scilit]
- Lim, Y.; Lee, Y.; Goo, J.; Bae, D.; Shin, Y.I. Vortex shedding frequency of a moving obstacle in a Bose–Einstein condensate. New J. Phys. 2022, 24, 083020. [Google Scholar] [CrossRef] [Scilit]
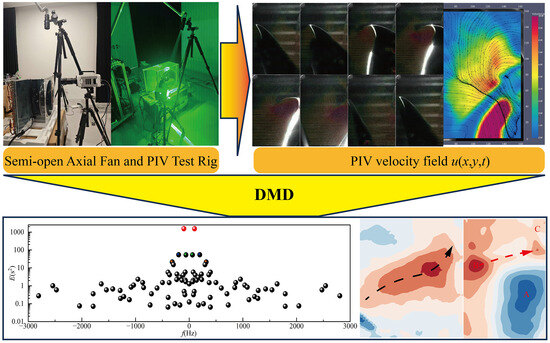
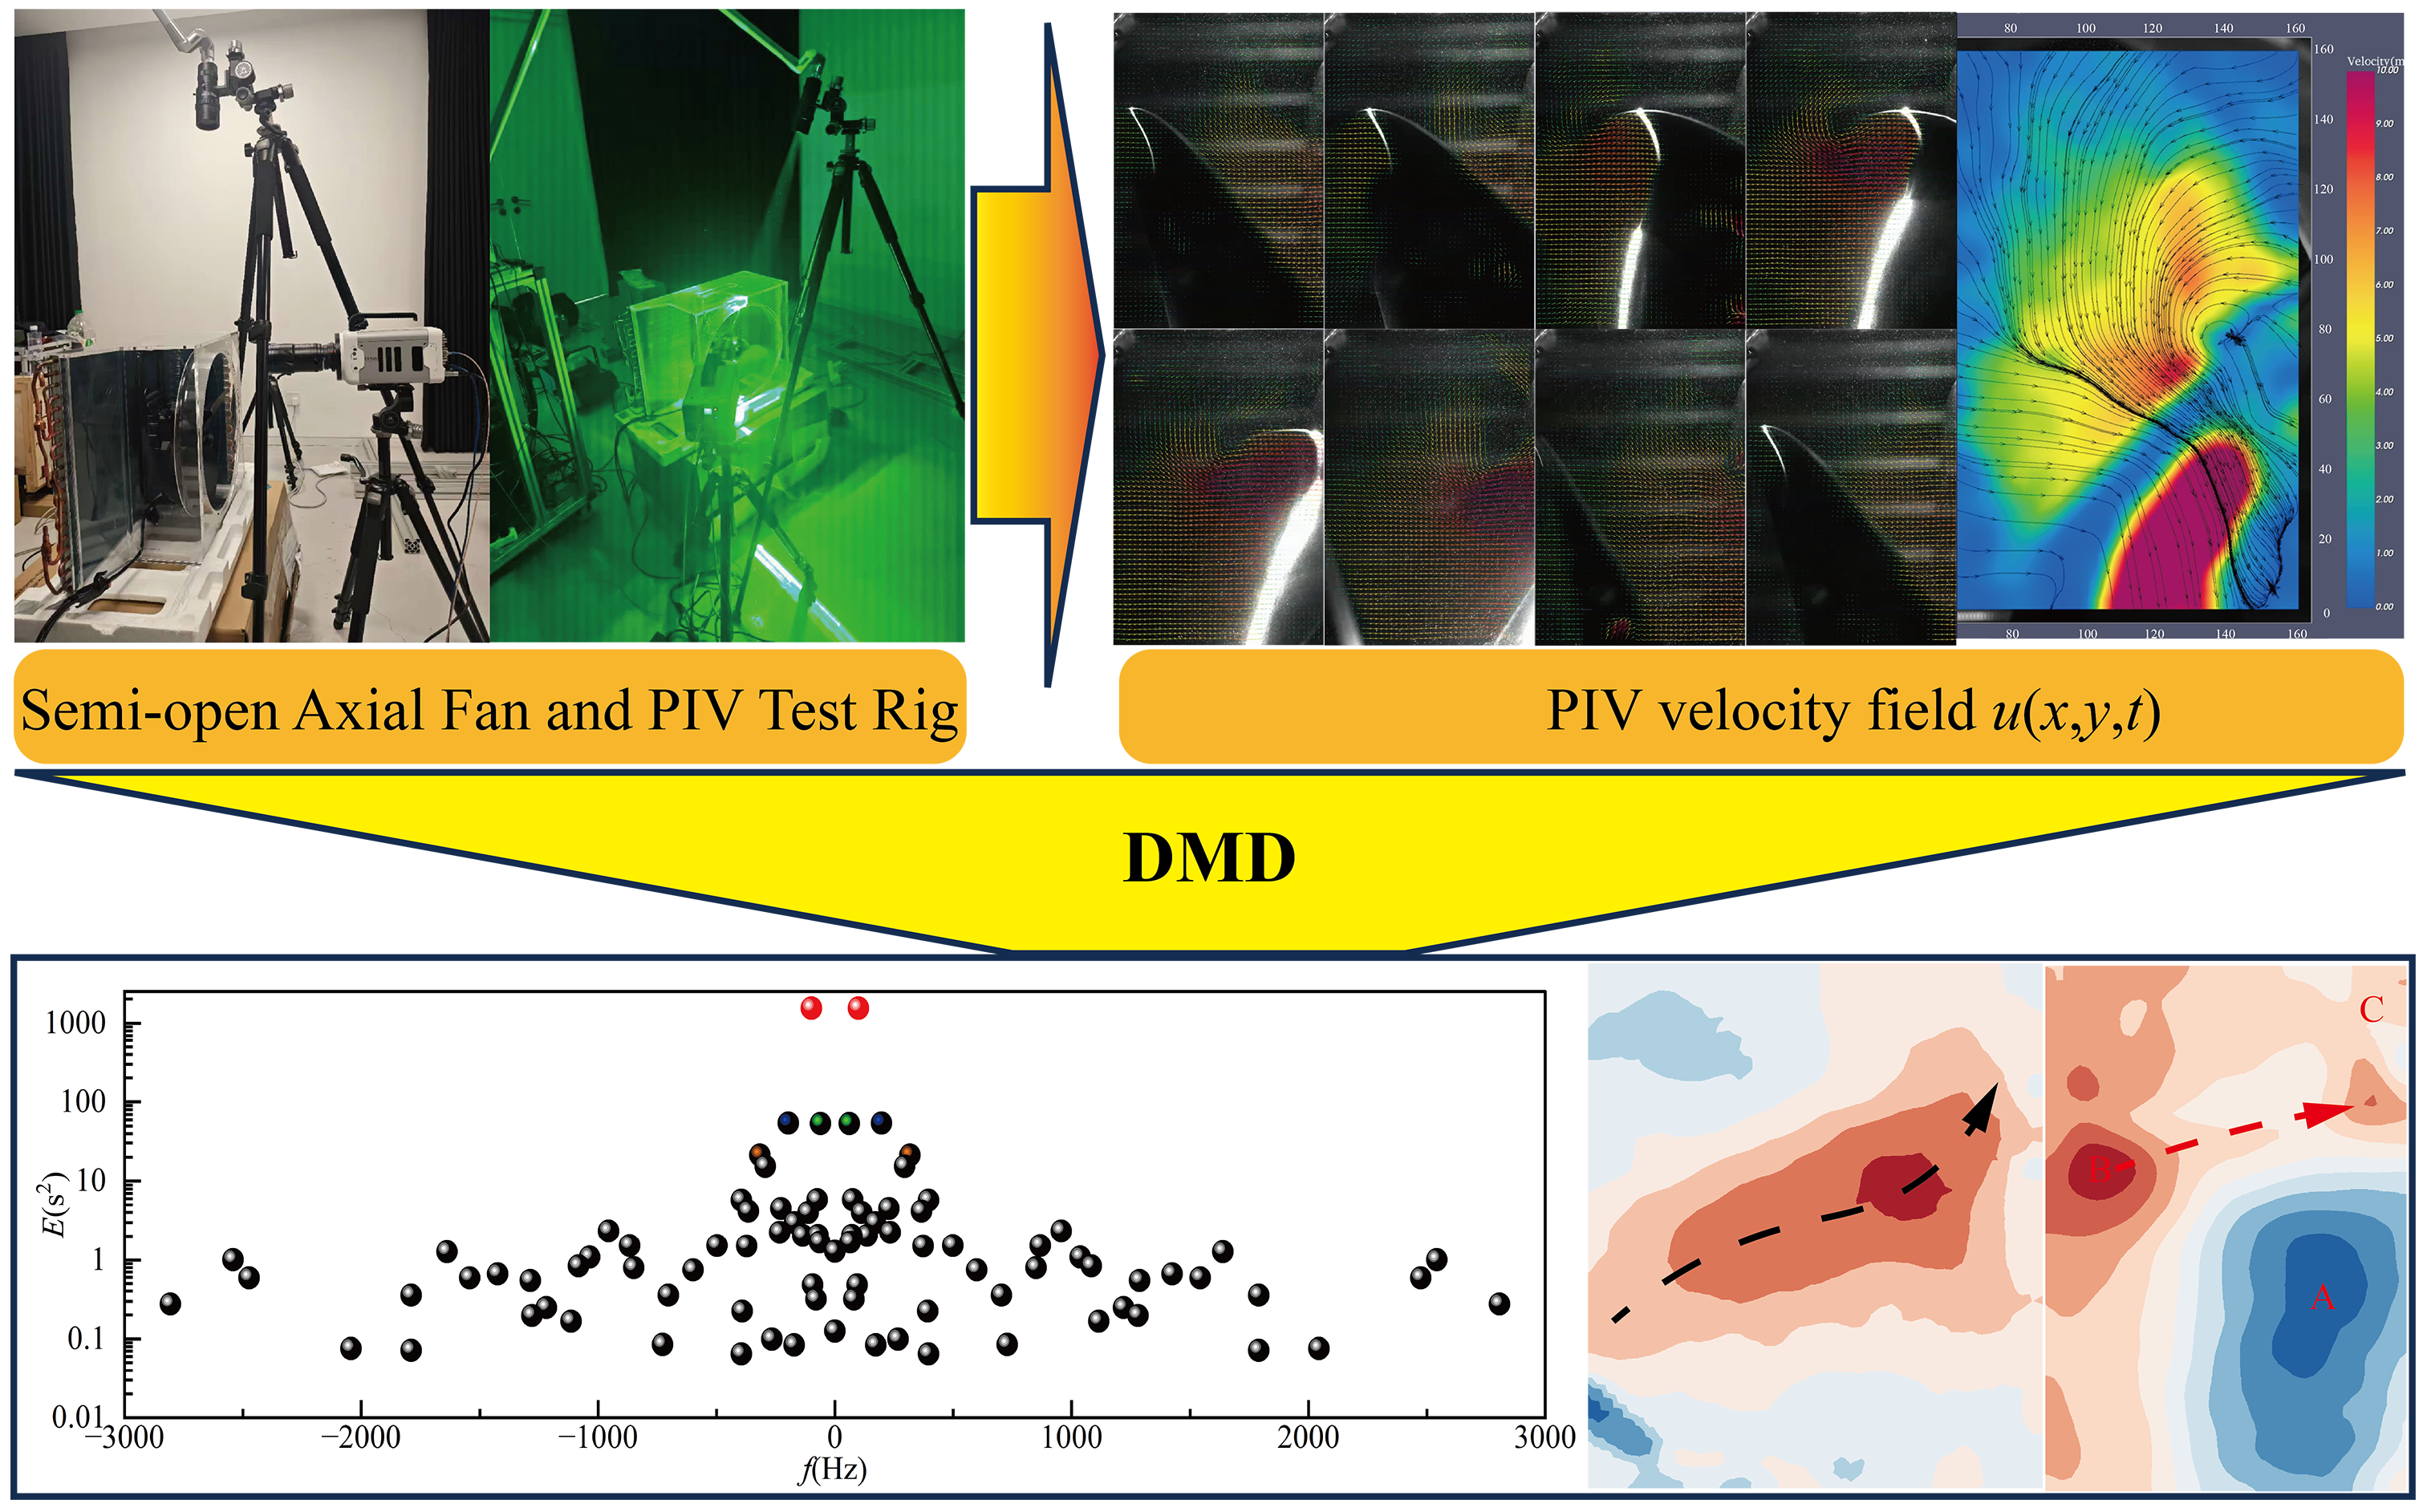
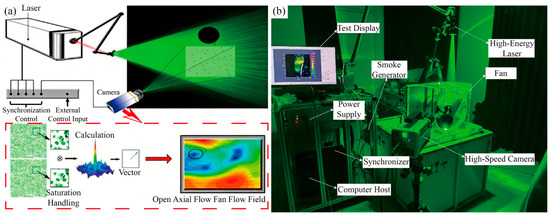
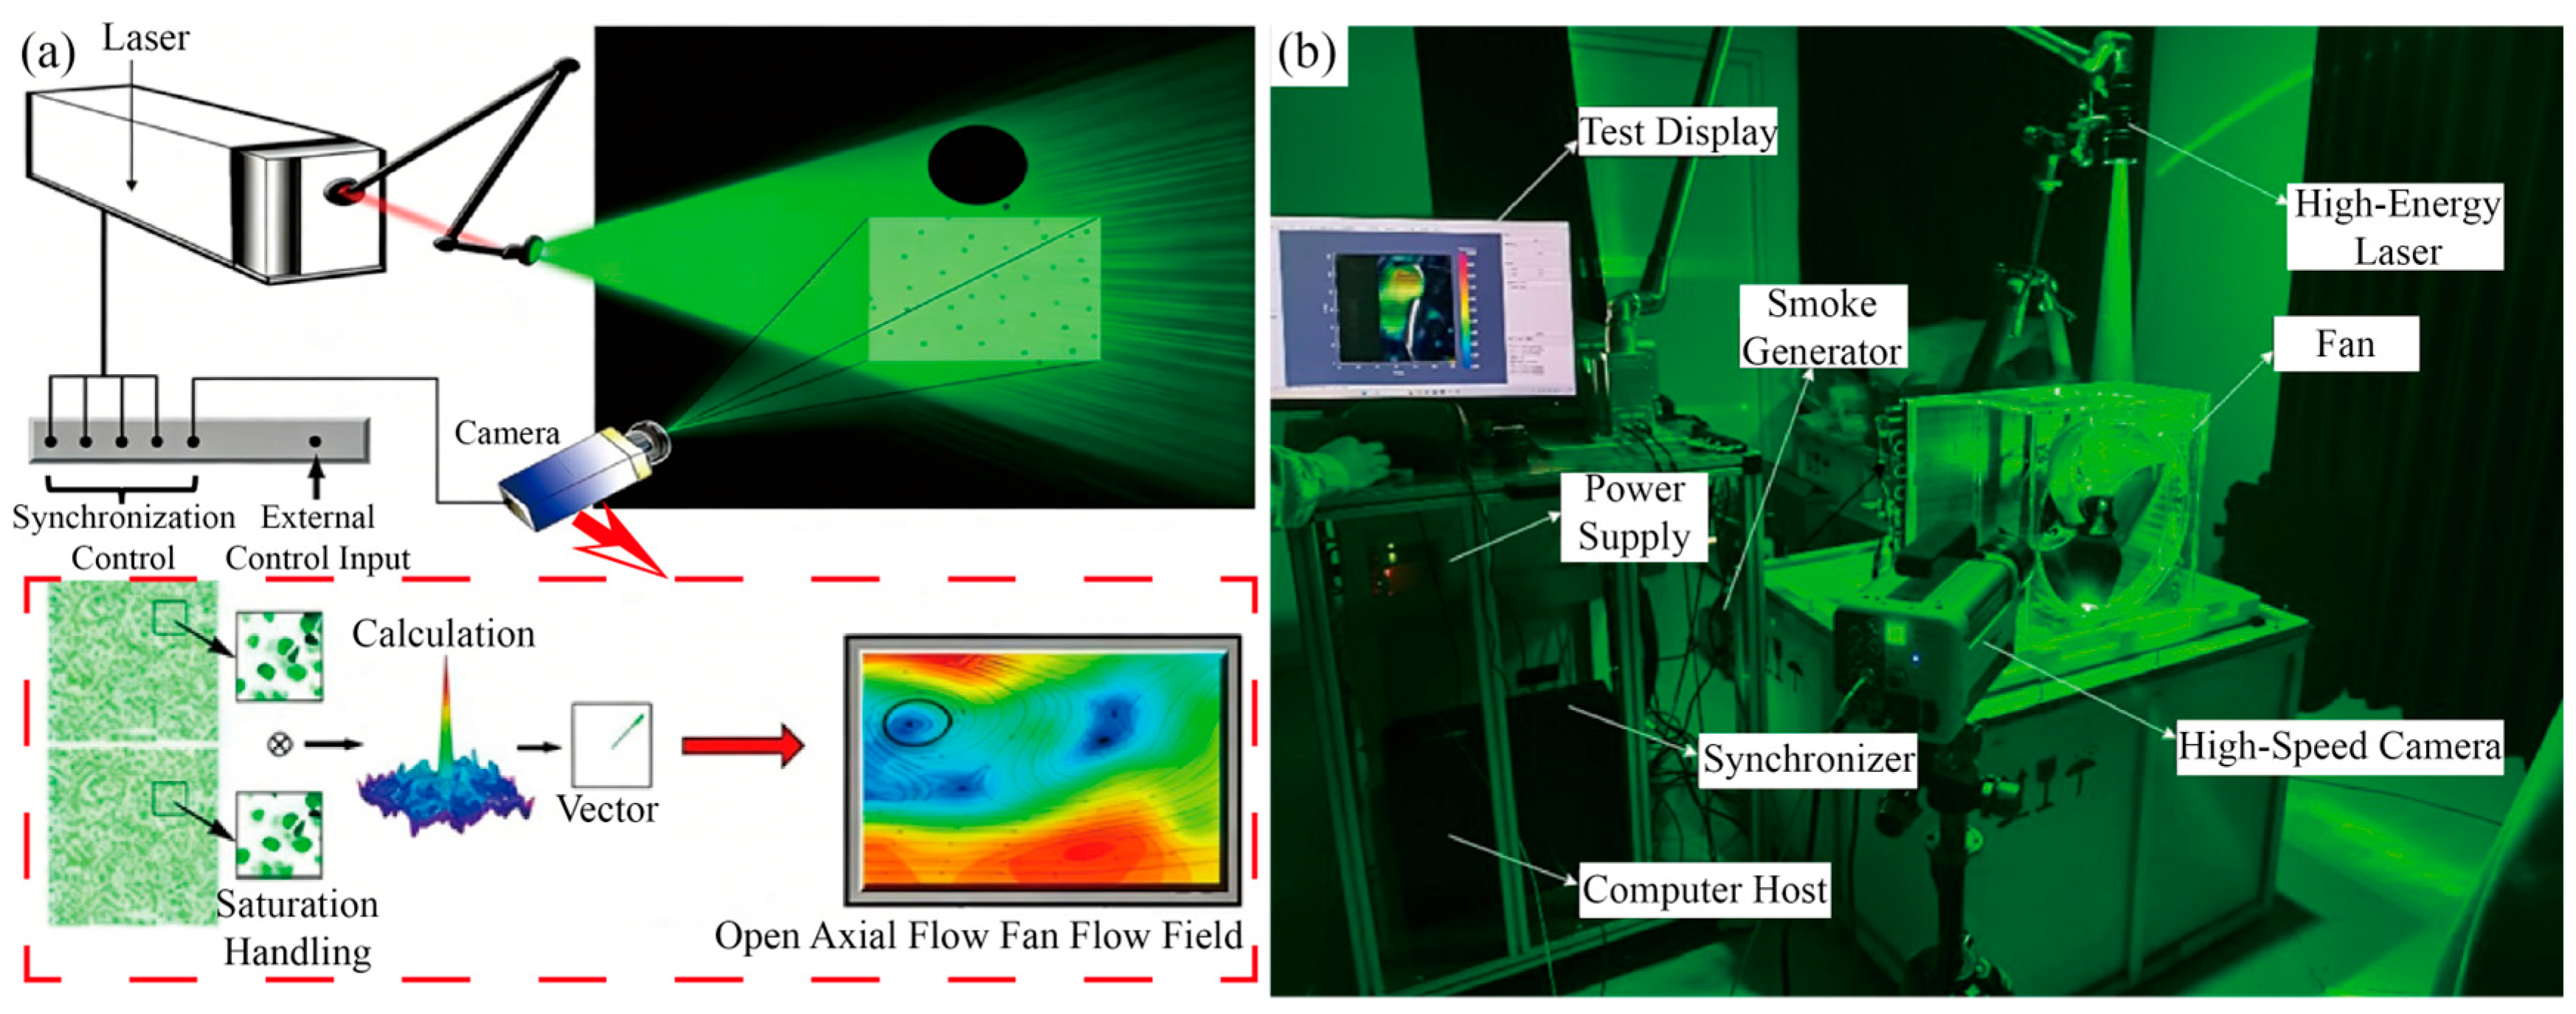
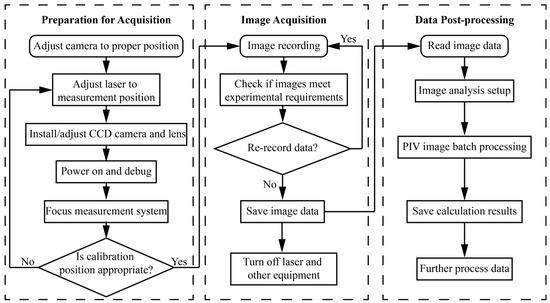
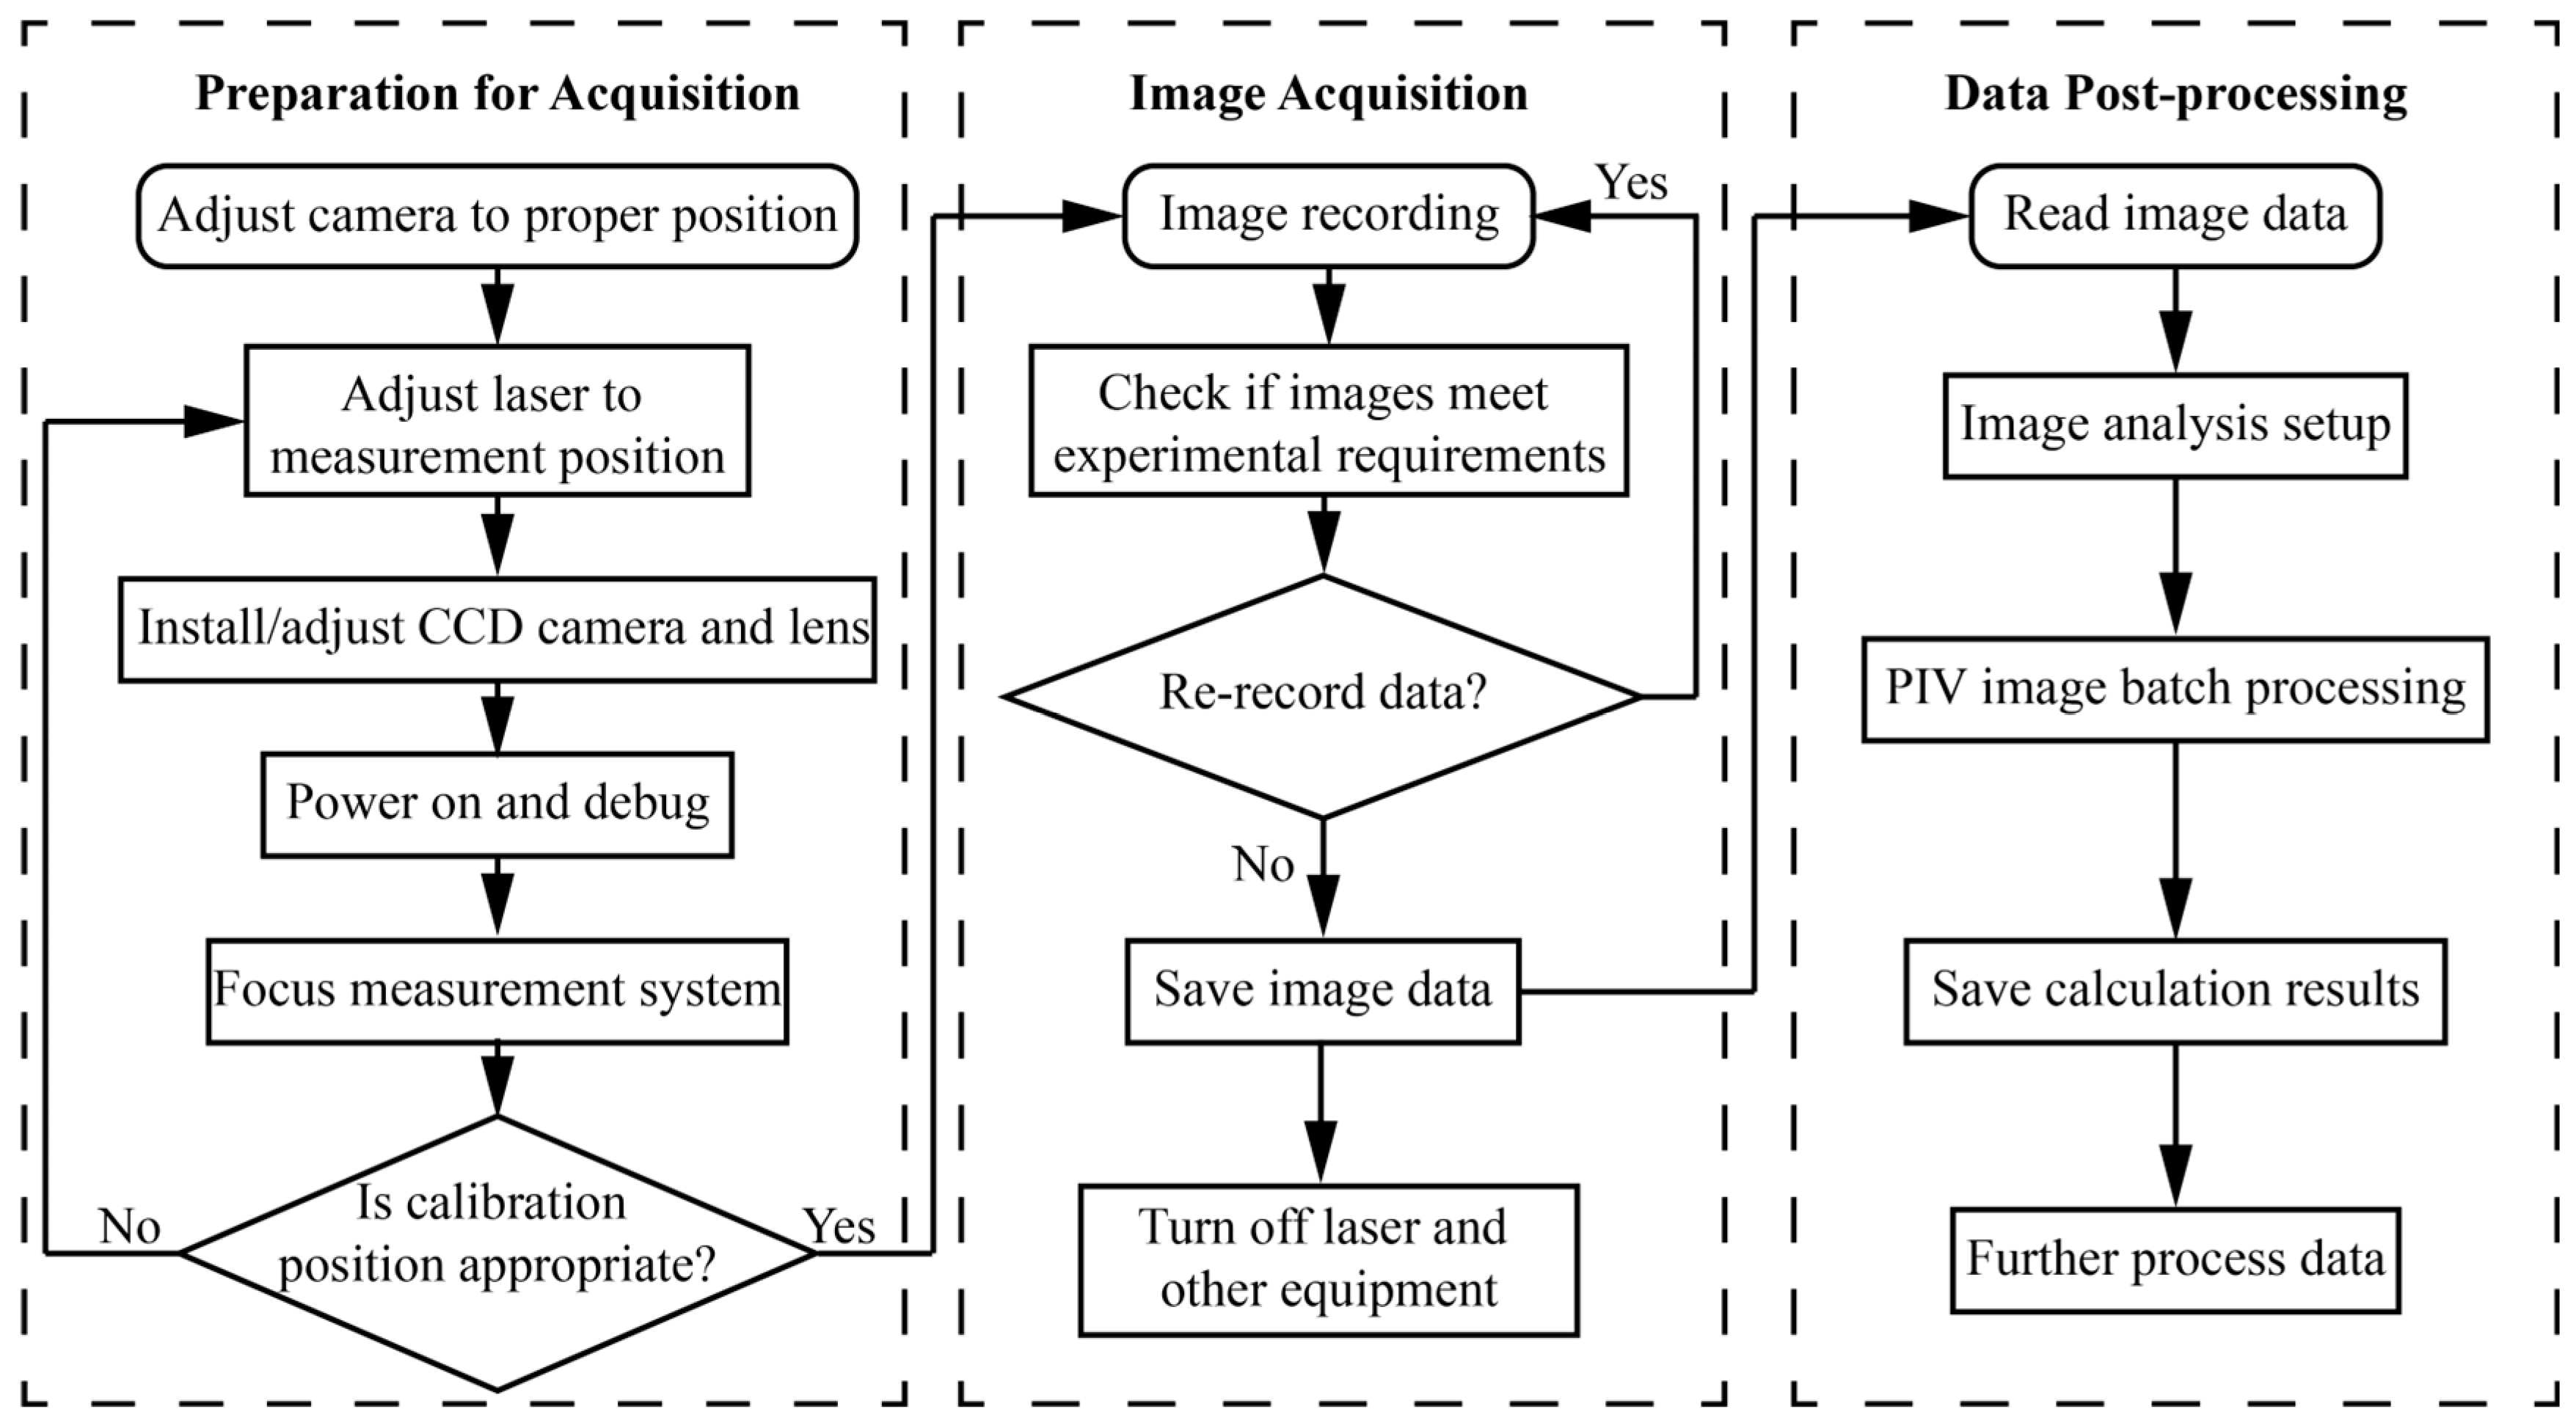
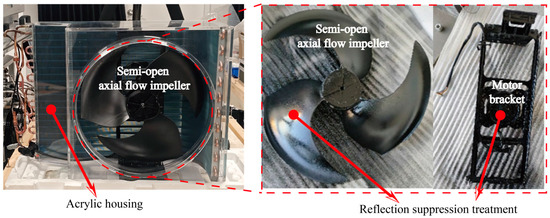
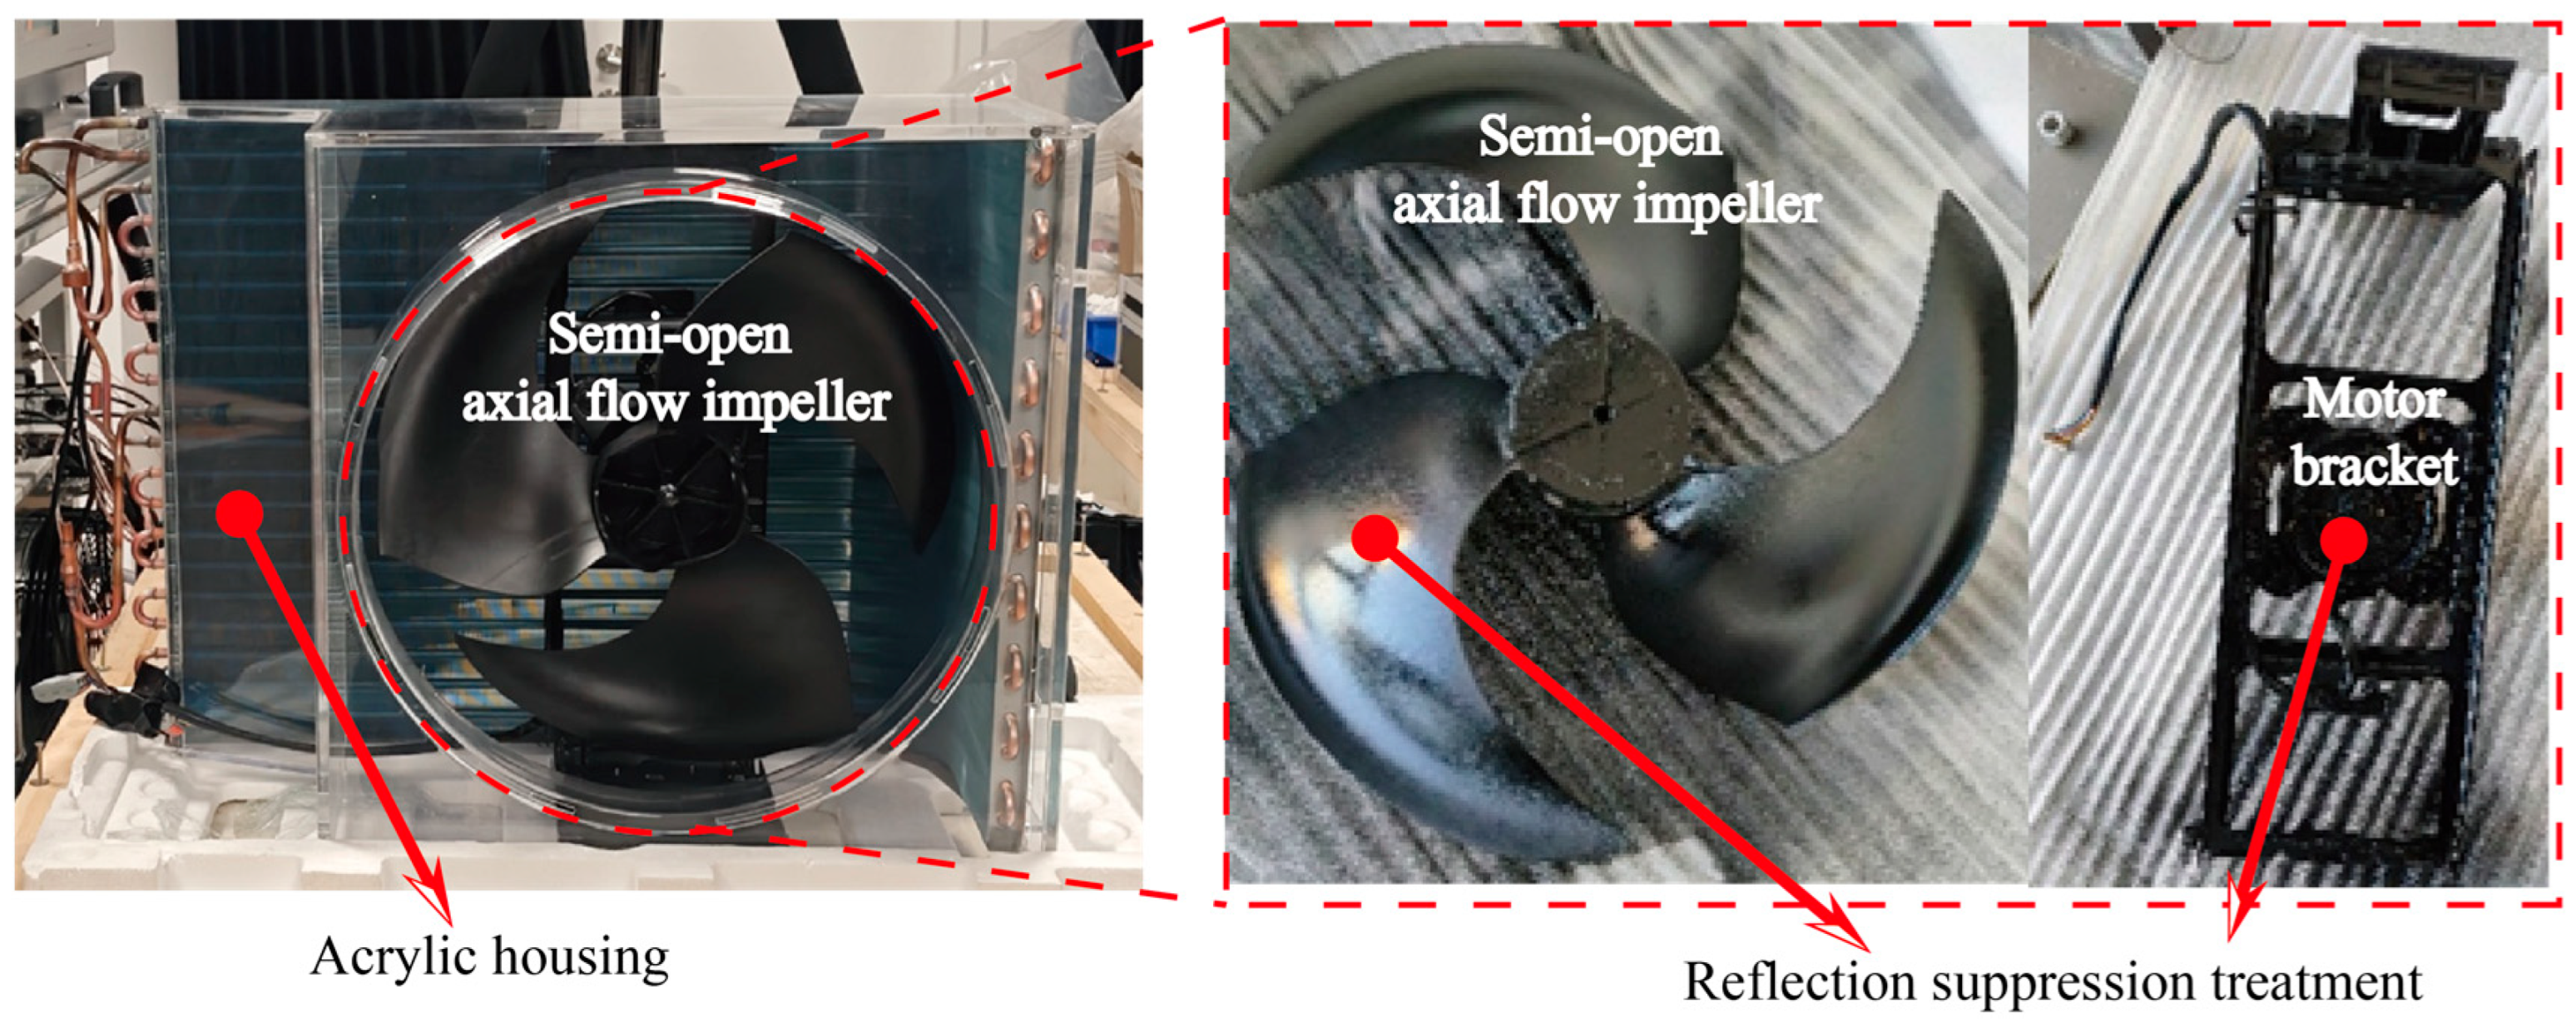
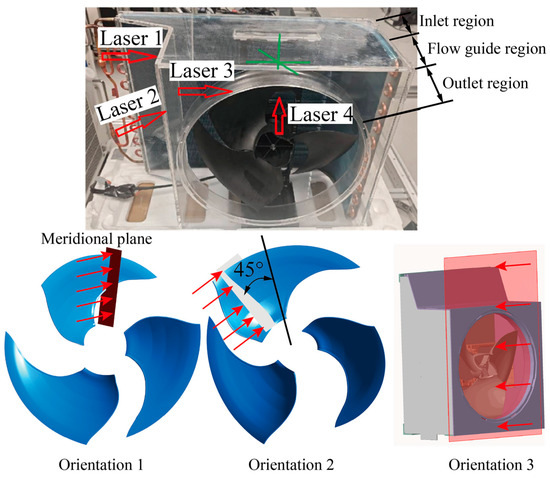
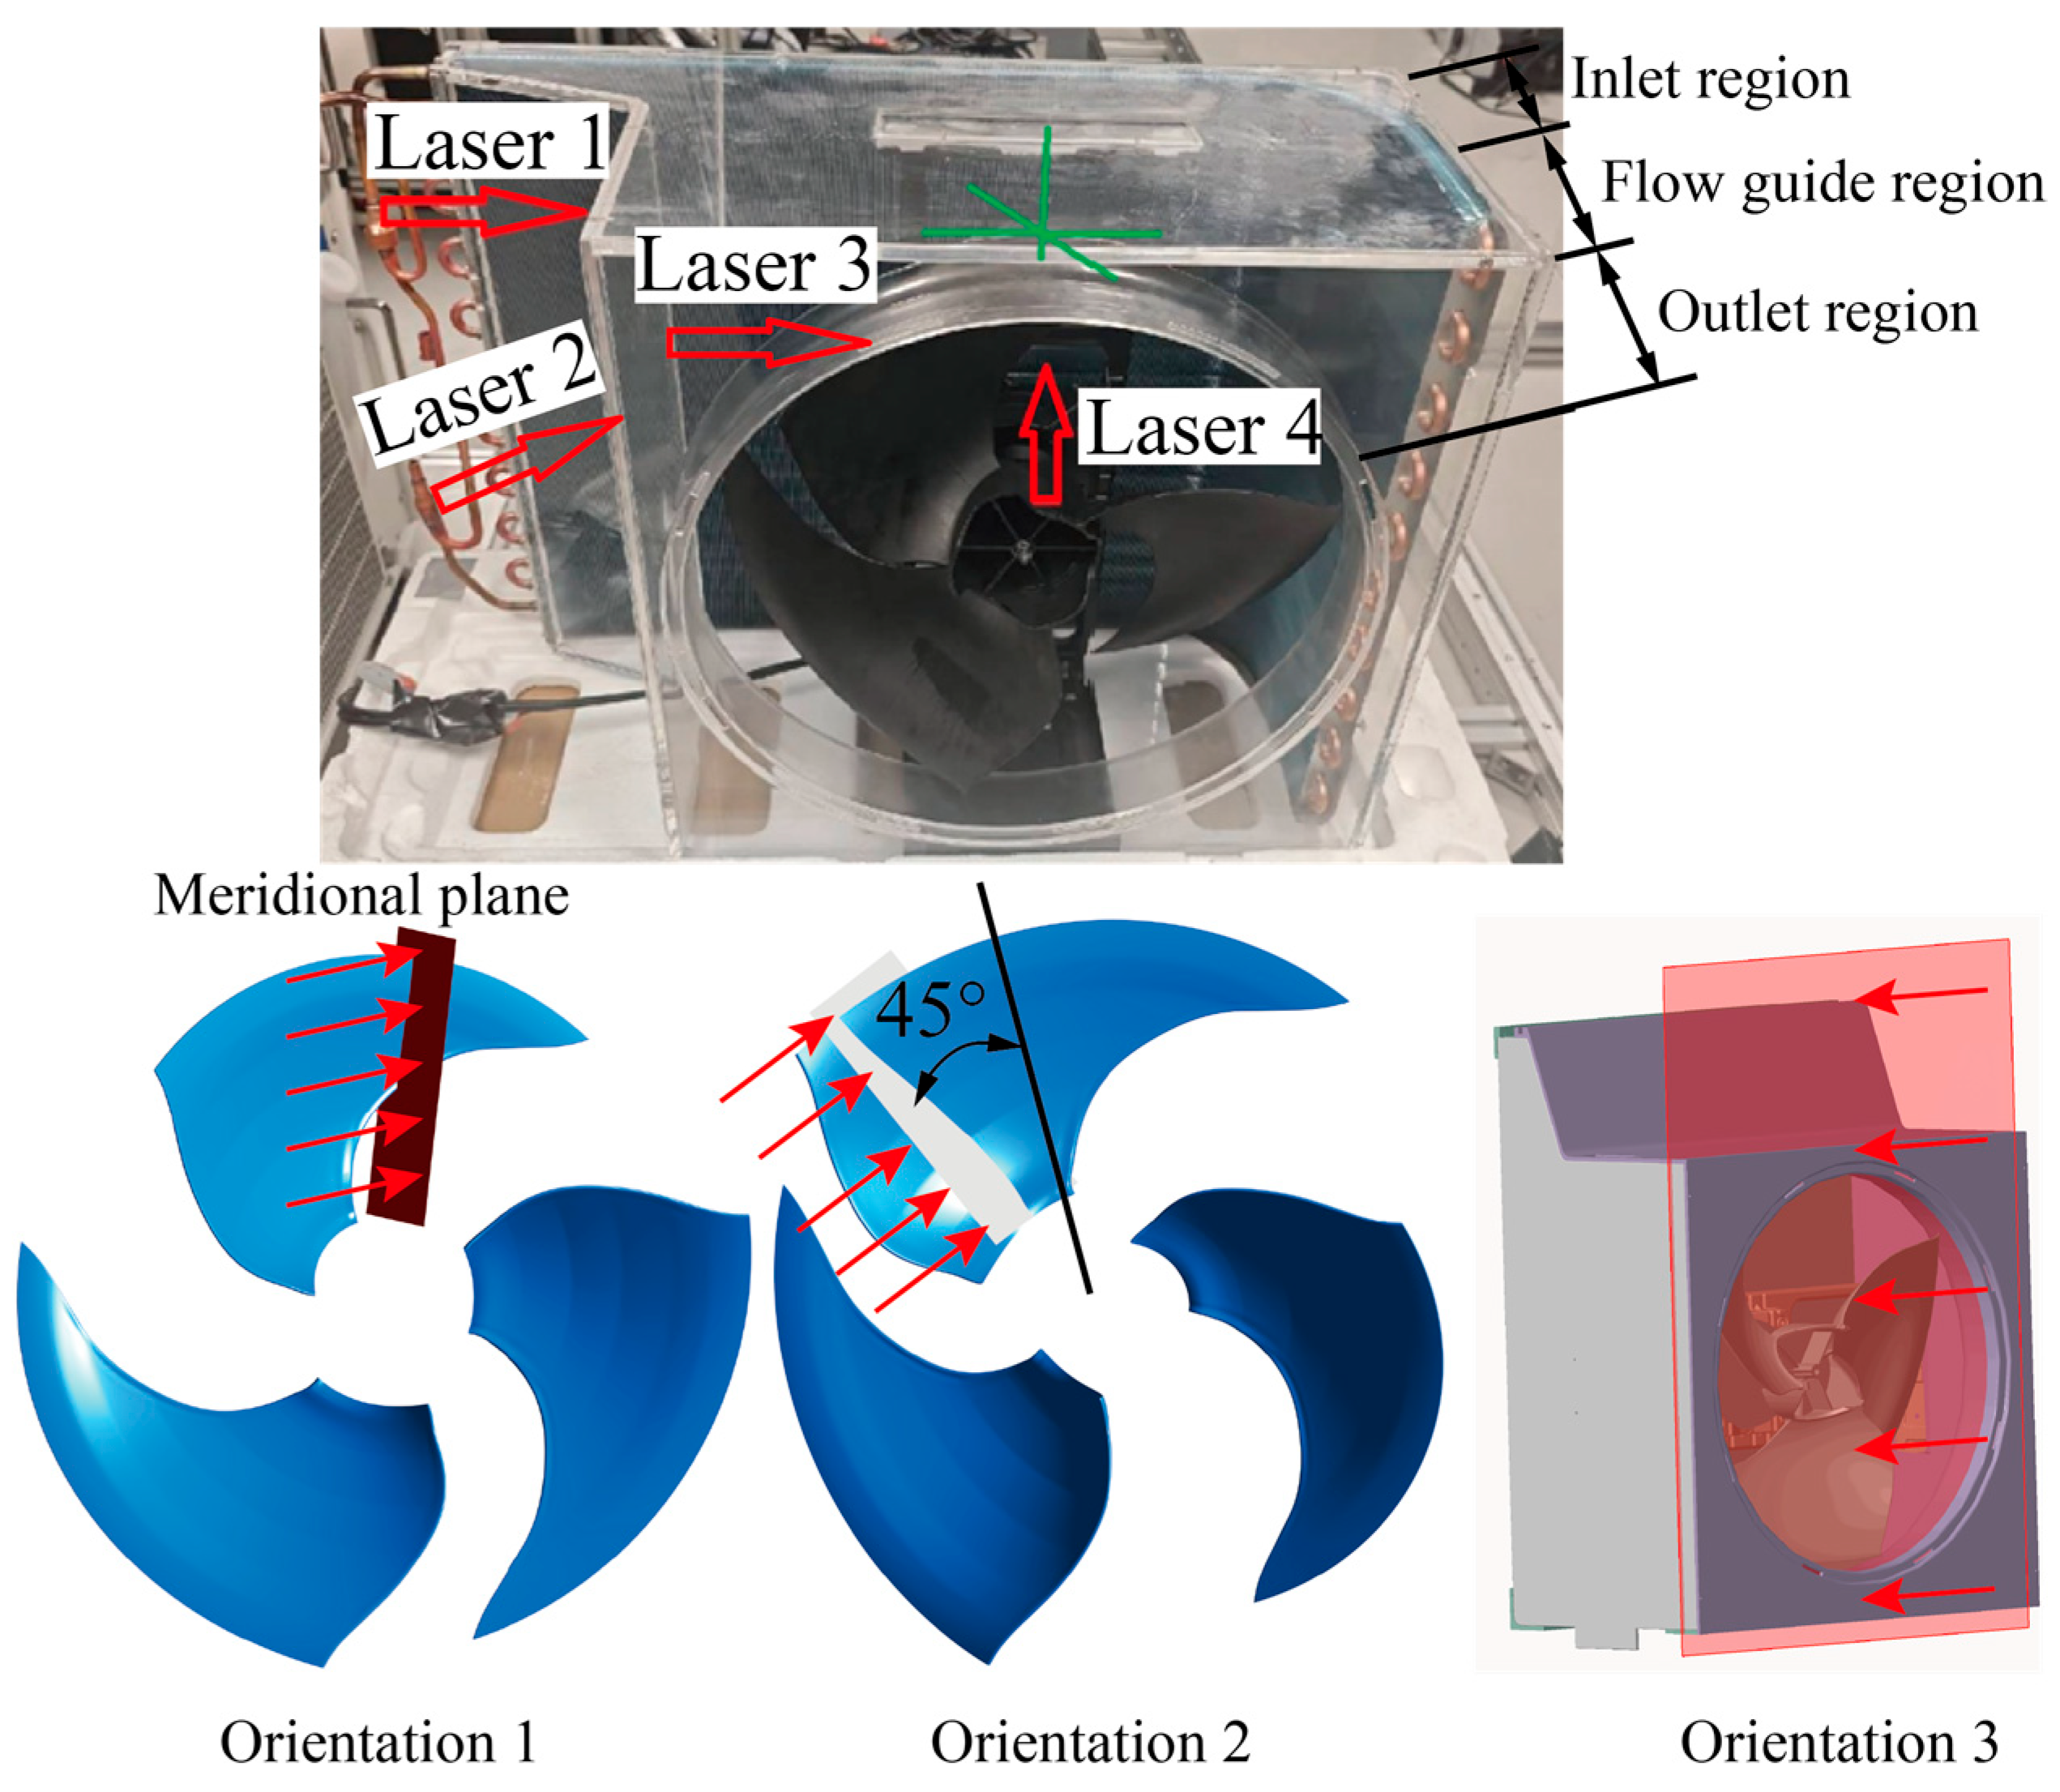
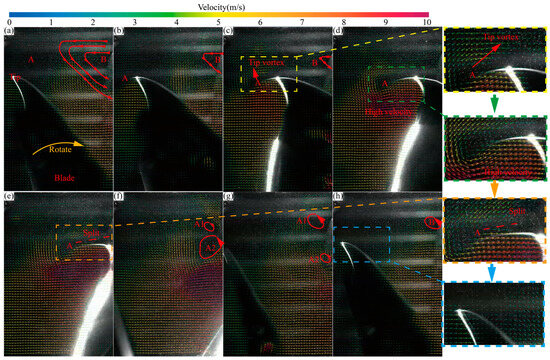
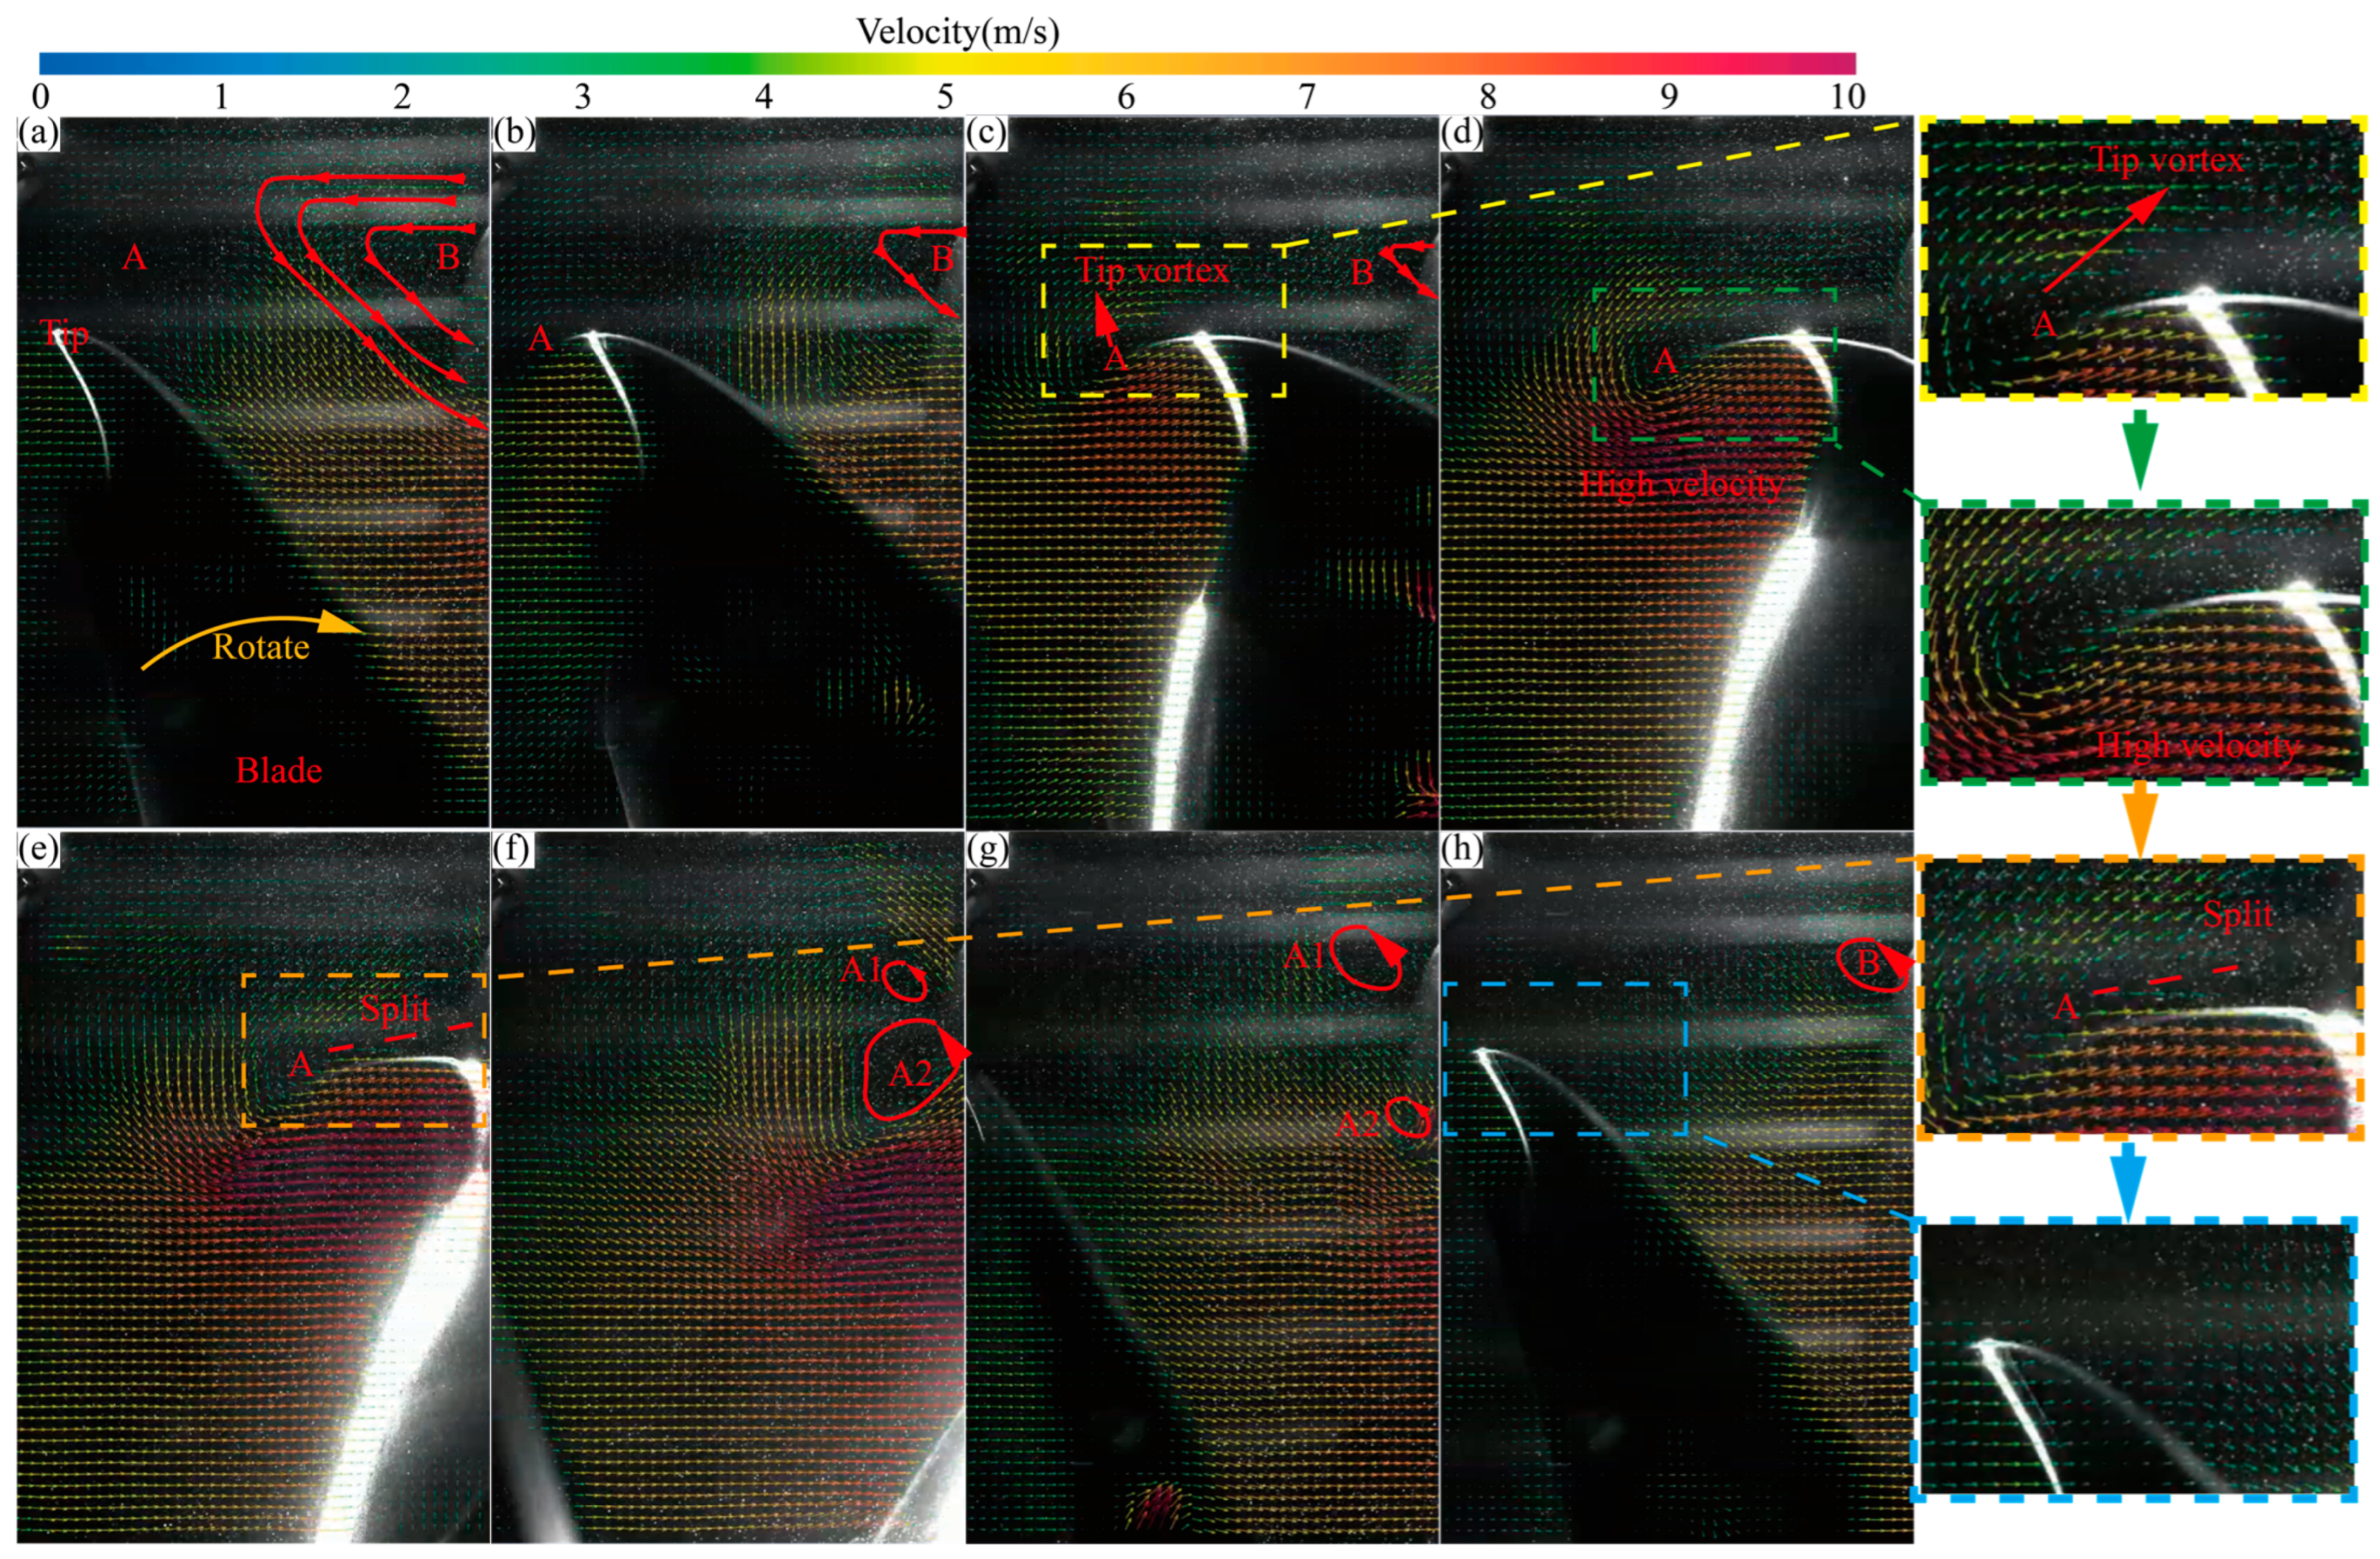
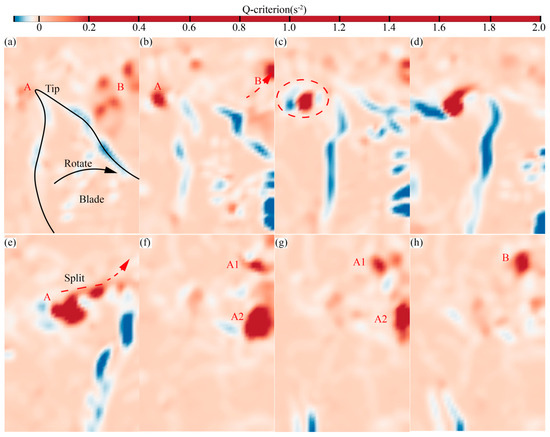
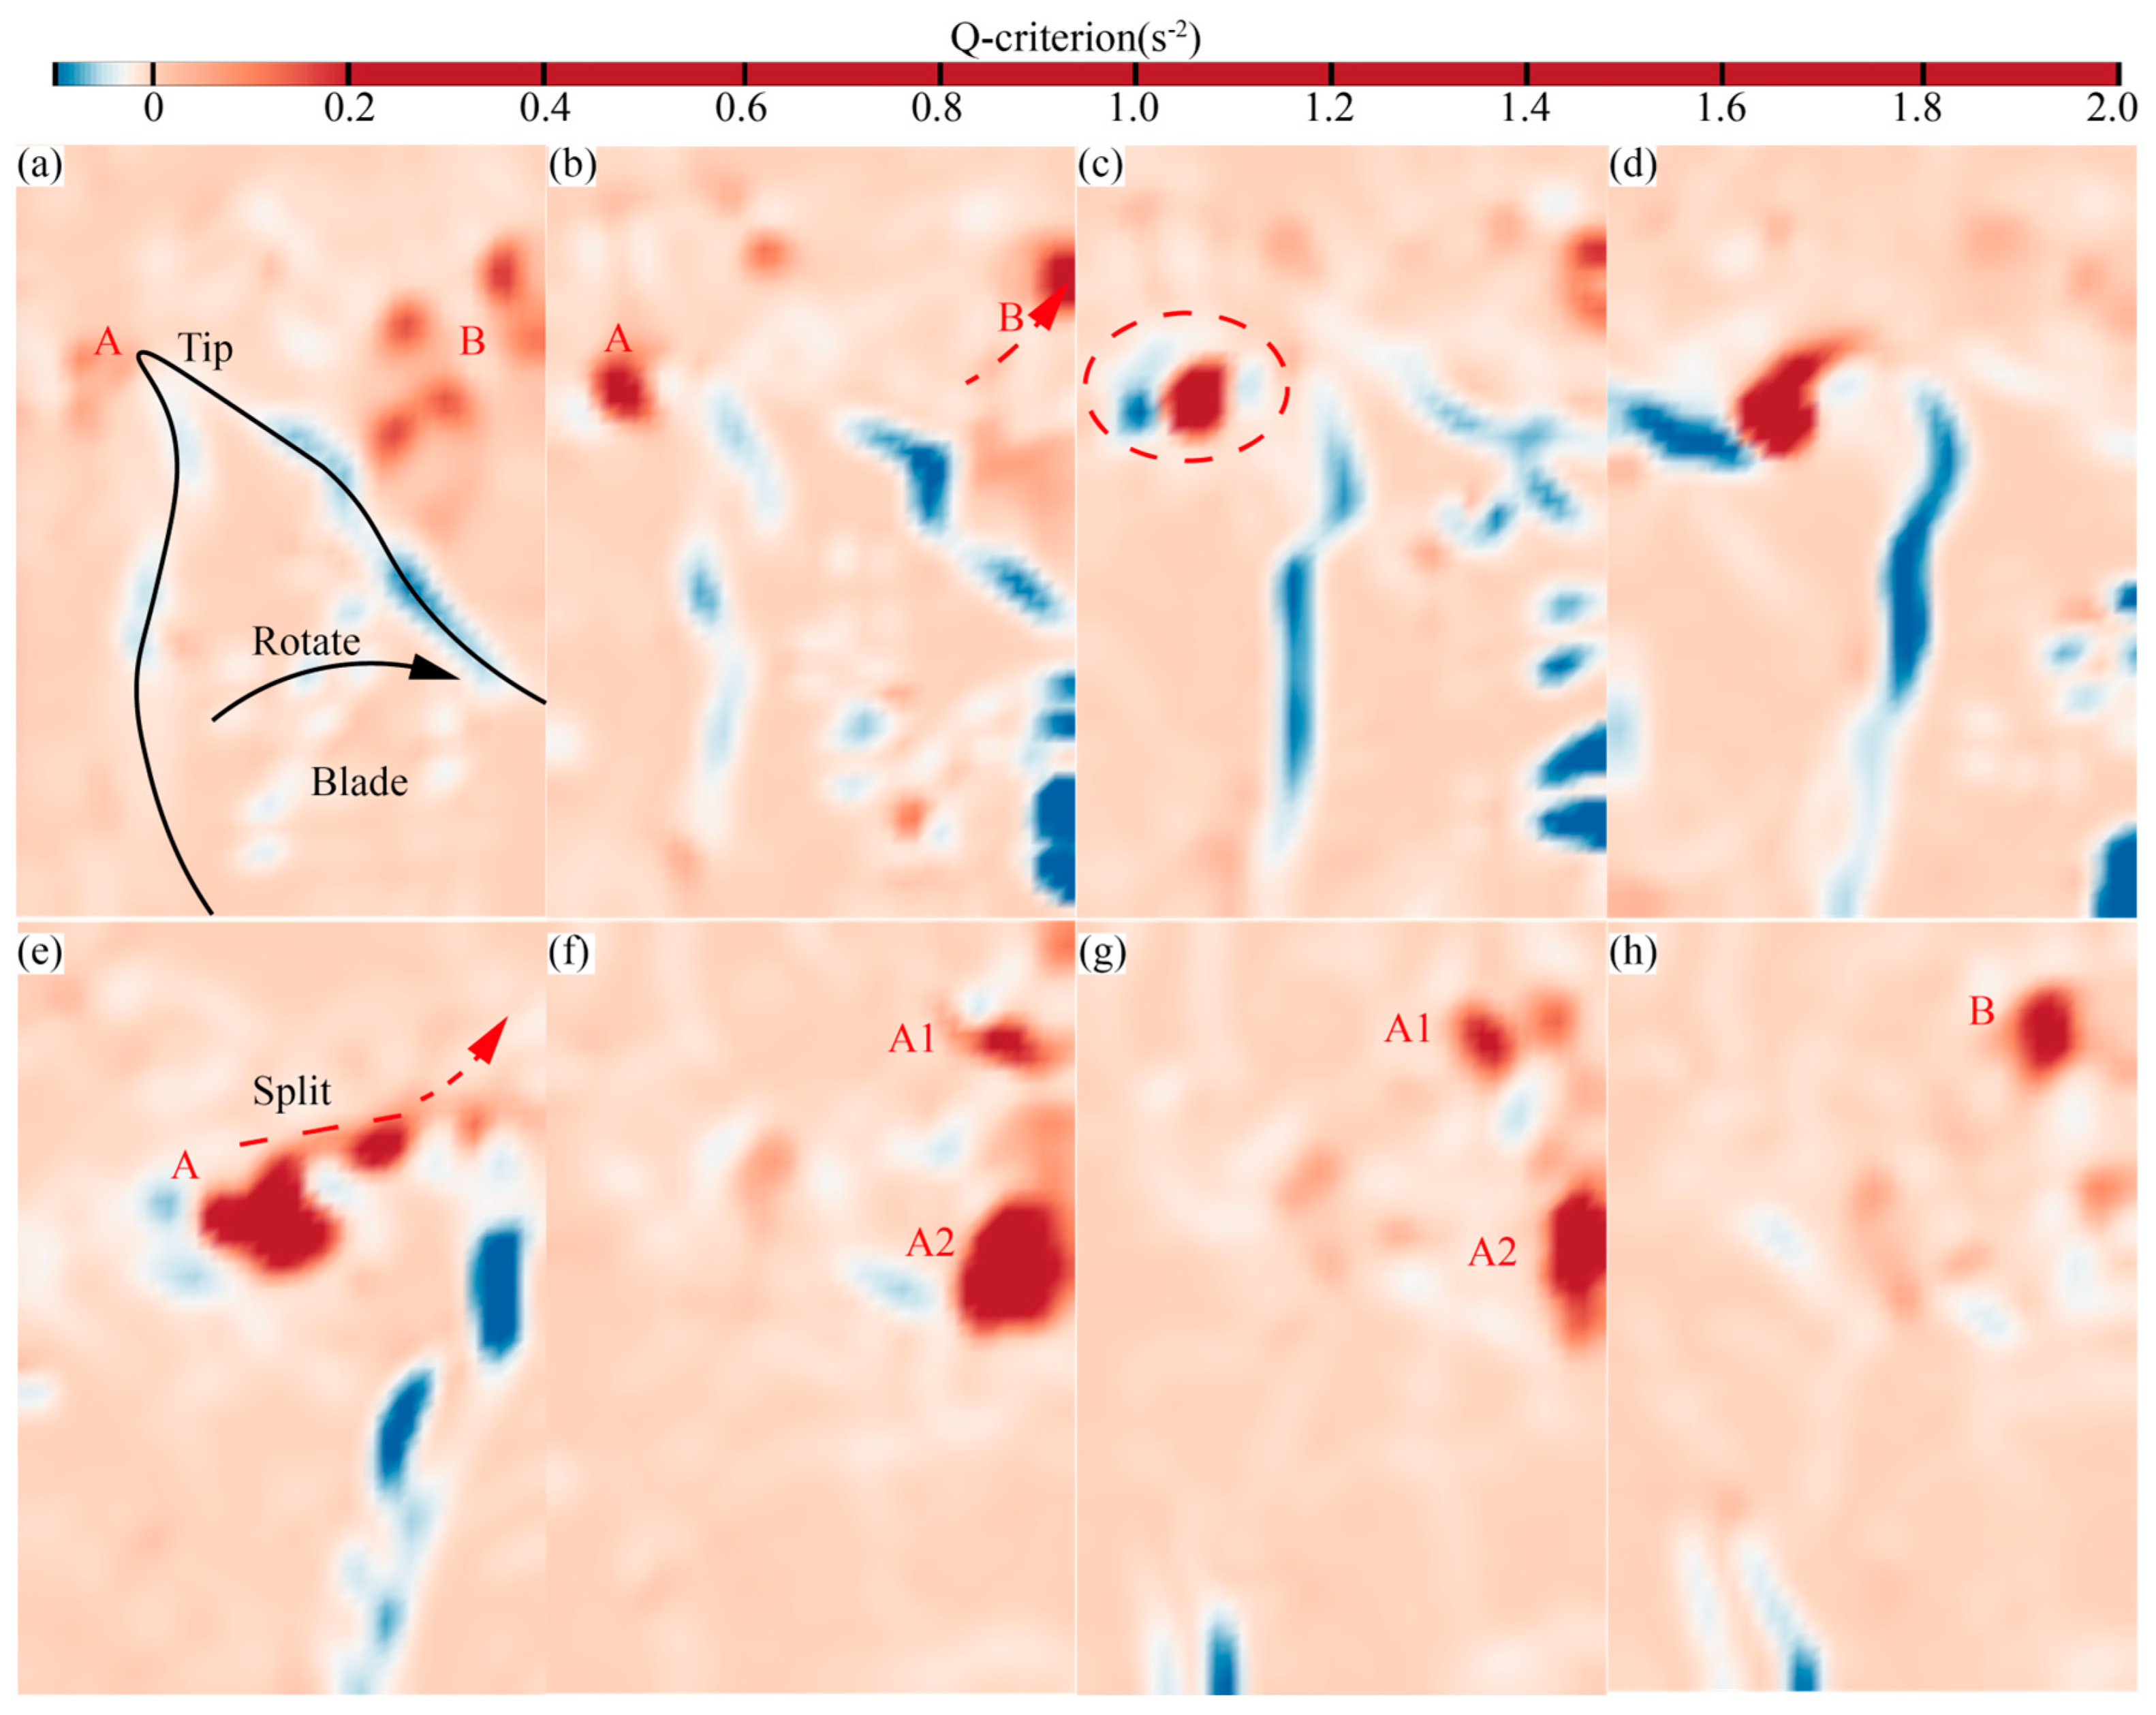
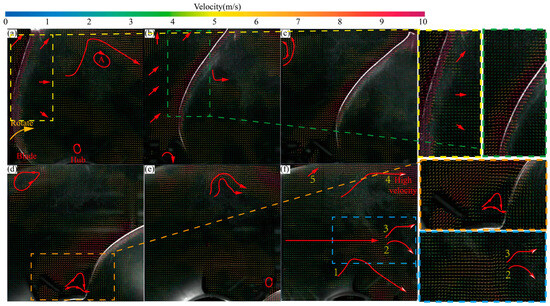
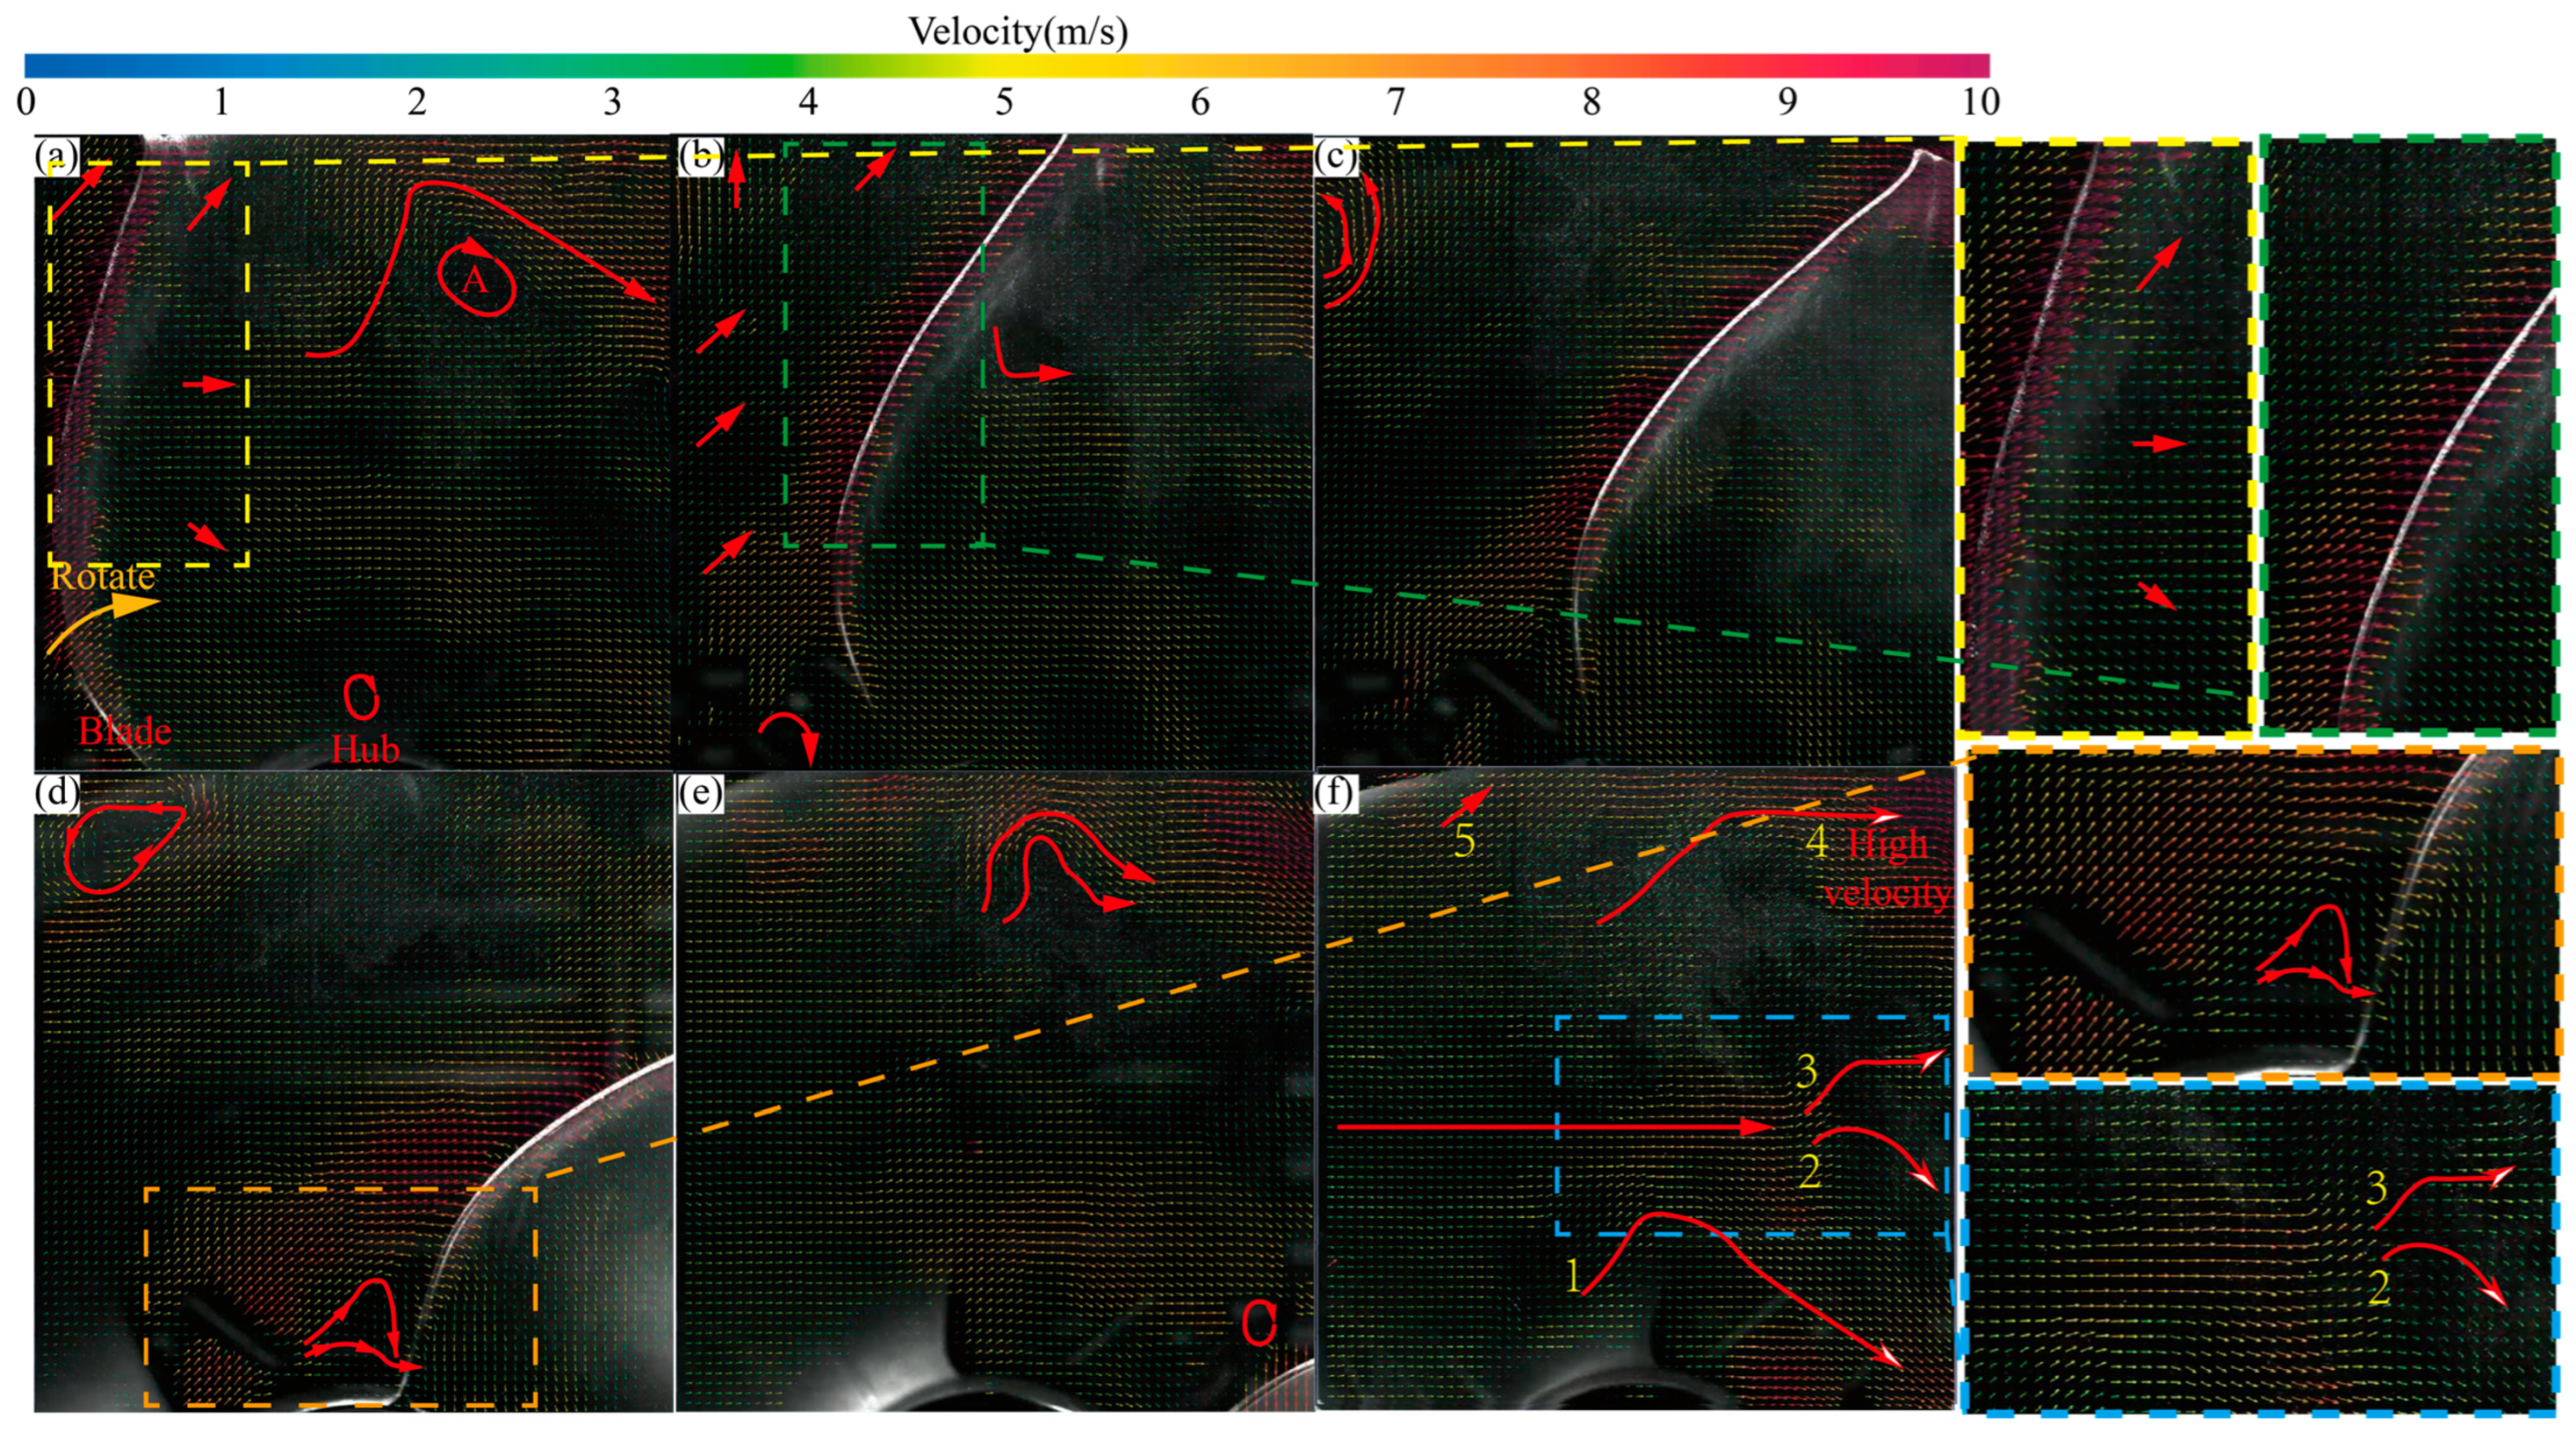
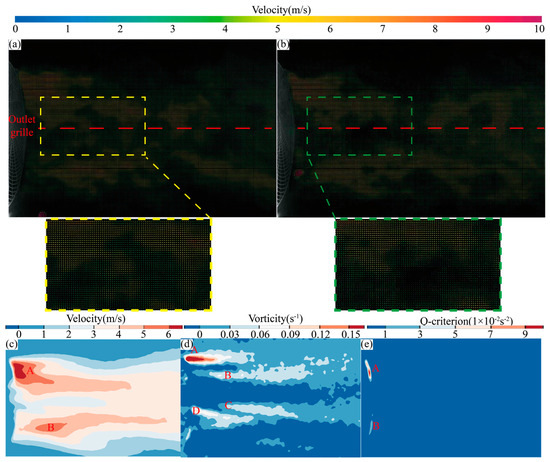
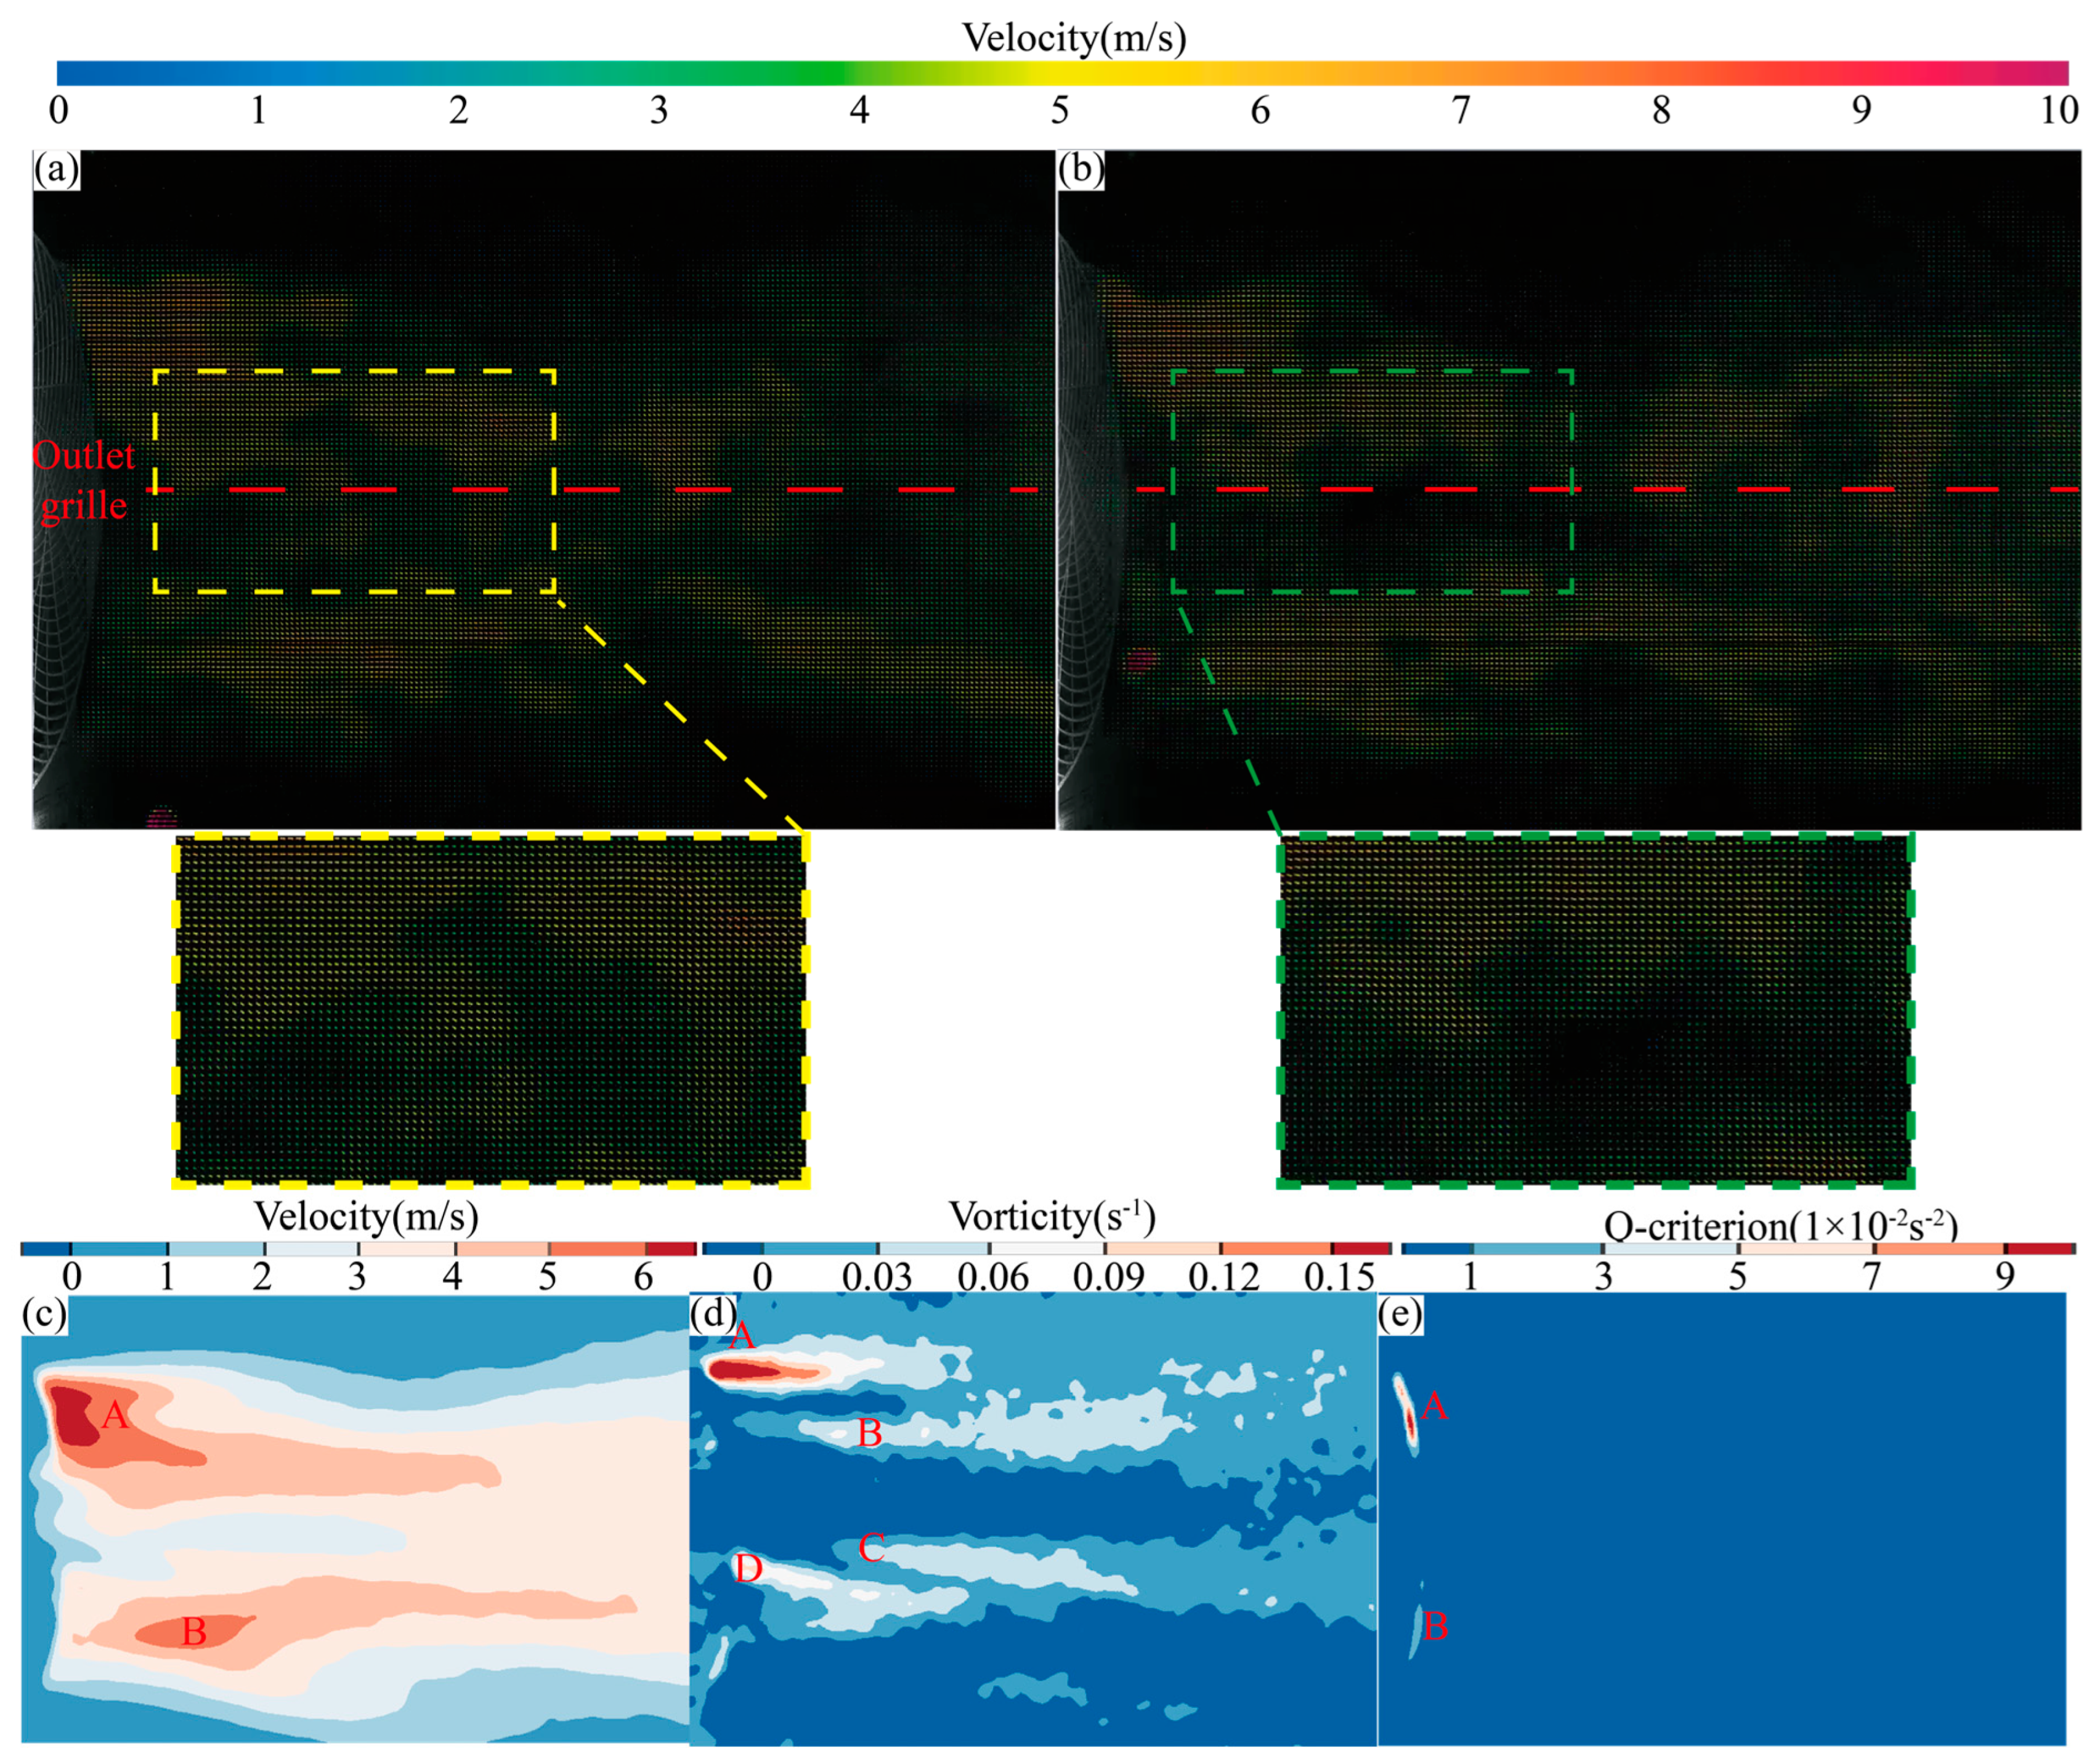
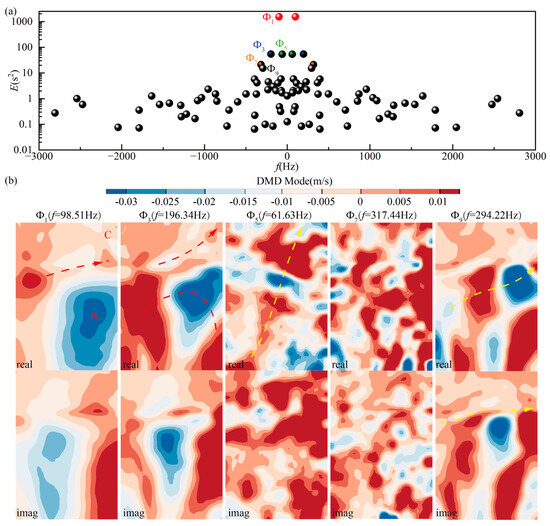
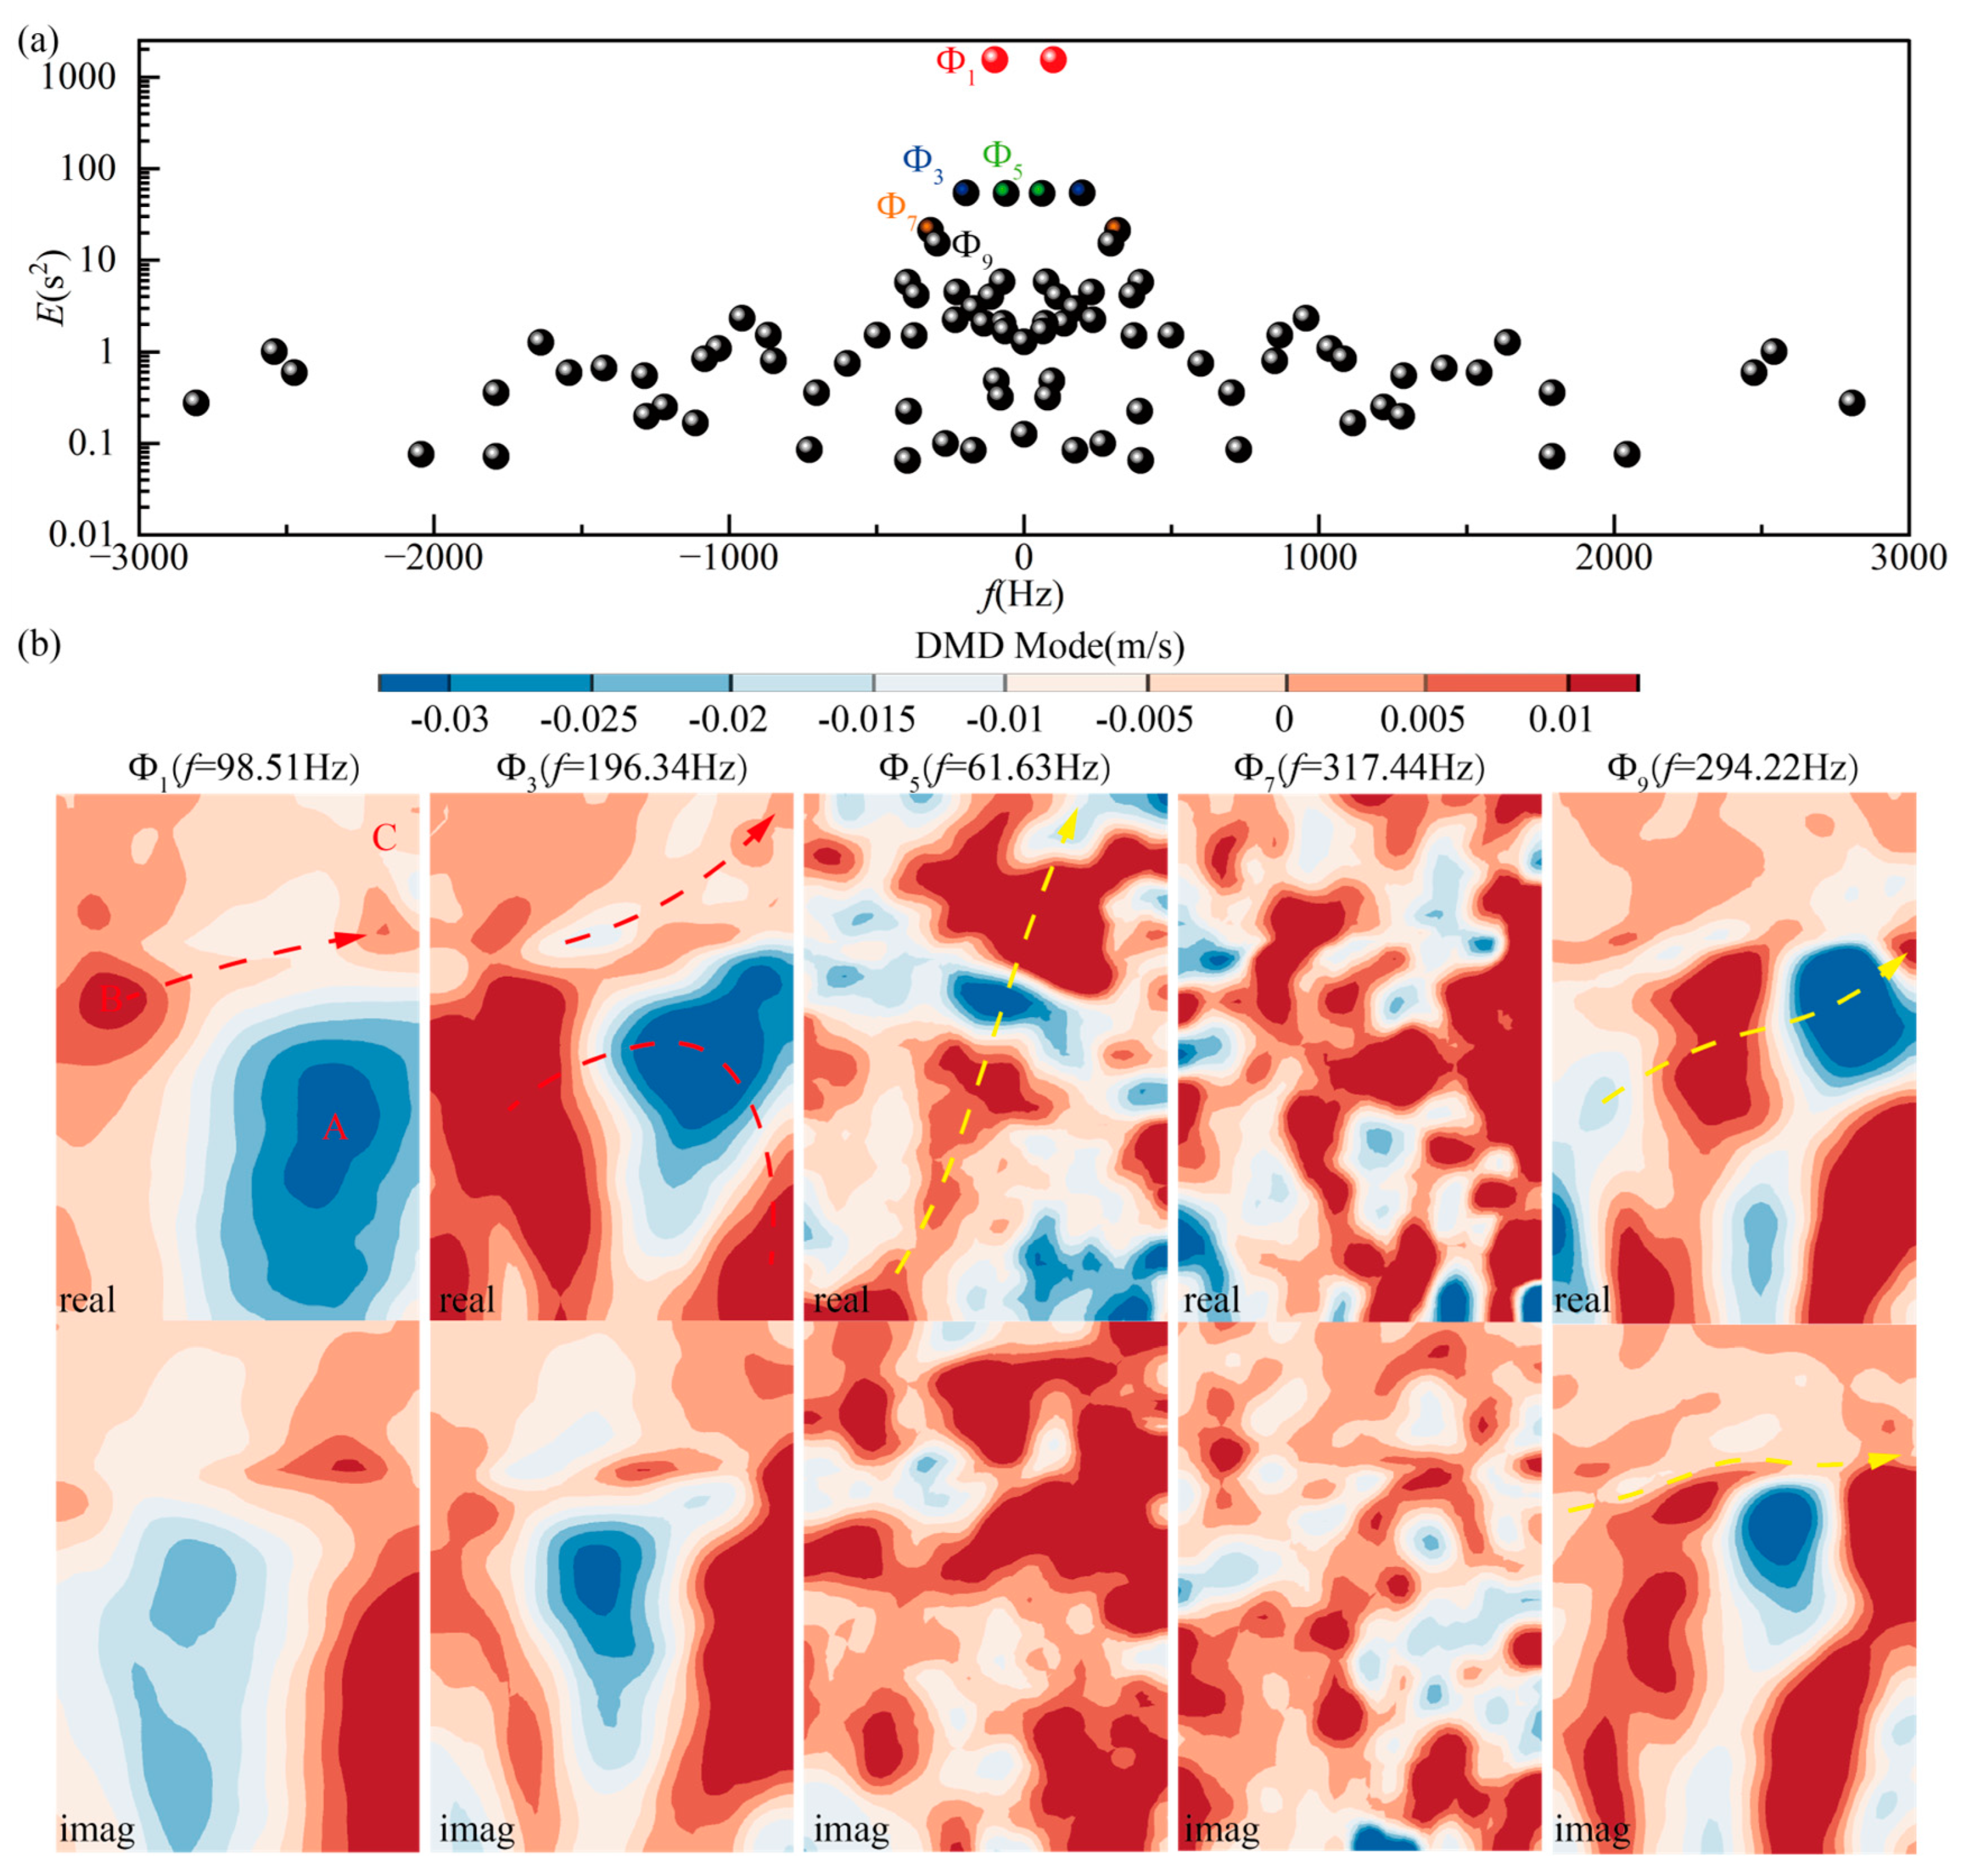
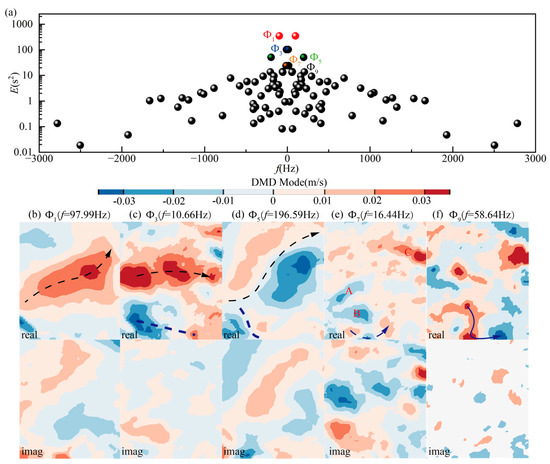
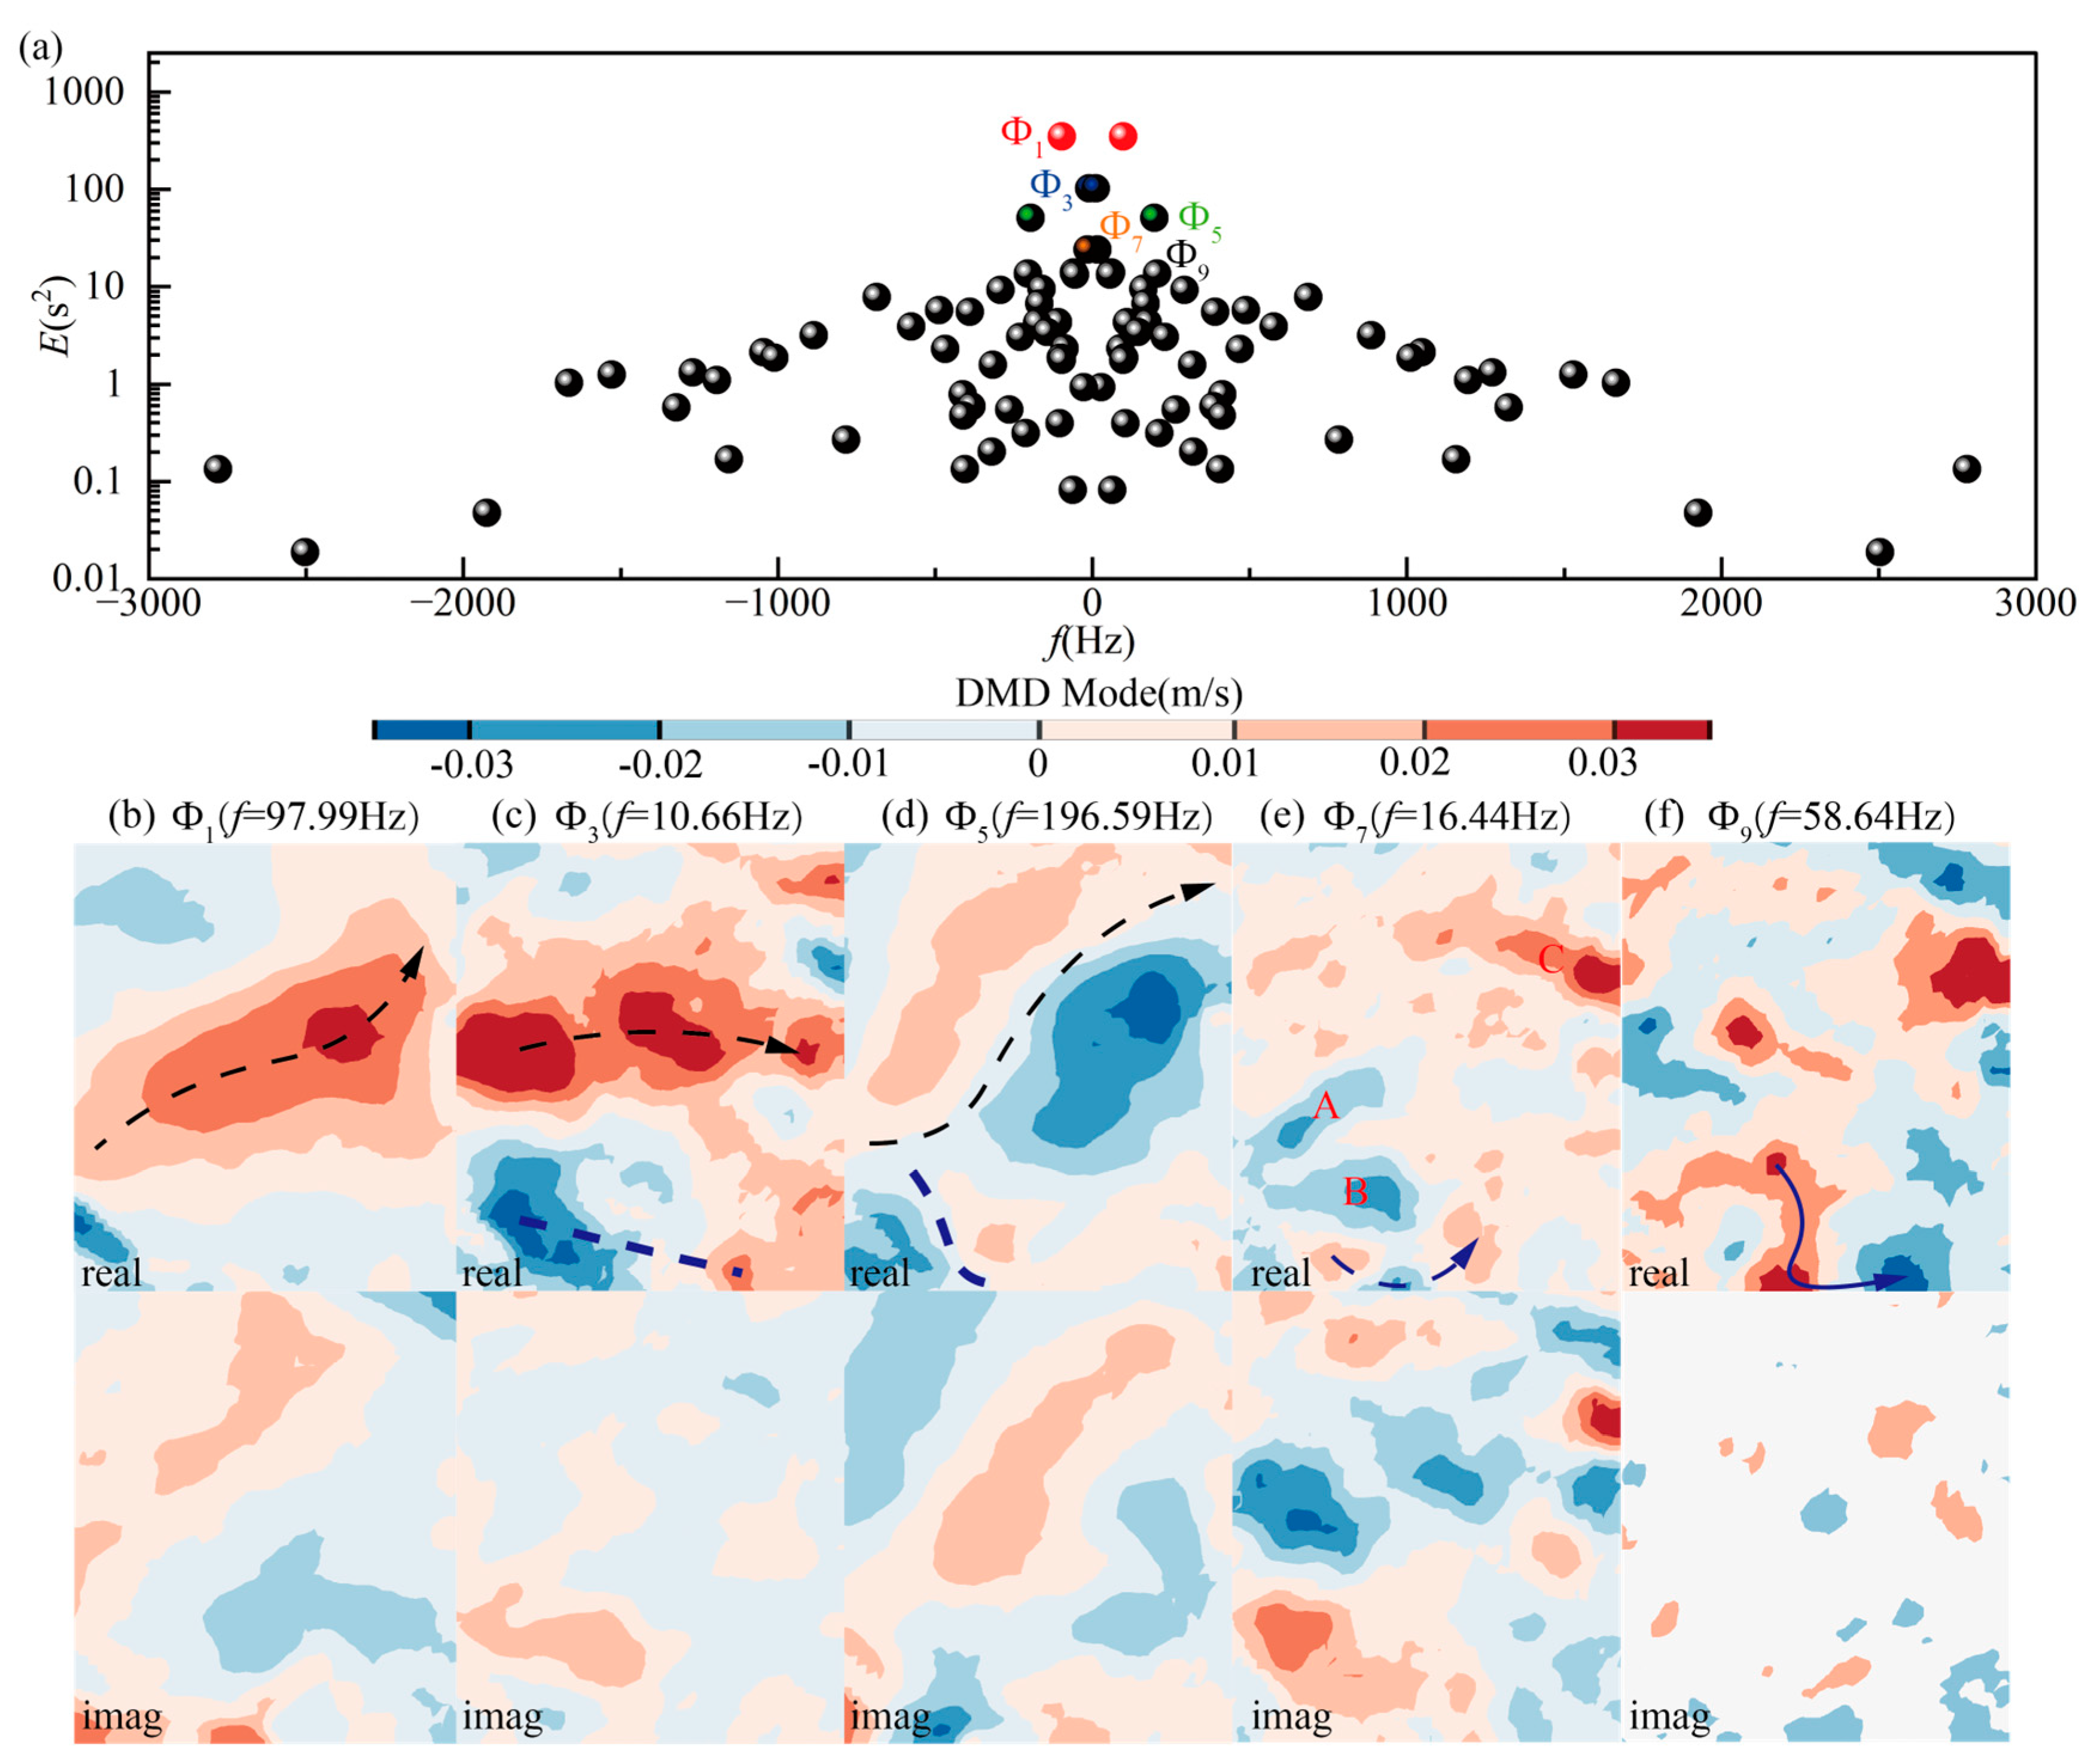
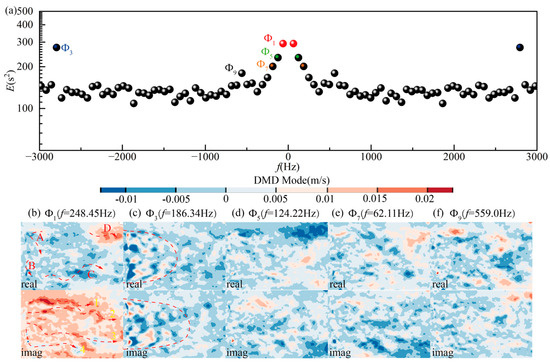
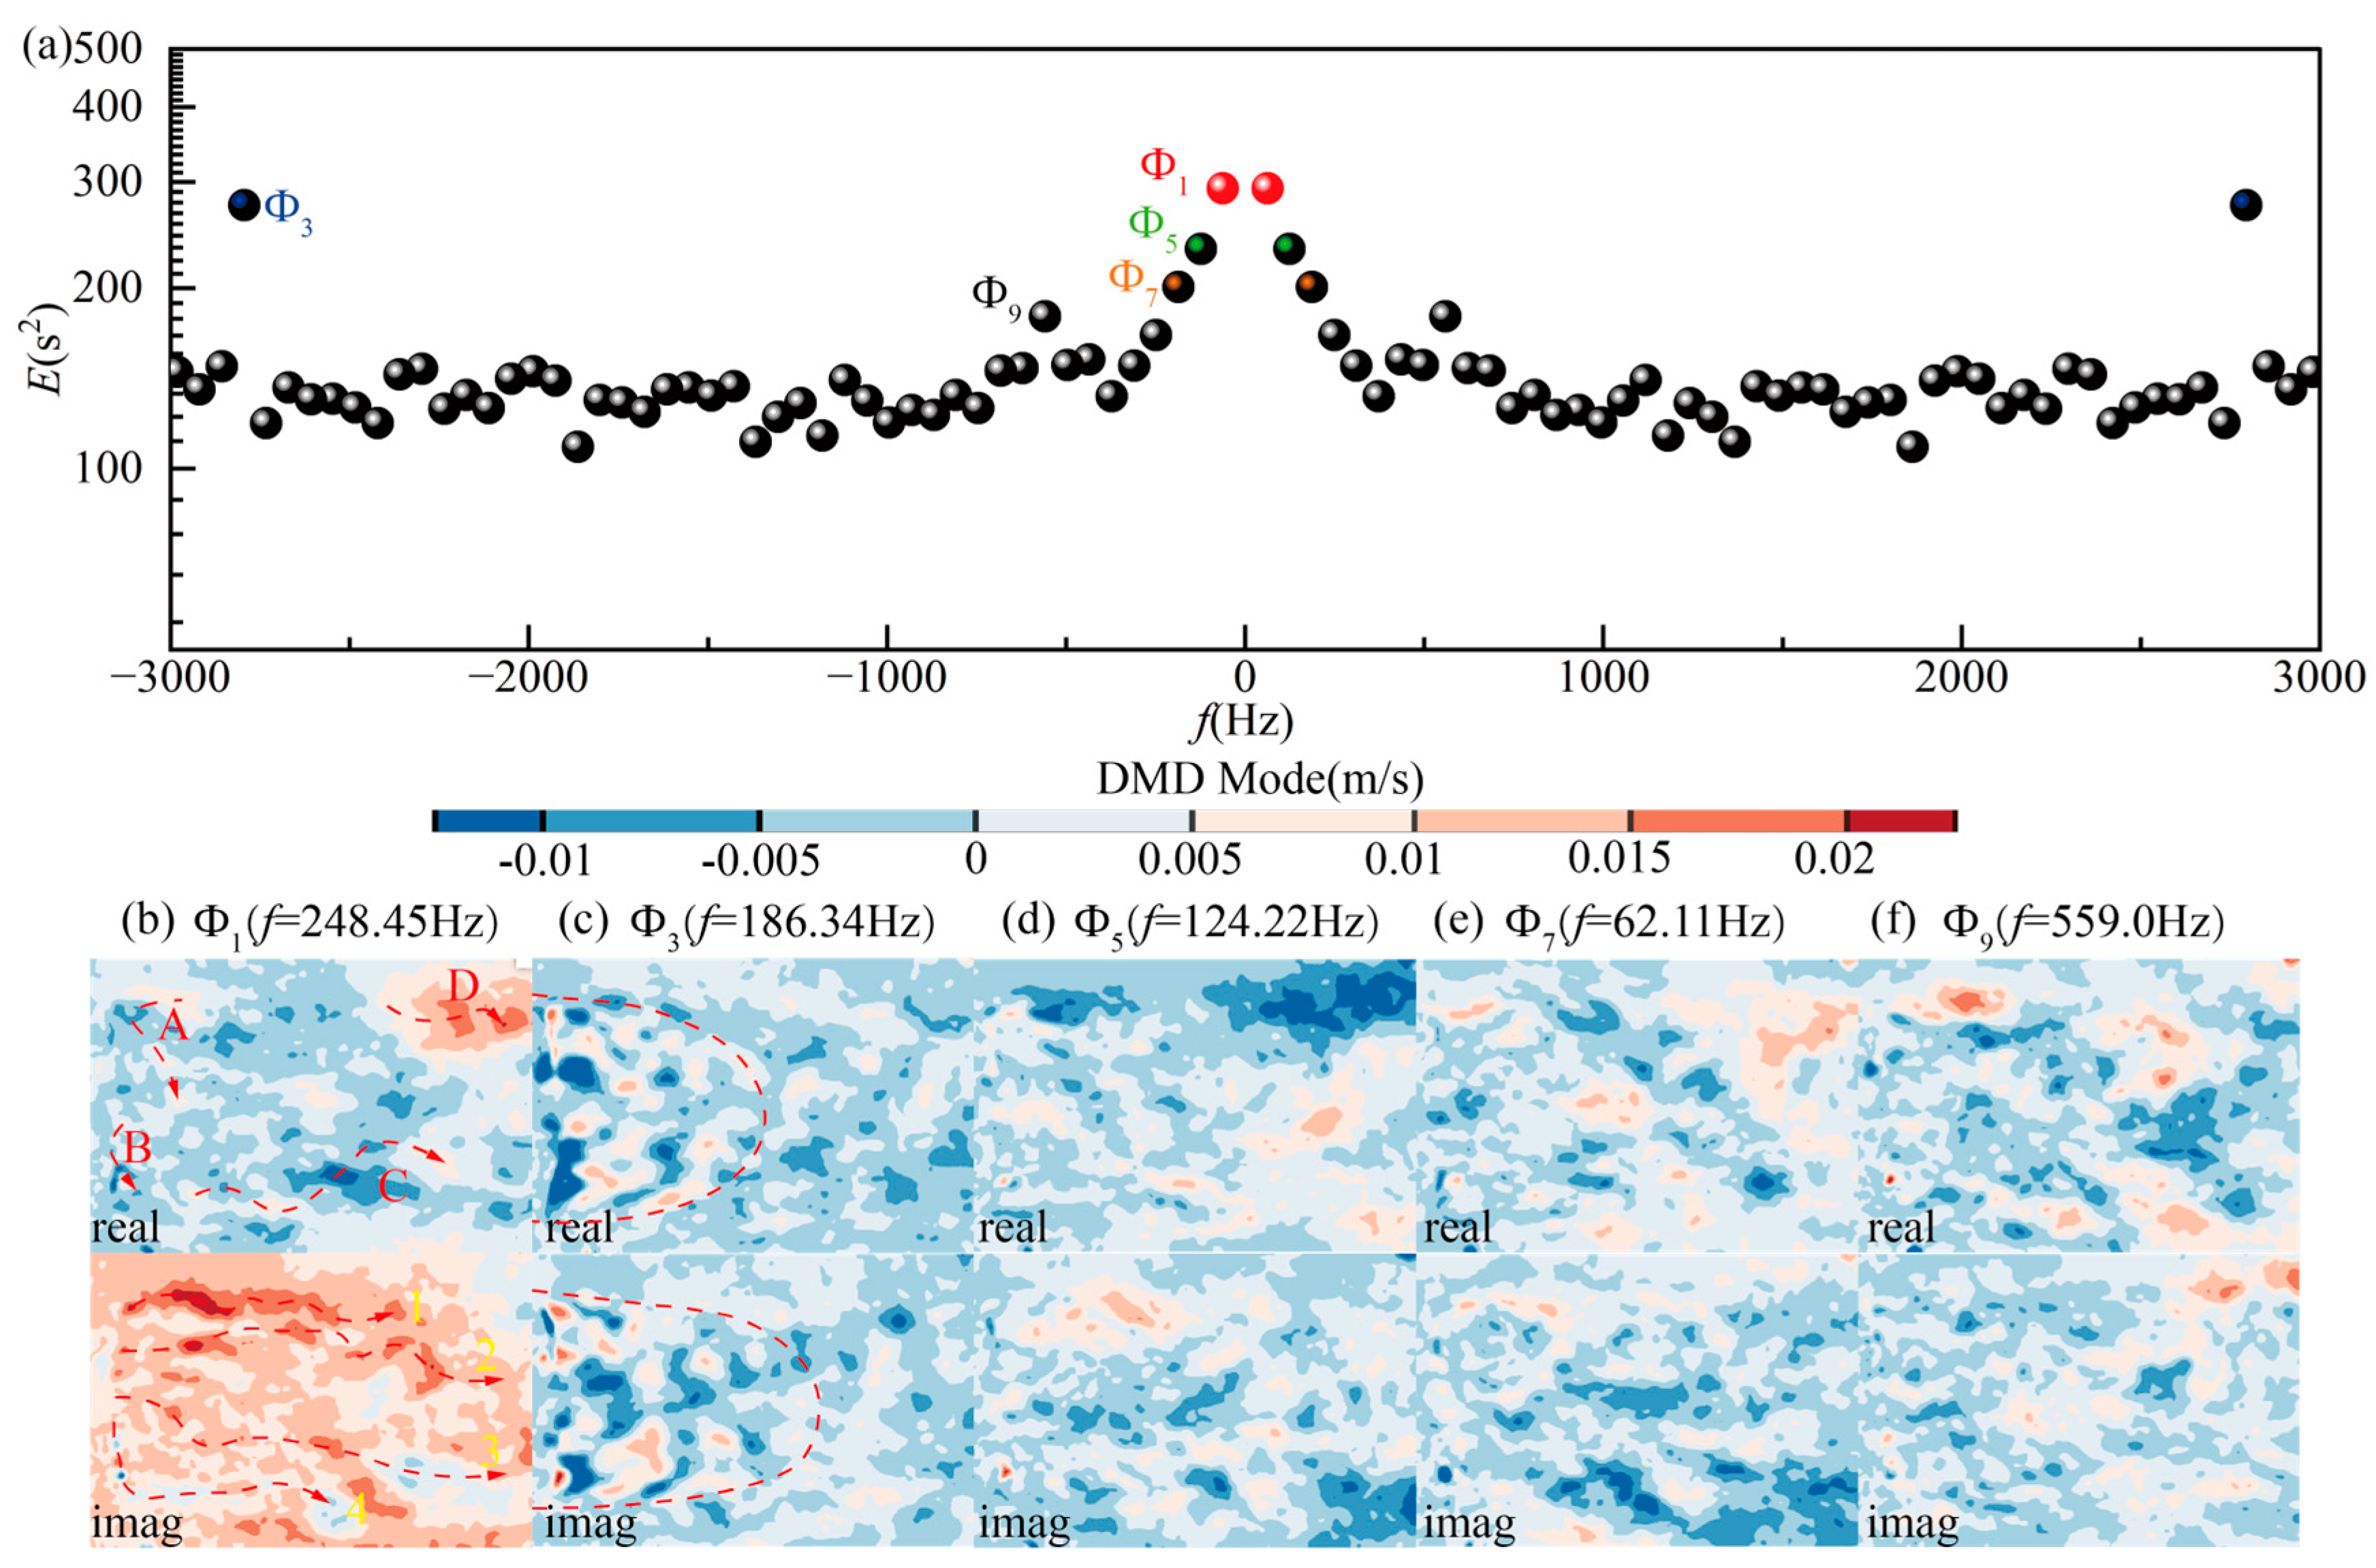
Disclaimer/Publisher’s Note: The statements, opinions and data contained in all publications are solely those of the individual author(s) and contributor(s) and not of MDPI and/or the editor(s). MDPI and/or the editor(s) disclaim responsibility for any injury to people or property resulting from any ideas, methods, instructions or products referred to in the content. |
© 2026 by the authors. Licensee MDPI, Basel, Switzerland. This article is an open access article distributed under the terms and conditions of the Creative Commons Attribution (CC BY) license.