


Abstract
Due to the increasing heterogeneity of consumer needs and preferences, manufacturing companies are forced to expand their product range to maintain market share while avoiding cost increases. However, increasing product variety increases the complexity of assembly systems and complicates planning, design, and production management. The quantification of manufacturing complexity and its impact on key performance indicators remains a subject of debate. To examine the relationship between assembly complexity, assembly line balance, and productivity from an operator-oriented perspective, an empirical complexity indicator for mixed-model assembly workstations is proposed. This indicator is based on experimentally collected data and analysis of working time variability. The proposed indicator is evaluated through controlled experimental case studies conducted in a learning factory environment. The results indicate that the relationship between complexity and productivity is not linear. Instead, within the investigated experimental boundaries, the observed trend suggests a turning point beyond which further increases in complexity are associated with decreased productivity, while line balance continues to improve. This finding suggests that integrating the proposed complexity indicator into production planning and management may support decision-making related to assembly line balancing and complexity management in manual assembly systems.
1. Introduction
Nowadays, manufacturing companies are faced with the trend to diversify their product range in order to meet different customer needs and remain competitive. Customer needs differ due to the individuality of each user, their social values, the way they use the product, etc. The assembly system, as a central process in product creation, is one of the most economical solutions for achieving high product variety [1,2]. Assembly usually represents the final stage of the product manufacturing process and therefore reflects all omissions, errors and defects that have occurred in the previous manufacturing stages. The importance of assembly is further emphasized by the fact that in some industries, assembly is the most time-consuming phase of the production process due to intensive human labor [3,4] and its significant impact on the company’s total production costs [5]. This highlights the importance of assembly in terms of both manufacturing time and cost and emphasizes the need to understand and improve it [6]. The inclusion of numerous components, tools and workstations in assembly processes contributes to a significant increase in the overall complexity of assembly [4,7,8]. Product variety requires a high degree of flexibility in assembly systems and their scheduling. As a result, assembly systems must be designed as mixed model configurations. Mixed-Model Assembly Lines (MMAL) are assembly systems on which a wide range of relatively different products are expected to be assembled [9]. Despite increasing automation in manufacturing, manual assembly lines are still widely used in mixed-model production environments because of their flexibility and suitability for handling high product variety and frequent changes in work content [10,11]. This study focuses on manual mixed-model assembly lines, where product variety directly affects workstation performance and operator workload. Although it is generally assumed that the Mixed-Model Assembly system can cope with complexity, the effects of product variety on the assembly process must not be ignored [8]. High product variety, triggered by the new production paradigm adapted to customer needs, may lead to some undesirable effects such as lower efficiency, more errors that translate into higher labor costs, lower product quality and more waste in the assembly system [6,12,13,14,15]. In addition, several studies have shown that a high percentage of manufacturing companies reference surveyed, almost 84%, consider product variety and the associated complexity of manufacturing processes to be one of the main cost drivers [12]. Accordingly, it can be stated that increasing complexity leads to challenges in system stabilization and has an impact on operators and system performance [16,17,18]. Recent research on manual and collaborative assembly systems suggests that greater technological sophistication does not necessarily reduce the impact of operational complexity on human performance. Gervasi et al. [19] found that work content distribution, interaction modes (from manual to collaborative), and team organization significantly affect operators’ perceived workload, regardless of the level of automation. These findings highlight the need for indicators that offer an operational understanding of how product diversity influences assembly performance.
An appropriate definition and indicator of assembly line complexity are important for supporting decision-making and understanding its potential impact on line performance. Unlike existing measures, which mainly focus on either structural or information-based complexity, this paper proposes a new variety-induced complexity indicator intended to quantify the operational effects of product and component variety at the workstation level and explores its influence on line balance and productivity. Specifically, the importance of this study lies in the empirical measurement of assembly times and time variability under controlled variation of product mix and task assignment. Based on these observations, the proposed workstation-level complexity indicator is developed and evaluated through repeated experiments conducted in a learning factory environment. Since the relationships between assembly line complexity, line balance, and productivity are still insufficiently explored in the literature [20,21], this study further investigates how changes in work content influence these performance metrics. Through these analyses, the paper provides empirical evidence on the operational relationship between product variety, assembly complexity, and assembly system performance. In line with the objectives of this paper, the remainder of the paper is organized as follows. Section 2 reviews the relevant literature. Section 3 then describes the proposed complexity indicator for assembly workstations and evaluates it using case studies. Section 4 presents a method for balancing assembly lines. The method is applied in a real environment to determine the relationship between the proposed complexity indicator, line balancing and productivity. Finally, conclusions, discussion and further research are given in Section 5 and Section 6.
2. Literature Review of Related Work and Associated Research Challenges
In line with the challenges posed by product variety for assembly systems and the objectives of this research, the literature review section is divided into two areas. The first section focuses on the review of existing complexity indicators. The second area deals with MMAL-related optimization problems, i.e., studies in which assembly line balancing and sequencing problems have been investigated. In the literature, these problems are usually considered individually, mainly due to the complexity of these problems. Recently, however, efforts and endeavors by authors to tackle the solution of these problems jointly have been observed. One of the recent approaches to solving these problems, individually or jointly, involves the inclusion of complexity indicators as one of the criteria to be met in the optimization process.
2.1. A Brief Overview of the Complexity of Assembly Systems
In general, complexity in manufacturing systems is a term often used to describe and predict the complex behavior of the observed system through the application of formal models [5]. According to Alkan [22] and ElMaraghy et al. [23], a system is perceived as complex if it consists of a large number of different elements whose interconnection causes complex causal relationships, i.e., they cause unexpected or unknown system behavior. This definition indicates that the system has certain characteristics that are not apparent from the characteristics of the individual components. One way to deal with complexity is to define and evaluate it [24]. Although the existence of manufacturing complexity and the challenges associated with it are widely recognized, there is no consensus on how to define and quantify complexity [25]. In an effort to define complexity, researchers have used various theories and methods. One of the most commonly used theories is Shannon entropy, also known as information theory [26]. Shannon entropy is a measure that quantitatively expresses the amount of information required to describe the uncertainty of a system state or behavior. The logic behind this definition is that the higher the value of entropy, the greater the uncertainty, which means that more information is required to describe the behavior of the system. Uncertainty can arise from the various sources of variety in the workplace (e.g., variety of components, fasteners, assembly sequence, product demand, etc.). Based on Shannon entropy, Zhu et al. [27] proposed a novel entropy-based method that refers to the operator’s choice complexity and describes the difficulties that the operator has to deal with when there is a large variety of products. Similarly, Busogi et al. [28] proposed an entropy-based method to quantify manufacturing choice complexity in MMAL, in which they consider the similarity of parts in addition to the influence of product variety on the operator’s decision. Zeltzer et al. [21] used entropy to define a complexity measure that takes into account the variability of task duration in MMAL. In Hamta et al. [29], entropy was used to define the information at each node of the supply chain configuration (the current variety of components at the nodes) and propose a complexity measure for an assembly supply chain network. The node refers to the participants in the supply chain. Modrak and Soltysova [16] use entropy in their work to define a complexity measure that focuses on finding the most appropriate system layout. More recently, Liu et al. [30] used information entropy and fuzzy entropy to describe the complexity of assembly workstations under uncertain demand.
Another commonly used approach to define the complexity of assembly systems is to relate it to product complexity in terms of the dimensional, geometric and structural characteristics of a given product [31]. These measures are mainly based on the principles of Design for Assembly (DFA). One of the notable studies in this area is that of Samy and ElMaraghy [4], in which the authors proposed a measure of product assembly complexity based on the difficulties during the insertion and handling process, which are a consequence of the physical attributes of the products. Alkan et al. [6] proposed a novel method to evaluate product assembly complexity based on the application of DFA principles and the adaptation of Hückel’s molecular orbital theory model [32] to assembly lines. In addition, Verna et al. [33] modified Alkan’s complexity model and used it to predict product defects. More recently, Puttero et al. [34] investigated the impact of product family complexity, using ARDUINO electronic boards as an example, on productivity (assembly time) and quality (number of defects) in HRC systems. Their results show that increasing product family complexity directly affects productivity levels and resource utilization, even in semi-automated environments. This study confirms that product-related complexity is an important factor influencing assembly performance, highlighting the need to develop indicators that can capture such effects at the workstation level.
All of the above measures for assessing the assembly complexity refer to the objective measures of complexity. These measures are linked to the measurable parameters of the system [35] and are therefore not dependent on the subject executing the task. In addition to objective complexity, another form is distinguished in the literature: perceived or subjective complexity. This form of complexity emphasizes that the same assembly system can be perceived differently depending on the individual skills, abilities and experience of the people involved in the assembly process. It is determined by subjective factors such as personal factors (knowledge, skills, type of person, motivation, mood, training, etc.) and by the company’s operational and management strategy [36,37]. The methods used to describe and define subjective complexity usually include questionnaires, interviews or discussions with employees. Measures of subjective complexity can be found in the work of Mattsson et al. [36], where complexity is associated with workstation design, work variance and disturbance handling and Falck et al. [13], who propose a measure called basic complexity criteria that describes the cognitive and physical aspects of assembly ergonomics. Recently, Capponi et al. [31] proposed a measure of subjective assembly complexity based on Thurstone’s law of comparative judgment, and Verna et al. [38] presented a method for evaluating the complexity of a manual assembly that integrates the complexity criteria proposed by Falck et al. [13] and Yager’s multi-expert, multi-criteria decision-making method as a synthesis approach. Building on previous research on product variety, Verna et al. [39] proposed a complexity index that integrates objective product characteristics and subjectively perceived worker workload, measured using the NASA TLX questionnaire.
Although considerable efforts have been made to describe and quantify assembly complexity, there is still an explicit need for tools that support an operationally grounded analysis and management of complexity, especially in the context of increasing complexity within traditional management theories [5,7,17,20].
2.2. Decision-Making Problems in the Literature
The two decision problems most commonly associated with assembly systems are line balancing and line sequencing. These two problems are complex optimization problems that are usually considered separately in the literature. In recent years, however, the efforts of authors trying to solve these problems simultaneously have become visible.
Assembly line balancing is concerned with achieving a balanced assembly line with maximum capacity utilization. According to Becker and Scholl [40], this problem can be categorized into the Simple Assembly Line Balancing Problem (SALBP)—the assembly of one product and the Mixed-Model Assembly Line Balancing Problem (MMALP)—the assembly of multiple products. The further classification of these problems is based on the specific objective to be achieved and differs as follows: the problem of minimizing the number of workstations, the problem of achieving a certain cycle time and the problem of minimizing both at the same time. The application of complexity theory in balancing problems is still in its infancy. The work that emphasizes the importance of establishing a connection between complexity and the balancing problem of MMAL is the work of Zeltzer et al. [21], in which the authors propose a complexity measure based on Shannon entropy and use it in the balancing procedure as a criterion for task assignment. In Liu et al. [41], the authors also proposed the integration of complexity measures to simultaneously achieve a better balance of the assembly line and optimal buffer allocation. In both research works, the variability of task duration for different products was considered as a source of complexity. Liu et al. [30] used uncertainty theory to define assembly complexity in the context of uncertain demand and utilized this measure to achieve a better balance within and between workstations. More recently, Aljinović Meštrović et al. [39] have shown that decisions about balancing an assembly line should also be considered at the workstation level, as variations in task content and operating conditions can significantly affect operator productivity and workload, even when formal line-balancing criteria are met.
Product sequencing within the assembly line refers to a sequence in which the required quantity of products is planned for assembly within a certain period of time. Different product assembly sequences have different economic effects on the resource utilization of the assembly system under consideration. In general, the assembly of different components or sub-assemblies at workstations leads to fluctuations in operator utilization and fluctuations in the number of assembled components. If labor-intensive components or product sub-assemblies follow one another at a workstation, this leads to work overloads that have to be compensated for by an additional operator, for example. Work overloads can be avoided if a suitable product sequence is found in which variants that cause long processing times at the workstation are exchanged for the less labor-intensive variants. Therefore, authors in the literature have recently attempted to define complexity measures that take into account the complexity of product sequencing in order to propose new algorithms to optimize product sequencing. Notable examples include Sun and Fan [8], who proposed the concept of changeover complexity to quantitatively express the operator’s uncertainty due to the change in work content. Similarly, Busogi et al. [25] proposed a measure of manufacturing complexity in MMAL, which refers to the uncertainty of whether a particular part will appear in the product sequence. Kumar et al. [42] described assembly complexity using a similarity index, which quantifies the degree of common components between products, and a reconfiguration complexity index, which expresses the difference in setup time between products. These measures were used as criteria for optimizing a sequence.
To solve these types of optimization problems, the authors emphasize the importance of integrating complexity measures into various optimization algorithms and methods as a promising way to improve system performance. From the literature reviewed, it can be stated that different authors have identified different sources of disturbances in the assembly line, such as task variability, demand fluctuations, rework due to human error or quality control issues, etc. Different definitions are proposed depending on the observed sources of complexity and the main optimization objectives of the authors defining the complexity measure.
2.3. Summary
As system complexity increases and production environments become more dynamic, traditional management approaches face limitations, motivating the use of complexity theory in manufacturing systems. Although the need for a comprehensive measure of complexity has long been emphasized [5,43,44,45], no universally accepted metric exists. As a result, the operational manifestation of complexity at the workstation level and its direct relationship with key performance indicators, especially productivity, remain insufficiently explored.
From an assembly perspective, effective complexity management offers a promising approach to achieving lower manufacturing costs, shorter lead times, and improved overall system performance [34,46,47]. Recent literature recognizes the importance of assembly complexity indicators for optimizing line balancing and sequencing of assembly operations and emphasizes the need to monitor assembly complexity to enhance line performance and operator well-being. Although complexity indicators are increasingly integrated into optimization problems, the relationship between assembly complexity and key performance indicators, particularly productivity, remains insufficiently understood [6]. While complexity is often assumed to negatively affect system performance, the magnitude and nature of this impact remain unclear. The question of possible positive effects of complexity also remains open, including the extent to which complexity can contribute to improving assembly system efficiency. This highlights the need for operationally based complexity indicators that enable a clearer connection between product variety, workstation-level complexity, line balance, and achieved performance. Further research in this area could significantly contribute to developing tools for better complexity management and its integration into optimization processes. Accordingly, this paper addresses this research gap by proposing a new assembly workstation complexity indicator and investigating its relationship with assembly line balance and productivity through empirical case studies in a learning factory environment. Existing complexity indicators primarily quantify structural characteristics of products and assembly systems, information-based uncertainty, or perceived cognitive workload. While these approaches provide valuable insights into various dimensions of assembly complexity, they do not directly quantify how product and component variety affect workstation performance during task execution. In contrast, the proposed AWCI is a time-based operational indicator derived from observed assembly time variability. Rather than measuring structural, informational, or subjective complexity directly, it captures the operational consequences of product variety through its impact on assembly performance at the workstation level. The results contribute to a more nuanced understanding of assembly complexity and support decision-making in assembly line design and balancing by complementing existing complexity measures with an operational, performance-oriented perspective.
3. Indicator for the Complexity of Assembly at the Workstation Level
In manual MMAL, complexity arises from the variety of end-product variants that manufacturers must offer customers. As product variety increases, operators encounter a broader range of components, tools, and assembly instructions at their workstations. This increase in work content leads to more frequent changes in assembly tasks and greater variability in workstation activities. Such operational variability affects operators’ skills, routines, and mental effort during manual assembly, increasing the likelihood of errors in part selection or the assembly process [36]. Additionally, this variety leads to variability in assembly times, which can cause fluctuations in the prediction of assembly line key performance indicators (KPIs). These effects make predicting and controlling assembly line performance more challenging in a manual environment. To address these challenges, this paper proposes a new Assembly Workstation Complexity Indicator designed to capture the operational impact of product variety at the workstation level by considering both product variety and the number of different components handled by operators at the workstations. In the literature, these two parameters are frequently identified as key starting points and important sources of complexity in manual assembly systems. Unlike structural or entropy-based complexity indicators, which often consider individual factors in isolation, the AWCI accounts for the combined effect and interaction of input variables that influence work content and time variability. Based on the input factors (product variety and the number of different components), an experimental design was defined to obtain a mathematical model of the AWCI. The proposed indicator was developed and evaluated through case studies in the learning factory (LF) environment. The methodology consists of three main phases: (i) conceptual and quantitative definition of the AWCI, (ii) experimental design and data collection in a controlled LF environment and (iii) statistical modeling and evaluation of the proposed indicator using regression analysis and independent case studies. All data were collected through repeated assembly experiments to ensure consistency and reduce the influence of learning effects. All experiments were performed by a total of four operators. The operators were researchers and graduate-level engineering students with prior experience in manual assembly tasks and basic training in the observed assembly process. None of the operators were professional industrial workers. For the purpose of developing the empirical relationship presented in Section 3.2, experiments were conducted using a single operator to minimize inter-operator variability and to isolate the effect of product and component variety on assembly time. The remaining operators were included in subsequent experiments (Section 3.3) to assess the sensitivity of the observed AWCI trend to inter-operator variability. The LF provides a controlled environment that replicates key characteristics of industrial assembly systems while allowing systematic experimentation without the constraints of real production settings [48,49].
To provide a comprehensive overview of the empirical research framework, a compact summary of all experimental phases, their core purposes, and the associated data collection scope is outlined in Table 1.
Table 1.
Summary of experimental phases and data collection.
3.1. Quantitative Definition of the AWCI
In this paper, the AWCI is defined as a factor that reflects the increase in average product assembly time caused by different workstation configurations in manual MMAL. These configurations result from subdividing selected work elements, as closed logical units, into several smaller and simpler work elements to achieve line balance. This often leads to overlapping work content across neighboring workstations. Such configurations increase assembly complexity at the workstation level, as operators must handle a wider range of parts, tools, and instructions. Consequently, performing a particular work element on a balanced line tends to require more time than performing it at a dedicated workstation. In this study, a work element is defined as a series of activities (assembly operations) that are small enough to be practically treated as a single unit. This indicator aims to objectively describe the impact of variety at the workstation level through its impact on operator performance and task execution time.
The proposed AWCI is a function of the number of different products () assembled at the workstation and the number of different parts () available for their assembly:
where
—AWCI, i.e., the complexity indicator of workstation for known values of the input parameters and within the observed EPEI period (),
—average actual product assembly time at workstation , depending on the defined input parameters and ,
—reference (idealized) average product assembly time at workstation in relation to the number of different products, , for the observed EPEI period ().
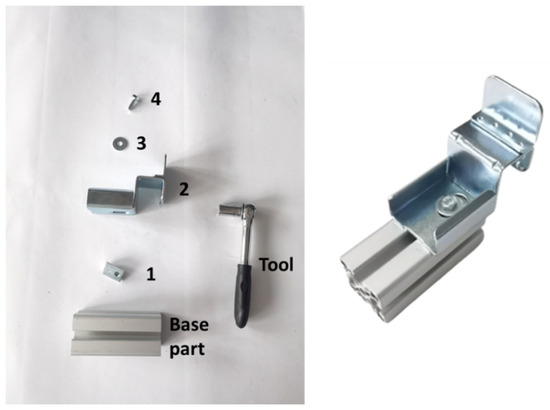
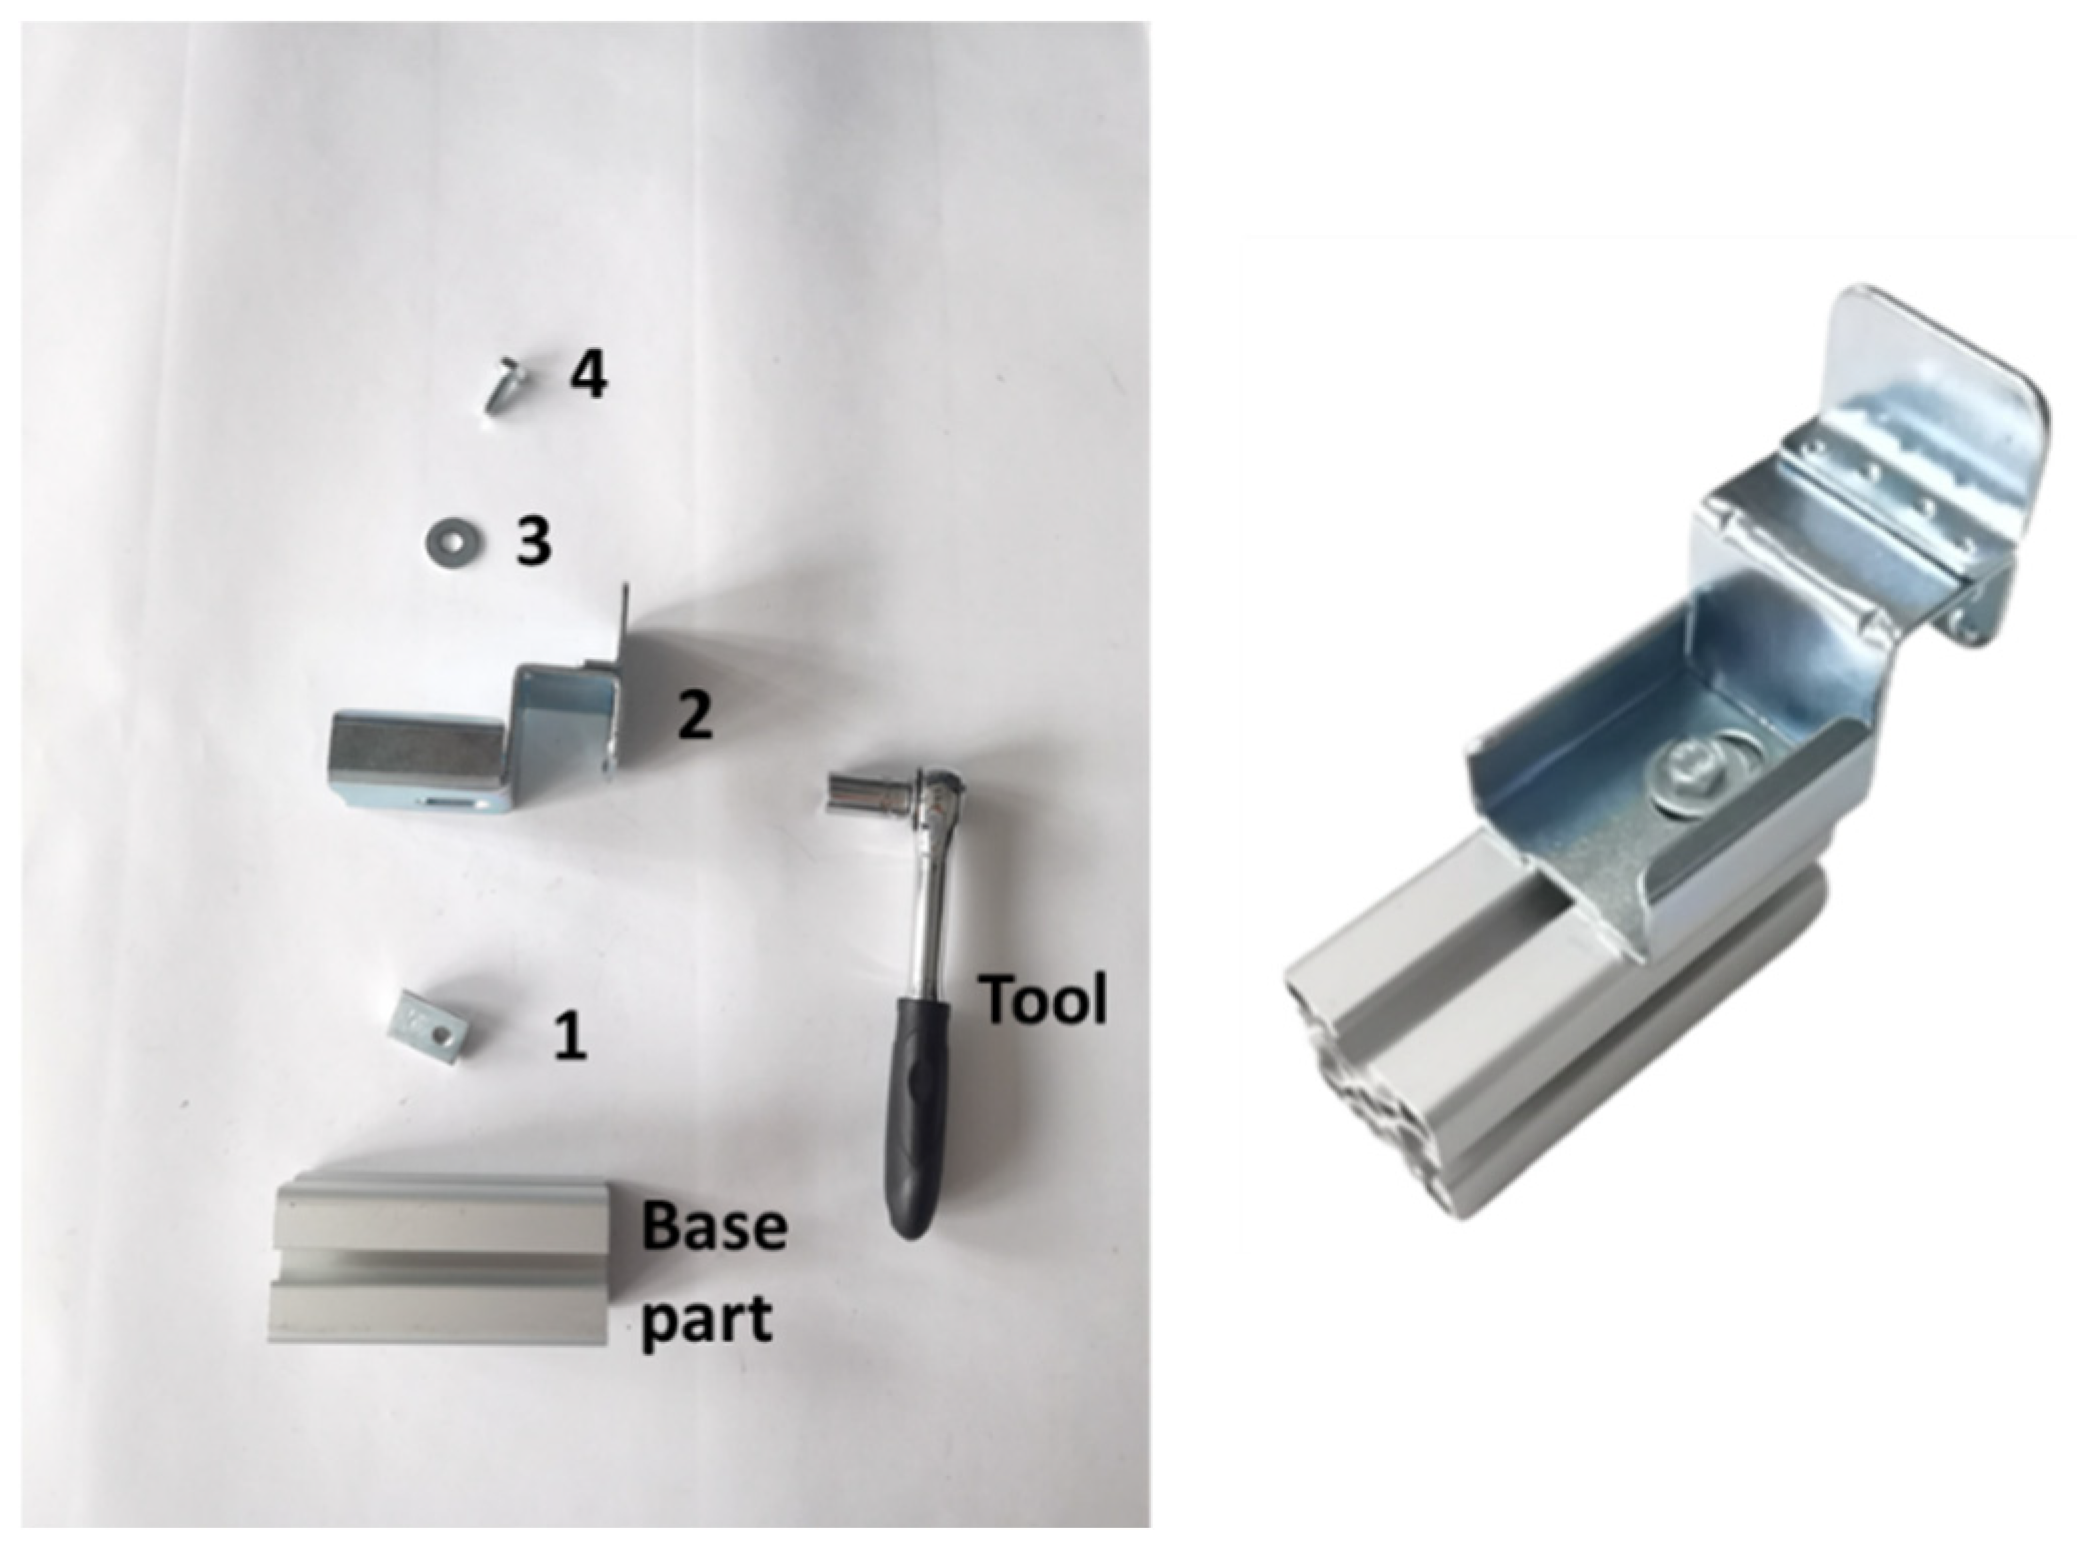
The reference product assembly time, , is defined as the average time of all products assembled in the product sample, measured under controlled conditions, where the operator is well-trained and familiar with both the assembly process and the workplace. The workplace is optimally organized, with only the required parts and tools available at the workstation and positioned to ensure efficient access during assembly. These items are arranged in the assembly sequence and aligned with the assembly direction of the part. The reference time is experimentally derived within the LF environment and is therefore considered context-specific and suitable for comparative analysis within the studied system, but not for universal generalization. In manual assembly, this assembly time typically follows a normal distribution. An example of the arrangement of the parts and the tools required for a product assembly consisting of one work element is shown in Figure 1.
Figure 1.
Arrangement of the parts, the tool and the end product (numbers 1–4 indicate the components and their assembly sequence).
The product assembly time, , is the average assembly time for products assembled according to the product sample. It includes the average preparation time (setup and auxiliary time) and the time spent on the actual assembly process. Setup time is the time required for the operator to study the instructions for the product to be assembled or to ensure that the product being assembled is identical to the previous one. Auxiliary time is the time the operator needs to find all the components required for assembly. The time spent on the assembly process is the time during which the required assembly is carried out. In general, the EPEI (Every Product Every Interval) period is defined as the time required to assemble each product in the portfolio at least once before repeating the sequence. In this study, the concept is adapted and expressed by the minimum ratio of products within the product sample. For example, if the EPEI ratio is 1:1:2 and three different products are produced in an assembly sequence, this means that one unit of Product 1, one unit of Product 2 and two units of Product 3 are assembled before the sequence starts again. To minimize the impact of sequence complexity, the product ratio was minimized and randomly assigned.
Based on the proposed AWCI, a mathematical model for predicting assembly complexity is presented in the following section. This model quantifies workstation complexity as a function of product variety and the number of different components, based on experimentally observed assembly times.
3.2. Mathematical Model for Predicting Assembly Complexity at the Workstation Level
This section describes the experimental design and statistical modeling approach used to derive a mathematical model for predicting the AWCI as a function of two factors. The assembly process is influenced by various interacting factors, making it difficult to reliably determine the output variables of the system from the input factors using a purely theoretical approach. Therefore, the use of experiments and analysis of the results is essential to quantify these relationships and provide a reliable basis for a predictive model of system performance. To support model development, controlled experiments were conducted in the LF environment under realistic manual assembly conditions. The experimental setup and the modeling procedure are described in the following sections.
3.2.1. Description of the Case Study
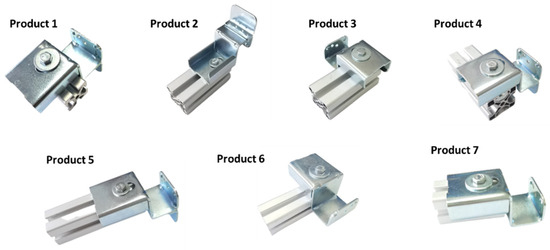
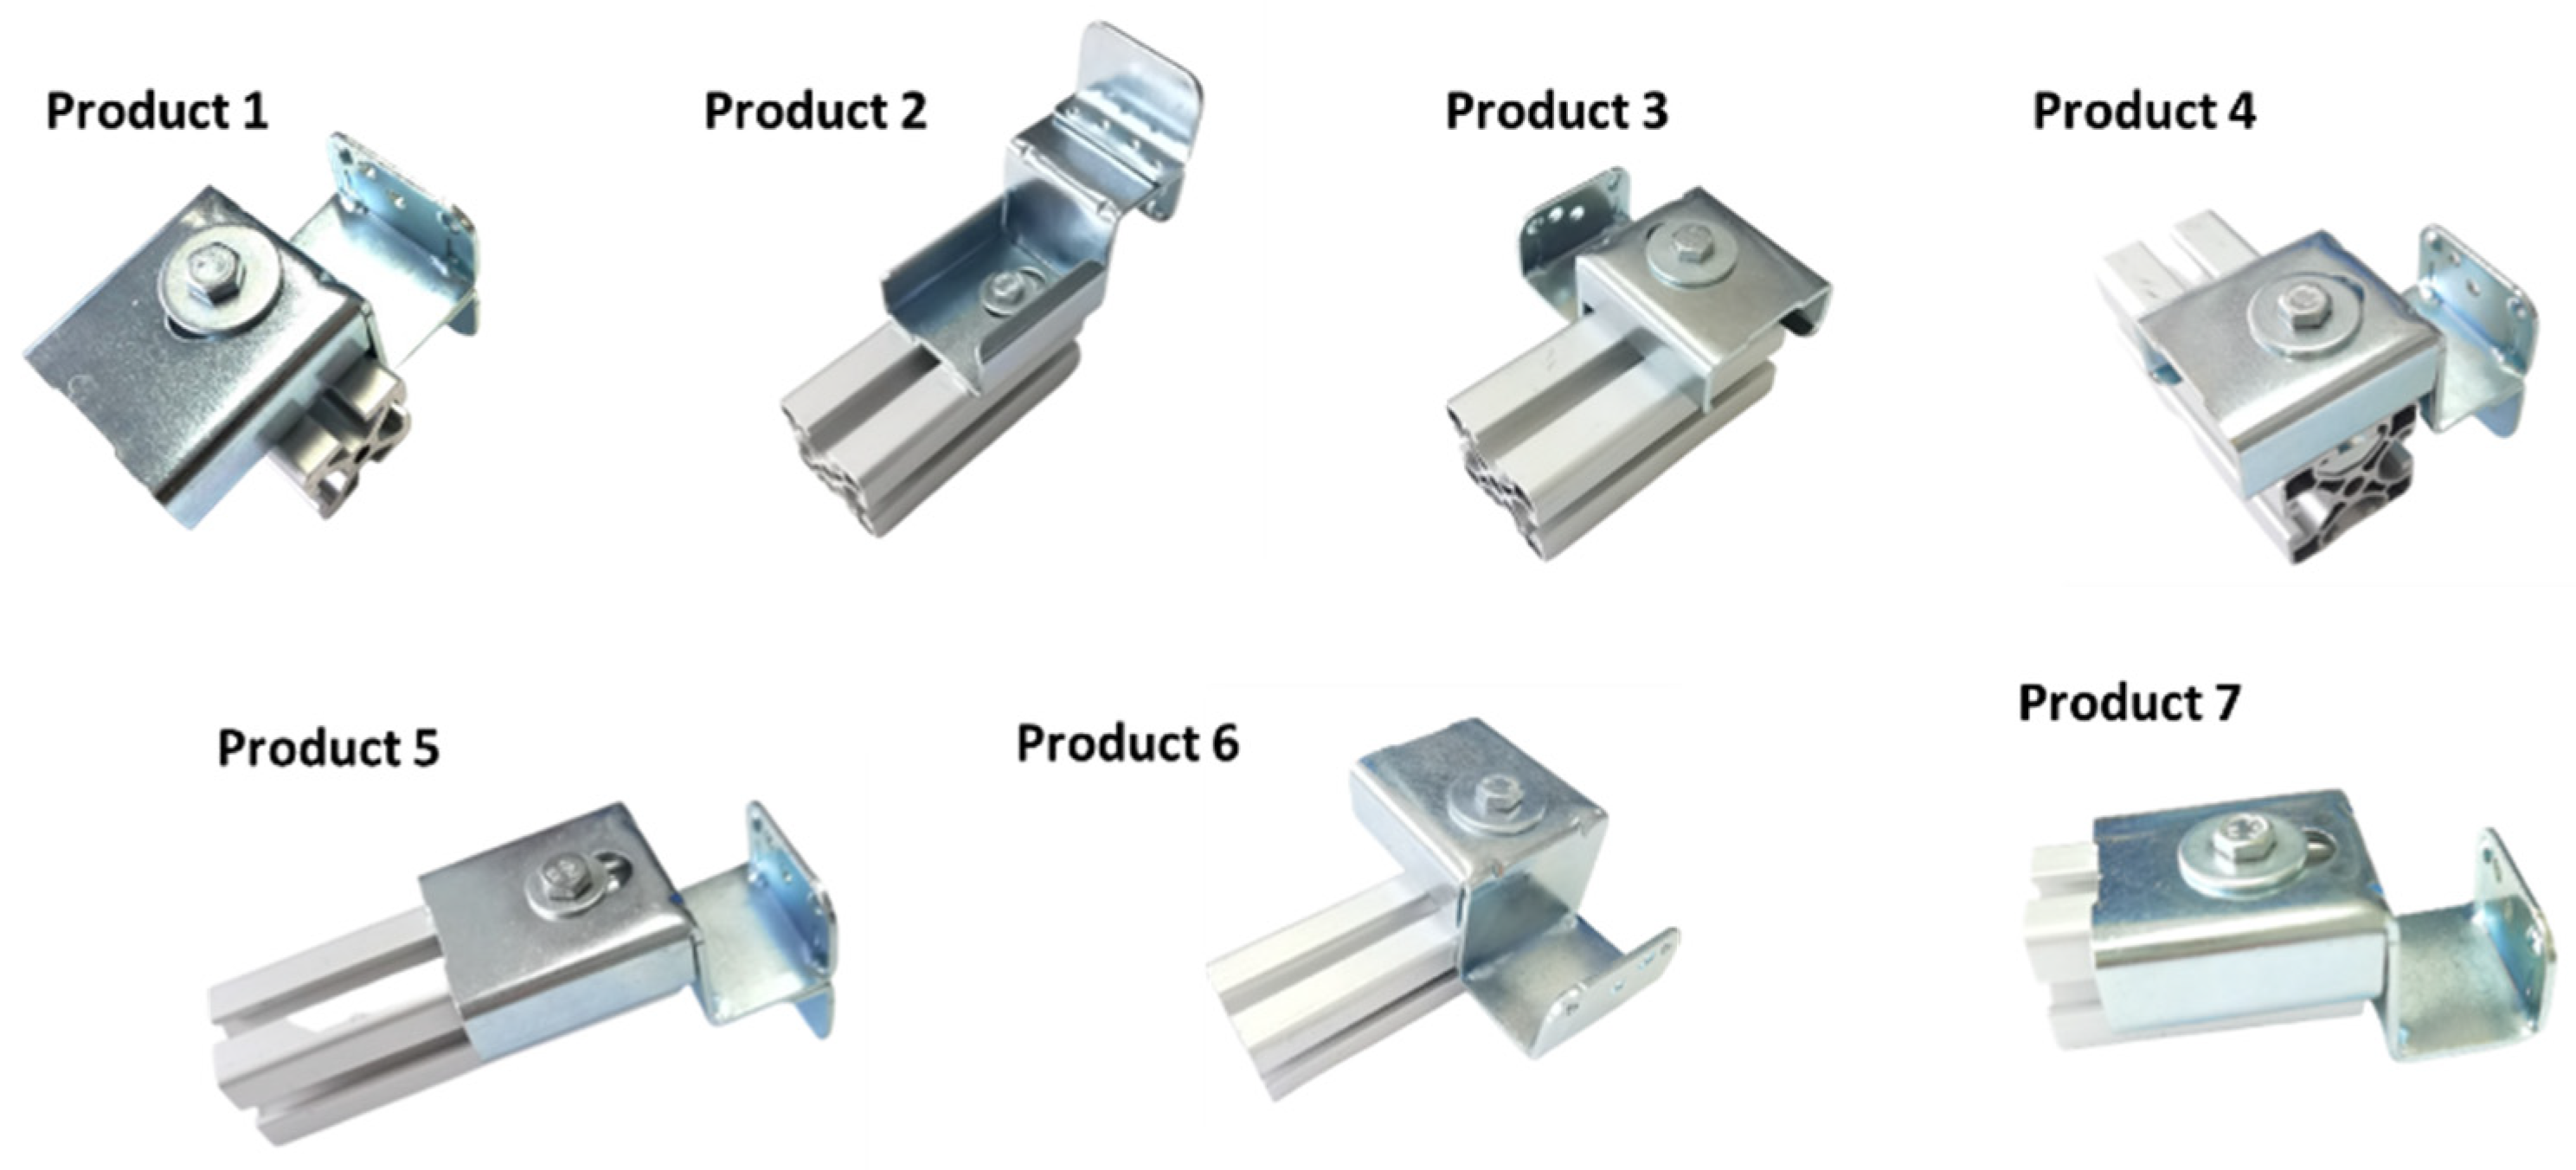
To propose a mathematical model to predict AWCI, experiments were conducted at a single workstation. Participants were asked to complete the assembly process for seven different products randomly selected from the product family assembled at this workstation (Figure 2).
Figure 2.
Observed products.
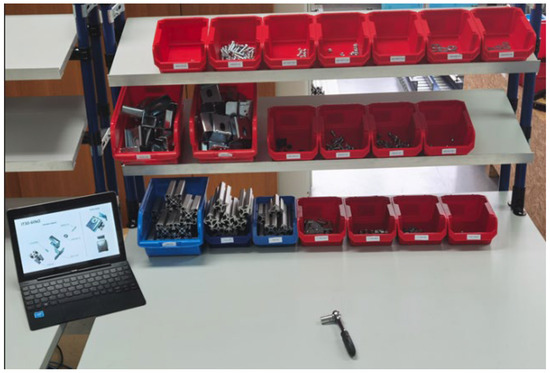
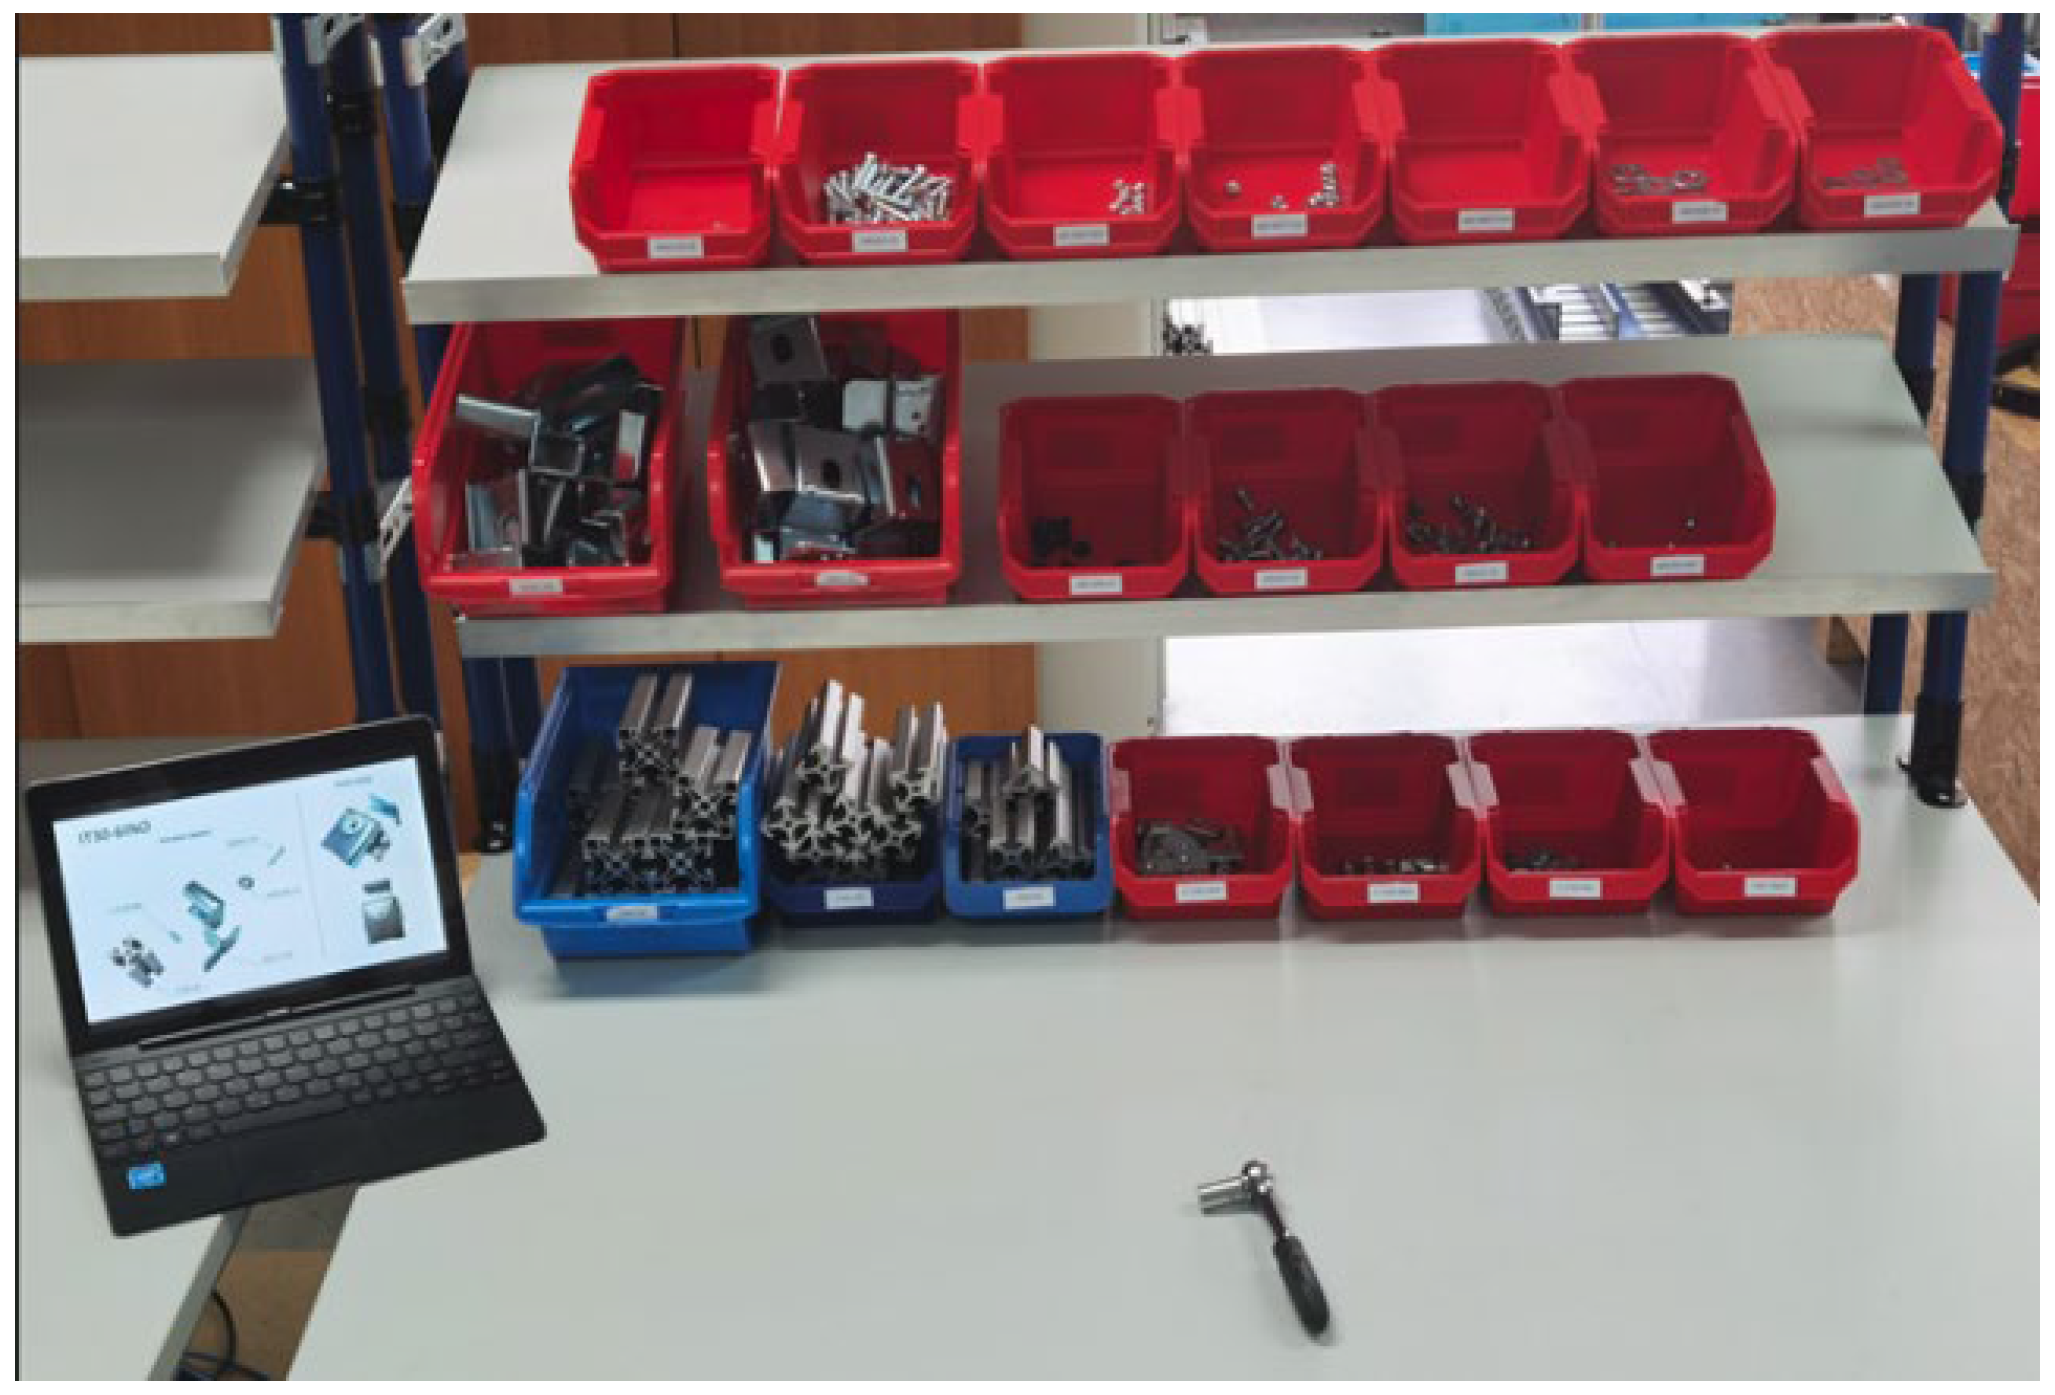
These products are visually similar and consist of a total of 20 different components that are required for their final assembly. Each component is assigned to its own box in the workstation supermarket. The observed products are simple products consisting of an equal number of components connected by a single screw connection. Therefore, each product consists of one work element. This means the number of products, , is equal to the number of work elements, (where Each observed product contains five different components. All seven products are assembled using the same tool. It is important to note that the products do not consist of five identical parts. The parts differ not only in their spatial arrangement within the final product, but also in their dimensions and geometric shapes. The assembly experiments were scheduled for 20 days in order to allow sufficient repetition to minimize learning effects and ensure stabilization of operator performance. An example of the workstation is shown in Figure 3.
Figure 3.
Workstation with the maximum number of different components for observed products.
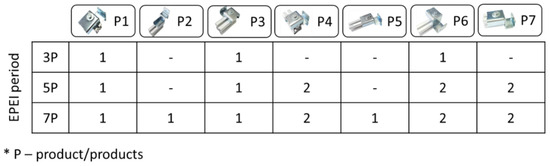
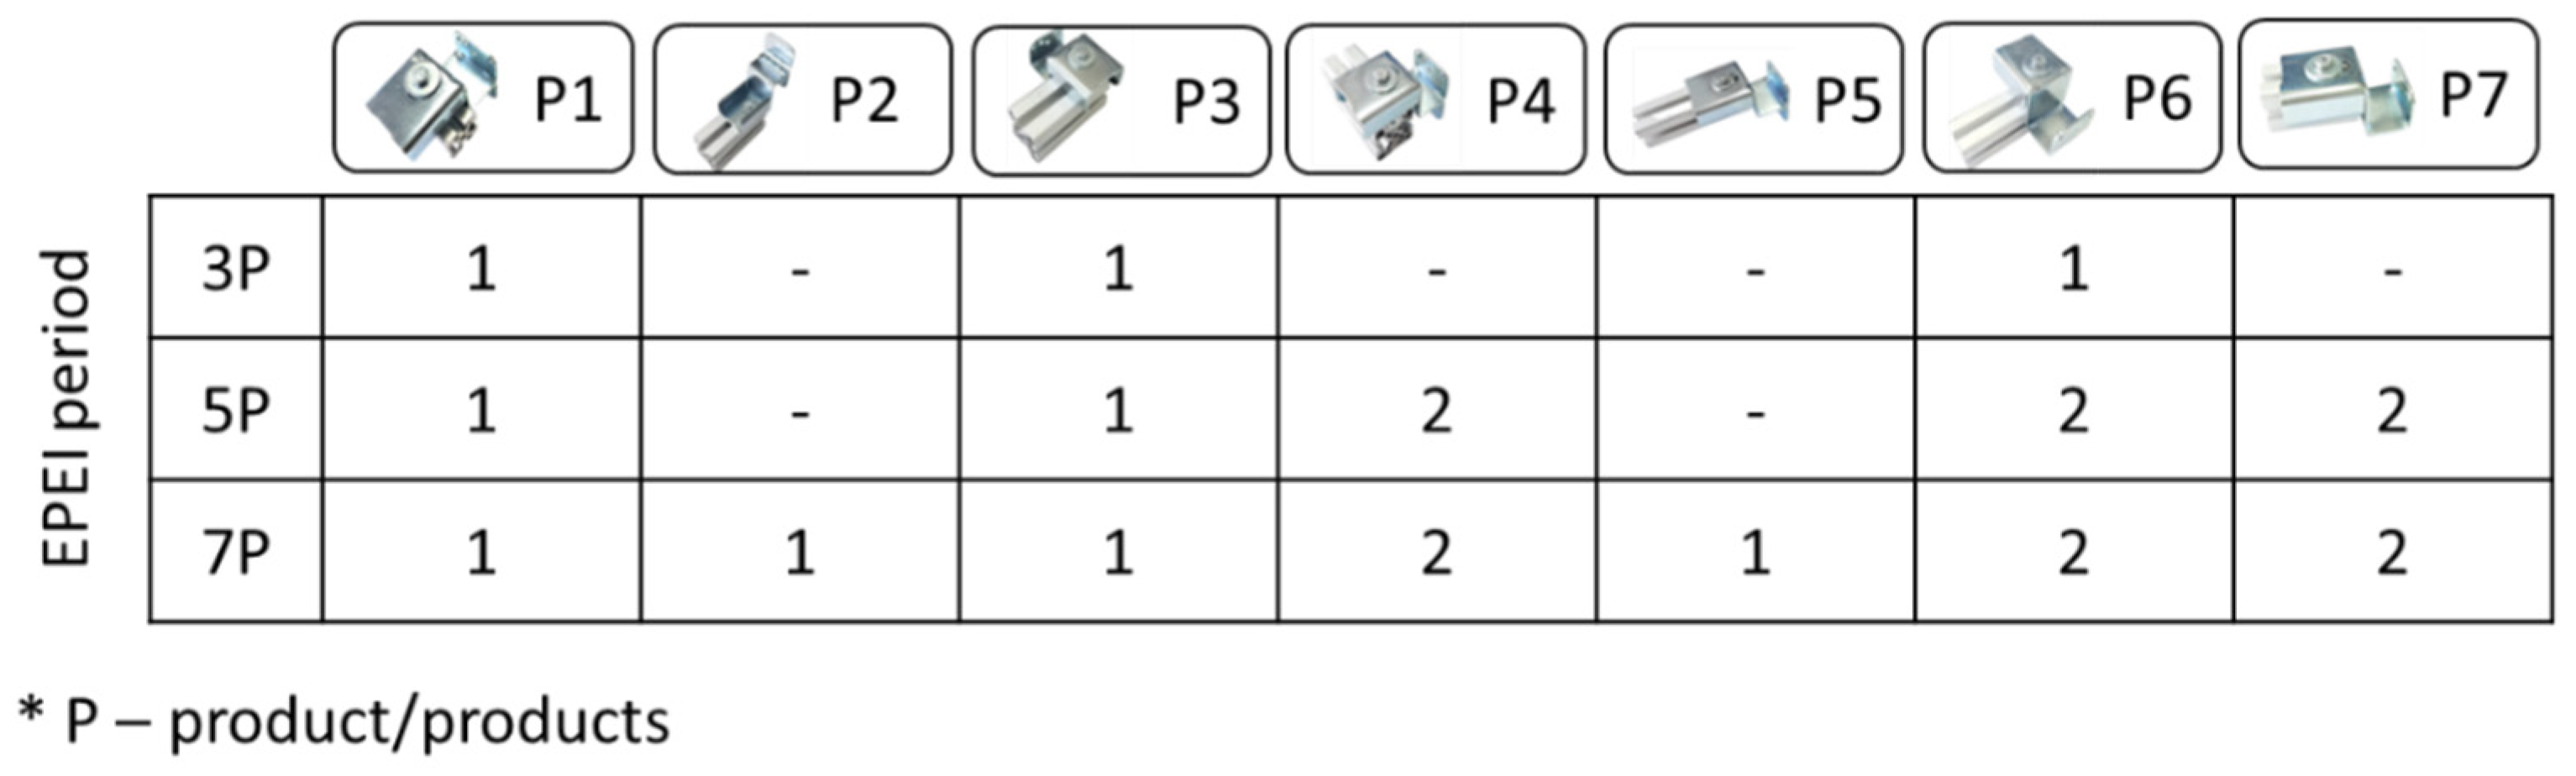
Two main parameters were analyzed at three levels: product variety, defined by product samples of 3, 5 and 7 different products, and component variety with 14, 17 and 20 different components. Fourteen is the minimum number of different components required to assemble seven products. To increase component variety, additional parts from other products in the observed product family were added to the workstation. Because the added components are very similar to the required components, reduced operator concentration can lead to confusion and errors, resulting in longer assembly times. The defined EPEI period and product samples were randomized and are shown in Figure 4. In Figure 4, the designation 3P refers to a group of three different products that are assembled and define the observed EPEI period. The same applies to the designations 5P and 7P, which refer to the assembly of five and seven different products, respectively.
Figure 4.
Product sequences defined through EPEI.
3.2.2. Experimental Design and Experiments
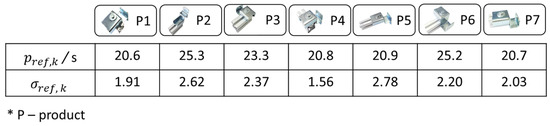
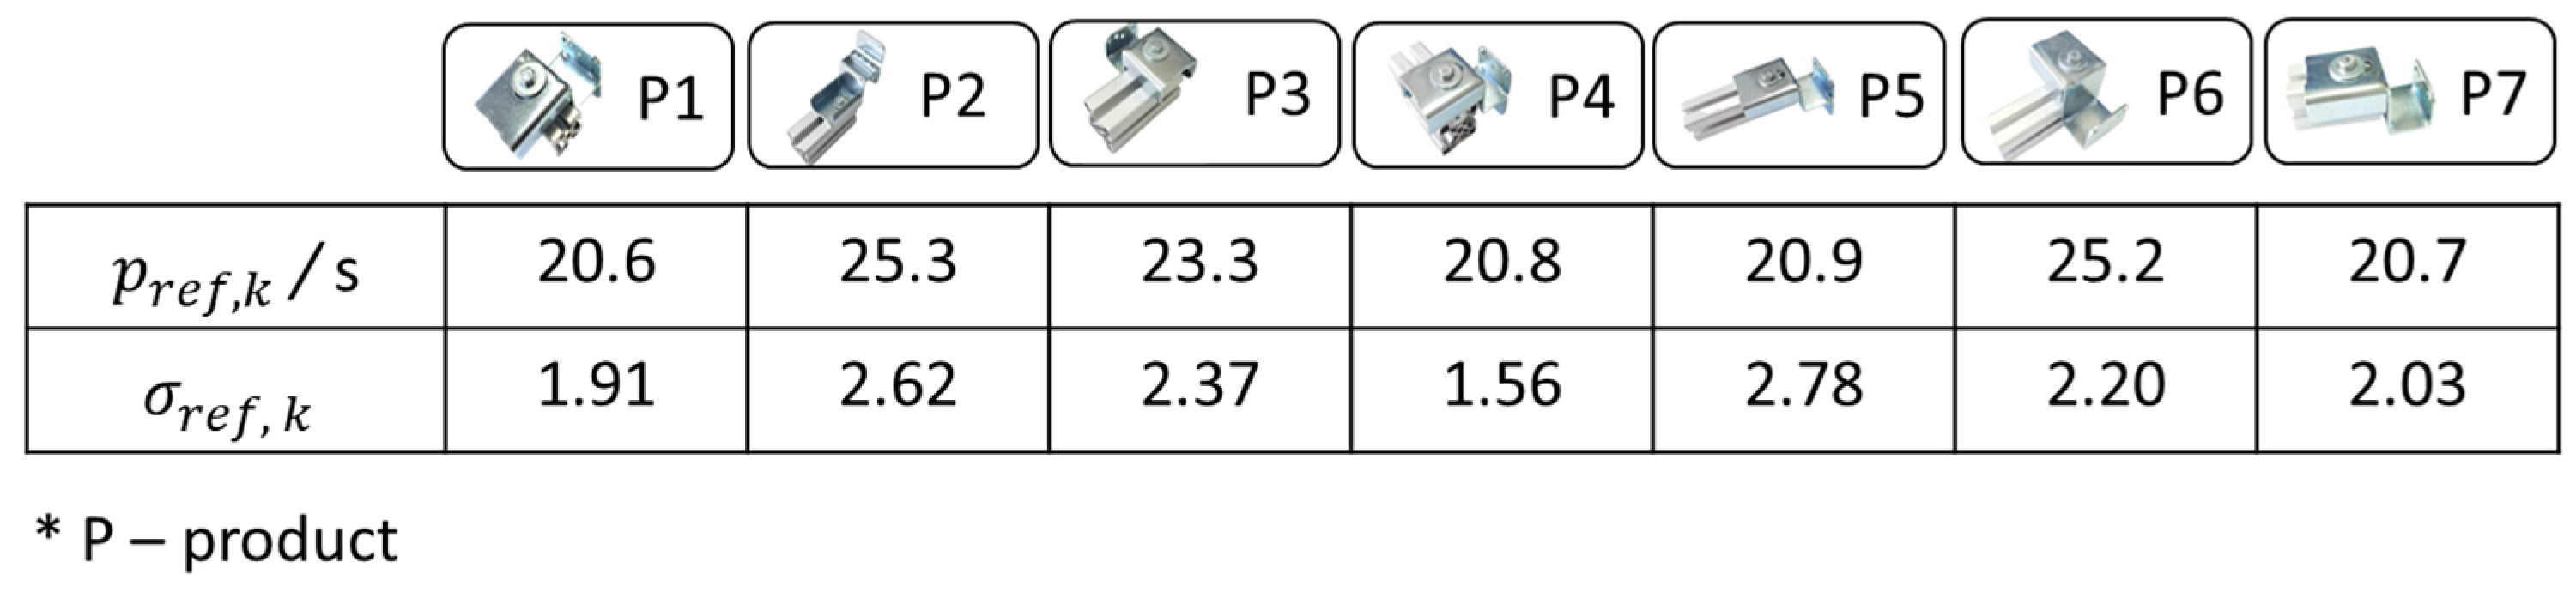
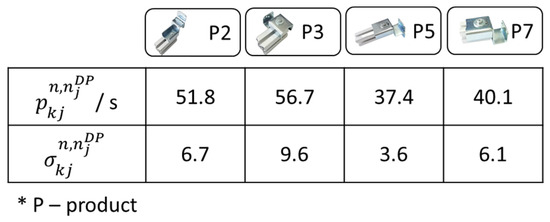
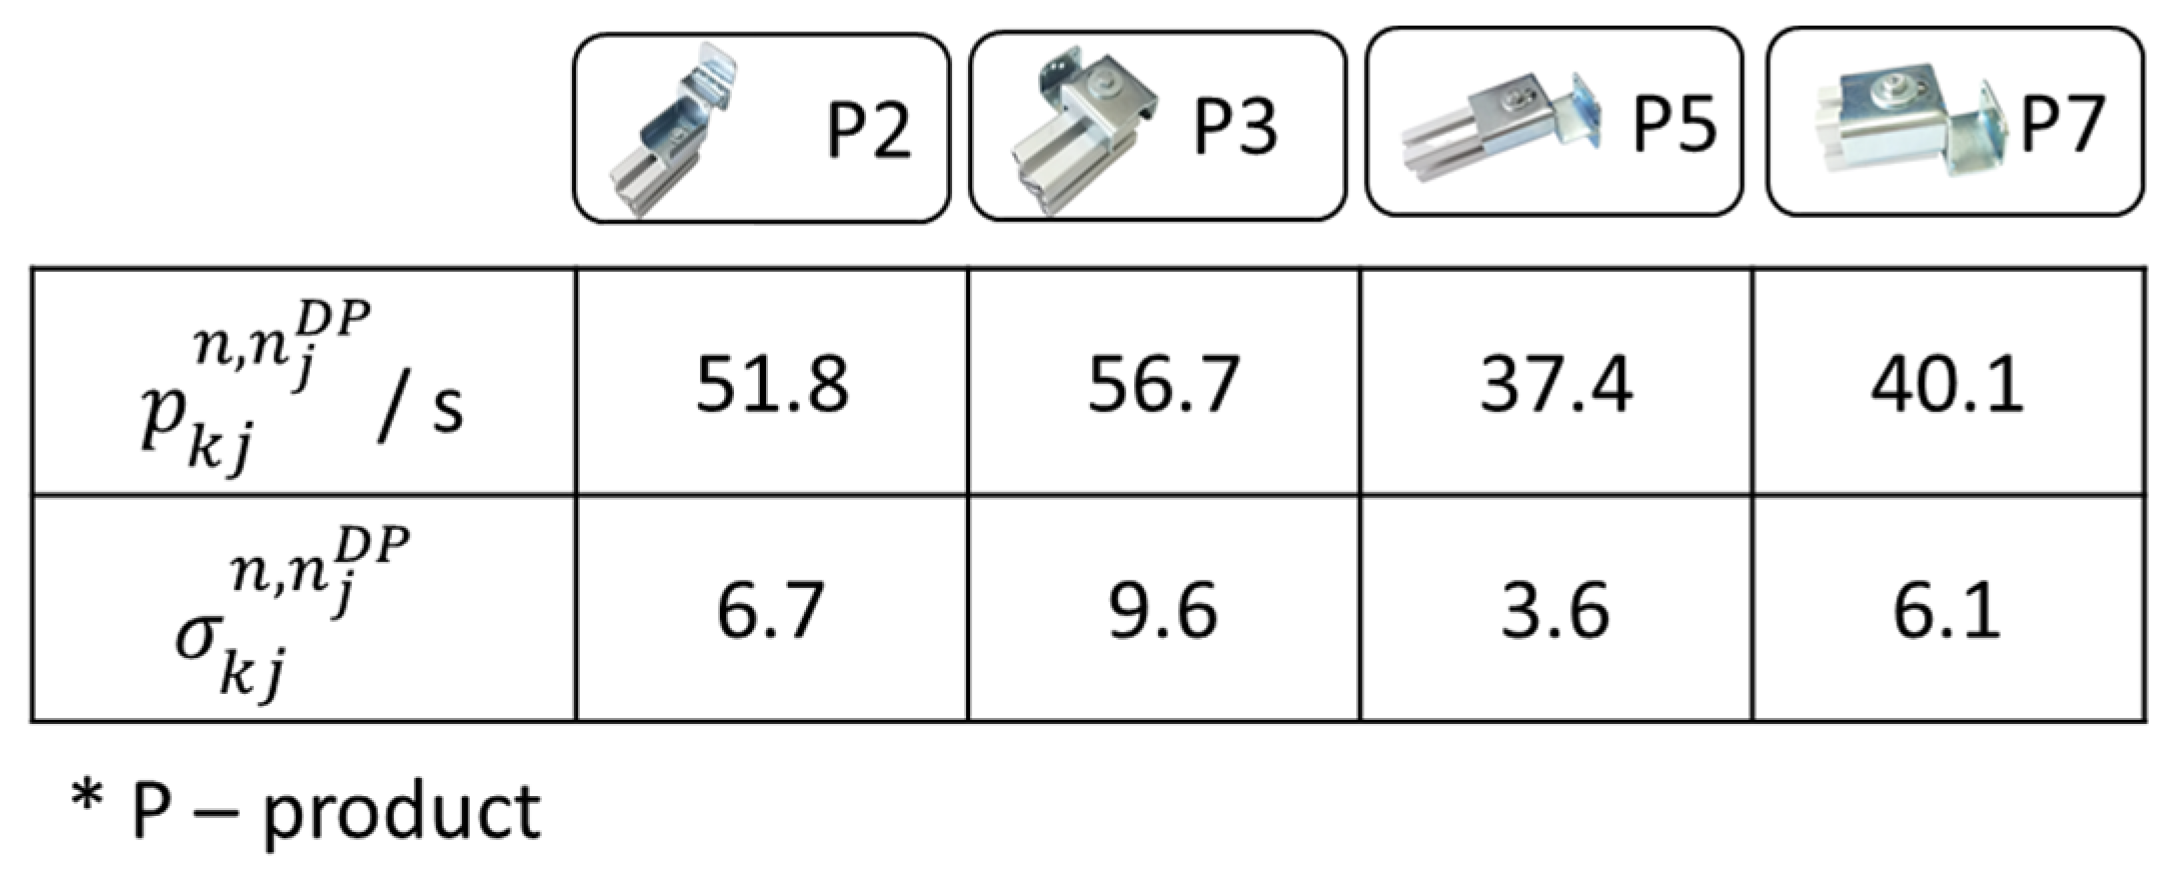
To determine the AWCI according to Equation (1), the experiments were carried out in two phases. In the first phase, experiments were conducted to determine the reference assembly time for each product, i.e., for each work element. The average reference assembly times, , and their standard deviation () for each product are shown in Figure 5.
Figure 5.
Reference assembly times for different products and their standard deviations.
The recorded data from Figure 5 was used to determine the average reference product assembly time at workstation j. For a sample of three products, the average reference assembly time () was 23.6 s. For samples of five and seven products, the values were 22.2 s and 22.4 s, respectively.
In the second phase, experiments were conducted to determine the average product assembly time at the workstation as a function of the product sample and a defined EPEI period (product ratio), Figure 4. These times were determined using a full factorial experimental design (Table 2). Regression analysis was performed to obtain a statistical mathematical model. The experimental design included 13 experiments (8 with different factor levels and 5 replicates at the midpoint). The collected data and the corresponding AWCI values calculated according to Equation (1) are shown in Table 2.
Table 2.
Plan of the experiments.
3.2.3. Mathematical Model
To derive a mathematical model for predicting AWCI, the central composite design (CCD), specifically the face-centered central composite design (CCF), was chosen with factor values at three levels (α = ±1). Statistical analysis of the results was performed using Design Expert 13 software. CCD was selected due to its ability to model nonlinear effects and interactions between input variables. Compared to other experimental designs, such as the simple factorial design or the Box-Behnken design, CCD enables a more detailed exploration of the factorial space with a relatively small number of required experiments. Based on the values shown in Table 2, the mathematical model for predicting AWCI is expressed as follows:
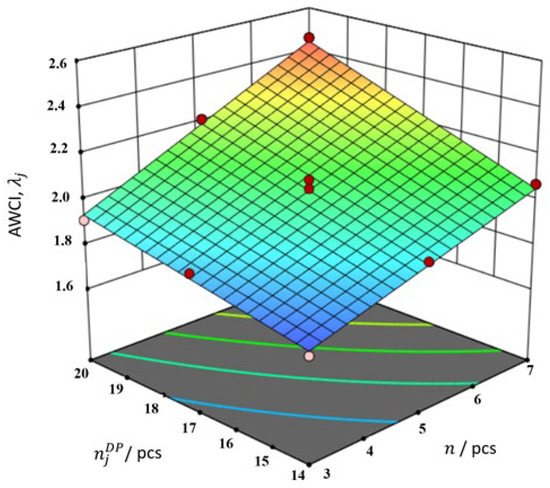
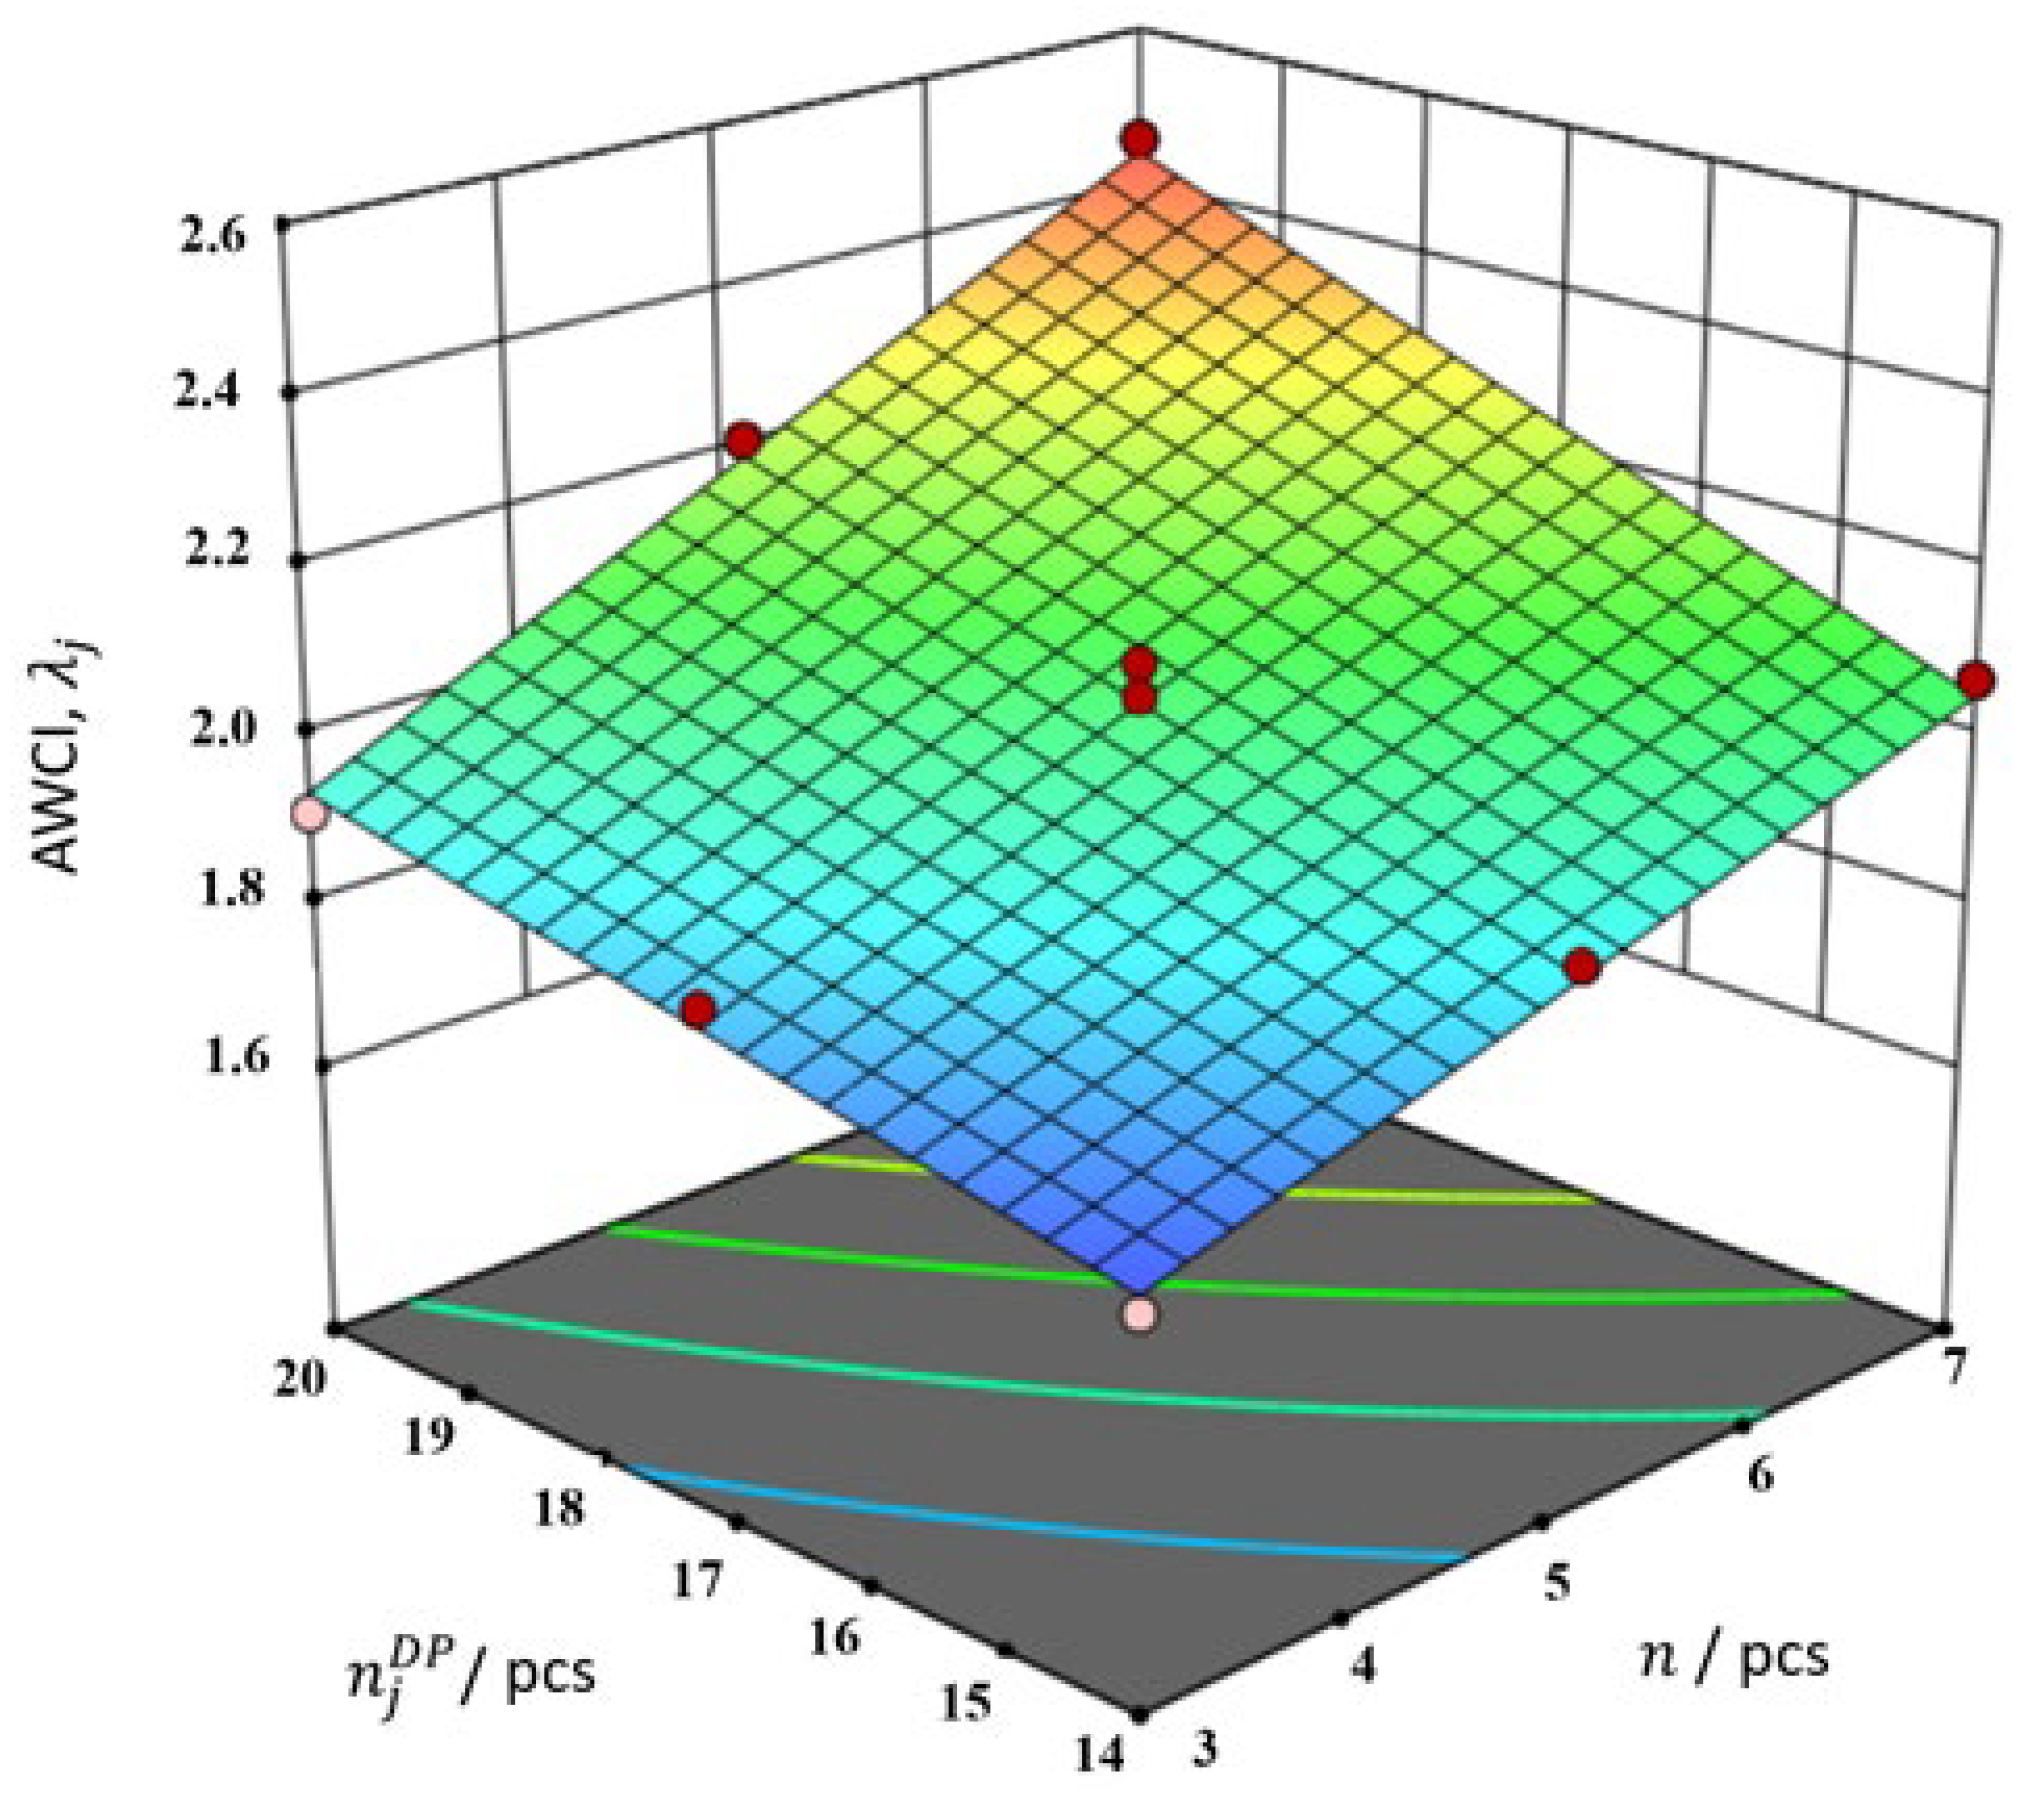
Analysis of variance (ANOVA) confirmed that the regression model is statistically significant ( = 109.29), with all main factors and their interactions making a significant contribution ( < 0.05). The model has high predictive ability ( = 0.9765; the difference between adjusted and predicted is less than 0.02; = 39.2044). The results of the regression analysis indicate that this model is suitable for predicting AWCI. Figure 6 shows the response surface obtained from the regression model, displaying the predicted AWCI values as a function of input parameters at the workstation level. Within the observed experimental range, AWCI values increase as both input parameters increase. Higher AWCI values are associated with greater assembly time deviations from the reference condition, indicating increased assembly complexity at the workstation level. This trend reflects the greater preparation effort required by the operator (i.e., selecting the appropriate parts needed for assembly) and the cognitive load resulting from more diverse work content. The proposed regression model was developed using experiments conducted within a specific range of product and component variety under controlled learning factory conditions. Therefore, the predictive applicability of the model should be interpreted within the investigated experimental domain, while applications outside these conditions require further validation.
Figure 6.
Influence of the input parameters on the AWCI.
3.3. Empirical Evaluation and Sensitivity Analysis of the Proposed AWCI
In the previous section, a mathematical model for AWCI prediction was proposed based on a controlled experiment. To assess the applicability and robustness of this model beyond the calibration data set, this section presents an empirical evaluation through two case studies. The first case study evaluates the model’s predictive accuracy within a defined experimental range using an independent data set. The second case study assesses the robustness and interpretability of the AWCI with respect to operator and product variability.
3.3.1. Case Study 1: Testing the Mathematical Model with Independent Input Data
The first case study was conducted to evaluate the predictive accuracy of the proposed AWCI model using an independent data set. To ensure comparability with the previous experiment, the experiments were conducted on the same workstation, under identical experimental conditions, with the same operator. The experiment included the assembly of four different products consisting of a total of 16 components. The results of the assembly times () for each work element and their standard deviations are shown in Figure 7.
Figure 7.
Actual assembly times and standard deviations (case study 1).
Using the data from Figure 5 and Figure 7, the values and were determined, amounting 22.2 s and 45.2 s, respectively. Two AWCI values () were calculated: 2.03 from Equation (1) and 1.89 from Equation (2). Comparison of these values indicates that the developed model provides a good approximation of assembly complexity within the observed range, with a deviation of approximately 7%, which is considered acceptable for experimental validation under controlled conditions.
3.3.2. Case Study 2: Sensitivity Analysis of the AWCI to Operator and Product Variability
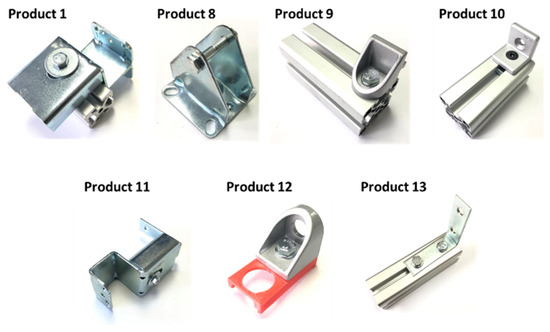
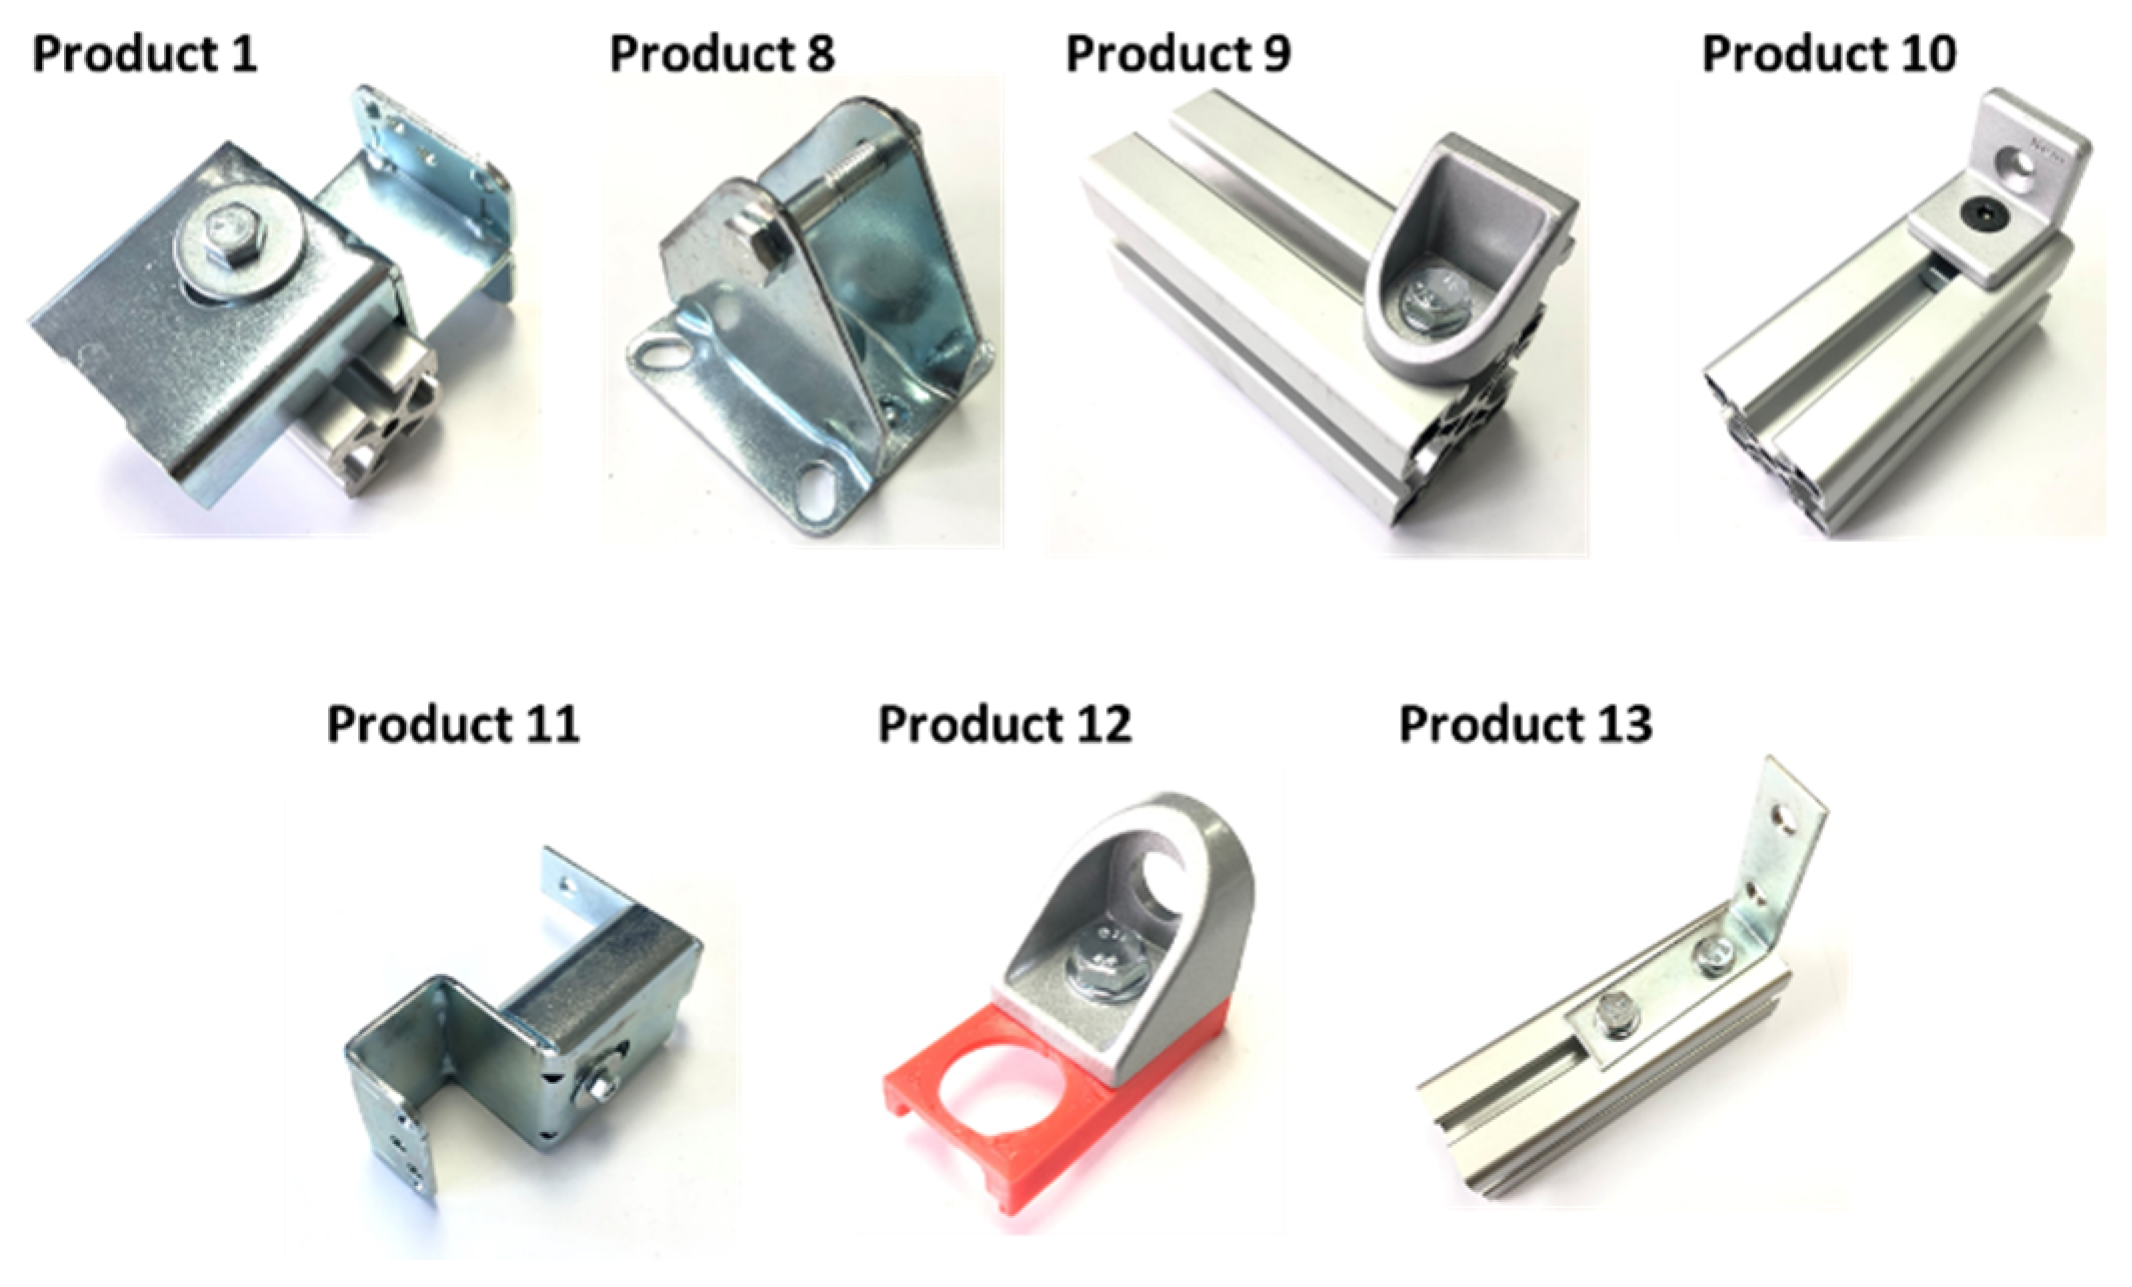
The second case study examines whether the AWCI maintains a stable trend when applied to a different product set and multiple operators. The experiments were conducted under the same conditions as previous experiments, but with a new group of products, from the same product family, that are less visually similar in their final form (see Figure 8). These products are characterized by greater variability in structure and work content compared to products in previous experiments. Three different operators participated in the experiments to assess the sensitivity of the AWCI to operator-related variability.
Figure 8.
Products in case study 2.
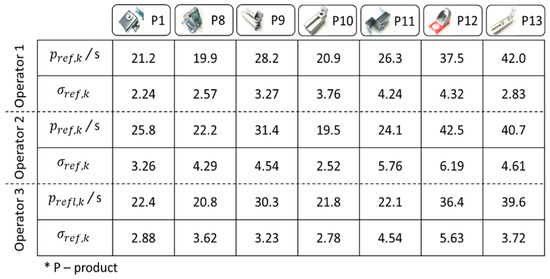
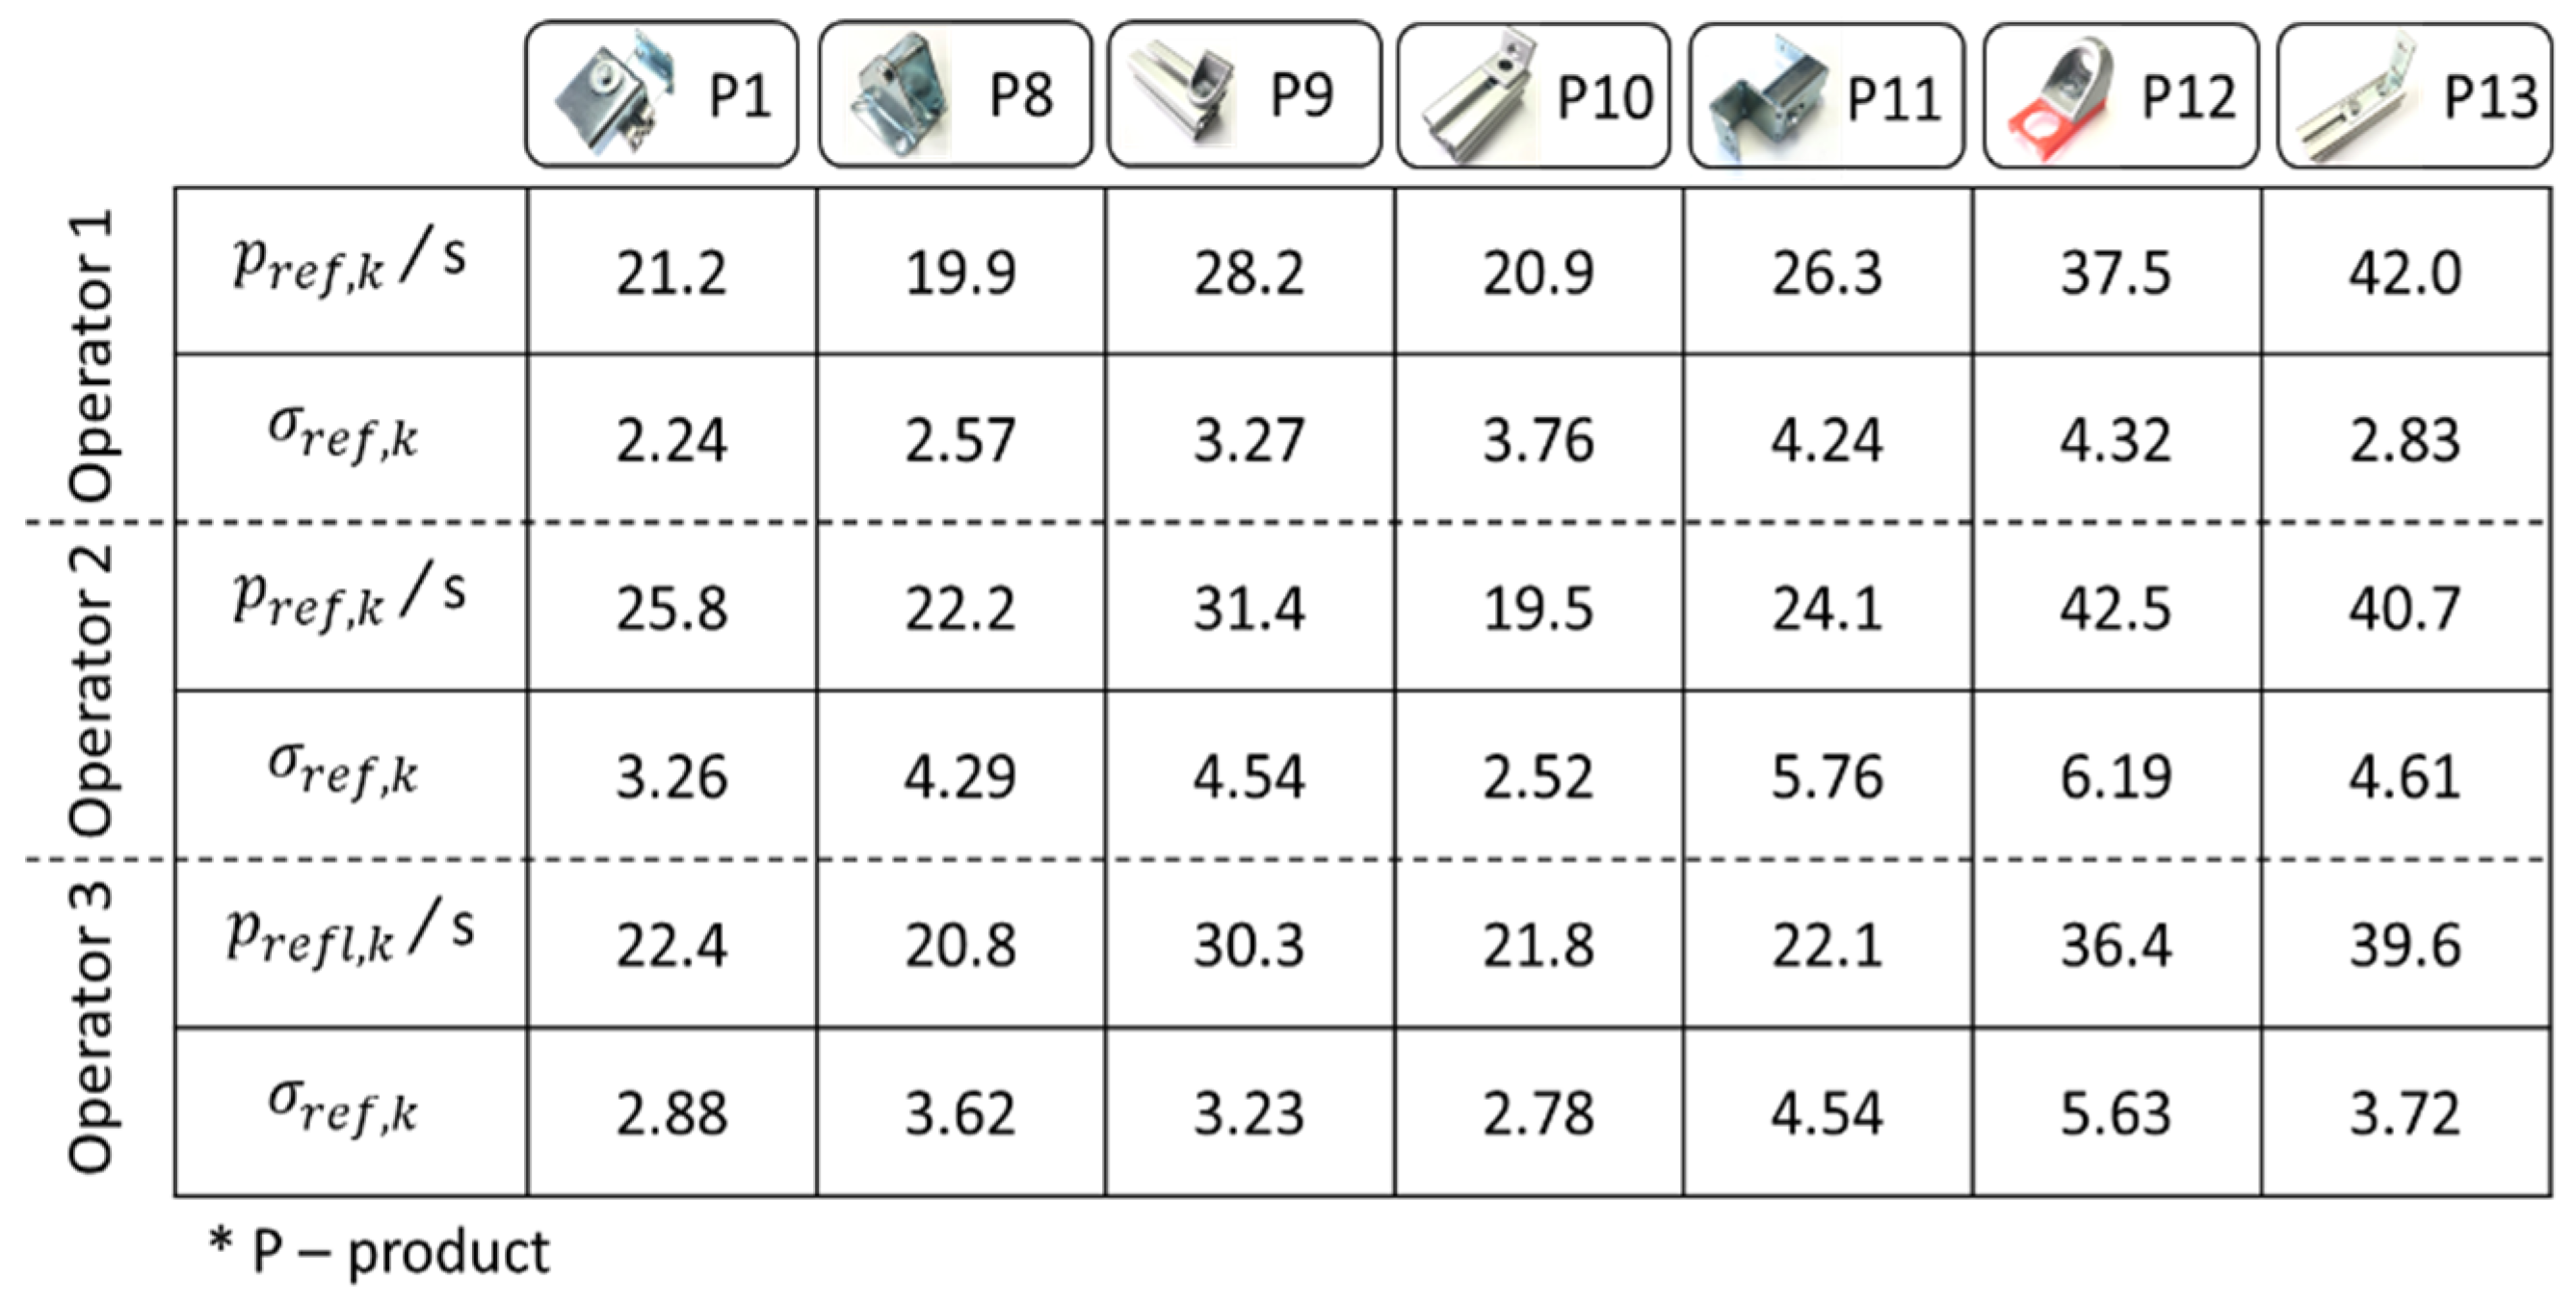
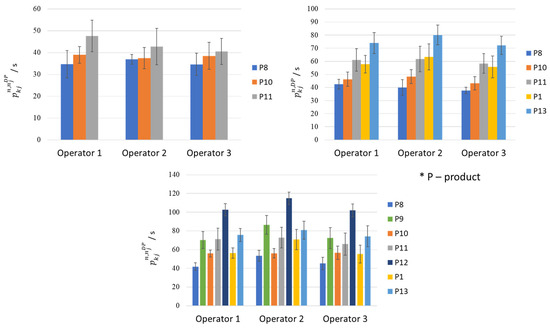
First, each operator performed 210 experiments (1 experiment = 1 product assembly), corresponding to 30 assemblies for each of the seven products. These experiments were used to calculate the average reference assembly time for each product and operator. The resulting reference values and their standard deviations are shown in Figure 9.
Figure 9.
Reference assembly times and standard deviations for different operators.
Results from Figure 9 indicate that the reference assembly times depend on the individual resourcefulness of the operator, such as their experience and interpretation of the instructions, with a variation of ±15% between operators. For all operators, the longest times were reported for Product 13 (the most components) and Product 12 (the most complex process).
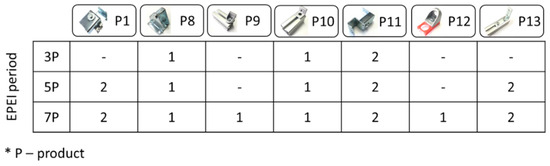
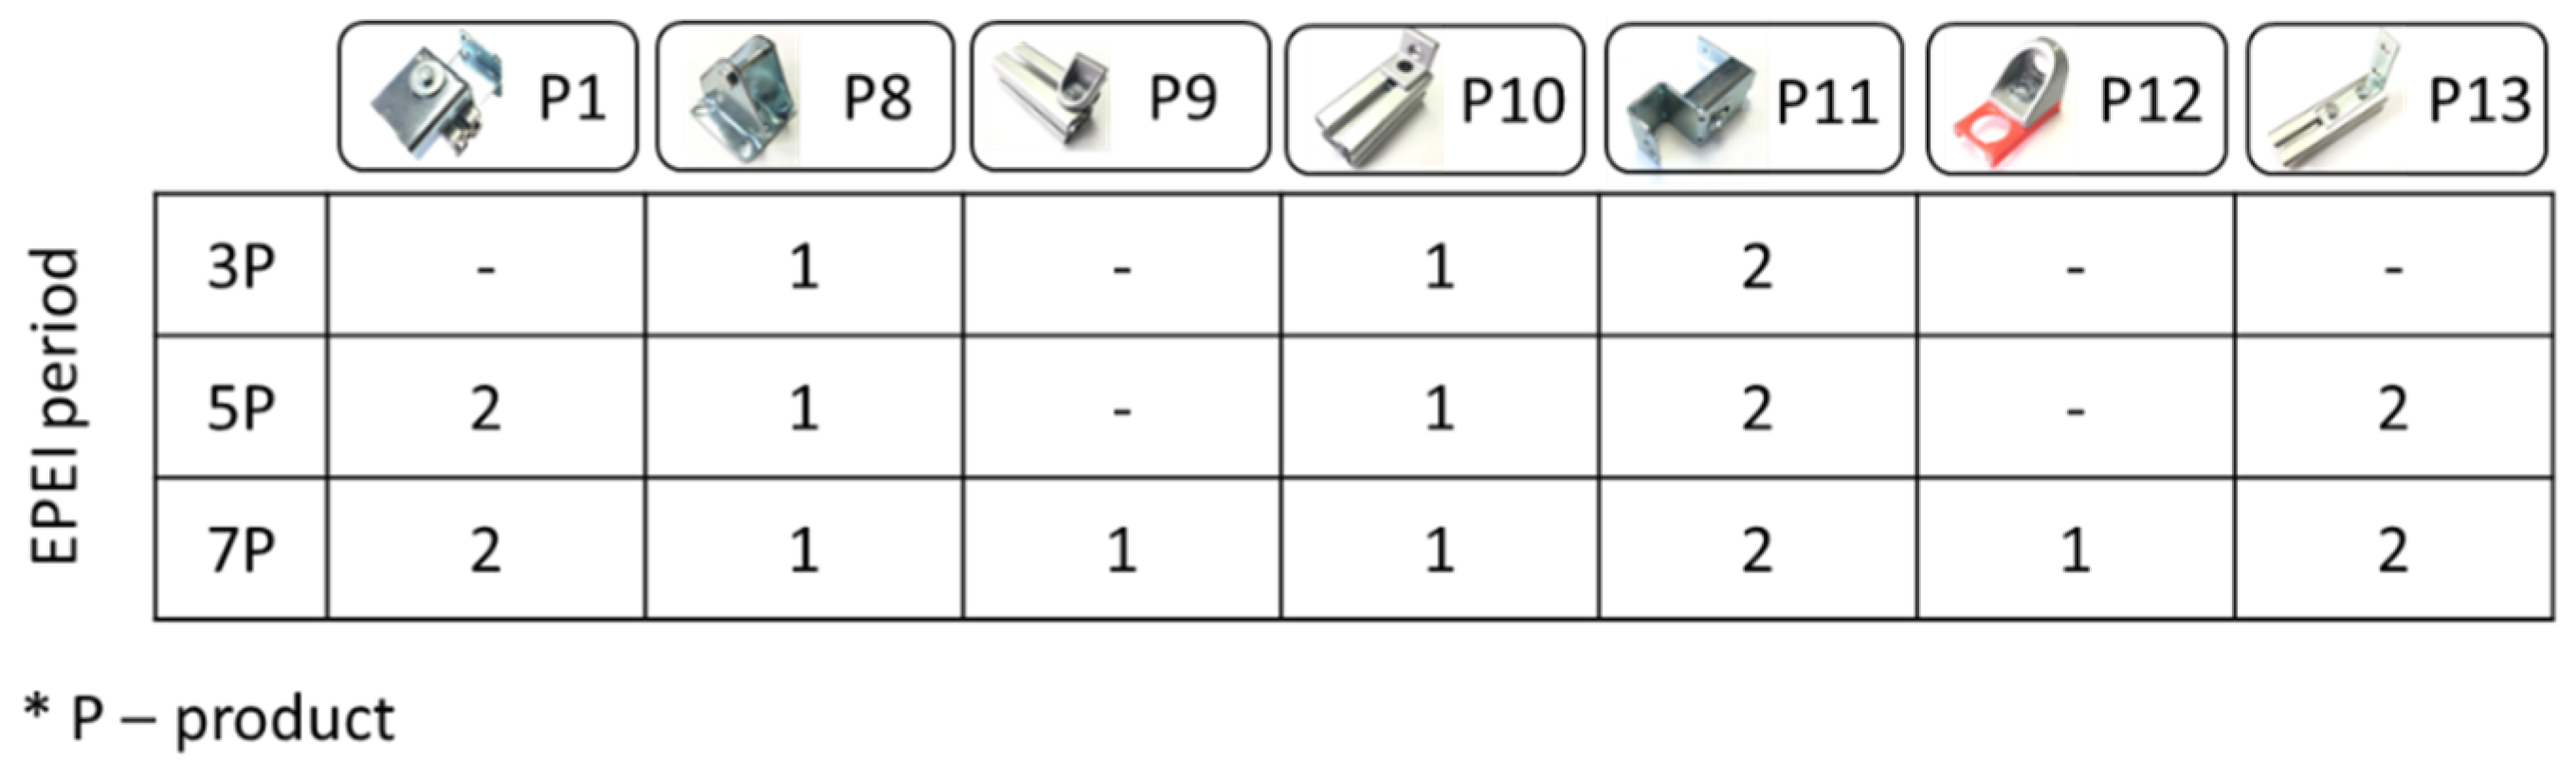
Second, additional experiments were conducted to measure the actual assembly times of operators for different product samples defined by the EPEI sequence. For each operator and product sample, a sufficient number of repeated assemblies was performed to ensure stable average values and minimize the influence of the learning effect. The defined EPEI period and the product sample at the workstation are shown in Figure 10.
Figure 10.
Product sequences defined through EPEI (case study 2).
The results of actual assembly times for each operator for different product samples are shown in Figure 11.
Figure 11.
Actual assembly times of operators per product sample.
The analysis of the data presented in Figure 11 reveals two main observations. First, the relative distribution of assembly times for the different products within the product sample is similar across all operators. Second, an increase in product and component variety results in longer assembly times for individual products for all operators. This effect can be attributed to higher preparation effort, increased part selection possibilities, and greater cognitive load associated with frequent changes in work content.
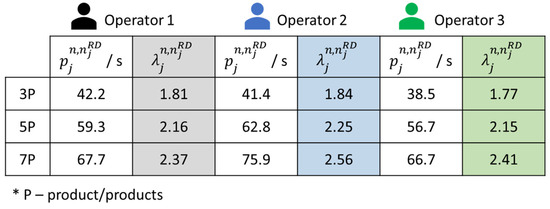
Based on the experiments conducted, the average product assembly times for the product sample were calculated, and the AWCI values were determined using Equation (1). These results are shown in Figure 12.
Figure 12.
AWCI for different operators.
The results of the second case study show that, despite differences in absolute assembly times between operators, the AWCI values remain within a narrow range. For all three operators, a similar trend of increasing AWCI values with increasing product and component variety at the workstation was observed, with deviations between operators not exceeding ±10%. This variability can be attributed to the individual psychophysical characteristics of the operators. Although the reference assembly times differ between operators (with deviations of ±15%), the relative relationship between the levels of complexity remains consistent, confirming the suitability of the AWCI for comparing workstation complexity, demonstrating a high degree of independence from the operators’ absolute performance within the studied sample. In addition, the mathematical model expressed by Equation (2) was used to predict the AWCI values for a sample of five products (5P), since it, considering the number of different components, falls within the experimental range used in the model’s development. The predicted AWCI index value is 2.19. Comparing the empirically calculated AWCI values obtained by Equation (1) for three different operators (Figure 12) shows that the predicted value is within the range of the measured values and close to their central value. This suggests that the mathematical model provides a representative estimate of the assembly complexity for the observed workstation configuration.
4. Relationship Between Assembly Complexity, Assembly Line Balancing and Productivity: Findings from the Case Study
After defining and empirically evaluating the AWCI indicator at the workstation level, the next chapter examines its relationship with assembly line performance. In practice, decisions about assembly line balancing directly affect the distribution of work content, the level of complexity at workstations, and consequently, system productivity. This chapter aims to analyze the interrelationship between assembly complexity, assembly line balancing, and productivity, using the AWCI indicator as a quantitative measure of complexity. To conduct this analysis, a case study was performed on a real industrial product in an LF environment. The case study observed how changes in the distribution of work elements and the level of line balancing affect workstation complexity and assembly line productivity. The results show that AWCI can serve as a support tool for analyzing and comparing different solutions for balancing assembly lines, especially in the context of finding a compromise between high line balancing and an acceptable level of productivity.
4.1. Procedure for Mixed-Model Assembly Line Balancing
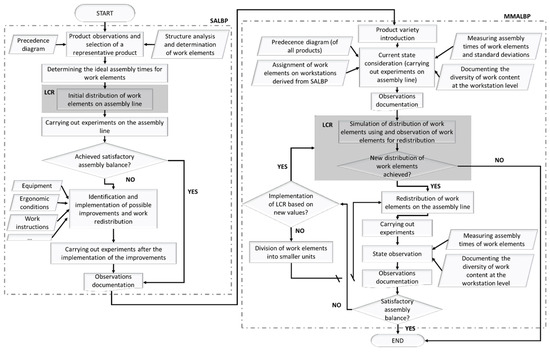
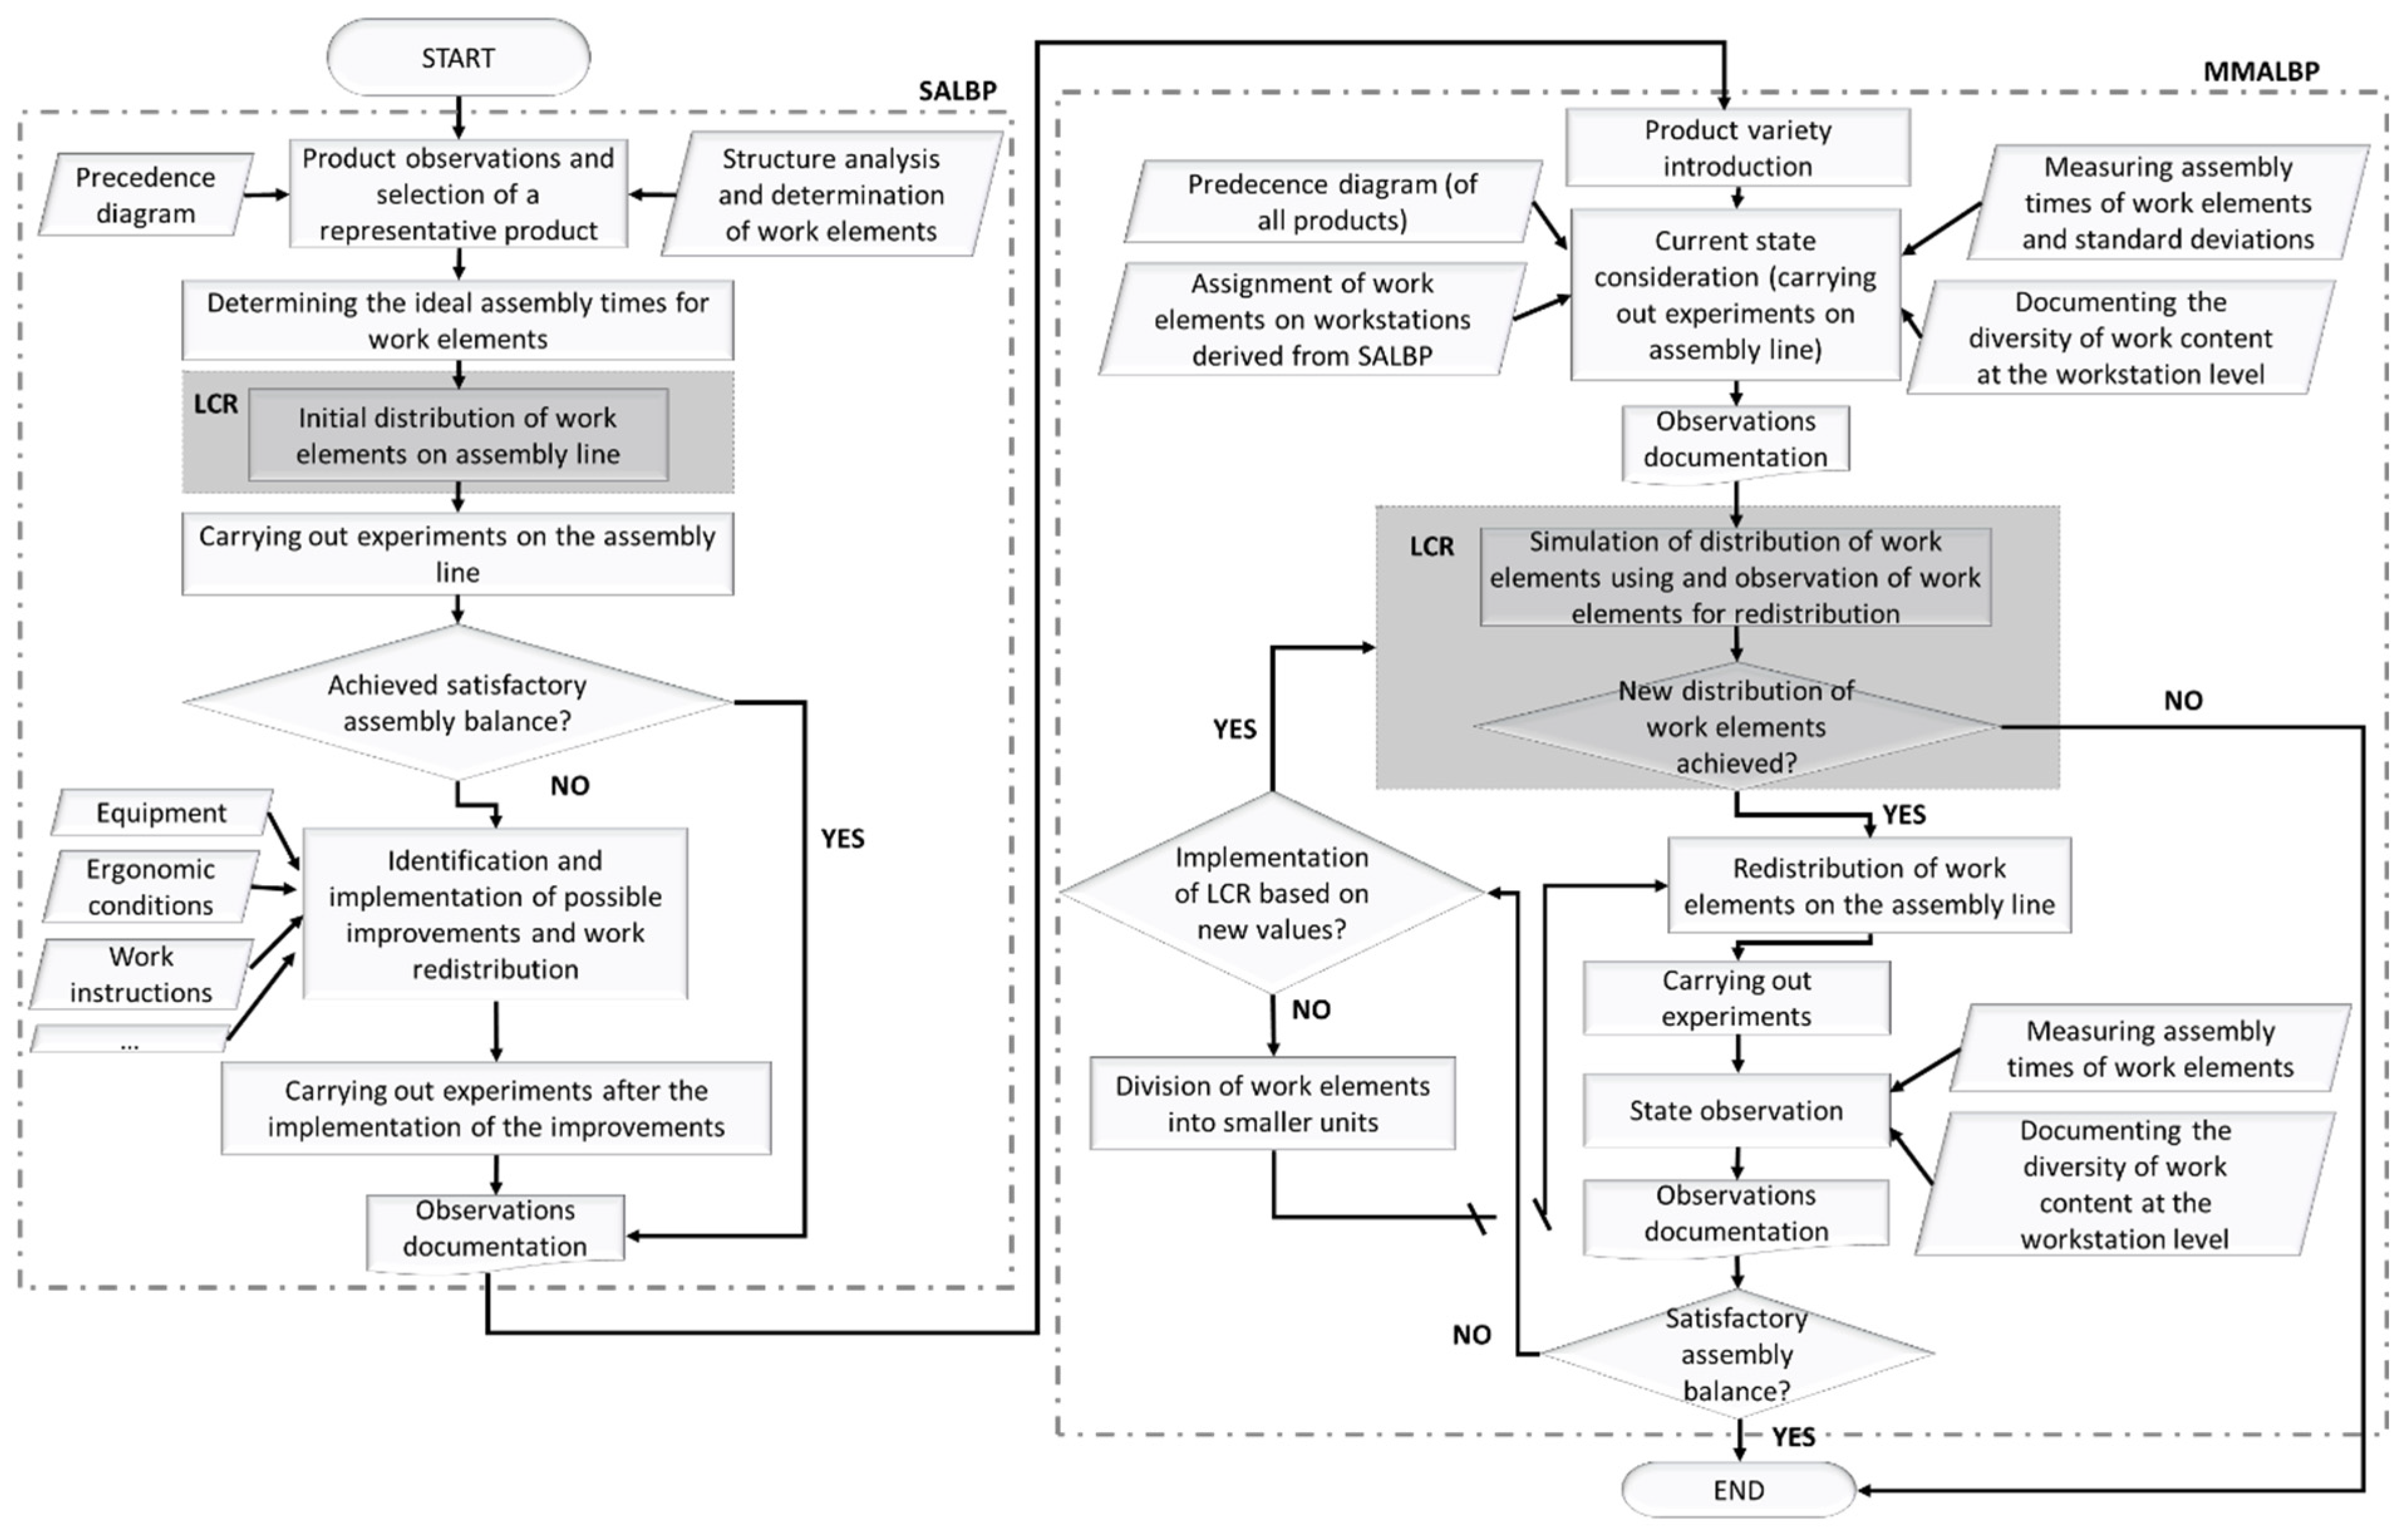
The MMAL balancing procedure used in this case study follows the two-step balancing approach shown in Figure 13. In the first step, the assembly line for a single product is balanced (SALBP). The most complex product in the observed product family, defined as the product with the largest number of different work elements, was selected as the representative product. Based on its structure, the work elements were defined, their reference assembly times determined, and the initial balancing of the assembly line was performed using the Largest Candidate Rule (LCR). The goal of this step was to achieve an acceptable load distribution among the workstations under conditions of minimal variety.
Figure 13.
Balancing procedure.
In the second step, product variety is introduced into the balanced assembly line. Introducing variety into an assembly line balanced for a single product is expected to make the previous load distribution unsatisfactory, as the variety of products, components, and assembly instructions increases. As a result, the previously achieved balance is no longer sufficient, and it becomes necessary to redistribute the work elements among the workstations [50]. The balancing procedure shown in Figure 13 is iterative. It involves repeatedly applying the LCR method to experimentally obtained data from a real assembly line until an acceptable level of balance is achieved. All experimental observations used in this case study for balancing and rebalancing were conducted after sufficient repetitions to ensure stable assembly times and minimize the influence of operator learning effects.
4.2. Gearbox Case Study: Setup and Implementation of the Proposed Procedure
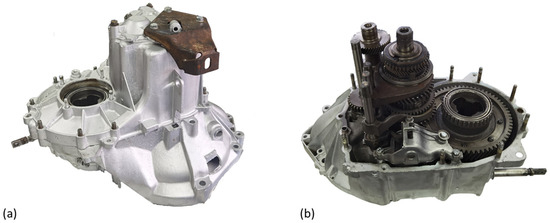
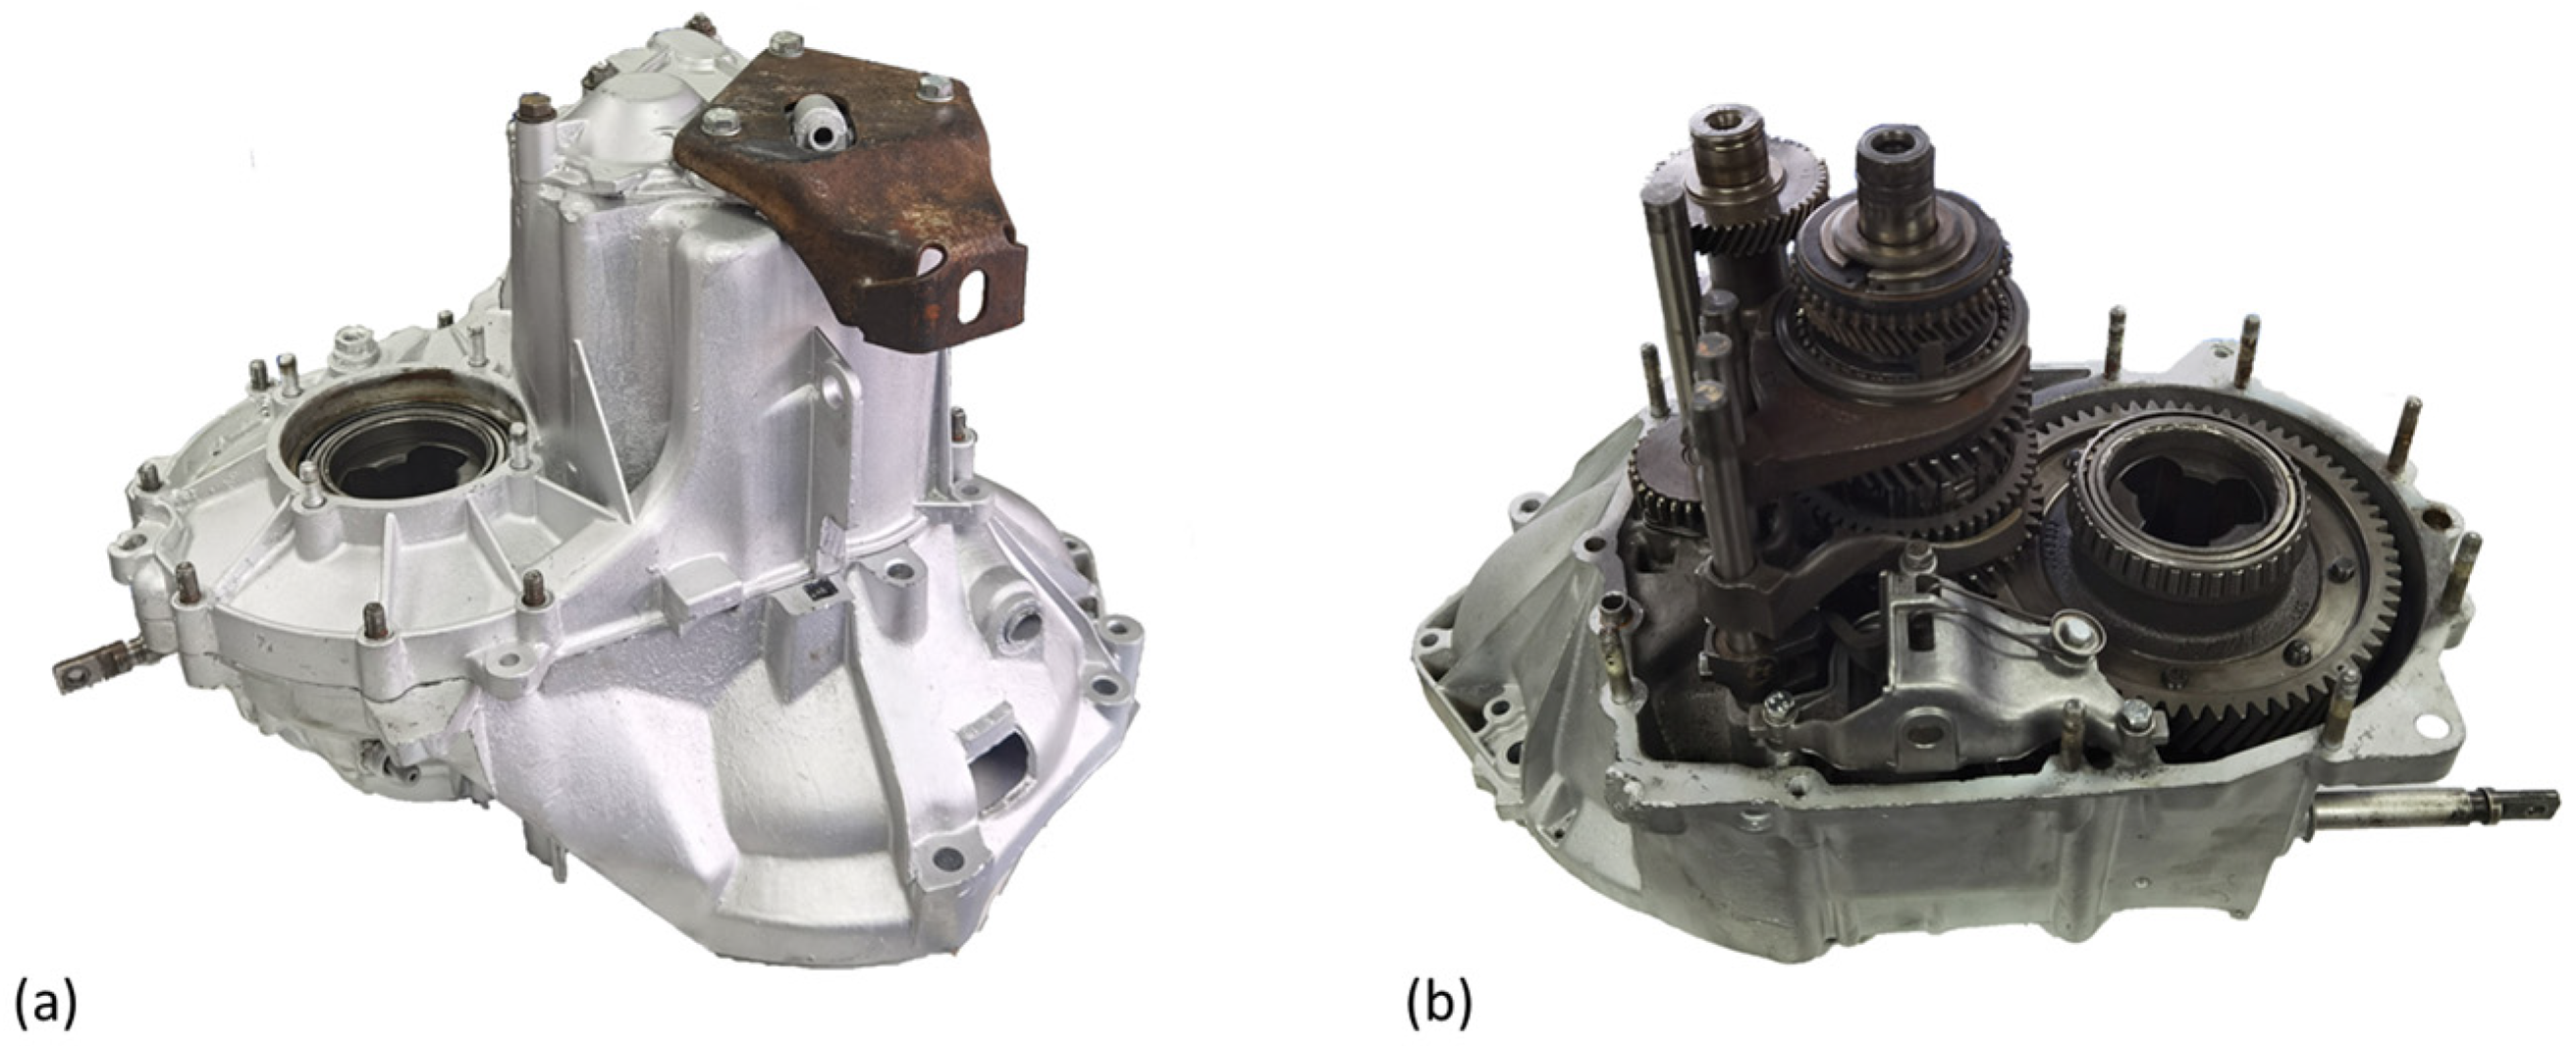
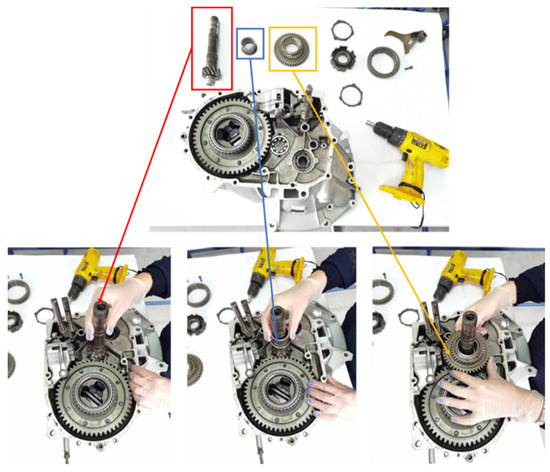
The assembly line used for this case study is a manual gearbox assembly line. The observed gearbox product family consists of a large number of different products, but for the purpose of this study, three arbitrarily selected gearboxes were considered: YZS, YAS and SZN. An example of the appearance of a YZS gearbox is shown in Figure 14. The first letter in the gearbox designation refers to the type of casting (Y or S), the second to the type of synchronization (A or Z) and the third letter to the type of upper housing cover and the associated mounting parts (N or S).
Figure 14.
YZS gearbox (a) external appearance, (b) internal appearance.
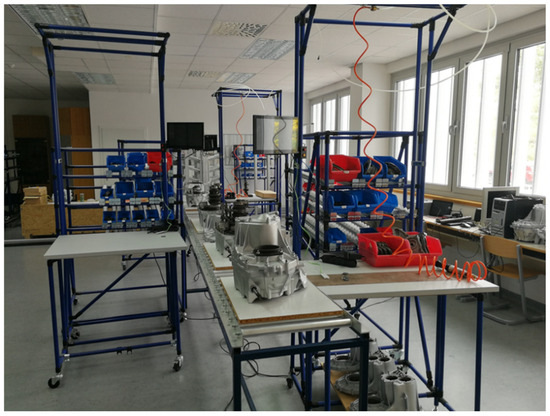
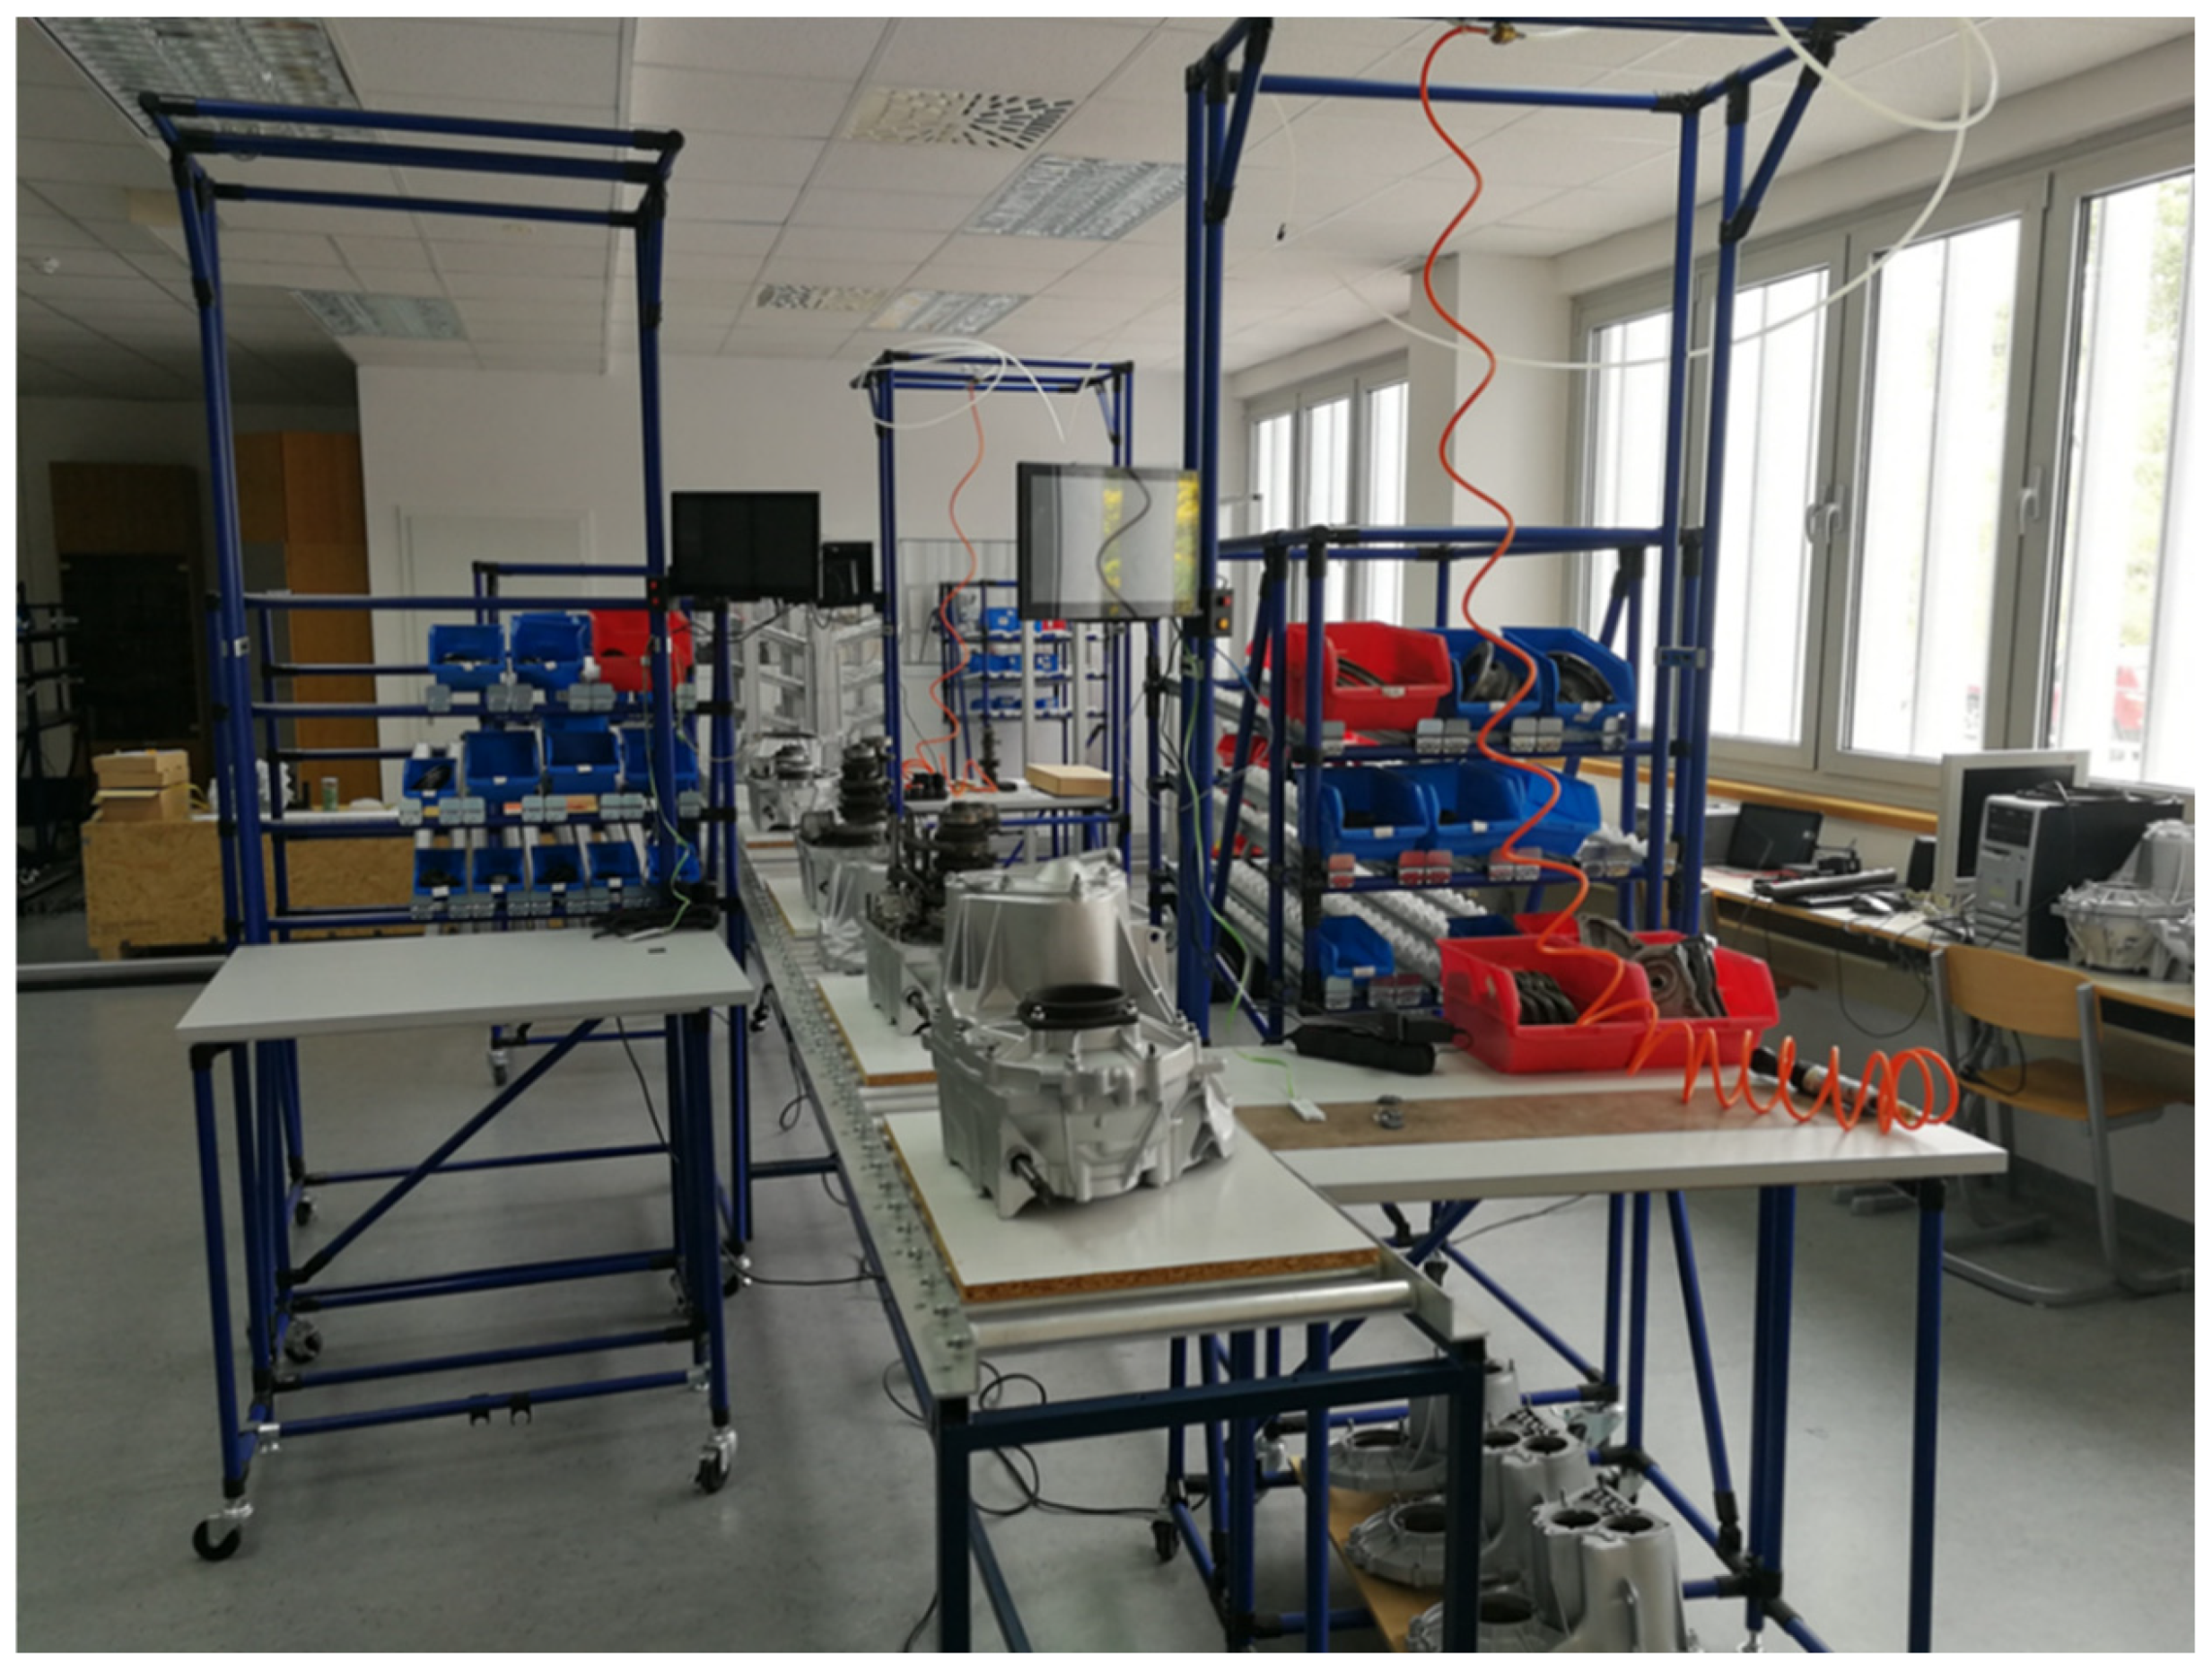
The manual assembly line represents the “I” line with a conveyor belt. A conveyor transports sub-assemblies between workstations to reduce physical strain on operators and improve both physical and mental well-being. Physical strain refers to the effort required to carry heavy sub-assemblies from one workstation to another. Due to space limitations when installing the conveyor belt in the LF, the assembly line consists of five workstations. Each workstation (WS) is designed for one operator and is equipped with work instructions, a supermarket, and the necessary tools. Therefore, this case study involved five operators working under identical process conditions. Figure 15 shows a schematic representation of the gearbox assembly line.
Figure 15.
Gearbox assembly line in LF environment.
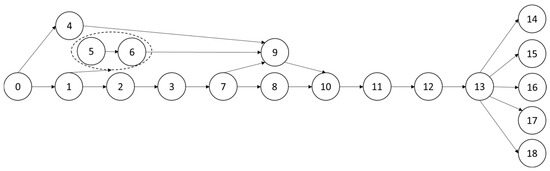
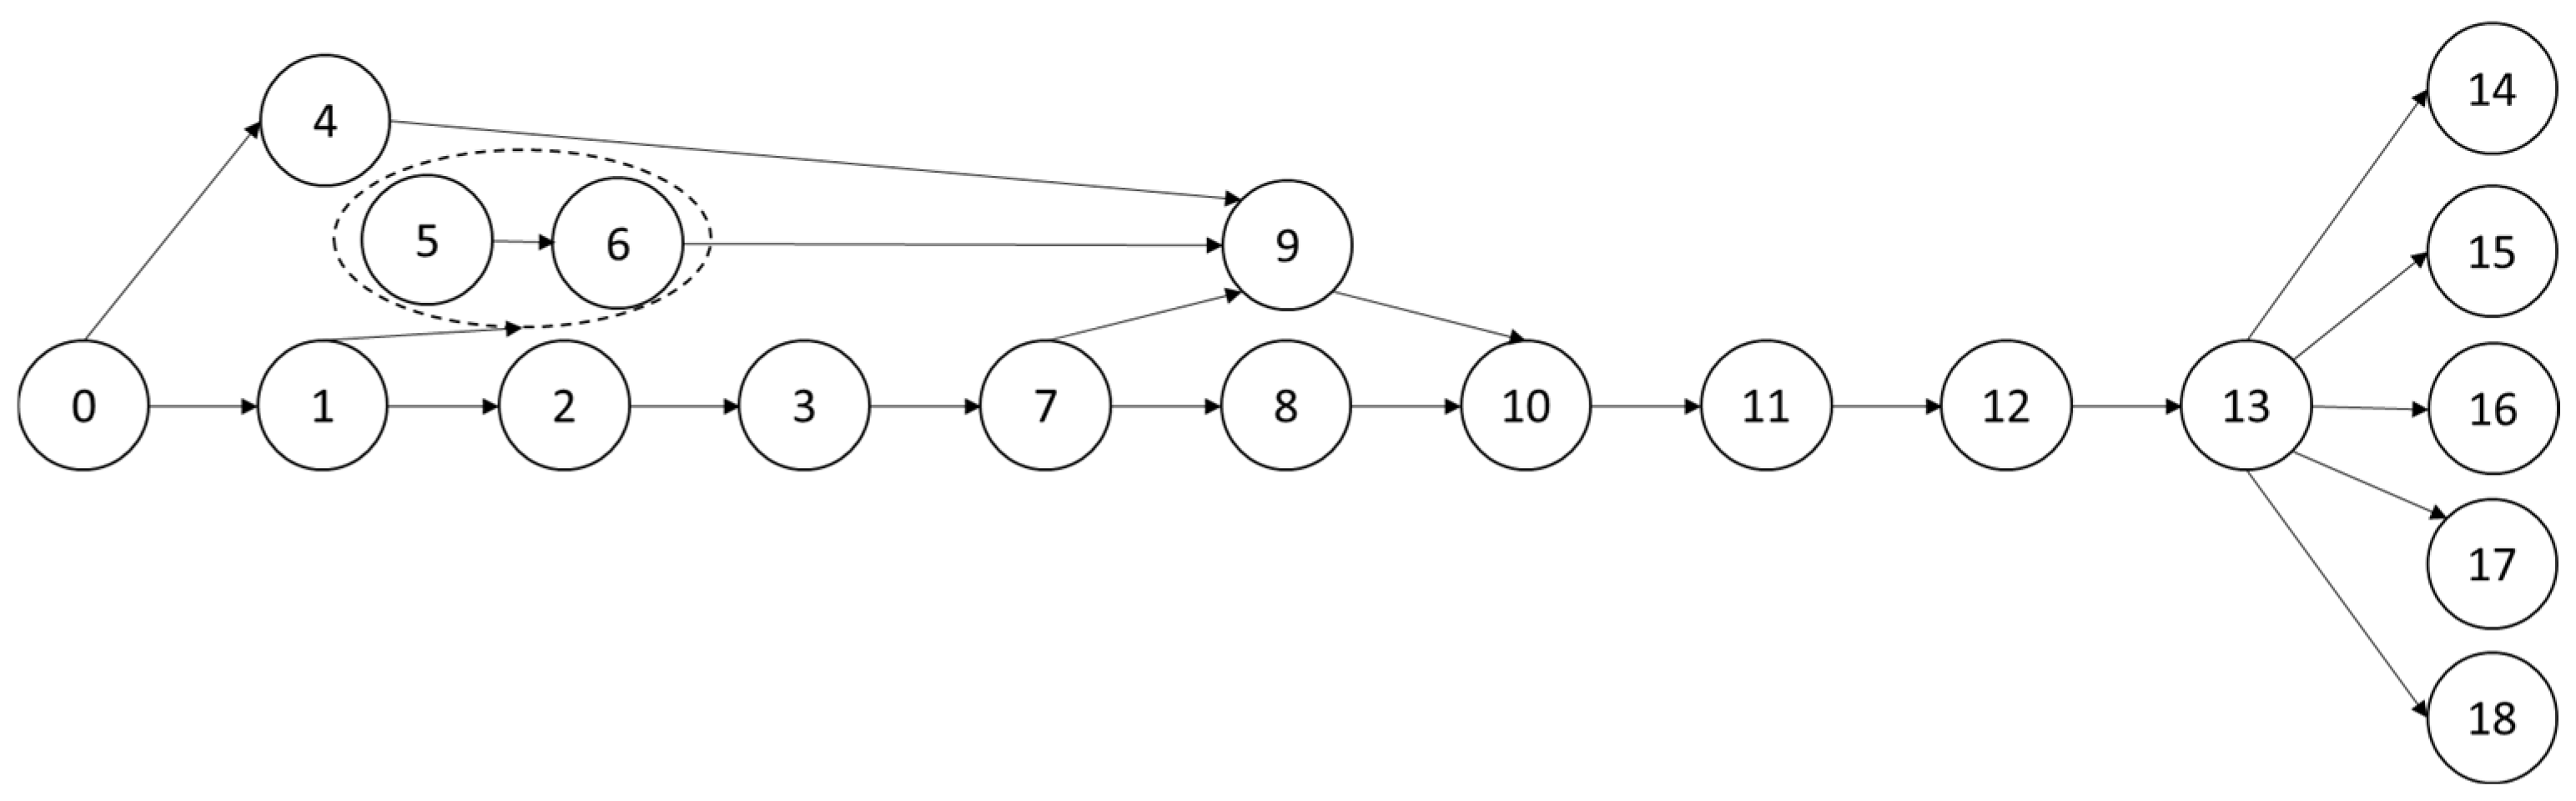
The starting point for the balancing procedure is the analysis of product structures to define the work elements. The most complex product in the group, the YZS gearbox, was used as a representative example. The assembly precedence diagram, which defines 18 work elements for the YZS gearbox, is shown in Figure 16. Work elements in a dashed ellipse are elements that must be assembled at the same workstation. The circle marked with zero refers to the lower part of the case, i.e., the base part of the product.
Figure 16.
YZS assembly precedence diagram.
This configuration served as the basis for single product line balancing and the subsequent introduction of product variety, described in the following sections.
4.2.1. Initial Balancing of the Assembly Line—SALBP
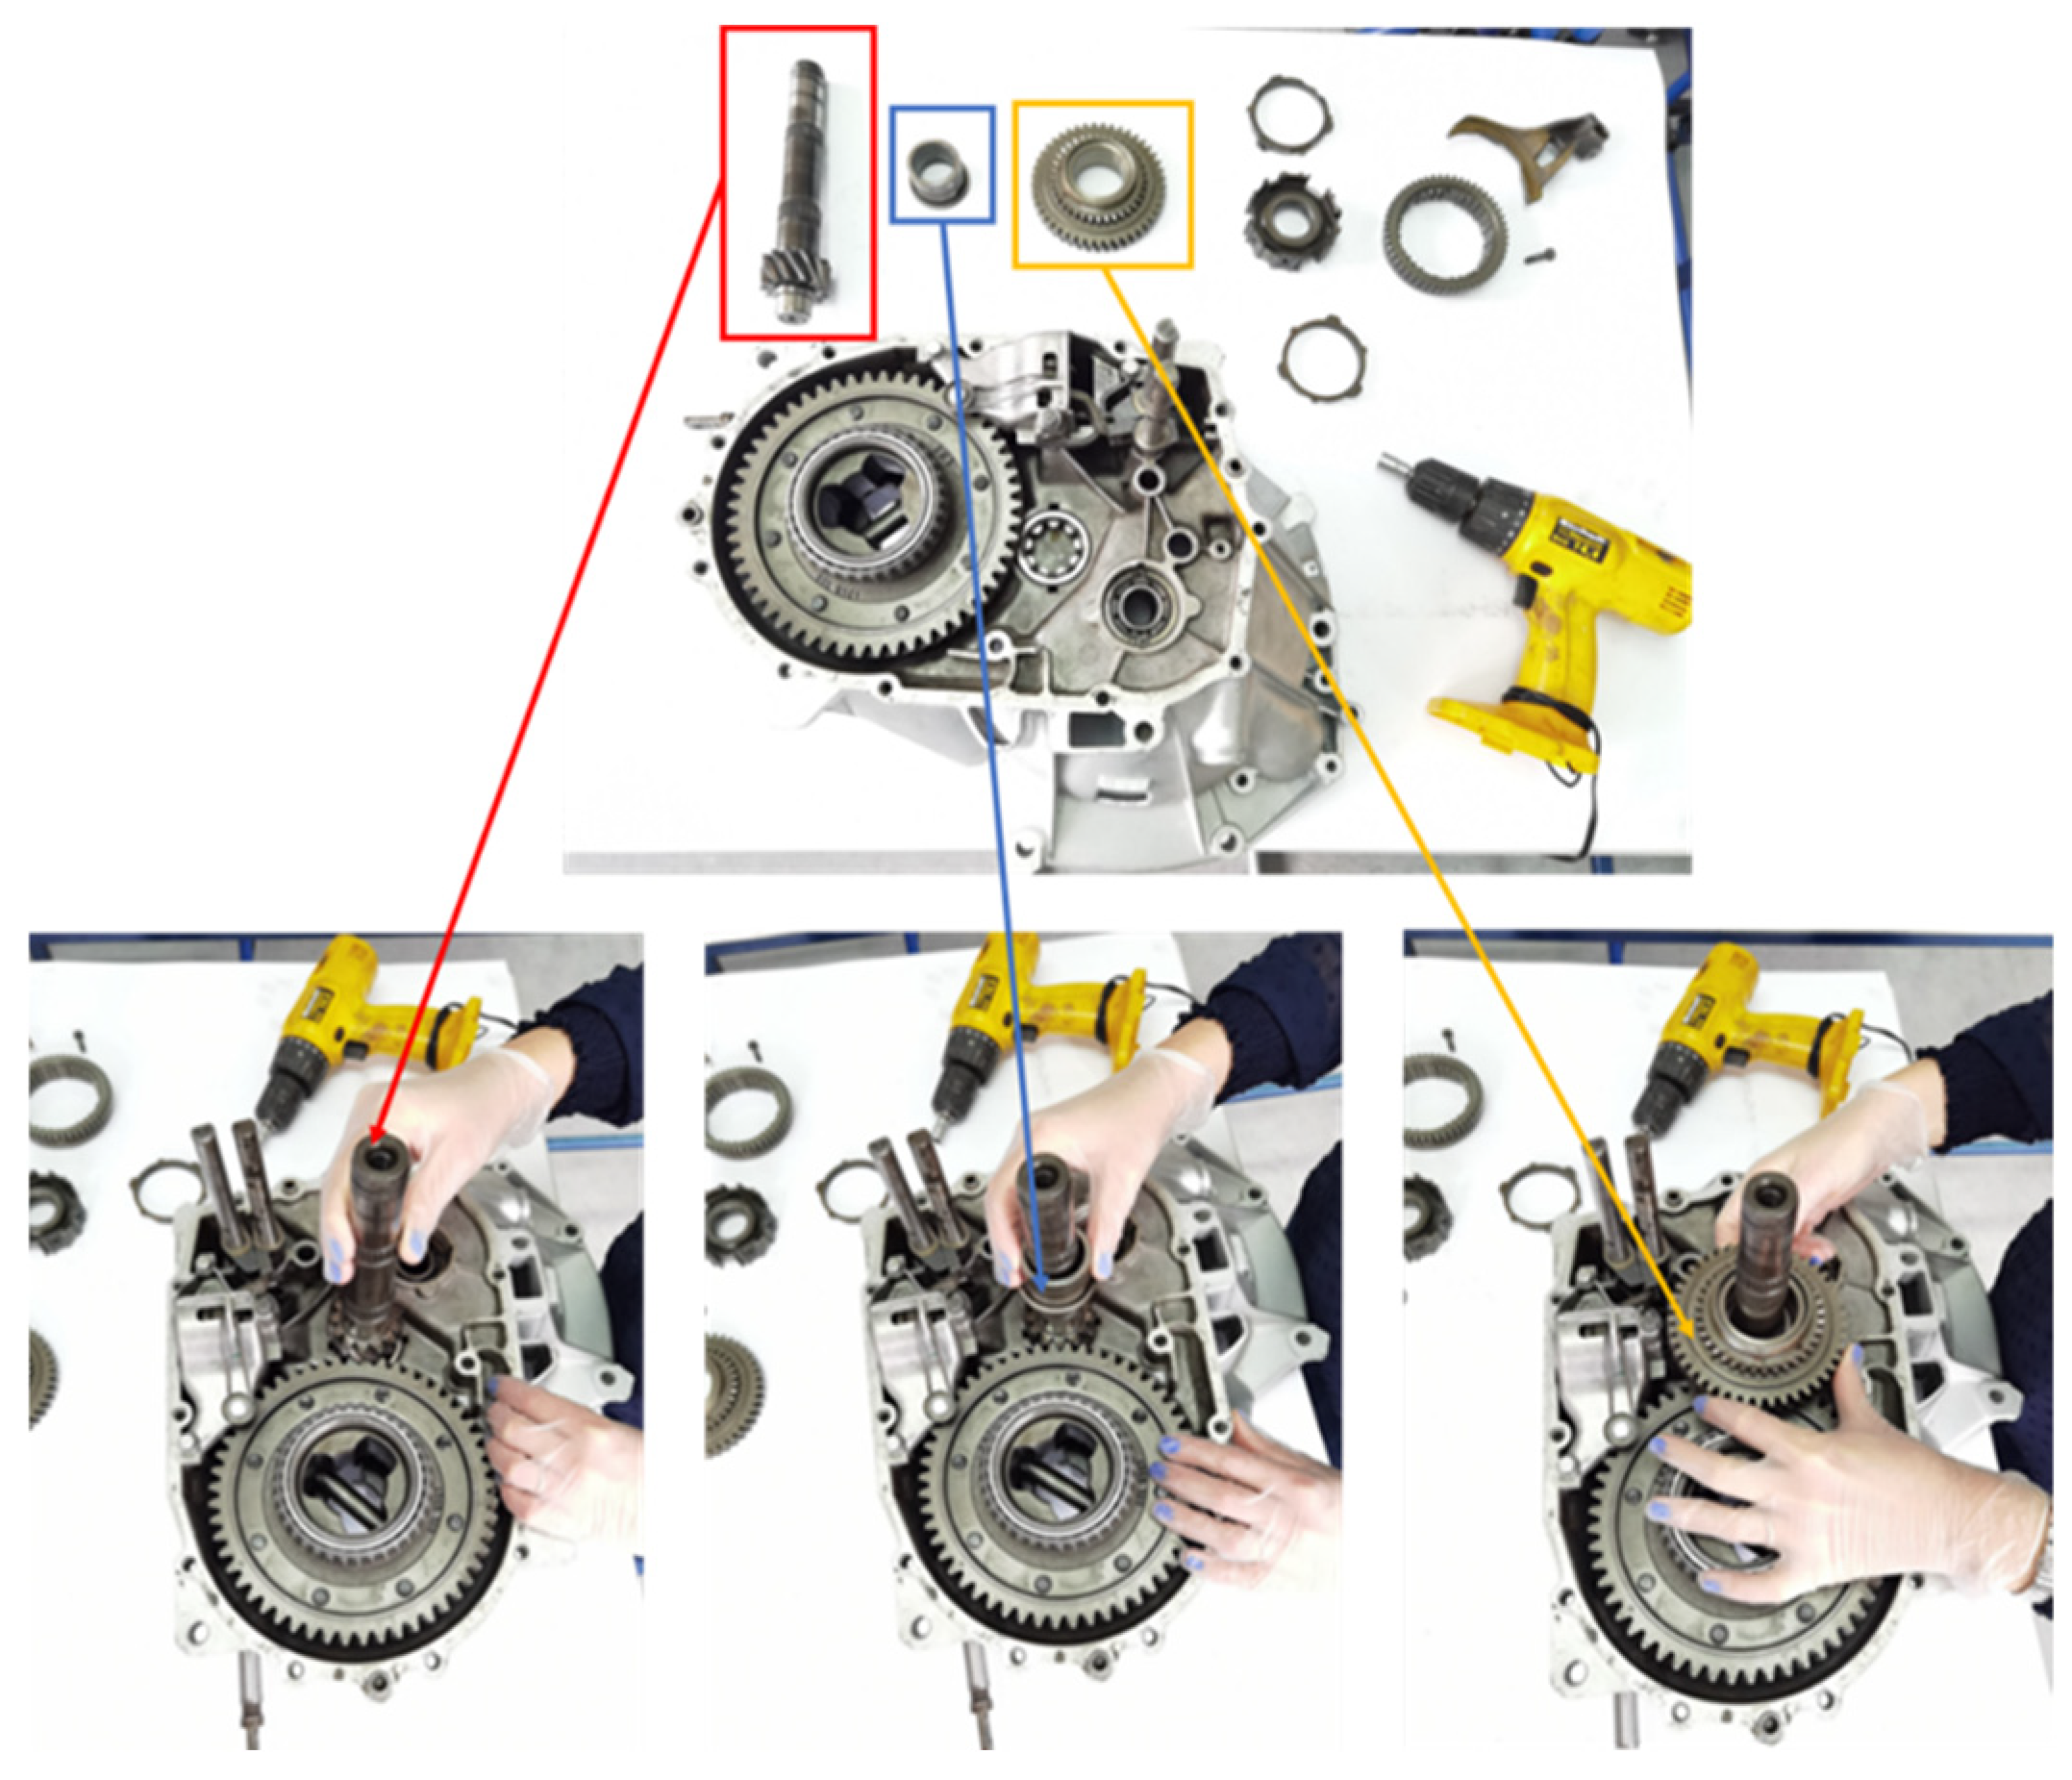
To balance the assembly line for a single product (YZS gearbox), the reference assembly time for each work element is determined experimentally. Figure 17 shows an example of the arrangement of the required assembly parts and tools at the workstation for assembling work element 9 when determining the reference assembly time.
Figure 17.
Workstation setup for work element 9.
For each work element, a sufficient number of test runs was conducted to ensure stabilization of assembly times and statistical reliability of the measured averages. The required number of repetitions was determined according to established time-study procedures [51]. The obtained values of the reference average assembly times with their standard deviations are shown in Table 3.
Table 3.
Reference assembly times of work elements and their standard deviations.
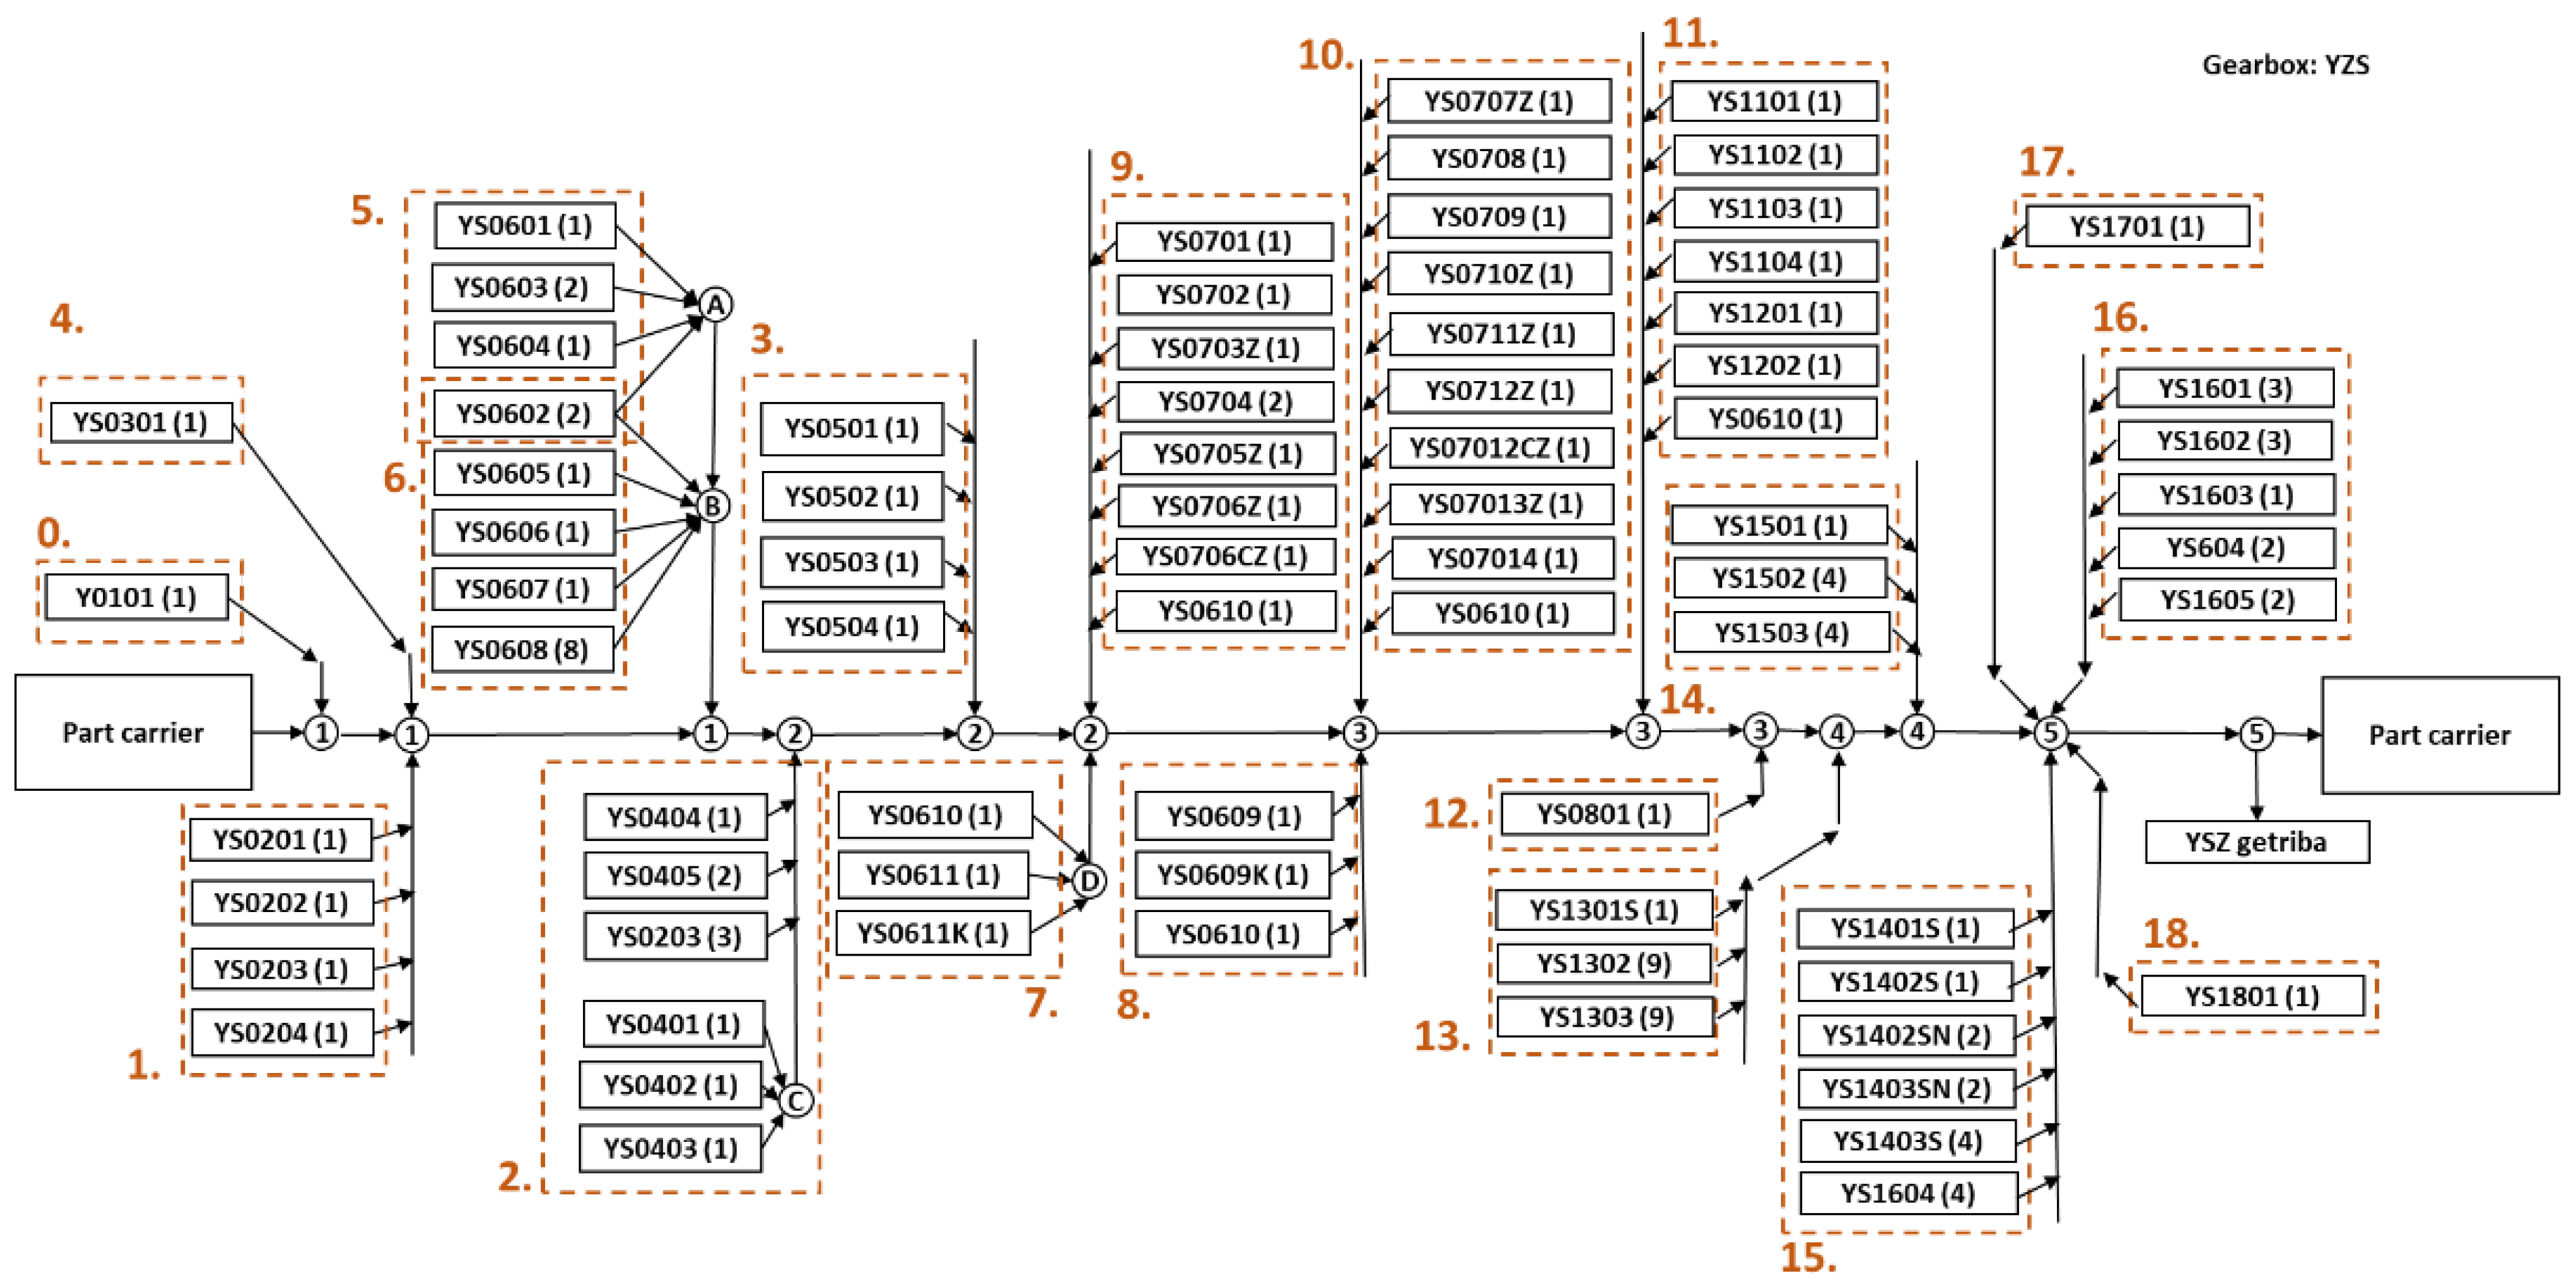
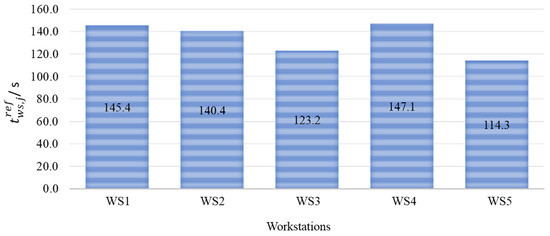
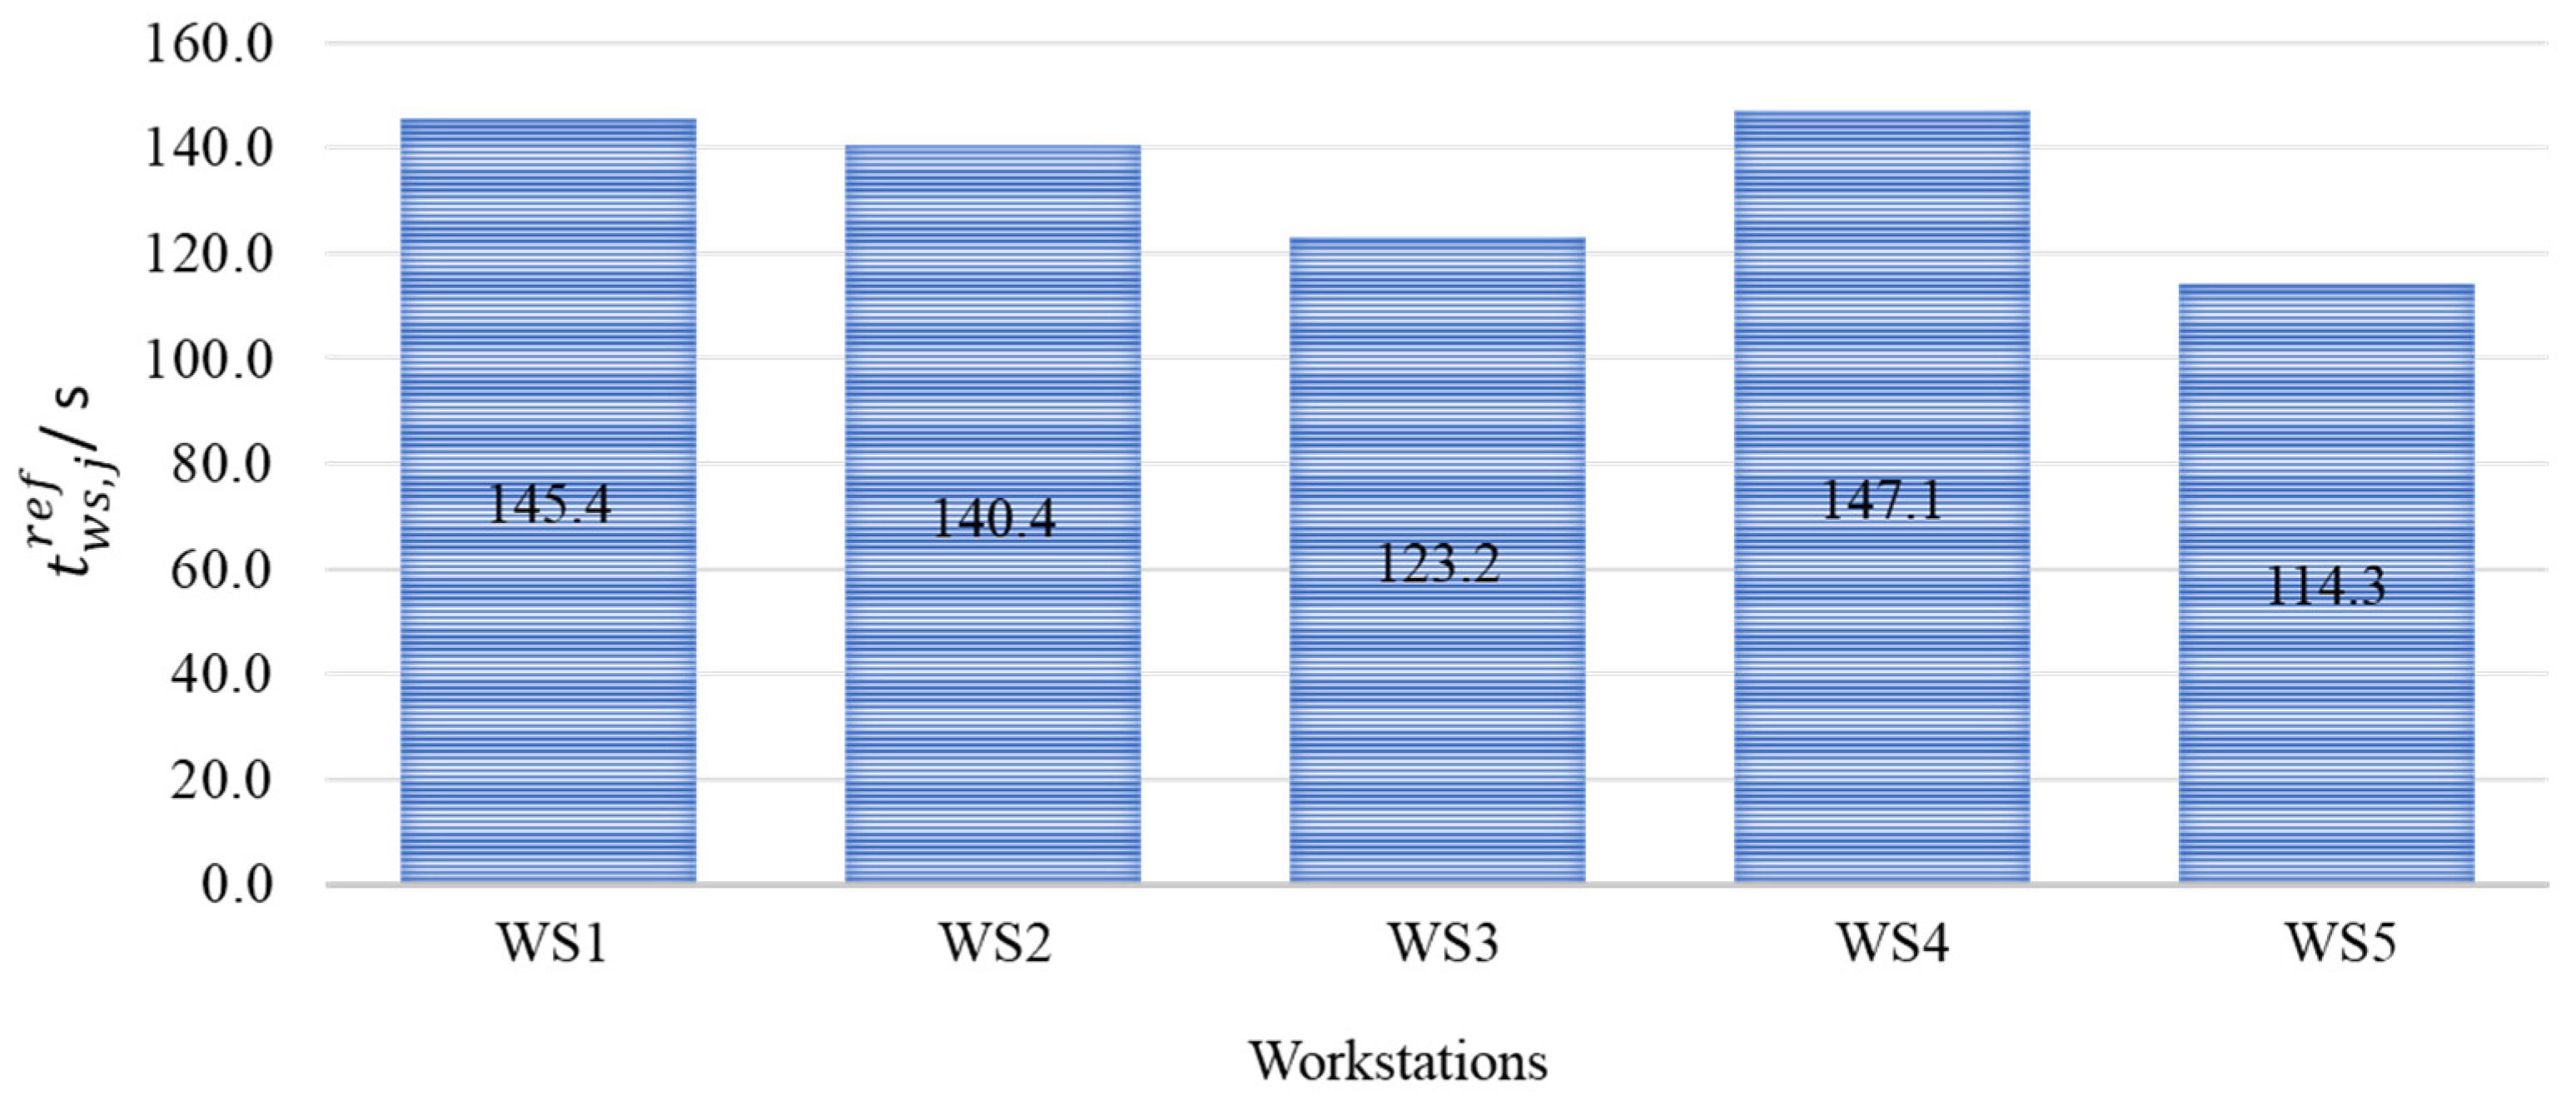
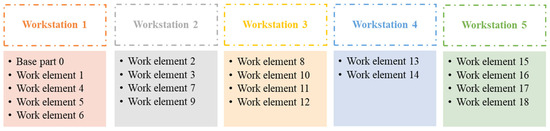
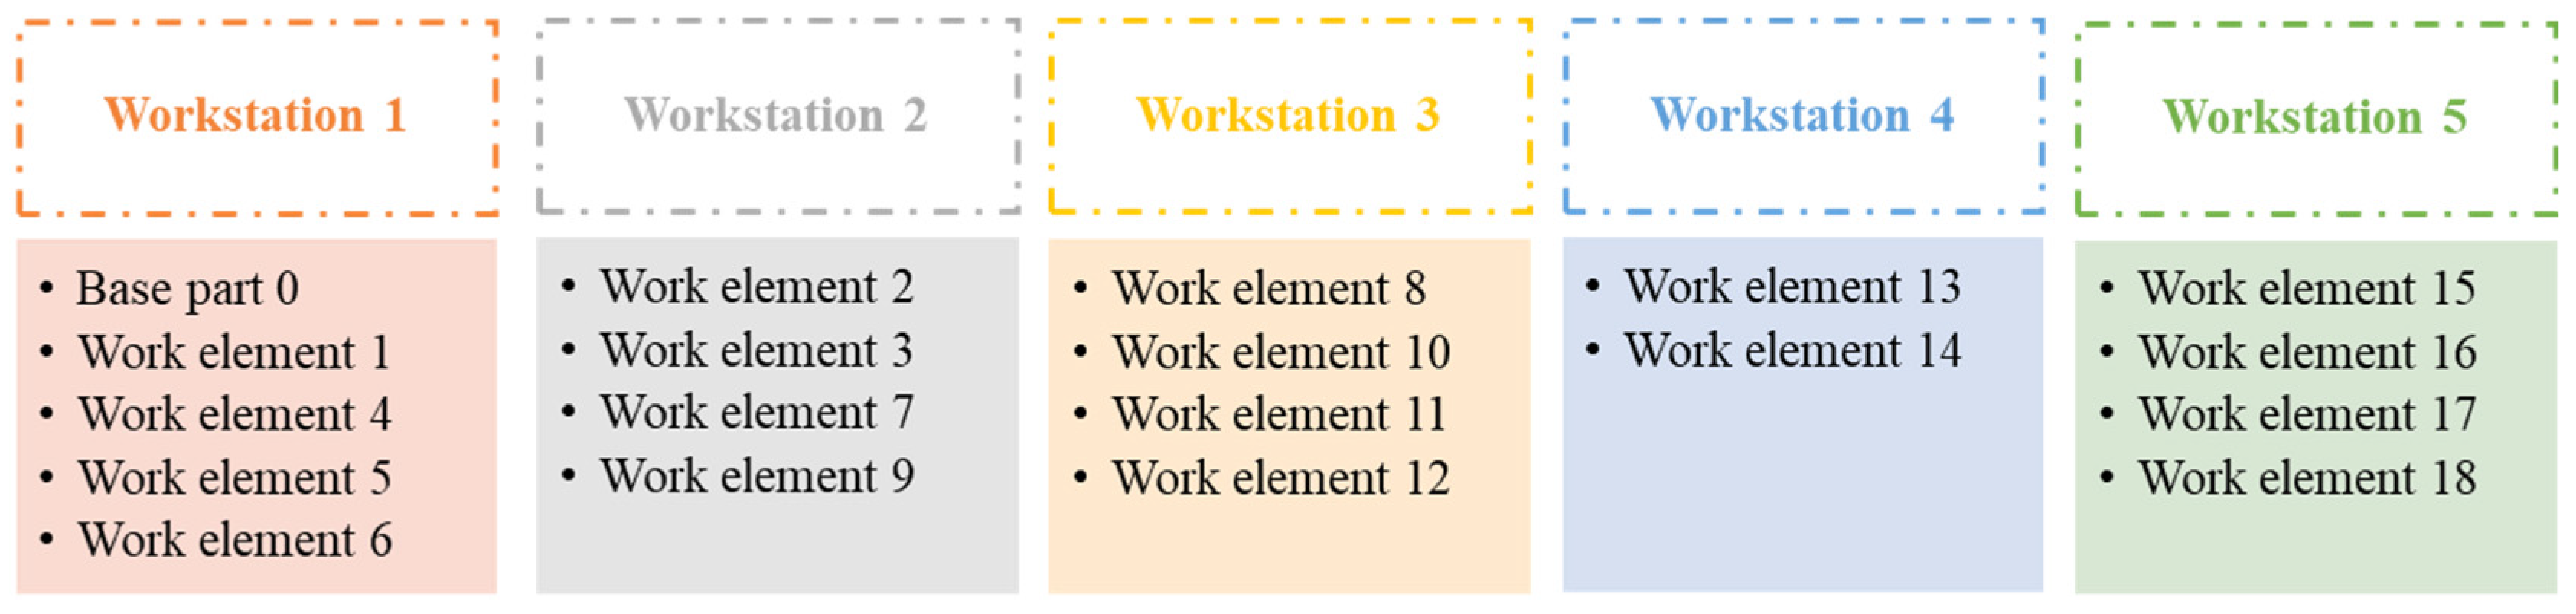
The initial balancing of the work elements for the car gearbox was performed on the existing assembly line. This corresponds to SALBP type II, which focuses on minimizing cycle time for a known number of workstations. The resulting distribution of work elements across five workstations and the identification of the parts required for each work element are shown in Figure 18, while Figure 19 presents the corresponding workload based on reference assembly times.
Figure 18.
Initial allocation of work elements on the assembly line.
Figure 19.
Workload distribution based on reference times (LCR method).
In Figure 18, the previously identified work elements are marked by a dotted frame with a corresponding number. Inside these frames, rectangles indicate the parts required to assemble each work element. Within each rectangle, the required quantity of the corresponding part is shown by a number in brackets. Circles with numerical values from one to five refer to workstations, while circles with letter designations refer to subassemblies within the work elements. In Figure 19, refers to the total reference assembly time of the work elements at workstation .
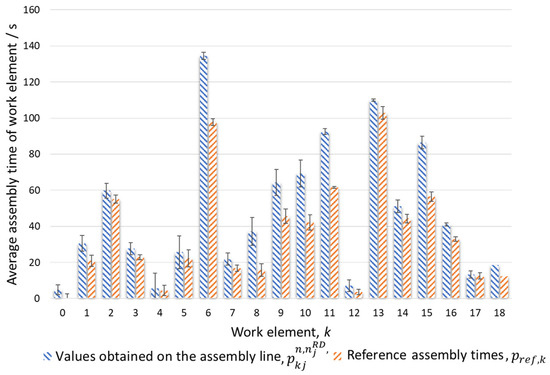
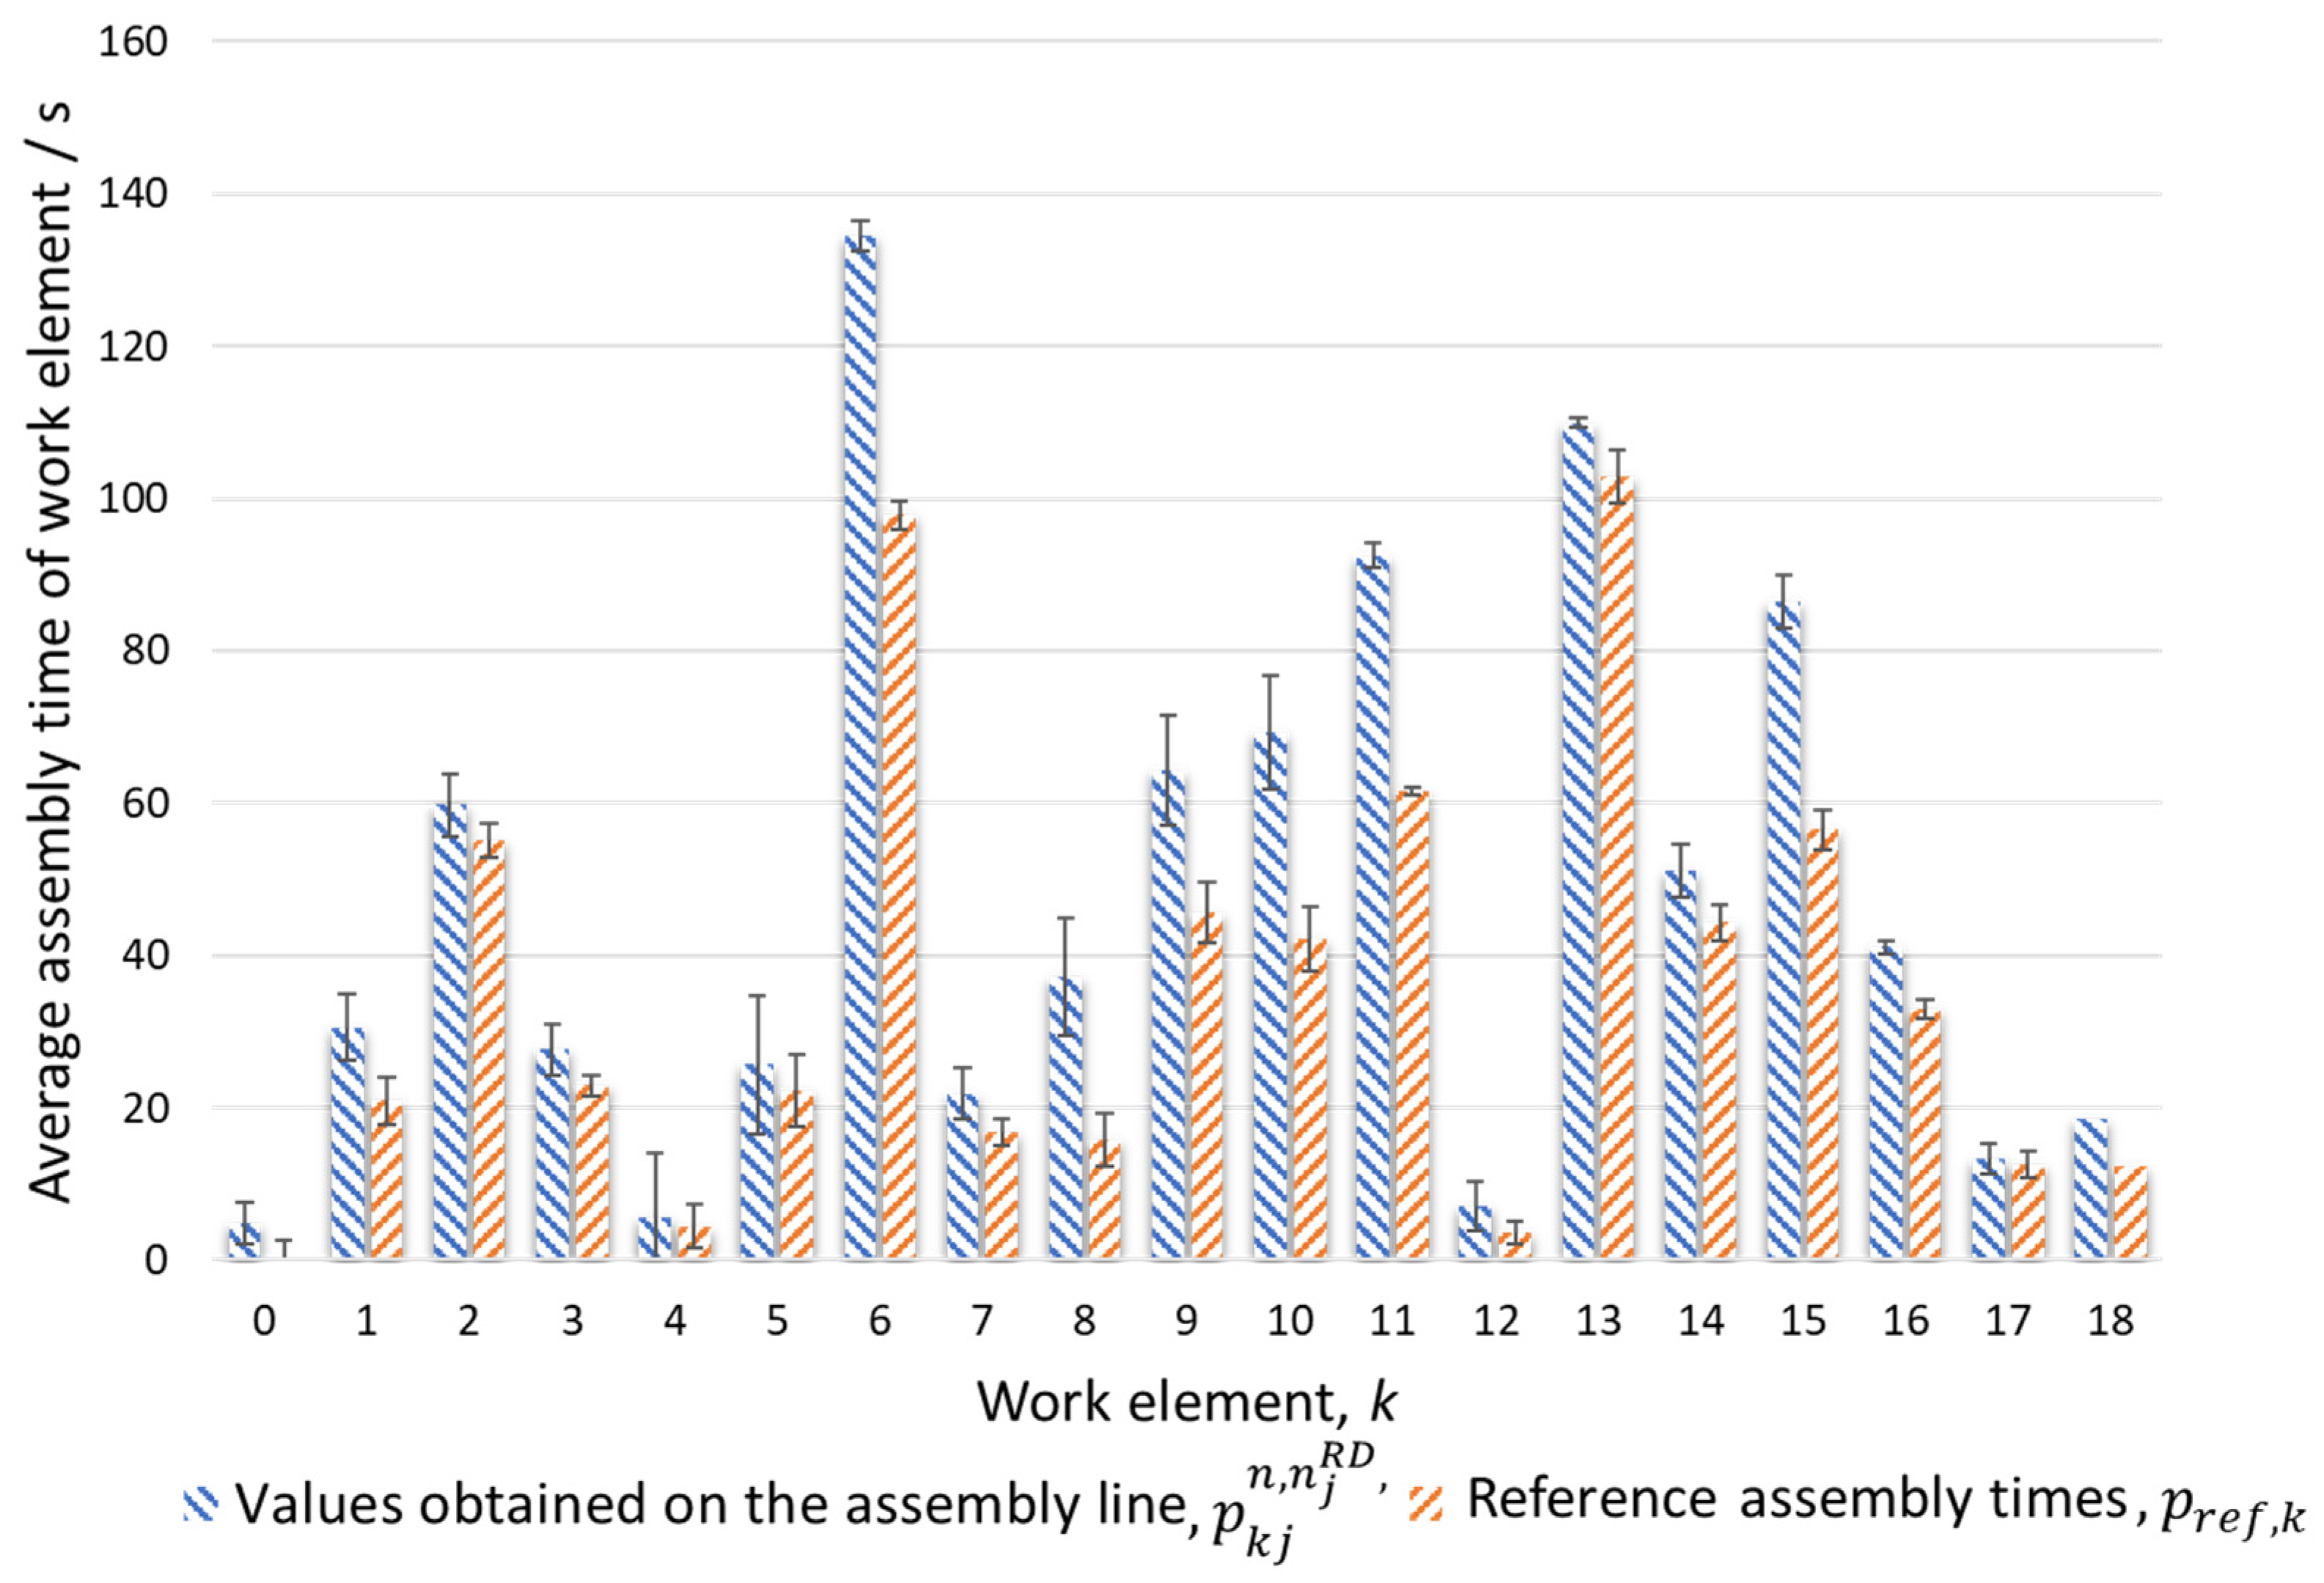
The achieved distribution of work elements was implemented on the actual assembly line. Figure 20 compares the reference and experimentally observed assembly times for each work element. Work element 0, which refers to the base part of the housing, was already at the workstation when the reference times were determined, while its average time on the assembly line refers to the average time required to pick up and transport the housing to the first workstation. The figure shows noticeable deviations between the experimental and reference values. These deviations are primarily attributed to the positioning and distribution of the required parts in the supermarket, the orientation of the parts and the performance of the operator. As the number of parts required to assemble a work element at a workstation increases, the variety of work instructions and tools also increases, leading to a higher complexity of assembly tasks and a longer cycle time.
Figure 20.
Experimental vs. reference assembly times of work elements.
The resulting distribution of workstation loads is presented in Figure 21.
Figure 21.
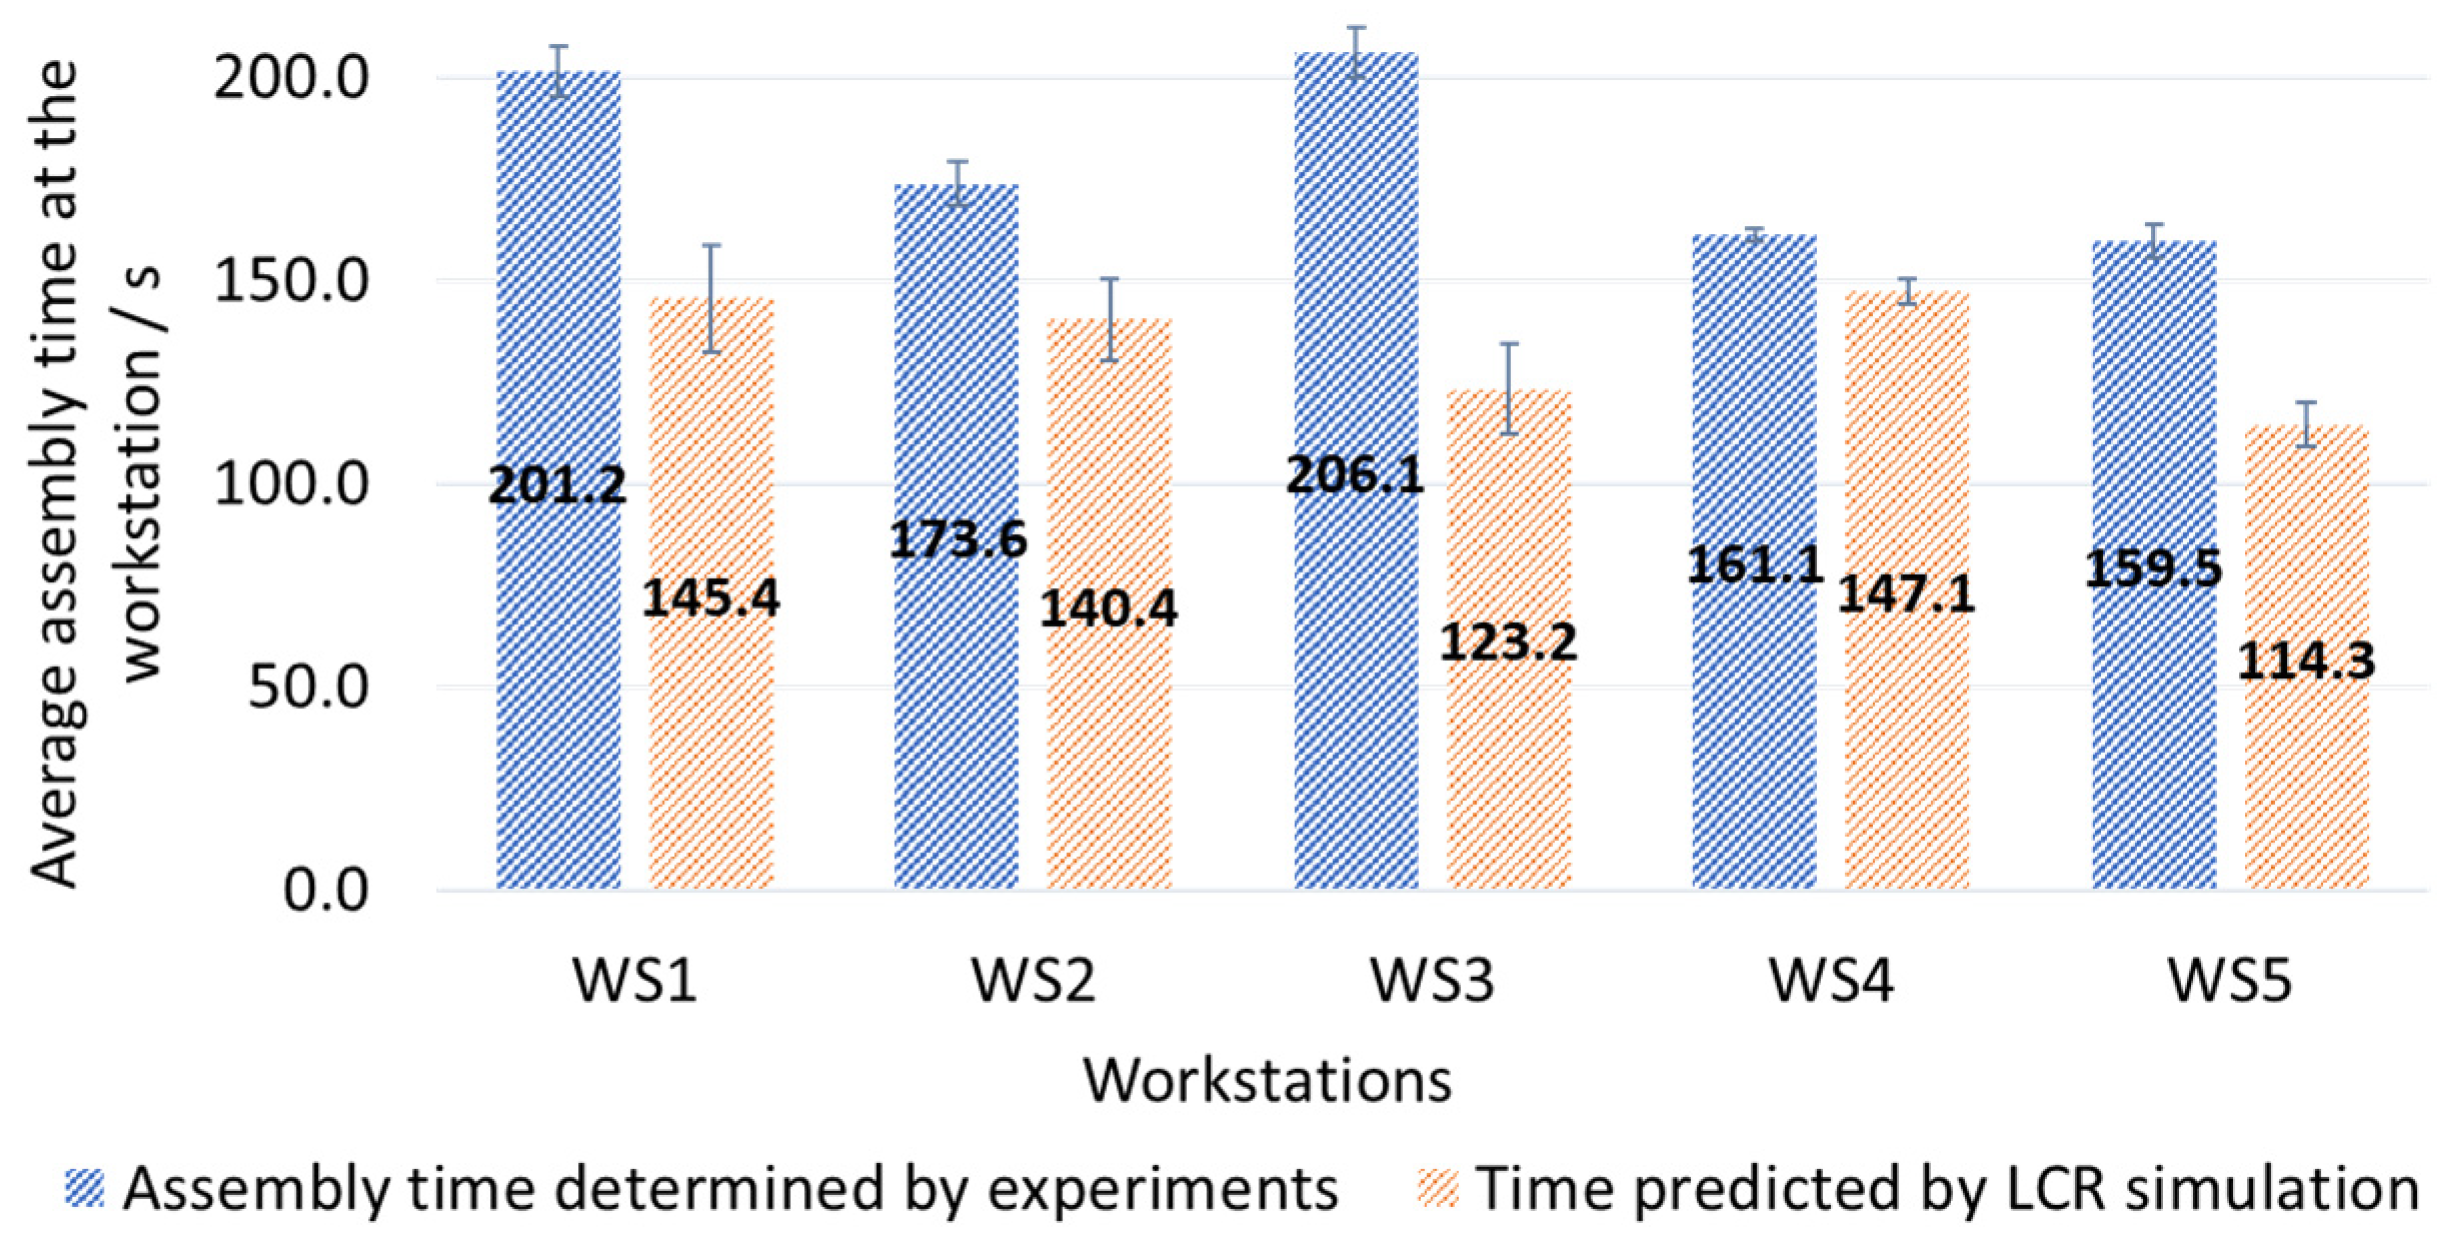
Comparison of the distribution of workload by the assembly line.
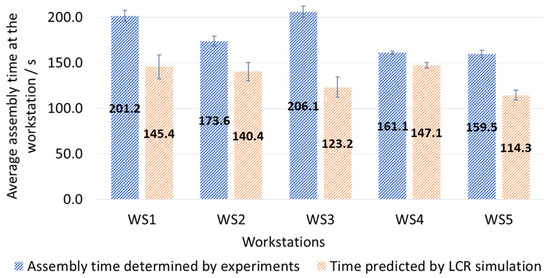
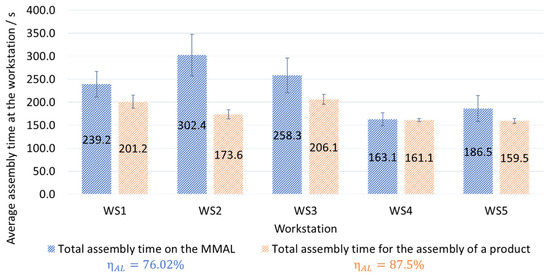
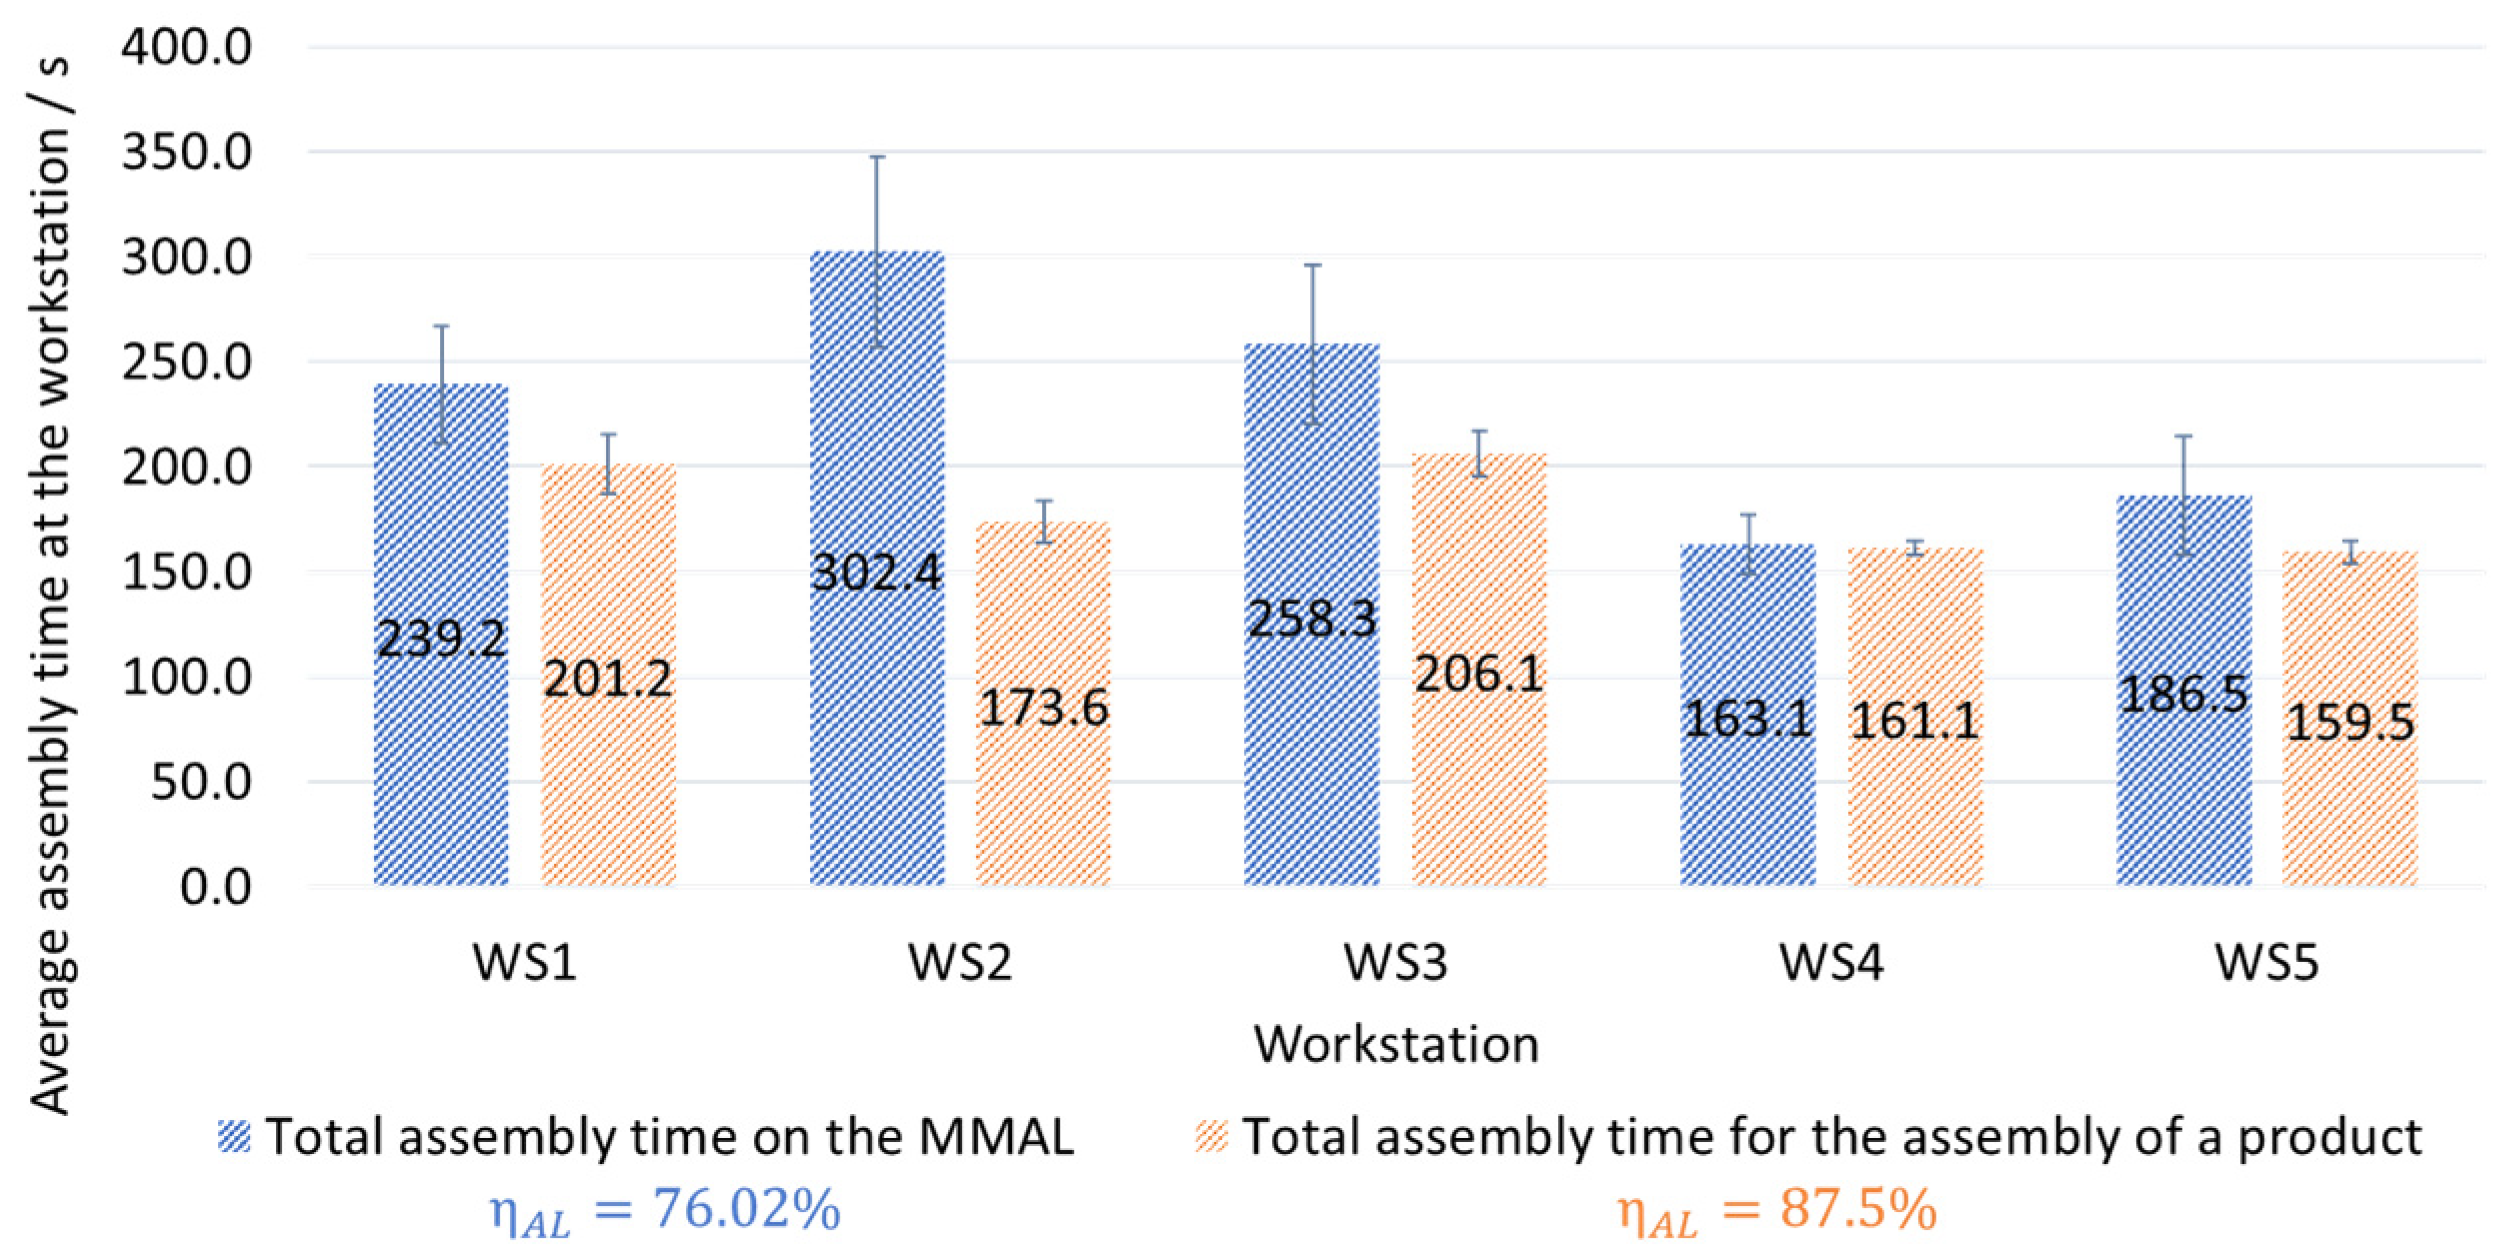
Figure 21 shows that the largest discrepancy between simulated and experimental times occurs in WS3. This is because WS3 has the greatest variety of components. In contrast, WS4, which has the least variety of components, shows minimal deviation. This distribution of elements, determined through experiments, results in an overall assembly line balance of 87.5%, which is considered acceptable. Therefore, it is decided to conclude SALBP with this assembly line balance. This condition serves as a starting point for introducing product variety on the assembly line.
4.2.2. Introduction of Variety into the Assembly Line
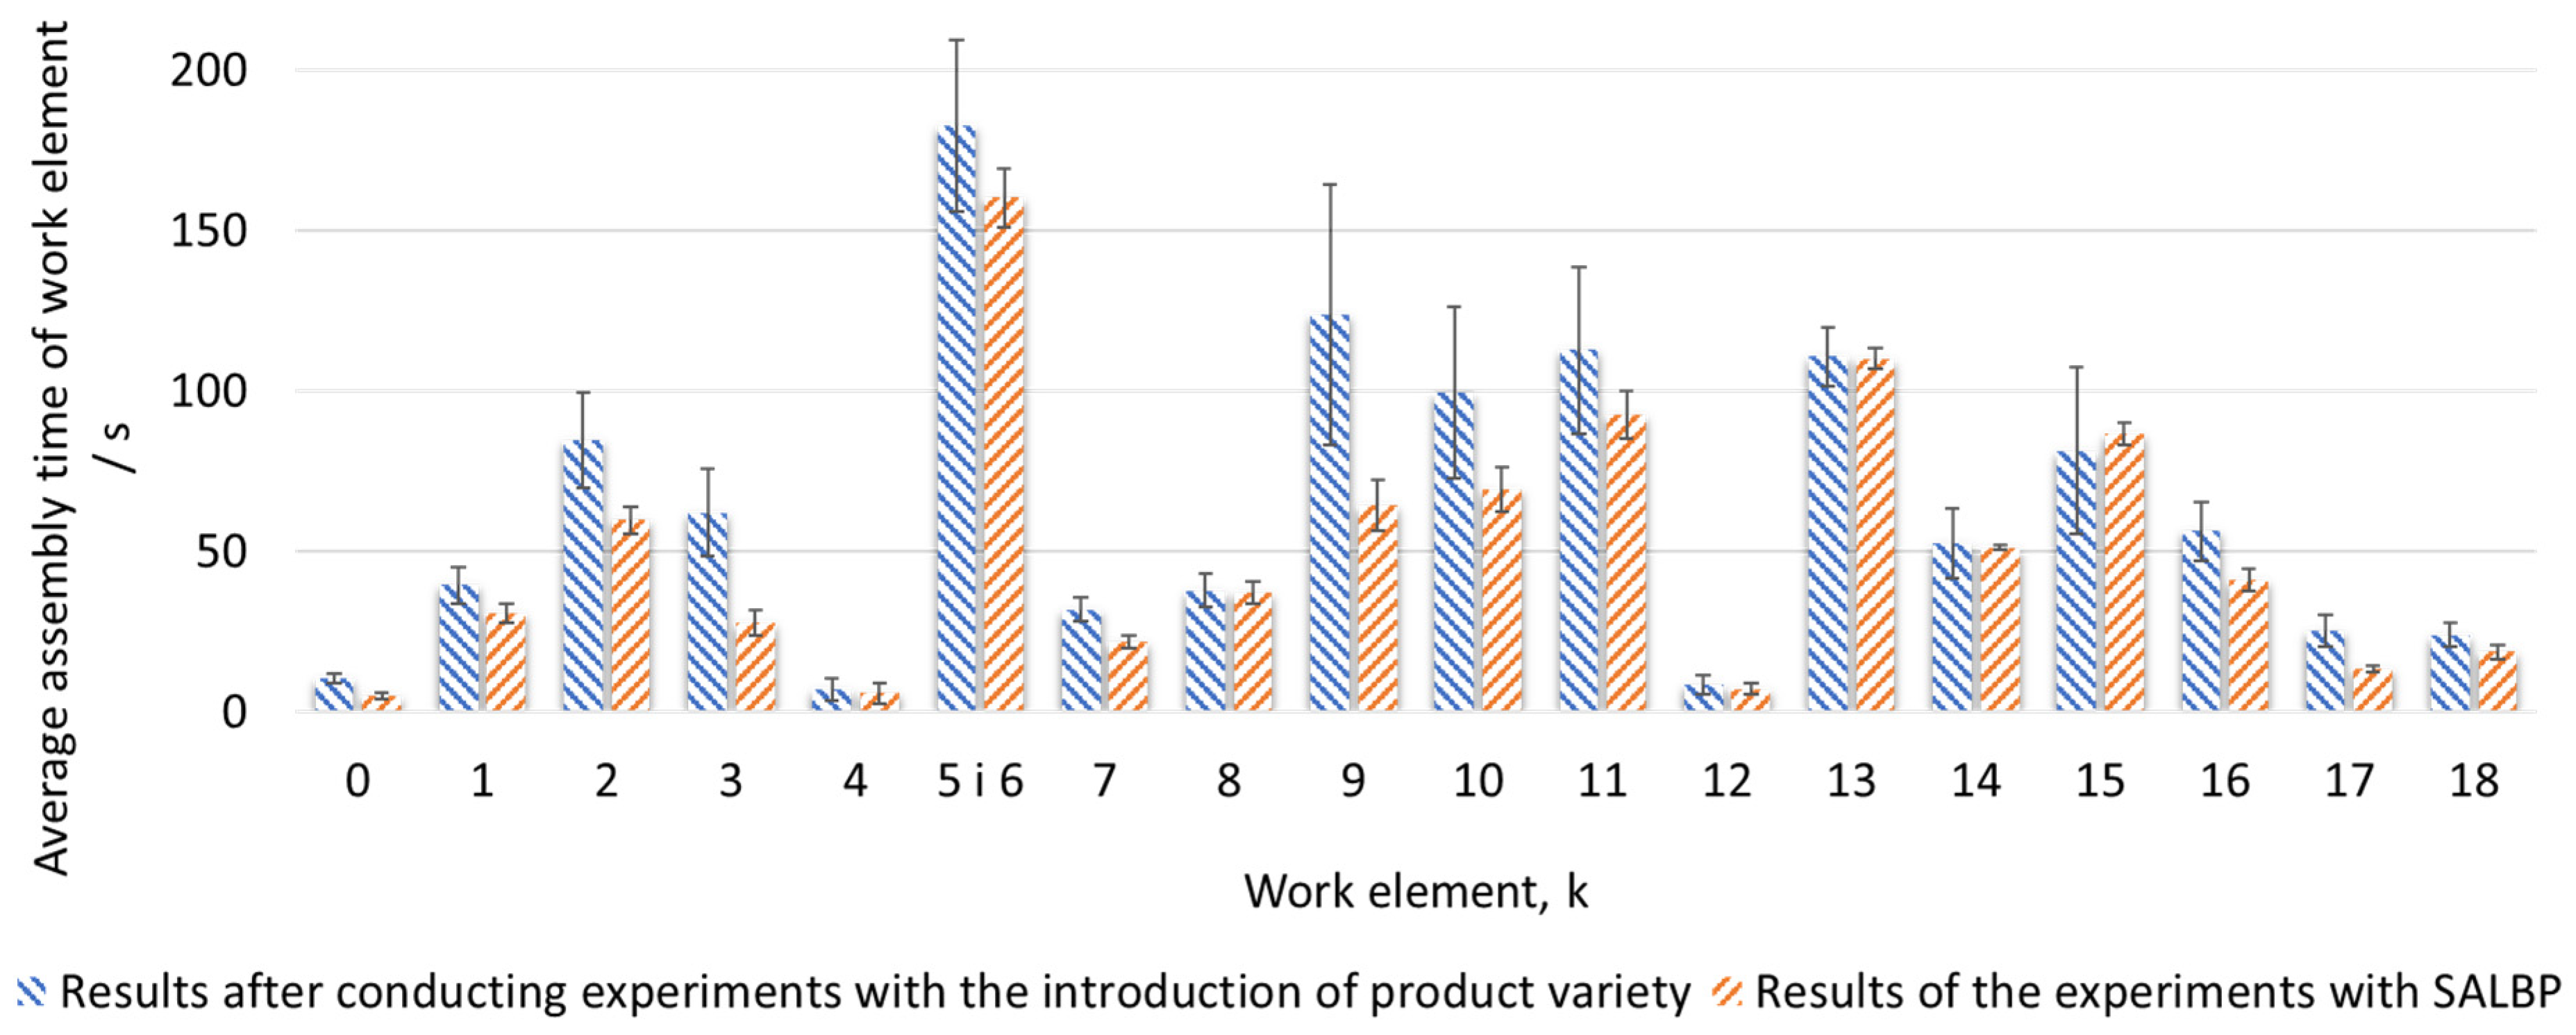
The previous distribution of work elements from the SALBP served as the basis for introducing variety into the assembly line. In addition to the YZS gearbox, two other products, the SZN and YAS gearboxes, were added to the line. The results for each individual work element and their comparison with previous derived experimental assembly times are shown in Figure 22. Because work elements 5 and 6 have to be assembled at the same workstations, their assembly times were considered together.
Figure 22.
Assembly times: SALBP vs. MMALBP.
With the introduction of variety, the overall balance level of the assembly line dropped to 76.02%, indicating that the previously acceptable workload distribution was no longer valid. In addition, the bottleneck workstation changed, as shown in Figure 23, due to the increased number of different components required for the new products at WS2.
Figure 23.
Comparison of workstation loads before and after product variety.
To achieve an acceptable workload distribution, work elements were reallocated using the LCR method in two iterative steps, resulting in balance levels of 89.16% and 90.27%, respectively. The results of the assembly line balance indicate a clear improvement in the distribution of work elements to individual workstations. The final distribution of work elements for a 90.27% balance is shown in Figure 24, while the corresponding workload profile is shown in Figure 25.
Figure 24.
Distribution of work elements balance of 90.27%.
Figure 25.
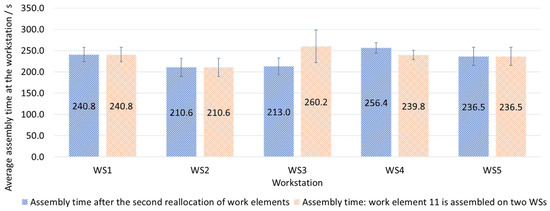
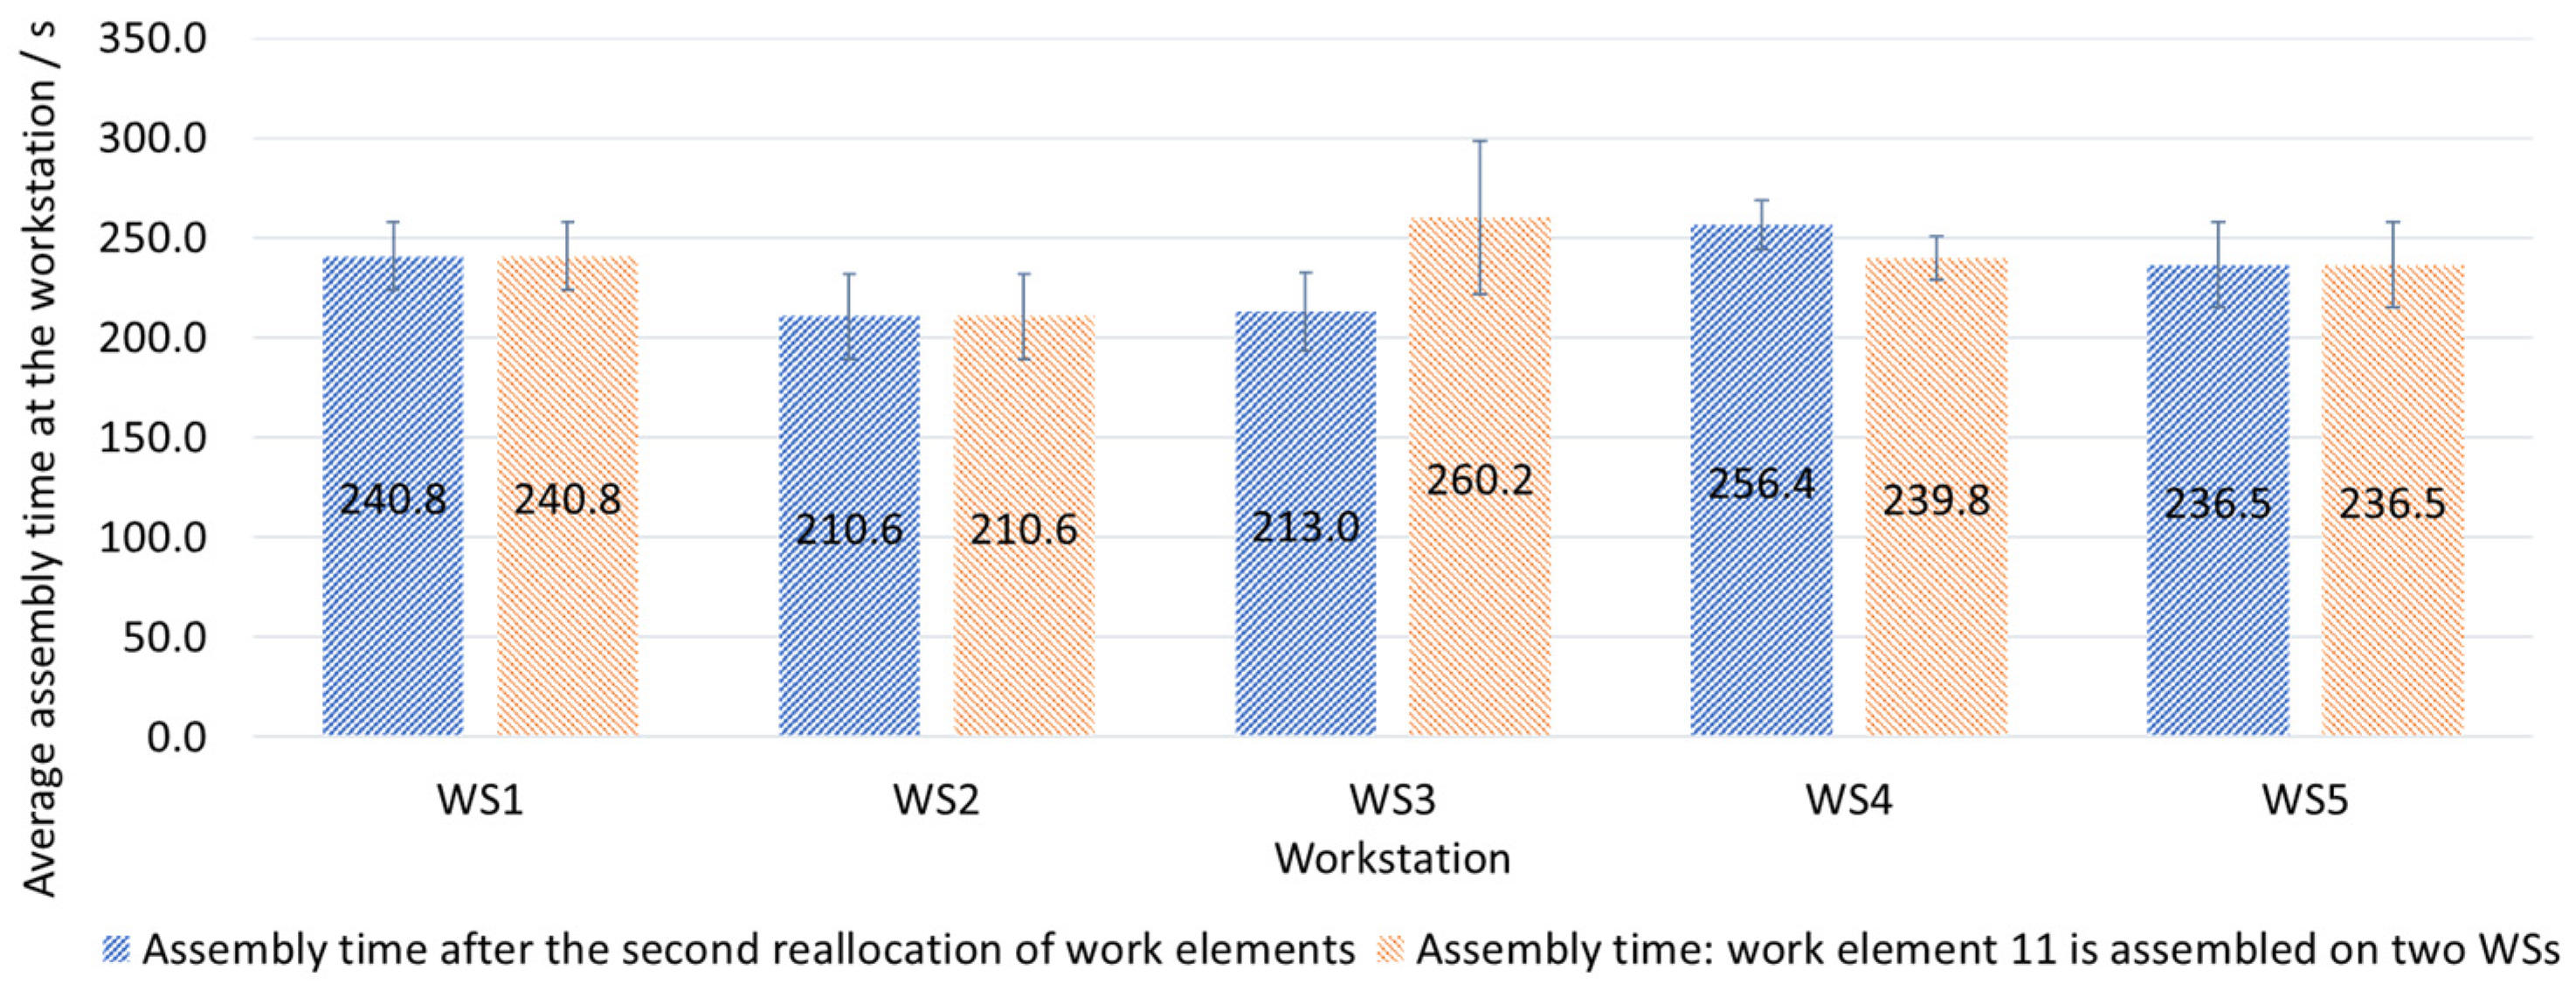
Workloads at a balance of 90.27% (blue columns) and a balance of 91.3% (orange columns).
Due to the nature of the products and the precedence constraints of the work elements, further improvement through reallocation was not possible. Therefore, work element 11 was distributed between WS3 and WS4 in a ratio of 1:3, that is, once to WS3 and three times to WS4. With this work distribution, a balance of 91.3% was achieved. The results for the average assembly times of the work elements by workstation are shown in Figure 25. This concludes the balancing procedure.
These results show that introducing product variety alters workstation loads and line balance, creating conditions in which workstation-level assembly complexity can be explicitly quantified. This motivates the use of the AWCI in the following analysis.
4.3. Comparison of Complexity Metrics: Actual Data and Model Outputs
Based on the MMAL balance data from the gearbox case study, the AWCI values were obtained from the experimental data using Equation (1). Although operator-specific reference assembly times may vary, the AWCI values reported in this section and in Section 4.4 were calculated using a single reference assembly time for all operators. To isolate configuration-driven effects of balancing and work redistribution, AWCI was computed using a common reference time baseline, ensuring comparability across alternative line configurations at the system level. These results were compared with the values from the regression model, Equation (2). Because the regression model is defined for a product variety of 3 to 7 and a part variety of 14 to 20, the comparison was made with workstations within these ranges. As Table 4 shows, the predicted values from Equation (2) and the actual measured AWCI values at the observed workstations from Equation (1) show good agreement, with deviations of less than ±10%, which are within acceptable limits.
Table 4.
Comparison of experimental and model-based AWCI values.
After empirically confirming the applicability of the proposed AWCI indicator within the observed experimental range, the analysis is extended to examine the relationships among assembly line balance, complexity, and productivity.
4.4. Relationship Between AWCI, Line Balancing and Productivity
Balancing an assembly line makes it possible to distribute the workload across workstations more evenly, which is generally associated with increased productivity. However, redistributing work elements between workstations or performing them at multiple locations can increase assembly complexity, particularly in mixed-model environments, due to greater diversity of work content. As a result, assembly complexity may rise at individual workstations, which can also affect the overall complexity of the assembly line and the productivity achieved.
The assembly complexity at the assembly line level, , can be expressed as the sum of the individual assembly complexities of the workstations:
To analyze the relationship between assembly line complexity and assembly line balance, Equation (1) was used to calculate the AWCI based on the distribution of work elements described in Section 4.2. Balancing values of 76.02%, 89.16%, 90.27%, and 91.3% were considered, and overall assembly line complexity was determined using Equation (3). As shown in Figure 26, higher levels of assembly line balance are associated with higher values of assembly line complexity within the observed experimental conditions.
Figure 26.
The complexity of the assembly line and its balance.
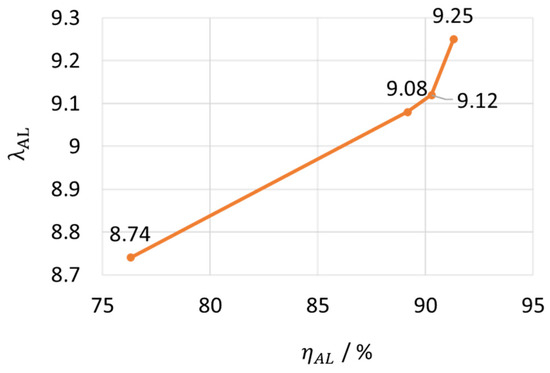
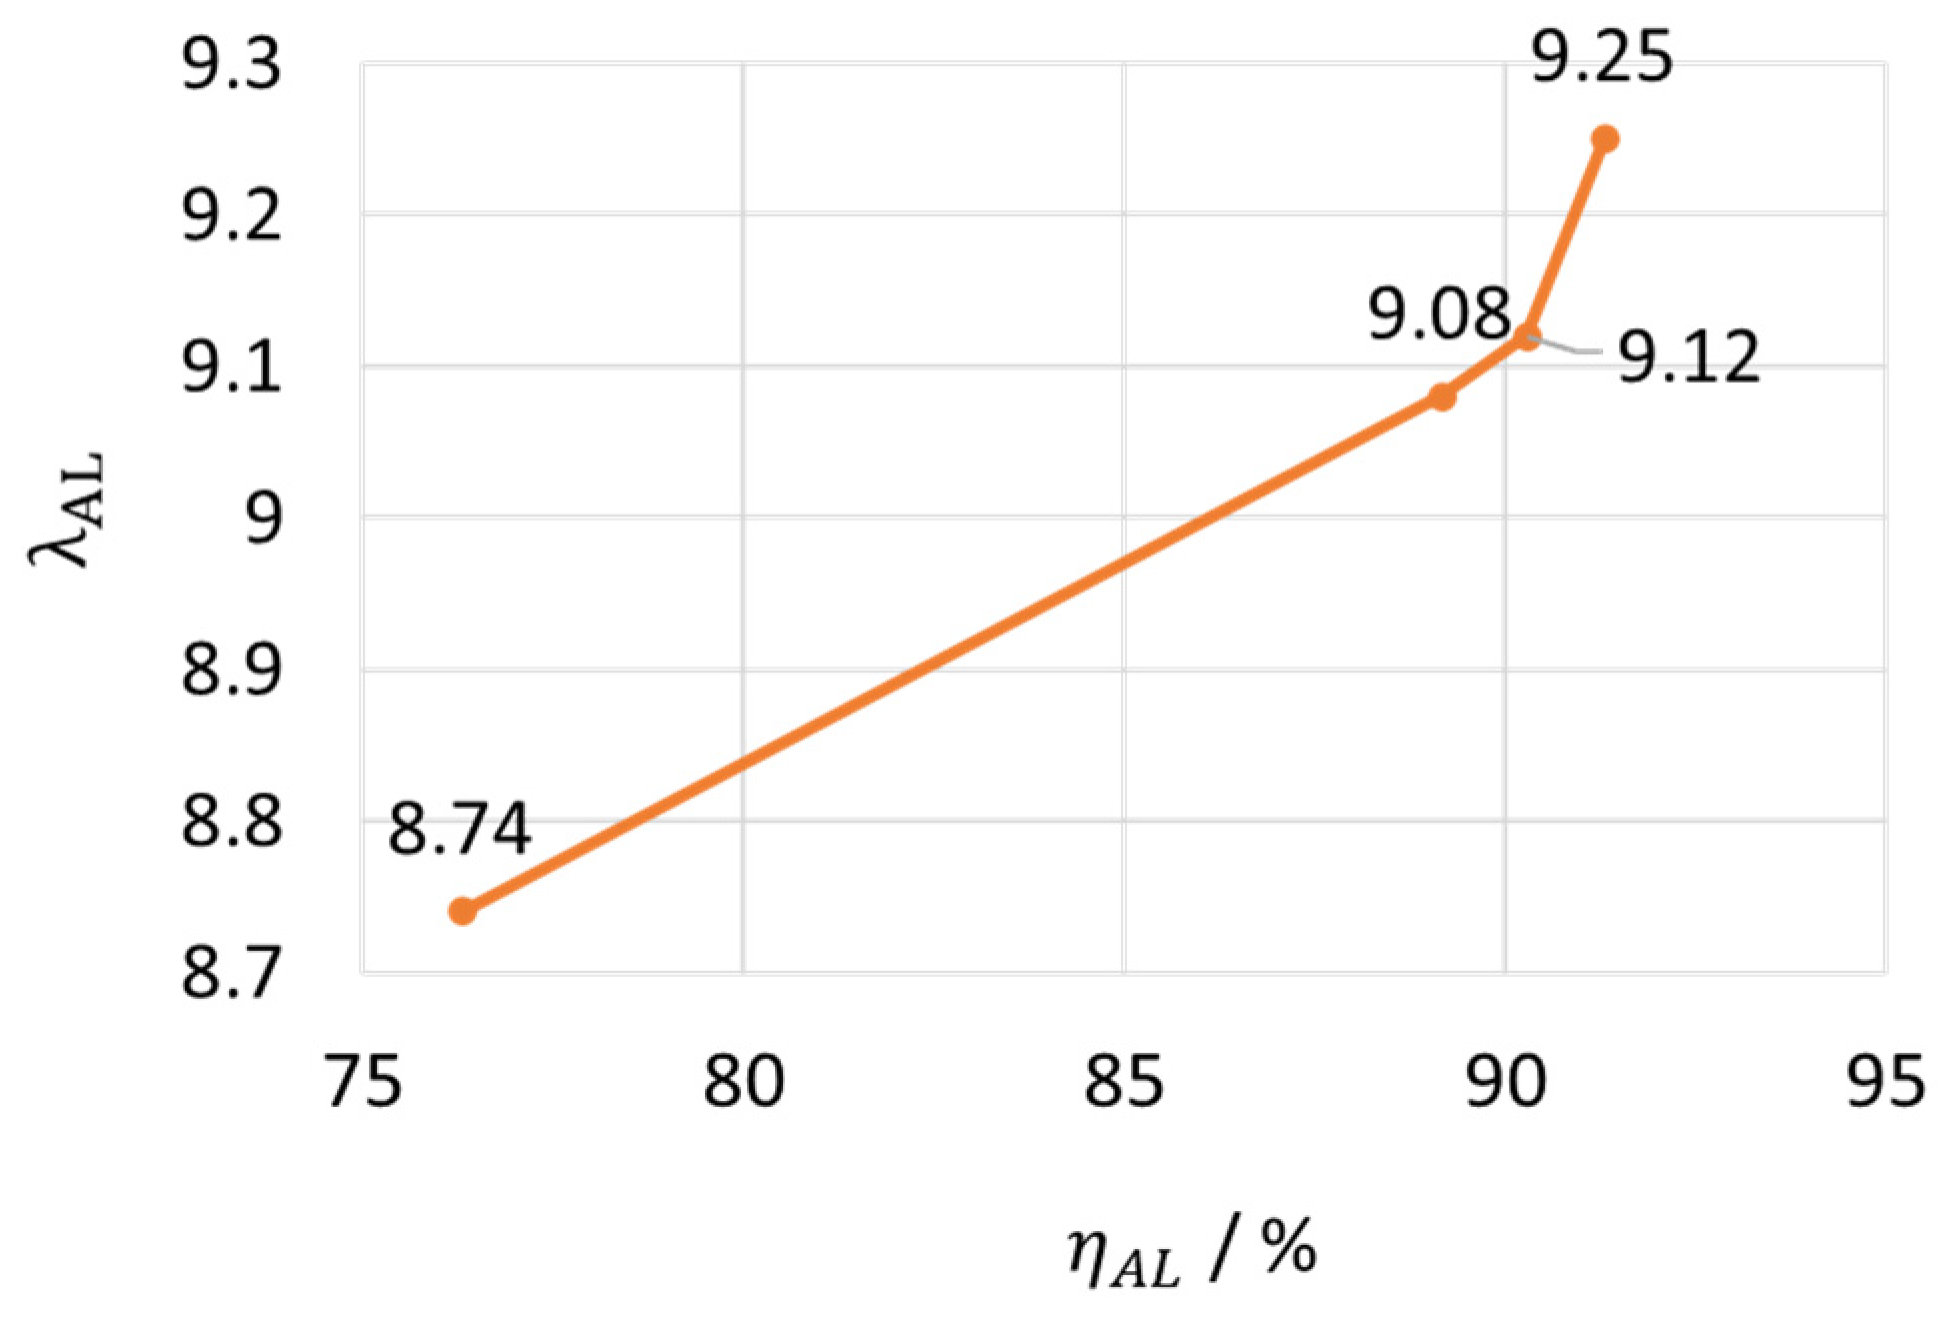
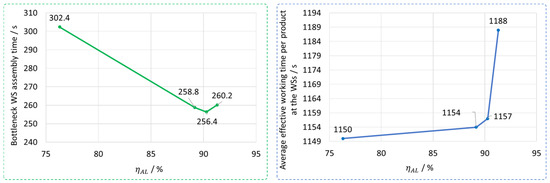
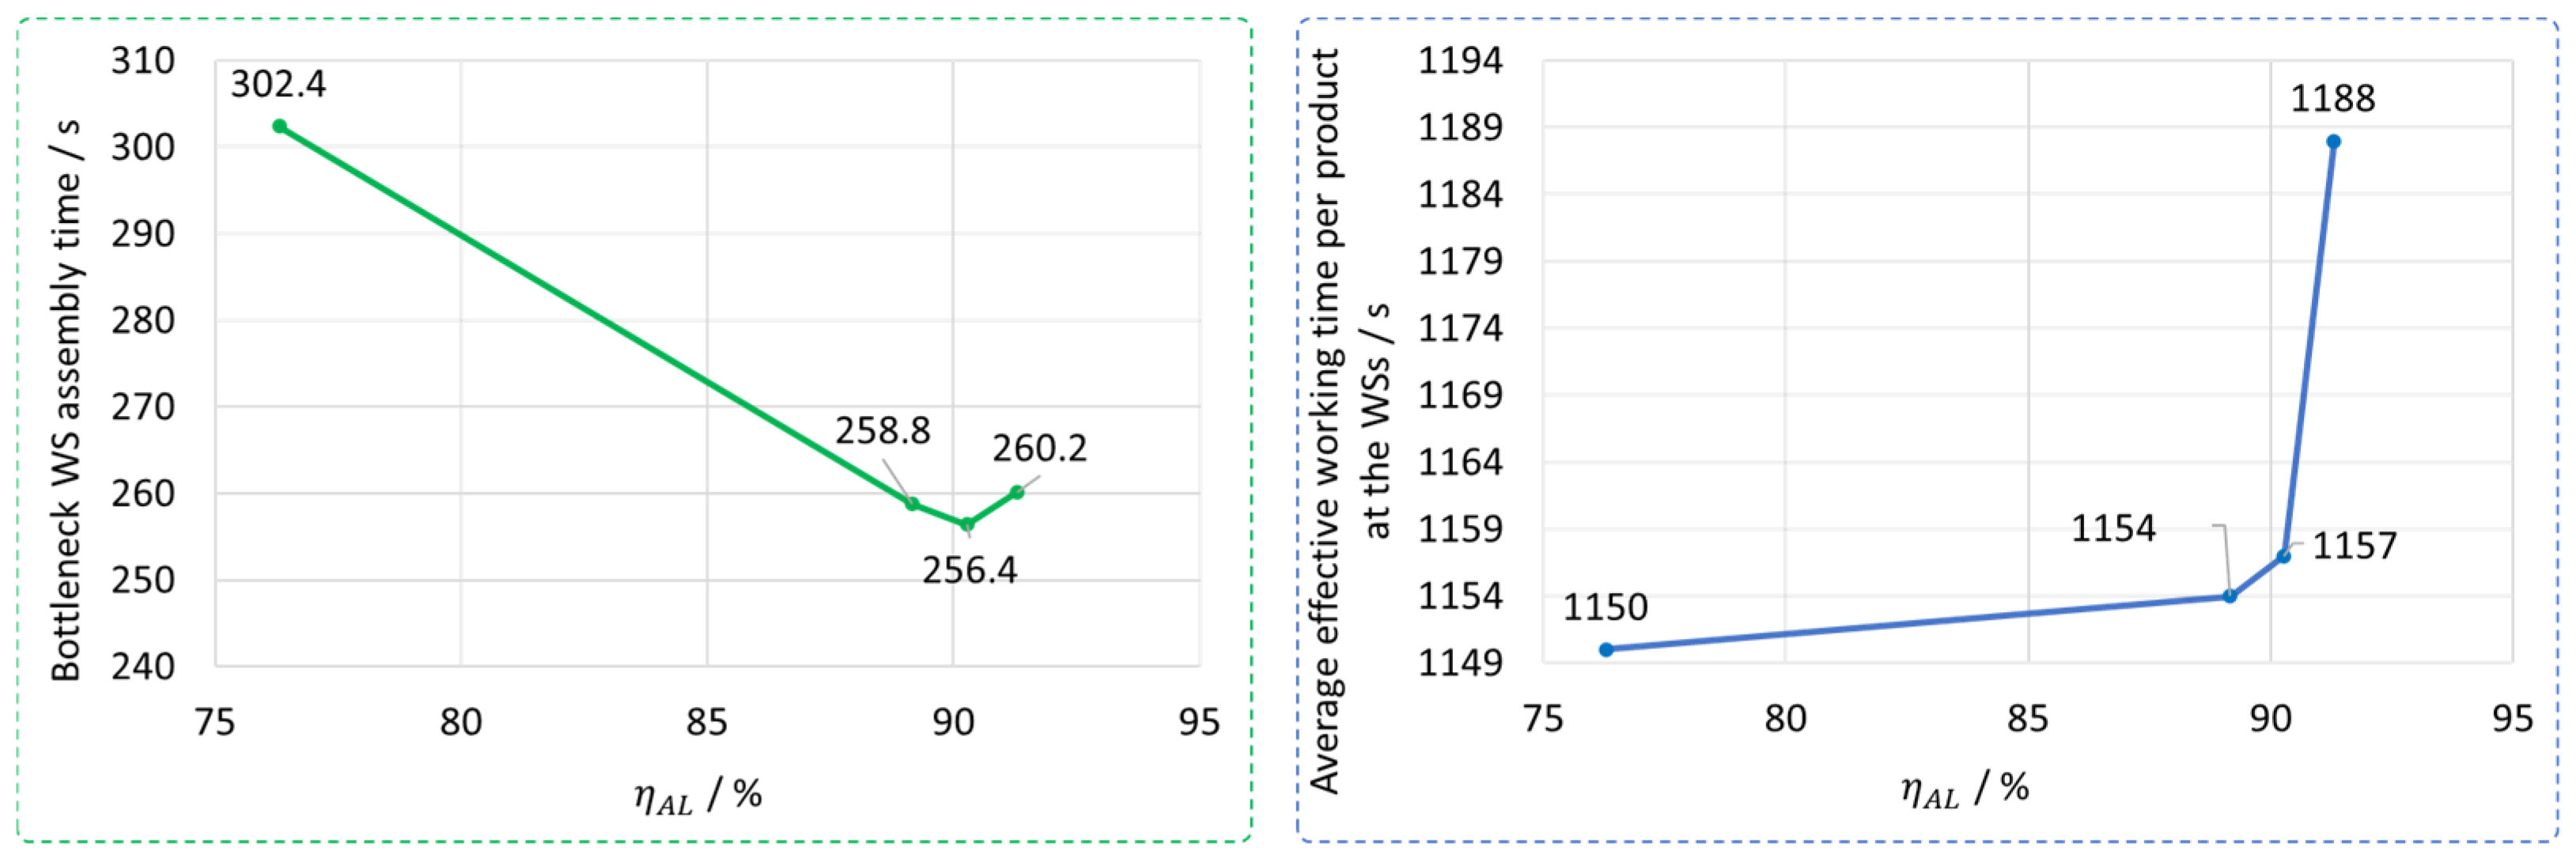
Increasing the degree of balance reduces the average load on the bottleneck workstation but simultaneously increases the effective average total time per product on the assembly line (Figure 27). Because productivity is determined by the bottleneck workstation, productivity initially improves as the balance increases. However, at higher balance levels, the concurrent increase in assembly complexity leads to longer assembly times at certain workstations.
Figure 27.
Average bottleneck assembly time (left) and average effective total product assembly time (right) as a function of the line balance.
In this case study, a balance level of 91.3% marks the point at which further increases in balance coincide with a reduction in observed productivity. This effect may be related to the increased variety of work elements assigned to individual workstations, which can result in higher cognitive and physical demands on operators. While these results do not establish a causal relationship, they highlight a trade-off between assembly line balance, complexity, and productivity that should be considered during line design and optimization.
This approach can serve as a guideline for future research. It is expected that with such an approach, companies can achieve a compromise between competing objectives that ensures both operational efficiency and sustainability.
5. Discussion
This paper proposes a new Assembly Workstation Complexity Indicator. This indicator considers complexity as a performance-based and dynamic concept. Unlike the previous studies, which have conceptualized assembly complexity mainly through structural characteristics or information, this study focuses on the operational manifestation of complexity as it directly impacts assembly time and variability at the workstation level. The proposed AWCI is based on experimental observations and demonstrates how increasing product and component variety affected operator performance within the observed experimental boundaries. In addition, the proposed predictive mathematical model captures interaction effects between input parameters through the regression model, which are often neglected in simpler complexity indicators in the literature. The AWCI was developed and validated through experiments in a controlled learning factory environment. In these experiments, product and component varieties were systematically varied while workstation conditions remained constant. The proposed indicator will complement existing literature on assembly complexity by explicitly linking assembly complexity to operational measures relevant to planning and managing assembly operations.
Findings from this research indicate that, within the investigated context, productivity does not always increase with greater assembly line balancing. In this study, it was observed that for the analyzed products, beyond a certain balance level, further redistribution of work elements can increase workstation complexity, leading to longer assembly times and reduced productivity. This suggests that maximum balance was not the optimal solution in the investigated case study and may not always be optimal in similar settings. This finding highlights the importance of balancing the load distribution and operational complexity when evaluating assembly line balancing alternatives. Instead of establishing causal relationships through a scientific approach, this study identifies context-specific empirical relationships between the variables of work content variety, assembly complexity, and productivity. These findings support the utility of the AWCI as a potential analytical tool to assess multiple alternative balancing solutions and to identify balance levels that optimize operational efficiency while maintaining acceptable loading conditions.
Although the proposed AWCI effectively captures the impact of product and component variety on assembly performance, assembly complexity is widely recognized as a multidimensional phenomenon. Previous studies have shown that complexity can also be influenced by factors such as component geometry, component similarity, handling difficulty, assembly sequence, workstation layout, ergonomics, and operator-related characteristics [52,53,54]. Furthermore, Zeltzer et al. [21] showed that complexity management in mixed-model assembly lines involves both workload balancing and complexity leveling across workstations. This perspective is consistent with the findings of the present study, where higher levels of line balance were associated with increased assembly complexity, while productivity did not continue to improve beyond a certain balance level. Consequently, the AWCI should be interpreted as an indicator of a specific operational dimension of assembly complexity rather than a comprehensive measure encompassing all factors that influence assembly performance.
The results of this study are subject to certain limitations. The proposed AWCI was developed and evaluated using a limited number of experimental case studies. The corresponding mathematical model was developed within a specific experimental range of product and component variety. Accordingly, the validity of the model is limited to the observed parameter range, and application outside this range requires additional experimental confirmation. The observed case studies involved products of moderate complexity and a limited set of assembly tasks. Therefore, the direct applicability of the results to highly complex industrial products and large-scale production systems cannot be assumed without further validation. In addition, the experiments were conducted in a learning factory environment. Although this environment is designed to simulate a real industrial setting, it cannot capture all sources of variability present in real-world manufacturing, such as production pressure, long-term operator fatigue, or shift-related changes. Furthermore, the use of engineering students as operators represents a limitation regarding the direct transferability of the results, as their work habits, experience and task familiarity may differ from those of professional industrial workers. Although basic training was provided before the experiments and a relatively large number of experimental repetitions were performed for each case study, the learning effect during task execution and rebalancing cannot be completely excluded.
6. Conclusions and Future Research
This paper introduces a new assembly complexity indicator developed to quantify the operational effects of product and component variety at the workstation level. The AWCI indicator was developed and validated through experiments conducted in a controlled learning factory environment and demonstrated its ability to capture changes in assembly performance associated with variations in work content. The results indicate that, within the investigated experimental conditions, higher assembly line balance does not necessarily lead to higher productivity. For the analyzed products and balancing scenarios, further redistribution of work elements was associated with increased workstation complexity and longer assembly times. These findings highlight the importance of considering both workload distribution and operational complexity when evaluating assembly line balancing alternatives. The AWCI was developed on a manual mixed-model assembly line with an “I” type layout. Thus, future research can focus on extending this indicator to other assembly line configurations, automated systems, or human–robot hybrid systems, which represents an important direction for future research. This research can also be extended by integrating additional parameters into the assembly complexity indicator, such as similarity of products/components, workplace organization, workplace ergonomics, the impact of Industry 4.0 technologies or operator-specific characteristics. The inclusion of these factors in the assembly complexity indicator could increase the accuracy of the prediction of assembly time, optimize the assignment of work tasks and ensure greater efficiency of the assembly system. Further research could also consider the development of an adaptive or dynamic assembly line balance algorithm that includes predicting the impact of AWCI on operator performance in an environment with dynamic changes in work content.
Author Contributions
Conceptualization, A.A.M. and N.G.; methodology, A.A.M.; validation, A.A.M., B.B. and M.M.; formal analysis, A.A.M. and B.B.; investigation, A.A.M.; resources, N.G.; data curation, A.A.M.; writing—original draft preparation, A.A.M.; writing—review and editing, N.G., B.B. and M.M.; visualization, A.A.M. and M.M.; supervision, N.G.; funding acquisition, N.G. All authors have read and agreed to the published version of the manuscript.
Funding
This work was supported by the European Union under the NextGenerationEU instrument, through the Re-covery and Resilience Mechanism, within the institutional research project AIMTECH 4.5 (IP-UNIST-07), implemented by the Ministry of Science, Education and Youth of the Republic of Croatia.
Data Availability Statement
The datasets used and/or analyzed during the current study are available from the corresponding author on reasonable request.
Conflicts of Interest
The authors declare no conflicts of interest.
References
- Hu, S.J.; Ko, J.; Weyand, L.; Elmaraghy, H.A.; Lien, T.K.; Koren, Y.; Bley, H.; Chryssolouris, G.; Nasr, N.; Shpitalni, M. Assembly System Design and Operations for Product Variety. CIRP Ann. Manuf. Technol. 2011, 60, 715–733. [Google Scholar] [CrossRef] [Scilit]
- Catalano, F.; Zennaro, I.; Persona, A. Manned Assembly Systems Design Considering Layout, Workforce Strategy, and Workers’ Heterogeneity: State of the Art and Future Research Agenda. Int. J. Adv. Manuf. Technol. 2025, 139, 4315–4337. [Google Scholar] [CrossRef] [Scilit]
- Baudin, M.; Netland, T. Introduction to Manufacturing: An Industrial Engineering and Management Perspective; Routledge Taylor & Francis Group: New York, NY, USA, 2023. [Google Scholar]
- Samy, S.N.; Elmaraghy, H. A Model for Measuring Products Assembly Complexity. Int. J. Comput. Integr. Manuf. 2010, 23, 1015–1027. [Google Scholar] [CrossRef] [Scilit]
- Herrera Vidal, G.; Coronado Hernández, J.R. Complexity in Manufacturing Systems: A Literature Review. Prod. Eng. 2021, 15, 321–333. [Google Scholar] [CrossRef] [Scilit]
- Alkan, B.; Vera, D.; Ahmad, B.; Harrison, R. A Method to Assess Assembly Complexity of Industrial Products in Early Design Phase. IEEE Access 2017, 6, 989–999. [Google Scholar] [CrossRef] [Scilit]
- Zizic, M.C.; Veza, I.; Vukicevic, D.; Mladineo, M. APPINT Algorithm for Decision-Making Based on Information Integration in the Assembly of Personalized Products. J. Ind. Inf. Integr. 2024, 38, 100560. [Google Scholar] [CrossRef] [Scilit]
- Sun, H.; Fan, S. Car Sequencing for Mixed-Model Assembly Lines with Consideration of Changeover Complexity. J. Manuf. Syst. 2018, 46, 93–102. [Google Scholar] [CrossRef] [Scilit]
- Battaı, O.; Dolgui, A. A Taxonomy of Line Balancing Problems and Their Solution Approaches. Int. J. Prod. Econ. 2013, 142, 259–277. [Google Scholar] [CrossRef] [Scilit]
- Sudhoff, M.; Schüler, P.; Herzog, M.; Kuhlenkötter, B. Proving the Applicability of Assembly Complexity Measures for Process Time Prediction of Customer-Specific Production. Procedia CIRP 2023, 107, 381–386. [Google Scholar] [CrossRef] [Scilit]
- Hashemi-Petroodi, S.; Thevenin, S.; Dolgui, A. The Configuration of Workforce and Equipment in Assembly Lines: Toward Industry 5.0. In Manufacturing from Industry 4.0 to Industry 5.0: Advances and Applications; Elsevier: Amsterdam, The Netherlands, 2024; pp. 207–230. [Google Scholar]
- Myrodia, A.; Hvam, L.; Sandrin, E.; Forza, C.; Haug, A. Identifying Variety-Induced Complexity Cost Factors in Manufacturing Companies and Their Impact on Product Profitability. J. Manuf. Syst. 2021, 60, 373–391. [Google Scholar] [CrossRef] [Scilit]
- Falck, A.C.; Örtengren, R.; Rosenqvist, M.; Söderberg, R. Basic Complexity Criteria and Their Impact on Manual Assembly Quality in Actual Production. Int. J. Ind. Ergon. 2017, 58, 117–128. [Google Scholar] [CrossRef] [Scilit]
- ElMaraghy, H.; Algeddawy, T.; Samy, S.N.; Espinoza, V. A Model for Assessing the Layout Structural Complexity of Manufacturing Systems. J. Manuf. Syst. 2014, 33, 51–64. [Google Scholar] [CrossRef] [Scilit]
- Hvam, L.; Hansen, C.L.; Forza, C.; Mortensen, N.H.; Haug, A. The Reduction of Product and Process Complexity Based on the Quantification of Product Complexity Costs. Int. J. Prod. Res. 2020, 58, 350–366. [Google Scholar] [CrossRef] [Scilit]
- Modrak, V.; Soltysova, Z. Development of Operational Complexity Measure for Selection of Optimal Layout Design Alternative. Int. J. Prod. Res. 2018, 56, 7280–7295. [Google Scholar] [CrossRef] [Scilit]
- Alkan, B.; Vera, D.A.; Ahmad, M.; Ahmad, B.; Harrison, R. Complexity in Manufacturing Systems and Its Measures: A Literature Review. Eur. J. Ind. Eng. 2018, 12, 116–150. [Google Scholar] [CrossRef] [Scilit]
- Bortolini, M.; Galizia, F.G.; Mora, C. Reconfigurable Manufacturing Systems: Literature Review and Research Trend. J. Manuf. Syst. 2018, 49, 93–106. [Google Scholar] [CrossRef] [Scilit]
- Gervasi, R.; Capponi, M.; Mastrogiacomo, L.; Franceschini, F. Manual Assembly and Human–Robot Collaboration in Repetitive Assembly Processes: A Structured Comparison Based on Human-Centered Performances. Int. J. Adv. Manuf. Technol. 2023, 126, 1213–1231. [Google Scholar] [CrossRef] [Scilit]
- Efthymiou, K.; Mourtzis, D.; Pagoropoulos, A.; Papakostas, N.; Chryssolouris, G. Manufacturing Systems Complexity Analysis Methods Review. Int. J. Comput. Integr. Manuf. 2016, 29, 1025–1044. [Google Scholar] [CrossRef] [Scilit]
- Zeltzer, L.; Aghezzaf, E.H.; Limère, V. Workload Balancing and Manufacturing Complexity Levelling in Mixed-Model Assembly Lines. Int. J. Prod. Res. 2017, 55, 2829–2844. [Google Scholar] [CrossRef] [Scilit]
- Alkan, B. A Complexity Modelling Approach to Support Early Life-Cycle Phases of Assembly Automation Systems. Ph.D. Thesis, University of Warwick, Coventry, UK, 2018. [Google Scholar]
- ElMaraghy, W.; ElMaraghy, H.; Tomiyama, T.; Monostori, L. Complexity in Engineering Design and Manufacturing. CIRP Ann. Manuf. Technol. 2012, 61, 793–814. [Google Scholar] [CrossRef] [Scilit]
- Frizelle, G.; Suhov, Y. The Measurement of Complexity in Production and Other Commercial Systems. Proc. R. Soc. A Math. Phys. Eng. Sci. 2008, 464, 2649–2668. [Google Scholar] [CrossRef] [Scilit]
- Busogi, M.; Song, D.; Kang, S.H.; Kim, N. Sequence Based Optimization of Manufacturing Complexity in a Mixed Model Assembly Line. IEEE Access 2019, 7, 22096–22106. [Google Scholar] [CrossRef] [Scilit]
- Shannon, C. A Mathematical Theory of Communication. Bell Syst. Tech. J. 1948, 27, 379–423. [Google Scholar] [CrossRef] [Scilit]
- Zhu, X.; Hu, S.J.; Koren, Y.; Marin, S.P. Modeling of Manufacturing Complexity in Mixed-Model Assembly Lines. J. Manuf. Sci. Eng. 2008, 130, 051013. [Google Scholar] [CrossRef] [Scilit]
- Busogi, M.; Ransikarbum, K.; Oh, Y.G.; Kim, N. Computational Modelling of Manufacturing Choice Complexity in a Mixed-Model Assembly Line. Int. J. Prod. Res. 2017, 55, 5976–5990. [Google Scholar] [CrossRef] [Scilit]
- Hamta, N.; Akbarpour Shirazi, M.; Behdad, S.; Fatemi Ghomi, S.M.T. Modeling and Measuring the Structural Complexity in Assembly Supply Chain Networks. J. Intell. Manuf. 2018, 29, 259–275. [Google Scholar] [CrossRef] [Scilit]
- Liu, X.; Yang, X.; Lei, M. Optimisation of Mixed-Model Assembly Line Balancing Problem Under Uncertain Demand. J. Manuf. Syst. 2021, 59, 214–227. [Google Scholar] [CrossRef] [Scilit]
- Capponi, M.; Gervasi, R.; Mastrogiacomo, L.; Franceschini, F. Assessing Perceived Assembly Complexity in Human-Robot Collaboration processes: A Proposal Based on Thurstone’s Law of Comparative Judgement. Int. J. Prod. Res. 2024, 62, 5315–5335. [Google Scholar] [CrossRef] [Scilit]
- Sinha, K. Structural Complexity and Its Implications for Design of Cyber-Physical Systems. Ph.D. Thesis, Massachusetts Institute of Technology, Cambridge, MA, USA, 2014. [Google Scholar]
- Verna, E.; Genta, G.; Galetto, M.; Franceschini, F. Defect Prediction for Assembled Products: A Novel Model Based on the Structural Complexity Paradigm. Int. J. Adv. Manuf. Technol. 2022, 120, 3405–3426. [Google Scholar] [CrossRef] [Scilit]
- Puttero, S.; Verna, E.; Genta, G.; Galetto, M. Impact of Product Family Complexity on Process Performance in Electronic Component Assembly. Int. J. Adv. Manuf. Technol. 2024, 132, 2907–2922. [Google Scholar] [CrossRef] [Scilit]
- Zeltzer, L. Analysing and Levelling Manufacturing Complexity in Mixed-Model Assembly Lines. Ph.D. Thesis, Ghent University, Ghent, Belgium, 2016. [Google Scholar]
- Mattsson, S.; Tarrar, M.; Fast-Berglund, A. Perceived Production Complexity—Understanding More Than Parts of a System. Int. J. Prod. Res. 2016, 54, 6008–6016. [Google Scholar] [CrossRef] [Scilit]
- Gullander, P.; Davidsson, A.; Dencker, K.; Fasth, Å.; Fässberg, T.; Harlin, U.; Stahre, J. Towards a Production Complexity Model That Supports Operation, Re-Balancing and Man-Hour Planning. In Proceedings of the 4th Swedish Production Symposium (SPS), Lund, Sweden, 3–5 May 2011; pp. 1–10. [Google Scholar]
- Verna, E.; Genta, G.; Galetto, M. A New Approach for Evaluating Experienced Assembly Complexity Based on Multi Expert-Multi Criteria Decision Making Method. Res. Eng. Des. 2023, 34, 301–325. [Google Scholar] [CrossRef] [Scilit]
- Aljinović Meštrović, A.; Crnjac Žižić, M.; Gjeldum, N.; Banduka, N. Human-Centered Assessment of Product Complexity and Its Impact on Assembly Line Performances. Machines 2025, 13, 855. [Google Scholar] [CrossRef] [Scilit]
- Becker, C.; Scholl, A. A Survey on Problems and Methods in Generalized Assembly Line Balancing. Eur. J. Oper. Res. 2006, 168, 694–715. [Google Scholar] [CrossRef] [Scilit]
- Liu, X.; Lei, M.; Zeng, Q.; Li, A. Integrated Optimization of Mixed-Model Assembly Line Balancing and Buffer Allocation Based on Operation Time Complexity. Procedia CIRP 2019, 81, 1040–1045. [Google Scholar] [CrossRef] [Scilit]
- Kumar, A.; Pattanaik, L.N.; Agrawal, R. Optimal Sequence Planning for Multi-Model Reconfigurable Assembly Systems. Int. J. Adv. Manuf. Technol. 2019, 100, 1719–1730. [Google Scholar] [CrossRef] [Scilit]
- Capponi, M.; Mastrogiacomo, L.; Franceschini, F. Empirical Comparison of Assembly Complexity Assessment Approaches in Manufacturing. Int. J. Interact. Des. Manuf. IJIDeM 2025, 19, 3219–3243. [Google Scholar] [CrossRef] [Scilit]
- Samy, S.N.; ElMaraghy, H. A Model for Measuring Complexity of Automated and Hybrid Assembly Systems. Int. J. Adv. Manuf. Technol. 2012, 62, 813–833. [Google Scholar] [CrossRef] [Scilit]
- Verna, E.; Genta, G.; Galetto, M. Effects of Product Complexity on Human Learning in Assembly and Disassembly Operations. J. Manuf. Technol. Manag. 2023, 34, 139–162. [Google Scholar] [CrossRef] [Scilit]
- Herrera-Vidal, G.; Coronado-Hernández, J.R.; Martínez Paredes, B.P.; Sánchez Ramos, B.O.; Sierra, D.M. Systematic Configurator for Complexity Management in Manufacturing Systems. Entropy 2024, 26, 747. [Google Scholar] [CrossRef] [Scilit] [PubMed]
- Samy, S.N.; Elmaraghy, H.A. Complexity Mapping of the Product and Assembly System. Assem. Autom. 2012, 32, 135–151. [Google Scholar] [CrossRef] [Scilit]
- ElMaraghy, H.; ElMaraghy, W. Learning Integrated Product and Manufacturing Systems. Procedia CIRP 2015, 32, 19–24. [Google Scholar] [CrossRef] [Scilit]
- Abele, E.; Metternich, J. Learning Factories: Featuring New Concepts, Guidelines, Worldwide Best-Practice Examples; Springer: Cham, Switzerland, 2024. [Google Scholar]
- Gjeldum, N.; Salah, B.; Aljinovic, A.; Khan, S. Utilization of Industry 4.0 Related Equipment in Assembly Line Balancing Procedure. Processes 2020, 8, 864. [Google Scholar] [CrossRef] [Scilit]
- Leber, M.; Polajnar, A. Študij Dela Za Delo v Praksi; Fakultet za strojništvo: Maribor, Slovenia, 2000. [Google Scholar]
- Zaeh, M.F.; Wiesbeck, M.; Stork, S.; Schubö, A. A multi-dimensional measure for determining the complexity of manual assembly operations. Prod. Eng. 2009, 3, 489–496. [Google Scholar] [CrossRef] [Scilit]
- Malik, A.A.; Bilberg, A. Complexity-based task allocation in human-robot collaborative assembly. Ind. Robot Int. J. Robot. Res. Appl. 2019, 46, 471–480. [Google Scholar] [CrossRef] [Scilit]
- Capponi, M.; Gervasi, R.; Mastrogiacomo, L.; Franceschini, F. Proposal of a complexity model for human-robot collaboration assembly processes. Robot. Comput.-Integr. Manuf. 2025, 95, 103026. [Google Scholar] [CrossRef] [Scilit]

Disclaimer/Publisher’s Note: The statements, opinions and data contained in all publications are solely those of the individual author(s) and contributor(s) and not of MDPI and/or the editor(s). MDPI and/or the editor(s) disclaim responsibility for any injury to people or property resulting from any ideas, methods, instructions or products referred to in the content. |
© 2026 by the authors. Licensee MDPI, Basel, Switzerland. This article is an open access article distributed under the terms and conditions of the Creative Commons Attribution (CC BY) license.