


Abstract
Pulsator tests are used to characterize the bending fatigue strength of the tooth root. In these tests, the tooth root is loaded not by meshing with another gear but by applying a pulsating load to the tooth flank via a testing machine. This leads to a different S-N curve with respect to the ones obtained through meshing gear tests. This study aims to investigate the impact of cracks in the tooth root on the results of pulsator and meshing tests. Here, we address the issue of load sharing modification during meshing due to the presence of a crack, and its influence on crack propagation. This approach is applied to a real-life example: estimating the finite life of meshing gears based on pulsator tests. This study aims to present an initial procedure for obtaining S-N curves for meshing gears based on those obtained from pulsator tests. The S-N curves obtained from the pulsator test are compensated for by adding the difference in the propagation speed between the two tests calculated by applying the Paris law with parameters extracted from FE simulation; the time spent in propagation is almost doubled in the meshing conditions.
1. Introduction
Fatigue is a phenomenon that affects almost every mechanical system [1]. If not properly considered, it can cause the failure of the component during work. Of course, gears are not exempt from it. They have various fatigue failure mechanisms (e.g., [2,3,4,5]): macro and micro pitting, tooth flank fracture and tooth root fracture (also called tooth root bending fatigue). The last one is considered one of the most critical, as it may lead to the sudden interruption of the power flow in the gearbox. Concerning this mechanism, the standards ISO 6336 series [6,7] and AGMA 2001-D04 [8] provide an analytical calculation framework for the assessment of a gear pair; they propose values of the fatigue limit for the most common combinations of heat treatment and materials, but they cannot cover all the possible combinations; hence, experimental campaigns are strongly suggested. The standards also propose an SN curve whose fatigue knee is located at 3 million cycles.
Two testing methodologies are used to evaluate the actual strength of the tooth root: running gear tests (e.g., [9,10,11]) and pulsator tests (e.g., [11,12,13,14,15,16]). The former uses two meshing gears to perform the fatigue test, while in the latter, the load is applied by anvils only to one tooth (or a pair of teeth) at a time in a fixed position. More details on various test setups can be found in [17,18].
The absence of gear meshing within pulsator tests implies some differences. The ones that are typically considered (e.g., [10,19,20,21,22,23,24]) are of a statistical and fatigue nature. There is also a third one, which is the different load application frequency [25,26].
The first difference arises from the different statistical nature of the specimen adopted in the pulsator test (i.e., a tooth or a teeth pair) while in the meshing gear test (MG) the focus is a system of teeth (or a system of tooth pairs).In the pulsator test, the failure of a tooth is predetermined (the failed one is the tested tooth or teeth pair) while in MG a gear is considered failed when only one tooth fails, and this tooth is considered as the weakest one. This problem can be addressed by adopting statistical consideration as suggested in [10,19,20,22,25,27] or using corrective coefficients—still derived based on the typical test scatter—as proposed in [28].
The second difference is related to the different stress history produced by the pulsator and MG, which leads to different fatigue damage [21]. In particular, the pulsator test produces a sinusoidal stress history generated by the pulsating loading applied by the machine; furthermore, this stress is typically in a load ratio between almost zero and 0.1. On the other hand, MG presents a more complex stress history that results in a non-proportional stress tensor and whose trend depends on the system stiffness. This problem can be addressed using corrective coefficients such as Rettig’s one [27], approaches similar to the Goodman diagram as proposed by [19,20], and high-cycle multi-axial fatigue criteria [21,29,30,31].
The third difference, less known, is related to the different frequency at which the load is applied and has only been discussed in [25,26]. To better explain this difference, an example must be made: if we consider a 20-tooth pinion, we have 20 load cycles for each rotation. The load at which the teeth are loaded is not applied at the gear rotation frequency, but at the meshing frequency. If that rotation occurs at 25 [Hz] (1500 rpm) the load frequency is at Hz. On the other hand, pulsator tests are typically performed at a frequency around 20–40 Hz.
The gear literature presents two contradictory experimental examples. On the one hand, in [25], while discussing this difference, an experimental comparative curve is present. The curve obtained using a higher-frequency pulsator shows a higher lifetime, while no indication or data representing the endurance limit are present. On the other hand, Stringer et al. [32], while discussing their high-frequency pulsator test rig (up to 1 kHz), show a comparative curve in which the lifetime shown by the specimen tested in their pulsator is not statistically different from those obtained using a classical pulsator rig. The classical literature regarding fatigue (e.g., [33,34]) provides a clearer discussion about the effect of loading frequency on the fatigue strength. Accordingly, there is an effect of the frequency only if the higher frequencies produce an excessive overheating of the stressed volume, hence locally reducing the material properties. If the tests present the possibility of controlling the specimen temperature, the load application frequency does not affect the fatigue resistance.
All relatively high-speed geared applications are kept lubricated within an oil bath [35], which is necessary to avoid the dry contact between surfaces and, most importantly, to remove heat [36,37]. Furthermore, MG tests are lubricated with oil kept at a constant temperature. It is logical to assume that the cooling action provided by the lubricating oil is more than enough to also remove the heat generated by the repeated loading of the tooth root. It is not the case that Stringer et al. [32] tests are performed submerged in constant temperature oil and that their high frequency does not affect the results. Hence, while its presence should be, at least, known, the available data suggests that the loading frequency does not play a significant role in the difference between the pulsator test and the meshing gears test.
All the aforementioned phenomena cannot explain completely the differences in the results of the two testing methodologies. More precisely, there is a discrepancy related to the lifetime, with MG showing a higher value. Previous studies [38] have suggested that a partial explanation might be the effect of the tooth root crack, which modifies the Meshing Stiffness (MS) of the damaged teeth pair, lowering the maximum load acting on the damaged tooth, reducing the crack growth rate. Crack propagation in pulsator tests is indeed not a negligible portion of the lifetime shown; it might take from 10% to 30% of the root lifetime [39,40,41,42,43,44,45]. Previous work by the authors (i.e., [24]) showed that all of the above modify the lifetime, in which the case studied showed that crack propagation in MG might require between 40% and 130% more time than in the pulsator case. Hence, the MG lifetime can increase by more than 20% by considering the typical proportion of crack nucleation and propagation in pulsator tests.
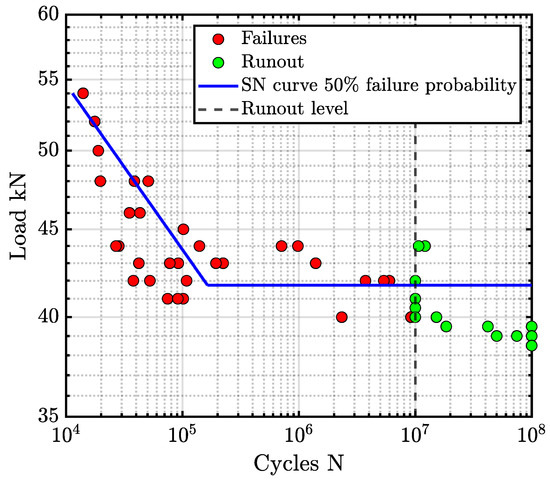
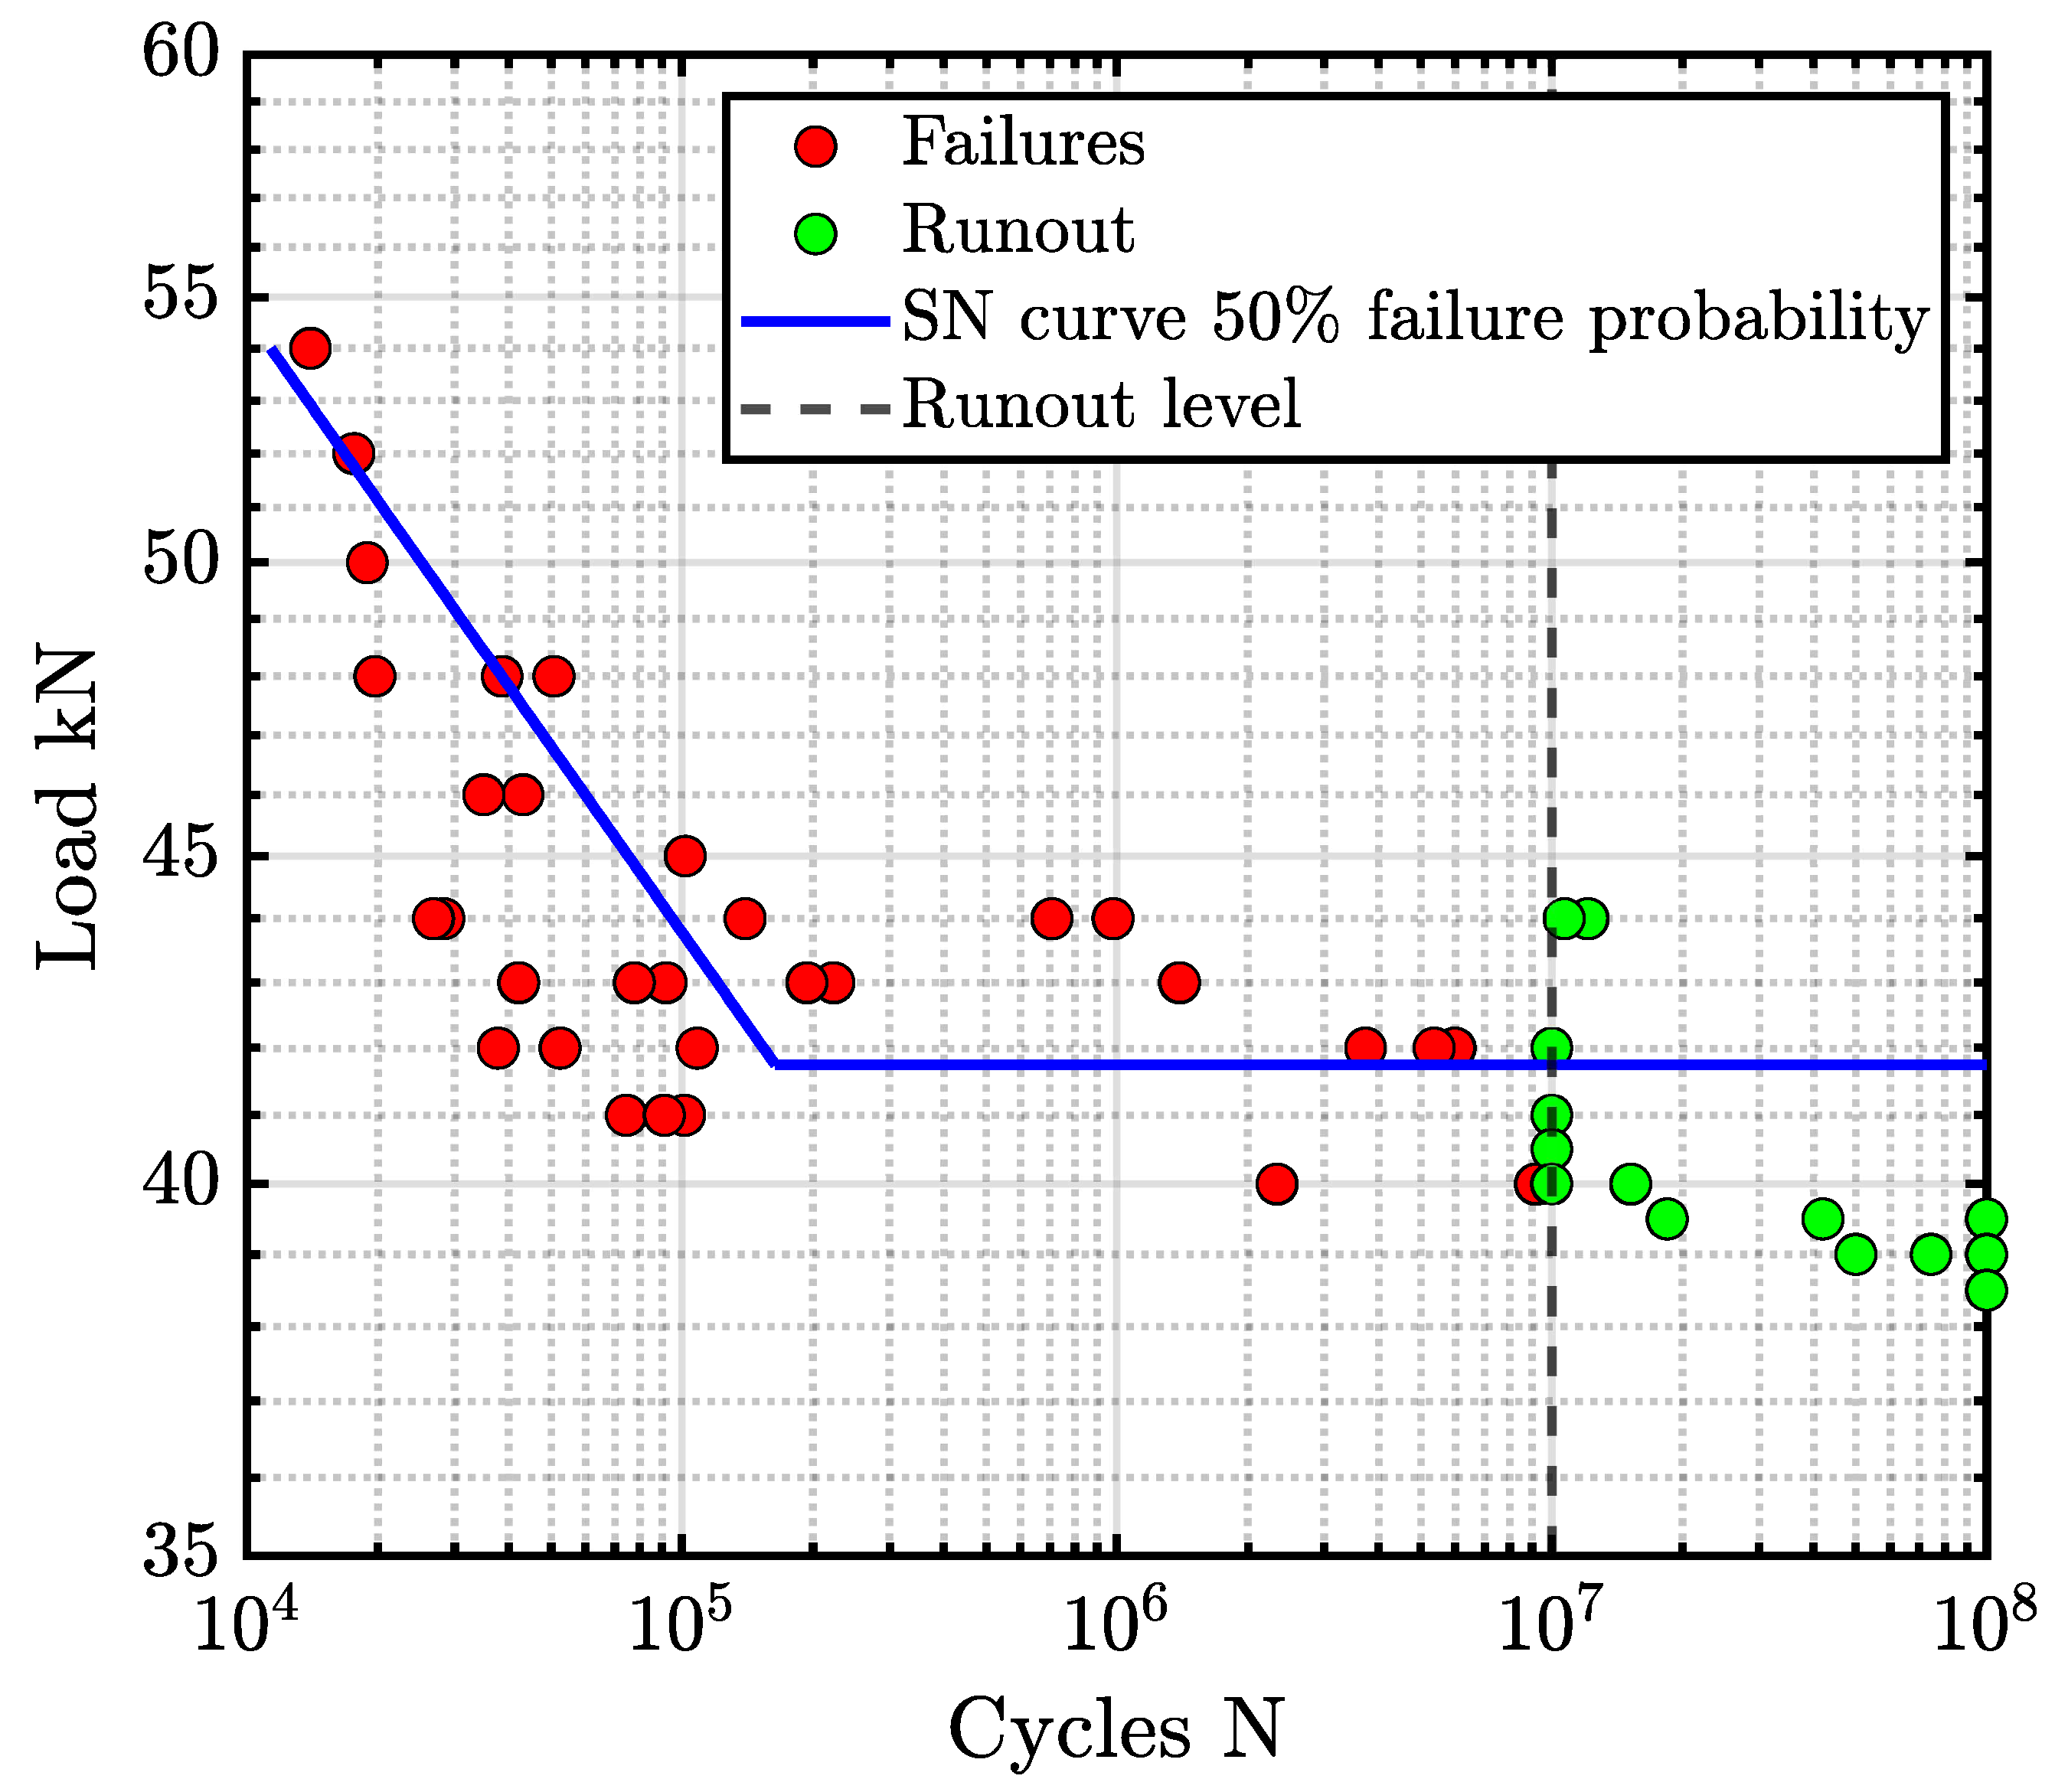
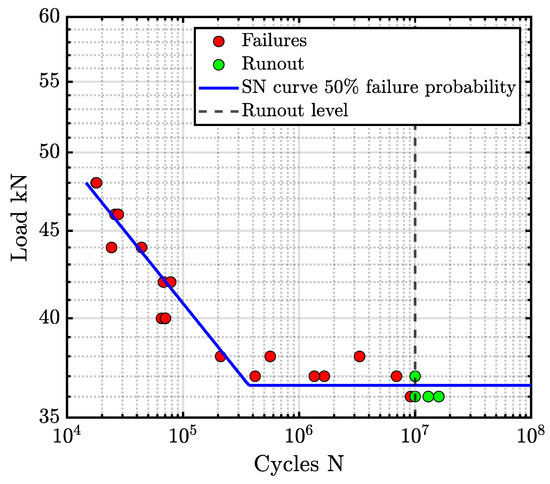
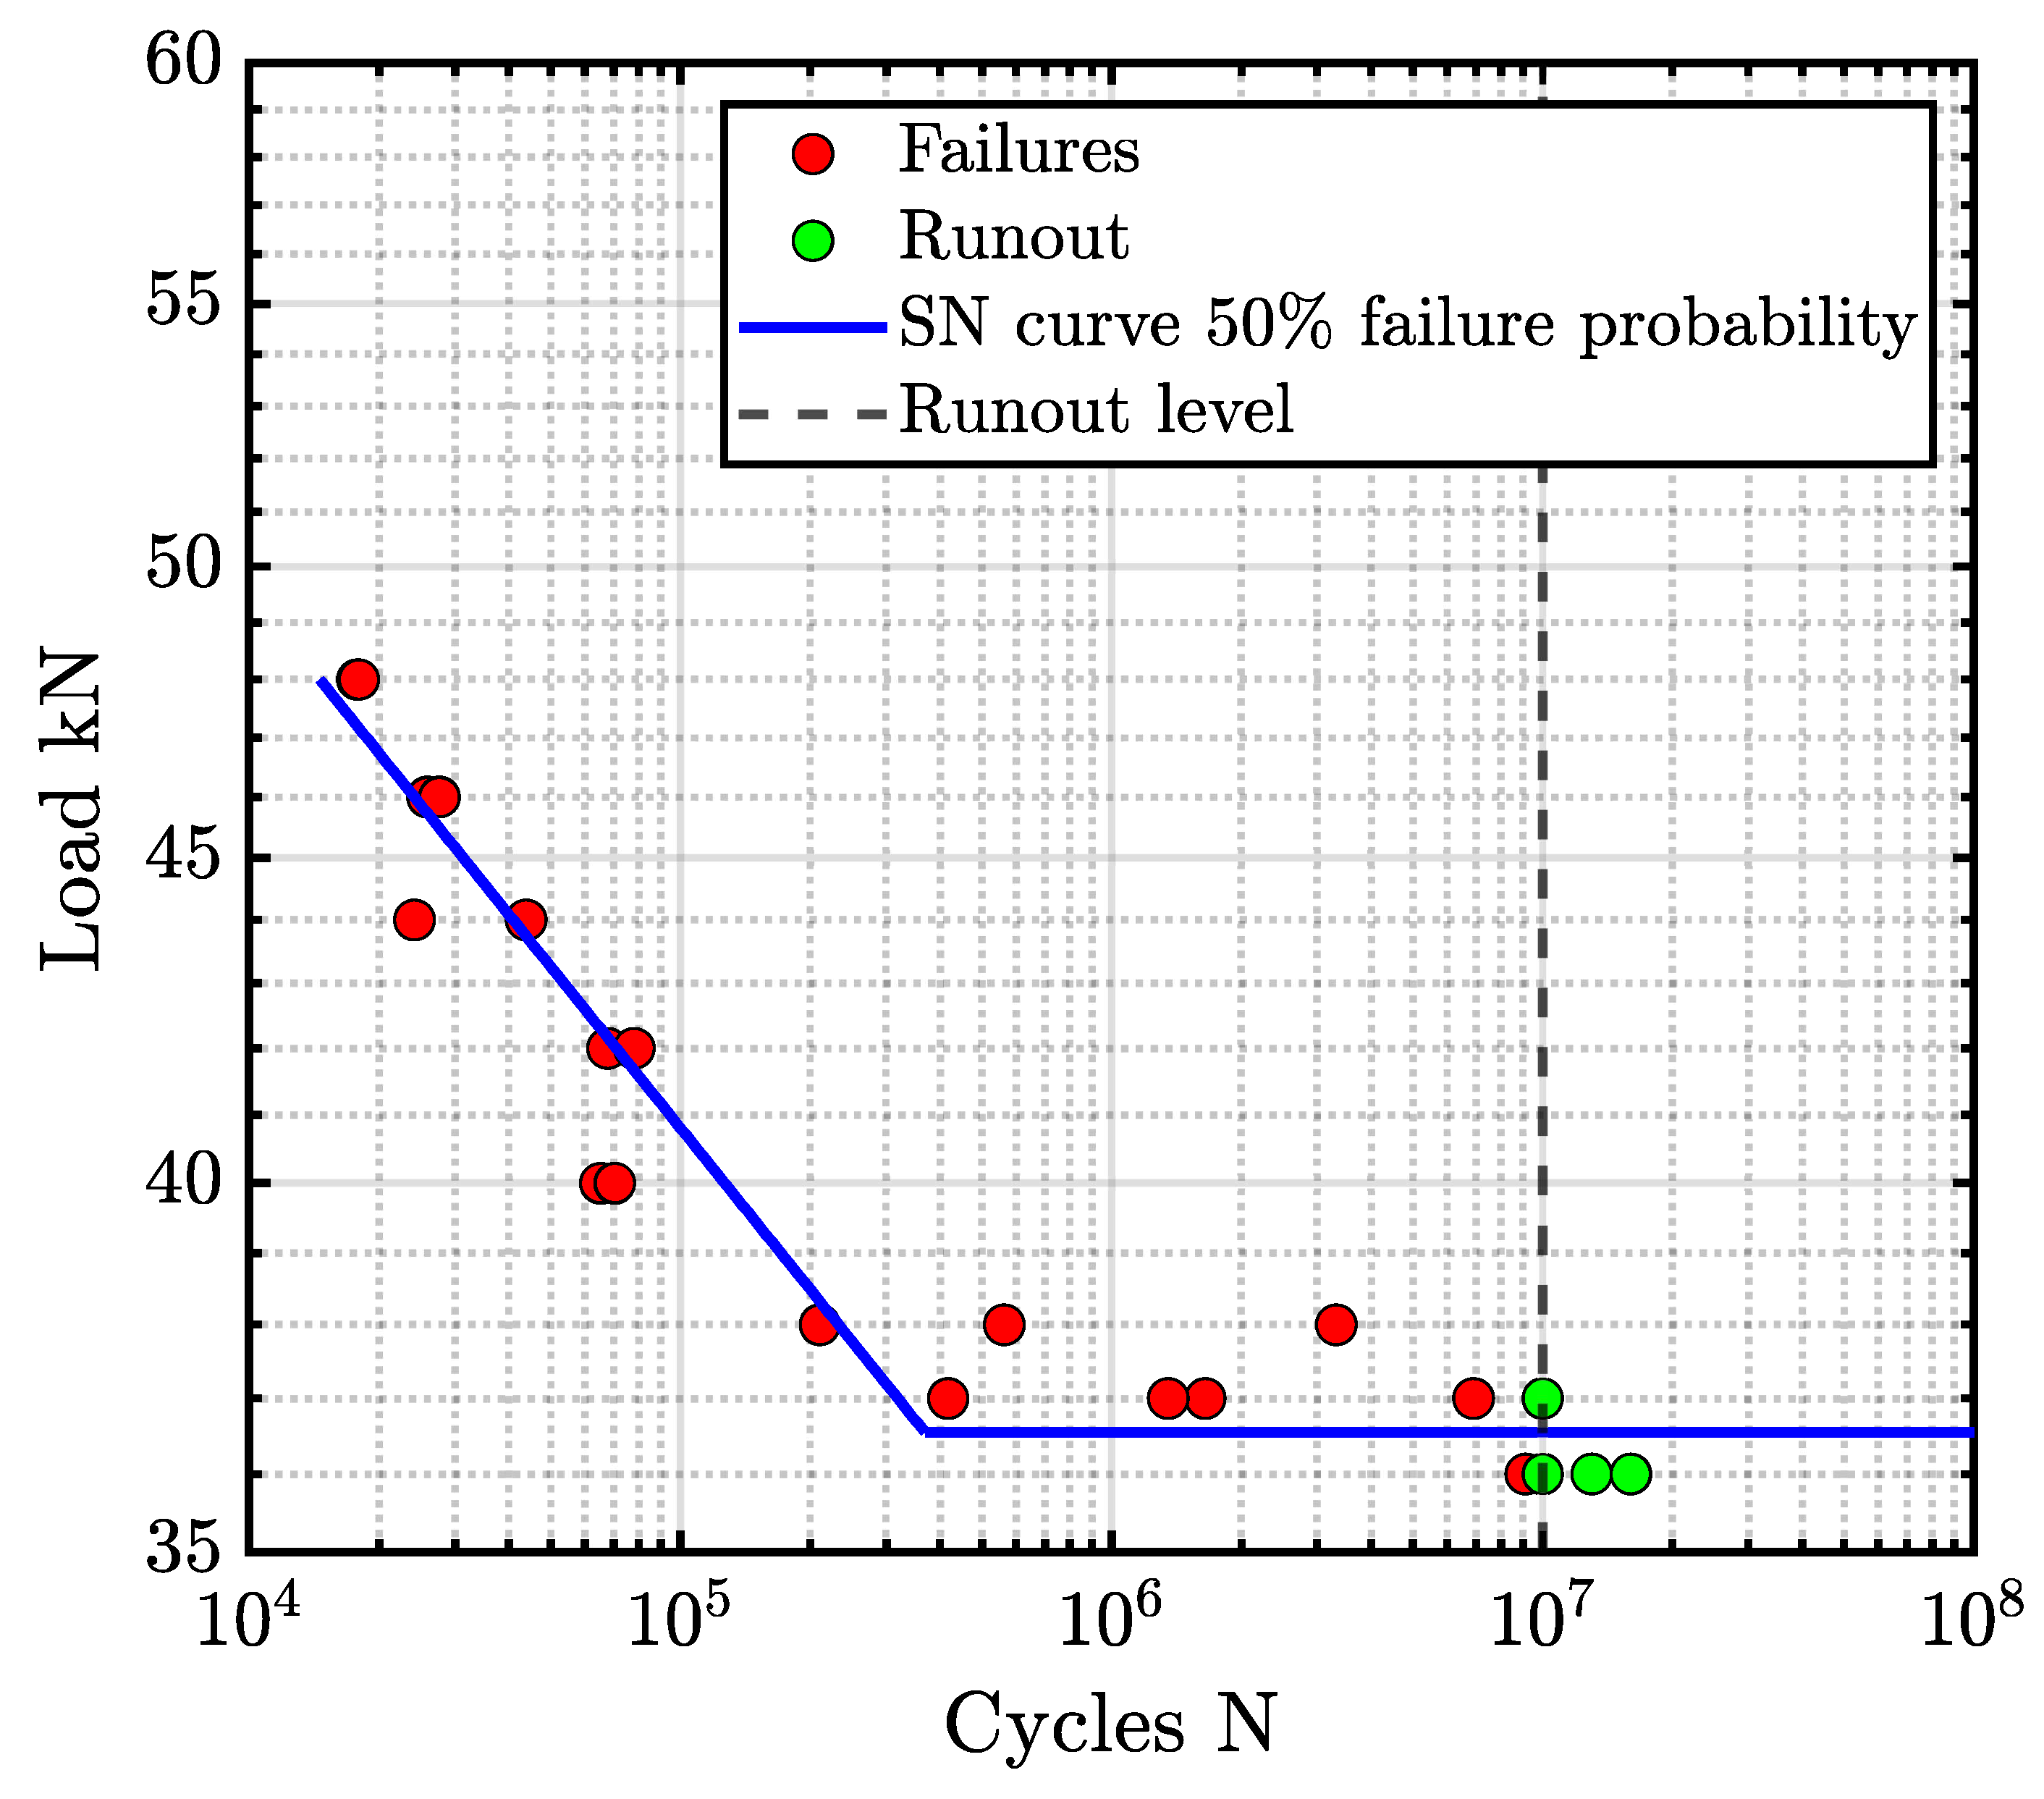
This article focuses on the effect of the load application method, in particular, on the effect of the crack presence at the tooth root on the load distribution in the two tests and how it influences its propagation. Here, a method is proposed capable of compensating for the pulsator experimental SN curve; in particular, the final number of cycles is modified by taking into account the different propagation time between the pulsator test and the running gear test, an aspect not yet included in the classical approaches used to elaborate pulsator data [10,19,20,22,25,27,28]. All the above is justified by the fact that the propagation time of a tooth root crack is not a negligible aspect of the root lifetime. Here, two different families of case hardened gears tested via the pulsator test are used as an application example (Figure 1 and Figure 2).
Figure 1.
Gear A points and SN curve.
Figure 2.
Gear B points and SN curve. The runouts at 36 kN have been shifted for visualization.
In the following sections, the procedure used to study these aspects will be discussed. First of all, experimental data are described, and then an overview of the adopted finite element (FE) models is presented. Finally, the crack propagation study and the application example are provided.
2. Experimental Tests
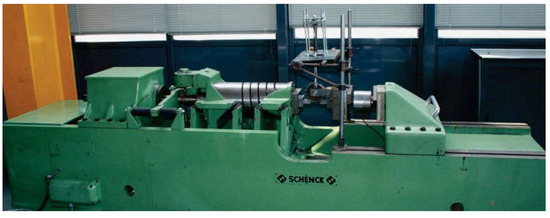
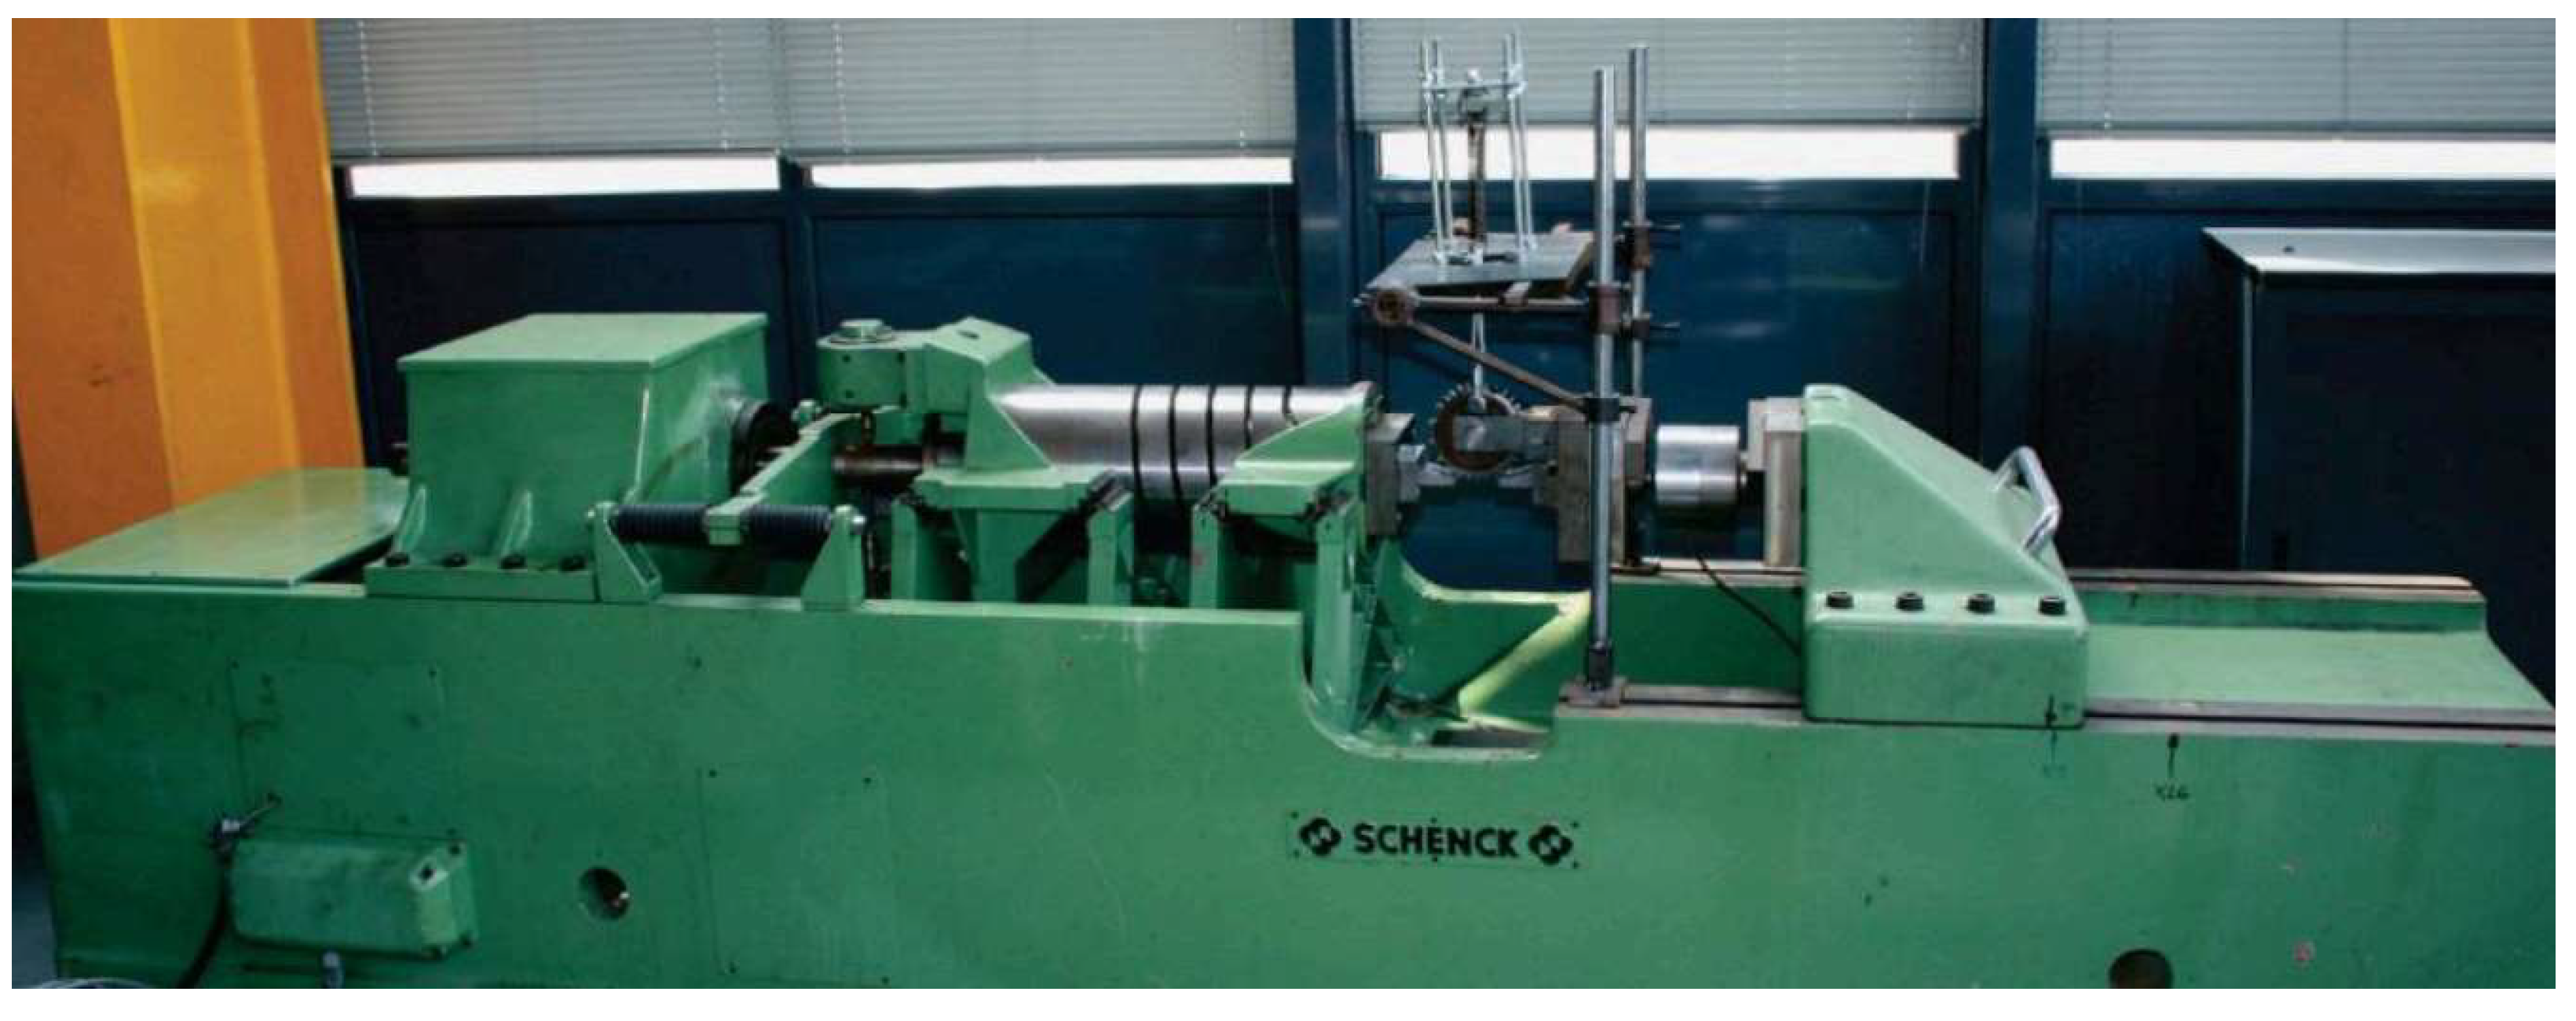
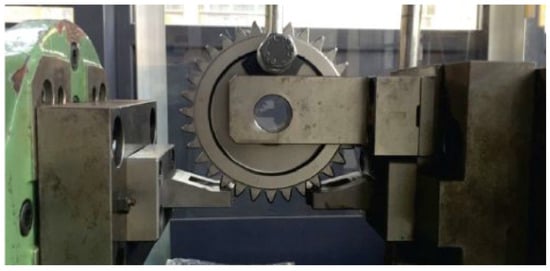
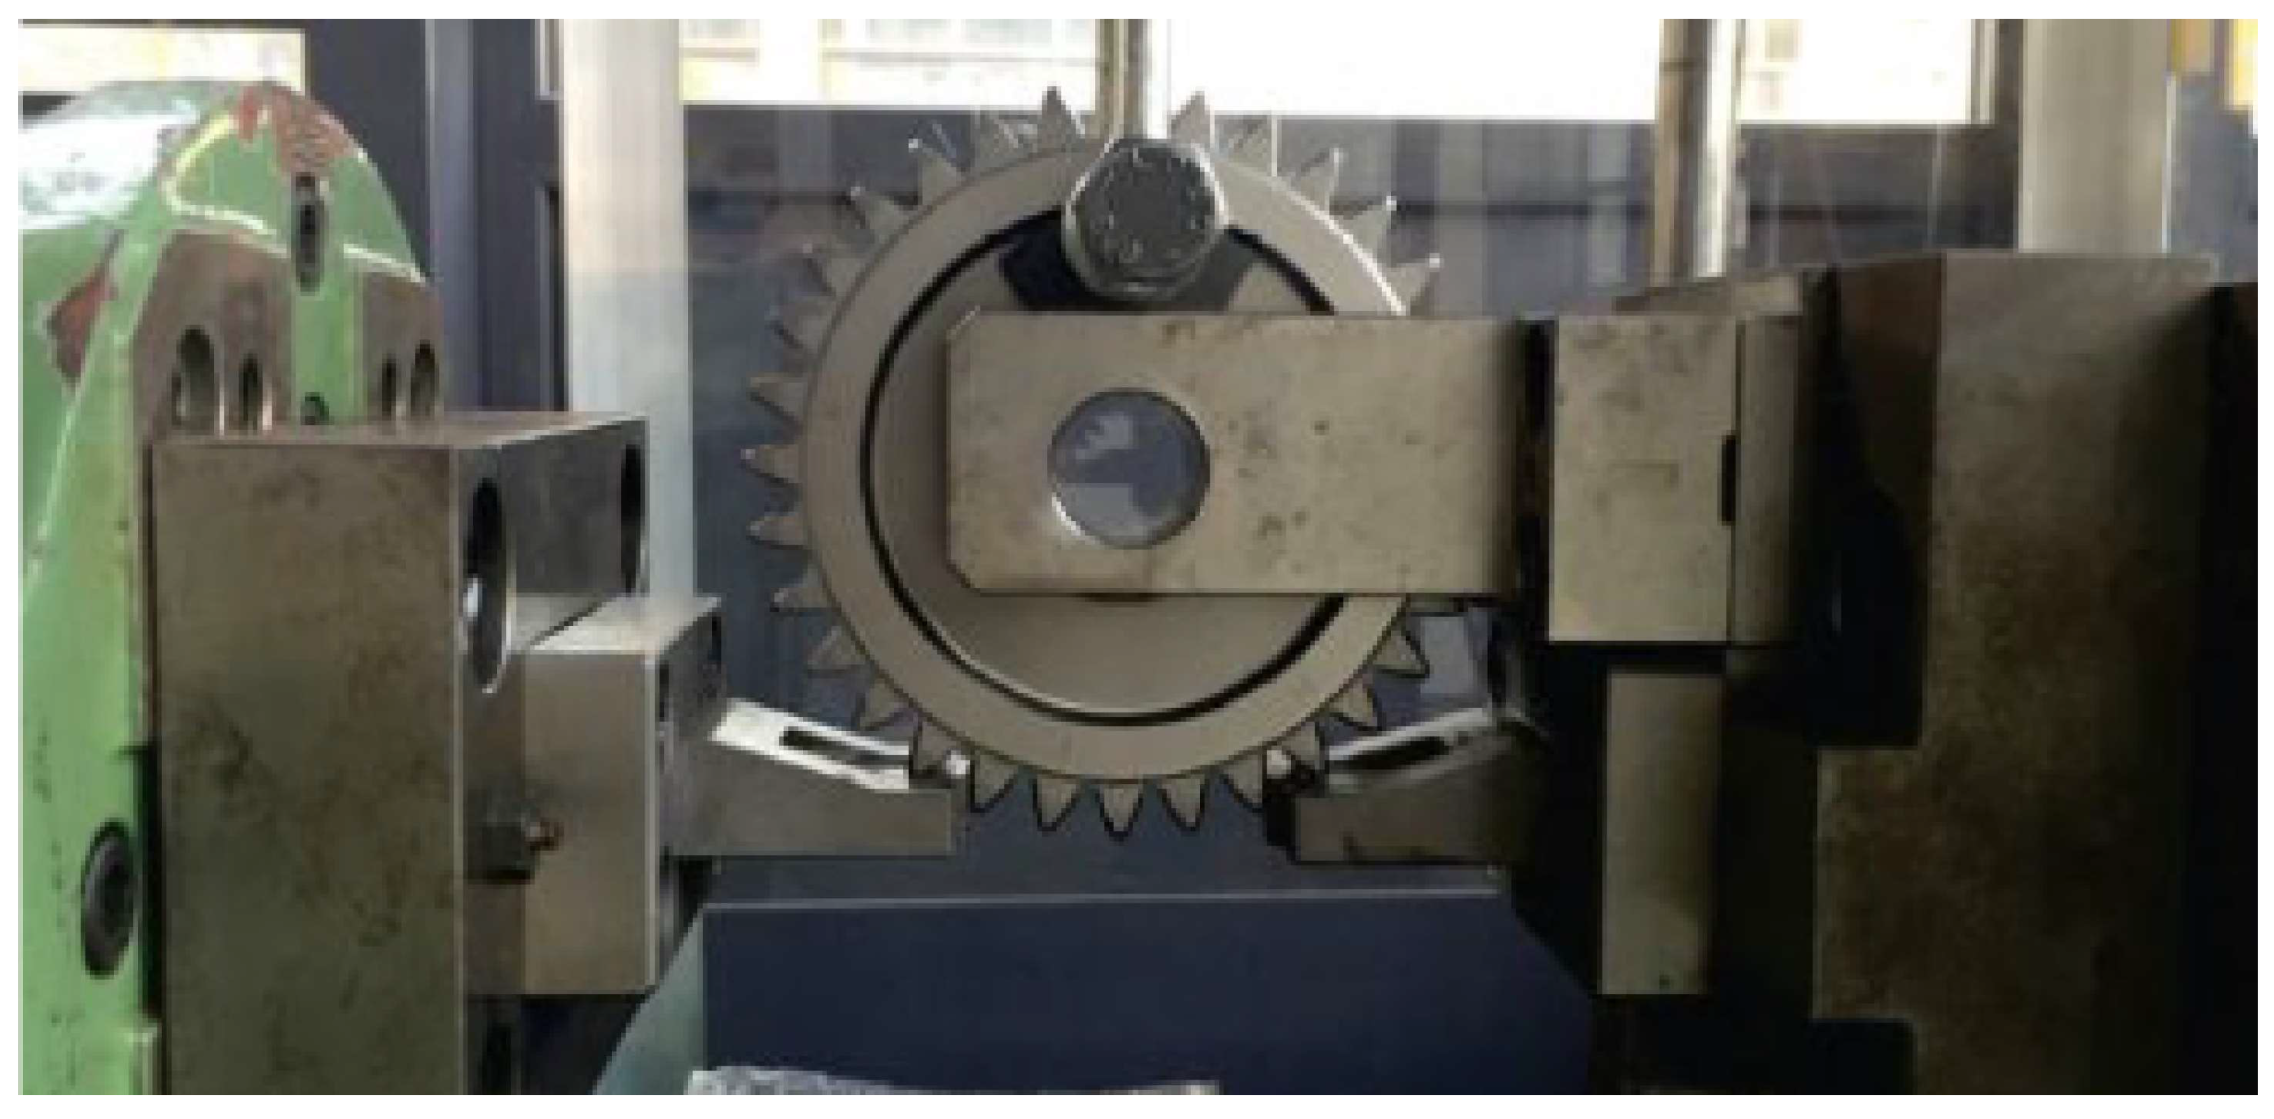
Pulsator tests have been conducted on a mechanical resonance Schenk pulsator (i.e., Figure 3 and Figure 4) with a max load capacity of 60 kN and a working frequency of almost 35 Hz. A symmetric pulsator configuration is used here (see Figure 4). Hence, thanks to the property of the Wildhaber span measurement and the correct design of the fixing system, the load is applied equally to two selected teeth, leading to the same tooth root stress. A load ratio of R = 0.1 is chosen as suggested by [46,47], allowing for the test scalability.
Figure 3.
Schenk pulsator.
Figure 4.
Detail of gear and anvils.
The gear geometry used in this study was defined previously and had been used in a two-decade experimental campaign on aerospace gears. A peculiar geometrical detail is that the position at which the pulsator applies the load corresponds to the outermost point of single tooth contact when the gear meshes with itself. The gear geometry is reported in Table 1. In this study, the material of the gears is AISI 9310, a case-hardening steel typically employed for aerospace applications. All experimental details can be found in [48,49,50].
Table 1.
Gear geometry.
Two families are discussed and identified: “A” and “B”. The difference between the two is the grade of cleanness of the material derived from their production process; in particular “A” is made AISI 9310 VIM VAR, while “B” is made in AISI 9310 VAR. Figure 1 and Figure 2 report the points acquired during the tests. The S-N curve presents two regions: the limited life and the fatigue limit. The limited life line is obtained by linearly interpolating the points of this region, while the fatigue limit is obtained according to Hück [51]. The interested reader is referred to [23,28] for further details regarding the adopted procedure.
The S-N curve shows that the knee is well below cycles, consistent with the general trend reported in [38].
3. Numerical Models
To properly analyze the difference in load exchanged by the teeth and the consequent tooth root stress, it is necessary to understand the behavior of the gear in the two test conditions: pulsator test and running gears. Analytical solutions for the tooth root stress are proposed in the standards [6,8]. The obtained results are approximations of the real stress and load values, whose real values can be obtained more precisely using the finite elements. Moreover, the analysis performed here goes far beyond what the standards predict, as it introduces the presence of the root crack, an aspect that is clearly not considered in the gear calculation framework proposed by the standards.
As discussed in [24], while several methods have been developed to simulate and analyze crack initiation and propagation under a prescribed load acting on the tooth (e.g., [52,53,54,55,56]), it is nevertheless necessary to consider the interaction between crack presence and the effective load acting on the tooth. Hence, the running gear simulation has been performed using the calculation step that follows the one described in previous work [21,24], which allows coupling the crack presence with the actual load acting on the tooth.
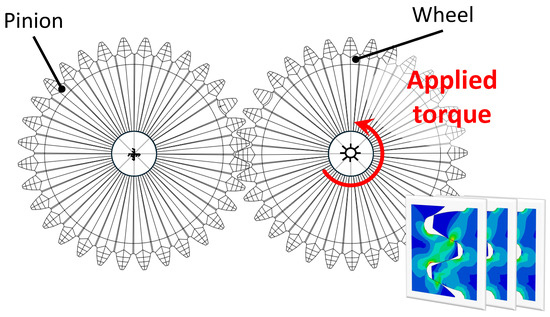
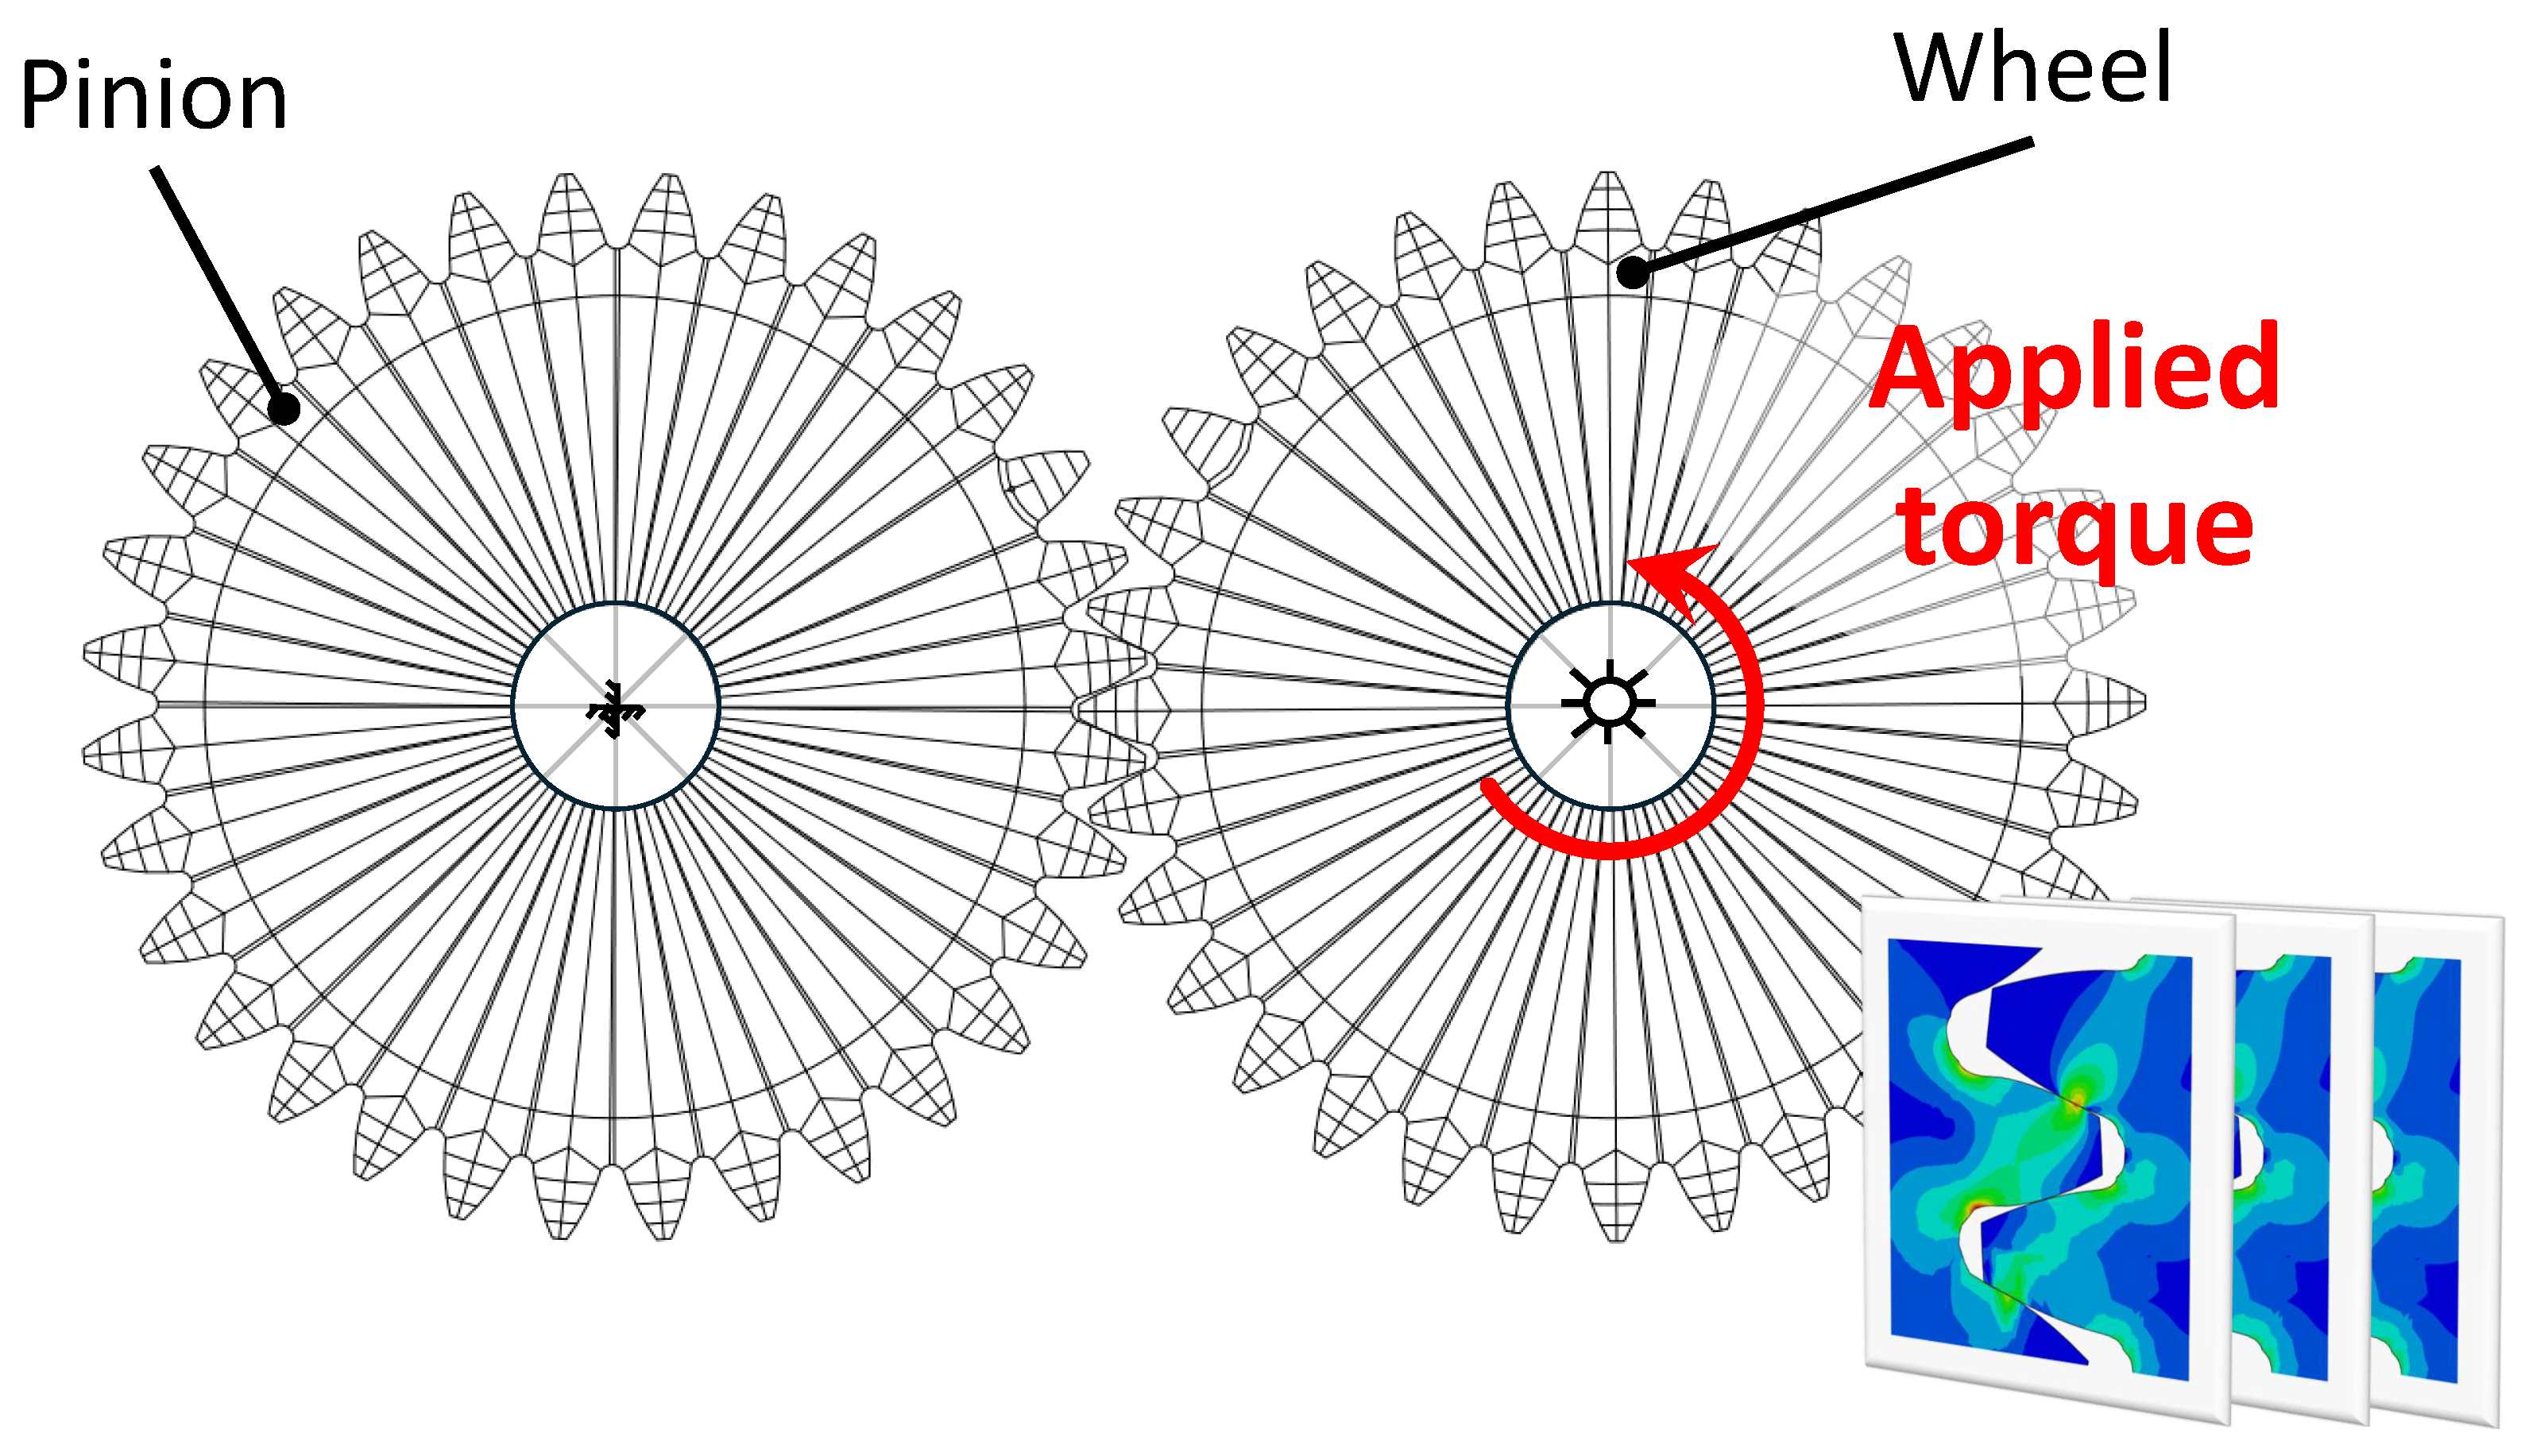
Accordingly, the rotation is discretized in a finite number of positions. That is, the meshing process is simulated using a step-by-step procedure and not a continuous one. In particular, Python 3.10 code controls the gear positions, and Abaqus then performs the simulation. As described by Figure 5, in each simulated position, a reference point, rigidly connected to the gear hubs, is used to apply both the load, namely the torque, and the boundary conditions. The reference point of the pinion (on the left) is constrained in all degrees of freedom, whereas the wheel (on the right) is allowed to rotate only about its axis. The torque is applied at the reference point of the wheel hub. The interaction between mating tooth flanks is described through a surface-to-surface contact formulation.
Figure 5.
Simulation framework showing the applied boundary conditions and loading configuration. The several stress fields represent the step-by-step procedure. The red circular arrow represents the applied torque, while the black lines ending with the black dot are annotation leaders.
For each position, the main quantities of interest are extracted automatically: the contact force, the tooth root stress and the stress intensity factor K. Pulsator case simulations follow the same procedure for crack opening. Under the assumption of linearity in the load case, a unit load is applied here; the results are then scaled so that both cases (meshing and pulsator) show the same stress at the tooth root when the crack is not present.
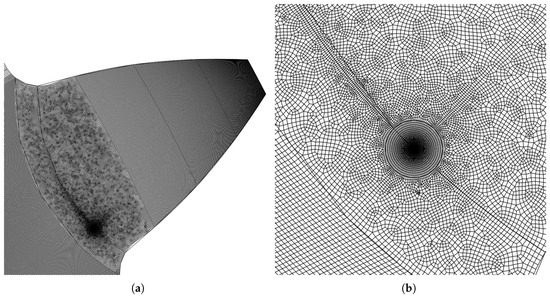
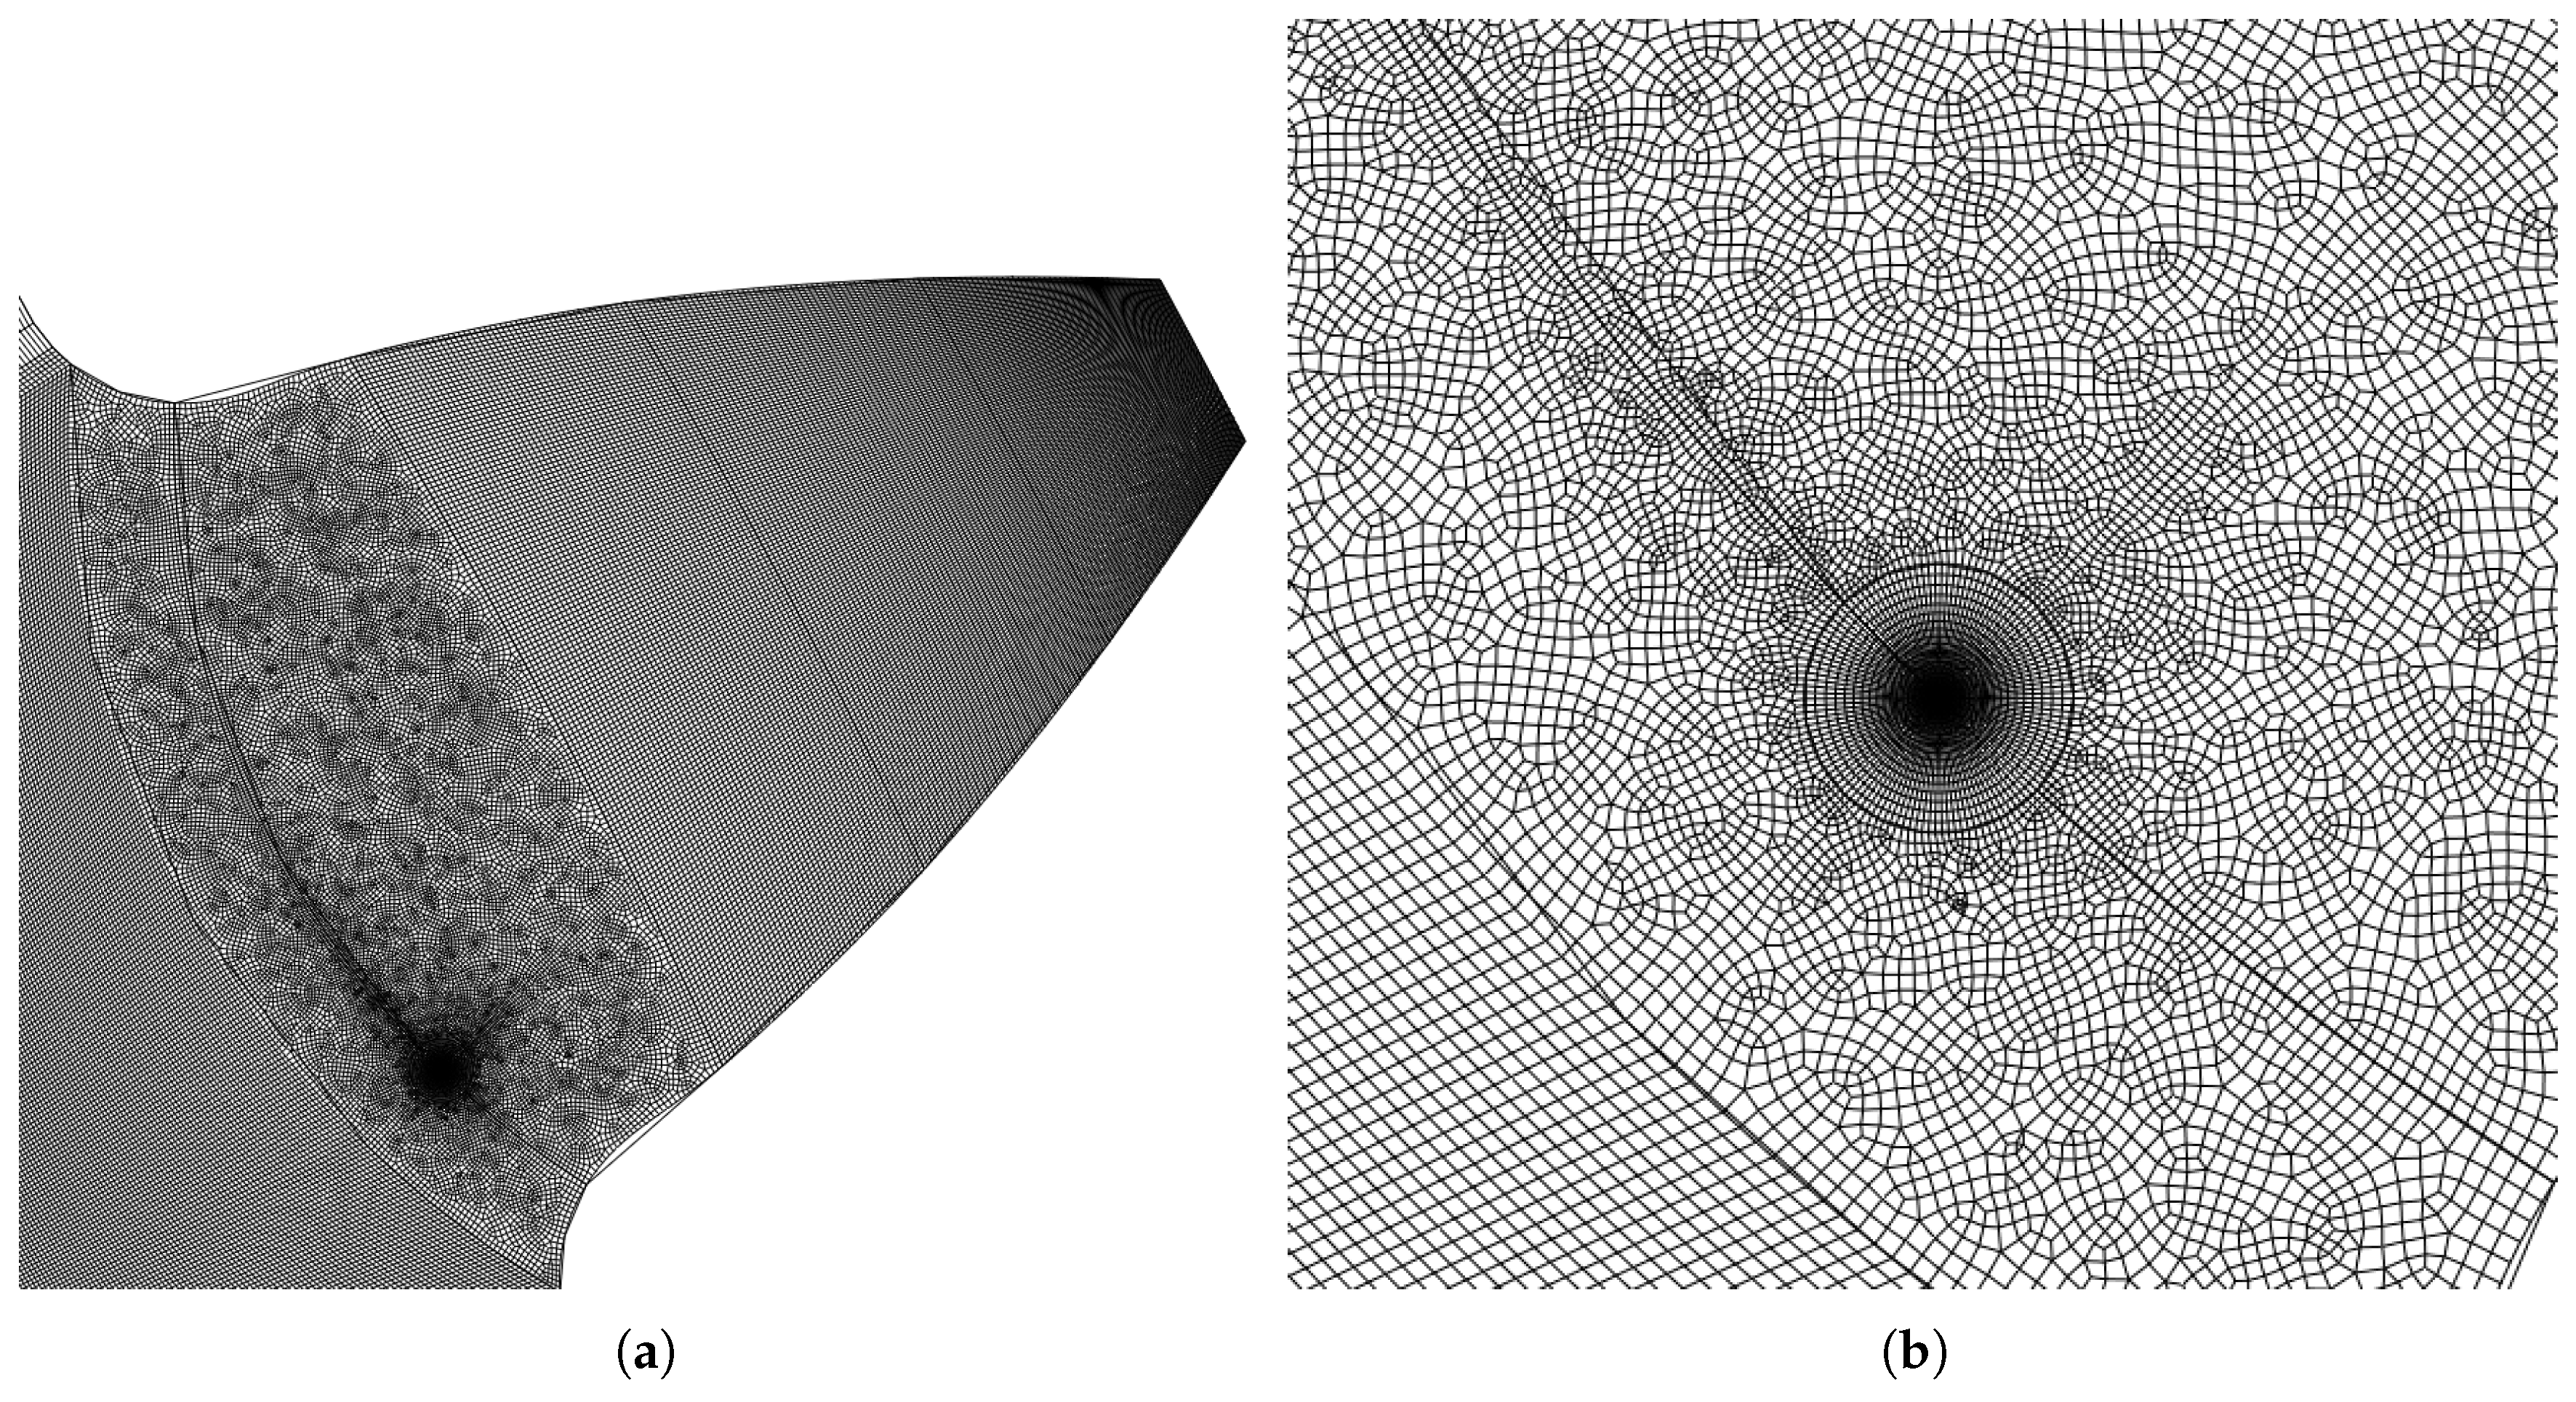
The gears are considered perfectly aligned; hence, the effect of eventual misalignment is not taken into account. This allows to better understand the effect of the load sharing in ideal conditions. For this reasons, following Conrado et al.’s suggestions [57], 2D plane stress elements are used, with a beneficial effect on the computational time. All the simulations are performed using Abaqus adopting CPS4 elements. The quarter-point element technique is adopted at the tip of the crack. In order to improve the estimation of the crack quantities, it is defined following the Abaqus manual in order to guarantee the convergence of K. Figure 6 shows an example of the mesh adopted within each simulation; the mesh size of the cracked tooth is 0.1 mm, while for the other teeth and the gear body, a less refined mesh is used to reduce the computational effort.
Figure 6.
(a) Example of tooth mesh. (b) Quarter point technique detail.
The crack is defined as an arc of a circle, perpendicular to the 30° tooth root tangent on both sides of the tooth root because that is the region identified by the ISO 6336 [6] with the peak of tooth root stress. Crack propagation is imposed as described in previous work [24]; the crack length is defined as a percentage of the arc length (between 0% and 80%). For each of them, the simulations are performed as described above.
4. Numerical Results
The analyses are performed considering various crack lengths as well as different torque levels as reported in Table 2. Those values are selected in order to have the same tooth root stress in both the testing conditions. The tooth root stress reported are the max principal stress obtained through FEM.
Table 2.
Load levels.
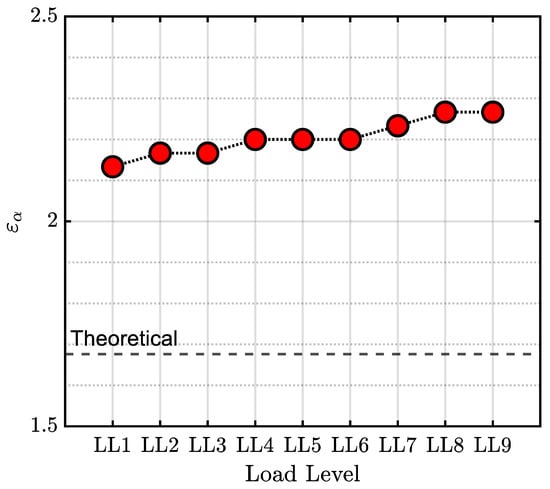
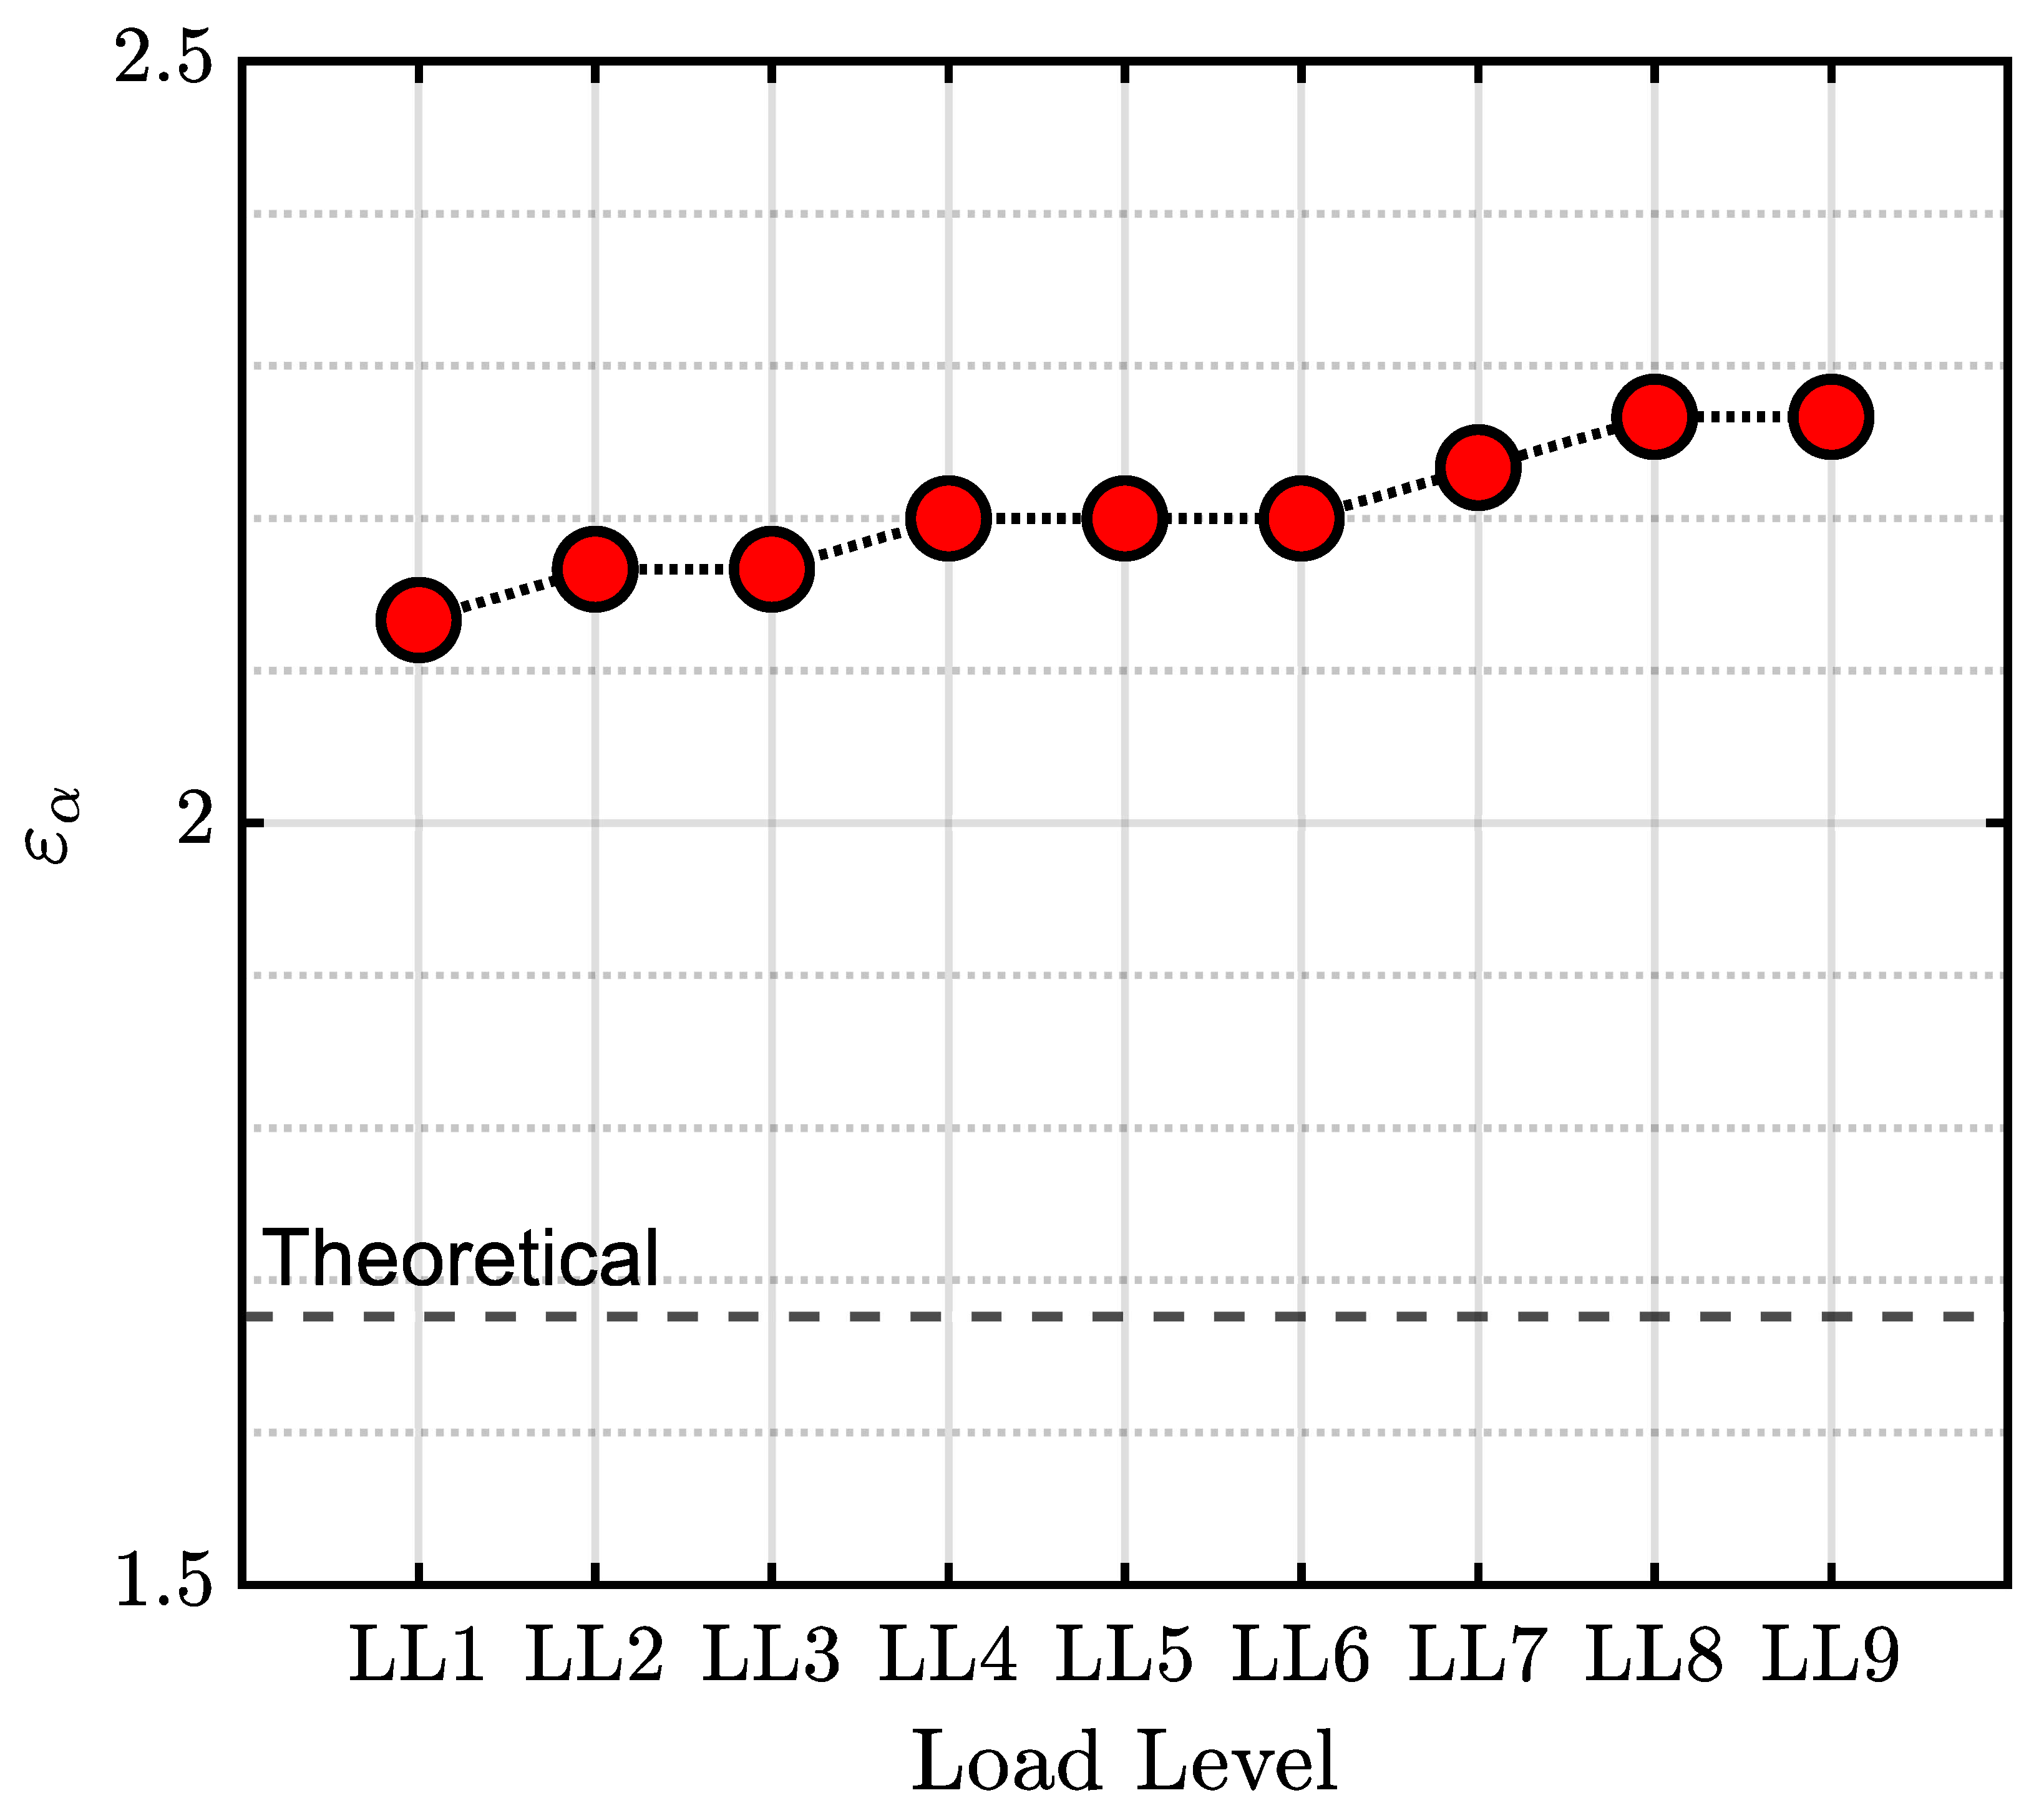
The relationship between the pulsator test loads and the corresponding torque levels (see Table 2) is not perfectly linear due to the influence of the contact ratio under load. In the present case, the nominal contact ratio is , while under load it varies between 2.14 and 2.26 (see Figure 7). This increase is associated with tooth deformation under load, which is more pronounced in the present study than under typical operating conditions. Indeed, the applied torque levels are substantially higher than those encountered in service; the applied loads are those required bring the system to failure. Therefore, they provide larger deformations than those normally observed in operation. This aspect is further emphasized by the fact that the gears under investigation are aerospace ones, for which the test loads are even higher.
Figure 7.
Contact ratio under load, calculated looking at first and last contact positions for the healthy case.
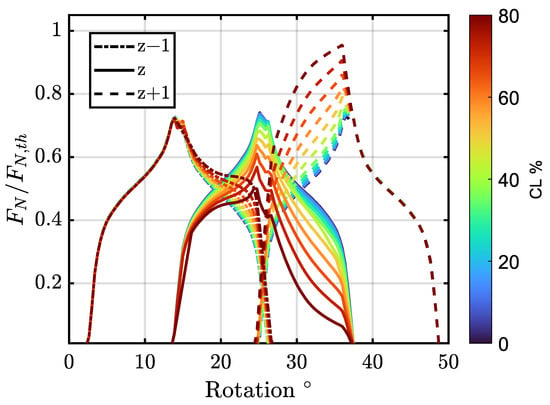
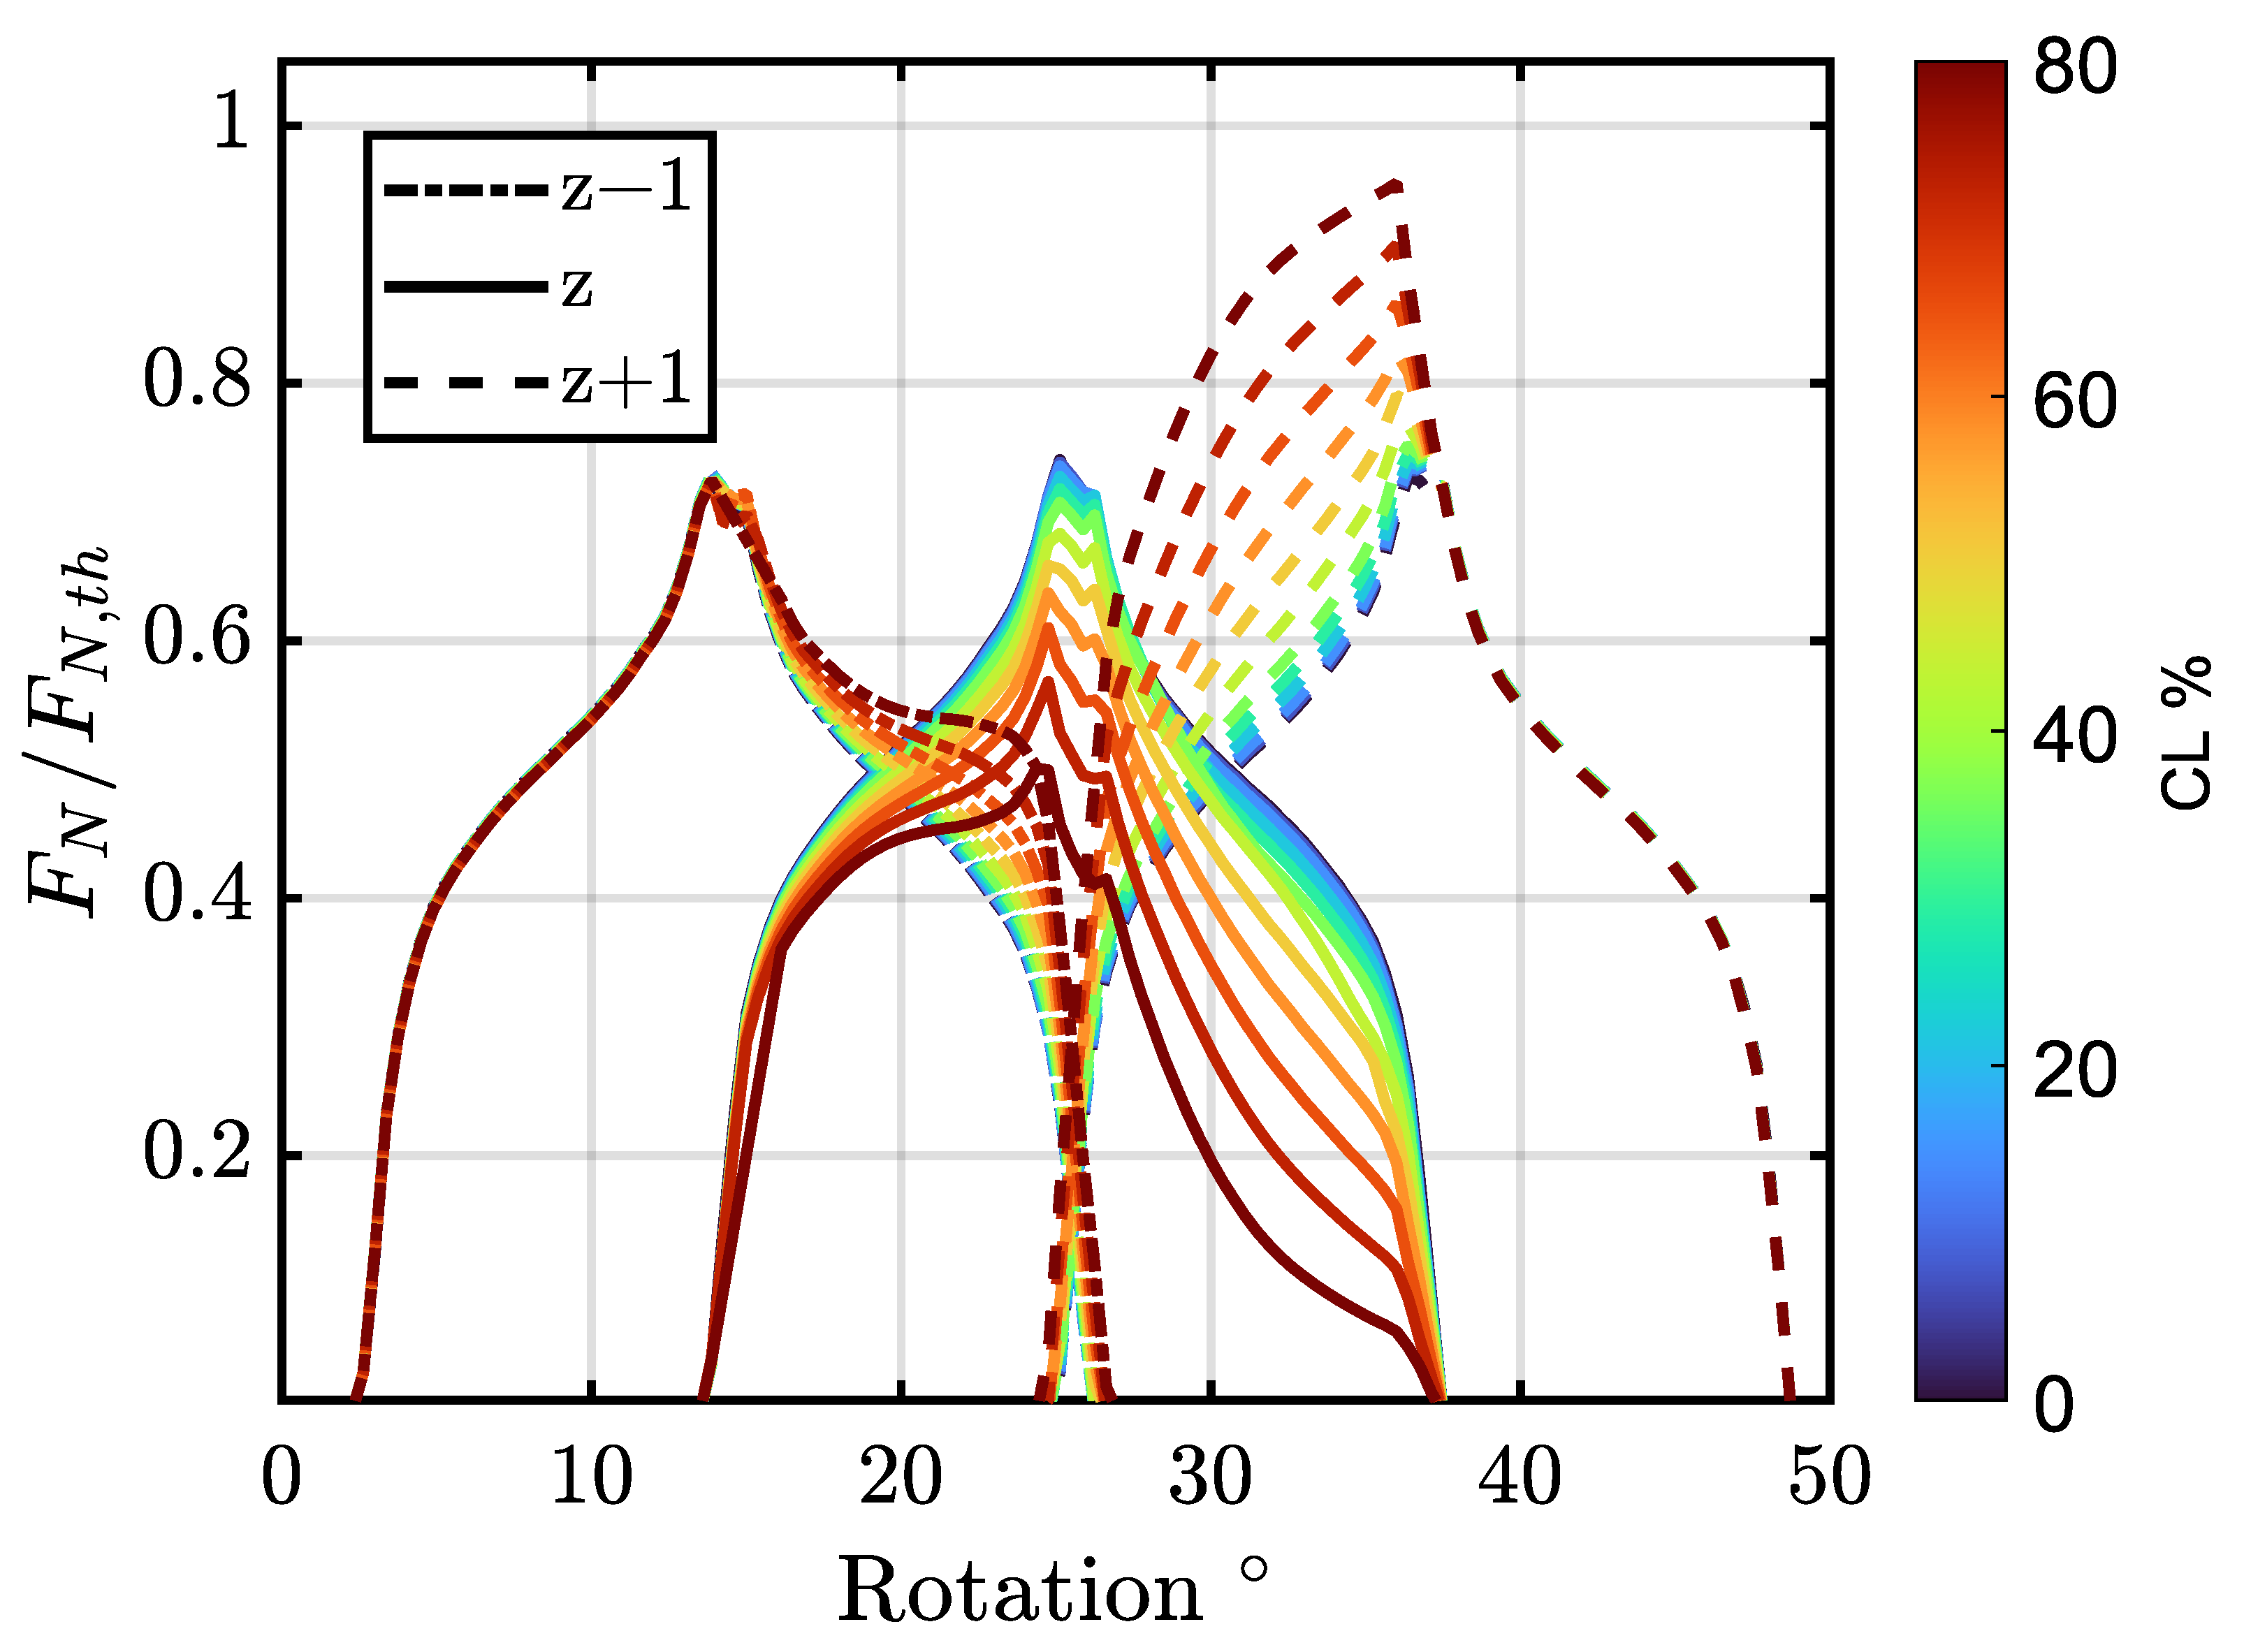
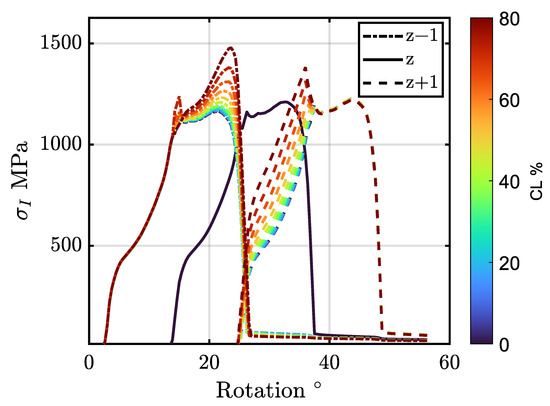
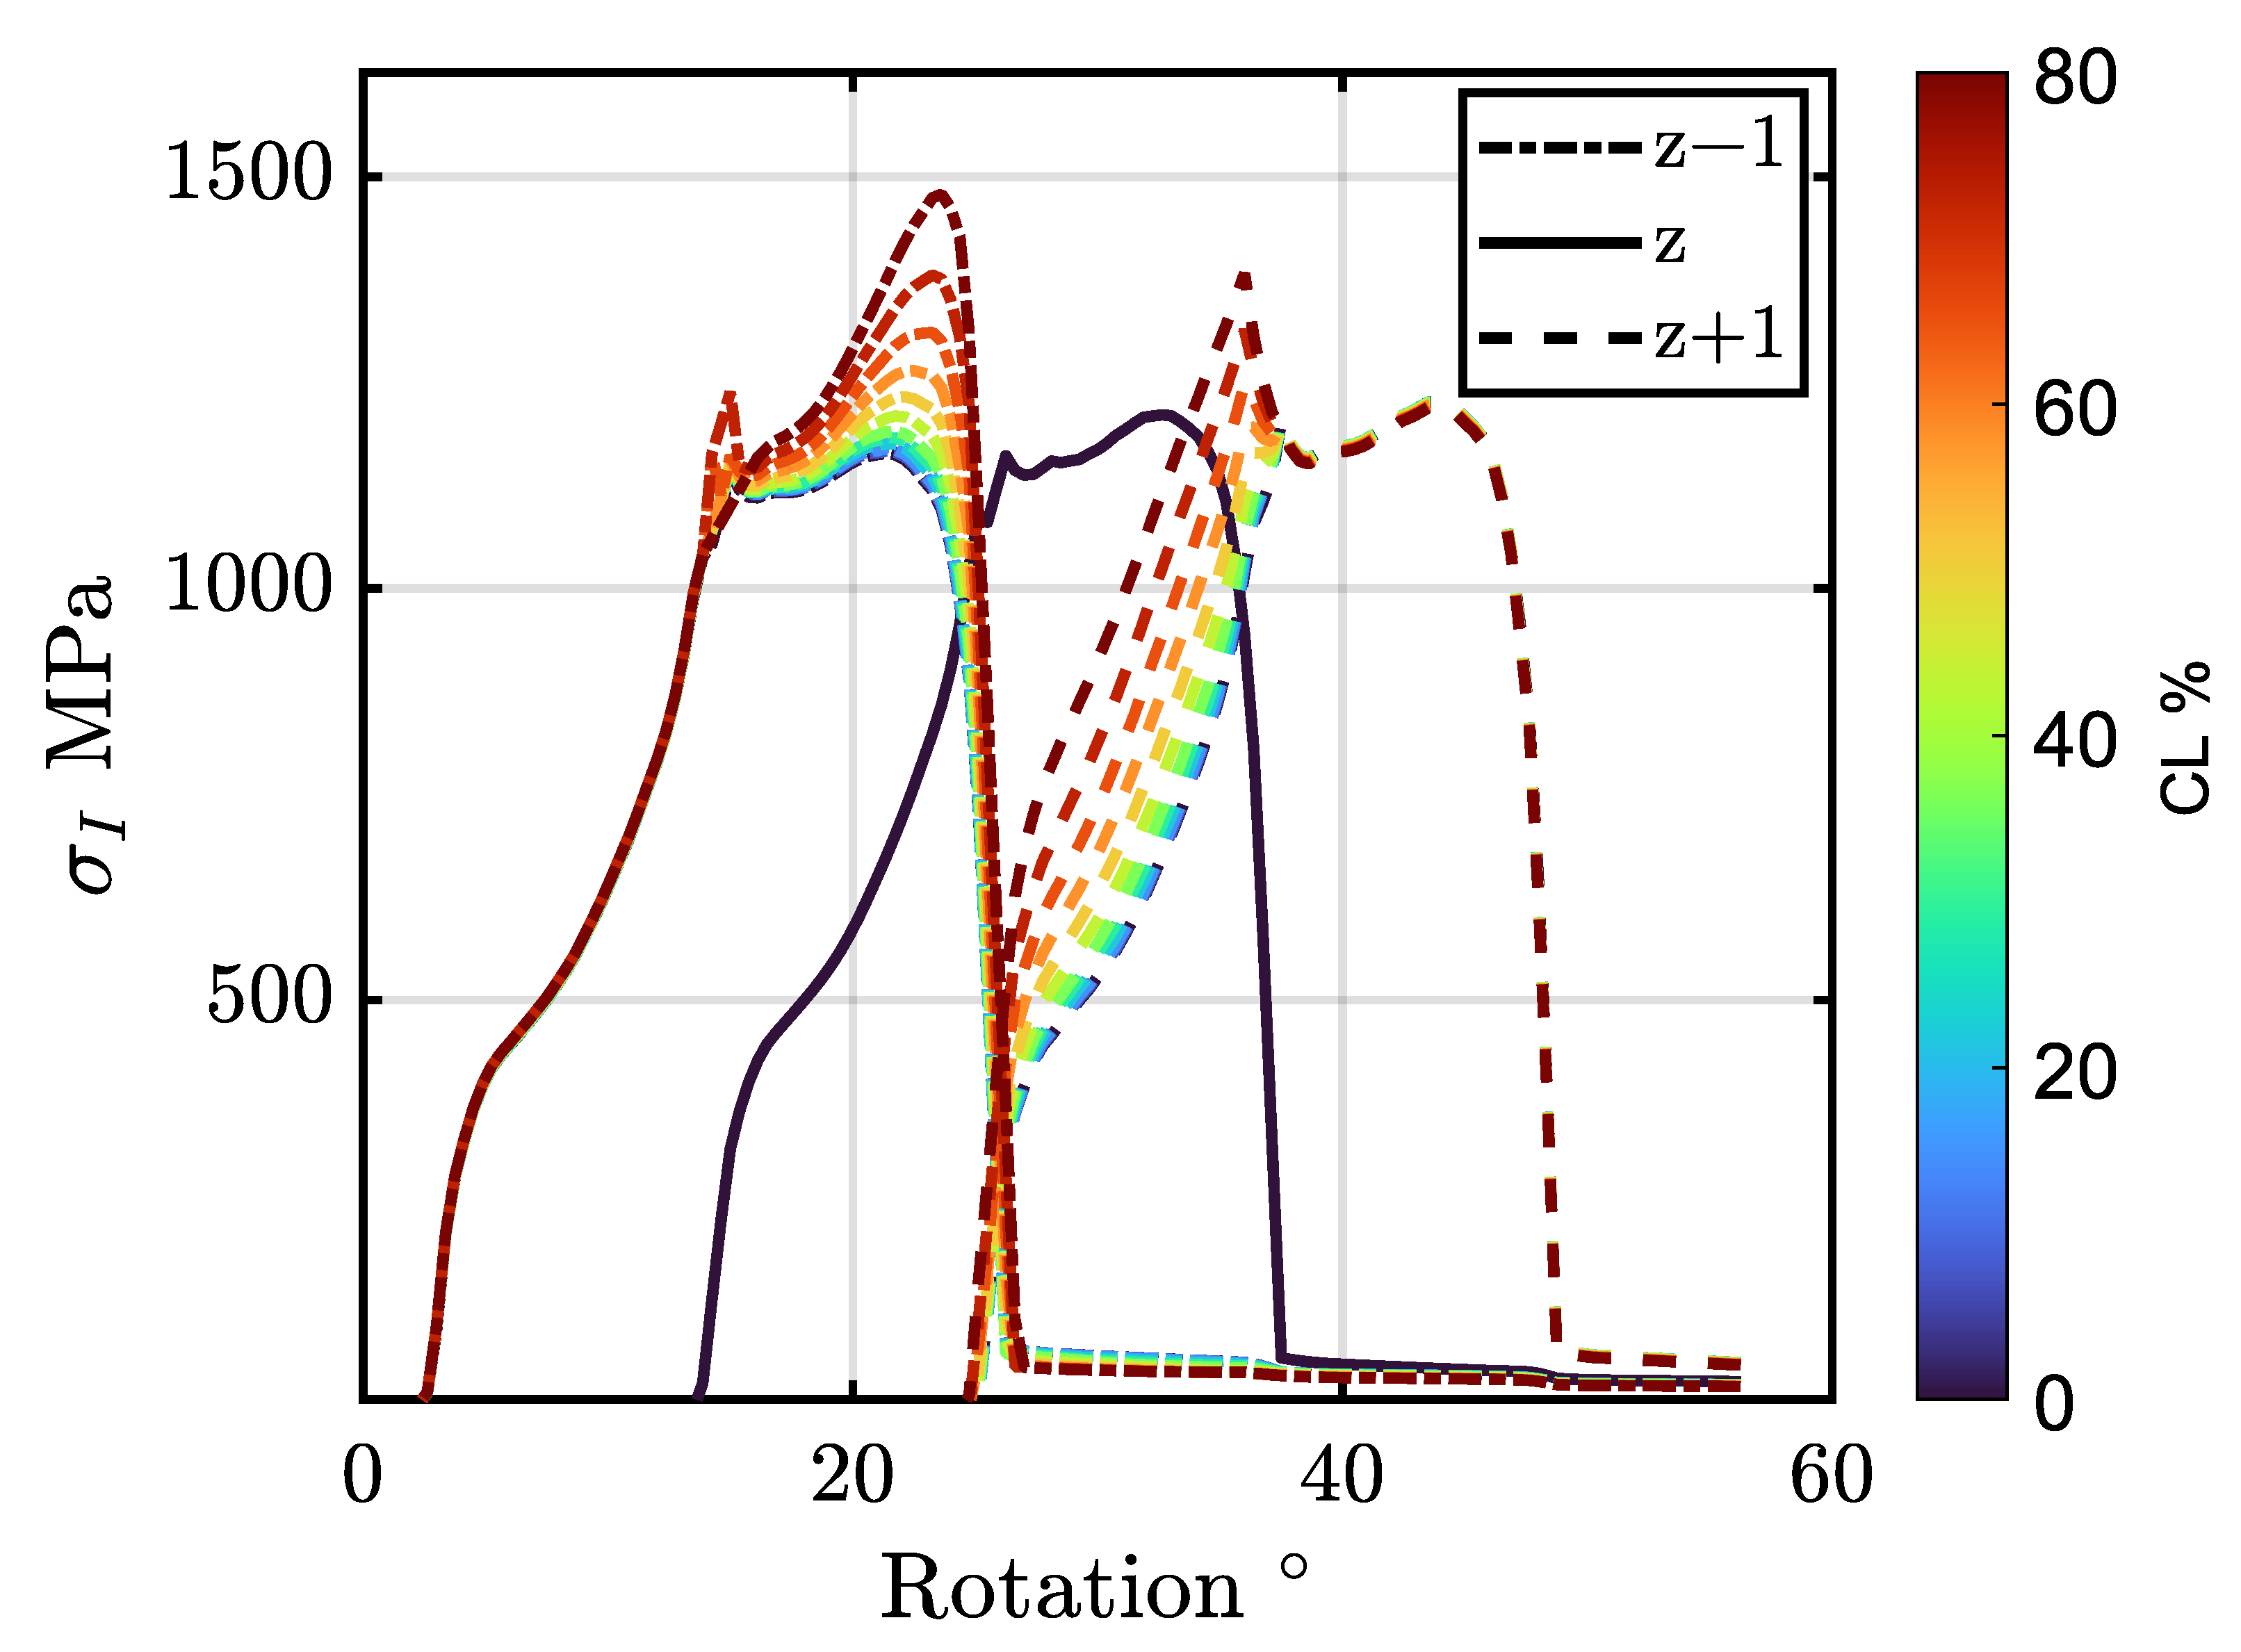
The first results show the alteration of the load distribution and the increase in the tooth root stress among teeth during crack propagation. These phenomena are described by Figure 8 and Figure 9: the former reports the values of the normal force that is exchanged in the contact between teeth flanks, while the latter reports the increase in tooth root stress in the healthy teeth adjacent to the damaged one.
Figure 8.
Normalized Contact force. “z” is the damaged tooth.
Figure 9.
Tooth root stress. “z” is the damaged tooth.
The presence of the crack modifies the forces exchanged at the contact between the flanks as well as the trend of stress at the roots of the adjacent healthy teeth (i.e., Figure 8 and Figure 10), which results in being overloaded. An important aspect to notice is that in the studied case, the normalized normal contact force between the meshing tooth is already lower than one, as the meshing gears present an overlap ratio (under load) greater than two, as can be seen in Figure 7. Thus, the force is always partitioned by at least two tooth pairs: the normal force, which is geometrically determined by the base diameter, is shared between the tooth pairs in contact according to their meshing conditions. The fact that the overlap ratio (under load) is greater than two can be noticed in Figure 8, where the occurrence of triple contact can be observed: in the central region of the pictures, all three tooth pairs exhibit a non-zero contact force, indicating that three tooth pairs are simultaneously in contact.
Figure 10.
Normalized contact force evolution.
On the other hand, as can be seen in Figure 8, for the damaged tooth pair, as the load and the crack length (CL) increase, the contact force decreases. These phenomena are related to the increased compliance of the damaged tooth, which alters the load sharing: unloading the damaged pair while loading the healthy adjacent one.
All the above leads also to an increase in the tooth root stress in the adjacent healthy teeth as shown by Figure 9. It is interesting to note that the adjacent teeth overload in different ways. The z − 1 (on the right) tooth has the higher increase in load, but it is the z + 1 (on the left) tooth that is subjected to a higher increase in tooth root stress. This is due to the fact that the meshing of z − 1 happens at diameters between the pitch diameter and the outer point of contact. On the other hand, the z − 1 tooth has an increase in the load for diameter between the pitch diameter and the internal point of contact; therefore, even if the load is higher, the lever is smaller, leading to a smaller increase in the stress of the tooth root.
All the effects described above do not happen in the pulsator test due to the intrinsic lack of gear meshing: the force amplitude and the point of application remain constant, as they are determined only by the machine setup. On the contrary, during meshing, the increase in tooth compliance, caused by the crack presence, leads to a reduction in load acting on the damaged tooth, even if the applied torque is maintained constant.
5. Estimation of the Propagation Time
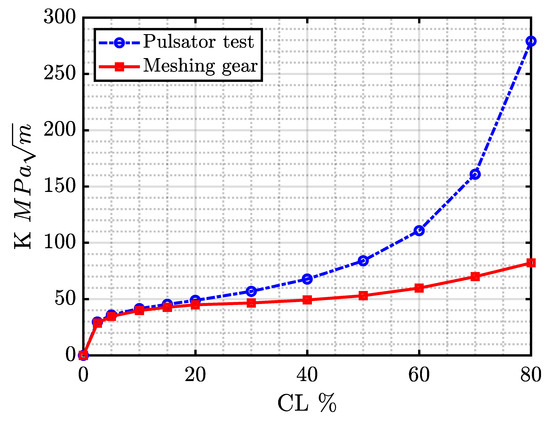
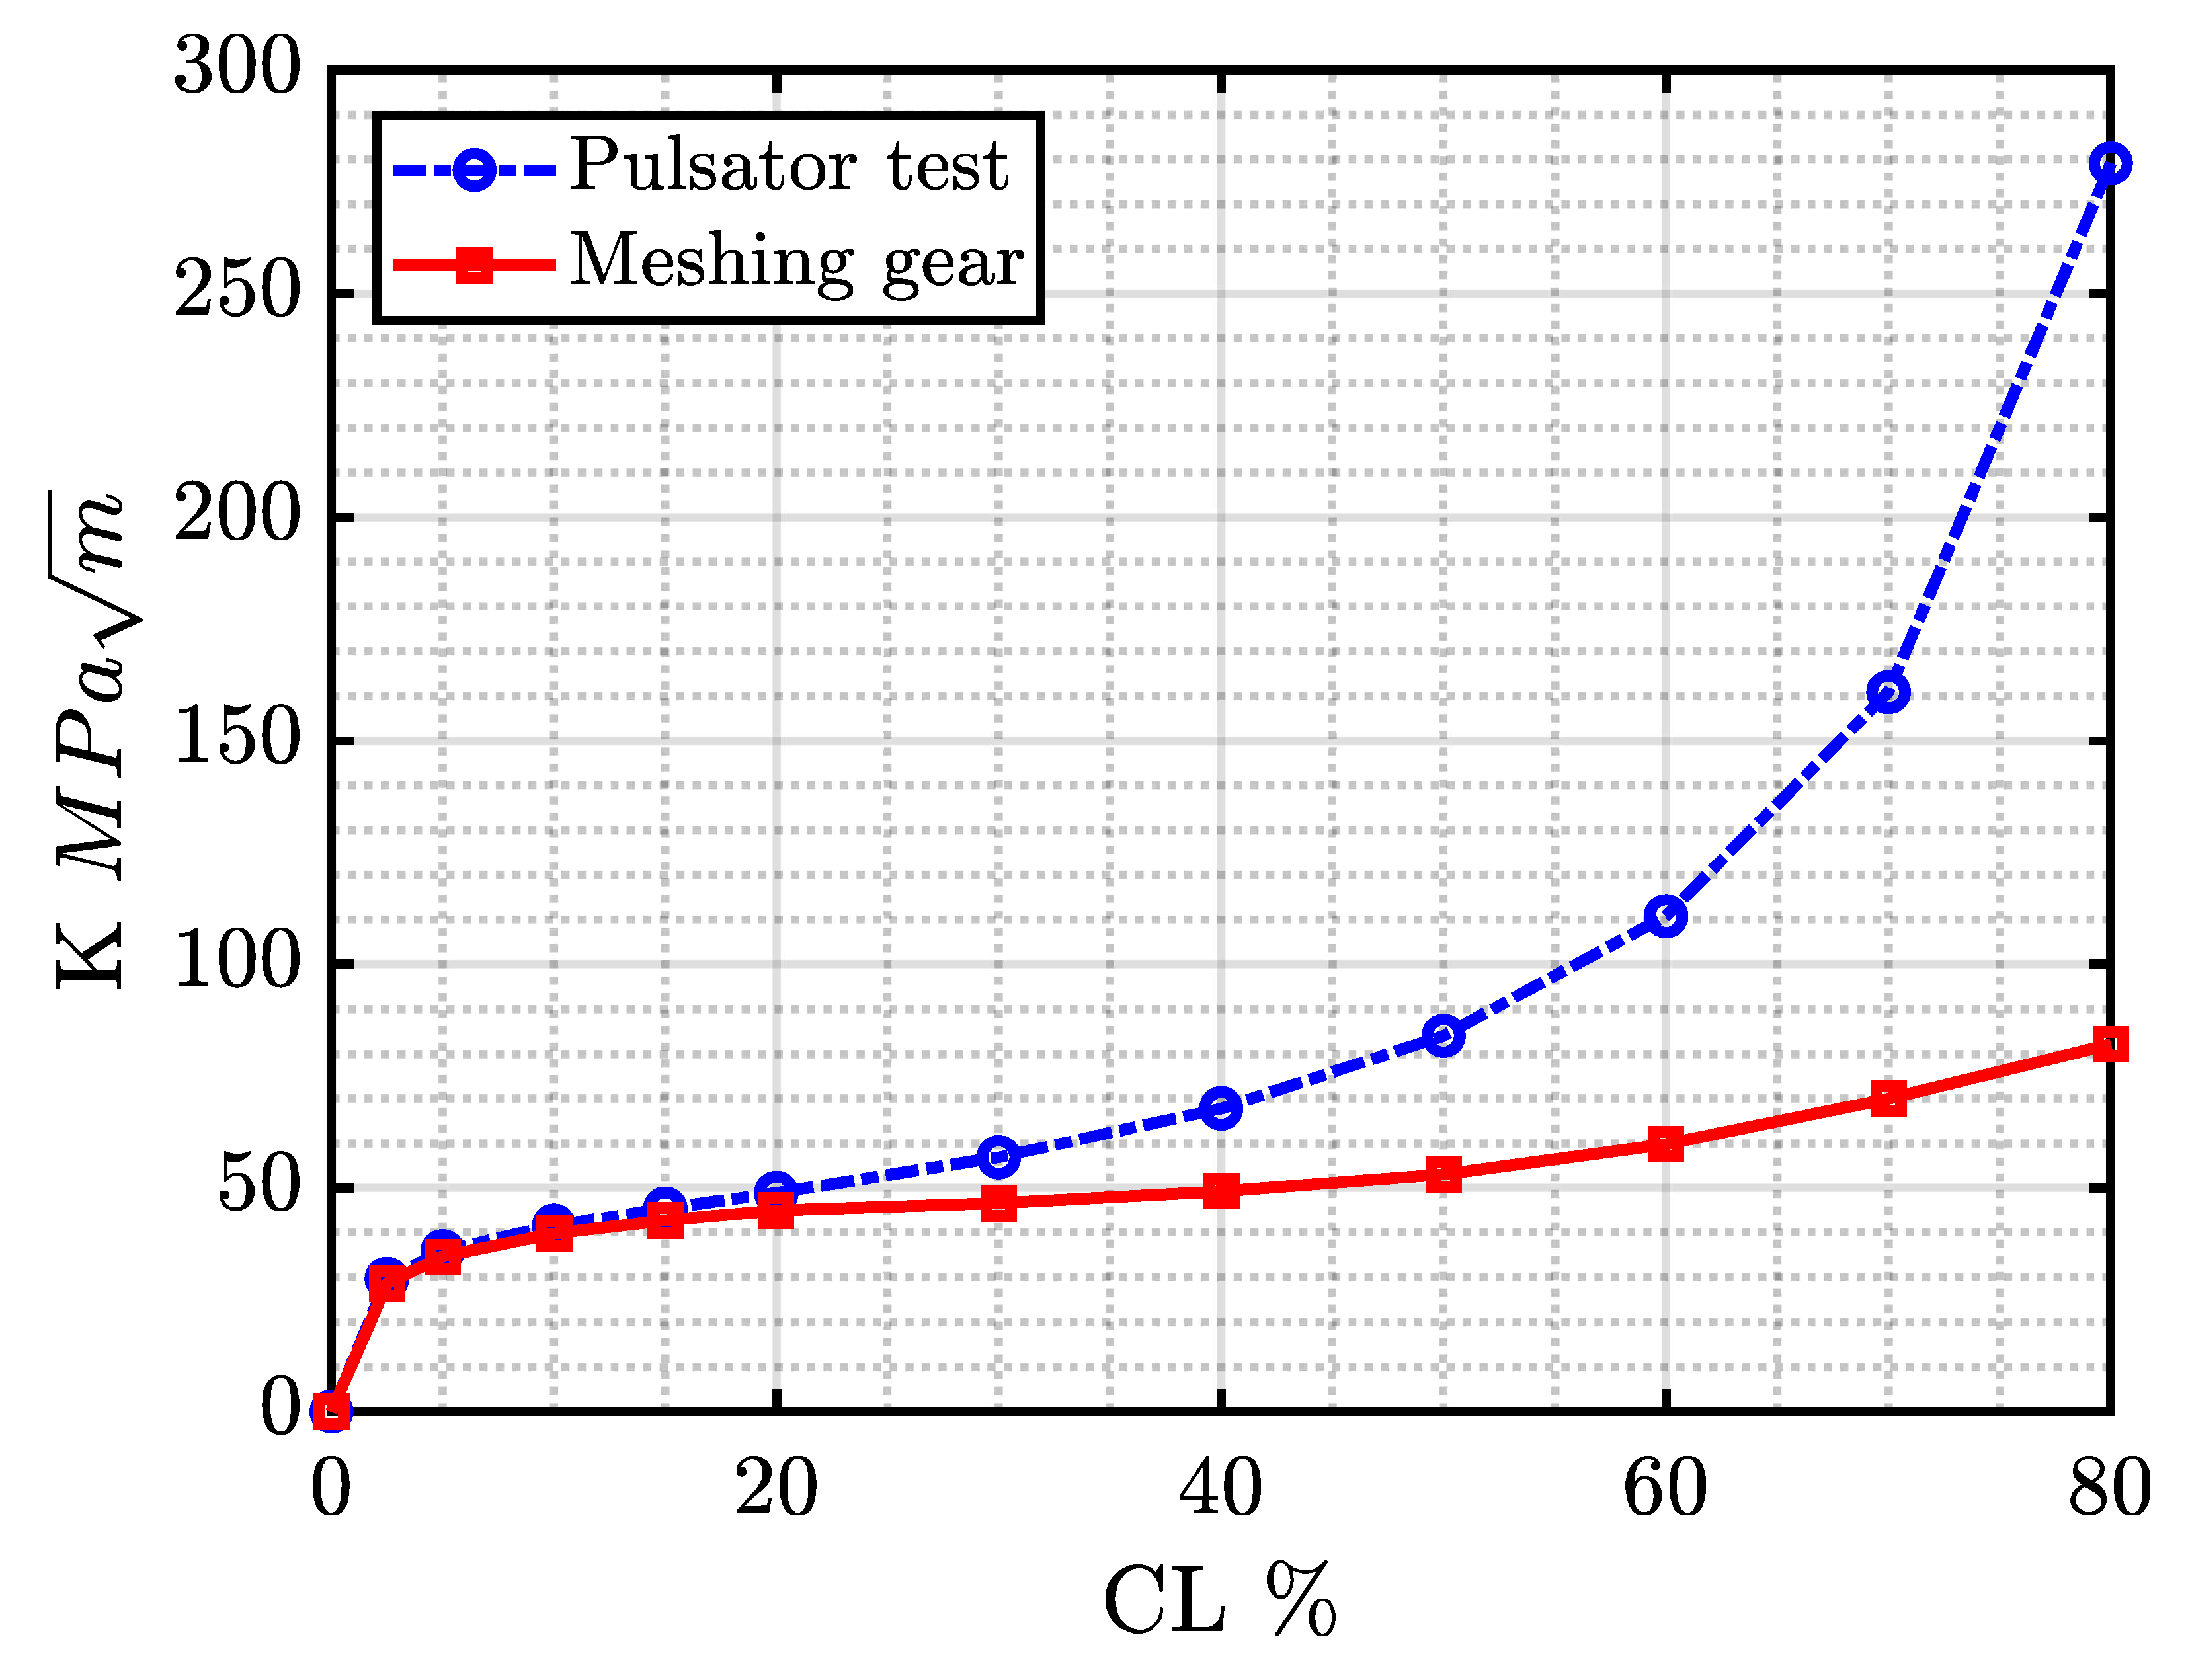
To take into account the effects of the load sharing at high overlap ratios, which splits the load more between the meshing teeth, the comparison between pulsator and meshing is performed at the same stress level (at the tooth root) and not at the same load level (LL). The unloading of the damaged pair that occurs during the meshing process implies a peculiar crack behavior. Indeed, if the two test cases are compared, it is possible to notice that the stress intensity factor K at the crack tip follows two different growing trends as shown in Figure 11. For the shorter cracks, the two tests provide similar K values. On the other hand, for all the other lengths, the curve diverges. The meshing gear case presents significantly lower K, implying a much slower crack propagation. This indicates that the same CL and loading conditions of the tooth root provide slower crack propagation, thus an increased life. In order to estimate the crack propagation, the Paris equation is used. Accordingly, it is possible to calculate the crack propagation speed as
where parameters C and m are material dependent. For our calculations, the following literature values are used: and [42] with crack growth () in and the stress intensity factor K in .
Figure 11.
Stress intensity factor K—LL1.
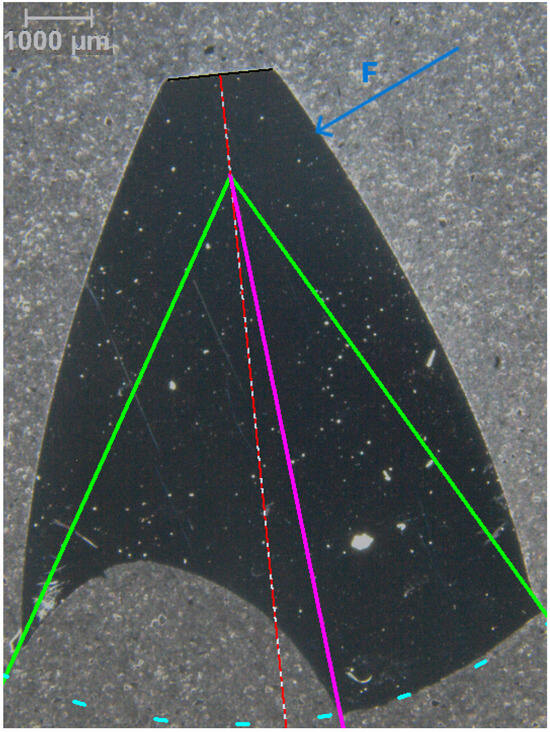
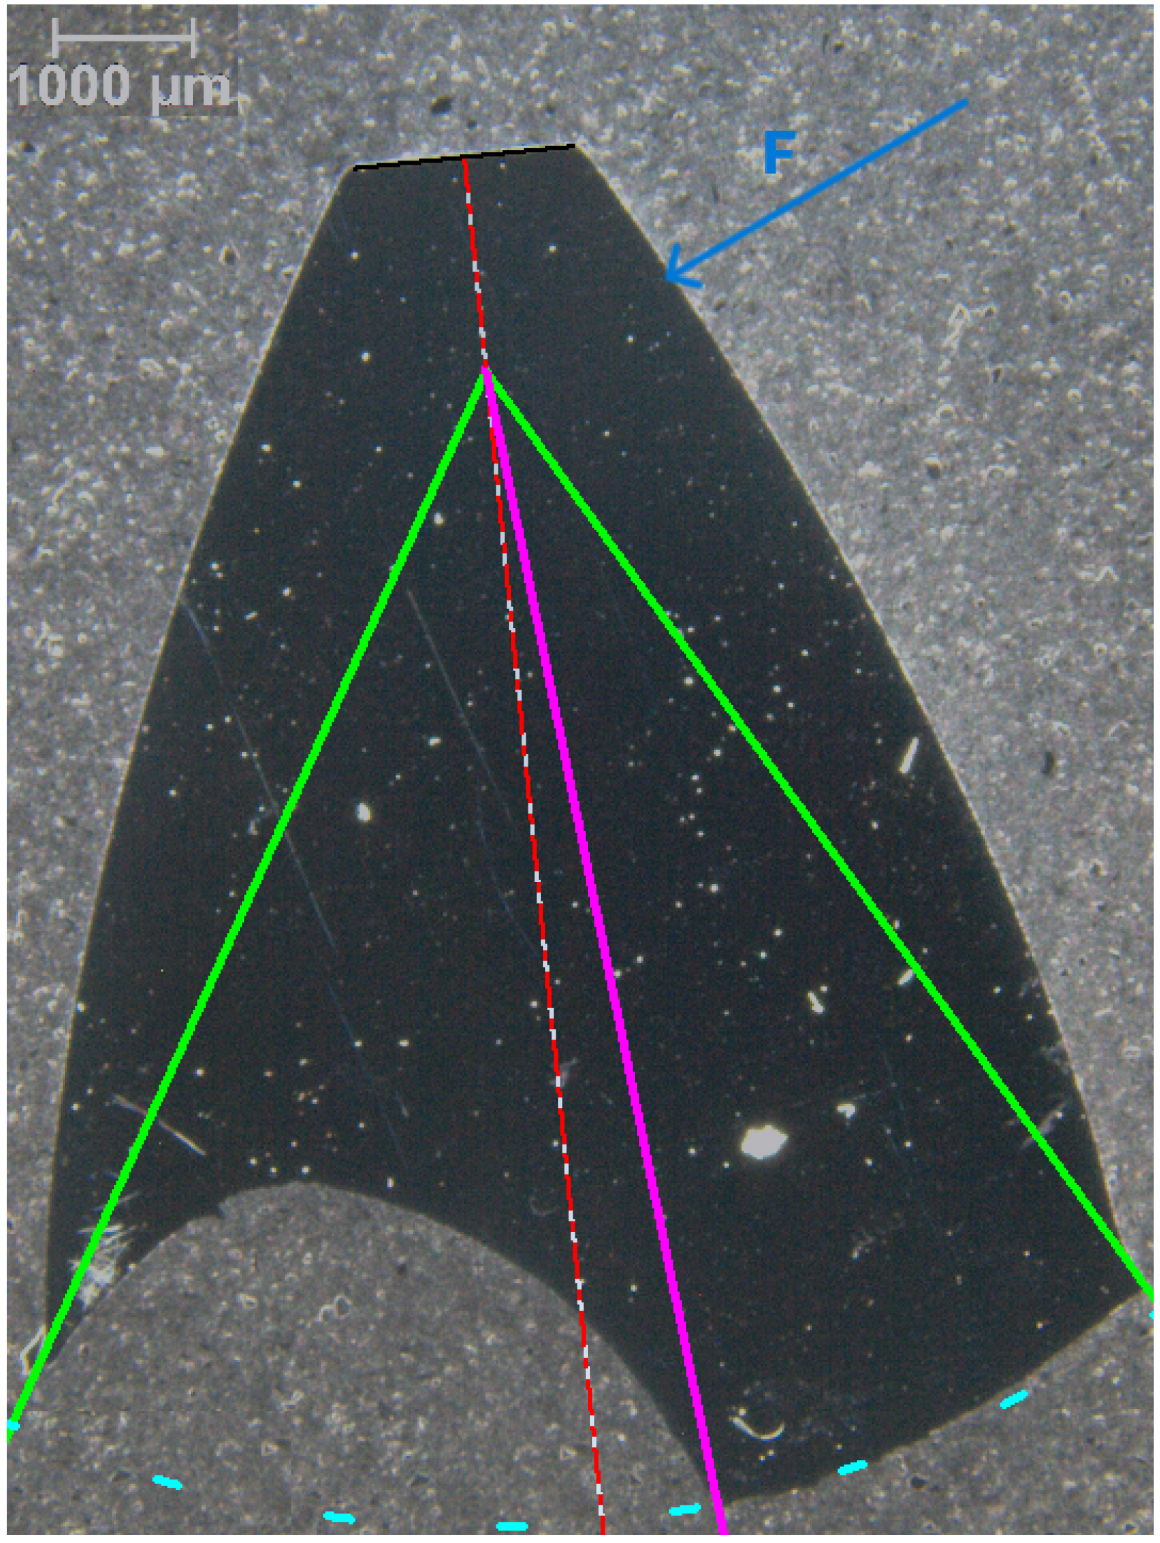
The failure condition is satisfied under two conditions: when the stress intensity factor reaches the or when the crack propagates completely through the tooth. The fracture toughness () is estimated by analyzing the tested teeth fracture according to the load applied during the test, that is 52 kN, and the final CL, which is defined as an arc of a circle between the tooth root and the start of the unstable propagation as shown in Figure 12. Accordingly, is estimated as equal to 108 . Such a value is a reasonable one if compared with those that can be found in the literature (e.g., 93–137 as proposed by [58]).
Figure 12.
Cracked tooth. Here, the red lines represent the tooth axis, the green lines are the 30° tangents, the dashed cyan is the imposed crack path, and the magenta line identifies the angular position at which unstable crack propagation occurs. The blue arrow identifies the direction of the applied pulsator force.
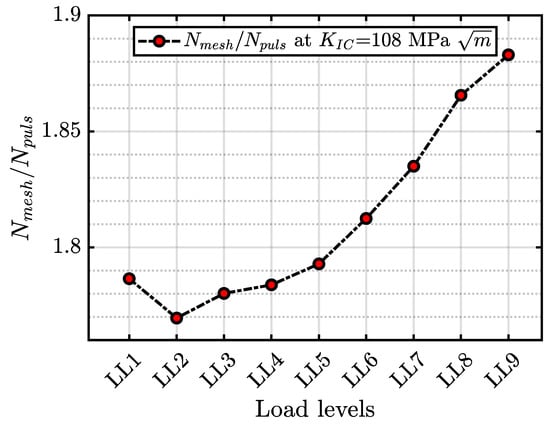
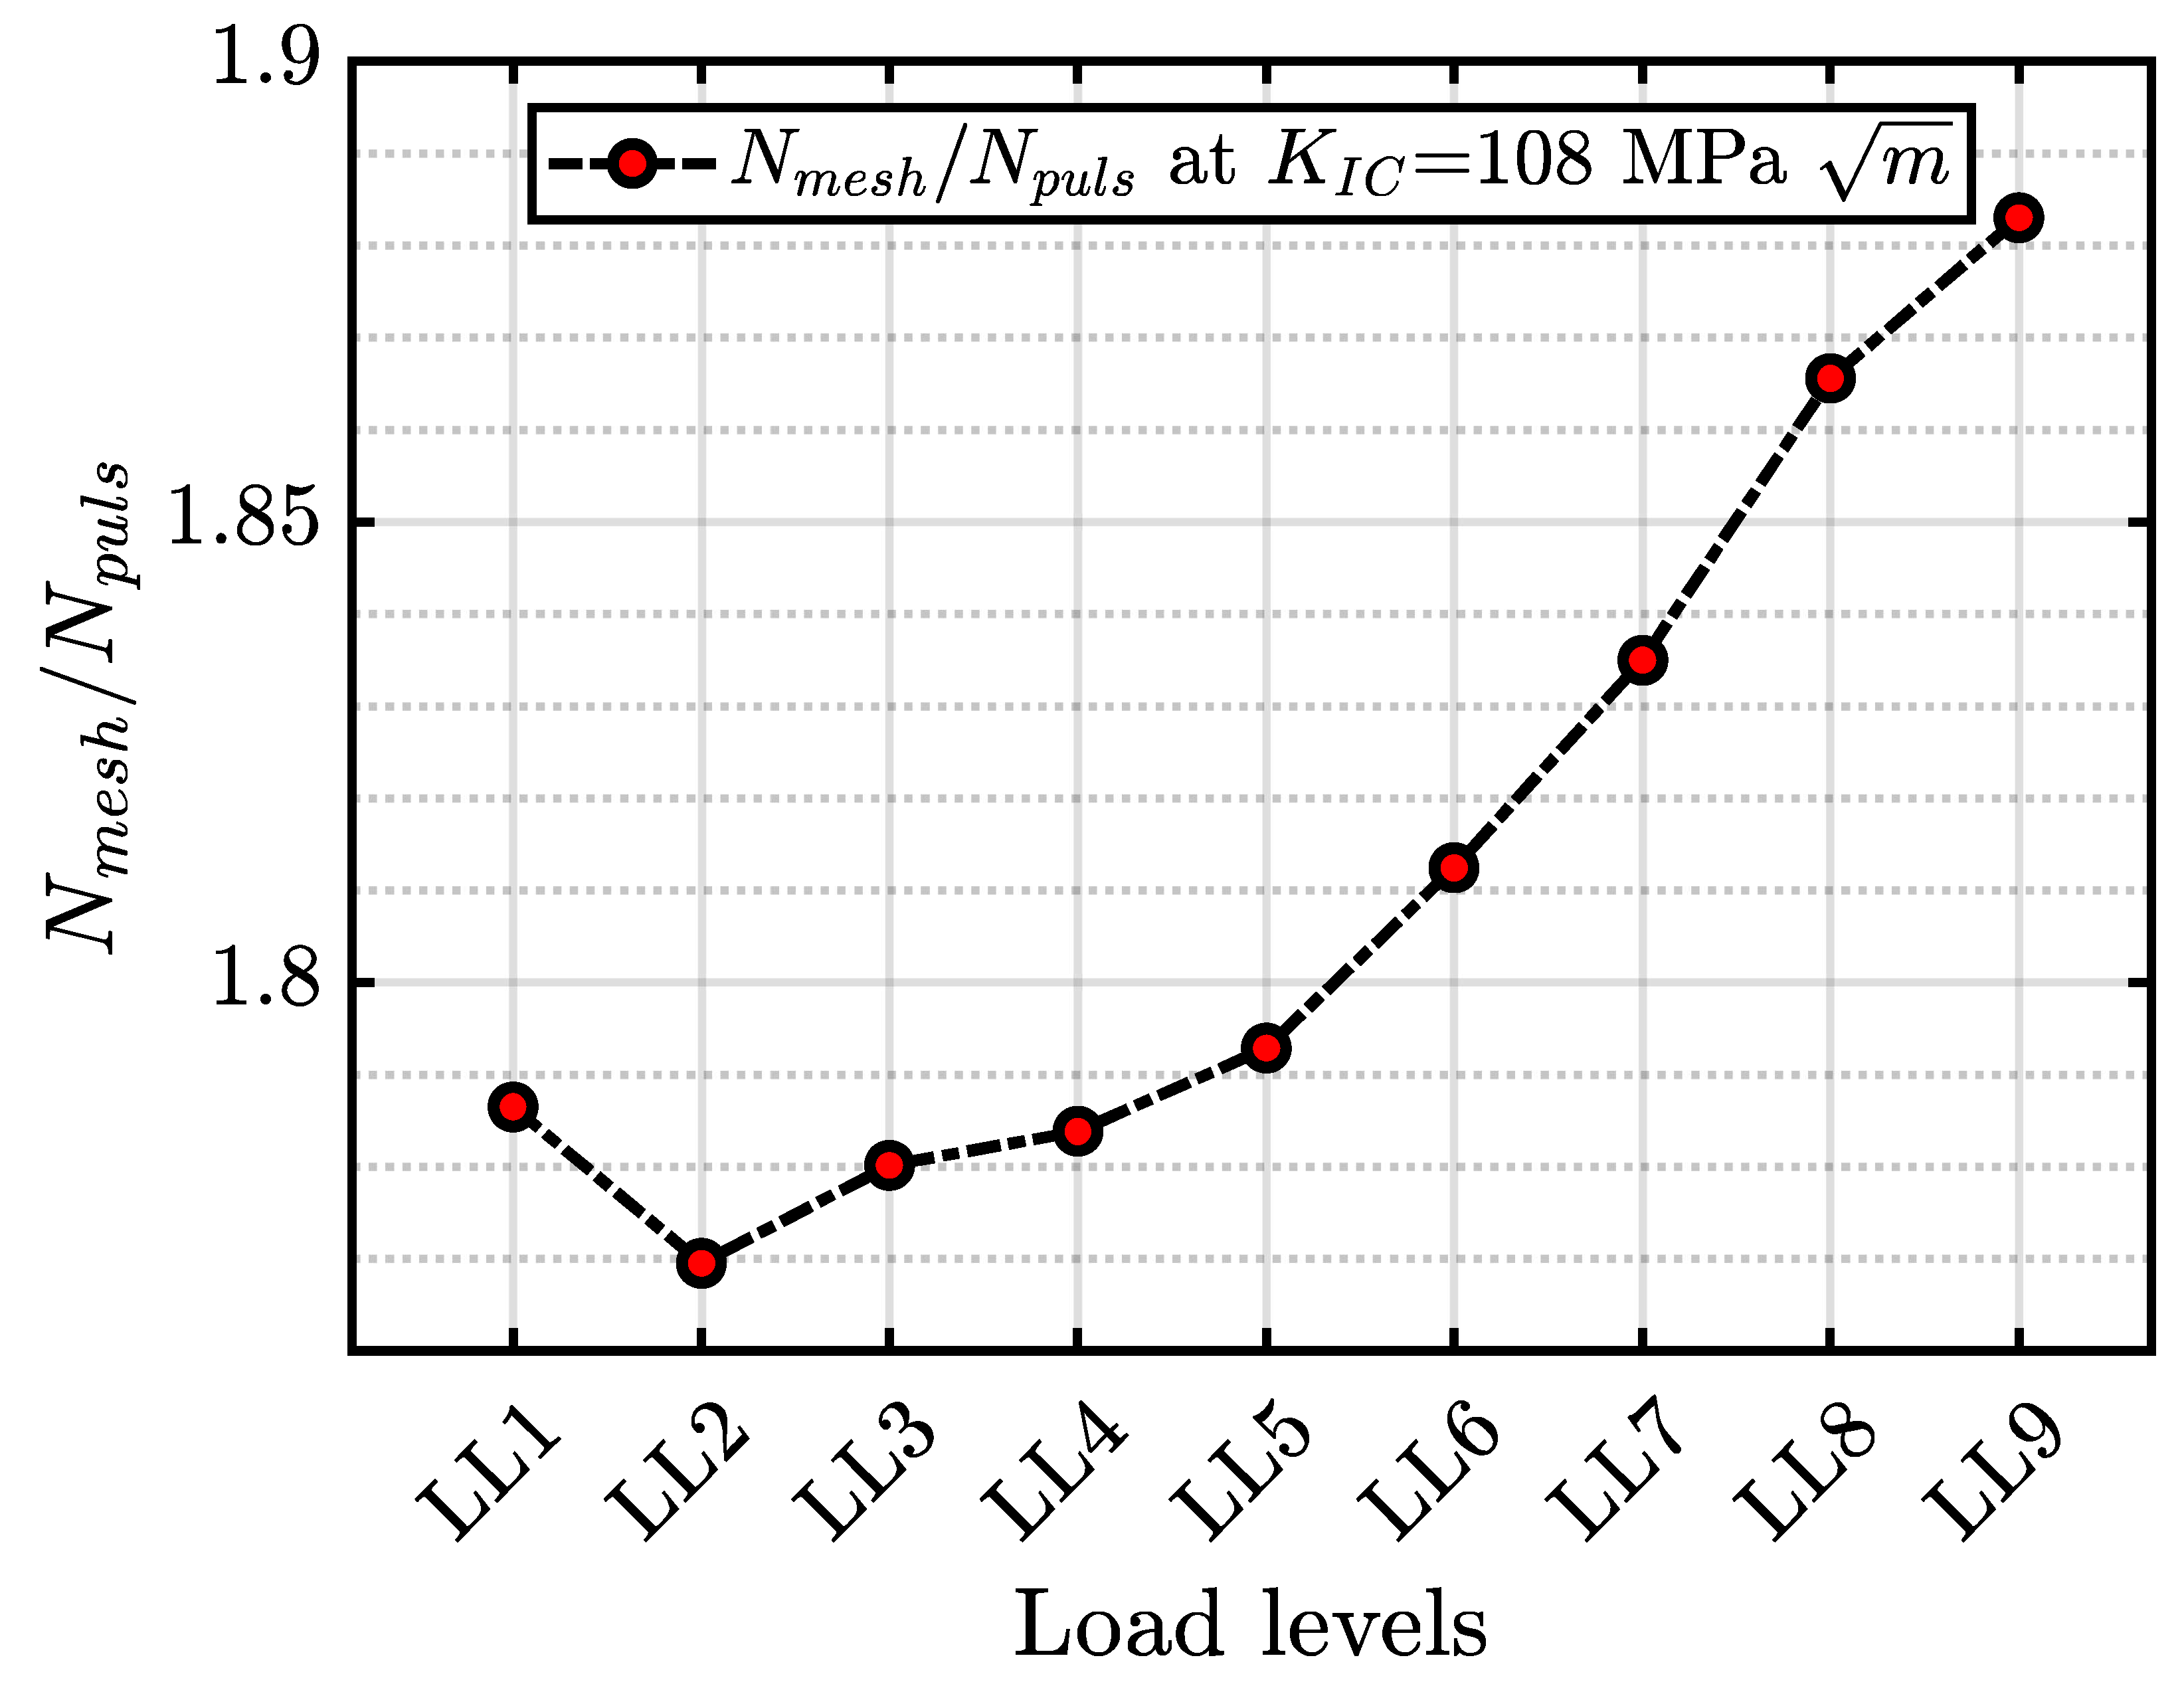
Hence, it is possible to calculate the final number of cycles for the two loading conditions. The difference between the two testing methodologies can be seen in Figure 13. The ratio between the final number of cycles of the meshing and the pulsator one () grows as the load increases. More specifically, the ratio is between 1.79 and 1.88, implying that the time spent in propagation is almost doubled in the meshing condition.
Figure 13.
ratio evolution. = meshing final number of cycle, = pulsator final number of cycle.
6. Proposed Method for the Lifetime Correction
Gears present a complex state of stress in the first layer of material due to the residual stresses generated by the machining, heat treatment and shot peening. This area requires precise data and an increased model complexity to properly model the gradient of mechanical properties, which influences the crack propagation.
The calculation of the modified lifetime starts from the definition of the number of cycles necessary for nucleation in the pulsator case (i.e., ). To do this, the estimated propagation , obtained by the Paris law, is subtracted from the experimental final number of cycles :
Similarly, for the final number of cycles of meshing gears, the two terms can be separated. Here, too, the propagation cycles are obtained through the integration of the Paris Equation (1):
Under the assumption that the time spent in nucleation for both the testing cases is the same when the stress at the tooth root is equal (i.e., ), it is possible to combine Equations (2) and (3), obtaining
Here, gears are case hardened (as most of the gears employed for power transmission); thus, there is a variation of local mechanical properties starting from the tooth root surface to the core of the tooth due to the local variation of microstructure and local residual stresses. For small cracks, whose length is comparable to the case-hardened depth, it is difficult to properly estimate the propagation due to the local variations. Luckily, Figure 11 shows that the stress intensity factor K for short cracks (a < 20%) is similar between pulsator and meshing. Thus, the difference in propagation occurs for longer cracks which propagate far from the case-hardened layer. This avoids the need to carefully model the initial material layer (e.g., [59,60,61,62,63], which are strongly affect by the presence of residual stresses, as the main difference occurs mainly in the base material, not affected neither by case hardening nor by shot peening.
Hence, the quantity (i.e., the difference between the estimated propagation time), contains information regarding only longer cracks, whose propagation speed is not influenced by t he local properties. Hence, it can be used to actually compensate for the lifetime.
Hence, from Equation (4) is possible to calculate the final number of cycles of the meshing case as
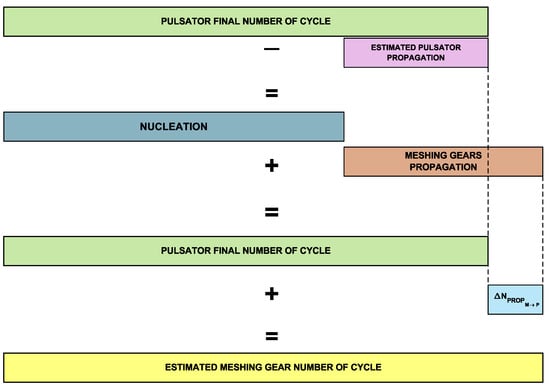
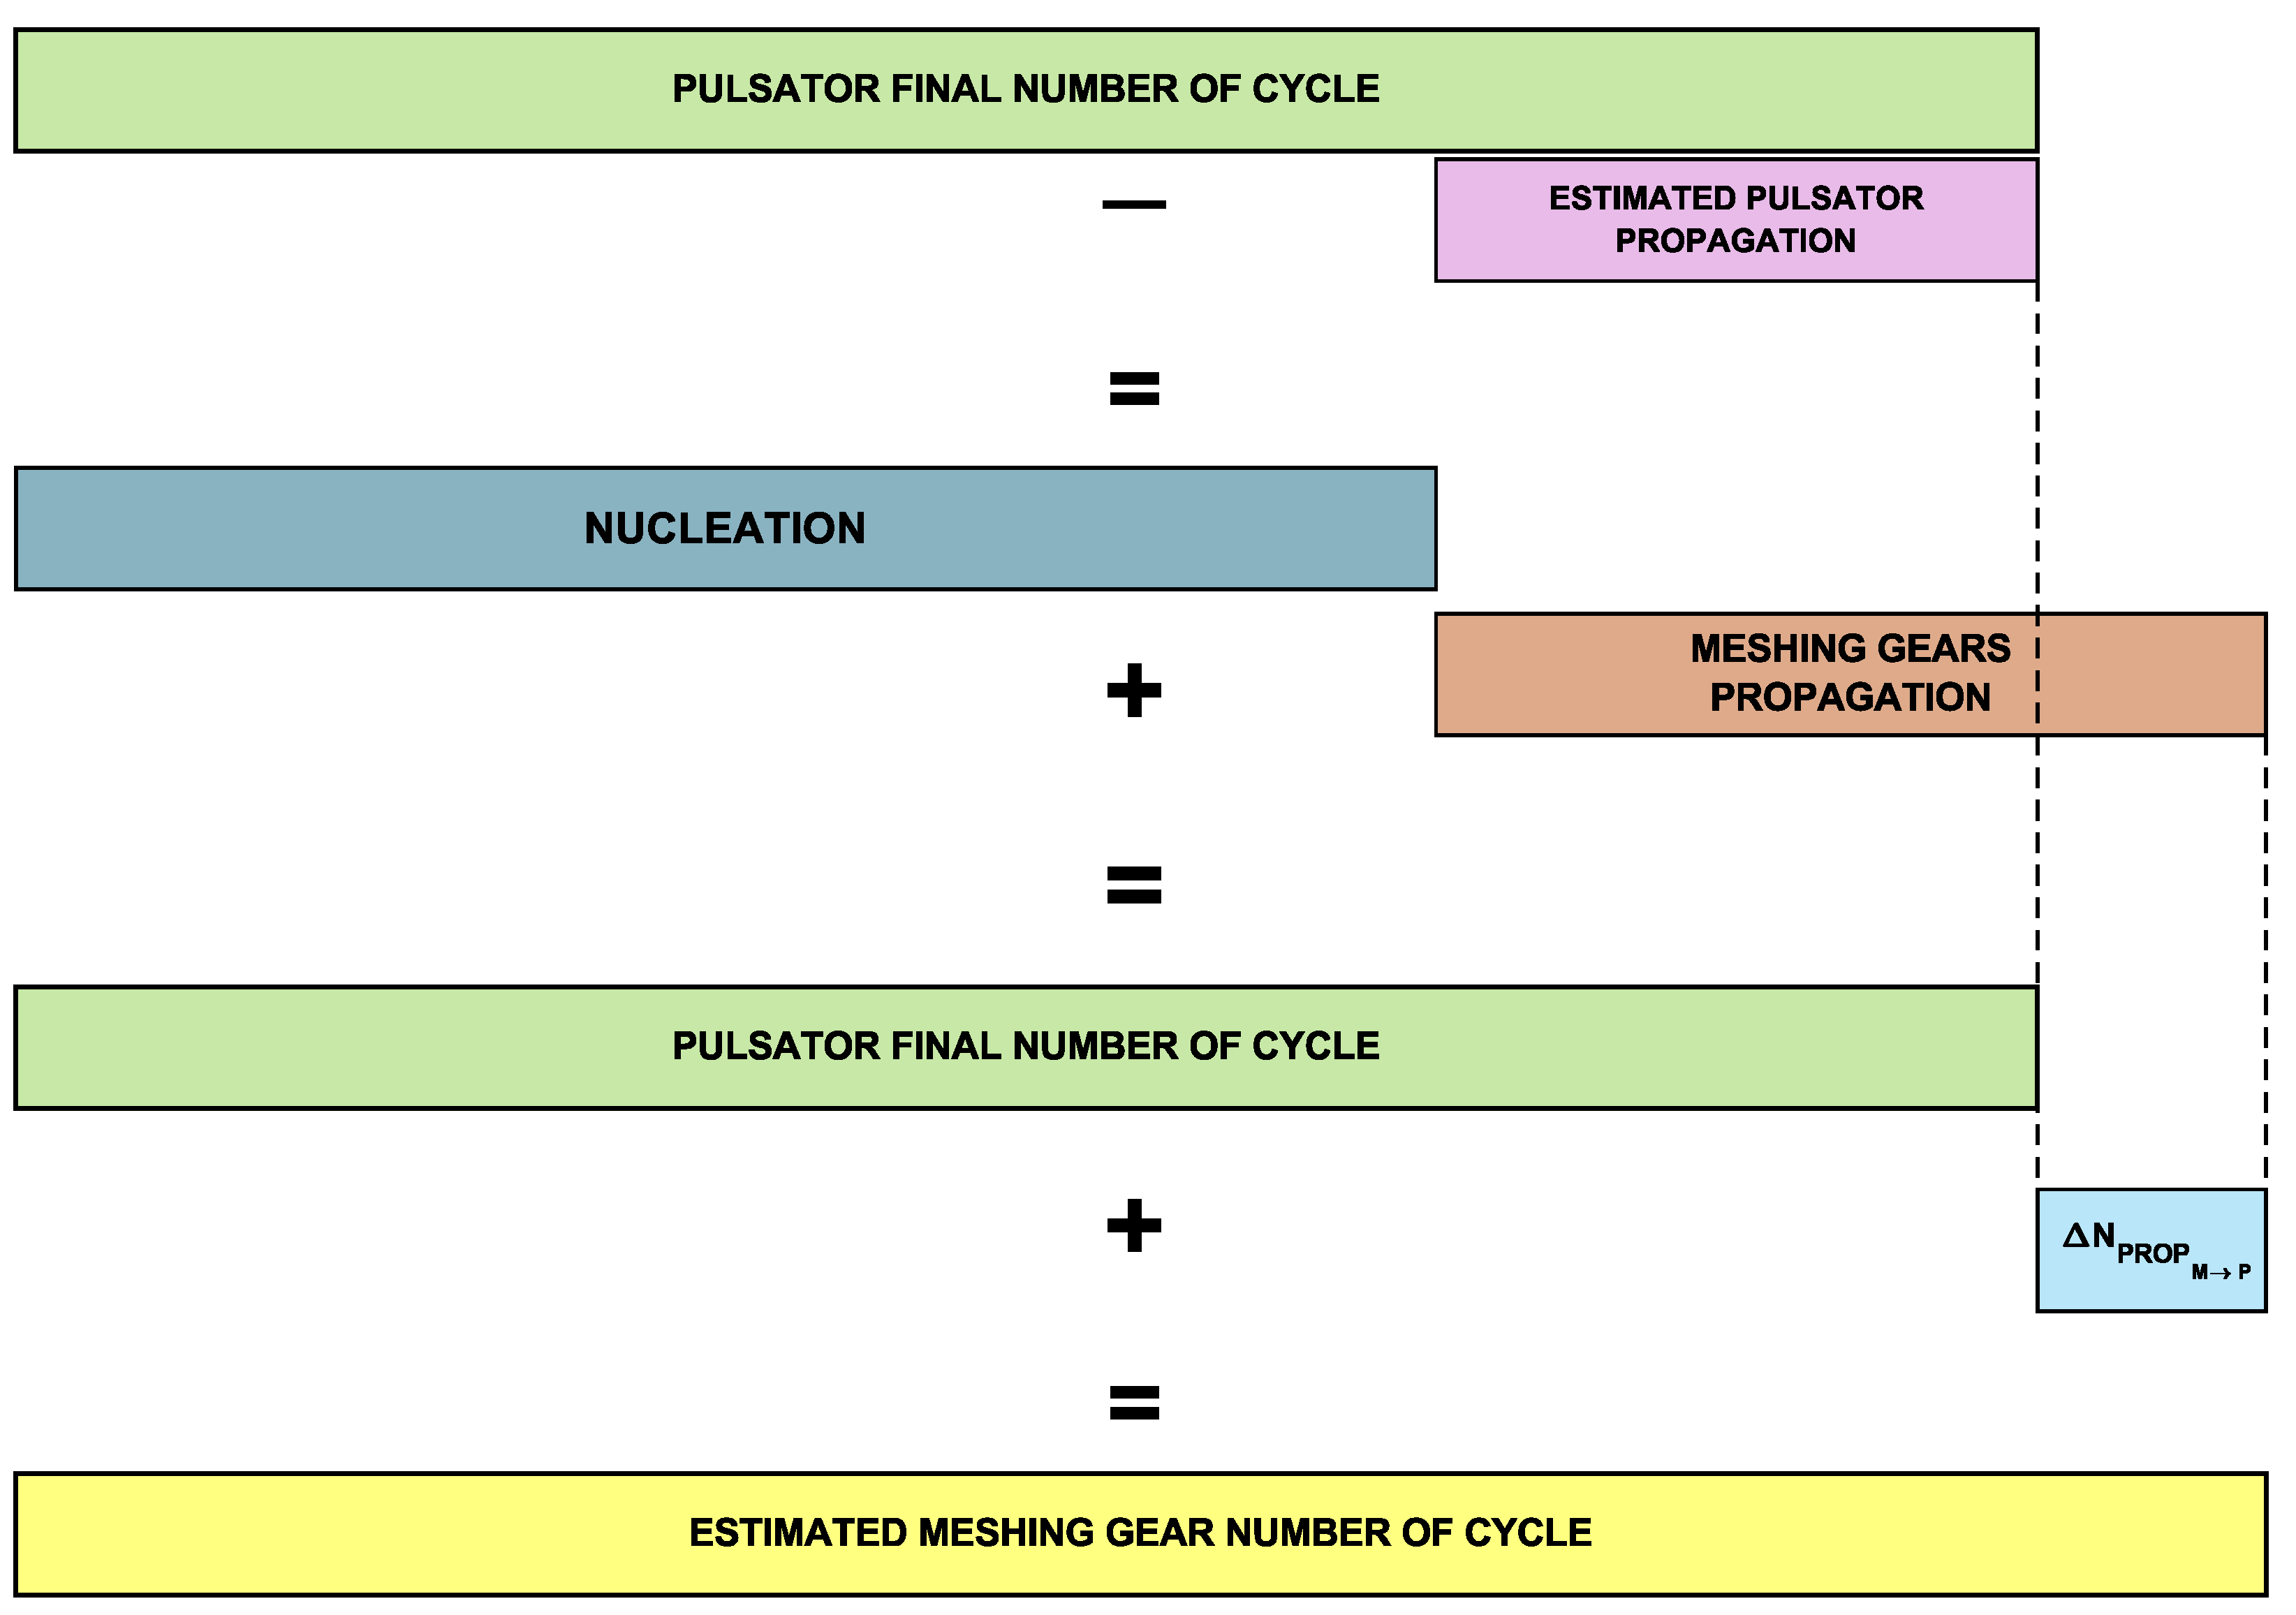
This equation allows to estimate the final number of cycles of the meshing gears starting from the results of the pulsator test. This allows to take into account the effect of the heat treatment and residual stresses of the gears without relying on complex FE models. The logic behind the above calculation scheme is graphically represented in Figure 14.
Figure 14.
Visual representation of the calculation.
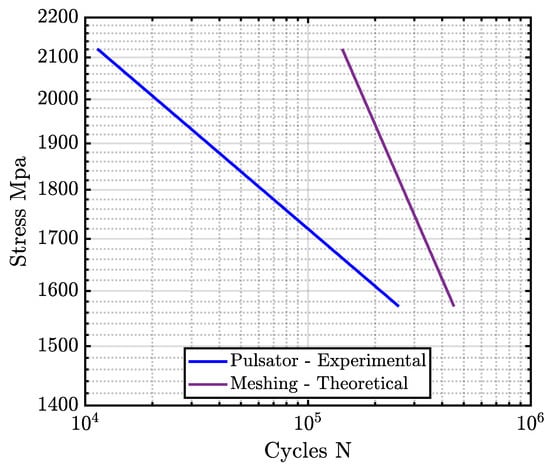
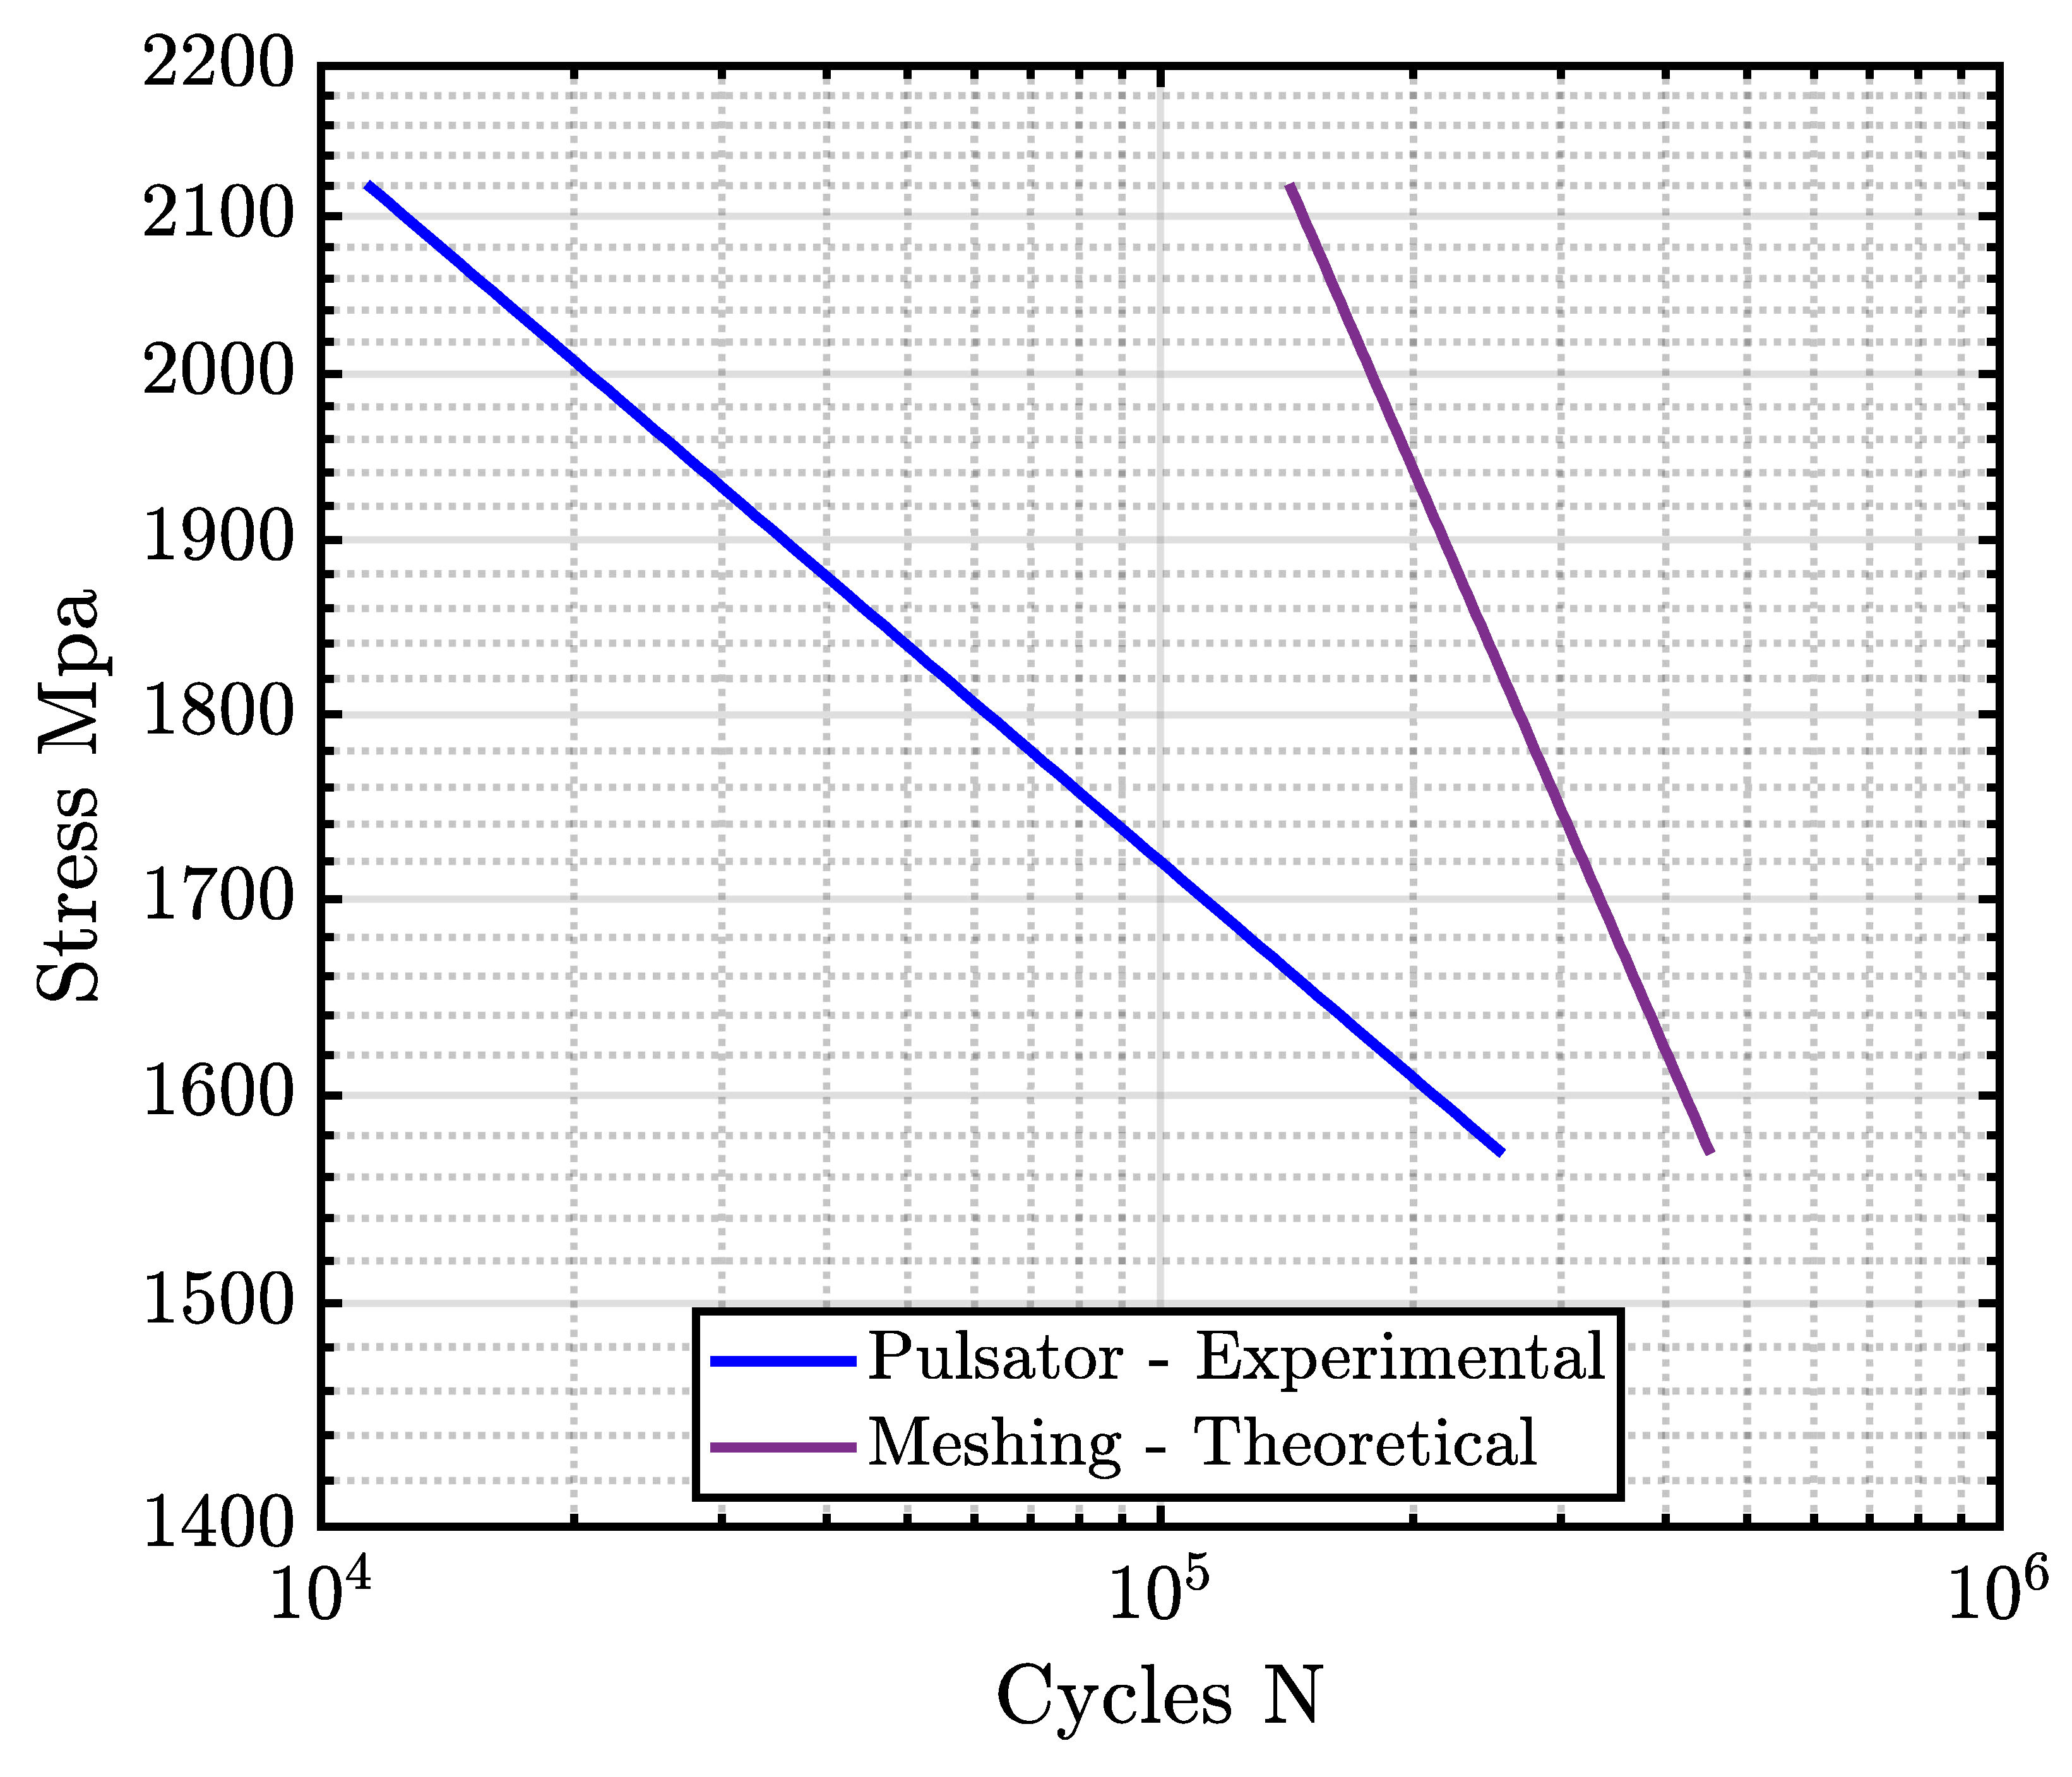
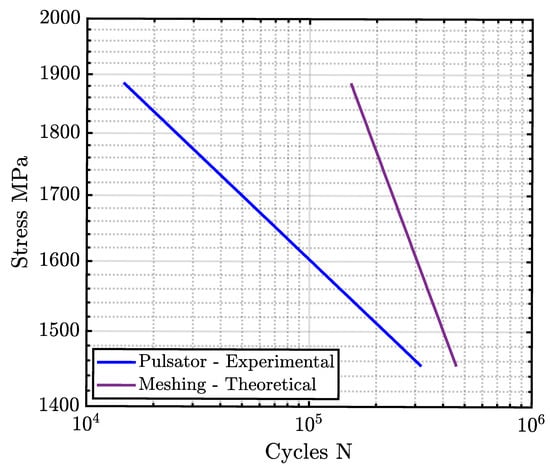
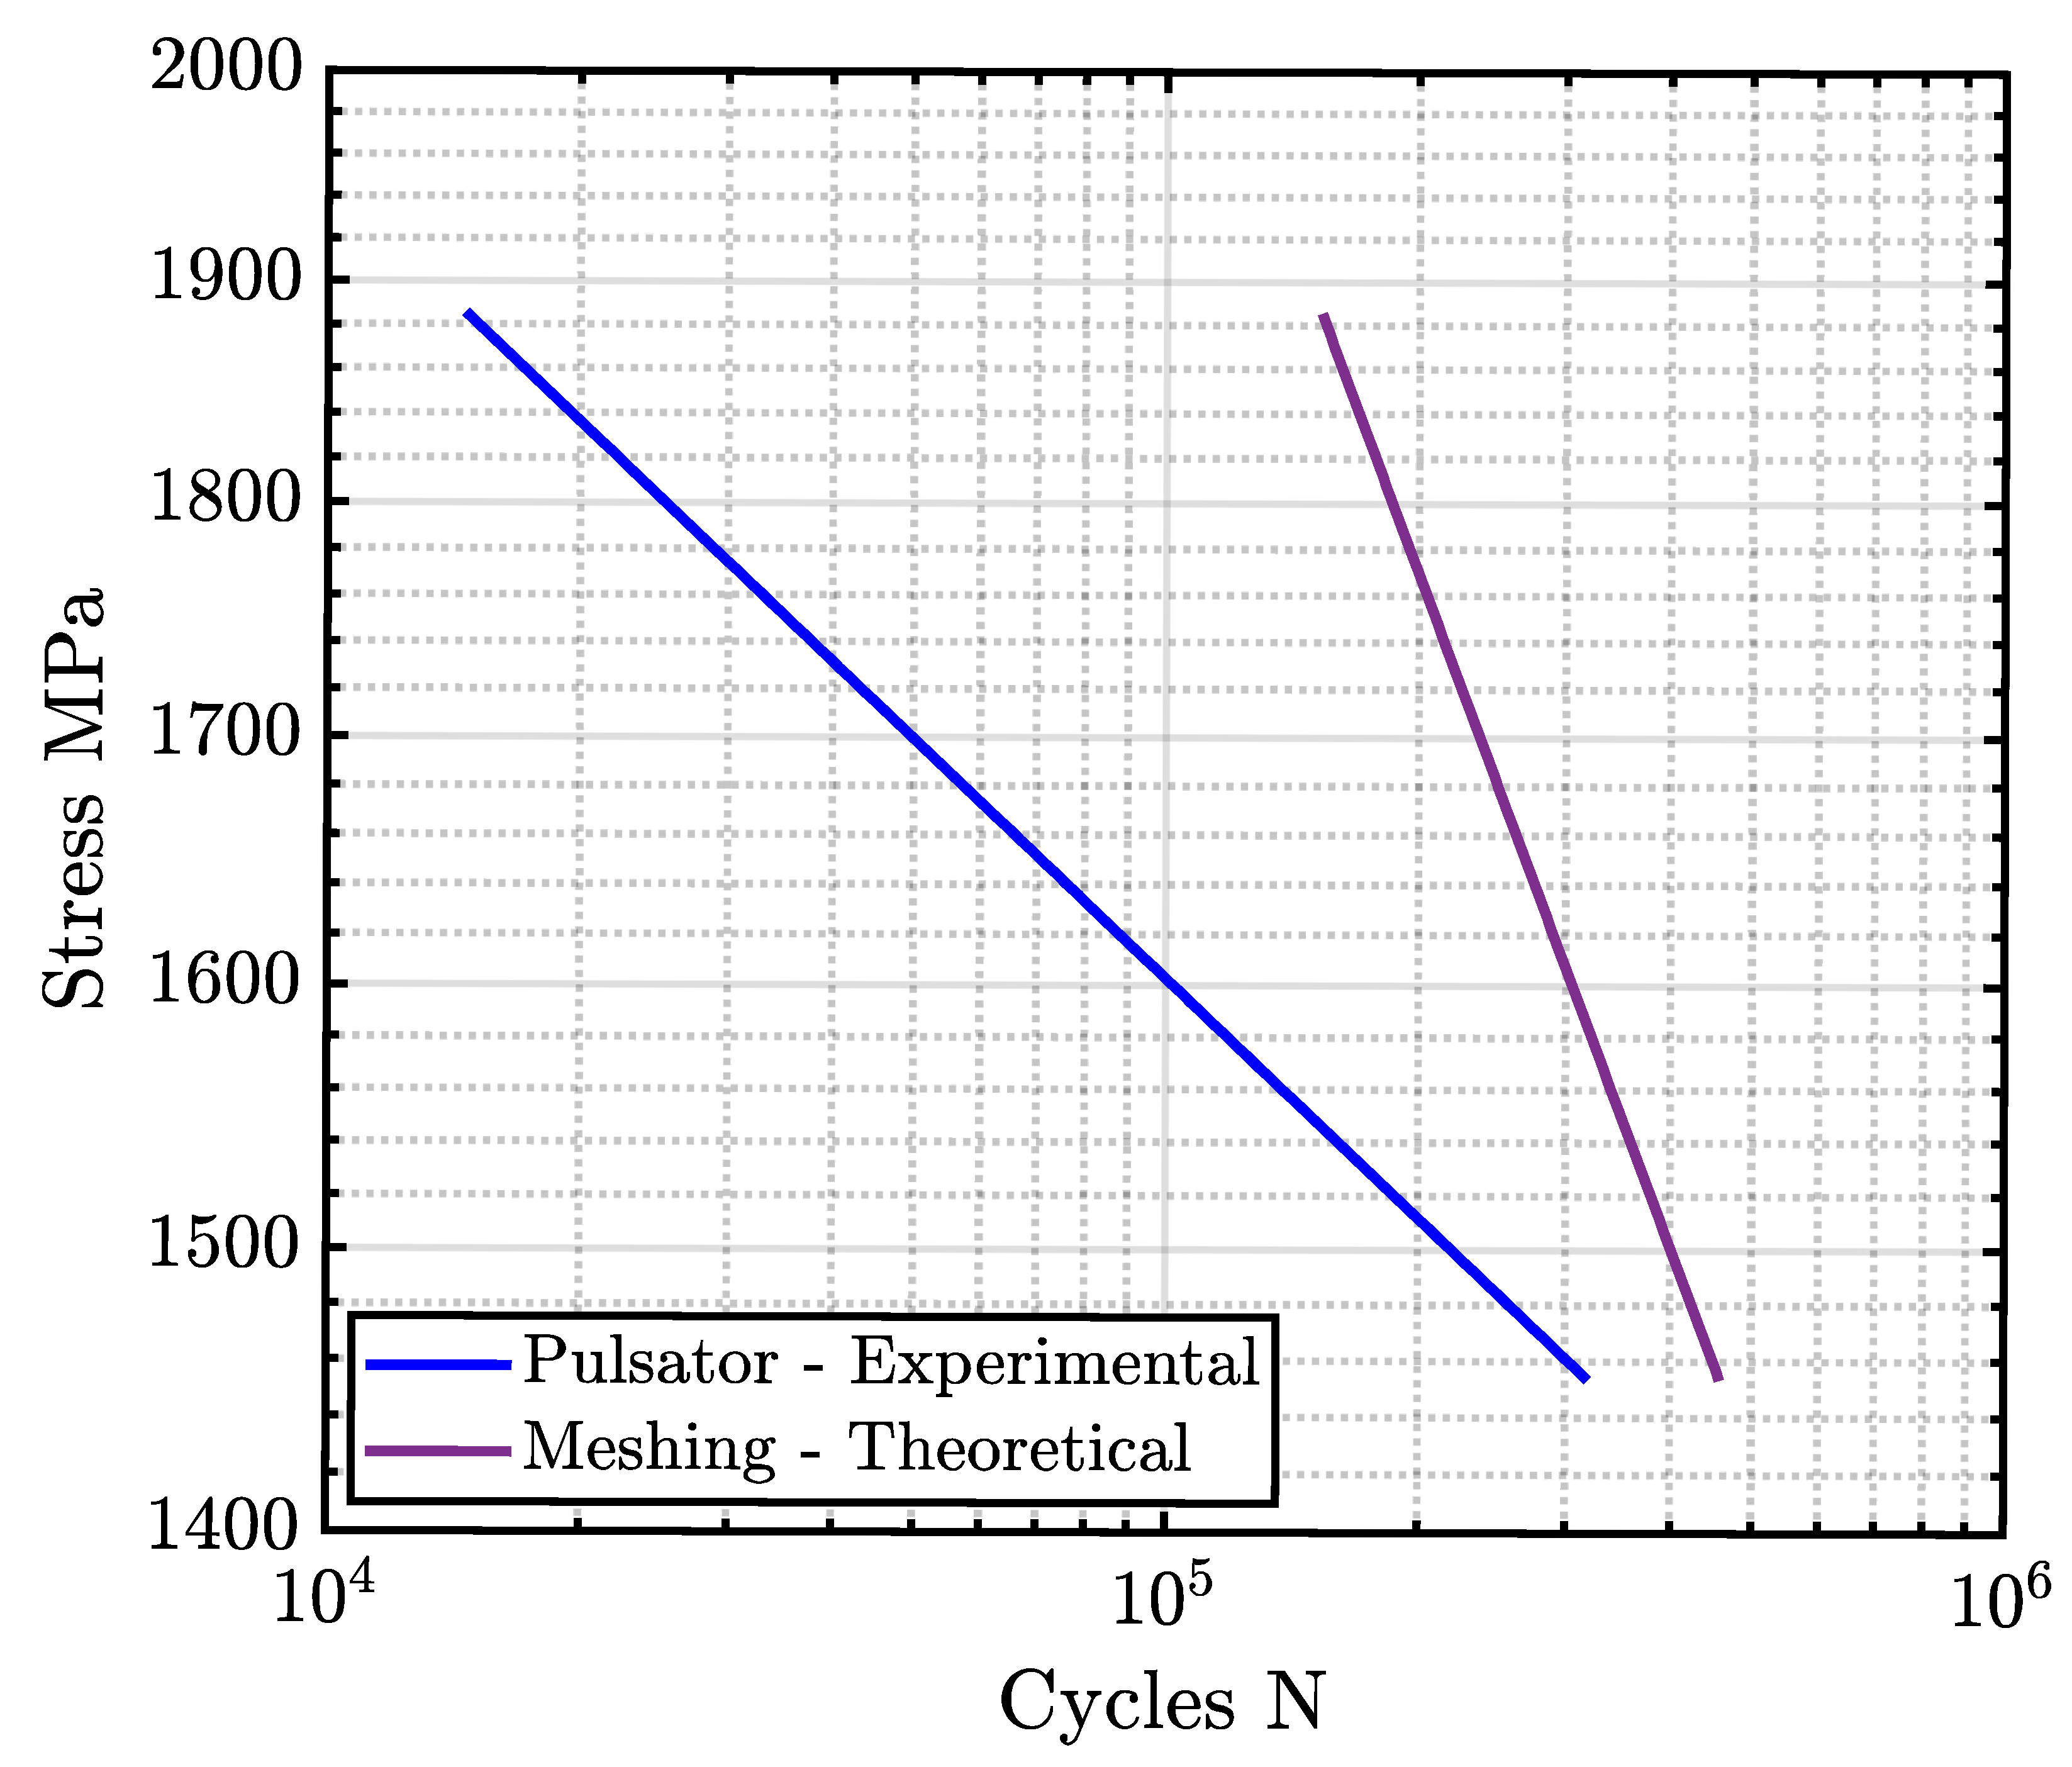
The effect of the meshing of the finite life part of the SN curve is clear: the curves are shifted rightwards as the final number of cycles increases due to the slower propagation in the meshing gear (Figure 15 and Figure 16). For the two investigated gear families, the compensated curves show not only an increase in lifetime but also a steeper slope. This indicates that the benefit associated with meshing-induced load sharing is more pronounced at higher load levels, where tooth compliance variations and load redistribution have a stronger influence on the stress intensity factor K and, consequently, on crack propagation.
Figure 15.
Gear A compensated curves, 50% failure probability.
Figure 16.
Gear B compensated curves, 50% failure probability.
7. Conclusions
This article investigates tooth-root crack propagation and its influence on gear fatigue life. A methodology is proposed to compensate for the pulsator test results and derive the corresponding meshing-gear S-N curves. The compensation is performed by adding the difference in crack-propagation life between the pulsator and meshing conditions. Two families of tested aerospace gears, namely “A” and “B”, were selected as application cases.
In order to quantify the effect of the load application method, two numerical models were developed: one for the meshing condition and one for the pulsator condition. The models were used to estimate the main quantities governing crack propagation in damaged teeth, namely the contact force acting on the cracked tooth and the stress intensity factor K at the crack tip. The latter was then used within the Paris law to calculate the final number of cycles in bot test configurations.
The comparison between the two loading cases shows that, for the investigated gear geometries, crack propagation is slower under meshing conditions than under pulsator loading. This retardation is caused by the redistribution of load among the teeth in contact during meshing: as the crack grows, the damaged tooth becomes more compliant and carries a lower share of the transmitted load, which is redistributed to the adjacent healthy meshing pairs. As a consequence, the stress intensity factor K is reduced with respect to the pulsator case, leading to slower crack growth.
For the considered gear geometries, the meshing condition increases the calculated crack-propagation life by a factor between 1.79 and 1.88 with respect to the pulsator condition. This means that the propagation phase in meshing gears is approximately 79–88% longer than that estimated from pulsator tests alone. Therefore, neglecting the meshing-induced load-sharing effect would lead to a conservative underestimation of the propagation life for the analyzed cases.
The proposed compensation methodology accounts for this effect by increasing the final number of cycles obtained from pulsator tests by the calculated difference in estimated propagation between the pulsator and meshing conditions. This procedure allows taking into account the effects of the heat treatment and the residual stresses because they are already included in the experimental pulsator test result (i.e., ) without relying on complex FE models or advanced propagation laws. The final compensated S-N curves, therefore, exhibit higher fatigue lives than the original pulsator curves.
Author Contributions
L.V.: conceptualization, data curation, methodology, software, writing—original draft preparation, writing—review and editing. L.B.: conceptualization, data curation, methodology, software, writing—original draft preparation, writing—review and editing. M.G.: conceptualization, data curation, methodology, writing—original draft preparation, writing—review and editing. S.S.: data curation, supervision, writing—review and editing. C.G.: methodology, supervision, writing—review and editing. All authors have read and agreed to the published version of the manuscript.
Funding
This research received no external funding.
Data Availability Statement
All the data used in this article are included in the article itself and in the references.
Conflicts of Interest
Author Sergio Sartori was employed by the company Leonardo S.p.A. The remaining authors declare that the research was conducted in the absence of any commercial or financial relationships that could be construed as a potential conflict of interest.
Abbreviations
| FE | Finite Element |
| MG | Meshing Gear Test |
| MS | Meshing Stiffness |
| LL | Load Level |
| CL | Crack Length |
| VIM | Vacuum Induction Melting |
| VAR | Vacuum Arc Remelting |
References
- Schütz, W. A history of fatigue. Eng. Fract. Mech. 1996, 54, 263–300. [Google Scholar] [CrossRef] [Scilit]
- ISO 10825-1:2022; Gears—Wear and Damage to Gear Teeth—Part 1: Nomenclature and Characteristics. International Organization for Standardization: Geneva, Switzerland, 2022.
- ANSI/AGMA 1010-E95; Appearance of Gear Teeth—Terminology of Wear and Failure. ANSI AGMA Standard: New York, NY, USA, 2007.
- Sacmaozu Kalfaoglu, G.; Dursun, A.B.; Pehlivanoglu, Y. A review of gear failure analysis: Classification, inspection methods, and literature-based case studies. J. Fail. Anal. Prev. 2026, 26, 678–714. [Google Scholar] [CrossRef] [Scilit]
- Li, F.; Ding, N.; Song, M.; Zhong, Z.; Liu, L.; Shen, X.; Xu, H.; Tian, L.; Xu, N.; Guo, W.; et al. A review on research of gear failures in mechanical equipment. J. Fail. Anal. Prev. 2025, 25, 612–648. [Google Scholar] [CrossRef] [Scilit]
- ISO 6336-3:2019; Calculation of Load Capacity of Spur and Helical Gears—Part 3: Calculation of Tooth Bending Strength. International Organization for Standardization: Geneva, Switzerland, 2019.
- ISO 6336-5:2019; Calculation of Load Capacity of Spur and Helical Gears—Part 5: Strength and Quality of Materials. International Organization for Standardization: Geneva, Switzerland, 2019.
- ANSI AGMA 2001-D04; Fundamental Rating Factors and Calculation Methods for Involute Spur and Helical Gear Teeth. ANSI AGMA: New York, NY, USA, 2004.
- Hong, I.J.; Kahraman, A.; Anderson, N. A rotating gear test methodology for evaluation of high-cycle tooth bending fatigue lives under fully reversed and fully released loading conditions. Int. J. Fatigue 2020, 133, 105432. [Google Scholar] [CrossRef] [Scilit]
- Hong, I.; Teaford, Z.; Kahraman, A. A comparison of gear tooth bending fatigue lives from single tooth bending and rotating gear tests. Forsch. Ingenieurwes 2022, 86, 259–271. [Google Scholar]
- Fuchs, D.; Schurer, S.; Tobie, T.; Stahl, K. On the determination of the bending fatigue strength in and above the very high cycle fatigue regime of shot-peened gears. Forsch. Ingenieurwes 2022, 86, 81–92. [Google Scholar]
- Fuchs, D.; Rommel, S.; Tobie, T.; Stahl, K. In-depth analysis of crack area characteristics of fisheye failures influenced by the multiaxial stress condition in the tooth root fillet of high-strength gears. Proc. Inst. Mech. Eng. Part C J. Mech. Eng. Sci. 2022, 236, 5581–5592. [Google Scholar] [CrossRef] [Scilit]
- Winkler, K.; Schurer, S.; Tobie, T.; Stahl, K. Investigations on the tooth root bending strength and the fatigue fracture characteristics of case-carburized and shot-peened gears of different sizes. Proc. Inst. Mech. Eng. Part C J. Mech. Eng. Sci. 2019, 233, 7338–7349. [Google Scholar] [CrossRef] [Scilit]
- Chen, D.; Gong, L.; Wu, J.; Qin, G.; Liu, H. A study on the key influencing factors of gear fatigue strength testing based on the Locati method. Measurement 2025, 255, 117869. [Google Scholar] [CrossRef] [Scilit]
- Ikuta, T.; Ando, N.; Kanamura, K.; Hanamoto, K.; Omura, T.; Nojima, K.; Nishi, R.; Ono, Y.; Koide, T. Bending fatigue and impact strength of repeated case-carburized gears. J. Mech. Sci. Technol. 2025, 39, 7211–7221. [Google Scholar] [CrossRef] [Scilit]
- Long, B.; Wang, H.; Zhu, L.; Li, L.; Zhao, H.; Li, T.; Yang, Y.; Ma, W.; Shi, L.; Yan, F.; et al. The improvement of bending fatigue properties of 20Cr2Ni4 steel gears based on multi-dimensional synergistic strengthening mechanism. Int. J. Fatigue 2026, 204, 109363. [Google Scholar] [CrossRef] [Scilit]
- Halgren, J.A.; Wulpi, D.J. Laboratory Fatigue Testing of Gears. SAE Trans. 1957, 65, 452–470. [Google Scholar]
- McPherson, D.R.; Rao, S.B. Mechanical Testing of Gears. In Mechanical Testing and Evaluation; Kuhn, H., Medlin, D., Eds.; ASM International: Singapore, 2000. [Google Scholar] [CrossRef] [Scilit]
- Rao, S.; McPherson, D. Experimental characterization of bending fatigue strength in gear teeth. Gear Technol. 2003, 20, 25–32. [Google Scholar]
- McPherson, D.R.; Rao, S.B. Methodology for translating single-tooth bending fatigue data to be comparable to running gear data. Gear Technol. 2008, 6, 42–51. [Google Scholar] [CrossRef] [Scilit] [PubMed]
- Bonaiti, L.; Bayoumi, A.B.M.; Concli, F.; Rosa, F.; Gorla, C. Gear Root Bending Strength: A Comparison Between Single Tooth Bending Fatigue Tests and Meshing Gears. J. Mech. Des. 2021, 143, 103402. [Google Scholar] [CrossRef] [Scilit]
- Bonaiti, L.; Gorla, C. Estimation of gear SN curve for tooth root bending fatigue by means of maximum likelihood method and statistic of extremes. Int. J. Fatigue 2021, 153, 106451. [Google Scholar] [CrossRef] [Scilit]
- Bonaiti, L.; Geitner, M.; Tobie, T.; Gorla, C.; Stahl, K. A Comparison between Two Statistical Methods for Gear Tooth Root Bending Strength Estimation Starting from Pulsator Data. Appl. Sci. 2023, 13, 1546. [Google Scholar] [CrossRef] [Scilit]
- Bonaiti, L.; Valsecchi, L.; Geitner, M.; Tobie, T.; Gorla, C.; Stahl, K. Crack Propagation in Tooth Root: A Comparison Between Pulsator Test and Running Gears. Fatigue Fract. Eng. Mater. Struct. 2025, 48, 5181–5194. [Google Scholar] [CrossRef] [Scilit]
- Bergmann, C.J.; Rettig, H.; Winter, H. FVA 169: Zahnrad-Pulsator- und Laufversuche—Untersuchungen über die Unterschiedlichen Beanspruchungsverhältnisse von Stirnrädern in Lauf- und Pulsatorprüfständen; Technical Report; Forschungsvereinigung Antriebstechnik e.V. Lyoner Straße 18, 6000 Frankfurt/Main 71: Frankfurt, Germany, 1983. [Google Scholar]
- Hong, I.; Talbot, D. Tooth bending strain rate analysis in a counter shaft drivetrain and implications on fatigue strength. In International Conference on Gears 2023; VDI Verlag: Düsseldorf, Germany, 2023; pp. 53–66. [Google Scholar]
- Rettig, H. Ermittlung von Zahnfußfestigkeitskennwerten auf Verspannungsprüfständen und Pulsatoren-Vergleich der Prüfverfahren und der gewonnenen Kennwerte. Antriebstechnik 1987, 26, 51–55. [Google Scholar]
- Stahl, K.; Michaelis, K.; Höhn, B. FVA Research Project 304, Final Report No. 580—Life Time Statistics—Statistical Methods for Estimation of the Machine Element Life Time and Reliability, and Exemplary Application on Gears (German: Lebensdauerstatisktik—Statistische Methoden zur Beurteilung von Bauteillebensdauer und Zuverlässigkeit und Ihre Beispielhafte Anwendung auf Zahnräder); Technical Report; Forschungsvereinigung Antriebstechnik e.V.: Frankfurt, Germany, 1999. [Google Scholar]
- Concli, F.; Maccioni, L. Critical planes criteria applied to gear teeth: Which one is the most appropriate to characterize crack propagation. Proc. WIT Trans. Eng. Sci. 2021, 133, 15–25. [Google Scholar] [CrossRef] [Scilit]
- Concli, F.; Maccioni, L.; Fraccaroli, L. Exploiting a numerical method to translate single tooth bending fatigue results into meshing gears design data: The influence of material properties. Int. J. Comput. Methods Exp. Meas. 2022, 10, 211–223. [Google Scholar] [CrossRef] [Scilit]
- Concli, F.; Fraccaroli, L.; Maccioni, L. Gear Root Bending Strength: A New Multiaxial Approach to Translate the Results of Single Tooth Bending Fatigue Tests to Meshing Gears. Metals 2021, 11, 863. [Google Scholar] [CrossRef] [Scilit]
- Stringer, D.B.; Dykas, B.D.; LaBerge, K.E.; Zakrajsek, A.J.; Handschuh, R.F. A New High-Speed, High-Cycle, Gear-Tooth Bending Fatigue Test Capability. In Proceedings of the 67th Annual Forum and Technology Display (Forum 67), Virginia Beach, VA, USA, 3–5 May 2011. [Google Scholar]
- Stephens, R.I.; Fatemi, A.; Stephens, R.R.; Fuchs, H.O. Metal Fatigue in Engineering; John Wiley & Sons: Hoboken, NJ, USA, 2000. [Google Scholar]
- Belloni, G.; Lo Conte, A. Costruzione di Macchine: Resistenza dei Materiali e Sicurezza; Hoepli: Milan, Italy, 2002. [Google Scholar]
- Niemann, G.; Winter, H.; Höhn, B.R.; Stahl, K. Schmierung, Schmierstoffe, Reibung, Verschleiß, Korrosion. In Maschinenelemente 1: Konstruktion und Berechnung von Verbindungen, Lagern, Wellen; Springer: Berlin/Heidelberg, Germany, 2019; pp. 471–490. [Google Scholar] [CrossRef] [Scilit]
- Höhn, B.R.; Michaelis, K. Gear Lubricants and Lubrication—Tomorrow’s Requirements. In Tribology of Mechanical Systems: A Guide to Present and Future Technologies; ASME Press: New York, NY, USA, 2004. [Google Scholar] [CrossRef] [Scilit]
- Höhn, B.-R.; Michaelis, K.; Otto, H.-P. Minimised Gear Lubrication by a Minimum Oil/Air Flow Rate. In Proceedings of the 10th International Power Transmission and Gearing Conference, International Design Engineering Technical Conferences and Computers and Information in Engineering Conference, Las Vegas, NA, USA, 4–7 September 2007; Volume 7. [Google Scholar] [CrossRef] [Scilit]
- Bonaiti, L.; Monti, M.; Geitner, M.; Tobie, T.; Gorla, C.; Stahl, K. On the usage of pulsator data within the load spectra assessment of gears. Int. J. Fatigue 2024, 181, 108145. [Google Scholar] [CrossRef] [Scilit]
- Nicoletto, G. Approximate stress intensity factors for cracked gear teeth. Eng. Fract. Mech. 1993, 44, 231–242. [Google Scholar] [CrossRef] [Scilit]
- Wheitner, J.A.; Houser, D.R. NASA-CR-195093: Investigation of the Effects of Manufacturing Variations and Materials on Fatigue Crack Detection Methods in Gear Teeth; Technical Report; NASA: Washington, DC, USA, 1994. [Google Scholar]
- Lewicki, D.G.; Ballarini, R. Rim Thickness Effects on Gear Crack Propagation Life. Int. J. Fract. 1997, 87, 59–86. [Google Scholar] [CrossRef] [Scilit]
- Lewicki, D.G.; Ballarini, R. Gear crack propagation investigations. Tribotest 1998, 5, 157–172. [Google Scholar] [CrossRef] [Scilit]
- Sun, X.; Zhao, J.; Song, S.; Lu, Y.; Sun, H. A numerical model for total bending fatigue life estimation of carburized spur gears considering the hardness gradient and residual stress. Meccanica 2024, 59, 1037–1060. [Google Scholar] [CrossRef] [Scilit]
- Egbert, H.; Kahraman, A.; Hong, I. In-Situ Image-based Crack Measurement Methodology for Gear Single Tooth Bending Fatigue Testing. Procedia Struct. Integr. 2024, 57, 179–190. [Google Scholar] [CrossRef] [Scilit]
- He, H.; Yang, D.; Ren, Z.; Zhao, R.; Huang, J. The proportion between the gear bending fatigue crack initiation and total life: A quantitative study. Eng. Fail. Anal. 2025, 175, 109611. [Google Scholar] [CrossRef] [Scilit]
- Buenneke, R.W.; Slane, M.B.; Dunham, C.R.; Semenek, M.P.; Shea, M.M.; Tripp, J.E. Gear Single Tooth Bending Fatigue Test. SAE Trans. 1982, 91, 3266–3274. [Google Scholar]
- Metals Technical Committee. Single Tooth Gear Bending Fatigue Test; Technical Report; SAE International: Warrendale, PA, USA, 2017. [Google Scholar]
- Gasparini, G.; Mariani, U.; Gorla, C.; Filippini, M.; Rosa, F. Bending fatigue tests of helicopter case carburized gears: Influence of material, design and manufacturing parameters. In American Gear Manufacturers Association (AGMA) Fall Technical Meeting; AGMA American Gear Manufacturers Association: Alexandria, VA, USA, 2008; pp. 131–142. [Google Scholar]
- Bonaiti, L.; Gorla, C.; Mariani, U.; Molinaro, R.; Rustici, S.; Sartori, S. Twenty Years of Pulsator Tests on Helicopter Gears. In American Gear Manufacturers Association Fall Technical Meeting, FTM 2025-Held at the Motion+ Power Technology Expo 2025; AGMA American Gear Manufacturers Association: Alexandria, VA, USA, 2025; pp. 439–457. [Google Scholar]
- Bonaiti, L.; Gorla, C.; Mariani, U.; Molinaro, R.; Rustici, S.; Sartori, S. Vent’anni di prove pulsatore su ingranaggi elicotteristici. In Organi di Trasmissione; Tecniche Nuove: Milan, Italy, 2026; pp. 28–35. [Google Scholar]
- Hück, M. Ein verbessertes Verfahren für die Auswertung von Treppenstufenversuchen. Mater. Werkst. 1983, 14, 406–417. [Google Scholar] [CrossRef] [Scilit]
- Yildiz, A.; Sekercioglu, T. Bending Fatigue Life Simulation and Experimental Validation of Carburized Spur Gears Based on Geometric Design Parameters. Fatigue Fract. Eng. Mater. Struct. 2026, 49, 528–545. [Google Scholar] [CrossRef] [Scilit]
- Wang, Z.; Gao, J.; Yuan, Y.; Zhou, J.; Zhang, H.; Pan, R.; Zhang, J. Crack Initiation, Propagation and Fatigue Life Prediction of Spur Gear Under a Moving Contact Load. Int. J. Numer. Methods Eng. 2025, 126, e70178. [Google Scholar] [CrossRef] [Scilit]
- Alves de Moura, A.R.; Morel, F.; Pessard, E.; Bellett, D.; Augustins, L.; Herisson, D. Understanding the bi-modal fatigue behavior of the case-hardened M50NiL steel. Int. J. Fatigue 2026, 207, 109495. [Google Scholar] [CrossRef] [Scilit]
- He, H.; Zhao, L.; Huang, J.; Liu, H.; Yuan, Y. Experimental and numerical studies on the propagation paths of gear root cracks. Eng. Fract. Mech. 2024, 311, 110583. [Google Scholar] [CrossRef] [Scilit]
- Wang, Z.; Zhang, K.; Shi, L.; Wang, D.; Xing, H. Experimental and numerical investigations on gear root crack propagation behavior and fatigue life. J. Fail. Anal. Prev. 2025, 25, 445–457. [Google Scholar] [CrossRef] [Scilit]
- Conrado, E.; Davoli, P. The “true” bending stress in SPUR gears. Gear Technol. 2007, 24, 52–57. [Google Scholar]
- Ural, A.; Heber, G.; Wawrzynek, P.A.; Ingraffea, A.R.; Lewicki, D.G.; Neto, J.B. Three-dimensional, parallel, finite element simulation of fatigue crack growth in a spiral bevel pinion gear. Eng. Fract. Mech. 2005, 72, 1148–1170. [Google Scholar] [CrossRef] [Scilit]
- Pehan, S.; Hellen, T.K.; Flašker, J. Applying Numerical Methods for Determining the Service Life of Gears. Fatigue Fract. Eng. Mater. Struct. 1995, 18, 971–979. [Google Scholar] [CrossRef] [Scilit]
- Blarasin, A.; Guagliano, M.; Vergani, L. Fatigue Crack Growth Prediction in Specimens Similar to Spur Gear Teeth. Fatigue Fract. Eng. Mater. Struct. 1997, 20, 1171–1182. [Google Scholar] [CrossRef] [Scilit]
- Colombo, C.; Guagliano, M.; Vergani, L. Fatigue Crack Growth Behaviour of Nitrided and Shot Peened Specimens. Struct. Durab. Health Monit. 2005, 1, 253–266. [Google Scholar] [CrossRef]
- Wang, Y.; Zhang, H.; Xu, H.; Liu, J.; Guo, Y. Research on the gear bending fatigue full-life prediction model of considering hobbing residual stress. Precis. Eng. 2025, 95, 551–565. [Google Scholar] [CrossRef] [Scilit]
- Pagliari, L.; Hong, I.; Kahraman, A.; Concli, F. Experimental and numerical analysis of low-cycle tooth bending fatigue in case-carburized gears. Int. J. Fatigue 2026, 202, 109237. [Google Scholar] [CrossRef] [Scilit]

Disclaimer/Publisher’s Note: The statements, opinions and data contained in all publications are solely those of the individual author(s) and contributor(s) and not of MDPI and/or the editor(s). MDPI and/or the editor(s) disclaim responsibility for any injury to people or property resulting from any ideas, methods, instructions or products referred to in the content. |
© 2026 by the authors. Licensee MDPI, Basel, Switzerland. This article is an open access article distributed under the terms and conditions of the Creative Commons Attribution (CC BY) license.