


Abstract
One of the main challenges in BLDC motor diagnostics is the identification of faults with different physical origins, especially in mixed states where the symptoms of multiple faults may overlap. In this work, a classification system based on feature-level data fusion was developed by combining current and rotational signals. A homogeneous Stacking Ensemble model was used as the main mechanism for fault classification. The study was conducted on a dataset of 184 samples representing four operating conditions: healthy operation, mechanical faults, electrical faults associated with permanent magnet degradation, and their combined occurrence. The stability of the proposed classifier was evaluated using ten different data splits. The experiments showed that omitting PCA preserves more diagnostically relevant information contained in the raw features, resulting in a classification accuracy of 97.3% with a standard deviation of 0.017. PCA consistently reduced performance across all considered data modalities. The model was further analysed using SHAP, indicating that its decisions were driven by physically interpretable features from both the rotational and current domains.
Keywords:
BLDC motor; data fusion; stacking ensemble; Random Forest; condition monitoring; SHAP; PCA 1. Introduction
Brushless DC (BLDC) motors are widely used in automation and robotics because of their high efficiency, favourable power-to-weight ratio, and reliable operation [1]. In modern industrial systems, the need to reduce unexpected failures, downtime, and maintenance-related costs has made condition monitoring and predictive diagnostics central elements of Industry 4.0-oriented predictive maintenance [2,3,4]. From the diagnostic perspective, early detection of degradation mechanisms is particularly important: bearing-related faults affect vibration and motion stability [5], whereas electrical faults in BLDC drives can be identified from characteristic changes in electrical signals and data-driven classification models [1].
Motor Current Signature Analysis (MCSA) remains one of the standard signal-based approaches in electrical machine diagnostics [6]. However, single-domain analysis becomes less reliable when fault signatures overlap or when different physical effects appear simultaneously. In multi-sensor fault diagnosis, Xu et al. showed that multimodal feature fusion improves discrimination capability compared with single-sensor representations [7]. Likewise, Wang et al. demonstrated that multilevel information fusion can improve motor-fault classification by combining complementary information streams [8]. These observations motivate the use of machine-learning-based feature fusion when mechanical and electrical symptoms coexist in a BLDC motor.
The aim of this study is to develop and validate a diagnostic system capable of classifying motor fault conditions, with particular focus on combined faults. The following research tasks were carried out:
- Development of a Stacking Ensemble classifier structure combining multiple base models to improve generalization performance;
- Implementation of feature-level data fusion, integrating information from current and mechanical (rotational) signals;
- Comparative analysis of the impact of dimensionality reduction using PCA on diagnostic performance; the results indicate that, for the considered problem, the use of raw features leads to higher classification accuracy (97.3%);
- Application of the SHAP method (SHapley Additive Explanations) to interpret model decisions and assess their consistency with the physical principles of electric drive operation.
The paper is organized as follows. Section 2 describes the materials and methods, including the experimental setup, data acquisition process, and theoretical background of the applied machine learning techniques. Section 3 presents the experimental results, including the evaluation of different classification variants and model stability. Section 4 provides a detailed discussion of the results using SHAP-based interpretability tools. Finally, Section 5 summarizes the conclusions and outlines directions for future work.
2. Materials and Methods
2.1. Dataset Description
The study was based on the DUDU-BLDC dataset (Dataset for Diagnostics of Brushless DC Motors with Degrading Magnets), developed by a research team led by Prof. J. Baranowski. Measurements were carried out on Fein EC48 brushless DC motors (Fein, Schwäbisch Gmünd, Germany) powered by 18 V Li-ion battery packs and controlled using PWM drives with a switching frequency of 16 kHz. To increase the inertia of the system, the drive units were mechanically coupled in pairs using shafts.
The data acquisition system included two channels: current measurement using a Hall-effect sensor and rotational speed measurement using a laser tachometer. Signals were sampled at 50 kHz, which allowed accurate representation of both current dynamics and harmonic phenomena associated with rotor magnet degradation.
2.1.1. Data Preparation and Population
The analysis focused on signals recorded under steady-state operating conditions. The raw time series were divided into segments of 0.8 s, each treated as a single observation. In total, the dataset consists of 184 samples assigned to four technical condition classes:
- Healthy (46 samples)—motors without diagnosed mechanical or electrical faults;
- Mechanical Fault (46 samples)—motors with mechanically induced faults;
- Electrical Fault (46 samples)—motors with faults of electrical origin associated with permanent magnet degradation;
- Mixed Fault Condition (46 samples)—motors with simultaneous mechanical and electrical faults.
The benchmark dataset is based on four controlled measurement campaigns corresponding to the four analyzed operating conditions. Consequently, segmentation into multiple 0.8 s windows increases the number of classification samples, but does not increase the number of independent physical experiments. Therefore, the results obtained on this benchmark should be interpreted primarily as within-benchmark discrimination results, whereas transferability to unseen units is assessed separately using the external validation dataset introduced later in the paper.
2.1.2. Feature Extraction
From each 0.8 s segment, 26 features describing the signal were extracted. These features were divided into two groups:
- Current domain (Current): A total of 13 statistical and spectral parameters, including mean value, standard deviation, RMS, crest factor, spectral centroid, and amplitudes at the first, second, and third harmonics of the rotational speed.
- Rotational domain (ROTO RPM): A total of 13 analogous parameters derived from the rotational speed signal.
The distributions and correlation matrices for individual classes are provided in the Data Appendix available as part of the dataset repository.
The DUDU-BLDC benchmark has already been used in several methodological studies, including baseline probabilistic classification, Bayesian data fusion, and feature-ranking analyses. These earlier works established the benchmark as a useful test case for evaluating diagnostic models based on current and rotational-speed measurements; for example, a KDE-based Bayesian data-fusion study showed that combining both modalities can improve multiclass fault recognition relative to single-modality variants [9]. Against this background, the present study extends the benchmark literature toward homogeneous stacking, an explicit comparison between PCA-transformed and raw-feature representations, and SHAP-based interpretation of the resulting fault-classification decisions.
2.2. Theoretical Background of Data Transformation and Reduction
In this study, Principal Component Analysis (PCA) was used to linearly transform high-dimensional diagnostic parameters into a space of uncorrelated orthogonal variables [10]. The input to the transformation consisted of 26 statistical and spectral features extracted from stator current signals and rotational speed (Roto) measured under steady-state operating conditions.
The main purpose of applying PCA was to reduce the number of variables while retaining as much variance of the original signal as possible. In the analysed dataset, 9 principal components explained 91.58% of the total variance. An important part of the study was the analysis of loadings, which describe how strongly the original physical features contribute to each principal component.
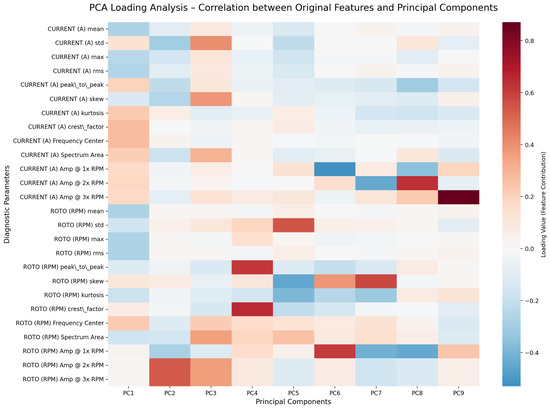
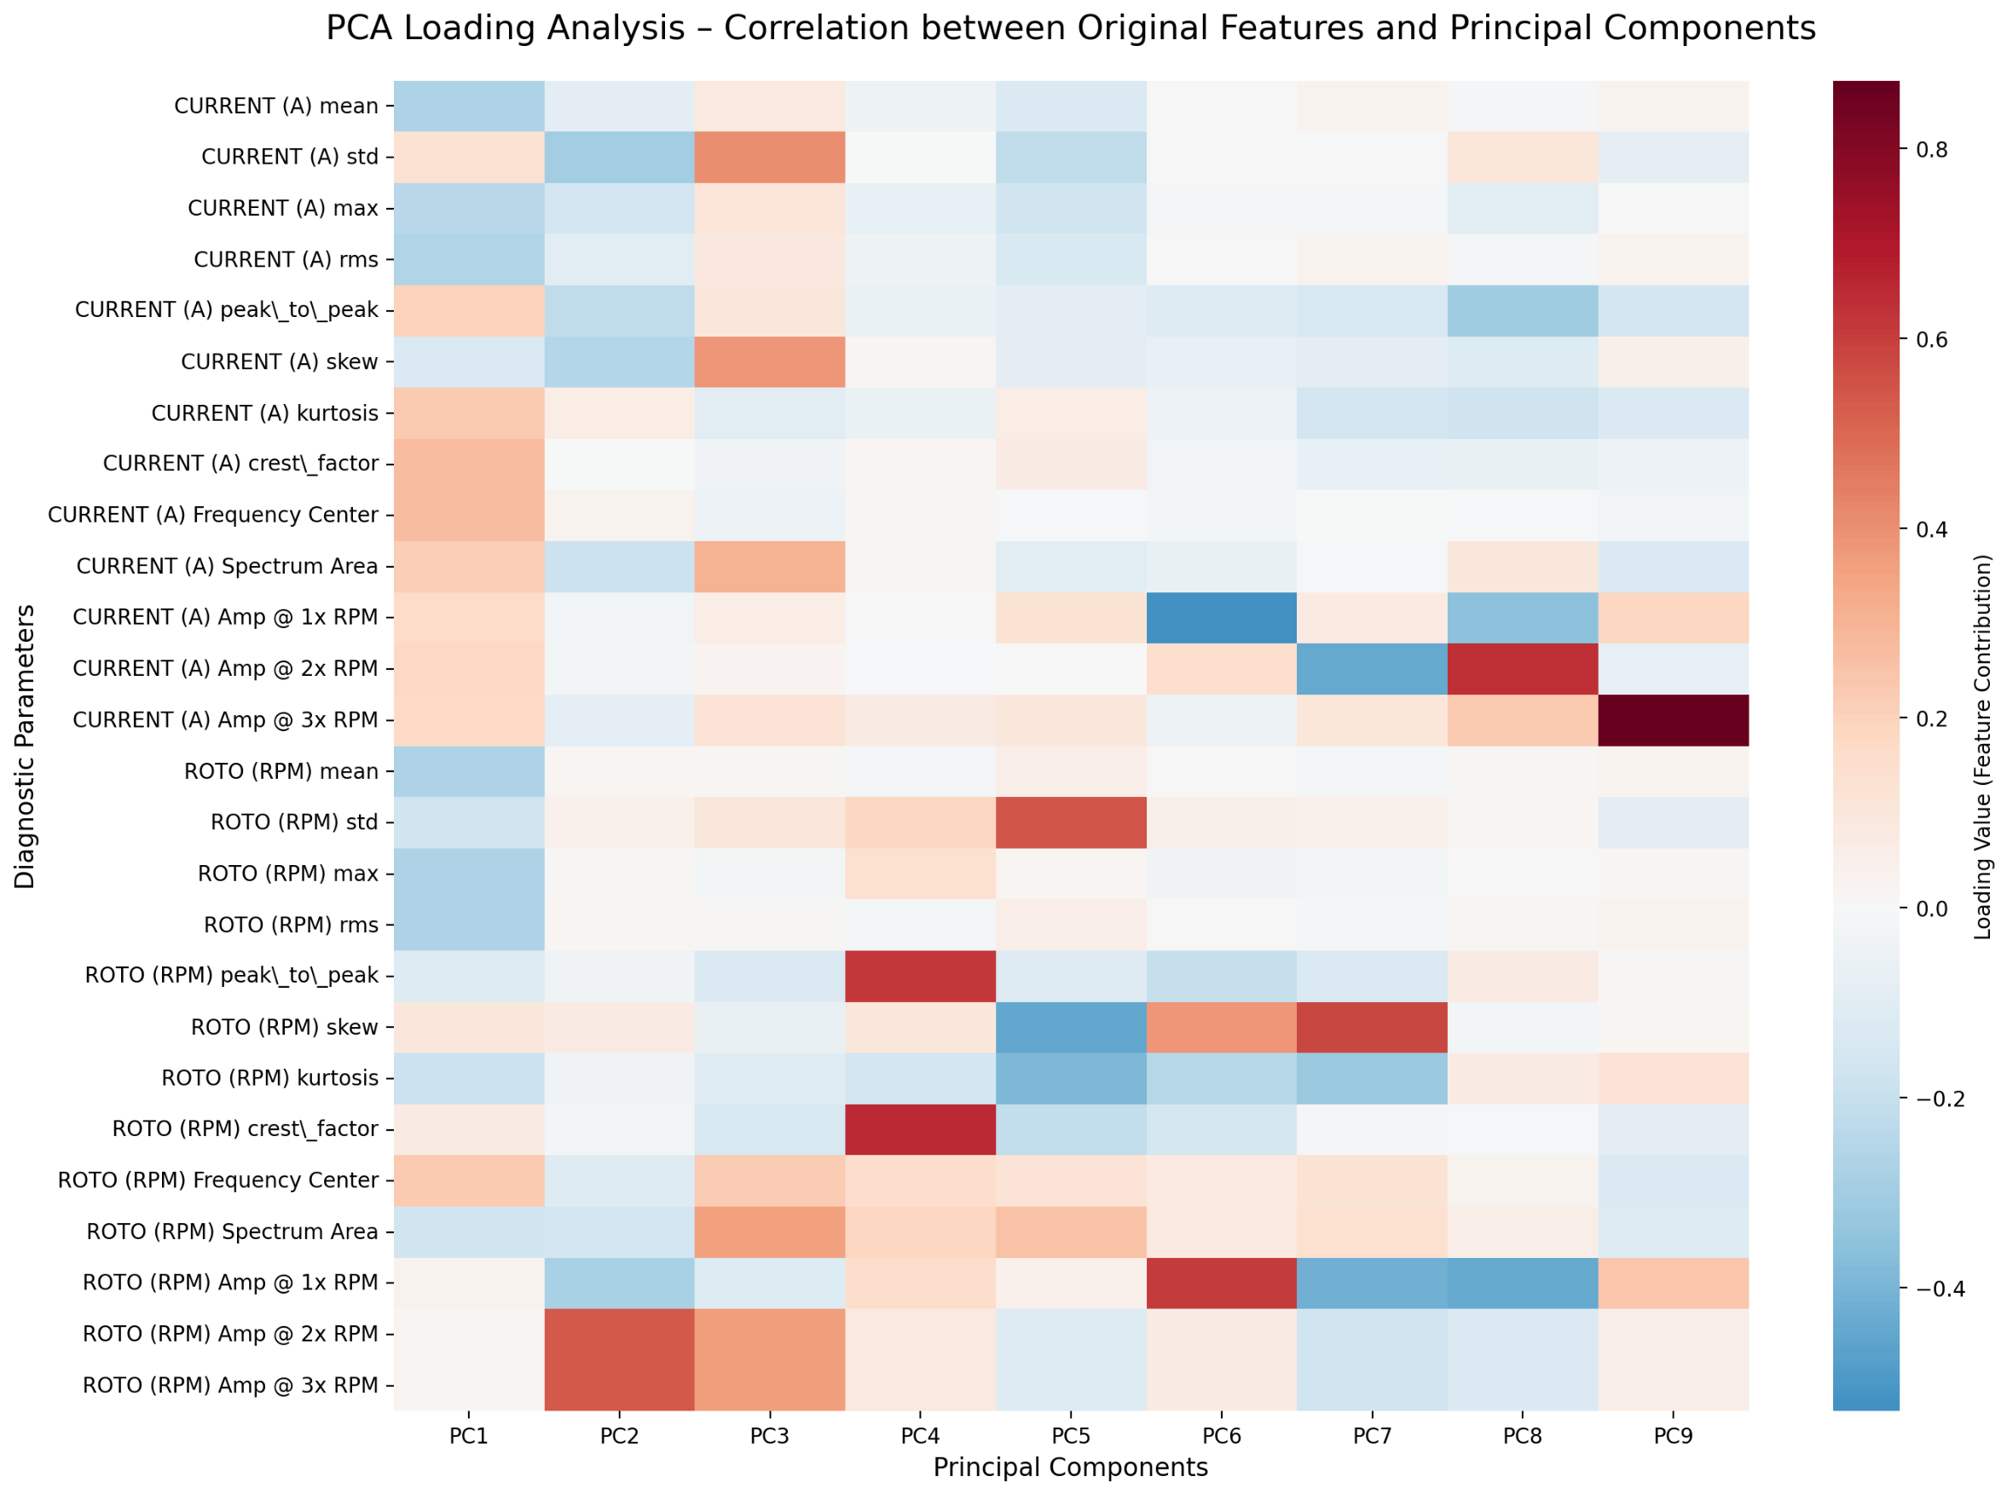
The loadings shown in Figure 1 make it possible to interpret what kind of diagnostic information is captured by individual components:
Figure 1.
Feature loadings for the first principal components, showing the influence of individual physical parameters on the variance structure of the dataset.
- PC1: Shows the highest loadings for energy-related parameters from both domains, such as CURRENT (A) mean, rms, and ROTO (RPM) mean. This suggests that the first component mainly represents overall signal energy and operating point stability.
- PC2 and PC3: Are dominated by spectral features, including higher harmonics of rotational speed (ROTO (RPM) Amp @ 2x and 3x RPM), indicating sensitivity to mechanical vibrations and rotor asymmetry.
- PC4 and PC5: Concentrate around features describing impulsive behavior of the signal, such as ROTO (RPM) crest_factor, which is relevant for detecting mechanically induced imbalance and related rotor-dynamic disturbances.
- PC9: Despite its relatively small contribution to total variance, it is strongly associated with CURRENT (A) Amp @ 3x RPM, highlighting current harmonics as a separate diagnostic dimension.
Despite its effectiveness in data compression, PCA may negatively affect the performance of tree-based ensemble methods by mixing diagnostically distinct variables into linear combinations [10,11]. In the present study, the model using full feature fusion without PCA achieved an accuracy of 97.30%, whereas reducing the feature space to 9 components lowered the accuracy to 91.89%. This can be explained by the fact that linear combinations of features tend to blur distinct diagnostic signatures, making it more difficult for tree-based models to form clear decision boundaries.
Projecting the data onto PCA axes, which are linear combinations of multiple physical variables, also reduces direct interpretability in terms of physical thresholds. As a result, this transformation may obscure important nonlinear relationships between current and rotational speed, which are important for identifying mixed fault conditions.
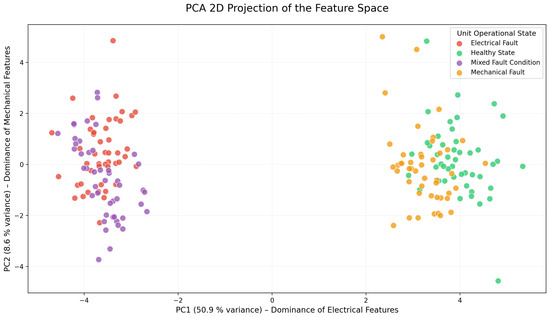
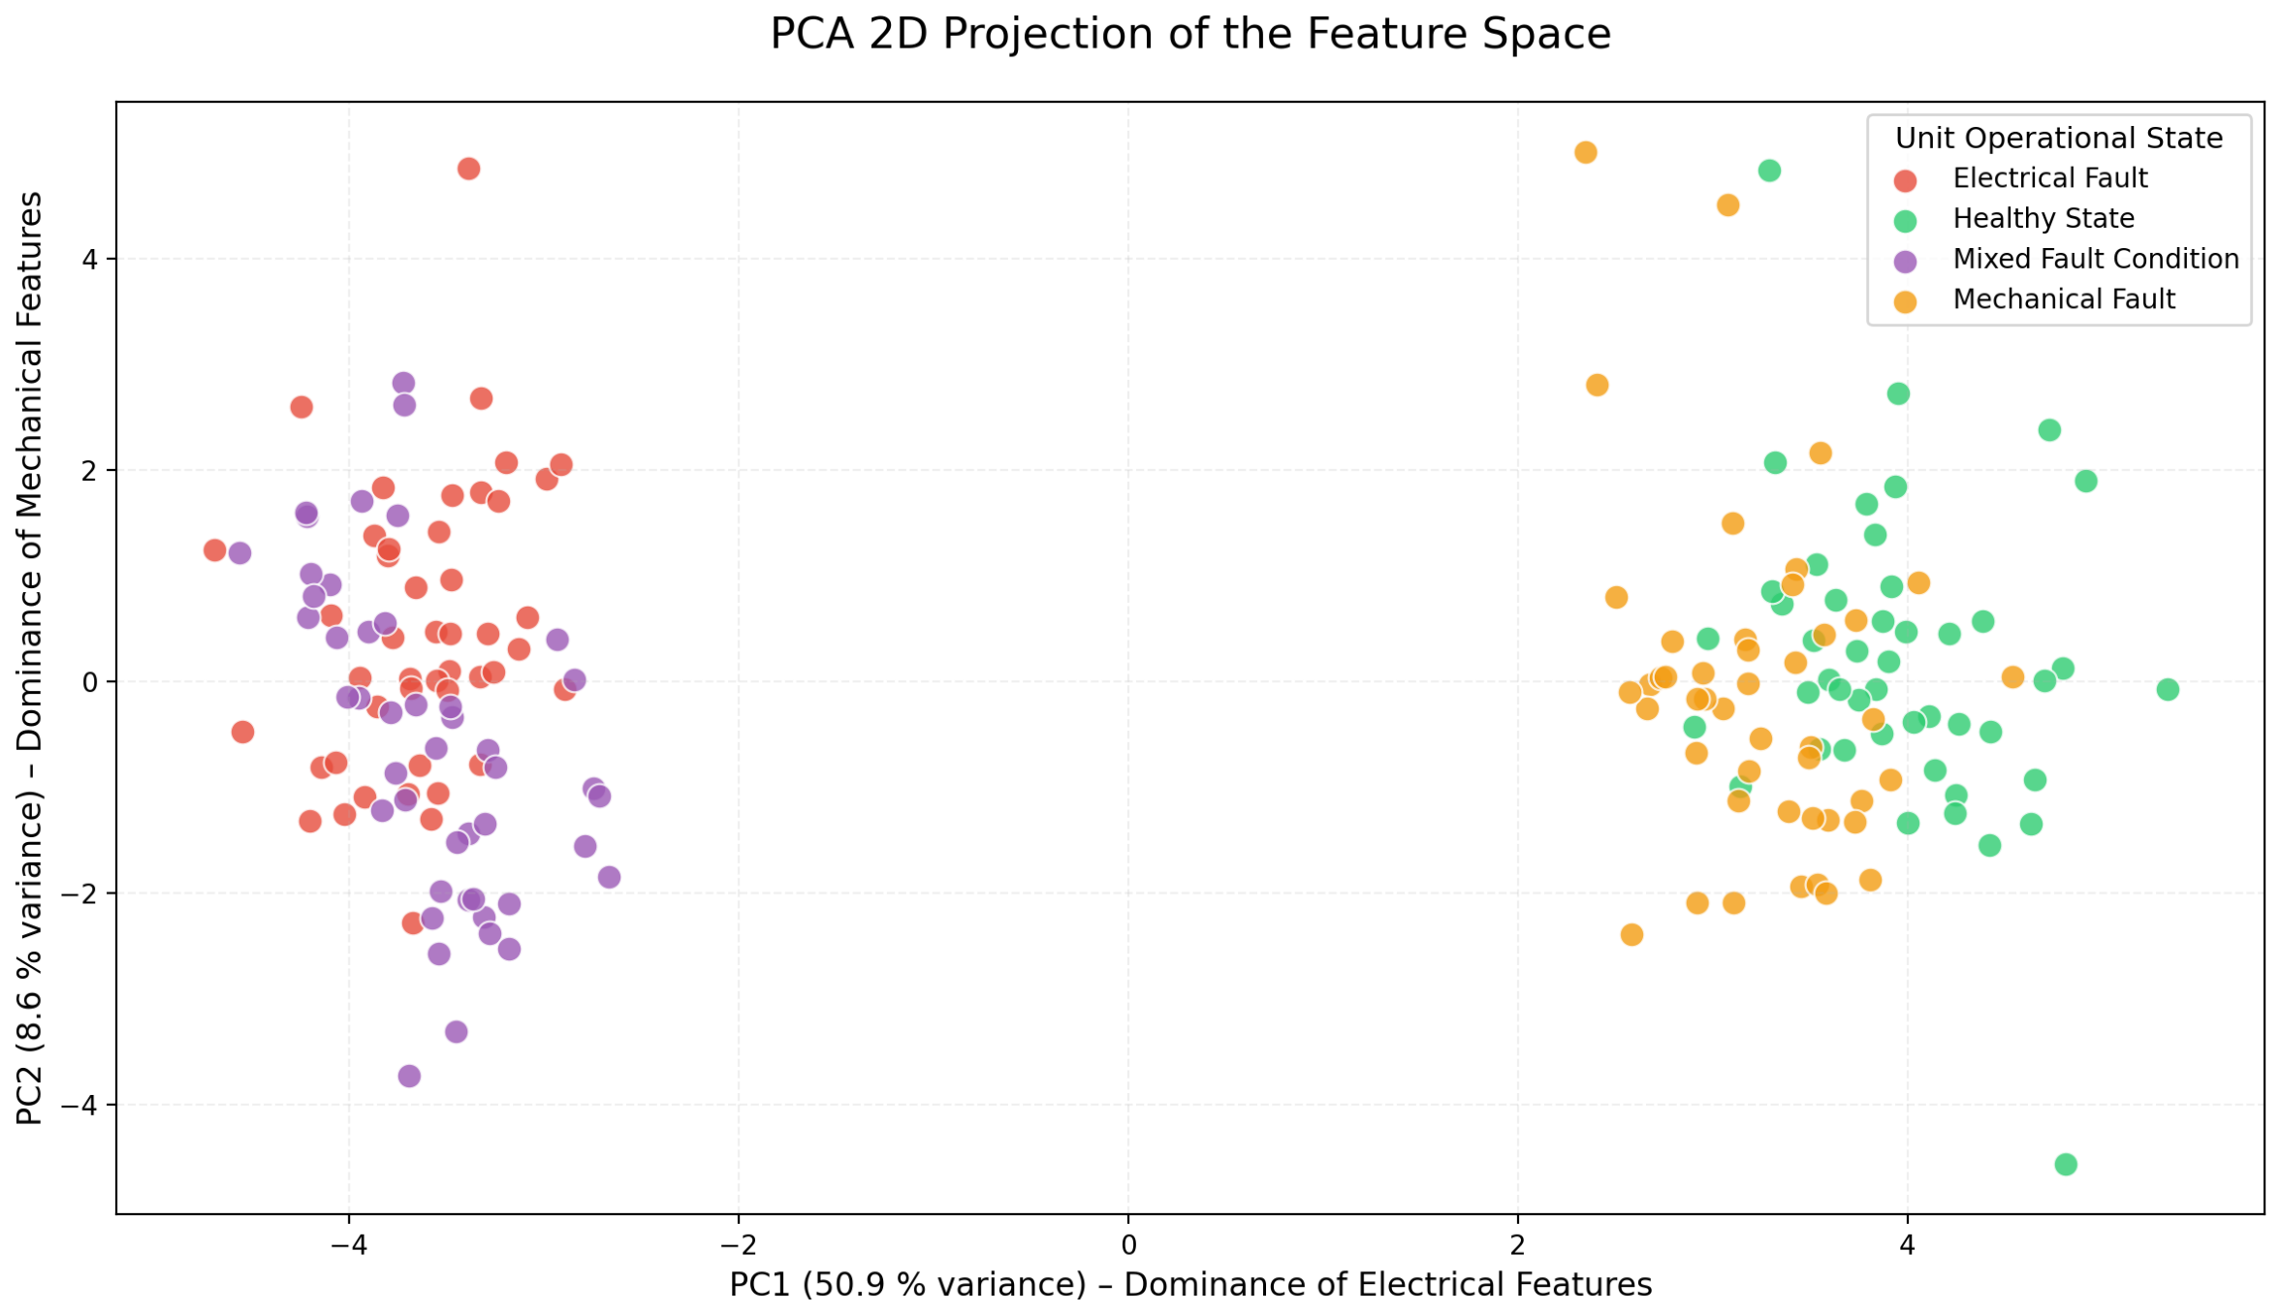
The visualization in Figure 2 shows a clear global separation of the dataset along the PC1 axis, which explains 50.9% of the total variance and is largely influenced by electrical-domain features. Samples representing electrical faults and mixed faults form a compact cluster on the left side of the plot (), while healthy states and mechanical faults are grouped on the right ().
Figure 2.
2D PCA visualization of the dataset; projection of the 26-dimensional feature vector onto the first two principal components.
However, despite this global separation, a closer look reveals significant overlap between classes, which limits classification performance after dimensionality reduction:
- Mechanical domain: The healthy class and mechanical fault classes overlap along the PC2 axis (8.6% variance), suggesting that the first two components do not capture enough information to clearly distinguish early-stage mechanical faults.
- Electrical domain: A similar overlap appears between electrical faults and mixed faults. The linear nature of PCA makes mechanical signatures in mixed faults harder to separate from purely electrical ones.
This effect directly explains the observed drop in classification accuracy from 97.30% to 91.89% when PCA was applied. The method leads to increased overlap between class distributions in the reduced feature space, making precise separation of physically similar signals more difficult.
The visual overlap observed in the PCA representation is also supported by quantitative separability measures. In the PCA space, the silhouette score was equal to , while the Davies–Bouldin index reached . At the same time, the first two principal components explained of the total variance. These values indicate weak global class separation in the reduced space and are consistent with the observed deterioration of classification performance after PCA.
2.3. Theoretical Background of Data Processing and Classification
The choice of the modeling approach was directly related to the nature of the analyzed diagnostic signals. Modern fault-diagnosis workflows increasingly rely on machine-learning models combined with feature fusion, especially when multiple signal domains are considered [7]. When combining 26 features from current and rotational domains, an important challenge arises from the fact that many of them (e.g., RMS, mean value, and harmonic amplitudes) are strongly correlated.
For a relatively small dataset of 184 samples, individual models are prone to overfitting, meaning they may capture noise instead of meaningful fault signatures. The following sections describe the methods used to mitigate these effects.
2.3.1. Principal Component Analysis (PCA)
PCA (Principal Component Analysis) was applied as a linear dimensionality reduction technique based on covariance matrix decomposition. Its goal is to transform the original feature vector into a new orthogonal space, where principal components (PCs) are uncorrelated and ordered by decreasing variance.
PCA helps reduce data redundancy. However, this approach has an important drawback: projecting physically meaningful features (such as kurtosis or crest factor) onto abstract mathematical axes reduces their direct interpretability. In modern diagnostics, increasing attention is given to explainability (XAI), where understanding the influence of individual physical features on the final decision is essential for building trust in the system [12,13]. As shown later in this study, the loss of clear decision thresholds in PCA-transformed space contributed to the observed drop in classification accuracy compared to models operating on raw features.
2.3.2. Random Forest Algorithm
Random Forest was selected as the base classifier due to its ability to capture nonlinear relationships between current and rotational speed without requiring feature scaling. Tree-based algorithms are widely used in motor diagnostics [14]. Instead of relying on a single decision tree, the method builds an ensemble of independent models. The final decision is obtained through their collective voting, which reduces sensitivity to errors made by individual trees.
The robustness and accuracy of this approach result from two key mechanisms:
- Bagging: Each tree is trained on a different subset of the dataset. As a result, local disturbances or noise in the signal affect only a limited number of trees, while the remaining models maintain correct predictions, improving overall robustness.
- Random subspace method: At each split, the algorithm considers only a randomly selected subset of features. This encourages the model to explore less obvious variables, improving information extraction in the process of multi-level data fusion. Without this mechanism, dominant statistical features could overshadow weaker but diagnostically relevant signals, reducing the model’s sensitivity to subtle fault patterns.
2.3.3. Homogeneous Stacking Architecture
A homogeneous stacking architecture was applied to combine multiple classifiers in order to improve generalization and reduce prediction error [8]. The approach is based on a hierarchical learning structure, where the outputs of base models are used as inputs to a higher-level model.
At the first level (Level 0), three different configurations of the Random Forest algorithm were used. This choice was motivated by the strong performance of tree-based models in rotating machinery diagnostics and their ability to handle data with different physical characteristics:
- 1.
- RF Shallow (max_depth = 5): a model with higher bias but lower variance. It acts as a stabilizing component, helping to reduce sensitivity to noise in current signals.
- 2.
- RF Dense (500 trees, deep): a low-bias model designed to capture subtle details and nonlinear patterns, especially in mixed fault conditions.
- 3.
- RF Standard: a balanced configuration used as a reference point for the other base models.
For the meta-classifier (Level 1), Logistic Regression was selected. Its role is not to directly analyze motor features, but to combine the outputs (probabilities) of Level 0 models in an optimal way. In practice, it learns which base model to rely on in a given situation, which improves class separation in more ambiguous cases—for example, when current and rotational domains provide conflicting indications.
2.3.4. Comparative Evaluation Protocol
To position the proposed method against standard tabular classifiers, an additional comparative experiment was conducted on the fused representation combining current and rotational features. Five models were evaluated: Logistic Regression, SVM, Random Forest, XGBoost, and the proposed Stacking Ensemble. For each model, two variants were considered: operation in the raw feature space and operation after PCA-based dimensionality reduction. To ensure consistency of comparison, all models were evaluated using the same feature-selection procedure, limiting the representation to 15 diagnostically relevant features by means of a Random-Forest-based selector fitted within each training fold.
Because the benchmark dataset consists of four controlled experiments segmented into multiple time windows, this comparison should be interpreted as a within-benchmark discrimination study rather than a full assessment of cross-unit generalization. Performance was quantified using macro-F1 and balanced accuracy, reported as mean ± standard deviation over five stratified folds.
3. Results
3.1. Impact of Data Modality and PCA Transformation on Classification Performance
A series of experiments was conducted to evaluate the impact of input data modality and the use of PCA-based dimensionality reduction on fault classification accuracy. The results are summarized in Table 1.
Table 1.
Comparison of classification accuracy for different data modalities and processing variants.
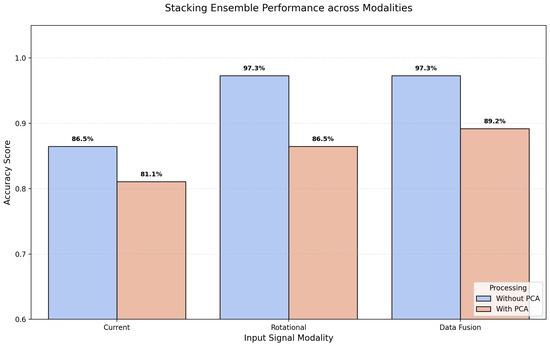
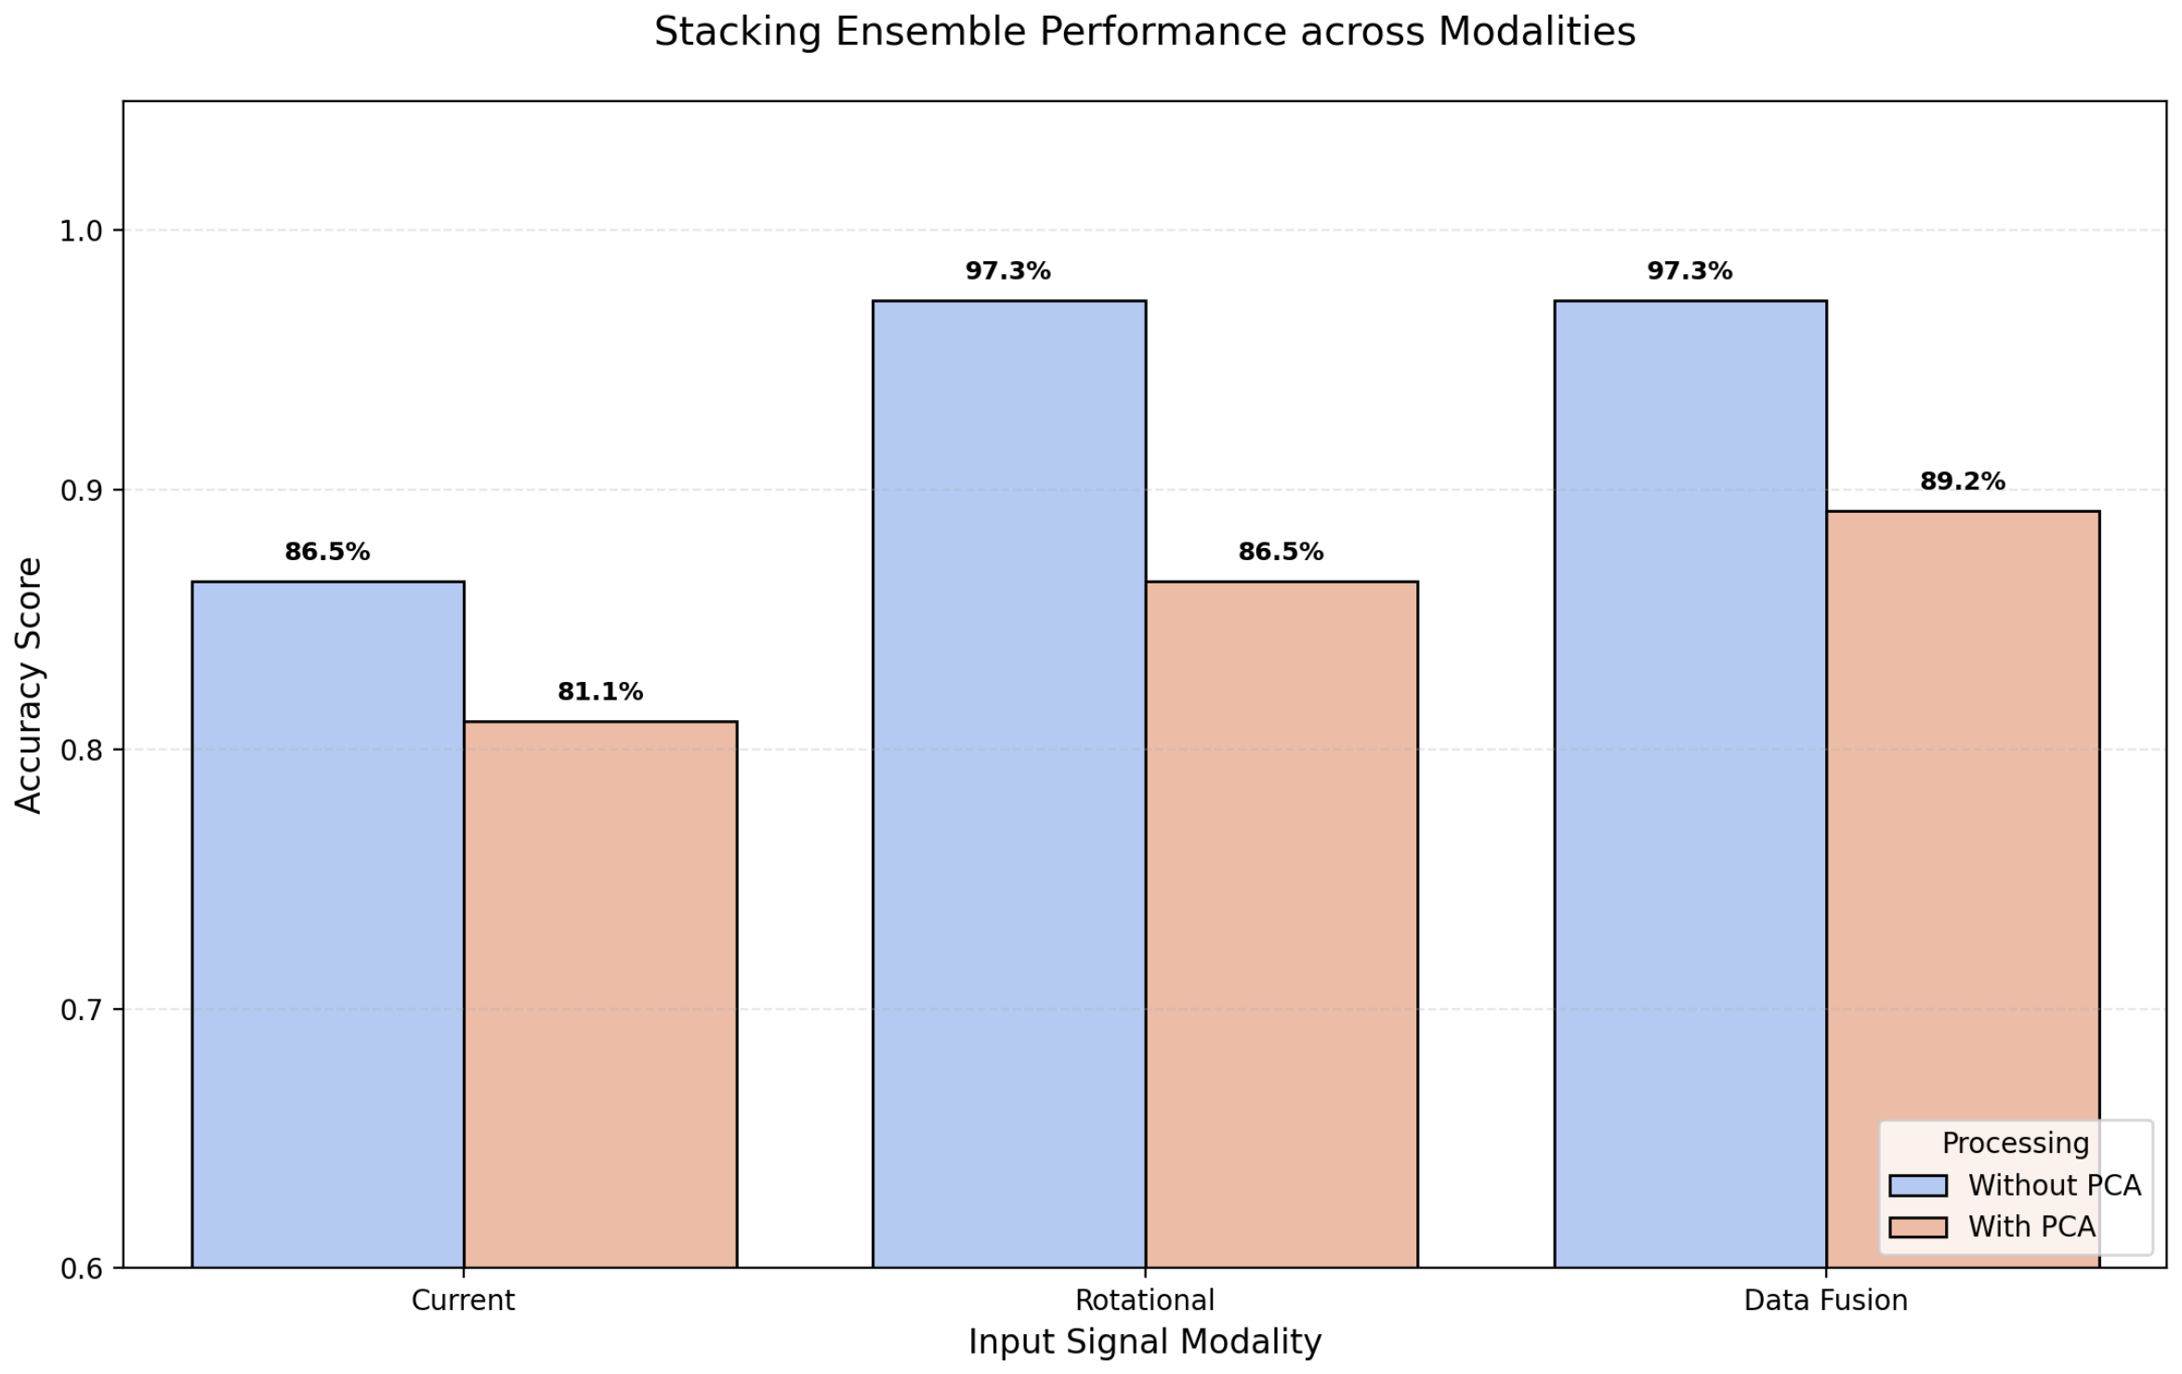
A graphical illustration of the impact of data modality and PCA transformation on classification performance is shown in Figure 3.
Figure 3.
Impact of data fusion and PCA reduction on the performance of the Stacking Ensemble model.
The highest classification accuracy, equal to 97.30%, was obtained for both the rotational-domain model and the fused model operating on raw features. Therefore, in the analysed dataset, feature-level fusion did not improve the headline accuracy over the best single-modality variant. Nevertheless, the fused representation was retained in the subsequent analysis because it provides simultaneous access to complementary physical information from the current and rotational domains, which is particularly useful when interpreting mixed fault conditions.
The additional comparative experiment on the fused feature representation shows that the proposed Stacking Ensemble achieved the highest balanced accuracy in the raw feature space, jointly with Random Forest at a very similar performance level, while XGBoost remained slightly below these two methods (Table 2). Logistic Regression and SVM produced lower results, especially in the PCA-transformed space. Across all evaluated models, dimensionality reduction consistently degraded performance. The largest drop was observed for Logistic Regression, whereas SVM showed the smallest deterioration. For the proposed Stacking Ensemble, the decrease in balanced accuracy between the raw and PCA variants was approximately 10 percentage points, which confirms that the fused raw-feature representation is more suitable for this diagnostic task than the reduced PCA space.
Table 2.
Comparative performance of standard classifiers and the proposed model on the fused feature representation.
The observed decrease in accuracy after applying PCA is likely related to the loss of clear physical decision thresholds, such as characteristic vibration amplitudes at , which are important for distinguishing mechanical faults. In the raw steady-state signals, these features remain more distinct and diagnostically useful.
3.2. Stability and Error Analysis
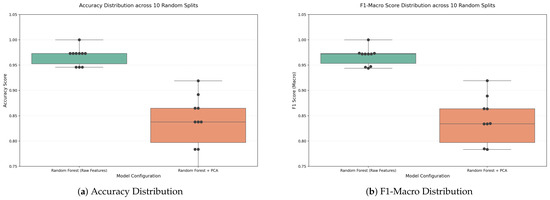
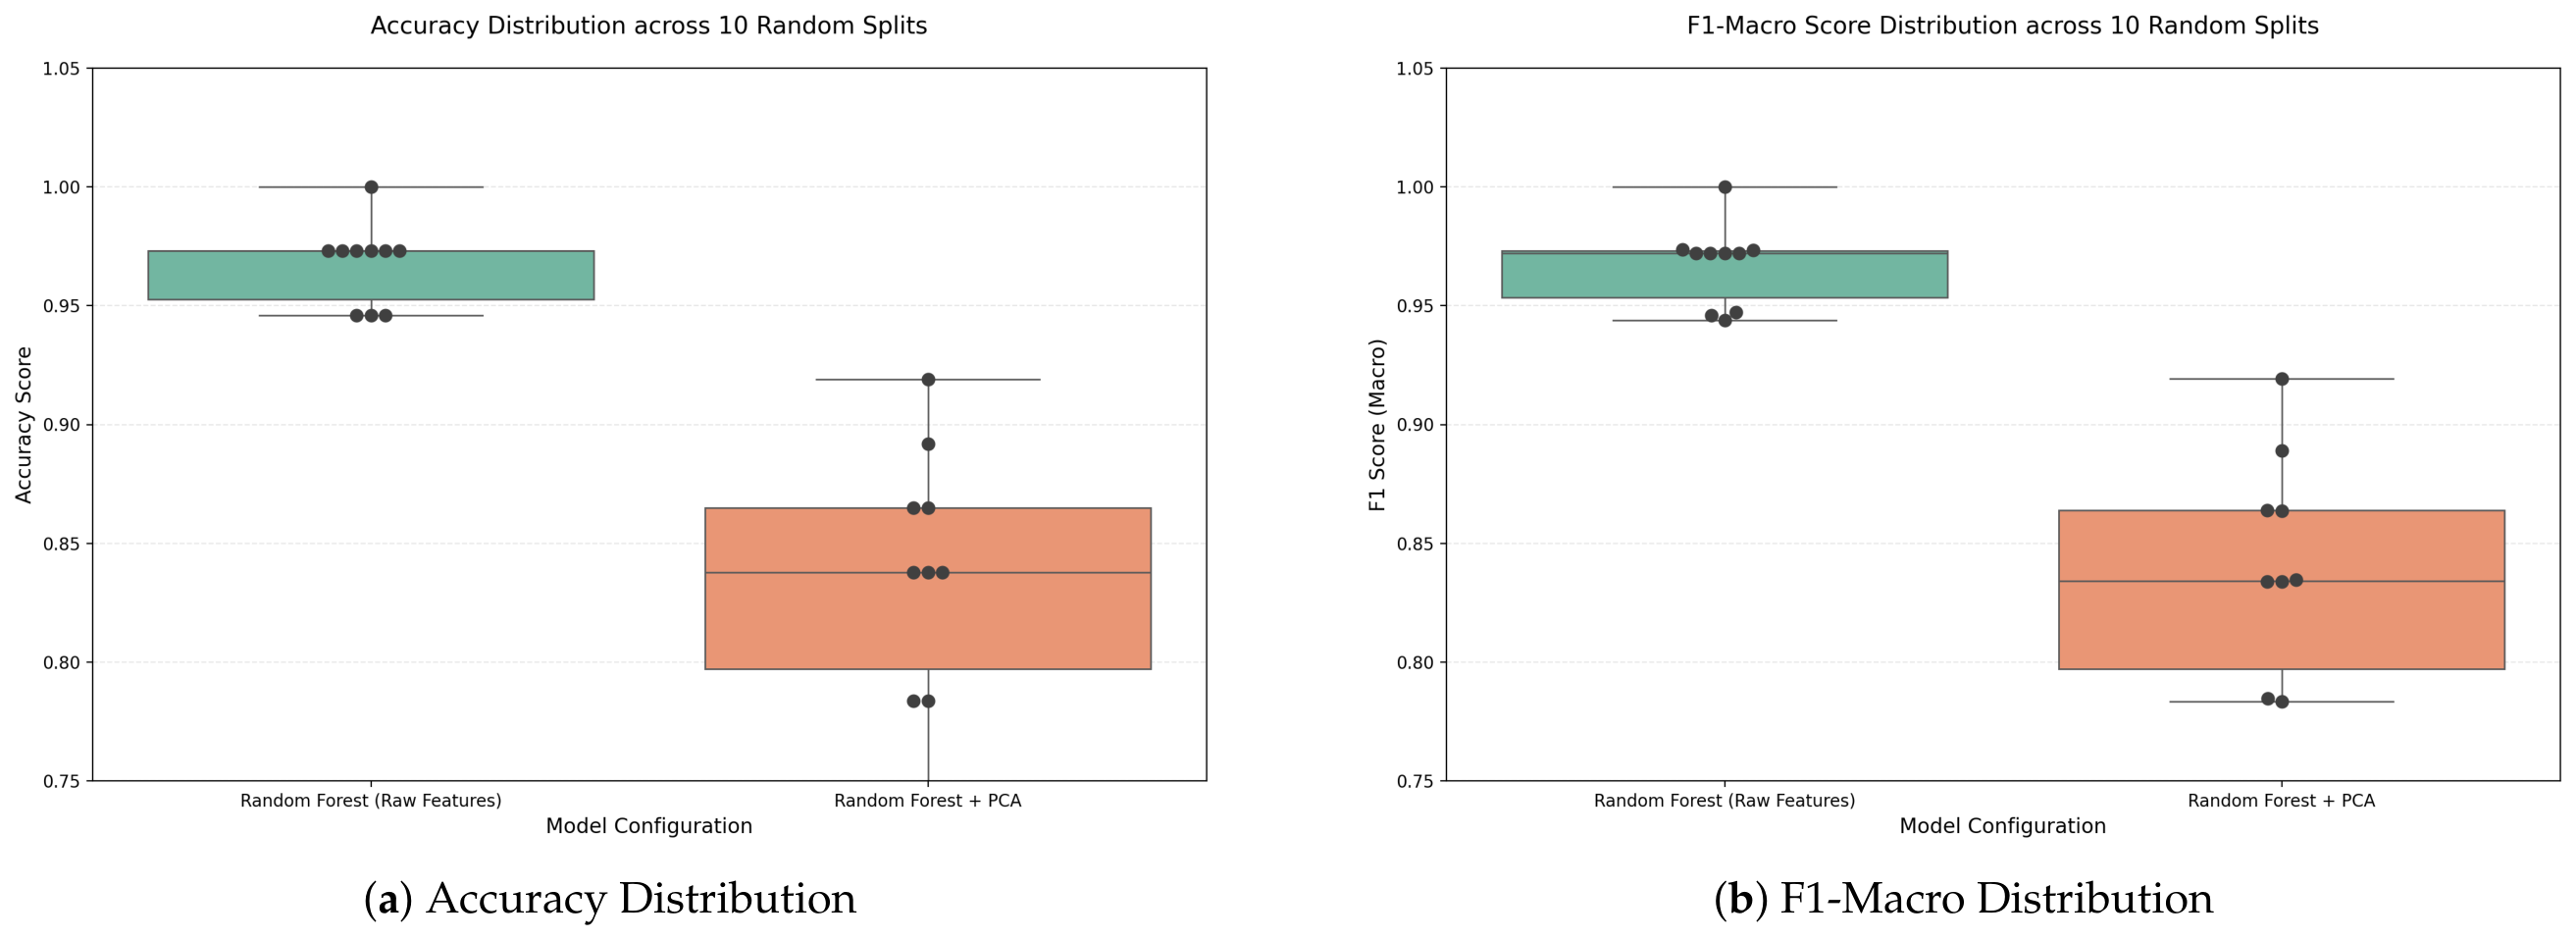
The robustness of the model with respect to data splitting was evaluated through stability tests using 10 different random seeds. This approach was motivated by the relatively small benchmark size (184 segmented samples), where even minor shifts in individual windows between training and test sets could noticeably affect the evaluation results. Accordingly, this analysis should be interpreted as a within-benchmark split-stability assessment rather than as an independent test of cross-unit generalization. A summary of the results is presented in Table 3.
Table 3.
Statistical summary of model stability across 10 data splits (Mean ± Standard deviation).
A comparison of the distributions of Accuracy and F1-Macro scores (Figure 4) provides additional insight into how dimensionality reduction affects model performance.
Figure 4.
Comparison of model stability for the Stacking Ensemble without PCA and with PCA transformation.
The results indicate that applying PCA leads to a noticeable decrease in model stability. While the model using the full feature set maintains a standard deviation of around 1.7%, the uncertainty of predictions increases significantly after dimensionality reduction, reaching . This larger variability suggests that projecting physically meaningful features onto PCA components makes the classifier more sensitive to the specific composition of training samples, even under steady-state operating conditions.
3.3. Physical Interpretability and SHAP Analysis
Understanding how individual features influence the decision-making process of the Stacking Ensemble model was achieved using the SHAP method (SHapley Additive exPlanations) [12,13]. This approach decomposes model predictions into contributions from individual input features, making it possible to relate the algorithm’s output to specific physical phenomena occurring in the BLDC motor. Such engineering validation improves the transparency of the system and allows its consistency with the physics of rotating machinery to be assessed.
3.3.1. Global Feature Importance
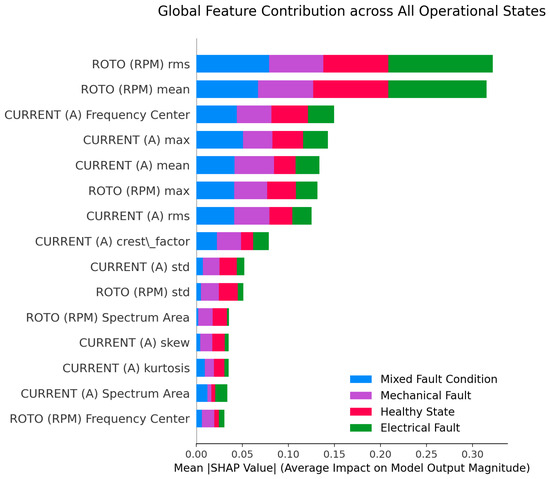
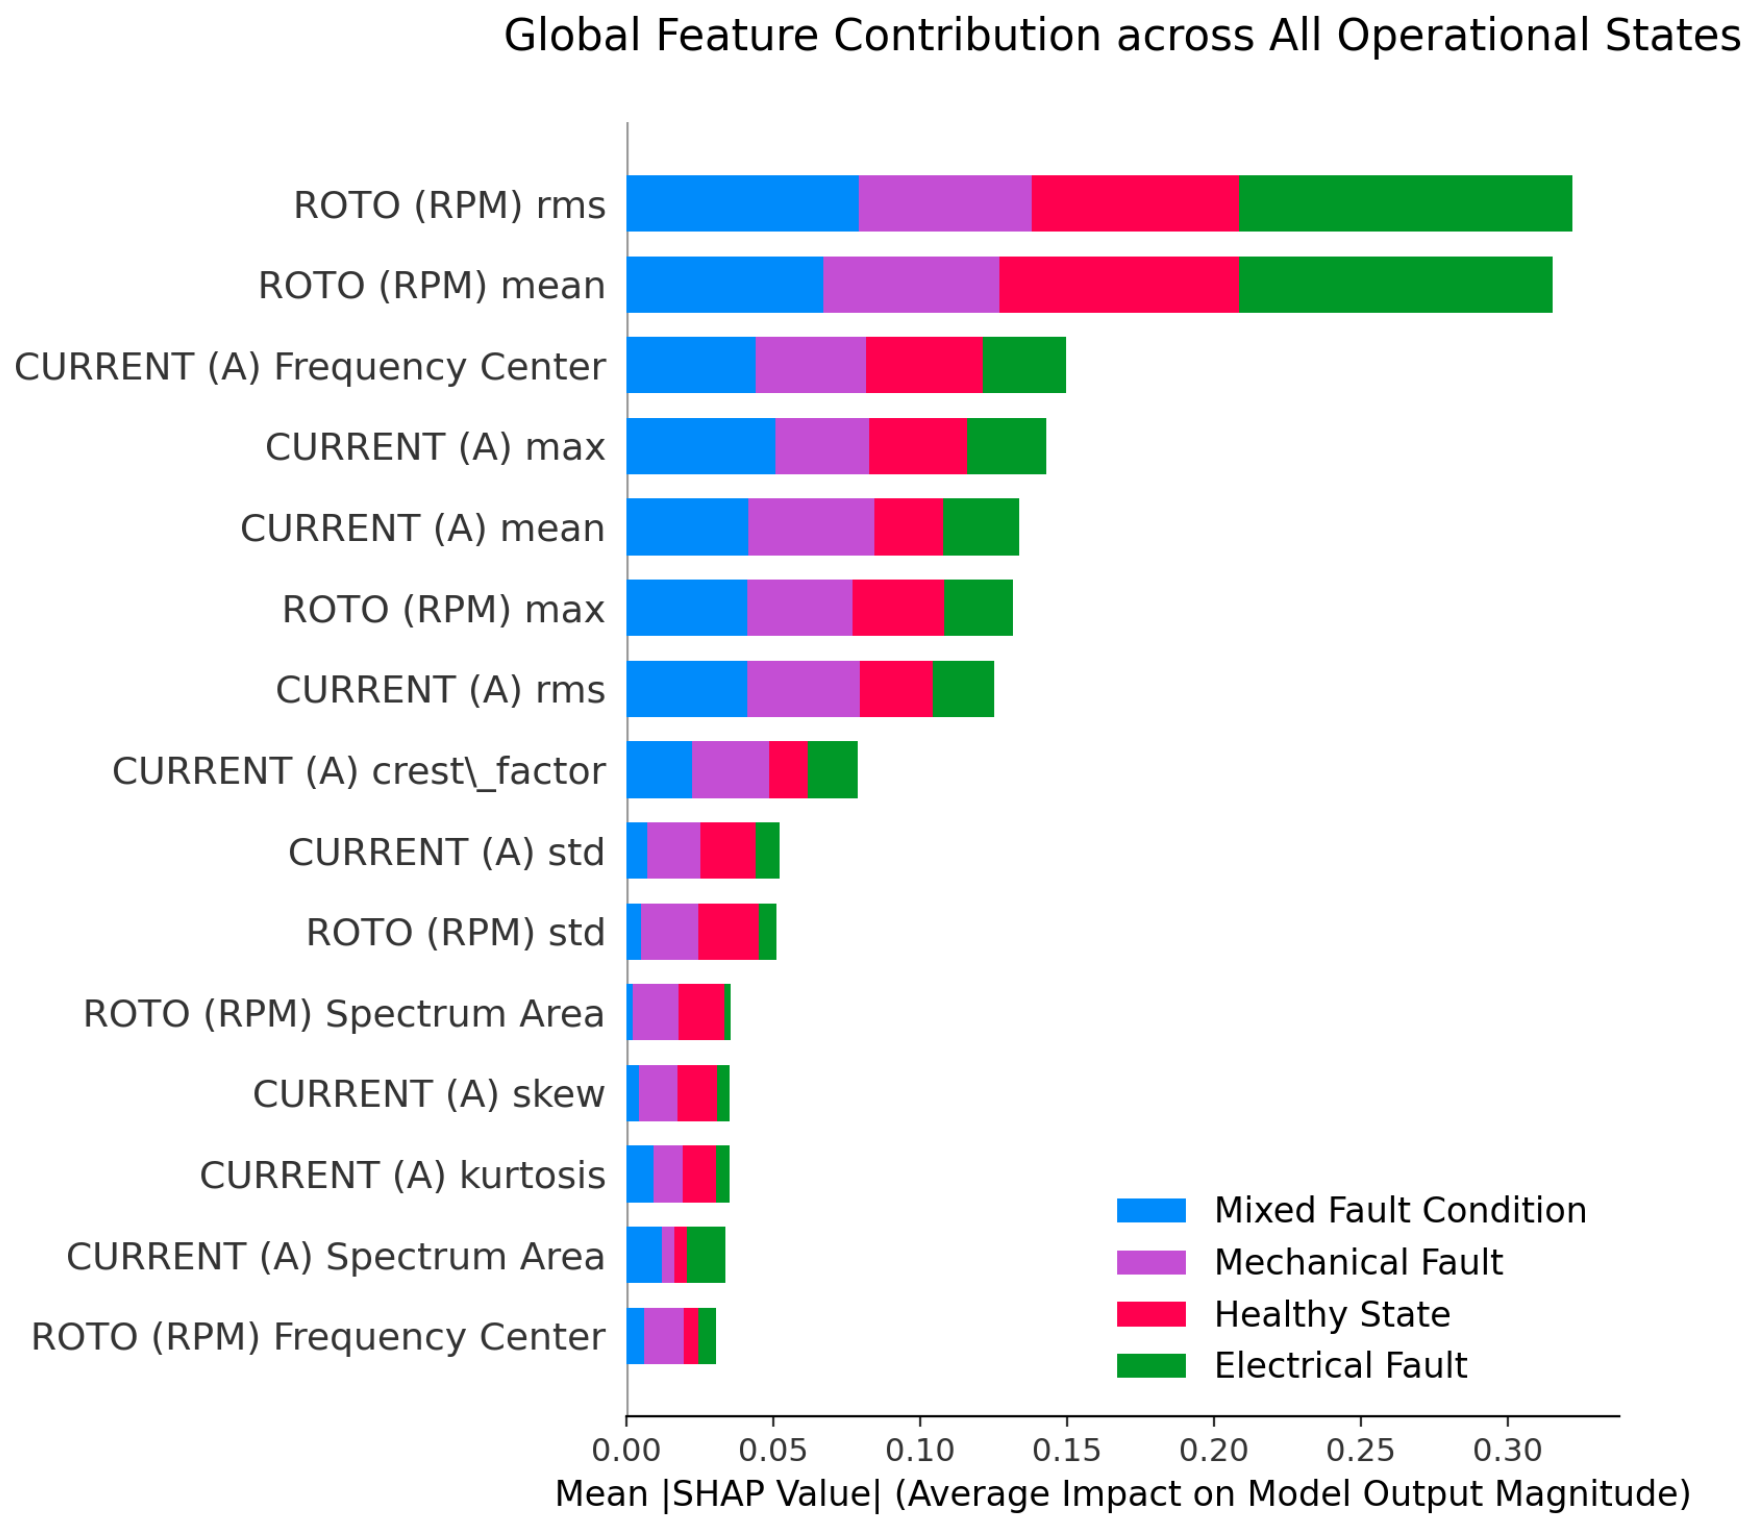
The global feature importance, calculated as the mean absolute SHAP value across all classes, is presented in Figure 5.
Figure 5.
Global feature impact on model output across all classes; rotational-domain (ROTO) features clearly dominate.
The most influential features are ROTO (RPM) rms and ROTO (RPM) mean. This indicates that variability and energy of the rotational speed signal are the most consistent indicators of machine condition, as they respond to both mechanical and electrical faults. In practice, these features act as primary indicators: the model first evaluates the overall stability of motion, and then refines the classification using more specific parameters, such as Frequency Center or CURRENT max, to distinguish between fault types.
3.3.2. Detailed Analysis of Diagnostic Features for Individual Classes
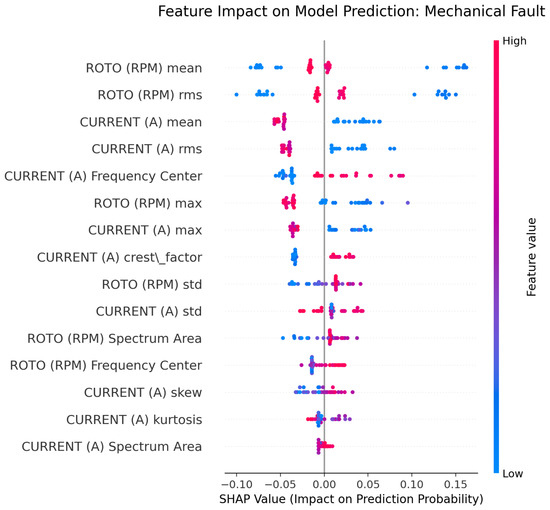
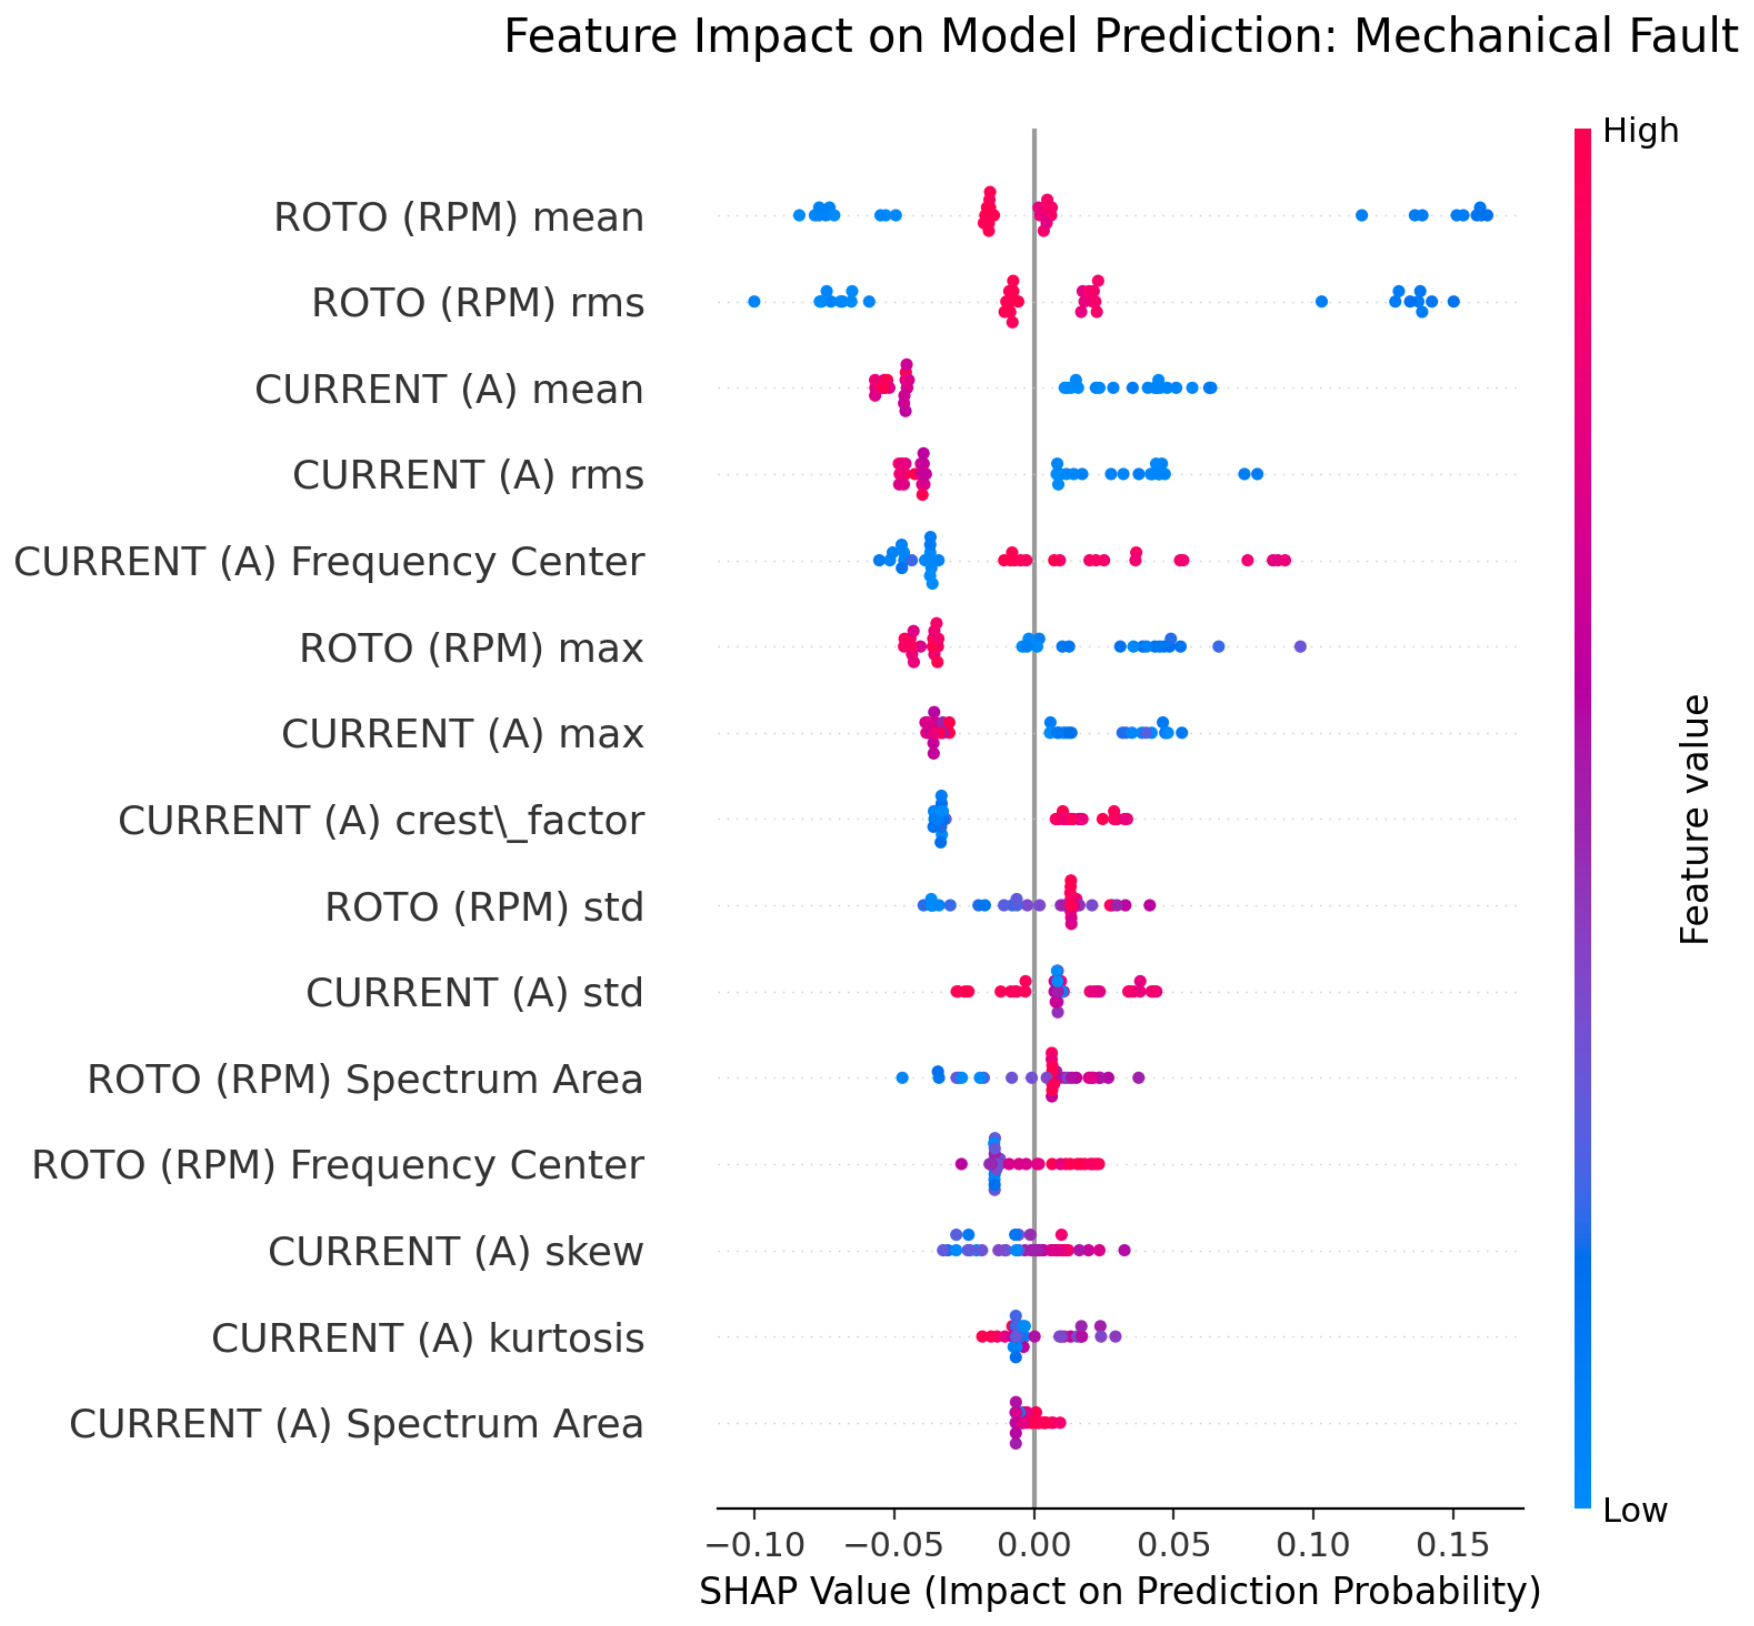
The following section presents feature attribution results for individual motor states. Beeswarm plots illustrate how feature values influence classification outcomes, with low values shown in blue and high values in red, indicating their contribution to the probability of assigning a sample to a given class.
3.3.3. Mechanical Fault Class
The distribution of SHAP values for the Mech_Damage class (Figure 6) indicates that shaft dynamics play a key role in diagnosing mechanically induced imbalance. The dominance of ROTO features is consistent with the physical interpretation of imbalance-related rotor-speed disturbances, which manifest themselves through fluctuations in angular velocity and motion stability.
Figure 6.
Feature contribution analysis for the mechanical fault class.
A closer look at the plot allows for a more detailed interpretation of individual parameters:
- ROTO (RPM) mean: As an indicator of mechanical load, it represents the average rotational speed within the analyzed time window. High values (red) clustered around zero SHAP contribution suggest that nominal operating speed has a neutral effect on the prediction. More informative are the lower values (blue), whose spread on both sides of the axis indicates that a drop in rotational speed is interpreted as a fault only when it is not accompanied by anomalies in the current domain.
- ROTO (RPM) rms: As a measure of vibration energy and motion stability, this parameter reflects the overall energy of the rotational signal. Its top ranking indicates that the model relies strongly on motion stability as a primary diagnostic cue. Similarly to the mean value, high energy (red) under stable conditions does not promote the fault class, whereas reduced or fluctuating energy (blue) helps distinguish mechanical faults from electrical ones, where vibration effects may be masked by electromagnetic torque ripple.
This ordering suggests that the model first evaluates the overall quality of rotational motion. Only after detecting anomalies in mean or rms does it consider lower-level features to determine whether the disturbance is purely mechanical or results from electromechanical interactions.
In the current domain, the model indicates that lower values of CURRENT (A) mean and rms (blue points) shift predictions toward the Mech_Damage class. This suggests that mechanical faults are identified mainly when anomalies in rotational behavior occur without a simultaneous increase in current-domain irregularities, which is more typical for electrical faults associated with permanent magnet degradation and magnetic asymmetry. This helps separate mechanical faults from electrical and mixed conditions.
Additionally, the positive contribution of higher CURRENT (A) Frequency Center values indicates that spectral shifts in the current signal, caused by rotor vibrations, serve as a supporting feature in the classification process.
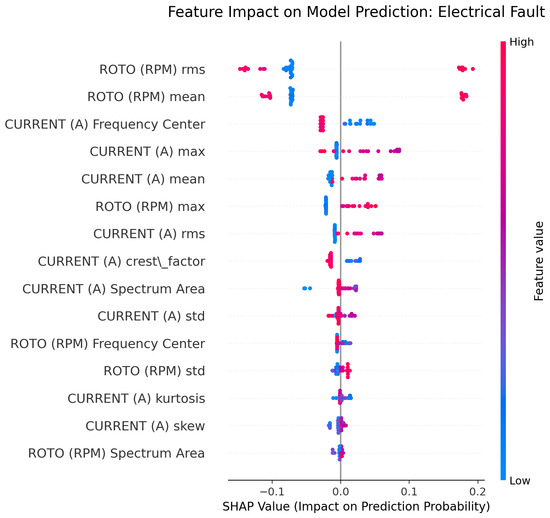
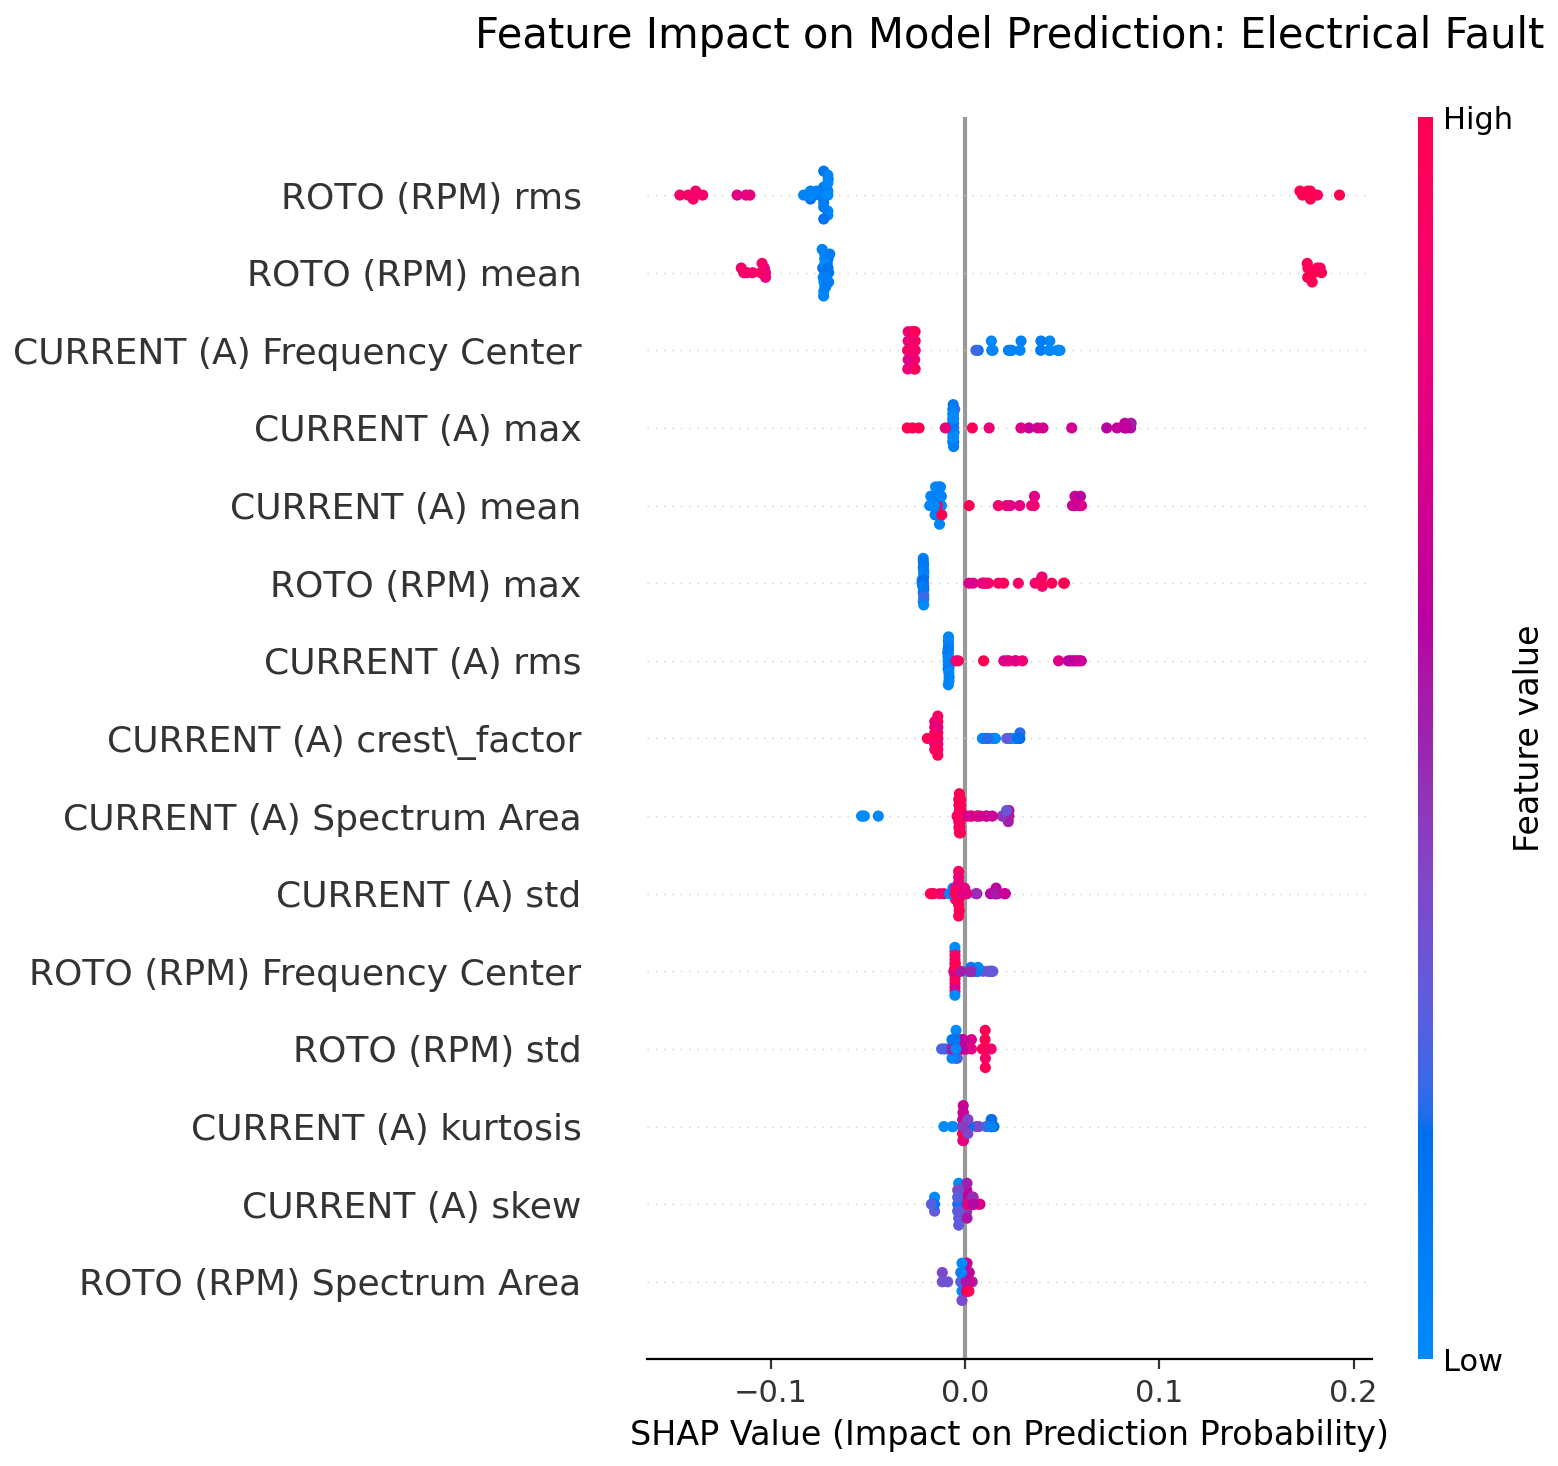
3.3.4. Electrical Fault Class
The diagnosis of electrical faults in the model focuses on disturbances associated with permanent magnet degradation and the resulting magnetic asymmetry. This is visible in the SHAP plot (Figure 7) through clear groupings on both sides of the axis. While in mechanical faults rotational parameters mainly reflect overall motion stability, here they are associated with torque irregularities induced by disturbed magnetic flux distribution.
Figure 7.
Feature contribution analysis for the electrical fault class.
The observed feature distribution for electrical faults leads to the following conclusions:
- Nonlinear influence of ROTO parameters (rms and mean): The top-ranked features are ROTO (RPM) rms and mean, with high values (red) spread across both sides of the zero axis. Their concentration on the right confirms that electrical faults generate strong torque oscillations with higher energy than purely mechanical faults. At the same time, the presence of high values on the left indicates that elevated fluctuation energy alone is not sufficient for classification. Without corresponding anomalies in the current domain, the model may use these features to rule out a purely electrical fault (e.g., in favor of a mixed condition).
- Magnetic asymmetry (Frequency Center): The CURRENT (A) Frequency Center feature plays a key discriminative role. Low values (blue) located on the right side of the axis indicate a shift in the current spectrum toward lower frequencies. This reflects magnetic asymmetry in the motor, helping distinguish this condition from external vibrations.
- Detection of current peaks (CURRENT max): High values of maximum current (red) show a strong positive contribution to classification. This indicates that the model captures local increases in current amplitude and transient deviations associated with disturbed magnetic flux distribution. Such behaviour is consistent with electrical faults related to permanent magnet degradation.
- ROTO max: The positive impact of high values highlights the oscillatory nature of motor operation under electrical faults. Sudden speed fluctuations provide a clearer diagnostic signal for the model than gradual increases in mechanical resistance.
The model identifies electrical faults mainly based on a combination of high ROTO rms values and clear anomalies in the current domain, such as amplitude deviations and spectral shifts associated with magnetic asymmetry. The spread of high-value points (red) on both sides of the axis shows that the model does not rely on simple thresholds but instead distinguishes fault types by analyzing the overall feature context.
At the same time, the clustering of low ROTO values (blue) on the left side of the axis indicates that stable, low-dynamic motor operation is treated as evidence against the presence of a serious electrical fault. This reasoning not only improves classification performance but also reduces the number of false positives, increasing the reliability of the diagnostic system.
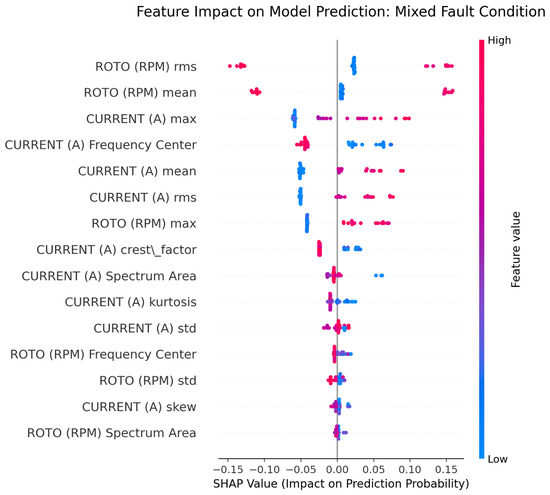
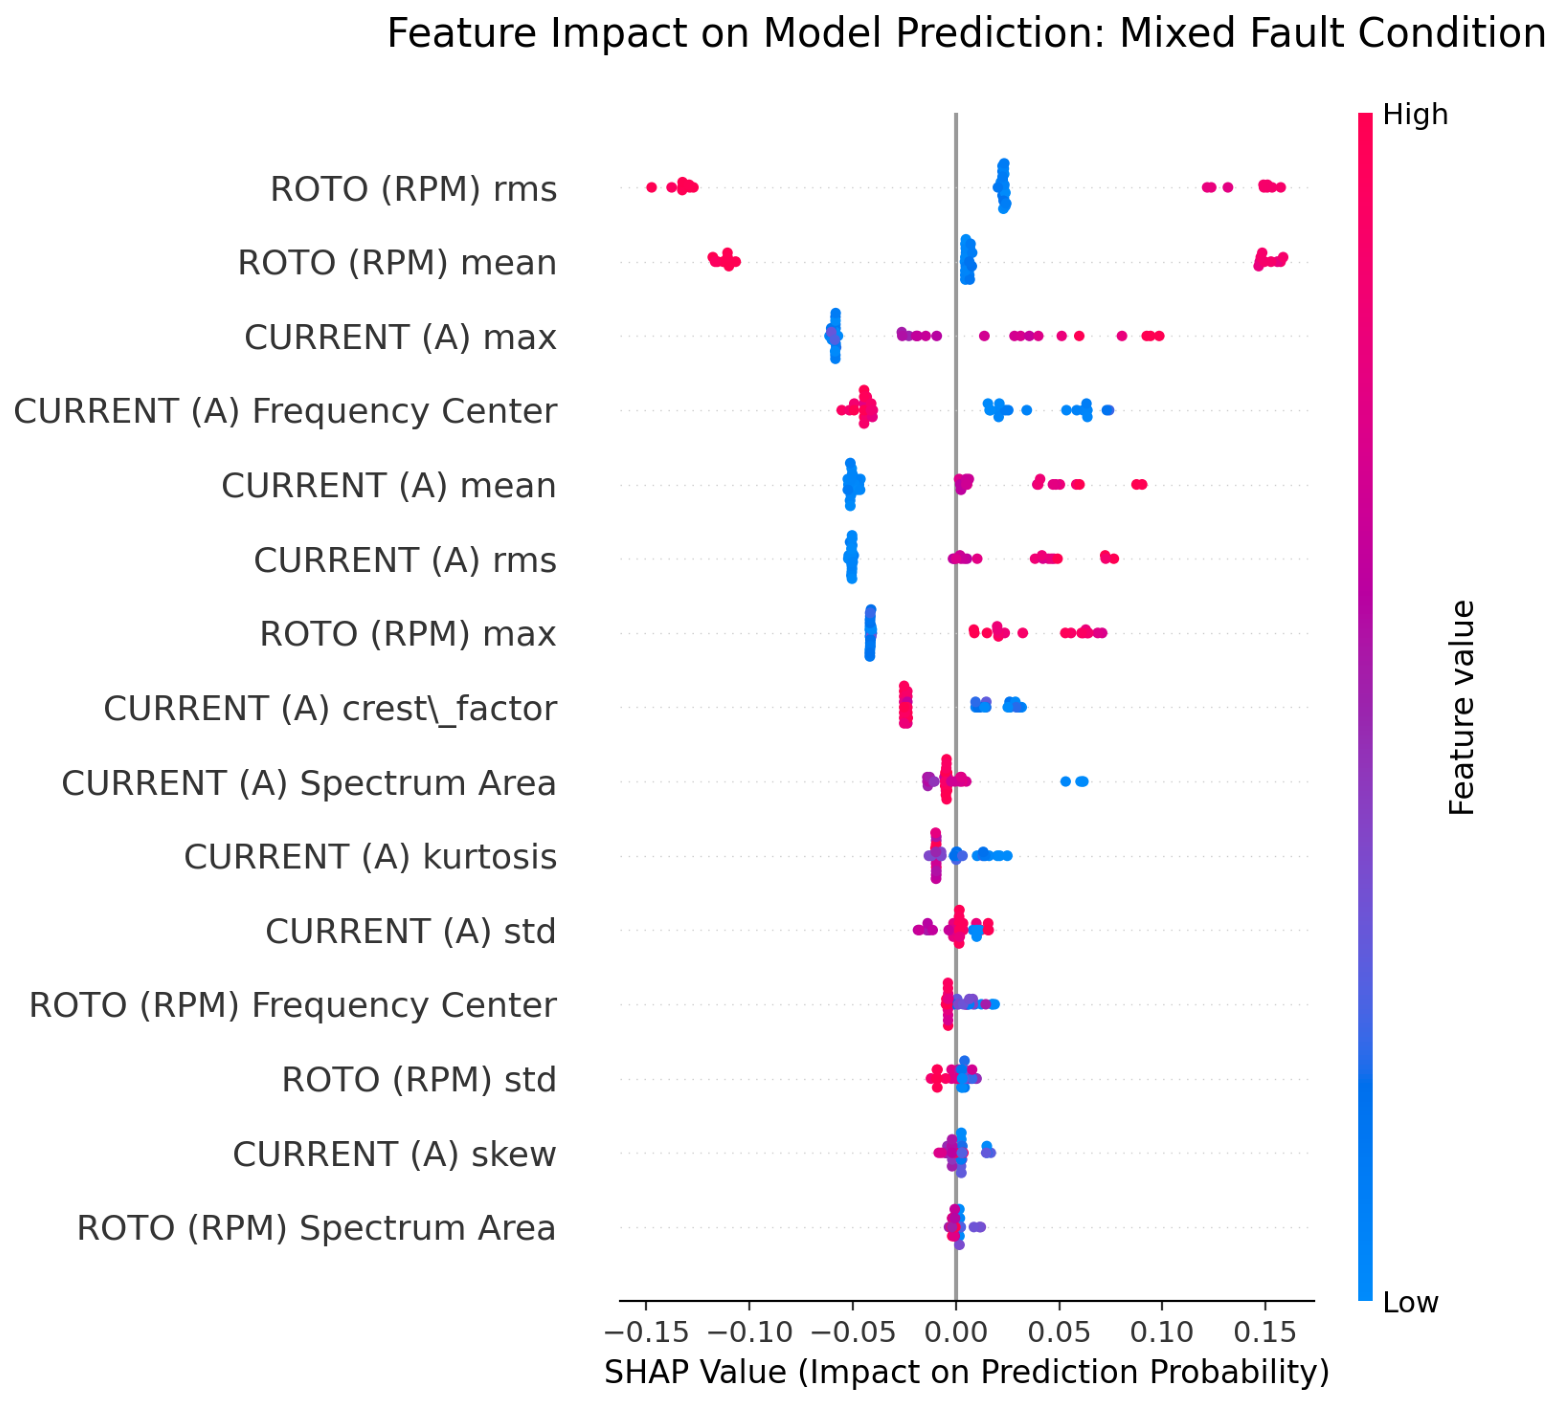
3.3.5. Mixed Faults Class
The identification of mixed fault conditions is the most challenging diagnostic task, as it combines physical phenomena of different origins. The SHAP plot (Figure 8) shows that the model does not simply sum these effects, but also captures their interactions, which helps avoid the masking of one fault by another.
Figure 8.
Feature contribution analysis for the mixed faults class.
The analysis of feature distributions for this class leads to the following observations:
- Dispersion of ROTO (rms and mean): As in single-fault cases, these parameters dominate the decision process. On one hand, the highest values of ROTO rms produce the strongest positive contribution, which corresponds to pronounced mechanical instability caused by the combined effect of bearing faults and electrical faults associated with permanent magnet degradation. These levels exceed those observed in single-fault conditions. On the other hand, the presence of high values on the left side of the axis acts as a separation mechanism. If strong vibrations are not accompanied by corresponding current anomalies, the model uses this information to rule out the mixed state, preventing misclassification as a purely mechanical fault.
- CURRENT max: Unlike in the mechanical class, where current features were nearly neutral, here high values appear on the right side of the axis. This confirms the presence of an electrical component (current spikes) superimposed on mechanical vibrations, which the model interprets as evidence of a combined fault.
- Frequency Center: Similar to purely electrical faults, low values promote this class. This indicates that mixed faults retain their characteristic magnetic signature in the current domain, even in the presence of strong mechanical disturbances.
In summary, the mixed fault condition is characterized by the highest levels of rotational speed fluctuations combined with distinct current spikes. The model’s ability to separate these effects, rather than allowing them to mask each other, highlights the effectiveness of feature-level fusion. This makes it possible to distinguish combined faults from severe single faults, a task that is often problematic for traditional single-signal diagnostic systems.
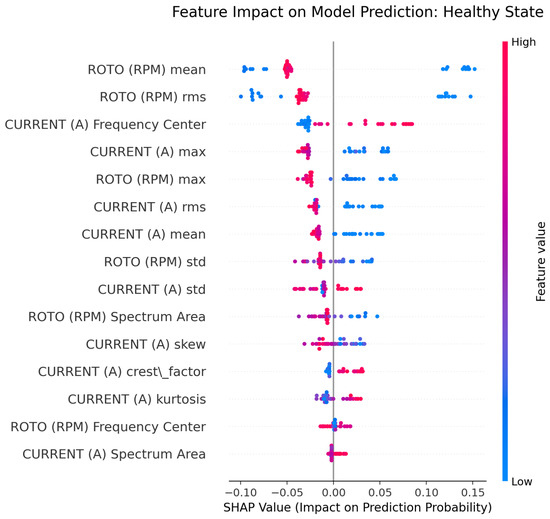
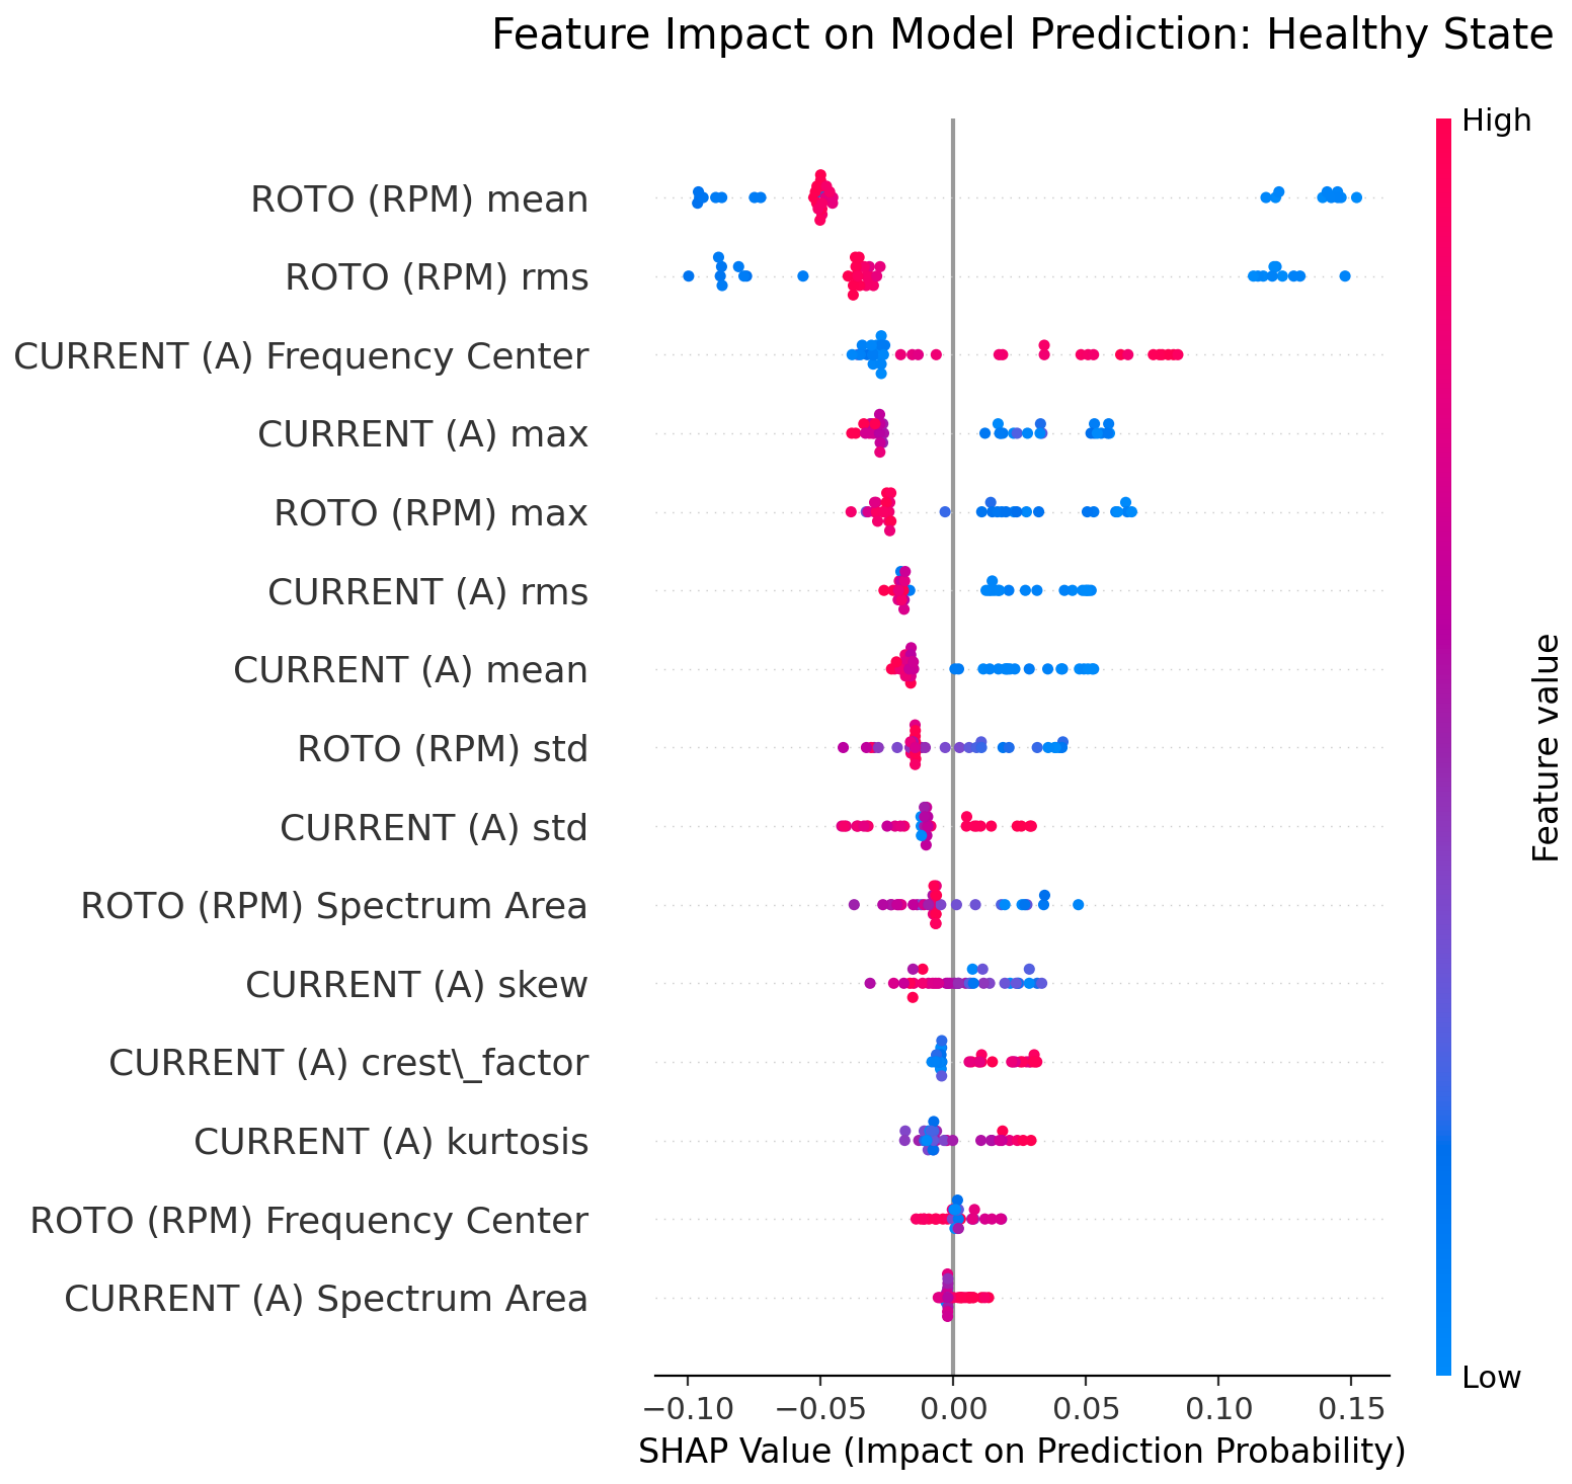
3.3.6. Healthy State
The classification of a motor as healthy (Healthy) is based on a distinct validation strategy. While fault conditions are identified through specific signatures (e.g., current spikes or vibrations), in this case the decision relies on confirming stability across both physical domains simultaneously (Figure 9).
Figure 9.
Feature contribution analysis for the healthy class.
The analysis of this class can be summarized as follows:
- Stability dynamics (ROTO): The plot shows a concentration of low values. Their presence on the right side of the axis (positive contribution) indicates that minimal speed fluctuations and low vibration energy are the strongest indicators of a healthy state. Importantly, some low-value points also appear on the left side, which means the model does not treat every low-speed condition as healthy. Instead, it distinguishes between genuinely stable operation and cases where low dynamics may hide a fault. Any increase in vibration energy shifts the prediction away from this class, making the model sensitive to even early signs of bearing degradation.
- Spectral purity of current: The Healthy class uniquely favors high values of CURRENT Frequency Center (red points on the right). This is the opposite of what is observed in electrical fault conditions. A stable and symmetric current spectrum, without shifts toward lower frequencies, is interpreted as evidence of proper electromagnetic condition and the absence of magnetic asymmetry.
- Low signal energy: The clustering of low values for CURRENT max and rms on the positive side of the axis confirms the absence of current spikes and overloads. The model classifies the motor as healthy only when the current signal does not exhibit sudden energy increases typical of electrical disturbance states.
Based on these observations, the classification decision for the healthy state is made by simultaneously excluding anomalies in both rotational (no vibrations) and current (no asymmetry or spikes) domains. This type of decision boundary makes the model robust to false positives. Any deviation from normal behavior in either domain immediately shifts the prediction toward the corresponding fault class.
3.4. Model Optimization and Feature Importance Analysis
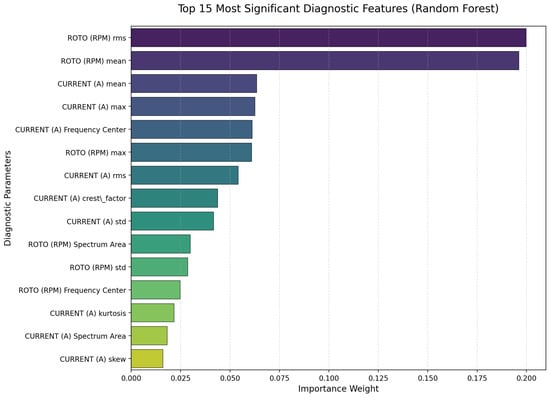
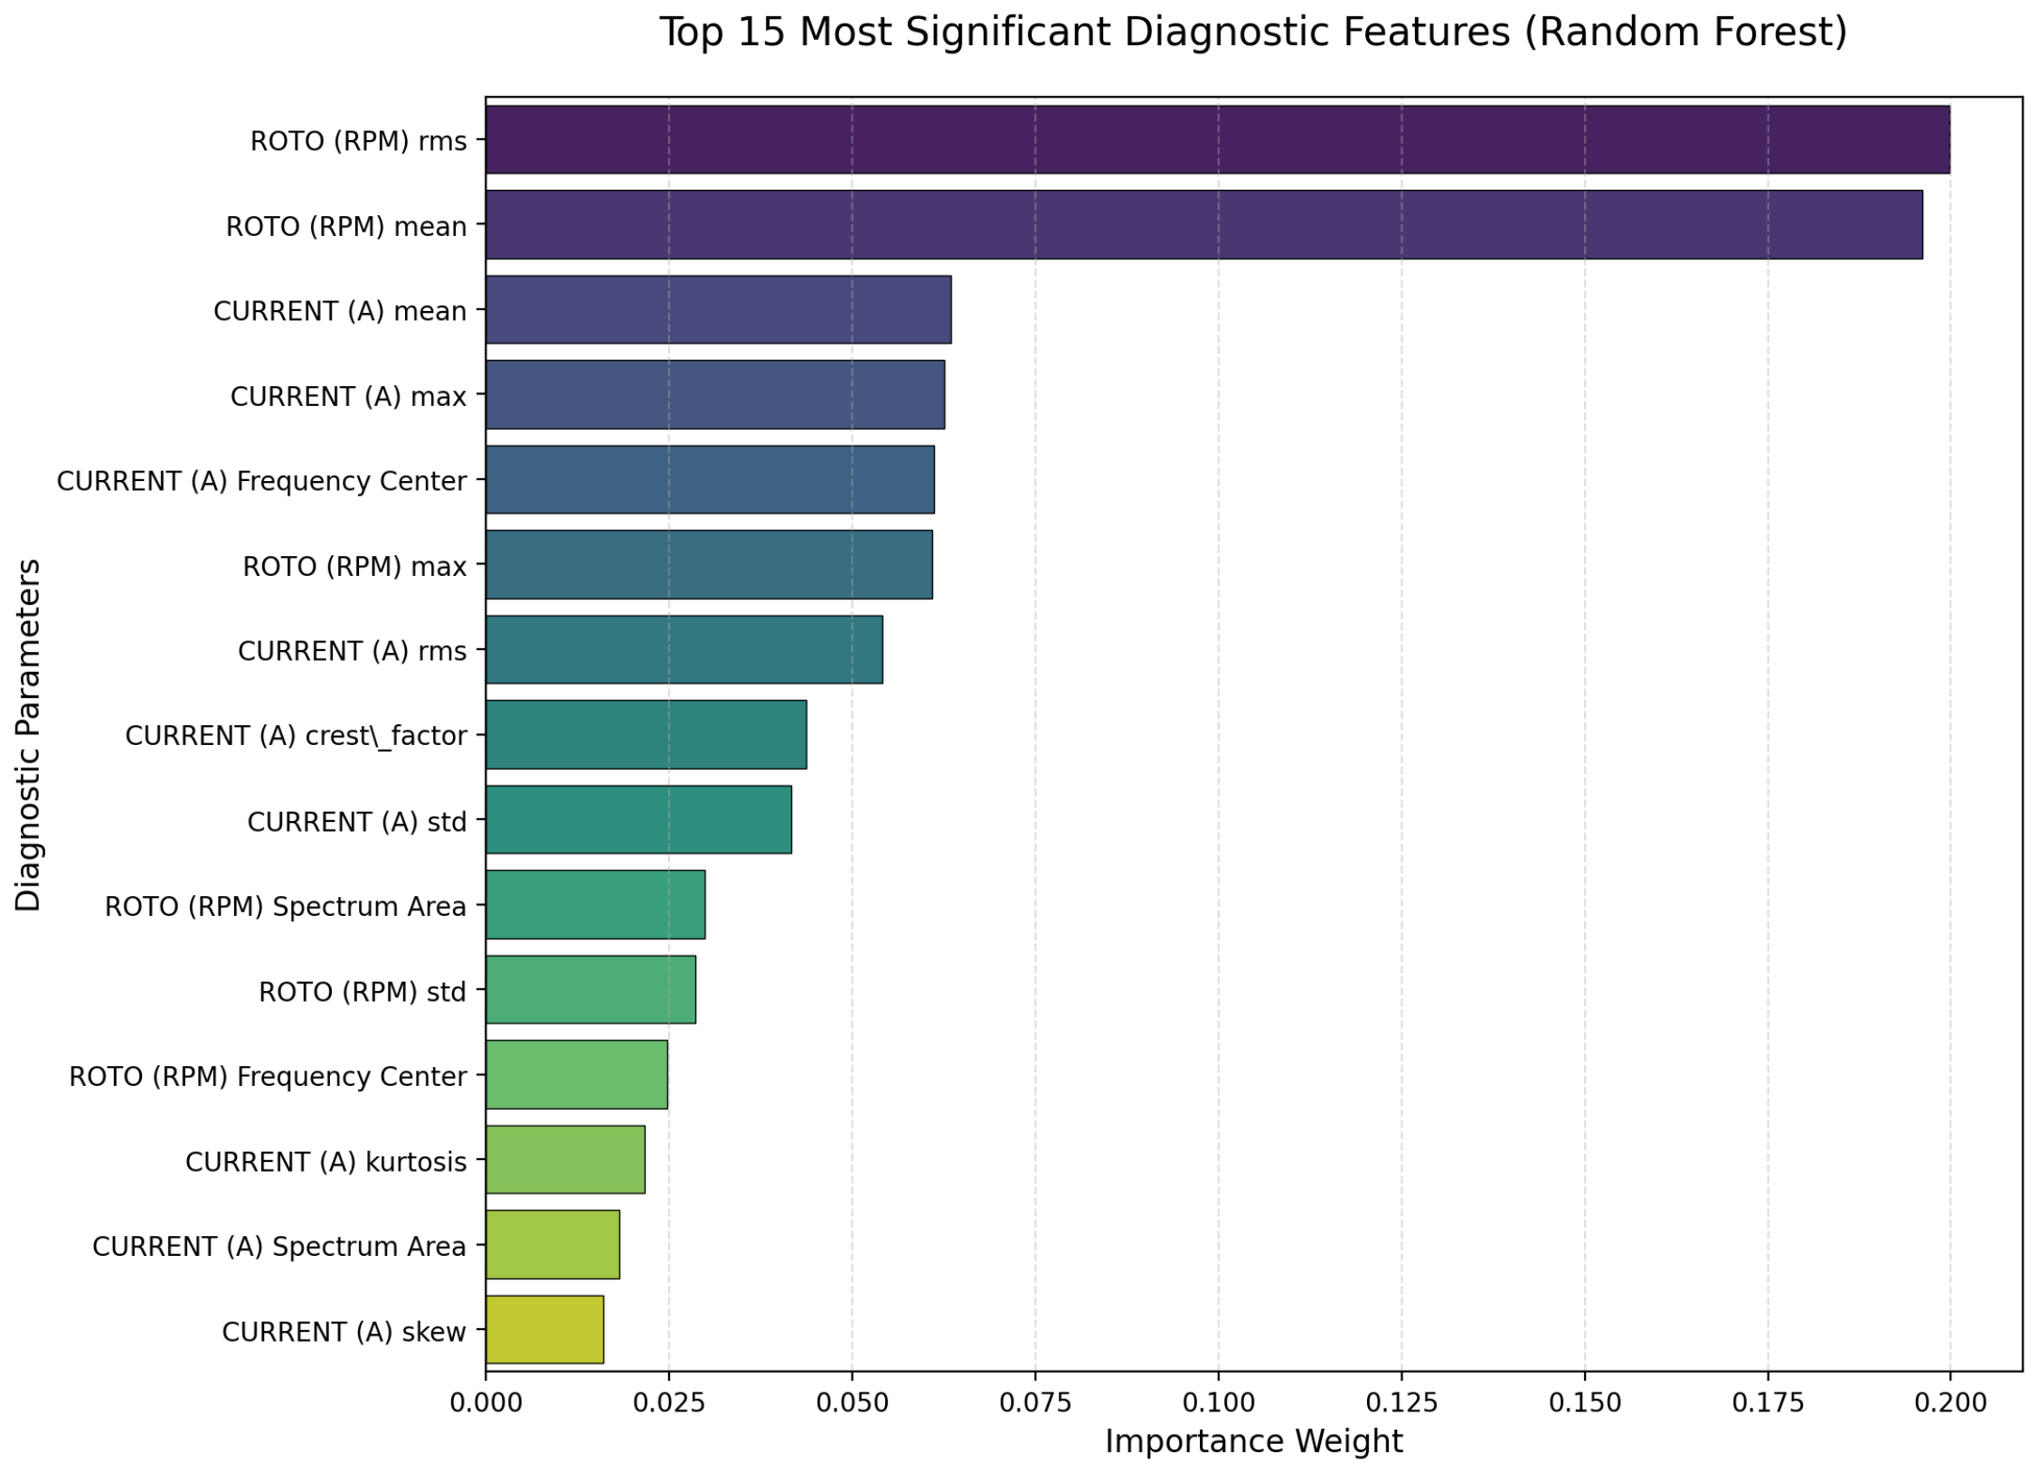
The next stage of the study focused on simplifying the model through the selection of the most relevant diagnostic features. Using the built-in feature importance mechanism of the Random Forest algorithm, a ranking of all 26 input parameters was obtained. Based on this ranking, the 15 most important features were selected for the final classification (Figure 10).
Figure 10.
Ranking of the 15 most important diagnostic features; dominance of the rotational domain (ROTO) and stator current statistics.
The feature importance analysis confirms the physical nature of the problem. The parameters ROTO (RPM) rms and ROTO (RPM) mean form the foundation for detecting mechanical faults, while CURRENT (A) mean and max are crucial for identifying electrical and mixed conditions.
Selecting the most relevant variables allowed the reduction of the input feature vector from 26 to 15 without degrading classification performance. The model maintained a stable accuracy of 97.3%, indicating that a significant portion of the original statistical parameters carried redundant information. Such a substantial simplification of the data structure, while preserving full performance, demonstrates that the key diagnostic signatures are captured by a limited subset of features. A detailed comparison before and after feature selection is presented in Table 4.
Table 4.
Impact of feature selection on the performance of the Stacking Ensemble model.
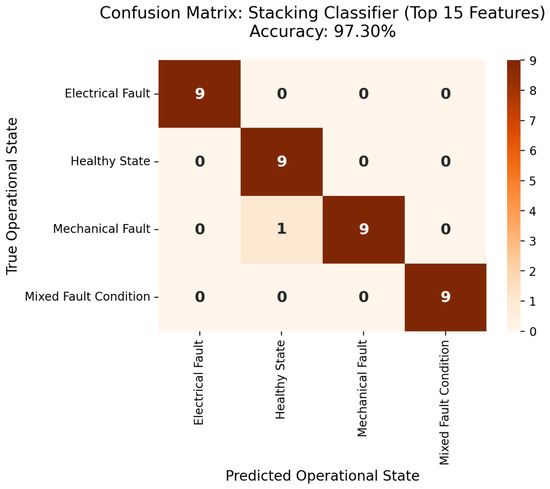
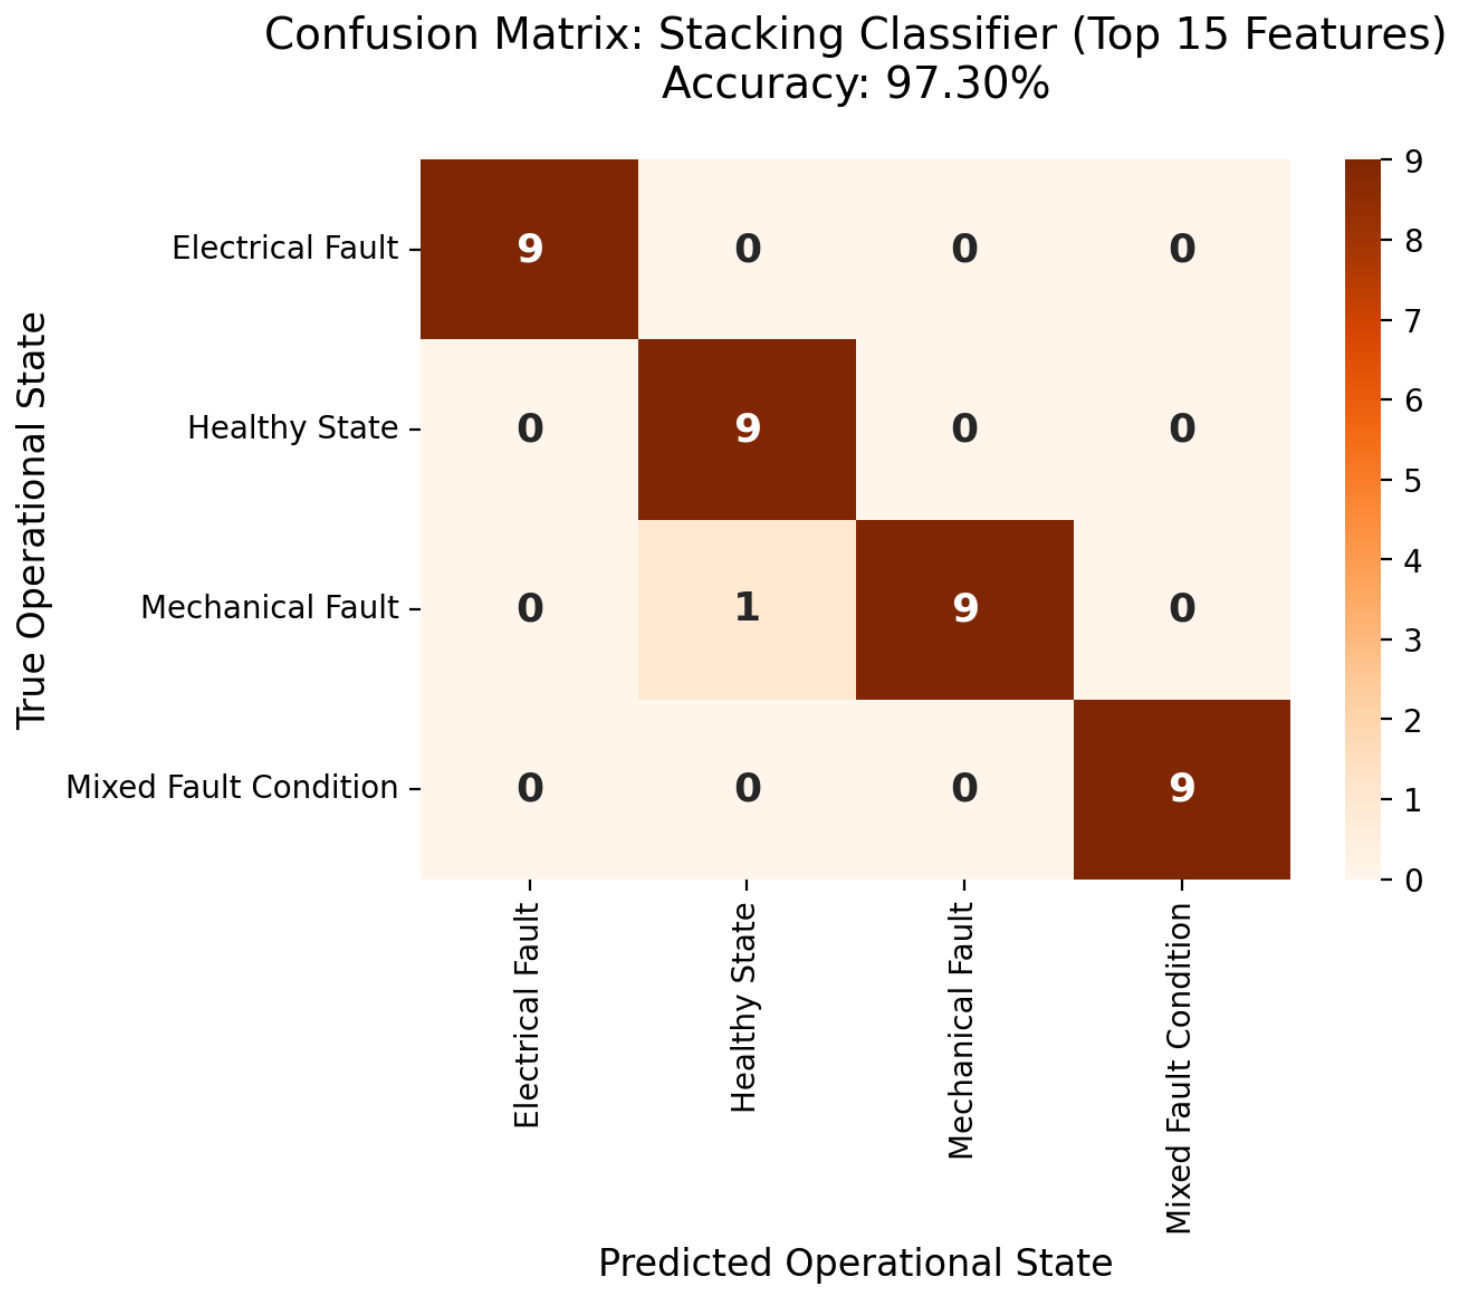
The detailed performance of the optimized model for each class is illustrated by the confusion matrix (Figure 11).
Figure 11.
Confusion matrix for the optimized Stacking model (Top 15 features); perfect classification of electrical and mixed fault conditions.
The model achieved 100% precision in detecting electrical faults and mixed conditions. The effective separation of the mixed conditions class indicates that the fusion of the 15 selected features eliminates the class overlap observed at the PCA stage (Figure 2).
A classification error was observed only in a single case, where a mechanical damage instance was classified as healthy. This results in a recall of 90% for this category while maintaining an overall accuracy of 97%. This behavior can be interpreted as an early-stage mechanical fault, where the parameters ROTO rms and mean have not yet exceeded the statistical thresholds distinguishing failure from normal operation.
Despite this error, the system exhibits no false positives for electrical faults. Accurate interpretation of current anomalies is particularly important in real-world maintenance systems, where unnecessary interventions generate high operational costs.
3.5. Analysis of Mixed Fault Separation
Because these binary analyses were performed within the same benchmark structure and do not increase the number of independent physical experiments, they should be interpreted as auxiliary separability checks rather than as standalone evidence of cross-unit generalization.
The model’s ability to distinguish between faults with similar physical characteristics was evaluated through experiments focused on separating single-fault conditions from mixed states. This task is particularly challenging in diagnostics, as combined faults share features from both signal domains, which often leads to misclassification in conventional systems.
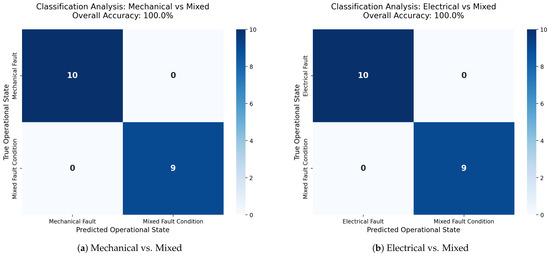
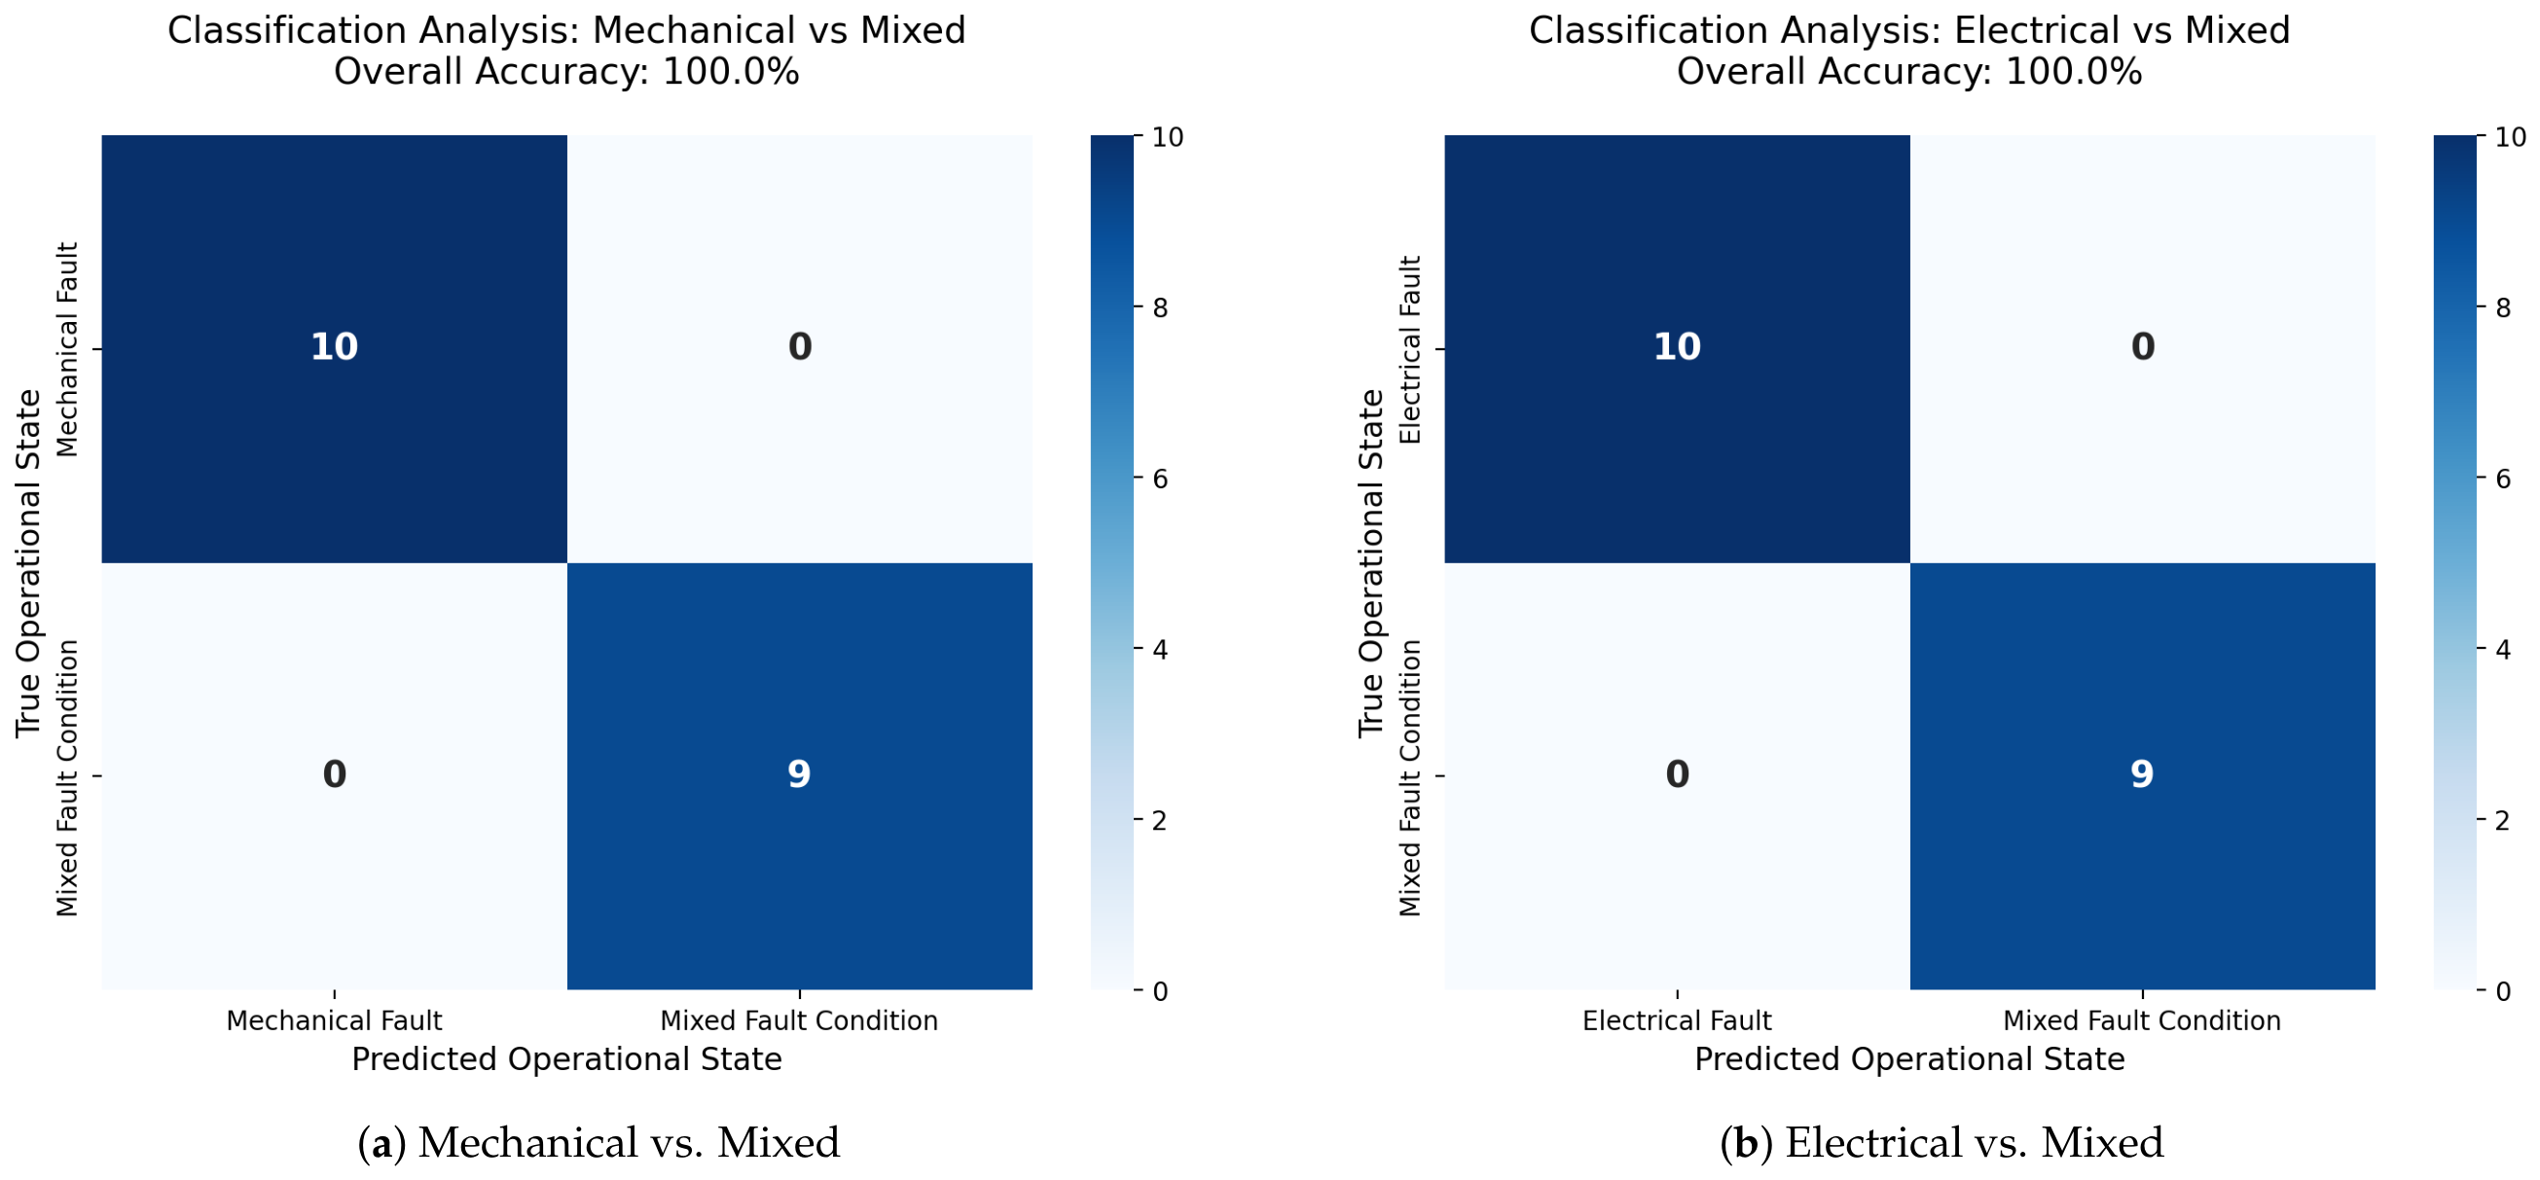
Cross-validation (5-fold CV) confirmed full class separability, achieving an accuracy of 100% in both analyzed scenarios (Figure 12).
Figure 12.
Confusion matrices for binary classifiers verifying the separation capability for mixed fault conditions.
The confusion matrix analysis leads to the following conclusions:
- Mechanical vs. Mixed scenario: The model correctly distinguished 10 cases of purely mechanical faults from 9 mixed-condition samples. This is significant because both classes exhibit high energy in the rotational domain (ROTO rms). The classification performance results from detecting additional current spikes (CURRENT max) and magnetic asymmetry, which are present only in combined faults.
- Electrical vs. Mixed scenario: The model successfully separated 10 electrical fault cases from 9 mixed-condition samples. The difficulty arises from the fact that both conditions share similar characteristics in the current domain, such as magnetic asymmetry and shifts in the spectral center (Frequency Center). Feature fusion enabled the model to detect differences in shaft dynamics (ROTO rms, mean), which are characteristic of mechanical faults.
Achieving full accuracy (Accuracy = 100%) in all conducted tests indicates that selecting the top 15 features enabled complete class separation. This approach effectively eliminated the issue of class overlap previously observed in the global PCA feature space.
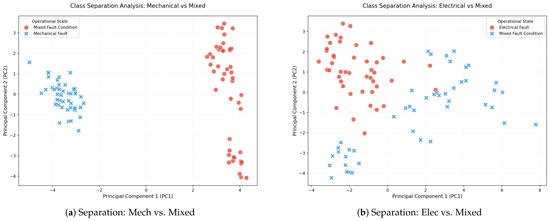
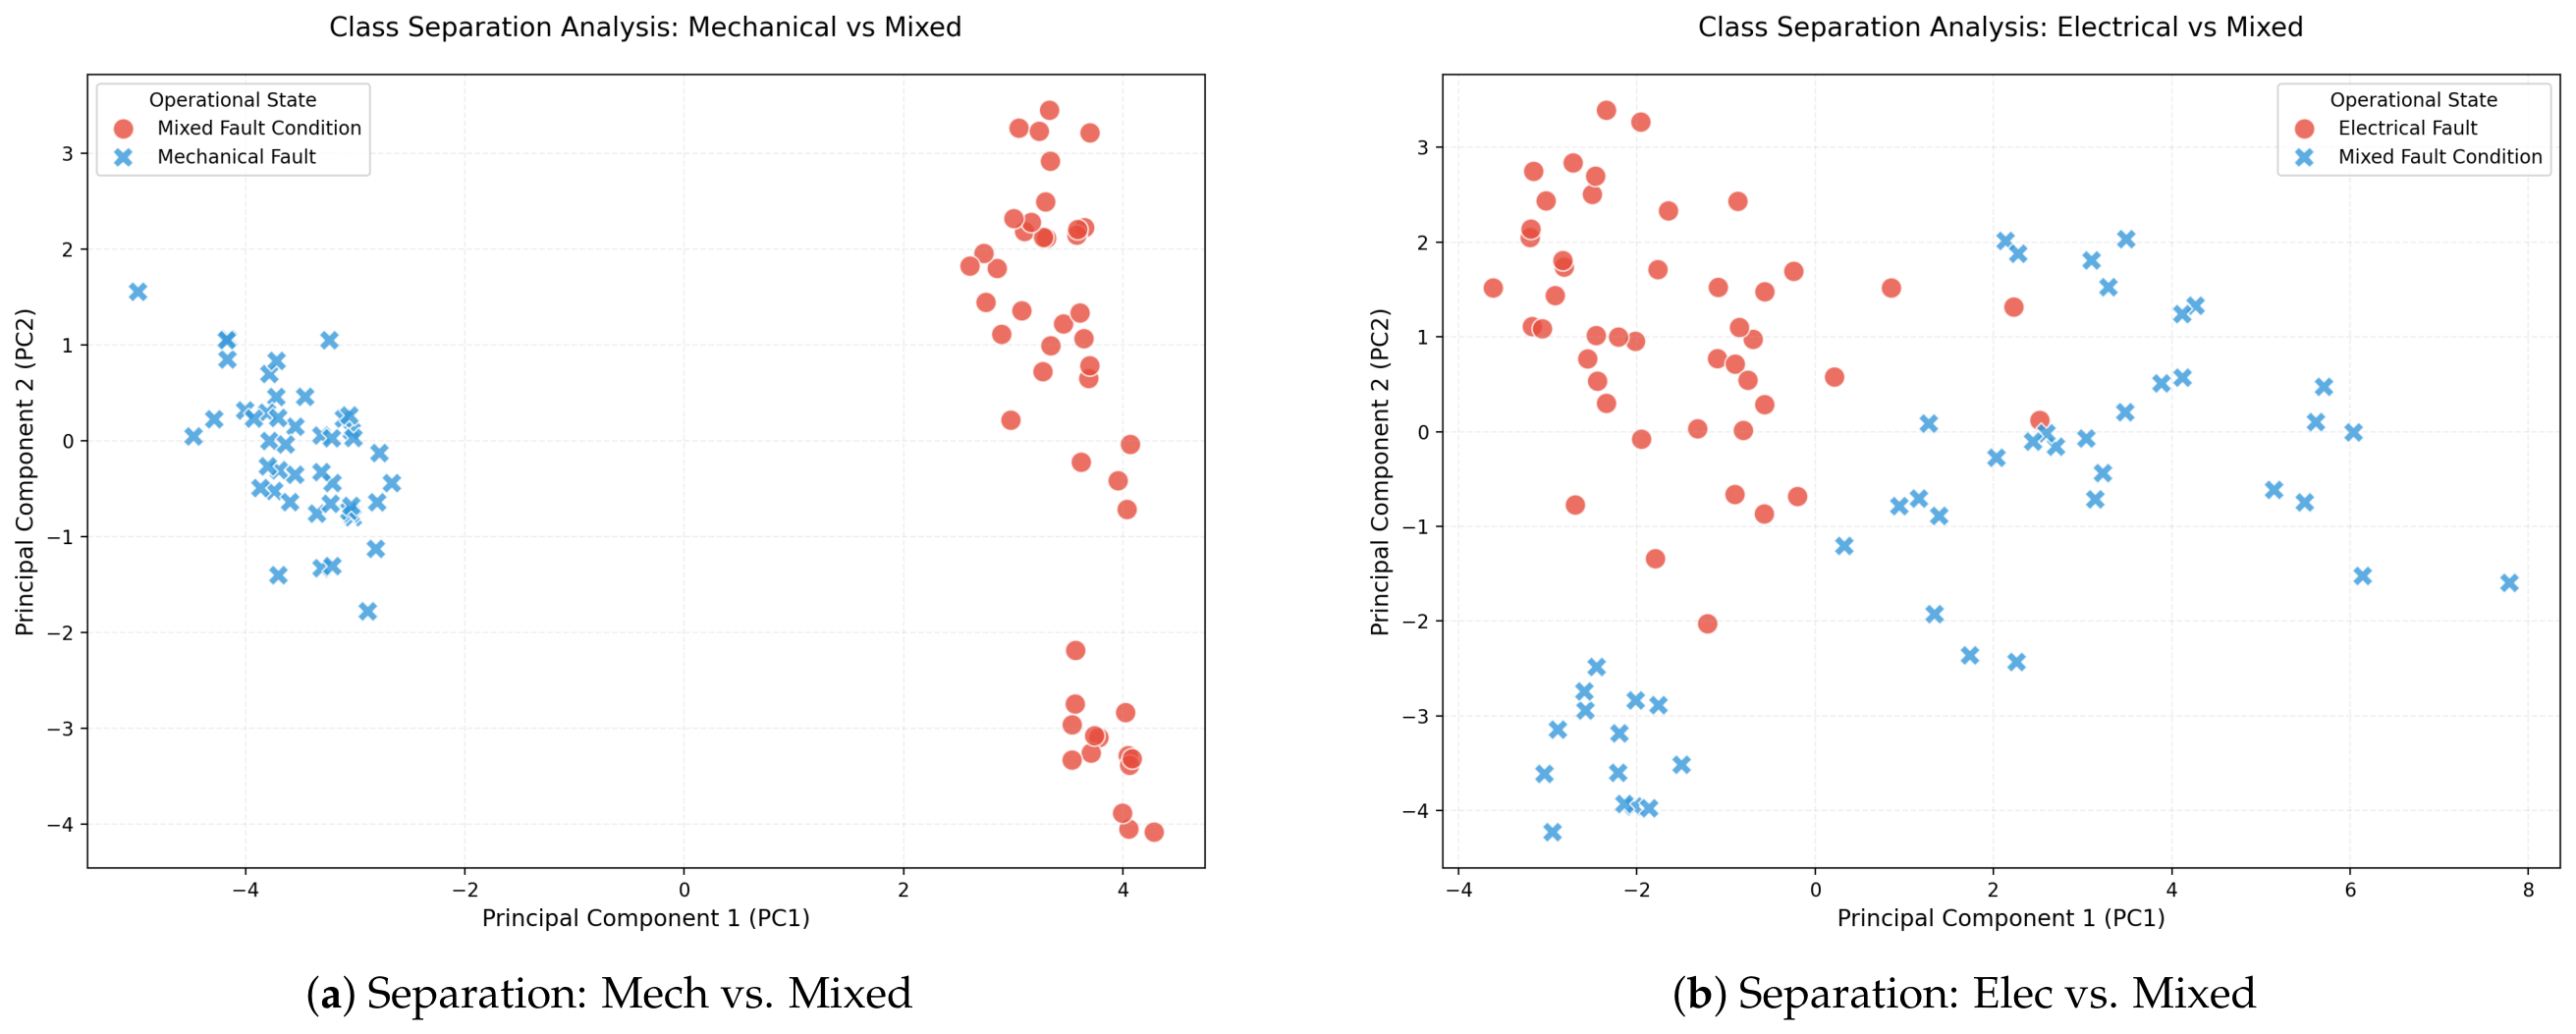
The PCA-based visualization (Figure 13) confirms that the system effectively distinguishes between the analyzed operating conditions. In the Mechanical vs. Mixed scenario (Figure 13a), a clear separation is visible along the first principal component (PC1). Mixed fault samples form a compact cluster, indicating that the addition of an electrical fault significantly alters the data structure, making it distinguishable from the mechanically induced imbalance condition.
Figure 13.
Visualization of class separation in the space of the first two principal components (PCA).
A similar pattern is observed in the Electrical vs. Mixed scenario (Figure 13b). Although both conditions exhibit similar characteristics in the current signals, feature fusion allows for a clear decision boundary between them.
The high classification performance in these scenarios demonstrates that the model effectively captures relationships between current and rotational signals. Moreover, the system is robust to situations in which one fault could mask the presence of another.
4. Discussion
The obtained results show that combining current and rotational signals provides a diagnostically useful representation of BLDC motor condition, especially when interpreting mixed fault states. In the analysed benchmark, however, feature-level fusion did not improve the headline accuracy over the best single-modality variant, although it remained advantageous from the interpretability perspective. Another important finding is that the application of PCA consistently degraded classification performance. This tendency was confirmed not only for the proposed model, but also across the additional baseline classifiers considered in the revised analysis.
The additional comparative study showed that the proposed Stacking Ensemble did not outperform all standard classifiers by a large numerical margin, but rather achieved a consistently high performance level together with Random Forest in the raw fused feature space. The main advantage of the proposed approach therefore lies not in a dramatic numerical gap over all tabular baselines, but in combining competitive performance with a physically interpretable multimodal representation. At the same time, the PCA-based variants consistently underperformed across all tested models, which supports the conclusion that linear compression of the handcrafted diagnostic descriptors is detrimental in this setting.
The application of SHAP [12,13] enabled a more transparent interpretation of the model and provided insight into how data fusion influences the diagnostic process. The analysis revealed that:
- Mixed faults are identified through the combination of high rotational fluctuations (ROTO rms) and current anomalies (CURRENT max), making them the most distinct condition in terms of physical characteristics (Figure 8).
- Early-stage mechanical faults represent the most challenging diagnostic case, as evidenced by the misclassification of one mechanical fault class instance as healthy (Figure 11). This suggests that rotational parameters in BLDC motors are highly sensitive to varying operating conditions.
- Electrical signatures are associated with shifts in the current spectrum center (Frequency Center), which the model interprets as an indicator of magnetic asymmetry.
The structure of the proposed Stacking Ensemble model, integrating classifiers of varying complexity (shallow and deep Random Forests), contributed to improved prediction stability and reduced the risk of overfitting, which is particularly important given the limited dataset (184 samples).
The successful distinction between mixed and single-fault conditions in the benchmark experiments (Accuracy = 100%) indicates effective separability under the controlled benchmark setting, although it should not be interpreted as standalone evidence of broad cross-unit generalization.
The external validation results also indicate that the current framework should be interpreted as a controlled benchmark study rather than as a finalized diagnostic solution with confirmed cross-unit generalization. Transfer to unseen cases was more reliable for mechanically induced imbalance than for permanent-magnet degradation and especially for combined fault conditions. This limitation is consistent with the restricted number of independent physical experiments in the main benchmark and motivates future work on broader acquisition campaigns and more diverse fault realizations.
5. Model Validation on a New Measurement Dataset
The final stage of the study involved validating the classifier on a new dataset. This made it possible to assess the algorithm’s ability to diagnose units whose signatures were not used during the training process.
5.1. Experimental Setup and Measurement Method
The experiments were conducted on a group of five BLDC motors with different technical conditions (Table 5). The measurement system included Hall-effect sensors (phase current), an optical sensor (rotational speed), and an accelerometer (vibration level), together with a data acquisition card operating in the DASYLab 2024 environment. In the present article, only the current and rotational-speed signals were used for classification, whereas the accelerometer signal was recorded as part of the measurement setup but was not included in the analysed classifier. Data acquisition was performed at a sampling frequency of 20,000 Hz.
The measurement procedure for each case lasted approximately 7 s and involved recording the motor operation in steady-state conditions. The study included the following units:
- Healthy motors (2 units): Factory-new units representing normal operation.
- Motors with permanent magnet damage (3 units): Units with diagnosed damage to permanent magnets. These cases are important due to their impact on magnetic flux asymmetry.
For each of the five motors, both a baseline measurement and a measurement with artificially introduced mechanical imbalance (zipcord) were performed, allowing simulation of mechanically induced imbalance.
5.2. Data Preparation for Classification
From the recorded time series, segments corresponding to steady-state operation were extracted, excluding the startup phase to eliminate disturbances resulting from transient current and rotational states.
The feature representation used in this validation stage was the same as in the main experiments, and the already developed Stacking Ensemble classifier was applied without introducing an additional sensing modality. The objective of this stage was to verify whether superimposing a mechanical fault onto an existing magnetic defect would allow correct separation of these states within the classifier’s decision space.
5.3. Statistical Analysis of Classification Results
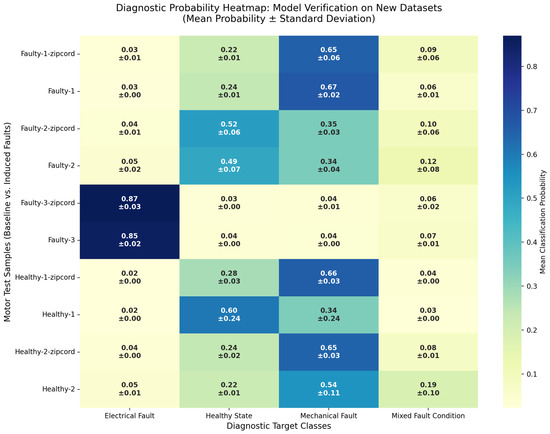
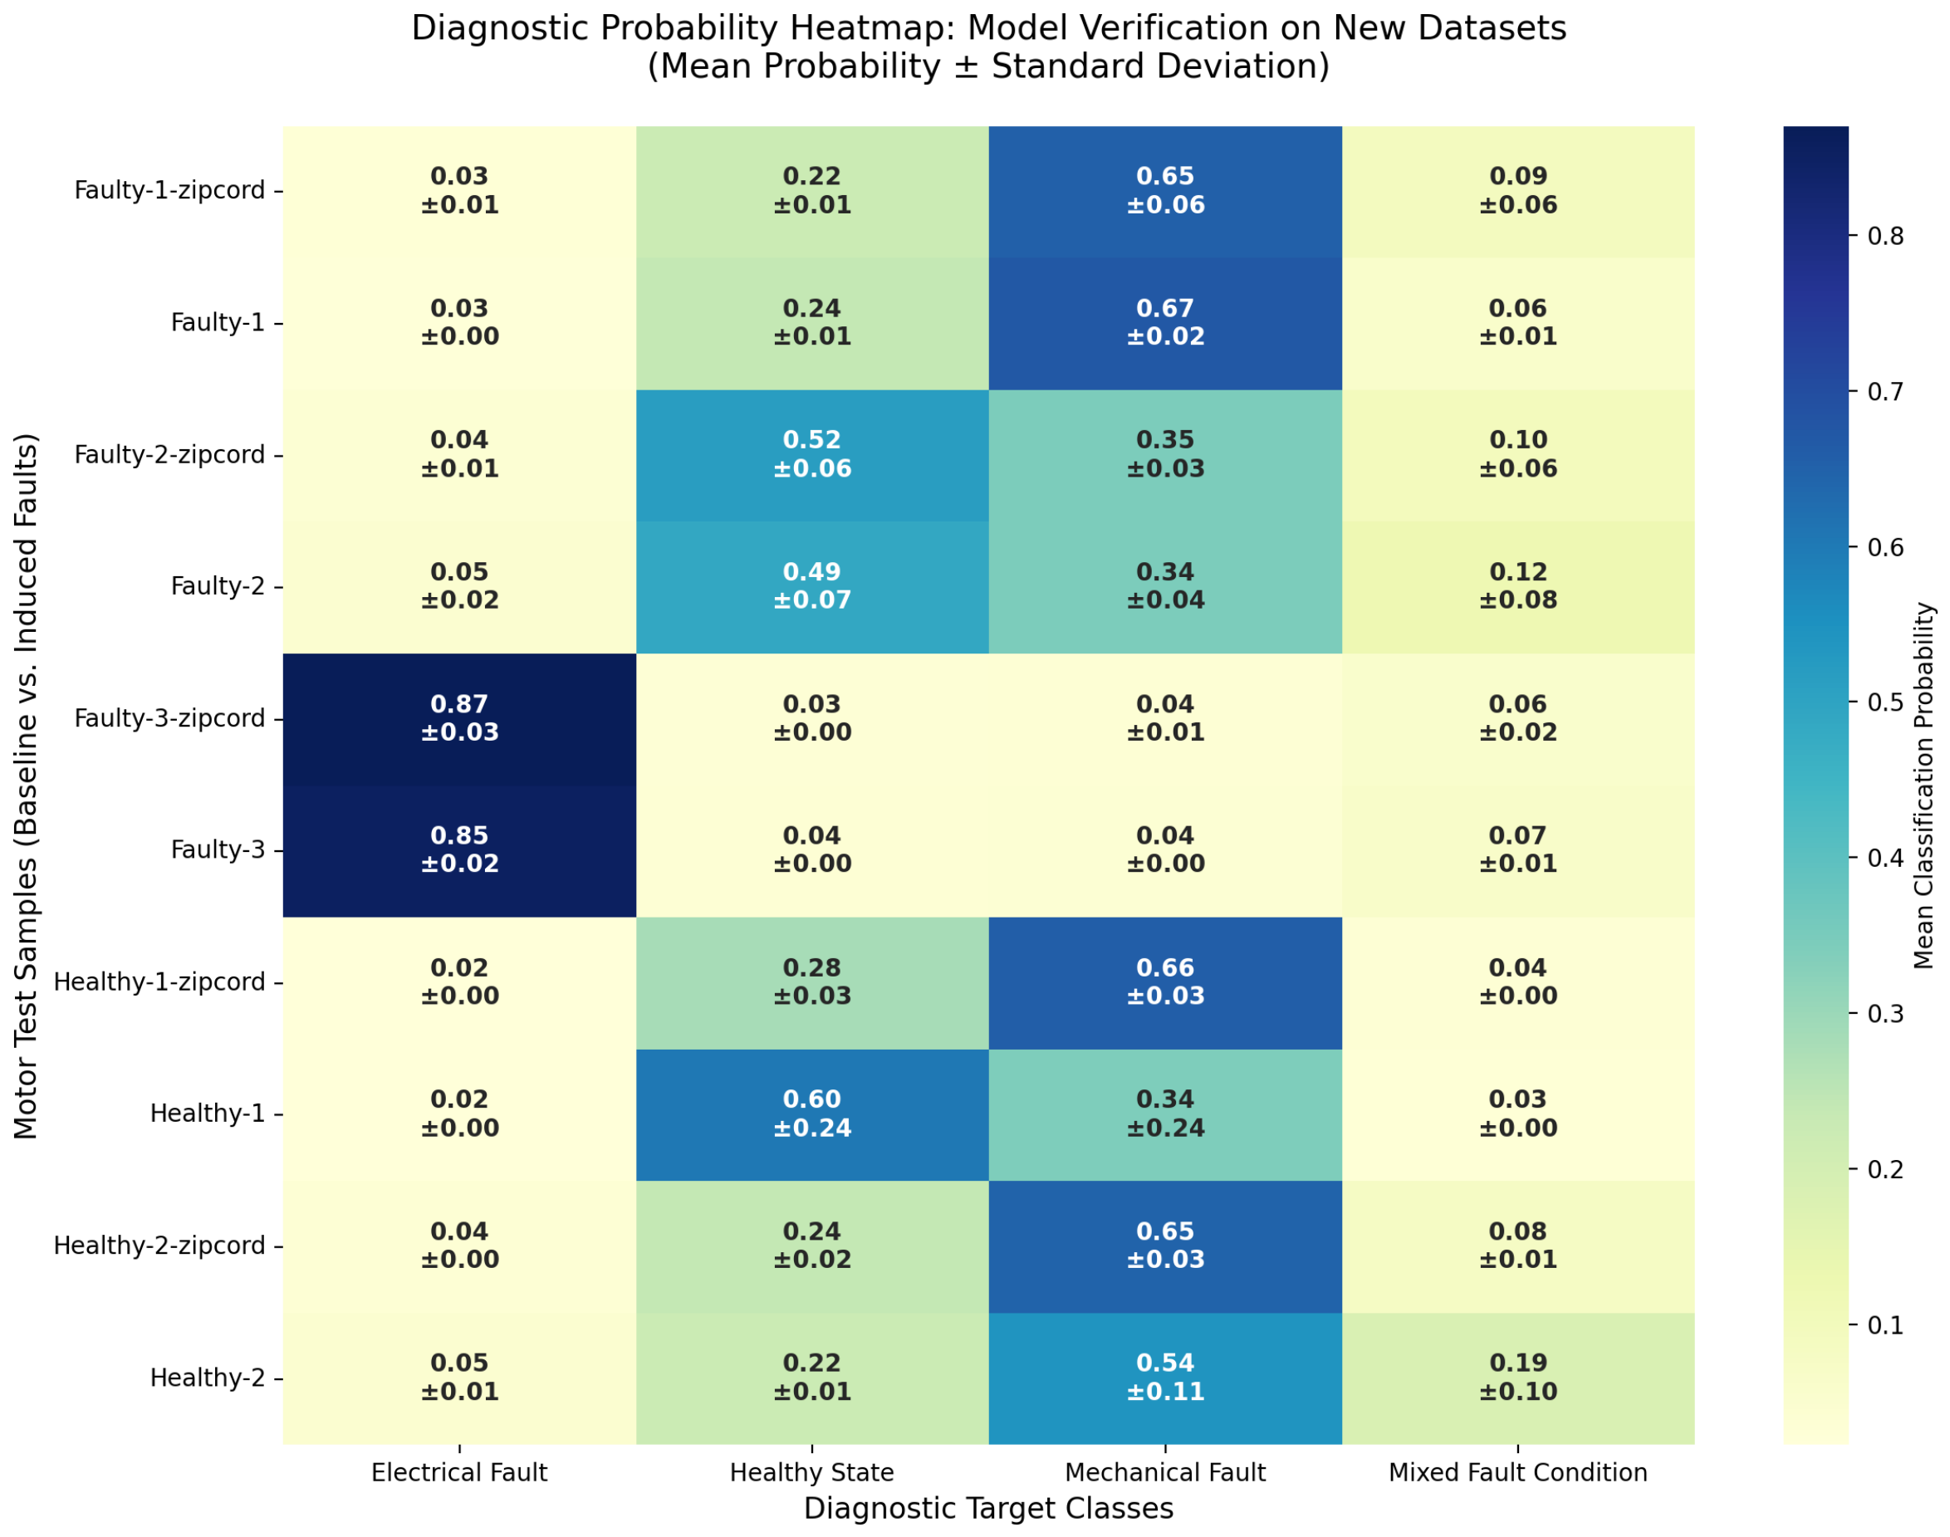
The final evaluation was performed using the Stacking Ensemble model. The diagnostic results are presented as a probability map (Figure 14), showing the mean prediction value across all time windows along with the standard deviation. This form of visualization highlights both high-confidence states and regions where the system exhibits lower decision certainty.
Figure 14.
Probability map of classification results for individual units ().
The external validation on additional motor units provided a more demanding test of transferability than the benchmark dataset. The model generalized more reliably to the mechanically induced imbalance cases than to the electrical and mixed fault conditions. In particular, both healthy motors with added imbalance were correctly assigned to the mechanical class, whereas only one out of three motors with permanent-magnet degradation was correctly assigned to the electrical class. None of the three externally measured combined cases were consistently mapped to the mixed-fault category. These results indicate that the present model retains useful sensitivity to certain fault signatures outside the training benchmark, but its cross-unit generalization remains limited, especially for electrical and mixed conditions.
Table 5.
Summary of external validation on additional motor units.
5.4. Sensitivity to Additional Downsampling
To assess the sensitivity of the inference pipeline to a further reduction in sampling frequency, the external recordings originally sampled at 20 kHz were additionally downsampled to 10 kHz and reprocessed using the same feature-extraction procedure.
All ten unit-level predictions remained unchanged after downsampling. Although this experiment does not replace a full harmonization study between the 50 kHz benchmark dataset and the 20 kHz external acquisition setting, it provides a partial robustness check indicating that moderate additional downsampling of the external recordings did not materially alter the final unit-level decisions once the features had been recomputed (Table 6).
Table 6.
Summary of unit-level prediction stability after downsampling external recordings from 20 kHz to 10 kHz.
5.5. Temporal Stability of Predictions
To evaluate the system, two characteristic scenarios were tested: stable fault identification and cases of decision uncertainty. This comparison allows determination of the model’s sensitivity limits.
Temporal validation showed that fluctuations in predictions (classification switching within a single sample) do not result from algorithmic errors but from the nature of the steady-state signal. Short-term fluctuations in parameters make point-by-point classification unstable, suggesting the need for longer observation windows or temporal averaging algorithms.
5.5.1. Case 1: Stable Identification of Permanent Magnet Damage
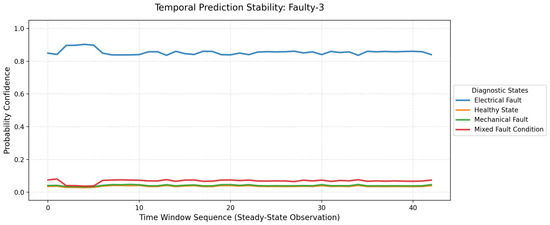
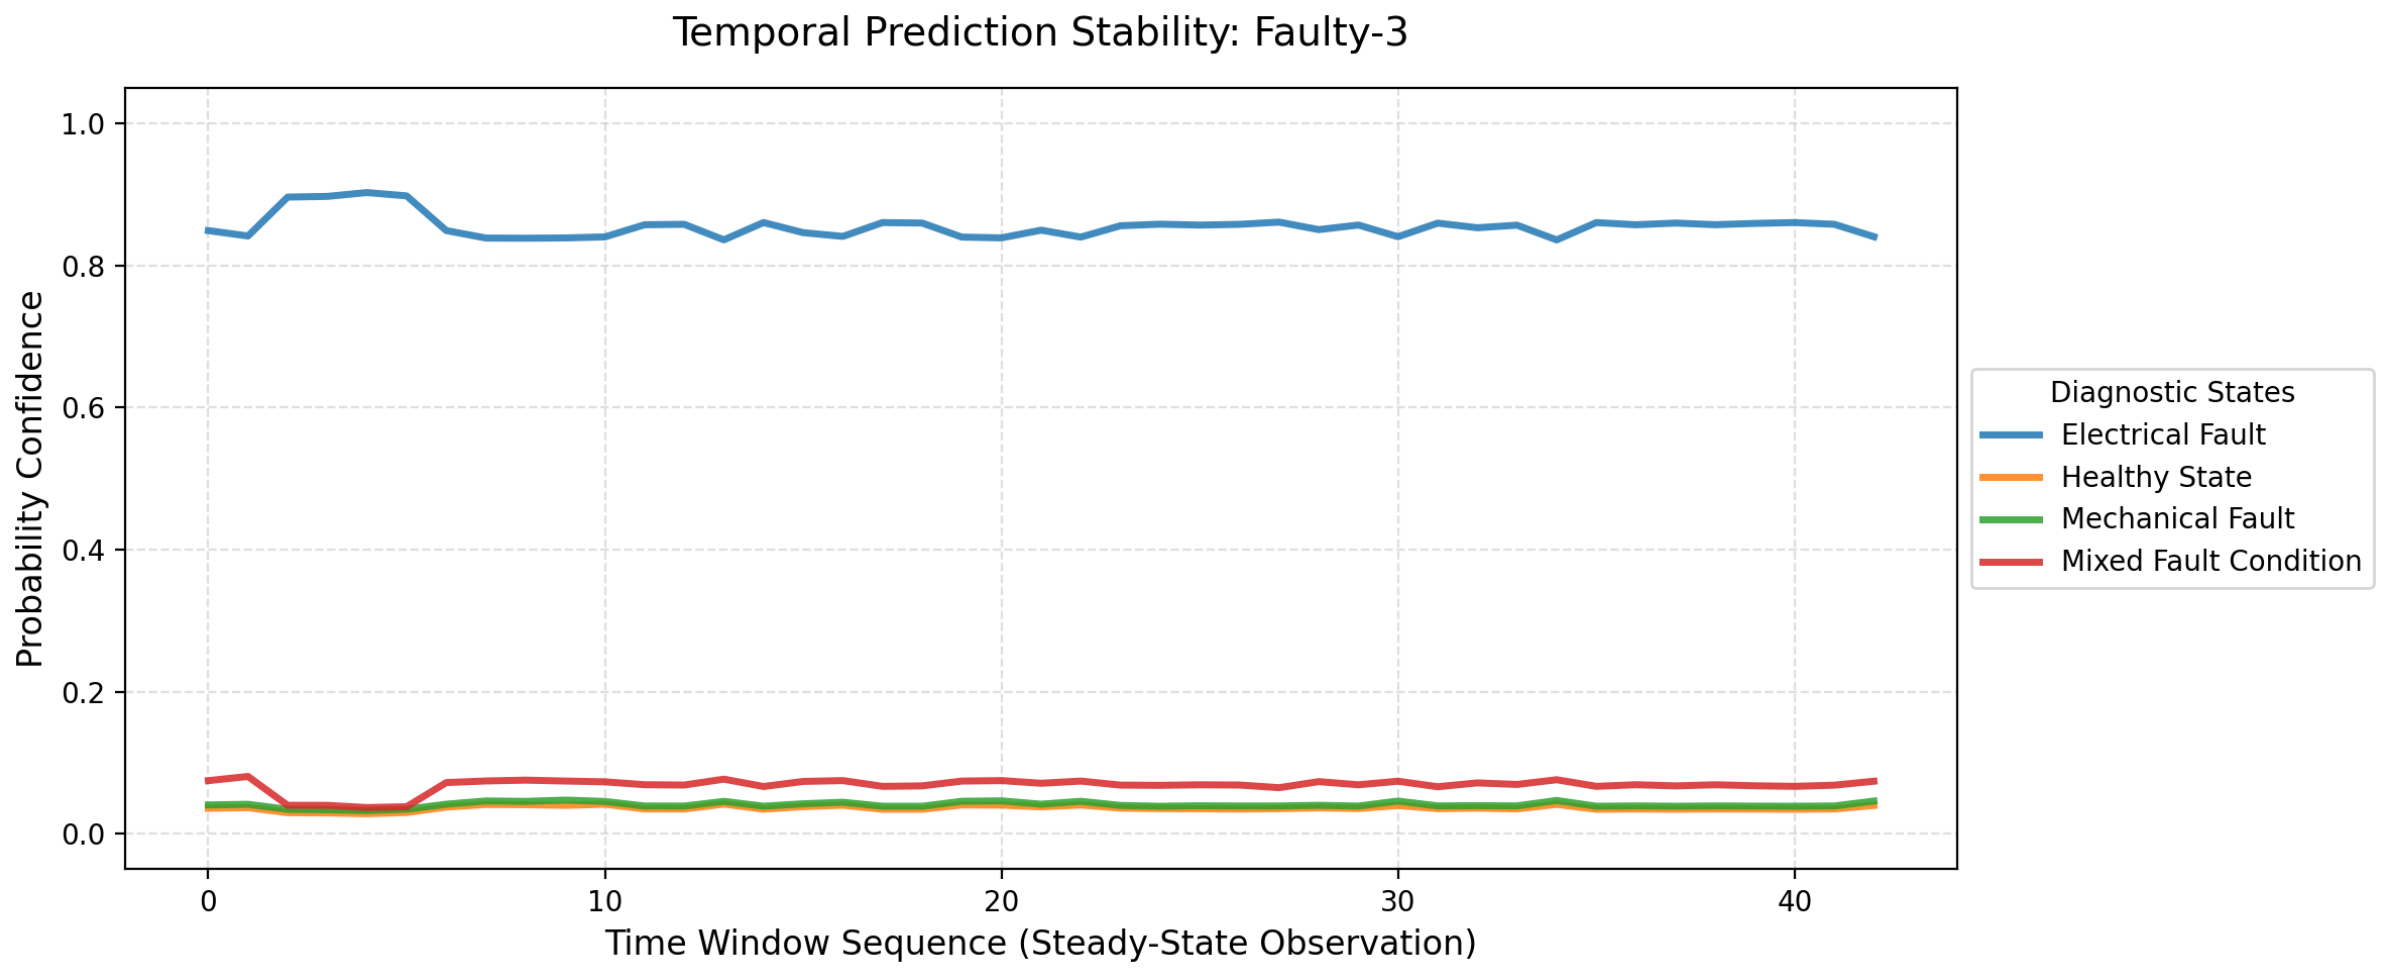
The ideal scenario is illustrated by a motor with permanent magnet damage in its baseline state, without additional mechanical load (Figure 15). The plot shows stable classification, as the probability of electrical fault detection remains consistently high throughout the observation period.
Figure 15.
Temporal stability of prediction for a motor with permanent magnet damage.
These results show that the classifier responds consistently to anomalies of electrical origin, as permanent magnet damage in BLDC motors produces a clear and repeatable signature in the current and rotational domains considered in this study.
5.5.2. Case 2: Decision Instability in a Theoretically Healthy State
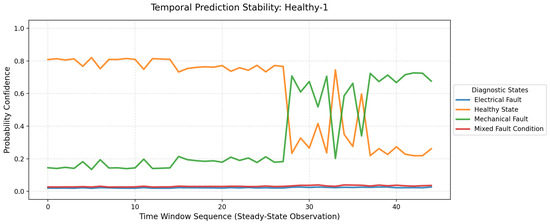
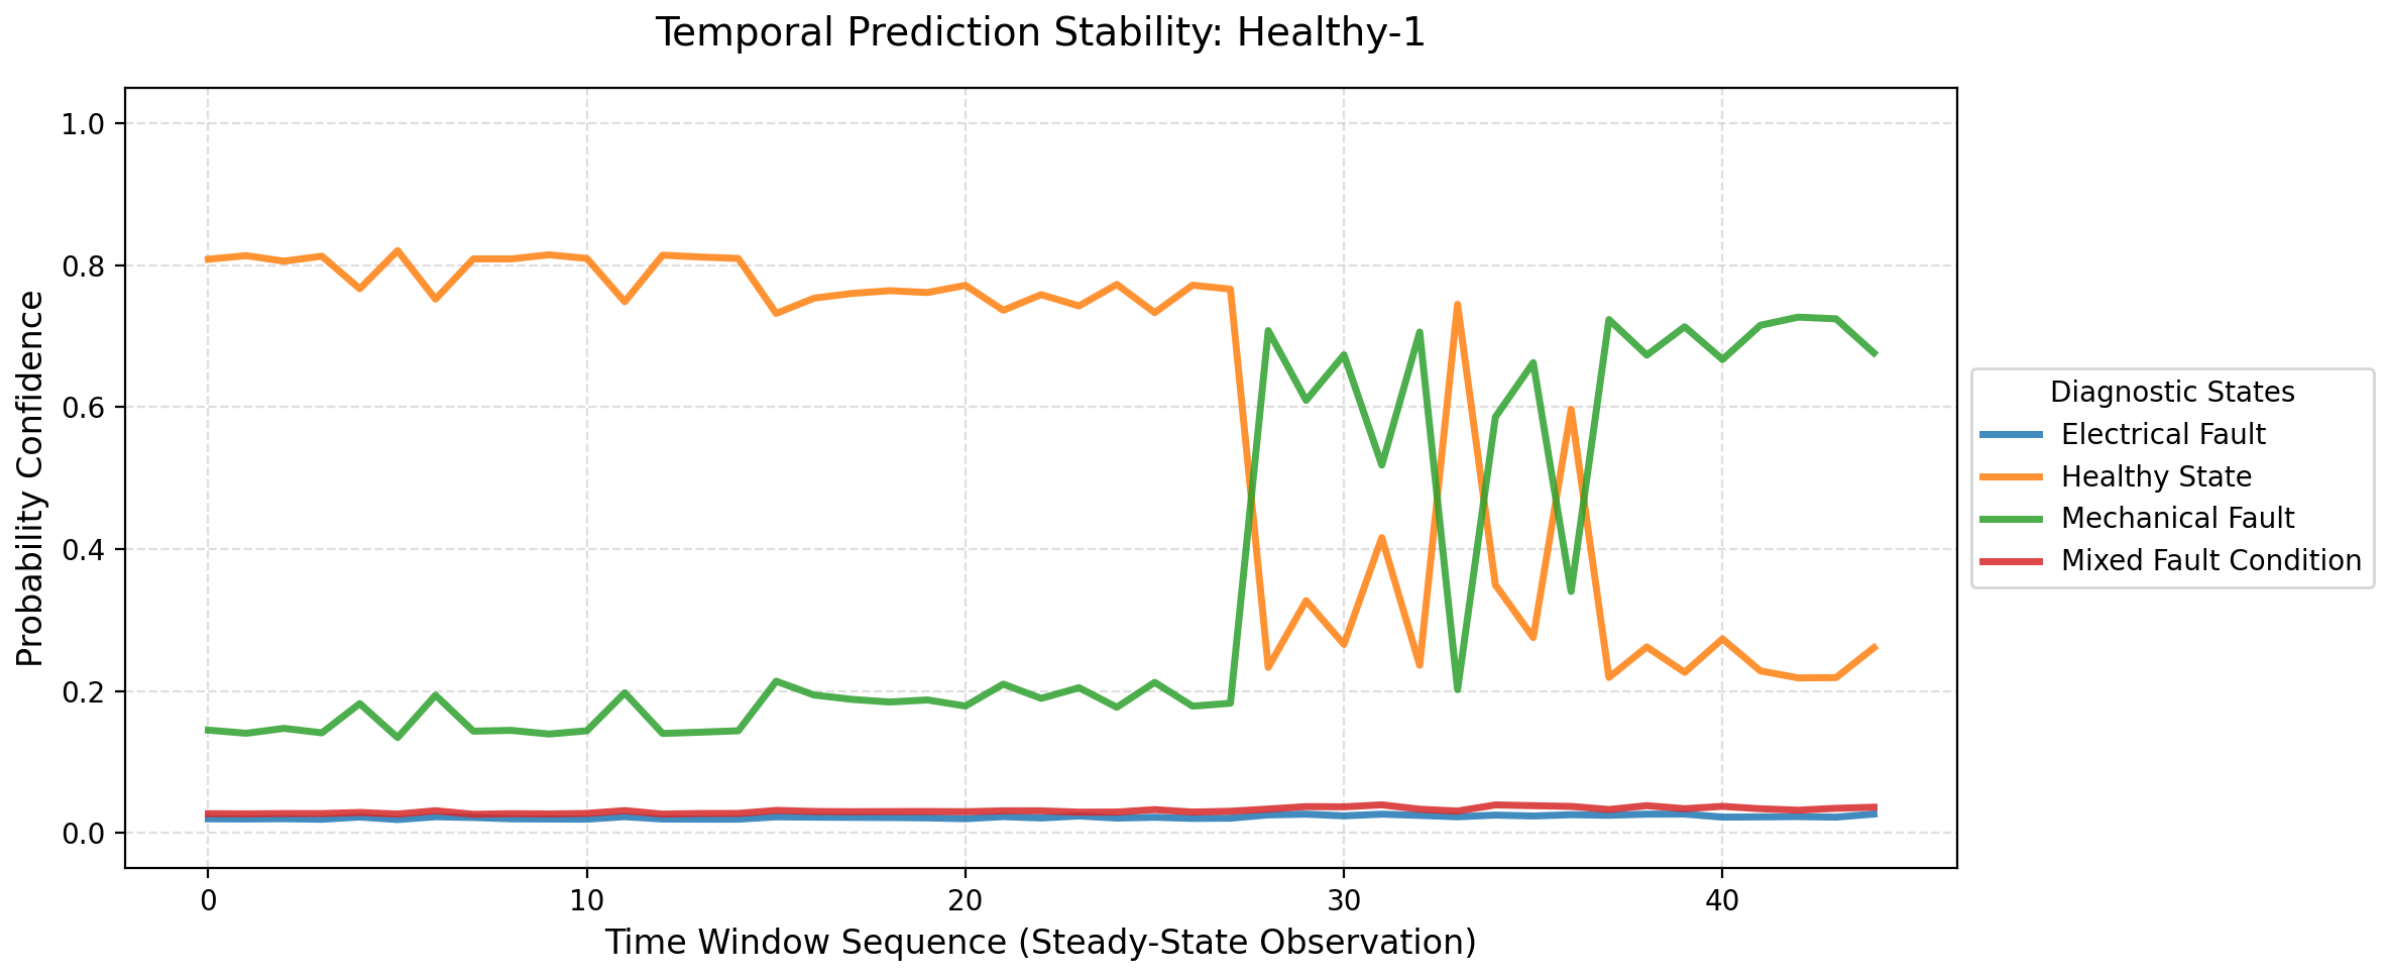
A problematic case is shown using a theoretically healthy motor (Healthy-1), for which no intentional faults were introduced (Figure 16). This example demonstrates the physical limits of method sensitivity and the impact of process disturbances on real-time decision stability.
Figure 16.
Occurrence of decision uncertainty and sudden classification change for a healthy motor (Healthy-1).
The plot clearly shows a sudden loss of prediction stability. Initially, the model identifies the unit as healthy with high confidence, but over time it incorrectly indicates a mechanical fault. This behavior is most likely caused by experimental setup conditions, such as thermal drift of magnets or mechanical resonance of auxiliary components, which alter the unit’s signature enough to destabilize classification. This indicates the need for temporal averaging mechanisms or longer observation windows in practical applications.
5.6. Method Limitations and Critical Analysis
The analysis identified several limitations of the system, the most significant being difficulty in detecting mechanical imbalance.
The quality of diagnosis is also affected by dataset size. A limited number of motor samples introduces a risk of data leakage, meaning the classifier may partially learn unique construction features or specific bearing noise of individual units rather than general fault patterns.
The validation process was also influenced by external factors related to the experimental setup. Instability of auxiliary components and manual introduction of imbalance introduced disturbances into the signal. Another limitation is the lack of winding temperature monitoring. Motor heating changes resistance and current signatures, contributing to the observed prediction fluctuations.
The obtained results provide a solid foundation for further system development, indicating the need to expand the dataset and incorporate thermal parameters in future iterations of the algorithm.
6. Conclusions and Final Remarks
The study demonstrated that the proposed Stacking Ensemble framework is effective in diagnosing BLDC motor faults using features extracted from the current and rotational domains. Based on the experimental analysis, the following conclusions can be drawn:
- Classification performance: the highest overall accuracy, equal to 97.30%, was obtained for raw-feature models. In the analysed dataset, the fused representation and the rotational-domain model achieved the same top-line accuracy. The fused representation was nevertheless retained because it provides access to complementary physical information and supports the interpretation of mixed fault conditions.
- Impact of data processing: PCA reduced classification performance in all analysed variants, lowering the accuracy of the fused model to 91.89%. This suggests that, for the considered problem, raw features preserve diagnostically relevant information better than linear projections onto a reduced component space.
- Model interpretability: SHAP analysis indicated that the model decisions were primarily driven by physically meaningful features, in particular ROTO (RPM) rms, ROTO (RPM) mean, and selected current-domain descriptors related to spectral shifts and amplitude changes.
- Mixed fault conditions: the proposed representation enabled effective separation of mixed fault states from single-fault conditions, which is particularly important in practical diagnostics, where overlapping symptoms from different physical mechanisms may occur.
- Limitations and future work: the main limitations of the study are the relatively small dataset and the restricted range of operating conditions. Future work should include validation under varying load and speed conditions, as well as further expansion of the dataset.
A natural next step is to evaluate how the identified diagnostic signatures behave under more diverse operating regimes typical of real-world electric-drive applications.
Author Contributions
Conceptualization, M.K. and J.B.; methodology, M.K.; software, M.K.; validation, M.K. and J.B.; formal analysis, M.K.; investigation, M.K.; resources, M.K.; data curation, M.K.; writing—original draft preparation, M.K.; writing—review and editing, J.B.; visualization, M.K.; supervision, J.B.; project administration, J.B.; funding acquisition, J.B. All authors have read and agreed to the published version of the manuscript.
Funding
Work financed by AGH’s subvention for scientific research.
Institutional Review Board Statement
Not applicable.
Informed Consent Statement
Not applicable.
Data Availability Statement
The data presented in this study are openly available in Zenodo at https://doi.org/10.5281/zenodo.15522163.
Acknowledgments
During the preparation of this manuscript, authors used ChatGPT 5 for the purposes of style verification and refinement. The authors have reviewed and edited the output and take full responsibility for the content of this publication.
Conflicts of Interest
The authors declare no conflicts of interest.
Abbreviations
The following abbreviations are used in this manuscript:
| BLDC | Brushless Direct Current motor |
| PCA | Principal Component Analysis |
| SHAP | SHapley Additive exPlanations |
| RF | Random Forest |
| RMS | Root Mean Square |
References
- Hussain, H.A.; Hussain, A.N.; Abed, W.R. Faults Diagnosis of BLDC Motors Using Artificial Neural Networks. IOP Conf. Ser. Mater. Sci. Eng. 2021, 1105, 012003. [Google Scholar] [CrossRef] [Scilit]
- Zonta, T.; da Costa, C.A.; da Rosa Righi, R.; de Lima, M.J.; da Trindade, E.S.; Li, G.P. Predictive Maintenance in the Industry 4.0: A Systematic Literature Review. Comput. Ind. Eng. 2020, 150, 106889. [Google Scholar] [CrossRef] [Scilit]
- Mallioris, P.; Aivazidou, E.; Bechtsis, D. Predictive Maintenance in Industry 4.0: A Systematic Multi-Sector Mapping. CIRP J. Manuf. Sci. Technol. 2024, 50, 80–103. [Google Scholar] [CrossRef] [Scilit]
- Achouch, M.; Dimitrova, M.; Ziane, K.; Sattarpanah Karganroudi, S.; Dhouib, R.; Ibrahim, H.; Adda, M. On Predictive Maintenance in Industry 4.0: Overview, Models, and Challenges. Appl. Sci. 2022, 12, 8081. [Google Scholar] [CrossRef] [Scilit]
- Wang, L.; Wu, M. Research on Bearing Fault Diagnosis Based on Machine Learning and SHAP Interpretability Analysis. Sci. Rep. 2025, 15, 41242. [Google Scholar] [CrossRef] [Scilit] [PubMed]
- Hamani, K.; Kuchar, M.; Kubatko, M.; Kirschner, S. Advancements in Induction Motor Fault Diagnosis and Condition Monitoring: A Comprehensive Review. Sensors 2025, 25, 5942. [Google Scholar] [CrossRef] [Scilit] [PubMed]
- Xu, Z.; Chen, X.; Li, Y.; Xu, J. Hybrid Multimodal Feature Fusion with Multi-Sensor for Bearing Fault Diagnosis. Sensors 2024, 24, 1792. [Google Scholar] [CrossRef] [Scilit] [PubMed]
- Wang, J.; Fu, P.; Zhang, L.; Gao, R.X.; Zhuang, Z. Multilevel Information Fusion for Induction Motor Fault Diagnosis. IEEE/ASME Trans. Mechatron. 2019, 24, 2139–2150. [Google Scholar] [CrossRef] [Scilit]
- Bauer, W.; Baranowski, J. Improving BLDC Motor Fault Detection via KDE-Based Bayesian Data Fusion. In Proceedings of the 2025 7th International Conference on Electrical, Control and Instrumentation Engineering (ICECIE); IEEE: Pattaya City, Thailand, 2025; pp. 217–223. [Google Scholar] [CrossRef] [Scilit]
- Khan, Z.A.; Raza, M.A.; Masud, M.I.; Jumani, T.A.; Faheem, M.; Aman, M. Machine Learning Based Fault Classification for Improved Induction Motor Performance. PLoS ONE 2025, 20, e0335367. [Google Scholar] [CrossRef] [Scilit] [PubMed]
- Gao, X.; Zhang, Y.; Dong, E.; You, Z.; Wen, L.; Cheng, Z. Research on Fault Diagnosis of Mechanical Bearings Based on Transfer Learning. Sensors 2025, 25, 7446. [Google Scholar] [CrossRef] [Scilit] [PubMed]
- Gawde, S.; Patil, S.; Kumar, S.; Kamat, P.; Kotecha, K.; Alfarhood, S. Explainable Predictive Maintenance of Rotating Machines Using LIME, SHAP, PDP, and ICE. IEEE Access 2024, 12, 29345–29361. [Google Scholar] [CrossRef] [Scilit]
- Brusa, E.; Cibrario, L.; Delprete, C.; Di Maggio, L.G. Explainable AI for Machine Fault Diagnosis: Understanding Features’ Contribution in Machine Learning Models for Industrial Condition Monitoring. Appl. Sci. 2023, 13, 2038. [Google Scholar] [CrossRef] [Scilit]
- Aishwarya, M.; Brisilla, R.M. Design and Fault Diagnosis of Induction Motor Using ML-Based Algorithms for EV Application. IEEE Access 2023, 11, 35456–35467. [Google Scholar] [CrossRef] [Scilit]

Disclaimer/Publisher’s Note: The statements, opinions and data contained in all publications are solely those of the individual author(s) and contributor(s) and not of MDPI and/or the editor(s). MDPI and/or the editor(s) disclaim responsibility for any injury to people or property resulting from any ideas, methods, instructions or products referred to in the content. |
© 2026 by the authors. Licensee MDPI, Basel, Switzerland. This article is an open access article distributed under the terms and conditions of the Creative Commons Attribution (CC BY) license.