


Abstract
Additive manufacturing by Selective Laser Melting (SLM) or, precisely, Laser Powder Bed Fusion (L-PBF), offers new opportunities for producing electrically functional metal components with tailored geometric designs and material properties. In this study, the electrical contact resistance and related properties of 3D-printed samples made from Al5086 aluminum alloy are tested. The benefits of Al5086 include flexibility without cracking, welding ability and exceptional resistance to corrosion in saltwater and industrial environments. This makes it an excellent candidate for power electric applications due to its good electrical conductivity and corrosion resistance. In this study, an analysis is performed to assess the impact of internal volumetric properties and surface parameters on general contact resistance performance. This analysis combines advanced testing procedures and parameter identification of the electric contact resistance model. This study investigates how these parameters affect contact resistance, which is a critical factor in the reliability of electrical devices. Electrical contact resistance was measured using a dedicated test setup that applied consistent pressure and maintained directional alignment. The results show that the printing direction of the samples slightly affects resistance values due to the continuity of current paths along the build direction, likely due to homogenous inter-layer boundaries and mechanical stress distribution. These findings suggest that both print orientation and internal structure must be considered when designing 3D-printed contact elements for electrical applications. Overall, this study demonstrates the feasibility of using L-PBF-fabricated aluminum components in electric applications where both electrical and structural performances are essential.
1. Introduction
As additive manufacturing technologies continue to evolve, their applications have expanded into domains traditionally dominated by subtractive processes, including the production of functional components for electric systems and devices. Among the various additive methods, Selective Laser Melting (SLM), or, precisely, Laser Powder Bed Fusion (L-PBF), has emerged as a leading technology for fabricating high-strength, dense metal parts directly from digital CAD models without the need for molds or extensive post-machining [1,2]. One promising area for L-PBF is the production of custom electrically conductive elements for electrical and electronic applications, including contact elements, where both mechanical performance and electrical properties are critical [3,4].
Metallic materials for electrical applications must have high electrical conductivity, so these applications primarily use copper, aluminum, and their alloys. These metals require specific conditions in L-PBF 3D printing due to their very high thermal conductivity and reflectivity, which lead to heat dissipation during 3D printing and internal heat redistribution within the printing sample [5]. Therefore, in complex geometries, some loss of property is observed. Most recent research has focused on volumetric electric conductivity characterization and its improvement by reducing internal stress and fixing micro-cracking [6,7]. However, one very important surface property for electric applications is electric contact resistance, which is investigated relatively rarely.
Contact resistance is the additional electrical resistance encountered at the surface interface between two conductive materials, normal to the current path. In electric power applications, contact resistance leads to significant energy loss and overheating, which can cause direct equipment failure. In low-power electronics, it causes signal noise and measurement errors. Contact resistance is a complex electro-mechanical phenomenon that depends on a combination of electrical and mechanical factors, most of which are defined by surface properties at the contacting interface [8].
Three-dimensional-printed electrically conductive materials can be used for electrical switchgear contacts, battery collector electrodes [9], electrolysis electrodes, welding electrodes, and many other applications. They must combine corrosion resistance and weldability without property deviation.
Additive manufacturing, such as 3D printing, mostly benefits complex shapes with tailored material properties for some specific applications. Material properties of 3D-printed designs can be classified into two categories: volumetric and surface. This is especially important for electric and magnetic properties [3,4]. Material properties are primarily achieved in 3D printing by gradual modulation of the main material during printing or post-processing, using material activation and even training to exhibit a desired property [9,10,11,12,13].
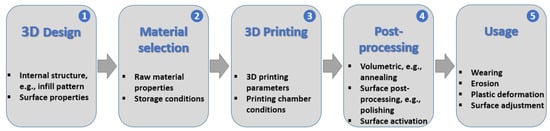
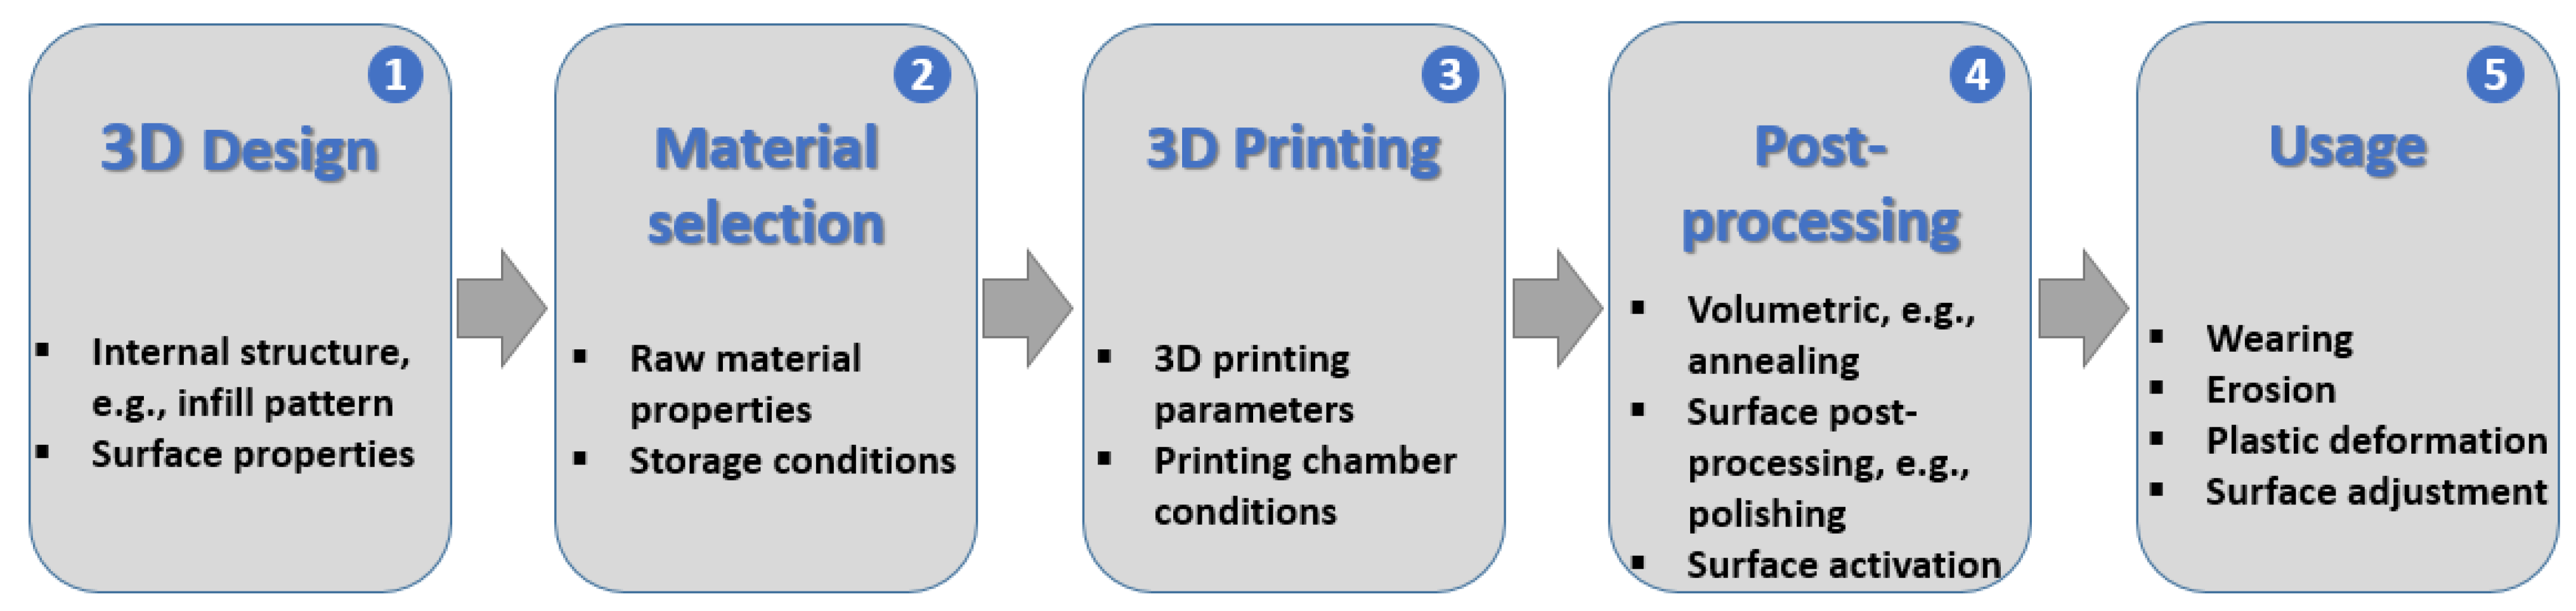
The process of achieving tailored material properties covers a complete sequence, shown in Figure 1, containing the following steps.
Figure 1.
The stages of the 3D printing process, with the sequential impact on surface properties of the printed sample highlighted.
- Design planning: Using optimal shape design and 3D printing adjustment parameters at the CAD stage, a desired combination of properties can be achieved [14].
- Material selection based on their material properties: By selecting printing materials with different alloys, the properties of 3D-printed outcomes are typically controlled [13,15,16,17].
- Three-dimensional printing process parameters: Material properties targeted by 3D printing are primarily achieved by gradual modulation of the internal fill of the main material during printing [18,19]. This way, in most cases, better properties than those of the raw material are not achieved, but there are some exceptions explained by micro-level synergetic effects and/or well-defined process control [17,19,20,21,22]. Printing process parameter selection optimization is extremely important for that stage [14,23,24].
- Post-processing operations: These directly influence surface properties; these post-processing operations are surface polishing, smoothing, etching, some drilling operations, sandblasting to improve surface uniformity, and thermal annealing to relieve residual stresses. These processes improve smoothness, surface roughness, etc. [4,25,26].
- Usage stage: Material property modification can be successfully achieved at the usage stage of the design. For example, the contact resistance of a joint can be improved through repeated contact-forming cycles that adjust the contact surface area via microscope plastic deformation and surface self-cleaning. The process is stochastic with statistical repeatability.
It must be noted that material properties in AM are not always achieved by using additive technologies. Many post-processing surface modifications are not achieved by additive technologies. Surface properties are activated and adjusted at the post-processing stage of manufacturing [27,28]. Electric contact resistance is a typical surface property [9,10].
Recent studies have explored the electrical properties of additively manufactured metals [9,10,11], but most focus on bulk electrical conductivity or thermal behavior [14], rather than on the interface level, such as surface contact resistance, which is a critical factor in connectors, switches, and embedded electronics [10]. Moreover, limited observations have been reported regarding the impact of layer interfaces on current flow, depending on the material and printing process used [20].
Aluminum alloys, particularly Al5086, are attractive candidates for such applications due to their good electrical conductivity, corrosion resistance, and compatibility with L-PBF processing [25,29,30,31]. However, despite growing interest in the use of 3D-printed aluminum [32,33,34,35] in electrical systems, limited data exist on its electrical contact behavior, especially when printed in different orientations or with internal structures [36]. In conventional materials, contact resistance is strongly influenced by surface roughness, oxidation, and material homogeneity [11,12]. With layer-wise manufacturing, new variables such as print orientation [37], infill density, and inter-layer bonding may further affect contact performance in ways that are not yet fully understood [26,38,39,40]. The benefits of Al5086 for contact-making include flexibility without cracking and exceptional resistance to corrosion in saltwater and industrial environments [41,42]. Higher strength is achieved through strain hardening, such as cold mechanical pressing. This provides a critical advantage in welding [43,44], because heat does not drastically change its tempered structure, and welded joints retain nearly all their original mechanical strength [5].
The aim of this study is to evaluate the electrical contact resistance of Al5086 aluminum components fabricated by L-PBF, with a focus on how build orientation and internal structure affect performance. By combining systematic sample design, controlled post-processing, and dedicated electrical testing, this work seeks to clarify the relationship between printing parameters and contact behavior. The findings contribute to a better understanding of the suitability of 3D-printed aluminum for electrical applications and offer design guidelines for additive manufacturing in electromechanical and mechatronic systems.
The paper structure is as follows: After the Introduction (Section 1), the 3D-printed sample preparation process and 3D printing parameters used for this study are presented (Section 2). The next section details the contact resistance model theory (Section 3); thereafter, stress–strain mechanical modeling is presented to describe internal parameters (Section 4). The next section describes the testing method (Section 5), followed by a discussion of the main results, including mechanical and electrical results (Section 6), and another discussion of the results (Section 7). Finally, the conclusion is presented (Section 8).
2. L-PBF Sample Preparation
The benefits of Al5086 include flexibility without cracking and exceptional resistance to corrosion in saltwater and industrial environments [42,43,44]. This makes it an excellent candidate for electric contact applications due to its good electrical conductivity, corrosion resistance, and compatibility with L-PBF processing.
Al5086 aluminum alloy is primarily composed of aluminum, which serves as the remainder of the mixture at approximately 93.0% to 96.3% by weight. Its principal alloying elements are magnesium, ranging from 3.50% to 4.50%, and manganese, accounting for 0.20% to 0.70%, supplemented by 0.05% to 0.25% chromium. The alloy also contains controlled amounts of several impurities and secondary elements, specifically up to 0.50% iron, 0.40% silicon, 0.25% zinc, 0.15% titanium, and 0.10% copper. Finally, trace ingredient alloy elements are limited to 0.05% each, with a combined total not exceeding 0.3%. A comparison of recommended ranges and achieved sample content is presented in Table 1.
Table 1.
Content of the aluminum sample.
The specimens in this study were manufactured using a high-precision metal additive manufacturing system—iSLM280 (ZRapid, China), based on L-PBF (SLM) technology. This process builds fully dense metal parts by selectively melting layers of metal powder using a high-power laser in an inert atmosphere. The iSLM280 printer features a fiber laser system, closed-loop powder handling, and a sealed build chamber that maintains constant temperature and gas purity during fabrication.
The L-PBF process was configured for high-speed printing with a laser power of 350 W and a scan speed of 1000 mm/s. To ensure proper consolidation of the material, a hatch spacing of 0.20 mm was utilized, and the laser beam maintained a focus diameter of approximately 200 μm. These parameters define the energy input and the thermal profile applied to the powder bed during the additive manufacturing cycle.
Stress-relieving and micro-pore reduction heat treatment was applied after printing. A temperature of 350 °C was applied to the printed samples for a duration of 4 h.
After heat treatment, bead blasting was performed to achieve a uniform finish and remove loosely sintered powder. SiO2 particles were used for final polishing with a 2000-mesh size. Finally, the sample was rinsed with deionized water from the loose cleaning and polishing beads.
The combination of controlled energy input, fine powder distribution, and inert argon gas environment ensured repeatable mechanical and electrical performance of the printed components. The iSLM280 system enabled consistent production of Al5086 samples used in all subsequent contact resistance measurements and structural analyses.
Aluminum alloys, particularly Al5086, are attractive candidates for such applications due to their good conductivity, corrosion resistance, and compatibility with L-PBF processing [3,4]. However, despite growing interest in the use of 3D-printed aluminum in electrical systems, limited data exist regarding its electrical contact behavior, especially when printed in different orientations or with internal structures. In conventional materials, contact resistance is strongly influenced by surface roughness, oxidation, and material homogeneity [11,12]. With layer-wise manufacturing, new variables such as print orientation, infill density, and inter-layer bonding may further affect contact performance in ways that are not yet fully understood.
The sample content is presented in Table 1, and the results were measured using a X-Met8000 (Hitachi, Japan) XRF Analyzer.
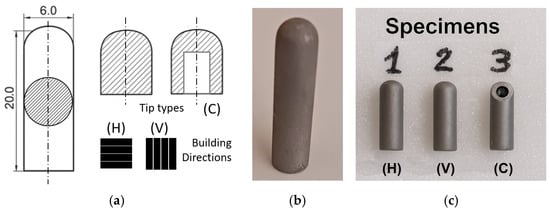
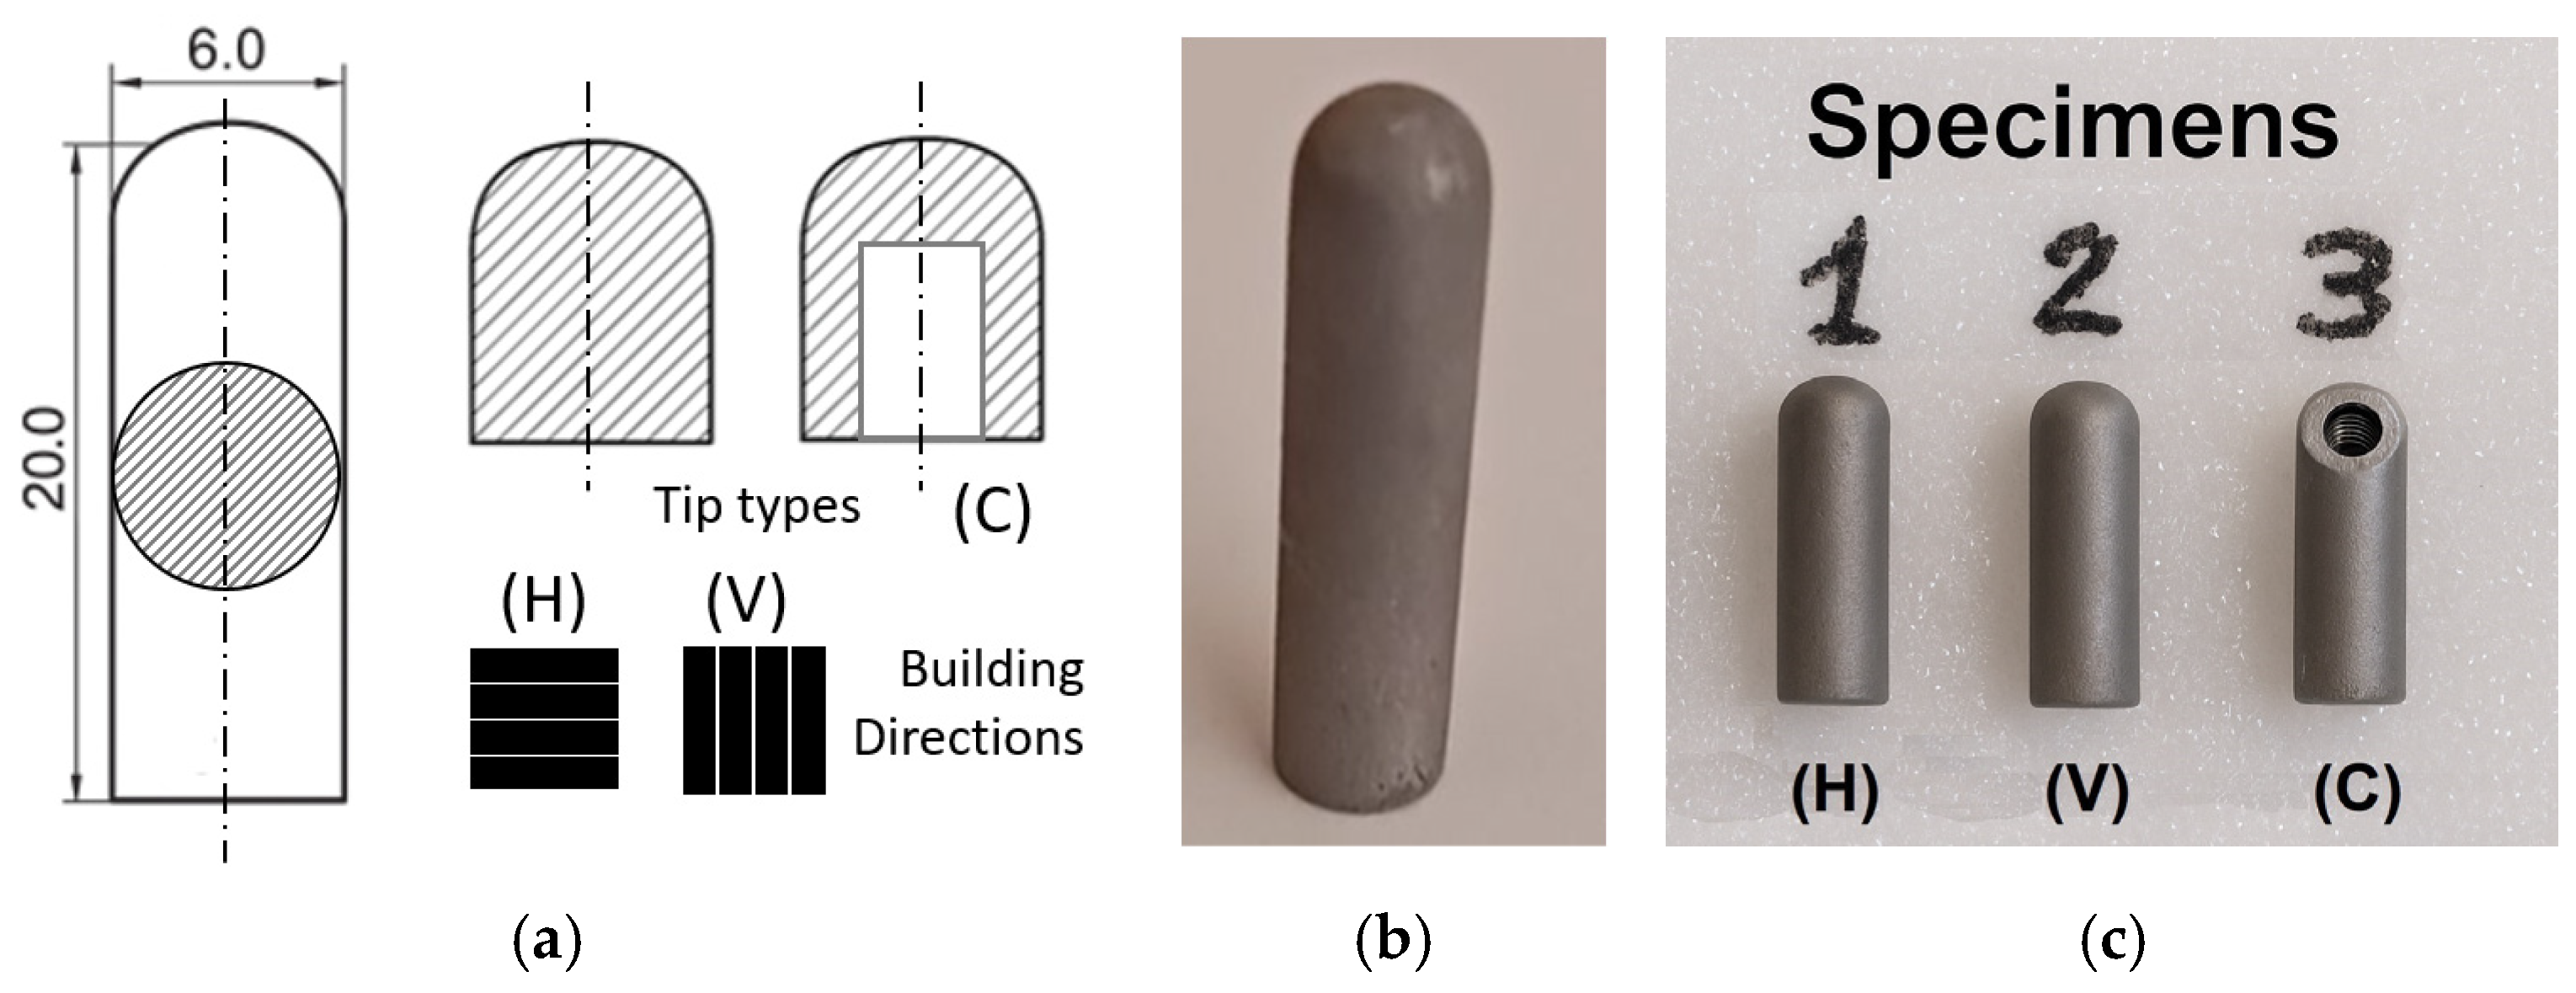
Cylindrical specimens with dimensions of 6 mm in diameter and 20 mm in length were designed to fit the requirements of the electrical contact resistance testing setup. Each specimen was printed as a solid body with a rounded top to facilitate uniform contact under applied force, as illustrated in Figure 2a. The figure also shows the set of three test samples (Figure 2c), fabricated with different build orientations and internal structures: specimen 1 (H) has an axis horizontal to the printing bed (also referred as Sample 1), specimen 2 (V) has an axis vertical to the printing bed (also referred as Sample 2), and specimen 3 (C) has a 3 mm internal cavity and horizontal axis.
Figure 2.
Cross-sectional views of the Al5086 cylindrical specimens used for contact resistance analysis. (a) Sizes and full-section cuts of the samples, highlighting the internal geometry. Plots (b) and (c) are actual 3D printed specimens with tested printing directions, where (H) is horizontal to sample axis, (V) is vertical and (C) is the sample with internal cavity. All samples have nominal dimensions of 20 mm in height and 6 mm in diameter.
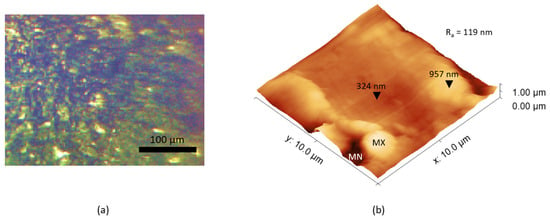
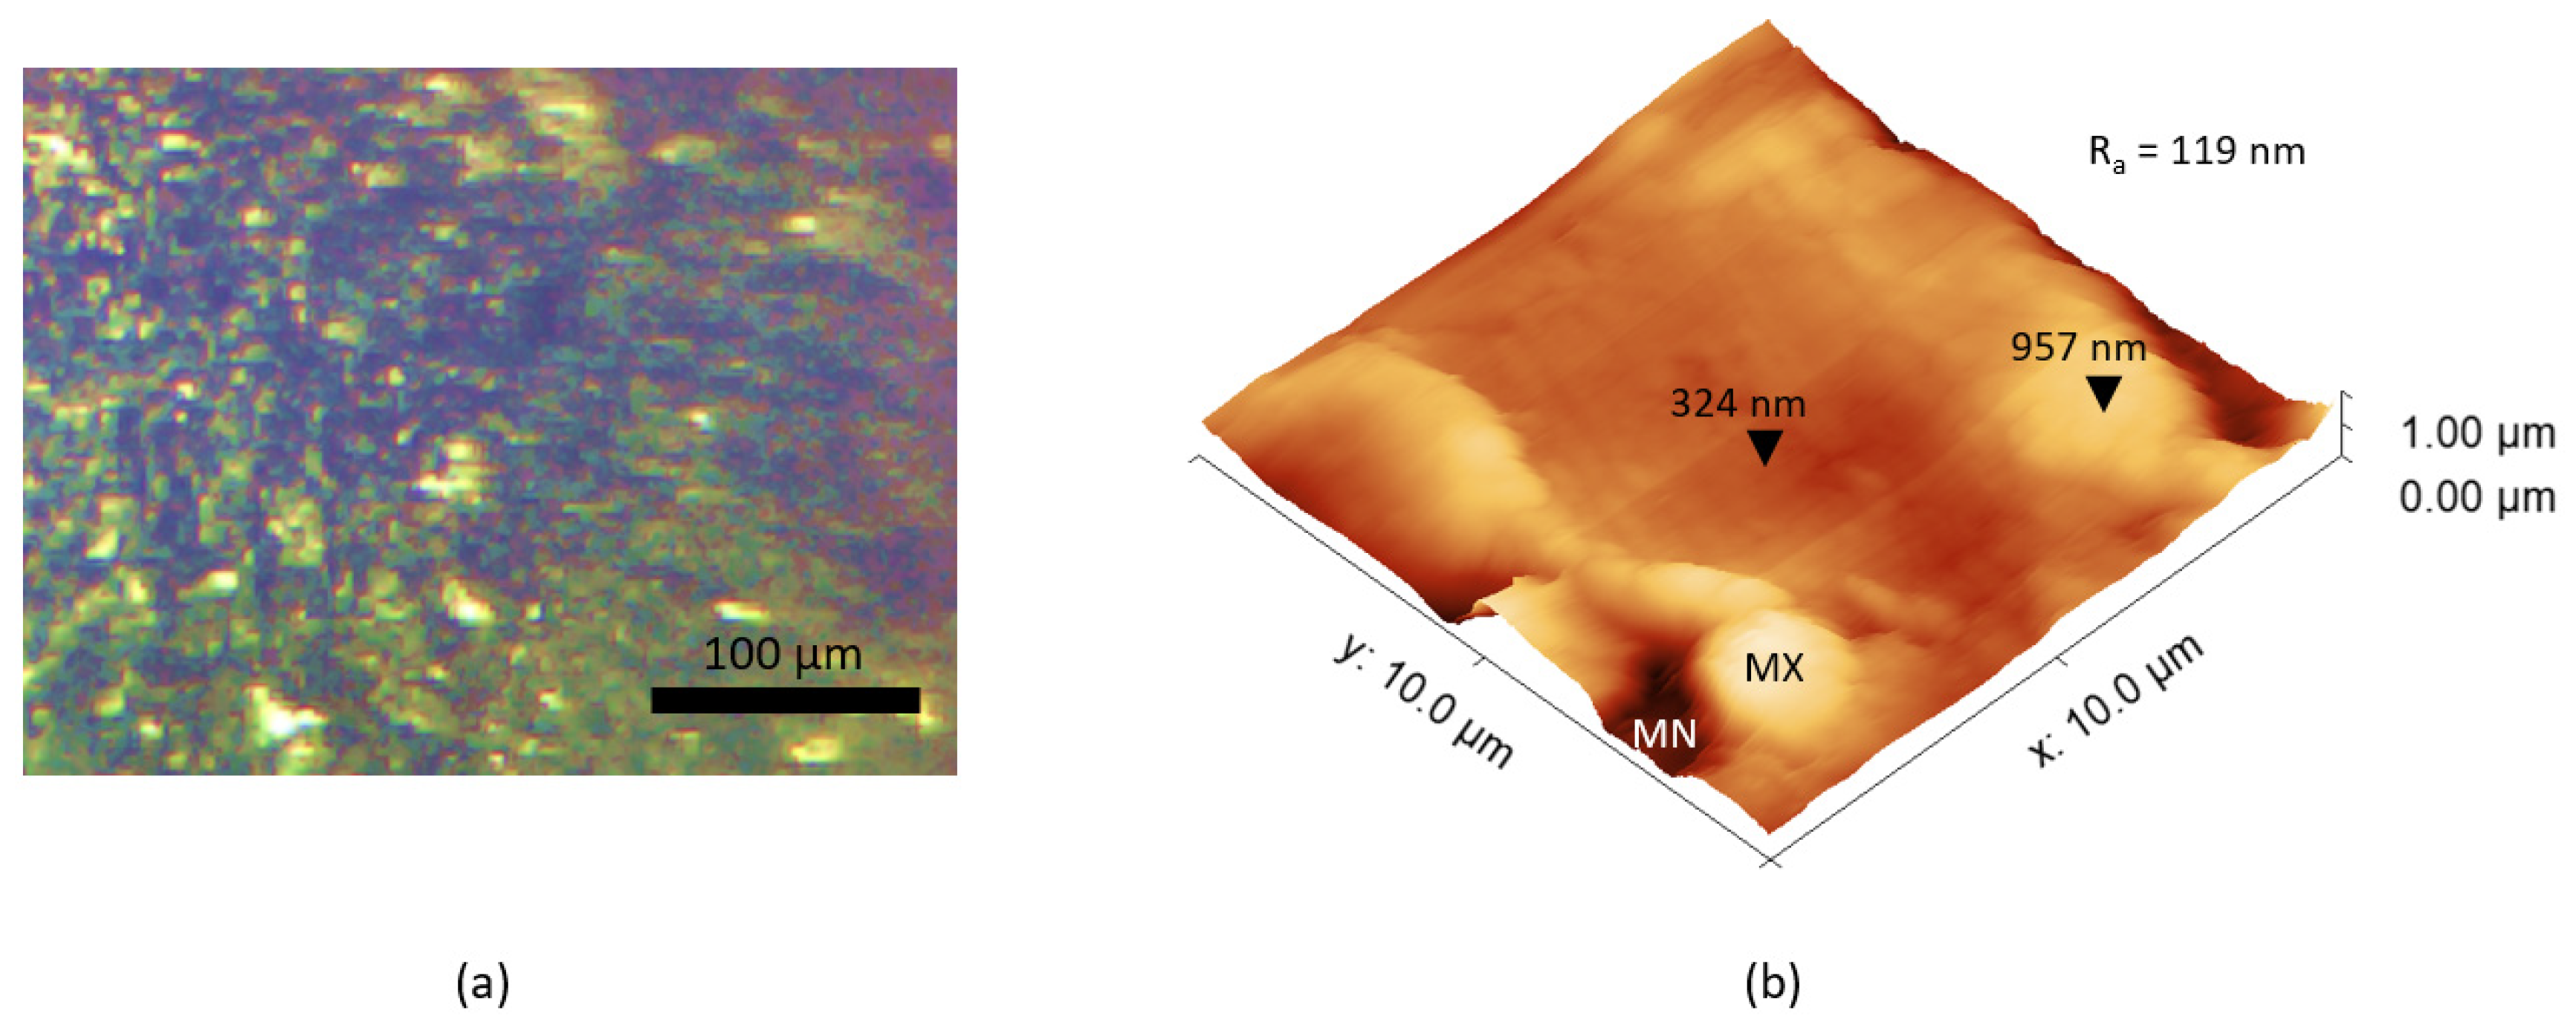
The surface roughness and height distribution were analyzed using atomic force microscopy (AFM). Atomic force microscopy (AFM) analysis was performed using a FlexAFM (Nanosurf, Switzerland). AFM observations were made in static force mode, scanning an area of 100 µm2 at a 512 × 512-line resolution, using a 0.2 N/m soft gold-plated sample cantilever (Stat0.2LAuD). Statistical surface micro-roughness estimations and AFM 3D visualization are presented in Figure 3b. The estimated micro-surface roughness, after blasting and polishing, was 119 ± 45 nm, but the observed surface waviness exceeded 4 μm. The optical magnification (×25) of the sample tip contact spot is shown in Figure 3a. No difference in surface roughness was observed before and after the contact force experiments.
Figure 3.
A 3D-printed specimen tip optical microscopy picture is depicted in (a), and the AFM micro-roughness topography is presented in (b).
3. Contact Resistance Modeling
According to the classical Holm theory [45], the actual contact surface S of the contact spot, depending on the contact force Fc, can be estimated using Equation (1):
where σc is the contact material’s compression strength.
The radius of the contact spot ra can be represented as a circle, S = πra2, and the contact spot radius can be derived from S, as expressed in Equation (2):
The total contact resistance of dry metal joints from the same interfacing material can be expressed as the sum of two main components—spot resistance, Rs, and tunneling resistance, Rt:
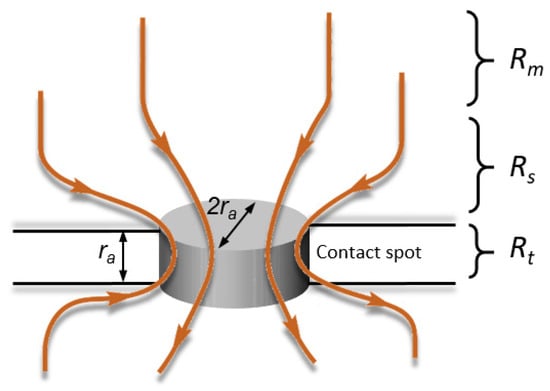
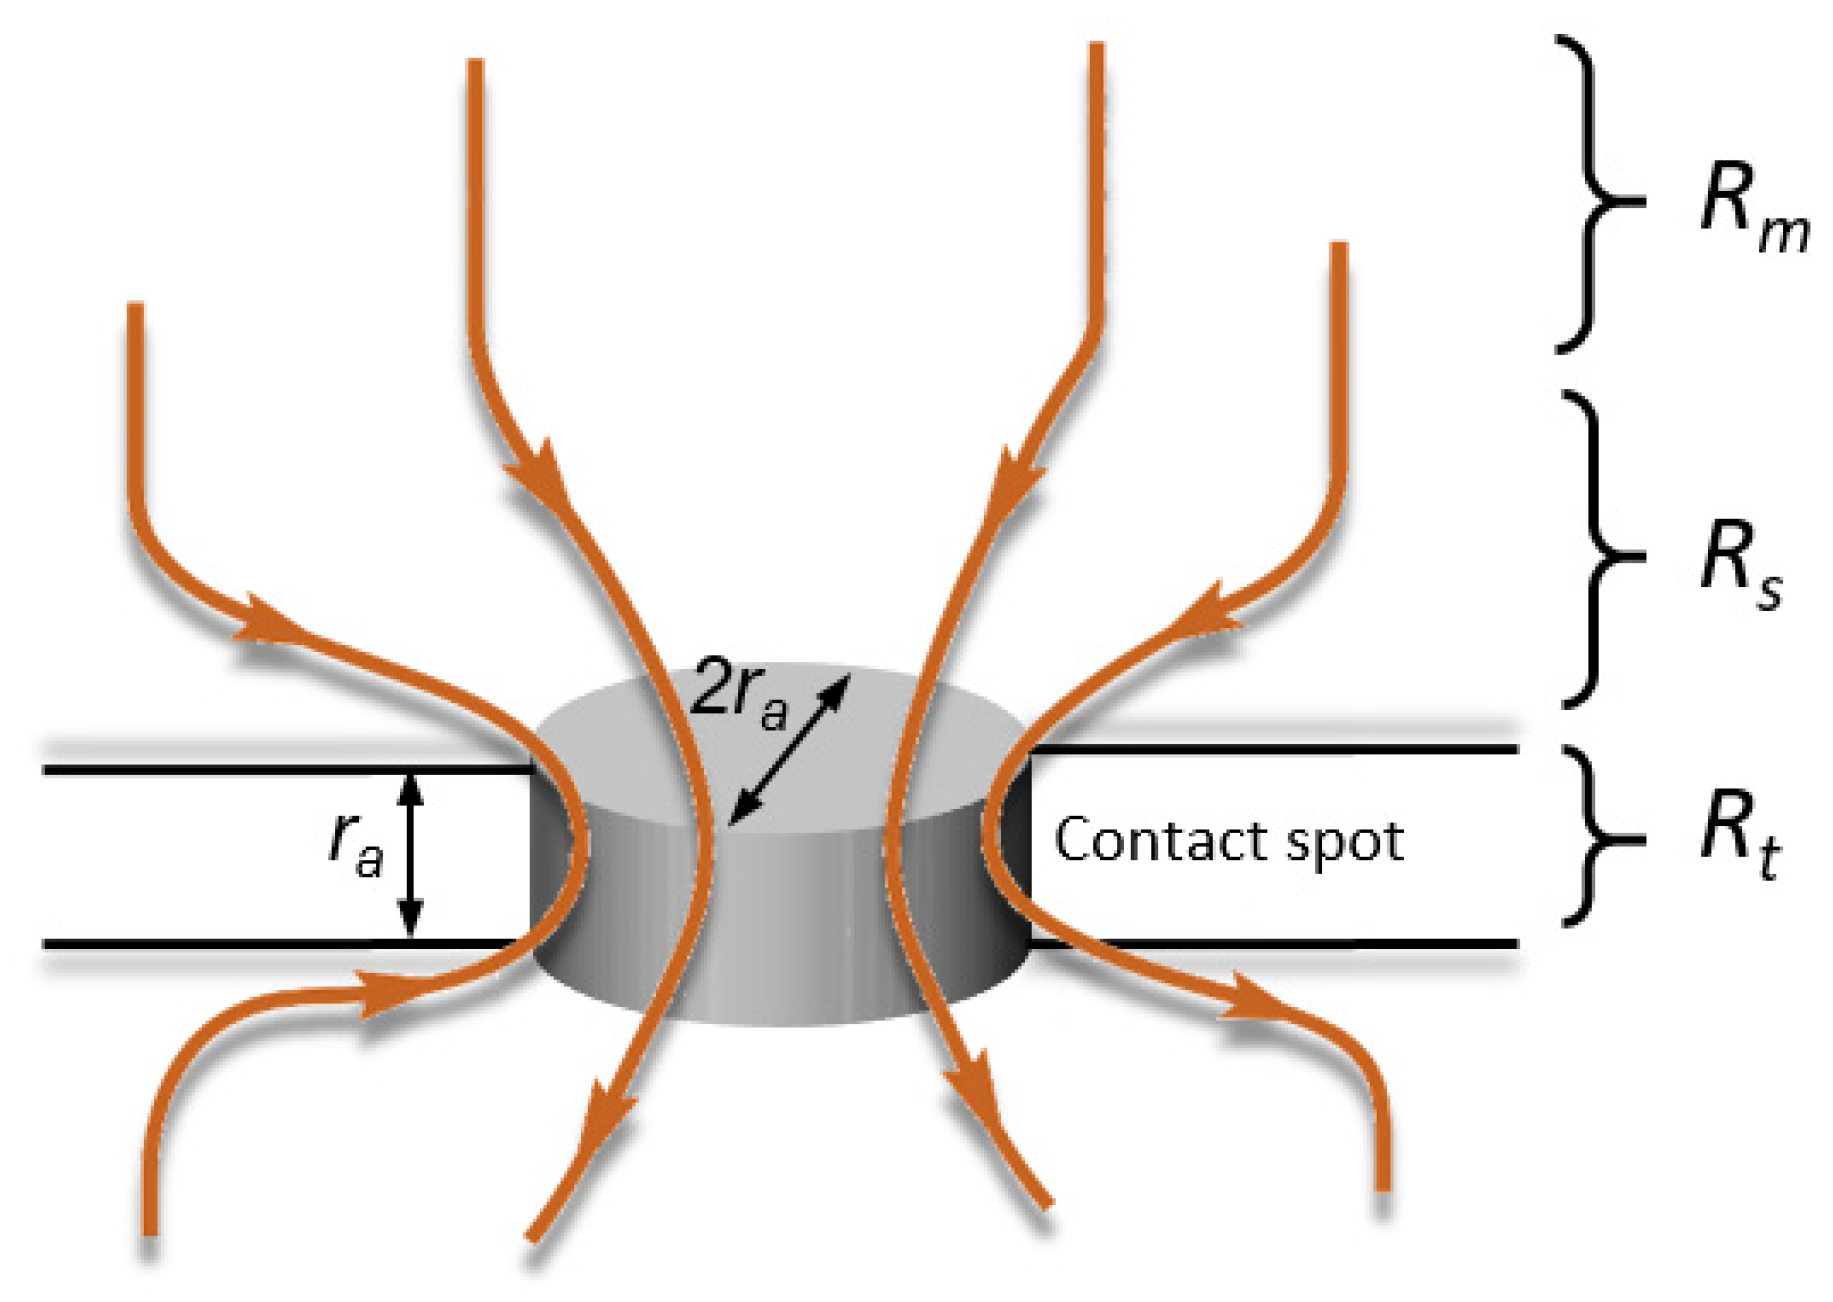
The representative regions of these resistances are presented in Figure 4, where the metal volumetric resistance Rm before the joint is also presented as an existing element.
Figure 4.
A microscopic representation of a contact spot with a radius of ra formed between two cylindrical surfaces under a compressive vertical load, as well as the corresponding domains of electric current redistribution with main resistive components Rm, Rs, and Rt.
The spot resistance Rs is represented here as a tick microscopic cylinder with radius ra; in this case, spot resistivity is expressed as
where ρ is the bulk metal resistivity (Ω·m).
Combining the expression for the contact spot radius ra obtained with the deformation expression given with (5), we provide the complete formulation of the spot resistance for a cylindrical contact spot:
The second component of the contact resistance is the tunneling resistance Rt, mainly influenced by surface properties such as coating barrier effects, e.g., oxidation. Aluminum naturally forms an oxidative coating with nm thickness, which can be mechanically removed. The tunneling resistance Rt is expressed as
where ρs is the surface specific resistivity (Ω/m2). The tunneling resistance term can be neglected for well-cleared metal surfaces.
The total contact resistance of the joint, expressed as a sum of the two main components, spot resistance Rs and tunneling resistance Rt, is as follows:
Equation (7) expresses the classical Holm model of contact resistance depending on the contact force [46]. The main factor in this model is the contact force, which affects resistance in the opposite way: increased force reduces it, making it the second main factor. Both components include the material electrical conductivity.
In addition to measuring electrical contact resistance, a key aspect of this study is analyzing the actual contact area formed between two identical 3D-printed aluminum specimens under mechanical load. The real contact zone, often much smaller than the apparent geometric surface, plays a critical role in determining the overall resistance at the interface. To visualize this effect, a simulated contact print method—comparable with placing an indigo paper between two surfaces—to capture the deformation-induced contact spot was used, with a 120 N compressive force applied.
Figure 4 shows that the effective contact area is highly localized, forming a central circular zone with a high-pressure concentration. This limited contact explains the significant influence of surface morphology, print orientation, and post-processing on the electrical behavior. The sharp contrast between the apparent surface area and the actual contact spot underscores the importance of accurate surface control and mechanical alignment in reducing electrical contact resistance in 3D-printed aluminum components [46,47,48].
Three-dimensional printing can slightly benefit some directions due to improved electrical conductivity in the main printing direction and the corresponding redistribution of current density lines.
As can be concluded from this section, the contact resistance is mainly affected by local deformation effects in the joint. The Holm model provides an integral representation of the contact resistance. Numerical modeling can provide a deeper understanding of mechanical surface effects and vice versa, to be used for inverse micro-property determination from the measurement results.
4. Stress–Strain Modeling
To gain a deeper insight into the mechanical response of the 3D-printed aluminum specimens under compressive loading, a detailed finite element analysis (FEA) was conducted. This numerical modeling was used to visualize the distribution of internal material stresses and deformation resulting from an externally applied contact force. The goal was to replicate the actual experimental conditions as closely as possible and to explore the influence of geometry and boundary conditions on stress concentration zones.
Mechanical stress and deformation are calculated sequentially using a system of equations that relate applied forces to reaction displacements. FEM is used for mechanical modeling. Nodal displacements (deformation), u, use the global stiffness matrix K over the applied force distribution F:
The displacements are calculated first, then the strain, and from strains, stresses are calculated using Hooke’s law for linear elastic materials.
The strain ε within each element is calculated by finding the spatial derivatives of the displacement field:
where B is the strain–displacement matrix, which contains the derivatives of the FE shape functions. Finally, the internal mechanical stress σ is calculated:
where σ is calculated from the strain using the material’s constitutive relationship (Hooke’s Law for linear elastic materials). The global stiffness matrix D, assembled from individual FE matrices based on defined material properties, including Young’s modulus, Poisson’s ratio, and sample geometry, is recreated by the FEM mesh. The material stiffness matrix, also called the constitutive matrix, defines the relationship between stress and strain based on properties such as Young’s modulus and Poisson’s ratio.
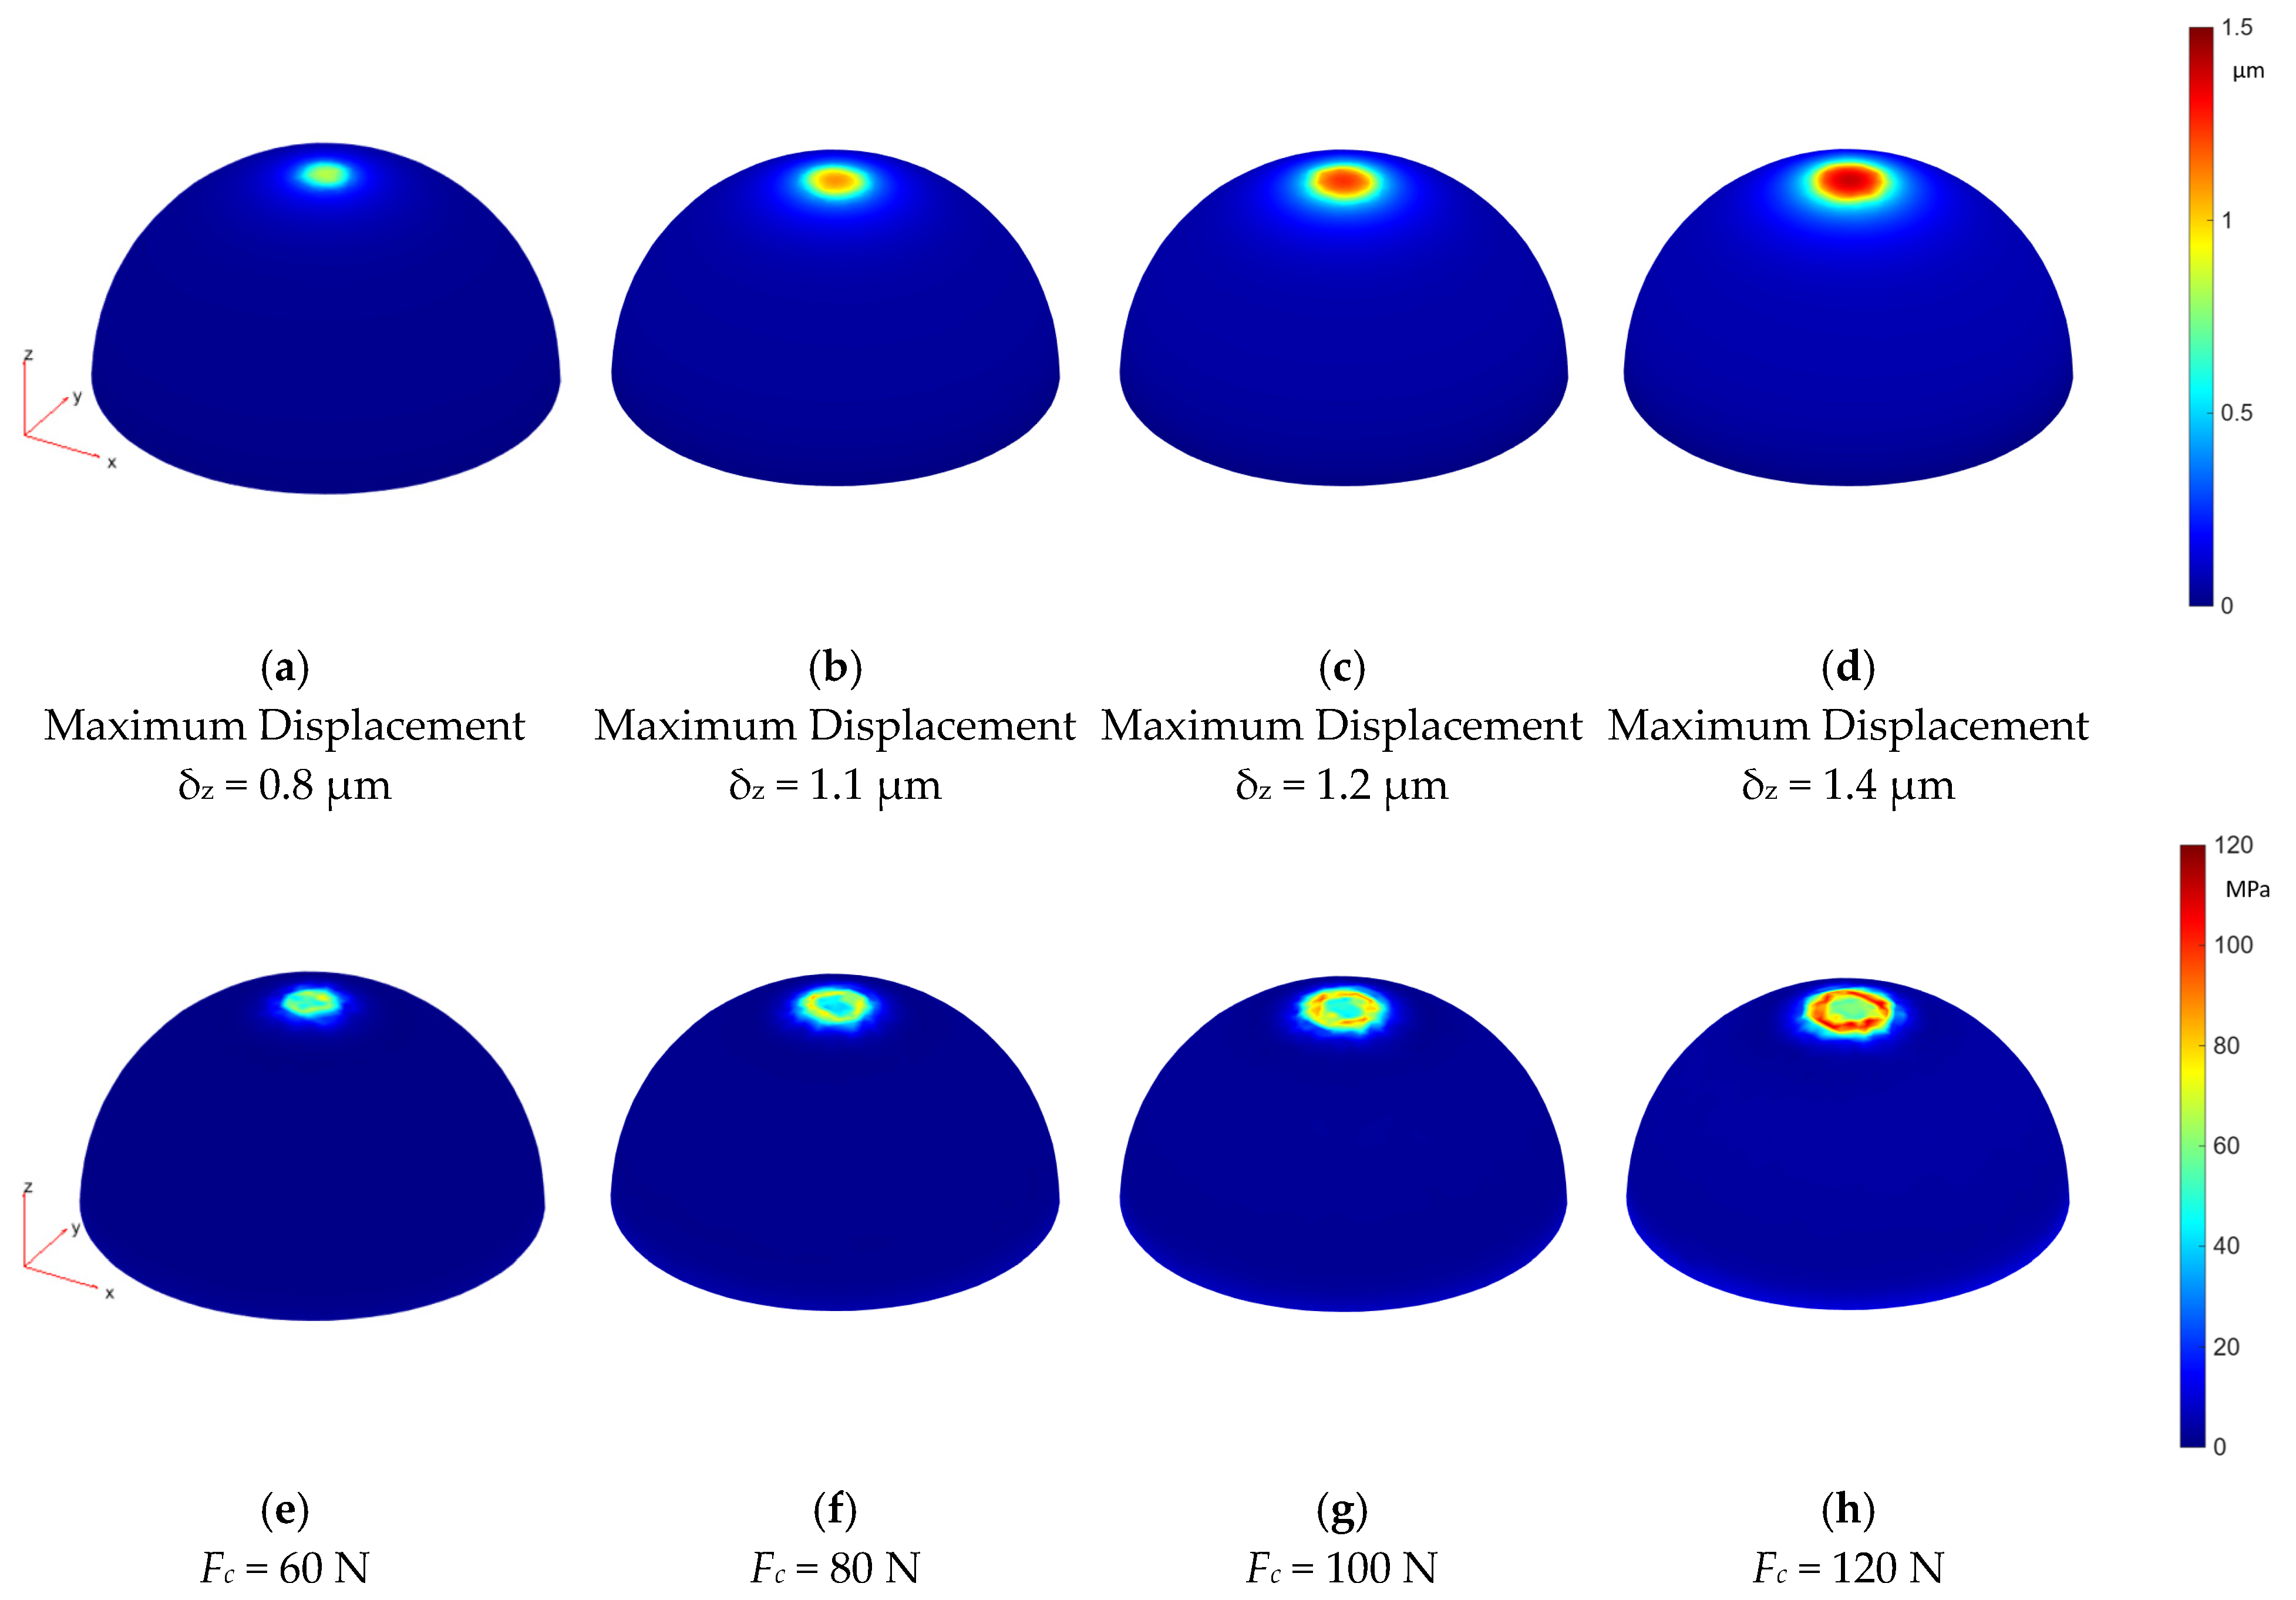
FEM modeling was implemented via the MATLAB (R2025b) PDE toolbox. The simulation model was based on the real geometry of the fabricated specimen, including a hemispherical top surface to reflect the manufacturing output of the L-PBF process. The lower base of the specimen was considered completely constrained in all directions, replicating the fixed conditions during testing. A downward axial compressive force of 60 to 120 N sweep was applied uniformly over the top curved surface to simulate contact with an opposing electrode as a loading element for Sample 1 (Figure 5).
Figure 5.
Finite element analysis of the stress and deformation distributions in an Al5086 aluminum Specimen 1 properties under vertical contact force. The normalized deformation from (a–d) and the von Mises stress from (e–h) are visualized using color mapping, with maximum concentrations in the loading zone near the top and a gradual decrease toward the fixed base.
The simulation employed linear elastic material behavior using mechanical properties for Al5086, including a Young modulus of 70 GPa and a Poisson ratio of 0.33 [49,50]. The resulting stress distribution provided insight into localized stress concentrations near the upper contact zone and offered valuable correlation with experimental observations. This approach complements physical testing by identifying regions of maximum mechanical demand and helps guide the interpretation of electrical contact resistance measurements.
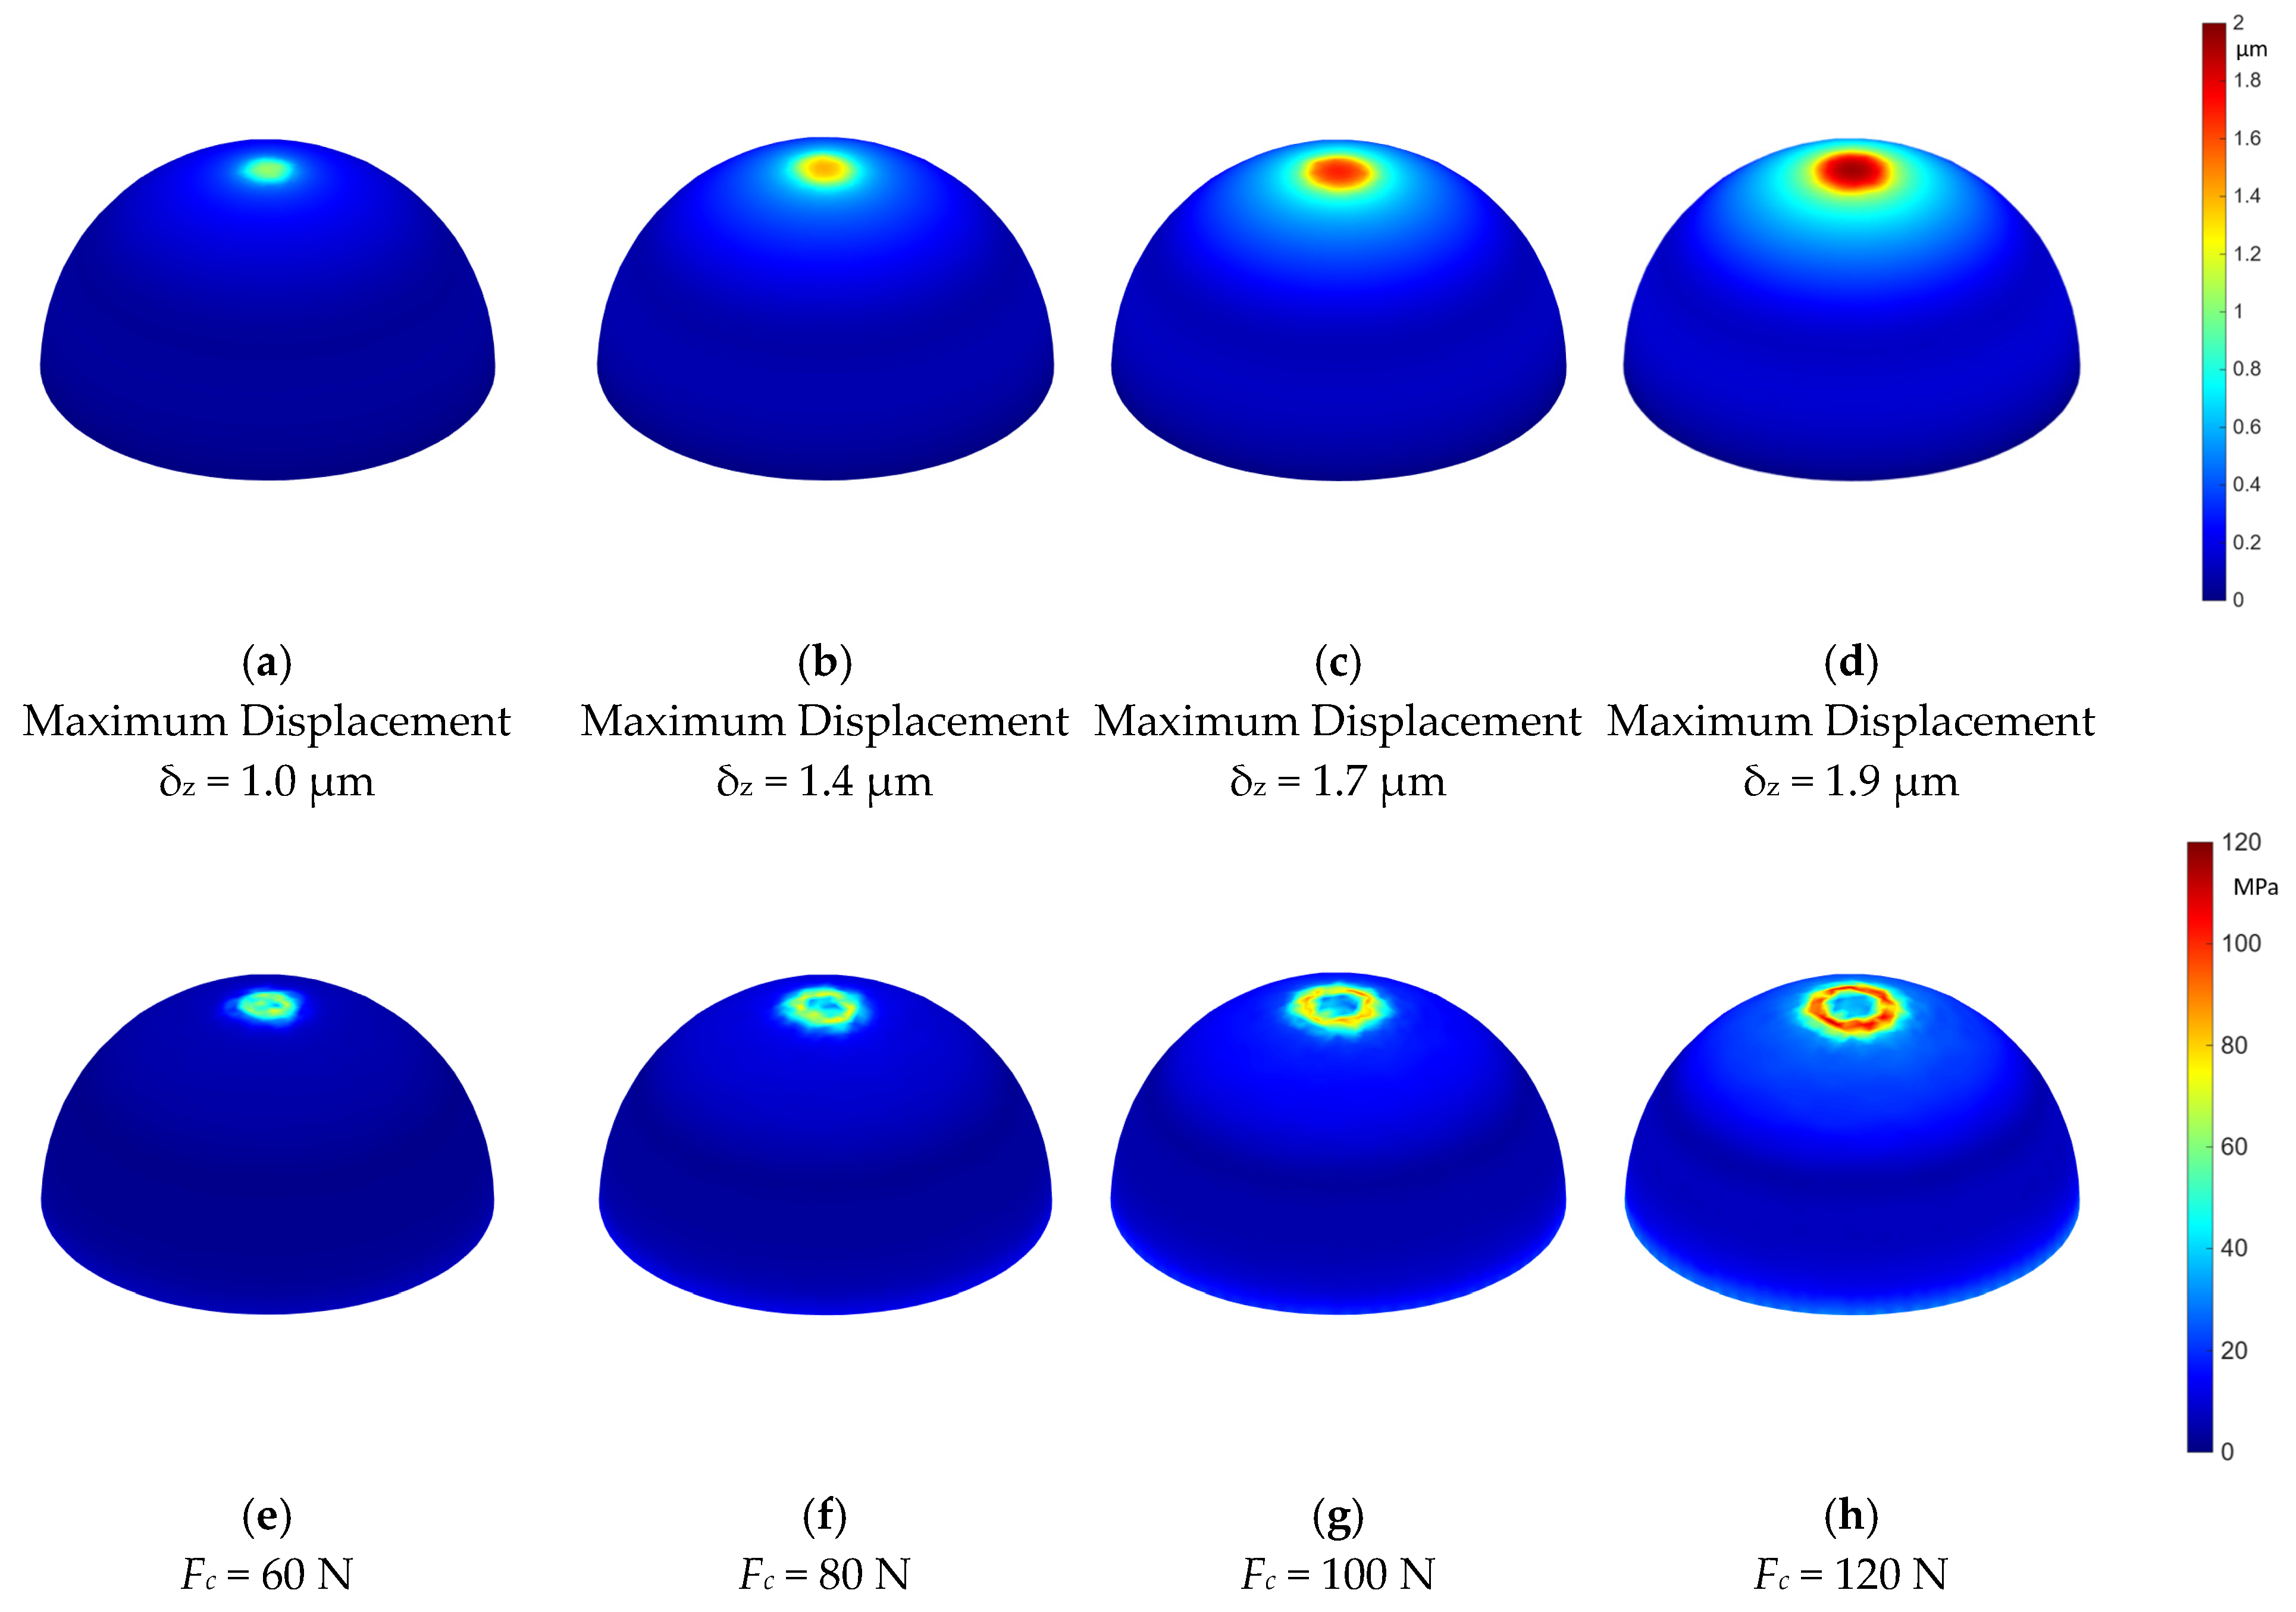
Results for stress and deformation distributions in an Al5086 aluminum specimen under vertical contact force for Specimen 3 properties are presented in Figure 6. Larger tip deformation is observed because of the internal cavity. This specimen design shows better vertical deformability (δz) from the applied contact force and can be used for future design optimization.
Figure 6.
Finite element analysis of stress and deformation distributions in an Al5086 aluminum specimen under vertical contact force for Specimen 3 properties.
The simulation results show that the highest stress is concentrated near the point of force application, as expected in compressive contact. The rest of the specimen experiences lower, more evenly distributed stress, confirming the axial load transfer across the body. These findings correlate with experimental measurements, which show minor deformation under high-load conditions. Such numerical modeling provides additional insight into how geometry and boundary conditions influence the stress distribution, and it reinforces the relevance of mechanical alignment in experimental setups for electrical contact resistance testing. Modeling is used to determine inverse material properties.
5. Contact Resistance Testing
Two distinct build orientations were employed to study their influence on electrical contact resistance behavior: a horizontal orientation, in which layers were stacked perpendicular to the axis of the cylinder, and a vertical orientation, with layers aligned along the axis. Additionally, specimens were printed using either full-density (solid) infill or with an internal cylindrical cavity design (Sample 3). Post-processing included sandblasting to improve surface uniformity and thermal annealing to relieve residual stresses. Annealing was carried out in accordance with published recommendations for Al5086: heating to approximately 350 °C and then controlled cooling to stabilize the microstructure [22].
The electrical contact resistance of each sample was measured using a custom-built test rig. This setup consisted of two flat copper electrodes and a mechanical holder that ensured consistent pressure and alignment between the sample and the electrodes. A precision digital micro-ohmmeter with micro-ohm resolution was used to perform the measurements. Each sample was tested three times to ensure repeatability, with ambient temperature maintained at 22 ± 1 °C. Prior to each measurement, the contact surfaces were cleaned using isopropyl alcohol to eliminate contaminants that could affect resistance readings.
To ensure accurate and repeatable evaluation of electrical contact resistance, a dedicated test fixture was developed and employed in this study. The fixture was designed to simulate real-world conditions of mechanical pressure and electrical contact while minimizing measurement noise and parasitic resistance.
Each cylindrical aluminum specimen was positioned vertically between two flat, highly conductive copper electrodes with polished contact surfaces. A calibrated mechanical system applied uniform axial pressure on the sample using a spring-loaded clamping mechanism. This configuration ensured consistent and repeatable contact force across all measurements. Contact pressure was selected based on common industrial contact ratings and remained constant throughout the tests to isolate the influence of the printing parameters.
Electrical current was supplied through the outer terminals of the fixture, while voltage drop was measured across the contact interfaces using a four-wire (Kelvin) configuration. This arrangement enabled accurate resistance determination by eliminating the effects of lead and wire resistance in the measurement loop.
To relate the measured contact resistance to the applied normal force, Holm’s model was used, which describes the inverse relationship between contact resistance and contact force as follows:
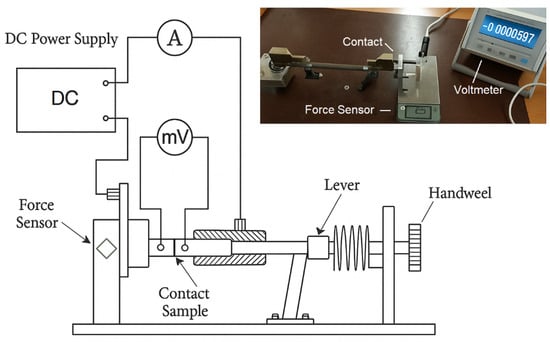
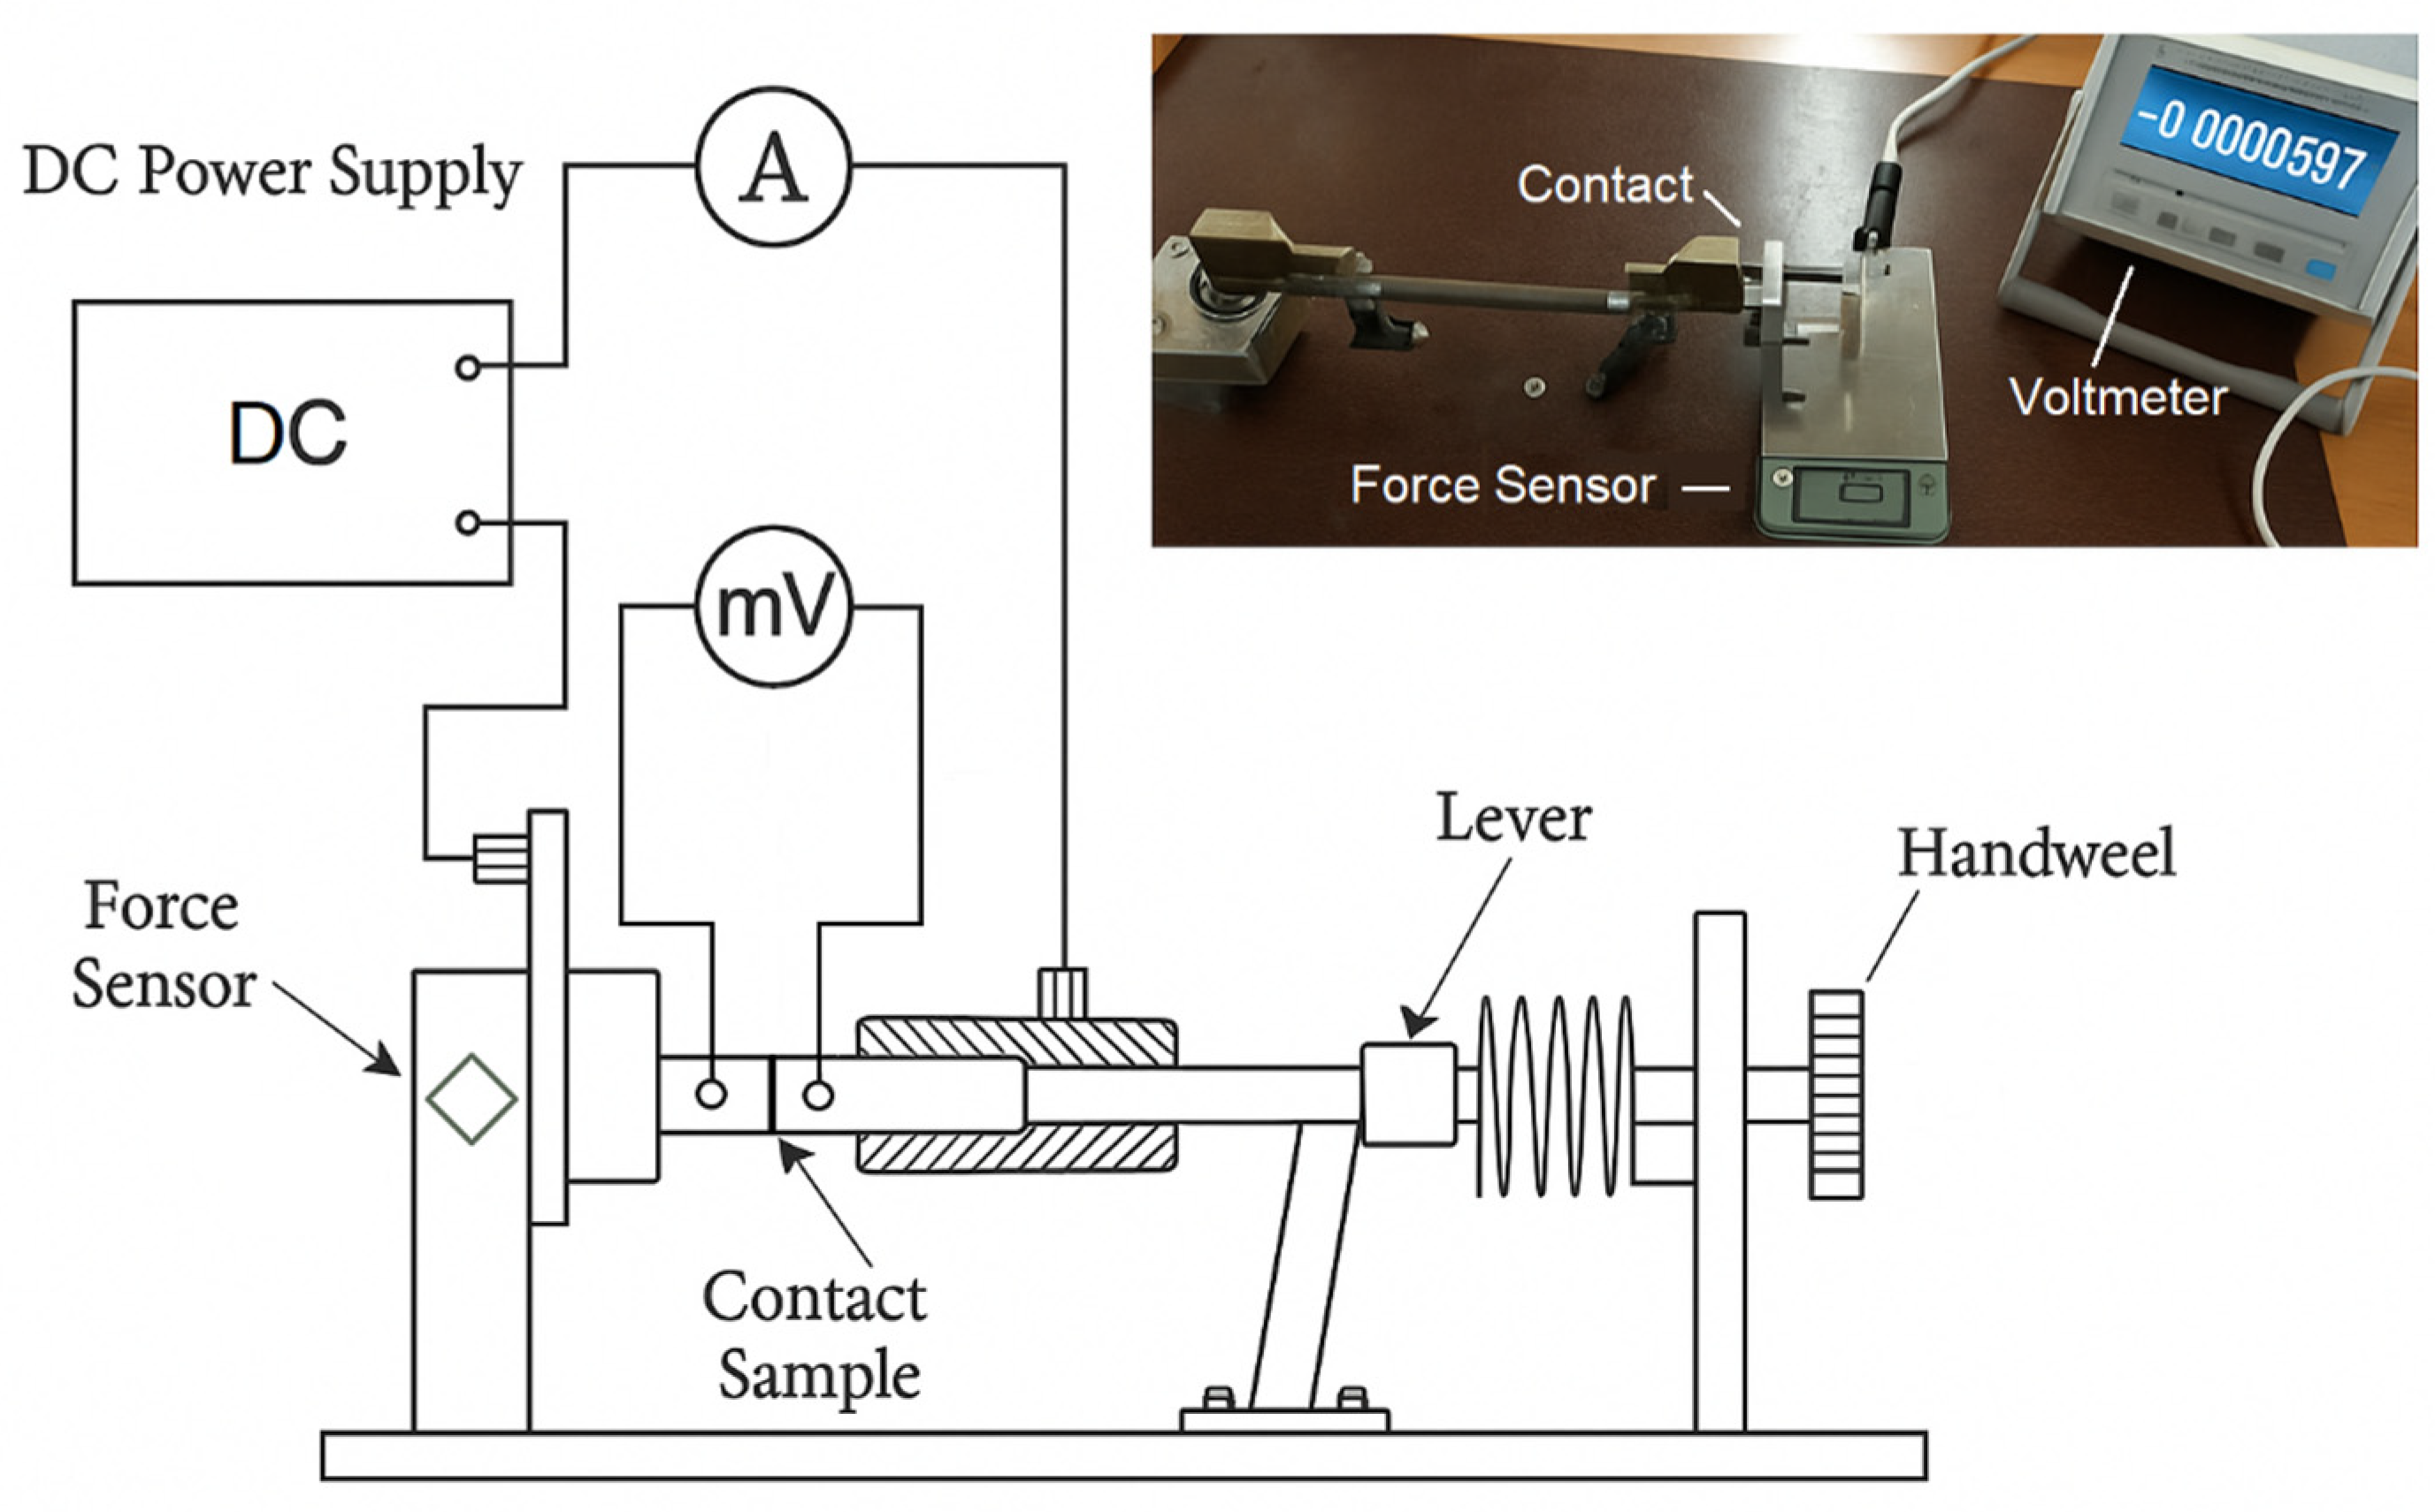
A schematic diagram of the test setup is presented in Figure 7. It illustrates the position of the aluminum test specimens, the upper and lower electrodes, the force application leaver, and the electric terminals used for current and voltage sensing.
Figure 7.
The experimental setup used to measure electrical contact resistance via the four-wire method under controlled contact force.
To enable a detailed evaluation of electrical contact resistance in 3D-printed aluminum components, particularly those fabricated using L-PBF, a specialized, precisely engineered test fixture was used. This fixture was tailored specifically to accommodate the unique geometries and material properties of the additively manufactured samples, ensuring both mechanical stability and measurement precision throughout the testing process. The experimental configuration was based on the well-established four-wire (Kelvin) method, which is widely recognized for its accuracy in low-resistance measurements. By separating the current supply and voltage sensing paths, this method effectively eliminates the contribution of lead and wire resistance from the measurement loop. As a result, the voltage drop recorded across the contact interface reflects only the actual resistance of the contact region.
This measurement setup provided high sensitivity and excellent repeatability, which are crucial for investigating subtle variations in contact behavior. It enabled precise monitoring of how the microstructural orientation, surface finish, and other features inherent to the L-PBF process affect contact resistance under different loading conditions. The complete mechanical and electrical design of the test system, including fixture components, terminal arrangements, and force application mechanisms, is presented in Figure 7.
The experimental setup used for measuring electrical contact resistance is shown in Figure 7. The mechanical structure included a spring-loaded lever that applied a controlled vertical force to the aluminum test specimen, which was positioned between two copper electrodes. The applied force was measured using a strain gauge-based force sensor mounted beneath the sample. The electrical circuit consisted of a DC power supply, an ammeter for injecting current into the sample, and a millivoltmeter to accurately measure the voltage drop across the contact interface. This combined system enables repeatable and precise measurements under variable mechanical loading conditions and is essential for evaluating the influence of 3D printing parameters—such as build orientation surface and internal structure—on electrical contact behavior [45,46,47,48].
Parametric modeling was used to determine inverse material properties by the experimental data measured, as detailed in the next section.
6. Results and Parameter Identification
This section first presents the experimental results obtained from measurements of electrical contact resistance between 3D-printed aluminum specimens under varying normal forces. The force was applied cyclically—increasing from 56 to 120 N, followed by a gradual decrease back to 56 N. The resistance values were recorded for five distinct specimens fabricated under different printing conditions, as outlined in the previous sections.
Table 1 summarizes the measured contact resistance Rc for each specimen during the loading phase. As the contact force increased from 56 to 120 N, all specimens exhibited a decreasing trend in contact resistance, consistent with classical contact mechanics theory. This behavior reflects the growth of the real contact area S due to elastic and plastic deformation at the interface.
The data clearly show that Sample 1 consistently yielded the lower resistance values, indicating a well-formed contact surface and favorable mechanical integrity. Conversely, Sample 3, which was printed with a special internal cavity, exhibited the lowest contact resistance throughout the loading cycle.
After reaching the maximum applied force of 120 N, the loading was reversed while continuing to monitor the contact resistance.
Notably, the unloading results reveal slightly higher resistance values at corresponding force levels compared with the loading phase, particularly at lower forces. This behavior is attributed to minor plastic deformation and residual changes at the contact interface, leading to hysteresis. The difference between loading and unloading curves was most pronounced in Sample 3, once again highlighting its structural inconsistency.
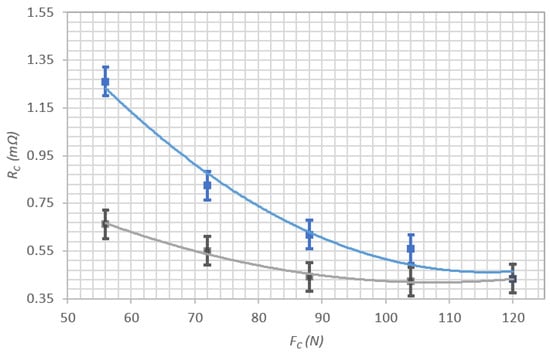
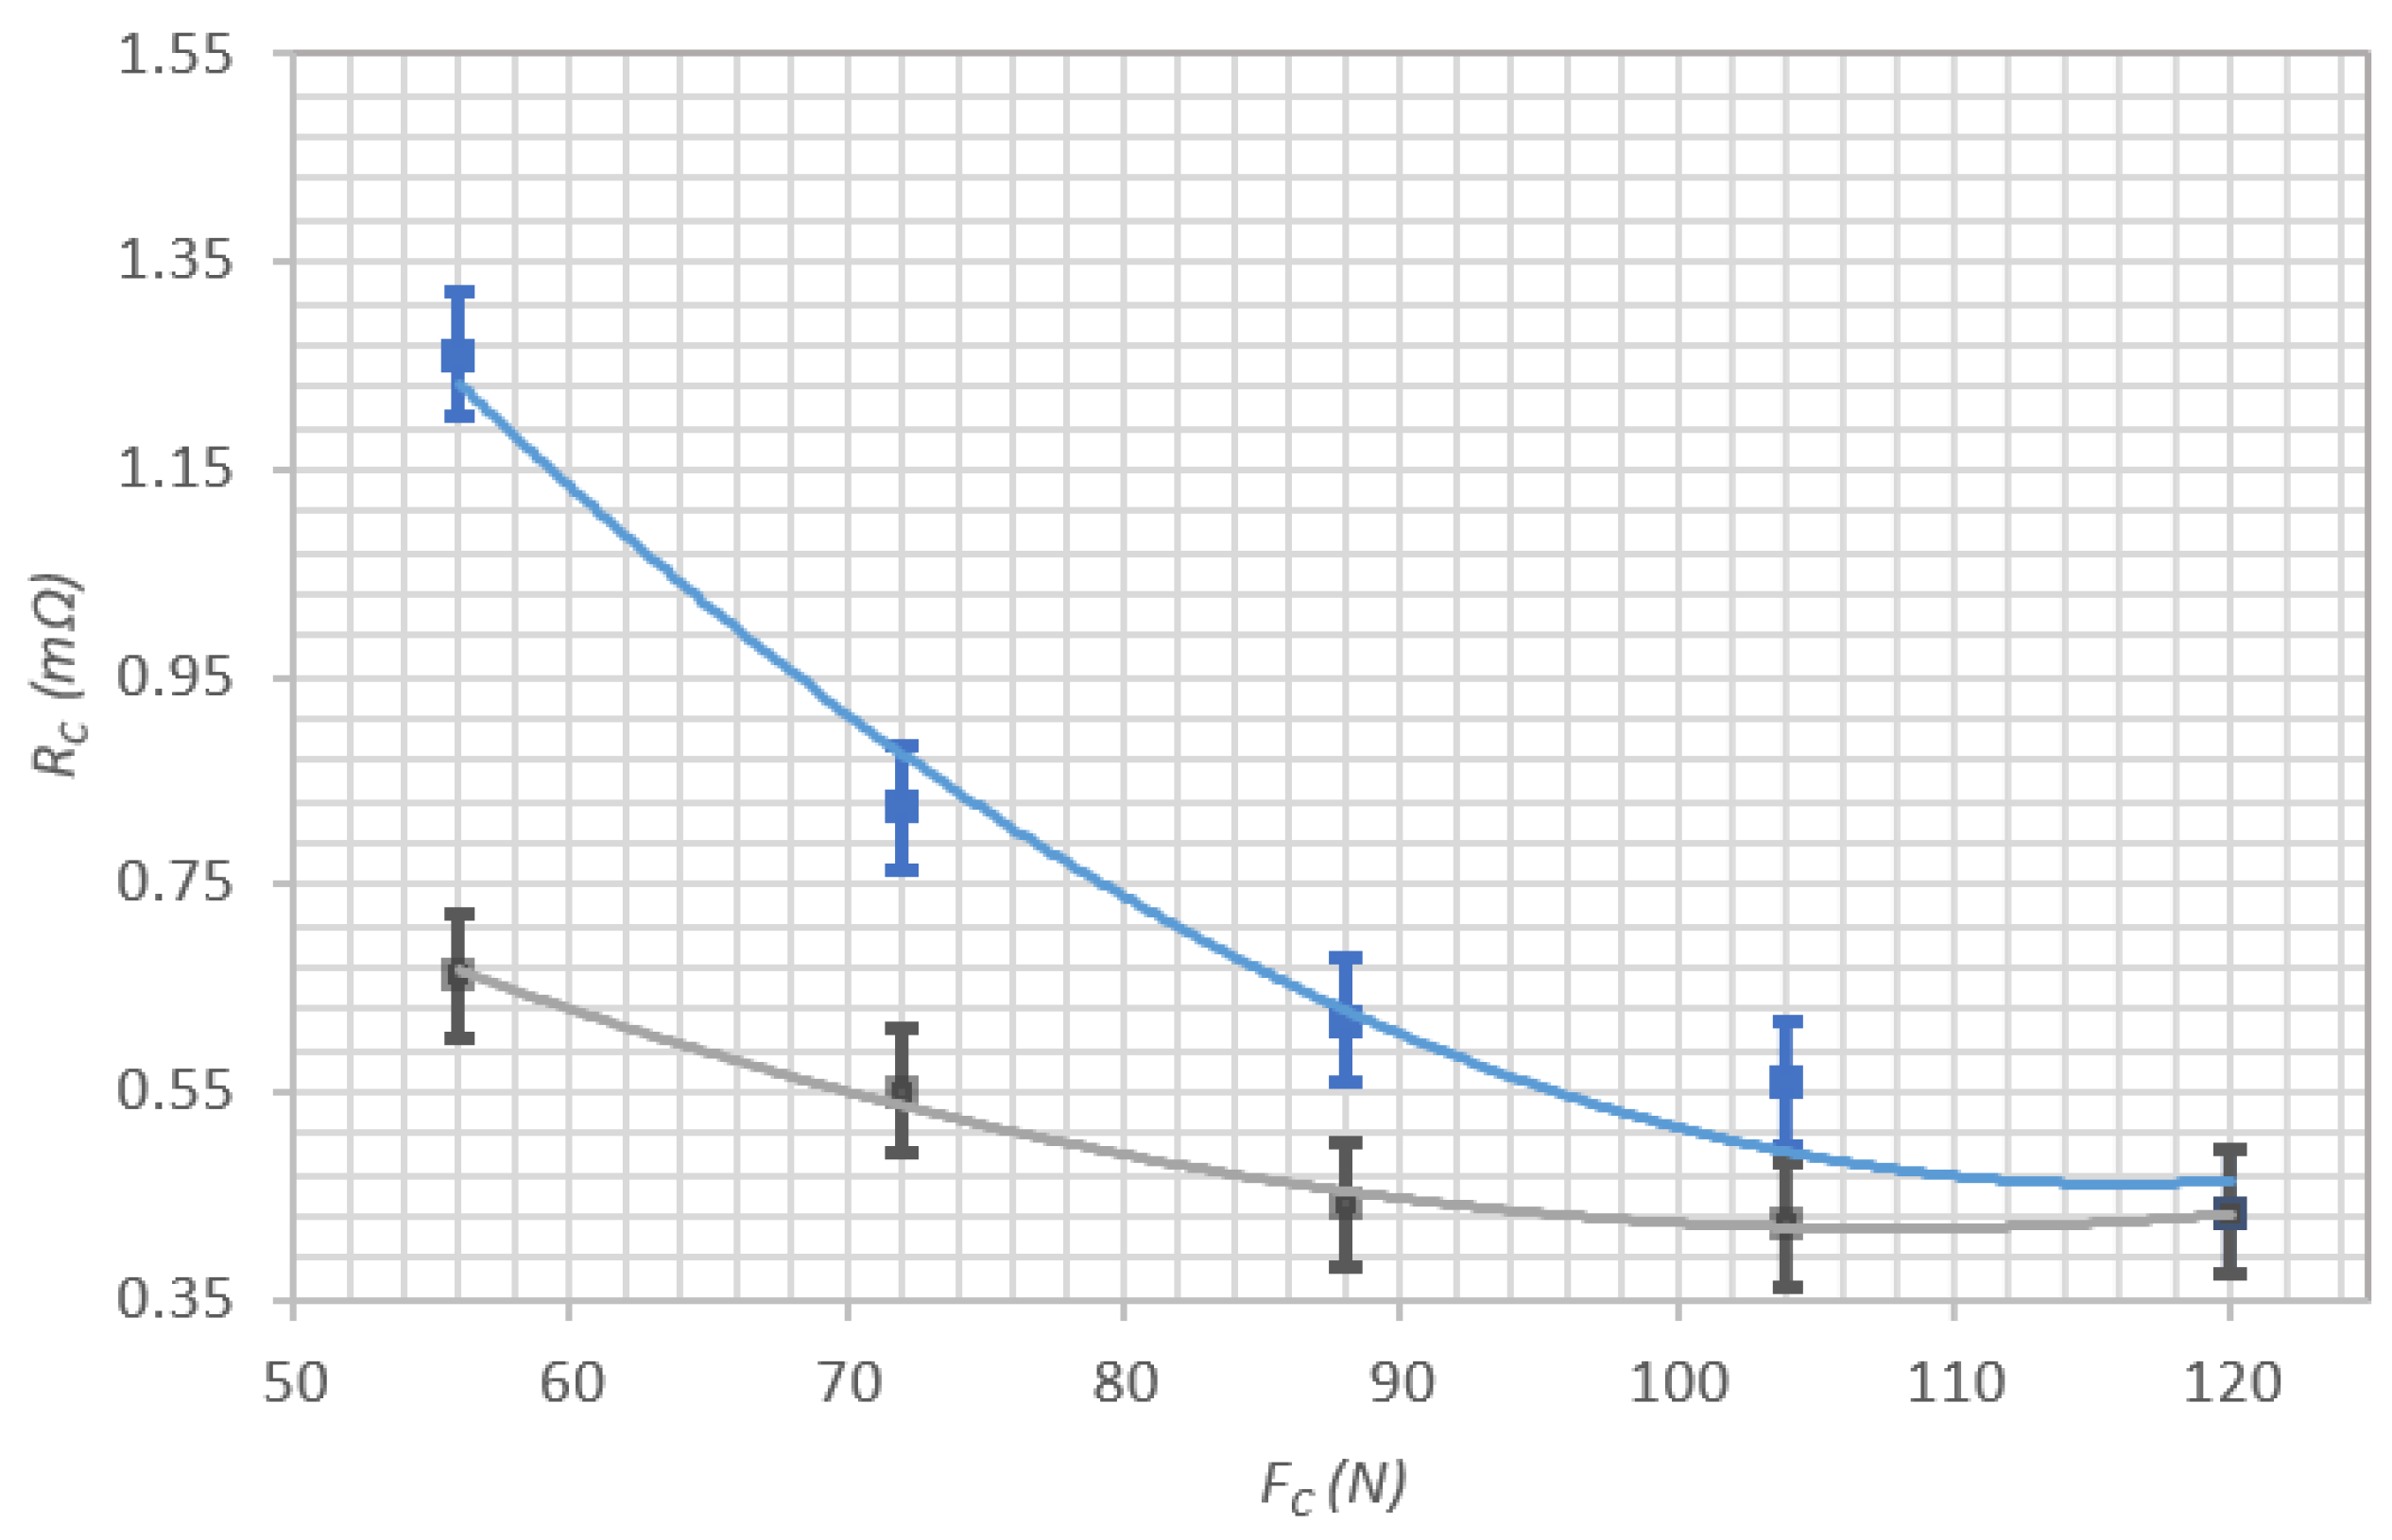
The electrical contact resistance of Sample 1 was analyzed in both loading and unloading cycles (Figure 8). This specimen was manufactured with a horizontal-to-axis building orientation, providing a baseline for comparison with other samples. The measurements revealed highly stable behavior with minimal deviation between force cycles. During the loading cycle, the contact resistance decreased from approximately 1.261 mΩ at 56 N to 0.433 mΩ at 120 N, showing a smooth, continuous decrease consistent with improved real contact area formation. Upon unloading, the resistance values remained nearly identical to those during loading, indicating low hysteresis and good mechanical recovery at the interface.
Figure 8.
Contact resistance Rc as a function of applied normal force Fc for Sample 1 (horizontal building direction). The graph includes experimental measurements during loading (blue) and unloading (gray), along with model approximations for both trends.
This behavior suggests that Sample 1 has a well-formed surface and a dense internal structure, which enables consistent electrical performance under repeated loading. The low deviation between the loading and unloading curves highlights the favorable mechanical compliance and confirms the reliability of this specimen design for applications requiring durable contact elements. Aluminum naturally forms an oxidation coating with a “nm” thickness, which can be mechanically removed.
The relatively wide gap between the two cycles reveals moderate hysteresis, indicating less stable contact formation. These results highlight how even specimens with the same nominal infill strategy can differ significantly depending on microstructural consistency and surface finish.
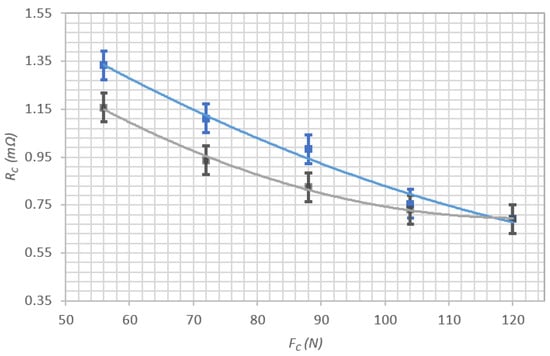
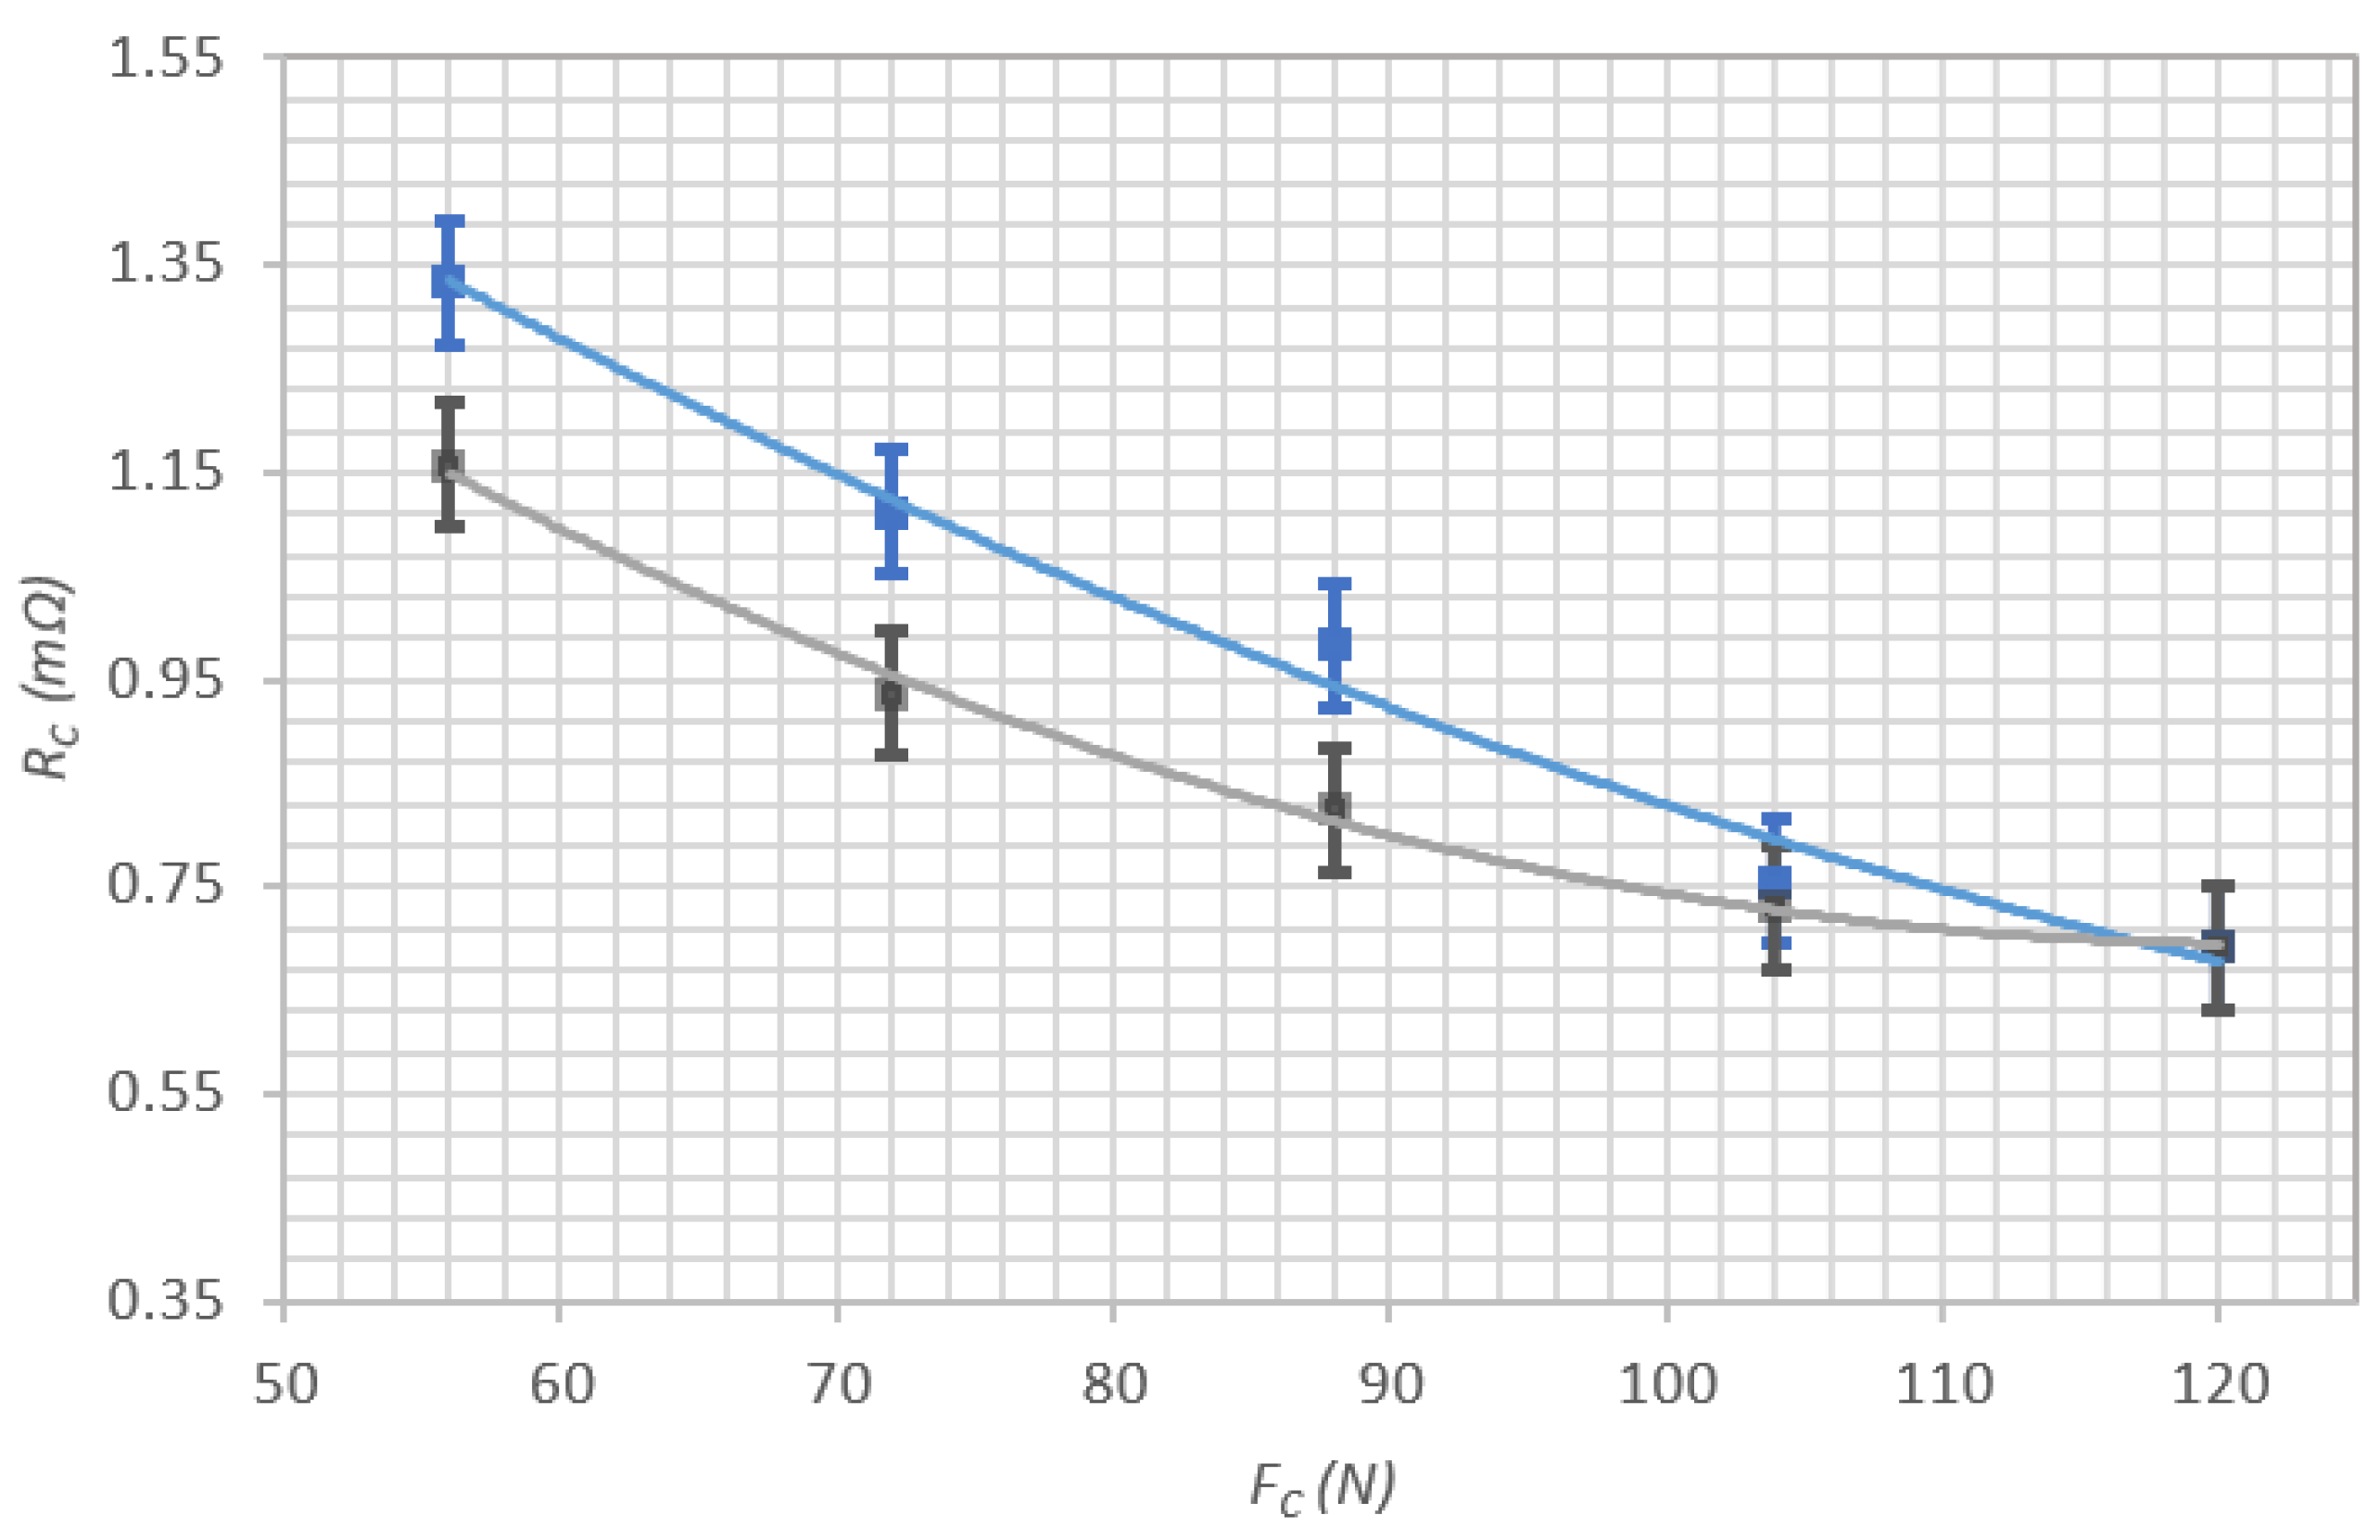
Sample 2 (Figure 9) was produced using a vertical printing orientation. As expected, this sample displayed the highest overall contact resistance among all tested specimens.
Figure 9.
Contact resistance Rc versus applied normal force Fc for Sample 2 (vertical building direction). The graph includes experimental measurements during loading (blue) and unloading (gray), along with model approximations for both trends.
The initial resistance at 56 N was as high as 1.334 mΩ, and although it decreased under increasing force, it remained elevated across all force levels compared with other samples. Notably, the unloading curve remains close to the loading path, with slightly higher resistance values, indicating limited plastic adaptation of the contact interface. This suggests that the internal structural imperfection led to poor conformity and reduced real contact area throughout the cycle.
These results strongly underline the influence of internal geometry on electrical behavior, even when using the same material and similar external dimensions. Sample 3 exemplifies the performance degradation associated with the printing conditions or quality control during additive manufacturing.
Compared with Sample 1, Sample 2 results demonstrate improved stability and slightly lower resistance, indicating that vertical orientation alone does not inherently degrade contact performance. However, the resistance remains higher than that of horizontally printed specimens, reflecting the anisotropic mechanical and electrical characteristics induced by the build direction.
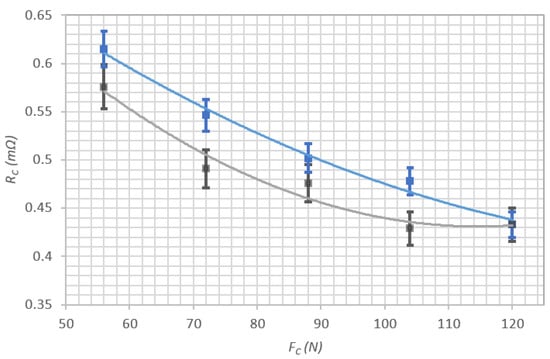
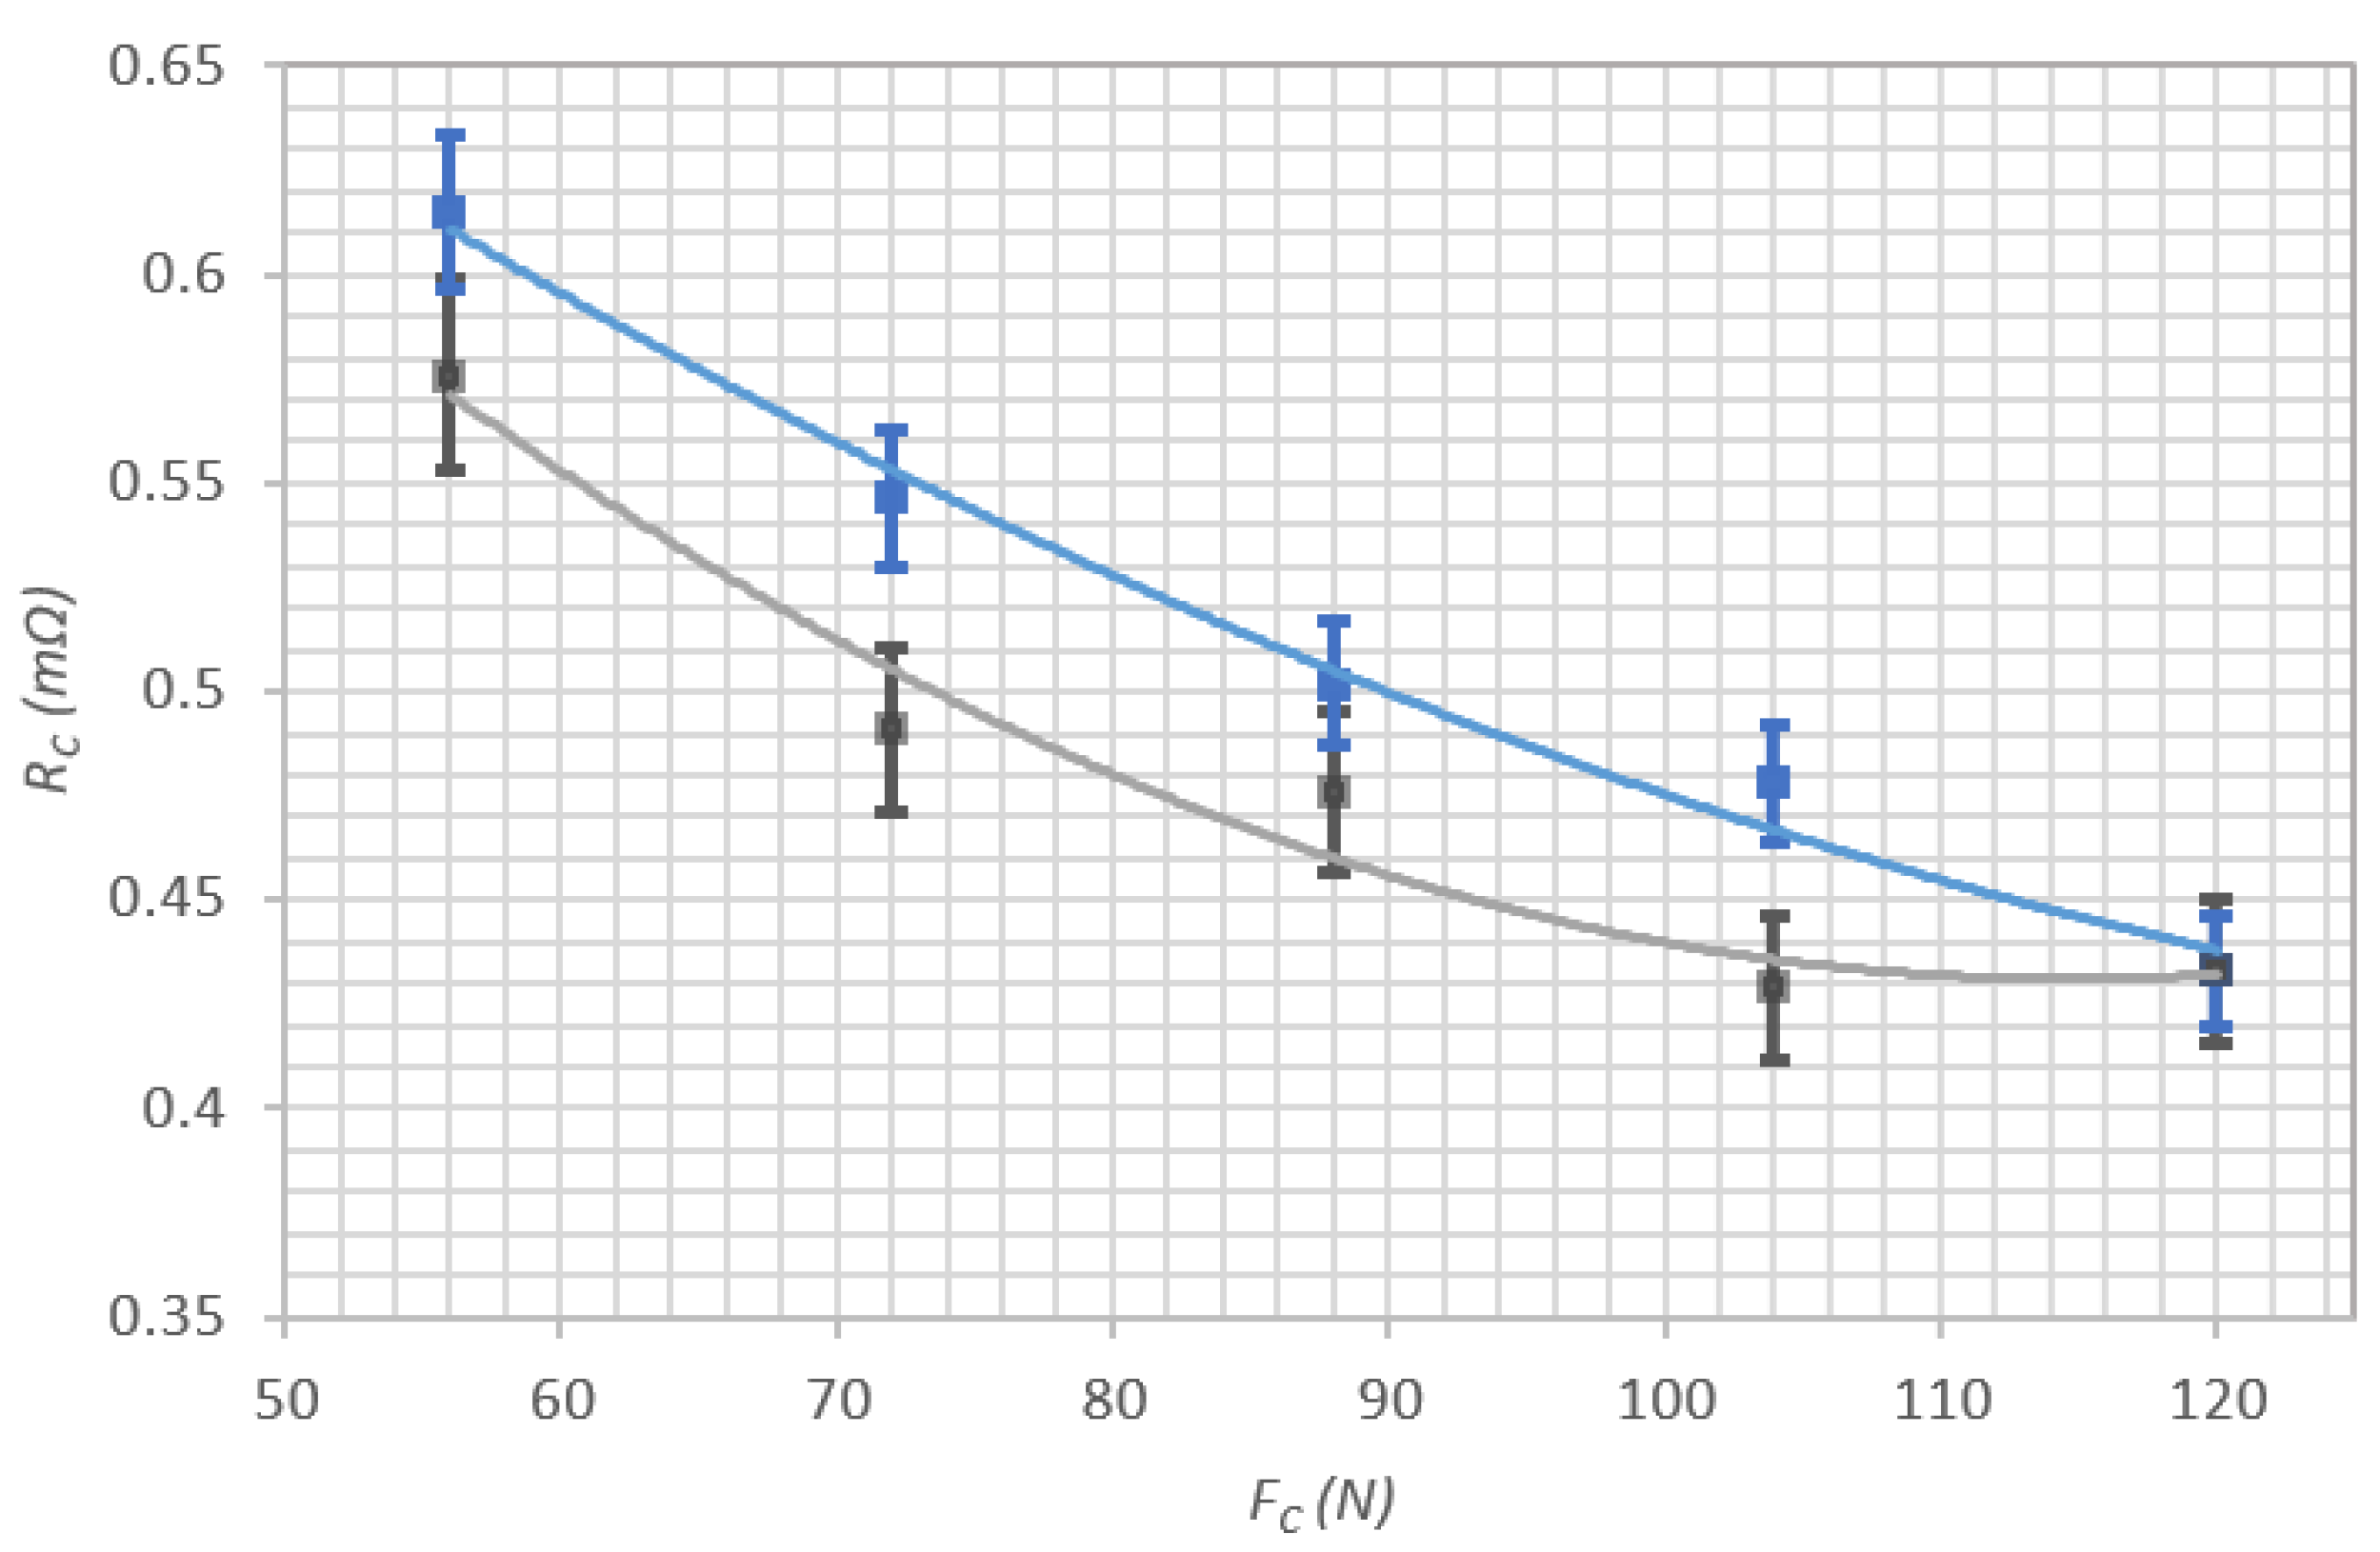
Sample 3 (Figure 10) is a special sample fabricated with a vertical building direction, similar to Sample 2. Its performance serves as a reference point for evaluating the consistency of vertically printed components.
Figure 10.
Contact resistance Rc as a function of normal force Fc for Sample 3 (vertical printing direction with internal cavity). The graph includes experimental measurements during loading (blue) and unloading (gray), along with model approximations for both trends.
The resistance behavior of Sample 3 is relatively smooth and predictable. The values start at 0.615 mΩ at 56 N and gradually decrease to 0.463 mΩ at 120 N. During the unloading cycle, the resistance remains stable, with minimal hysteresis, suggesting a reliable elastic response and good surface conformity.
Compared with Sample 3, which demonstrates more favorable electrical behavior despite being printed vertically, its resistance values are consistently lower and more repeatable, likely due to improved surface finish or slightly denser microstructure.
These findings show that horizontal orientation may offer slightly better overall performance for Rc compared with vertically printed components.
To provide a comparative overview of the electrical performance of horizontal and vertical test specimens, the average electric and mechanical properties was calculated by the measured contact resistance Rc data, separately for the increasing- and decreasing-force cycles for each sample.
The least squares method of minimization via MATLAB implementation was used with minimization expression (11), where the relative difference between the measured values and those modeled with the Holm model is used:
where Rcm is the measured contact resistance value, and RcH is calculated via the Holm model value. Using the relative difference ΔRc/Rc keeps the importance of all values in the loading cycle. This way, the final small values of the contact resistance at high force are not neglected relative to the high contact resistance values at small force loading.
The material properties derived by Holm’s model minimization are summarized in Table 2. They represent material property anisotropy due to the printing direction.
Table 2.
Contact resistance parameters—Sample 1.
The results confirm that Sample 1, manufactured with an axis horizontal to the printing direction, exhibited the lowest average material resistance and more stable contact characteristics. Sample 3, which contained internal cavities, exhibited the largest change values in both cycles, validating the detrimental effect of internal cavities. Sample 2 showed (Table 3) intermediate performance, with Sample 3 performing better than the other vertically printed specimens.
Table 3.
Three-dimensional-printed samples: Holm’s model parameter identification.
Thermally annealed 3D-printed Al5086 aluminum shows yield strength of 125 MPa [50,51], which is in good agreement with the modeled results in Table 3 and Table 4.
Table 4.
Contact resistance parameters—Sample 2.
This summary reinforces the importance of print orientation and material density control in the design of functional 3D-printed electrical contacts.
The behavior of specially designed Sample 3, with an internal cavity to improve mechanical softness, shown in Table 5, indicates that reliable electrical properties can still be achieved if structural integrity is maintained.
Table 5.
Contact resistance parameters—Sample 3.
7. Discussion
The experimental investigation of electrical contact resistance in 3D-printed aluminum specimens revealed several critical dependencies related to printing parameters, structural integrity, and contact mechanics. The consistent reduction in resistance with increasing contact force, observed in all tested samples, is consistent with classical theories of contact, such as Holm’s model, in which increased load leads to plastic deformation and an enlargement of the real contact area, thereby reducing the constriction resistance.
Sample 1, printed with a horizontal-to-object-axis building direction and high internal density, demonstrated better to Sample 2 electrical performance and minimal hysteresis. This result supports the hypothesis that the printing orientation can influence surface topology and load-bearing area at the contact interface. Similar findings have been reported in studies involving L-PBF-fabricated copper and aluminum components, where anisotropic material properties and surface roughness are directly related to the layer orientation and scanning strategy during printing.
Sample 2 consistently showed very small increase of resistance and the small hysteresis between loading and unloading cycles. This confirms that internal porosity and lack of fusion can severely disrupt current paths and reduce contact reliability. The prior literature in additive manufacturing similarly highlights the detrimental effects of defects on both mechanical strength and electrical continuity, especially in applications involving conductive interfaces. Vertically printed Sample 2 generally exhibited higher resistance than horizontally printed ones, but not all performed equally poorly.
Sample 3, although printed vertically, achieved reasonably low and stable resistance values, suggesting that other factors—such as surface finish quality and local density uniformity—also play a decisive role.
These observations underline the complex interplay between geometry, process parameters, and final part performance in metal additive manufacturing. While the printing direction orientation is a strong determinant of contact resistance, it is not the sole factor. Residual stresses, surface contamination, and even build plate adhesion can introduce variability in electrical behavior.
The findings of this study have practical implications for the design of 3D-printed electrical contact components, especially in applications requiring high repeatability and low contact resistance under variable mechanical loads. To ensure optimal performance, careful selection of printing direction, post-processing (e.g., blasting, annealing), and defect inspection are essential. Furthermore, material properties can be modified after the 3D printing process. For example, the contact resistance of a joint can be improved through a number of contact-forming repetitions that adjust the contact surface area via microscope plastic deformation and surface self-cleaning. Optimal refinement of printing parameters, as well as in-situ monitoring during printing, could help reduce variability and ensure reliable performance of additively manufactured conductive elements.
8. Conclusions
This study investigated the electrical contact resistance of 3D-printed aluminum specimens produced by L-PBF technology, focusing on the influence of build orientation and surface structural integrity during contact force loading.
Horizontally aligned printed samples exhibited very slightly lower contact resistance and better repeatability than their vertically aligned counterparts. These samples, in particular, showed the most favorable performance, with larger hysteresis between loading and unloading cycles, confirming the reliability of well-oriented printed structures. Printed samples vertical to the main axis displayed slightly higher contact resistance and more stable behavior during the loading cycle, highlighting the critical role of manufacturing consistency and density in the direction of electric current.
While vertically oriented samples generally performed less favorably, the behavior of specially designed Sample 3, with an internal cavity to improve mechanical softness, indicates that reliable electrical properties can still be achieved if structural integrity is maintained. The trends observed across all specimens suggest that contact resistance in 3D-printed aluminum parts is governed by both macro-scale orientation and microstructural cohesion of the complete sample design.
These findings reinforce the need for optimized printing strategies and robust post-processing techniques when designing metallic contact components for electrical applications. Modification of material properties can be achieved after the 3D printing process. For example, the contact resistance of a joint can be improved through repeated contact-forming cycles that adjust the contact surface area via microscope plastic deformation and surface self-cleaning. Future research may further explore dynamic loading effects, real contact area mapping, and the correlation among mechanical hardness, porosity, and electrical performance.
Author Contributions
Conceptualization, M.R., V.M. and I.M.; methodology, M.R., V.M. and I.M.; software, M.R., V.M. and I.M.; validation, M.R., V.M. and I.M.; formal analysis, M.R., V.M. and I.M.; investigation, M.R., V.M. and I.M.; resources, V.M. and I.M.; data curation, V.M. and I.M.; writing—original draft preparation, M.R., V.M. and I.M.; writing—review and editing, M.R., V.M. and I.M.; visualization, M.R., V.M. and I.M.; supervision, V.M. and I.M.; project administration, V.M. and I.M.; funding acquisition, V.M. and I.M. All authors have read and agreed to the published version of the manuscript.
Funding
This research was funded by the European Regional Development Fund under “Research Innovation and Digitization for Smart Transformation” program 2021–2027 under the Project BG16RFPR002-1.014-0006 “National Centre of Excellence Mechatronics and Clean Technologies”.
Data Availability Statement
The results obtained in this study are included in the article. Further inquiries can be directed to the corresponding author.
Conflicts of Interest
The authors declare no conflicts of interest.
References
- Kruth, J.-P.; Froyen, L.; Van Vaerenbergh, J.; Mercelis, P.; Rombouts, M.; Lauwers, B. Selective laser melting of iron-based powder. J. Mater. Process. Technol. 2004, 149, 616–622. [Google Scholar] [CrossRef] [Scilit]
- Herzog, D.; Seyda, V.; Wycisk, E.; Emmelmann, C. Additive manufacturing of metals. Acta Mater. 2016, 117, 371–392. [Google Scholar] [CrossRef] [Scilit]
- Rafi, H.K.; Karthik, N.V.; Gong, H.; Starr, T.L.; Stucker, B.E. Microstructures and mechanical properties of Ti6Al4V parts fabricated by selective laser melting and electron beam melting. J. Mater. Eng. Perform. 2013, 22, 3872–3883. [Google Scholar] [CrossRef] [Scilit]
- Casati, R.; Nasab, M.H.; Coduri, M.; Tirelli, V.; Vedani, M. Effects of Platform Pre-Heating and Thermal-Treatment Strategies on Properties of AlSi10Mg Alloy Processed by Selective Laser Melting. Metals 2018, 8, 954. [Google Scholar] [CrossRef] [Scilit]
- Khaleeq-Ur-Rahman, M.; Butt, M.; Samuel, A.; Siraj, K. Investigation of laser irradiation effects on the hardness of Al 5086 alloy under different conditions. Vacuum 2010, 85, 474–479. [Google Scholar] [CrossRef] [Scilit]
- Huang, J.; Yan, X.; Chang, C.; Xie, Y.; Ma, W.; Huang, R.; Zhao, R.; Li, S.; Liu, M.; Liao, H. Pure copper components fabricated by cold spray (CS) and selective laser melting (SLM) technology. Surf. Coat. Technol. 2020, 395, 125936. [Google Scholar] [CrossRef] [Scilit]
- Varol, T.; Hacısalihoğlu, İ.; Kaya, G.; Güler, O.; Yıldız, F.; Aksa, H.C.; Akçay, S.B. The effect of selective laser melting process on the microstructure, density, and electrical conductivity of silver-coated copper cores. J. Mater. Eng. Perform. 2021, 30, 5216–5226. [Google Scholar] [CrossRef] [Scilit]
- Wong, P.; Kwok, C.; Man, H.; Cheng, F. Laser surface alloying (LSA) of copper for electrical erosion resistance. In Laser Surface Modification of Alloys for Corrosion and Erosion Resistance; Woodhead Publishing: Cambridge, UK, 2012; pp. 288–319. [Google Scholar]
- Grakov, T.; Mateev, V.; Marinova, I. Modeling the Energy and Heating Efficiency of 3D Printing for Composite Materials with Dispersed Volumetric Particles. Electronics 2025, 14, 688. [Google Scholar] [CrossRef] [Scilit]
- Mateev, V. Applications: Energy harvesting and storage. In 3D Printed Smart Sensors and Energy Harvesting Devices: Concepts, fabrication and applications; IOP Publishing: Bristol, UK, 2024; pp. 11-1–11-17. [Google Scholar]
- Slade, P.G. Electrical Contacts: Principles and Applications; CRC Press: Boca Raton, FL, USA, 2013. [Google Scholar]
- Lunn, K.F.; Apelian, D. Thermal and Electrical Conductivity of Aluminum Alloys: Fundamentals, structure-property relationships, and pathways to enhance conductivity. Mater. Sci. Eng. A 2025, 924, 147766. [Google Scholar] [CrossRef] [Scilit]
- Qiu, C.; Panwisawas, C.; Ward, M.; Basoalto, H.C.; Brooks, J.W.; Attallah, M.M. On the role of melt flow into the surface structure and porosity development during selective laser melting. Addit. Manuf. 2015, 8, 135–142. [Google Scholar] [CrossRef] [Scilit]
- Bajaj, P.; Wright, J.; Todd, I.; Jägle, E.A. Predictive process parameter selection for SLM: Applications to high thermal conductivity alloys. Addit. Manuf. 2019, 27, 246–258. [Google Scholar]
- Read, N.; Wang, W.; Essa, K.; Attallah, M.M. Selective laser melting of AlSi10Mg alloy: Process optimisation and mechanical properties development. Mater. Des. 2015, 65, 417–424. [Google Scholar] [CrossRef] [Scilit]
- Du, D.; Dong, A.; Shu, D.; Zhu, G.; Sun, B.; Li, X.; Lavernia, E. Influence of build orientation on microstructure, mechanical and corrosion behavior of Inconel 718 processed by selective laser melting. Mater. Sci. Eng. A 2019, 760, 469–480. [Google Scholar] [CrossRef] [Scilit]
- Rao, H.; Giet, S.; Yang, K.; Wu, X.; Davies, C.H. The influence of processing parameters on aluminium alloy A357 manufactured by Selective Laser Melting. Mater. Des. 2016, 109, 334–346. [Google Scholar] [CrossRef] [Scilit]
- Thijs, L.; Kempen, K.; Kruth, J.-P.; Van Humbeeck, J. Fine-structured Al products by SLM of AlSi10Mg. Acta Mater. 2013, 61, 1809–1819. [Google Scholar] [CrossRef] [Scilit]
- Dai, D.; Gu, D. Tailoring surface quality through mass and momentum transfer modeling using a volume of fluid method in selective laser melting of TiC/AlSi10Mg powder. Int. J. Mach. Tools Manuf. 2015, 88, 95–107. [Google Scholar] [CrossRef] [Scilit]
- Zhang, J.; Song, B.; Wei, Q.; Bourell, D.; Shi, Y. A review of selective laser melting of aluminum alloys: Processing, microstructure, property and developing trends. J. Mater. Sci. Technol. 2019, 35, 270–284. [Google Scholar] [CrossRef] [Scilit]
- Zhang, H.; Gu, D.; Yang, J.; Dai, D.; Zhao, T.; Hong, C.; Gasser, A.; Poprawe, R. Selective laser melting of rare earth element Sc modified aluminum alloy: Thermodynamics of precipitation behavior and its influence on mechanical properties. Addit. Manuf. 2018, 23, 1–12. [Google Scholar] [CrossRef] [Scilit]
- Prashanth, K.G.; Scudino, S.; Klauss, H.J.; Surreddi, K.B.; Löber, L.; Wang, Z.; Chaubey, A.K.; Kühn, U.; Eckert, J. Microstructure and mechanical properties of Al-12Si produced by selective laser melting: Effect of heat treatment. Mater. Sci. Eng. A 2014, 590, 153–160. [Google Scholar] [CrossRef] [Scilit]
- Schwab, H.; Prashanth, K.G.; Löber, L.; Kühn, U.; Eckert, J. SLM of Ti-45Nb alloy. Metals 2015, 5, 686–694. [Google Scholar] [CrossRef] [Scilit]
- Prashanth, K.G.; Damodaram, R.; Scudino, S.; Wang, Z.; Rao, K.P.; Eckert, J. Friction welding of Al-12Si parts produced by SLM. Mater. Des. 2014, 57, 632–637. [Google Scholar] [CrossRef] [Scilit]
- Xiong, Z.; Liu, S.; Li, S.; Shi, Y.; Yang, Y.; Misra, R. Role of melt pool boundary condition in determining the mechanical properties of selective laser melting AlSi10Mg alloy. Mater. Sci. Eng. A 2019, 740, 148–156. [Google Scholar] [CrossRef] [Scilit]
- Agarwala, M.; Bourell, D.; Beaman, J.; Marcus, H.; Barlow, J. Post-processing of selective laser sintering metal parts. Rapid Prototyp. J. 1995, 1, 36–44. [Google Scholar] [CrossRef] [Scilit]
- Sercombe, T.B.; Li, X. Selective laser melting of aluminium and aluminium metal matrix composites: Review. Mater. Technol. 2016, 31, 77–85. [Google Scholar] [CrossRef] [Scilit]
- Prashanth, K.G.; Scudino, S.; Maity, T.; Das, J.; Eckert, J. Is the energy density a reliable parameter for materials synthesis by SLM? Mater. Res. Lett. 2017, 5, 386–390. [Google Scholar] [CrossRef] [Scilit]
- Thijs, L.; Kempen, K.; Kruth, J.-P.; Van Humbeeck, J. Fine-structured aluminium products with controllable texture by SLM of pre-alloyed AlSi10Mg powder. Acta Mater. 2013, 61, 1809–1819. [Google Scholar] [CrossRef] [Scilit]
- Aboulkhair, N.T.; Maskery, I.; Tuck, C.; Ashcroft, I.; Everitt, N.M. On the formation of AlSi10Mg single tracks and layers in selective laser melting: Microstructure and nano-mechanical properties. J. Mater. Process. Technol. 2016, 230, 88–98. [Google Scholar] [CrossRef] [Scilit]
- Louvis, E.; Fox, P.; Sutcliffe, C.J. Selective laser melting of aluminium components. J. Mater. Process. Technol. 2011, 211, 275–284. [Google Scholar] [CrossRef] [Scilit]
- Martinez, A.; González-Estrada, O.A.; Martínez, E. Evaluation of the tribological properties of MMCs obtained by AM using SLM. arXiv 2017, arXiv:1709.08818. [Google Scholar]
- Buchbinder, D.; Schleifenbaum, H.; Heidrich, S.; Meiners, W.; Bültmann, J. High-powder SLM of aluminum parts. Phys. Procedia 2011, 12, 271–278. [Google Scholar] [CrossRef] [Scilit]
- Kang, N.; Coddet, P.; Liao, H.; Coddet, C. Macrosegregation mechanism of primary silicon phase in SLM hypereutectic Al-high Si alloy. J. Alloys Compd. 2016, 662, 259–262. [Google Scholar] [CrossRef] [Scilit]
- Kempen, K.; Thijs, L.; Van Humbeeck, J.; Kruth, J.-P. Mechanical properties of AlSi10Mg produced by SLM. Phys. Procedia 2012, 39, 439–446. [Google Scholar] [CrossRef] [Scilit]
- Zhang, Z.; Zhu, H.; Hu, Z.; Zhang, L.; Zeng, X. Comparative study on single-layer and multi-laser SLM AlSi10Mg: Defects, microstructure & mechanical properties. Mater. Sci. Eng. A 2019, 746, 416–423. [Google Scholar]
- Barkman, A.H. Investigating electrical properties of ADAM 3D printed 17-4PH stainless steel for integrated sensing functionalities. Bachelor’s Thesis, University of Twente, Enschede, The Netherlands, 2022. [Google Scholar]
- Gao, B.; Zhao, H.; Peng, L.; Sun, Z. A Review of Research Progress in Selective Laser Melting (SLM). Micromachines 2023, 14, 57. [Google Scholar] [CrossRef] [Scilit] [PubMed]
- Khan, M.; Dickens, P. SLM of gold. Rapid Prototyp. J. 2012, 18, 81–94. [Google Scholar] [CrossRef] [Scilit]
- Ciurana, J.; Hernandez, L.; Delgado, J. Energy density analysis on single tracks formed by SLM with CoCrMo powder. Int. J. Adv. Manuf. Technol. 2013, 68, 1103–1108. [Google Scholar] [CrossRef] [Scilit]
- Gharbi, O.; Jiang, D.; Feenstra, D.R.; Kairy, S.K.; Wu, Y.; Hutchinson, C.R.; Birbilis, N. On the corrosion of AM aluminium alloy AA2024 fabricated by SLM. Corros. Sci. 2018, 143, 93–106. [Google Scholar] [CrossRef] [Scilit]
- Chen, H.; Zhang, C.; Jia, D.; Wellmann, D.; Liu, W. Corrosion Behaviors of Selective Laser Melted Aluminum Alloys: A Review. Metals 2020, 10, 102. [Google Scholar] [CrossRef] [Scilit]
- Maamoun, A.H.; Veldhuis, S.C.; Elbestawi, M. Friction stir processing of AlSi10Mg parts produced by SLM. J. Mater. Process. Technol. 2019, 263, 308–320. [Google Scholar] [CrossRef] [Scilit]
- Du, Z.; Tan, M.J.; Chen, H.; Bi, G.; Chua, C.K. Joining of 3D-printed AlSi10Mg by friction stir welding. Weld. World 2018, 65, 675–678. [Google Scholar] [CrossRef] [Scilit]
- Holm, R. Electric Contacts: Theory and Application; Springer: Berlin, Germany, 2013. [Google Scholar]
- Ralchev, M.; Mateev, V.; Marinova, I.; Tzeneva, R. Electrical contact resistance of 3D printed conductive elastomer material. AIP Conf. Proc. 2022, 2570, 030009. [Google Scholar]
- Davis, J.R. (Ed.) Aluminum and Aluminum Alloys; ASM International: Materials Park, OH, USA, 1993. [Google Scholar]
- Todorov, G.; Kamberov, K.; Sofronov, Y.; Gavrilov, T.; Miltchev, R. Study of Electrical Contact in a System for High Power Transmission Through Well Piping. Appl. Sci. 2025, 15, 9932. [Google Scholar] [CrossRef] [Scilit]
- ISO 20958:2013; Measurement of the Electrical Resistance of Metallic Materials. International Organization for Standardization: Geneva, Switzerland, 2013.
- Zavari, S.; Bagheri, E.; Ding, H.; Adibi, N.; Eller, M.; Cox, C.; Guo, S. The influence of additive friction stir deposition process on mechanical properties, corrosion resistance, and electrical conductivity of Al5086-H32 alloy. Prog. Addit. Manuf. 2025, 10, 7791–7802. [Google Scholar] [CrossRef] [Scilit]
- Mousa, A.B.; Abbass, M.K.; Hussein, S.K. Comparative study of mechanical properties of similar and dissimilar friction stir welded joints of aluminum alloys (AA6061-T6) and (AA5086-H32). AIP Conf. Proc. 2026, 3379, 020014. [Google Scholar] [CrossRef] [Scilit]

Disclaimer/Publisher’s Note: The statements, opinions and data contained in all publications are solely those of the individual author(s) and contributor(s) and not of MDPI and/or the editor(s). MDPI and/or the editor(s) disclaim responsibility for any injury to people or property resulting from any ideas, methods, instructions or products referred to in the content. |
© 2026 by the authors. Licensee MDPI, Basel, Switzerland. This article is an open access article distributed under the terms and conditions of the Creative Commons Attribution (CC BY) license.