


Abstract
The paper deals with the comparative analysis, at microgeometric scale, of machined surfaces by classic electrical discharge machining (EDM) and hybrid ultrasonic EDM of CoCr alloys, using computer vision aimed at emphasizing the advantages of this hybrid technology. The analysis generally revealed the superior stability of EDM+US process against classic EDM, explained by the better evacuation of debris from the working gap due to ultrasonically induced cavitation. This key phenomenon also contributed to the enhancement of machining rate by removing the material in liquid and solid state from the microgeometry peaks, while also reducing the surface roughness if the power on the ultrasonic chain was optimized.
1. Introduction
Processing by electrical discharge machining (EDM) with the simultaneous ultrasonic (US) vibration of tool-electrode or workpiece is considered a hybrid variant (EDM+US) rather than merely assisted, because in this case, the ultrasonic component contributes directly to material removal, and not only to creating favorable processing conditions as in the case of ultrasonically aided machining. Thus, there are two components of this complex material removal mechanism: The first one is thermal, due to classical EDM, and the second one is mechano-hydraulic, provided by the ultrasonic component, more precisely by the ultrasonically induced cavitation within the gap. This type of cavitation causes the collapse of gas bubbles in the working gap at the end of each ultrasonic period, after the liquid stretching half-cycle; when the frontal gap begins to decrease due to the ultrasonic oscillation, the frontal tool surface moves toward the machined surface. The development of pressures on the order of hundreds of MPa causes the collective implosion of the gas bubbles, including, certainly, those formed around the plasma channel of the discharge. This is called the cumulative microjets stage (CMS), which could be synchronized with the pulse duration and thus molten material produced by discharge could be removed, increasing EDM efficiency, against usual EDM, where the most part of the melted material is resolidified because the gas bubble formed around the plasma channel lasts a long time after the pulse ends, and dielectric liquid cannot removed it [1]. Similar advantages of hybrid EDM with ultrasonic vibration have been documented in recent studies by other researchers. Recent advances in several directions of EDM, including hybrid machining with ultrasonic vibrations are presented by Sukma and Heryana [2]. Dinh et al. approached the construction of the ultrasonic horn to obtain an increase in machining rate and decrease surface roughness [3]. Yu et al. used EDM+US processing composite material and carbon-fiber-reinforced silicon carbide (C/SiC) and optimized the process with machining rate as the objective function [4].
This research approaching EDM+US-enhanced performances is state of the art regarding the application of computer vision in EDM, as starting point, focusing on some key areas. The integration of computer vision into EDM has gained significant attention in recent years due to its potential to enhance process monitoring, defect detection, quality control and finally, optimization. One of the primary applications of computer vision in EDM is real-time process monitoring. Usual EDM processes rely on electrical parameters such as voltage, current, and discharge frequency to monitor the machining process. However, these parameters alone may not provide a complete picture of the process dynamics. Computer vision systems, equipped with high-speed cameras and advanced image processing algorithms, can capture visual information about the discharge process, at microgeometric scale, including the shape, size, and distribution of discharge craters [5].
Defect detection is another critical area where computer vision has been applied in EDM. Surface defects, such as micro-cracks, craters, and recast layers, can significantly affect the quality of the machined parts. Traditional inspection methods, such as manual inspection or coordinate measuring machines, are time-consuming and may not be suitable for real-time quality control. Computer vision systems offer a faster and more automated approach to defect detection. Tool wear is a significant concern in EDM, as it can affect machining accuracy and surface quality [6]. Traditional methods for monitoring tool wear, such as measuring the weight loss of the electrode, are indirect and may not provide real-time information. Computer vision systems can directly observe the tool’s condition and provide real-time feedback on tool wear.
In EDM processes, the machined surface is composed of numerous small, overlapping craters. The geometry of individual craters significantly affects the resulting surface characteristics. However, most existing crater-shape models fail to capture key features observed in practice, such as the raised rim surrounding the crater and the asymmetric bowl-like shape.
A geometric prediction model for micro-EDM surface morphology was developed by Hou et al. [7], incorporating the stochastic characteristics of discharge crater size. The model uses the response surface method to correlate machining parameters with crater size distribution, characterized by normal probability density functions. Compared to models assuming fixed crater sizes, the proposed model reduces roughness prediction error by 1.01% and overall error by 18.97%, offering improved accuracy for predicting surface topography in micro-EDM applications.
A novel pulse-crater identification model for micro-EDM was developed by Yao et al. [8], using in-process electrical signals to map discharge pulse types to crater morphology. The model employs machine learning, achieving prediction errors of 7.81%, 12.49%, and 18.82% for crater diameter, depth, and volume, respectively, with a cumulative material removal error of 1.64%. Applied to micro-EDM drilling, it predicts hole material removal volume with a 3.33% error, enhancing geometric precision control.
Çakıroğlu et al. [9] investigated the impact of EDM machining parameters on keyway fabrication in Ti-6Al-4V alloy, focusing on discharge current, pulse on-time, and pulse off time. Experimental results reveal that higher discharge current and pulse on-time significantly increase material removal rate (MRR) and surface roughness (SR), while tool wear rate (TWR) decreases with longer pulse on-time. SEM and EDS analyses highlight the formation of craters, cracks, and a heat-affected zone up to 60 μm deep due to the alloy’s low thermal conductivity. Predictive models using artificial neural networks (ANN) and regression analysis (RA) were developed, with ANN demonstrating superior accuracy in estimating MRR, TWR, and SR, supporting enhanced precision in industrial EDM applications.
Gonzalez-Sanchez et al. [10] introduced an automated method for characterizing single craters in wire electrical discharge machining using advanced computer vision techniques. By fine-tuning the YOLOv8 model on a custom dataset, single craters are detected with high precision, while the Segment Anything Model accurately segments their contours without requiring further training. The study reveals that crater size and shape vary significantly with discharge energy, but wire diameter has minimal impact. The approach enhances sample size for statistical analysis, offering insights into WEDM process optimization, though it is limited to specific materials and wire types.
Using high-speed imaging in single-pulse EDM (copper tool, steel workpiece), Li and Yang [11] revealed that arc plasma moves randomly at average speeds of 16–36 m/s with increasing range over time; cathodic workpiece polarity yields significantly faster and wider plasma movement, resulting in craters up to 50% larger, composed of overlapping micro-craters and scattered nano-craters, whereas anodic polarity confines plasma mostly within the molten pool, producing compact bowl-shaped craters with smooth re-solidified rims; plasma movement intensifies with higher discharge current and narrower gap, is more restricted in oil dielectric than in air, and is strongly influenced by electrode end shape.
Experiments were performed by Feng and Wong [12] to investigate the three-dimensional geometry of single craters produced by micro-EDM. Using experimental observations, a new geometric model is proposed that more accurately represents the actual 3D shape of individual craters. Two versions of the model are developed: a simplified uniform model and a more realistic non-uniform model that explicitly accounts for the raised rim and the asymmetry of the crater profile. Additionally, a method is presented for generating overlapping crater patterns by combining multiple instances of the non-uniform single-crater model. This approach successfully reproduces the main geometrical characteristics of real crater clusters found on micro-EDM machined surfaces.
Despite the promising results, several challenges remain in the application of computer vision in EDM, as the quality of images captured during the EDM process can be affected by factors such as debris, sparks, and the high-speed nature of the process.
Developing robust image processing algorithms that can handle these challenges is crucial. The real-time processing of high-speed camera images requires significant computational resources. Optimizing algorithms for real-time performance is essential for practical implementation. Integrating computer vision systems with existing EDM control systems can be complex. Developing seamless interfaces and communication protocols is necessary for effective integration.
2. Characterization of CoCr Alloys
The behavior of two CoCr alloys during EDM and hybrid EDM combined with ultrasonics (EDM+US) was comparatively investigated. These alloys are of particular interest due to their potential applications across a wide range of industries, including the medical field for the manufacture of orthopedic prostheses and implants [13] as well as surgical instruments [14]; the aeronautical and aerospace sectors for turbine components and parts exposed to high temperatures and corrosive environments [15]; the automotive industry for engine valves, piston rings, and turbocharger components [16]; the energy sector for parts in gas turbines and power plants [17]; the tooling and die-making industry for cutting tools and molds used in plastic injection or die-casting processes [18]; the petrochemical industry for valves and pumps operating in corrosive media [19]; and the military sector for armament components requiring extreme wear resistance [20].
Given the required characteristics for the applications from above, conventional machining by chip removal is difficult, thereby justifying the use of EDM and EDM+US.
The characteristics of the CoCr alloys studied comparatively are presented in terms of chemical composition (Table 1) and mechanical properties (Table 2):
Table 1.
Chemical composition of CoCr alloys [21].
Table 2.
Mechanical characteristics of CoCr alloys [21].
3. Experimental Setup
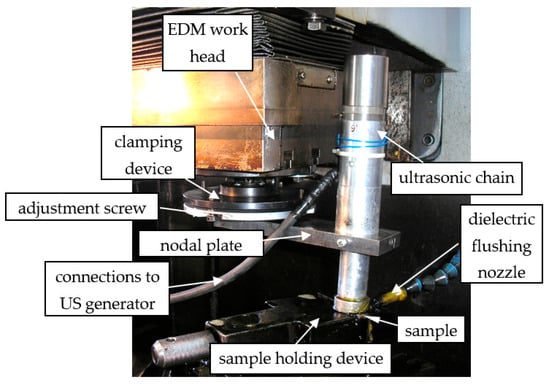
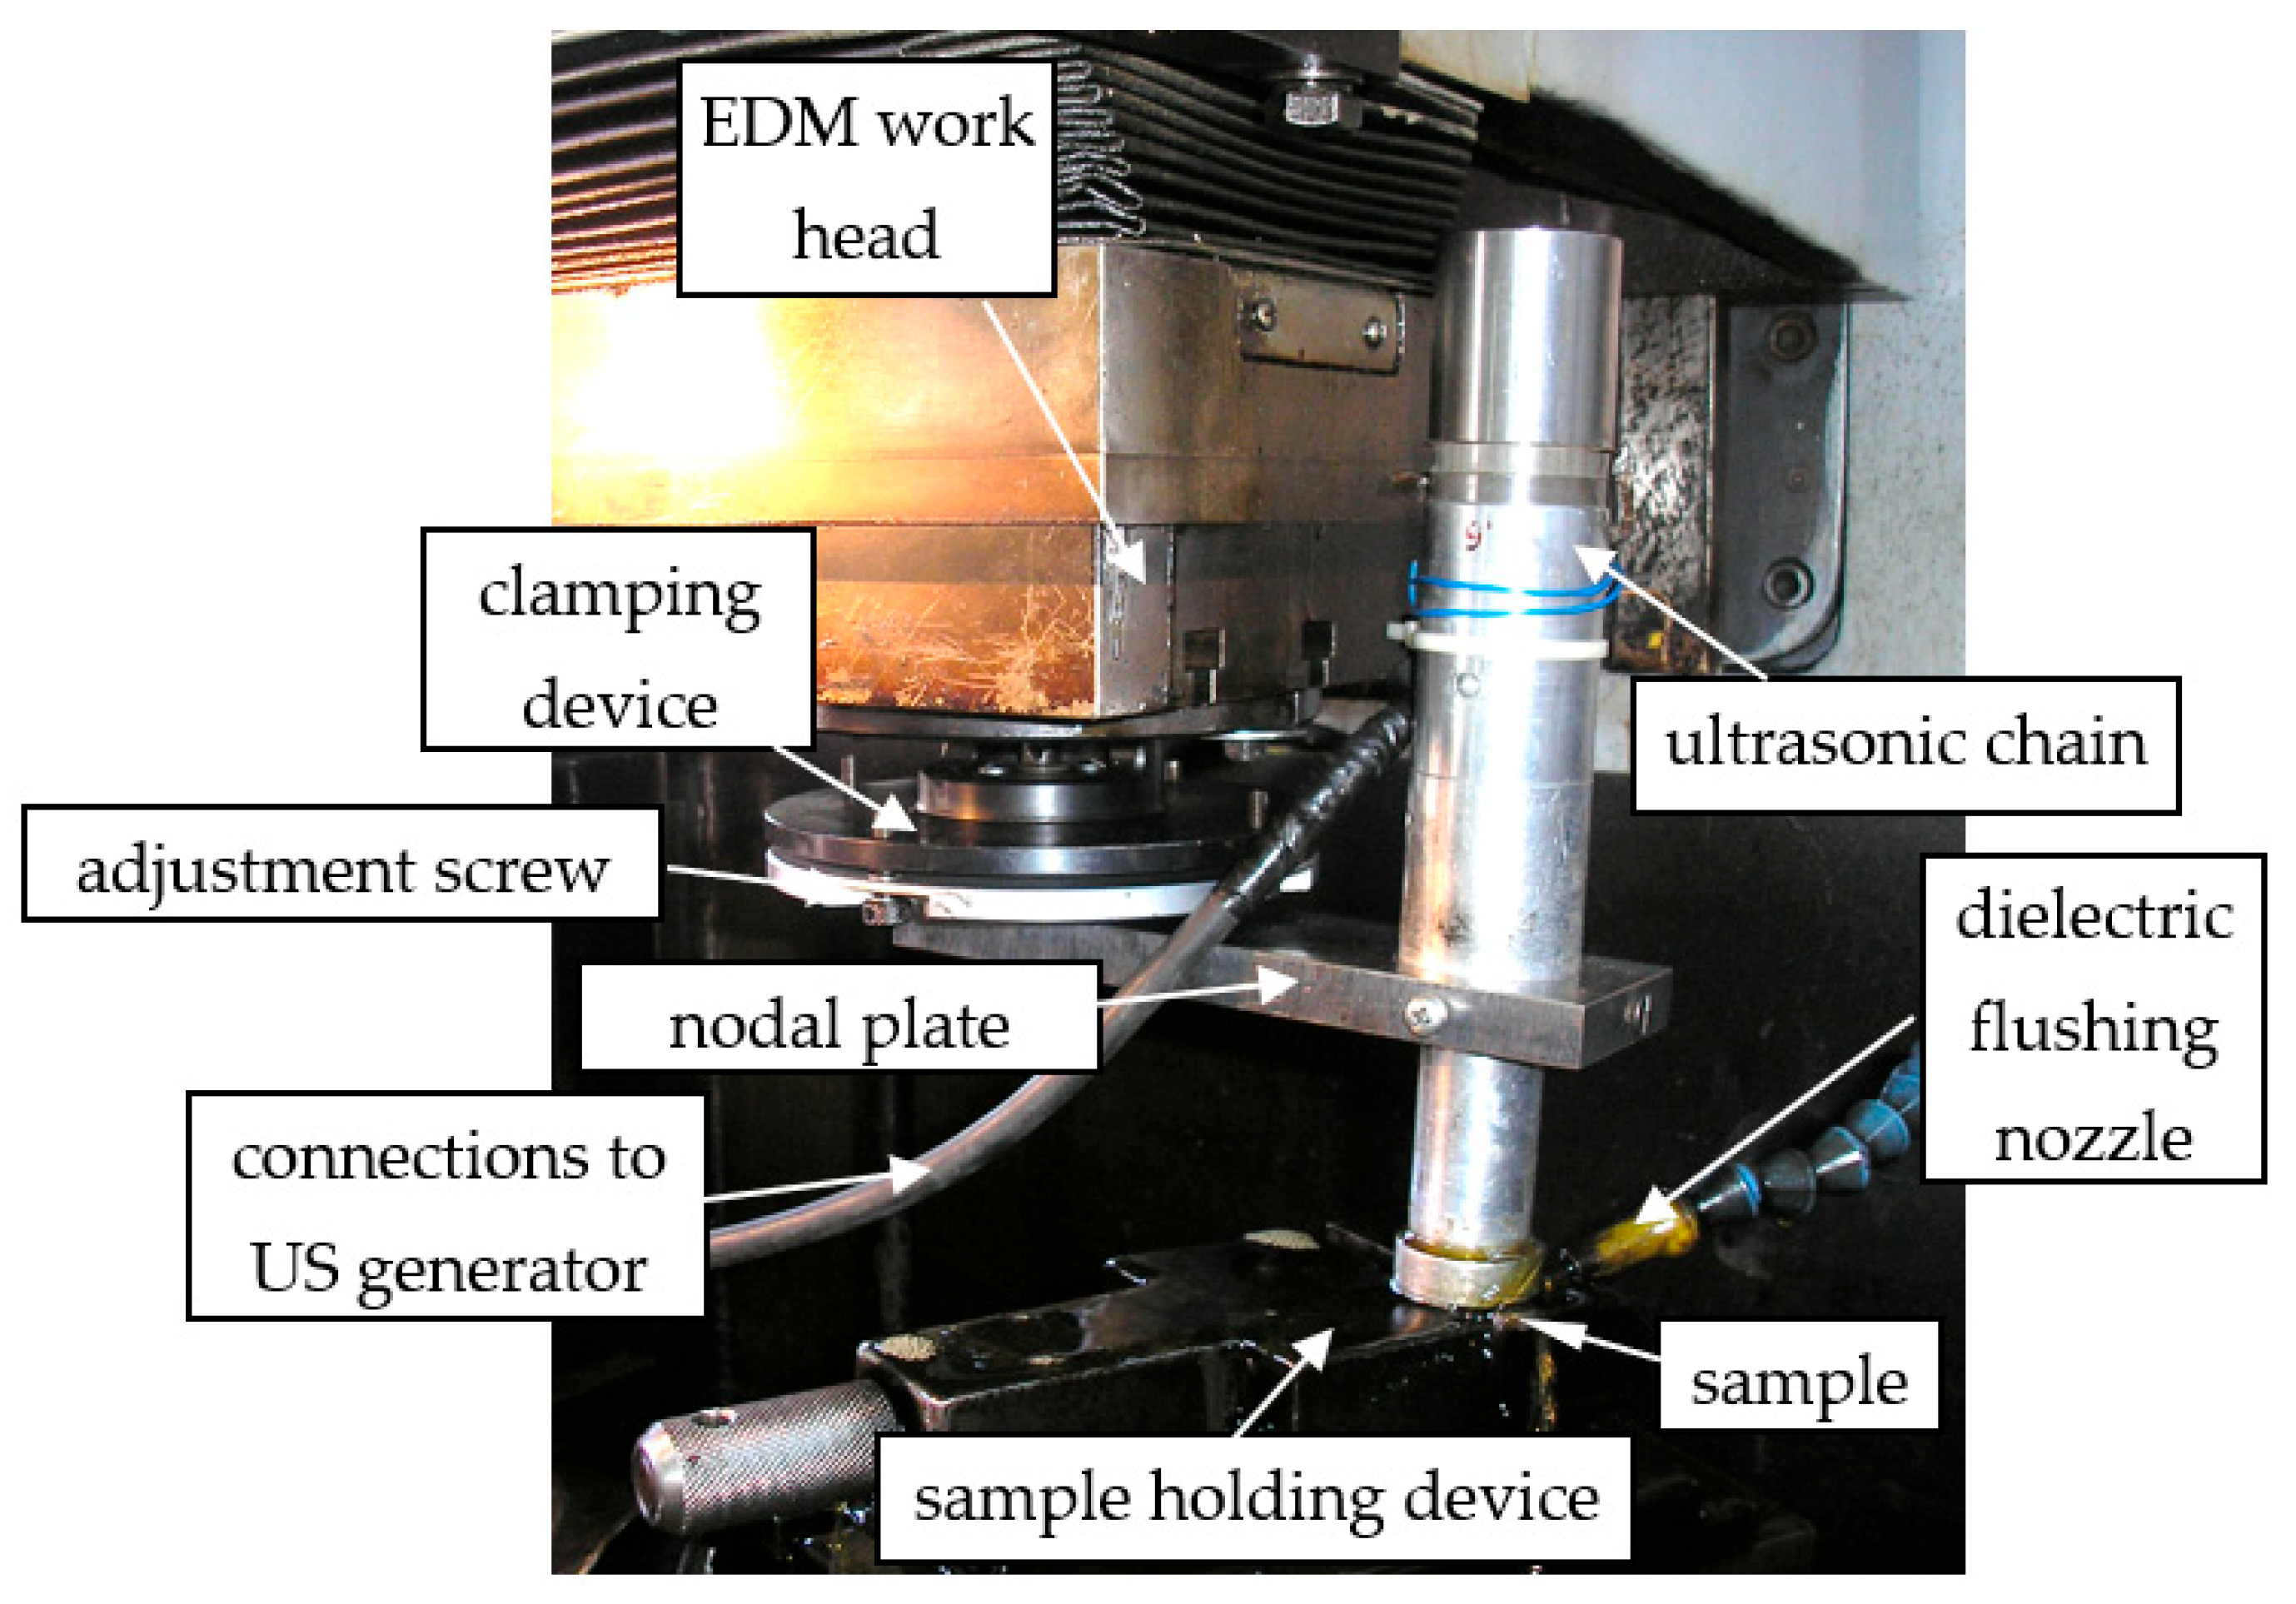
The experimental tests were conducted on the Romanian ELER 11 EDM machine (Producer ELECTROTIMIS Timisoara, design ICTCM Bucharest, Romania) from the Faculty of Industrial Engineering and Robotics, National University of Science and Technology “Politehnica” Bucharest. The setup for machining comparatively CoCr alloys samples by EDM and EDM+US is presented in Figure 1.
Figure 1.
Experimental setup.
The ultrasonic chain is clamped on the work head using a device that adjusts the position of its longitudinal axis relative to machined surface by a spherical mechanism and adjustment screws [22]. A disk tool-electrode is positioned at the end of the ultrasonic chain, against the workpiece (CoCr alloy) sample that is clamped by a vice device.
A disk tool-electrode with diameter of 25 mm, and thickness of 3 mm from electrolytic copper, Cu 99.9% minimum. The tool was assembled onto the ultrasonic concentrator by silver brazing. The tool was not replaced because the machining parameters used are considered to produce very low wear, and any minor changes in the natural frequency of the ultrasonic chain were compensated by the ultrasonic generator adaptive control. A lateral flushing with dielectric liquid was used through a nozzle oriented tangential to machined surface.
The working parameters used in our experiments are presented in Table 3:
Table 3.
Working parameters.
The commanded pulses under the specified current steps were delivered by EDM generator GEP 50 MFM, with a maximum current of 50 A. The natural frequency of the US chain was f0 = 19.21 kHz. The functional resonance condition was obtained by the numerical simulation of US horn, and then the physical achievement (slight dimensional adjustment of the parts lengths) of having equality between the sandwich transducer’s own frequency and that of US horn. Finally, the US generator, GUS 20 was adjusted to deliver the same frequency, f0 = 19.21 kHz. During machining, the US generator with adaptive control hunted the resonance frequency, f0.
The machined area on the frontal surface of the sample was only an indentation, smaller than the tool-electrode’s front surface of 4 cm2, depending on the effective parallelism between the tool and sample frontal surfaces.
After machining, the surfaces generated by EDM and EDM+US were scanned by SEM QUANTA INSPECT F50 (FEI Company, Eindhoven, The Netherlands) from “Politehnica” University, with a resolution of 1 nm, obtaining images analyzed by computer vision. The entire machined surface was scanned, but specific areas were magnified to capture relevant details of a sufficient number of craters, allowing for the statistical interpretation of the experimental data.
We also mention that the machined images were not frontal. For more realistic images the longitudinal axes of samples were inclined relative to vertical direction, intending to capture also the depth of the microgeometry shapes. A slight tilt of the machined front surface was preferred to capture the height of the micro-peaks without altering the data regarding the diameters of the craters produced by the EDM discharges (see following relation (2), which accounts for the oval shape of the crater images using the ‘Circularity C’ parameter). A relevant minimum threshold was set for the C value to account for any potential real crater.
4. Software Application
The number of craters and their dimensions and distribution in images of surfaces processed by EDM with and without ultrasonic assistance are important for the evaluation of microgeometry surface quality and its roughness. Lower dimensions of craters and uniform distribution suggest smoother, and more regular microgeometry, which is desirable for many applications requiring precision or wear resistance. Analyzing craters helps evaluate the efficiency of the EDM process. Ultrasonic assistance can influence material removal rates and surface finish. A relatively lower crater size may signify improved process stability and energy efficiency, and this can affect the mechanical properties of the machined surface, such as hardness, fatigue resistance, and corrosion resistance. Excessive voids may indicate defects or weak points, impacting the material’s performance. By counting craters and their dimensions through image analysis, one can compare the effects of EDM with and without ultrasonics. This data helps optimize parameters like pulse duration, current, or ultrasonic frequency, and especially the power delivered on the ultrasonic chain, to achieve desired outcomes. This also can influence the wear behavior of the tool electrode. Understanding craters’ size and their distribution aids in predicting tool life and maintenance needs. Image analysis could be used to quantify these features accurately, providing measurable data for statistical comparison and process refinement.
The images were analyzed through an application that comprises three interconnected classes forming modular architecture. The application is primarily built using Python 3.12.2 as the programming language, leveraging computer vision and Graphical User Interface (GUI) libraries. This architecture emphasizes modularity with a sequential data pipeline, state management in the GUI class, and no additional external dependencies. The data processing pipeline executes sequentially: Image loading and optional grayscale conversion, user-initiated calibration establishing the pixel-to-micrometer conversion factor, feature detection through one or both detection algorithms, geometric and intensity-based validation of detected features, quality score computation and filtering, visualization with color-coded annotations, and finally multi-format data export. State management is centralized in the GUI class which maintains references to the original image, binary masks from detection operations, lists of detected structures and lines, calibration parameters, and current selection state for individual feature highlighting.
In the preprocessing stage, the algorithm begins by converting the input image to single-channel grayscale using OpenCV’s cvtColor function with the COLOR_BGR2GRAY flag [20]. Gaussian blur is a smoothing technique applied to an image using a Gaussian function and is applied using a 3 × 3 kernel with the standard deviation of the Gaussian distribution sigma = 0 (automatically calculated), implementing the convolution: G (x, y) = (1/16)[1 2 1; 2 4 2; 1 2 1] × I (x, y). The formula shows how G (x, y) is computed through convolution: Each output pixel is a weighted average of neighboring input pixels, using the kernel. This reduces high-frequency noise while preserving edge information critical for accurate contour detection. G (x, y) represents the output image (resulting blurred image). It is the pixel value at position (x, y) in the smoothed image. I (x, y) represents the input image (original image). It is the original pixel value at position (x, y) before blurring. The convolution replaces each I (x, y) with a linear combination of values from its 3 × 3 neighborhood.
Binary segmentation separates features from the background using intensity thresholding. For dark features (craters), inverse binary thresholding is applied: B (x, y) = 255 if I (x, y) < T, else 0. For bright features (bubbles), standard binary thresholding is used: B (x, y) = 255 if I (x, y) > T, else 0. The threshold value T is user-configurable through a GUI slider (range 0–255 pixels).
Two morphological operations refined the binary mask. Opening operation (erosion followed by dilation) removes small, isolated noise pixels using a 2 × 2 elliptical structuring element. The operation is defined as: (A ⊖ B) ⊕ B, where A is the binary image, B is the structuring element, ⊖ denotes erosion, and ⊕ denotes dilation. Closing operation (dilation followed by erosion) fills small holes within features using a 5 × 5 elliptical structuring element: (A ⊕ B) ⊖ B. The asymmetric kernel sizes ensure noise removal while preserving feature connectivity.
In image processing, the area of a shape (like a detected object or region) can be calculated efficiently for a closed polygon defined by contour points. The formula is a discrete application of Green’s theorem from vector calculus, which relates the area enclosed by a curve to a line integral. For practical computation on a set of ordered points (vertices of the polygon), it simplifies to the shoelace formula. Contours are extracted using the Suzuki-Kato border-following algorithm (cv2.findContours with RETR_EXTERNAL mode), which traces only external boundaries and discards internal holes. Each contour is represented as a list of (x, y) coordinate pairs. Initial filtering rejects contours with area A < Amin or A > Amax, where area is computed using Green’s theorem:
where A is the area of the enclosed region (in pixel units, assuming integer coordinates).
The sum is made over all consecutive pairs of points. Absolute value to ensure a positive area, 0.5 factor scales the double-area sum from Green’s theorem to the actual area. For a closed contour with n vertices (x1, y1), (x2, y2), …, (xn, yn), the last point connects back to the first ((xn+1, yn+1) = (x1, y1)). Circularity C was quantified for each contour as:
where A denotes the contour area (computed through Green’s theorem, as previously described) and P represents the perimeter length, estimated using the cv2.arcLength function from the OpenCV library [23].
This dimensionless metric attains a value of 1.0 for a perfect circle and diminishes toward 0 for increasingly elongated or irregular geometries, thereby serving as an indicator of shape isotropy. Factor C could be decreased taking account of the inclination of machined surfaces examined at SEM. Nevertheless, contours with C < 0.1 were discarded, as such low values are characteristic of linear artifacts rather than the compact, circular features targeted in this analysis. Additionally, the convex hull H of each contour was derived employing Graham’s scan algorithm, implemented through the cv2.convexHull function. Solidity S, defined as the ratio of the contour area to the area enclosed by its convex hull, , was subsequently computed to assess structural compactness. Values of S approaching 1.0 signify convex, solid objects with minimal internal voids or indentations, whereas deviations below this threshold reflect pronounced concavities. Accordingly, contours with S < 0.3 were rejected to exclude highly irregular or fragmented detections, enhancing the specificity of the morphological characterization.
A binary mask M, initialized to zero and matching the dimensions of the input grayscale image I, was generated to delineate the interior region of each detected contour. The contour was subsequently filled using the cv2.fillPoly function from the OpenCV library, assigning a value of 255 to all pixels enclosed by the contour boundary.
The interior pixel intensities were then extracted as the set:
with the corresponding mean intensity computed as:
where N denotes the number of interior pixels [24]. This regional mean was compared against the global mean intensity of the image:
with W and H representing the image width and height, respectively.
For dark structure detection (craters), candidate structures were rejected if μinterior ≥ 0.9 × μglobal, thereby retaining only features exhibiting sufficient contrast relative to the background. Conversely, for bright structure detection (bubbles), structures were rejected if μinterior ≤ 1.1 * μglobal, ensuring the preservation of features with adequate brightness enhancement over the surrounding region. This thresholding mechanism effectively filters out spurious detections while maintaining sensitivity to true morphological anomalies.
For each validated contour, spatial moments M were computed utilizing the cv2.moments function from the OpenCV library, yielding centralized and normalized descriptors of the shape’s distribution. The centroid coordinates (cx, cy) were subsequently derived from the zeroth- and first-order moments as:
where M00 represents the total area [25]. The axis-aligned bounding rectangle was obtained with the cv2.boundingRect function, providing the coordinates (xmin, ymin) and dimensions (width, height) of the minimal enclosing box. The equivalent diameter deq, defined as the diameter of a circle possessing equivalent area to the contour, was calculated:
Then the algorithm applies binary thresholding to isolate bright pixels: B (x, y) = 255 if I (x, y) > Tbright, else 0, where Tbright is user-configurable (default 184). Line segments are often fragmented due to varying intensity or surface irregularities. Three directional closing operations reconnect broken segments while preserving orientation information: Morphological closing with Kh = [1 1 1 1 1 1 1 1 1 1 1] (11 × 1 rectangular kernel) connects horizontally aligned segments. Morphological closing with Kv = [1; 1; 1; 1; 1; 1; 1; 1; 1; 1; 1] (1 × 11 rectangular kernel) connects vertically aligned segments. Morphological closing with Kd = 7 × 7 elliptical kernel connects diagonally oriented segments. The three resulting binary images are combined using bitwise OR: Blines = Bh | Bv | Bd.
Binary thresholding was subsequently applied to the grayscale input image to delineate bright pixels, yielding a binary map B defined B (x, y) = 255 if I (x, y) > Tbright, and 0 otherwise, where Tbright constitutes a user-configurable intensity threshold (default: 184). This value was selected to align for bright-object segmentation within scanning electron microscopy (SEM), thereby optimizing sensitivity to high-contrast linear features. Due to inherent intensity gradients or topographic variations in SEM acquisitions detected line segments frequently exhibit fragmentation. To mitigate this, three orientation-specific morphological closing operations were employed to bridge discontinuities while retaining directional fidelity: Closing with a horizontal structuring element Kh comprising an 11 × 1 rectangular kernel [1 1 1 1 1 1 1 1 1 1 1] for reconnecting collinear horizontal segments; closing with a vertical structuring element Kv as 1 × 11 rectangular kernel for vertical alignments; closing with a 7 × 7 elliptical structuring element Kd to coalesce diagonally oriented segments. The resultant binary images Bh, Bv and Bd from these operations were then amalgamated with pixel-wise bitwise OR to produce the consolidated line map Blines = Bh | Bv | Bd, ensuring the comprehensive capture of multi-directional linear motifs without introducing extraneous artifacts.
The output binary image (combined mask) Blines highlights all detected features from the inputs. A pixel in Blines is 255 (white) if any of the input images has a white pixel at that location; otherwise, it is 0 (black). This union ensures no features are lost during merging. The horizontal lines binary image Bh is typically the result of thresholding or edge detection focused on horizontal structures (from a Sobel operator in the x-direction). The vertical lines binary image Bv is similar to Bh, but for vertical structures (Sobel in the y-direction). The diagonal lines binary image Bd could represent lines at 45° or 135° angles (from diagonal Sobel kernels or Hough line detection). This multi-directional approach ensures line detection independent of orientation.
The bitwise OR operator | executes a pixel-wise logical disjunction across the input binary images, amalgamating the respective directional maps Bh, Bv and Bd into a unified line detection image Blines. For each aligned pixel position (x, y), the output value is set to 255 if at least one corresponding input pixel registers 255, whereas a value of 0 is assigned exclusively when all inputs are 0. This operation is particularly efficacious for binary imagery, circumventing saturation artifacts inherent to additive merging (pixel sum exceeding the 255 intensity ceiling in 8-bit representations), thereby preserving the integrity of the foreground union without introducing clipping or overflow distortions.
Morphological opening was applied to the binary line image Blines using a 3 × 3 elliptical structuring element Ksmall, effectively suppressing isolated noise pixels while maintaining the integrity of coherent linear structures. This operation is expressed as Bclean = (Blines ⊖ Ksmall) ⊕ Ksmall where ⊖ and ⊕ denote erosion and dilation, respectively. For each extracted contour in Bclean, the minimum bounding rectangle (MBR) was computed to yield the enclosing width WMBR and height HMBR. The effective line length L and width W were then derived as L = max (WMBR, HMBR) and W = min (WMBR, HMBR), respectively, assuming principal orientation alignment. The aspect R = L/W served as a quantitative metric of linearity. Post-extraction dimensional filtering was imposed to discard non-elongated contours, retaining only those satisfying L ≥ Lmin (default 30 pixels), W ≤ Wmax (default 15 pixels), and R ≥ Rmin (default 2.5).
The initial orientation of each validated contour was preliminarily assigned based on the dimensions of its axis-aligned bounding rectangle, classifying the structure as horizontal if the width W > H (height) and vertical otherwise. For contours comprising at least five vertices, a more accurate angular estimation was performed via least-squares line fitting, implemented through the cv2.fitline function with L2 distance metric. This procedure yields a direction vector v = (vx, vy) from which the orientation angle θ is derived as:
Orientation assignment was refined using angular thresholds: horizontal for θ < 45° or θ > 135°, and vertical for 45° ≤ θ ≤ 135°, thereby accommodating bidirectional ambiguities in line directionality. A binary mask M, initialized to zero and dimensionally congruent with the input image I, was generated and populated with the contour with cv2.fillPoly function, assigning 255 to enclosed pixels. The line-associated pixel intensities were then extracted as the set Lpixels = {I (x, y) | M (x, y) = 255}, enabling computation of the mean line intensity:
where NL denotes the cardinality of Lpixels. To mitigate false positives arising from aggregated noise clusters, only contours satisfying μline ≥ Tbright were retained, confirming that the candidate line exhibits sufficient elevational contrast relative to the predefined brightness threshold.
The calibration procedure necessitates the selection of two distinct points within the image, where the real-world separation Dreal (in micrometers) is known and user-specified. User interactions via mouse clicks on the display canvas yield pixel coordinates (xcanvas, ycanvas). These are first mapped to the coordinate system of the rendered image through offset corrections accounting for canvas centering: ximg = xcanvas − xoffset, yimg = ycanvas − yoffset. The display scaling factor sdisplay, accounting for potential downsampling or upsampling relative to the native resolution, is computed as follows:
The corresponding coordinates in the original, unscaled image are then obtained as xorig = ximg/sdisplay, yorig = yimg/sdisplay. This sequential affine transformation chain ensures metrical fidelity irrespective of rendering artifacts induced by variable canvas dimensions or zoom levels. The pixel-wise Euclidean distance Dpixels between the transformed point pairs (xorig,1, yorig,1) and (xorig,2, yorig,2) is quantified as:
The calibration factor CF = Dpixels/Dreal (pixels per micrometer) is derived therefrom, facilitating the isotropic conversion of all subsequent measurements: linear dimensions as Lμm = Lpixels/CF and areas Aμm2 = Apixels/CF2.
The magnification tool dynamically monitors the mouse cursor position (xmouse, ymouse) on the primary display canvas, transforming these coordinates into the native pixel space of the original grayscale image through the inverse of the affine display mapping (encompassing offsets and scaling factors). A square subregion of side length 2Rmag is subsequently extracted from I, centered at the transformed position (x, y) as: Iregion = I [y − Rmag: y + Rmag, x − Rmag: x + Rmag], where Rmag is a user-adjustable parameter ranging from 100 to 250 pixels. For each validated structure identified by the crater and bubble detection algorithms, the centroid (cx, cy) is evaluated for enclosure within the magnified bounds: xstart ≤ cx ≤ xend and ystart ≤ cy ≤ yend. Qualifying contours are remapped to local coordinates relative to the subregion origin via Clocal = Cglobal − (xstart, ystart). These localized contours are overlaid onto Iregion employing the cv2.drawContours function from the OpenCV library, with color-encoded visualization: green for crater detections, and yellow for bright-line identifications [25]. The annotated subregion is then upsampled by a user-specified zoom factor Z (ranging from 2.0 to 8.0) using nearest-neighbor interpolation:
where and .
Izoomed = cv2.resize (Iregion, (WZ, HZ), interpolation = INTER_NEAREST)
This interpolation scheme was selected to maintain edge acuity and preclude blurring artifacts inherent to bilinear or bicubic methods, thereby facilitating the precise on-screen inspection of fine morphological details.
5. Results
The experimental results regarding the microgeometry obtained on surfaces of the studied CoCr alloys, NE and Soft systems, by the two types of machining, EDM, and EDM+US at semi finishing working modes were presented in synthesis, and comparatively in Table 4. Although we tried to cover all the above-mentioned parameters, not all images provided by SEM were relevant, because they did not capture zones with enough craters from the statistic point of view. So, we kept only those that depict relevance for the goal of the research, which was to point out the major possibilities to increase performances of EDM by US hybrid machining.
Table 4.
Comparative experimental results.
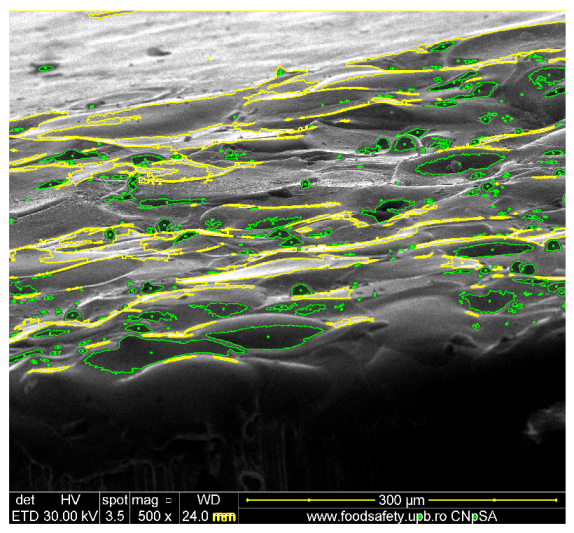
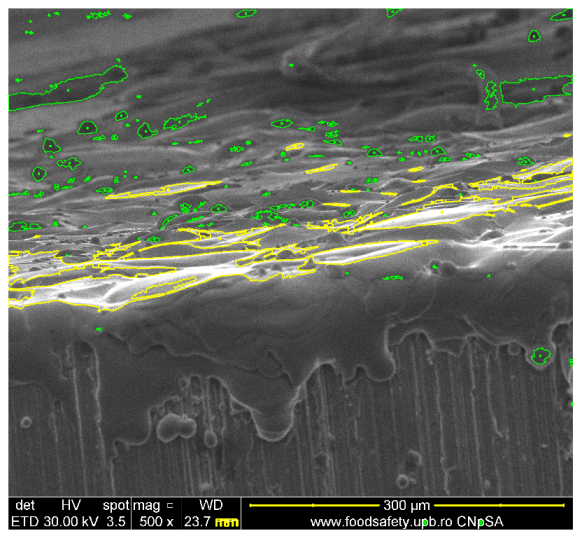
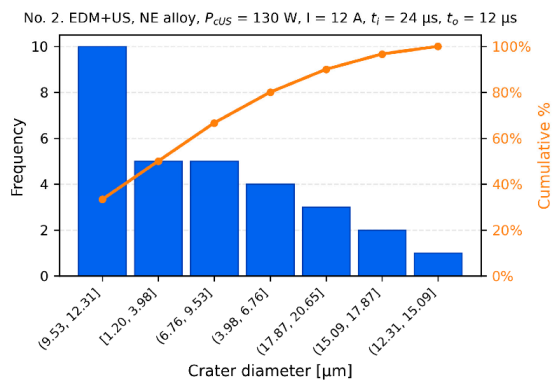
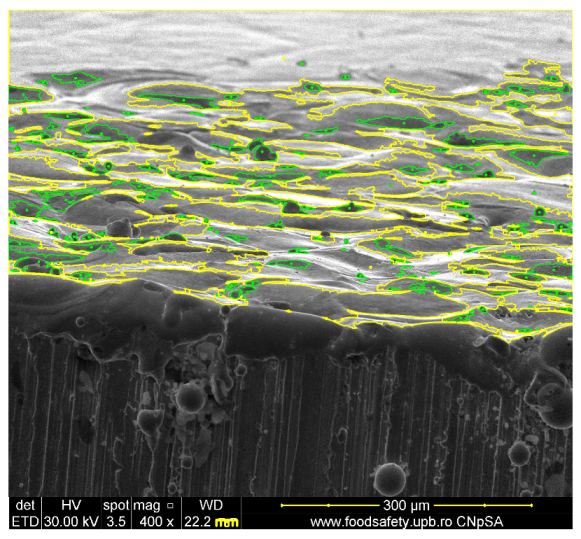
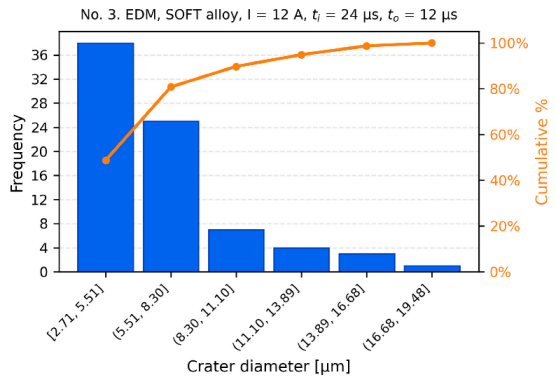
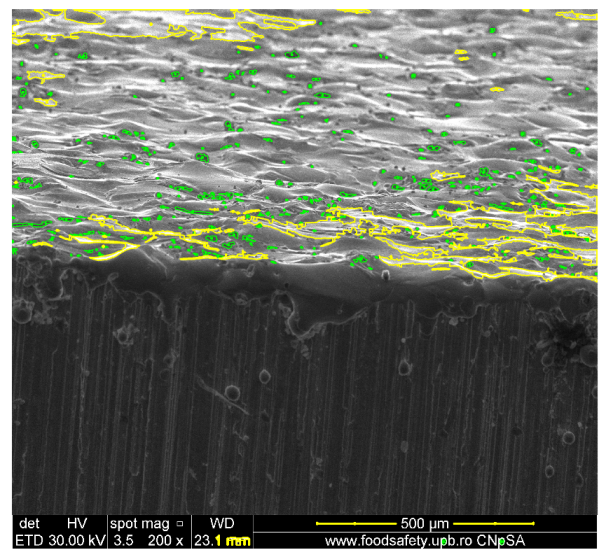
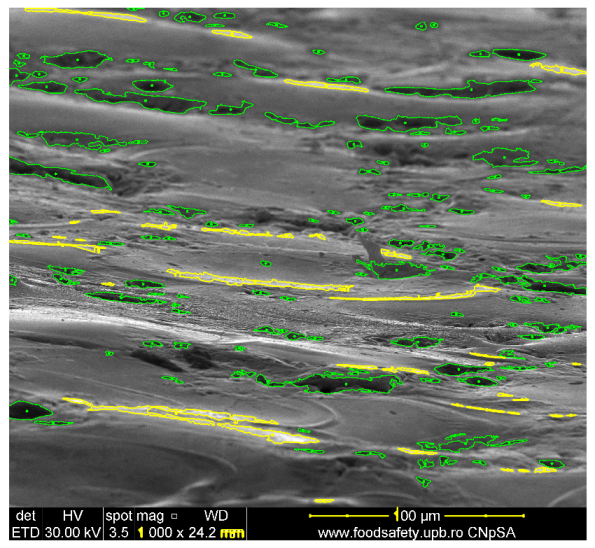
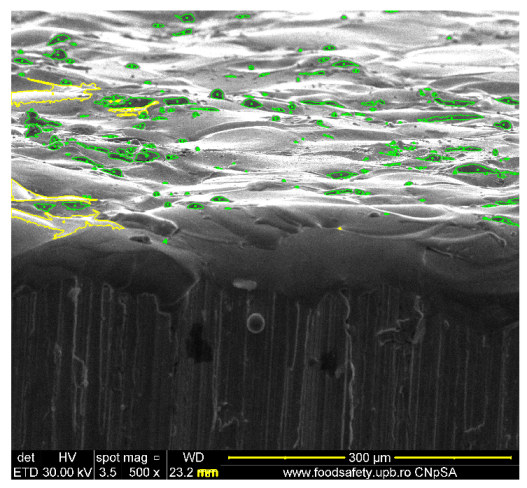
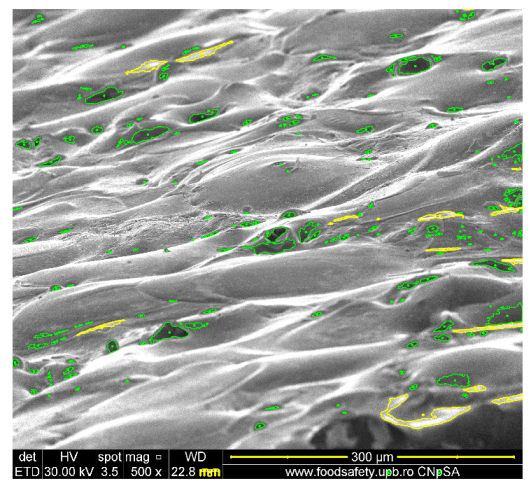
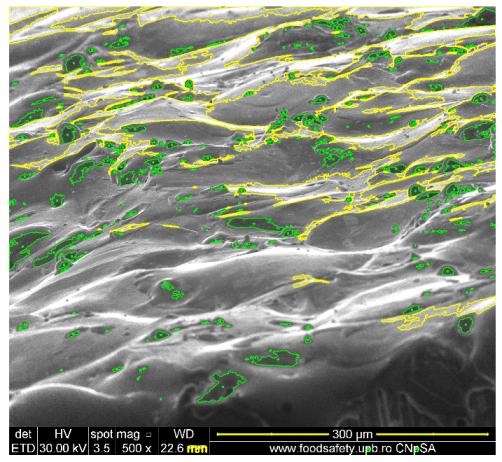
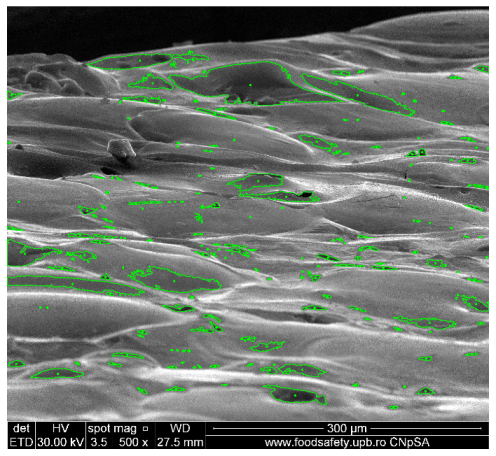
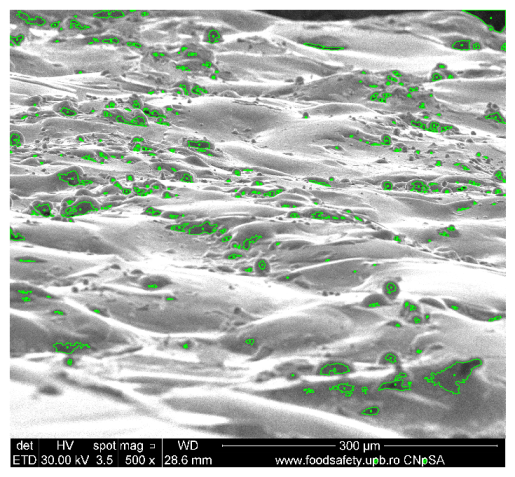
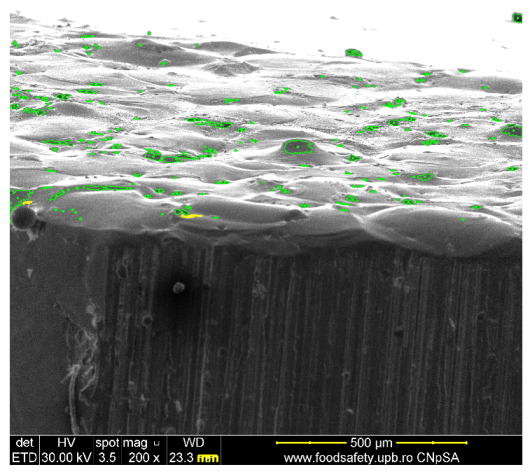
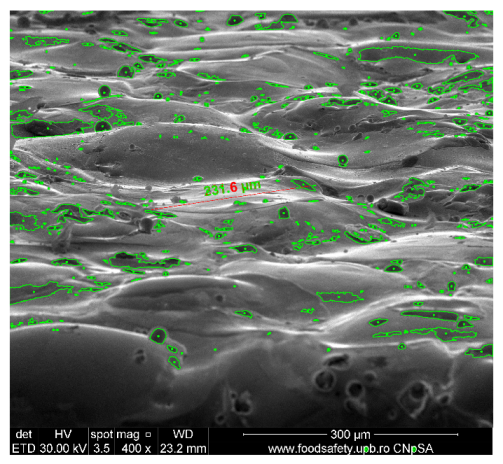
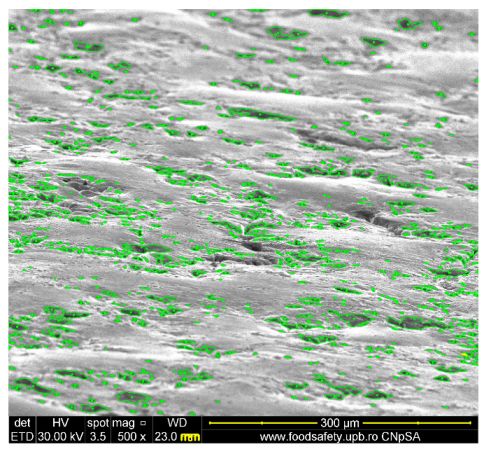
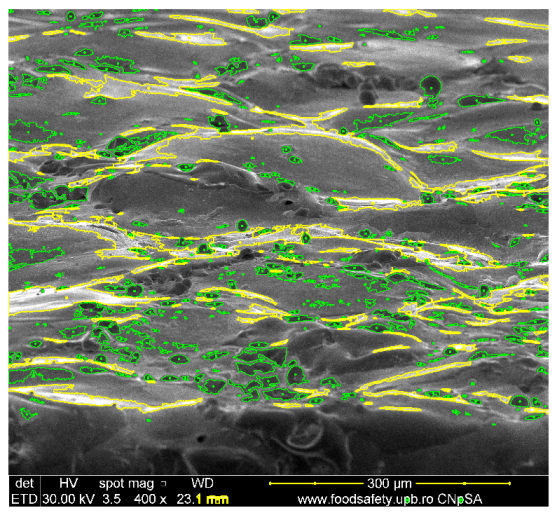
The Computer Vision (CV) was used to scan the images from SEM of machined surface by EDM and EDM+US, marking with green the microvalleys (micro-craters), and yellow the micropeaks as presented in Table 5, (left side). Using SEM, actual dimensional values could be extracted from the images. The computer vision system used the length reference in each photograph to rigorously determine every crater dimension, providing a statistical dataset. These data were subsequently processed to obtain the proportion of normal discharges and the average crater diameter for each image and its corresponding machining parameters. Therefore, data provided by CV instruments provided several categories of information among others, all values of crater diameters, which were processed taking into account that the swept surface was inclined against the horizonal plane at an SEM device to have a more realistic image of a machined surface, including the depth of the microgeometry. Then all data were imported into Microsoft Office Excel files in order to make a classification of crater diameter aiming at the evaluation of EDM processes through material removal mechanisms.
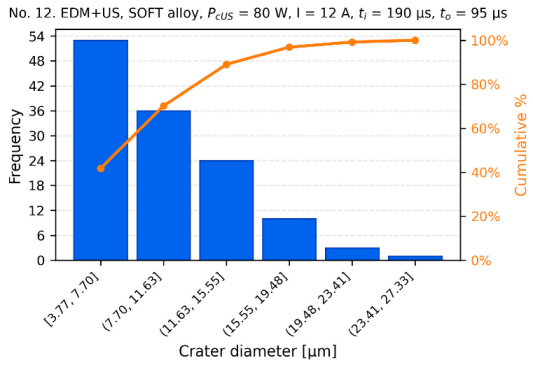
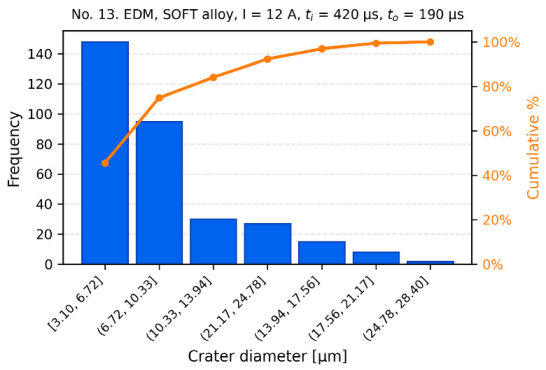
Table 5.
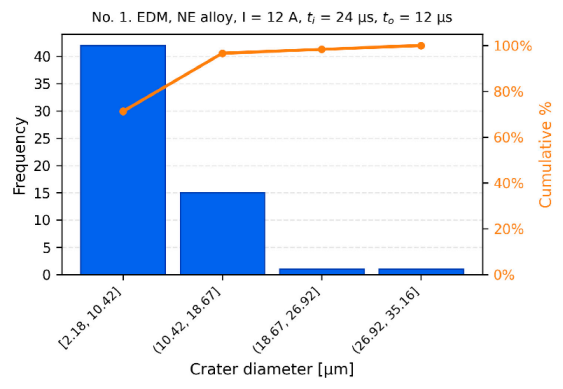
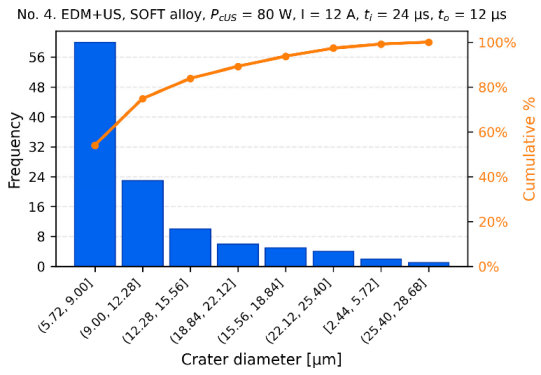
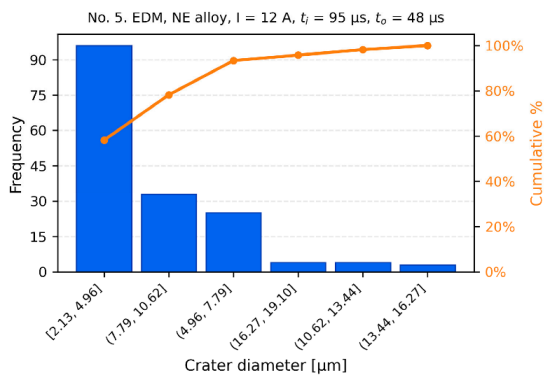
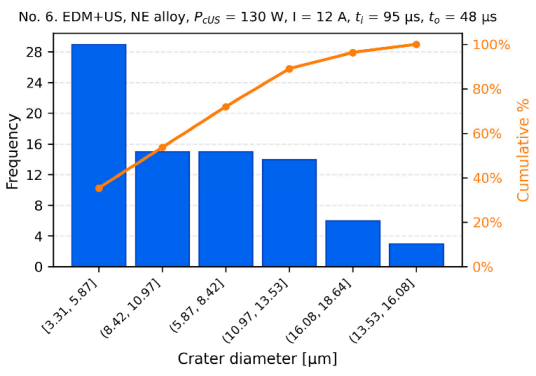
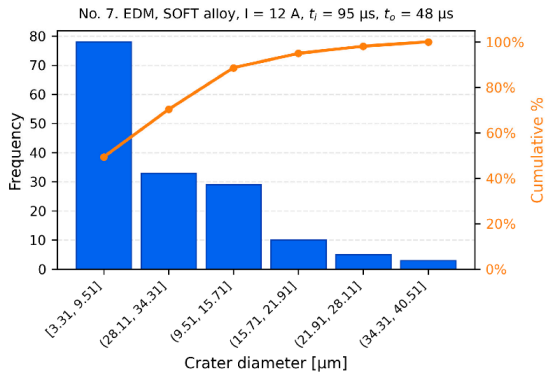
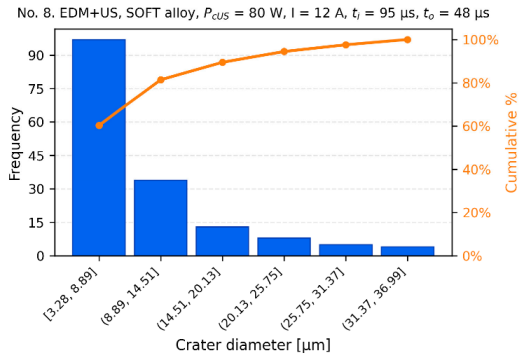
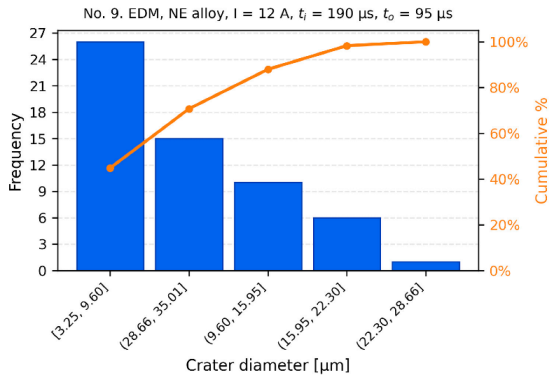
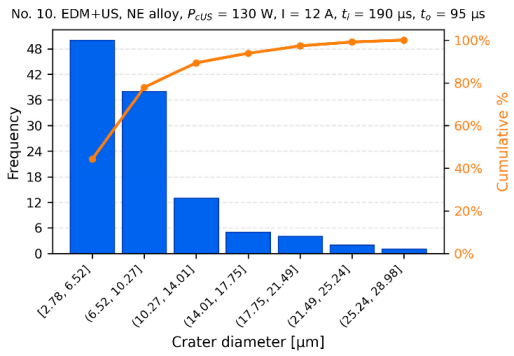
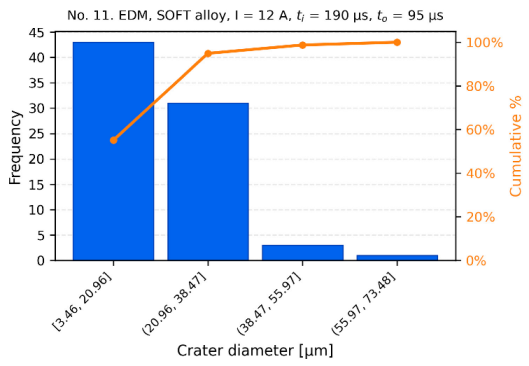
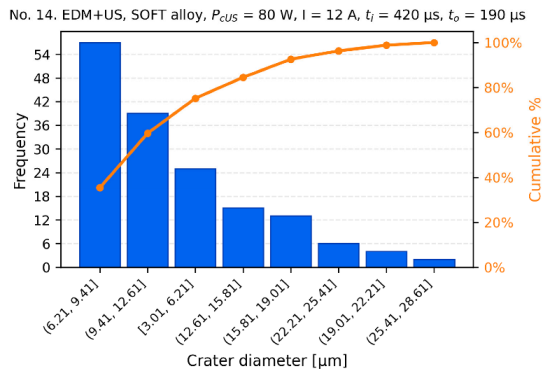
SEM images of machined surfaces and corresponding histograms of craters’ diameters.
Each crater was considered the result of a discharge produced during the EDM process. As it is known, the discharges could be characterized or discriminated like these: (a) normal (stabile process) when the discharge takes its energy from the plasma column as the dielectric liquid is broken down, after the initial stage of electronic and ionic bombardment; (b) short-circuit, contact between surfaces of the tool and the workpiece, and even arcing between those surfaces, a degenerated material removal process; (c) false discharges, produced between conductive particles removed from the material of a workpiece and tool-electrode, and the machined surface; (d) discharges produced after a relatively long delay time due to a large frontal gap, considerably reducing the energy that reached the machined surface. Consequently, the crater dimensions correspond to the following categories: normal (a); large dimensions (b) due to short-circuit and arcing; small dimensions (c) produced by false and delayed discharges. It is very difficult to establish the limits of these categories, which are strongly influenced by all the influencing factors of the EDM process that has a stochastic nature. It could be considered that for a 12 A working current, the ratio of normal discharges is around 30–50% from the total of discharges during a stabile EDM process [26,27,28], so the ratio of normal crater dimensions should belong to this interval. It should be mentioned that at microEDM, because of the narrow working gap, this ration could be much lower [29]. Therefore, two thresholds were set for each processing regime: a higher one, separating crater sizes caused by short-circuits or arcing between the tool and workpiece from those produced by normal discharges (HT—high threshold); a lower one, separating craters from false discharges and delayed discharges from those from normal discharges (LT—low threshold).
On histogram distributions of craters diameters provided by CV instruments created by Microsoft Office Excel, a maximum number of bins were used, thus all having at least one value contained in each histogram-corresponding interval. The histograms from Table 5 (the right part), corresponding to SEM images with microvalleys and micropeaks marked by CV instruments, were ordered by decreasing the values of each of them. In the upper part of the graph, the red curve is a Pareto one, depicting the cumulative values of each histogram up to 100% (on the right), and frequency of values appearance (on the left).
Considering that growing the pulse time (ti) and keeping the current I constant, the discharge energy increased at ti growing. So, the values of LT and HT were increased at ti ascending and kept the same for both alloys studied. Thus, the values of these thresholds at each working regime are presented in Table 4, and therefore the average of normal craters could serve further to numerical simulations of thermal and mechanical phenomena governing the EDM and EDM+US material removal processes.
6. Discussion
Analyzing all the data provided by CV of machined surfaces by EDM and EDM+US, for any values of delimiting thresholds, LT and HT, the ratio of normal discharges (the craters’ diameters between the two thresholds) from total discharges number was superior in some cases, even with more than 20%, at hybrid machining comparing to classic EDM, with an exemption. At the lowest pulse time, ti = 24 µs, the stability at EDM is superior but still close to EDM+US. Apart from that, at simple EDM, they were in interval 41.46–63.22%. So, the ultrasonic component at hybrid machining raised the interval of considered stability at 56–78.26%. This could be explained by the effect of ultrasonically induced cavitation within the frontal gap at the ultrasonic vibration of the tool-electrode that produces a local pressure of 100 MPa order of magnitude. This decreases with the square of the distance from the place of the implosion to the current point [30]. This phenomenon contributes to the superior evacuation of removed particles from the gap and significantly reduces the false discharges between them and machined surfaces, reducing also the short-circuits and arcing determined by particle accumulation that were not evacuated enough from the gap in the case of classic EDM [1].
For certain working regimes, it can be observed that at classic EDM, most discharges could be false ones or delayed since they were in the interval inferior to that of normal discharges like at no. 5 and 13 probes. At homologous regimes of hybrid machining, this similar interval was much reduced due to a better evacuation of the debris and reducing the lack of ignition due to the retraction of the tool.
The values of mean diameters were calculated from experimental data, only at craters produced by normal discharges, after discrimination through criteria from above, eliminating those supposed to be provided by false and short-circuit or arc discharges. They have increased values as expected, since pulse time increased in interval 24–420 µs, and consequently, discharged energies. These mean values will be used further for numerical simulations.
When comparing the craters’ dimensions at the two studied alloys, it could be noted that these were greater in the case of SOFT alloy, which denotes a higher machinability by EDM, first of all due to lower melting temperatures, Tm = 1345–1385 °C [31] against Tm = 1405–1420 °C System NE [32], and as the others thermo-physical parameters are comparable: thermal conductivity, density (a slightly higher at NE, but compensated by Tm).
Finally, the crater dimensions at US hybrid machining were smaller than homologous ones from classic EDM, except in the cases with ti = 24 µs. Even though it is supposed that US increases the removed volume through the use of an additional mechanical-hydraulic component from a material removal mechanism, the shock waves oriented parallel to machined surface microgeometry could remove only the profile micropeaks, and the margins of the craters that have rims consisted of melted material resolidified. Thus, the roughness of machined surfaces could be reduced [1]. This mechanical removal process can only be a benefit if the consumed power on the ultrasonic chain (PcUS) that integrates the tool-electrode at its end is optimized. The values used were PcUS = 130 W for NE alloy hybrid machining, and PcUS = 80 W, for SOFT alloy, corresponding to distinct values of ultrasonic pressure that produced Ra roughness decrease in agreement to numerical simulation results. This is justified by differences in the resistance characteristics of the studied alloys.
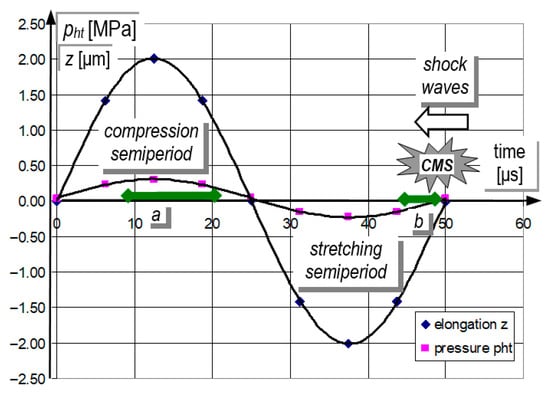
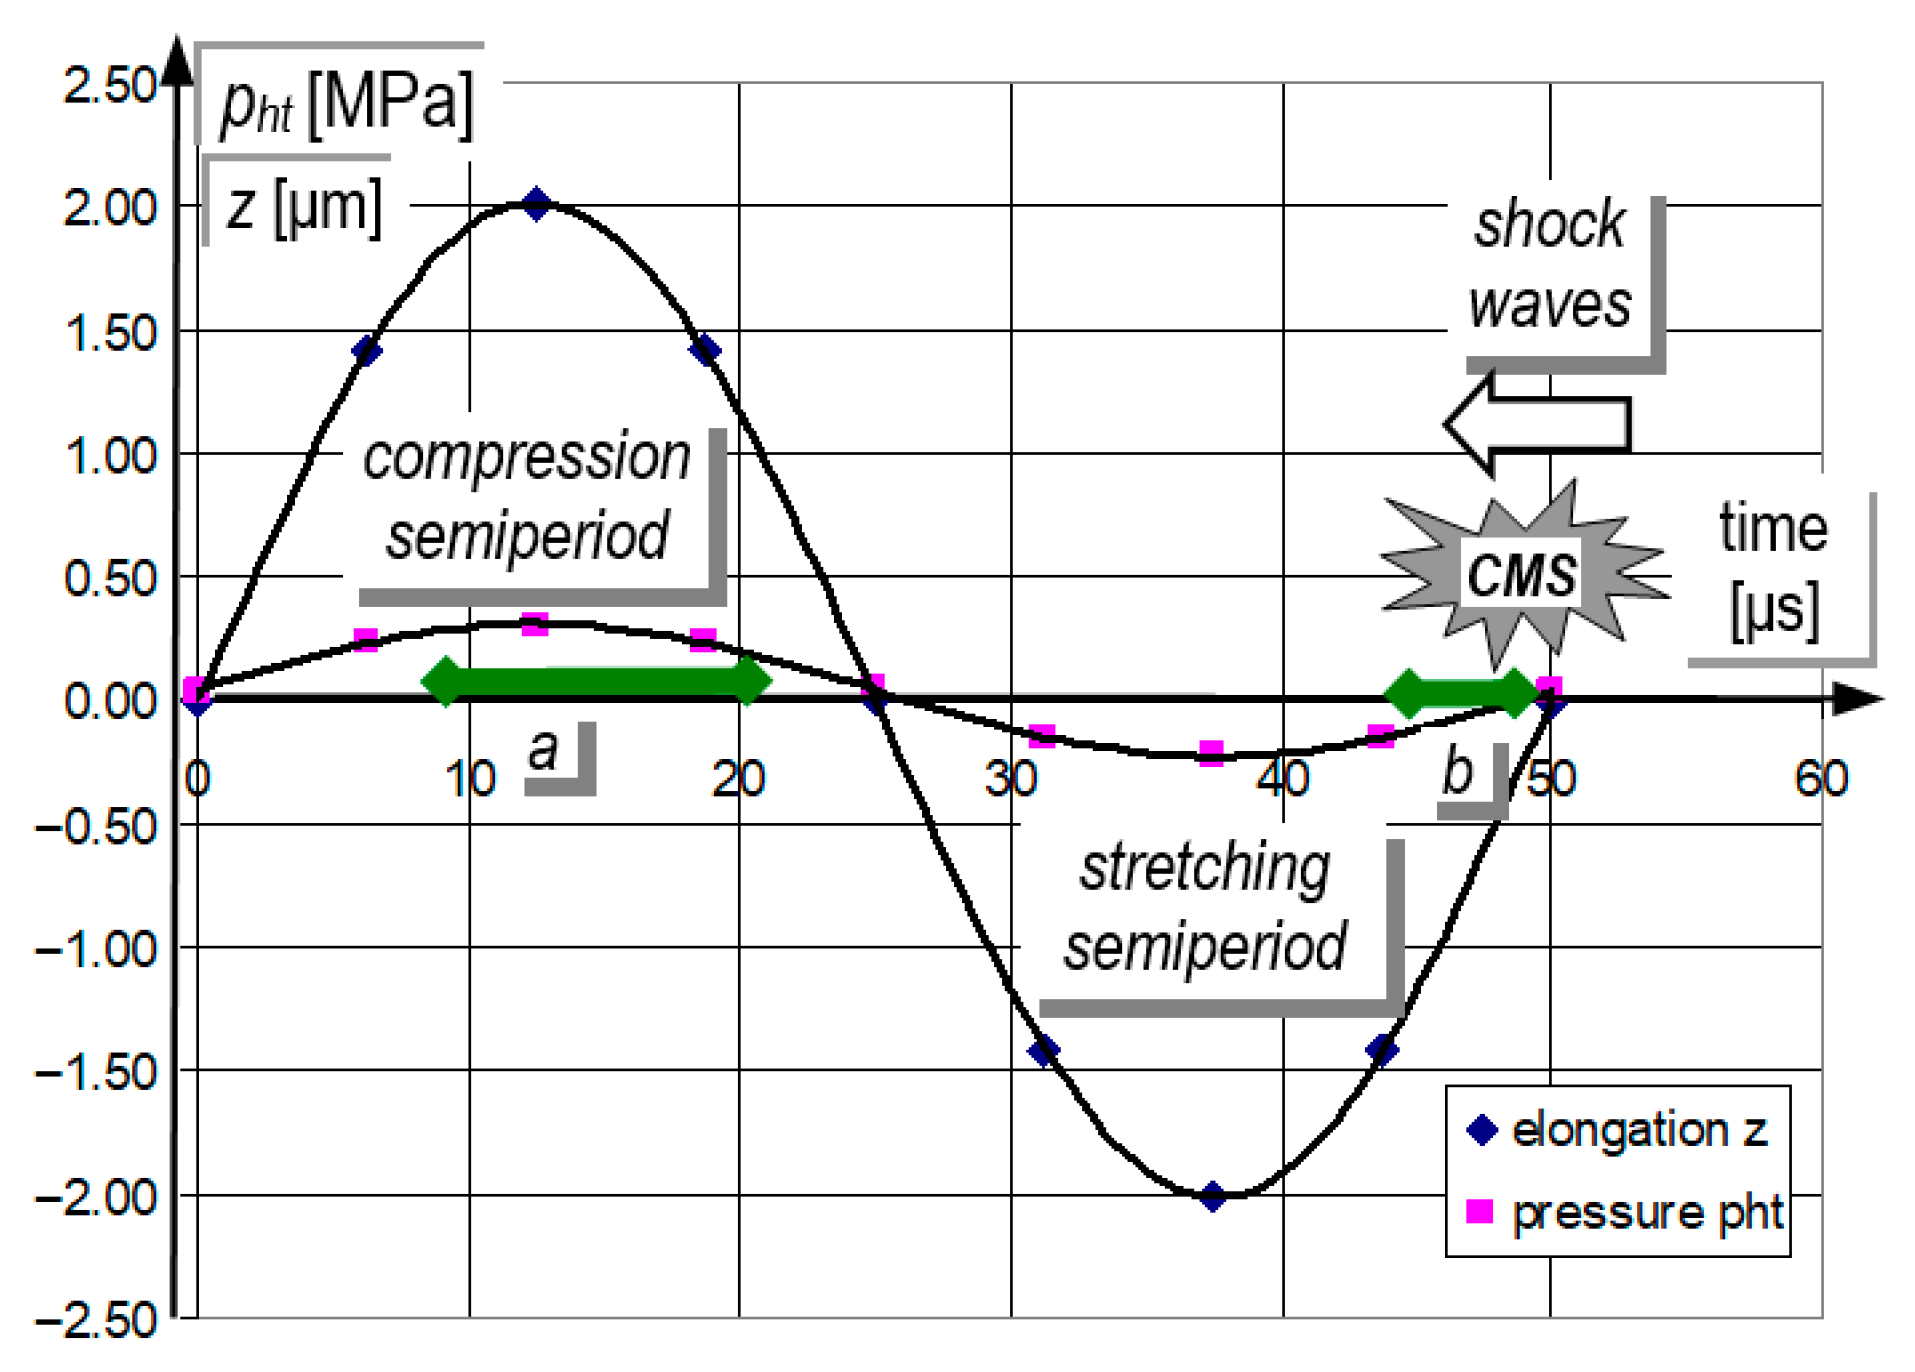
The thermal component produced by EDM under conditions of ultrasonic hybridization become dominant only if the gas bubble formed around the plasma channel implodes at the end of any ultrasonic period, at the finale of a stretching semi period (cumulative microjets stage—CMS). Figure 2 is overlapping EDM pulse duration, position (b).
Figure 2.
Elongation and pressure in working gap within ultrasonic period of TUS = 50 μs.
So, the hydraulic forces of dielectric liquid could remove the melted material by discharge from a workpiece, after the bubble implosion. According to our experimental observations, the discharge could be stopped at the moment of CMS occurrence.
The modeling of ultrasonically induced cavitation in the working gap is focused on the total hydraulic pressure (pht) created within the gap that was calculated with [1]:
where c is sound velocity in dielectric liquid [m/s]; ρ—density of dielectric liquid, in this case the oil P3 [kg/m3]; fUS is ultrasonic frequency [Hz]; A is amplitude of elongation z, normal on machined surface [m]; ω = 2π fUS [s−1]; phl is local hydraulic pressure [Pa]. In this case, the parameters’ values were: phl = 0.04 MPa, ρ = 840 kg/m3, K = 1.35 × 10⁹ Pa (K—bulk modulus), c = (K/ρ)1/2 = 1267.7 m/s, A = 2 μm, fUS = 20 kHz.
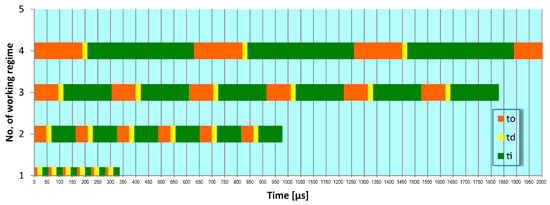
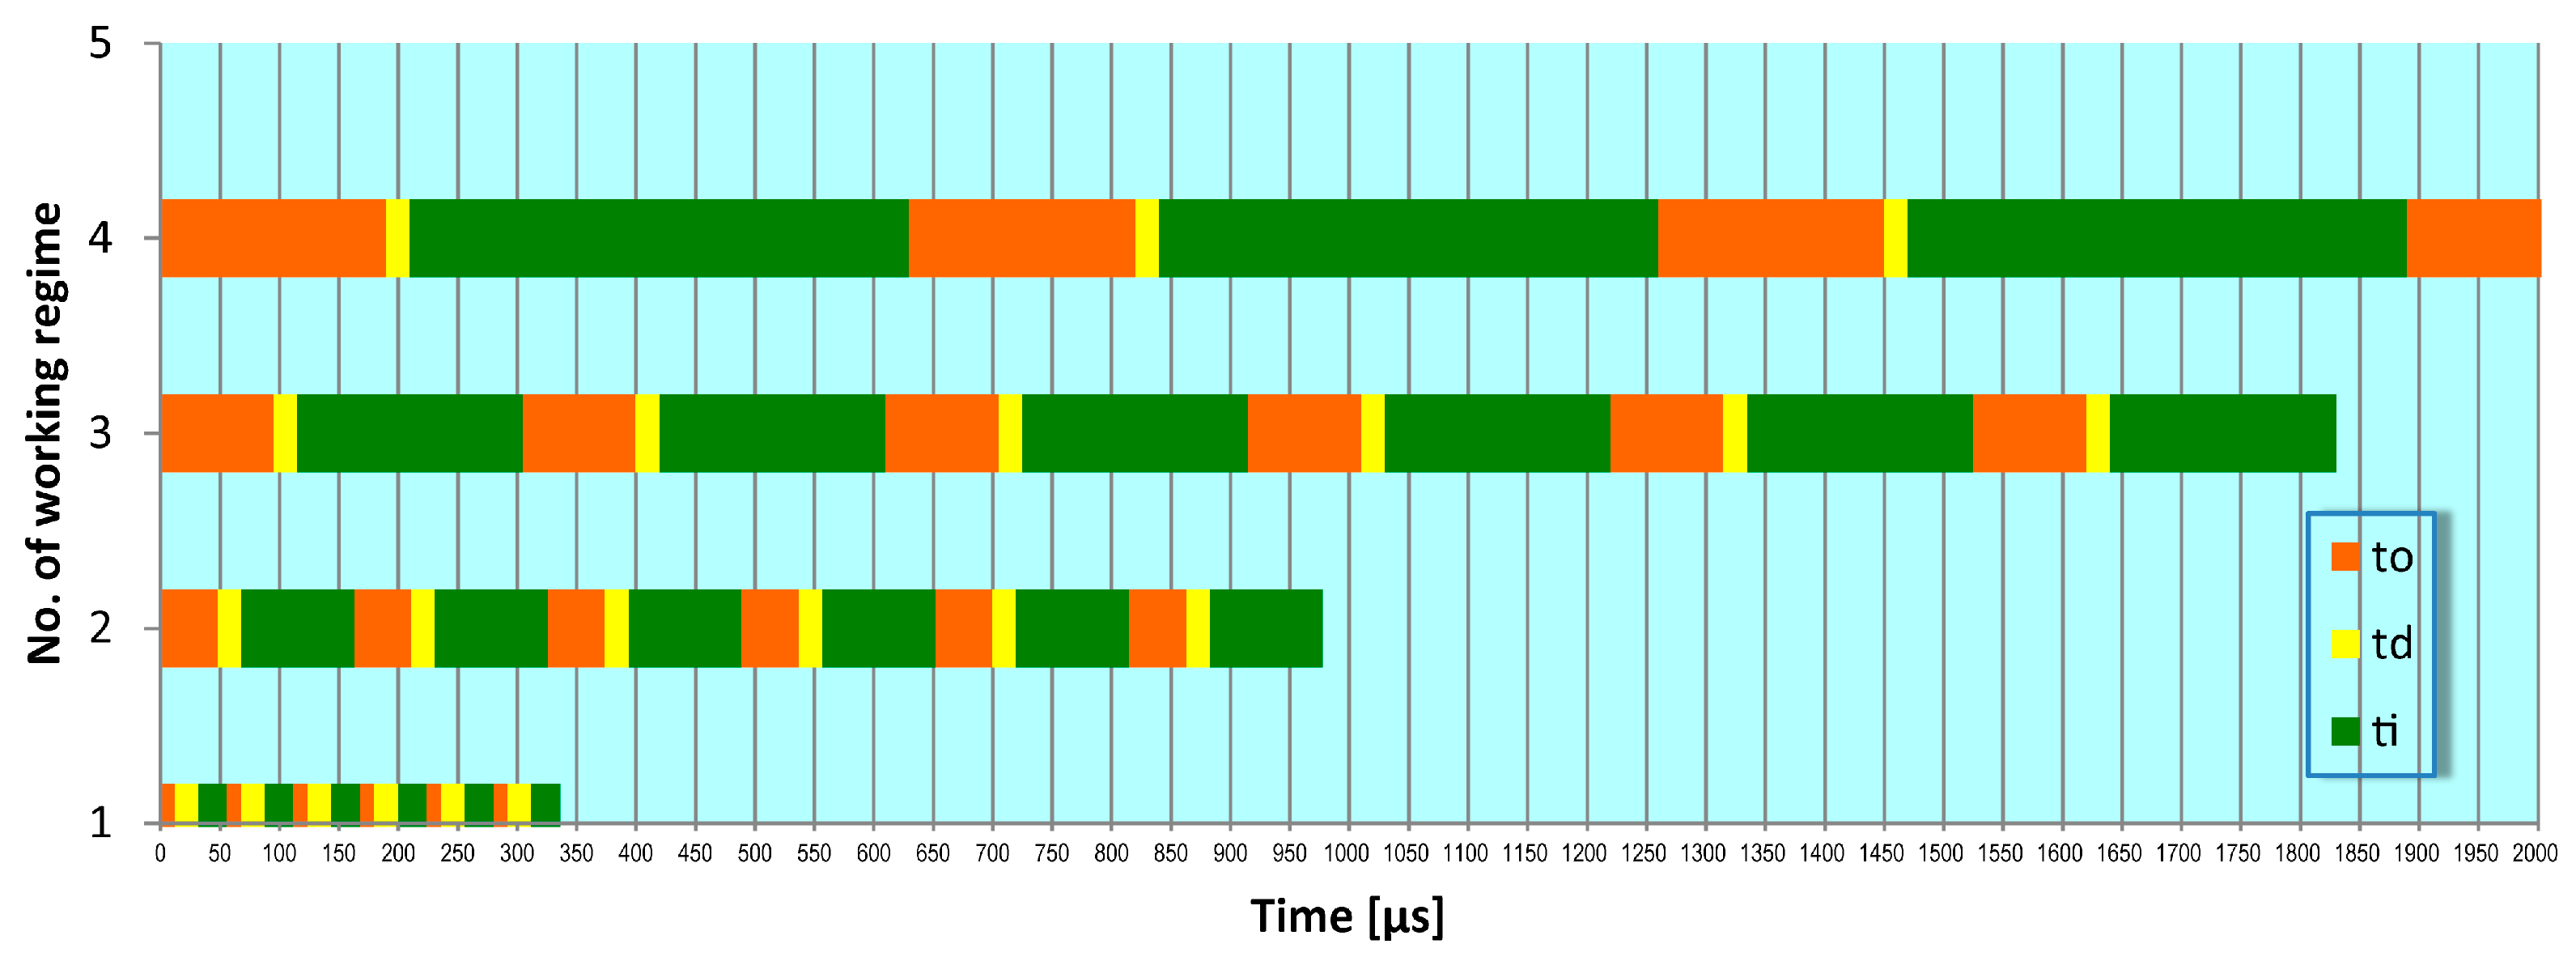
The probability of producing this overlapping is presented in Figure 3, demonstrating the ratio between the number of intersections of black vertical lines and green zones on number of periods in a certain time interval. In our case, the ultrasonic period is Tus = 50 µs (at frequency 20 kHz). One can notice that at a small pulse time ti = 24 µs, this probability is P = 50%, and at a longer pulse time, like ti = 95 µs; 190 µs; ti = 420 µs; to = 190 µs, P = 100%. However, not all the discharges are considered normal; therefore, to determine the potential of overlapping the CMS on pulse time, the ratio of normal discharges nd on total number of discharges should be considered. So, for ti = 24 µs, and nd = 50%, the altered probability becomes, P* = P × nd = 25%, and for the rest of the longer pulse times, the mean value of nd = 70%, so P* = P × nd = 70%. Moreover, this overlapping could be produced several times during a pulse time, so the effective pulse time could cover several ultrasonic periods of Tus = 50 µs. When this overlapping is not possible, the thermal material removal process occurs normally as at classic EDM position (a) in Figure 2, only with mechanical-hydraulic component that takes off locally the material in solid state at each final of Tus, contributing to surface roughness reduction as craters’ diameters decrease, pointed out experimentally (Figure 3).
Figure 3.
Pulse delivery moments at working modes with I = 12 A, delay time, td = 20 µs: (1) ti = 24 µs; to = 12 µs; (2) ti = 95 µs; to = 48 µs; (3) ti = 190 µs; to = 95 µs; (4) ti = 420 µs; to = 190 µs.
The ignition delay time for a semi-finishing regime of 12 A and an open-circuit (breakdown) voltage of 100 V, with the dielectric being a hydrocarbon-based transformer oil (P3), could be considered around td = 20 µs [33].
The experimental data pointing out the stability of the EDM process is enhanced by US hybridization at a longer pulse time, when the probability (P* ≈ 70%) of overlapping the CMS—collective implosion of gas bubbles, including the one formed around current plasma channel produced by discharge—is over pulse duration. At a lower pulse time, at decreased probability (P* ≈ 20%), the process occurs very similarly to classic EDM, so the stability of the hybrid process compared to the usual process has no major benefits.
7. Numerical Simulation
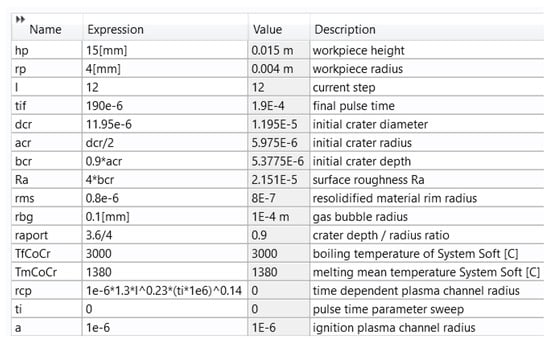
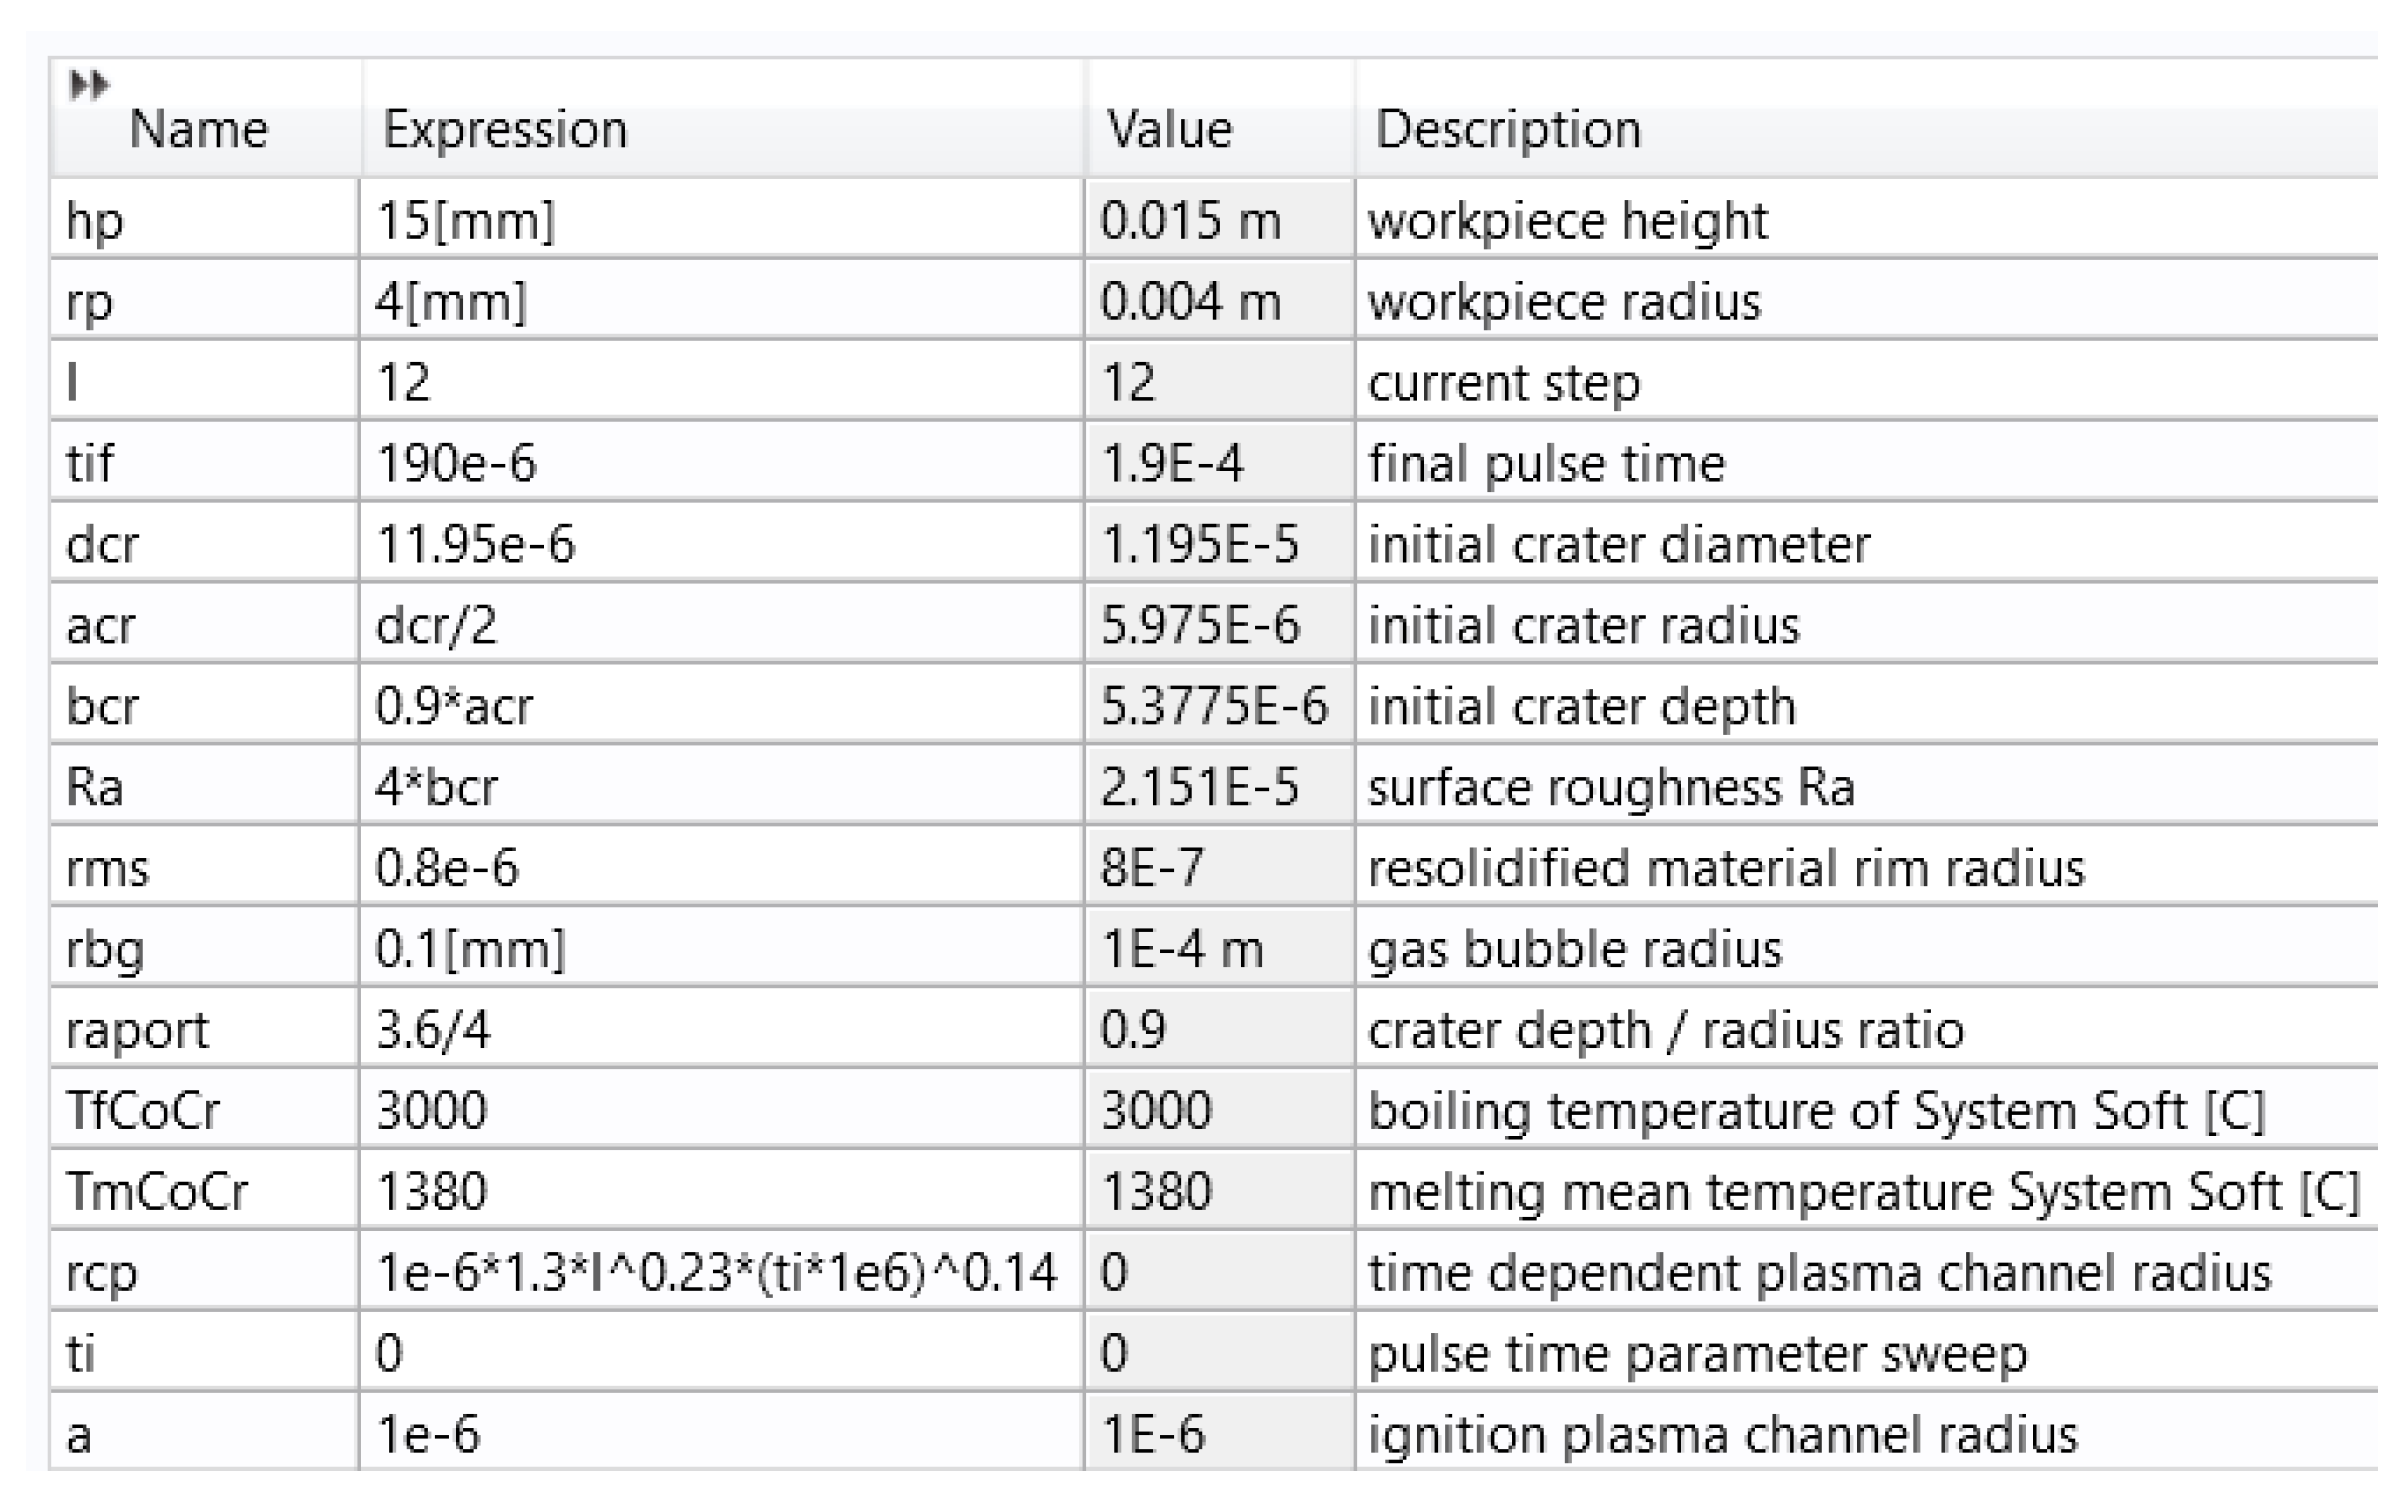
Based on the experimental results discussed above, a numerical simulation of the US hybrid EDM process in comparison to the classic EDM process is approached aiming at better understanding the complexity of the phenomena that governs the material removal process. Comsol Multiphysics 5.5 was used in the first stage, with modules of Heat Transfer in Solids, Time Dependent. A parameterized model was built with the values of technological parameters in Figure 4. Plasma channel radius, rcp was time dependent on pulse time according to the formula [1]:
where I is current step [A]; ti—pulse time [µs].
Figure 4.
Parameters for a workpiece from System Soft machined by EDM and EDM+US.
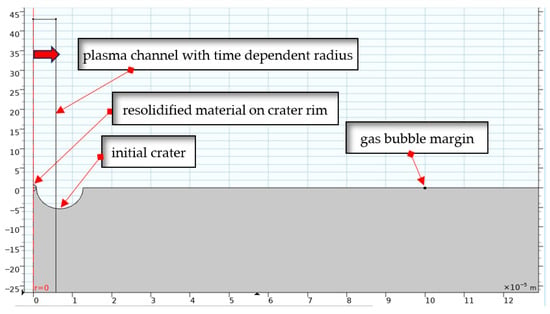
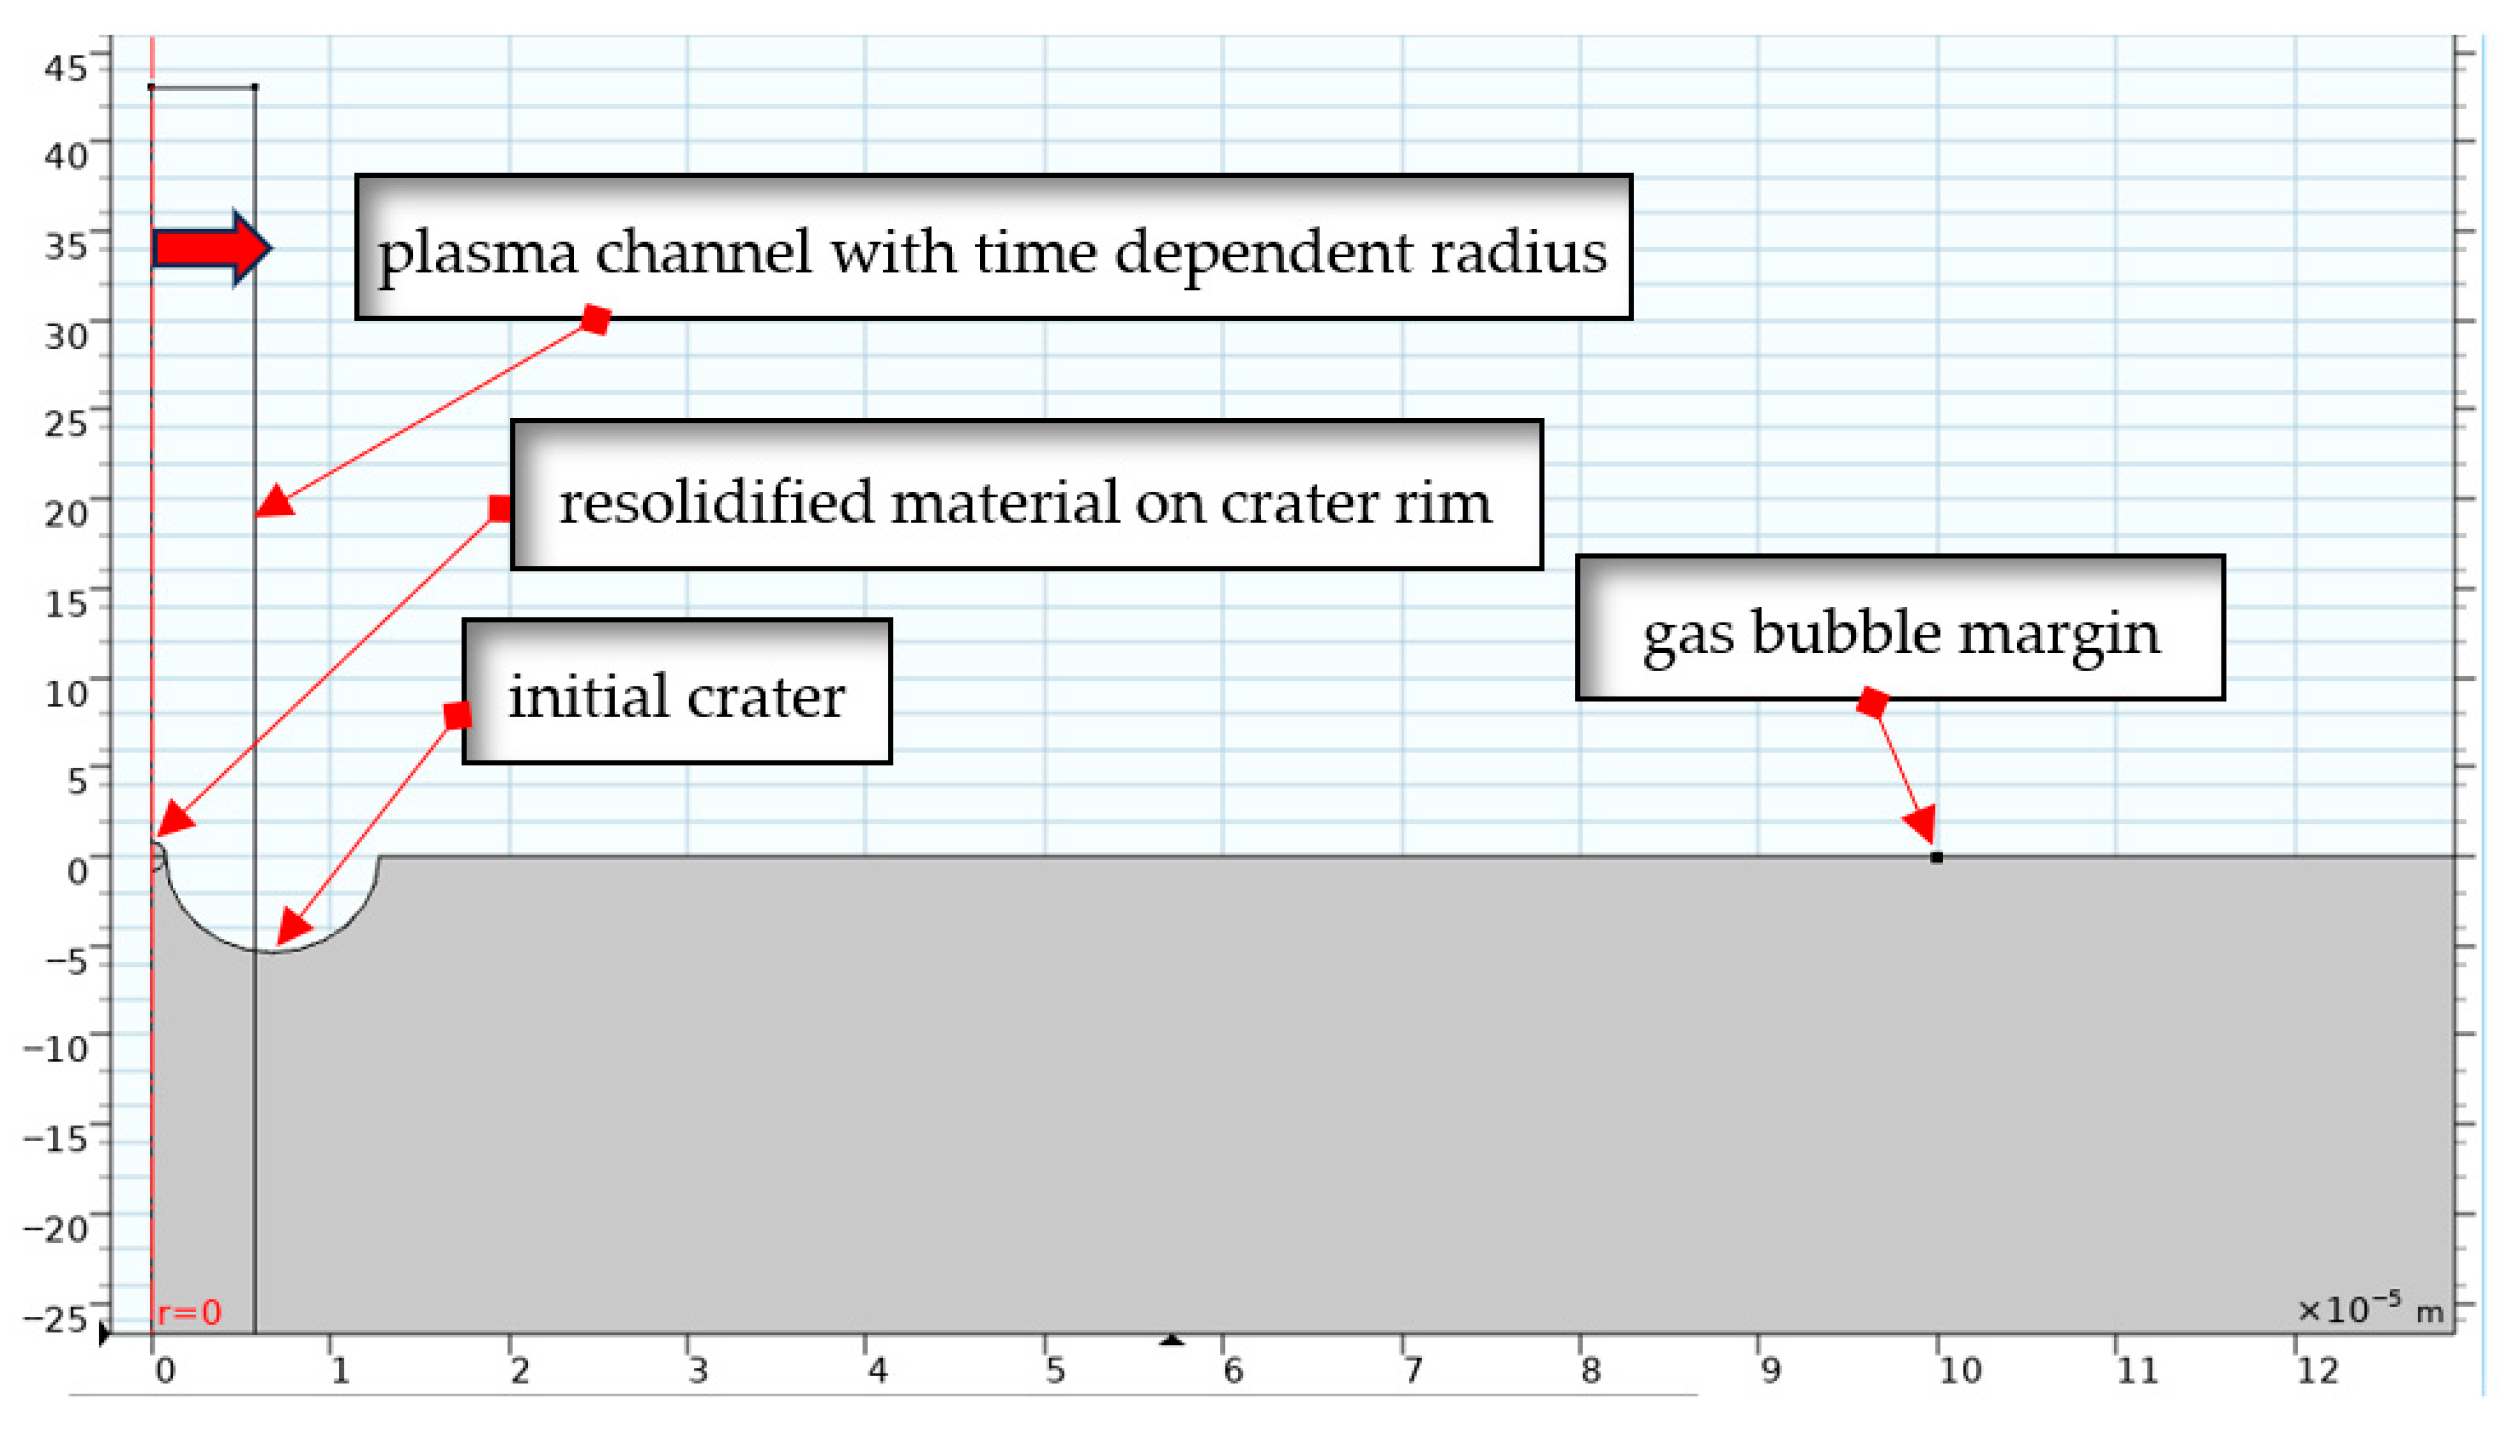
The geometry was created in a 2D axis symmetric dimensional space as it presented in Figure 5, detailed in the interest zone.
Figure 5.
The geometry model in the interest zone.
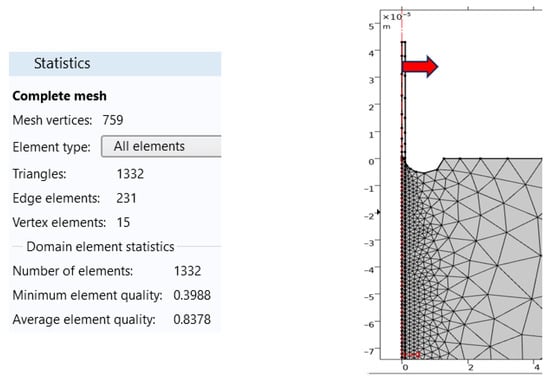
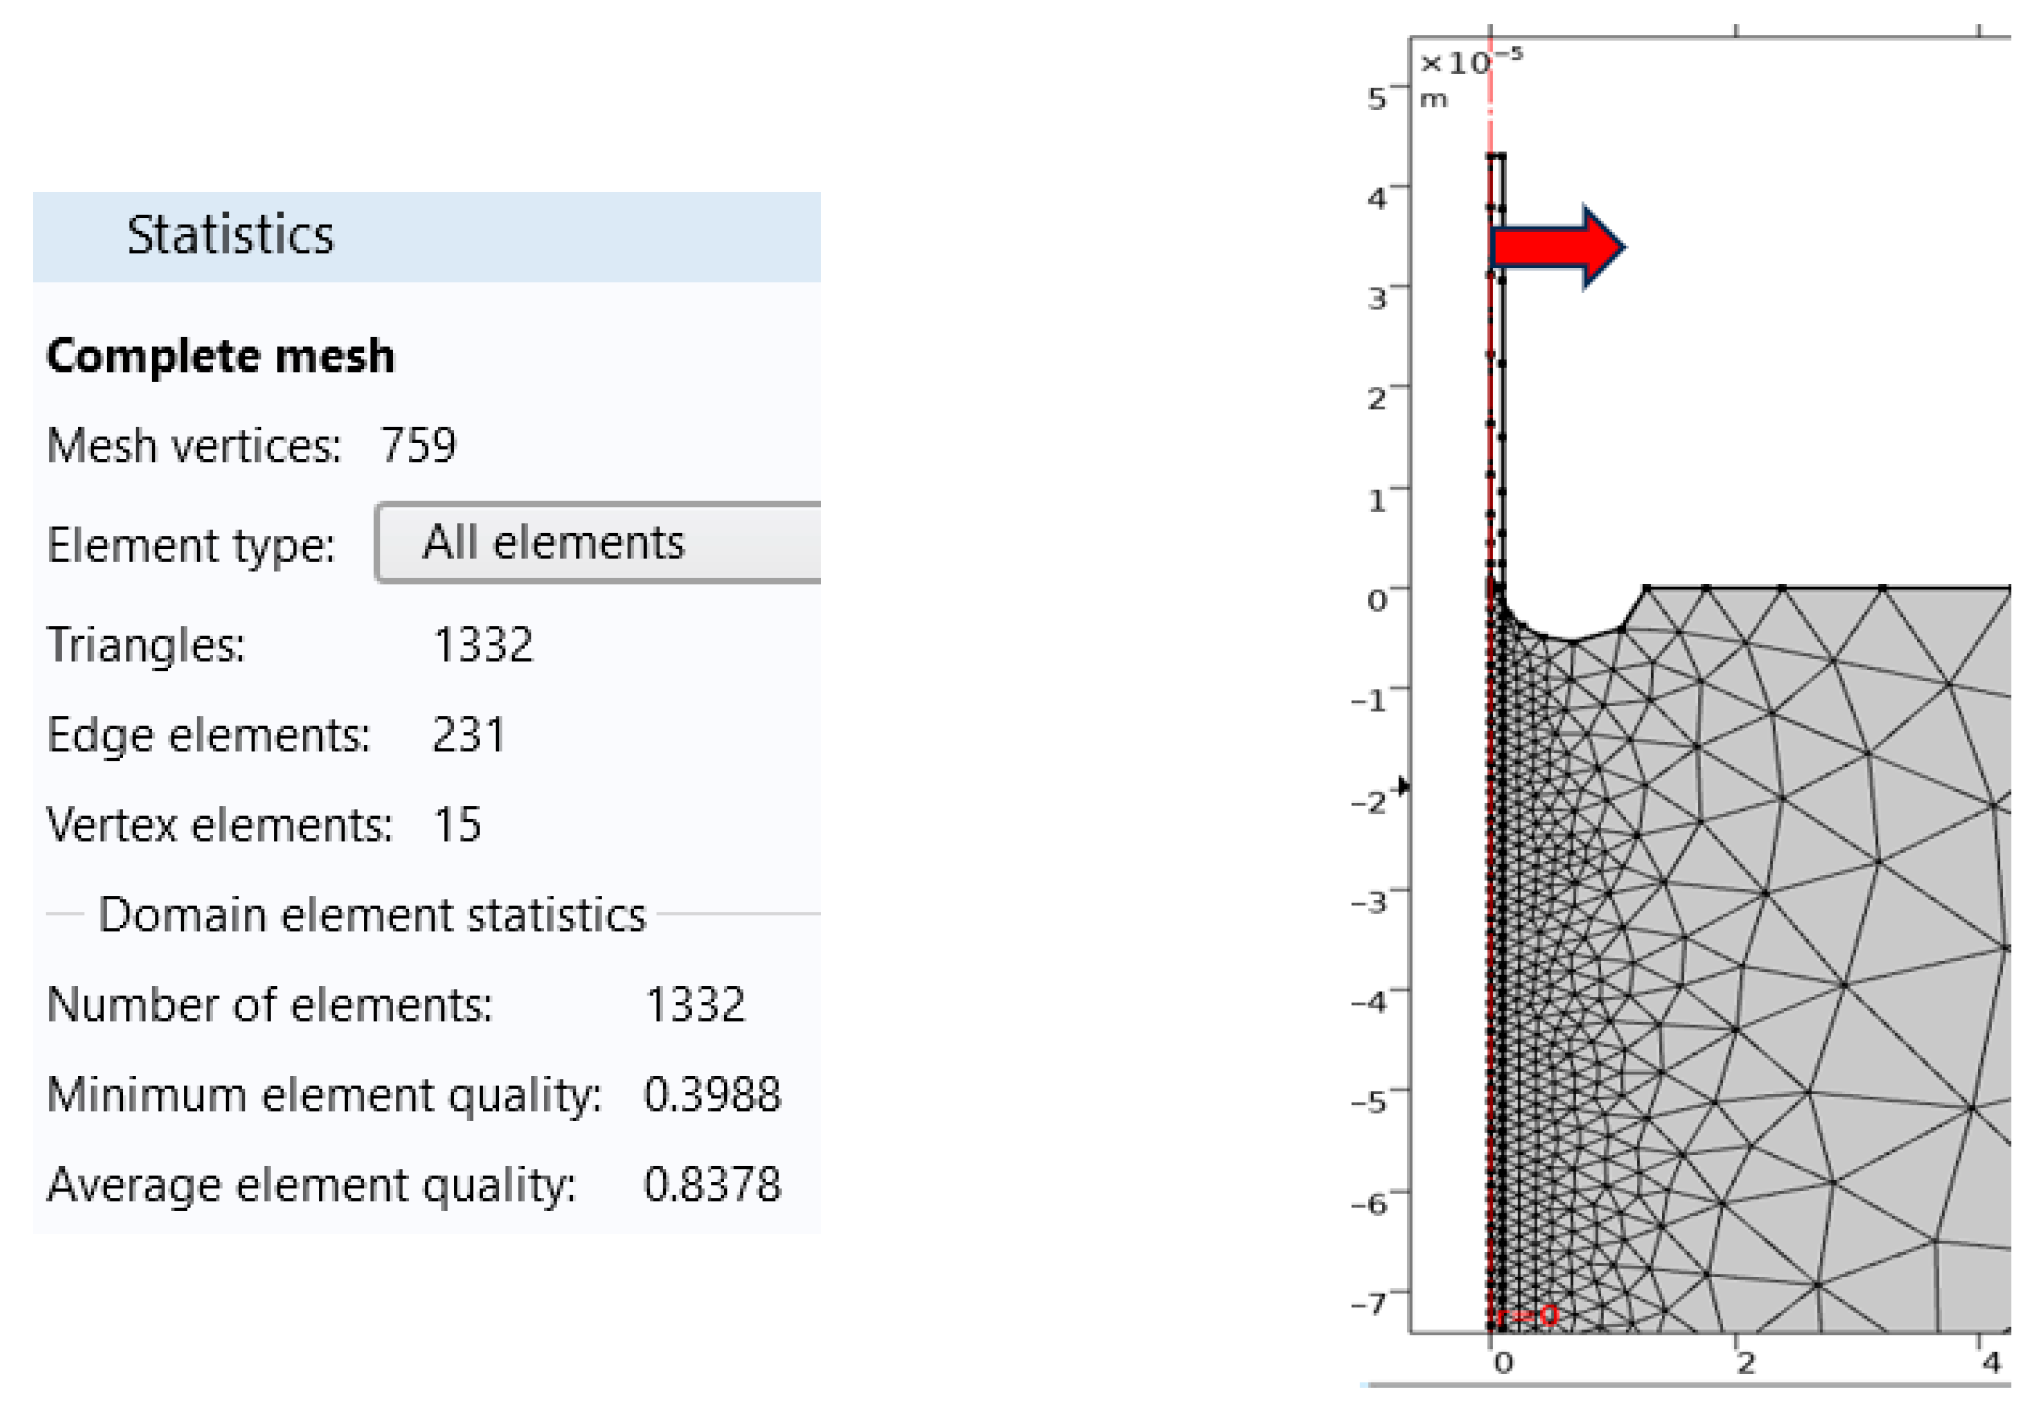
A moving mesh associated with a plasma channel time dependent is created, finer within the interest zone, see Figure 6.
Figure 6.
The dynamic mesh and its statistics.
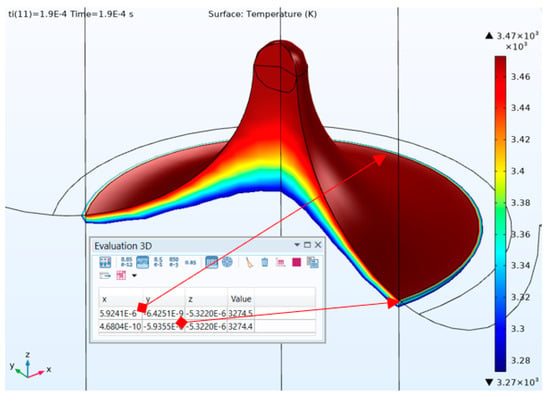
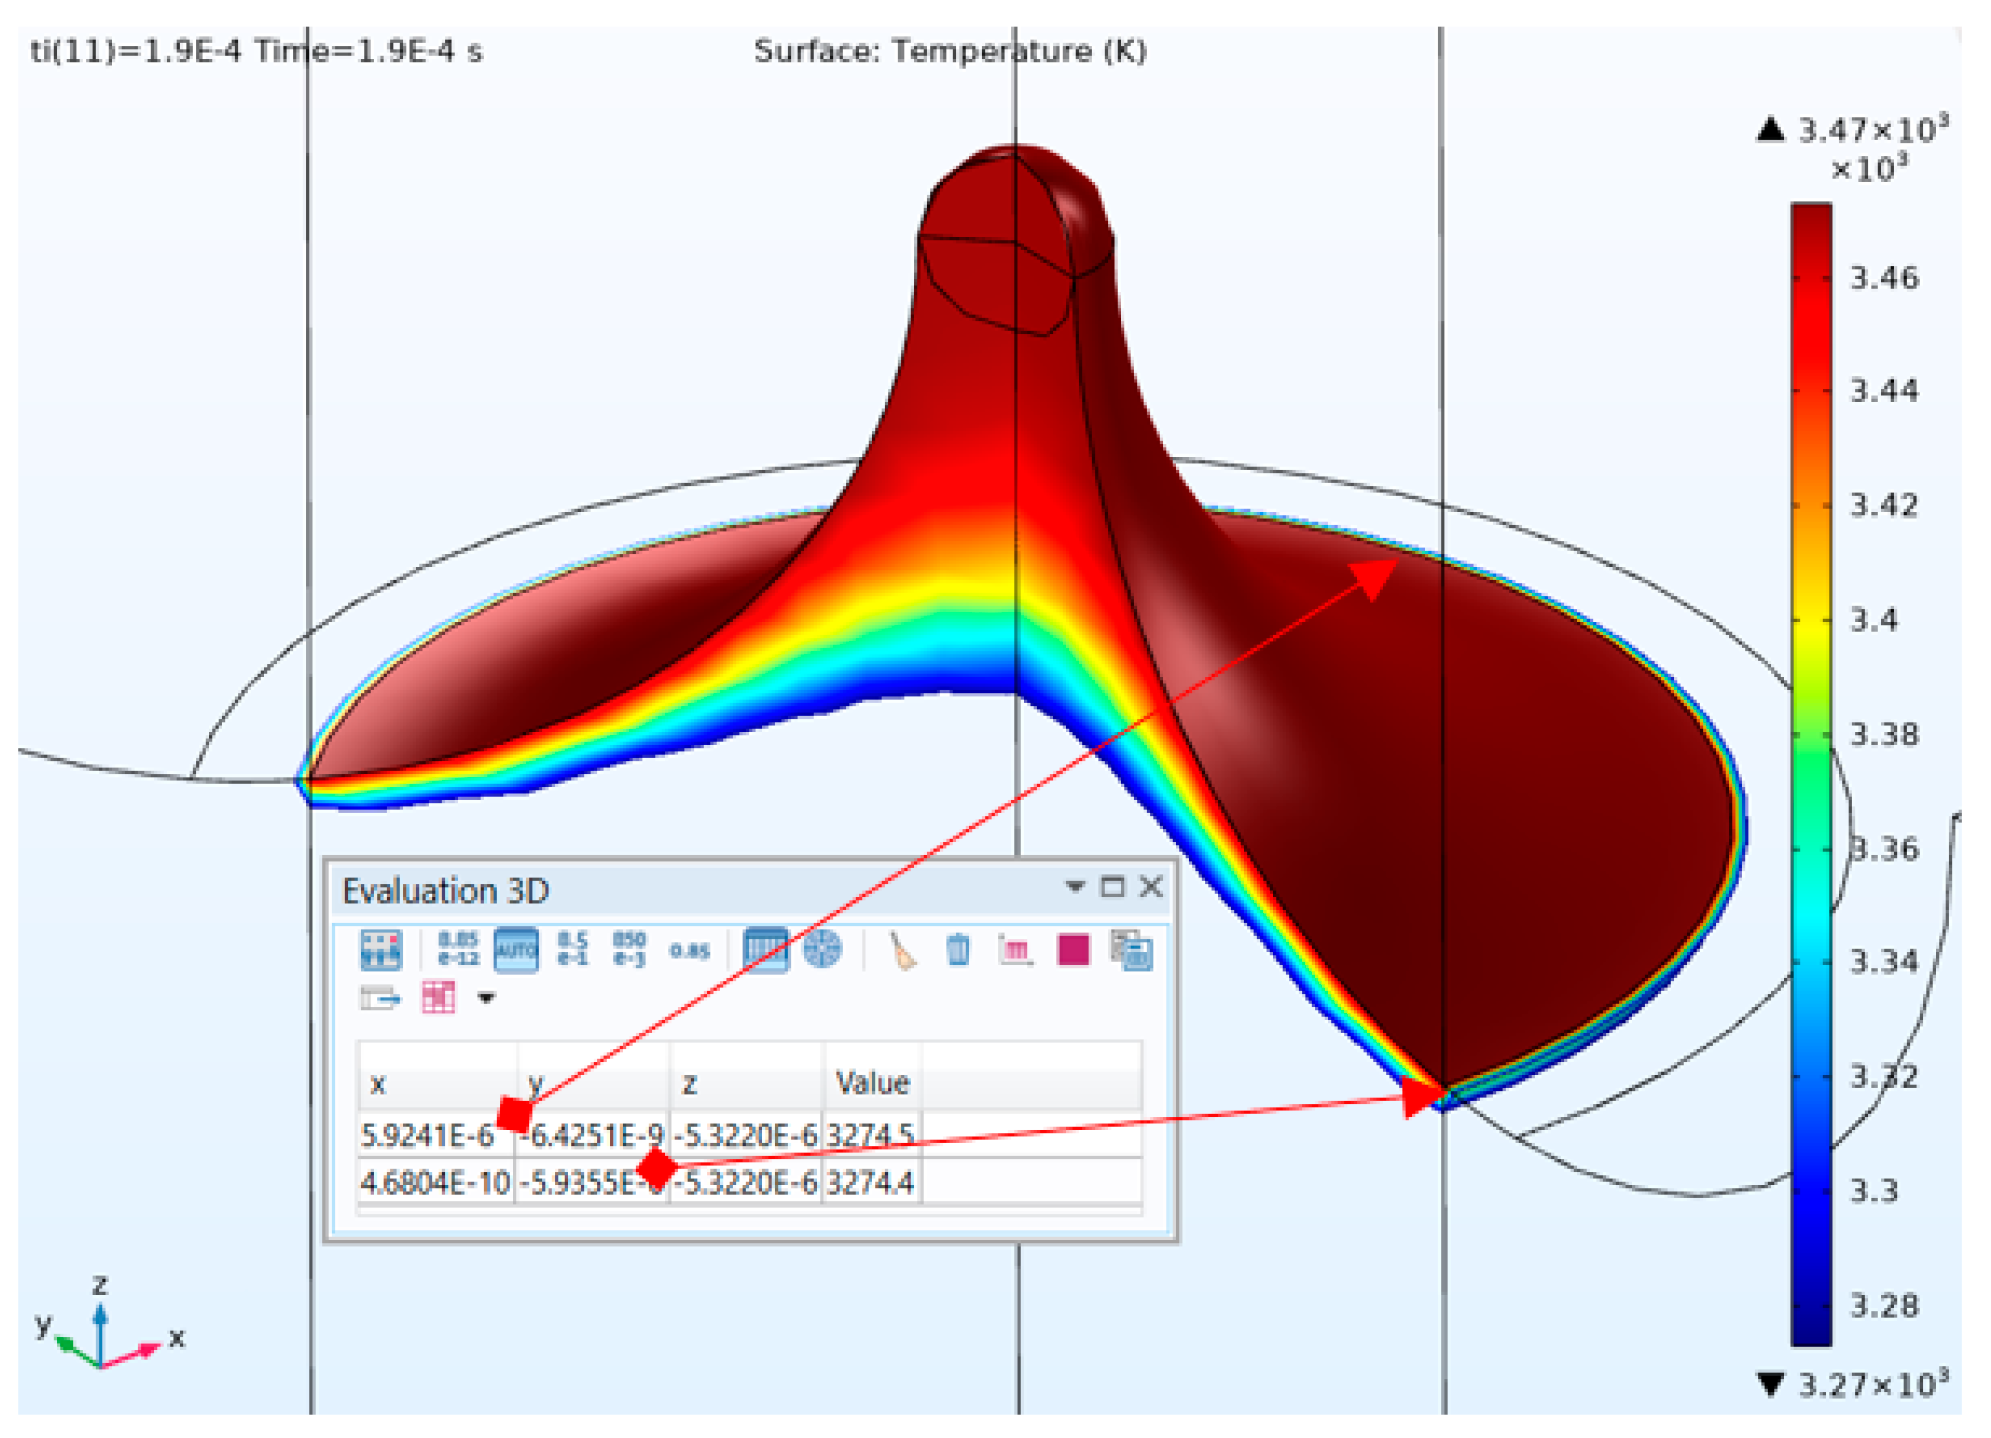
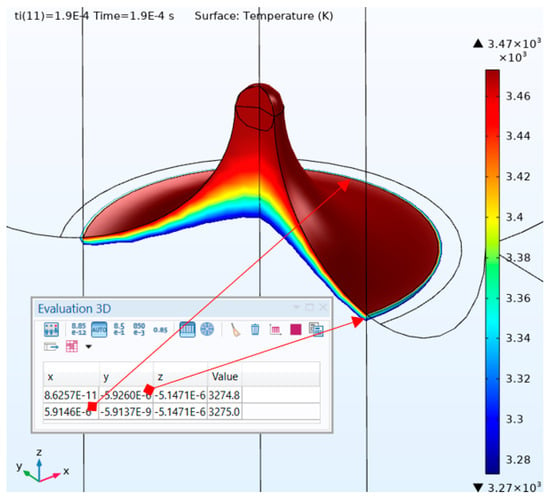
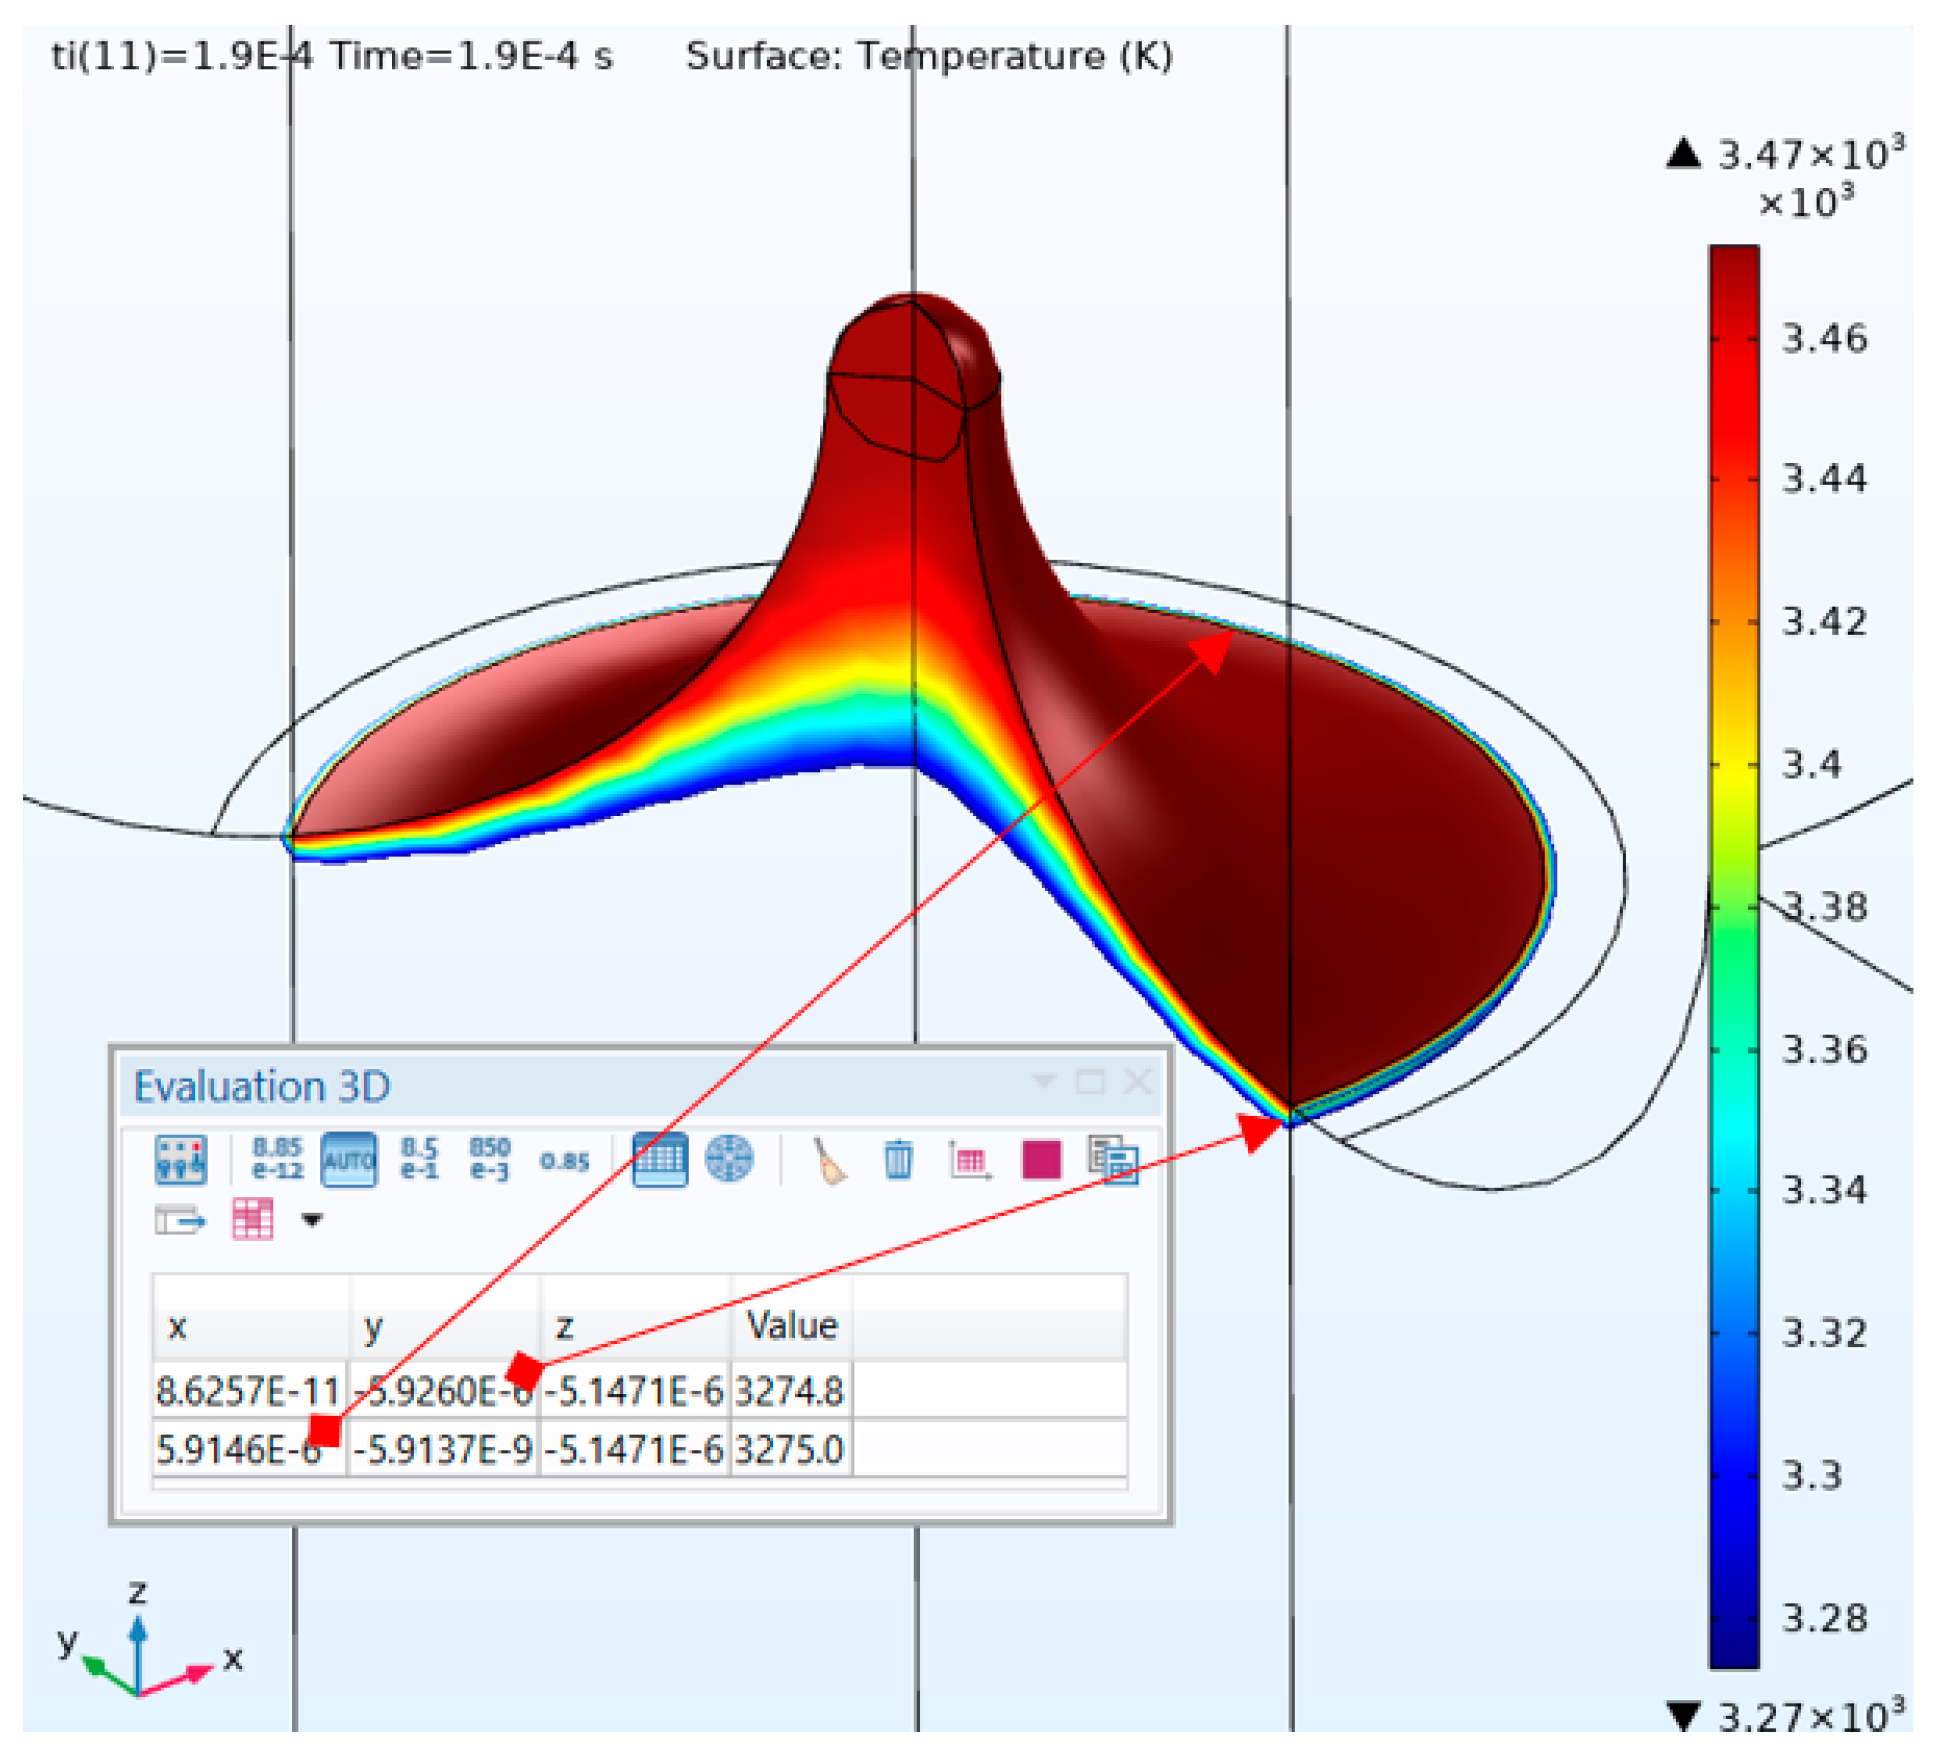
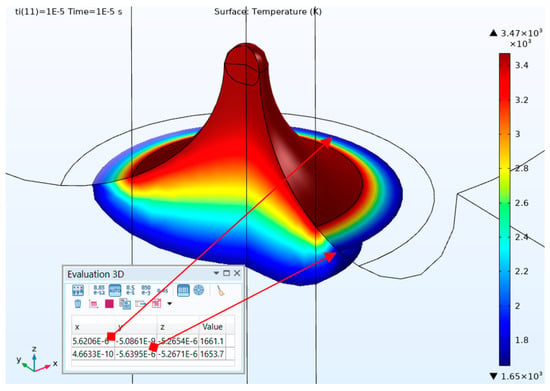
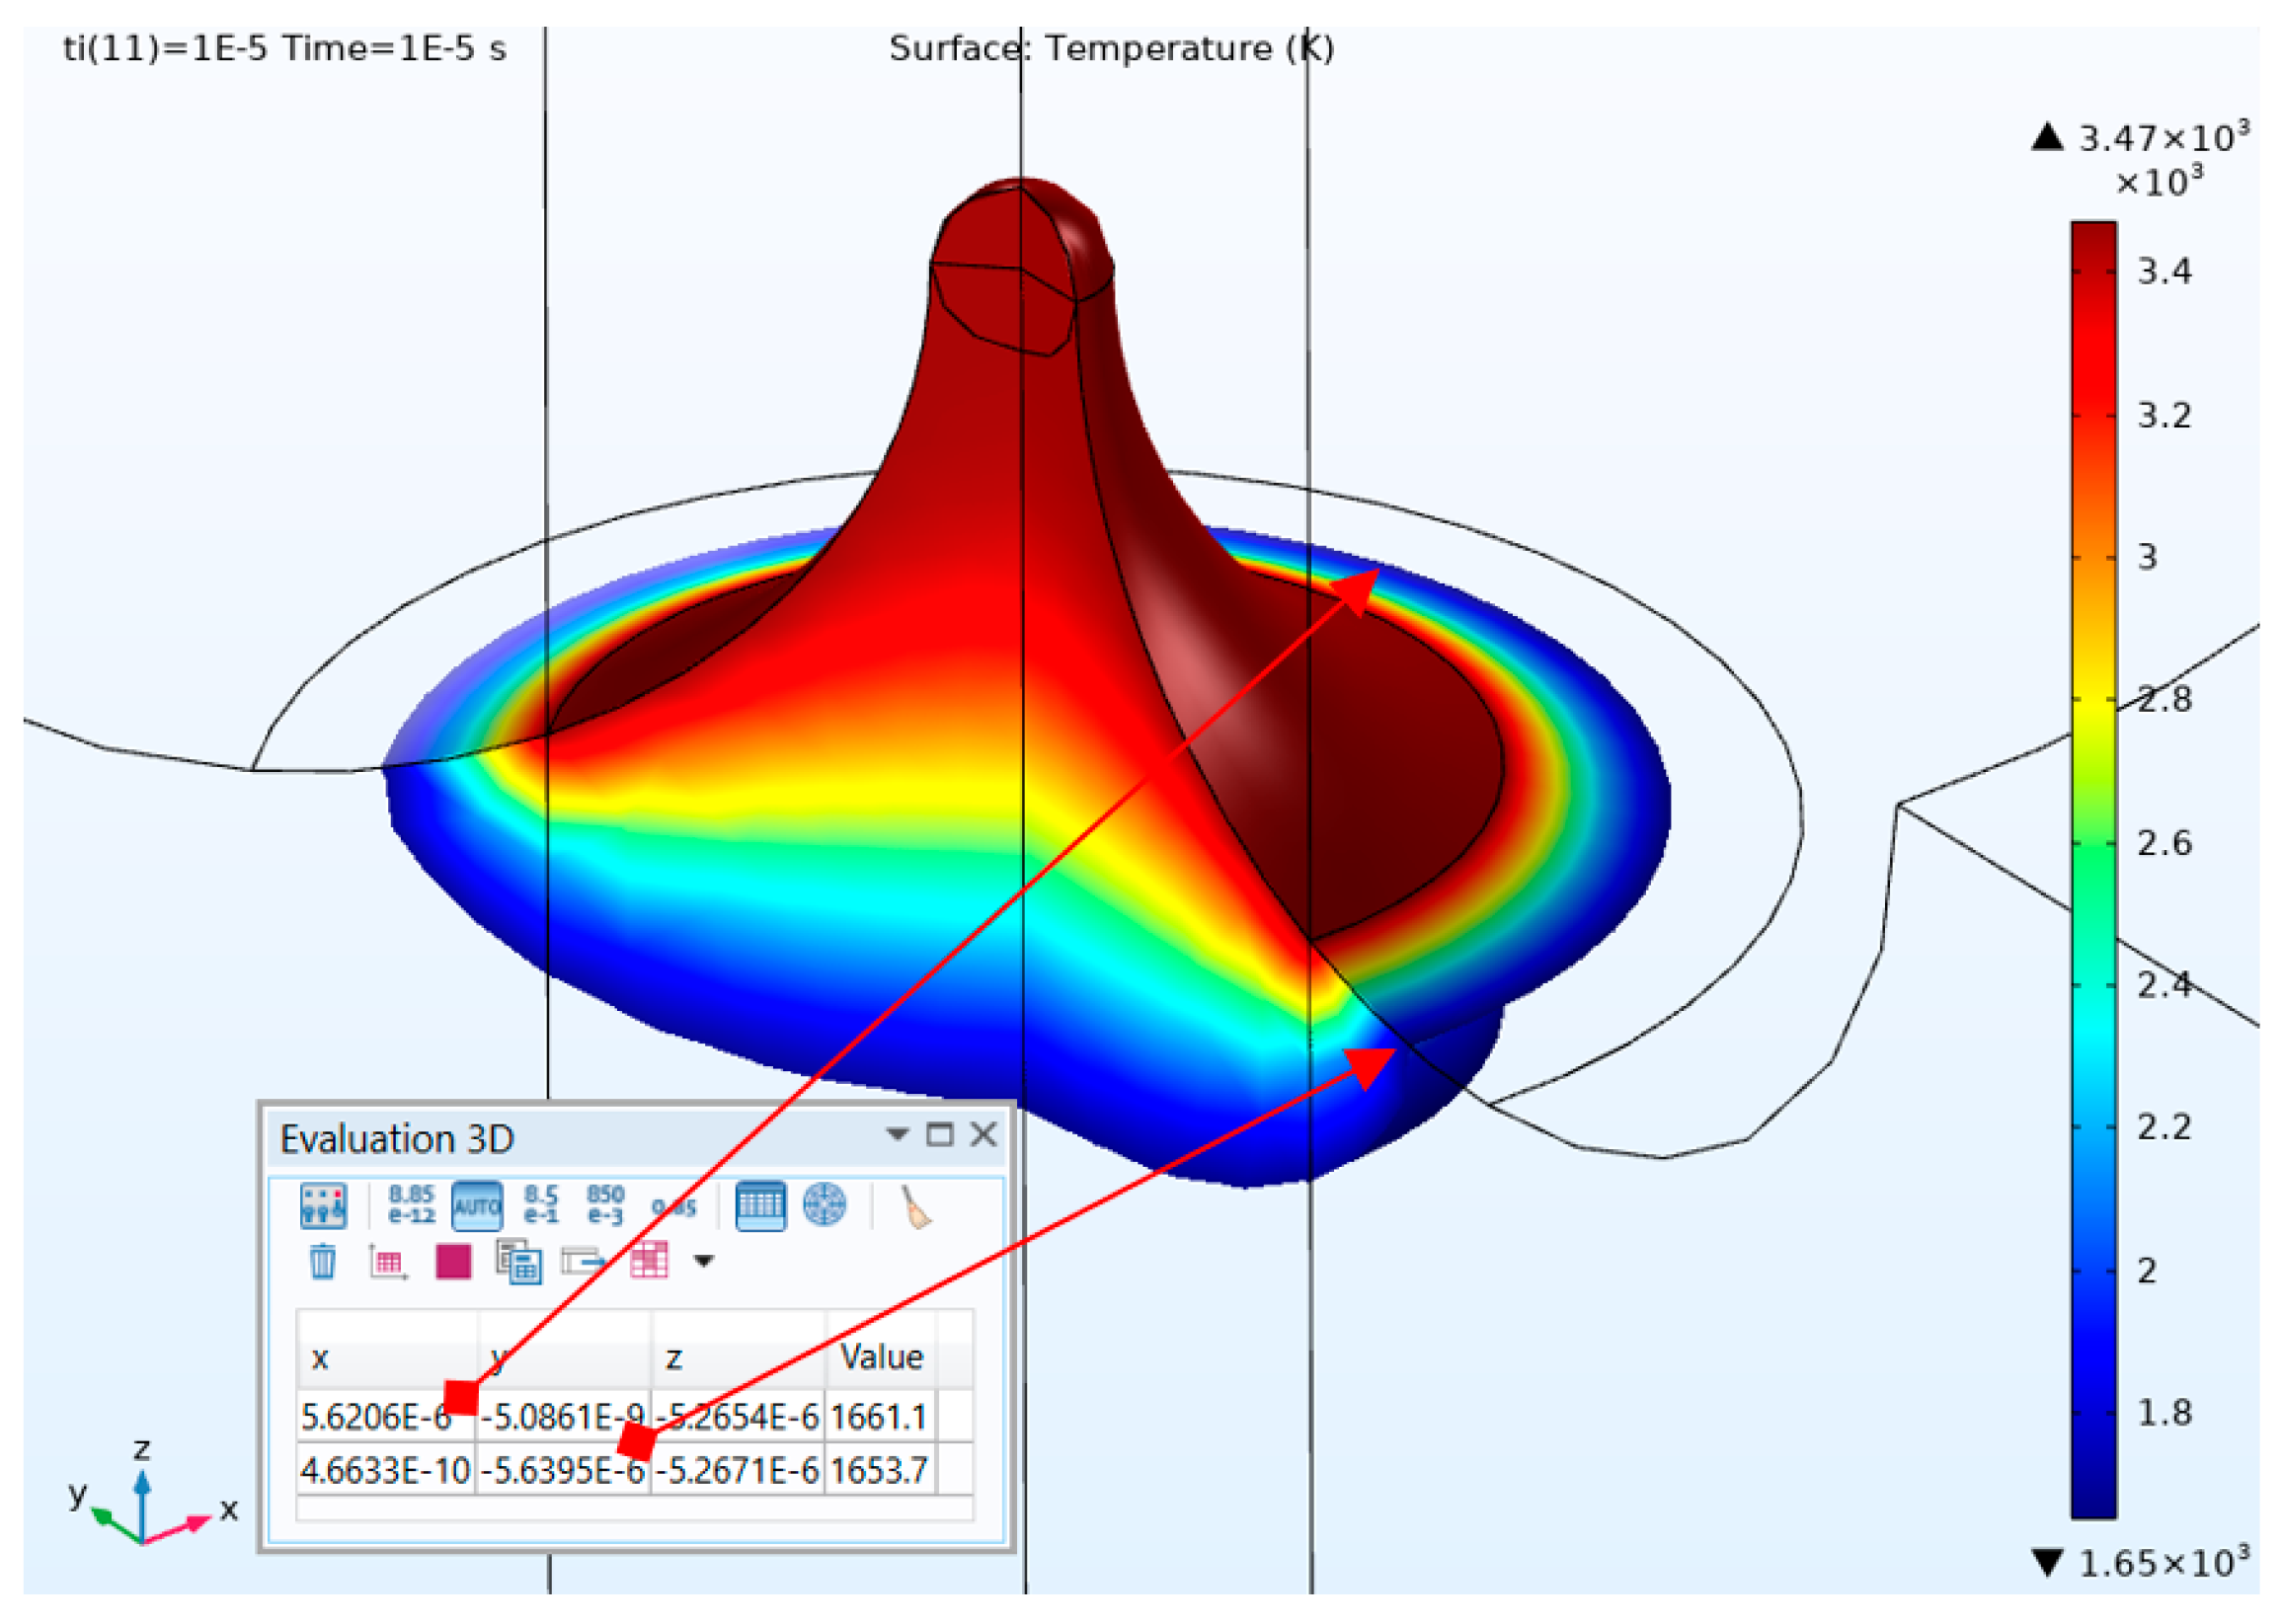
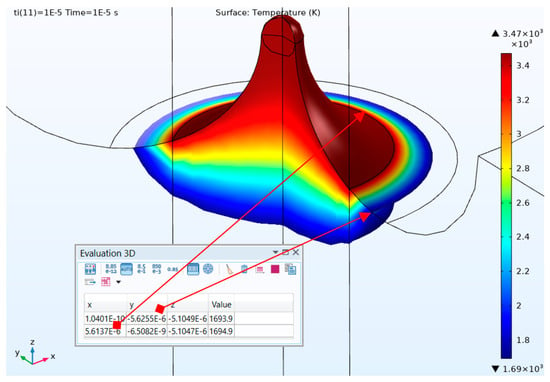
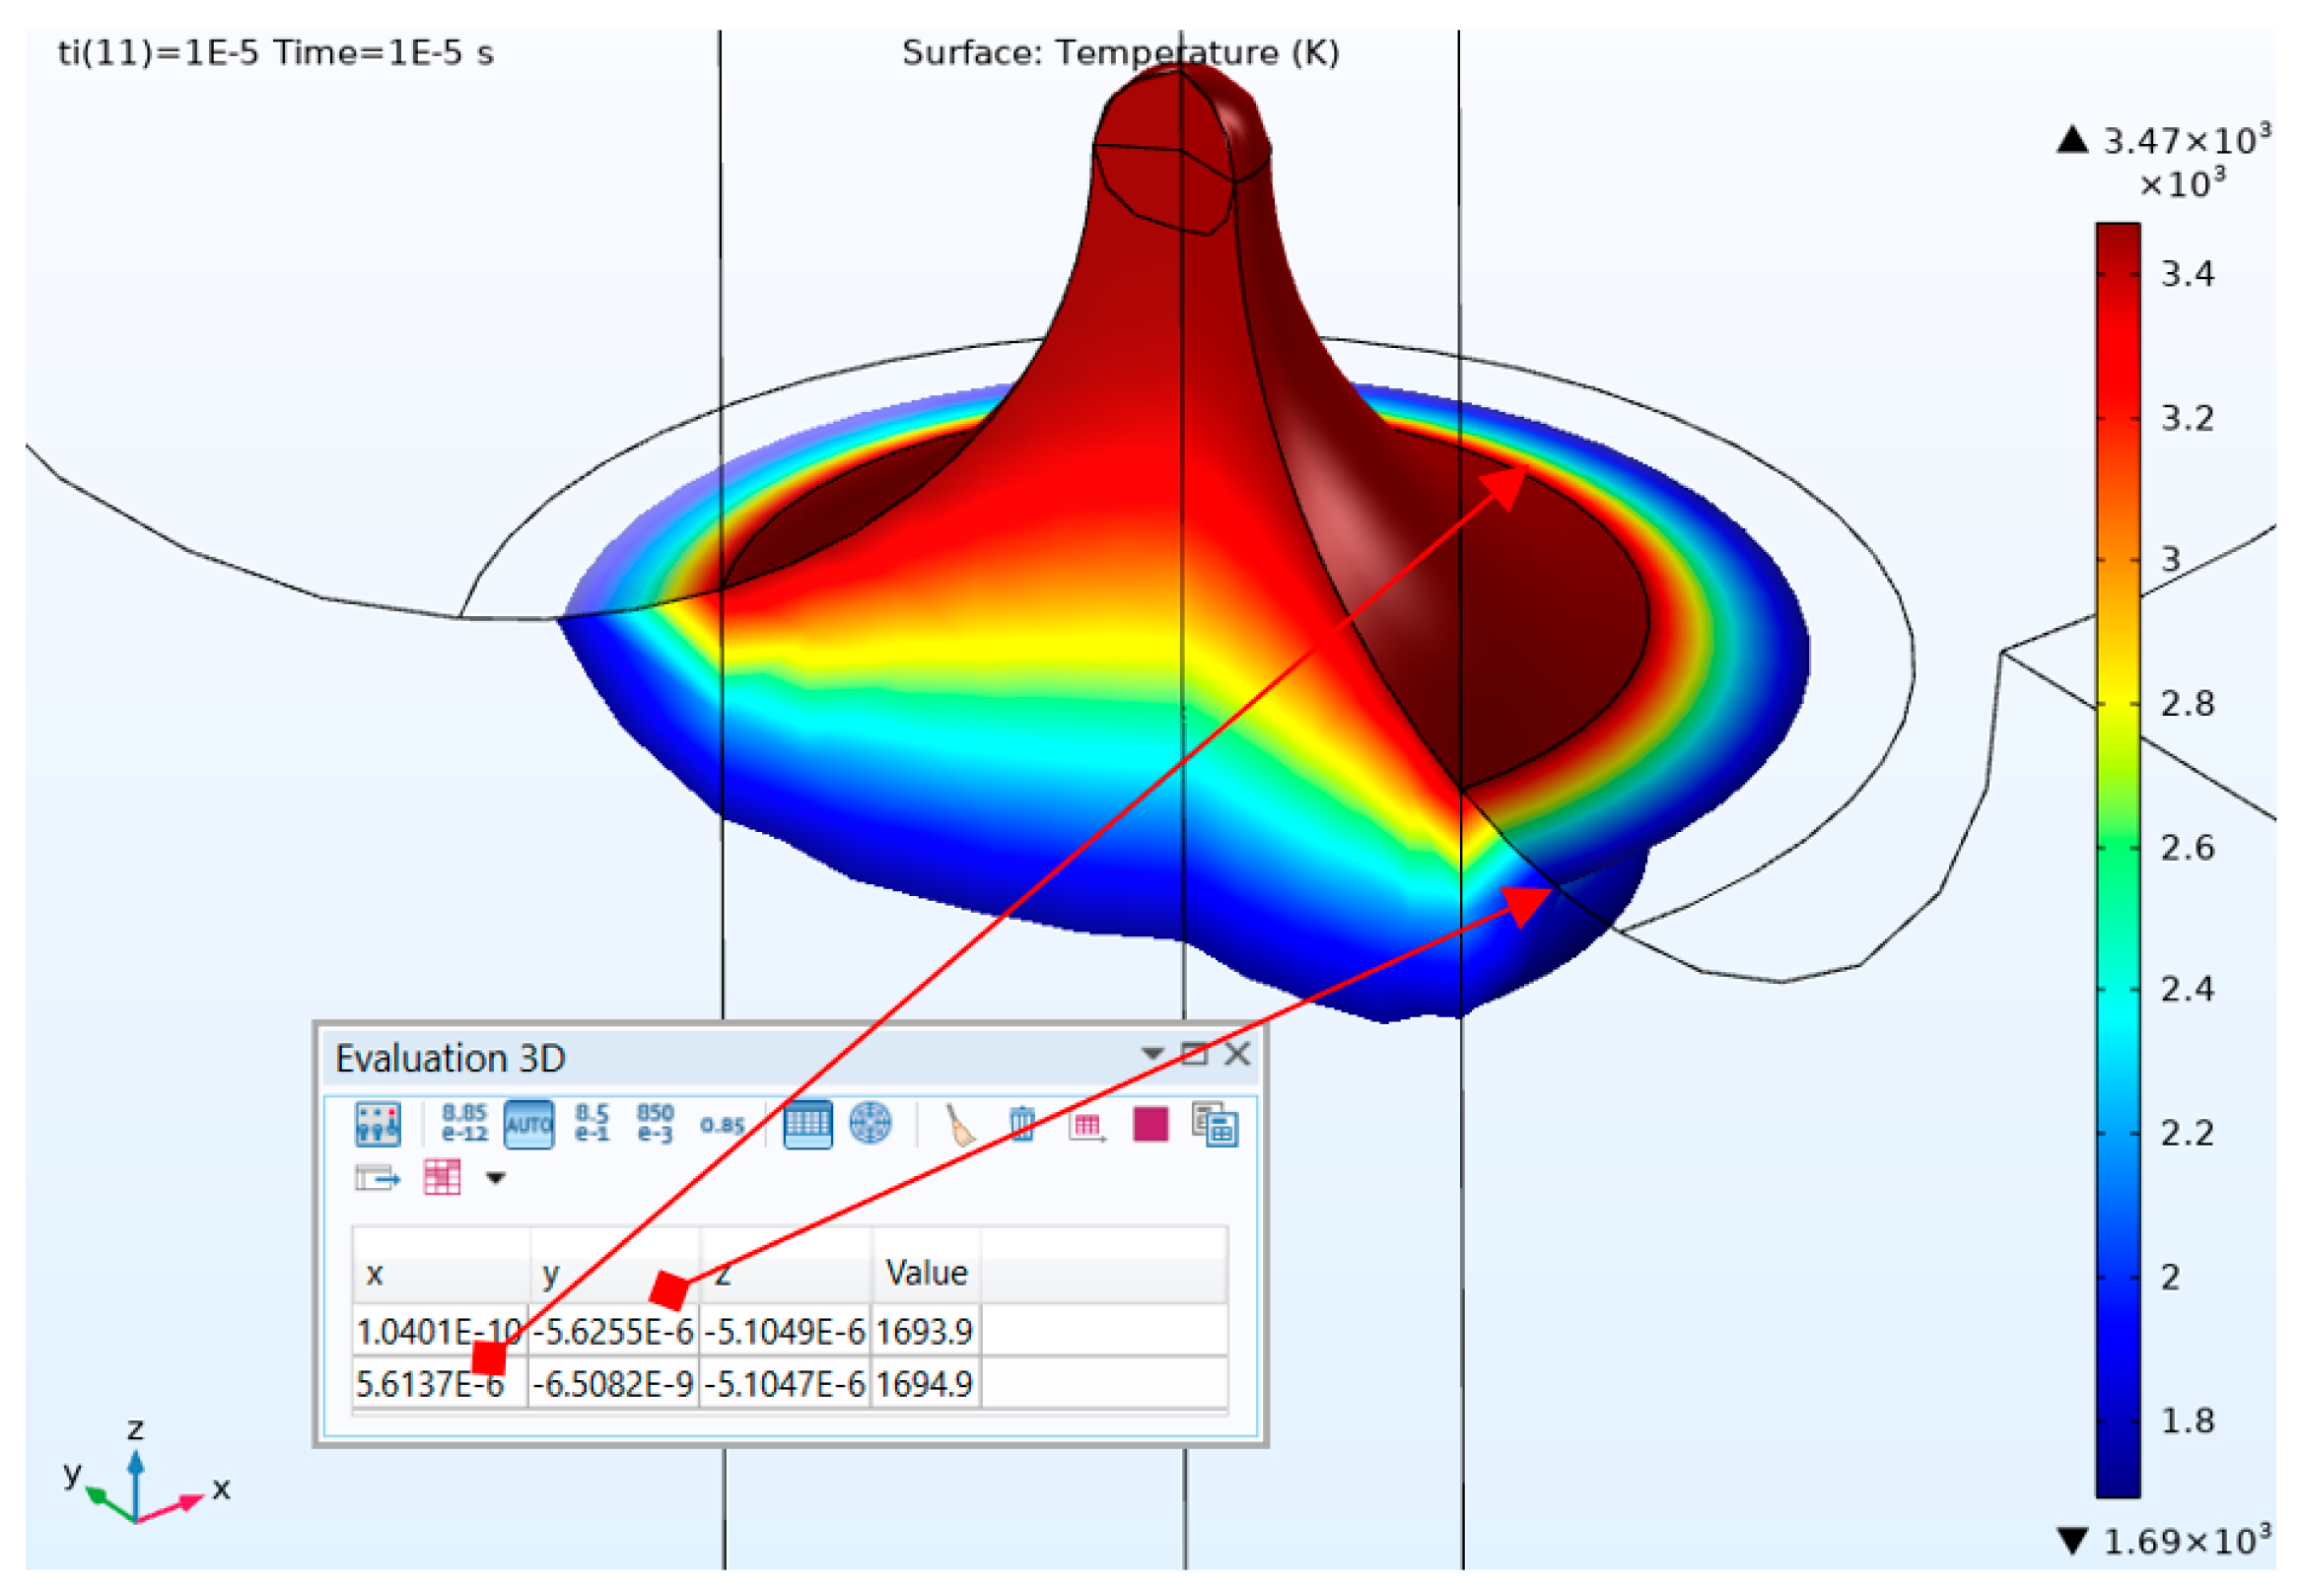
Temperature distributions from Figure 7 and Figure 8 were obtained with boundary conditions specific to Snoeys and Van Dijck’s model of overheating above the boiling temperature, with around 200–300 °C, due to high pressure during pulse time [1,34]. The other conditions were thermal insulation produced by the gas bubble formed around the plasma channel, and cooling using the temperature of dielectric liquid, which was 20 °C and in contact with the periphery of the workpiece. The coordinates of the boiling isothermal were around 3000 °C in the case of CoCr alloys, indicating the crater radius under conditions of usual EDM are in agreement with the experimental data (see Table 4, craters diameters, M—Mean diameter of normal craters corresponding to considered normal discharges), validating the model. After pulse time ended, due to a sudden decrease in pressure within the gap, the material was removed bordered by the boiling isothermal. For US hybrid machining, the pulse time was modified. In the case of ti = 190 µs, the number of overlapping CMS stages on pulse time was around four. Hence, the discharges could be stopped due to the high pressure of 100 MPa order within the gap, as our experimental observations pointed out. Consequently, the pulse duration could be fragmented by any end of an oscillation period of ti = 50 µs (vertical black lines intersecting the green zone in Figure 4). Taking into account the delay time at ignition of around td = 20 µs, the fragmented pulse time could be ti = 20 µs or even less, depending on the gap conductivity, facilitating the dielectric breakdown. These temperature distributions are presented in Figure 9 and Figure 10.
Figure 7.
Temperature distribution at EDM after pulse time, ti = 190 µs at SOFT alloy.
Figure 8.
Temperature distribution at EDM after pulse time, ti =190 µs at NE alloy.
Figure 9.
Temperature distribution at US hybrid EDM after pulse time, ti = 10 µs, at SOFT alloy.
Figure 10.
Temperature distribution at US hybrid EDM after pulse time, ti = 10 µs, at NE alloy.
As one can notice, the coordinates for the melting isothermal, denoting its radius, pointed out that it is lower than in the case of the boiling isothermal considered at simple EDM, which is in accordance with experimental data that shows the craters’ diameters are lower at US hybrid machining. This is only the effect of the thermal component under ultrasonic conditions. Moreover, one can notice that in the case of the SOFT system, the craters’ dimensions are greater than in the case of a NE system alloy due to its higher machinability through EDM, both at classic regimes and US hybrid ones.
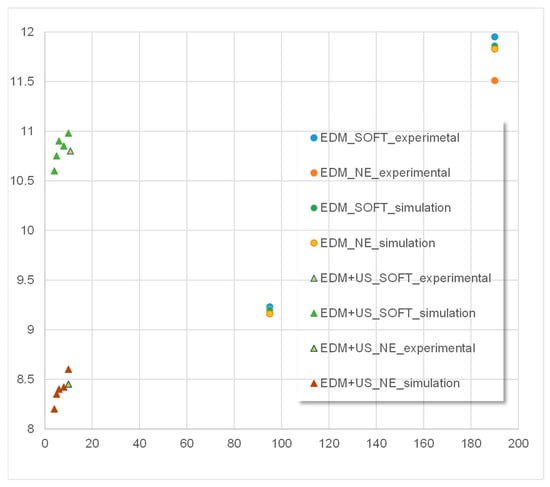
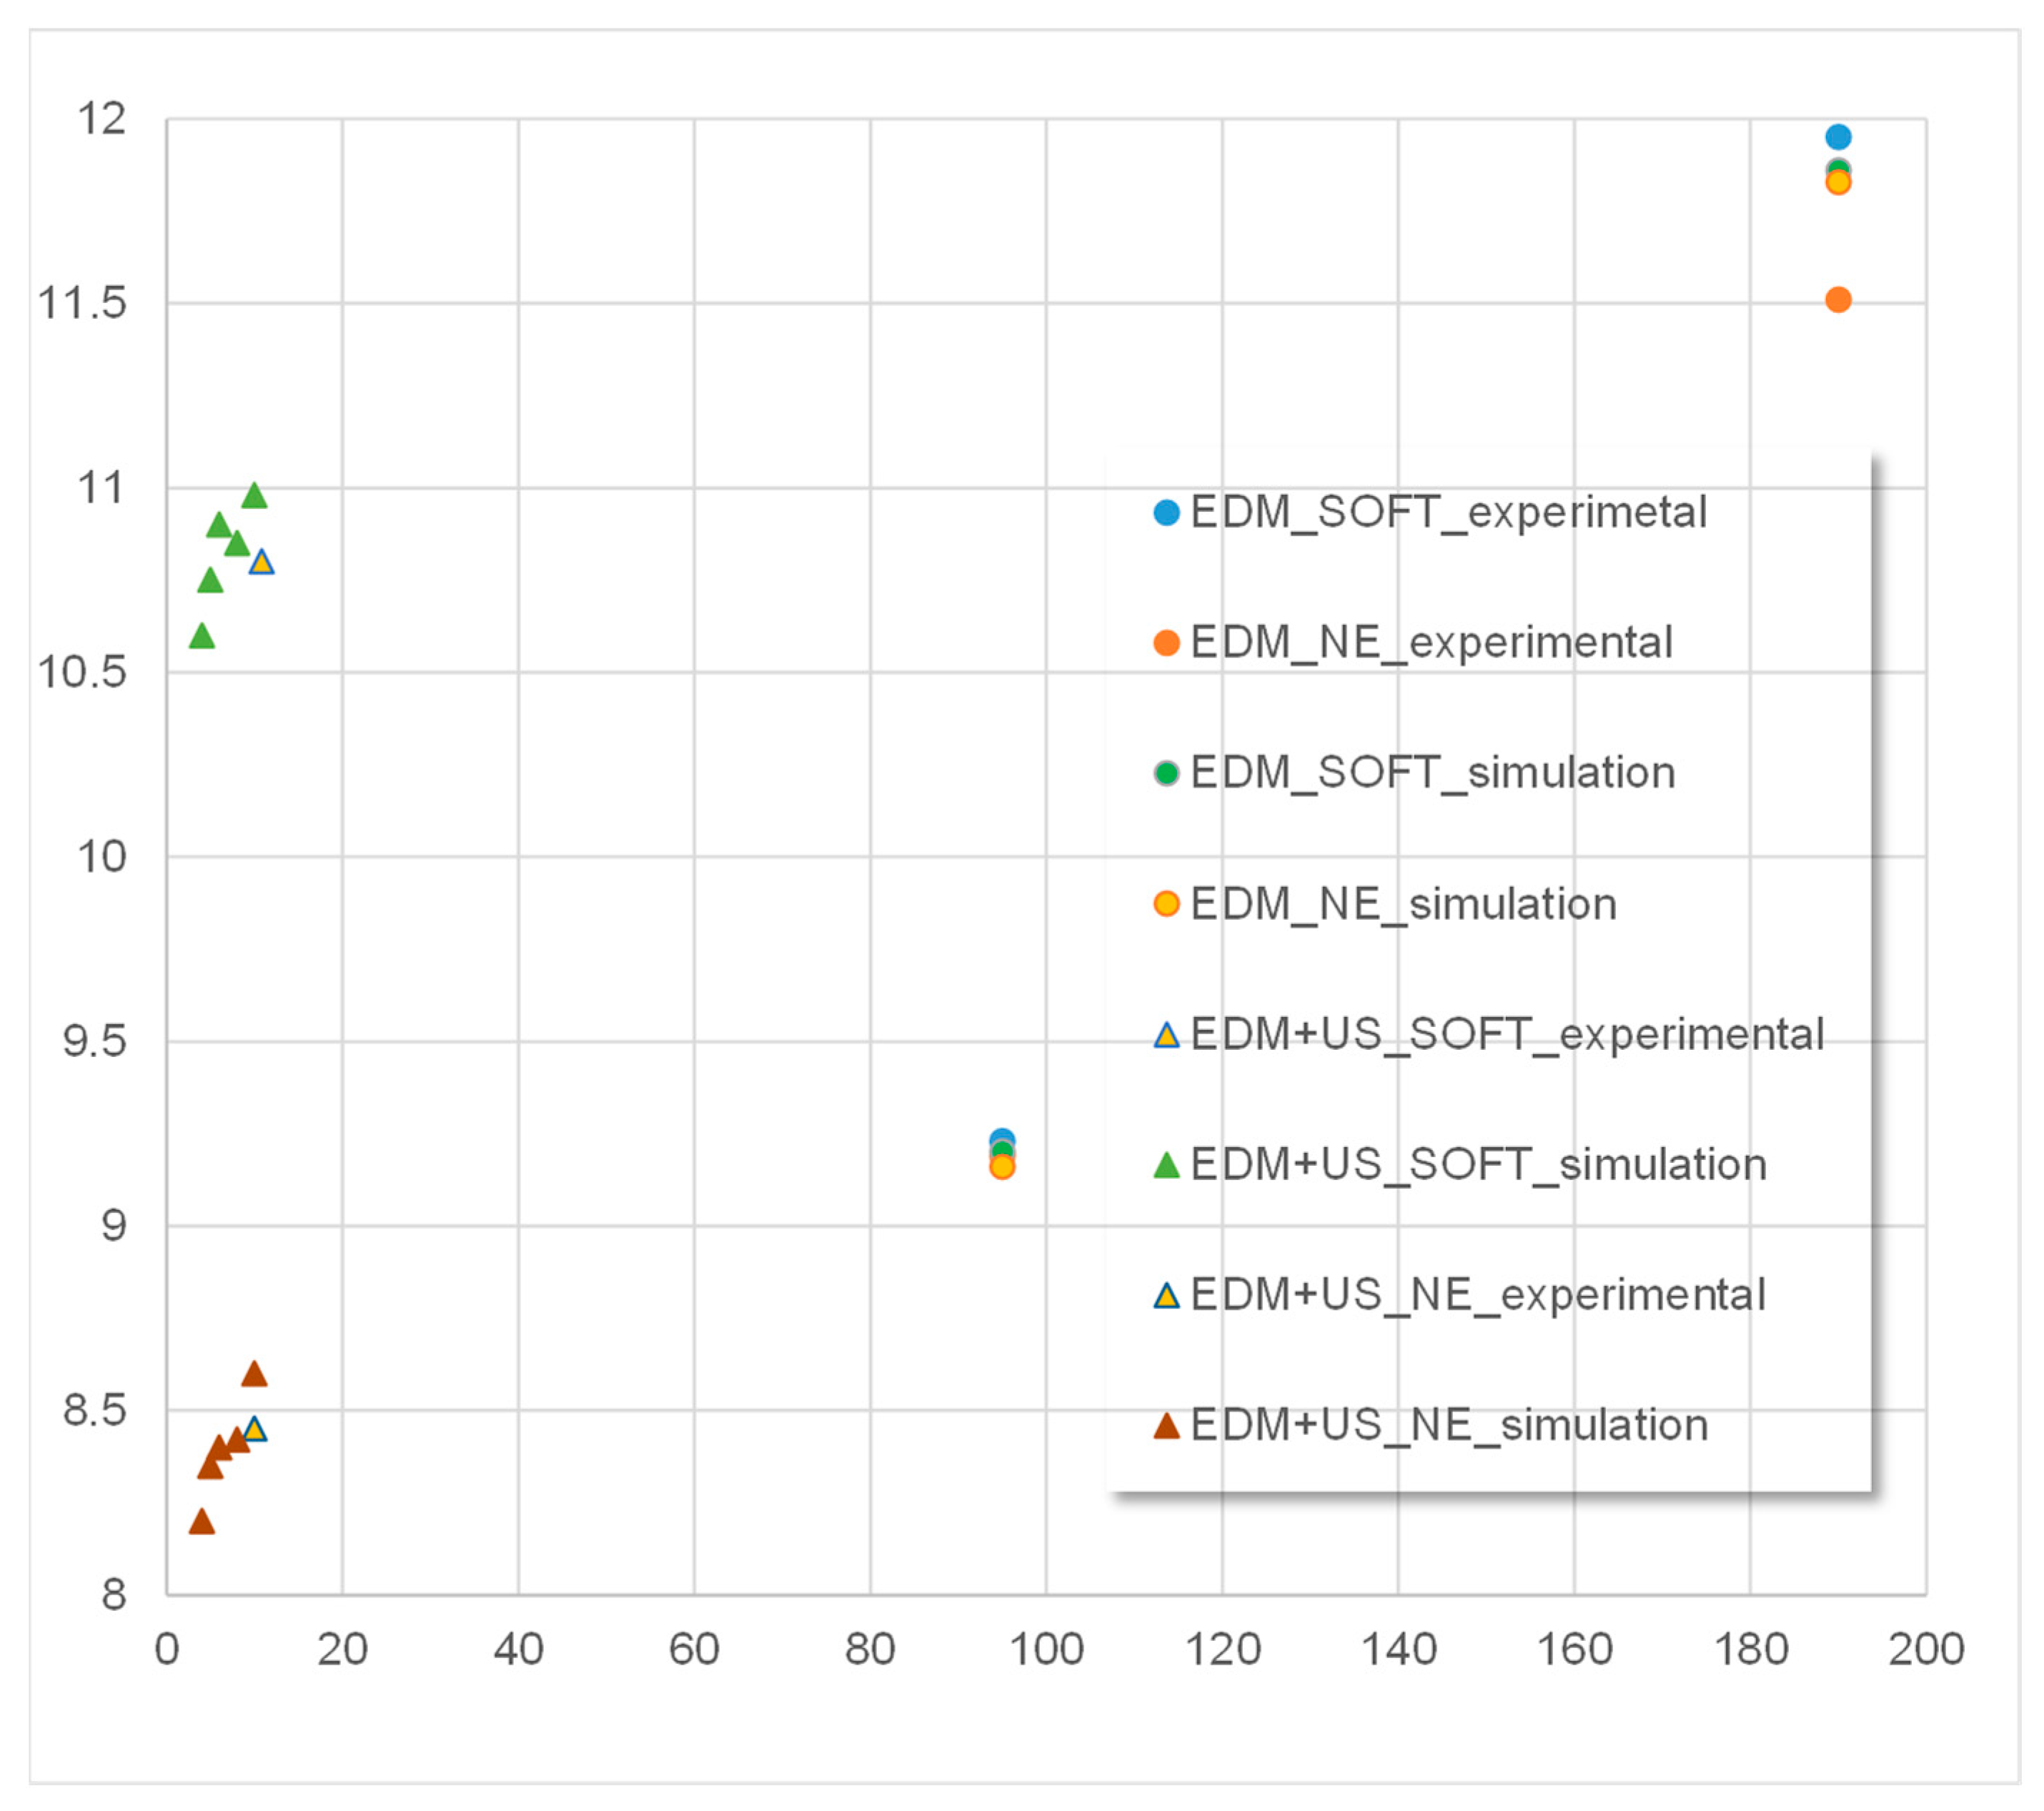
We extended the simulations, comparing them with experimental data, and the results are presented in Figure 11.
Figure 11.
Comparison of simulation results and experimental data at classic EDM and hybrid EDM+US.
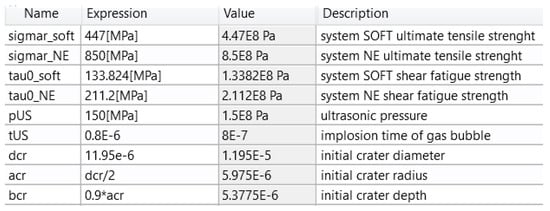
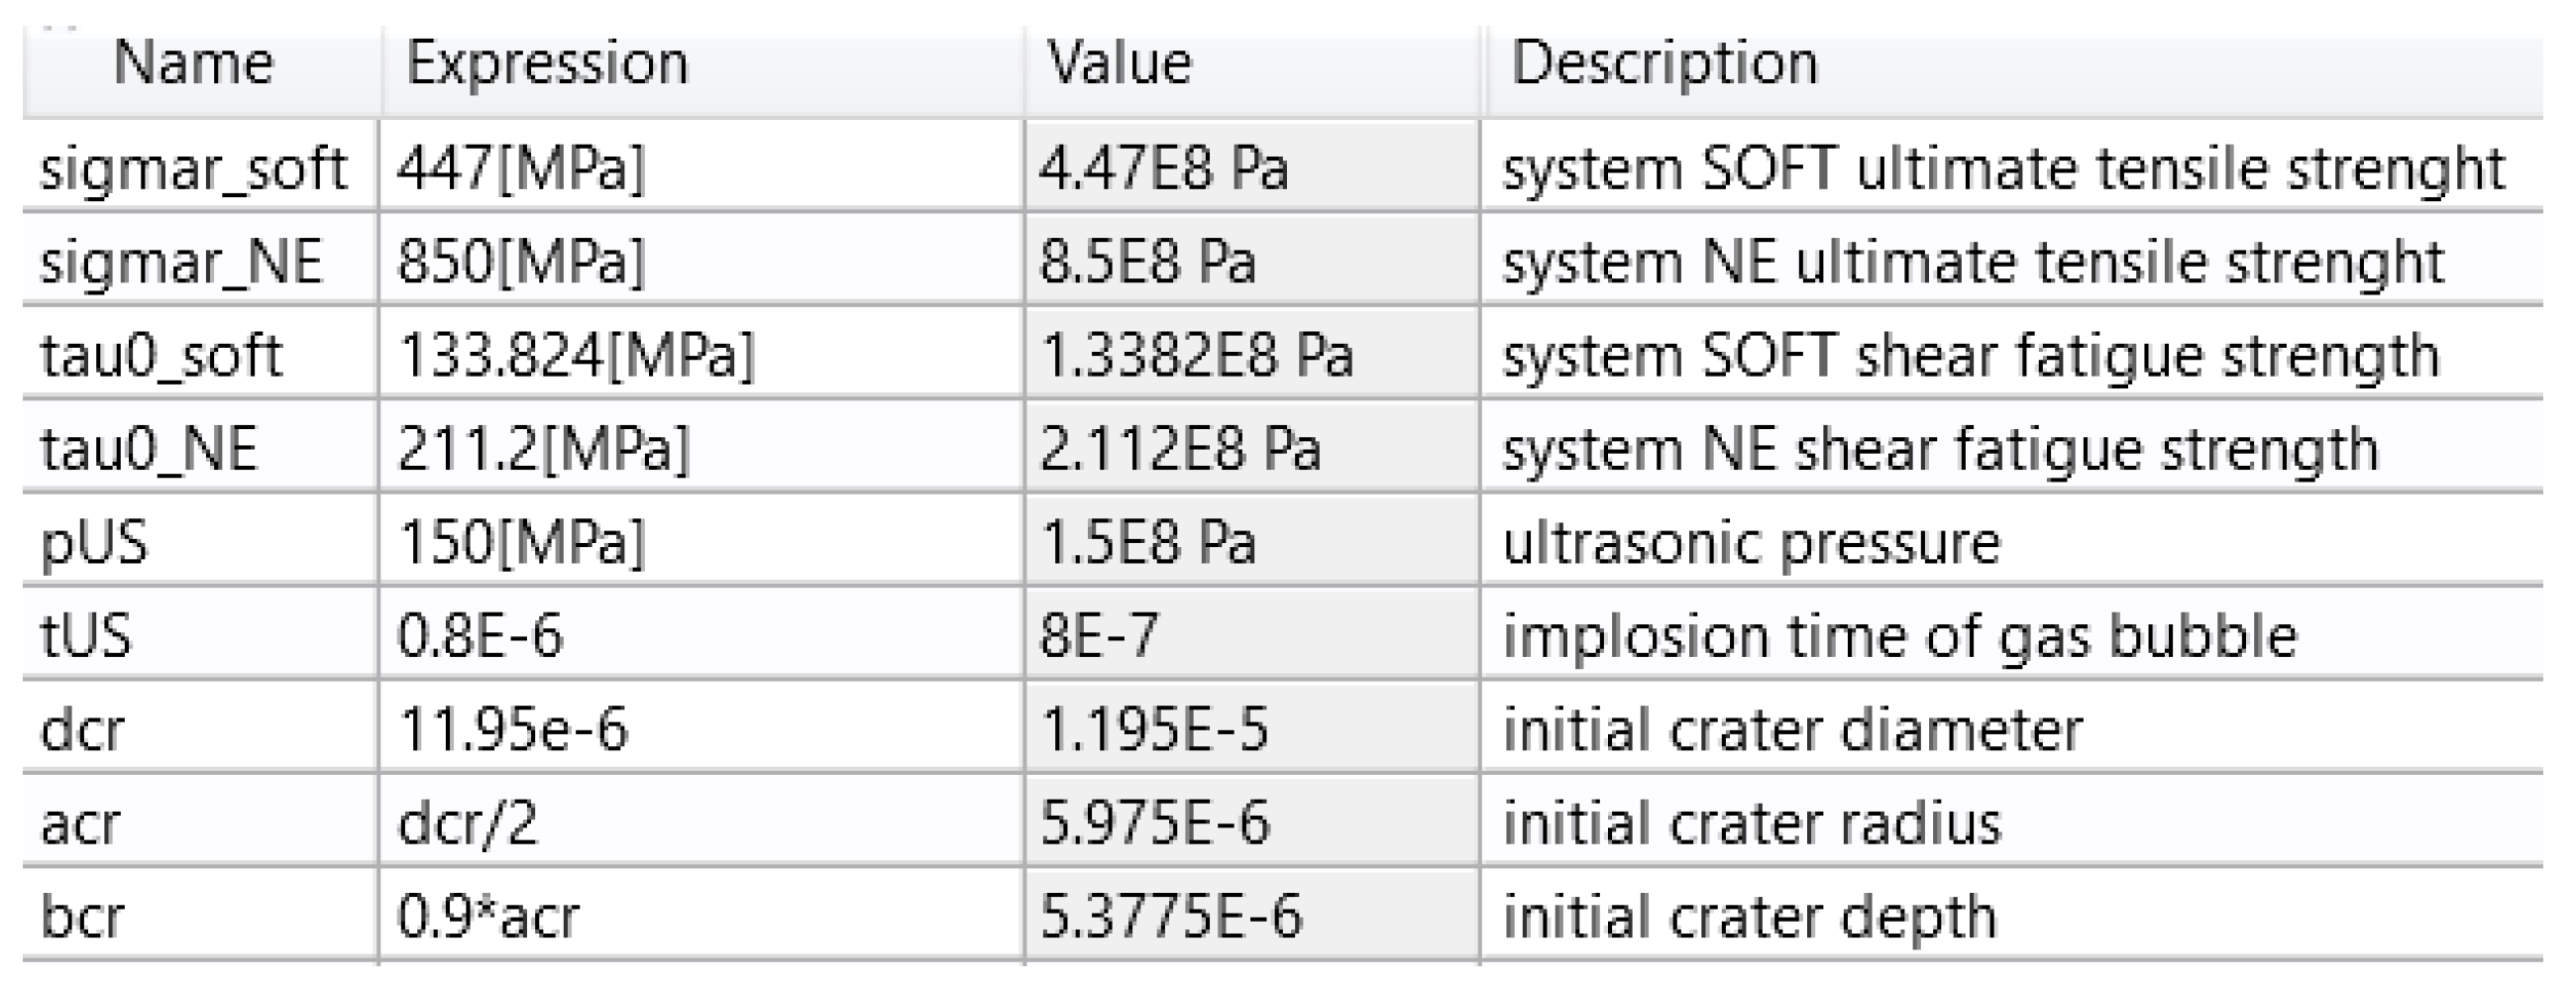
The ultrasonic mechanical component is also involved in the frame of the material removal mechanism, and to further understand this, another model for numerical simulation was built. The Comsol Multiphysics module of Solid Mechanics, Time Dependent in 2D Axis Symmetric dimensions was used. The specific additional parameters of this model are presented in Figure 12.
Figure 12.
Additional parameters for US mechanical model for SOFT and NE alloys.
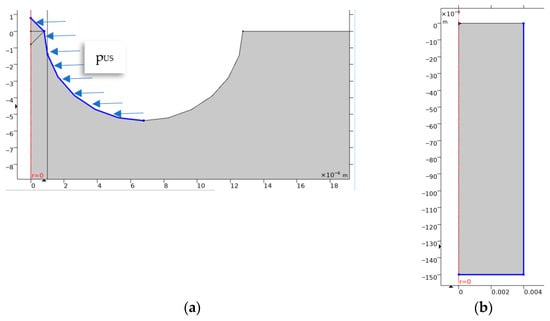
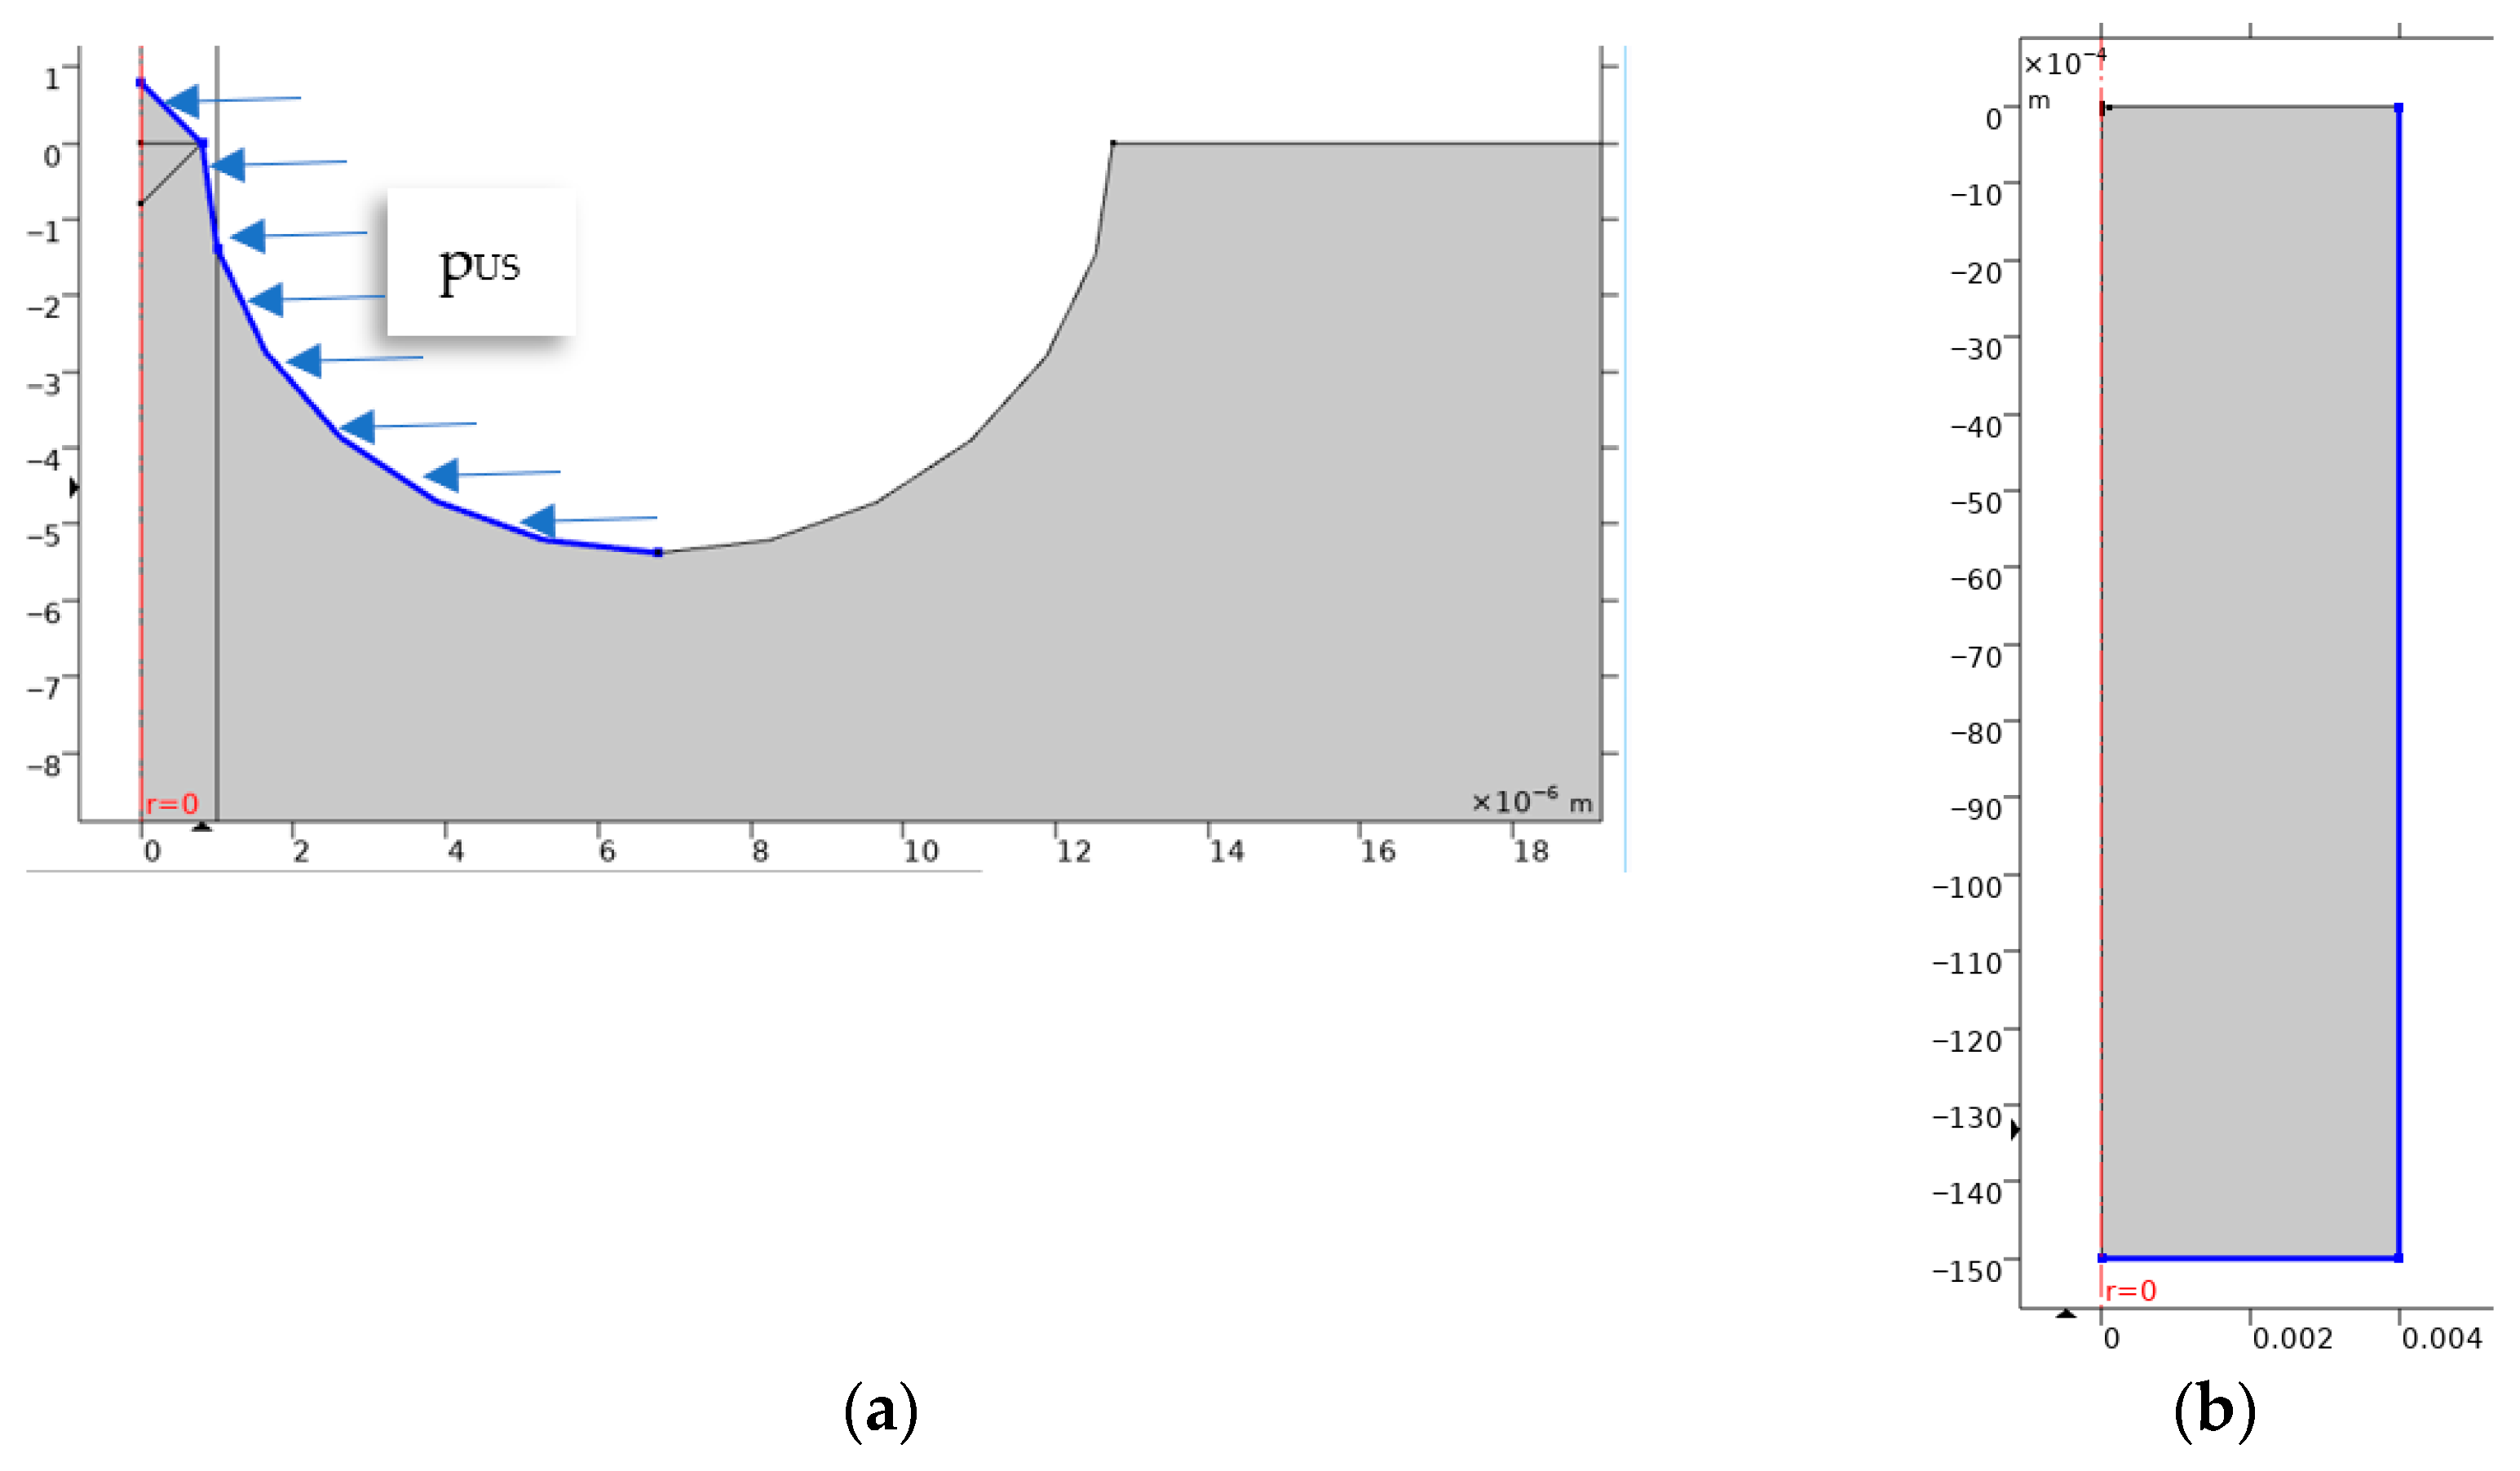
The boundary conditions were boundary load on a profile of microgeometry produced by local ultrasonic pressure, pUS, generated by CMS (a), and the fixed constraints due to the workpiece clamping device (b), Figure 13.
Figure 13.
Boundary conditions at ultrasonic mechanical–hydraulic model. (a) Boundary load–ultrasonic pressure of CMS. (b) Fixed constraints.
The implosion time was calculated with Rayleigh formula, resulting in tUS = 0.8 µs [30]. This is a load of shear fatigue of the profile microgeometry that is more sensitive at its peak. The limit of ultimate tensile τ0 at this type of loading was calculated with the relation [1]:
where σr is the ultimate static tensile for system SOFT and respectively, system NE (see Table 2); replacing the corresponding values, it results τ0 = 133.824 MPa for system SOFT, and τ0 = 211.2 MPa for system NE.
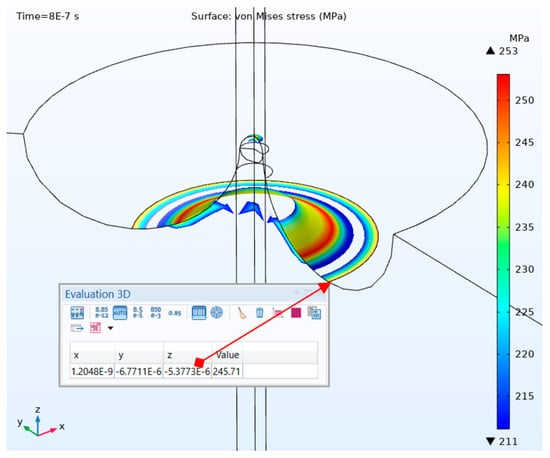
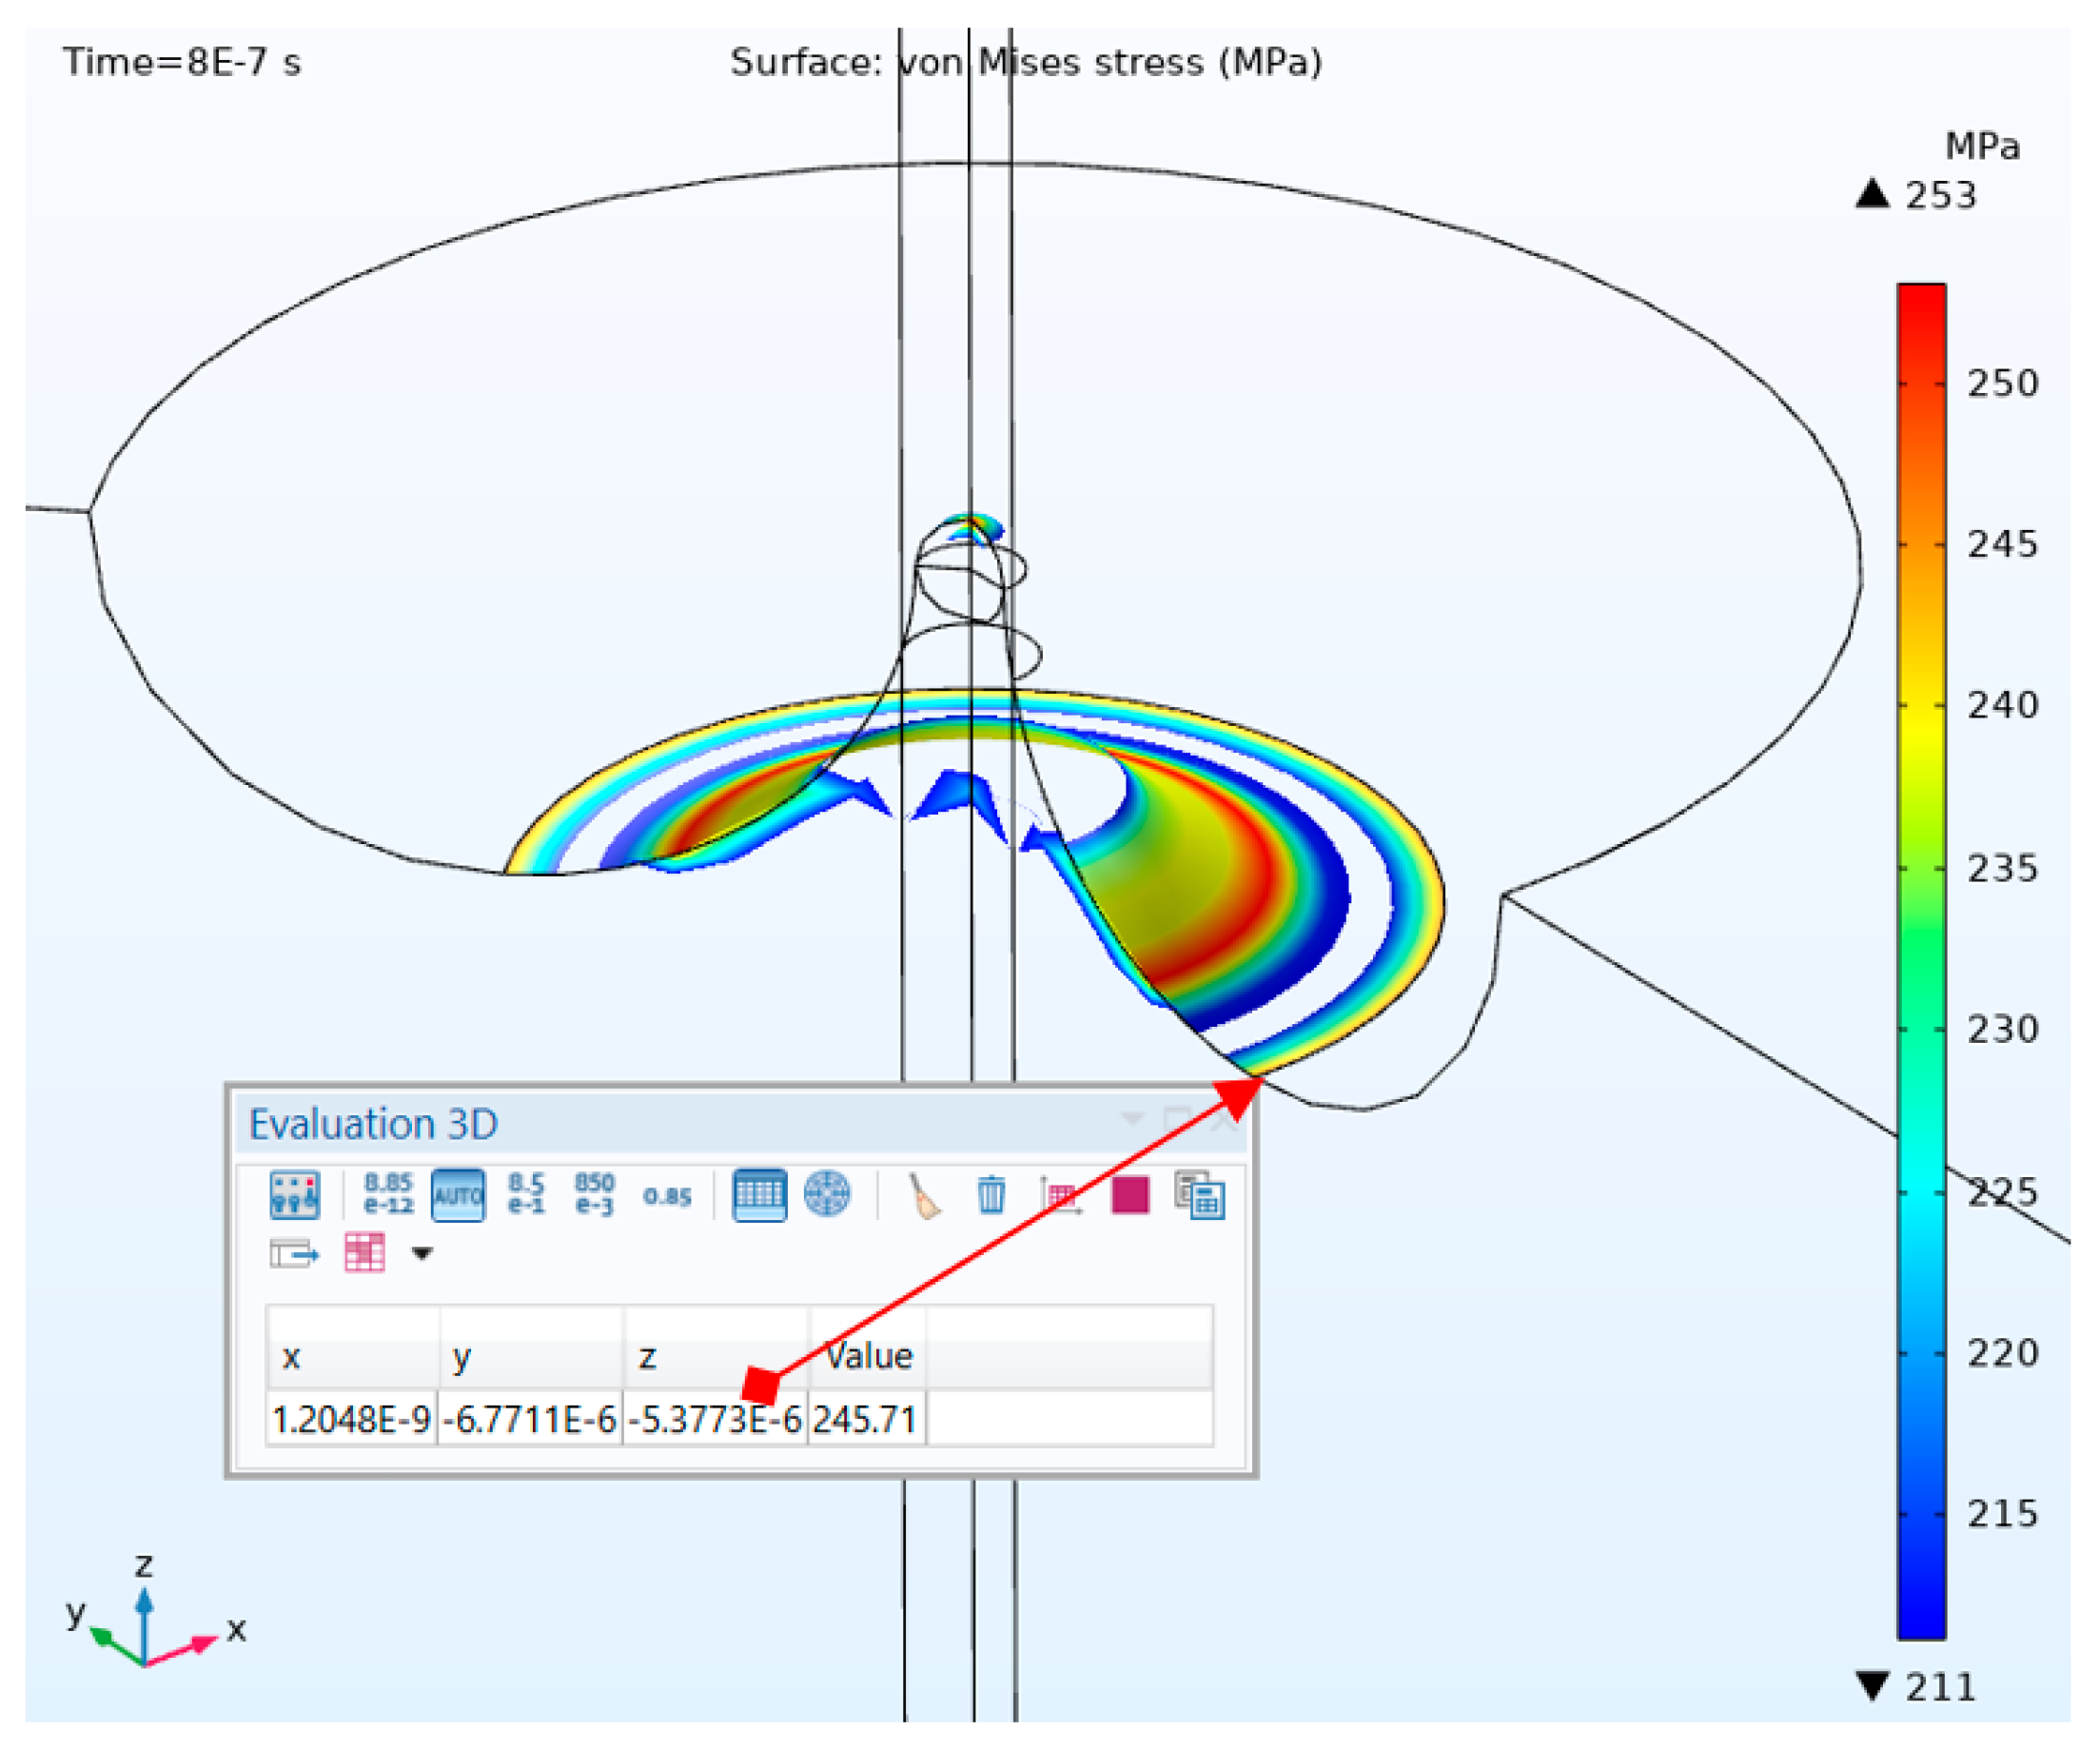
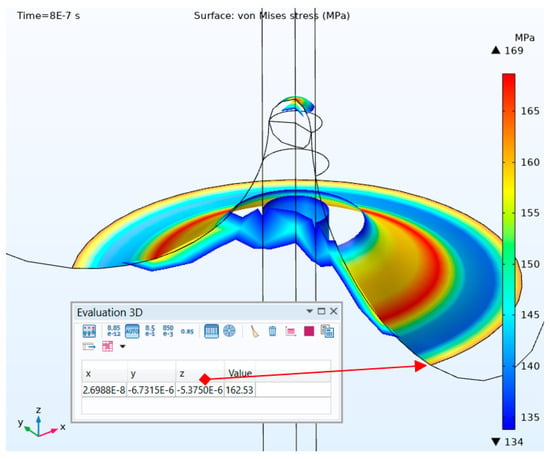
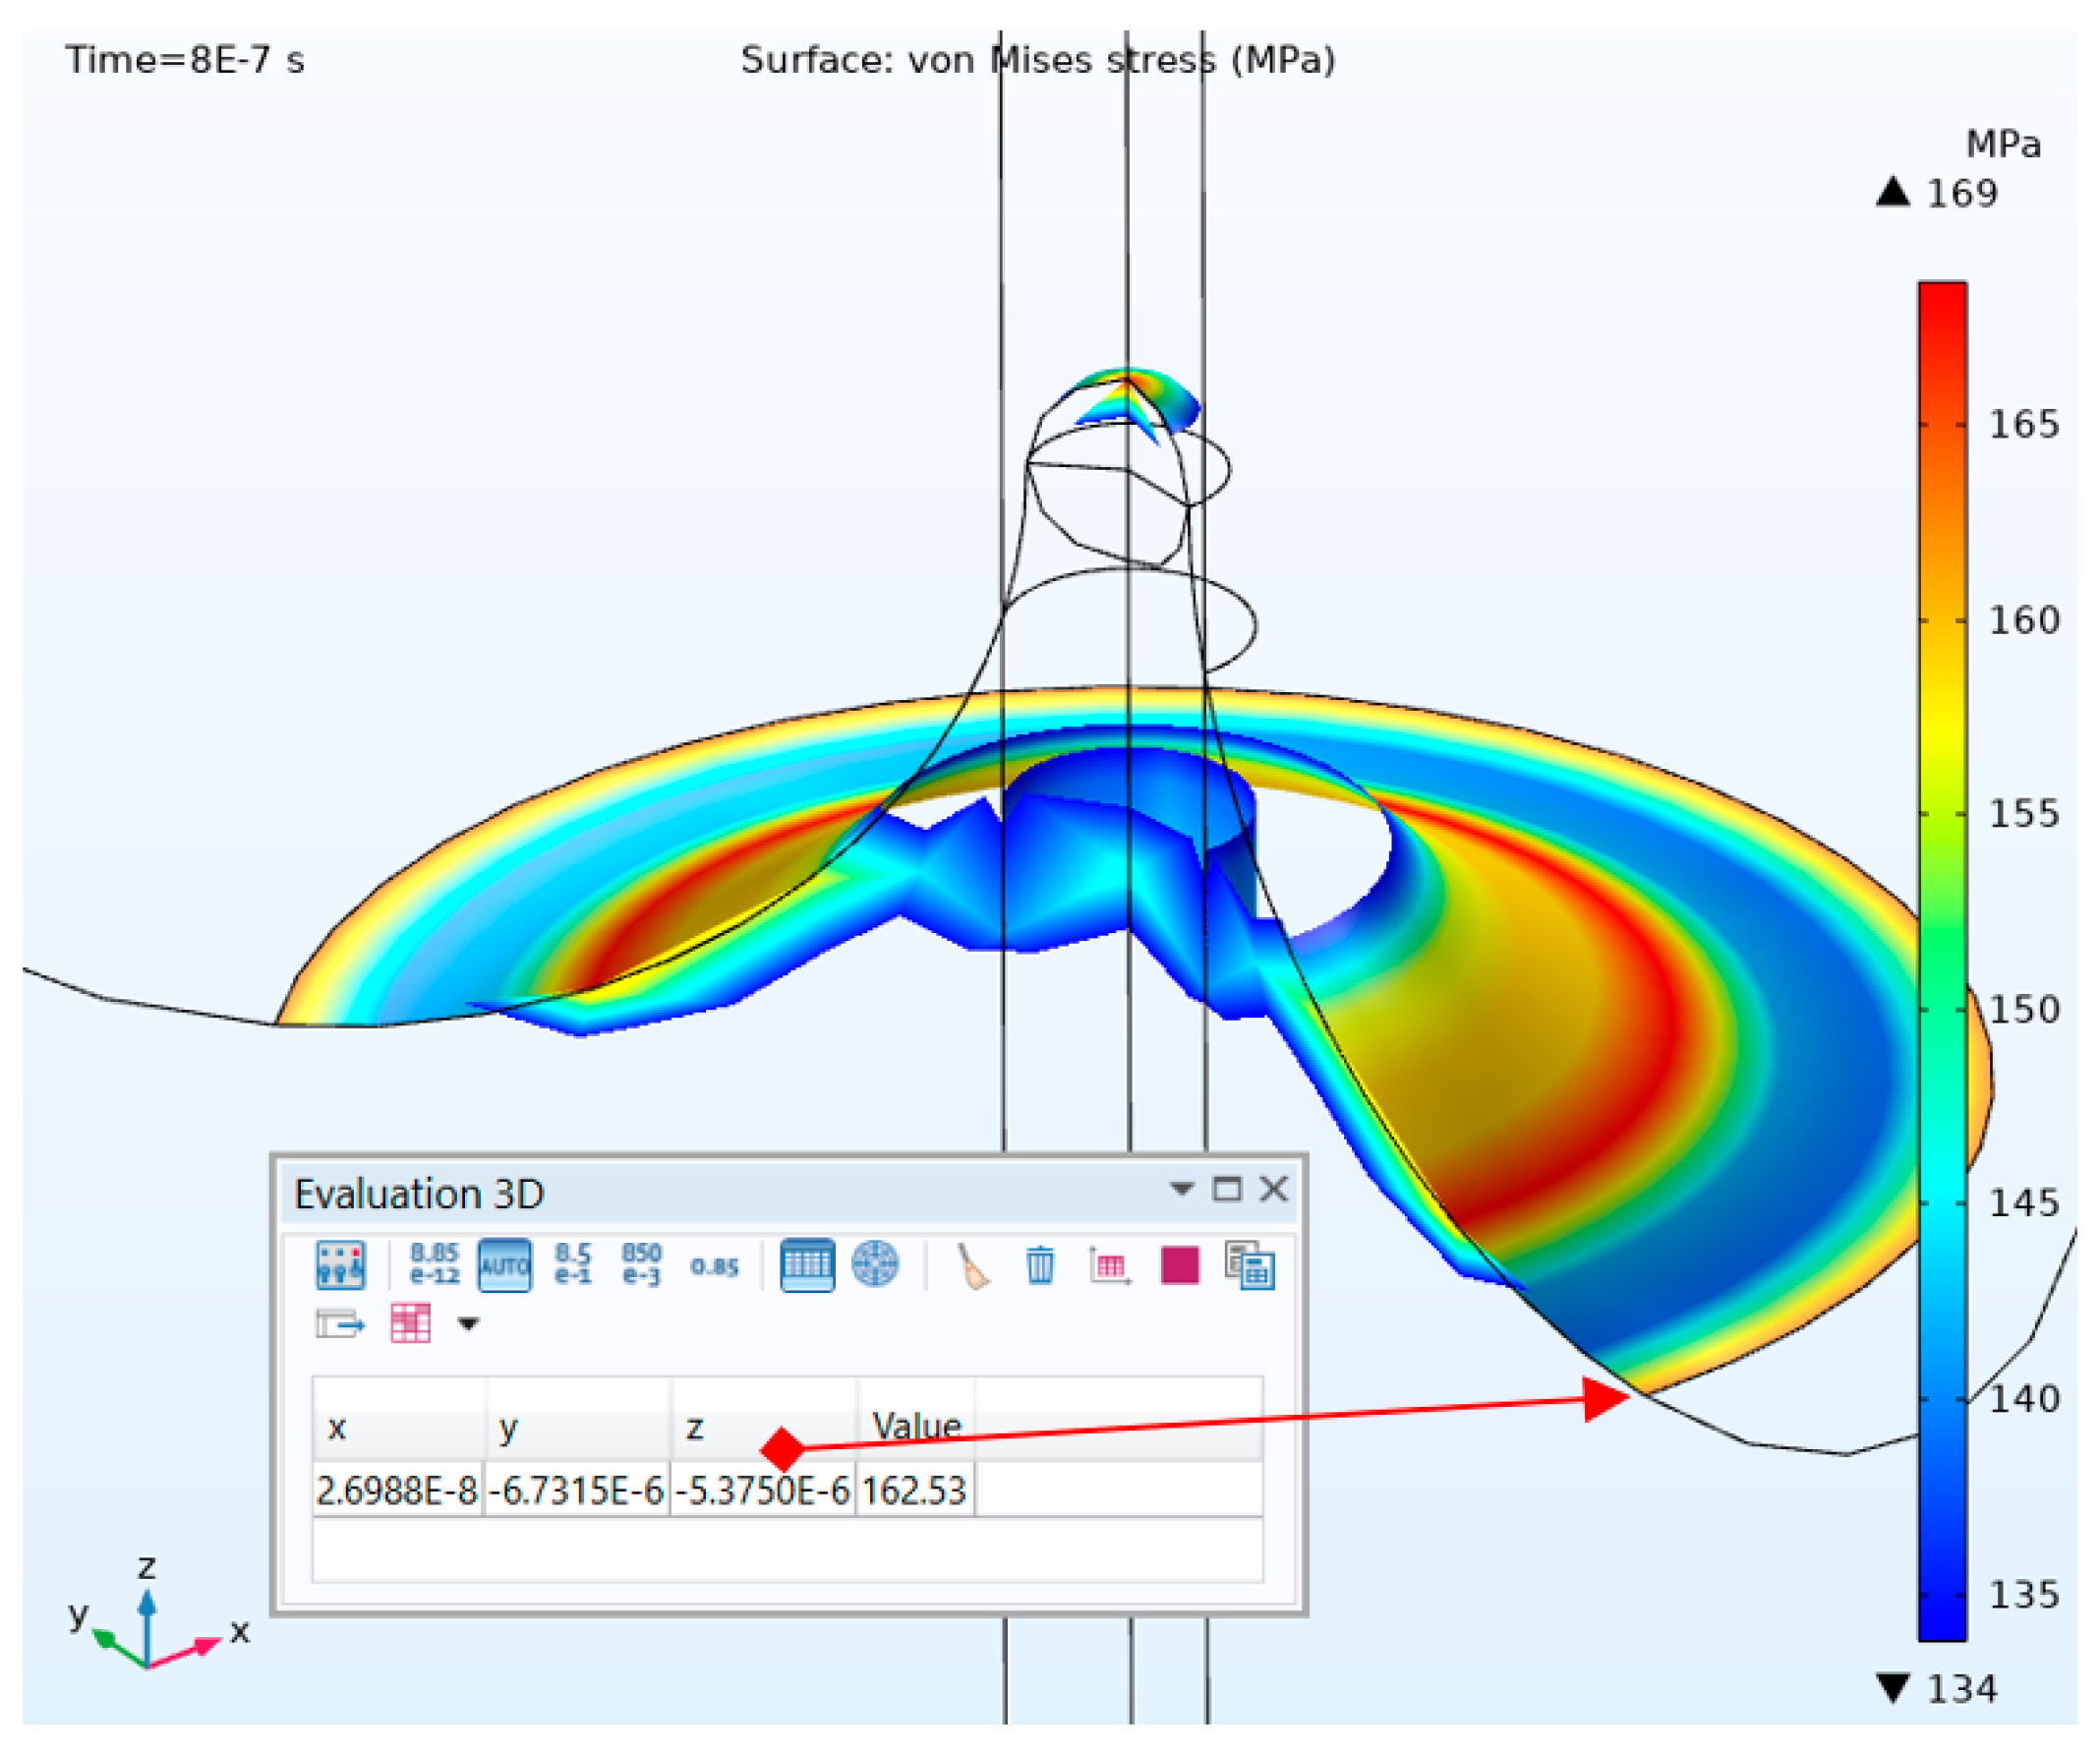
The results obtained in the case of those materials confirmed the experimentally distinctive values of consumed power, PcUS = 130 W, used for NE allow, and PcUS = 80 W, since they correspond to different values of ultrasonic pressure, respectively, pUS = 150 MPa, and pUS = 100 MPa. These values decreased the surface roughness Rz, so the depth of the removed layer did not exceed the depth of the initial crater as it is presented in Figure 14 for system NE, and Figure 15 for system SOFT.
Figure 14.
System NE removed material by pressure pUS = 150 MPa.
Figure 15.
System SOFT removed material by pressure pUS = 100 MPa.
This could be explained by different resistance characteristics (see Table 2), which are higher in the case of the system NE alloy compared to system SOFT.
8. Conclusions
The multiple types of applications and domains of using CoCr alloys justify the study of their behavior at adequate machining, like EDM and US hybrid EDM. Computer vision instruments are powerful means for the analysis of machined surfaces that cover a significant number of microgeometry elements from a statistic point of view, since the machining process EDM and EDM+US have strong stochastic natures.
Despite the fact that the discrimination of craters’ dimensions at different working modes has a degree of subjectivity involved because it is difficult to rigorously establish the margins of normal discharges, it could be a valuable method of comparison between usual EDM process and US hybrid machining, since it pointed out that process stability produced by ultrasonic hybrid machining is higher than at usual EDM at any pulse time longer than 95 µs. The stability of the EDM process is enhanced by US hybridization at a relatively long pulse time, when the probability (P*) of overlapping cumulative microjets stage on pulse duration is high, at around 70%. At a lower pulse time, and at decreased probability of overlapping (P* ≈ 20%), the process occurs very close to classic EDM, so the stability of the hybrid EDM compared to the usual process has no major benefits.
The analysis revealed the role of key-technological parameters, such as the consumed power on the ultrasonic chain (PcUS) that could improve the stability and surface quality of hybrid machining. This should be optimized as a function of microgeometry dimensions and resistance characteristics of materials to be machined. In this study the PcUS power increased by around 60% by switching from System SOFT to System NE alloy machining. Moreover, in EDM+US, the melted layer and resolidified layer are much thinner than in the case of simple EDM because the gas bubble implodes at the end of each ultrasonic period (Tus) during the cumulative micro-jets (CMS) phase. This allows the dielectric fluid to remove the material melted by the discharge when the CMS overlaps with the discharge duration.
Further research will be directed to validate these experimental results through additional means of investigation like speed cameras which are able to visualize the dynamics of ultrasonically induced cavitation within the gap correlated with plasma channel evolution.
Author Contributions
Introduction, L.-D.G. and V.G.; Characterization of CoCr Alloys, and Experimental Setup, L.-D.G.; Software Application, V.G. and A.-A.S.; Results, Discussion, Numerical Simulation, and Conclusions, L.-D.G.; Extended numerical simulations for different working regimes and detailed comparison with experimental results, P.-A.C.; References, L.-D.G., V.G. and A.-A.S.; Writing—review and editing, L.-D.G., V.G. and A.-A.S.; Funding acquisition, L.-D.G. and V.G. All authors have read and agreed to the published version of the manuscript.
Funding
The Article Processing Charge (APC) was funded by the National University of Science and Technology POLITEHNICA Bucharest.
Data Availability Statement
The data presented in this study are available on request from the corresponding author due to privacy.
Conflicts of Interest
The authors declare no conflict of interest.
References
- Ghiculescu, D. Ultrasonically Aided Electrical Discharge Machining. In Electrical Discharge Machining (EDM), Types, Technologies and Applications; Jahan, M.P., Ed.; Nova Publishers: New York, NY, USA, 2015; pp. 151–208. ISBN 978-1-63438-591-6. [Google Scholar]
- Sukma, I.; Heryana, G. Electrical Discharge Machining (EDM) for Precision Manufacturing of Diesel Engine Injector Orifice Nozzles: A Systematic Review of Advances, Optimization, and Sustainability. J. Teknol. Dan Rekayasa Alat Berat 2026, 3, 13–20. [Google Scholar]
- Dinh, V.T.; Le, T.Q.; Vu, D.B.; Vu, N.P.; Mai, T.L. Ultrasonic EDM for External Cylindrical Surface Machining with Graphite Electrodes: Horn Design and Hybrid NSGA-II–AHP Optimization of MRR and Ra. Machines 2025, 13, 675. [Google Scholar] [CrossRef] [Scilit]
- Yu, P.; Wang, L.; Gao, Y.; Li, Q.; Li, Y. Ultrasonic Vibration-Assisted Micro-Electrical Discharge Machining Characteristics and Parameter Optimization of C/SiC Composites. Micromachines 2025, 16, 1257. [Google Scholar] [CrossRef] [Scilit]
- Esser, G.; Yan, J. Direct Observation of Discharge Phenomena in Vibration-Assisted Micro EDM of Array Structures. Micromachines 2022, 13, 1286. [Google Scholar] [CrossRef] [Scilit]
- Kumba, A.B.; Ramaiah, V. Optimization in Wire-Cut EDM of Aluminium Hybrid Metal Matrix Composite using Taguchi Coupled Deng’s Similarity based Approach. UPB Sci. Bull. Ser. D 2019, 81, 169–186. [Google Scholar]
- Hou, S.; Bai, J. A Geometric Prediction Model of Surface Morphology in Micro-EDM Considering Stochastic Characteristics of Discharge Crater Size. Int. J. Adv. Manuf. Technol. 2021, 117, 1147–1162. [Google Scholar] [CrossRef] [Scilit]
- Yao, Z.; Ye, L.; Wu, M.; Qian, J.; Reynaerts, D. Prediction of Crater Morphology and Its Application for Enhancing Dimensional Accuracy in Micro-EDM. J. Intell. Manuf. 2024, 36, 4055–4081. [Google Scholar] [CrossRef] [Scilit]
- Çakıroğlu, R. Analysis of EDM Machining Parameters for Keyway on Ti-6Al-4V Alloy and Modelling by Artificial Neural Network and Regression Analysis Methods. Sadhana Indian Acad. Sci. 2022, 47, 150. [Google Scholar] [CrossRef] [Scilit]
- Gonzalez-Sanchez, E.; Saccardo, D.; Borges Esteves, P.; Kuffa, M.; Wegener, K. Automatic Characterization of WEDM Single Craters Through AI Based Object Detection. Int. J. Autom. Technol. 2024, 18, 265–275. [Google Scholar] [CrossRef] [Scilit]
- Li, Q.; Yang, X. Study on Arc Plasma Movement and its Effect on Crater Morphology during Single-Pulse Discharge in EDM. Int. J. Adv. Manuf. Technol. 2020, 106, 5033–5047. [Google Scholar] [CrossRef] [Scilit]
- Feng, X.; Wong, S. Characterization and Geometric Modeling of Single and Overlapping Craters in micro-EDM. Mach. Sci. Technol. 2016, 20, 79–98. [Google Scholar] [CrossRef] [Scilit]
- Mani, G.; Porter, D.; Collins, S.; Schatz, T.; Ornberg, A.; Shulfer, R. A Review on Manufacturing Processes of Cobalt-Chromium Alloy Implants and its Impact on Corrosion Resistance and Biocompatibility. J. Biomed. Mater. Res. B Appl. Biomater. 2024, 112, e35431. [Google Scholar] [CrossRef] [Scilit]
- Szczęsny, G.; Kopec, M.; Politis, D.J.; Kowalewski, Z.L.; Lazarski, A.; Szolc, T. A Review on Biomaterials for Orthopaedic Surgery and Traumatology: From Past to Present. Materials 2022, 15, 3622. [Google Scholar] [CrossRef] [Scilit]
- Wai Cho, H.H.; Takaichi, A.; Kajima, Y.; Htat, H.L.; Kittikundecha, N.; Hanawa, T.; Wakabayashi, N. Effect of Post-Heat Treatment Cooling Conditions on Microstructures and Fatigue Properties of Cobalt Chromium Molybdenum Alloy Fabricated through Selective Laser Melting. Metals 2021, 11, 1005. [Google Scholar] [CrossRef] [Scilit]
- Mazumder, S.; Boban, J.; Ahmed, A. A Comprehensive Review of Recent Advancements in 3D-Printed Co-Cr-Based Alloys and Their Applications. J. Manuf. Mater. Process. 2025, 9, 169. [Google Scholar] [CrossRef] [Scilit]
- Pauzi, A.A.; Ghazali, M.J.; Zamri, W.F.H.W.; Rajabi, A. Wear Characteristics of Superalloy and Hardface Coatings in Gas Turbine Applications—A Review. Metals 2020, 10, 1171. [Google Scholar] [CrossRef] [Scilit]
- Durejko, T.; Lazinska, M. Characterization of Cobalt-Based Stellite 6 Alloy Coating Fabricated by Laser-Engineered Net Shaping (LENS). Materials 2021, 14, 7442. [Google Scholar] [CrossRef] [Scilit] [PubMed]
- Smolina, I.; Kobiela, K. Characterization of Wear and Corrosion Resistance of Stellite 6 Laser Surfaced Alloyed (LSA) with Rhenium. Coatings 2021, 11, 292. [Google Scholar] [CrossRef] [Scilit]
- De Rosset, W.S.; Montgomery, J.S. Cobalt-base Alloy Gun Barrel Study. Wear 2014, 316, 119–123. [Google Scholar] [CrossRef] [Scilit]
- CoCr Alloys for Stomatology. Available online: https://www.dentex.ro/aliaj-co-cr-system-soft-1g (accessed on 28 December 2025).
- Ghiculescu, D.; Marinescu, N.I.; Nanu, A.S. Equipment for Ultrasound Assisted Electrical Discharge Machining of Microslots. Patent RO126191B1, 23 December 2008. [Google Scholar]
- Beyeler, M. A Practical Introduction to the World of Machine Learning and Image Processing Using OpenCV and Python; Packt Publishing Ltd.: Birmingham, UK, 2017; ISBN 978-1-78398-028-4. [Google Scholar]
- McBride, M. Image Processing in Python; LeanPub: London, UK, 2021. [Google Scholar]
- Ansari, I.A.; Bajaj, V. Image Processing with Python: A Practical Approach; IOP Publishing: Bristol, UK, 2024. [Google Scholar]
- Nadda, R.; Nirala, C.K.; Singh, P.K.; Lee, D.; Kumar, R.; Singh, T. An Overview of Techniques for Monitoring and Compensating Tool Wear in Micro-Electrical Discharge Machining. Heliyon 2024, 10, e26784. [Google Scholar] [CrossRef] [Scilit]
- Zhang, Y.; Liu, Y.; Ji, R. Sinking EDM in Water-in-oil Emulsion. Int. J. Adv. Manuf. Technol. 2013, 65, 705–716. [Google Scholar] [CrossRef] [Scilit]
- Hayakawa, S.; Wang, W.; Itoigawa, F.; Nakamura, T.; Matsubara, T. In-Process Measurement and Control of Gap Distance in EDM Process. Int. J. Electr. Mach. 2023, 8, 39–43. [Google Scholar]
- Modica, F.; Guadagno, G.; Marrocco, V.; Fassi, I. Evaluation of Micro-EDM Milling Performance Using Pulse Discrimination. In Proceedings of the ASME 2014 International Design Engineering Technical Conferences and Computers and Information in Engineering Conference. Volume 4: 19th Design for Manufacturing and the Life Cycle Conference; 8th International Conference on Micro- and Nanosystems; ASME: New York, NY, USA, 2014. [Google Scholar]
- Koukouvinis, P.; Gavaises, M. Cavitation and Bubble Dynamics. Fundamentals and Applications; Academic Press: London, UK, 2021; ISBN 9780128233887. [Google Scholar]
- System SOFT. Instruction for Use. Available online: https://adentatec.com/wp-content/uploads/2022/02/GBA-System-Soft.pdf (accessed on 31 December 2025).
- System, N.E. Instruction for Use. Available online: https://adentatec.com/wp-content/uploads/2022/02/GBA-System-NE.pdf (accessed on 31 December 2025).
- Kunieda, M.; Lauwers, B.; Rajurkar, K.P.; Schumacher, B.M. Advancing EDM through Fundamental Insight into Discharge Phenomenon. CIRP Ann. 2005, 54, 64–87. [Google Scholar] [CrossRef] [Scilit]
- Salonitis, K.; Stournaras, A.; Canellidis, V.; Chryssolouris, G. Thermal Modeling of the Material Removal Rate and Surface Roughness for Die-Sinking EDM. Int. J. Adv. Manuf. Technol. 2009, 40, 110–123. [Google Scholar] [CrossRef] [Scilit]

Disclaimer/Publisher’s Note: The statements, opinions and data contained in all publications are solely those of the individual author(s) and contributor(s) and not of MDPI and/or the editor(s). MDPI and/or the editor(s) disclaim responsibility for any injury to people or property resulting from any ideas, methods, instructions or products referred to in the content. |
© 2026 by the authors. Licensee MDPI, Basel, Switzerland. This article is an open access article distributed under the terms and conditions of the Creative Commons Attribution (CC BY) license.