


Abstract
Intralogistic activities play a critical role in sustaining uninterrupted manufacturing in production systems. With the increased usage of autonomous mobile robots (AMRs) to feed the production systems; a complex problem structure has emerged that includes the simultaneous evaluation of the sizing of the robotic fleet, task assignment and scheduling, as well as feasibility analysis of the investment. In this study, a complete decision-support frame is proposed to decide the minimum number of robots, plan the time index robot-line assignments and calculate the Cost Ratio for multiline manufacturing systems without starvation. In the proposed method, the total robot travel time, plant layout, operation times and safety factors are given as inputs to the time-indexed mixed-integer linear programming (MILP). In the literature, the fleet sizing and the scheduling problems are mostly handled separately. These highly related problems are integrated into one frame in this study. The method is validated by utilizing two worst case scenarios for an uninterrupted operation with changeable batteries and mandatory charging break. The results demonstrate that charging strategies have a huge impact on the number of minimum robots, operational applicability and economic performance.
1. Introduction
The decision of the minimum number of robots for an uninterrupted manufacturing operation is mostly addressed as a capacity-demand balance and system bottleneck problem. Robot requirements are affected by the interaction of station count, arrival rates, travel time, and queue dynamics. Due to this fact, most of the work puts the relationship between the size of the fleet and the system performance quantitatively by relying on the queuing network-based analytical models. Especially, closed and semi-open queuing networks show that below certain robot numbers, there is starvation at the manufacturing lines. Once exceeding a certain threshold, adding a new robot to the system just contributes marginally. Studies that have taken this approach further have combined closed-queue networks with nonlinear mixed-integer programming (MINLP) to treat fleet sizing decision as a direct optimization problem and calculate the minimum number of robots under service level and waiting time constraints [1,2].
The relationship between warehouse robots and production lines is not limited to static task assignments. Demand fluctuations, unexpected delays, and robot failures in real production environments require continuous updating of plans. Therefore, in recent studies, the dynamic redefinition of robot task assignments based on real-time system status has become an important research direction. Particularly in models where production equipment and robots are considered in an integrated manner, it has been shown that classical rule-based approaches are limited; conversely, data-driven methods such as deep reinforcement learning (DRL) offer more flexible and adaptable solutions [3,4].
In robotic warehouse systems, it has been shown that performance changes significantly not only with the number of robots, but also with which tasks are assigned to which robots and with which rule set. Therefore, in the literature, decision rules such as “select the nearest task”, “earliest delivery time”, “prioritize station starvation”, “assign according to charge threshold” and their effects on system outputs are considered as a separate line of research. These results emphasize that even with the same robot fleet size, different assignment/prioritization policies can significantly change cycle time, queue length and station service levels [5].
The question of “in what order and time intervals robots will go to production lines” corresponds to the complex combinatorial problems classically addressed in the AGV/AMR scheduling literature. Early studies focused primarily on simultaneously optimizing machine operations and handling tasks using meta-heuristic methods (e.g., genetic algorithms, differential evolution). More recent literature emphasizes comparative algorithm analyses aimed at determining which solution strategy is more suitable based on different problem sizes and constraint structures. By comparing the performance of heuristic, hybrid, or exact methods depending on the problem scale, level of dynamism, and constraint density, systematic method selection for practitioners are aimed [6,7,8,9].
Charging-related operational constraints such as battery swapping, inductive charging and partial charging as well as delivery time windows and robots sharing the same corridors are considered together. The impact of charging strategies on total completion time has been examined in detail using methods such as branch-price-and-cut and MILP. Similar optimization frameworks are used to show how delivery delays have a chain reaction effect on production delays in integrated planning environments [10,11,12].
On the application side, the coordination of hundreds of robots, resource allocation, and traffic management have significantly changed the research agenda with the rise of “goods-to-person” approach in robotic warehouses. Recent surveys suggest that the question of “how many robots are sufficient?” should be considered in the design phase not only with the average demand but also with variance, peak load, and operational constraints [13,14].
The financial analysis is fed by two channels in the literature: (i) deriving financial impact from KPIs such as labor savings, cycle time, efficiency and energy consumption with simulation/analytic models, and (ii) discussing process maturity, integration and change management conditions for implementation success in technology adoption and operational adaptation studies (e.g., in the context of Industry 4.0) [15,16]. These studies show that determining the appropriate number of robots requires not only operational optimization but also economic feasibility assessment.
In the existing literature, studies on warehouse and production feeding robots mostly address the fleet sizing problem using analytical or queue network-based models that neglect the time dimension or examine robot-station assignment and scheduling problems under the assumption of a fixed number of robots. In contrast, the approach presented in this study addresses the direct calculation of robot cycle time based on physical layout, operational times, and safety factors, the use of these calculations as input for fleet sizing decisions, and the verification of the resulting number of robots through time-based scheduling, all within a single integrated framework. In this respect, the study positions itself as one of the rare studies that can directly evaluate the risk of starvation in production lines through operational scheduling, by combining the questions “how many robots are sufficient?” and “how should robots be assigned over time?”, which are usually examined separately in the literature, under the same modeling logic. The method is validated by utilizing two worst case scenarios for uninterrupted operation with changeable batteries and mandatory charging break. The results demonstrate that charging strategies have a huge impact on the number of minimum robots, operational applicability and economic performance. The data used in this study are based on real operational data of a Turkey-based manufacturing site and due to the company privacy policies, the data is used anonymously.
This study explicitly links deterministic capacity estimation derived from physical cycle time calculations with operationally feasible scheduling decisions. Cycle time-based capacity calculations first provide a lower-bound estimate for the required number of robots, and this estimate is subsequently validated through a time-indexed MILP scheduling model that ensures starvation-free operation of production lines. This relationship between capacity estimation and scheduling feasibility constitutes the main methodological distinction of the proposed framework compared with existing integrated scheduling models.
The main contributions can be summarized as follows:
- -
- An integrated decision-support framework which combines deterministic cycle time-based capacity estimation with time-indexed MILP scheduling for AMR-based production feeding systems.
- -
- A unified model that jointly addresses fleet sizing and robot-line scheduling decisions. This structure enables explicit evaluation of starvation risks in multi-line manufacturing environments.
- -
- An operational and economic evaluation framework that links scheduling feasibility with investment assessment through comparative cost analysis under different charging strategies.
2. Materials and Methods
2.1. Problem Definition
This study focuses on an optimization problem related to maintaining continuous operation in four parallel production lines within a manufacturing facility supported by autonomous mobile robots (AMRs). In the proposed system, the robots collect palletized products from a central drop-off point and deliver them to designated picking stations on each production line, after which they return the empty pallets. The main objective is to determine the minimum number of robots to maintain operations without starvation on the production lines, to plan the order and robot assignment timeline to the lines, and to analyze the Cost Ratio.
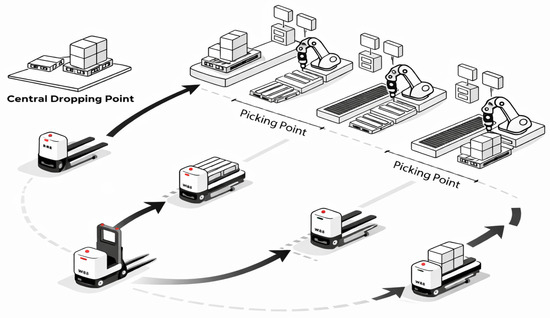
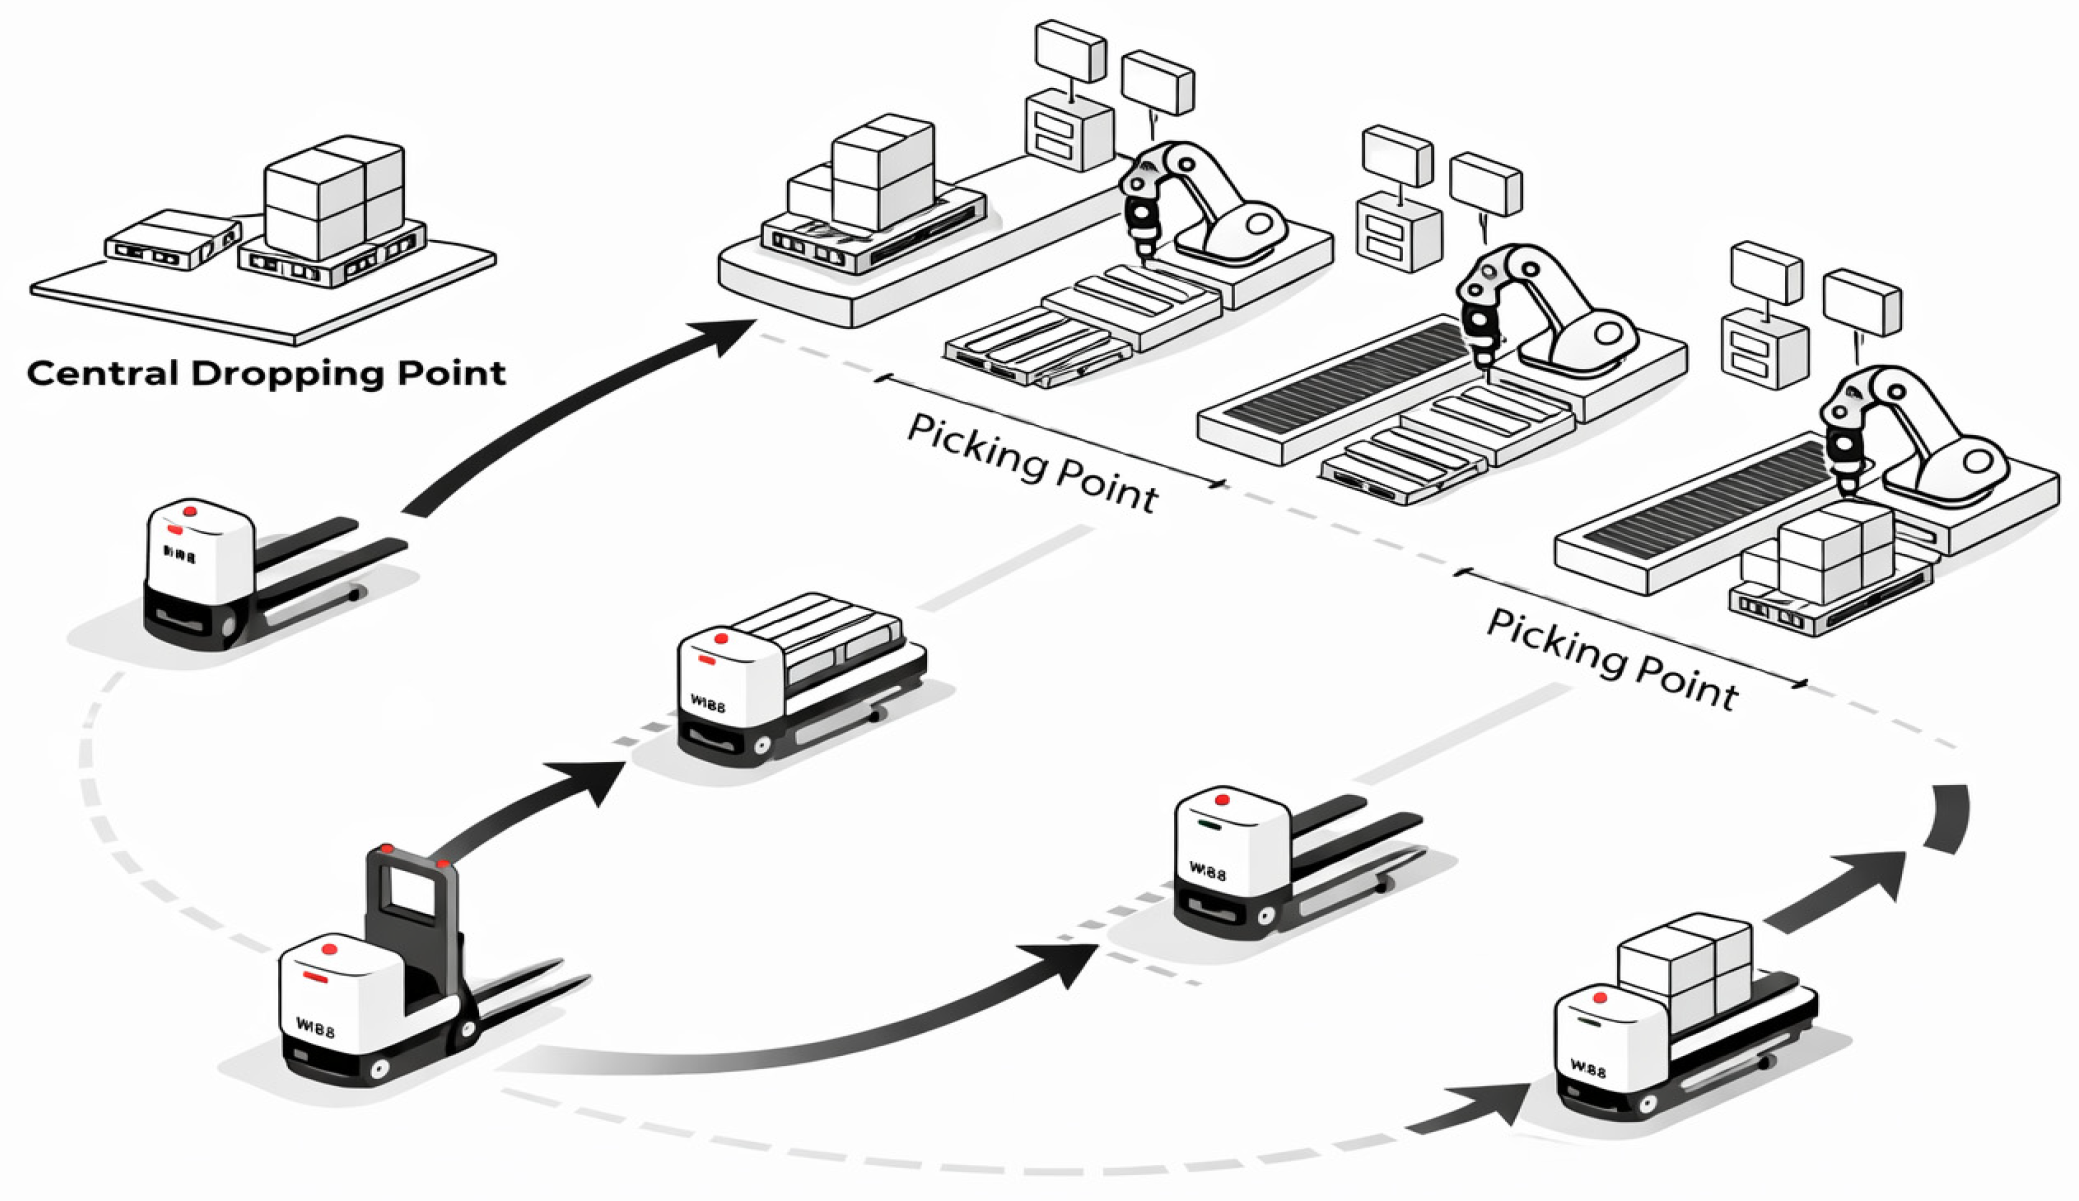
The robotic system in this study consists of AMRs operating as pallet transport units between a central dropping point and production lines as illustrated in Figure 1. The robots carry up to 750 kg, move as fast as 2 m/s, take orders from facility management systems, localize themselves, plan their paths, detect and dock with the pallets autonomously. They are characterized by parameters such as travel speed, payload handling capability, and operational service times (pick-up, drop-off, and waiting). These characteristics are explicitly incorporated into the cycle time calculations, which directly determine robot capacity and fleet sizing. Although the study focuses on AMRs, the proposed modeling framework can be adapted to other types of mobile transport systems by adjusting the corresponding operational parameters.
Figure 1.
Representative AMRs used for pallet transportation between the central dropping point and production lines.
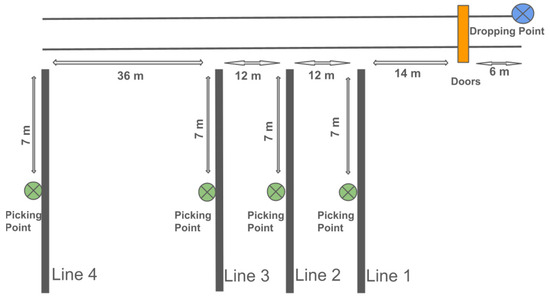
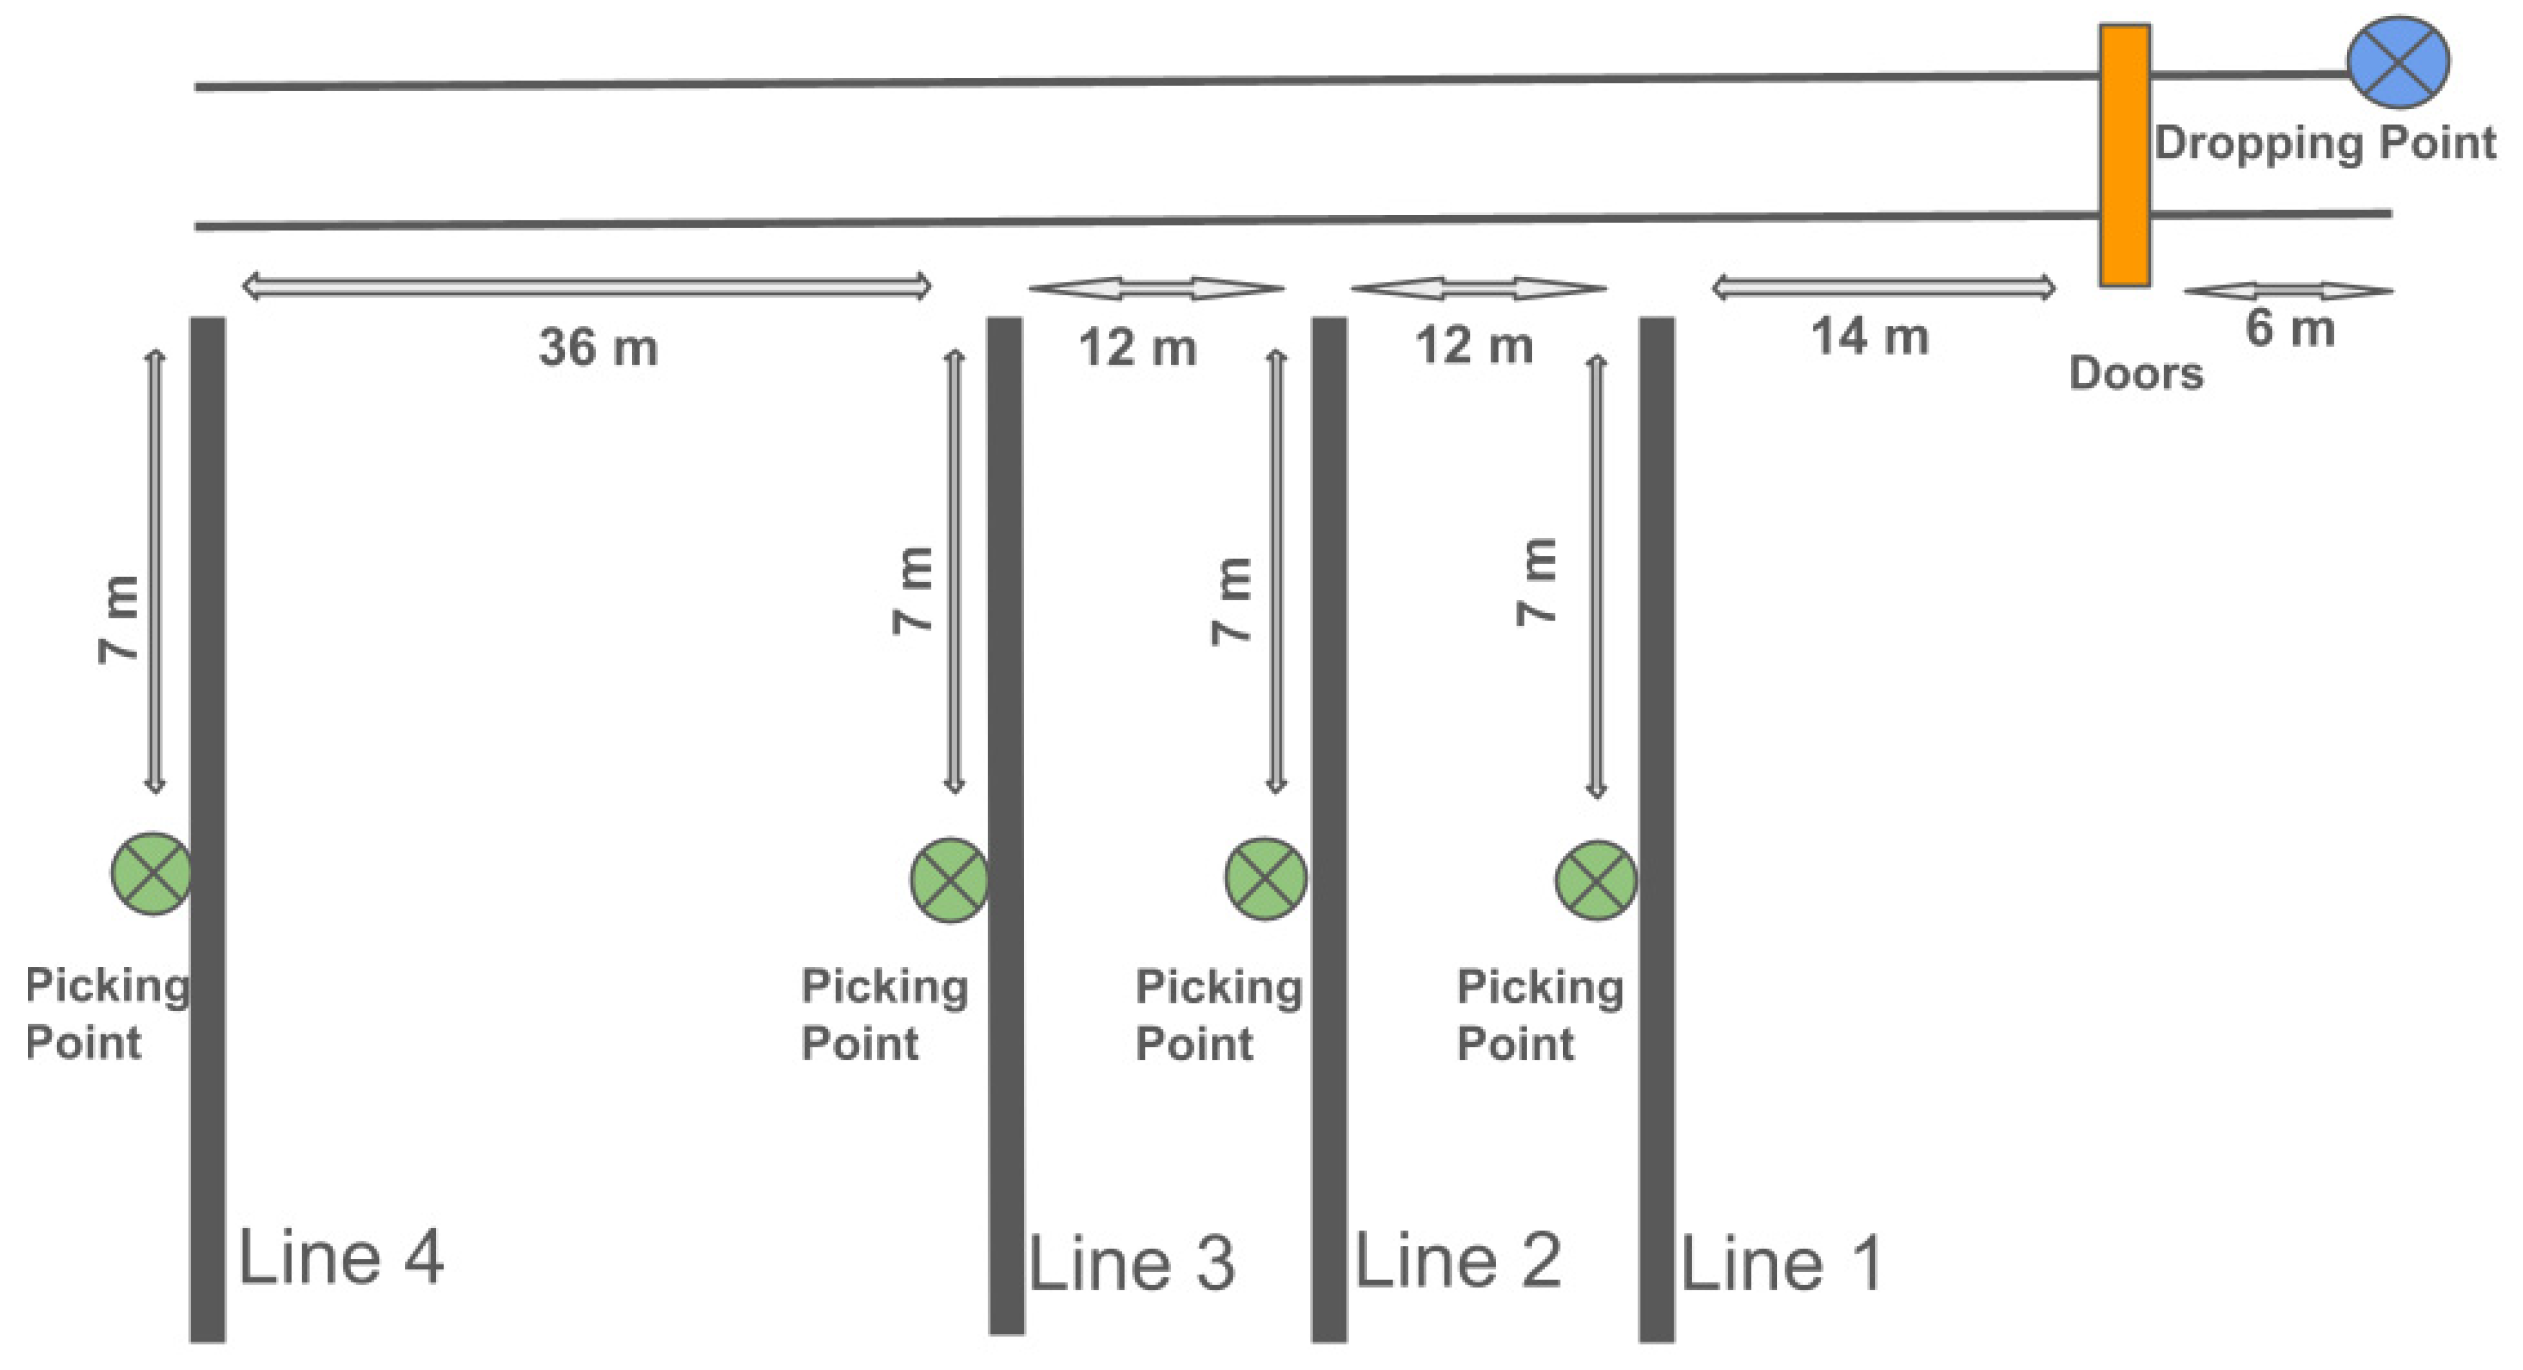
Figure 2 shows the system layout which consists of four production lines, designated as Line 1 through Line 4 and a main corridor perpendicular to these lines. Each line has a single picking point, which is modeled as fixed positions where robots perform pallet dropping/pick-up operations. The movement of the robots is calculated by considering the distances parallel and perpendicular to the lines, door passages, and distances to the dropping point. This geometric layout-based modeling approach is widely used in the literature for accurate estimation of robot travel times in warehouse and production feeding systems [1,3].
Figure 2.
Layout of four manufacturing lines.
Hourly product requirements and product quantity per pallet are pre-known parameters for each production line. This information determines the material demand that arises over time on a line basis and directly affects the service frequency of robots. Robot cycle time is derived from travel distances and operational processing times. Similarly, in fleet sizing studies in the literature, modeling the robot cycle time by separating it enables a realistic analysis of system performance [2].
Since the problem represents a dynamic intralogistics environment, the assignment of robots to production lines is not treated as a purely static distribution problem. Which line, in what order, and at what time intervals the robots will serve is determined by the instantaneous status of the production lines and the pending demand. This makes the problem a multi-robot multi-station task assignment and scheduling problem. In the literature, such problems are classified as complex and NP-hard, especially for AGV/AMR systems. The solution approaches vary according to the problem scale and level of dynamism [9].
The problem also includes the decision regime and policy design dimension. Different task assignment options can significantly alter waiting times and services on production lines even with the same number of robots. The maintenance policies are as critical as the number of robots [5].
In this work, the problem is treated not only as an operational challenge but also as an economic decision-making task. The payback period of the automation investment is estimated by considering the monthly robot costs, annual service expenses, and existing labor costs. This perspective aligns with widely used Cost Ratio and payback period analyses in robotic intralogistics systems. In this way, technical performance is directly related to financial outcomes [13,15].
The data used in this study, including the system layout, production line demand, robot travel distances, and processing times, were collected from an industrial facility that is currently in operation. Due to confidentiality agreements with the company, specific details such as the company name, product type, and other commercially sensitive information cannot be disclosed. However, all parameters used in the model were preserved to represent a model-based analysis of a real industrial problem rather than a hypothetical example.
2.2. Mathematical Model
This section discusses the proposed mathematical model for AMRs that perform material feeding on production lines. The model includes robot cycle time calculation, robot capacity estimation, robot-line assignment, and time-based scheduling to meet production line demands. The results are also used to calculate the Cost Ratio.
The fundamental contribution of the proposed mathematical model is its systematic extension of commonly used linear approaches based on total demand–total capacity through a time-indexed MILP structure. The model utilizes the deterministic cycle time calculations directly as a parameter generation layer which transforms operational data into a scheduling formulation. The model allows comparison of two extreme scenarios (one where robots operate continuously and another where they are out of operation due to charging) under the same model structure quantitatively reveals the impact of battery strategy on fleet sizing and Cost Ratio. Therefore, the proposed method is not only a scheduling model but also a decision-support tool that simultaneously considers practical feasibility and economic decisions.
The queue network-based approaches provide a lower bound for robot fleet size. However, these models often fail to adequately represent the time dimension and robot-line interactions. In this study, the capacity heuristic obtained using closed and semi-open queue network logic is validated at the operational level with a time-indexed MILP formulation. The scheduling model refines the lower bound by explicitly modeling temporal conflicts, assignment exclusivity, and sequencing constraints. Thus, capacity sufficiency is translated into operational feasibility.
In this sense, the proposed formulation extends classical time-indexed MILP scheduling models by introducing a deterministic capacity estimation layer that derives the candidate fleet size directly from physical cycle time calculations before the scheduling stage. This hierarchical structure allows the model to bridge analytical fleet sizing heuristics and operational scheduling feasibility within a single optimization framework.
The proposed method follows a two-layer structure. In the first layer, the service time per pallet for each line and the associated robot capacity are derived using the cycle time calculation. In the second layer, this capacity is used as a constraint in a time-indexed MILP model for assigning and scheduling robots to lines over time. This approach is consistent with the literature based on integrating transportation tasks in intralogistics with MILP-based scheduling via “calculated service times” [11,17,18].
2.2.1. Parameters, Inputs and Outputs
The model inputs consist of demand and operational parameters defined separately for each production line and are given in Table 1. These parameters are hourly product requirement, product quantity per pallet, robot speed, horizontal and vertical travel distances, dropping distance, pallet pick-up and drop-off times, door waiting time, and safety factor. In addition, robot charging time, empty pallet handling time, monthly robot cost, annual service cost, monthly worker salary, and current number of workers were included in the model for economic analysis. This type of detailed parameterization is commonly used in the literature for realistic modeling of robotic intralogistics systems [1,3].
Table 1.
Model inputs.
The model produces key outputs that ensure continuous supply to production lines by considering operational and economic decisions together. In Table 2, the outputs include the minimum number of robots required to service the four production lines, time-based service schedules for the robots on the lines, and the comparative economic Cost Ratio of the robotic system compared to the existing workforce. The index sets are given in Table 3. The outputs allow for the evaluation not only of the technical feasibility of the system but also of the financial sustainability of investment decisions.
Table 2.
Model outputs.
Table 3.
Sets.
The production lines’ demand, distances in the layout, time, and cost parameters in the model are derived from operational data and field measurements of a real production facility. Due to confidentiality requirements, raw data was not shared directly. However, the ratios between parameters, physical constraints, and operational logic are preserved exactly as they were.
2.2.2. Robot Cycle Time Calculation
The total distance traveled during a single pallet handling task is defined as the sum of the vertical distance, horizontal distance, and dropping distance:
The round-trip travel time is calculated by dividing two times the total distance by the robot’s speed:
The total time required to transport a pallet is obtained by summing the pallet pick-up time, travel time, drop-off time, and door waiting time, and multiplying this sum by a safety factor.
A safety factor is used to account for uncertainties, congestion, and micro-delays in the model [14]. This approach allows the model to capture uncertainty implicitly without resorting to stochastic programming, which would substantially increase computational complexity.
2.2.3. Robot Capacity
Robot capacity is defined as the maximum number of pallets a robot can carry in a given time period. For stationary battery robots, assuming 8 h of daily operation and 4 h of charging time, the daily capacity is calculated as follows:
Alternatively, in the scenario where a replaceable battery is used, the robot capacity can be recalculated by increasing the operation time. This type of cycle time-based modeling of robot capacity is a standard approach in fleet sizing studies [2].
2.2.4. The Decision Parameters and the Cost Function
The decision parameters of the problem are as follows
robot activation;
If the robot r is assigned to the line i at time t;
the number of pallets served by the robot r at time t;
start of the robot r to serve to the line i.
The objective function aims to determine the minimum number of robots that must be included in the system to meet the demands of all production lines, under time-indexed scheduling and task conflict constraints:
2.2.5. Constraints for Robot Assignment and Scheduling Assumptions
The following operational constraints are considered during the scheduling phase:
- The assignment service capacity relationship is
- A robot is assigned if it is active.
- Each robot can only serve one production line at a time.
- More than one robot cannot serve the same production line at the same time.
- Robot-line assignments are sequenced in time to meet demand.
The cycle time of requires the robot to be “busy” in consecutive slots while serving a line. The slot number is formulated as . The service duration is defined in terms of discrete time slots which are derived from the pallet cycle time. This ensures consistency between physical execution and scheduling while preventing fractional task overlaps that would be infeasible in practice.
If robot r starts serving to line i at time t, it cannot be assigned to another line during the next slot.
Constraints (11) and (12) ensure that once a robot begins serving a production line, it remains occupied for the duration of the pallet service cycle. This prevents the robot from being assigned to another line during the service period. These assumptions are consistent with AGV/AMR scheduling problems involving multiple robots and multiple stations [9,19]. This structure transforms the problem from a classical static assignment problem into a scheduling problem including a time dimension.
2.2.6. Economic Model and Cost Ratio Analysis
The investment decisions are often evaluated based on payback considerations which can be given using the Cost Ratio calculation formulated with the following steps:
The total annual cost of robots is calculated as follows:
The total annual cost paid for labor in the current manual system is:
The Cost Ratio is defined as the ratio between the annual cost of the robotic system and the annual labor cost of the current manual operation [13,15].
This formulation delivers a transparent comparison between robotic and manual systems under identical operational assumptions instead of providing a full investment evaluation.
The proposed model integrates fleet sizing and scheduling by integrating deterministic capacity abstraction with time-indexed scheduling and economic evaluation within a unified framework. Hence the theoretical and practical scope of intralogistics optimization models is extended.
3. Results
The proposed mixed-integer linear programming model was implemented in Python 3.11 using the PuLP optimization library and solved with the open-source CBC MILP solver. The computational experiments were performed on a standard workstation (Intel-based processor with 16 GB RAM). For the case study presented in this work (four production lines, candidate robot set, and discretized time slots representing the planning horizon), optimal solutions were obtained within a few seconds of computation time.
Scenario 1 (Replaceable battery—uninterrupted operation):
Based on the inputs in Table 4 (hourly product requirement per line: P = {1400, 1400, 850, 1400} products/hour; products per pallet: U = {336, 432, 384, 384} products/pallet; speed v = 0.5 m/s; vertical distance 7 m; horizontal distance {14, 26, 38, 74} m; pick and drop times 150 s and 90 s, respectively; door waiting 30 s; drop distance 6 m; safety factor 1.1), cycle time-based capacity calculations and the subsequent scheduling step resulted in a minimum of three robots to meet the demand of four lines. This solution maximizes effective daily operating time, reducing fleet requirements, under the assumption that robots do not require charging interruptions.
Table 4.
Inputs for the replaceable battery case and 8 h of operation + 4 h of charging case.
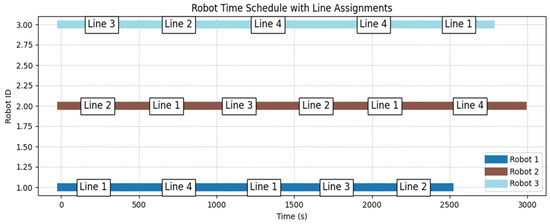
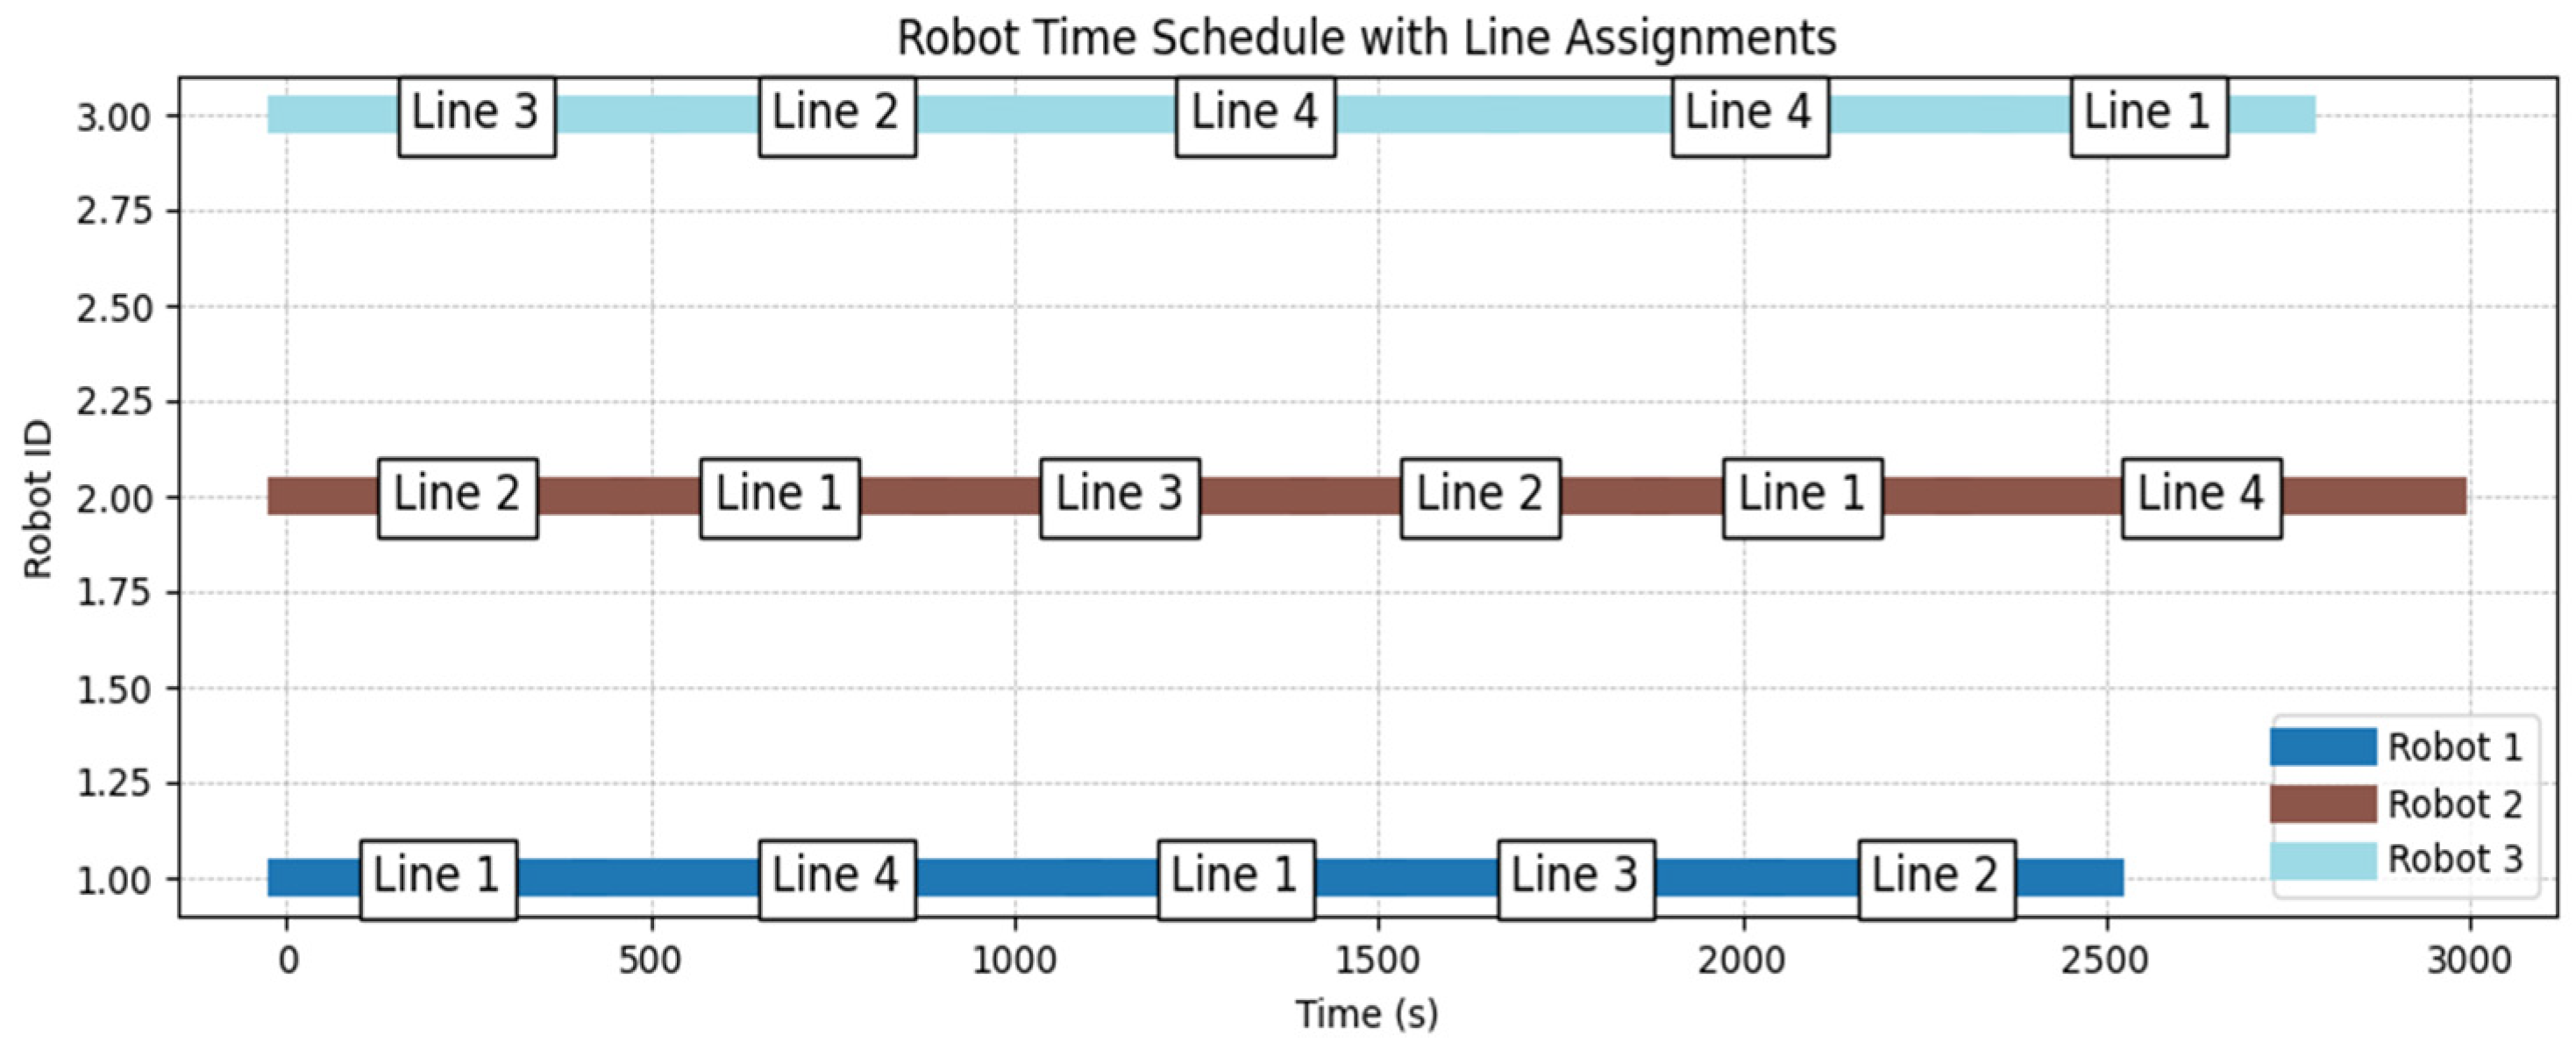
The schedule in Figure 3 shows how robots rotate across production lines over time. Service continuity is maintained while fulfilling the constraints of single-line service and robot availability. The detailed schedule indicates that three robots alternate service between lines over time. For example, Robot 1 operates in the sequence Line 1→Line 4→Line 1→Line 3→Line 2, Robot 2 in the sequence Line 2→Line 1→Line 3→Line 2→Line 1→Line 4, and Robot 3 in the sequence Line 3→Line 2→Line 4→Line 4→Line 1. This satisfies the constraint that each robot serves only one line at a time. It also ensures that no more than one robot is assigned to a line simultaneously.
Figure 3.
Robot time schedule with line assignments for replaceable battery.
In the economic evaluation, the total annual robot cost for three robots was calculated as $57,000 (assuming a monthly robot payment of $1500 and an additional annual service cost of $1000 per robot), while the annual labor cost for three workers in the current situation was found to be $54,000 ($1500 per month). Based on this comparison, the Cost Ratio between robotic and manual operation is 1.06.
Scenario 2 (8 h of operation + 4 h of charging):
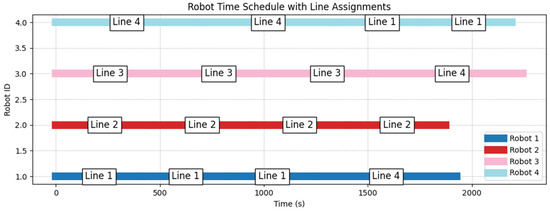
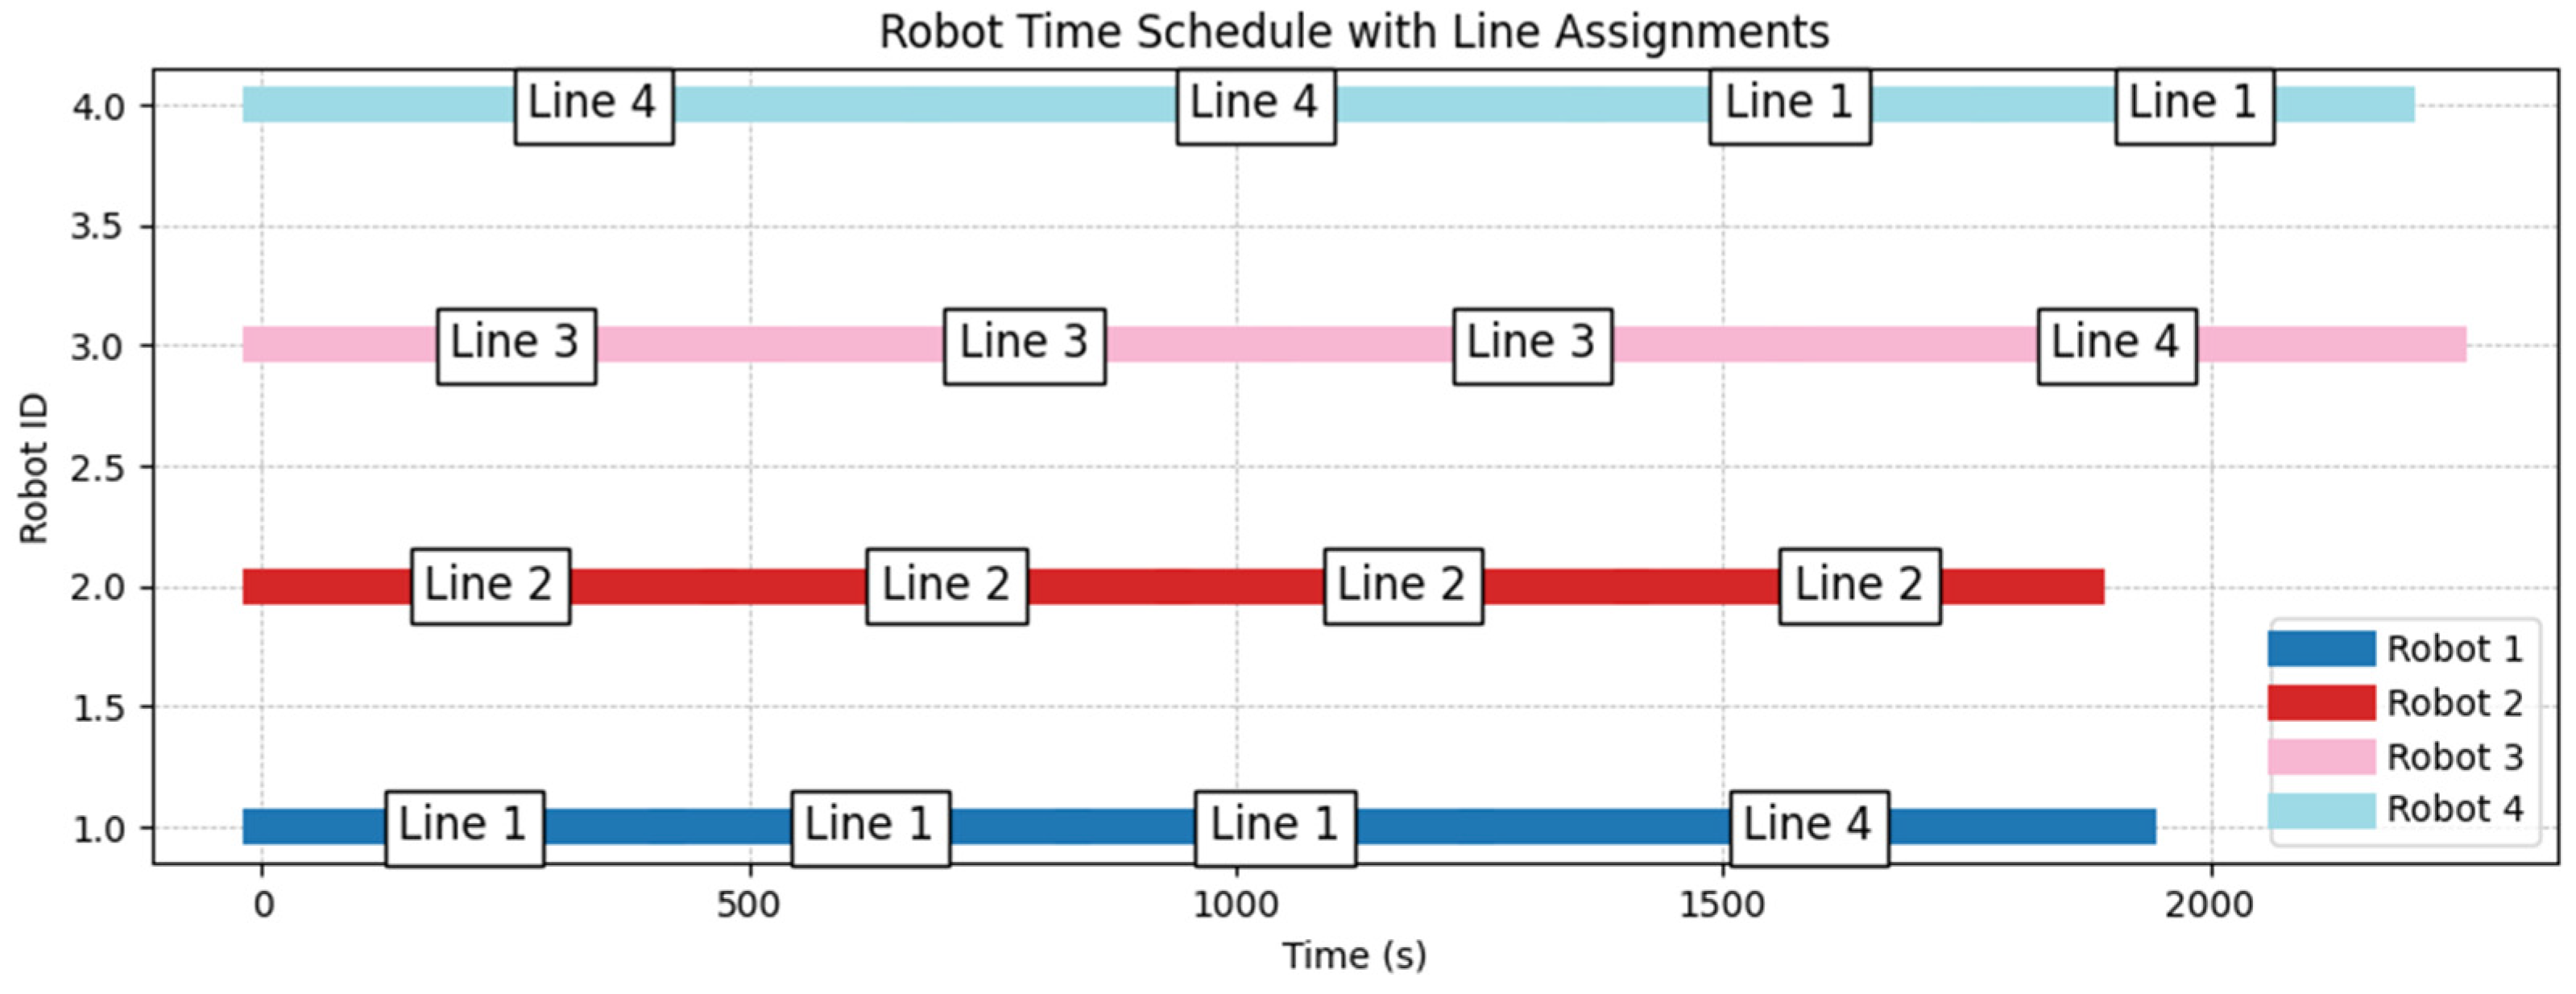
In a scenario of 8 h of operation and 4 h of charging, the reduced operating time decreases the service capacity of each robot, which leads to an increase in the required fleet size. When the cycle time and demand parameters obtained in Scenario 1 were kept constant as shown in Table 4, the minimum fleet size to meet the pallet demand of four production lines under time-indexed scheduling and capacity constraints was determined to be four. The resulting schedule in Figure 4 illustrates that each robot is primarily concentrated on a single line throughout the day. Hence, service continuity, especially for high-demand lines (e.g., Line 1 and Line 2) is ensured under this structure. This indicates that charging intervals reduce the flexibility of task sharing between robots.
Figure 4.
Robot time schedule with line assignments for 8 h operation 4 h charging.
From an economic standpoint, the total annual cost of operating four robots is estimated at $76,000, whereas employing three workers results in an annual labor cost of $54,000. Based on these values, the Cost Ratio of the robotic system is calculated as 1.41. When robots are temporarily unavailable due to charging requirements, additional units are needed to ensure continuous supply to the production lines. This, in turn, reduces the overall economic attractiveness of the robotic solution.
The two scenarios highlight the direct relationship between robot operating availability, fleet sizing decisions, and the ability to maintain uninterrupted material supply to production lines. In the replaceable battery scenario, where robots operate continuously without charging interruptions, the system can satisfy the pallet demand of all four production lines with a minimum fleet size of three robots. Robot service is distributed dynamically across the lines which ensures balanced utilization while preventing line starvation. In contrast, when robots are limited to eight hours of operation with four hours of charging, the reduced operating time leads to higher fleet requirements. The robots tend to concentrate on high-demand lines to preserve service continuity. Hence robot availability and charging strategy significantly influence fleet sizing decisions, robot utilization patterns, and the operational feasibility of continuous production feeding.
Scenario 3 (Extended and Different Layout):
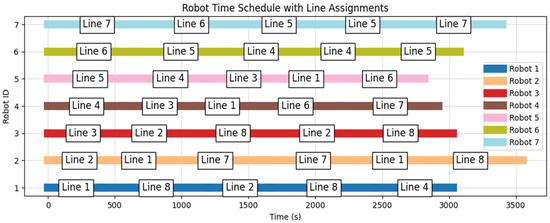
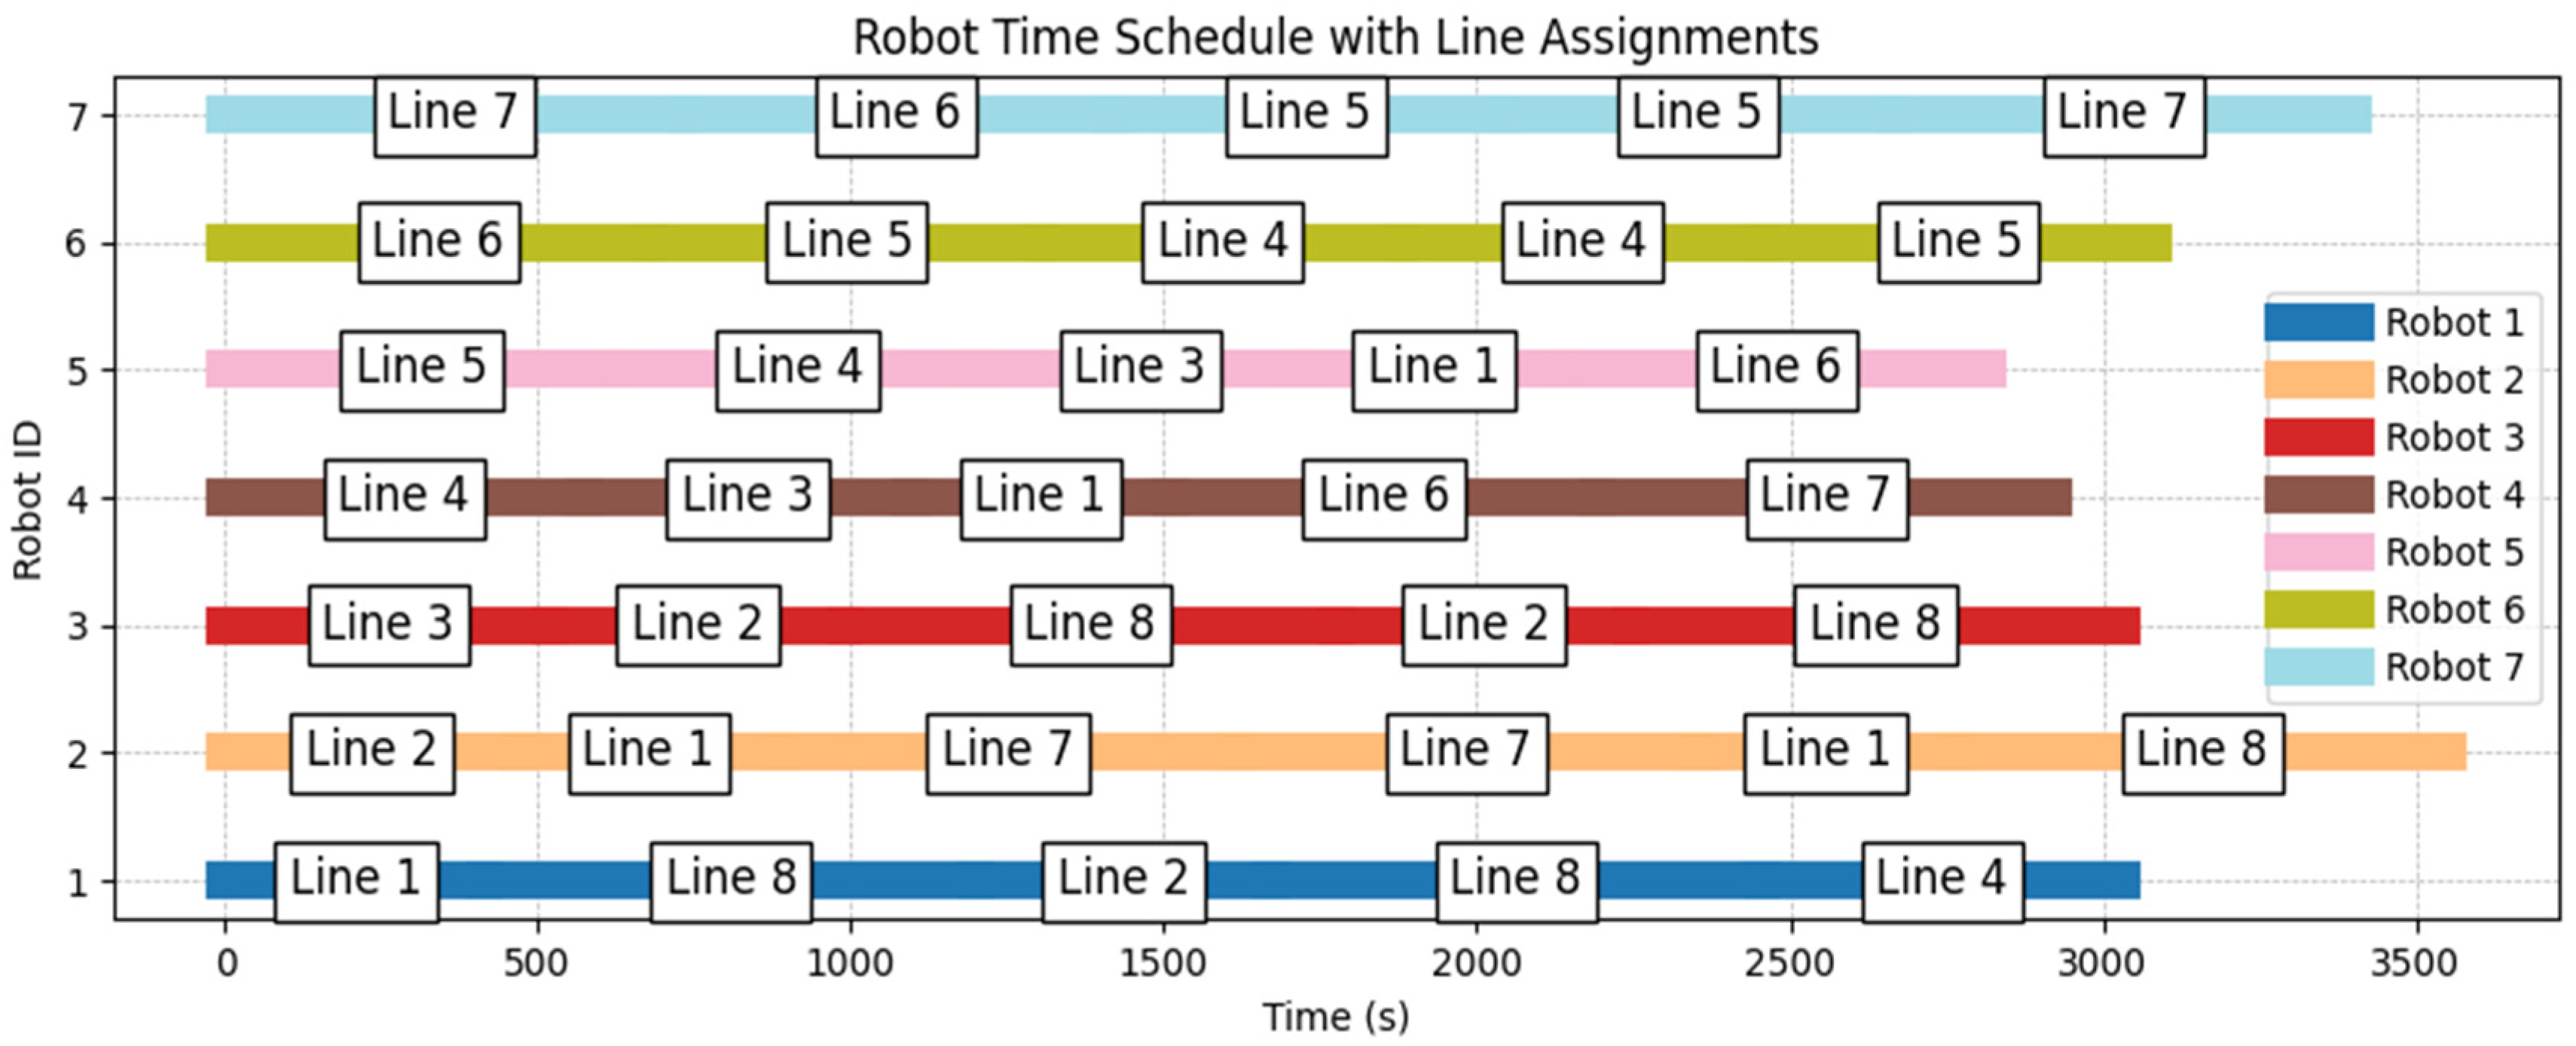
The numerical experiments presented in Scenarios 1 and 2 are based on the layout of a single industrial facility. However, the proposed framework is not restricted to this configuration. The optimization model can be directly adapted to different facility layouts and demand profiles. To illustrate the scalability of the model, an additional experiment was conducted with an extended layout including eight production lines. The inputs are hourly product requirement per line: P = {1400, 1400, 850, 1400, 1400, 1400, 1400,1400} products/hour; products per pallet: U = {336, 432, 384, 336, 336, 384, 336, 336} products/pallet; speed v = 0.5 m/s; vertical distance 7 m; horizontal distance {14, 26, 38, 50, 62, 74, 86, 98} m; pick and drop times 150 s and 90 s respectively; door waiting 30 s; drop distance 6 m; safety factor 1.1 in Table 5. Applying the same modeling approach to the extended layout results in a minimum of seven robots to meet the demand across eight lines. Figure 5 presents that the proposed time-indexed formulation can coordinate robot assignments across a larger number of stations while maintaining scalability.
Table 5.
Inputs for the replaceable battery case for extended and different layout.
Figure 5.
Robot time schedule with line assignments for replaceable battery for extended layout.
Sensitivity analysis
To evaluate the robustness of the results, a brief sensitivity analysis was conducted by varying several key operational parameters that directly influence the robot cycle time and scheduling feasibility. Robot speed, safety factor (α), and time slot length (Δ) were examined. Increasing robot speed reduces travel time and therefore increases effective robot capacity which leads to a reduction in the minimum fleet size required to satisfy line demand. Higher safety factors cause longer service times, which may increase fleet requirements and reduce scheduling flexibility in short planning horizons. Finally, the time slot length affects the temporal discretization of the scheduling model through the relationship . While larger slot lengths slightly increase scheduling flexibility by reducing the number of discrete service intervals, smaller slot lengths provide higher temporal resolution. Across these variations, the main conclusion of the study remains consistent such that charging strategy has a significant impact on fleet sizing and economic performance.
Decision-Support Tool
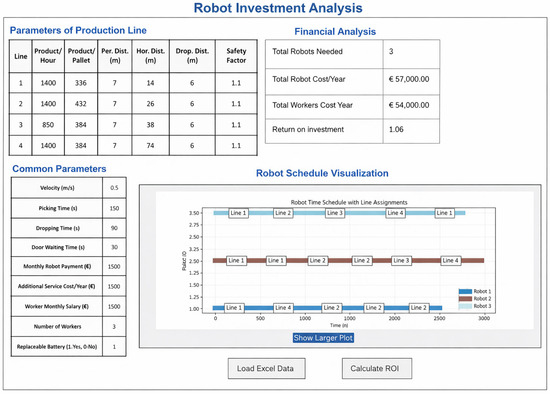
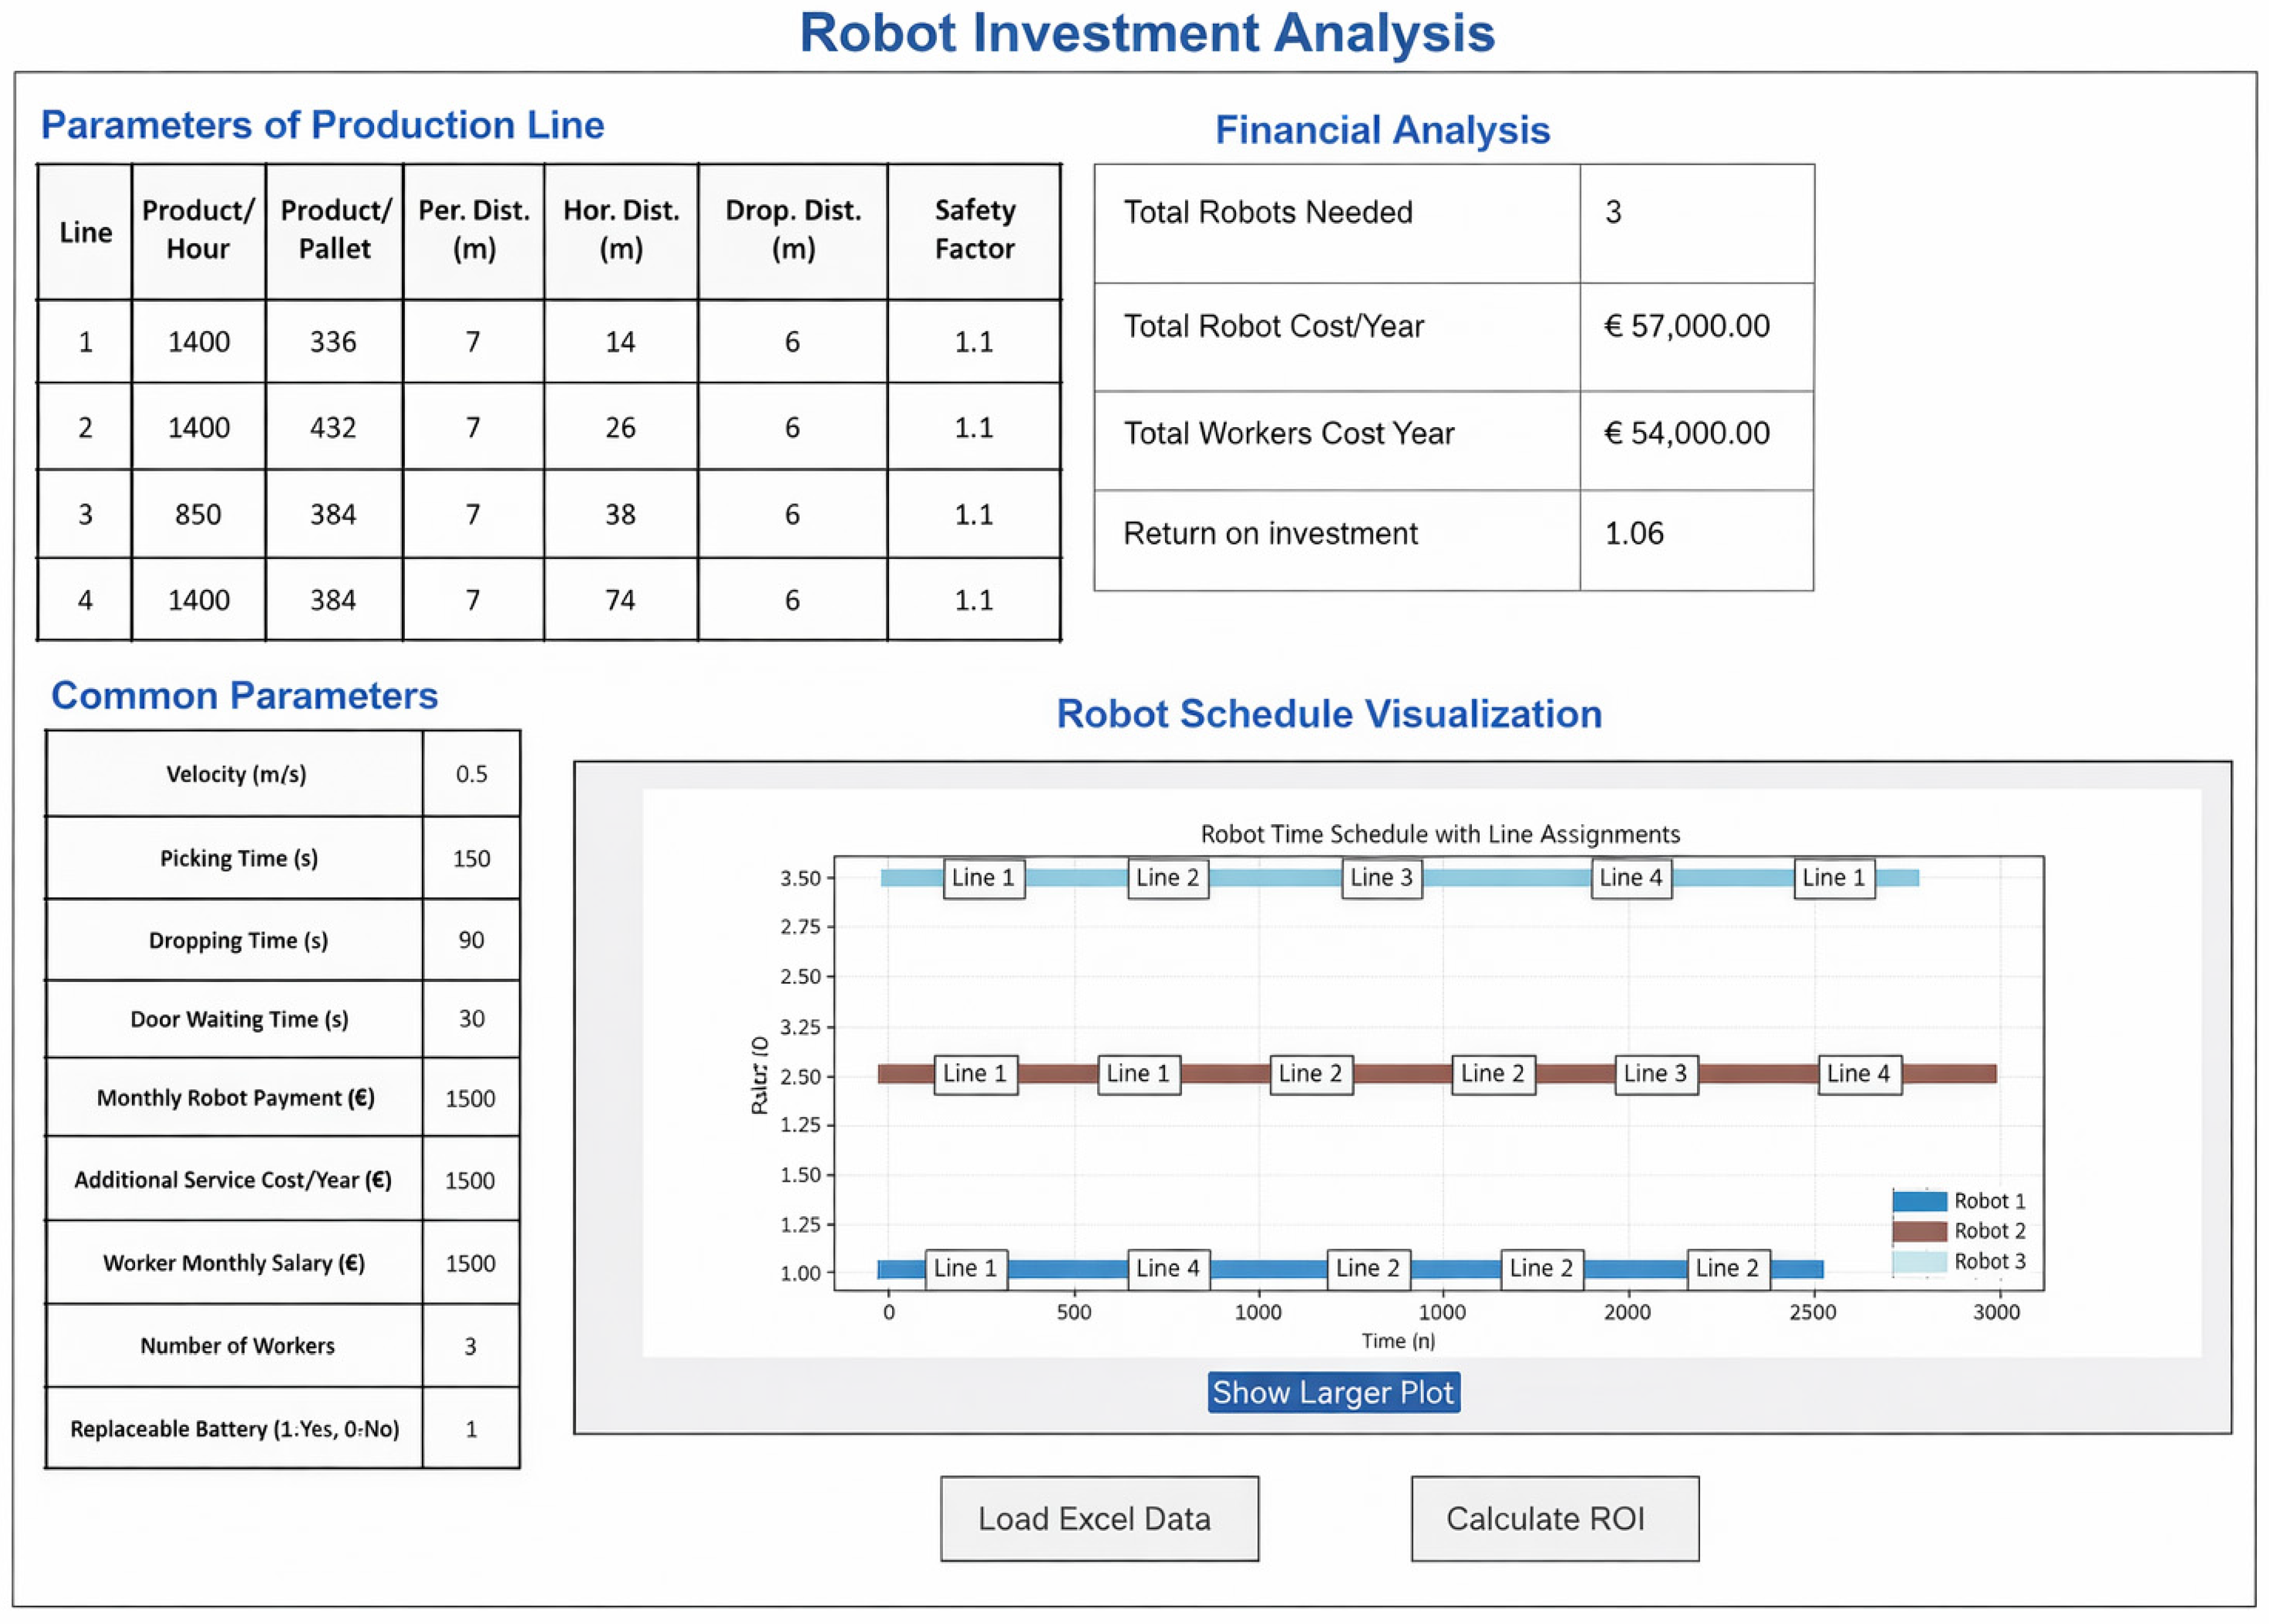
The proposed mathematical model is supported by a user-friendly interface shown in Figure 6 to enable industrial users to quickly and systematically evaluate different operational scenarios. This developed interface allows for the entry of demand, layout, and processing time parameters for production lines on a line-by-line basis. The common parameters such as robot speed, safety factor, and cost components can be defined centrally. Based on the data entered by the user, the system automatically calculates the required minimum number of robots, robot-line assignments, and time-based service schedules. It also provides financial analysis.
Figure 6.
Robot investment analysis interface.
With this structure, the interface transforms from a static calculation tool that analyzes only a single scenario into an interactive decision-support system which can perform sensitivity analyses on demand changes, increases in the number of production lines, and critical parameters. Therefore, the developed tool boosts the applicability of the proposed optimization model in real industrial environments and supports both operational planning and investment evaluation.
4. Conclusions
This study presents an integrated modeling approach for feeding production lines using AMRs. The proposed method combines cycle time calculations based on physical layout with a time-indexed MILP formulation. It simultaneously addresses robot fleet sizing, robot-line assignments, time-based scheduling, and economic evaluation. This integrated structure shows that capacity-based approaches that disregard the time dimension of robot operations, may underestimate the required number of robots.
Comparative analyses based on two different worst case scenarios clearly revealed the impact of a battery charging strategy on system performance. In the scenario where robots can operate continuously with replaceable batteries, it is possible to feed production lines with fewer robots. When robots require charging interruptions, additional robots are needed to maintain continuity. This directly affects the economic investment parameters of robotic systems and shows that investment decisions should not rely solely on average capacity calculations but also on time-based operational models.
The proposed approach provides a powerful evaluation tool for both operational and economic decision-making. The study provides a methodological contribution to literature by integrating fleet sizing and scheduling decisions under a single time-indexed MILP model.
The model also offers practical applicability in real industrial environments. The results were evaluated to support operational decisions at the production facility where the study was conducted. The feasibility of the proposed robot fleet size and time-based schedules under field conditions was confirmed by the relevant engineering teams.
The present model relies on deterministic cycle time estimations derived from average operational parameters. However, real systems may exhibit operational variability due to congestion, dynamic task arrivals, unexpected delays, and robot interactions in shared corridors. Future research may extend this work by integrating stochastic modeling and congestion-aware routing strategies in AMR-based intralogistics systems.
Funding
This research received no external funding.
Data Availability Statement
The data are not publicly available due to confidentiality and privacy restrictions.
Conflicts of Interest
The author declares no conflict of interest.
Abbreviations
The following abbreviations are used in this manuscript:
| MILP | Mixed-Integer Linear Programming |
| AMR | Autonomous Mobile Robots |
| AGV | Autonomous Guided Vehicles |
References
- Lamballais, T.; Roy, D.; De Koster, R. Estimating performance in a Robotic Mobile Fulfillment System. Eur. J. Oper. Res. 2017, 256, 976–990. [Google Scholar] [CrossRef] [Scilit]
- Amjath, M.; Kerbache, L.; Smith, J.M.; Elomri, A. Fleet sizing of trucks for an inter-facility material handling system using closed queueing networks. Oper. Res. Perspect. 2022, 9, 100245. [Google Scholar] [CrossRef] [Scilit]
- Moretti, E.; Tappia, E.; Mauri, M.; Melacini, M. A performance model for mobile robot-based part feeding systems to supermarkets. Flex. Serv. Manuf. J. 2022, 34, 580–613. [Google Scholar] [CrossRef] [Scilit]
- Wang, J.; Li, Y.; Zhang, Z.; Wu, Z.; Wu, L.; Jia, S.; Peng, T. Dynamic Integrated Scheduling of Production Equipment and Automated Guided Vehicles in a Flexible Job Shop Based on Deep Reinforcement Learning. Processes 2024, 12, 2423. [Google Scholar] [CrossRef] [Scilit]
- Merschformann, M.; Lamballais, T.; de Koster, R.; Suhl, L. Decision rules for robotic mobile fulfillment systems. Oper. Res. Perspect. 2019, 6, 100128. [Google Scholar] [CrossRef] [Scilit]
- Babu, A.G.; Jerald, J.; Noorul Haq, A.; Luxmi, V.M.; Vigneswaralu, T.P. Scheduling of machines and automated guided vehicles in FMS using differential evolution. Int. J. Prod. Res. 2010, 48, 4683–4699. [Google Scholar] [CrossRef] [Scilit]
- Dang, Q.; Singh, N.; Adan, I.; Martagan, T.; Sande, D. Scheduling heterogeneous multi-load AGVs with battery constraints. Comput. Oper. Res. 2021, 136, 105517. [Google Scholar] [CrossRef] [Scilit]
- De Ryck, M.; Versteyhe, M.; Shariatmadar, K. Resource management in decentralized industrial Automated Guided Vehicle systems. J. Manuf. Syst. 2020, 54, 204–214. [Google Scholar] [CrossRef] [Scilit]
- Schweitzer, F.; Bitsch, G.; Louw, L. Choosing Solution Strategies for Scheduling Automated Guided Vehicles in Production Using Machine Learning. Appl. Sci. 2023, 13, 806. [Google Scholar] [CrossRef] [Scilit]
- Meyer, A.; Gschwind, T.; Amberg, B.; Colling, D. Exact algorithms for routing electric autonomous mobile robots in Intralogistics. Eur. J. Oper. Res. 2025, 323, 830–851. [Google Scholar] [CrossRef] [Scilit]
- Liang, T.; Zhou, L.; Jiang, Z. Integrated scheduling of production and material delivery for the intelligent manufacturing system. Int. J. Prod. Res. 2025, 63, 882–903. [Google Scholar] [CrossRef] [Scilit]
- Zhuang, C.; Qu, J.; Wang, T.; Lin, L.; Bi, Y.; Li, M. Comprehensive MILP Formulation and Solution for Simultaneous Scheduling of Machines and AGVs in a Partitioned Flexible Manufacturing System. Machines 2025, 13, 519. [Google Scholar] [CrossRef] [Scilit]
- D’Andrea, R. Guest Editorial: A Revolution in the Warehouse: A Retrospective on Kiva Systems and the Grand Challenges Ahead. IEEE Trans. Autom. Sci. Eng. 2012, 9, 638–639. [Google Scholar] [CrossRef] [Scilit]
- Azadeh, K.; De Koster, R.; Roy, D. Robotized and Automated Warehouse Systems: Review and Recent Developments. Transp. Sci. 2019, 53, 917–945. [Google Scholar] [CrossRef] [Scilit]
- Grover, A.K.; Ashraf, M.H. Leveraging autonomous mobile robots for Industry 4.0 warehouses: A multiple case study analysis. Int. J. Logist. Manag. 2024, 35, 1168–1199. [Google Scholar] [CrossRef] [Scilit]
- Lacknera, T.; Hermanna, J.; Kuhna, C.; Palma, D. Review of autonomous mobile robots in intralogistics: State-of-the-art, limitations and research gaps. Procedia CIRP 2024, 130, 930–935. [Google Scholar] [CrossRef] [Scilit]
- Hu, E.; He, J.; Shen, S. A dynamic integrated scheduling method based on hierarchical planning for heterogeneous AGV fleets in warehouses. Front. Neurorobot. 2023, 16, 1053067. [Google Scholar] [CrossRef] [Scilit] [PubMed]
- Bocciaa, M.; Masonea, A.; Sterlea, C.; Murino, T. The parallel AGV scheduling problem with battery constraints: A new formulation and a matheuristic approach. Eur. J. Oper. Res. 2023, 307, 590–603. [Google Scholar] [CrossRef] [Scilit]
- Li, Y.; Wen, X.; Zhou, S.; Chung, S. Smart Automated Guided Vehicle scheduling with flexible battery management: A new formulation and an exact approach. Comput. Oper. Res. 2025, 183, 107156. [Google Scholar] [CrossRef] [Scilit]

Disclaimer/Publisher’s Note: The statements, opinions and data contained in all publications are solely those of the individual author(s) and contributor(s) and not of MDPI and/or the editor(s). MDPI and/or the editor(s) disclaim responsibility for any injury to people or property resulting from any ideas, methods, instructions or products referred to in the content. |
© 2026 by the author. Licensee MDPI, Basel, Switzerland. This article is an open access article distributed under the terms and conditions of the Creative Commons Attribution (CC BY) license.