


Abstract
This paper presents a comprehensive review of the intelligent understanding of power grid drawings, with the aim of enabling reliable and executable grid modeling. First, a unified pipeline is established to describe the transformation from drawings to grid models, covering visual understanding, topology inference, and consistency validation. Second, existing methods are systematically analyzed within this framework, where visual understanding extracts components and textual information and topology inference reconstructs electrical connectivity and network structure. Third, model generation methods are investigated as a critical yet underexplored component, focusing on topology correctness and physical constraint verification. Compared with existing review studies that primarily focus on perception-level tasks such as detection and recognition, this paper explicitly emphasizes the reliability of the resulting models. It highlights that errors in connectivity inference and the lack of validation mechanisms significantly limit practical deployment. Key challenges, including connectivity ambiguity, error propagation, and the absence of standardized validation frameworks, are analyzed. Furthermore, emerging directions such as topology-aware learning and physics-constrained validation are discussed. This review provides a structured perspective on transforming power grid drawings into reliable models and offers insights for future research into power system digitalization.
1. Introduction
Power grid drawings, such as single-line diagrams (SLDs), substation configuration diagrams, and wiring schematics, serve as fundamental carriers of structural and operational information in modern power systems [1,2,3]. They provide compact visual representations of electrical components, connectivity relationships, and functional configurations, and are widely used across system design, construction, operation, and maintenance, as shown in Figure 1. With the increasing deployment of digital substations and the growing demand for intelligent grid management, these drawings are expected to support not only human interpretation but also automated processing for applications such as network modeling, power flow analysis, and digital twin construction [4]. Despite their importance, most power grid drawings remain in unstructured or semi-structured formats, often stored as scanned documents, PDF files, or CAD files without explicit machine-readable semantics. As a result, critical information, including component types, electrical connections, and system topology, must still be manually interpreted and converted into computational models, such as common information model (CIM)-based representations. This manual process is time-consuming, error-prone, and difficult to scale, particularly in large-scale power systems with complex configurations and frequent updates. Consequently, enabling the automated transformation of drawings into executable grid models has become an important research problem.
Figure 1.
Functions of power grid drawings.
In recent years, significant efforts have been devoted to the analysis of engineering and power grid drawings using computer vision and pattern recognition techniques [5,6,7,8,9,10,11,12,13]. For example, Hussain et al. present a standards-based approach for automatically generating single-line diagrams of multivendor smart distribution systems in [5]. Their work demonstrates the feasibility of using standardized data structures to support automated diagram generation. However, the approach assumes that structured system information is already available and does not address how such information can be automatically extracted from unstructured drawings. Similarly, Solorio-García et al. investigate the translation and analysis of substation configurations based on the IEC 61850 standard in [6]. Their work focuses on mapping system configurations into standardized representations for substation automation systems. While this approach improves interoperability between power system components, it primarily relies on predefined configuration data and does not consider the problem of extracting topology and parameters from engineering drawings. Other studies focus on modeling and planning of smart distribution systems. For instance, Siddique et al. analyze the modeling and operation of prospective smart distribution substations in [7]. Although this work provides insights into system modeling and operational analysis, it assumes that the system topology is already known and does not address how topology information can be reconstructed from graphical representations such as single-line diagrams. With the rapid development of digital power systems, digital twin technologies have also attracted increasing attention. Gómez-Luna et al. investigate the role of standards in enabling digital twin-based grid planning in [8], while Das et al. provide comprehensive reviews of digital twin applications in energy systems and power grids in [9]. These studies highlight the importance of accurate and up-to-date system models for digital twin applications. However, they generally assume that grid models are already available and do not address how such models can be automatically generated from existing engineering documentation. In parallel, recent research has explored computer-vision-based approaches for interpreting engineering drawings. Yin et al. propose a graph-enhanced vision framework for detecting equipment components in construction drawings in [10]. Their work demonstrates the potential of deep learning methods for recognizing graphical elements in complex diagrams. Nevertheless, such approaches mainly focus on visual recognition tasks and do not explicitly address how detected components and textual information can be transformed into reliable electrical network models. Recent advances in computer vision and artificial intelligence have significantly improved visual recognition capabilities. Surveys such as Wang et al. summarize recent developments in deep learning-based visual understanding in [11]. Other works explore AI applications in power system security and intelligent analysis [12], or discuss emerging paradigms of cognitive AI [13]. Although these studies provide valuable insights into advanced AI techniques, they are largely method-oriented and do not directly address the structured transformation from engineering drawings to executable grid models. Overall, existing studies address different aspects of power system digitalization, including diagram generation, system modeling, digital twins, and visual recognition of engineering drawings. However, these efforts remain fragmented. Most power system studies assume that system topology and parameters are already available, while computer-vision-based approaches primarily focus on detecting visual elements without ensuring the correctness of the resulting electrical network models. Consequently, the critical problem of transforming power grid drawings into reliable and executable grid models remains insufficiently studied.
Although many studies and surveys have investigated diagram recognition and engineering drawing understanding, most of them concentrate on perception-level problems, such as symbol detection, optical character recognition, or general diagram parsing, as illustrated in [14,15,16]. These works typically evaluate recognition accuracy without addressing how extracted visual elements can be transformed into reliable and executable power system models, as shown in Table 1. And to the best of our knowledge, existing reviews on engineering or power grid drawing analysis primarily focus on isolated tasks such as symbol recognition, text extraction, or general diagram parsing. A systematic review that explicitly frames power grid drawing analysis as a structured transformation from visual representations to reliable grid models, while jointly considering topology inference and model generation, remains largely absent. Motivated by this perspective, this paper presents a comprehensive review of intelligent understanding of power grid drawings from a pipeline-oriented viewpoint. Instead of organizing existing methods solely by techniques, this review structures the literature along the transformation pipeline from drawings to reliable grid models. Specifically, we analyze three key aspects: (i) visual understanding for extracting components and textual information, (ii) topology inference for reconstructing electrical connectivity and network structure, and (iii) model generation methods for ensuring the correctness and reliability of the resulting models. As shown in Figure 2, the main contributions of this paper are summarized as follows:
- (1)
- This paper reframes power grid drawing analysis from isolated visual recognition tasks into a structured transformation process toward reliable grid models. It establishes a unified pipeline that links visual understanding, topology inference, model generation, and model generation, highlighting the interdependence among these stages.
- (2)
- Rather than reviewing methods in isolation, the paper explicitly connects perception-level techniques, connectivity analysis, and topology reconstruction to their impacts on model correctness and usability, providing a clearer understanding of how errors propagate across stages and affect downstream power system applications.
- (3)
- The review identifies topology inference and model generation as the critical yet underexplored challenges in existing research. It systematically analyzes issues such as ambiguous connectivity, missing or incorrect links, and the lack of mechanisms to enforce electrical and structural constraints, offering a more realistic assessment of current limitations.
- (4)
- The paper discusses emerging research directions for improving reliability, including topology-aware learning, physics-constrained validation, multimodal reasoning, and automated model verification. By situating these developments within the broader context of power system modeling and digital twins, the review outlines potential pathways toward robust and scalable deployment.
Figure 2.
Pipeline framework and organization of this review.
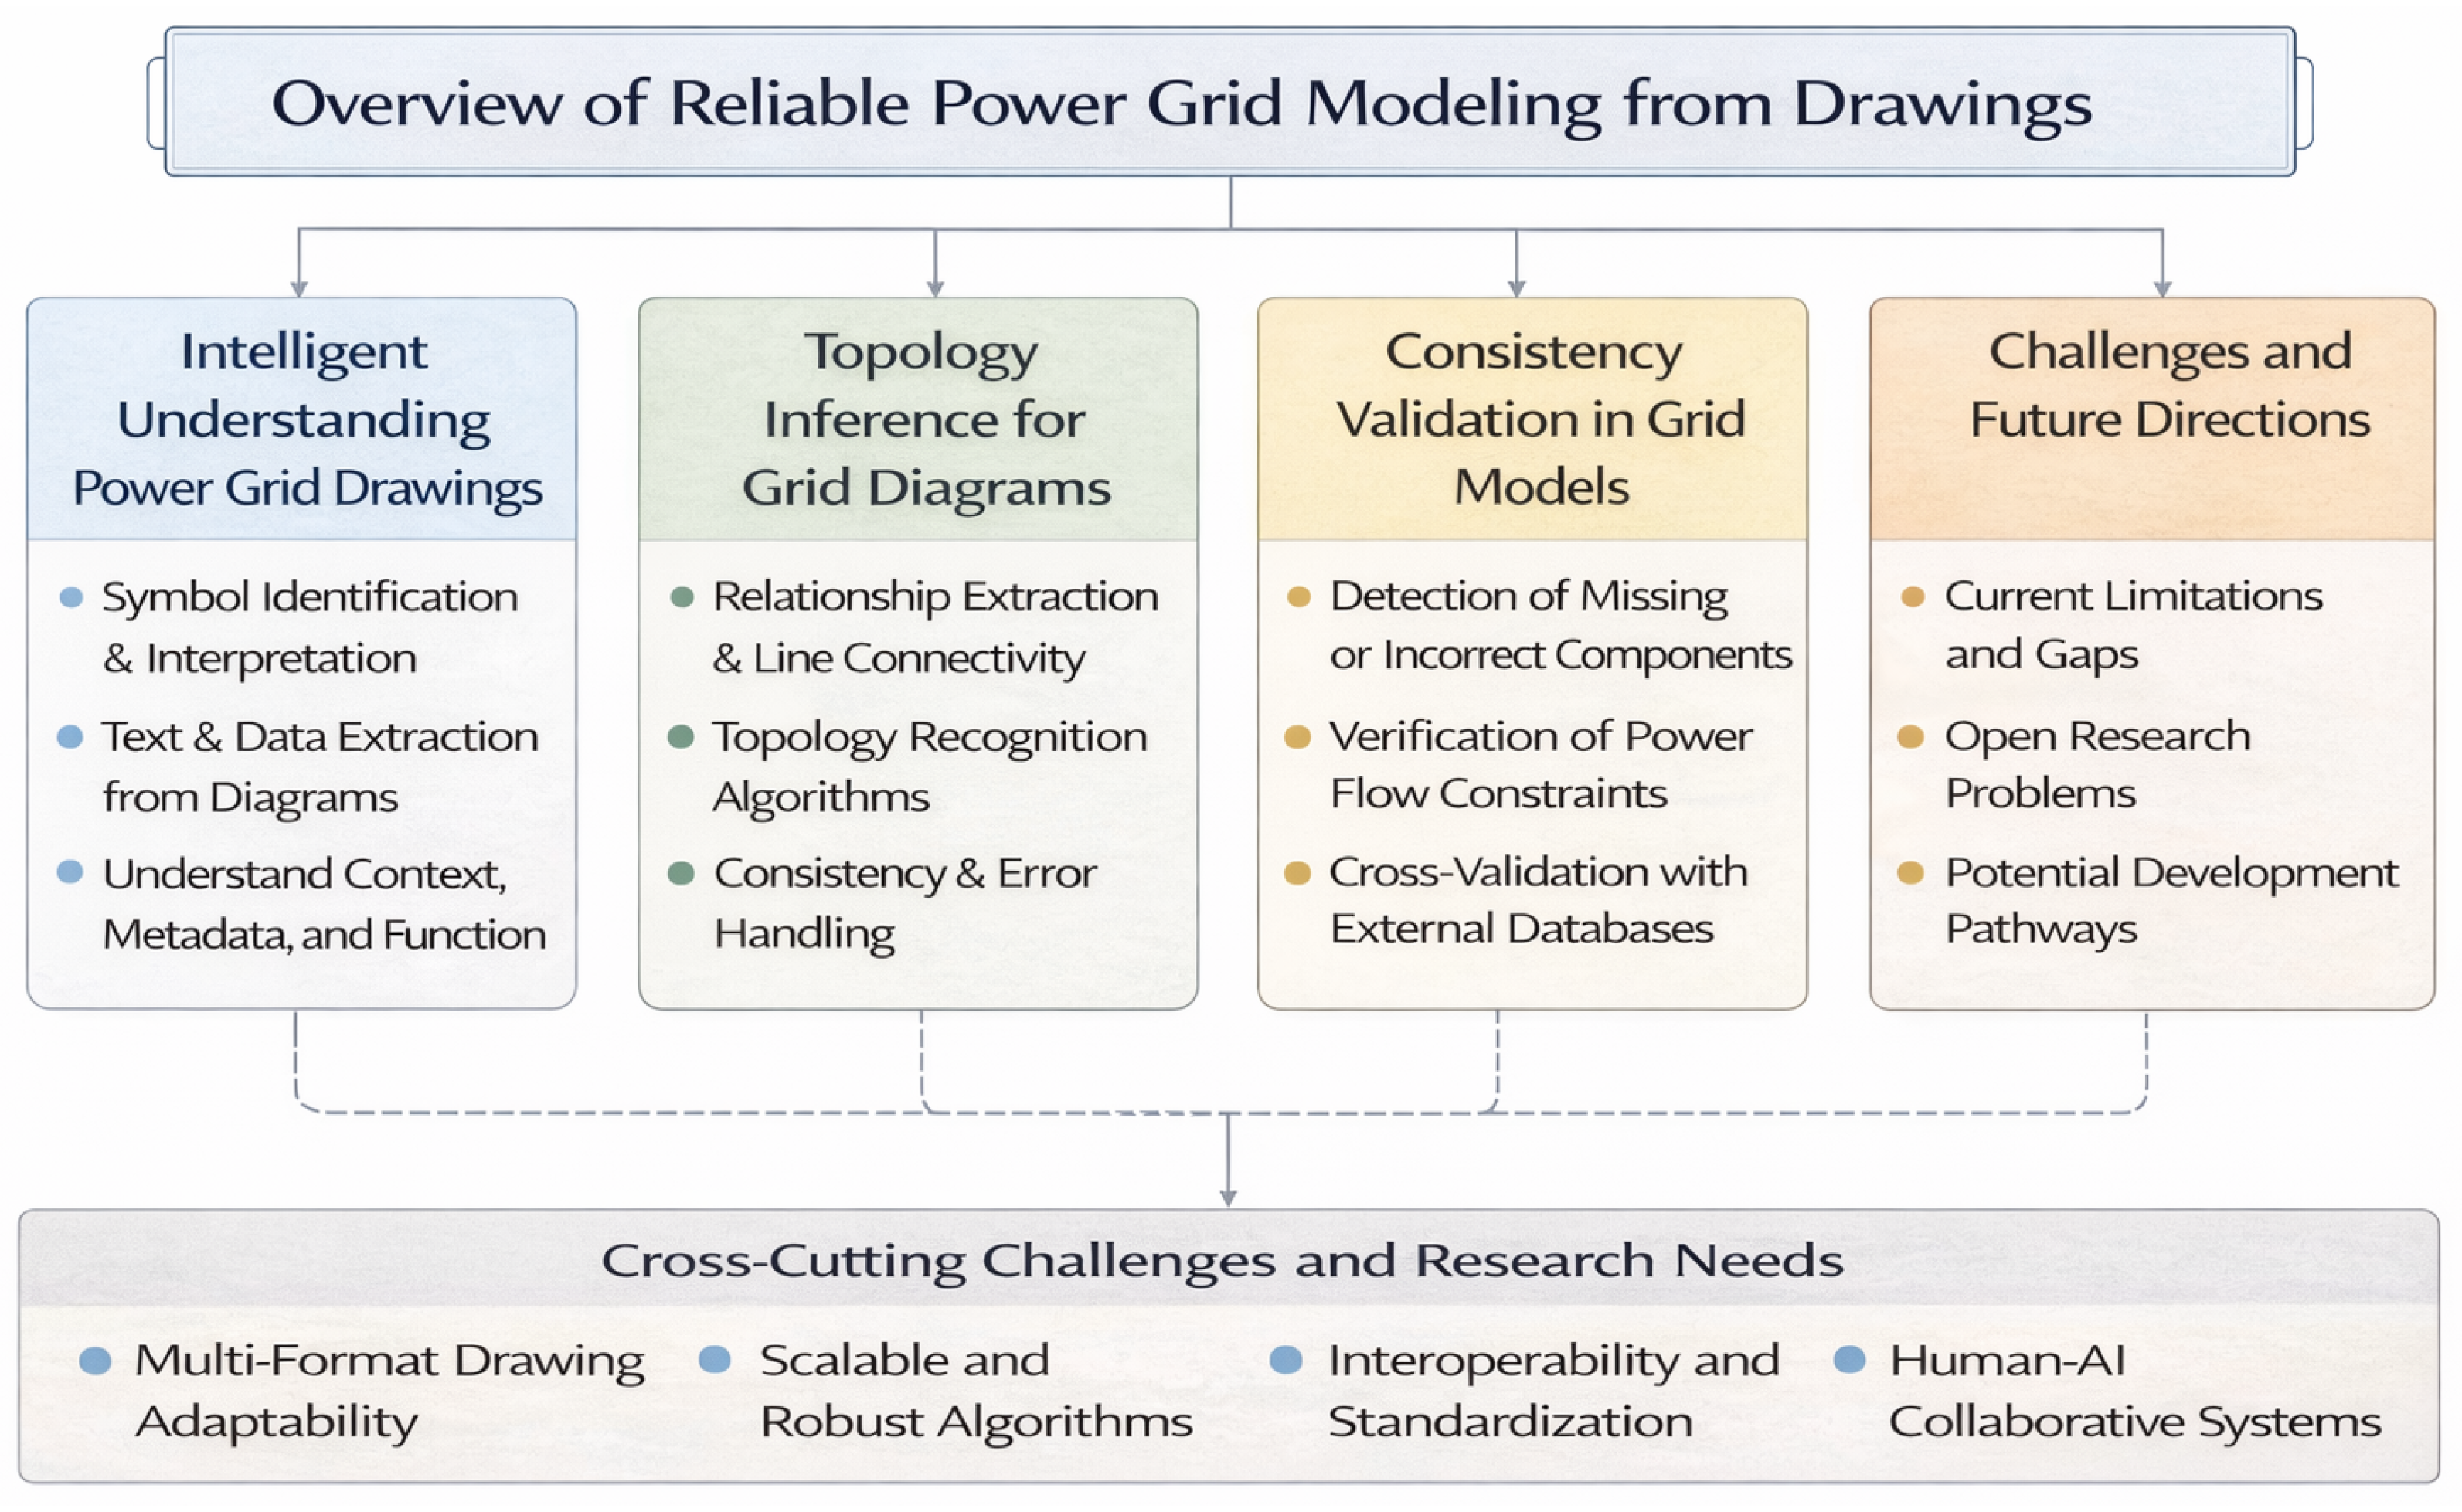
Table 1.
Comparison of representative studies related to diagram understanding and power grid modeling.
The rest of the paper is arranged as follows. Section 2 presents the problem formulation and the unified pipeline framework for power grid drawing analysis, emphasizing the transformation from visual representations to structured grid models and highlighting the key challenges associated with this process. Section 3 focuses on visual understanding of power grid drawings, including component detection, symbol recognition, and text extraction, which serve as the foundation for subsequent structural analysis. Section 4 addresses connectivity analysis and topology inference, covering line extraction, connection reconstruction, and graph-based modeling methods for representing electrical networks. Section 5 discusses model generation from inferred topology, including the construction of executable grid models and their applications in power system analysis and digitalization. Section 6 discusses open challenges and future research directions. Section 7 concludes the paper.
2. Problem Formulation and Pipeline Framework
This part establishes a unified formulation for power grid drawing understanding and introduces a pipeline framework that explicitly incorporates topology inference and consistency validation. This perspective provides a conceptual foundation for the subsequent analysis and emphasizes that reliability is the key requirement for transforming drawings into practical power system models.
2.1. Problem Formulation of Drawing-to-Model Transformation
Power grid drawing understanding can be fundamentally formulated as a structured transformation problem, in which unstructured visual representations are converted into reliable and executable power system models [17]. Let a drawing be denoted as D, which typically consists of graphical elements and textual annotations, and let the target grid model be represented as M. The objective is to establish a mapping M = F(D), where F is a multi-stage transformation process that integrates perception, structural inference, and validation. To provide a formal representation, a power grid drawing can be decomposed into multiple semantic layers:
where E represents electrical components, L denotes geometric line structures, G corresponds to the implicit topology, and S contains semantic attributes such as labels, voltage levels, and equipment parameters. Among these elements, topology G is not explicitly encoded in the drawing and must be inferred from the combination of components and geometric connections, while semantic information provides important contextual constraints for interpreting the structure.
Based on this representation, topology inference can be interpreted as a graph construction problem. Let G = (V, E) denote the electrical network, where nodes V correspond to components and edges represent electrical connections. The reconstruction of connectivity φ can be expressed as:
where Ecomp denotes the detected components and Lgeom represents geometric line information. This mapping is inherently ambiguous due to visual complexity, such as overlapping lines, missing junctions, and drawing inconsistencies. As a result, topology inference becomes a critical step that determines whether visual elements can be transformed into meaningful system structures.
Once the topology is obtained, the next step is to generate an executable grid model. This stage bridges the gap between visual understanding and power system applications, enabling tasks such as power flow analysis, fault diagnosis, and digital twin construction. However, errors in topology or parameter assignment may lead to invalid or unreliable models, highlighting the importance of subsequent validation [18].
2.2. Unified Pipeline and Reliability-Oriented Framework
To systematically organize the transformation process, a power grid drawing can be described using a unified pipeline [19]:
Drawing → Components → Connections → Topology → Grid Model.
This pipeline describes the information flow from raw visual input to structured grid representation. In this process, visual understanding extracts components and textual information, connectivity analysis identifies geometric relationships among elements, topology inference reconstructs the electrical network, and model generation produces executable representations [20]. Unlike conventional diagram analysis, this pipeline emphasizes not only information extraction but also structural correctness and system usability.
A key extension of this framework is the incorporation of consistency validation, which ensures that the reconstructed model satisfies electrical and structural constraints. Topology validation checks connectivity completeness and the absence of contradictory links, while physical validation ensures compliance with electrical principles such as Kirchhoff’s laws and voltage level consistency. Structural validation further examines whether the network conforms to expected configurations, such as radial or meshed structures. This validation stage is essential because visually correct interpretations do not necessarily guarantee physically valid models [21].
Compared with general engineering diagrams, power grid drawings exhibit several domain-specific characteristics that make the problem more challenging [22,23]. First, strong topology constraints require that connectivity must be physically meaningful and consistent with electrical laws. Second, components are often densely distributed and vary significantly in scale, making detection and association difficult. Third, symbol representations are not fully standardized across different drawing conventions, introducing variability in visual appearance. Finally, there is a strong coupling between structure and semantics, where textual annotations play a crucial role in interpreting connectivity and system functionality.
The pipeline formulation also reveals several fundamental challenges [24]. Errors introduced in early stages, such as detection or line extraction, may propagate and amplify through subsequent stages, significantly affecting topology and model accuracy. Connectivity inference is inherently uncertain due to visual ambiguity, particularly in complex layouts with overlapping structures. In addition, the lack of systematic validation mechanisms in existing approaches limits their reliability in practical applications [25]. These challenges indicate that power grid drawing understanding should be treated as a reliability-oriented system problem integrating visual, structural, and physical reasoning.
2.3. Methodological Framework and Design Rationale
The review framework adopted in this paper is organized around a structured transformation pipeline that reflects the practical workflow of converting power grid drawings into executable system models. The design of this framework is motivated by the observation that most engineering diagram interpretation tasks involve several sequential stages, including visual element extraction, connectivity reconstruction, and system-level model generation.
Specifically, the framework consists of four main stages: (1) visual understanding, which extracts observable elements such as components, symbols, and textual annotations from the drawing; (2) connectivity analysis and topology inference, which reconstruct electrical relationships among detected components; (3) model generation, which transforms the inferred topology into executable grid models with associated parameters; (4) consistency validation, which verifies whether the generated models satisfy structural and physical constraints. This staged formulation is adopted for two main reasons. First, it reflects the typical engineering workflow in which graphical documentation is gradually translated into structured system representations. Second, it enables systematic analysis of error propagation across different stages, thereby highlighting the importance of reliability and validation when transforming visual information into operational power system models.
It should be noted that the proposed pipeline is intended as a conceptual framework for organizing existing research rather than a specific implementation algorithm. Alternative approaches, such as end-to-end learning frameworks, may integrate several stages into a single model. However, the staged representation adopted in this review allows clearer identification of methodological assumptions and limitations across different research directions.
3. Visual Understanding of Power Grid Drawings
Visual understanding constitutes the first stage of the power grid drawing analysis pipeline and serves as the foundation for subsequent connectivity analysis and topology reconstruction. Its primary role is to transform raw visual inputs into structured representations that describe the basic elements present in the drawing [26]. Unlike downstream stages that focus on structural inference and system modeling, visual understanding is concerned with identifying and localizing observable entities from the input image, thereby providing essential information for higher-level reasoning.
Starting from raw drawings, which are often represented as scanned images, PDF files or rasterized CAD files, visual understanding aims to extract meaningful visual elements through a series of processing steps [27]. These drawings typically contain a mixture of graphical symbols, line structures, and textual annotations, often under conditions of noise, distortion, or varying resolution. Therefore, the task involves not only detecting visual patterns but also organizing them into interpretable units that can be further processed. The output of this stage can be viewed as an intermediate representation that captures “what is present” in the drawing, without yet specifying how these elements are connected. The extracted information can be broadly categorized into three types [28,29,30]. First, components refer to the physical elements in the power system, such as transformers, circuit breakers, disconnectors, and busbars, which form the basic building blocks of the network. Second, symbols represent graphical encodings of these components, often following specific drawing standards but exhibiting variations across different domains and design conventions. Accurate recognition of symbols is essential for determining component types and functionalities. Third, textual information, including equipment labels, voltage levels, and identifiers, provides critical semantic context that complements visual elements and supports subsequent interpretation and modeling. By extracting components, symbols, and text from raw drawings, visual understanding establishes the necessary input for connectivity analysis and topology inference. However, it should be noted that this stage focuses on element-level recognition and does not explicitly capture relationships among elements, which motivates the need for further structural analysis in the subsequent stages.
3.1. Preprocessing and Image Enhancement
Preprocessing and image enhancement play a critical role in stabilizing the performance of visual understanding tasks, particularly when dealing with power grid drawings that are often affected by noise, low resolution, and scanning artifacts [31]. Unlike natural images, engineering drawings typically exhibit high-contrast structures, sparse textures, and strong geometric regularities. However, variations in acquisition conditions, document quality, and formatting introduce distortions that can significantly degrade the performance of downstream detection and recognition methods. Therefore, preprocessing aims to improve the visual quality and structural clarity of input drawings, enabling more reliable extraction of components, symbols, and textual information [32].
Binarization is one of the most fundamental preprocessing operations, aiming to separate foreground elements from the background, as shown in Table 2 [33]. By converting grayscale or color images into binary representations, binarization enhances the visibility of line structures and symbols while suppressing background noise [34]. Global thresholding methods are effective under uniform illumination conditions, whereas adaptive thresholding techniques are more suitable for handling uneven lighting and local variations commonly found in scanned documents [35]. Proper binarization is essential for preserving fine structural details, particularly thin lines and small components that are critical for connectivity analysis.
Table 2.
Preprocessing and image enhancement techniques for power grid drawings.
Noise removal is applied to eliminate spurious artifacts that may interfere with subsequent processing [36]. Common noise sources include scanning distortions, compression artifacts, and background clutter. Filtering techniques, such as median filtering and morphological operations, are widely used to remove isolated pixels and small irregularities while preserving structural integrity [37]. In addition, morphological closing and opening operations can help repair broken line segments and smooth irregular contours. Effective noise suppression improves the robustness of both detection and line extraction, especially in low-quality drawings [38]. Text–graphics separation is another important step, as textual annotations and graphical elements require different processing strategies. In power grid drawings, text often overlaps with or is located near graphical components, making it necessary to distinguish between these two types of information [39]. Separation methods typically rely on differences in shape, size, and structural patterns, as well as learning-based approaches that classify regions into text or graphics. Accurate separation facilitates more effective optical character recognition (OCR) processing and prevents interference between text recognition and component detection [40]. Resolution enhancement further improves the quality of input images, particularly when dealing with low-resolution or degraded scans. Super-resolution techniques, including interpolation-based methods and deep learning-based models, can enhance fine details and improve the visibility of small objects [41,42]. This is especially important for detecting small components and thin line structures, which are easily lost in low-resolution images. Image normalization techniques may also be applied to standardize contrast and intensity distributions, improving consistency across different inputs.
Overall, preprocessing and image enhancement serve as a crucial foundation for visual understanding by improving input quality and reducing variability. By enhancing structural clarity and suppressing noise, these operations enable more accurate detection, classification, and recognition of visual elements. However, it should be noted that preprocessing does not introduce new structural information; rather, it facilitates the extraction of existing visual cues, which must be further interpreted in subsequent stages of the pipeline.
3.2. Electrical Component Detection
Electrical component detection aims to localize and identify key physical elements in power grid drawings, such as transformers, circuit breakers, disconnectors, and busbars, as shown in Figure 3. As a fundamental task in visual understanding, it provides the spatial and semantic basis for subsequent symbol classification, connectivity analysis, and topology reconstruction [43]. Compared with general object detection in natural images, component detection in engineering drawings exhibits unique challenges, including limited texture information, strong geometric regularity, and high density of small-scale objects [44].
Figure 3.
Electrical component detection methods for power grid.
With the rapid development of deep learning, convolutional neural network (CNN)-based object detection frameworks have become the dominant approach for component detection [45]. Among them, the YOLO (you only look once) family of detectors has been widely adopted due to its high efficiency and real-time performance [46]. YOLO-based methods perform detection in a single forward pass, making them suitable for large-scale or real-time applications involving power grid drawings. These models demonstrate strong capability in detecting components with varying scales and orientations, particularly when trained with sufficient annotated data. However, their performance may degrade when dealing with extremely small objects or highly cluttered layouts [47,48]. The development of learning-based approaches for power grid drawing understanding strongly depends on the availability of annotated datasets. However, compared with natural image analysis, publicly available datasets specifically designed for power grid diagrams or engineering drawings remain limited. In many studies, datasets are constructed from proprietary engineering documents, scanned drawings, or CAD files collected from utilities and design institutes. These datasets often differ significantly in drawing conventions, resolution, and annotation styles, which makes cross-study comparison difficult. Several datasets related to engineering diagram understanding have been reported in the literature, including datasets for symbol detection, component recognition, and diagram parsing. Representative examples include the SESYD dataset for engineering symbol recognition [49], the PubLayNet dataset for document layout analysis [50], and the DeepFigures dataset for figure extraction in scientific documents [51]. In addition, some studies construct custom single-line diagram (SLD) datasets derived from power grid drawings to support component detection and topology inference tasks [52,53]. However, most existing datasets focus primarily on perception-level tasks, such as symbol classification or text recognition, while relatively few datasets provide detailed annotations for connectivity relationships or electrical topology. As a result, the development of topology inference and model generation methods remains constrained by the lack of suitable benchmark datasets. Another major challenge lies in the complex annotation of power grid drawings. Unlike object detection in natural images, labeling power grid diagrams requires not only identifying components but also annotating electrical connections and system structure. This process typically requires domain expertise in power system engineering, making dataset construction time-consuming and expensive. Furthermore, the diversity of drawing standards and symbol conventions across different organizations further complicates annotation consistency and dataset standardization. Table 3 summarizes representative datasets used in engineering drawing analysis and related diagram understanding studies. The table highlights their main characteristics, including data sources, annotation types, and typical application tasks. The limited size and diversity of existing datasets indicate that dataset construction and standardization remain important challenges for future research.
Table 3.
Representative datasets used in engineering drawing analysis and related diagram understanding studies.
Two-stage detectors, such as Faster R-CNN, provide an alternative approach by first generating region proposals and then performing classification and refinement [54]. This architecture generally achieves higher detection accuracy, especially for small and complex objects, due to its more precise localization capability. In the context of power grid drawings, Faster R-CNN has been shown to be effective in detecting fine-grained components and handling overlapping structures [55]. Nevertheless, its computational cost is higher than that of one-stage detectors, which may limit its applicability in time-sensitive scenarios. More recently, transformer-based detection frameworks have been introduced to address the limitations of convolution-based models. By leveraging global attention mechanisms, these models can capture long-range dependencies and contextual relationships across the entire drawing. This is particularly beneficial in engineering diagrams, where spatial context plays an important role in distinguishing components. Transformer-based detectors also provide a more unified architecture without the need for hand-crafted anchor design. However, they typically require large-scale training data and substantial computational resources, which may constrain their practical deployment [56].
Despite the progress achieved by these detection frameworks, small-object detection remains one of the most critical challenges in power grid drawing analysis [57]. Many electrical components occupy only a small number of pixels, especially in high-resolution drawings with dense layouts. As a result, these components are easily overlooked or incorrectly detected due to insufficient feature representation. Techniques such as multi-scale feature fusion, feature pyramid networks, and resolution enhancement have been explored to mitigate this issue, but robust detection of small components remains an open problem [58]. In addition, the dense layout of power grid drawings introduces significant complexity for detection models. Components are often closely packed and connected by intricate line structures, leading to frequent occlusions and ambiguous boundaries. This increases the difficulty of distinguishing individual objects and may result in overlapping detections or misclassification. Furthermore, the lack of clear separation between components and connecting lines complicates the learning process, as models must differentiate between structural elements and functional devices [59].
Overall, electrical component detection has benefited greatly from advances in deep learning-based object detection frameworks. However, challenges related to small-object recognition and dense layout complexity continue to limit detection accuracy and robustness. These limitations highlight that, although component detection provides essential visual elements, it does not resolve structural ambiguity, thereby necessitating further analysis in connectivity inference and topology reconstruction.
3.3. Symbol Classification
Symbol classification aims to assign semantic labels to detected regions by identifying the specific type of electrical component represented by each graphical symbol. While component detection provides the spatial location of candidate regions, classification determines their functional roles within the power system, such as transformers, circuit breakers, and disconnectors [60]. This task is essential for bridging visual perception and semantic understanding, as accurate symbol recognition affects parameter association and subsequent topology interpretation, as shown in Table 4.
Table 4.
Symbol classification methods in engineering drawings for power grid drawings.
Early studies on symbol classification primarily relied on handcrafted features combined with traditional machine learning models [61]. For instance, Elyan et al. developed a symbol classification framework for engineering drawings using a combination of supervised learning algorithms, including support vector machines (SVMs) and random forests (RFs), demonstrating that classical models can achieve competitive performance under controlled conditions [62]. These methods typically depend on geometric and contour-based descriptors and are effective when symbol patterns are relatively consistent. However, their performance is highly sensitive to feature design and tends to degrade in the presence of complex layouts and symbol variations. With the advancement of deep learning, convolutional neural networks (CNNs) have become the dominant approach for symbol classification. Elyan et al. further extended their work by incorporating deep learning models for symbol detection and classification, showing that CNN-based methods can significantly improve recognition accuracy by learning hierarchical feature representations directly from data. CNNs are particularly effective in capturing subtle visual differences between similar symbols and handling variability in scale and orientation [63]. However, their performance may be limited in scenarios with insufficient training data or severe class imbalance.
To improve robustness, hybrid approaches that combine learning-based models with domain knowledge have been explored [64]. These methods typically integrate rule-based constraints, such as spatial relationships and structural consistency, with data-driven classification. For example, combining classification outputs with contextual information, such as alignment with busbars or proximity to specific components, can help resolve ambiguities in visually similar symbols [65]. Such hybrid strategies are especially valuable in engineering drawings, where strong structural regularities can be leveraged to refine classification results.
Despite these advances, symbol classification in power grid drawings remains challenging due to variability across standards and drawing conventions [66]. The same component may be represented by different graphical symbols depending on regional standards or design practices, while visually similar symbols may correspond to different functional roles. As highlighted classification models trained on one dataset often struggle to generalize across different drawing standards, indicating a fundamental limitation in current approaches [67]. This lack of standardization significantly increases the difficulty of learning consistent feature representations.
Generalization is therefore a critical issue. Models trained on specific datasets frequently exhibit performance degradation when applied to drawings from different sources, resolutions, or annotation styles. Variations in line thickness, symbol scaling, and drawing quality further exacerbate this problem. Although techniques such as data augmentation and synthetic data generation have been introduced to improve robustness, achieving reliable cross-domain generalization remains an open challenge [68].
In summary, symbol classification plays a crucial role in assigning semantic meaning to detected components and enabling subsequent interpretation of power grid drawings. While CNN-based and hybrid methods have significantly improved classification performance, challenges related to symbol variability and generalization continue to limit their applicability in diverse real-world scenarios. These limitations further highlight the necessity of integrating semantic recognition with structural reasoning in later stages of the analysis pipeline.
3.4. Text Detection and Recognition
Text detection and recognition constitute a critical component of visual understanding, as textual annotations in power grid drawings provide essential semantic information that complements graphical elements, as shown in Figure 4. Unlike natural images, text in engineering drawings often appears in structured forms, such as equipment identifiers, voltage levels, and connection labels, and is closely coupled with nearby components [69]. Therefore, the objective of this stage is not only to accurately recognize textual content but also to correctly localize and associate it with corresponding graphical elements.
Figure 4.
Text detection and recognition framework for power grid.
A typical OCR pipeline for engineering drawings consists of two main stages: text detection and text recognition [70,71]. In the detection stage, candidate text regions are identified using either rule-based segmentation or learning-based methods. Techniques such as connected component analysis, region proposal networks, and more recently deep learning-based detectors are widely used to localize text areas [72]. In the recognition stage, the detected text regions are processed to extract character sequences, often under challenging conditions such as low resolution, irregular layouts, and overlapping with graphical elements. This two-stage pipeline provides flexibility in handling complex document structures, but its performance is highly dependent on the accuracy of both detection and recognition stages.
Among recognition methods, convolutional recurrent neural networks (CRNNs) have become a standard approach due to their ability to model sequential information in text images [73]. CRNN-based models combine convolutional layers for feature extraction with recurrent layers for sequence modeling, enabling end-to-end recognition without explicit character segmentation. For example, Tsai et al. developed a text code recognition and positioning system for engineering drawings by integrating CNN-based feature extraction with CRNN-based sequence modeling, achieving high recognition accuracy in practical applications [74]. Such methods are particularly effective in handling structured text patterns and moderate variations in font and scale.
More recently, transformer-based OCR methods have been introduced to further improve recognition performance, especially in complex and low-quality drawings [75]. By leveraging self-attention mechanisms, transformer models can capture long-range dependencies within text sequences and better handle irregular layouts. For instance, the authors of [76] incorporate transformer-based architectures, such as Swin Transformer and enhanced text super-resolution networks, into a single-line diagram recognition framework, significantly improving text recognition performance in low-resolution conditions. These approaches demonstrate strong robustness to noise and distortions, although they typically require larger datasets and higher computational resources.
Beyond detection and recognition, label-component association is a crucial yet often overlooked step in text understanding [77,78,79]. In power grid drawings, textual annotations must be correctly linked to their corresponding components to enable semantic interpretation and parameter assignment. This association is challenging due to spatial ambiguity, especially in dense layouts where multiple components and labels are closely packed [80]. Common strategies include proximity-based matching, geometric alignment rules, and learning-based association models that consider both spatial and contextual information [81]. However, errors in association may lead to incorrect parameter assignment, which can propagate to topology reconstruction and model generation.
Despite the progress achieved in OCR techniques, several challenges remain [82,83]. Text in engineering drawings may be degraded, partially occluded, or embedded within complex graphical structures, making detection and recognition difficult. Variations in font style, size, and orientation further complicate the problem [84]. In addition, the strong coupling between text and graphical elements introduces additional ambiguity that cannot be resolved by OCR alone [85]. These limitations indicate that text recognition must be integrated with structural and contextual reasoning to achieve reliable interpretation.
In summary, text detection and recognition provide critical semantic information that complements visual elements in power grid drawings. While CRNN-based and transformer-based methods have significantly improved OCR performance, challenges related to low-quality inputs and label-component association continue to limit their effectiveness. These issues further emphasize that semantic understanding must be combined with structural inference in subsequent stages of the analysis pipeline.
3.5. Limitations of Understanding
Despite the significant progress achieved in preprocessing, component detection, symbol classification, and text recognition, visual understanding remains fundamentally limited in its ability to support reliable power grid modeling, as shown in Table 5. A key issue is that detection and recognition results do not directly provide system-level understanding [86]. In particular, identifying components and extracting textual information only answer the question of “what is present” in the drawing, but do not reveal “how elements are connected” or how the system operates as a whole [87]. As a result, visual understanding alone is insufficient for constructing meaningful representations of electrical networks.
Table 5.
Limitations of visual understanding in power grid drawing analysis.
A more critical limitation lies in the absence of explicit structural relationships among extracted elements. Power systems are defined by connectivity and topology, where system behavior depends on how components are interconnected [88]. However, outputs from visual understanding tasks, such as bounding boxes, class labels, and recognized text, are typically independent and lack relational information [89]. This disconnect prevents direct mapping from perception results to graph-based representations, making it necessary to introduce additional stages for connectivity analysis and topology reconstruction.
Furthermore, visual understanding methods are highly sensitive to variations in drawing conditions [90]. Layout complexity poses a major challenge, as power grid drawings often contain densely distributed components, overlapping line structures, and irregular arrangements [91]. Such complexity increases the likelihood of missed detections, incorrect classifications, and ambiguous interpretations. In addition, drawing quality significantly affects performance. Low-resolution images, noise, distortions, and variations in line thickness or symbol appearance can degrade feature extraction and reduce the robustness of learning-based models [92]. These factors limit the generalization capability of visual understanding approaches across different datasets and real-world scenarios.
Another important issue is error propagation across the processing pipeline [93]. Imperfections in early-stage tasks, such as missed component detection or incorrect text recognition, can propagate to subsequent stages and lead to compounded errors. For example, a misclassified component or an incorrectly recognized label may result in erroneous connectivity inference or incorrect parameter assignment in later stages [94]. Since visual understanding provides the foundational inputs for the entire pipeline, its errors can significantly affect the correctness and reliability of the final grid model.
Finally, Most existing approaches for interpreting power grid drawings rely on several implicit assumptions. First, it is generally assumed that the input diagrams follow standard engineering conventions, such as consistent symbol definitions and structured graphical layouts. Second, many visual recognition methods assume that graphical elements remain visually distinguishable despite potential noise or distortions introduced during scanning or document conversion. Third, topology inference methods often assume that geometric connections in diagrams correspond directly to electrical connectivity in the actual system. In practice, however, ambiguities may arise due to overlapping lines, dense layouts, or incomplete graphical representations. These assumptions simplify the interpretation process but may limit the robustness of automated methods when dealing with heterogeneous drawing standards.
4. Connectivity Analysis and Topology Reconstruction
Connectivity analysis and topology reconstruction constitute the central stage in power grid drawing understanding, bridging the gap between visual perception and system-level modeling. While preceding steps extract components, symbols, and textual information, they do not establish the relationships among these elements that define the actual power network [95]. Connectivity analysis focuses on identifying geometric and spatial relationships, such as lines, junctions, and busbars, to determine how components are physically linked in the drawing. Building upon this, topology reconstruction abstracts these connections into a graph representation, where nodes correspond to components and edges represent electrical connections [96]. This process transforms fragmented visual outputs into a structured network model that reflects the functional organization of the system. However, due to challenges such as ambiguous line intersections, missing connections, and layout complexity, accurately inferring topology remains a non-trivial task. As a result, connectivity analysis and topology reconstruction play a decisive role in determining whether visual understanding results can be successfully translated into reliable power system models.
4.1. Role of Connectivity and Topology in Grid Modeling
Following visual understanding, which extracts components, symbols, and textual information from power grid drawings, the next critical step is to establish the relationships among these elements [97]. While visual understanding provides a set of isolated entities, it does not capture how these entities are interconnected within the system. In power grid applications, however, system functionality is fundamentally defined by connectivity rather than individual components [98]. Therefore, transitioning from visual perception to topology representation is essential for enabling meaningful interpretation and subsequent modeling.
Topology defines the structural organization of power systems [99]. It determines how electrical components are organized and interconnected, directly reflecting the configuration of the network. Without accurate topology, even perfectly detected components and correctly recognized labels cannot form a valid system representation [100]. In this sense, topology not only defines the structure of the network but also determines whether the extracted information can be transformed into a computational model. The ability to construct a correct topology is therefore a prerequisite for enabling downstream tasks such as power flow analysis, fault diagnosis, and system optimization.
From a modeling perspective, topology is the key factor that determines model validity and usability [101]. Power system models, such as graph-based representations or CIM-based structures, rely on explicit connectivity information to describe electrical relationships [102]. Incorrect or incomplete topology leads to invalid models that cannot support reliable analysis. Thus, topology reconstruction is not merely an intermediate processing step but a decisive stage that governs the transition from visual data to executable system models.
4.2. Connectivity Analysis of Power Grid Drawings
As shown in Figure 5, connectivity analysis in power grid drawings can be systematically decomposed into three closely related subproblems: line and structure extraction, junction and intersection analysis, and the associated challenges arising from visual ambiguity and data quality [103,104,105,106]. First, line and structure extraction aims to identify fundamental geometric elements, such as wires and busbars, which form the basis of potential connections. Building upon these extracted structures, junction and intersection analysis further determines how different line segments interact, enabling the inference of candidate connectivity relationships. However, due to factors such as broken lines, overlapping structures, and drawing noise, this process is inherently uncertain and error-prone. Therefore, a comprehensive understanding of connectivity analysis requires not only examining these individual steps but also addressing the challenges that affect their reliability.
Figure 5.
Typical challenges in connectivity analysis of power grid drawings.
4.2.1. Line and Structure Extraction
Connectivity analysis begins with the extraction of line structures that represent electrical connections in power grid drawings. These structures include wires, feeders, and busbars, which form the geometric basis for inferring connectivity among components [107]. Classical line detection methods, such as the Hough transform, have been widely used to identify straight-line segments by transforming image space into parameter space, enabling robust detection of dominant linear structures even in the presence of noise [108]. However, Hough-based methods are generally more effective for long and continuous lines and may struggle with fragmented or irregular segments commonly found in engineering drawings [109]. To address these limitations, line segment detection (LSD) methods have been introduced to detect shorter and more localized line segments with higher precision [110]. LSD operates directly in the image domain and is capable of capturing fine-grained structures, making it suitable for detecting thin wires and complex connection patterns. Compared with global methods, LSD provides better adaptability to local variations, although it may generate redundant or fragmented segments that require further processing.
In addition to general line extraction, busbar detection represents a domain-specific task unique to power grid drawings [111]. Busbars typically serve as central connection nodes linking multiple components and are often represented as thick horizontal or vertical lines [112]. Accurate identification of busbars is crucial for establishing high-level connectivity, as they define major aggregation points in the network [113]. Specialized detection strategies, including thickness-based filtering and structural pattern recognition, are often employed to distinguish busbars from ordinary line segments.
Following line detection, line structure modeling is required to organize extracted segments into meaningful connection patterns [114]. This involves merging collinear segments, refining endpoints, and establishing continuity across fragmented lines. Such processing is essential for constructing coherent geometric representations that can support subsequent junction analysis and connectivity inference.
4.2.2. Junction and Intersection Analysis
After extracting line structures, the next step is to analyze junctions and intersections to determine how different line segments are connected [115]. Junction detection aims to identify points where multiple lines meet, branch, or terminate, which directly indicates potential electrical connections. Accurate detection of these junctions is critical, as they define the nodes of connectivity in the drawing.
Different types of intersections must be distinguished to correctly interpret connectivity [116,117,118]. For example, T-type connections represent branching structures where one line connects to another, while cross-type intersections may either indicate true electrical connections or merely visual crossings without connectivity [119]. Distinguishing between these cases is non-trivial and often requires additional contextual or geometric reasoning. A further complexity arises from the distinction between implicit and explicit connections. Explicit connections are clearly indicated by graphical elements such as junction dots or connection markers, whereas implicit connections rely on conventions, such as line alignment or proximity, without explicit visual indicators [120]. In many practical drawings, implicit connections are common, requiring inference based on geometric consistency and domain knowledge [121]. This significantly increases the difficulty of connectivity analysis, as the absence of explicit cues introduces ambiguity in interpretation.
4.2.3. Challenges in Connectivity Analysis
Despite the structured nature of power grid drawings, connectivity analysis remains a challenging problem due to various sources of uncertainty [122]. One major issue is the presence of broken or incomplete lines, which may result from scanning artifacts, image degradation, or drawing imperfections. Such discontinuities can lead to missing connections if not properly handled [123]. Another challenge arises from overlapping or crossing lines. In dense layouts, multiple lines may intersect or overlap visually, making it difficult to determine whether a true electrical connection exists [124]. Without reliable disambiguation mechanisms, these cases may lead to incorrect connectivity inference, either by falsely introducing connections or by missing valid ones.
In addition, drawing noise and distortions further complicate connectivity analysis. Variations in line thickness, irregular edges, and background artifacts can affect the accuracy of line detection and junction identification [125,126]. These factors not only degrade the quality of extracted geometric structures but also increase the likelihood of ambiguity in subsequent processing stages.
Overall, connectivity analysis transforms low-level geometric features into candidate connection relationships, providing the foundation for topology reconstruction. However, due to the inherent ambiguity and sensitivity to drawing conditions, it introduces significant uncertainty that must be carefully addressed in the subsequent topology inference stage.
4.3. Graph Representation of Power Grid Topology
To enable systematic analysis and model generation, the inferred connectivity from drawings is abstracted into a graph representation of the power grid [127]. Specifically, the electrical network can be modeled as a graph. This abstraction provides a unified and structured way to describe the topology of the system, transforming geometric and visual information into a form suitable for computation and analysis [128]. In this representation, each node encapsulates a physical component identified during the visual understanding stage, such as transformers, circuit breakers, disconnectors, and busbars. Nodes may also include associated semantic information, such as component type, identifier, and operational parameters [129]. Edges, on the other hand, represent the electrical relationships inferred from connectivity analysis, indicating how components are linked within the network [130]. Unlike simple geometric connections, these edges must reflect true electrical connectivity, requiring careful interpretation of line structures and junction relationships.
Beyond basic connectivity, additional attributes are incorporated into the graph to capture richer system information [131]. Nodes and edges can be annotated with properties such as component type, voltage level, and operational status, while edges may include directionality to represent power flow or switching conditions [132]. These attributes are essential for ensuring that the graph representation is not only structurally correct but also semantically meaningful and compatible with power system analysis tasks. Compared with general graph representations in computer vision, power grid topology exhibits strong domain-specific constraints [133]. For example, electrical networks must satisfy connectivity completeness, hierarchical organization (e.g., bus-branch structures), and consistency of voltage levels across connected components [134]. These constraints impose additional requirements on graph construction, distinguishing it from generic diagram parsing problems and emphasizing the need for domain-aware modeling.
Another important consideration is the transition from geometry to graph abstraction [135]. While connectivity analysis operates in the spatial domain, graph representation abstracts away geometric details and retains only essential structural relationships. This transformation reduces redundancy and enables the application of graph-based algorithms for simulation, optimization, and validation [136]. However, it also introduces potential information loss, particularly when geometric cues are ambiguous or incomplete, which may affect the accuracy of the resulting topology.
4.4. Topology Inference Methods
Topology inference aims to construct a valid and complete graph representation of the power grid from extracted components and connectivity cues. Given the inherent ambiguity in line structures and junction interpretations, this process requires not only geometric reasoning but also domain knowledge and, increasingly, data-driven learning [137]. Existing approaches can be broadly categorized into rule-based methods, learning-based methods, and hybrid approaches, each with distinct advantages and limitations, as shown in Table 6.
Table 6.
Topology inference methods for power grid drawings.
4.4.1. Rule-Based Methods
Rule-based methods represent the earliest and most intuitive approach to topology inference in power grid drawings. These methods determine connectivity relationships using predefined geometric rules and engineering heuristics derived from CAD conventions and drawing standards. From a methodological perspective, rule-based topology inference typically follows a sequential procedure consisting of three main steps: graphical element extraction, geometric relationship analysis, and rule-based connectivity validation. First, line segments, symbols, and connection points are extracted from the drawing using image processing or vector parsing techniques. Second, geometric relationships between these elements are analyzed. Common criteria include spatial alignment, endpoint proximity, intersection detection, and line continuity [138]. For example, collinearity and endpoint alignment are frequently used to determine whether two line segments belong to the same electrical connection, while intersection patterns are analyzed to distinguish valid junctions from visual crossings [139]. To improve robustness, geometric heuristics are introduced through parameterized constraints. These constraints often include distance thresholds, angular tolerances, and line continuity requirements, which help determine whether two graphical elements should be connected [140]. The selection of these parameters is typically guided by drawing resolution, symbol size, and standard engineering conventions. For instance, distance thresholds are often defined relative to the average line width or symbol dimensions in the drawing, ensuring that the rules remain consistent across diagrams with different scales.
Rule-based methods also incorporate domain-specific structural rules to enforce engineering consistency. For example, busbars often serve as central connection structures, and predefined connection patterns can be used to identify valid busbar-centered topologies [141]. Due to their explicit formulation, rule-based methods offer high interpretability and allow engineers to directly inspect and modify inference logic. However, these methods rely on several assumptions. They generally assume that drawings follow standardized graphical conventions, that line segments are visually distinguishable, and that geometric connections correspond directly to electrical connectivity. When these assumptions are violated, such as in drawings with broken lines, overlapping elements, or inconsistent symbol representations, rule-based methods may fail to produce reliable topology inference results [142].
In terms of validation, rule-based inference is typically evaluated by comparing reconstructed connectivity graphs with manually annotated ground truth models. Metrics such as connectivity accuracy, graph completeness, and node-edge consistency are commonly used to assess the correctness of inferred topologies [143]. Despite their interpretability, rule-based methods suffer from limited generalization capability. Their performance strongly depends on the completeness of predefined rules, and extending rule sets to accommodate diverse drawing styles often increases system complexity and reduces scalability.
4.4.2. Learning-Based Methods
To address the limited adaptability of rule-based approaches, learning-based methods have been introduced to infer topology from data-driven models [144]. These methods employ machine learning techniques to automatically capture complex spatial and contextual patterns that are difficult to encode through explicit rules.
From a methodological standpoint, learning-based topology inference generally involves three stages: feature representation, connectivity prediction, and graph construction. In the first stage, visual features describing graphical elements and their spatial relationships are extracted using deep neural networks. Convolutional neural networks (CNNs), for example, can learn hierarchical features from annotated diagram data, enabling the model to capture geometric patterns, contextual cues, and symbol relationships [145]. In the second stage, the model predicts potential connectivity relationships between graphical elements. More advanced approaches use graph neural networks (GNNs) to directly operate on graph structures [146]. In these models, detected components are represented as nodes, while candidate connections are represented as edges with associated features. Through message passing and feature aggregation, GNNs allow information to propagate across the graph, enabling the model to infer connectivity based on both local geometry and global structural context [147]. Compared with rule-based methods, learning-based approaches exhibit stronger adaptability to complex layouts and diverse drawing styles [148]. When trained on sufficiently large and representative datasets, these models can generalize across variations in scale, layout, and graphical representation [149].
However, learning-based approaches introduce their own methodological assumptions and limitations. First, they assume the availability of sufficiently large, annotated datasets containing accurate topology labels. In practice, labeling electrical connectivity in engineering diagrams is labor-intensive and requires domain expertise. Second, model performance is sensitive to training data quality and distribution. If the training dataset does not adequately represent real-world drawing variations, the resulting models may fail to generalize effectively [150].
In terms of validation, learning-based methods are typically evaluated using both perception-level and topology-level metrics. Detection accuracy, precision, recall, and F1-score are used to assess visual recognition performance, while graph similarity metrics and connectivity accuracy are used to evaluate topology reconstruction quality. Despite their flexibility, learning-based methods often lack interpretability, which makes it difficult to trace inference errors or enforce strict engineering constraints.
4.4.3. Hybrid Approaches
Hybrid approaches attempt to combine the interpretability of rule-based methods with the adaptability of learning-based techniques, aiming to achieve both robustness and practical applicability [151,152,153,154,155]. In these frameworks, rule-based components provide structural constraints and domain knowledge, while machine learning models handle ambiguity and complex visual patterns.
Methodologically, hybrid systems typically adopt a multi-stage architecture. First, learning-based models are used to detect graphical elements and generate candidate connectivity relationships. These candidate connections are then refined using rule-based reasoning modules that enforce domain-specific constraints, such as connectivity completeness, hierarchical structure consistency, and voltage-level compatibility [156]. Another strategy involves embedding domain knowledge directly into learning frameworks. For instance, structural priors or constraint-aware loss functions can be incorporated during neural network training, enabling models to learn from data while respecting fundamental engineering properties [157]. Additionally, rule-based preprocessing can be used to reduce the search space for learning models, improving both computational efficiency and inference stability [158]. Hybrid methods benefit from a balanced trade-off between interpretability and adaptability. The rule-based components provide transparent decision logic and enforce engineering constraints, while learning-based modules allow the system to handle complex and irregular drawing patterns [159]. This combination makes hybrid approaches particularly suitable for real-world scenarios where diagrams exhibit both structured regularity and unpredictable variations.
In terms of validation, hybrid systems are usually evaluated using multi-level verification strategies. Connectivity reconstruction results are compared with ground truth network models, while additional rule-based consistency checks are used to verify that inferred topologies satisfy engineering constraints. These validation mechanisms improve the reliability of topology inference and reduce the risk of generating structurally invalid models.
In practice, hybrid approaches are widely regarded as the most feasible solution for engineering deployment. By integrating explicit domain knowledge with data-driven learning mechanisms, they provide a flexible yet reliable framework for power grid topology reconstruction. As a result, hybrid methods represent a promising direction for advancing scalable and trustworthy power grid modeling from engineering drawings [160].
5. Model Generation and System Integration
Model generation and system integration represent the final stage in the pipeline of power grid drawing understanding, where inferred topology is transformed into executable and application-ready representations [161]. While topology reconstruction provides a graph-based description of system structure, it does not yet constitute a usable power system model. This stage focuses on converting the abstract topology into standardized formats by incorporating component attributes, electrical parameters, and operational constraints [162]. In addition, system integration ensures that the generated models can be seamlessly connected with downstream platforms, including power system simulators, geographic information system (GIS) databases, and digital twin environments [163]. This process not only enables practical applications such as power flow analysis and system monitoring but also serves as a critical validation step, where inconsistencies in topology or parameter assignment can be identified and corrected [164]. Therefore, model generation and system integration play a decisive role in determining whether the extracted information can be effectively utilized in real-world power system operations.
5.1. From Topology to Executable Grid Models
Following topology reconstruction, the obtained graph representation provides a structural description of the power grid but does not yet constitute a model that can be directly used for analysis or simulation [165]. To enable practical applications, the topology must be transformed into an executable grid model that integrates both structural information and electrical attributes. At the core of this process is the mapping from graph elements to domain-specific model entities. Validation of automated drawing interpretation methods typically involves multiple levels of evaluation. At the perception level, detection and recognition algorithms are commonly evaluated using metrics such as precision, recall, and F1-score on annotated datasets. At the topology level, the correctness of reconstructed connectivity can be assessed by comparing inferred graphs with manually annotated ground-truth network structures. At the system level, validation may involve verifying whether the generated grid models produce consistent results in power system simulations, such as power flow analysis or contingency studies. These multi-level validation procedures highlight that reliability cannot be assessed solely at the perception stage but must also consider structural and system-level correctness.
Nodes in the graph are converted into device objects, such as transformers, circuit breakers, generators, and loads, each with well-defined attributes including ratings, voltage levels, and operational states [166]. Edges, which represent electrical connections in the topology, are translated into network branches or connectivity relationships, such as transmission lines or switchable links [167,168]. This conversion requires not only structural consistency but also semantic completeness, as each element must be properly parameterized to reflect its physical behavior in the system. Beyond structural mapping, parameter integration is essential for constructing executable models [169]. Parameters may be obtained from textual annotations extracted via OCR, standardized component libraries, or engineering assumptions when explicit data is unavailable. These parameters include electrical quantities such as resistance, reactance, and voltage levels, as well as operational constraints such as switching states and protection settings [170]. The accuracy and completeness of parameter assignment directly influence the fidelity of the resulting model and its suitability for simulation and analysis.
Another critical aspect is the adoption of standardized modeling frameworks, such as the CIM, which provides a unified schema for representing power system components and their relationships [171]. By mapping graph-based representations into standardized formats, the generated models can be seamlessly integrated with existing power system tools, including simulation platforms, energy management systems, and digital twin environments. This standardization is essential for ensuring interoperability and scalability in real-world applications. Importantly, this stage represents a fundamental shift from structural interpretation to computational usability [172]. While topology reconstruction focuses on identifying how components are connected, model generation emphasizes how the system behaves under operational conditions. In this sense, the transformation bridges the gap between visual understanding and engineering analysis, enabling tasks such as power flow calculation, fault analysis, and system optimization.
In summary, the mapping from topology to executable grid models is a critical step that converts structural information into a form suitable for computation. It establishes the link between extracted graphical information and practical power system applications, ensuring that the inferred topology can be effectively utilized in analysis, simulation, and decision-making processes, as shown in Figure 6.
Figure 6.
Transformation from topology to executable model.
5.2. Parameter Association and Semantic Integration
While topology reconstruction defines the structural framework of the power grid, it remains insufficient for executable modeling without the integration of semantic and physical parameters. As shown in Table 7, parameter association and semantic integration aim to enrich the topology with quantitative and descriptive information extracted primarily from textual annotations, enabling the transition from a purely structural graph to a fully functional system model, and the commonly used methods include conventional recurrent neural network (CRNN) and transformer OCR, etc. [173,174]. In this process, OCR outputs are mapped to corresponding components and connections. A central task in this stage is the extraction and assignment of device attributes [175]. Textual annotations in power grid drawings often contain critical parameters such as voltage levels, impedance values, power ratings, and equipment identifiers. These parameters must be accurately interpreted and associated with the correct components identified in the topology. For example, a voltage label (e.g., “110 kV”) must be linked to the corresponding bus or transmission line, while equipment ratings and impedance values must be assigned to specific devices such as transformers or loads. This process requires not only accurate text recognition but also correct semantic interpretation of the extracted information.
Table 7.
Summary of parameter association and semantic integration.
Label-component matching plays a pivotal role in enabling this mapping [176]. Given that textual annotations are often spatially separated from their associated components, the system must infer the correct correspondence based on spatial proximity, geometric alignment, and contextual cues. In simple layouts, proximity-based matching may suffice [177]. However, in dense or complex drawings, multiple candidate components may exist near a given label, introducing ambiguity. More advanced approaches incorporate structural context, such as connectivity relationships or alignment with busbars, to improve matching accuracy. Despite these efforts, label-component association remains a challenging problem, particularly in the presence of overlapping elements or inconsistent annotation styles.
A key issue in this stage is the strong coupling between semantics and structure [178]. Unlike general document analysis tasks, where text and graphics can often be treated independently, power grid drawings require joint reasoning over both domains. The meaning of a parameter is inherently tied to the structural position of its associated component within the network. For instance, the significance of a voltage level depends on the connectivity of the node it is assigned to, and incorrect association can lead to physically inconsistent models [179]. This interdependence implies that errors in either topology reconstruction or text recognition can propagate and amplify during semantic integration. Moreover, incomplete or missing annotations further complicate parameter association. In practical scenarios, not all required parameters are explicitly provided in the drawing, necessitating the use of default values, inference rules, or external databases [159,180]. This introduces additional uncertainty into the modeling process and highlights the need for robust integration strategies that can handle partial information.
In summary, parameter association and semantic integration transform topology into a semantically enriched and physically meaningful model. By linking OCR-derived information with graph structures, this stage enables the construction of executable grid models. However, due to the tight coupling between semantics and structure, achieving reliable integration remains a challenging task that requires coordinated reasoning across multiple modalities.
5.3. Standardized Model Construction
To ensure that the generated grid models are usable in practical power system applications, the inferred topology and associated parameters must be transformed into standardized representations [181]. This process is not merely a format conversion but a critical step that determines whether the reconstructed model can be integrated into existing engineering workflows [182]. Without standardization, models derived from drawings remain isolated artifacts, lacking compatibility with simulation tools, databases, and operational platforms.
A key challenge in this stage lies in the semantic alignment between extracted information and standardized data schemas. While the graph-based model captures structural and parametric information, standardized frameworks impose strict requirements on how this information is organized and interpreted [183]. For example, in the CIM, components must be mapped into predefined classes such as equipment, terminals, and connectivity nodes, with explicit relationships governing their interactions, as shown in Table 8. This requires not only structural correctness but also semantic consistency, as improper mapping may lead to invalid or non-compliant models.
Table 8.
Comparison of standardized grid model representations.
CIM has become the de facto standard for representing power system data due to its comprehensive and extensible object-oriented structure. It enables the integration of network topology, equipment attributes, and operational states within a unified framework, supporting applications in energy management systems (EMSs), state estimation, and digital twins [184]. However, mapping reconstructed topology into CIM is non-trivial, as it involves resolving ambiguities in component roles, defining connectivity nodes, and ensuring consistency across voltage levels and network hierarchies. In parallel, GIS databases provide a complementary representation by incorporating spatial information into grid models. While topology focuses on electrical connectivity, GIS emphasizes geographical positioning and spatial relationships [185]. Integrating reconstructed models into GIS requires the alignment of topological structures with coordinate systems, which introduces additional challenges when spatial information is incomplete or inconsistent in the original drawings [186]. Nevertheless, GIS-based representations are essential for applications such as asset management, infrastructure planning, and visualization.
For circuit-oriented analysis, netlist representations offer a compact and computation-friendly format, where components and their interconnections are described in a structured textual form [187]. Compared with CIM and GIS, netlists provide a simplified abstraction that is well-suited for simulation tasks. However, this simplification may omit higher-level semantic information, making it less suitable for large-scale system integration. In practical power system environments, the grid models generated must be compatible with existing operational platforms, such as supervisory control and data acquisition (SCADA) systems and energy management systems (EMSs). These platforms typically rely on standardized data models, particularly the common information model (CIM), to represent network topology and equipment attributes [188,189]. Therefore, automated drawing interpretation systems must map reconstructed topology and component parameters into CIM-compliant structures, including equipment objects, terminals, and connectivity nodes. Once integrated into CIM-based databases, the generated models can be used to support operational applications such as state estimation, contingency analysis, and system monitoring. However, achieving seamless integration remains challenging due to differences in data formats, incomplete parameter information, and inconsistencies between engineering drawings and operational databases.
A central issue across all these representations is interoperability. Standardized models enable seamless data exchange between heterogeneous systems, allowing simulation tools, databases, and control platforms to operate on a shared representation of the grid [188]. This is particularly important in modern power systems, where digitalization requires tight coupling between planning, operation, and monitoring systems. Without interoperability, inconsistencies between models can lead to errors in analysis and decision-making. Importantly, standardized model construction also acts as an implicit validation layer [189]. The constraints imposed by standards, such as connectivity consistency, component compatibility, and voltage coherence, can expose errors introduced in earlier stages, including topology reconstruction and parameter association [190]. In this sense, standardization is not only a means of integration but also a mechanism for improving model reliability.
In summary, standardized model construction represents a critical transition from reconstructed topology to application-ready system models. By enforcing structured representations and enabling interoperability, it ensures that the extracted information can be effectively integrated into real-world power system environments. At the same time, it highlights the importance of semantic consistency and constraint satisfaction, which are essential for achieving reliable and scalable grid modeling from drawings.
5.4. Application Scenarios of Generated Models
The generation of executable and standardized grid models enables a wide range of applications across power system analysis, operation, and digitalization, as shown in Figure 7. By transforming drawings into structured and semantically enriched models, the proposed pipeline supports not only offline analysis but also integration with real-world engineering systems [191,192]. The value of model generation is ultimately reflected in its applicability, which spans simulation, infrastructure management, and emerging digital twin paradigms.
Figure 7.
Typical application scenarios enabled by automatically generated grid models.
5.4.1. Power System Simulation
One of the most direct applications of generated grid models is in power system simulation. Once the topology and associated parameters are correctly established, the model can be used to perform power flow analysis, which evaluates voltage profiles, power distribution, and system loading under steady-state conditions [193]. Accurate power flow computation relies on both correct connectivity and reliable parameter assignment, highlighting the importance of upstream stages in the pipeline.
In addition to steady-state analysis, generated models can support fault analysis, where system behavior under abnormal conditions, such as short circuits or equipment failures, is evaluated [194]. Fault analysis requires detailed modeling of network topology and device characteristics, including protection settings and impedance parameters [195]. Errors in topology or parameter association may lead to incorrect fault current estimation or misidentification of critical system components, underscoring the need for reliable model generation.
5.4.2. Grid Digitalization and GISs
Beyond simulation, generated models play a crucial role in grid digitalization and infrastructure management [196]. By converting power grid drawings into structured databases, utilities can build comprehensive digital representations of their networks. These databases serve as the foundation for asset management systems, enabling the tracking, maintenance, and lifecycle analysis of equipment such as transformers, lines, and switchgear.
Integration with GIS platforms further enhances the value of these models by incorporating spatial information [197]. This allows operators to visualize network configurations, analyze geographic dependencies, and support planning and maintenance decisions. For example, GIS-based models enable efficient identification of affected areas during outages and facilitate optimized routing for maintenance operations. The combination of topology, parameters, and spatial data forms a comprehensive digital infrastructure for modern power systems.
5.4.3. Digital Twin of Power Systems
An emerging and highly promising application is the development of digital twins of power systems. A digital twin is a real-time, dynamic representation of a physical system, continuously updated with operational data [198]. Generated grid models provide the structural and parametric foundation required to initialize and maintain such digital twins. In this context, real-time modeling becomes essential, as the system model must reflect current operating conditions, including switching states, load variations, and network reconfigurations [199,200]. By integrating sensor data and operational measurements, the digital twin can support advanced functionalities such as system monitoring, anomaly detection, and predictive maintenance. This enables a shift from reactive to proactive system management.
Moreover, the accuracy and consistency of the underlying model directly determine the effectiveness of digital twin applications. Any errors in topology or parameter assignment can propagate into monitoring and decision-making processes, potentially leading to incorrect assessments. Therefore, reliable model generation from drawings is a critical prerequisite for realizing robust and trustworthy digital twin systems.
5.5. Limitations of Current Model Generation Methods
Despite the progress in transforming reconstructed topology into executable grid models, current model generation methods still face several fundamental limitations that affect their reliability and practical deployment [201,202,203,204,205]. These limitations mainly arise from the strong dependency on upstream perception stages, the propagation of errors across the interpretation pipeline, and the incomplete or inconsistent information contained in engineering drawings. As a result, even when topology reconstruction appears structurally reasonable, the generated models may still contain inaccuracies or missing information that limit their usability in real-world power system applications.
- ➢
- First, model generation strongly depends on the correctness of the inferred topology. Most approaches assume that connectivity relationships obtained from earlier stages accurately represent the actual electrical structure. However, errors in connectivity detection or topology reconstruction cannot easily be corrected during model generation. Missing junctions, incorrect connections, or misidentified components may directly lead to inconsistent or invalid system models. Since topology forms the structural foundation of power system modeling, even small errors can significantly affect downstream analyses such as power flow computation or fault simulation.
- ➢
- Second, error propagation across the pipeline remains a major challenge. Model generation integrates outputs from several upstream tasks, including component detection, optical character recognition (OCR), and topology inference. Errors introduced at any stage may propagate and accumulate in subsequent steps. For instance, incorrect text recognition may lead to erroneous parameter assignment, while detection errors may produce missing nodes or incorrect connectivity. These compounded inaccuracies can reduce the reliability of the generated model and make it difficult to trace the source of modeling errors.
- ➢
- Third, missing or inconsistent parameter information frequently occurs in practical drawings. Power grid diagrams often contain incomplete annotations, ambiguous labels, or parameters that are only partially specified. Important electrical attributes, such as impedance values, voltage levels, and equipment ratings, may therefore be missing or incorrectly associated with components during interpretation. These issues reduce the fidelity of the resulting grid model and may require additional assumptions or external data sources to complete the parameterization.
- ➢
- Fourth, lack of unified standardization and interoperability further complicates model generation. Although standards such as the Common Information Model (CIM) provide a unified framework for representing power system components and relationships, differences in implementation and data formats across platforms limit interoperability. As a result, models generated from drawings may require additional transformation and validation before they can be integrated into simulation platforms, geographic information systems (GISs), or digital twin environments.
- ➢
- In addition to these technical limitations, practical deployment of automated drawing interpretation systems requires mechanisms for informing users and proposing corrective actions when validation or completeness analysis identifies missing or inaccurate information. During the validation stage, the system may detect issues such as incomplete parameter definitions, ambiguous connectivity relationships, or inconsistencies between structural and semantic information. Instead of only reporting these problems as errors, the system should provide interpretable feedback to the user, clearly indicating the location and nature of the detected issue and its potential impact on model reliability.
- ➢
- Furthermore, automated systems can assist users by proposing possible solutions or refinement strategies. For example, missing parameters may be estimated using standard equipment libraries or inferred from contextual information within the drawing. Ambiguous connections may be resolved through rule-based reasoning, probabilistic inference, or by presenting alternative candidate topologies ranked according to confidence levels. In situations where automated inference remains uncertain, interactive mechanisms can allow domain experts to confirm or modify inferred results. Such human-in-the-loop processes enable iterative refinement of the generated model and help ensure that the final system representation remains consistent with engineering knowledge and operational requirements.
- ➢
- Finally, in addition to algorithmic limitations, practical deployment of drawing interpretation systems also faces several industrial challenges. Power utilities often maintain large collections of legacy engineering documents with heterogeneous drawing standards and inconsistent annotation conventions. Converting these documents into structured digital models requires not only accurate visual recognition but also robust mechanisms for handling incomplete or ambiguous information. Furthermore, integration with existing enterprise systems, such as SCADA platforms, asset management databases, and digital twin environments, requires strict compliance with standardized data formats and operational constraints. These factors highlight that successful deployment depends not only on algorithmic performance but also on system interoperability and engineering workflow integration.
Overall, these limitations indicate that reliable model generation from power grid drawings requires not only accurate perception and topology reconstruction, but also robust validation, user feedback, and correction mechanisms. Future research should therefore focus on developing integrated frameworks that combine automated inference with expert interaction and domain knowledge, enabling more reliable and scalable deployment of drawing-to-model transformation systems.
6. Discussion About Challenges, and Future Directions
The transformation from power grid drawings to executable models is inherently a multi-stage process that spans visual perception, structural inference, and system-level modeling. While significant progress has been achieved in individual tasks such as component detection, OCR, and topology reconstruction, the overall capability of existing approaches remains constrained by their fragmented design. Most methods optimize isolated modules without explicitly considering how errors propagate across stages or how system-level requirements should guide intermediate representations. As a result, the reliability and practical usability of generated grid models remain limited.
From a system perspective, the core difficulty of power grid drawing understanding lies not in any single task, but in the cross-level coupling between perception, topology, and semantics. Visual elements must be correctly interpreted, structurally organized, and semantically grounded under physical constraints. This multi-level dependency implies that errors are not only accumulated but also transformed across stages, making them increasingly difficult to detect and correct at later steps. Therefore, future research should move beyond stage-wise optimization toward integrated and reliability-oriented frameworks that explicitly account for structural and physical consistency throughout the pipeline.
6.1. Key Challenges
Despite advances in visual understanding and topology inference, several fundamental challenges remain that limit the robustness and scalability of current approaches.
- ➢
- Power grid drawings often contain a large number of small-scale components densely distributed within limited space. These components are easily missed or incorrectly detected due to insufficient feature representation and overlapping structures. Detection errors at this stage directly affect all downstream processes, especially topology reconstruction.
- ➢
- In practical scenarios, drawings are frequently degraded by noise, low resolution, distortions, and inconsistent formatting. Variations in symbol style, line thickness, and annotation conventions further increase the difficulty of both detection and recognition tasks. These factors significantly reduce the robustness and cross-domain applicability of existing models.
- ➢
- Inferring electrical connectivity from geometric structures remains the most challenging problem. Ambiguities arise from broken lines, overlapping or crossing structures, and implicit connections without explicit markers. These issues make it difficult to determine whether visual intersections correspond to actual electrical links. Errors in topology cannot be easily corrected in later stages and directly lead to invalid system models.
- ➢
- Power grid drawings are created under diverse standards and conventions, leading to inconsistencies in symbols, layouts, and annotation styles. At the modeling stage, differences in data formats and incomplete adoption of standards such as CIM further hinder interoperability. This fragmentation limits large-scale deployment and model reuse.
- ➢
- Most existing methods are trained and evaluated on specific datasets with limited variability. When applied to drawings from different sources, their performance often degrades significantly. This lack of generalization restricts practical applicability in real-world power systems.
6.2. Future Directions
To address the above challenges and improve reliability, several promising research directions can be identified.
- ➢
- Future approaches should explicitly incorporate topological constraints into the learning process. Instead of treating detection, classification, and connectivity inference as independent tasks, models should jointly reason over components and their relationships. Graph-based learning frameworks and structure-aware loss functions provide a potential pathway for integrating topology into perception.
- ➢
- Integrating physical laws and engineering constraints into model construction and validation is essential for improving reliability. Constraints such as voltage consistency, connectivity completeness, and feasible operating ranges can be used not only for post hoc validation but also as supervisory signals during model learning. This enables the generation of models that are both structurally correct and physically meaningful.
- ➢
- Power grid drawings inherently combine graphical elements and textual annotations. Future methods should adopt multimodal frameworks that jointly process visual, textual, and structural information. By leveraging cross-modal interactions, such approaches can improve both parameter association and topology inference, especially in complex and ambiguous scenarios.
- ➢
- Developing end-to-end systems that directly generate executable grid models from drawings is a key step toward practical deployment. Such systems should integrate perception, topology inference, parameter association, and validation within a unified framework, with built-in mechanisms for error correction and consistency enforcement.
6.3. Discussion
A key insight emerging from this review is that the difficulty of understanding power grid drawings arises from the progressive transformation across multiple representation levels. The process involves sequential transformations from visual signals to geometric structures, electrical topology, and executable grid models. Each stage performs a form of abstraction, translating information from one representation domain into another. While such abstraction is necessary to convert graphical documentation into structured models, it also introduces uncertainty and increases sensitivity to errors. For example, errors in symbol detection or line extraction may lead to incorrect geometric structures, which can subsequently affect topology inference and ultimately produce invalid system models. This cascading effect highlights that drawing interpretation is not simply a perception problem but a multi-level reasoning process in which early-stage inaccuracies may propagate and accumulate. Therefore, achieving reliable model generation requires not only accurate visual recognition but also mechanisms capable of controlling error propagation across different stages of the transformation pipeline.
From the perspective of the objective of this review, which is to examine how power grid drawings can be reliably transformed into executable system models, the literature reveals an important structural limitation in current research. In real power systems, semantic information (such as equipment type and ratings), structural relationships (such as network connectivity), and physical constraints (such as electrical feasibility and operational rules) are strongly interdependent. However, most existing approaches treat these aspects separately. Computer vision studies typically focus on improving the detection and recognition of graphical elements, while power system modeling research often assumes that the underlying topology is already available. As a result, the intermediate step that connects perception outputs with physically valid system models remains insufficiently addressed. This fragmentation creates a gap between diagram interpretation and system-level correctness, meaning that high recognition accuracy does not necessarily guarantee reliable grid models. Consequently, the reliability of automated drawing interpretation systems cannot be ensured by perception improvements alone but requires deeper integration between visual analysis and power system modeling knowledge.
These findings suggest that future research should move beyond purely stage-wise pipelines and develop integrated reasoning frameworks capable of jointly considering perception, topology inference, and physical validation. Instead of treating each stage as an independent processing module, integrated approaches could incorporate domain knowledge and structural constraints throughout the interpretation process. For instance, electrical connectivity rules and network constraints could be used to guide topology reconstruction and detect inconsistencies in inferred connections. Similarly, feedback mechanisms could allow errors identified at later stages, such as topology validation or simulation checks, to trigger corrections in earlier perception stages. Such iterative refinement strategies transform the pipeline into a closed-loop reasoning system with both forward and backward information flow. This type of integration would significantly improve the robustness of drawing-to-model transformation processes, particularly when dealing with complex diagrams, ambiguous connections, or incomplete graphical information.
From a practical perspective, the insights obtained from this review have important implications for modern power system digitalization. In many power utilities and engineering organizations, a large number of legacy documents—including single-line diagrams, substation schematics, and wiring drawings—are still stored in non-machine-readable formats. Converting these drawings into structured and executable system models remains a time-consuming manual task that requires significant engineering expertise. Automated drawing interpretation technologies have the potential to substantially reduce this effort by enabling rapid conversion of graphical documentation into computational models. Such capabilities are particularly relevant for emerging applications such as digital twin systems, automated grid documentation, infrastructure asset management, and intelligent power system planning. However, practical deployment of these technologies requires a high level of reliability and robustness, since errors in reconstructed topology or system parameters could directly affect operational decisions and simulation results. Therefore, the transition from loosely connected processing pipelines to closed-loop, constraint-aware modeling systems will be essential for enabling scalable and trustworthy deployment of automated grid modeling technologies in real-world power system environments.
Ultimately, the analysis presented in this review indicates that reliable power grid modeling from drawings cannot rely solely on advances in visual recognition algorithms. Instead, it requires a holistic integration of perception, structural reasoning, and physical validation mechanisms across multiple representation levels. Future research should therefore focus on developing frameworks that combine computer vision techniques with domain-specific knowledge of power systems, enabling automated interpretation systems that are both intelligent and physically consistent. Such developments will play a crucial role in bridging the gap between traditional engineering documentation and modern data-driven power system management platforms.
7. Conclusions
This paper provides a comprehensive review of the intelligent understanding of power grid drawings from a pipeline-oriented perspective, with particular attention paid to reliability considerations. Motivated by the increasing demand for automated grid modeling and the digitalization of power systems, the review examines drawing interpretation not only as a set of visual recognition tasks, but also as a structured transformation process from unstructured visual representations to machine-readable grid models. By organizing existing studies along a unified pipeline consisting of visual understanding, topology inference, and model generation, the review offers a structured synthesis of current research efforts in this area.
The analysis of the literature highlights several observations. First, visual understanding techniques provide essential information about graphical elements such as symbols, lines, and textual annotations. However, these perception-level results alone are insufficient for reliable system modeling because they do not explicitly capture structural relationships between components. Second, topology inference plays a critical role in connecting visual outputs with system-level representations, since ambiguities in connectivity may significantly affect the correctness of reconstructed network models. Third, the reliability of drawing-to-model transformation is influenced by error propagation across stages and by the limited availability of systematic validation mechanisms that enforce structural and physical consistency. The review also suggests that power grid drawing understanding involves multiple interrelated aspects, including perception, structural reasoning, and domain semantics. Connectivity analysis and graph-based topology reconstruction serve as important intermediate steps linking visual interpretation with system-level modeling. Meanwhile, model generation and standardization facilitate the integration of reconstructed network models into practical applications such as simulation environments, geographic information systems (GISs), and digital twin platforms. In this context, validation mechanisms that incorporate structural rules and engineering constraints may play an important role in improving the reliability of automated modeling workflows.
Despite the progress summarized in this review, several important research gaps remain. First, connectivity ambiguity in power grid drawings remains a major challenge, as visually adjacent components do not always correspond to actual electrical connections, making reliable topology inference difficult. Second, errors introduced in early perception stages, such as component detection and text recognition, may propagate across subsequent stages of topology reconstruction and model generation, significantly affecting the correctness of the final grid model. Third, there is still a lack of standardized validation frameworks for verifying the structural and physical consistency of automatically generated grid models. Addressing these challenges will be essential for improving the reliability and practical applicability of drawing-based power grid modeling systems. Finally, although the importance of consistency validation for reliable grid model generation is discussed, this topic is not comprehensively reviewed in the present work, as the paper mainly focuses on intelligent understanding, topology inference, and model generation. Future studies should further investigate validation mechanisms such as graph consistency checking, electrical constraint verification, and simulation-based approaches (e.g., power flow analysis).
Author Contributions
C.W. and C.G.—Original draft; Y.L.—review & editing; H.Y.—supervision. All authors have read and agreed to the published version of the manuscript.
Funding
This research received no external funding.
Institutional Review Board Statement
Not applicable.
Informed Consent Statement
Not applicable.
Data Availability Statement
The original contributions presented in this study are included in the article. Further inquiries can be directed to the corresponding author.
Acknowledgments
The authors acknowledge the use of ChatGPT5.0 (OpenAI) solely for language polishing and figure improvements. AI was used only for language polishing and figure color adjustment, not for content generation. All ideas, methods, and conclusions were independently developed by the authors.
Conflicts of Interest
The authors declare that the research was conducted in the absence of any commercial or financial relationships that could be construed as a potential conflict of interest.
References
- Mahmood, M.; Chowdhury, P.; Yeassin, R.; Hasan, M.; Ahmad, T.; Chowdhury, N.-U.-R. Impacts of digitalization on smart grids, renewable energy, and demand response: An updated review of current applications. Energy Convers. Manag. X 2024, 24, 100790. [Google Scholar] [CrossRef] [Scilit]
- Vargas, G.A.D.; Mosquera, D.J.; Trujillo, E.R. Optimization of Topological Reconfiguration in Electric Power Systems Using Genetic Algorithm and Nonlinear Programming with Discontinuous Derivatives. Electronics 2024, 13, 616. [Google Scholar] [CrossRef] [Scilit]
- Zaboli, A.; Hong, J.; Ştefanov, A.; Liu, C.-C.; Hwang, C.-S. Large language models for power system security: A novel multi-modal approach for anomaly detection in energy management systems. IEEE Access 2025, 13, 203558–203585. [Google Scholar] [CrossRef] [Scilit]
- Heluany, J.B.; Gkioulos, V. A review on digital twins for power generation and distribution. Int. J. Inf. Secur. 2024, 23, 1171–1195. [Google Scholar] [CrossRef] [Scilit]
- Hussain, A.; Aslam, M.; Arif, S.M. A standards-based approach for auto-drawing single line diagram of multivendor smart distribution systems. Int. J. Electr. Power Energy Syst. 2018, 96, 357–367. [Google Scholar] [CrossRef] [Scilit]
- Solorio-García, M.Y.; Mata-López, W.A.; Álvarez-Flores, J.L.; Simón, J.; Castillo, V.H. Supporting Translation and Analysis of the Configuration of an Electrical Substation Automation System Based on the IEC 61850 2.0 Standard. Electricity 2026, 7, 15. [Google Scholar] [CrossRef] [Scilit]
- Siddique, A.H.; Hasan, M.; Islam, S.; Rashid, K. Prospective Smart Distribution Substation in Bangladesh: Modeling and Analysis. Sustainability 2021, 13, 10904. [Google Scholar] [CrossRef] [Scilit]
- Gómez-Luna, E.; Murillo-Becerra, M.; Garibello-Narváez, D.R.; Vasquez, J.C. Advancing Modern Power Grid Planning Through Digital Twins: Standards Analysis and Implementation. Energies 2026, 19, 556. [Google Scholar] [CrossRef] [Scilit]
- Das, O.; Zafar, M.H.; Sanfilippo, F.; Rudra, S.; Kolhe, M.L. Advancements in digital twin technology and machine learning for energy systems: A comprehensive review of applications in smart grids, renewable energy, and electric vehicle optimisation. Energy Convers. Manag. X 2024, 24, 100715. [Google Scholar] [CrossRef] [Scilit]
- Yin, M.; Duan, W.; Wu, Z.; Wang, M.; Tang, L.; Cheung, R.C.C.; Brilakis, I. Adaptive detection of equipment components in MEP construction drawings via graph-enhanced siamese vision. J. Build. Eng. 2025, 115, 114526. [Google Scholar] [CrossRef] [Scilit]
- Wang, A.; Wu, H.; Iwahori, Y. Advances in Computer Vision and Deep Learning and Its Applications. Electronics 2025, 14, 1551. [Google Scholar] [CrossRef] [Scilit]
- Singh, N.; Buyya, R.; Kim, H. Securing Cloud-Based Internet of Things: Challenges and Mitigations. Sensors 2025, 25, 79. [Google Scholar] [CrossRef] [Scilit]
- Zhu, Y.; Gao, T.; Fan, L.; Huang, S.; Edmonds, M.; Liu, H.; Gao, F.; Zhang, C.; Qi, S.; Wu, Y.N.; et al. Dark, beyond deep: A paradigm shift to cognitive AI with humanlike common sense. Engineering 2020, 6, 310–345. [Google Scholar] [CrossRef] [Scilit]
- Yazed, M.; Shaubari, E.; Yap, M. A Review of Neural Network Approach on Engineering Drawing Recognition and Future Directions. JOIV Int. J. Inform. Vis. 2023, 7, 2513–2522. [Google Scholar]
- Villena, J.; Wiberg, A.; Tarkian, M. Optical character recognition on engineering drawings to achieve automation in production quality control. Front. Manuf. Technol. 2023, 3, 1154132. [Google Scholar] [CrossRef] [Scilit]
- Sergey, A.; Uchida, S. Recognition of Engineering Drawing Entities: Review of Approaches. Int. J. Image Graph. 2017, 7, 709–733. [Google Scholar]
- Yu, Z.; Zhang, P.; Shi, J. Transformation of industrial robotics with natural language models: Recent progress and future prospects. Robot. Comput.-Integr. Manuf. 2026, 97, 103113. [Google Scholar] [CrossRef] [Scilit]
- Qin, B.; Pan, H.; Dai, Y.; Si, X.; Huang, X.; Yuen, C.; Zhang, Y. Machine and deep learning for digital twin networks: A survey. IEEE Internet Things J. 2024, 11, 34694–34716. [Google Scholar] [CrossRef] [Scilit]
- Doğan, Y. SOMTreeNet: A Hybrid Topological Neural Model Combining Self-Organizing Maps and BIRCH for Structured Learning. Mathematics 2025, 13, 2958. [Google Scholar] [CrossRef] [Scilit]
- Schirner, M.; Rothmeier, S.; Jirsa, V.K.; McIntosh, A.R.; Ritter, P. An automated pipeline for constructing personalized virtual brains from multimodal neuroimaging data. NeuroImage 2015, 117, 343–357. [Google Scholar] [CrossRef] [Scilit] [PubMed]
- Parvaz, R.; Niknam, T.; Nafar, M. Detection and identification of islanding microgrid in active distribution networks using active frequency distribution and optimal utilization. Results Eng. 2026, 29, 109050. [Google Scholar] [CrossRef] [Scilit]
- Powell, J.; McCafferty-Leroux, A.; Hilal, W.; Gadsden, S.A. Smart grids: A comprehensive survey of challenges, industry applications, and future trends. Energy Rep. 2024, 11, 5760–5785. [Google Scholar] [CrossRef] [Scilit]
- Ali, Z.M.; Ćalasan, M.; Jurado, F.; Abdel Aleem, S.H.E. Complexities of power quality and harmonic-induced overheating in modern power grids studies: Challenges and solutions. IEEE Access 2024, 12, 151554–151597. [Google Scholar] [CrossRef] [Scilit]
- Awuku, B.; Huang, Y.; Yodo, N. Predicting Natural Gas Pipeline Failures Caused by Natural Forces: An Artificial Intelligence Classification Approach. Appl. Sci. 2023, 13, 4322. [Google Scholar] [CrossRef] [Scilit]
- Ahangar, M.N.; Farhat, Z.A.; Sivanathan, A. AI Trustworthiness in Manufacturing: Challenges, Toolkits, and the Path to Industry 5.0. Sensors 2025, 25, 4357. [Google Scholar] [CrossRef] [Scilit] [PubMed]
- Lyu, H.; Xu, H.; Jiao, D.; Zhang, H. Geometry and Topology Preservable Line Structure Construction for Indoor Point Cloud Based on the Encoding and Extracting Framework. Remote Sens. 2025, 17, 3033. [Google Scholar] [CrossRef] [Scilit]
- Zhao, Y.; Deng, X.; Lai, H. A Deep Learning-Based Method to Detect Components from Scanned Structural Drawings for Reconstructing 3D Models. Appl. Sci. 2020, 10, 2066. [Google Scholar] [CrossRef] [Scilit]
- Ping, P.; Yao, Q.; Guo, W.; Liao, C. A Novel Electrical Equipment Status Diagnosis Method Based on Super-Resolution Reconstruction and Logical Reasoning. Sensors 2024, 24, 4259. [Google Scholar] [CrossRef] [Scilit]
- Zhang, T.; Ding, J.; Liu, Z.; Zhang, W. Visualization of industrial big data: State-of-the-art and future perspectives. Engineering 2025, 52, 85–101. [Google Scholar] [CrossRef] [Scilit]
- Lan, Q.; Wen, D.; Zhang, Z.; Zeng, Q.; Chen, X.; Popovski, P.; Huang, K. What is semantic communication? A view on conveying meaning in the era of machine intelligence. J. Commun. Inf. Netw. 2021, 6, 336–371. [Google Scholar] [CrossRef] [Scilit]
- Trigka, M.; Dritsas, E. A Comprehensive Survey of Deep Learning Approaches in Image Processing. Sensors 2025, 25, 531. [Google Scholar] [CrossRef] [Scilit]
- Maliński, K.; Okarma, K. Analysis of Image Preprocessing and Binarization Methods for OCR-Based Detection and Classification of Electronic Integrated Circuit Labeling. Electronics 2023, 12, 2449. [Google Scholar] [CrossRef] [Scilit]
- Kardos, R.A.; Tóthpálné Hidegh, G.; Rácz, E.; Józsa, V. Assessment and ranking of 16 binarization methods for turbulent swirl flame images of various flame types. Appl. Energy Combust. Sci. 2025, 24, 100428. [Google Scholar] [CrossRef] [Scilit]
- Bataineh, B.; Tounsi, M.; Zamzami, N.; Janbi, J.; Abu-ain, W.A.K.; AbuAin, T.; Elnazer, S. A Comprehensive Review on Document Image Binarization. J. Imaging 2025, 11, 133. [Google Scholar] [CrossRef] [Scilit] [PubMed]
- Tarbă, N.; Boiangiu, C.-A.; Voncilă, M.-L. From Classic to Cutting-Edge: A Near-Perfect Global Thresholding Approach with Machine Learning. Appl. Sci. 2025, 15, 8096. [Google Scholar] [CrossRef] [Scilit]
- Rendón-Castro, Á.A.; Mújica-Vargas, D.; Luna-Álvarez, A.; Vianney Kinani, J.M. Enhancing Image Quality via Robust Noise Filtering Using Redescending M-Estimators. Entropy 2023, 25, 1176. [Google Scholar] [CrossRef] [Scilit]
- Volkov, A.A.; Kozlov, A.V.; Cheremkhin, P.A.; Rymov, D.A.; Shifrina, A.V.; Starikov, R.S.; Nebavskiy, V.A.; Petrova, E.K.; Zlokazov, E.Y.; Rodin, V.G. A Review of Neural Network-Based Image Noise Processing Methods. Sensors 2025, 25, 6088. [Google Scholar] [CrossRef] [Scilit]
- Shin, J.-J.; Cho, J. A Unified Preprocessing Pipeline for Noise-Resilient Crack Segmentation in Leaky Infrastructure Surfaces. Sensors 2025, 25, 5574. [Google Scholar] [CrossRef] [Scilit] [PubMed]
- Li, J.; Lv, R.; Lan, Q.; Shou, X.; Ruan, H.; Cao, J.; Li, Z. Deep Line-Segment Detection-Driven Building Footprints Extraction from Backpack LiDAR Point Clouds for Urban Scene Reconstruction. Remote Sens. 2025, 17, 3730. [Google Scholar] [CrossRef] [Scilit]
- Xu, Y.; Quan, R.; Xu, W.; Huang, Y.; Chen, X.; Liu, F. Advances in Medical Image Segmentation: A Comprehensive Review of Traditional, Deep Learning and Hybrid Approaches. Bioengineering 2024, 11, 1034. [Google Scholar] [CrossRef] [Scilit]
- Yuan, Q.; Shi, Y.; Li, M. A Review of Computer Vision-Based Crack Detection Methods in Civil Infrastructure: Progress and Challenges. Remote Sens. 2024, 16, 2910. [Google Scholar] [CrossRef] [Scilit]
- Meng, X.; Yang, K.; Wang, M.; Yu, Q.; Shang, J.; Wu, Z. Morphological Reconstruction Based on Optical Images for the Seabed Semi-Buried Polymetallic Nodules: A Fusion Model of Elliptic Approximation and Contour Interweaving Methods. J. Mar. Sci. Eng. 2026, 14, 257. [Google Scholar] [CrossRef] [Scilit]
- Li, X.; Liu, X. Optimizing Parameter Extraction in Grid Information Models Based on Improved Convolutional Neural Networks. Electronics 2024, 13, 2717. [Google Scholar] [CrossRef] [Scilit]
- You, H.; Yang, D.; Wu, T.; He, Q.; Zhu, W.; Ren, X.; Liu, J. Hierarchical Topology Knowledge Extraction for Five-Prevention Wiring Diagrams in Substations. Energies 2026, 19, 546. [Google Scholar] [CrossRef] [Scilit]
- Tsirtsakis, P.; Zacharis, G.; Maraslidis, G.S.; Fragulis, G.F. Deep learning for object recognition: A comprehensive review of models and algorithms. Int. J. Cogn. Comput. Eng. 2025, 6, 298–312. [Google Scholar] [CrossRef] [Scilit]
- Murat, A.A.; Kiran, M.S. A comprehensive review on YOLO versions for object detection. Eng. Sci. Technol. Int. J. 2025, 70, 102161. [Google Scholar] [CrossRef] [Scilit]
- Ali, M.L.; Zhang, Z. The YOLO Framework: A Comprehensive Review of Evolution, Applications, and Benchmarks in Object Detection. Computers 2024, 13, 336. [Google Scholar] [CrossRef] [Scilit]
- Liu, B.; Mo, P.; Wang, S.; Cui, Y.; Wu, Z. A Refined and Efficient CNN Algorithm for Remote Sensing Object Detection. Sensors 2024, 24, 7166. [Google Scholar] [CrossRef] [Scilit]
- Massafra, A.; Al-Harasis, D.H.; Stefanini, L.; Jabi, W. Semi-Automated Dataset Generation for Residential Buildings Using Graph-Based Topological Modelling. Buildings 2025, 15, 1283. [Google Scholar] [CrossRef] [Scilit]
- Hansen, M.; Pomp, A.; Erki, K.; Meisen, T. Data-Driven Recognition and Extraction of PDF Document Elements. Technologies 2019, 7, 65. [Google Scholar] [CrossRef] [Scilit]
- Bhatt, J.; Hashmi, K.A.A.; Afzal, M.Z.; Stricker, D. A Survey of Graphical Page Object Detection with Deep Neural Networks. Appl. Sci. 2021, 11, 5344. [Google Scholar] [CrossRef] [Scilit]
- Barja-Martinez, S.; Aragüés-Peñalba, M.; Munné-Collado, Í.; Lloret-Gallego, P.; Bullich-Massagué, E.; Villafafila-Robles, R. Artificial Intelligence Techniques for Enabling Big Data Services in Distribution Networks: A Review. Renew. Sustain. Energy Rev. 2021, 150, 111459. [Google Scholar] [CrossRef] [Scilit]
- Bhanbhro, H.; Hooi, Y.K.; Kusakunniran, W.; Amur, Z.H. Symbol Detection in a Multi-class Dataset Based on Single Line Diagrams Using Deep Learning Models. Int. J. Adv. Comput. Sci. Appl. 2023, 14, 43–56. [Google Scholar] [CrossRef] [Scilit]
- Mohammed, S.Y. Architecture review: Two-stage and one-stage object detection. Frankl. Open 2025, 12, 100322. [Google Scholar] [CrossRef] [Scilit]
- Madan, M.; Reich, C. Strengthening Small Object Detection in Adapted RT-DETR Through Robust Enhancements. Electronics 2025, 14, 3830. [Google Scholar] [CrossRef] [Scilit]
- Mo, N.; Zhu, R. A novel transformer-based object detection method with geometric and object co-occurrence prior knowledge for remote sensing images. IEEE J. Sel. Top. Appl. Earth Obs. Remote Sens. 2025, 18, 2383–2400. [Google Scholar] [CrossRef] [Scilit]
- Nikouei, M.; Baroutian, B.; Nabavi, S.; Taraghi, F.; Aghaei, A.; Sajedi, A.; Ebrahimi Moghaddam, M. Small object detection: A comprehensive survey on challenges, techniques and real-world applications. Intell. Syst. Appl. 2025, 27, 200561. [Google Scholar] [CrossRef] [Scilit]
- Faisal, M.A.A.; Mecheter, I.; Qiblawey, Y.; Hernandez Fernandez, J.; Chowdhury, M.E.H.; Kiranyaz, S. Deep learning in automated power line inspection: A review. Appl. Energy 2025, 385, 125507. [Google Scholar] [CrossRef] [Scilit]
- Wang, Z.Z.; Xie, K.; Zhang, X.Y.; Chen, H.Q.; Wen, C.; He, J.B. Small-object detection based on YOLO and dense block via image super-resolution. IEEE Access 2021, 9, 56416–56429. [Google Scholar] [CrossRef] [Scilit]
- Kharroubi, A.; Remondino, F.; Ballouch, Z.; Hajji, R.; Billen, R. Semantic and Geometric Fusion for Object-Based 3D Change Detection in LiDAR Point Clouds. Remote Sens. 2025, 17, 1311. [Google Scholar] [CrossRef] [Scilit]
- Bhanbhro, H.; Kwang Hooi, Y.; Kusakunniran, W.; Amur, Z.H. A Symbol Recognition System for Single-Line Diagrams Developed Using a Deep-Learning Approach. Appl. Sci. 2023, 13, 8816. [Google Scholar] [CrossRef] [Scilit]
- Elyan, E.; Gaber, M. A genetic algorithm approach to optimising random forests applied to class engineered data. Inf. Sci. 2017, 384, 220–234. [Google Scholar] [CrossRef] [Scilit]
- Othman, A.; Kaddoum, G.; Evangelista, J.V.C.; Au, M.; Agba, B.L. Digital Twinning in Smart Grid Networks: Interplay, Resource Allocation and Use Cases. IEEE Commun. Mag. 2024, 61, 120–126. [Google Scholar] [CrossRef] [Scilit]
- Sun, Q.; Zhu, M.; Li, M.; Li, G.; Deng, W. Symbol Recognition Method for Railway Catenary Layout Drawings Based on Deep Learning. Symmetry 2025, 17, 674. [Google Scholar] [CrossRef] [Scilit]
- Tran, A.T.; Zeevi, T.; Payabvash, S. Strategies to Improve the Robustness and Generalizability of Deep Learning Segmentation and Classification in Neuroimaging. BioMedInformatics 2025, 5, 20. [Google Scholar] [CrossRef] [Scilit]
- Gong, C.; Hu, Y.; Gao, J.; Wang, Y.; Yan, L. An Improved Delay-Suppressed Sliding-Mode Observer for Sensorless Vector-Controlled PMSM. IEEE Trans. Ind. Electron. 2019, 67, 5913–5923. [Google Scholar] [CrossRef] [Scilit]
- Rasmussen, C.B.; Kirk, K.; Moeslund, T.B. The Challenge of Data Annotation in Deep Learning—A Case Study on Whole Plant Corn Silage. Sensors 2022, 22, 1596. [Google Scholar] [CrossRef] [Scilit]
- Cheng, Y.; Huang, J.; Tai, I.S.; Mondal, S.K.; Wang, T.; Kabir, H.M.D. A Two-Stage End-to-End Framework for Robust Scene Text Spotting with Self-Calibrated Detection and Contextual Recognition. Electronics 2025, 14, 4594. [Google Scholar] [CrossRef] [Scilit]
- Han, Y.; Chen, S.; Gong, C.; Zhao, X.; Zhang, F.; Li, Y. Accurate SM Disturbance Observer-Based Demagnetization Fault Diagnosis With Parameter Mismatch Impacts Eliminated for IPM Motors. IEEE Trans. Power Electron. 2023, 38, 5706–5710. [Google Scholar] [CrossRef] [Scilit]
- Abdella, J.; Shuaib, K. Peer to Peer Distributed Energy Trading in Smart Grids: A Survey. Energies 2018, 11, 1560. [Google Scholar] [CrossRef] [Scilit]
- Gay, D.; Rogers, T.; Shirley, R. Small Island Developing States and Their Suitability for Electric Vehicles and Vehicle-to-Grid Services. Util. Policy 2018, 55, 69–78. [Google Scholar]
- Boel, L.; Rubens, G.Z.; Sovacool, B.K. Optimizing Innovation, Carbon and Health in Transport: Assessing Socially Optimal Electric Mobility and Vehicle-to-Grid Pathways in Denmark. Energy 2018, 153, 628–637. [Google Scholar]
- Ren, Y.; Yao, H.; Liu, G.; Bai, Z. A Text Code Recognition and Positioning System for Engineering Drawings of Nuclear Power Equipment. In Proceedings of the 2022 IEEE 6th Information Technology and Mechatronics Engineering Conference (ITOEC), Chongqing, China, 4–6 March 2022; pp. 661–665. [Google Scholar]
- Tsai, P.-F.; Shiu, J.-Y.; Yuan, S.-M. A Deep Learning Framework of Super Resolution for License Plate Recognition in Surveillance System. Mathematics 2025, 13, 1673. [Google Scholar] [CrossRef] [Scilit]
- Jing, T.; Liu, C.; Chen, Y. A Lightweight Single-Image Super-Resolution Method Based on the Parallel Connection of Convolution and Swin Transformer Blocks. Appl. Sci. 2025, 15, 1806. [Google Scholar] [CrossRef] [Scilit]
- Johnson, D.S.; Hakobyan, O.; Paletschek, J.; Drimalla, H. Explainable AI for audio and visual affective computing: A scoping review. IEEE Trans. Affect. Comput. 2025, 16, 518–536. [Google Scholar] [CrossRef] [Scilit]
- Shin, J.; Hamza, M.; Kim, H.; Jo, J.; Park, B.; Kim, Y. Lightweight Swin transformer for high-precision industrial defect detection in smart manufacturing. Alex. Eng. J. 2025, 130, 227–240. [Google Scholar] [CrossRef] [Scilit]
- Hassija, V.; Palanisamy, B.; Chatterjee, A.; Mandal, A.; Chakraborty, D.; Pandey, A.; Chalapathi, G.S.S.; Kumar, D. Transformers for vision: A survey on innovative methods for computer vision. IEEE Access 2025, 13, 95496–95523. [Google Scholar] [CrossRef] [Scilit]
- Zhan, C.; Wang, C.; Lu, B.; Yang, W.; Zhang, X.; Wang, G. NGSTGAN: N-Gram Swin Transformer and Multi-Attention U-Net Discriminator for Efficient Multi-Spectral Remote Sensing Image Super-Resolution. Remote Sens. 2025, 17, 2079. [Google Scholar] [CrossRef] [Scilit]
- Liu, Z.; Song, R.; Li, K.; Li, Y. From Detection to Understanding: A Systematic Survey of Deep Learning for Scene Text Processing. Appl. Sci. 2025, 15, 9247. [Google Scholar] [CrossRef] [Scilit]
- Spencer, B.F., Jr.; Hoskere, V.; Narazaki, Y. Advances in computer vision-based civil infrastructure inspection and monitoring. Engineering 2019, 5, 199–222. [Google Scholar] [CrossRef] [Scilit]
- Sulaiman, A.; Omar, K.; Nasrudin, M.F. Degraded Historical Document Binarization: A Review on Issues, Challenges, Techniques, and Future Directions. J. Imaging 2019, 5, 48. [Google Scholar] [CrossRef] [Scilit]
- Dilek, E.; Dener, M. Computer Vision Applications in Intelligent Transportation Systems: A Survey. Sensors 2023, 23, 2938. [Google Scholar] [CrossRef] [Scilit]
- Shahin, M.; Chen, F.F.; Maghanaki, M.; Hosseinzadeh, A.; Zand, N.; Khodadadi Koodiani, H. Improving the Concrete Crack Detection Process via a Hybrid Visual Transformer Algorithm. Sensors 2024, 24, 3247. [Google Scholar] [CrossRef] [Scilit]
- Ni, X.; Jiang, S.; Yu, K.; An, C.; Zhang, Y.; Huang, H. Smart Grid Intrusion Detection System Based on Incremental Learning. Electronics 2025, 14, 3820. [Google Scholar] [CrossRef] [Scilit]
- Wang, L.; Dong, J.; Wang, L.; Liu, F.; Wen, Q.; Genc, B. A decoupled segmentation-classification strategy based on Semantic-SAM for precise semantic segmentation in coal mine areas. IEEE J. Sel. Top. Appl. Earth Obs. Remote Sens. 2025, 18, 14820–14842. [Google Scholar] [CrossRef] [Scilit]
- Nimma, D.; Al-Omari, O.; Pradhan, R.; Ulmas, Z.; Krishna, R.V.V.; El-Ebiary, T.Y.A.B.; Rao, V.S. Object detection in real-time video surveillance using attention based transformer-YOLOv8 model. Alex. Eng. J. 2025, 118, 482–495. [Google Scholar] [CrossRef] [Scilit]
- Lim, Y.; Son, M.; Park, K.; Kim, M.; Song, K.; Lee, H.; Kim, H. Power System Decision Making in the Age of Deep Learning: A Comprehensive Review. Energies 2025, 18, 4867. [Google Scholar] [CrossRef] [Scilit]
- Liang, H.; Moya, B.; Chinesta, F.; Chatzi, E. Quantifying the value of seismic structural health monitoring for post-earthquake recovery of electric power system in terms of resilience enhancement. Reliab. Eng. Syst. Saf. 2026, 273, 112292. [Google Scholar] [CrossRef] [Scilit]
- Liu, Y.; Wang, Y.; Liu, Z.; Liu, Y.; Shen, X. Research on improved YOLOv5-based small component recognition method of electrical drawings. In Proceedings of the 8th International Conference on Signal and Image Processing (ICSIP), Wuxi, China, 8–10 July 2023; pp. 64–68. [Google Scholar]
- Shin, J.-H.; Yi, B.-J.; Kim, Y.-I.; Yang, I.-K. Development of power distribution facility map input system using automatic image recognition technology. IEEE Trans. Power Deliv. 2010, 25, 231–237. [Google Scholar] [CrossRef] [Scilit]
- Kumar, P.; Saini, R.; Roy, P.P.; Dogra, D.P. Study of text segmentation and recognition using Leap Motion sensor. IEEE Sens. J. 2017, 17, 1293–1301. [Google Scholar] [CrossRef] [Scilit]
- Elyan, E.; Jamieson, L.; Ali-Gombe, A. Deep learning for symbols detection and classification in engineering drawings. Neural Netw. 2020, 129, 91–102. [Google Scholar] [CrossRef] [Scilit]
- Elyan, E.; Moreno Garcia, C.; Jayne, C. Symbols classification in engineering drawings. In Proceedings of the International Joint Conference on Neural Networks (IJCNN), Rio de Janeiro, Brazil, 8–13 July 2018; pp. 1–8. [Google Scholar]
- Cordella, L.; Vento, M. Symbol recognition in documents: A collection of techniques. Int. J. Doc. Anal. Recognit. 2000, 3, 73–88. [Google Scholar] [CrossRef] [Scilit]
- Ye, Z.; Qi, D.; Liu, H.; Yan, Y.; Chen, Q.; Liu, X. RoUIE: A method for constructing knowledge graph of power equipment based on improved universal information extraction. Energies 2024, 17, 2249. [Google Scholar] [CrossRef] [Scilit]
- Yang, L.; Wang, J.; Zhang, J.; Li, H.; Wang, K. Practical single-line diagram recognition based on digital image processing and deep vision models. Expert Syst. Appl. 2024, 238, 122389. [Google Scholar] [CrossRef] [Scilit]
- Kim, H.; Lee, W.; Kim, M. Deep-learning-based recognition of symbols and texts at an industrially applicable level from images of high-density piping and instrumentation diagrams. Comput. Ind. 2021, 183, 115337. [Google Scholar] [CrossRef] [Scilit]
- Llados, J.; Marti, E.; Villanueva, J.J. Symbol recognition by error-tolerant subgraph matching between region adjacency graphs. IEEE Trans. Pattern Anal. Mach. Intell. 2001, 23, 1137–1143. [Google Scholar] [CrossRef] [Scilit]
- Boykov, Y.; Jolly, M.-P. Interactive graph cuts for optimal boundary and region segmentation of objects in N-D images. In Proceedings of the ICCV, Vancouver, BC, Canada, 7–14 July 2001; pp. 105–112. [Google Scholar]
- Sadasivan, A.K.; Senthilkumar, T. Automatic character recognition in complex images. Int. J. Comput. Appl. 2012, 30, 218–225. [Google Scholar] [CrossRef] [Scilit]
- Santosh, K.C.; Lamiroy, B.; Wendling, L. Integrating vocabulary clustering with spatial relations for symbol recognition. Int. J. Doc. Anal. Recognit. 2014, 17, 61–78. [Google Scholar] [CrossRef] [Scilit]
- Moreno-García, C.F.; Elyan, E.; Jayne, C. New trends on digitisation of complex engineering drawings. Neural Comput. Appl. 2019, 31, 1695–1712. [Google Scholar] [CrossRef] [Scilit]
- Lu, T.; Tai, C.-L.; Yang, H.; Cai, S. A novel knowledge-based system for interpreting complex engineering drawings: Theory, representation, and implementation. IEEE Trans. Pattern Anal. Mach. Intell. 2009, 31, 1444–1457. [Google Scholar]
- Yu, Y.; Samal, A.; Seth, S.C. A system for recognizing a large class of engineering drawings. IEEE Trans. Pattern Anal. Mach. Intell. 1997, 19, 868–890. [Google Scholar] [CrossRef] [Scilit]
- Ren, A.; Yu, Q.; Xu, Y. Drawing recognition for automatic dimensioning of shear-walls. Tsinghua Sci. Technol. 2002, 7, 555–559. [Google Scholar]
- Ning, X.; Zhao, B.; Huang, B.; Zhu, M.; Zhang, Q.; Zhang, B. DrawingNet for communication tower drawings recognition. IEEE Access 2024, 12, 156378–156389. [Google Scholar] [CrossRef] [Scilit]
- Yang, C.; Wang, J.; Yang, L.; Shi, D.; Duan, X. Intelligent digitization of substation one-line diagrams based on computer vision. IEEE Trans. Power Deliv. 2023, 38, 3912–3923. [Google Scholar] [CrossRef] [Scilit]
- Schäfer, B.; van der Aa, H.; Leopold, H.; Stuckenschmidt, H. Sketch2Process: End-to-end BPMN sketch recognition based on neural networks. IEEE Trans. Softw. Eng. 2023, 49, 2621–2641. [Google Scholar] [CrossRef] [Scilit]
- Cheng, B.; Stanley, R.J.; Antani, S.; Thoma, G.R. Graphical figure classification using data fusion for integrating text and image features. In Proceedings of the 12th International Conference on Document Analysis and Recognition (ICDAR), Washington, DC, USA, 25–28 August 2013; pp. 693–697. [Google Scholar]
- Wang, G.; Wang, R.; Liang, M.; Wei, S.; Zhao, X.; Yang, D.; Wang, Z. Natural scene text detection with multiscale feature augmentation and attention mechanisms. IEEE Access 2024, 12, 174041–174052. [Google Scholar] [CrossRef] [Scilit]
- Bhanbhro, H.; Hooi, Y.K.; Hassan, Z. Modern approaches towards object detection of complex engineering drawings. In Proceedings of the International Conference on Digital Transformation and Intelligence (ICDI), Kuching, Sarawak, Malaysia, 1–2 December 2022; pp. 1–6. [Google Scholar]
- Huang, C.; Gao, C.; Li, M.; Li, Y.; Wang, X.; Jiang, Y.; Huang, X. Correlation information enhanced graph anomaly detection via hypergraph transformation. IEEE Trans. Cybern. 2025, 55, 2865–2878. [Google Scholar] [CrossRef] [Scilit]
- Li, J.; Luo, Y.; Liu, S.; Wu, S.; Chen, Y. Application of a YOLO object detection model for blind review mode in image content recognition of response documents in the power industry. In Proceedings of the IEEE International Conference on Automation, Electronics and Electrical Engineering (AUTEEE), Shenyang, China, 28–30 November 2025; pp. 1128–1133. [Google Scholar]
- de Assis Mota, A.; Mota, L.T.M. Drawing meshed one-line diagrams of electric power systems using a modified controlled spring embedder algorithm enhanced with geospatial data. J. Comput. Sci. 2011, 7, 234–241. [Google Scholar] [CrossRef] [Scilit]
- Bai, H.; Zhou, C.; Yuan, Z.; Lei, J. Prospect and Thinking of Digital Power Grid Based on Digital Twin. South. Power Syst. Technol. 2020, 14, 18–24, 40. [Google Scholar]
- Bai, H.; Wang, Y. Digital power grid based on digital twin: Definition, structure and key technologies. Energy Rep. 2022, 8, 390–397. [Google Scholar] [CrossRef] [Scilit]
- Han, J.; Hong, Q.; Syed, M.H.; Khan, M.A.U.; Yang, G.; Burt, G.; Booth, C. Cloud-Edge Hosted Digital Twins for Coordinated Control of Distributed Energy Resources. IEEE Trans. Cloud Comput. 2023, 11, 1242–1256. [Google Scholar] [CrossRef] [Scilit]
- Xu, H.; Sun, S.; Ge, Z.; Qu, G.; Sun, Y.; Wang, X.; Sun, W. Research and Application of Architecture and Key Technologies for Power Grid Real-time Dispatching and Control Data Platform. Automation Electr. Power Syst. 2019, 43, 157–164. [Google Scholar]
- Bhat, V.; Callaway, C.P.; Risko, C. Computational approaches for organic semiconductors: From chemical and physical understanding to predicting new materials. Chem. Rev. 2023, 123, 7498–7547. [Google Scholar] [CrossRef] [Scilit] [PubMed]
- Goyel, H.; Swarup, K.S. Data Integrity Attack Detection Using Ensemble-Based Learning for Cyber-Physical Power Systems. IEEE Trans. Smart Grid 2023, 14, 1198–1209. [Google Scholar]
- Nie, T.; Sun, J.; Ma, W. Exploring the roles of large language models in reshaping transportation systems: A survey, framework, and roadmap. Artif. Intell. Transp. 2025, 1, 100003. [Google Scholar] [CrossRef] [Scilit]
- Tsegaye, S.; Heyi, K.G.; Endaylalu, M.T.; Melaku, Z.A.; Turufi, K.T. Deep Neural Networks in Smart Grid Digital Twins: Evolution, Challenges, and Future Outlooks. IEEE Access 2025, 13, 114845–114864. [Google Scholar] [CrossRef] [Scilit]
- Glass, P.; Serugendo, G.D. Coordination Model and Digital Twins for Managing Energy Consumption and Production in a Smart Grid. Energies 2023, 16, 7629. [Google Scholar] [CrossRef] [Scilit]
- Zoppi, T.; Bicchierai, I.; Brancati, F.; Bondavalli, A.; Schwefel, H.P. Deploying a Generic Threat Model for Detecting Anomalies in a Power Grid Digital Twin. In Proceedings of the 2024 IEEE 29th Pacific Rim International Symposium on Dependable Computing (PRDC), Osaka, Japan, 13–15 November 2024; pp. 208–215. [Google Scholar]
- Djebali, S.; Guerard, G.; Taleb, I. Survey and insights on digital twins design and smart grid’s applications. Future Gener. Comput. Syst. 2024, 153, 234–248. [Google Scholar]
- Mlakic, D.; Baghaee, H.; Nikolovski, S. Gibbs Phenomenon-Based Hybrid Islanding Detection Strategy for VSC-Based Microgrids Using Frequency Shift, THDU, and RMSU. IEEE Trans. Smart Grid 2019, 10, 5479–5491. [Google Scholar] [CrossRef] [Scilit]
- Zhang, Y.; Xu, D.; Cao, H.; Li, D.; Lv, Y.; Zhang, X. Intelligent Recognition of Power Grid Station Wiring Diagrams Based on Multi-stage Collaboration. Power Syst. Technol. 2024, 48, 4341–4348. [Google Scholar]
- Yang, X.; Zou, Q.; Pan, L.; Chen, M.; Li, G.; Jiang, Q. Dynamic Error Correction Method of Power Grid Primary Wiring Diagram Based on Feature Fusion and Compositional Map Element. Microcomput. Appl. 2025, 41, 148–151. [Google Scholar]
- Li, B.; Yang, J. Development and Application of Automatic Generation Technology for Panoramic View of Power grid Operation. Electr. Eng. 2022, 6, 151–153. [Google Scholar]
- Lu, C.; Ji, X.; Qi, L.; Zhu, W.; Li, Q. Research and application of automatic mapping technology for power grid geographic wiring diagram for T-connections. Electr. Eng. 2024, 25, 62–67. [Google Scholar]
- Zhang, J.; Sheng, J.; Jin, N.; Zhou, S.; Gong, X. Design and Implementation of SVG Graphic System in Power Grid Fault Information System. Power Syst. Technol. 2007, 31, 74–78. [Google Scholar]
- Li, H.; Wang, S.; Geng, Y.; Wang, L.; Sun, W.; Miao, C. Wiring diagram detection and check based ondeep learning and graph matching. J. Beijing Univ. Aeronaut. Astronaut. 2021, 47, 539–548. [Google Scholar]
- Stefenon, S.F.; Seman, L.O.; Klaar, A.C.R.; Ovejero, R.G.; Leithardt, V.R.Q. Hypertuned-YOLO for interpretable distribution power grid fault location based on EigenCAM. Ain Shams Eng. J. 2024, 15, 102722. [Google Scholar] [CrossRef] [Scilit]
- Atat, R.; Ismail, M.; Shaaban, M.F.; Serpedin, E.; Overbye, T. Stochastic Geometry-Based Model for Dynamic Allocation of Metering Equipment in Spatio-Temporal Expanding Power Grids. IEEE Trans. Smart Grid 2020, 11, 2080–2091. [Google Scholar] [CrossRef] [Scilit]
- Wang, M.; Han, X.; Wu, L.; Sun, Y.; Wang, Y.; Zhai, M. Implementation of WEB Graphical Display Technology for CIM/G Based Power Grid Dispatching and Control Systems. Autom. Electr. Power Syst. 2018, 42, 81–85. [Google Scholar] [CrossRef] [Scilit]
- Khoshnevis, S.A.; Amirkhani, A. Tracking with attention: A review of transformer-based object tracking. Eng. Sci. Technol. Int. J. 2026, 73, 102263. [Google Scholar] [CrossRef] [Scilit]
- Ithaya, R.; Shobana, R.; Mishra, A.K.; Christinal, J.B. CAD-IGMS: Cyber attack detection in an intelligent grid management system via the deep learning enhancing grid reliability. Ain Shams Eng. J. 2025, 16, 103678. [Google Scholar] [CrossRef] [Scilit]
- Tang, J.; Chen, H.; Xu, W.; Gao, P.; Wu, H. Power grid partitioning method considering flexibility under high proportion of new energy. Electr. Power Autom. Equip. 2025, 45, 191–195. [Google Scholar]
- Zhao, Y.; Liu, F.; He, Q.; Liu, F.; Sun, X.; Zhang, J. SRW-YOLO: A Detection Model for Environmental Risk Factors During the Grid Construction Phase. Remote Sens. 2025, 17, 2576. [Google Scholar]
- Stilla, U.; Xu, Y. Change detection of urban objects using 3D point clouds: A review. ISPRS J. Photogramm. Remote Sens. 2023, 197, 228–255. [Google Scholar]
- Lu, H.; Cheng, Y.F. Artificial intelligence in energy pipelines: Opportunities and risks. Engineering, 2025; in press. [CrossRef] [Scilit]
- Zhang, Z.; Peng, H.; Li, L.; Bao, S. Adaptive Asynchronous Federated Learning for Digital Twin Driven Smart Grid. IEEE Trans. Smart Grid 2025, 16, 4167–4183. [Google Scholar] [CrossRef] [Scilit]
- Qiu, J.; Zhang, X.; Wang, T.; Hou, H.; Wang, S.; Yang, T. A GNN-Based False Data Detection Scheme for Smart Grids. Algorithms 2025, 18, 166. [Google Scholar] [CrossRef] [Scilit]
- Lu, Q.; Liu, C.; Jiang, Z.; Men, A.; Yang, B. G-CNN: Object Detection via Grid Convolutional Neural Network. IEEE Access 2017, 5, 24023–24031. [Google Scholar] [CrossRef] [Scilit]
- Hasan, M.N.; Toma, R.N.; Abdullah-Al, N.; Islam, M.M.M.; Kim, J.-M. Electricity Theft Detection in Smart Grid Systems: A CNN-LSTM Based Approach. Energies 2019, 12, 3310. [Google Scholar] [CrossRef] [Scilit]
- Stefenon, S.F.; Singh, G.; Yow, K.-C.; Cimatti, A. Semi-ProtoPNet Deep Neural Network for the Classification of Defective Power Grid Distribution Structures. Sensors 2022, 22, 4859. [Google Scholar] [CrossRef] [Scilit]
- Gao, Z.; Gao, G.; Liu, C.; Xu, Y.; Liu, C.; Luo, Z.; Hu, Y. TNet: Power Pole Classification with Deep Learning for Automated Inspection in Smart Grids. Int. J. Pattern Recogn. Artif. Intell. 2025, 39, 10. [Google Scholar] [CrossRef] [Scilit]
- Basiri, F.; Casadiego, J.; Timme, M.; Witthaut, D. Inferring power-grid topology in the face of uncertainties. Phys. Rev. E 2018, 98, 12305. [Google Scholar] [CrossRef] [Scilit]
- Cheng, H.; Han, P.; Wang, D.; Zhai, Y. Location Method of Insulators in Power Grid Patrol Aerial Images. J. Syst. Simul. 2017, 29, 1327–1336. [Google Scholar]
- Deka, D.; Doddi, H.; Misra, S.; Salapaka, M. Tractable Learning in Underexcited Power Grids. IEEE Trans. Control Netw. Syst. 2022, 9, 763–774. [Google Scholar] [CrossRef] [Scilit]
- Lang, W.; Hu, Y.; Gong, C.; Zhang, X.; Xu, H.; Deng, J. Artificial intelligence-based technique for fault detection and diagnosis of EV motors: A review. IEEE Trans. Transp. Electr. 2022, 8, 384–406. [Google Scholar] [CrossRef] [Scilit]
- Zhou, B.; Meng, Z.; Wu, W.; Zhu, Y.; Guo, J. Power Grid Diagram Automatic Mapping Algorithm for Radial Distribution Feeder. Electr. Power 2015, 48, 136–140. [Google Scholar]
- Gong, C.; Li, Y.R.; Zargari, N.R. An overview of advancements in multimotor drives: Structural diversity, advanced control, specific technical challenges, and solutions. Proc. IEEE 2024, 112, 184–209. [Google Scholar] [CrossRef] [Scilit]
- Li, X.; Jiao, W.; Han, Q.; Lu, Z. Detection of FDIA in Power Grid Based on Hypergraph and Attention Mechanism. IEEE Trans. Smart Grid 2025, 16, 1862–1871. [Google Scholar] [CrossRef] [Scilit]
- Du, S.; Chen, Y.; Ling, J.; Shi, W.; Li, Y. Visual Rotation Detection Algorithm for Power Grid UAV Inspection Targets Based on YOLO-OBB. IEEE Access 2025, 13, 202354–202361. [Google Scholar] [CrossRef] [Scilit]
- Zhang, Y.; Song, A.; Su, M. Research on vectorization technology for electrical wiring diagrams. Zhejiang Electr. Power 2024, 43, 28–35. [Google Scholar]
- Xiang, B.; Chang, H.; Sun, L.; Ye, Y. Application of Digital Twin Technology in Intelligent Digital Power Grid. In Proceedings of the 2025 8th Asia Conference on Energy and Electrical Engineering (ACEEE), Qingdao, China, 25–27 July 2025; pp. 184–189. [Google Scholar]
- Mchirgui, N.; Quadar, N.; Kraiem, H.; Lakhssassi, A. The Applications and Challenges of Digital Twin Technology in Smart Grids: A Comprehensive Review. Appl. Sci. 2024, 14, 10933. [Google Scholar] [CrossRef] [Scilit]
- Heluany, J.B.B.; Galvao, R. IEC 62443 Standard for Hydro Power Plants. Energies 2023, 16, 1452. [Google Scholar] [CrossRef] [Scilit]
- Abdmouleh, Z.; Alammari, R.A.M.; Gastli, A. Review of policies encouraging renewable energy integration & best practices. Renew. Sustain. Energy Rev. 2015, 45, 249–262. [Google Scholar] [CrossRef] [Scilit]
- Li, Q.; Xiang, H.; Cui, W.; Liu, K.; Li, D. A Multi-Factor Authentication Method for Power Grid Terminals Based on Edge Computing Paradigm. IEEE Access 2025, 13, 166062–166077. [Google Scholar] [CrossRef] [Scilit]
- Zaboli, A.; Kim, Y.H.; Hong, J. An Advanced Generative AI-Based Anomaly Detection in IEC61850-Based Communication Messages in Smart Grids. IEEE Access 2025, 13, 89997–90016. [Google Scholar] [CrossRef] [Scilit]
- Wang, S.; Zou, X.; Zhu, W.; Zeng, L. Insulator Defects Detection for Aerial Photography of the Power Grid Using You Only Look Once Algorithm. J. Electr. Eng. Technol. 2023, 18, 3287–3300. [Google Scholar] [CrossRef] [Scilit]
- Hadjidimitriou, N.S.; Lippi, M.; Mamei, M.; Nastro, R.; Picone, M.; D’Andreagiovanni, F. Data-Driven Adaptation of Smart Grids With Hierarchical Digital Twi. IEEE Pervasive Comput. 2025, 24, 10–18. [Google Scholar] [CrossRef] [Scilit]
- Atalay, M.; Angin, P. A Digital Twins Approach to Smart Grid Security Testing and Standardization. In Proceedings of the 2020 IEEE International Workshop Metrology for Industry 4.0 & IOT (METROIND4.0&IOT), Roma, Italy, 3–5 June 2020; pp. 435–440. [Google Scholar]
- Mansour, D.E.A.; Numair, M.; Zalhaf, A.S.; Ramadan, R.; Darwish, M.M.F.; Huang, Q.; Hussien, M.G.; Abdel-Rahim, O. Applications of IoT and digital twin in electrical power systems: A comprehensive survey. IET Gener. Transm. Distrib. 2023, 17, 4457–4479. [Google Scholar] [CrossRef] [Scilit]
- Olivares-Rojas, J.C.; Reyes-Archundia, E.; Gutierrez-Gnecchi, J.A.; Molina-Moreno, I.; Cerda-Jacobo, J.; Mendez-Patino, A. Towards Cybersecurity of the Smart Grid Using Digital Twins. IEEE Internet Comput. 2022, 26, 52–57. [Google Scholar] [CrossRef] [Scilit]
- Li, H.; Lu, Q.; Yang, Y.; Xie, D.; Gao, W. Integrating Attention-augmented CNN and Transformer for Critical Nodes Identification in Power Grids. J. Beijing Univ. Technol. 2026, 52, 117–129. [Google Scholar]
- Wang, Z.; Luo, Q.; Xiao, W.; Wang, Y.; Yu, T. Key Method of Wiring Diagram Recognition with Artificial Intelligence for Power Plant and Substation. Autom. Electr. Power Syst. 2023, 47, 115–124. [Google Scholar]
- Su, Y.; Luo, J.; Xiong, H.; Fan, Q.; Wu, H.; Chen, L. Automatic Generation of Substation Wiring Graph Based on Inventory Graph Topology Analysis. Autom. Electr. Power Syst. 2020, 44, 162–166. [Google Scholar]
- Li, Y.; Lu, F.; Liu, L.; Wei, S.; Zhu, Y. Identification of weak nodes in complex power grids based on GNN. Eng. J. Wuhan Univ. 2025, 58, 407–415. [Google Scholar]
- Liu, Y.; Hao, T.; Zhang, W. Locating Short-Circuit Fault of Power Grid Based on RMT-CNN. Trans. Beijing Inst. Technol. 2024, 44, 403–412. [Google Scholar]
- Tian, J.; Wang, B.; Li, J.; Wang, Z. Adversarial Attacks and Defense for CNN Based Power Quality Recognition in Smart Grid. IEEE Trans. Netw. Sci. Eng. 2022, 9, 807–819. [Google Scholar] [CrossRef] [Scilit]
- Stefenon, S.F.; Yow, K.C.; Nied, A.; Meyer, L.H. Classification of distribution power grid structures using inception v3 deep neural network. Electr. Eng. 2022, 104, 4557–4569. [Google Scholar] [CrossRef] [Scilit]
- Penagos, C.A.V.; Diaz, J.L.; Rodriguez-Martinez, O.F.; Andrade, F.; Luna, A.C. Metrics and Strategies Used in Power Grid Resilience. Energies 2024, 17, 168. [Google Scholar] [CrossRef] [Scilit]
- Zhang, L.; Yang, H.; Liu, G.; Li, Y. Intelligent imaging detection for power system grounding grid. Adv. Technol. Electr. Eng. Energy 2018, 37, 76–82. [Google Scholar]
- Li, J.; Wang, F. Non-Technical Loss Detection in Power Grids with Statistical Profile Images Based on Semi-Supervised Learning. Sensors 2020, 20, 236. [Google Scholar] [CrossRef] [Scilit]
- Zhou, B.; Meng, Z.; Wang, Z. A design method for an automatic primary wiring diagram drawing system based on CIM. In Proceedings of the 27th Annual Conference on China University Society for Electric Power Systems and Automation (CUS–EPSA), Qinhuangdao, China, 15 October 2011; pp. 1–6. [Google Scholar]
- Zheng, H.; Lin, Z.; Lin, H.; Huang, C.; Huang, X.; Ji, S.; Zhang, X. Neural Network Based Power Meter Wiring Fault Recognition of Smart Grids Under Abnormal Reactive Power Compensation Scenarios. Energies 2025, 18, 545. [Google Scholar] [CrossRef] [Scilit]
- Xu, X.; Tian, G.; Liu, T.; Yu, W.; Xiao, D.; Liang, S. Automatic Topology Wiring Method of Power Flow Diagram Based on Neural Network. Autom. Electr. Power Syst. 2022, 46, 102–108. [Google Scholar]
- Wang, Q.; Wang, Y.; Ma, L.; Xu, Y. An Automatic Recognition Method of Electrical Wiring Diagrams Based on Optimized YOLO11 and CAD Automatic Recognition Technology. IEEE Access 2025, 13, 176129–176140. [Google Scholar] [CrossRef] [Scilit]
- Ayturan, K.; Sarikamis, B.; Aksahin, M.F.; Kutbay, U. SPHERE: Benchmarking YOLO vs. CNN on a Novel Dataset for High-Accuracy Solar Panel Defect Detection in Renewable Energy Systems. Appl. Sci. 2025, 15, 4880. [Google Scholar] [CrossRef] [Scilit]
- Dinkelbach, J.; Razik, L.; Mirz, M.; Benigni, A.; Monti, A. Template-based generation of programming language specific code for smart grid modelling compliant with CIM and CGMES. J. Eng. 2023, 2023, 1. [Google Scholar] [CrossRef] [Scilit]
- Lin, F.; Guo, B.; Qian, W. Common Electric Power Grid GIS Platform Oriented Architecture for Electric Power Grid GIS Applications. Autom. Electr. Power Syst. 2011, 35, 63–67. [Google Scholar]
- Li, W.; Jin, H.; Wang, J.; Guo, T. Development of application system based on GIS for rural power grids. In Proceedings of the 2009 International Conference on Industrial and Information Systems (IESES), Haikou, China, 24–25 April 2009; pp. 433–436. [Google Scholar]
- Morgado, P.M.; Flores, P.F.; Silveira, L.M.; Becker, J.; Reis, R. Generating realistic stimuli for accurate power grid analysis. In Proceedings of the IEEE-Computer-Society Annual Symposium on VLSI, Porto Alegre, Brazil, 8–11 March 2007; p. 233. [Google Scholar]
- Nevisi, M.M.S.; Shoeibi, M.; Hernando-Gallego, F.; Martín, D.; Khatami, S.S. An Evolutionary Deep Reinforcement Learning-Based Framework for Efficient Anomaly Detection in Smart Power Distribution Grids. Energies 2025, 18, 2435. [Google Scholar] [CrossRef] [Scilit]
- Shen, X.; Shi, G.; Ren, H.; Zhang, W. Biomimetic Vision for Zoom Object Detection Based on Improved Vertical Grid Number YOLO Algorithm. Front. Bioeng. Biotechnol. 2022, 10, 905583. [Google Scholar] [CrossRef] [Scilit] [PubMed]
- He, B.; Mo, W.; Hu, J.; Yang, G.; Lu, G.; Liu, Y. Development of Power Grid Web3D GIS based on Cesium. In Proceedings of the 2016 IEEE PES Asia-Pacific Power and Energy Engineering Conference (APPEEC), Xian, China, 25–28 October 2016; pp. 2465–2469. [Google Scholar]
- Feng, X.; Han, J.; Liu, Y.; Hou, R.; Li, T. Dual-Scale Dataset-Based Intelligent Recognition of Power Equipment for Enhanced Digital Grid Planning. Trait. du Signal 2024, 41, 919–927. [Google Scholar] [CrossRef] [Scilit]
- Aghahadi, M.; Bosisio, A.; Merlo, M.; Berizzi, A.; Pegoiani, A.; Forciniti, S. Digitalization Processes in Distribution Grids: A Comprehensive Review of Strategies and Challenges. Appl. Sci. 2024, 14, 4528. [Google Scholar] [CrossRef] [Scilit]
- Gürcan, F.; Berigel, M. Real-Time Processing of Big Data Streams: Lifecycle, Tools, Tasks, and Challenges. In Proceedings of the 2018 2nd International Symposium on Multidisciplinary Studies and Innovative Technologies (ISMSIT), Ankara, Turkey, 19–21 October 2018; pp. 1–6. [Google Scholar]
- Villarreal, R.; Chamorro-Solano, S.; Vega-Sampayo, Y.; Espejo, C.A.; Cantillo, S.; Gaviria, L.; Paez, J.; Ochoa, C.; Moreno, S.; Polo, C.; et al. A New Approach to Electrical Fault Detection in Urban Structures Using Dynamic Programming and Optimized Support Vector Machines. Sensors 2025, 25, 2215. [Google Scholar] [CrossRef] [Scilit]
- Pérez-García, J.M.; Eguía, P.; Perea Olabarria, E.; Pujana, A.; Gyftakis, K.N.; Guerrero, J.M. Diagnosis and protection of ground fault in electrical systems: A comprehensive analysis. IEEE Access 2025, 13, 189150–189176. [Google Scholar] [CrossRef] [Scilit]
- Demir, S.; Yomralioglu, T. Bridging Geo-Data and Natural Gas Pipeline Design Standards: A Systematic Review of BIM-GIS Integration for Natural Gas Pipeline Asset Management. Energies 2024, 17, 2306. [Google Scholar] [CrossRef] [Scilit]
- Bae, C.; Choi, E.; Lee, S. Technologies, applications, and challenges of digital twin across industries: A systematic review of the state-of-the-art literature. IEEE Access 2025, 13, 152843–152869. [Google Scholar]
- Sleiti, A.K.; Kapat, J.S.; Vesely, L. Digital twin in energy industry: Proposed robust digital twin for power plant and other complex capital-intensive large engineering systems. Energy Rep. 2022, 8, 3704–3726. [Google Scholar] [CrossRef] [Scilit]
- Kukushkin, K.; Ryabov, Y.; Borovkov, A. Digital Twins: A Systematic Literature Review Based on Data Analysis and Topic Modeling. Data 2022, 7, 173. [Google Scholar] [CrossRef] [Scilit]
- Jalali, M.; Alizadeh-mousavi, O. Application of Real-Time Distribution Grid Monitoring for Grid Forecasting and Control Considering Incomplete Information of Resources Behind-the-Meter. IEEE Open Access J. Power Energy 2022, 9, 308–318. [Google Scholar] [CrossRef] [Scilit]
- Syed, T.A.; Siddiqui, M.S.; Abdullah, H.B.; Jan, S.; Namoun, A.; Alzahrani, A.; Nadeem, A.; Alkhodre, A.B. In-Depth Review of Augmented Reality: Tracking Technologies, Development Tools, AR Displays, Collaborative AR, and Security Concerns. Sensors 2023, 23, 146. [Google Scholar] [CrossRef] [Scilit]
- Khosravi, N.; Çelik, D.; Bevrani, H.; Echalih, S. Microgrid stability: A comprehensive review of challenges, trends, and emerging solutions. Int. J. Electr. Power Energy Syst. 2025, 170, 110829. [Google Scholar] [CrossRef] [Scilit]
- Latif, A.; Saim, A.; Houari, A.; Djerioui, A. State-of-the-art of hierarchical microgrid technological framework: Operational strategies with manifold barriers and future trajectories. Renew. Energy Focus 2025, 55, 100743. [Google Scholar] [CrossRef] [Scilit]
- Gao, J.; Luo, J.; Yin, S.; Gong, C.; Wang, S.; Zhang, G. Adaptive Digital Twin Framework for PMSM Thermal Safety Monitoring: Integrating Bayesian Self-Calibration with Hierarchical Physics-Aware Network. Machines 2026, 14, 138. [Google Scholar] [CrossRef] [Scilit]
- Wang, X.; Wang, L.; Yu, Y.; Ao, Z.Q.; Sun, L.Y. Survey on Characteristics, Architecture and Applications of Digital Twin Power Grid. J. Electron. Inf. Technol. 2022, 44, 3721–3733. [Google Scholar]
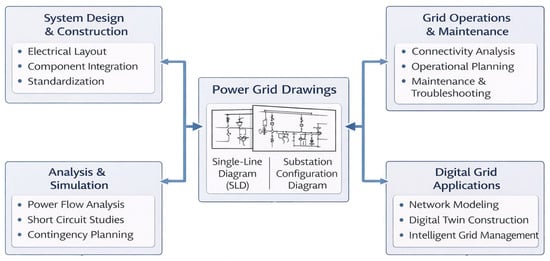
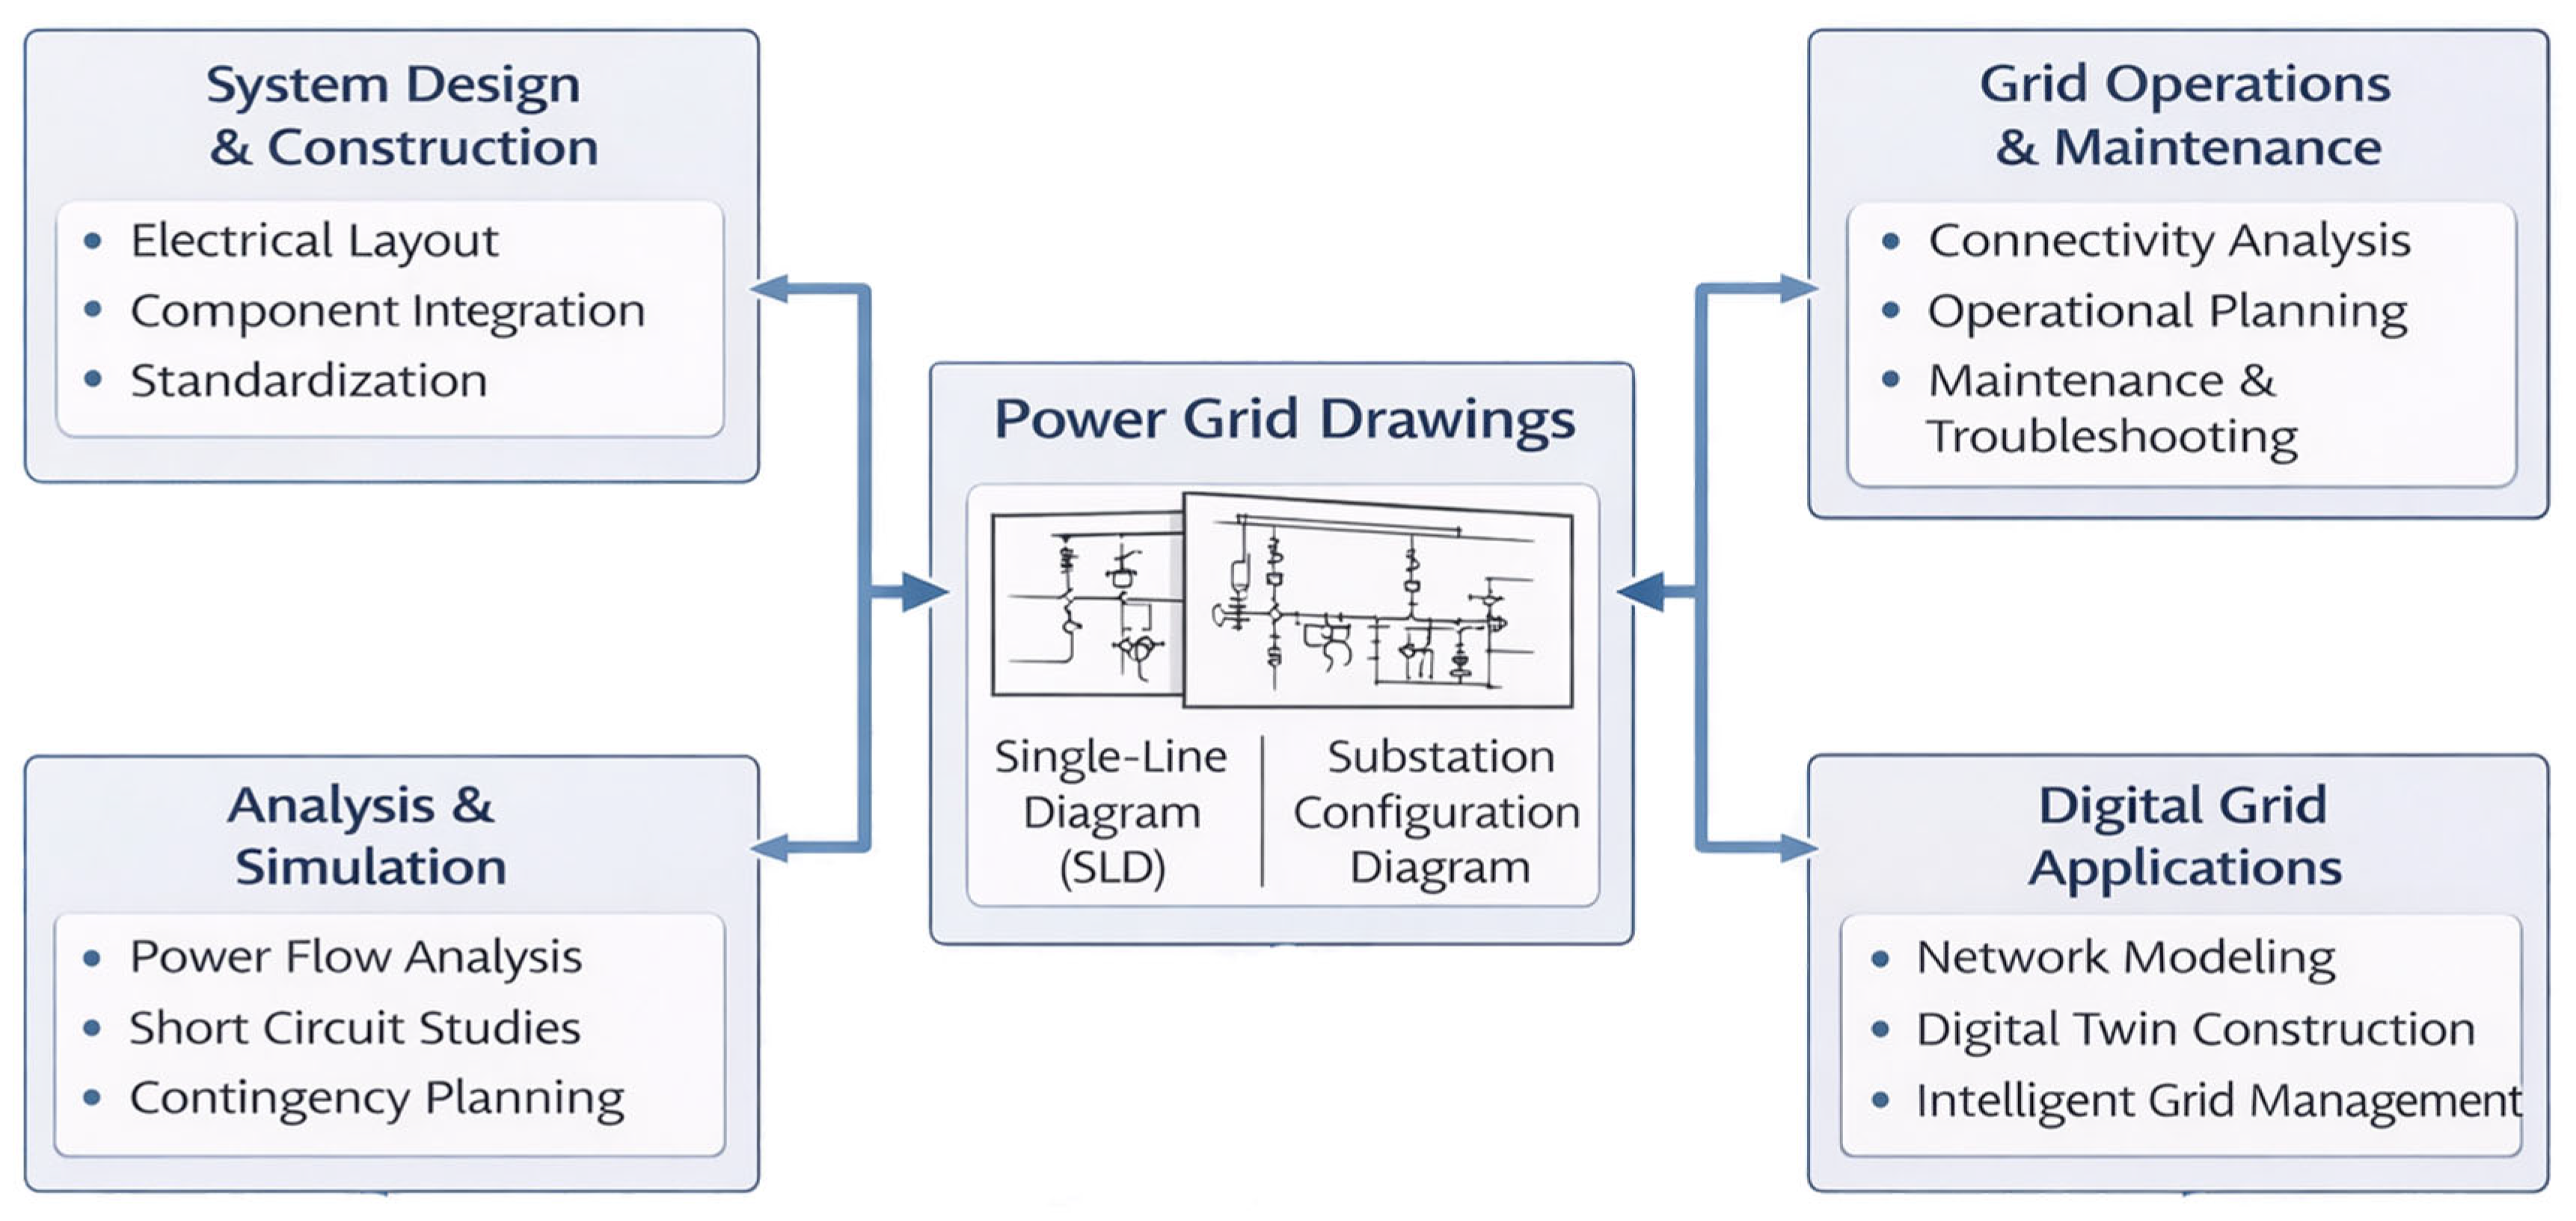
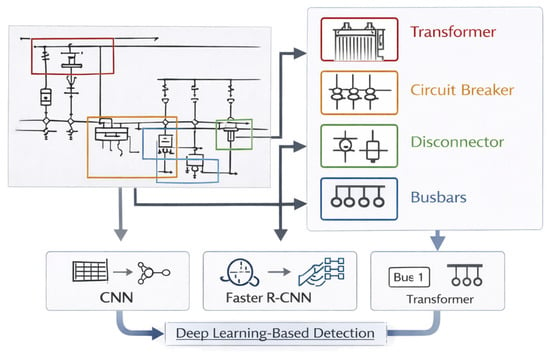
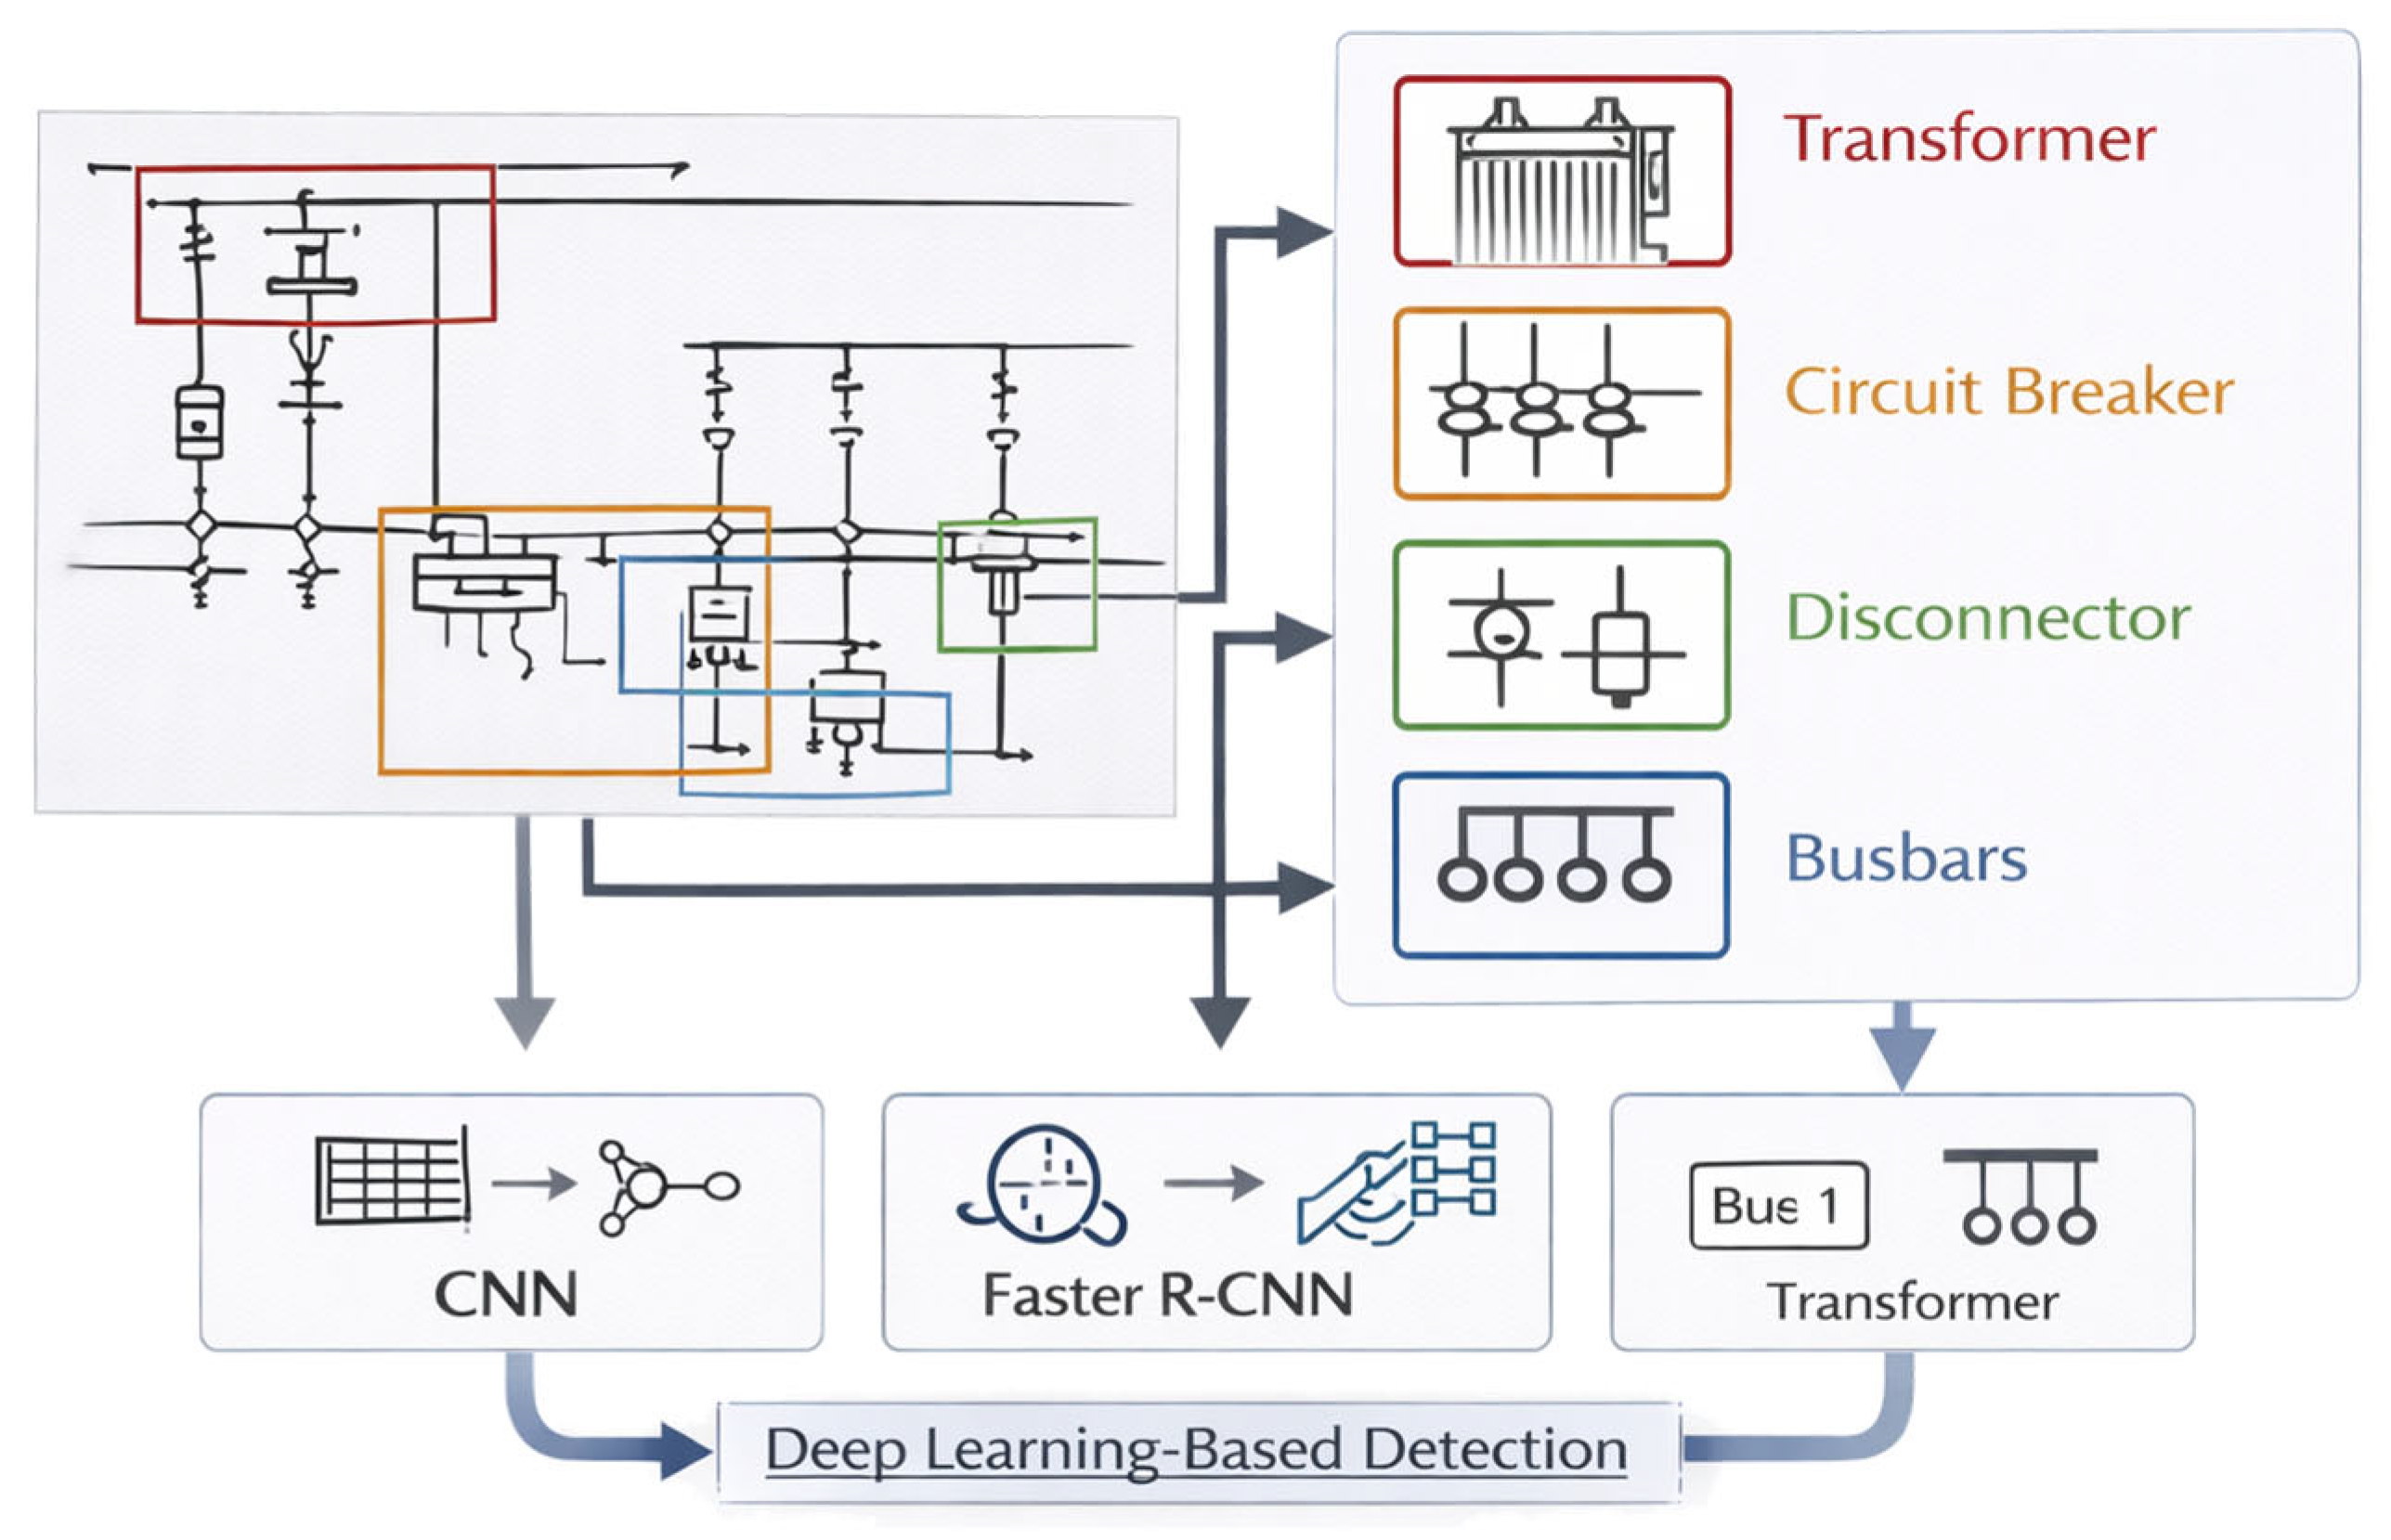
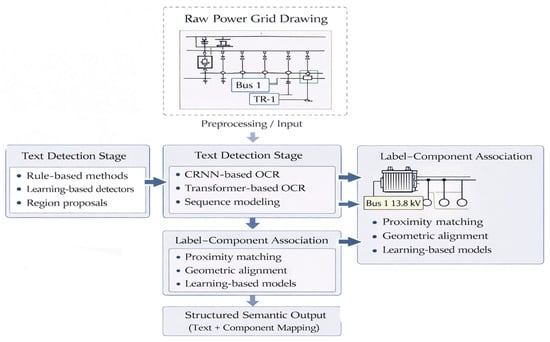
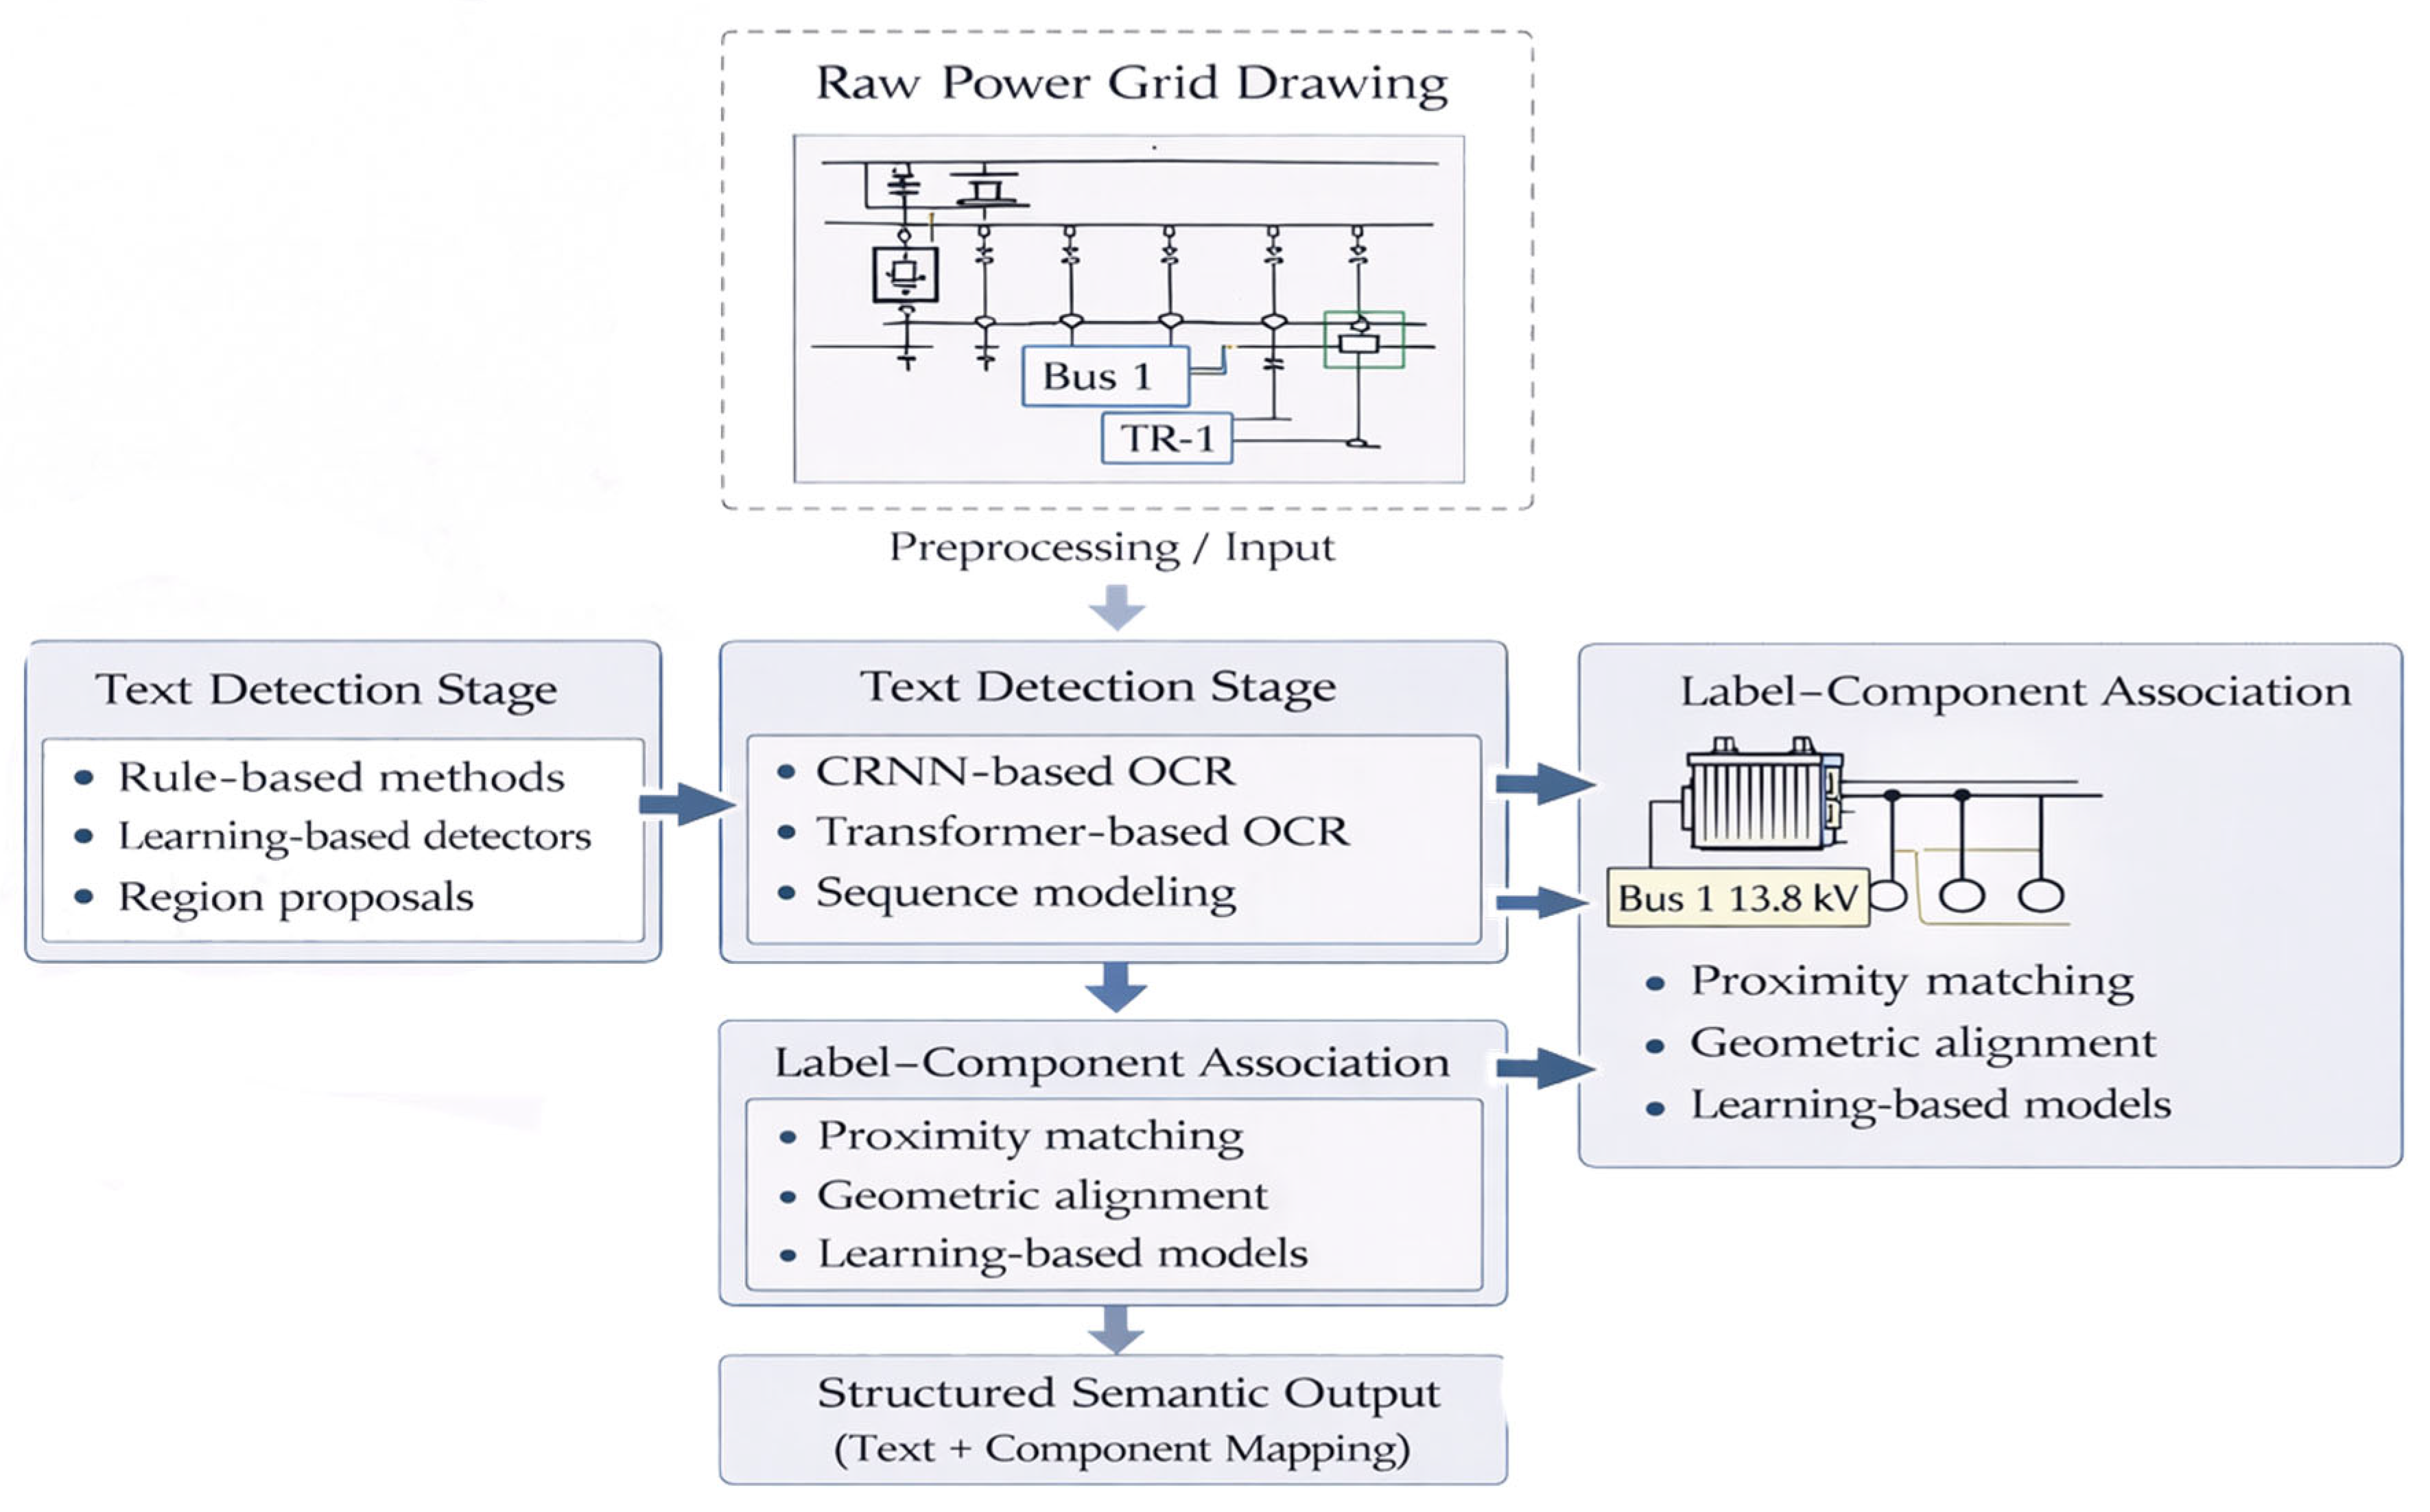
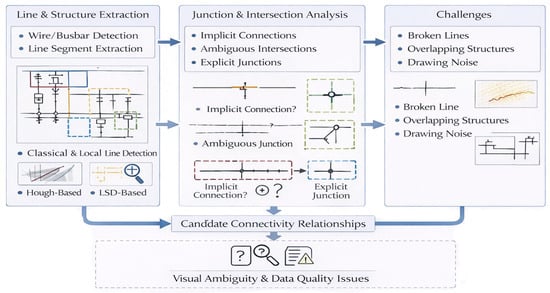
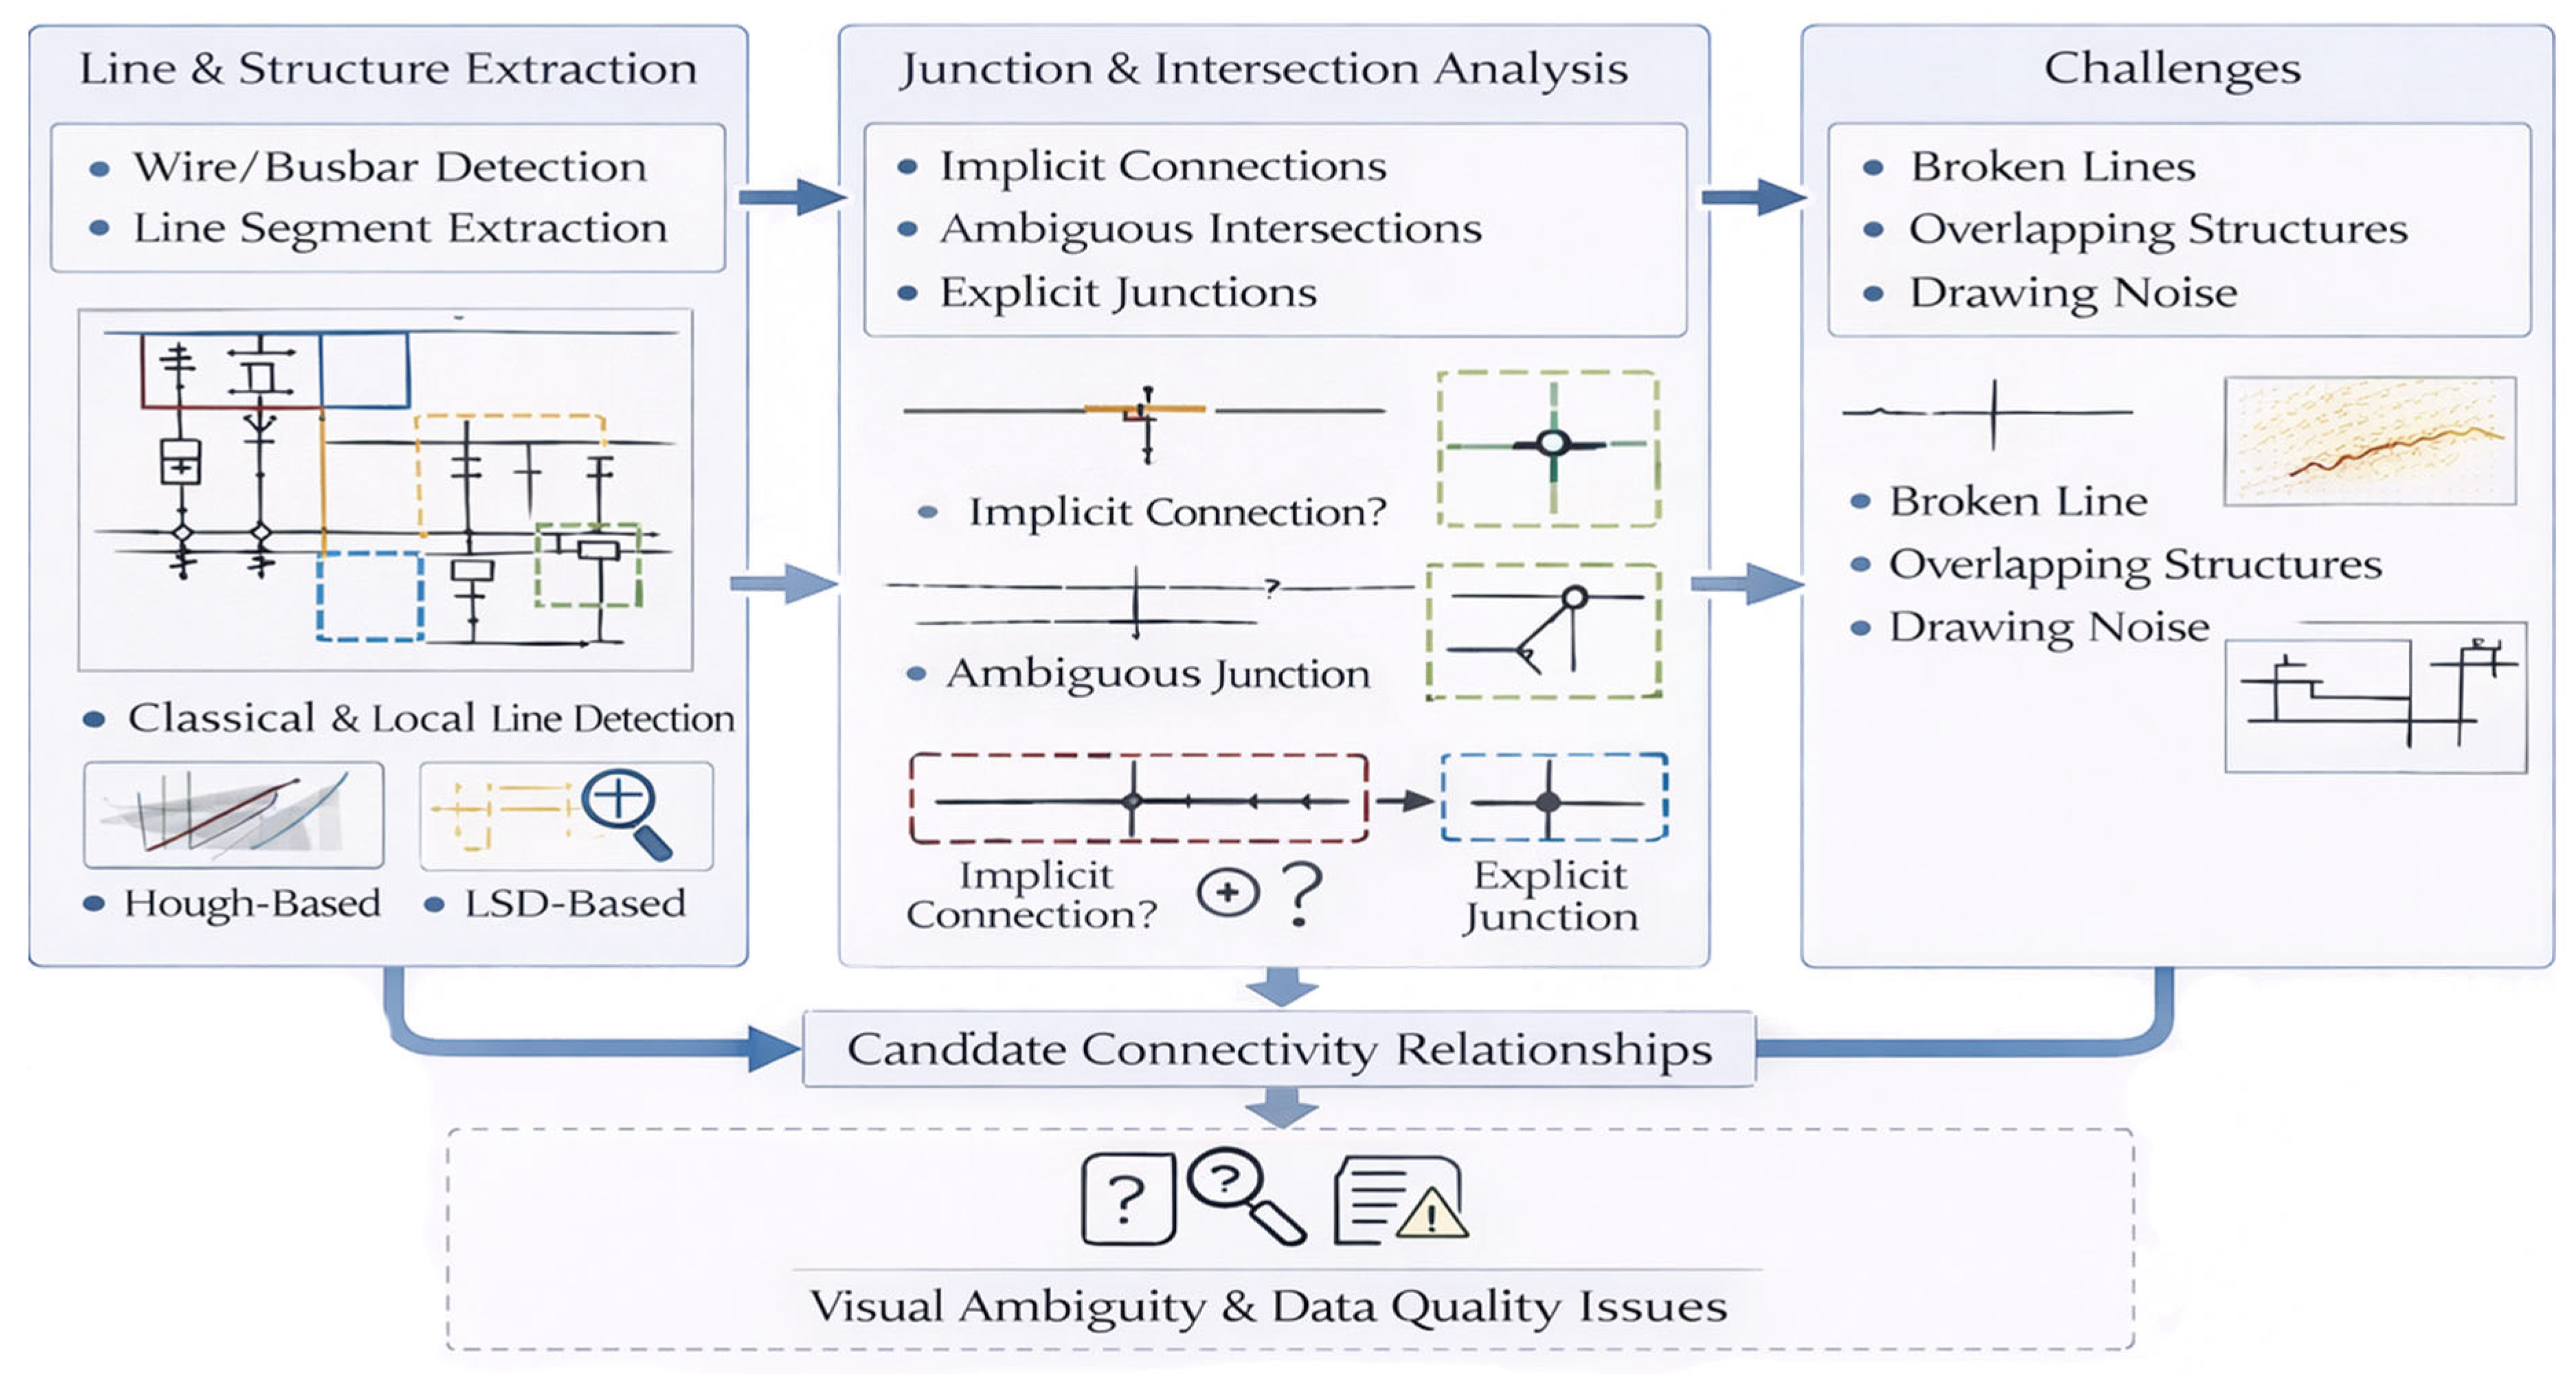
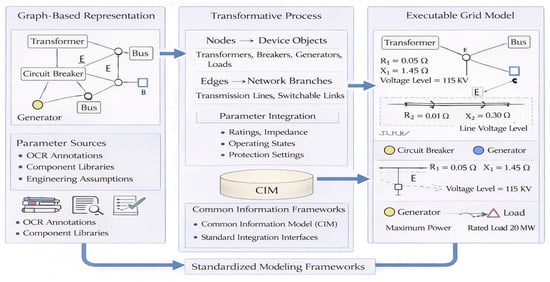
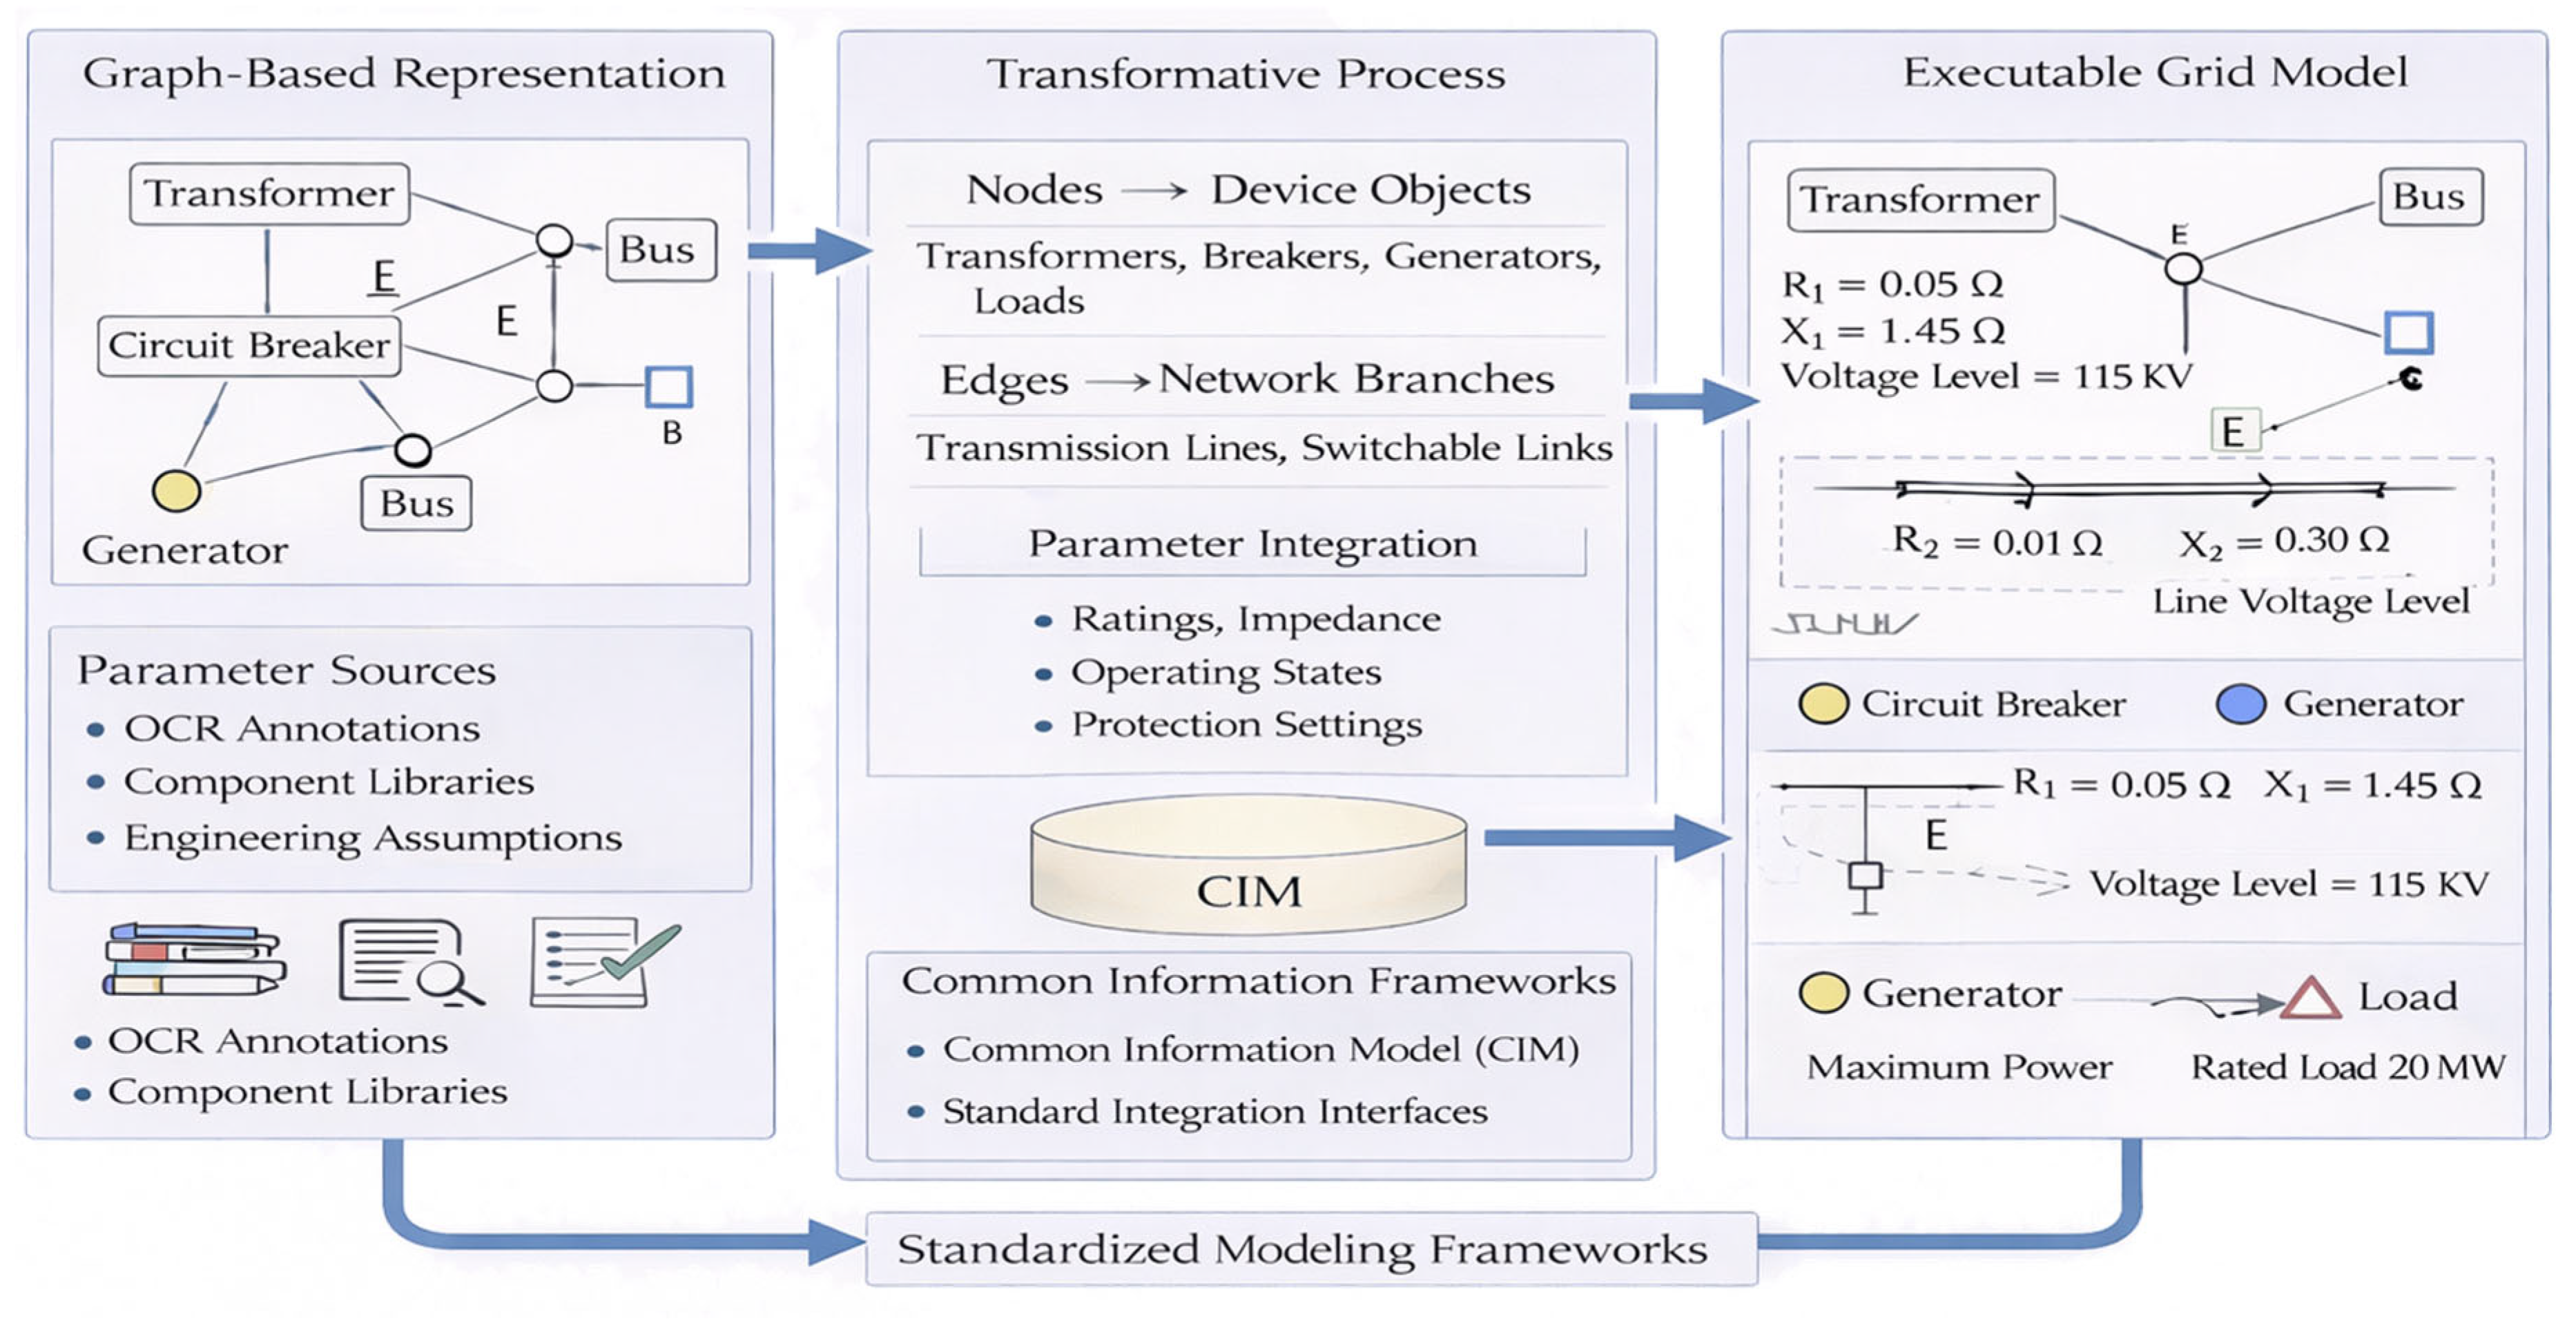
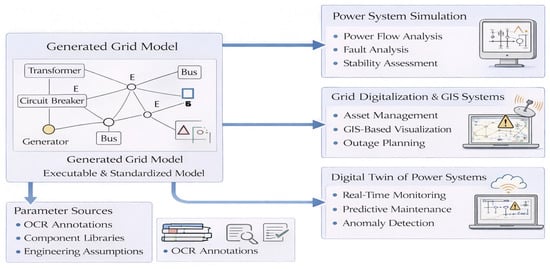
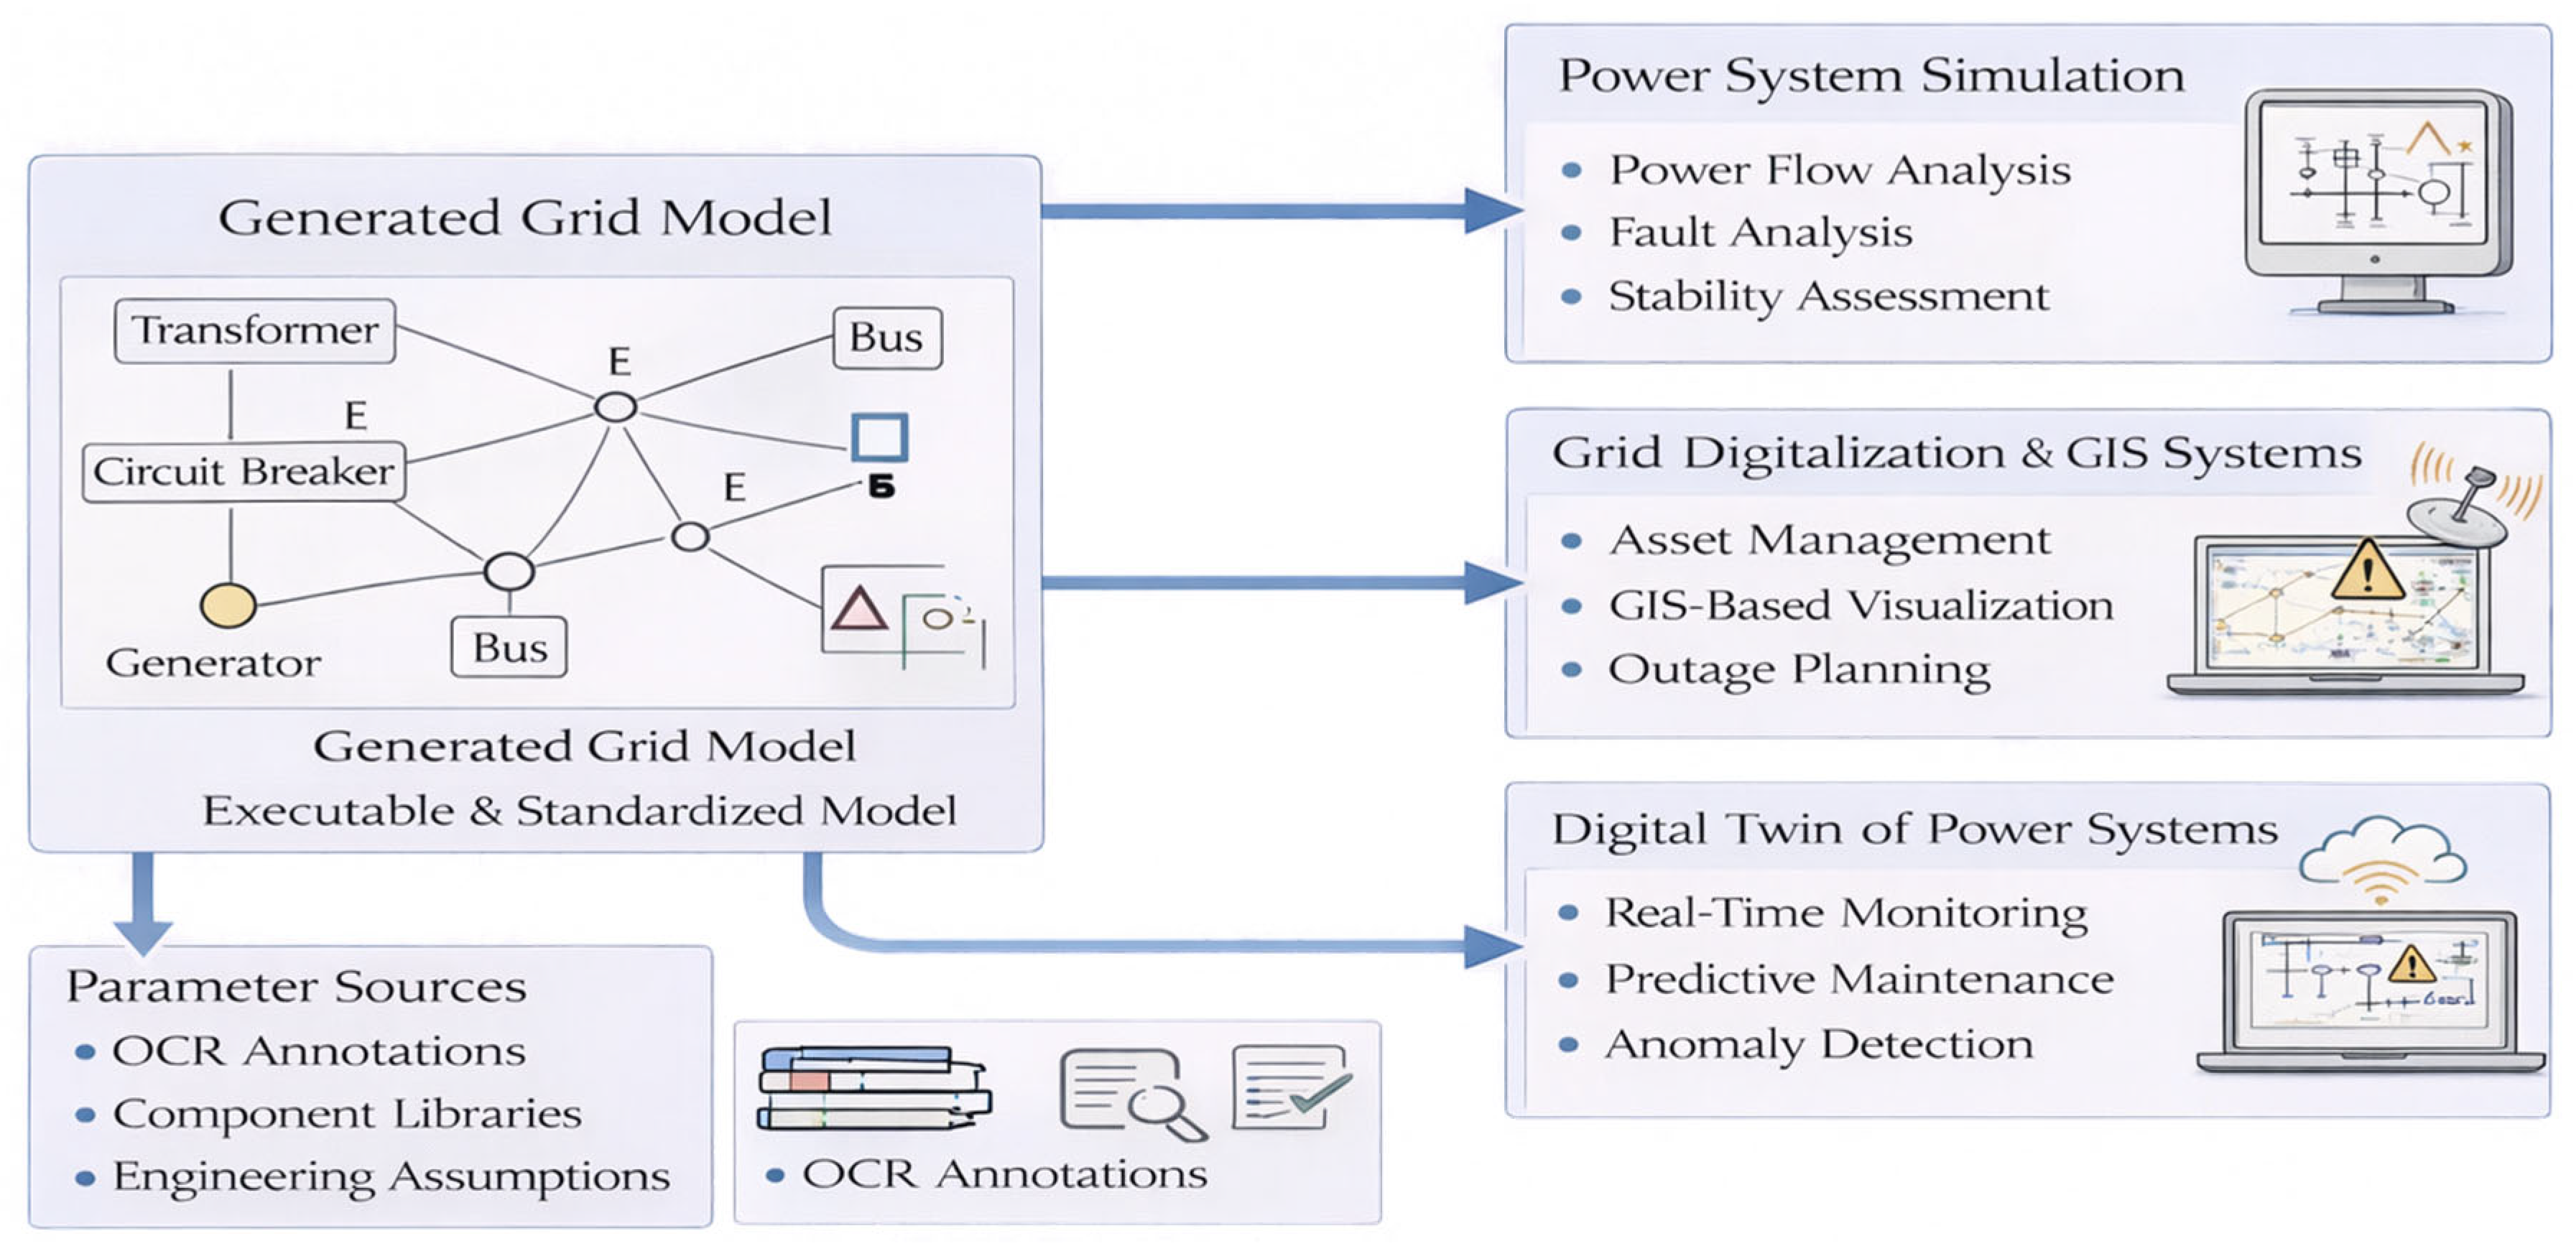

Disclaimer/Publisher’s Note: The statements, opinions and data contained in all publications are solely those of the individual author(s) and contributor(s) and not of MDPI and/or the editor(s). MDPI and/or the editor(s) disclaim responsibility for any injury to people or property resulting from any ideas, methods, instructions or products referred to in the content. |
© 2026 by the authors. Licensee MDPI, Basel, Switzerland. This article is an open access article distributed under the terms and conditions of the Creative Commons Attribution (CC BY) license.