Article

Effective Compensations for Disability: Results from a Usability Evaluation of an Assistive Robot Among Spinal-Cord-Injured Users
ECE and Psychology, University of Central Florida, Orlando, FL 32816, USA
*
Author to whom correspondence should be addressed.
Machines 2026, 14(2), 174; https://doi.org/10.3390/machines14020174
Submission received: 25 April 2025 / Revised: 12 January 2026 / Accepted: 22 January 2026 / Published: 3 February 2026

Abstract

Wheelchair-mounted robotic arms (WMRAs) are assistive manipulators designed to increase the functional independence of individuals with limitations in the upper and lower extremities. While previous research has identified several visual, cognitive, and physical abilities that facilitate optimal operation of such a device, these have yet to be accounted for when designing the human–robot interface. This study investigates whether interface-level compensations can improve usability and support more personalized control across users with different abilities. Five interface compensations were implemented and evaluated: object highlighting, move suggestions, slowing near objects, a one-click approach, and a level indicator. A user study was conducted among individuals with spinal cord injury as well as able-bodied younger and older adults serving as comparison groups. Evaluations of task performance metrics, perceived WMRA usability, and user experience were conducted. The results indicate that younger adults achieved the highest task efficiency, followed closely by participants with spinal cord injury, with both groups reporting good-to-excellent usability, whereas older adults showed lower efficiency and rated the system as having fair usability. The one-click automated object approach feature was identified as the most useful compensation among all participant groups. Overall, participant feedback indicated that spatial visualization and spatial orientation were the most important individual differences affecting the operation of the arm.

1. Introduction

Millions of Americans rely on assistive mobility devices (e.g., wheelchairs and scooters) as a way to increase their functional independence. Yet, a majority of these users require additional assistance in completing instrumental activities of daily living (IADLs) [1]. These activities include everyday tasks, such as retrieving a remote from the ground, a glass from a table, or a book from a high shelf of a bookcase [2]. Many turn to caregiver support to address these issues, though it presents several drawbacks. In-home caregiver support can be costly and does not increase user functional independence, which has been associated with improvements in quality of life [3]. A more suitable solution is to augment a user’s functional capability with a mobile assistive robot, such as a wheelchair-mounted robotic arm (WMRA).
WMRAs have been in use for over 40 years [4]. While technological improvements over the years have led to size and weight reductions, their basic design has remained relatively unchanged. A typical WMRA is composed of multiple arms segments which end in a gripper or “hand” that is used to grab and manipulate objects at a distance. These multiple segments require control of several degrees of freedom (e.g., six degrees of freedom may indicate three translational directions—front/back, left/right, and up/down—and three rotational movements—roll, pitch, and yaw) in order to locate the end-effector with arbitrary orientation in 3D space. Common control devices include joysticks and touchscreens. As users cannot always directly observe the object they wish to retrieve, a camera-in-hand is mounted on the WMRA, and the video feed is relayed to the user’s display.
Operation of such a device may be difficult for users who have sensory and upper-body mobility limitations, which are common across several disability conditions (e.g., spinal cord injury) [5]. This has led to designing WMRA systems to be increasingly automated in performing ADLs for the user [6,7,8,9,10,11]. Although automation can reduce the need for user control, individuals with disabilities often prefer to maintain autonomy by directly controlling the robot. In a three-week user study, Kim et al. evaluated the relationship between autonomy, performance, and user satisfaction in individuals with spinal cord injury using an assistive robotic manipulator. Their results showed that while higher levels of automation could improve objective task performance in some cases, increased autonomy did not consistently lead to higher user satisfaction. Several participants expressed a preference for retaining direct control over the robot, highlighting the importance of perceived autonomy and user involvement in an assistive robotic system [12]. In a follow-up and more comprehensive study, Kim et al. systematically evaluated multiple autonomy levels in an assistive robotic arm among spinal-cord-injured users. The study demonstrated that higher robot autonomy could improve task efficiency, but users often preferred lower or shared autonomy modes that allowed them to remain actively involved in control. The authors found that perceived control and autonomy were strongly linked to user satisfaction, even when fully autonomous modes performed better objectively. These findings emphasize that users with disabilities value maintaining control over assistive robots rather than relinquishing it entirely to automation [13].
Usability remains a persistent challenge due to the need for precise control of multiple degrees of freedom and reliance on indirect visual feedback via camera-in-hand systems. A more effective approach is for the robot to collaborate with the user. Recent research has shifted toward shared autonomy and semi-autonomous control to reduce cognitive and physical demands. For instance, Styler et al. demonstrated that a vision-guided shared-control system significantly reduced task time and mental workload in kitchen-based tasks, although roughly half of the participants still preferred manual joystick control for greater autonomy [14]. Alternative control modalities—including chin-joysticks, eye-gaze, and keypads—have shown high precision and accessibility in healthy participants, but they do not address cognitive or spatial challenges, nor have they been tested thoroughly with SCI users [15]. Similarly, Liu et al. proposed a laser-pointing affordance interface that was evaluated on a robotic platform rather than human participants. The system achieved an ~85% reduction in limb movement time and high object selection accuracy, though its effectiveness with actual users, including those with SCI, remains untested [16]. For a more exhaustive literature survey, we refer the readers to [17,18,19,20,21,22,23]. Collectively, these studies rarely isolate compensatory interface features (e.g., object highlighting, slowing near objects, movement suggestions, and one-click approaches), evaluate performance across diverse populations, or consider how cognitive and spatial abilities influence user performance.
Leveraging previous research on telerobotics [24,25,26,27], our previous research identified individual differences across several visual, cognitive, and physical abilities which were associated with people’s ability to complete simulated ADLs [28,29]. Higher levels of processing speed, spatial ability, working memory, dexterity, and visual ability led to decreases in time-on-task and the number of moves required to execute an ADL. While taking longer to complete a particular task is not in itself a marker of reduced performance, it may lead to the user feeling less effective and less independent when completing ADLs. Users may be less likely to rely on this technology when multiple objects must be retrieved, such as during grocery shopping. Thus, individuals’ functional independence may still be reduced.
The present study examined human–robot interface compensations grounded in established theories of human–robot interaction, including shared and adjustable autonomy, cognitive load theory, situation awareness, and sense of agency [30,31,32,33,34,35]. These compensations—interface features designed to mitigate sensory, cognitive, and physical limitations—aim to reduce perceptual and mental workload while preserving user autonomy and active involvement in control. In particular, object highlighting and motion slowing near objects align with cognitive load theory by reducing visual search demands and decision-making complexity [30,31], whereas move suggestions and one-click automated object approach reflect shared autonomy principles by assisting task execution without removing user initiation or authority [32,33]. The level indicator provides continuous feedback that supports spatial awareness and reinforces perceived control during manipulation tasks [34], while design choices that maintain user initiation and feedback loops contribute to a stronger sense of agency [35]. Quantitative and qualitative metrics were analyzed across three participant groups to evaluate both objective performance differences and perceived usability benefits, enabling assessment of how these theoretically motivated compensations support effective human–robot collaboration across diverse user populations.
The remainder of the paper is organized as follows: Section 2 goes over the initial choice of human factors, technical details of the human–robot interface compensations, experimental setup, methodology, and performance metrics for the study. Section 3 describes the quantitative results and the determination of the important human factors. Section 4 focuses on usability and user experience evaluation using a grounded theory analysis based on quantitative and qualitative user data collected from the participants. Finally, Section 5 concludes the paper with a discussion of the current research and direction for future work.

2. Methods

2.1. Participants

Eight participants with spinal cord injury (SCI), including three females, aged 29 to 54 (M = 39.75, SD = 9.84), completed the study. One additional participant did not complete the second study session due to scheduling difficulties. SCI participants were recruited from SCI resource and support groups, rehabilitation centers, and sports organizations in the Greater Orlando area. To qualify for the study, participants needed to be clinically diagnosed with a spinal cord injury between C3 and C7 and be at least 90 days post-injury.
Twenty able-bodied young adults (YA), 10 females, aged 18 to 30 (M = 20.95, SD = 3.95), acted as a baseline group. Three additional participants did not complete the study: two had technical issues with the WMRA, and one did not return for the second study session. YA participants were recruited via the University of Central Florida’s (UCF) SONA Psychology Research Participation System and received class credit for each study session completed.
Twenty able-bodied older adults (OA), 10 females, aged 54 to 90 (M = 73.75, SD = 10.10), also completed this study. OA were included in this study since aging is generally accompanied by a decline in many of the individual differences identified as being important for optimal operation of the WMRA [28,29]. An additional nine older adults did not complete the study: five had technical issues with the robotic arm, and four did not score a minimum of 26 on the Montreal Cognitive Assessment (MoCA) [36]. OA participants were recruited from the Greater Orlando area through the Learning Institute for Elders (LIFE) at UCF and through an OA research volunteer database created and maintained by UCF research labs. SCI and OA received USD 15 compensation per completed session.

2.2. Materials

(1) Questionnaires and Assessment Tools: A short demographics questionnaire was used to record information regarding age, gender, and education level. For SCI participants, information regarding the year of injury and the vertebrae affected was also collected.
Table 1 lists the individual differences measured and corresponding assessments. The following cognitive abilities were included in the individual differences: (a) processing speed or the speed of visual processing; (b) working memory as the capacity to temporarily hold mental information; (c) spatial visualization as the ability to mentally transform a perceived object; and (d) spatial orientation which refers to the ability to imagine different viewpoints of a scene. As part of a larger series of studies, additional individual differences were measured but not included in the present analysis.
A three-item questionnaire was used to assess participants’ experience with each compensation, including any likes or dislikes. The 10-item System Usability Scale (SUS) [42] assessed perceived usability of the robotic arm system. The items were adapted for the current study (i.e., “robot arm” replaced “robot”). Participants were asked to rate the items (e.g., “I thought the robot arm was easy to use”) on a five-point scale from strongly disagree to strongly agree. A concluding six-item questionnaire was used to obtain additional feedback regarding the compensations and the overall system.
(2) Robotic Arm and Control Modalities: The UCF-MANUS is a six-degrees-of-freedom assistive robotic manipulator modified from the commercially available ARM from Exact Dynamics, Inc. (Didam, The Netherlands). The robotic arm has a lifting capacity of 2.041 kg and a reach of 0.8 m. The interface has been modified over several generations of the UCF-MANUS to be more inclusive [8,43]. The arm was controlled by a touchscreen GUI or a 3D mouse [44]. The software for the robot ran on a Windows computer and automatically recorded and time-stamped all movements of the arm.
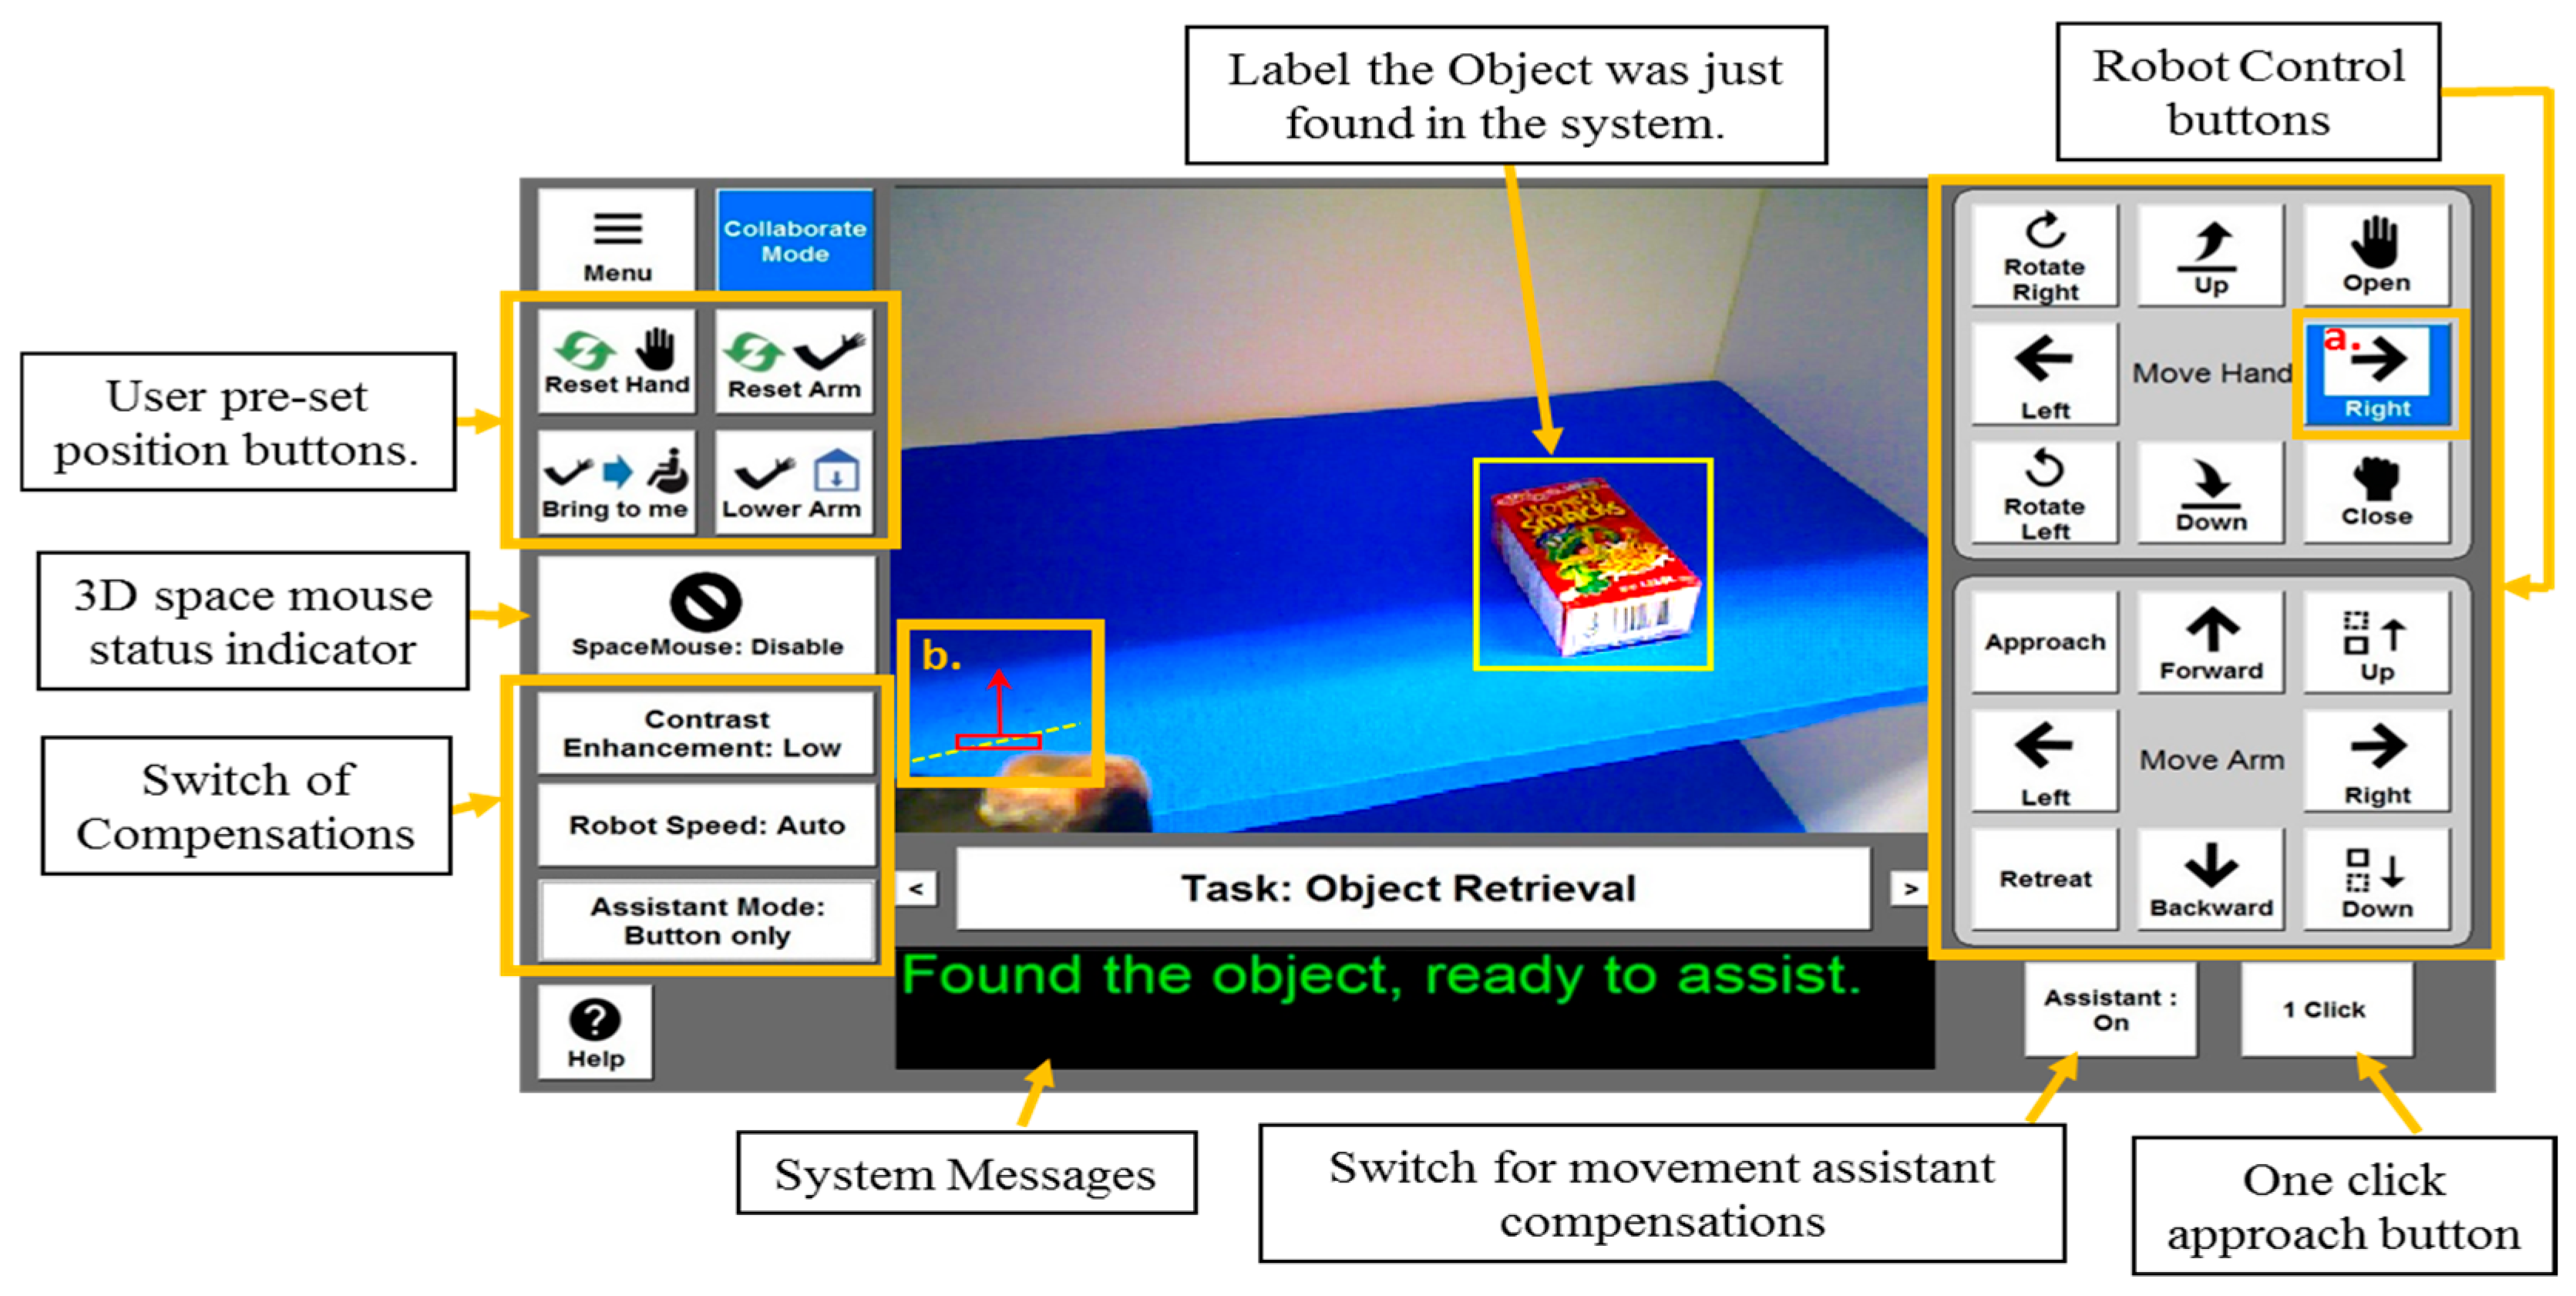
As shown in Figure 1, the GUI included a view from a camera mounted on the robotic arm gripper, a feedback panel, and touchscreen buttons for controlling the movements of the arm. To ensure safety, every motion button had to be continuously latched to keep the robot moving. The GUI ran on a TOGUARD portable monitor, 10.1 Inch touchscreen IPS HD 1280 × 800. The 3D mouse was a six-degrees-of-freedom SpaceMouse [44] designed for work with computer-aided design programs. Robot arm movements were mapped to individual movements with the mouse. For example, moving the mouse forward resulted in the robot arm moving forward.
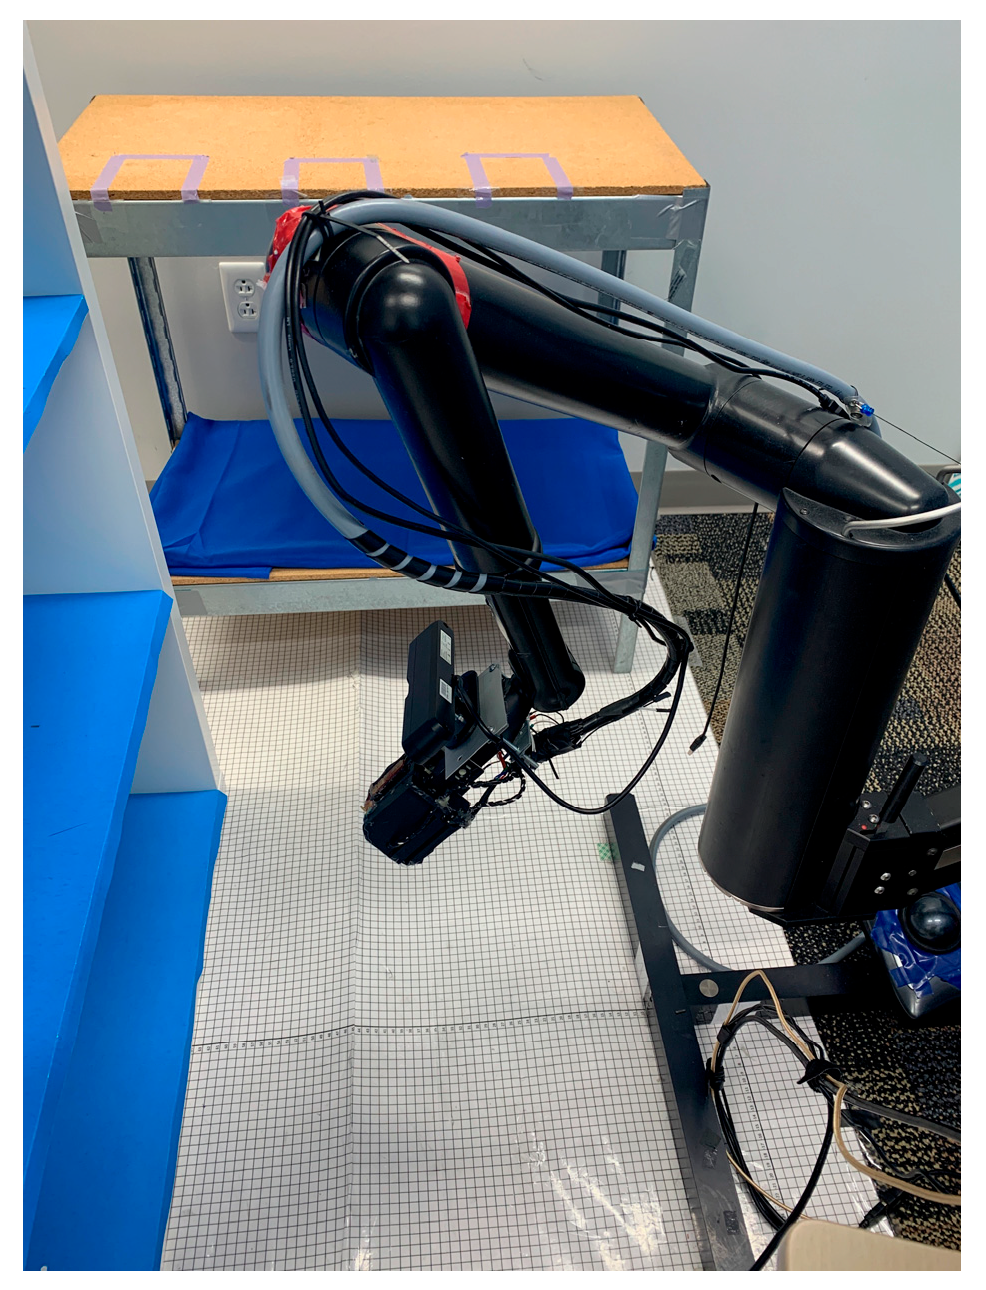
Participants were seated to the left of the base of the robot to mimic use as if the arm was attached to a wheelchair. OA and YA sat on a chair while SCI participants were able to maneuver their wheelchairs into the same position. A small rolling tray table fits under the legs of the chair to create a similitude of a tray table placed on the right arm of a wheelchair. The touchscreen and 3D mouse were affixed to the table with Velcro. If more comfortable for SCI participants, a lap tray topped with a non-slip cover was used to hold the touchscreen. As shown in Figure 2, a bookshelf with four shelves was placed in front of the robot. The top shelf was divided into two cubes, and the view of the top right cube was obstructed by a barrier created from a poster board in order to force the users to utilize the live camera view projected on the GUI. A small stand placed in the top-right cube allowed for a box to be placed at a 45° angle. A small table was placed to the right of the robot. Tape was used to create three “target areas” on the top of the table.
(3) Compensations: Five compensations were included in the study. The compensations were turned on and off via the touchscreen GUI.
(a) Move suggestions provided auditory and visual suggestions as to the next direction the arm could be moved to reach an object. Visual suggestions were given through highlighting the suggested button on the GUI (e.g., see the button highlighted in blue in Figure 1). An in-built gripper navigation function was utilized to plan in real time the sequence of motion from the current state to the final state while keeping the object in the camera’s field of view during execution of the motion. The suggestion feature was initiated 2.5 s after the last movement initiated by the user ceased. These suggestions could aid users with spatial visualization and orientation difficulties who may be hindered in planning arm movements. Additionally, those with lower working memory may feel a decreased workload in operating the arm.
(b) One-click to approach was a GUI button that, when activated, automatically moved the arm toward the object and alerted the user when the object was within the gripper’s reach and ready for grasping. This feature may assist users with reduced processing speed or working memory, who might struggle to perform multiple successive movements while retaining task parameters. Additionally, reducing the number of control movements may aid users who have dexterity deficits.
To obtain an optimal grasp gesture, an algorithm developed in-house [44] detected graspable edge pairs (such as two opposite edges of a box surface) and selected the optimal pair by ranking their features, such as edge length and the orientation of the fitted surface. Finally, a collision-free path was generated [45] and carried out. The target object remained in the field of view [46] throughout the approach path.
(c) Object highlighting equalized the histogram (i.e., showed pixels in the view at different brightness), to change the brightness of the foreground and background [46], thus enhancing contrast [47] in the camera view. This feature may aid users with deficiencies in contrast sensitivity.
(d) Slowing near an object automatically reduced the speed of the arm when an object was detected nearby. Gripper-to-object distance was extracted from the depth image obtained by the gripper-mounted RGBD camera.
The reduction in speed could aid users with decreased processing speed abilities as it provides additional time for reaction and decision-making. Additionally, the feature may aid those with lower contrast sensitivity who have more difficulty seeing details within the environment or camera view.
(e) The level indicator was meant to provide an indication of the gripper position to aid users with deficiencies in spatial visualization and orientation abilities who may benefit from assistance to re-orient the gripper after multiple manipulations. Given feedback from many OA indicating a high degree of confusion with this indicator and that they largely ignored the feature, the use of this compensation was discontinued for YA and SCI participants.

2.3. Procedures

(1)
Assessments: Upon arrival on the first day, OA were screened with the MoCA and dismissed from the study if unable to score a minimum of 26. All participants completed the informed consent, demographics questionnaire, and personality questionnaire. Participants then completed the vision assessments. To avoid fatigue or order effects, YA and OA participants then completed the remaining assessments in randomized order.
The processing speed and working memory assessments were completed on a computer, while the spatial visualization and spatial orientation measures were performed with pen and paper. To limit excessive adjustments of the wheelchairs, lab equipment, and assistive writing or typing devices for SCI participants, the assessments were paired by modality. Pairs of assessments were performed in random order, and the assessments were presented randomly within each pair.
(2)
Tasks: Participants completed baselines for the two study tasks in randomized order.
Task TA was an object retrieval task meant to mimic grabbing an object from a high shelf, which may not be visible for a wheelchair user. Participants were instructed to grab a box from the top-right cube of the bookshelf, utilizing the camera view on the GUI. The box was on the stand and thus at an angle. Once the box was retrieved from the shelf, participants could look at the camera view or the robot and the box in order to bring the box to themselves. The task ended when the box was released from the robot into the hand of the participant or researcher standing next to the participant (as needed for SCI).
Task TB was a pick-and-place task that required participants to grab a square bottle from the second bottom shelf in front of them and then place the bottle in the middle target of the side table. No restrictions were placed on where the participant could look to achieve the task. The task ended when the bottle was released in the target area.
(3)
Compensations: The compensations were activated one at a time in random order. Participants were given a brief description of what had changed. For instance, with the move suggestion feature, participants were told that if there was a delay in choosing a movement, suggestions for the next movement would be offered on the screen and auditorily.
Contrast enhancement and the level indicator were features on the GUI and were therefore utilized with Task TA, which required the use of the camera view. Velocity reduction was also paired with Task TA, as the object retrieval portion of the task was more complex than for Task TB. The move suggestions and click-to-approach compensations required the object to be in view of the camera for the software to provide suggestions or plot a path. As such, these two compensations were always used to complete Task TB. After using each compensation, participants answered aloud to three items: “Did the addition of [compensation] change your experience using the robotic arm?”, “What did you like about [compensation]?”, “What did you dislike about [compensation]?”.
(4)
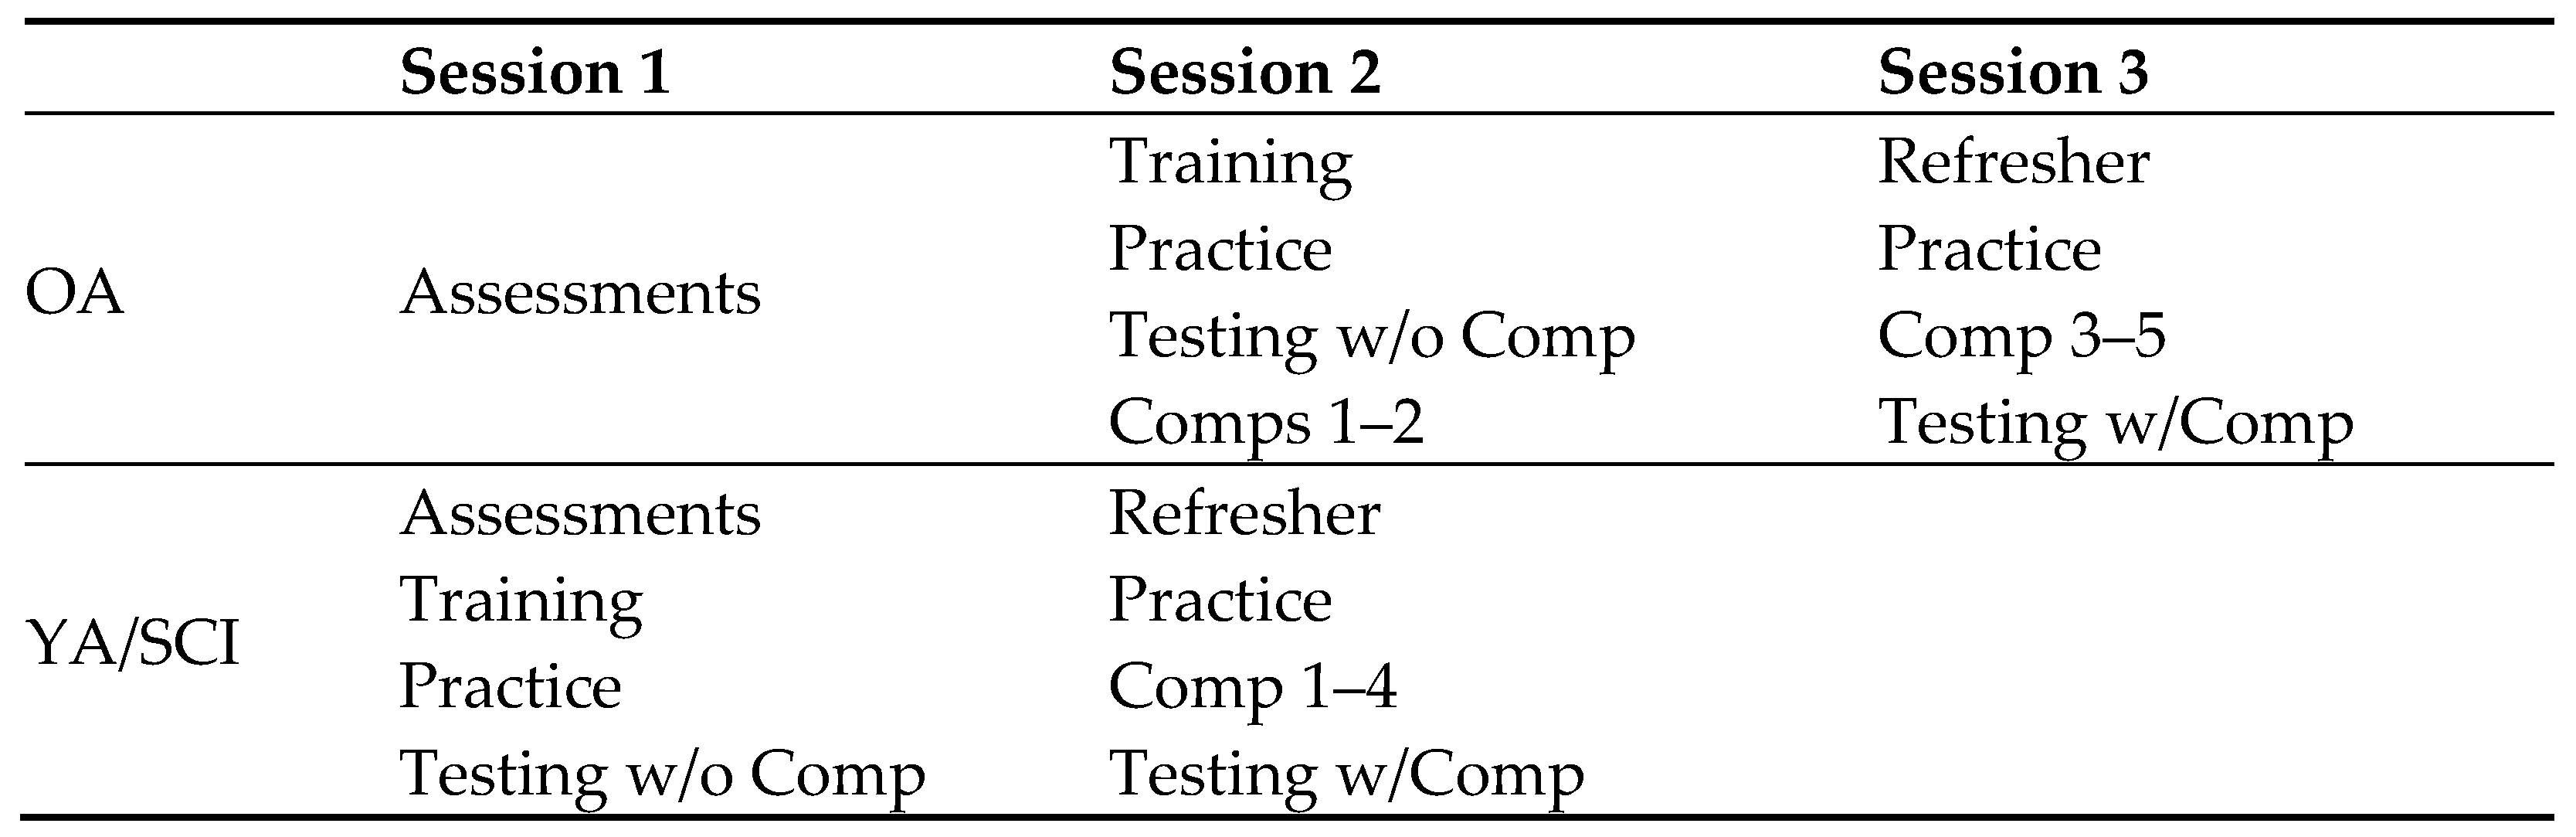
Study Details: On average, OA required more time to complete the individual difference assessments and therefore completed the robotic arm tasks during a second and third session, while SCI and YA completed the tasks in the first and second sessions, with each session lasting approximately one hour. Figure 3 outlines how the workload was broken down per session for each group.
OA and YA participants were randomly assigned to use the touchscreen or 3D mouse. Given the dexterity requirements of the mouse, all SCI participants used the touchscreen. Seven SCI participants were able to use their hand to press the touchscreen buttons, generally by pressing with the outer edge of the pinkie finger and knuckle. One SCI participant used a mouth-held stylus. For all tasks, participants were instructed not to stand up or move from the chair in any way. The camera view was to be used if participants could not see an object directly. The arm was returned to a pre-set starting position before each task. A researcher recorded the approximate start and end time for each movement, which was later used to calculate the exact time on each task and the number of moves, both of which were recorded automatically by the robotic arm software.
Participants were positioned next to the robotic arm setup, as shown in Figure 2. A brief introduction to the robot was followed by training in which the researcher demonstrated each button/mouse control and asked the participant to perform the same. A practice session followed the training, in which participants completed four object retrieval and placement tasks that together encapsulated all possible movements of the robotic arm. The participants were then given the opportunity to practice as they wished. No participant practiced for more than five minutes. This was followed by testing without compensation for tasks TA and TB in random order.
In the subsequent robotic arm session, a refresher of the controls was conducted in which the researcher briefly demonstrated the controls for the participant, with the participant then conducting the same movements. Participants also completed the same practice tasks as in the first robotic arm session. This was followed by an introduction to each of the compensations and subsequently testing Tasks TA and TB with the aid of compensations.
Finally, participants were asked to complete the SUS, and a six-item open-ended questionnaire was administered as follows. Participants were asked to identify which compensation they found most useful, as well as which compensation was least useful. Participants were then asked to describe what aspects of their experience gave them the most difficulty using the system, followed by three questions regarding suggestions to improve the system: “What features or functions should be added to the system?”, “What type of feedback would be useful to have from the system?”, and “How do you think the system could be improved overall?”.

3. Experimental Task Results

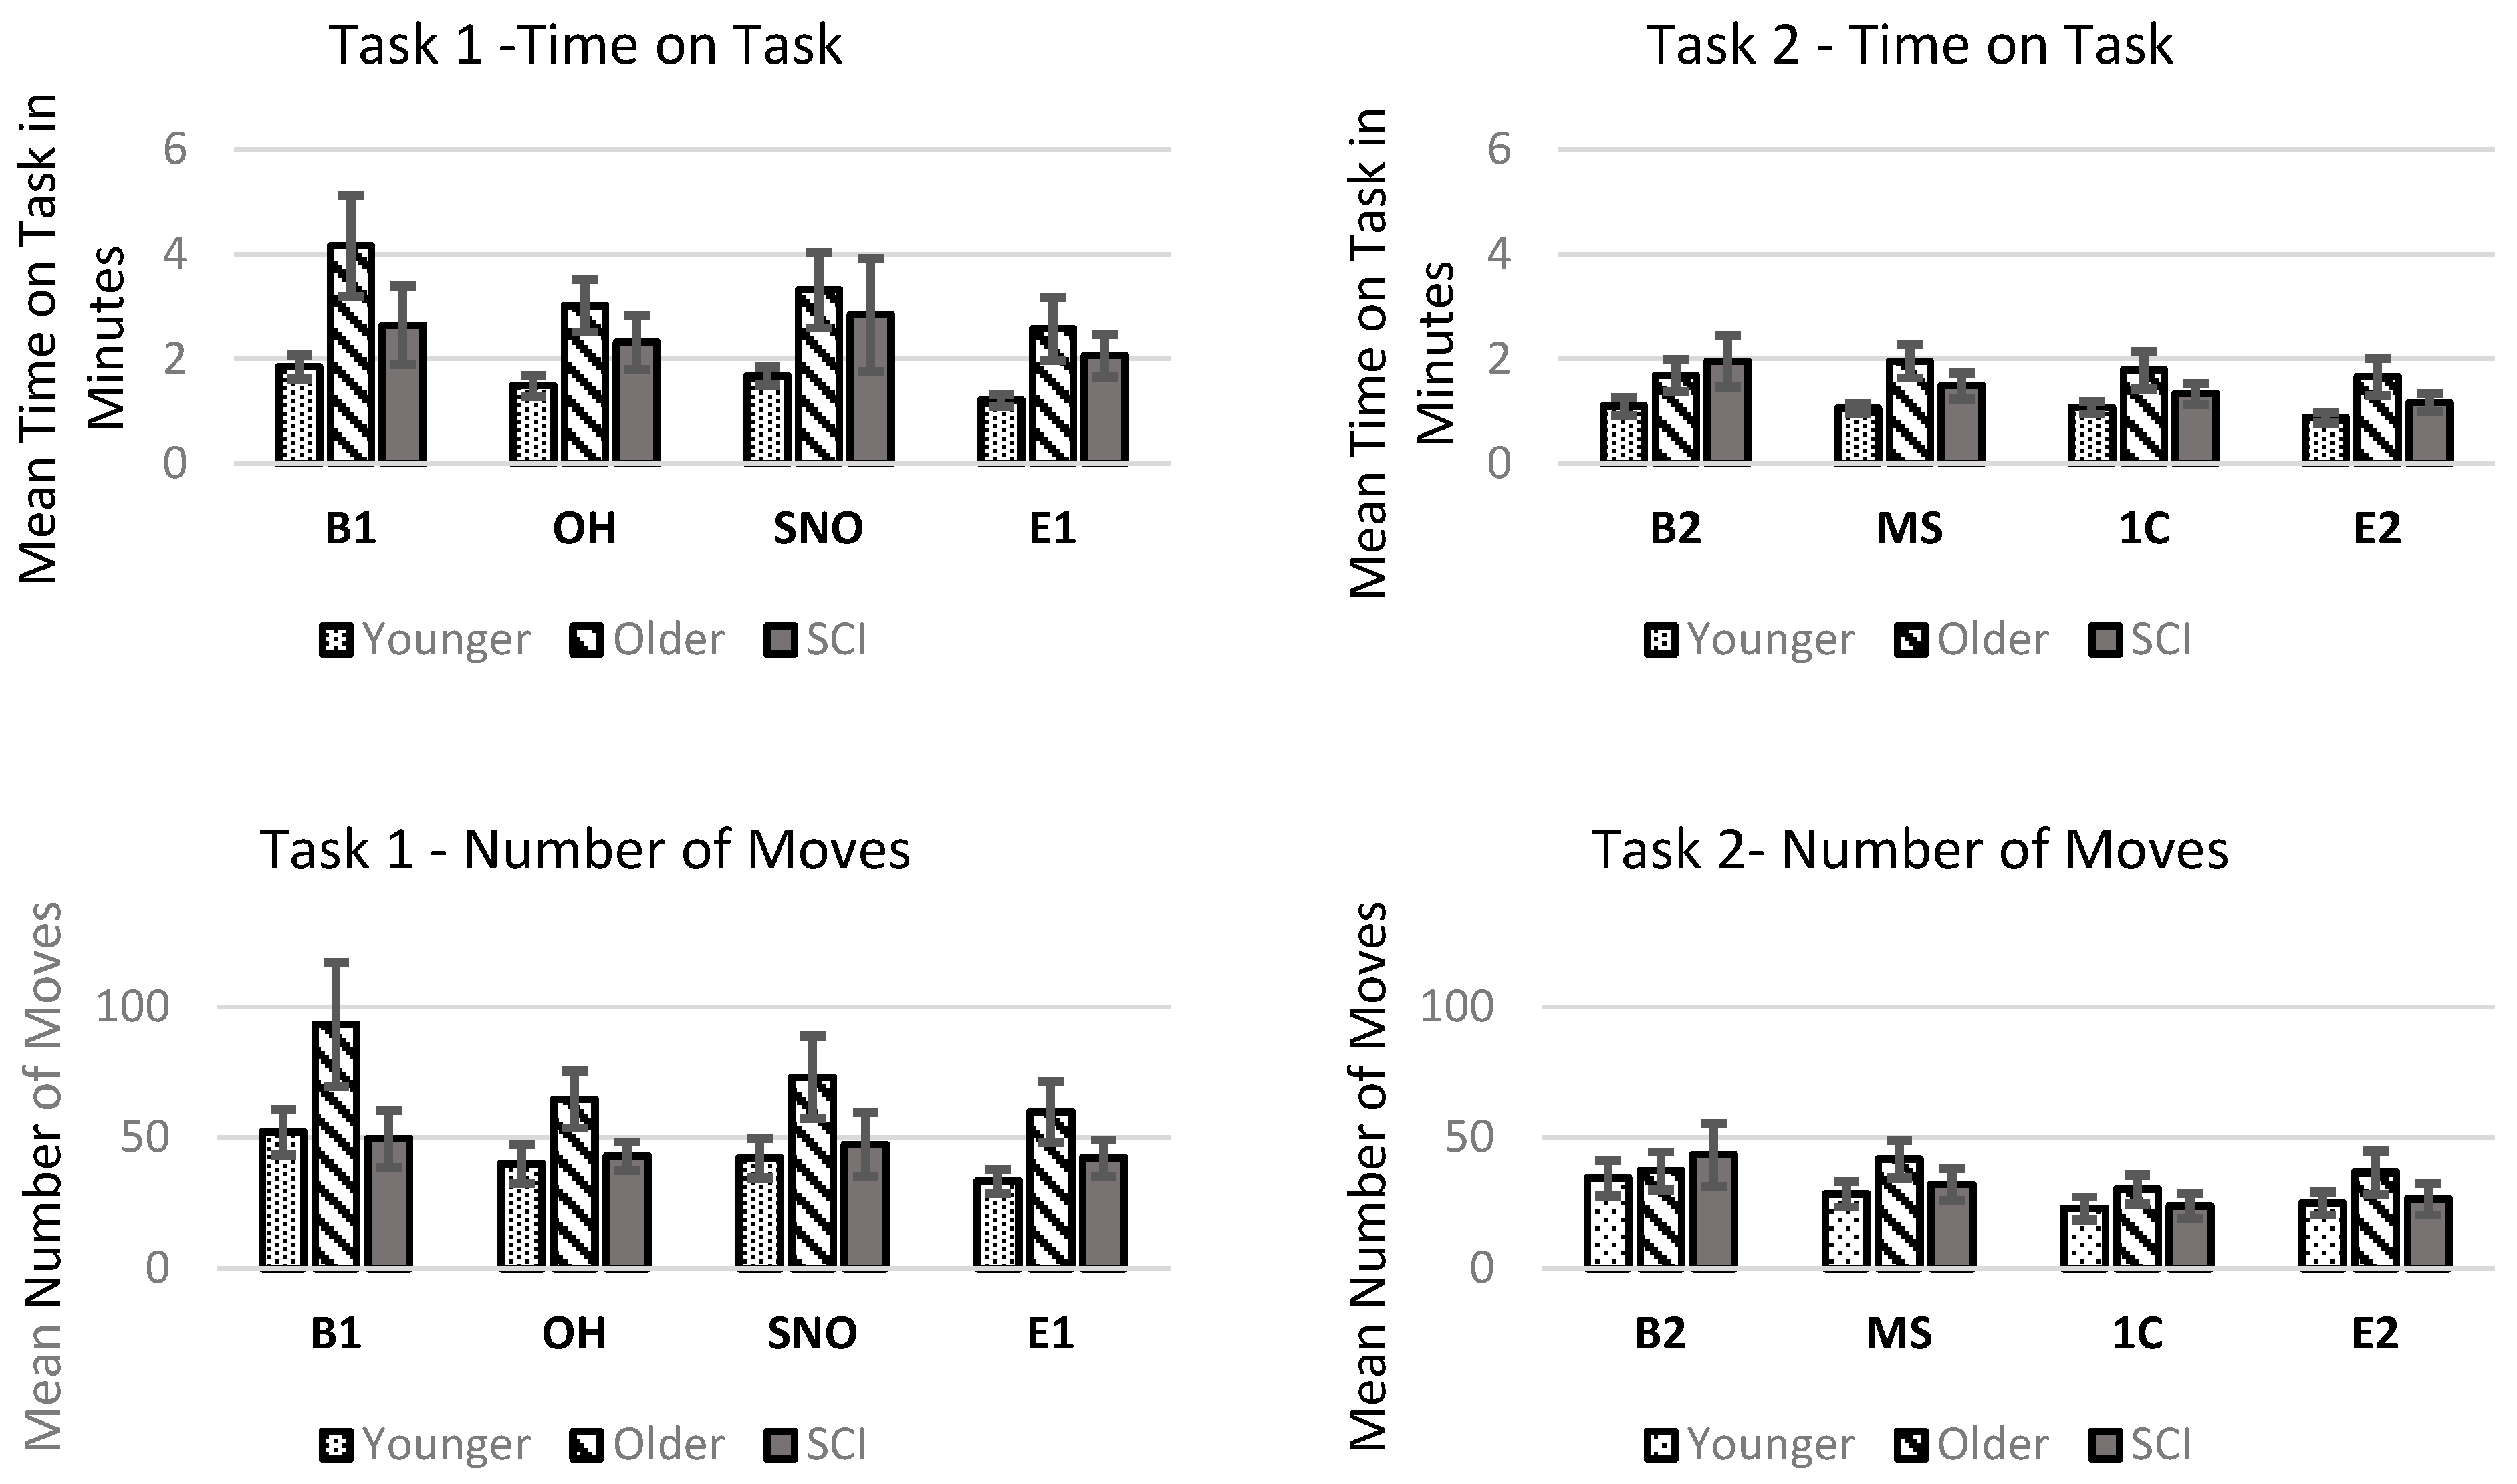
Results of the performance measures are presented first, while qualitative analyses of the interviews are presented in Section 4 below. Figure 4 shows differences in performance across all participant groups for each compensation. A shortcoming in our research design resulted from only having time for participants to use each compensation once. Even counterbalancing compensation presentation, practice effects are nevertheless evident in the results.
These scores reflect that, relative to each other, YA completed all tasks fastest and OA took the longest time on each task, with the exception of the baseline for Task 2, where SCI participants were slowest. In the number of moves, SCI made approximately the same number of moves as YA. As SCI times on task were higher, the relative efficiency of movements/time was less for SCI than for YA. OA, generally requiring more time and a higher number of moves, had the poorest overall efficiency.
Table 2 and Table 3 detail the performance results for time and number of moves for each task, by participant group and cognitive or perceptual differences. Although the effect was countered as participants progressed from baselines to end lines, the effect was considerably lessened over Task 2 due to the plateauing of the learning curve as participants gained experience. The change in time and practice effects were taken into consideration during analyses.
To assess whether one perceptual (contrast sensitivity) or four cognitive (working memory, processing speed, spatial orientation, and spatial visualization) domains, as well as age, had any effect on the overall participants’ performance with each task and compensation, the variables were regressed with each task/compensation’s time and number of moves as the dependent variables. As shown in Table 4, age was the primary factor affecting performance with the WMRA. Age was a significant regressor for all measurement points, except for the second baseline. Generally, as the age of participants went up, time-on-task and the number of moves increased. Contrast sensitivity, processing speed, and working memory differences had no significant effect on participant performance. However, spatial orientation had a significant effect on B2 time, all task 1 compensations time, and E1 time, while spatial visualization had a significant effect, as shown in Table 2.
Weak effect on the B2 number of moves. In all relevant cases, as spatial skills increased, the time or the number of moves decreased.
The importance of both spatial skills in B2 is likely due to participants’ first use of the arm without the requirement to look at the camera. This requires understanding the orientation of the arm in space without a first-person point of view between arm and target, as well as the position and angle of the gripper. Neither spatial orientation nor visualization was a significant variable in the linear models for the move suggestions and one-click compensations, and no significant differences were present across the means of the change in time or number of moves beyond the effects presented by age.
Spatial orientation skills impacted the results of the two compensations in Task 1 (which were not designed to assist with spatial deficits). However, by eliminating the significant and negative association between spatial orientation or visualization groups and performance, the two automatic compensations present in task 2 appear to provide a benefit to participants challenged by these spatial individual differences.

4. Usability and User Experience Evaluation

Usability evaluations examine how easy a system component is to use, taking into account differences such as user task performance, number of errors, and learnability. In contrast, user experience (UX) research concerns itself with all the experiential aspects of a user’s interaction with the component, including affective and user perception elements.
Two methods assessed the usability of the compensations. First, an overall assessment of the WMRA system, including all compensations, was conducted using the SUS. Scores range from 0 to 100, with higher numbers indicating better user-perceived usability. Generally, a score of 0 to 49 is considered unacceptable usability, 50 to 69 is marginally acceptable, and above 70 is acceptable [48]. Second, the usability and UX of each individual compensation was assessed through the three-item questionnaire administered after each compensation and the final six-item questionnaire.

4.1. Grounded Theory Analysis

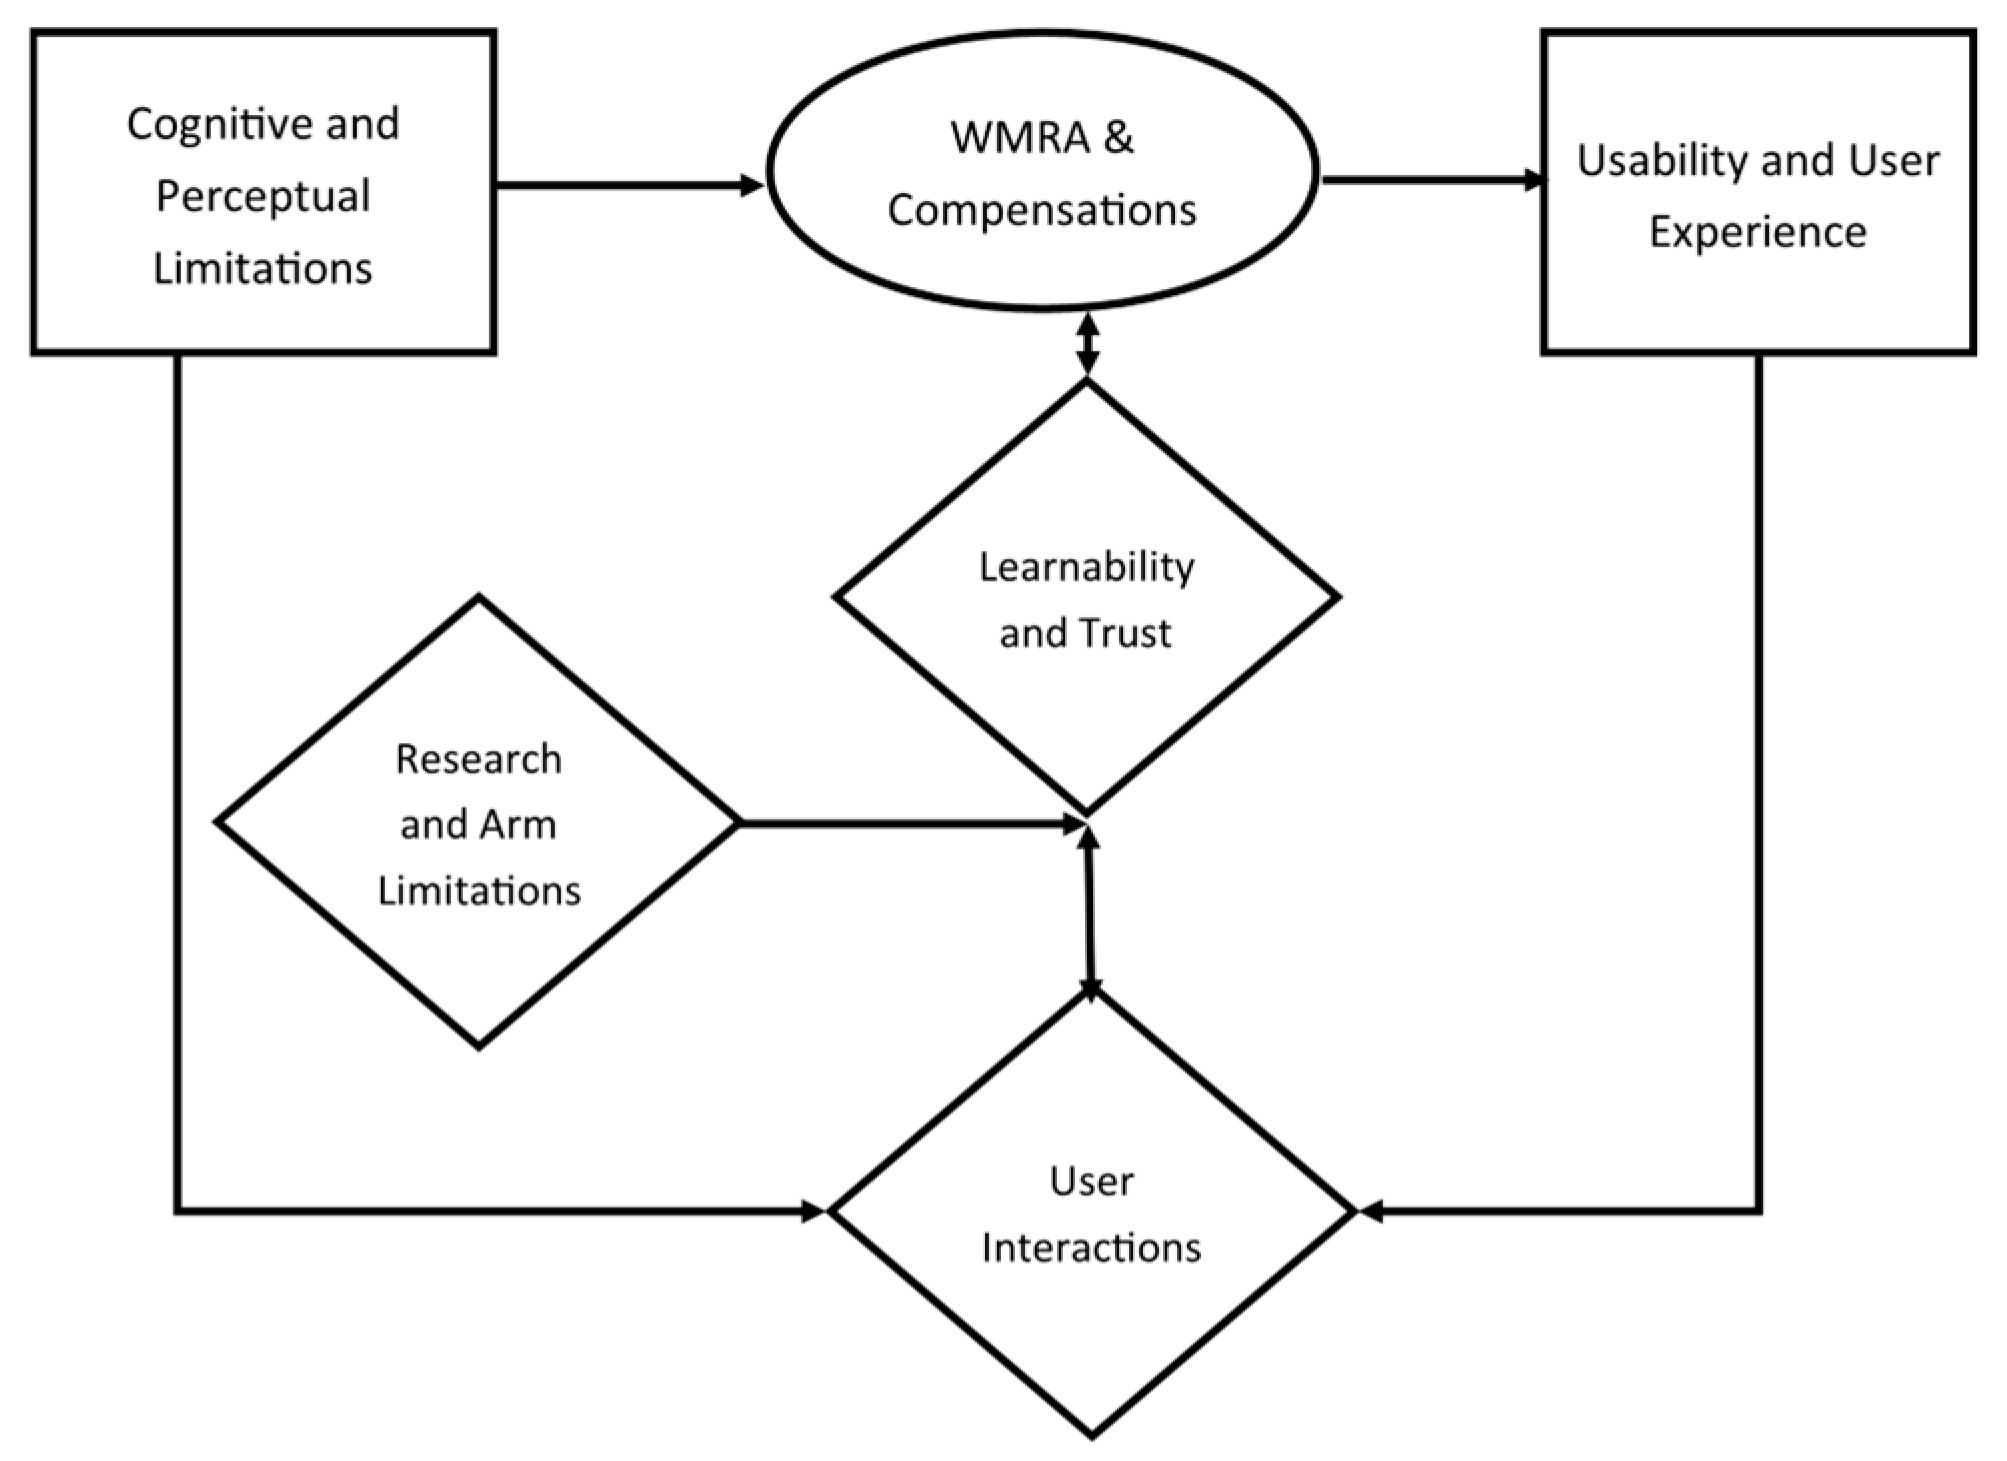
Given an interest in assessing usability and UX information without limiting participant answers with pre-specified topics, a data-driven grounded theory approach [49] was utilized to analyze all interview answers. Rather than use an a priori hypothesis, a grounded theory approach involves using open coding of any emergent themes in the interview answers. In this way, the data drives the generation of themes leading to a more naturalistic analysis. The open codes are then related to each other using a framework of relationships (see Figure 5) and grouped into overarching codes, a process known as axial coding. In the final stage of analysis, selective coding, core relationships in the grouped codes are identified, and study-relevant hypothetical assertions about the data are created. These hypothetical assertions were then verified against the data to create the usability and UX result narratives.
In the present study, and based on the proposed framework of relationships for axial coding [49], categories were grouped as related to the phenomena under study, causal conditions, context conditions, intervening conditions, human–robot interactions (HRI), and consequences (usability and UX). The framework is shown in Figure 5.
The phenomena under study are the WMRA’s compensations and features, as well as the corresponding improvement or hindrance of the HRI. The compensations themselves are developed as a result of causal conditions, which are the users’ cognitive and/or perceptual limitations, including any HRI difficulties that result from them. Compensation is developed to lessen the impact of such HRI difficulties. As such, the main areas of focus are the HRI that occur while participants operate the WMRA. These include user action preferences, as well as the feedback and assistance users receive from the compensations themselves.
During open coding, two major intervening conditions were identified: learnability and trust in automation. Intervening conditions directly affect HRI by altering user behavior during the interactions. Specifically, learnability refers to how easy, effective, and satisfying learning to use a new system is [50]. Trust in automation refers to how a user “feels” about a particular automated technology, specifically to how these feelings relate to the technology’s reliability, robustness, familiarity, understandability, transparency, usefulness, and dependency [51]. Both learnability and trust in automation often affect participants’ interactions with the robot.
The outcome of the HRI between the user and the compensations, referred to as consequences under the grounded theory framework [49], is the task performance measures delineated in III above, as well as users’ perception of usability and their individual user experiences. Finally, it should be noted that at all times, the participants took part in the study while under a specific research context. These contextual conditions include research-specific limitations and inherent HRI properties of the WMRA without compensation. These were taken into account when coding the data.

4.2. Usability: Results and Discussion

4.2.1. SUS Scores

Given the characteristics of the three samples and the ordinal nature of the survey data, the Kruskal–Wallis rank-based nonparametric test was used to compare across the participant groups. Additionally, all pairwise comparisons have been adjusted using the Bonferroni correction due to multiple tests.
Although OA reported a lower mean score than YA and SCI participants, there were no significant differences among participants in whether they would like to use the WMRA and compensation system frequently (χ2(2) = 3.74, p = 0.15, with a mean rank score of 20.08 for OA, 27.28 for YA, and 28.63 for SCI). Mean scores represent a positive desire across all groups to use the WMRA system frequently, with the highest scores among SCI participants. This is important, as it shows that among our SCI participants, the desire to use the arm and compensation systems is high. Similarly, although OAs reported a higher mean score than YA and SCI, no significant differences were present in whether participants found the system to be unnecessarily complex (χ2(2) = 3.00, p = 0.22, with a mean rank score of 28.35 for OA, 22.03 for YA, and 21.06 for SCI). Most participants did not find the WMRA system to be unnecessarily complex.
Significant differences were present in user perception of the system’s ease of use (χ2(2) = 9.88, p = 0.007, with a mean rank score of 17.55 for OA, 30.15 for YA, and 27.75 for SCI). This effect appears to be primarily driven by age. Pairwise comparisons show significant differences are present only between OA and YA participants (p = 0.007). A linear regression of age’s relationship to SUS scores for this item was significant, F(1,46) = 16.27, p < 0.001, R2 = 0.26. Based on the findings of Paperno et al. [44], important differences exist in the strategies employed by younger and older robotic manipulator users. OA use a larger set of cognitive information processing and spatial skills when operating a robotic arm. This higher mental skill utilization, as well as greater requirements in learning how to use the arm, may be the primary drivers of lower ease-of-use scores among older adults. This difficulty in use may account for OA’s performance on the experimental tasks, as delineated in III above. Importantly, SCI participants found the system easy to use.
Although OA, in general, typically require additional help from others when interacting with new technology and their mean score was higher (meaning higher need for assistance) than YA and SCI participants, no significant differences were present between participant groups in perceived need for technical support (χ2(2) = 1.56, p = 0.46, with a mean rank score of 26.60 for OA, 24.15 for YA, and 20.13 for SCI). Mean scores for all three groups indicate that most participants do not feel they will need support from a technical person to use the robotic arm.
Significant differences were present between groups regarding whether they thought the features in the WMRA system were well integrated (χ2(2) = 11.00, p = 0.004, with a mean rank score of 16.95 for OA, 29.18 for YA, and 31.69 for SCI). Pairwise comparisons showed significant differences between OA and YA (p = 0.01), as well as OA and SCI participants (p = 0.03). SCI participants felt, in general, that the features of the arm were well integrated.
Significant differences were also present in how participants perceived consistency in the operation of the WMRA system (χ2(2) = 9.43, p = 0.09, with a mean rank score of 30.90 for OA, 21.75 for YA, and 15.38 for SCI). Higher scores indicate greater perceived inconsistency. Pairwise comparisons show significant differences only between OA and SCI (p = 0.005). However, most participants across all groups felt that the system was consistent, with SCI participants perceiving the most consistency. Differences also existed between groups when considering the learnability of the system (χ2(2) = 18.36, p < 0.001, with a mean rank score of 15.23 for OA, 33.08 for YA, and 26.25 for SCI), with older adults again scoring the usability of the system lower. In general, and as will be detailed below, OA participants expressed a greater need for practice and adapting to the features of the system than YA and SCI participants. Pairwise comparisons show significant differences between OA and YA (p < 0.001), as well as OA and SCI (p = 0.046).
No differences were present among groups in how awkward participants felt the WMRA was to use (χ2(2) = 3.68, p = 0.16, with a mean rank score of 28.90 for OA, 21.50 for YA, and 21.00 for SCI). Although the mean score for OA was higher than the scores for YA and SCI, most participants did not find the WMRA system awkward to use.
Two other significant differences were present among SUS scores. First, significant differences existed in user confidence (χ2(2) = 10.41, p = 0.005, with a mean rank usability score of 18.05 for OA, 26.85 for YA, and 34.75 for SCI). Although most users exhibited positive confidence in using the system, pairwise comparisons showed significant differences between OA and SCI participants (p = 0.007). SCI participants were very confident in their ability to use the system. Second, differences were present between groups in perceived need to learn things before using the WMRA system (χ2(2) = 10.17, p = 0.006, with a mean rank usability score of 30.88 for OA, 22.43 for YA, and 13.75 for SCI). Pairwise comparisons again showed differences only between OA and SCI participants (p = 0.007), indicating a higher perceived need for learning among the older participants.
Overall, significant differences exist across participant groups in SUS scores (χ2(2) = 16.50, p < 0.001, with a mean rank usability score of 14.98 for OA, 30.08 for YA, and 34.38 for SCI). OA participants perceived the usability of the system as lower (M = 60.13, SD = 23.68) than both YA (M = 81.36, SD = 9.58, p = 0.002) and SCI (M = 85.31, SD = 8.91, p = 0.003) participants. Based on Bangor, Kortum, and Miller’s interpretation of usability scores [52], OA participants, on average, considered the WMRA system to be on the lower end of marginally useful (i.e., fair usability), while YA and SCI participants ranked usability as well into the acceptable range (i.e., good to excellent). The lower SUS scores among older participants are primarily driven by lower user confidence and perceived ease of system use, lower perceived positive integration of system components and consistency, and lower perceived learnability of the system.
For the purposes of the present research, the main takeaway from the SUS results is that SCI participants found the WMRA system to have excellent usability.

4.2.2. Participant Interviews: Overall

Most major difficulties in operating the WMRA system did not relate specifically to the compensations themselves but dealt with overall WMRA operation concerns. For example, a considerable portion of participants (27.1%) indicated that spatial orientation when using the camera view was very difficult for them. No significant differences were present between participants who expressed this difficulty and those who did not in terms of scores on spatial orientation, t(45) = 1.47, p = 0.15, and mental rotation, t(45) = 0.77, p = 0.44. While over a third of older adult participants (35%) indicated difficulties orienting in camera view, only 20% of younger adults had similar difficulties. A total of 25% of SCI participants indicated difficulty with camera view. No significant differences existed between participants who expressed this difficulty and those who did not in regard to overall SUS scores, t(45) = 1.78, p = 0.08. However, the prevalence of this difficulty among participants’ answers may be reflected in the task performance scores, since spatial orientation and visualization are the only other factors that have an effect on any of the target variables, apart from age (see Section 3).
Slightly over one-fifth (22.9%) of study participants expressed the most difficulty learning and operating the controls in the robotic arm. Specifically, participants struggled with differentiating between controls that operated general arm movement and those that controlled the gripper tilt and pan. This learnability element of WMRA operation did not appear to affect perceived overall SUS scores, t(45) = 0.92, p = 0.36. Older adults had the greatest percentage of participants with difficulty learning the WMRA controls (30%), while only 15% of younger adults struggled with it. A total of 25% of SCI participants indicated difficulty with learning the controls.
Another major difficulty for participants (22.9%) was dealing with the WMRA’s operating limits. This difficulty was expressed by younger (30%) participants more than by older participants (20%). Only one SCI participant indicated having difficulty with limits. No clear discernible pattern or association was identified in the data, which indicated why younger participants struggled with the limits more. A potential reason may be that younger users could be more comfortable using the entire movement range of the robotic arm, rather than a limited movement range, which keeps the arm clear of the limits. However, while older participants made significantly more moves (M = 54.68, SD = 17.19) than younger (M = 34.91, SD = 10.70, p < 0.001) and SCI (M = 38.58, SD = 7.07, p = 0.02) participants (χ2(2) = 16.73, p <0.001, with a mean rank score of 34.15 for OA, 16.50 for YA, and 20.38 for SCI), our data does not relate these movements to user spatial movements or limit proximity. Previous research [42] showed that navigation strategies are similar across different age groups when using a similar WMRA system (i.e., same UCF MANUS robotic manipulator with different control inputs).
Participants also expressed difficulty with the responsiveness of the robotic arm controls (20.8% of participants), including an input to movement lag, inconsistency in controls (e.g., “tilting of the gripper as I tried moving the arm only”), sensitivity of controls to inputs, and difficulties with precision. These difficulties were expressed as causing difficulty in operations by 30% of older adults, 20% of younger adults, and 12.5% of SCI participants. The responsiveness difficulties did not result in significant differences in SUS scores, t(45) = 0.92, p = 0.36.

4.3. User Experience (UX) and Usability of Compensations

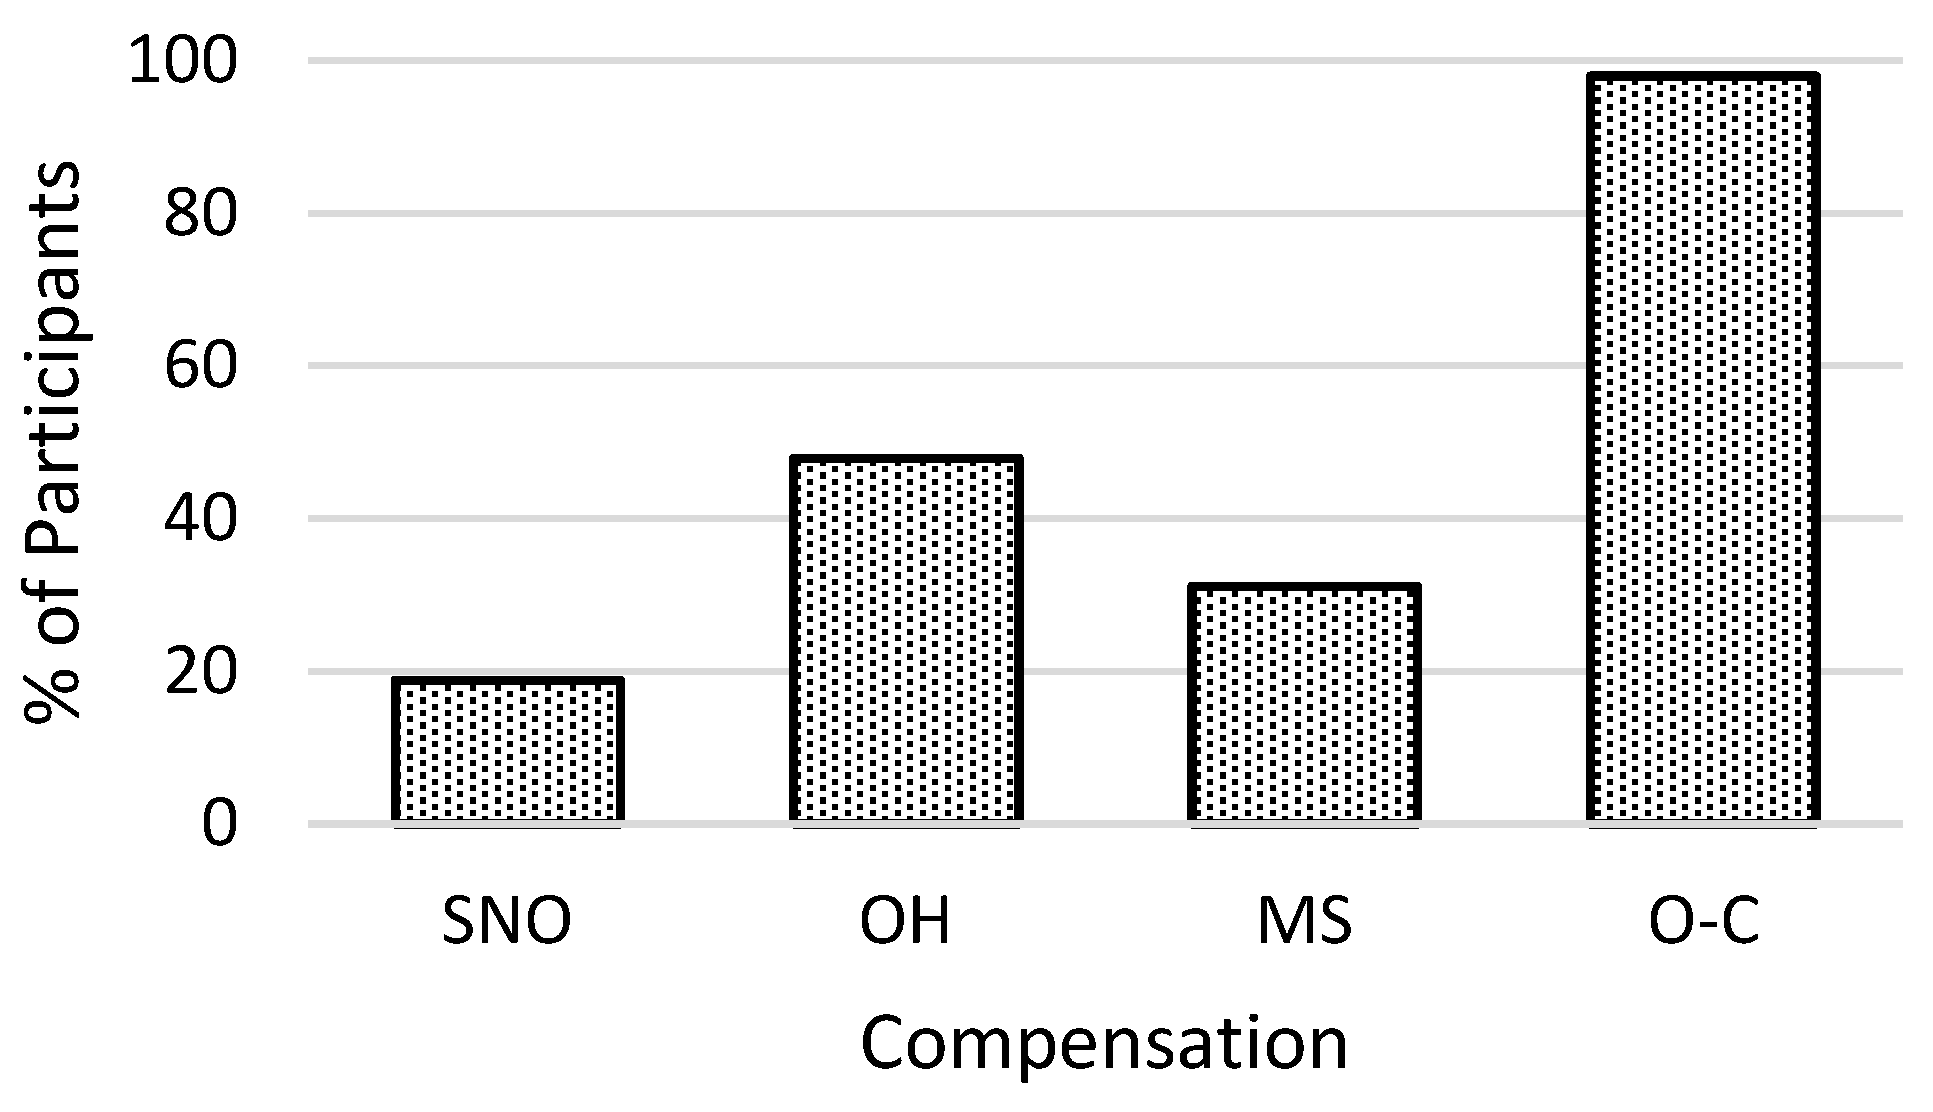
Figure 6 shows the percentage of participants who felt that each compensation changed their experience of using the robotic arm by improving the interaction.

4.3.1. Slowing near Object

Only 43.8% of participants (30.0% OA, 65.0% YA, 25.0% SCI) reported experiencing a change in their WMRA interactions as a result of using slowing near objects. Of these, only 42.9% (18.8% of the total participant sample, 10.0% OA, 35.0% YA, 0.0% SCI) reported having a positive or useful experience with slowing near objects. SCI participants either did not find that slowing near objects changed their experience of the WMRA or felt that it did so in a negative manner. The positive improvements cited by participants for using slowing near objects included smoother movement, collision avoidance, and ease of arm control. The negative aspects of using the compensation included greater difficulty of arm control, frustration with the arm’s slow speed, and lack of control responsiveness.
The utility of slowing near an object was affected by the base WMRA characteristics. The UCF Manus robotic manipulator was perceived as too slow by 31.3% of all participants (50% SCI, 35% YA, and 20% OA), even before the slowing near the object was employed in the research tasks. As a result, participants expressed frustration with the reduced speed of the WMRA with the compensation.

4.3.2. Object Highlight

A slight majority of participants found object highlight changed their experience using the robotic arm in a positive way (52.1% of participants, 35% OA, 60% YA, 50% SCI). These participants reported that the compensation provided improved brightness, as well as a clearer image and an improved target outline. These features made the compensation helpful and increased confidence in some participants. However, a small number of participants reported that the compensation changed their experience in a negative way (4.2%, 0% older, 10% Younger, 25% SCI). Mainly, these participants felt the brightness change caused problems with depth perception, since it eliminated shadows and natural lighting.
A major concern with object highlight was that many participants never noticed a difference in the improved contrast (41.7% of participants). This effect was strongest among older adults (60%), as compared to younger adults (30%). However, the effect was least present in our target population of SCI participants (25%). The mean age of participants who did not notice a difference was 53.35 years old (SD = 24.39), while those who did notice the difference were on average 39.56 years old (SD = 25.31). However, a Mann–Whitney U test revealed no significant age differences exist between the groups, U = 186, p = 0.07. Given that twice as many older than younger users reported no difference when experiencing object highlight, age-related usability difficulties should be considered when creating contrast-increasing compensation. In previous research, older participants assigned less value to automatic brightness adjustments in screens than younger participants [43]. Given age-related changes in vision, older users may benefit less and see less value in a compensation that changes the brightness of colors, as compared to younger users.

4.3.3. Move Suggestions

Less than half of all participants felt that move suggestions changed their experience using the WMRA (45.8% of participants, 30% OA, 55% YA, 62.5% of SCI). Of these, 68% felt the compensation improved the HRI (83% OA, 63.6% YA, 80% SCI). These participants stated that the compensation made the interaction easier by providing suggestions when the user was unsure or stuck, as well as providing reaffirmation of the user’s own choices. A total of 52.1% of participants (65% OA, 45% YA, 37.5% SCI) reported no change in the interaction, while 27.1% (15% OA, 35% YA, 37.5% SCI) of participants reported a negative experience with the compensation. Two predominant concerns led to these experiences. First, the compensation took too long to make a suggestion, so most users had already moved on or decided not to wait for a suggestion. Participants often reported not receiving a suggestion or receiving too few suggestions. SCI participants found the compensation mostly useful, as they expressed a general preference for both automatic compensations.
A second problem relates to trust in automation. A total of 27.1% of participants (40% YA, 20% OA, 12.5% SCI) stated that they did not believe the suggestions provided by the arm were correct or provided the best alternative for a path. Participants with low trust in the compensation were more likely to report having a negative experience with the WMRA task (χ2(2) = 15.98, p < 0.001), especially among younger participants. These participants preferred making their own decisions regarding movement direction.
Older adults described move suggestions as being distracting and requiring them to remove attention from the task at hand. Older adults have reduced ability to divide attention among two tasks [44]. Participants indicated a preference for focusing on the primary task, which led to the auditory suggestions in the move suggestions being ignored.

4.3.4. One-Click

Most participants liked one-click, with 93.8% of participants stating that the compensation changed their experience of using the WMRA, and 97.9% of participants reporting a positive experience with the compensation. In general, participants felt the compensation lowered mental workload, was easy to use, helpful, faster, and required less thinking. Only two older adults and one younger adult reported not liking the compensation. One of these participants reported that the compensation felt like it malfunctioned, while the other two were worried about the WMRA object collision.

4.3.5. Level Indicator

Only the older adult group used the level indicator. Of these, only two participants found the compensation useful as an alternative source of information regarding the orientation of the arm. A total of 90% of older adult participants did not like the compensation, preferring to circumvent it by using the crosshairs as a reference instead, or being unable to understand what the compensation was indicating. This latter problem was substantial and is indicative of the low learnability of the compensation.

4.3.6. Most Useful and Least Useful Compensations

Participants ranked one-click as the most useful compensation (68.8% of participants, 85% YA, 50% OA, 75% SCI). The compensation was a clear favorite among most participants, especially the younger adult participant group and the SCI group. In earlier research, Kim et al. [12,13] suggested that robotic manipulators allowed individuals with spinal cord injuries to reassert their ability to interact with the world. In their study, participants indicated that while automatic features in the manipulator provided a benefit, users had greater satisfaction being in charge of controlling the arm. In the present study, we did not specifically evaluate differences in user satisfaction between manual control and automatic processes. However, during interviews, SCI participants reported feeling that one-click allowed for easier operation of the arm, helping them complete tasks in less time and with lower effort.
Participants ranked slowing near an object as the least useful compensation (31.3% of participants, 55% YA, 5% OA, 37.5% SCI). This is likely due to the aforementioned perception of both the arm and compensation as excessively slow. Users reported the compensation as annoying and frustrating. Object highlight and the level indicator (used only by OA) were both ranked as the next least useful compensations, with 18.8% (25% YA, 10% OA, 25% SCI) and 18.8% (45% OA), respectively. Overall, the level indicator provided a negative usability and user experience, leading to confusion and dissatisfaction among participants who used it. Although some participants expressed utility in object highlight, most reported that there was no experienced difference in using the WMRA when the compensation was active, with many participants failing to notice any difference between the active compensation and regular manipulator operation.

4.4. User Suggestions

Participants were asked about ways to improve the compensations, arm, and feedback options.

4.4.1. WMRA Movement

Participants, including SCI, expressed interest in a faster WMRA system. This was a persistent problem with the arm and was particularly evident in participant answers related to slowing near objects. Additionally, participants wanted more fluid movements from the arm and a greater range of movement. The latter was especially important to younger adult participants, who felt the limited range of the arm (i.e., limits) made operation of the arm difficult and required adjustment.

4.4.2. Automation

Given participants’ positive experiences using one-click, it was no surprise that participants expressed an interest in additional automatic functions. Mostly, participants wanted automatic grasping of the object and a one-click to automatically “retrieve” the object as part of the process, bringing the object back to the person. In its current iteration, one-click stops once it is ready to grasp the object, with some minor adjusting of the gripper often required.
The UCF Manus control interface is equipped with a “Bring to Me” automated function, which allows the arm to bring the object to the participant, and a “Lower Arm” function, which moves the arm down and the gripper to face the ground. However, as these were not part of the one-click compensation, they were not tested as part of the research tasks.

4.4.3. Controls

Participants’ desires for new control options were varied. Some SCI participants expressed an interest in voice control. Paperno et al. [28] identified decrements in dexterity as one of the factors that can result in difficulty interacting with a robotic arm, increased time-on-task, added user frustration, and decreased feelings of autonomy. Individuals with SCI often have deficiencies in motor dexterity [5], as well as processing speed, motor speed, and working memory [46], which creates difficulties in operating manual control interfaces. Voice control interfaces reduce or eliminate the need to depend on physical interactions with the WMRA’s control system, improving accessibility and potentially reducing frustration among SCI users when interacting with the WMRA.
Related to complaints by users of control lag and lack of responsiveness, participants also stated a need for better control responsiveness to input commands, especially when using slow controls near objects.

4.4.4. Feedback and Indications

In general, with the exception of some older users who felt distracted by the directional instructions made by the move suggestions compensation, participants expressed liking feedback from the arm. However, two important needs were highlighted by most participants. Given that lining up the gripper to the object correctly required practice and most participants were not fully comfortable with this in the short time the experiments were conducted, many highlighted a need for a gripper-to-object alignment indicator. Suggestions for implementing this varied system, including a laser light which indicated the gripper’s position relative to the object, distance to object verbal notifications, placement on object confirmation, and a specialized digital gripper to object indicator.
The second need expressed by participants was related to the difficulties many young and older participants had with both arm movement limits (younger adults) and collisions of the arm and its components with objects (older adults). Participants indicated a desire for limited earcons that warned users of proximal limits and contact/hit warnings. Younger users also indicated a need for movement suggestions to include movement prompts related to recovering from unusual or potentially WMRA-damaging situations.

4.5. Usability and UX: SCI Discussion

One important aspect of the usability and UX analysis must be considered. Grounded theory’s data-driven approach presupposes that themes missing from the structured interview answers cannot be incorporated into the analysis unless there are sufficient grounds or bases to do so [41]. The target users of our WMRA and its compensations are users with SCI. Among our SCI participants, none of them mentioned motor difficulties or any other SCI-related difficulties in their interview answers. As such, while our analysis represents the usability and UX perspectives of individuals with SCI, motor difficulties or impairments related to SCI are not discussed in the UX analysis, given that the participants themselves did not provide this information. However, to the extent that previous research provides enough guidance, some elements relating to SCI-specific difficulties were discussed, such as a preference for automation.
As established in the frameworks and explanations above, the compensations were designed to address any potential cognitive and perceptual limitations that may hinder a participant’s HRI with the WMRA. For example, deficiencies in contrast sensitivity are known to cause difficulties seeing objects on a display screen, especially when the contrast between elements in the display or scene is low [45]. Object highlight attempts to reduce these difficulties by increasing the contrast between objects in the visual scene and the target object.
Among SCI participants, six out of eight participants reported benefiting from at least one compensation related to cognitive and perceptual measures in which they scored in the lowest performing half. With the exception of slowing near objects, which was rated as annoying, least useful, and too slow by SCI participants, all remaining compensations were found to provide positive experiences to some degree. In SCI participants with low contrast sensitivity scores, object highlight was found to be useful by some participants, while others did not see any difference in the contrast. Some of these participants felt the compensation improved the target outline, while others expressed that the overall visual quality was improved. These participants felt that the compensation improved depth perception and provided them with increased confidence in the use of the arm. This highlights the importance of visual image quality on user self-efficacy. Regardless of participant perceptions, object highlight did not improve performance for people with contrast sensitivity difficulties above and beyond improvements seen across participants.
Move suggestions are a compensation aimed at helping those with working memory, spatial visualization, and spatial orientation difficulties. These problems can lead to difficulties maneuvering the arm towards and away from the target object. As the name suggests, move suggestions offer users a suggested direction of movement in order for the arm to reach the target. While some users liked the compensation, its usefulness was not evident. Still, SCI participants who needed the compensation expressed that it provided helpful alternatives to users’ planned movements, provided suggestions for slow users, and was useful if the object was not visible either by the participant or on the screen. However, as mentioned above, a large percentage of all participants did not receive a suggestion from the compensation or felt that the suggestion was incorrect or inefficient, suggesting low trust in the compensation.
One-click was by far the compensation users perceived as most useful. In general, SCI participants preferred this compensation to others. Specifically, the participants stated that the compensation was easier, faster, most useful, provided a lower workload, and was helpful.

5. Conclusions and Future Work

The present study sought to evaluate the potential benefit of interface features intended to compensate for specific visual, cognitive, and physical abilities that impact proficiency in using a WMRA. Four compensations were used by YA, OA, and SCI participants: slowing near objects, object highlighting, move suggestions, and one-click to approach. OA also used the level indicator compensation, but due to the poor user feedback, this compensation was not used by the other participant groups.
Generally, performance metric results, defined as time-on-task and the number of moves, mirrored SUS ratings of perceived usability of the WMRA system. SCI efficiency was only slightly behind that of YA participants, and both rated the system as having good to excellent usability. Overall, this indicates that the WMRA system used in the study, along with the associated compensations, was found to have high usability among our SCI participants. OA showed significantly less efficiency in using the robot, requiring more time and a higher number of moves per task. They also rated the system as having only fair usability. This finding is important because the use of wheelchairs increases tenfold (10×) among older adults [47]. Furthermore, the aging of the baby boomer generation will bring with it a significant number of older users, especially those with SCI, who would benefit greatly from using a WMRA. Finding ways to increase efficiency of use and usability ratings for older users, such as with improved compensations, could help with the adoption of such technology and improve the lives of older people with SCI. While individuals with SCI were the target subgroup of this particular study, it should be noted that a wide range of wheelchair users can benefit from WMRAs.
The one-click approach feature was far and away the most positively rated compensation. Aside from developing and implementing additional automatic WMRA processes, future research should also venture to determine what types of human–robot and human–computer interaction models users can benefit from in terms of increased task efficiency while also preserving user satisfaction. One potentially beneficial technology is adaptive automation, which changes the degree of user involvement based on task needs and participant use preferences.
Given the exploratory nature of this study, all participants used all compensations regardless of scores on the individual difference measures. The poor user feedback for certain compensations, such as move suggestions, may likely have resulted from participants using compensations that did not match their needs. Auditory and visual suggestions can be a distraction and interfere with the conceptual model of users who do not need the assistance. Participants who had more difficulty navigating the arm, especially among SCI, reported the compensation to be more useful and beneficial. Future studies should further test compensations with participants who may benefit most from such features.
Based on our research results, future work should also aim to refine WMRA compensations to better match individual user needs. For example, slowing near objects could be optimized with adaptive speed control, allowing users to adjust responsiveness according to preference and task context. Object highlight could be personalized based on users’ contrast sensitivity and age-related visual differences to maximize perceived benefit. Move suggestions should incorporate timing improvements and enhanced reliability to build trust, possibly through predictive modeling of user movement paths. Moreover, providing participants with extra time to repeat tasks with each compensation can help control for learning effects in future studies. Additional time to practice with and use the WMRA can also reduce some of the difficulties reported by the participants, including confusion with the controls and in learning the limits of the robot arm movements. In addition, further research should be conducted with a larger SCI cohort to strengthen the generalizability of the findings.
Overall, participant feedback indicated spatial visualization and spatial orientation as the most important individual differences affecting the operation of the arm. As shown in task efficiency as well as qualitative feedback, participants with spatial ability difficulties benefited the most from the two automated compensations: move suggestions and the one-click approach. While further incorporating automated features will increase usability for a wider range of users, developers should continue to leave space for individualization of the interface. Any integrated compensations should be easily activated or deactivated to allow users to choose the level of automation for optimal individual control.

Author Contributions

Conceptualization: A.B. and J.A.S.; methodology: A.B. and Z.D.; software: Z.D.; validation: E.L.P. and F.M.; formal analysis: F.M.; investigation: E.L.P.; resources: A.B. and J.A.S.; data curation: F.M.; writing—original draft preparation: F.M. and E.L.P.; writing—review and editing: A.B. and J.A.S.; visualization: F.M.; supervision: A.B. and J.A.S.; project administration: A.B. and J.A.S.; funding acquisition: A.B. and J.A.S. All authors have read and agreed to the published version of the manuscript.

Funding

This study was funded in part by NIDILRR grants 90IFST0024-01-00 and H133G120275, and in part by NSF grants number IIS-1409823 and IIS-1527794. However, the study contents do not necessarily represent the policy of the aforementioned funding agencies, and one should not assume endorsement by the Federal Government.

Data Availability Statement

While data were created during this study, the data are unavailable due to HIPAA restrictions.

Acknowledgments

The authors acknowledge the tremendous help provided by UCF graduate student Nihad Habizada in amending the original manuscript to respond to reviewer comments.

Conflicts of Interest

The authors declare no conflicts of interest. The funders of the study had no role in the design of the study; in the collection, analyses, or interpretation of data; in the writing of the manuscript; or in the decision to publish the results.

References

  1. Kaye, H.S.; Kang, T.; LaPlante, M.P. Mobility Device Use in the United States; National Institute on Disability and Rehabilitation Research, US Department of Education: Washington, DC, USA, 2000; Volume 14.
  2. King, C.H.; Chen, T.L.; Fan, Z.; Glass, J.D.; Kemp, C.C. Dusty: An assistive mobile manipulator that retrieves dropped objects for people with motor impairments. Disabil. Rehabil. Assist. Technol. 2012, 7, 168–179. [Google Scholar] [CrossRef] [Scilit]
  3. Kobelt, G.; Berg, J.; Atherly, D.; Hadjimichael, O. Costs and quality of life in multiple sclerosis a cross-sectional study in the United States. Neurology 2006, 66, 1696–1702. [Google Scholar] [CrossRef] [Scilit]
  4. Laffont, I.; Biard, N.; Chalubert, G.; Delahoche, L.; Marhic, B.; Boyer, F.C.; Leroux, C. Evaluation of a graphic interface to control a robotic grasping arm: A multicenter study. Arch. Phys. Med. Rehabil. 2009, 90, 1740–1748. [Google Scholar] [CrossRef] [Scilit]
  5. Crewe, N.M.; Krause, J.S. Spinal cord injury. In Medica, Psychosocial and Vocational Aspects of Disability; Brodwin, M.G., Siu, F.W., Howard, J.H., Brodwin, E.R., Eds.; Elliot and Fitzpatrick: Athens, Georgia, 2009; pp. 289–304. [Google Scholar]
  6. Tsui, K.; Yanco, H.; Kontak, D.; Beliveau, L. Development and evaluation of a flexible interface for a wheelchair mounted robotic arm. In Proceedings of the 3rd ACM/IEEE International Conference on Human Robot Interaction; ACM: New York, NY, USA, 2008; pp. 105–112. [Google Scholar]
  7. Nguyen, H.; Anderson, C.; Trevor, A.; Jain, A.; Xu, Z.; Kemp, C. El-E: An Assistive Robot that Fetches Objects from Flat Surfaces. In Proceedings of the Human-Robot Interaction 2008 Workshop on Robotic Helpers, Amsterdam, The Netherlands, 12–15 March 2008. [Google Scholar]
  8. Ding, Z.; Jabalameli, A.; Al-Mohammed, M.; Behal, A. End-to-End Intelligent Adaptive Grasping for Novel Objects using an Assistive Robotic Manipulator. Machines 2025, 13, 275. [Google Scholar] [CrossRef] [Scilit]
  9. Gallenberger, D.; Bhattacharjee, T.; Kim, Y.; Srinivasa, S.S. Transfer Depends on Acquisition: Analyzing Manipulation Strategies for Robotic Feeding. In Proceedings of the 14th ACM/IEEE International Conference on Human-Robot Interaction (HRI), Daegu, Republic of Korea, 11–14 March 2019; pp. 267–276. [Google Scholar]
  10. Try, P.; Schöllmann, S.; Wöhle, L.; Gebhard, M. Visual Sensor Fusion Based Autonomous Robotic System for Assistive Drinking. Sensors 2021, 21, 5419. [Google Scholar] [CrossRef] [Scilit] [PubMed]
  11. Alwala, A.; El-Hussieny, H.; Mohamed, A.; Iwasaki, K.; Assal, S.F.M. On the Development of Autonomous Assistive Robotic System for Drinking Task for People with Disability. In Proceedings of the 2022 IEEE International Conference on Advanced Robotics and Its Social Impacts (ARSO), Long Beach, CA, USA, 28–30 May 2022; pp. 1–6. [Google Scholar] [CrossRef] [Scilit]
  12. Kim, D.J.; Hazlett, R.; Godfrey, H.; Rucks, G.; Portee, D.; Bricout, J.; Cunningham, T.; Behal, A. On the relationship between autonomy, performance, and satisfaction: Lessons from a three week user study with post-SCI Patients using a smart 6DOF assistive robotic manipulator. In Proceedings of the 2010 IEEE International Conference on Robotics and Automation, Anchorage, AK, USA, 3–8 May 2010; pp. 217–222. [Google Scholar]
  13. Kim, D.J.; Hazlett-Knudsen, R.; Culver-Godfrey, H.; Rucks, G.; Cunningham, T.; Portee, D.; Bricout, J.; Wang, Z.; Behal, A. How autonomy impacts performance and satisfaction: Results from a study with spinal cord injured subjects using an assistive robot. IEEE T. Syst. Man. Cybern. A 2012, 42, 2–14. [Google Scholar] [CrossRef] [Scilit]
  14. Styler, B.K.; Deng, W.; Chung, C.-S.; Ding, D. Evaluation of a vision-guided shared-control robotic arm system with power wheelchair users. Sensors 2025, 25, 4768. [Google Scholar] [CrossRef] [Scilit]
  15. Zarif, M.I.I.; Sunny, M.S.H.; Banik, N.; Longwell-Grice, E.H.R.; Ahamed, S.I.; Wang, I.; Rahman, M.H. Evaluation of different control systems of wheelchair-mounted assistive robotic arm in performing activities of daily living. In Proceedings of the International Conference on Biomedical and Health Informatics (ICBHI 2024), Tainan, Taiwan, 30 October–2 November 2024; IFMBE Proceedings; Springer: Cham, Switzerland, 2024; Volume 118, pp. 204–209. [Google Scholar] [CrossRef] [Scilit]
  16. Liu, Y.; Liu, Y.; Yao, Y.; Zhong, M. Object affordance-based implicit interaction for WMRA using a laser pointer. Sensors 2023, 23, 4477. [Google Scholar] [CrossRef] [Scilit]
  17. Czaja, S.J.; Boot, W.R.; Charness, N.; Rogers, W.A. Designing for Older Adults: Principles and Creative Human Factors Approaches, 3rd ed.; CRC Press: Boca Raton, FL, USA, 2019; pp. 125–141. [Google Scholar]
  18. Sutika, T.; Funikul, S.; Triyason, T.; Supattatham, M. Quality of smartphone user experience analysis: Focusing on smartphone screen brightness level for the elderly. In Proceedings of the IAIT 2018 10th International Conference on Advances in Information, Bangkok, Thailand, 10–13 December 2018; pp. 1–6. [Google Scholar]
  19. Naveh-Benjamin, M.; Craik, F.I.; Guez, J.; Kreuger, S. Divided attention in younger and older adults: Effects of strategy and relatedness on memory performance and secondary task costs. J. Exp. Psychol. Learn. Mem. Cogn. 2005, 31, 520–537. [Google Scholar] [CrossRef] [Scilit]
  20. Hess, D.W.; Marwitz, J.H.; Kreutzer, J.S. Neuropsychological impairments after spinal cord injury: A comparative study with mild traumatic brain injury. Rehabil. Psychol. 2003, 48, 151–156. [Google Scholar] [CrossRef] [Scilit]
  21. Pak, R.; McLaughlin, A. Designing Displays for Older Adults; CRC Press: Boca Raton, FL, USA, 2011; pp. 20–22. [Google Scholar]
  22. Dillen, A.; Omidi, M.; Ghaffari, F.; Romain, O.; Vanderborght, B.; Roelands, B.; Nowé, A.; De Pauw, K. User Evaluation of a Shared Robot Control System Combining BCI and Eye Tracking in a Portable Augmented Reality User Interface. Sensors 2024, 24, 5253. [Google Scholar] [CrossRef] [Scilit]
  23. Langer, D.; Legler, F.; Diekmann, P.; Dettmann, A.; Glende, S.; Bullinger, A.C. Got It? Comparative Ergonomic Evaluation of Robotic Object Handover for Visually Impaired and Sighted Users. Robotics 2024, 13, 43. [Google Scholar] [CrossRef] [Scilit]
  24. Lathan, C.; Tracey, M. The Effects of Operator Spatial Perception and Sensory Feedback on Human-Robot Teleoperation Performance. Presence Teleoper. Virtual Environ. 2002, 11, 368–377. [Google Scholar] [CrossRef] [Scilit]
  25. Long, L.O.; Gomer, J.A.; Moore, K.S.; Pagano, C.C. Investigating the Relationship between Visual Spatial Abilities and Robot Operation during Direct Line of Sight and Teleoperation. Proc. Hum. Factors Ergon. Soc. Annu. Meet. 2009, 53, 1437–1441. [Google Scholar] [CrossRef]
  26. Gomer, J.; Pagano, C. Spatial Perception and Robot Operation: Should Spatial Abilities Be Considered When Selecting Robot Operators? Proc. Hum. Factors Ergon. Soc. Annu. Meet. 2011, 55, 1260–1264. [Google Scholar] [CrossRef] [Scilit]
  27. Long, L.O.; Gomer, J.A.; Wong, J.T.; Pagano, C.C. Visual Spatial Abilities in Uninhabited Ground Vehicle Task Performance During Teleoperation and Direct Line of Sight. Presence Teleoperators Virtual Environ. 2011, 20, 466–479. [Google Scholar] [CrossRef] [Scilit]
  28. Paperno, N.; Rupp, M.A.; Parkhurst, E.L.; Maboudou-Tchao, E.M.; Smither, J.A.; Behal, A. A predictive model for use of an assistive robotic manipulator: Human factors versus performance in pick-and-place/retrieval tasks. IEEE Trans. Hum-Mach. Syst. 2016, 46, 846–858. [Google Scholar] [CrossRef]
  29. Paperno, N.; Rupp, M.A.; Parkhurst, E.L.; Maboudou-Tchao, E.M.; Smither, J.A.; Bricout, J.; Behal, A. Age and gender differences in performance for operating a robotic manipulator. IEEE Trans. Hum-Mach. Syst. 2019, 49, 137–149. [Google Scholar] [CrossRef] [Scilit]
  30. Sweller, J. Cognitive load during problem solving: Effects on learning. Cogn. Sci. 1988, 12, 257–285. [Google Scholar] [CrossRef]
  31. Sweller, J.; Ayres, P.; Kalyuga, S. Cognitive Load Theory; Springer: New York, NY, USA, 2011. [Google Scholar]
  32. Fong, T.; Thorpe, C.; Baur, C. Collaboration, dialogue, and human–robot interaction. In Proceedings of the International Symposium of Robotics Research (ISRR), Siena, Italy, 19–22 October 2003; pp. 255–266. [Google Scholar]
  33. Goodrich, M.A.; Schultz, A.C. Human–robot interaction: A survey. Found. Trends Hum.–Comput. Interact. 2007, 1, 203–275. [Google Scholar] [CrossRef] [Scilit]
  34. Endsley, M.R. Toward a theory of situation awareness in dynamic systems. Hum. Factors 1995, 37, 32–64. [Google Scholar] [CrossRef] [Scilit]
  35. Haggard, P. Sense of agency in the human brain. Nat. Rev. Neurosci. 2017, 18, 196–207. [Google Scholar] [CrossRef] [Scilit]
  36. Nasreddine, Z.S.; Phillips, N.A.; Bedirian, V.; Charbonneau, S.; Whitehead, V.; Collin, I.; Cummings, J.L.; Chertkow, H. The Montreal Cognitive Assessment, MoCA: A brief screening tool for mild cognitive impairment. J. Am. Geriatr. Soc. 2005, 53, 695–699. [Google Scholar] [CrossRef] [Scilit]
  37. Ginsburg, A.P. Next generation contrast sensitivity testing. In Functional Assessment of Low Vision; Mosby: St Louis, MO, USA, 1996; pp. 77–88. [Google Scholar]
  38. Visual Awareness Research Group, Inc. (2020). UFOV® Software. Available online: https://www.visualawareness.com/ (accessed on 24 April 2025).
  39. Kirchner, W.K. Age differences in short-term retention of rapidly changing information. J. Exp. Psychol. Gen. 1958, 55, 352–358. [Google Scholar] [CrossRef] [Scilit]
  40. Peters, M.; Laeng, B.; Latham, K.; Jackson, M.; Zaiyouna, R.; Richardson, C. A Redrawn Vandenberg and Kuse Mental Rotations Test—Different Versions and Factors that affect Performance. Brain Cogn. 1995, 28, 39–58. [Google Scholar] [CrossRef] [Scilit]
  41. Hegarty, M.; Waller, D. A dissociation between mental rotation and perspective-taking spatial abilities. Intelligence 2004, 32, 175–191. [Google Scholar] [CrossRef] [Scilit]
  42. Brooke, J. A ‘quick and dirty’ usability scale. In Usability Evaluation in Industry; Jordan, P.W., Thomas, B., Weerdmeester, B.A., McClelland, I.L., Eds.; Taylor & Francis: London, UK, 1996; pp. 189–194. [Google Scholar]
  43. Hazlett, R.; Smith, M.; Behal, A. Knowledge Based Design of User Interface for Operating an Assistive Robot. In Proceedings of the 14th International Conference on Human Computer Interaction, Orlando, FL, USA, 9–14 July 2011; pp. 304–312. [Google Scholar]
  44. 3Dconnexion, Inc. Spacemouse Wireless. 2018. Available online: https://www.3dconnexion.com/ (accessed on 24 April 2025).
  45. Koditschek, D.E.; Rimon, E. Robot Navigation Functions on Manifolds with Boundary. Adv. Appl. Math. 1990, 11, 412–442. [Google Scholar] [CrossRef] [Scilit]
  46. Jabalameli, A.; Behal, A. From Single 2D Depth Image to Gripper 6D Pose Estimation: A Fast and Robust Algorithm for Grabbing Objects in Cluttered Scenes. Robotics 2019, 8, 63. [Google Scholar] [CrossRef] [Scilit]
  47. Wang, Z.; Kim, D.J.; Behal, A. Design of stable visual servoing under sensor and actuator constraints via a Lyapunov-based approach. IEEE Trans. Control Syst. Technol. 2012, 20, 1575–1582. [Google Scholar] [CrossRef] [Scilit]
  48. Abdullah-Al-Wadud, M.; Kabir, M.H.; Dewan, M.A.A.; Chae, O. A dynamic histogram equalization for image contrast enhancement. IEEE Trans. Consum. Electron. 2007, 53, 593–600. [Google Scholar] [CrossRef] [Scilit]
  49. Strauss, A.; Corbin, J. Grounded theory methodology: An overview. In Handbook of Qualitative Research; Denzin, N.K., Lincoln, Y.S., Eds.; Sage Publications Inc.: Thousand Oaks, CA, USA, 1994; pp. 273–285. [Google Scholar]
  50. ISO/IEC 25010:2011; Systems and Software Engineering—Systems and Software Quality Requirements and Evaluation (SQuaRE)—System and Software Quality Models. International Organization for Standardization: Geneva, Switzerland, 2011.
  51. Sheridan, T.B. Automation, authority, and angst. In Proceedings of the Human Factors Society 35th Annual Meeting, San Francisco, CA, USA, 2–6 September 1991; pp. 2–6. [Google Scholar]
  52. Bangor, A.; Kortum, P.; Miller, J. Determining what individual SUS scores mean: Adding an adjective rating scale. J. Usability Stud. 2009, 4, 114–123. [Google Scholar]
Figure 1. Touchscreen graphical user interface. a. shows move suggestion implementation through button highlighting. b. shows level indicator.
Machines 14 00174 g001
Figure 2. Experimental setup from the subject’s POV when facing right while seated next to the robot.
Machines 14 00174 g002
Figure 3. Study sessions for each participant group.
Machines 14 00174 g003
Figure 4. Mean time-on-task and the number of moves for younger, older, and SCI participants, broken down by task: baseline 1 (B1), object highlight (OH), slowing near objects (SNO), endline 1 (second baseline for task 1; E1), baseline 2 (B2), move suggestions (MS), one-click (1C), and endline 2 (second baseline for task 2; E2). Error bars 95% confidence intervals.
Machines 14 00174 g004
Figure 5. Framework for grounded theory analyses, based on open coding. User interactions may be affected by cognitive and perceptual limitations as well as the research setting. The interaction with the robotic arm, mediated by learnability and trust, leads to perceived usability and user experience.
Machines 14 00174 g005
Figure 6. Percentage of participants who stated that the use of the compensation improved their interaction with the WMRA. Compensations: slowing near object (SNO), object highlight (OH), move suggestions (MS), and one-click approach (O-C).
Machines 14 00174 g006
Table 1. Individual differences and corresponding measures.
Contrast Sensitivity (CS)Functional Acuity Contrast Test [37]
Processing Speed (PS)Useful Field of View (UFOV) Subtest 1 [38]
Working Memory (WM)Two-Back Task [39]
Spatial Visualization (SV)Mental Rotations Test [40]
Spatial Orientation (SO)Perspective Taking Test [41]
Table 2. Mean, standard deviation, and Z-score for total time and number of moves in task 1 across participant groups. Among SCI groups: 1 n = 1, 2 n = 2, 3 n = 3, 4 n = 5.
TASK 1
B1OHSNOE1
GROUP M (SD)ZM (SD)ZM (SD)ZM (SD)Z
YoungerToT1.85 (0.47)−0.621.49 (0.43)−0.741.68 (0.36)−0.651.21 (0.25)−0.67
NoM52.20 (19.27)−0.4140.10 (15.66)−0.5042.30 (15.95)−0.4833.40 (9.78)−0.59
OlderToT4.16 (2.07)0.693.02 (1.06)0.723.32 (1.54)0.562.58 (1.28)0.62
NoM93.35 (50.77)0.6064.70 (23.29)0.6473.15 (33.77)0.6059.85 (24.86)0.66
SCIToT2.65 (0.90)−0.172.32 (0.62)0.212.85 (1.29)0.222.07 (0.50)0.14
NoM49.63 (13.09)−0.4743.00 (6.48)−0.3647.38 (14.69)−0.3042.25 (8.29)−0.17
CSToT3.91 (2.09)0.552.93 (0.96)0.643.57 (1.68)0.742.68 (1.41)0.71
NoM82.13 (49.73)0.3459.94 (23.65)0.4274.56 (37.32)0.6557.50 (26.39)0.55
SCI-CS 1ToT4.180.702.630.355.532.192.430.48
NoM60−0.22510.01770.74500.19
WMToT3.99 (2.31)0.592.90 (1.18)0.613.31 (1.57)0.552.32 (1.02)0.37
NoM83.94 (55.79)0.3758.39 (25.94)0.3569.56 (37.25)0.4852.78 (27.72)0.32
SCI-WM 2ToT3.43 (1.06)0.282.87 (0.33)0.584.60 (1.32)1.502.61 (0.25)0.65
NoM55.00 (7.07)−0.3450.50 (0.70)−0.0264.00 (18.38)0.2849.00 (1.41)0.15
PSToT2.84 (1.90)−0.062.03 (0.92)−0.232.37 (0.99)−0.131.79 (0.85)−0.12
NoM73.18 (57.07)0.1048.18 (27.40)−0.1258.47 (35.35)0.0945.77 (26.17)−0.01
SCI-PS 3ToT2.23 (0.46)−0.412.19 (0.79)−0.072.58 (0.94)0.022.07 (0.63)0.14
NoM46.00 (9.64)−0.5640.67 (8.08)−0.4742.67 (7.37)−0.4739.67 (8.02)−0.29
SOToT4.05 (2.34)0.622.90 (1.25)0.613.43 (1.83)0.642.55 (1.44)0.59
NoM79.80 (52.15)0.2757.20 (25.92)0.2960.40 (31.76)0.1554.13 (26.76)0.39
SCI-SO 3ToT2.83 (1.17)−0.062.21 (0.40)−0.063.26 (1.97)0.511.89 (0.47)−0.03
NoM51.00 (14.73)−0.4443.00 (7.00)−0.3652.00 (22.91)−0.1441.00 (8.19)−0.23
SVToT2.85 (1.01)−0.052.36 (0.83)0.093.37 (1.85)0.602.25 (1.36)0.31
NoM60.80 (19.76)−0.2047.60 (12.37)−0.1566.00 (30.88)0.3548.20 (19.47)0.11
SCI-SV 4ToT2.68 (0.87)−0.152.28 (0.58)0.023.09 (1.53)0.392.02 (0.55)0.09
NoM51.20 (10.47)−0.4443.00 (7.00)−0.3649.40 (17.04)−0.2340.60 (8.11)−0.25
Table 3. Mean, standard deviation, and Z-score for total time and number of moves in task 2 across participant groups.
TASK 2
B2MS1CE2
GROUP M (SD)ZM (SD)ZM (SD)ZM (SD)Z
YoungerToT1.10 (0.36)−0.621.06 (0.19)−0.721.07 (0.24)−0.550.88 (0.20)−0.60
NoM34.65 (14.56)−0.1828.55 (10.45)−0.4523.10 (9.34)−0.3025.00 (9.31)−0.36
OlderToT1.69 (0.64)0.321.96 (0.69)0.721.79 (0.78)0.601.66 (0.76)0.65
NoM37.40 (14.56)0.0141.85 (15.14)0.5330.35 (11/78)0.3936.75 (17.69)0.46
SCIToT1.96 (0.58)0.761.49 (0.30)−0.021.34 (0.24)−0.131.17 (0.21)−0.14
NoM43.50 (14.34)0.4232.25 (7.21)−0.1824.00 (5.76)−0.2226.63 (7.27)−0.25
CSToT1.72 (0.72)0.381.84 (0.70)0.521.59 (0.53)0.281.55 (0.67)0.48
NoM38.63 (14.44)0.0937.50 (14.56)0.2127.69 (11.54)0.1434.69 (19.53)0.32
SCI-CS 1ToT2.301.301.50−0.021.570.241.500.40
NoM460.5930−0.35290.26350.34
WMToT1.69 (0.74)0.331.82 (0.78)0.511.76 (0.83)0.561.50 (0.83)0.40
NoM38.39 (17.01)0.0837.94 (17.20)0.2429.78 (13.09)0.3432.83 (19.76)0.19
SCI-WM 2ToT2.29 (0.65)1.291.64 (0.20)0.211.55 (0.02)0.221.27 (0.33)0.02
NoM49.50 (4.95)0.8230.00 (0.00)−0.3531.00 (8.00)0.4526.00 (12.73)−0.29
PSToT1.49 (0.72)0.011.44 (0.57)−0.101.33 (0.32)−0.141.28 (0.68)0.05
NoM34.94 (17.08)−0.1632.77 (15.49)−0.1424.18 (9.77)−0.2032.12 (20.21)0.14
SCI-PS 3ToT1.94 (0.53)0.731.57 (0.27)0.101.46 (0.23)0.661.17 (0.17)−0.13
NoM41.00 (13.11)0.2531.33 (2.31)−0.2526.33 (7.64)0.0125.33 (9.71)−0.34
SOToT1.83 (0.70)0.551.90 (0.71)0.621.78 (0.89)0.581.60 (0.85)0.57
NoM38.00 (17.49)0.0538.27 (13.69)0.2626.87 (13.34)0.0635.07 (19.85)0.35
SCI-SO 3ToT1.90 (0.38)0.661.60 (0.09)0.151.34 (0.30)−0.111.24 (0.23)−0.02
NoM42.00 (6.08)0.3236.67 (6.11)0.1423.33 (5.51)−0.2830.00 (4.36)−0.01
SVToT1.58 (0.48)0.141.66 (0.56)0.241.53 (0.36)0.191.39 (0.46)0.22
NoM37.40 (8.51)0.0136.93 (11.00)0.1628.40 (6.59)0.2031.07 (9.15)0.06
SCI-SV 4ToT2.04 (0.33)0.881.65 (0.10)0.231.44 (0.25)0.041.22 (0.20)−0.05
NoM44.40 (6.47)0.4834.80 (5.22)0.0126.20 (5.81)−0.0128.60 (7.64)−0.11
Younger, older, and SCI include all participants within those groups. All other groups include only the lowest-performing tercile in each perceptual or cognitive test. CS = contrast sensitivity, PS = processing speed, WM = working memory, SO = spatial orientations, SV = spatial visualization. Among SCI groups: 1 n = 1, 2 n = 2, 3 n = 3, 4 n = 5.
Table 4. Linear regression model and coefficient statistics.
Variable TASK 1B1OHSNOE1TASK 2B2MS1CE2
Age ToT0.56 ***0.60 ***0.47 ***0.53 *** 0.71 ***0.57 ***0.59 ***
NoM0.49 ***0.54 ***0.58 ***0.62 ***0.48 ***0.36 *0.37 **
SO ToT −0.27 *−0.32 *−0.28 * −0.33 *
SV NoM −0.31 *
FToT19.95 ***23.04 ***19.33 ***22.14 *** 8.81 **45.56 ***21.71 ***24.63 ***
NoM14.53 ***19.14 ***22.93 ***28.59 ***4.98 *14.02 **6.99 *7.38 **
R2ToT0.450.590.440.47 0.250.490.310.34
NoM0.220.280.320.370.080.220.110.12
Backwards linear regression results. Only significant standardized beta coefficients are shown, as well as model F and adjusted R2. No significant results for contrast sensitivity, working memory, or processing speed. Baseline 1 (B1), object highlight (OH), slowing near object (SNO), endline 1 (second baseline for task 1; E1), baseline 2 (B2), move suggestions (MS), one-click (1C), and endline 2 (second baseline for task 2; E2). Spatial orientation (SO) and spatial visualization (SV). * p < 0.05, ** p < 0.01, *** p < 0.001. Model: ToT or NoM = Age(X) + CS(X) + WM(X) + PS(X) + SO(X) + SV(X) + Constant.
Disclaimer/Publisher’s Note: The statements, opinions and data contained in all publications are solely those of the individual author(s) and contributor(s) and not of MDPI and/or the editor(s). MDPI and/or the editor(s) disclaim responsibility for any injury to people or property resulting from any ideas, methods, instructions or products referred to in the content.