


Abstract
Comminution is the most energy-intensive stage of mineral processing, and microwave-assisted comminution (MAC) can reduce grinding energy by selectively heating microwave-absorbing minerals within transparent gangue, generating thermal microcracks that improve liberation. MAC performance, however, depends on the ore mineralogy and surface, which fixed-parameter operation cannot accommodate. An integrated mechatronic “intelligent crusher” is presented unifying actuation (microwave source, feed system, adjustable crusher geometry), sensing (thermal infrared and hyperspectral imaging, HSI), and control (offline reinforcement learning). HSI-derived mineralogical features and infrared thermal features form the state of a behavior-regularized actor–critic (BRAC) controller trained offline on logged operating data to adjust the power, exposure, feed rate, and crusher setting. A two-dimensional coupled electromagnetic–thermal–mechanical finite-element study underpins the process model. It is executed with temperature-independent dielectric properties in a single staggered coupling pass, and so calibrates the damage law qualitatively rather than predicting stress quantitatively. It reproduces cracking thresholds from the literature and shows that thermal gradients decay with exposure time as (1 + t/)−0.57, so that damage at a constant dose falls from 0.63 to 0.02 as exposure lengthens from 0.25 to 16 s. On this basis, the phenomenological damage law, which had been exposure-insensitive, is corrected. On the FEA-calibrated simulator, the BRAC policy reduces the mean size targeting error by 62% (1.43 to 0.54 mm) and the total specific energy by 4.2% (6.50 to 6.22 kWh/t), averaged over five training seeds, relative to fixed-parameter operation, outperforms rule-based and behavior-cloning baselines, and generalizes to a simulated ore batch excluded from the training. The framework establishes a validated control architecture for adaptive MAC ahead of three-dimensional model extension and experimental deployment.
1. Introduction
Comminution—the crushing and grinding of ore to liberate valuable minerals—is the single most energy-intensive operation in mineral processing. Benchmarking of copper and gold operations attributes on average 36% of mine energy to comminution alone [1]. Even modest efficiency gains therefore translate into substantial costs and carbon reductions, motivating decades of research into ore pre-weakening methods, of which microwave-assisted comminution (MAC) is among the most studied [2,3].
MAC exploits the contrast in dielectric properties between mineral phases. Under microwave irradiation, lossy phases such as magnetite and sulfides heat rapidly and volumetrically, while silicate gangue remains comparatively transparent and cool [3,4]. The resulting differential thermal expansion generates localized grain boundary stresses, nucleating intergranular microcracks that reduce ore strength and improve liberation [4,5,6]. The effect is strongly texture-dependent—coarse-grained absorbers dispersed in a transparent matrix respond best [2,7]—and energy delivery mode matters as much as dose: high power applied briefly produces steeper thermal gradients and better weakening per unit energy [4,8]. Reported benefits range from >30% comminution energy reduction at <1 kWh/t microwave input for amenable ores [4] to a more conservative ∼9% reduction in specific comminution energy at pilot scale [9].
The reported energy benefit spans an order of magnitude, from more than 30% comminution energy reduction at under 1 kWh/t on amenable laboratory ore [4] to about 9% at continuous pilot scale [9], a gap attributed mainly to feed variability and to loss of field concentration at scale [9,10]. The numerical literature identifies power density rather than total dose as the governing variable; thermal stress models of two-phase particles [11,12], microstructure-resolved electromagnetic–thermal–mechanical models of granite [13,14,15], and damage mechanics formulations [16,17,18] all predict larger grain boundary stress when the same dose is delivered briefly at higher power density, and infrared thermography places fracture onset for granite near 200 °C and 6 °C mm−1 [19]. Offline reinforcement learning recovers strong policies from fixed logged data provided extrapolation error is controlled, by an action support constraint [20] or a divergence penalty [21], and outperforms fixed-schedule baselineson sequential industrial tasks [20,22,23].
A central obstacle to commercialization is feed variability: the optimal dose and downstream crusher setting depend on mineralogy and texture, which fluctuate continuously. Fixed-parameter treatment either under-treats, wasting the pre-weakening opportunity, or over-treats, wasting energy and risking arcing and excessive fines [9,10,24]. What is missing is a closed-loop machine that senses the incoming material, predicts its microwave response, and adapts actuation accordingly. This gap maps directly onto the definition of a mechatronic system: the synergistic integration of mechanical engineering, electronics, sensing, and intelligent computer control [25,26]. The mining sector has begun this transition explicitly: Mine 4.0 programs have introduced cyber–physical sorting machines in which vision sensing, robotic actuation, and supervisory control are engineered as one mechatronic unit rather than as separate subsystems [27], and the emerging Mine 5.0 framing extends this by returning the human operator to the loop as a supervisory and decision-making agent [28]. Comminution, however, has largely remained outside this transition. The same mechatronic logic is applied here upstream of sorting, organizing the machine around actuation (microwave source, feed system, adjustable crusher geometry), sensing (thermal infrared and hyperspectral imaging), and control (offline reinforcement learning).
Experimental microwave work has established that pre-weakening is real, texture-dependent, and power density-sensitive, but treats process parameters as fixed settings, so feed variability appears as scatter rather than being compensated [4,7,8,9]. Numerical work has resolved the physics of individual samples in detail but is descriptive and unconnected to any sensing or control layer [11,12,13,14,15,16,17,18,29]. Sensor-based sorting closes a perception–actuation loop at industrial rates, but on a binary accept/reject decision downstream of comminution rather than on continuous treatment parameters upstream of it [30,31,32,33,34,35]. No published system senses incoming mineralogy and texture, predicts the microwave response from physics, and adapts the dose, dose rate, and crusher setting accordingly. The novelty claimed here is therefore not a new applicator, finite-element formulation, or learning algorithm, but the closure of the loop between them: hyperspectral texture descriptors serve simultaneously as microstructure input to the finite-element model and as the controller state, and the finite-element study is used to correct the reward-bearing damage law rather than to describe a specimen.
Sensing is the first enabler. Infrared (IR) thermography quantifies heating non-uniformity and thermal gradients on irradiated rock. In granite, fracturing thresholds of approximately 200 °C peak temperature and 6 °C/mm gradient have been established by IR imaging [19]. Because heating is phase-selective, the thermal image is a proxy map of dielectric loss distribution—the very property governing microwave amenability. Hyperspectral imaging (HSI) in the visible-to-shortwave infrared range resolves diagnostic mineral absorptions and, combined with machine learning, enables quantitative mineral mapping and sensor-based sorting [30,31,32,33]. The sorting literature further shows that combining complementary modalities outperforms any single sensor: multi-modal architectures that fuse RGB and multispectral streams through parallel encoders into a common latent space classify heterogeneous material streams with accuracies unattainable from the shape or spectrum alone [34], and such fusion has been realized in deployed cyber–physical sorting systems that couple imaging, actuation, and control in one machine [35]. Together, HSI provides feed-forward characterization and IR imaging provides in-process feedback—precisely the observability a controller requires.
Control is the second enabler. Reinforcement learning (RL) suits sequential process control problems [22,23,36,37], but online trial and error exploration is unsafe on capital-intensive equipment. Offline (batch) RL learns from a fixed dataset of logged operation without further interaction [20,21]. Its key failure mode—extrapolation error from out-of-distribution actions—is addressed by batch-constrained Q learning (BCQ) [20] and generalized by the behavior-regularized actor–critic (BRAC) framework, which penalizes divergence between the learned and data-generating policies [21]. BRAC is adopted here because it targets exactly the safety-critical, data-constrained regime of industrial MAC. It is noted that “batch-constrained” and “BRAC” denote distinct methods [20,21]; the implementation reported here is BRAC.
The contribution of this paper is fourfold: (1) a system-level mechatronic design integrating microwave actuation, thermal–hyperspectral sensing, and offline RL control; (2) an HSI processing pipeline producing microwave amenability features that condition the controller state; (3) a two-dimensional coupled electromagnetic–thermal–mechanical finite-element study, which corrects the exposure time-dependence of the damage law; and (4) a simulation-based validation using a reduced-order process model calibrated to published MAC data and then recalibrated against the finite-element study, demonstrating that a BRAC policy trained purely on logged data outperforms fixed-parameter, rule-based, and behavior-cloning control, including on a held-out simulated ore batch.
2. Materials and Methods
2.1. Mechatronic System Architecture
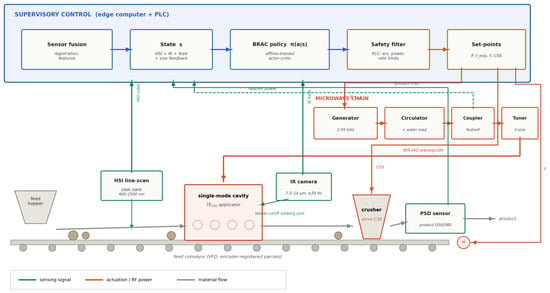
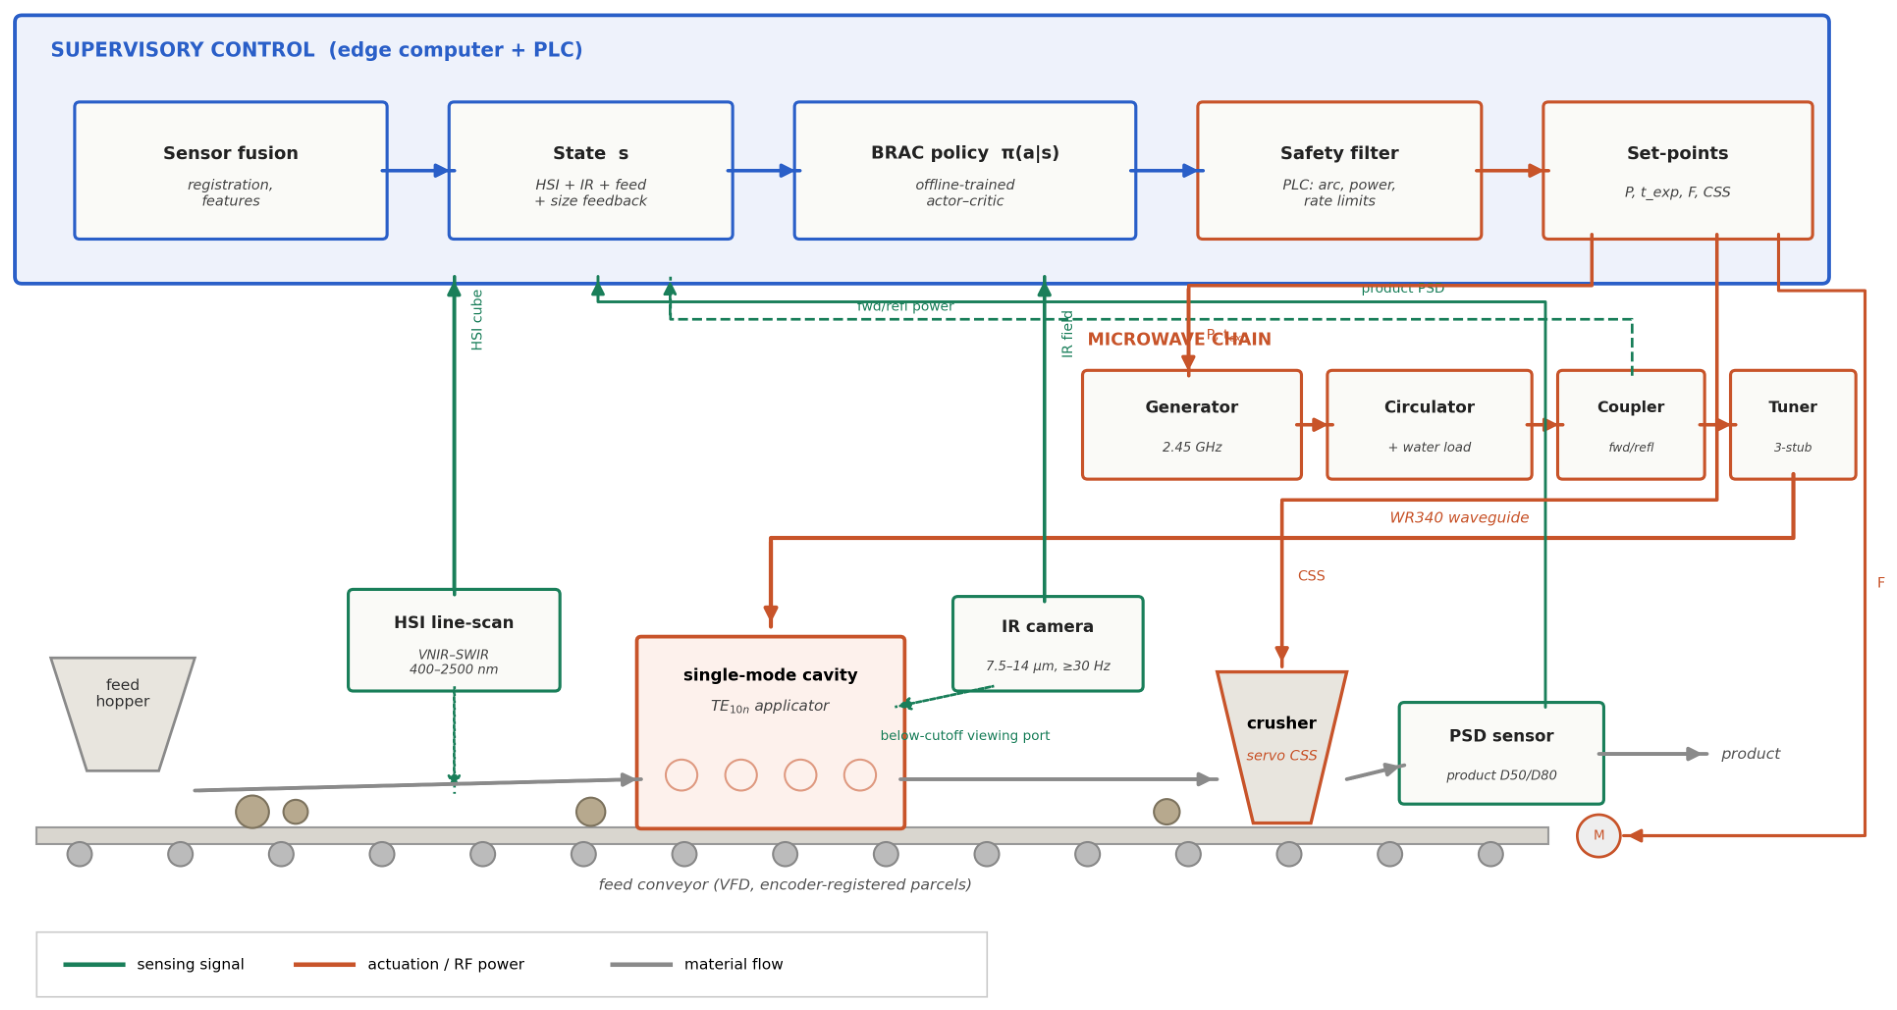
The intelligent crusher is organized as a perception–decision–actuation loop (Figure 1). Ore parcels on a feed conveyor are characterized by the HSI station. Each parcel passes through a microwave applicator observed by an IR camera. Treated material reports to a crusher with an adjustable closed-side setting (CSS). Product size is measured downstream. A supervisory controller ingests the fused sensor state and issues bounded actuation commands, microwave power P ∈ [1, 30] kW, exposure time t ∈ [0.2, 16] s, feed rate F ∈ [0.5, 5] t/h, and CSS ∈ [4, 25] mm—with hard safety limits enforced outside the learned policy.
Figure 1.
System architecture of the intelligent crusher. Bottom: process line (feed hopper, encoder-registered conveyor, hyperspectral line scan station, single-mode TE10n cavity applicator with below-cut-off infrared viewing port, servo adjustable crusher, product size analyzer). Middle: microwave chain (generator, circulator with water load, dual-directional coupler, three-stub tuner, WR340 waveguide). Top: supervisory control layer, in which fused sensor features form the state of the offline trained BRAC policy whose commands pass through a deterministic PLC safety filter before actuation. Green: sensing signals; orange: actuation commands and RF power; gray: material flow.
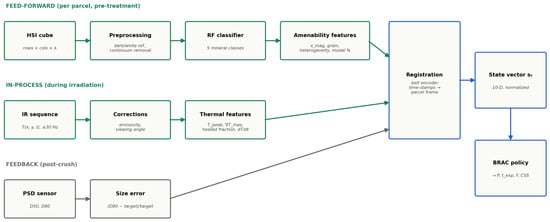
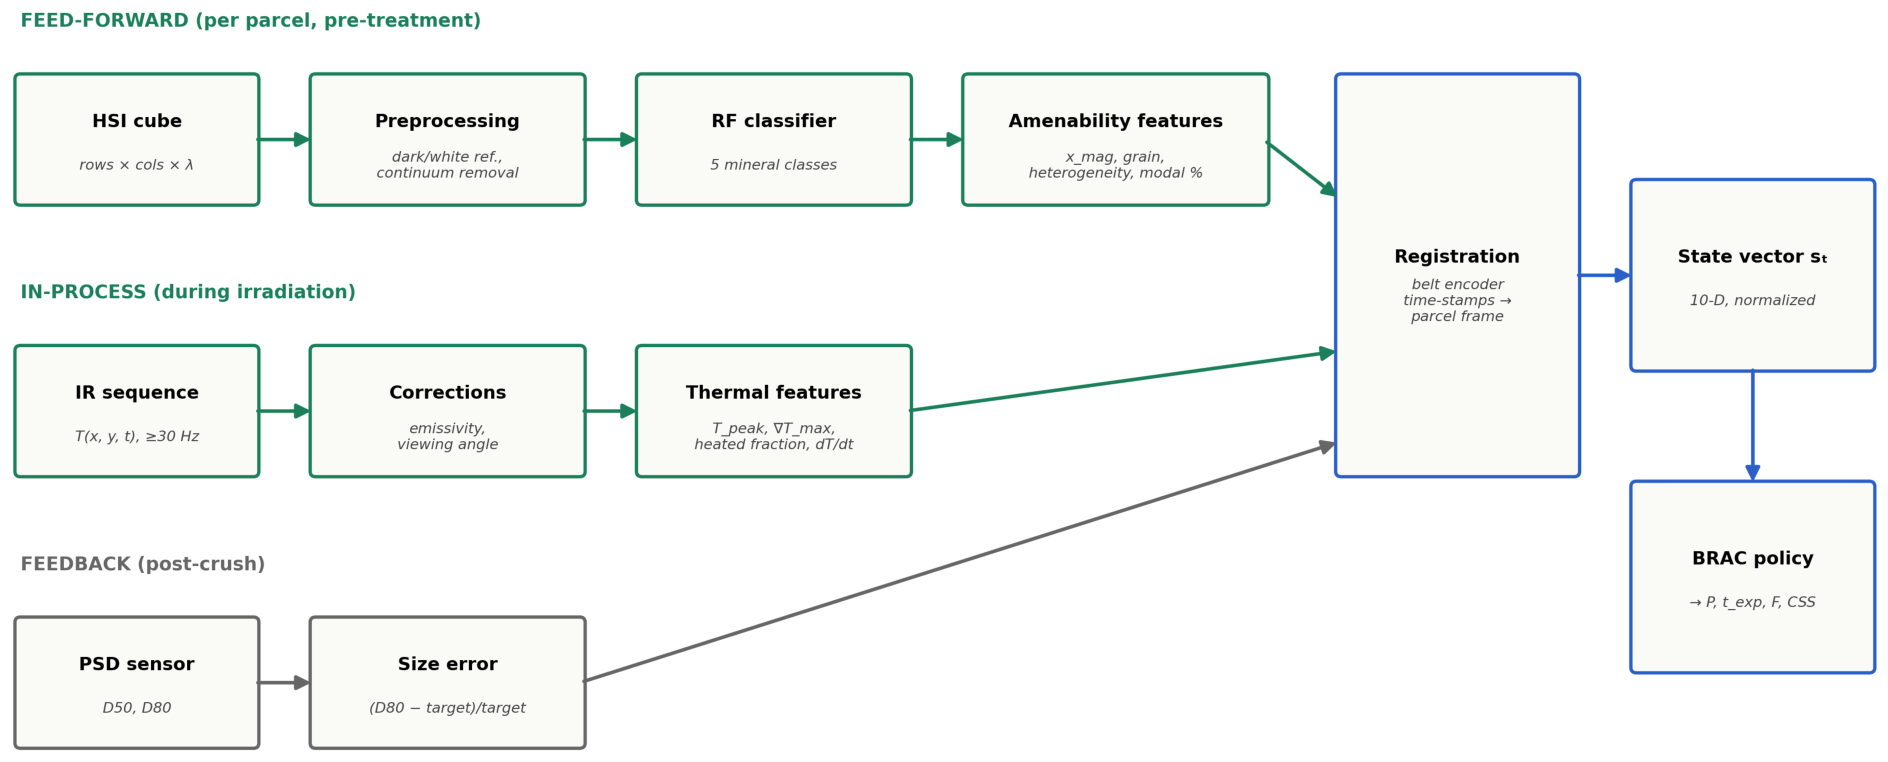
The specifications of the actuation subsystem are as follows: Microwave energy is delivered at 2.45 GHz from a magnetron or solid-state generator through a WR340 rectangular waveguide fitted with a circulator and water load (protecting the source from reflected power), a dual-directional coupler for forward/reflected power measurement, and a three-stub automatic tuner for impedance matching as the load mineralogy varies. A single-mode TE10n cavity applicator is preferred over a multi-mode oven because it concentrates the electric field into a high-power-density hot zone, through which the ore stream passes—consistent with the finding that high power density applied briefly maximizes weakening per unit energy [4,8,9]—at the cost of a smaller treatment volume and stricter tuning requirements [10]. Ore enters and exits the cavity through reactive choke tunnels dimensioned below the cut-off to suppress microwave leakage at the conveyor openings, supplemented by leakage interlocks. The infrared camera views the hot zone through a metallic hole array screen (with an aperture diameter well below the guided wavelength) or an IR transparent window offset from the field maximum. The HSI line scanner images the belt upstream of the cavity under stabilized halogen illumination, with a belt encoder synchronizing spectral lines, thermal frames, and parcel identity. The crusher closed-side setting is servo-actuated, and all actuators are commanded through a PLC whose hard-coded safety filter—comprising a power density ceiling, reflected power limit, leakage and over-temperature interlocks—bounds every action issued by the learned policy. The sensing, fusion, and state assembly chain that feeds this controller is summarized in Figure 2.
Figure 2.
Sensor fusion pipeline. Feed-forward branch: hyperspectral cubes are referenced, continuum-removed, classified, and reduced to amenability features (, grain size index, heterogeneity, modal mineralogy). In-process branch: emissivity-corrected infrared sequences yield thermal features (peak temperature, maximum gradient, heated area fraction, heating rate). Feedback branch: downstream size measurement provides the normalized D80 error. Belt encoder registration aligns all three streams to the parcel frame before assembly of the 10-dimensional state vector consumed by the BRAC policy. Green arrows carry sensing data acquired before or during treatment of the current parcel; gray arrows carry the post-crush feedback signal, which reaches the controller one parcel later; blue arrows carry the assembled state into the policy and the resulting action out of it.
The four commanded variables are not independent in hardware. On a continuously moving belt, the residence time in the hot zone is fixed by geometry and belt speed t = /v, while the feed rate is F = v; therefore, for a fixed hot zone length, t and F are inversely related and cannot be commanded independently. The applicator is therefore operated in an indexed stop-and-treat cycle: a parcel is advanced into the cavity, held for the commanded exposure, and indexed out, giving F = /(t + ) with parcel mass adjustable at the hopper gate and belt loading adjustable at the vibratory feeder. Every proposed action is then projected by the PLC onto the feasible set defined by the power and power density ceilings, the reflected power limit, the mass balance constraint, and the CSS range and its per-parcel rate limit, with any residual (t, F) inconsistency resolved in favor of t. Because the projection is applied identically during logging and evaluation, infeasible combinations never enter the offline dataset and cannot be selected at run time.
The end-to-end latency of the loop determines whether an action is applied on a current or a stale observation. The feed-forward chain costs about 2.85 s per parcel (2500 ms hyperspectral acquisition, 120 ms referencing and continuum removal, 180 ms random forest inference, 50 ms feature extraction), but it is pipelined: the belt encoder time-stamps each parcel at the hyperspectral station and the chain executes during the roughly 6 s of transport to the applicator, so sensing is never on the critical path. The critical path is about 0.86 s and is dominated by actuation rather than computation; state assembly and the policy forward pass together take under 2 ms, against a 10 ms fieldbus cycle, 50 ms generator settling, 200 ms servo CSS move, and 600 ms belt index stroke. Infrared features and the downstream size error enter the state with a deliberate one-parcel delay, which is how the Markov decision process is defined. The residual risk is therefore registration rather than latency, and is bounded by per-parcel identity tokens verified at the applicator entry photocell.
2.2. Hyperspectral Characterization Pipeline
Reflectance cubes are radiometrically calibrated and continuum-removed (upper convex hull), and a random forest classifier (200 trees) maps pixels to five classes: magnetite, hematite, silicate gangue, carbonate, and background. From the classification map, three microwave amenability features are extracted: the high loss phase fraction ; an absorber grain size index (75th percentile equivalent diameter of connected magnetite components, normalized); and a spatial heterogeneity index (patch-level standard deviation of ). These features, together with modal mineralogy, constitute the feed-forward portion of the controller state. In this study, the classifier is trained and demonstrated on a synthetic spectral library and synthetic ore cubes (Section 3.1); application to the authors’ measured HSI cubes follows the identical pipeline. The pipeline follows established practice in sensor-based sorting, where spectral preprocessing feeds a learned classifier whose output drives a downstream actuator in real time [34,38]. The difference here is that the classifier output conditions a continuous treatment policy rather than a binary accept/reject decision.
The synthetic demonstration excludes the four dominant error sources on a production belt. Dust and surface coating flatten diagnostic absorptions. Continuum removal suppresses the low-frequency multiplicative component and is complemented by a per-pixel standard normal variate transform, so features depend on band shape rather than absolute reflectance. Surface moisture introduces water absorptions near 1400 and 1900 nm, which are excluded from the feature set and retained instead as a covariate flagging parcels for conservative treatment. Uneven illumination is handled by per-line white referencing and is the reason the heterogeneity index uses patch-level statistics. Mixed pixels are intrinsic at a 1–3 mm ground sampling distance, so the measured data pipeline replaces the hard label map with a non-negative, sum-to-one linear spectral mixture model and computes as an abundance. Robustness is obtained by training on spectra augmented with physically structured perturbations rather than by adversarial training, since the perturbations of interest are structured rather than worst-case. Retaining the classifier posteriors instead of the argmax would additionally supply a per-parcel classification entropy, letting the policy retreat to low-dose actions when the feed is poorly characterized; this is identified as an extension for the measured data study. The in-process infrared branch carries an equivalent caveat: field measurements of rock surfaces are sensitive to emissivity assumptions, viewing angle, and ambient radiative loading, all of which bias apparent temperature and gradient unless corrected [39], so the thermal features used here should be regarded as model quantities until the correction chain is validated on the built machine.
2.3. Reduced-Order Process Model (Simulation Environment)
Because closed-loop training on physical equipment is unsafe, control validation uses a reduced-order model of the MAC process chain. Microwave dose q (kWh/t) follows from power, exposure, and parcel mass. Peak absorber temperature saturates in dose, = 25 + 950·a·(1 − e⌃(−q/3)), with absorptivity an increasing in . Thermal gradient scales with the peak temperature rise, decays with exposure time, and increases with absorber grain size. Microcrack damage D ∈ [0, 1] is a product of two sigmoids in peak temperature and gradient. Damage reduces the effective Bond work index by up to 45%, shifts product D80 below the CSS-governed baseline, and increases fines. Crushing energy follows Bond’s law, and liberation gain increases with intergranular damage but is penalized by over-fragmentation. The Gaussian process and sensor noise are applied throughout. Five synthetic magnetite-rich ore batches spanning grade ( 0.15–0.55), surface (fine disseminated to coarse), and competency (Wi 13–18.5 kWh/t) define the feed population. The gradient and damage expressions are initially set from published thresholds (∼200 °C, 6 °C mm−1 [19]) and are subsequently replaced by finite-element calibrated forms (Section 2.4 and Section 3.5). The coefficients reported in Section 3.5 are those used for all results in this paper.
2.4. Coupled Electromagnetic–Thermal–Mechanical Finite-Element Study
The reduced-order damage law of Section 2.3 is phenomenological, so a coupled electromagnetic–thermal–mechanical finite-element analysis (FEA) is performed to test it. The study is two-dimensional and serves three purposes: to validate or correct the damage law D(, T) used to train the controller; to locate the cracking threshold in dose and power density for this ore class; and to supply a physics-based justification for the high-power/short-exposure actuation preference. The approach follows the established numerical literature on microwave-induced rock damage, which includes thermal stress FEM on idealized two-phase particles [11,12], microstructure-resolved 2D/3D simulations of granite with finite-difference time-domain or FEM electromagnetic solvers [13,14,15], fully coupled formulations with temperature-dependent dielectric properties [29], and damage mechanics or damage viscoplasticity models of strength reduction after irradiation [16,17,18]. A three-dimensional vector field study in HFSS/Mechanical on measured microstructures is identified as the natural extension (Section 4).
Governing equations: The electromagnetic problem is the time-harmonic Maxwell (vector Helmholtz) equation, ×(∇ × E) − k02(− j)E = 0, solved in three dimensions with edge (Nédélec) vector elements [40]. The two-dimensional study executed here solves the equivalent scalar TMz problem by finite differences, over the cavity, waveguide feed, and ore charge, with a port excitation at the specified forward power, impedance (lossy wall), or perfect electric conductor boundary conditions on cavity walls, and below cut-off choke sections at the conveyor openings. The volumetric heat source is Q = 0|E|2, which drives transient heat conduction CpT/t = ·(k∇T) + Q with convective and radiative losses on free surfaces. The mechanical problem is quasi-static linear thermoelasticity, · = 0 with = C:(−T I), extended by a damage model: either a maximum tensile stress (Rankine) continuum damage law, with cohesive zone elements inserted along grain boundaries to capture the intergranular fracture mode that benefits liberation, or a damage viscoplastic formulation following [16]. Coupling in the two-dimensional study executed here is one-way and staggered throughout. The electromagnetic problem is solved once, at room temperature with the temperature-independent properties of Table 1, to obtain Q. Q drives the transient thermal solve, and the temperature field drives the quasi-static mechanical solve, the mechanical dissipation being negligible against Q [16]. Bi-directional coupling through temperature-dependent (T), (T)—essential at elevated temperature because the loss factor of many minerals rises steeply and can produce runaway hot spots [29,41,42]—is not implemented here and is a requirement of the planned three-dimensional study (Table 2). This single-pass formulation is the one used to recalibrate the reduced-order simulator in Section 3.5, and it is adequate for that purpose only because the recalibration extracts the shape of the gradient–exposure relation rather than absolute temperatures.
Table 1.
FEA input properties (representative room-temperature literature values). , at 2.45 GHz.
Table 2.
Solver configuration and verification results of the executed two-dimensional study together with the corresponding targets for the three-dimensional extension.
Geometry and microstructure: Two model scales are used. At applicator scale, the waveguide-fed cavity and ore charge are solved as an effective medium to obtain the field distribution and absorbed power density. At particle scale, the microstructure is taken directly from an HSI-derived phase map so that the sensing pipeline and the physics model share one description of the ore; the two scales are coupled by matching the absorbed dose. In the present two-dimensional study, the electromagnetic problem is solved by finite differences on a 180 × 420 grid and the thermal and mechanical problems by finite elements on a 192 × 192 mesh (104 m elements, 74,498 degrees of freedom). Mesh refinement and energy audit results are given in Table 2.
Table 1 assembles representative room-temperature material properties for the four modeled phases from the literature. These serve as FEA inputs until phase-specific measurements are available.
The two-dimensional study uses three discretizations. The electromagnetic problem is solved by the finite-difference frequency-domain method on a uniform structured 180 × 420 Cartesian grid with direct sparse LU factorization. The thermal problem uses four-node bilinear quadrilateral (Q4) elements with 2 × 2 Gauss quadrature on a structured 192 × 192 element mesh (37,249 nodes, h = 104 m), lumped capacity, the implicit backward Euler method at t ≤ t/200, and Robin conditions on the free boundary. The mechanical problem uses the same Q4 mesh under plane strain with two displacement degrees of freedom per node (74,498 DOF), a Rankine maximum principal stress damage criterion evaluated at the integration points and accumulated over grain boundary element pairs, and roller conditions on two edges and traction-free conditions elsewhere. The mesh coincides with the hyperspectral phase map, so no geometric approximation of the phase boundaries is introduced; the boundaries are correspondingly stair-stepped.
Grid independence is assessed on a single fixed geometry at three mesh levels with constant refinement ratio r = 2 (48 × 48, 96 × 96, and 192 × 192 elements; h = 416.7, 208.3, and 104.2 m), so that a three-level Richardson extrapolation is admissible. The raw output is given in Appendix A.2. The three quantities behave differently: Peak temperature converges non-monotonically, so no formal order can be extracted, but the level-to-level change is bounded by 0.25%. The grain boundary damage fraction is converged to 0.01% on the fine-grid convergence index. Maximum principal stress converges monotonically at an observed order p = 1.88, close to the theoretical second order of the Q4 element, giving a discretization error of 2.50% at the finest level. Three percent stress resolution is adequate here, because the recalibration draws on peak temperature and gradient, which are grid-independent, and on stress only through an integrated damage fraction that is itself converged; it would not be adequate for a study reporting absolute fracture stresses, and the 2% target is retained for the three-dimensional work.
The finite-element results are used for qualitative calibration of the damage law, not as quantitative predictions of stress or the crack path. Plane strain constrains the out-of-plane strain to zero and removes the gradient along the long axis of an elongated particle; it cannot represent the three-dimensional stress concentration around an embedded absorber grain, bounded in three dimensions by a closed surface rather than a closed curve, nor the branching crack paths that decide whether fracture is intergranular and liberating or transgranular and not. Only the shape of the fitted relations is transferred to the reduced-order model; absolute damage magnitude is scaled to the literature threshold [19].
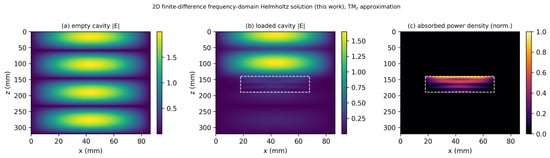
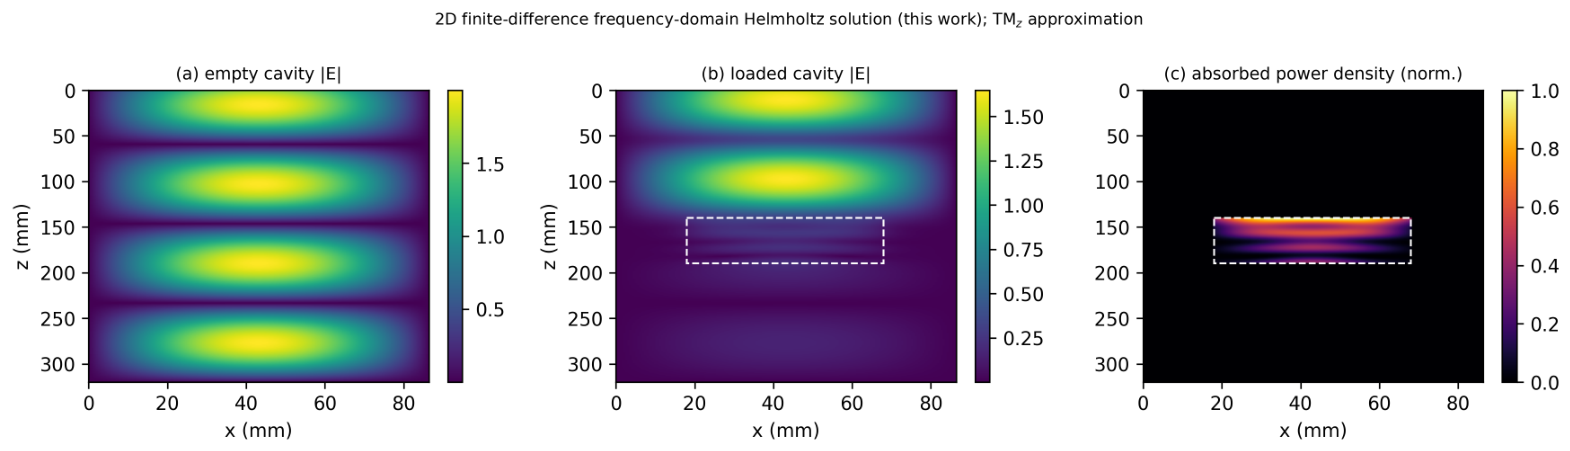
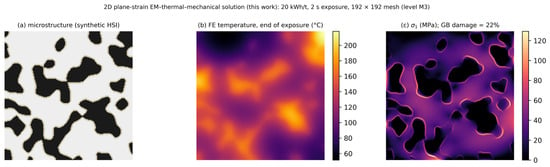
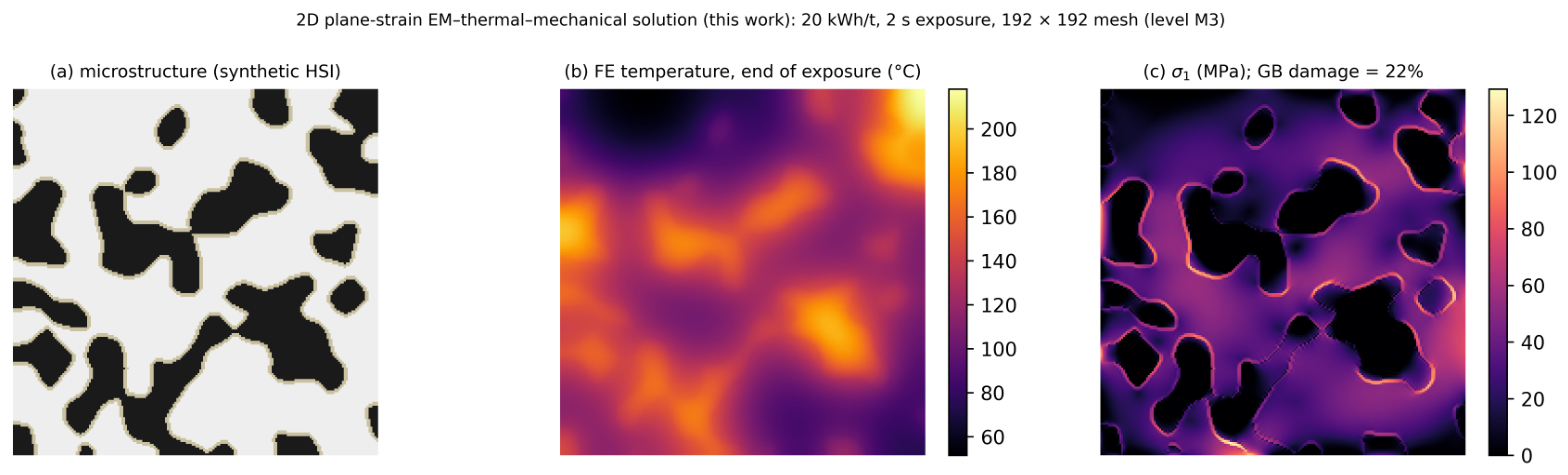
Figure 3, Figure 4 and Figure 5 present the executed study. Stage A solves the loaded cavity and Stage B the microstructure temperature and stress fields. Stage C sweeps exposure time at a constant dose to test the damage law directly.
Figure 3.
Stage A, applicator-scale electromagnetic solution at 2.45 GHz. (a) Electric field magnitude in the empty single-mode cavity, showing the unperturbed standing-wave pattern. (b) Electric field magnitude with the ore charge in place, showing that the lossy charge materially redistributes the field relative to the empty cavity. (c) Absorbed power density in the charge, concentrated in the high-loss phase. The energy audit closes to machine precision and the peak field varies by 0.11% between the two finest grids (Table 2).
Figure 4.
Stage B, microstructure-scale response at 20 kWh/t over 2 s. (Table A2). (a) Phase map used as the finite-element geometry. (b) Temperature field, peak 218.1 °C. (c) Maximum principal stress, 129.3 MPa at magnetite–silicate boundaries.
Figure 5.
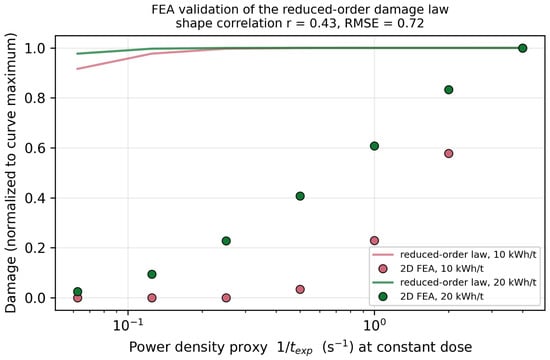
Normalized grain boundary damage against the power density proxy at constant dose, so that higher values on the horizontal axis correspond to shorter, more intense exposures. Filled circles are the two-dimensional finite-element results at 10 and 20 kWh/t; solid lines are the phenomenological reduced-order law of Section 2.3 evaluated at the same two doses. The law saturates near its maximum across almost the whole range, whereas the finite-element damage rises steadily with power density, giving a shape correlation of only r = 0.43 (RMSE = 0.72). This mismatch motivates the finite-element calibrated damage law of Section 3.5.
2.5. Offline Reinforcement Learning with BRAC
Treatment of successive parcels is modeled as a Markov decision process. The 10-dimensional state comprises HSI features (, grain, heterogeneity, modal mineralogy), normalized feed properties (Wi, feed D80), IR feedback from the previous parcel (peak temperature, maximum gradient, heated area fraction), and the previous product size error. The 4-dimensional continuous action is [P, t, F, CSS]. The reward combines liberation gain, the absolute D80 error against a 10 mm target, total specific energy, a fines penalty above 15%, and a large arcing penalty at excessive power density on the conductive feed with respective weights 1.0, 1.2, 0.8, 0.6, 5.0.
The offline dataset comprises 20,000 transitions (800 episodes of 25 parcels) logged by a noisy rule-based behavior policy—a heuristic operator with exploration noise and occasional random experiments—on four of the five ore batches; batch B3 (fine disseminated) is entirely excluded to test generalization. A Gaussian behavior-cloning (BC) model is fit to the data and used both as a baseline and as the behavior policy in the BRAC’s regularizer. The BRAC agent (policy regularization variant) trains twin critics against Polyak-averaged targets and maximizes Q(s, (s)) −·KL(b) with = 0.3. Training runs 8000 gradient steps per seed over five seeds. Hyperparameters are listed in Table 3. Baselines comprise fixed-parameter operation (mid-range settings), the rule-based heuristic, and BC. Evaluation uses the mean action of each trained policy over 40 episodes per ore batch per seed, so each learned controller entry in the comparison tables of Section 3.3 pools the five policies over 200 episodes per batch. Per-seed values are given in Appendix A.1. The baselines are deterministic and therefore seed-independent.
Table 3.
Training configuration and hyperparameters.
Because offline learning can only recommend actions the dataset supports, the coverage of the 20,000 logged transitions determines what the policy can learn. The behavior policy is not a single deterministic rule; its set points are functions of the sensed state, perturbed by exploration noise on every parcel and replaced on a fixed fraction of parcels by an action drawn uniformly from the admissible box. Support is non-zero everywhere but strongly non-uniform, and two regions are sparse by construction: the high-power/long-exposure corner, avoided because it triggers the arcing penalty, and the low-power/short-exposure corner, which forgoes the treatment opportunity. The KL penalty does not forbid out-of-distribution actions but prices them, so a sparse-region action is selected only when its advantage exceeds times the log density ratio. Section 3.2 shows empirically that the learned policy stays well inside the supported region. The safety-critical corner is additionally protected by the deterministic PLC projection, so a catastrophic action is unreachable even if the critic misjudges its value.
3. Results
All results in this section are simulation results obtained with the reduced-order model described in Section 2.3. They validate the control architecture, not the physical process, pending the FEA study (Section 2.4) and experiments.
3.1. HSI Pipeline Demonstration
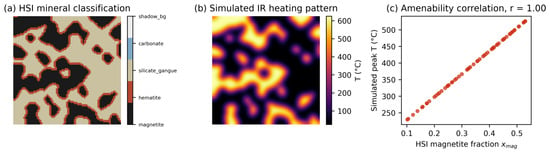
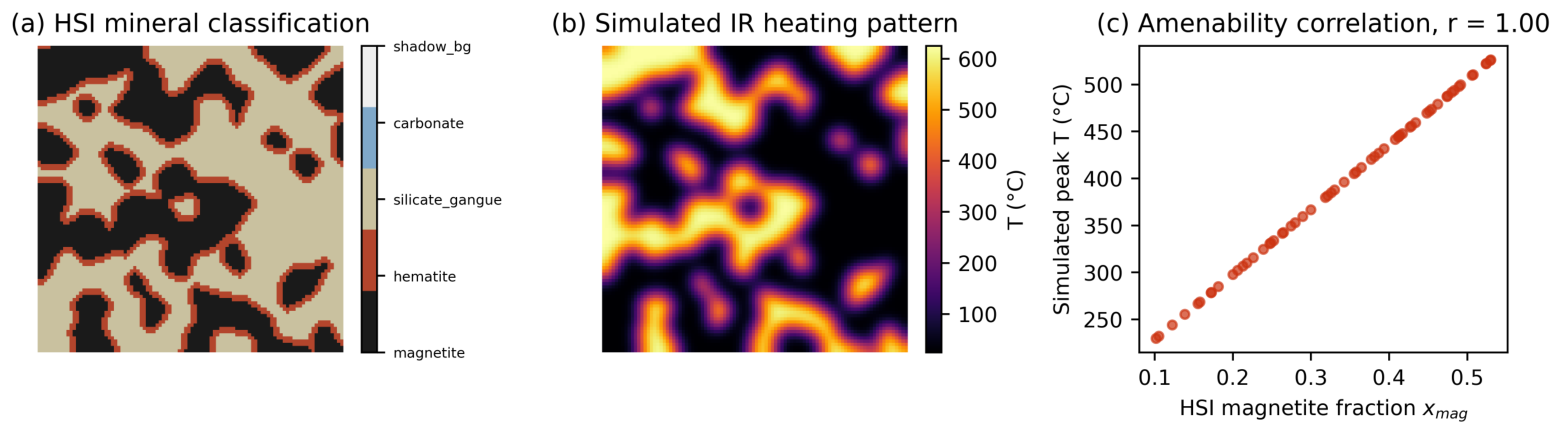
Figure 6 demonstrates the sensing pipeline on a synthetic ore cube: (a) the random forest mineral classification (5-fold cross-validation accuracy 1.00 on the noise-free synthetic library—an upper bound that will decrease on measured spectra); (b) the simulated IR heating pattern, spatially coincident with the magnetite phase, as expected from selective heating; and (c) the resulting monotonic relationship between the HSI-derived magnetite fraction and the simulated peak temperature (r = 1.00 under the model, by construction), which is the physical basis for using HSI features as the predictive state.
Figure 6.
Sensing pipeline demonstrated on a synthetic hyperspectral cube (a) mineral classification. (b) simulated infrared heating pattern. (c) correlation between HSI magnetite fraction and simulated peak temperature.
3.2. Offline Training Behavior
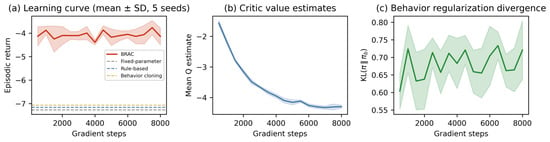
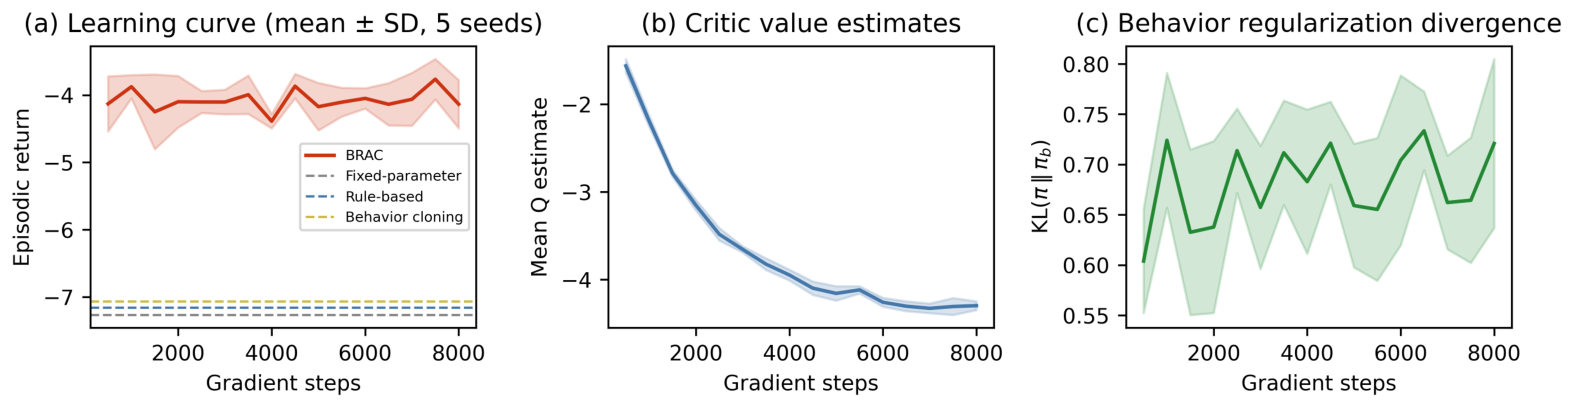
Figure 7 shows BRAC training diagnostics over five seeds on the FEA-calibrated simulator. Episodic return stabilizes within ∼2000 gradient steps at a level exceeding all baselines and remains stable to 8000 steps (final returns −3.86 to −4.66 across seeds; per-seed results in Appendix A.1). Critic Q estimates converge smoothly toward the realized return scale without the divergent overestimation typical of unregularized offline learning, and the KL divergence to the behavior policy remains bounded at 0.6–0.9 nats, confirming that the regularizer constrains the policy to well-supported actions.
Figure 7.
BRAC offline training diagnostics on the finite-element calibrated simulator, over five training seeds. (a) Evaluation return against gradient steps for BRAC and the three baselines. (b) Mean critic values estimate. (c) KL divergence to the behavior policy.
Seed-to-seed variability is small relative to episode-to-episode variability. The five independently trained policies span mean returns of −4.655 to −3.858 and mean absolute D80 errors of 0.423 to 0.707 mm, against pooled episode-level standard deviations of 1.298 and 0.148, respectively, while fines fraction and liberation gain are almost seed-invariant. Every seed outperforms fixed-parameter operation in both return and size targeting error, so no conclusion depends on seed selection.
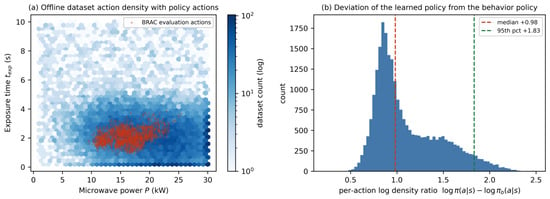
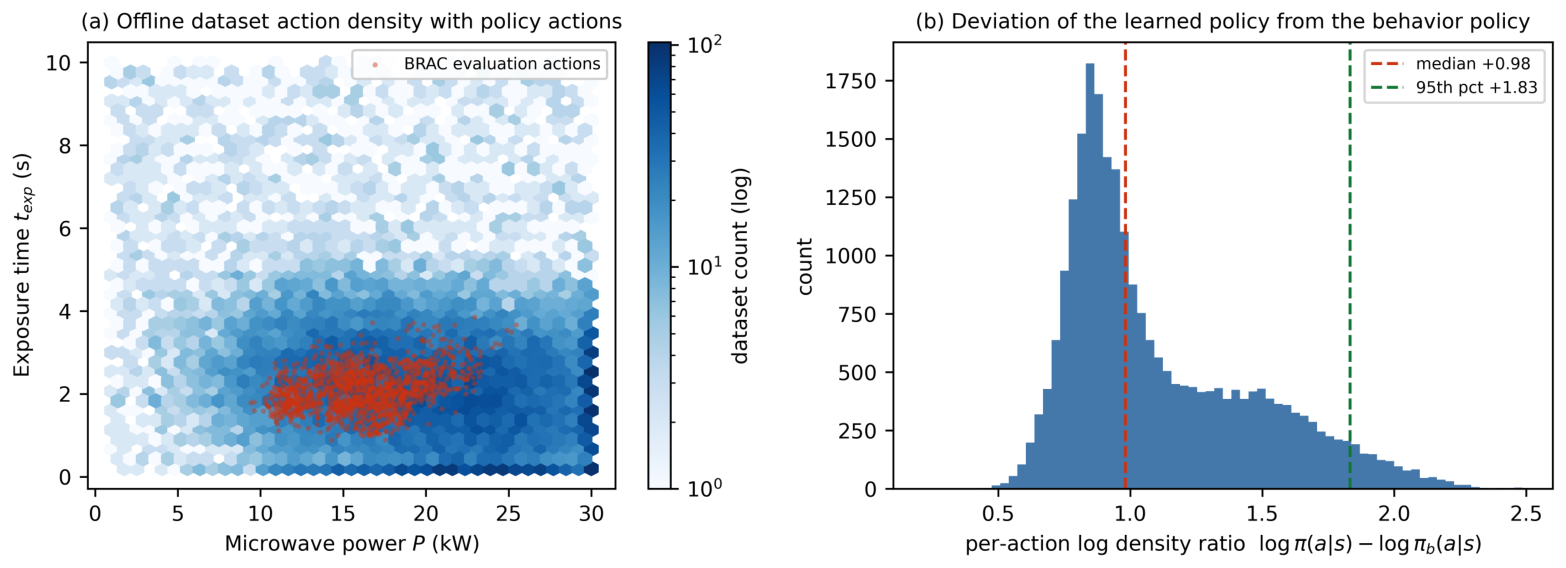
Because an offline policy is only trustworthy where the logged data provide support, we quantify how far the learned controller departs from the behavior policy. Figure 8a shows the empirical density of logged actions in the (P, ) plane with the evaluation actions of the trained policy overlaid. The logged data span the full actuation envelope (P 1.0–30.0 kW, 0.2–10.0 s), whereas the learned policy confines itself to P 9.4–25.7 kW and 0.81–4.01 s—an interior subregion of the support, consistent with the short-exposure/moderate-power regime that the finite-element damage law rewards. Figure 8b reports the per-action log density ratio log (a|s) − log b(a|s): its median is +0.98 nats, the 95th percentile +1.83, and the 99th percentile +2.08, so even the most off-behavior action selected during evaluation is about eight times more likely under the learned policy than under the behavior policy, and no evaluation action falls outside the convex range of logged actions. These magnitudes are consistent with the KL divergence of 0.6–0.9 nats observed during training (Figure 7c) and confirm that the behavior regularizer, rather than the evaluation protocol, is what keeps the policy inside the supported region.
Figure 8.
Coverage of the offline dataset by the learned policy (a) Empirical density of the 20,000 logged behavior-policy actions in the microwave power–exposure time plane, shown as a hexagonal-bin logarithmic count map; the red markers are a random subsample of 1500 evaluation actions taken by the trained BRAC policy, overlaid on the same axes to show that the policy occupies an interior subregion of the logged support. (b) Distribution of the per-action log density ratio over all 25,000 evaluation state–action pairs, with the median (five seeds), with median and 95th percentile marked.
3.3. Learned Versus Conventional Control
Table 4 reports the primary comparison over all five batches (40 episodes per batch per controller) on the FEA-calibrated simulator, with the BRAC row pooled across the five training seeds. BRAC achieves the best return (−4.19 ± 1.30), a 62% reduction in mean absolute D80 error relative to fixed-parameter operation (0.540 vs. 1.426 mm), and the lowest total specific energy (6.22 vs. 6.50 kWh/t, −4.2%; and −22% relative to the rule-based and BC controllers, which purchase size accuracy with energy). Fines fraction and liberation gain are statistically indistinguishable among the three adaptive controllers (BRAC 0.160 ± 0.064 and 0.117 ± 0.048; rule-based 0.164 and 0.119; behavior cloning 0.170 and 0.124), with all of them being above the fixed-parameter values (0.110 and 0.083) because any adaptive policy delivers more damage per tonne. Notably, BRAC outperforms behavior cloning trained on the identical dataset by 2.9 return points, and the improvement is attributable to offline RL itself rather than to imitation of the logged operator.
Table 4.
Simulation comparison over all five ore batches. Baseline rows are deterministic policies (mean ± SD over 200 episodes). The BRAC row is pooled across all five training seeds (mean of the five per-seed means ± SD over the 1000 pooled episodes); per-seed values are given in Table A1. Higher return and lower error/energy are better; target D80 = 10 mm.
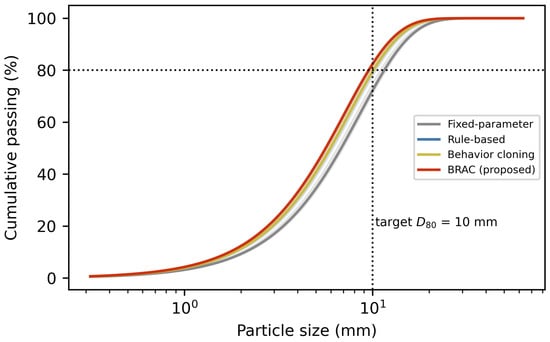
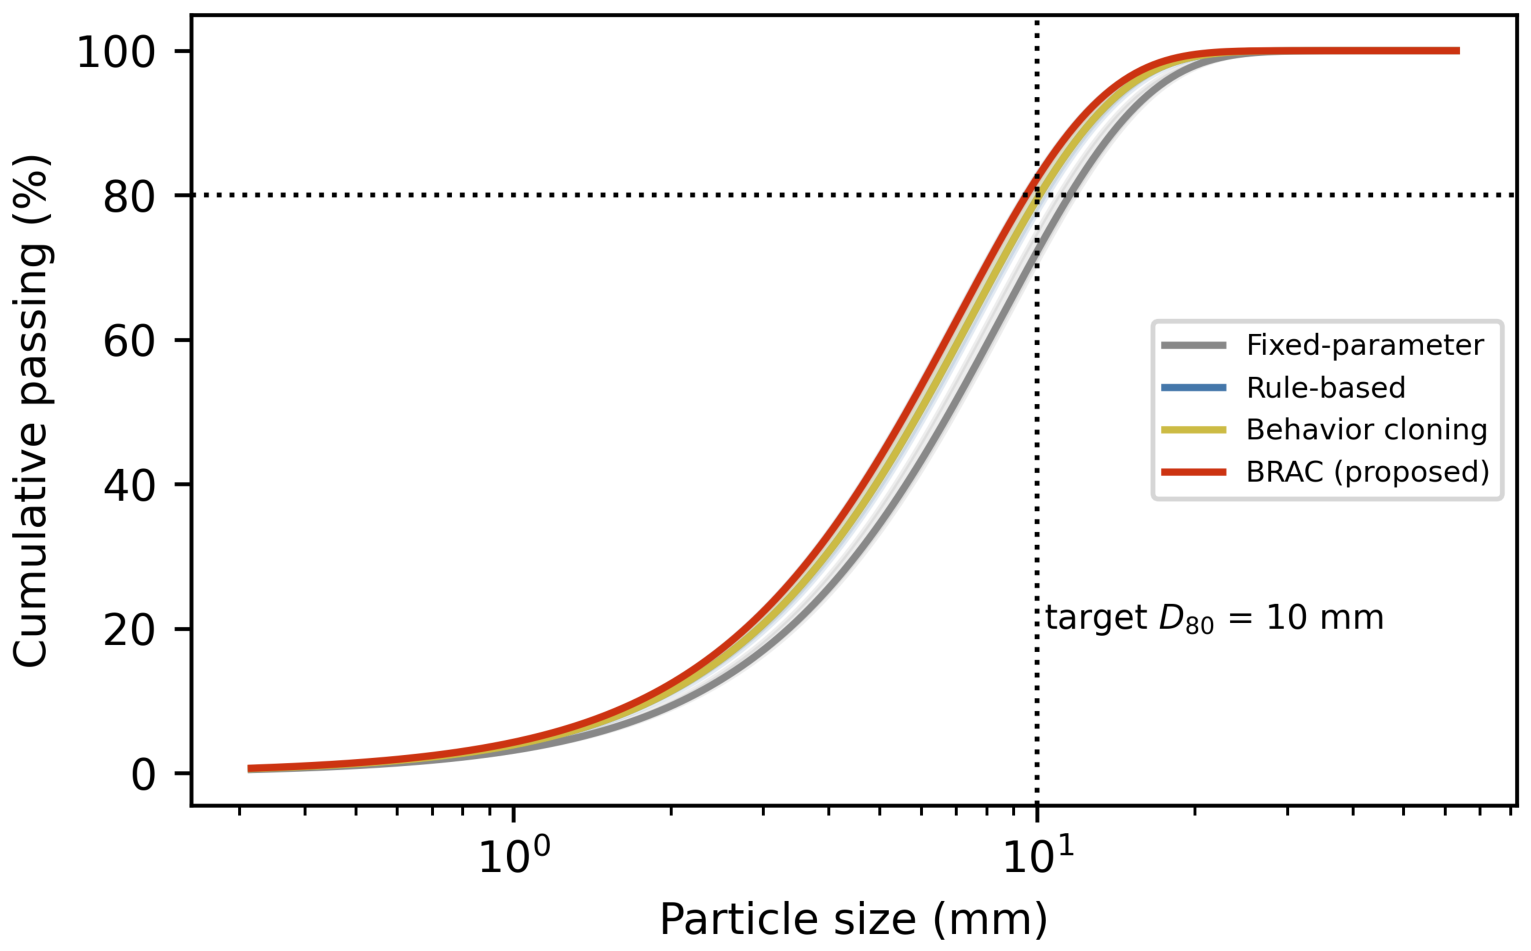
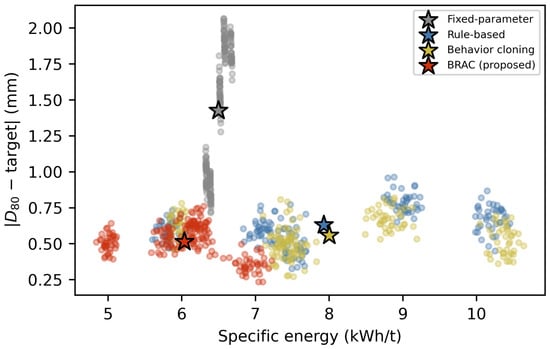
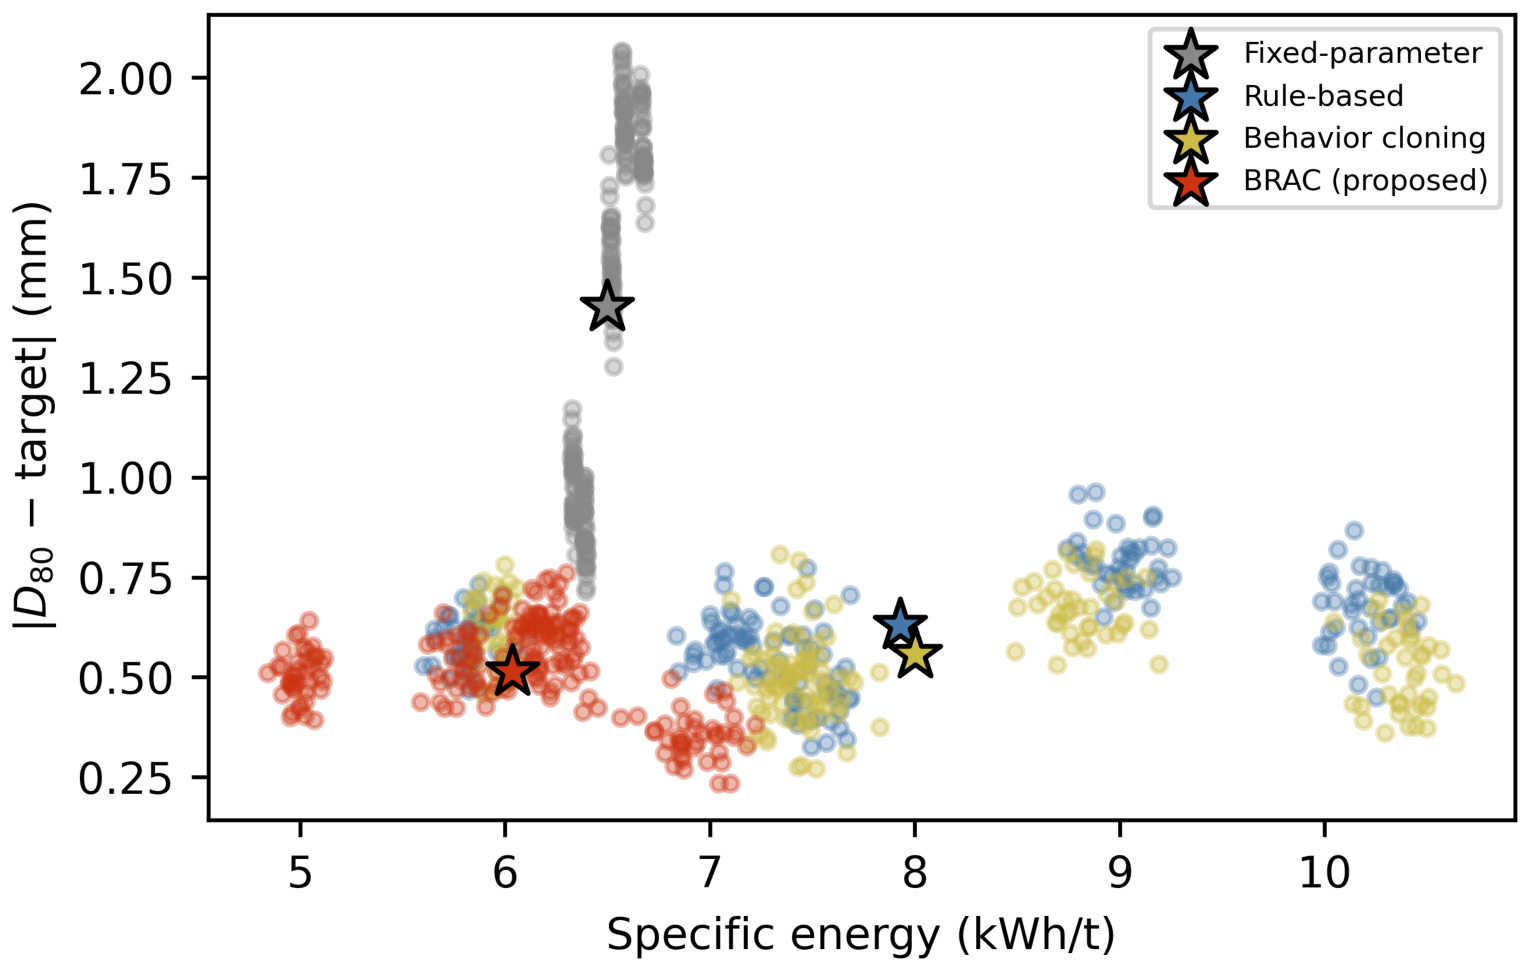
Figure 9 shows reconstructed product size distributions (Rosin–Rammler curves through episode mean D80 with interquartile bands). The BRAC distribution is centered on the target with visibly tighter spread. Figure 10 shows the energy–accuracy plane. The BRAC episode cluster occupies the lower-left (Pareto-dominant) region, and is simultaneously more accurate and less energy-intensive than every baseline mean.
Figure 9.
Reconstructed product size distributions for the four controllers, as Rosin–Rammler curves fitted through the episode-mean D80 with interquartile bands.The vertical dashed line marks the 10 mm product size target against which the size targeting error of Table 4 is computed; the BRAC distribution is centered on that target with visibly tighter spread.
Figure 10.
Energy–accuracy trade off across all evaluation episodes (simulation)Stars denote controller means. BRAC dominates the lower left frontier. The BRAC cluster lies closest to the origin, being simultaneously more accurate and less energy-intensive than every baseline mean.
3.4. Generalization to a Held-Out Ore Batch
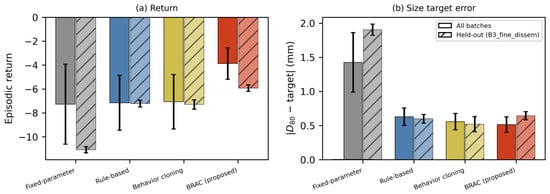
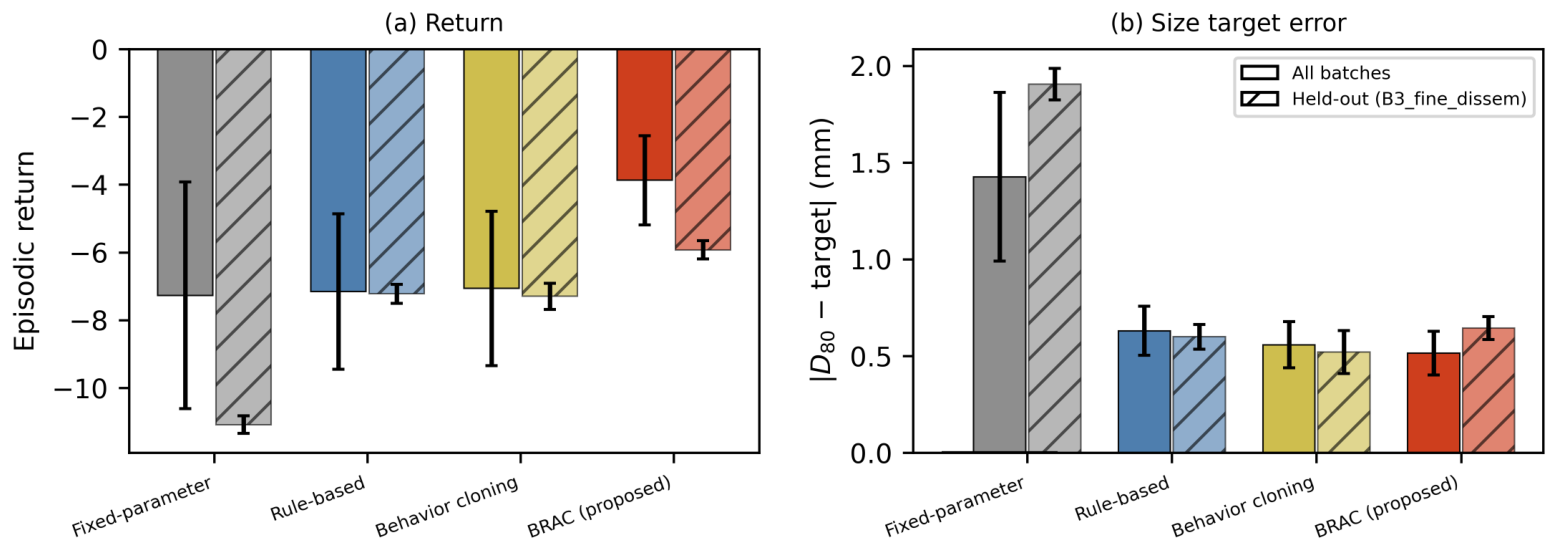
Table 5 and Figure 11 report performance on batch B3 (fine disseminated magnetite), which contributes no transitions to the logged dataset. As in Table 4, the BRAC row is pooled across the five seeds. BRAC retains the best return (−6.04 ± 0.48 vs. −11.09 ± 0.26 for fixed-parameter control) and a 68% lower size targeting error (0.612 vs. 1.905 mm), confirming that the sensor-conditioned policy transfers to unseen feeds. Its specific energy on this batch (6.38 kWh/t) is 3.1% below that of fixed-parameter operation and roughly 12% below that of the rule-based and behavior-cloning controllers. Behavior cloning attains a slightly lower size error on this batch (0.520 mm) at a cost of 1.03 kWh/t more energy, so the two policies occupy different points within the same trade-off rather than one dominating the other. Fixed-parameter control degrades most (1.905 mm), illustrating the feed variability failure mode that motivates adaptive control.
Table 5.
Held-out batch B3 (fine disseminated; excluded from all training data). Baseline rows are deterministic policies (mean ± SD over 40 episodes); the BRAC row is pooled across all five seeds (mean of per-seed means ± SD over the 200 pooled episodes) on the same basis as Table 4.
Figure 11.
Generalization to held-out batch B3, excluded from training. (a) Episodic return. (b) Absolute size targeting error. Solid bars: all five ore batches. Hatched bars: batch B3 only. Error bars: one standard deviation over episodes.
3.5. Finite-Element Results and Correction of the Damage Law
The electromagnetic solve (Figure 3) confirms that the ore charge materially redistributes the cavity field: the loaded solution departs from the empty cavity mode, and absorbed power concentrates in the lossy phase. Numerically, the solution is sound: the energy audit closes to machine precision and |E|max varies by 0.11% between the two finest grids.
At microstructure scale (Figure 4), 20 kWh/t delivered over 2 s produces a peak temperature of 218.1 °C, a maximum principal stress of 129.3 MPa concentrated at magnetite–silicate boundaries, and a grain boundary damage fraction of 0.221. These are the level-M3 values of the grid study (Table A2), and all microstructure-scale results quoted in this section are computed on that single mesh and geometry. A dose scan on the same configuration places the damage onset between 10 and 15 kWh/t: damage is nil at 5 kWh/t ( 73 °C), below 0.001 at 10 kWh/t (122 °C), 0.094 at 15 kWh/t (170 °C), 0.221 at 20 kWh/t (218 °C), and 0.391 at 30 kWh/t (315 °C). The steep rise therefore occurs between 170 and 218 °C, bracketing the ∼200 °C cracking threshold reported from infrared thermography of granite [14]. This is an independent consistency check, since no threshold is imposed on the mechanical model.
The constant dose sweep (Figure 5) produces the most consequential result of the study. Fitting the finite-element gradient field gives T = c( − 25)/(1 + t/)⌃p with c = 3.14, = 0.019 s, and p = 0.572 (R2 = 1.000). Thermal gradients decay steeply with exposure time as conduction smooths the field. Consequently, damage at 20 kWh/t falls from 0.63 to 0.02 as exposure lengthens from 0.25 to 16 s. The phenomenological law of Section 2.3 does not reproduce this behavior—it saturates near 0.80 irrespective of exposure (normalized shape correlation r = 0.43, RMSE = 0.72)—and therefore over-rewards long exposures during controller training.
Following the correction protocol, the damage law is re-fitted to the finite-element grid as a product of sigmoids in peak temperature and gradient (T0 = 155.8 °C, a_T = 33.4 °C, g0 = 56.6 °C mm−1, a_g = 34.6 °C mm−1; R2 = 0.965, RMSE = 0.043), the simulator is updated, and the BRAC policy is retrained from scratch on the corrected physics over five seeds. All results reported in Section 3.2, Section 3.3 and Section 3.4 and in Table 4 and Table 5 are post-correction. To make the pre- and post-correction figures comparable, the pre-correction controller is likewise retrained over five seeds on the original simulator and evaluated on the same across-seed basis. On that common footing, the advantage of BRAC over fixed-parameter operation in size targeting error widens from 37% before correction to 62% after it, because the corrected physics reward exactly the short-exposure, well-timed treatments that a learned policy can select and a fixed-parameter schedule cannot. The energy advantage moves in the opposite direction, from 6.1% to 4.2%, since the corrected law makes damage—and hence the grinding energy saving—harder to obtain at long exposures. The net effect on return is nonetheless strongly positive.
Grid independence is assessed on a single fixed geometry at three mesh levels with a constant refinement ratio r = 2 (Table A2). Peak temperature and damage are grid-independent at the finest level ( = 0.25%, damage = 0.001 between the two finest meshes). Maximum principal stress converges monotonically with an observed order of accuracy p = 1.88, close to the theoretical second order of the Q4 element, giving a Richardson-extrapolated value of , max = 132.6 MPa. The finest-mesh result of 129.3 MPa therefore carries an estimated discretization error of 2.5% and a fine-grid convergence index of 3.21%. Stress is thus resolved to within approximately 3%, which is adequate for the damage law calibration reported here but does not yet meet the 2% target set for the three-dimensional study. The boundary-adjacent stress concentrations are the limiting feature and motivate the boundary-refined meshing planned for that work.
4. Discussion
The simulation study supports three conclusions about the control architecture: First, offline RL adds value beyond imitation: BRAC improves on behavior cloning by 2.9 return points from the same 20,000 logged transitions, indicating that the critic extracts and recombines high-value action patterns present only sparsely in the operator data. Second, the learned policy is Pareto-improving rather than single-objective: it simultaneously reduces size targeting error (−62% vs. fixed) and energy (−4.2% vs. fixed; −22% vs. the rule-based operator), whereas each baseline sacrifices one objective for the other. The simulated energy improvement is of the same order as, though smaller than, the ∼9% specific energy reduction reported in pilot-scale microwave treatment [9]; the two figures are not directly comparable. Third, conditioning the policy on HSI-derived mineralogy enables generalization: performance is retained on a texturally distinct held-out batch, the simulator analog of the operationally relevant scenario for real ore streams. The architecture is retrofittable and changes nothing in the comminution flowsheet. The training requirement matches industrial practice, since the policy is learned from logs of the plant’s existing heuristic schedule with no exploratory trials on production equipment. Commissioning can be staged behind the deterministic PLC filter, in advisory mode first with operator accept/reject decisions logged as further training data, and reverted at any point without interrupting the process. The economic case rests on both terms together, since, at the simulated 4.2% energy reduction and 62% size targeting improvement, the value is split between direct energy cost and the downstream effect of a tighter size distribution on mill throughput and recovery.
Some concern arose regarding the control results, where the agent optimizes a reward defined by the same reduced-order simulator on which it is evaluated. Furthermore, the finite-element study is two-dimensional and single-pass, featuring temperature-independent properties, a stair-stepped pixel mesh with peak stress converged only to approximately 3%, and a uniform in-parcel field at the microstructure scale. Consequently, only the shape of the calibrated relations transfers. Finally, dataset coverage remains an artifact of a synthetic behavior policy, whereas a real operator log would be narrower and significantly less exploratory.
From a mechatronic systems perspective, the study illustrates that machine intelligence here emerges from integration rather than from any single component: physics bounded actuation makes learned control safe, dual modality sensing makes the process observable, and behavior-regularized offline learning makes adaptation feasible without exploratory risk on capital equipment [20,21,25,26]. The intelligent crusher is, in this sense, the comminution stage counterpart of the cyber physical sorting machines already entering mineral value chains [27,35]: both replace fixed operator set schedules with sensor-conditioned decisions, and both are defined by the co-design of imaging, actuation, and control. A natural extension is the human-centric dimension emphasized by Mine 5.0 [28] and by recent machine vision practice in manufacturing [43]—namely, presenting the reasoning of the learned policy to the operator, and allowing supervisory override, so that adaptivity does not come at the cost of transparency.
5. Conclusions
The design and simulation-based validation of an intelligent crusher—a mechatronic system integrating microwave actuation, thermal–hyperspectral sensing, and behavior-regularized offline reinforcement learning control for adaptive microwave assisted comminution—have been presented. A coupled two-dimensional electromagnetic–thermal–mechanical finite-element study reproduced cracking thresholds from the literature and revealed that thermal gradients decay with exposure time as (1 + t/)−0.57, correcting a phenomenological damage law that had been exposure insensitive. On the recalibrated simulator, the BRAC controller reduced size targeting error by 62% and total specific energy by 4.2%, averaged over five training seeds, relative to fixed-parameter operation, outperformed rule-based and behavior-cloning baselines trained on identical data, and generalized to an unseen ore batch. Future work comprises a three-dimensional study on measured microstructures with temperature-dependent dielectric properties, application of the hyperspectral pipeline to the authors’ measured ore cubes, and staged experimental deployment in which the offline trained policy is evaluated on instrumented laboratory hardware.
Author Contributions
Conceptualization, G.C. and F.K.; methodology, G.C.; software, G.C.; validation, G.C., G.T., and F.K.; formal analysis, G.C.; investigation, G.C.; writing—original draft preparation, G.C.; writing—review and editing, G.T., A.P.M., A.A., and F.K.; supervision, A.P.M. and A.A.; project administration, F.K. All authors have read and agreed to the published version of the manuscript.
Funding
This research received no external funding.
Data Availability Statement
The simulation code, the offline reinforcement learning dataset, and the finite-element run logs that support the reported results are available from the corresponding author upon reasonable request.
Conflicts of Interest
The authors declare no conflicts of interest.
Appendix A. Supplementary Verification Data
Appendix A.1. Per-Seed Control Results
Table A1 reports every evaluation metric separately for each of the five training seeds for all five ore batches (200 episodes per seed) and for the held-out batch B3 alone (40 episodes per seed). Across seeds, the mean return is −4.186, the mean absolute D80 error 0.540 mm, the mean specific energy 6.223 kWh/t, the mean fines fraction 0.160, and the mean liberation gain 0.117. The standard deviations of the five per-seed means are 0.365, 0.101, 0.129, 0.004, and 0.003, respectively, so fines and liberation are extremely stable across seeds while the size targeting error is the most seed-sensitive metric (0.422–0.707 mm). Every individual seed outperforms fixed-parameter operation in return and in size targeting error, so the conclusions of Section 3.3 do not depend on seed selection. The values in Table 4 and Table 5 of the main text are the pooled across-seed figures from this table.
Table A1.
Per-seed evaluation results: all batches (upper panel) and held-out batch B3 (lower panel). Per-seed entries are mean ± SD over that seed’s episodes. The ‘Across seeds’ rows give the mean of the per-seed means ± SD over the pooled episodes, which is the convention used in Table 4 and Table 5. The final column gives the median per-action log density ratio against the behavior policy.
Appendix A.2. Grid Independence Study and Richardson Extrapolation
Table A2 gives the raw solver output for the three mesh levels used in the grid independence study of the microstructure-scale thermal–mechanical model. All levels solve the same fixed geometry, obtained by nearest-neighbor resampling of one 192 × 192 phase map, at a constant refinement ratio r = 2, so that a three-level Richardson extrapolation is admissible. An additional intermediate level (64 × 64, h = 312.5 m, 8450 DOF, = 221.56 °C, ,max = 103.61 MPa, damage = 0.106) was also computed but is excluded from the extrapolation because it does not lie on the r = 2 sequence.
Table A2.
Grid independence study: raw solver output at three mesh levels with constant refinement ratio r = 2 and the resulting three-level Richardson extrapolation. The observed order of accuracy for maximum principal stress, p = 1.88, is close to the theoretical second order of the bilinear quadrilateral element. Peak temperature converges non-monotonically (the sign of the difference changes between levels), so a formal order cannot be extracted; the level-to-level change is nevertheless bounded by 0.25%. GCI denotes the fine-grid convergence index computed with a factor of safety of 1.25.
References
- Ballantyne, G.R.; Powell, M.S. Benchmarking comminution energy consumption for the processing of copper and gold ores. Miner. Eng. 2014, 65, 109–114. [Google Scholar] [CrossRef] [Scilit]
- Kingman, S.W.; Rowson, N.A. Microwave treatment of minerals—A review. Miner. Eng. 1998, 11, 1081–1087. [Google Scholar] [CrossRef] [Scilit]
- Chen, J.; Li, X.; Gao, L.; Guo, S.; He, F. Microwave treatment of minerals and ores: Heating behaviors, applications, and future directions. Minerals 2024, 14, 219. [Google Scholar] [CrossRef] [Scilit]
- Kingman, S.W.; Jackson, K.; Cumbane, A.; Bradshaw, S.M.; Rowson, N.A.; Greenwood, R. Recent developments in microwave assisted comminution. Int. J. Miner. Process. 2004, 74, 71–83. [Google Scholar] [CrossRef] [Scilit]
- Jones, D.A.; Kingman, S.W.; Whittles, D.N.; Lowndes, I.S. Understanding microwave assisted breakage. Miner. Eng. 2005, 18, 659–669. [Google Scholar] [CrossRef] [Scilit]
- Ali, A.Y.; Bradshaw, S.M. Bonded particle modelling of microwave induced damage in ore particles. Miner. Eng. 2010, 23, 780–790. [Google Scholar] [CrossRef] [Scilit]
- Kingman, S.W.; Vorster, W.; Rowson, N.A. The influence of mineralogy on microwave assisted grinding. Miner. Eng. 2000, 13, 313–327. [Google Scholar] [CrossRef] [Scilit]
- Batchelor, A.R.; Jones, D.A.; Plint, S.; Kingman, S.W. Deriving the ideal ore texture for microwave treatment of metalliferous ores. Miner. Eng. 2015, 84, 116–129. [Google Scholar] [CrossRef] [Scilit]
- Batchelor, A.R.; Buttress, A.J.; Jones, D.A.; Katrib, J.; Way, D.; Chenje, T.; Stoll, D.; Dodds, C.; Kingman, S.W. Towards large scale microwave treatment of ores: Part 2—Metallurgical testing. Miner. Eng. 2017, 111, 5–24. [Google Scholar] [CrossRef] [Scilit]
- Buttress, A.J.; Katrib, J.; Jones, D.A.; Batchelor, A.R.; Craig, D.A.; Royal, T.A.; Dodds, C.; Kingman, S.W. Towards large scale microwave treatment of ores: Part 1—Basis of design, construction and commissioning. Miner. Eng. 2017, 109, 169–183. [Google Scholar] [CrossRef] [Scilit]
- Whittles, D.N.; Kingman, S.W.; Reddish, D.J. Application of numerical modelling for prediction of the influence of power density on microwave assisted breakage. Int. J. Miner. Process. 2003, 68, 71–91. [Google Scholar] [CrossRef] [Scilit]
- Wang, Y.; Djordjevic, N. Thermal stress FEM analysis of rock with microwave energy. Int. J. Miner. Process. 2014, 130, 74–81. [Google Scholar] [CrossRef] [Scilit]
- Meisels, R.; Toifl, M.; Hartlieb, P.; Kuchar, F.; Antretter, T. Microwave propagation and absorption and its thermo mechanical consequences in heterogeneous rocks. Int. J. Miner. Process. 2015, 135, 40–51. [Google Scholar] [CrossRef] [Scilit] [PubMed]
- Toifl, M.; Meisels, R.; Hartlieb, P.; Kuchar, F.; Antretter, T. 3D numerical study on microwave induced stresses in inhomogeneous hard rocks. Miner. Eng. 2016, 90, 29–42. [Google Scholar] [CrossRef] [Scilit]
- Toifl, M.; Hartlieb, P.; Meisels, R.; Antretter, T.; Kuchar, F. Numerical study of the influence of irradiation parameters on the microwave induced stresses in granite. Miner. Eng. 2017, 103–104, 78–92. [Google Scholar] [CrossRef] [Scilit]
- Saksala, T. Numerical modelling of microwave heating assisted rock fracture. Rock Mech. Rock Eng. 2022, 55, 481–503. [Google Scholar] [CrossRef] [Scilit]
- Xu, T.; Yuan, Y.; Heap, M.J.; Zhou, G.-L.; Perera, M.S.A.; Ranjith, P.G. Microwave-assisted damage and fracturing of hard rocks and its implications for effective mineral resources recovery. Miner. Eng. 2021, 160, 106663. [Google Scholar] [CrossRef] [Scilit]
- Su, X.; Li, D.; Zhao, J.; Wang, M.; Su, X.; Zhou, A. Numerical simulation of microwave induced cracking and melting of granite based on mineral microscopic models. Int. J. Miner. Metall. Mater. 2024, 31, 1512–1524. [Google Scholar] [CrossRef] [Scilit]
- Sun, T.; Ma, Z. Microwave heating and fracturing of granite: Insights from infrared thermal imaging. J. Therm. Stresses 2022, 45, 762–771. [Google Scholar] [CrossRef] [Scilit]
- Fujimoto, S.; Meger, D.; Precup, D. Off policy deep reinforcement learning without exploration. In Proceedings of the 36th International Conference on Machine Learning (ICML), Long Beach, CA, USA, 9–15 June 2019; pp. 2052–2062. [Google Scholar]
- Wu, Y.; Tucker, G.; Nachum, O. Behavior regularized offline reinforcement learning. arXiv 2019, arXiv:1911.11361. [Google Scholar]
- McCoy, J.T.; Auret, L. Machine learning applications in minerals processing: A review. Miner. Eng. 2019, 132, 95–109. [Google Scholar] [CrossRef] [Scilit]
- Rajasekhar, N.; Radhakrishnan, T.K.; Samsudeen, N. Exploring reinforcement learning in process control: A comprehensive survey. Int. J. Syst. Sci. 2025, 56, 3528–3557. [Google Scholar] [CrossRef] [Scilit]
- Ali, A.Y.; Bradshaw, S.M. Confined particle bed breakage of microwave treated and untreated ores. Miner. Eng. 2011, 24, 1625–1630. [Google Scholar] [CrossRef] [Scilit]
- Mutaz, R.; Enrico, F.; Hisham, E.; Natheer, A.; Ghaith, A.R. The integration of advanced mechatronic systems into Industry 4.0 for smart manufacturing. Sustainability 2024, 16, 8504. [Google Scholar] [CrossRef] [Scilit]
- Thramboulidis, K. From mechatronic components to industrial automation things: An IoT model for cyber physical manufacturing systems. arXiv 2016, arXiv:1606.01120. [Google Scholar]
- Balakera, N.; Konstantinidis, F.K.; Sifnaios, S.; Tsimiklis, G.; Amditis, A. Ore sorter as part of Mining 4.0 from mechatronics approach. In Proceedings of the 2025 11th International Conference on Mechatronics and Robotics Engineering (ICMRE); IEEE: Piscataway, NJ, USA, 2025; pp. 359–363. [Google Scholar]
- Konstantinidis, F.K.; Sifnaios, S.; Tsimiklis, G.; Mouroutsos, S.G.; Amditis, A.; Gasteratos, A. The design of ore sorting prototype within the transition from Mine 4.0 to Mine 5.0: Human centric approach. Procedia Comput. Sci. 2022, 277, 2606–2611. [Google Scholar]
- Shadi, A.; Ahmadihosseini, A.; Rabiei, M.; Samea, P.; Hassani, F.; Sasmito, A.P.; Ghoreishi Madiseh, S.A. Numerical and experimental analysis of fully coupled electromagnetic and thermal phenomena in microwave heating of rocks. Miner. Eng. 2022, 178, 107406. [Google Scholar] [CrossRef] [Scilit]
- Tuşa, L.; Kern, M.; Khodadadzadeh, M.; Blannin, R.; Gloaguen, R.; Gutzmer, J. Evaluating the performance of hyperspectral short wave infrared sensors for the presorting of complex ores using machine learning methods. Miner. Eng. 2020, 146, 106150. [Google Scholar] [CrossRef] [Scilit]
- Robben, C.; Wotruba, H. Sensor based ore sorting technology in mining—Past, present and future. Minerals 2019, 9, 523. [Google Scholar] [CrossRef] [Scilit]
- Peukert, D.; Xu, C.; Dowd, P. A review of sensor-based sorting in mineral processing: The potential benefits of sensor fusion. Minerals 2022, 12, 1364. [Google Scholar] [CrossRef] [Scilit]
- Okada, N.; Nozaki, H.; Nakamura, S.; Manjate, E.P.A.; Gebretsadik, A.; Ohtomo, Y.; Arima, T.; Kawamura, Y. Optimizing multi spectral ore sorting incorporating wavelength selection utilizing neighborhood component analysis for effective arsenic mineral detection. Sci. Rep. 2024, 14, 11544. [Google Scholar] [CrossRef] [Scilit] [PubMed]
- Konstantinidis, F.K.; Sifnaios, S.; Arvanitakis, G.; Tsimiklis, G.; Mouroutsos, S.G.; Amditis, A.; Gasteratos, A. Multi modal sorting in plastic and wood waste streams. Resour. Conserv. Recycl. 2023, 199, 107244. [Google Scholar] [CrossRef] [Scilit]
- Konstantinidis, F.K.; Balaska, V.; Symeonidis, S.; Mouroutsos, S.G.; Gasteratos, A. Multi sensor cyber physical sorting system (CPSS) based on Industry 4.0 principles: A multi-functional approach. Procedia Comput. Sci. 2022, 217, 227–236. [Google Scholar] [CrossRef] [Scilit]
- Alginahi, Y.M.; Sabri, O.; Said, W. Reinforcement learning for industrial automation: A comprehensive review of adaptive control and decision making in smart factories. Machines 2025, 13, 1140. [Google Scholar] [CrossRef] [Scilit]
- Sutton, R.S.; Barto, A.G. Reinforcement Learning: An Introduction, 2nd ed.; MIT Press: Cambridge, MA, USA, 2018. [Google Scholar]
- Konstantinidis, F.K.; Mouroutsos, S.G.; Gasteratos, A. The role of machine vision in Industry 4.0: An automotive manufacturing perspective. Machines 2022, 10, 746. [Google Scholar] [CrossRef] [Scilit]
- Sass, O.; Bauer, C.; Heil, S.; Schnepfleitner, H.; Kropf, F.; Gaisberger, C. Infrared thermography monitoring of rock faces—Potential and pitfalls. Geomorphology 2023, 439, 108837. [Google Scholar] [CrossRef] [Scilit]
- Monk, P. Finite Element Methods for Maxwell’s Equations; Oxford University Press: Oxford, UK, 2003. [Google Scholar]
- Shadi, A.; Samea, P.; Rabiei, M.; Ghoreishi Madiseh, S.A. Energy efficiency of microwave induced heating of crushed rocks/ores. Minerals 2023, 13, 924. [Google Scholar] [CrossRef] [Scilit]
- He, G.; Li, S.; Yang, K.; Liu, J.; Liu, P.; Zhang, L.; Peng, J. Dielectric properties of zinc sulfide concentrate during the roasting at microwave frequencies. Minerals 2017, 7, 31. [Google Scholar] [CrossRef] [Scilit]
- Balaska, V.; Tserkezis, A.; Konstantinidis, F.K.; Sevetlidis, V.; Symeonidis, S.; Karakatsanis, T.; Gasteratos, A. Machine vision in human centric manufacturing: A review from the perspective of the frozen dough industry. Electronics 2025, 14, 3361. [Google Scholar] [CrossRef] [Scilit]

Disclaimer/Publisher’s Note: The statements, opinions and data contained in all publications are solely those of the individual author(s) and contributor(s) and not of MDPI and/or the editor(s). MDPI and/or the editor(s) disclaim responsibility for any injury to people or property resulting from any ideas, methods, instructions or products referred to in the content. |
© 2026 by the authors. Licensee MDPI, Basel, Switzerland. This article is an open access article distributed under the terms and conditions of the Creative Commons Attribution (CC BY) license.