


Abstract
Centrifugal compressors are vital components in industrial applications, but they are prone to a disruptive phenomenon known as surge, which can lead to mechanical stress and temperature increase. Surge occurrence is influenced by machine design, plant layout, and geometry. Engineers often deploy long (cold) and short (hot) recycle valves to address this issue. To ensure surge prevention, a fluid dynamic model is indispensable. In this study, a 1D Computational Fluid Dynamics (1D-CFD) model was developed using Amesim for a two-section centrifugal compressor. The main objective was to investigate the impact of various parameters on surge occurrence and compare different plant layouts to determine the most suitable solution for the specific study case. Here, the focus is on the influence of vent valves over the plant performance. To achieve this comparison, transient simulations of emergency shutdown (ESD) operations were performed. This study contributes to a better understanding of how machine design and operational factors affect surge behavior. By systematically evaluating different plant layouts, we identified the most effective strategies for preventing surge and enhancing compressor performance. This research provides valuable insights for engineers and operators striving to optimize industrial processes and improve the reliability and efficiency of centrifugal compressor systems.
1. Introduction
Centrifugal compressors have diverse applications, such as air separation units, chemical plants, and vehicles. During the design of these systems, particular attention must be paid to the surge phenomenon, as it can lead to significant damage to the compressor. Surge is a critical event, as the compressor works in unstable flow conditions, especially during transient operations. This instability occurs at low flow rates and high pressure ratios where the compressor performance curve (p-Q curve) exhibits a shallow decline or an increasing slope. The occurrence of surge is also influenced by the discharge volume, as the pressure differential over the compressor requires more time to decrease in the presence of larger volumes. The surge phenomenon may occur during transient operations, and it is marked by a rapid dynamic, as it evolves in a few seconds. So, any analysis tool has to consider the transient nature of the phenomenon in order to be effective in surge prediction. Many solutions are available to address the surge phenomenon. The main ones involve the installation of one or two recirculation valves. The anti-surge control system usually includes a cold-gas recycle (CGR) valve connecting the suction side with the discharge section downstream of the cooler. Depending on the plant arrangement (volumes, valve opening times, etc.), the addition of a hot-gas recycle (HGR) valve may be necessary. This solution is more efficient for anti-surge control, as it bypasses the cooler’s volume. To evaluate the effectiveness of a chosen solution, a Dynamic System Analysis (DSA) of the compressor plant is necessary. Moreover, these analyses are also used for the prevention of overheating during recycle loop operations. Despite the literature presenting many studies, it is still not always certain in which cases a cold-gas recycle valve is enough for surge prevention [1]. On the other hand, the installation of a hot-gas recycle valve is a challenging and expensive solution. So, the development of a model is a necessary step for verifying a system’s compliance with anti-surge requirements, especially for emergency shutdown (ESD) scenarios [2].
Several contributions on the topic are available in the literature. Many textbooks such as [3] provide an effective explanation and definition of surge that is useful for understanding the phenomenon. Sparks [4] explains how the piping system affects the compressor transient behavior. Kurz et al. [5] summarize different approaches for estimating the compressor’s train speed. MacDougal and Elder [6] develop a model able to simulate centrifugal compressor behavior during transient conditions. Morini et al. [7] propose a 1D simulation model to predict surge occurrence, extending the performance map to the backflow region (negative mass flow rate). Pak et al. [8] show an interesting approach for surge analysis during emergency shutdown operations. Almasi [9] highlights several important parameters and considerations useful for recycle valve system design and sizing. Haeckel et al. [10] propose a new compressor model aimed at enhancing the numerical definition of the surge limit. Cravero and Marsano [11] offer a comprehensive review of existing centrifugal compressor limits related to flow instabilities. Furthermore, Qiao et al. [12] investigate the occurrence of a secondary surge following the recovery from an initial surge event. Botros defines a dimensionless parameter, named the inertia number [13], which is useful in deciding whether a hot-gas recycle valve is required for safe operations [1]. Yoon et al. [14] further develop Botros’s work by establishing another dimensionless parameter, the surge number. This new model should provide higher certainty, whereas the previous one is not able to predict whether a hot-gas recycle valve is necessary. Brun et al. [15,16] study the stresses acting on the compressor train during the surge phenomenon. They develop a lumped-parameter model useful for determining the forces that appear during surge or any transient operation. Epstein et al. [17] compare the effectiveness of active and passive suppression systems for compressor instabilities. Tamaki [18] investigate the piping system’s influence on the surge line using a lumped-parameter model. Powers et al. [19] develop a quintic characteristic curve (flow–head) that allows for the differentiation of mild and severe surge. Pinsley et al. [20] develop a suppression system for small perturbations based on a servo valve placed on the plenum outlet, expanding the operational range for low flow rates. Gravdahl and Egeland [21] further develop Pinsley’s work by adding a speed control on the compressor drive. Blanchini et al. [22] propose an effective control strategy for surge suppression, which they assess using experimental tests. Zou et al. [23] analyze how the diffuser vanes’ presence influences the rotating stall onset and the surge line position.
The current article focuses on the dynamic analysis of a centrifugal compressor, which is useful for assessing the occurrence of the surge phenomenon. Initially, key plant parameters were gathered to construct a 1D fluid dynamic (CFD) model. The handling of experimental data is crucial in developing an accurate compressor performance map. With the model in place, simulations of shutdown operations, considered the most severe transient condition, were conducted. The primary goal was to assess the occurrence and severity of the surge phenomenon. While simplified dimensionless models offer initial guidance for surge protection, they present limitations when applied to complex multi-stage machines and typically exclude the consideration of alternative solutions. This motivates the need for a comprehensive dynamic analysis. Subsequently, the analysis was broadened to evaluate the impact of various parameters on the system dynamics and to explore different layouts. Specifically, the focus is on the vent ones, which are considered cost-effective solutions for the present case when compared to HGR valves. Moreover, the analysis of these layouts would expand the literature, which is mainly focused on hot-gas recycle valves. So, the comparison of results provides useful insights into how different solutions address the surge phenomenon and highlights key parameters that need consideration. Consequently, this comprehensive study aims to not only examine the surge phenomenon during shutdown operations but also assess the influence of different parameters and layouts in order to offer valuable understanding for optimizing compressor performance.
2. Materials and Methods
2.1. System Description
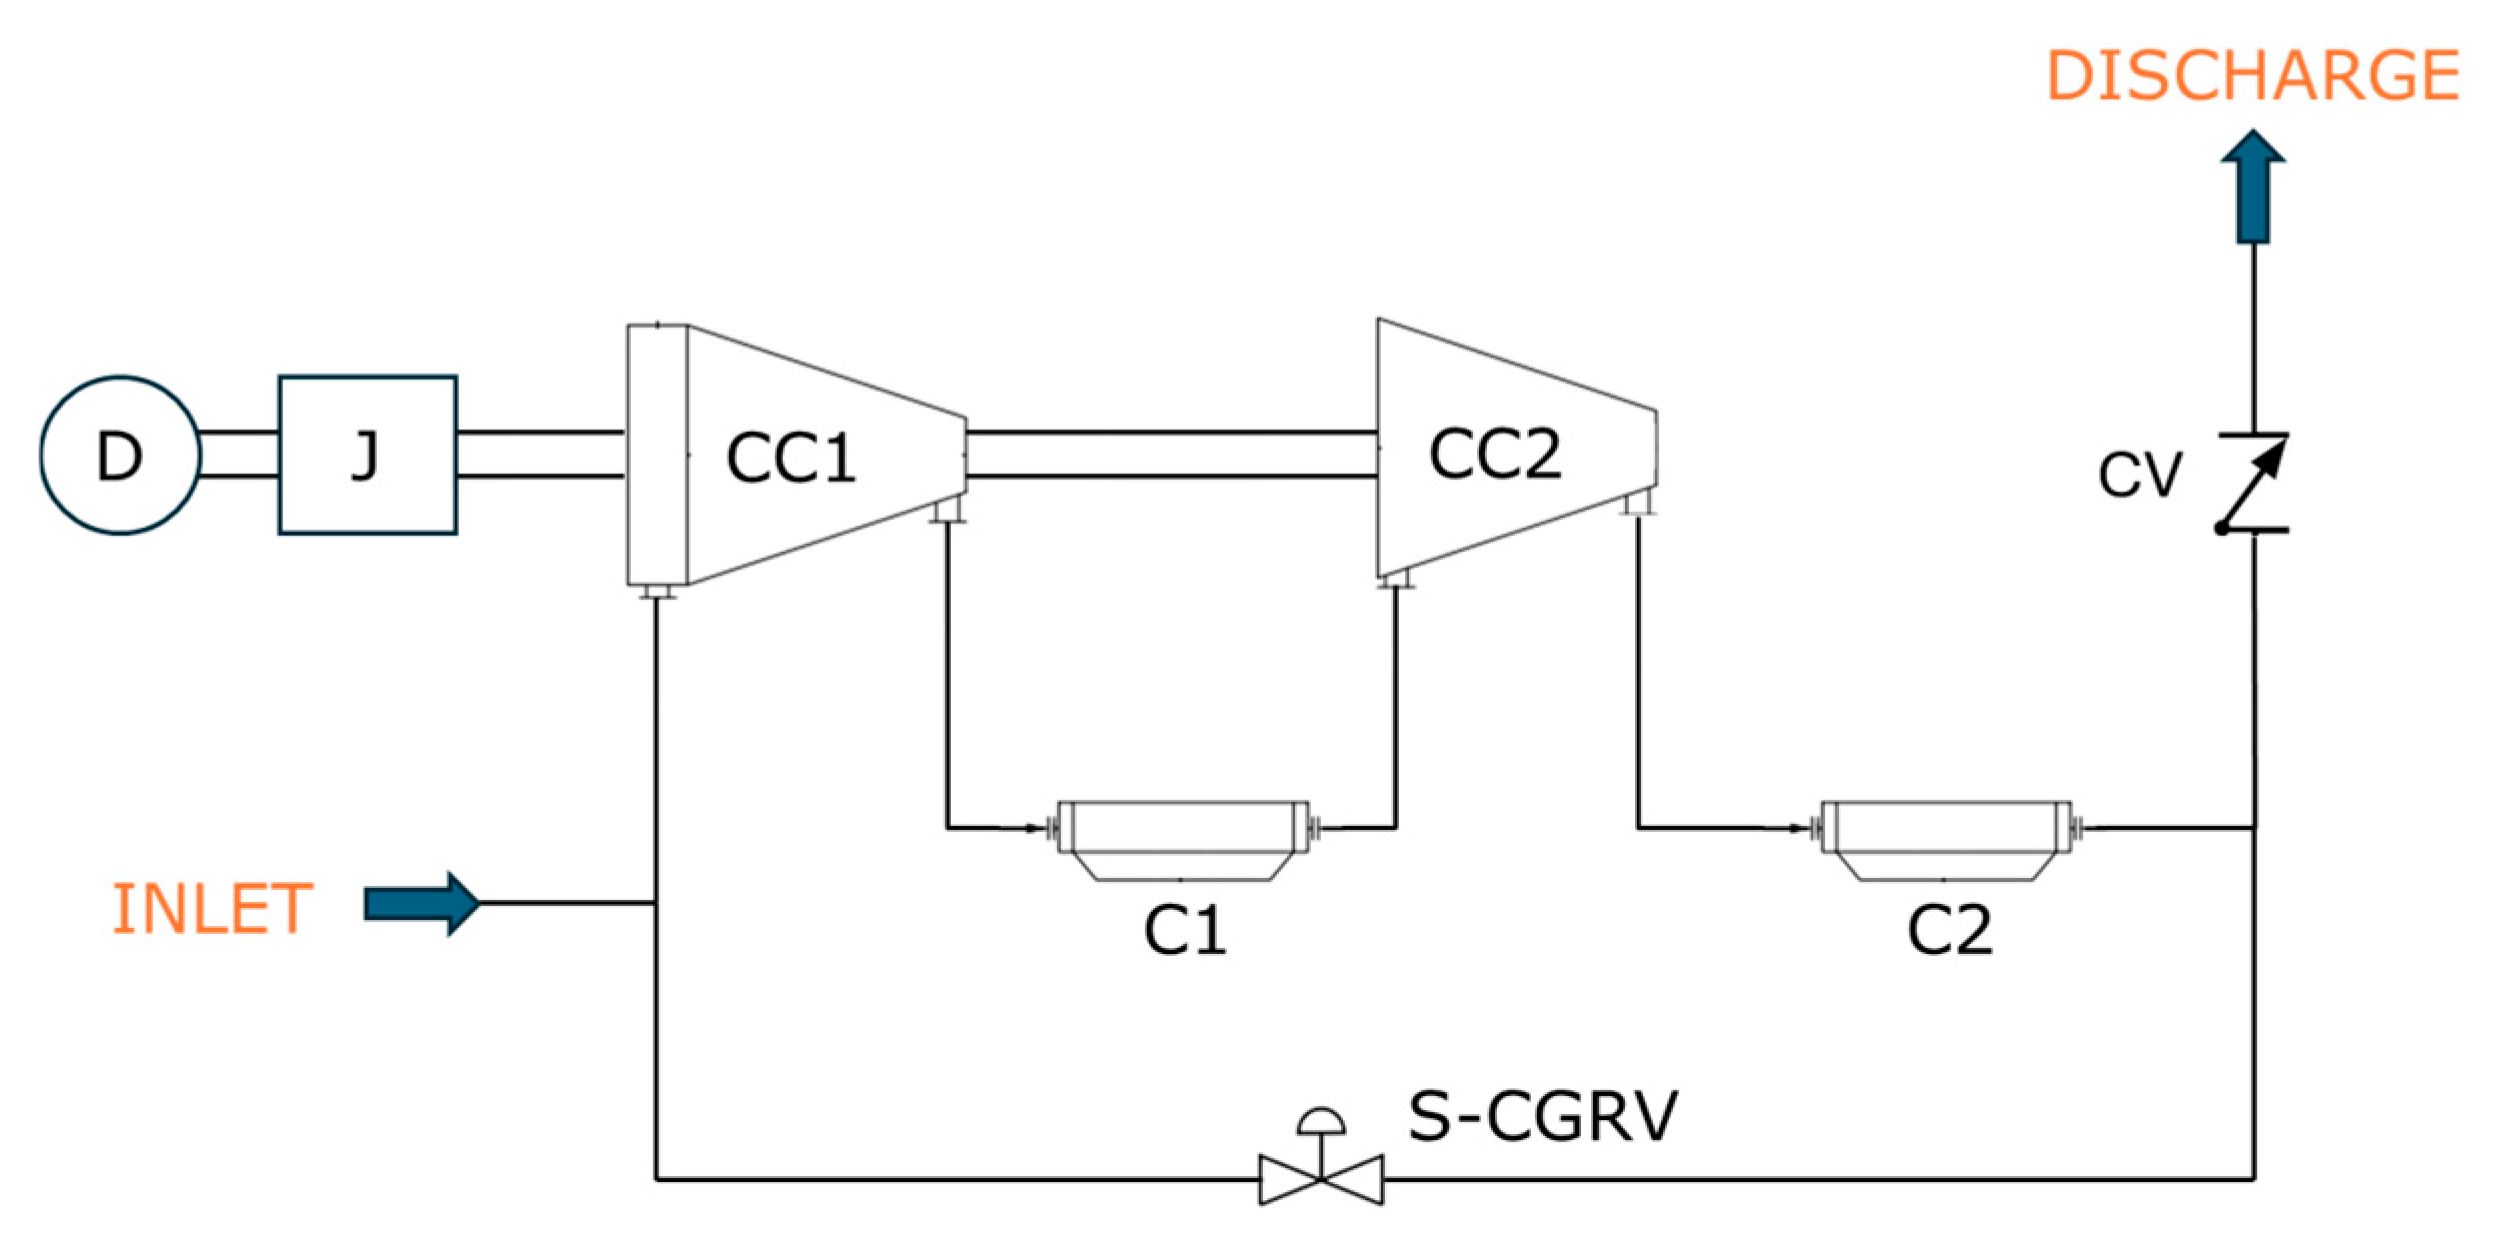
The case study concerns a two-section compressor with inter-cooler and after-cooler (Figure 1). The machine is integrally geared. The basic version of the plant includes an 8″ slow cold-gas recycle valve (S-CGRV). A check valve is placed in the discharge line after the cooler to prevent backflow and to facilitate a pressure drop in the discharge side during the recycle valve opening. The processed gas is nitrogen, which has a safe nature. This feature makes the vent valves a feasible solution for addressing the surge phenomenon during transient operations. An electric motor drives the compressor through a gearbox. An inlet guide vane system adjusts the machine’s performance according to the inlet and the discharge parameters. The gas enters the inlet port at 8 °C and 6 barA. The discharge port conditions are, nominally, 40 °C and 28.5 barA. The compressor nominally processes 56,000 kg/h. Table 1 reports the main parameters used in the model. Then, referring to Botros and Ganesan [13] and Yoon et al. [14], both the inertia number and the surge number are calculated for this system: NI = 3.64 and NS = 153,291, respectively. According to these numbers, Yoon’s model claims that the cold-gas recycle valve is not adequate and that the system requires a hot-gas recycle valve to prevent surge occurrence. However, one should notice that Yoon’s model is developed for single-stage compressors, while the present study deals with a two-section machine.
Figure 1.
Sketch of the compression unit basic layout (D: driver, J: inertia, CC1: first stage, CC2: second stage, C1: inter-stage cooler, C2: discharge cooler, S-CGRV: slow cold-gas recycle valve, CV: check valve).
Table 1.
Case study parameters.
2.2. Virtual Model
To represent the compressor unit, it is necessary to model both the mechanical and the fluid dynamic components. For the mechanical sub-system, a speed trend derived from the literature [5] was imposed. Meanwhile, for the fluid dynamic components, a 1D-CFD representation was chosen to take into account wave propagation phenomena, which are essential for a realistic transient analysis. This approach is critical for the assessment of surge occurrence, as this system-wide instability is dependent on the acoustic dynamics and transient wave propagation throughout the piping system [4]. Consequently, Simcenter Amesim version 2504 [24] was chosen for developing the model, as it is able to perform 1D-CFD simulations [25]. For the shaft speed trend (Figure 2), the following equation [5] is obtained, assuming a constant Q/N ratio and the fan law and neglecting friction losses:
where
- N(t) is the shaft speed [rad/s];
- N0 is the initial shaft speed [rad/s];
- J is the compressor train inertia [kg m2];
- P0 is the initial power consumed by the compressor [W];
- T0 is the initial torque on the shaft [Nm];
- t is the time from the shutdown event start [s].
Then, a comparison with constant speed decay trends [5] was performed:
where
- k is the speed decay [1/s].
Figure 2.
Speed trends used as input.
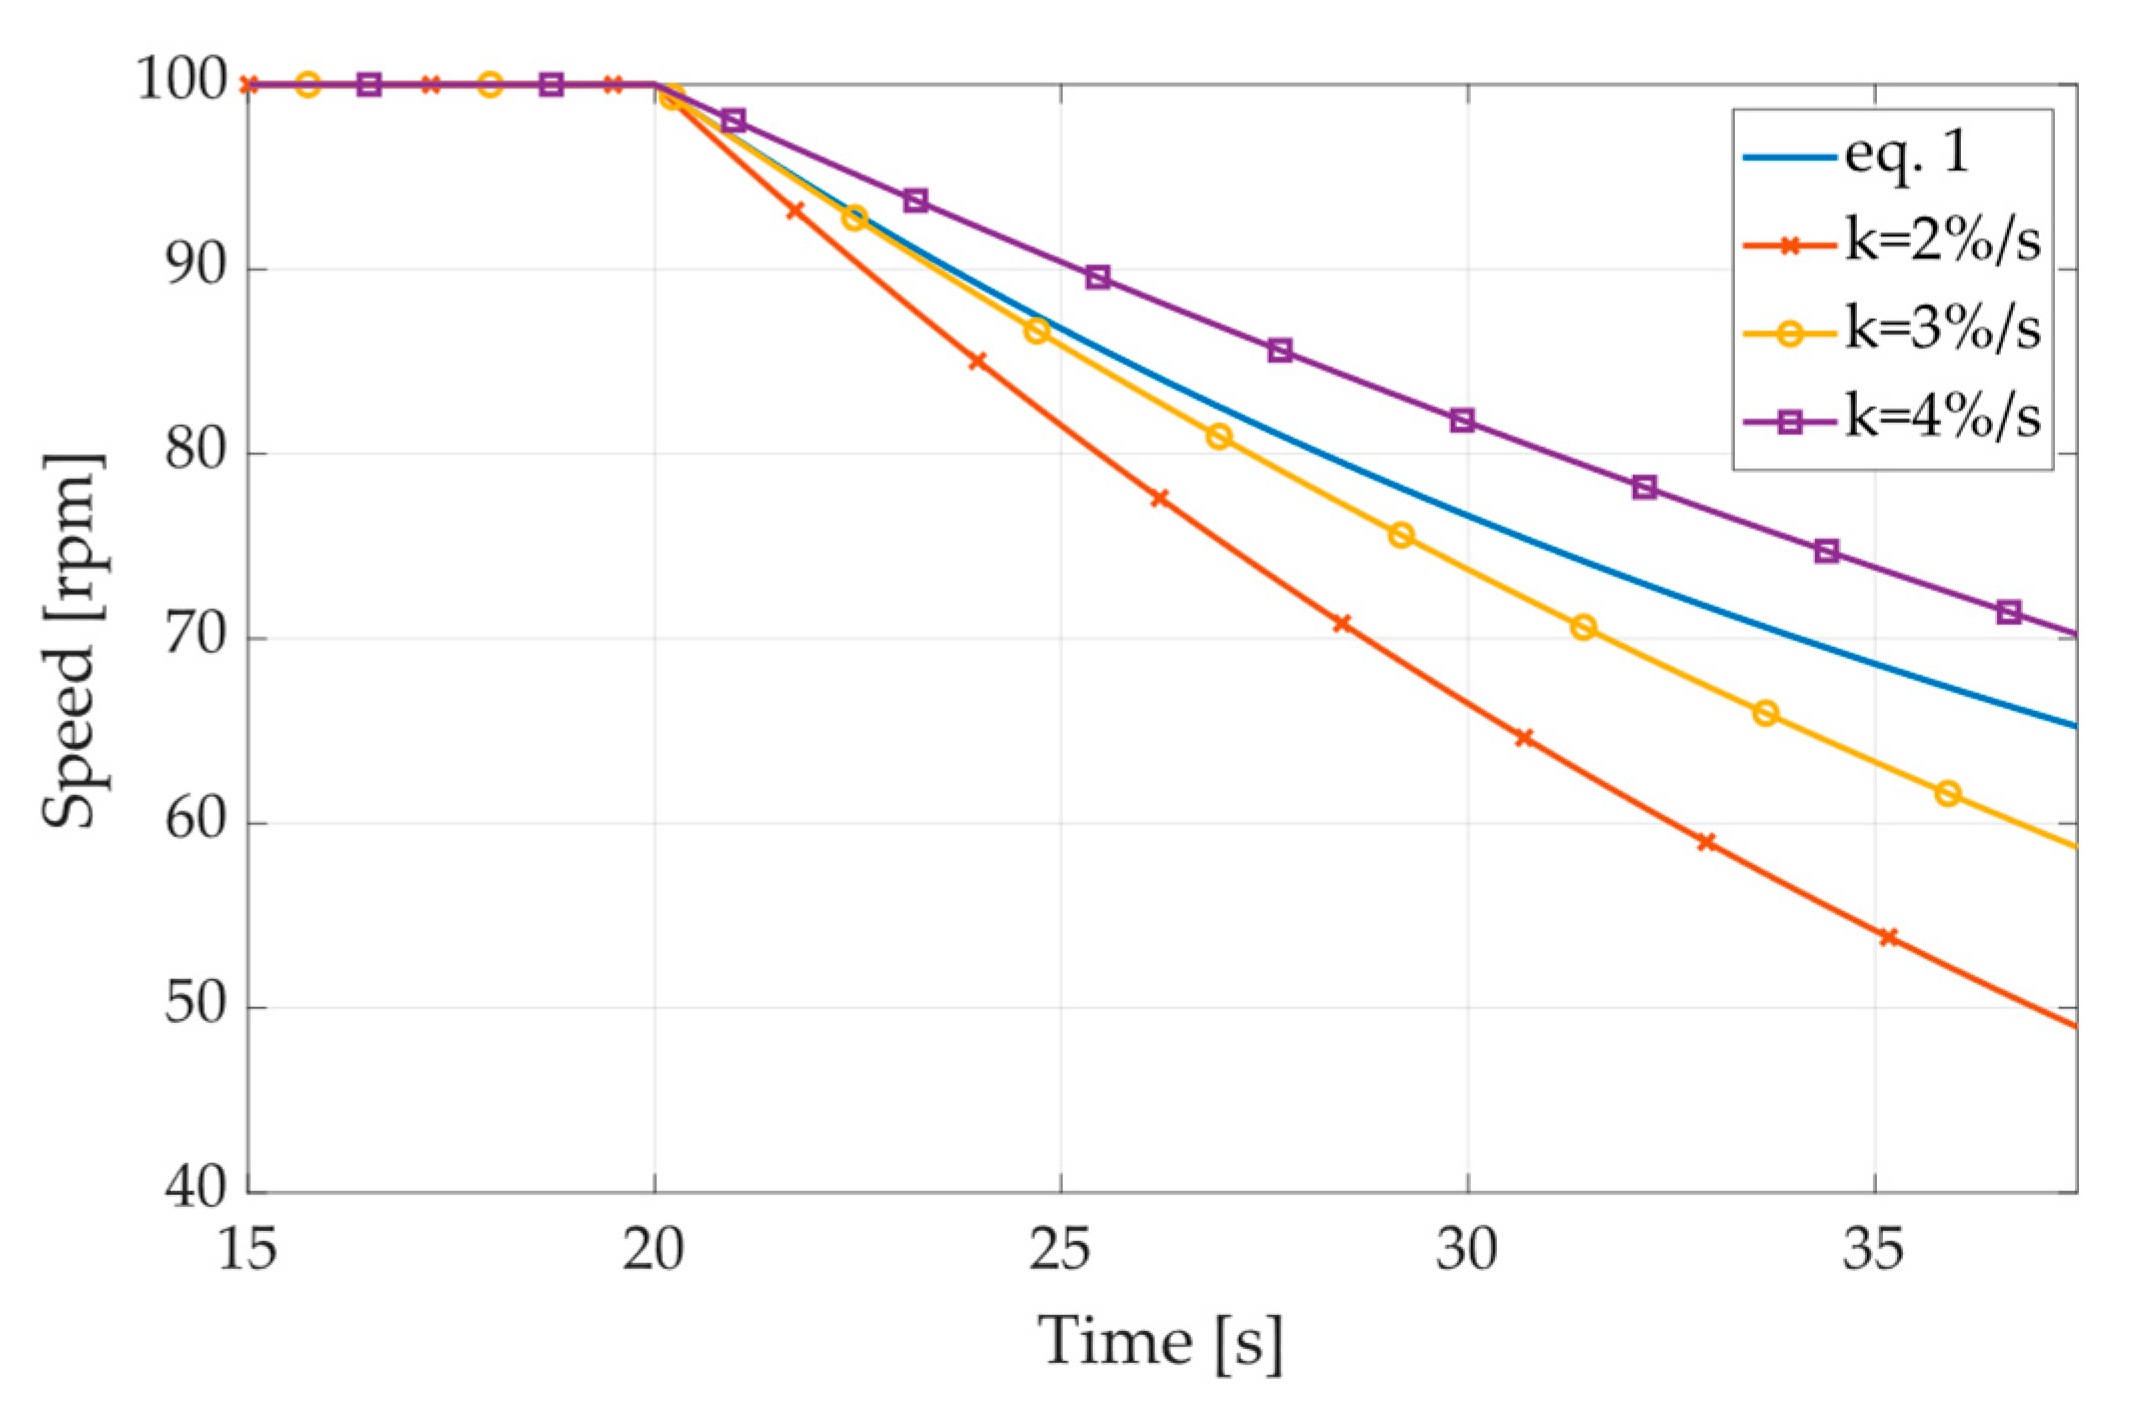
The non-linear decay model is the primary input for the main transient simulations because it provides a more realistic speed input for the severe shutdown transient, as it is derived from the conservation of angular momentum and considers the non-linear dependency between speed and aerodynamic resistance (fan law), while constant decay rates are useful for preliminary sensitivity analyses or for more conservative assumptions. For the fluid dynamic components, the 1D-CFD approach involves the use of continuity (Equation (3)), momentum (Equation (4)), and total energy (Equation (5)) equations to simulate each fluid dynamic element.
where
- is the gas density;
- u is the gas speed;
- S is the pipe section;
- t is the time;
- x is the abscissa;
- p is the pressure;
- f is the friction coefficient;
- T is the gas temperature;
- Twall is the pipe’s wall temperature;
- hc is the convective heat transfer coefficient;
- hr is the radiative heat exchange coefficient.
The discretization of the governing equations above was achieved by dividing the pipe network into N cells, each having a uniform spatial step, ∆x. The selection of the cell size is intrinsically linked to the numerical scheme adopted and is a requirement for stable computation. In this study, the Lax–Wendroff two-step scheme, as proposed by Richtmyer and Morton [26] and modified by Bassett et al. [27], was employed.
For this model, numerical stability and convergence are ensured by satisfying the Courant–Friedrichs–Lewy (CFL) condition (Equation (6)), which dictates the relationship between the spatial step, the time step, and the maximum absolute velocity of the fluid flow (|u|).
To maintain a balance between computational efficiency and accuracy, a CFL number equal to 0.7 was specified, following established best practices. A uniform spatial discretization of ∆x = 100 mm was selected. Given this fixed spatial step and using the maximum expected characteristic velocity, the software automatically calculates the time step for the working fluid, which is Nitrogen (N2). For the defined system conditions, the resulting time step was of the order of 1.5 × 10⁻⁴ s, ensuring the stability and high-frequency resolution required for the transient simulation.
The boundary conditions are imposed as fixed temperatures and pressures. Table 2 reports the values for inlet, discharge, and vent ports.
Table 2.
Boundary conditions.
Then, to describe the centrifugal compressor behavior, performance map data were collected. This map is represented using a table containing the shaft speed, compression ratio, volume flow rate, and efficiency. Missing isospeed curves were extrapolated using the fan law. To simulate the shutdown operation and check the surge occurrence, a complete map is necessary, while the isospeed curves are limited inside the operating range. Consequently, the data was extrapolated in four regions of the map:
- Low speed;
- Maximum speed;
- Surge;
- Choke.
A Riemann solver and the mass conservation equation were used to find the operative conditions of the compressor on the map, and the parameters were corrected according to the intake temperature and pressure. The 1D-CFD approach was used for pipes and coolers, while valves are represented as pressure loss elements. The valves’ flow coefficient vs time trends are considered linear during opening. Their behavior is described using a constant discharge coefficient (Cv) and a maximum area. Pipes and cooler dimensions were computed according to measured length, diameters, and volumes. The piping and coolers are considered ideal; thus, they are considered rigid. The gas, pure Nitrogen, is modeled as semi-perfect.
All valves were evaluated using standard diameters (even numbers from 2″ to 12″), while the S-CGRV did not change in size (8″). Table 3 reports the flow coefficients and the opening and delay times for each diameter. The flow area is assumed to be linear over time during opening. However, real fast-acting valves may possess a non-linear flow area characteristic with respect to stem travel and time.
Table 3.
Valve parameters.
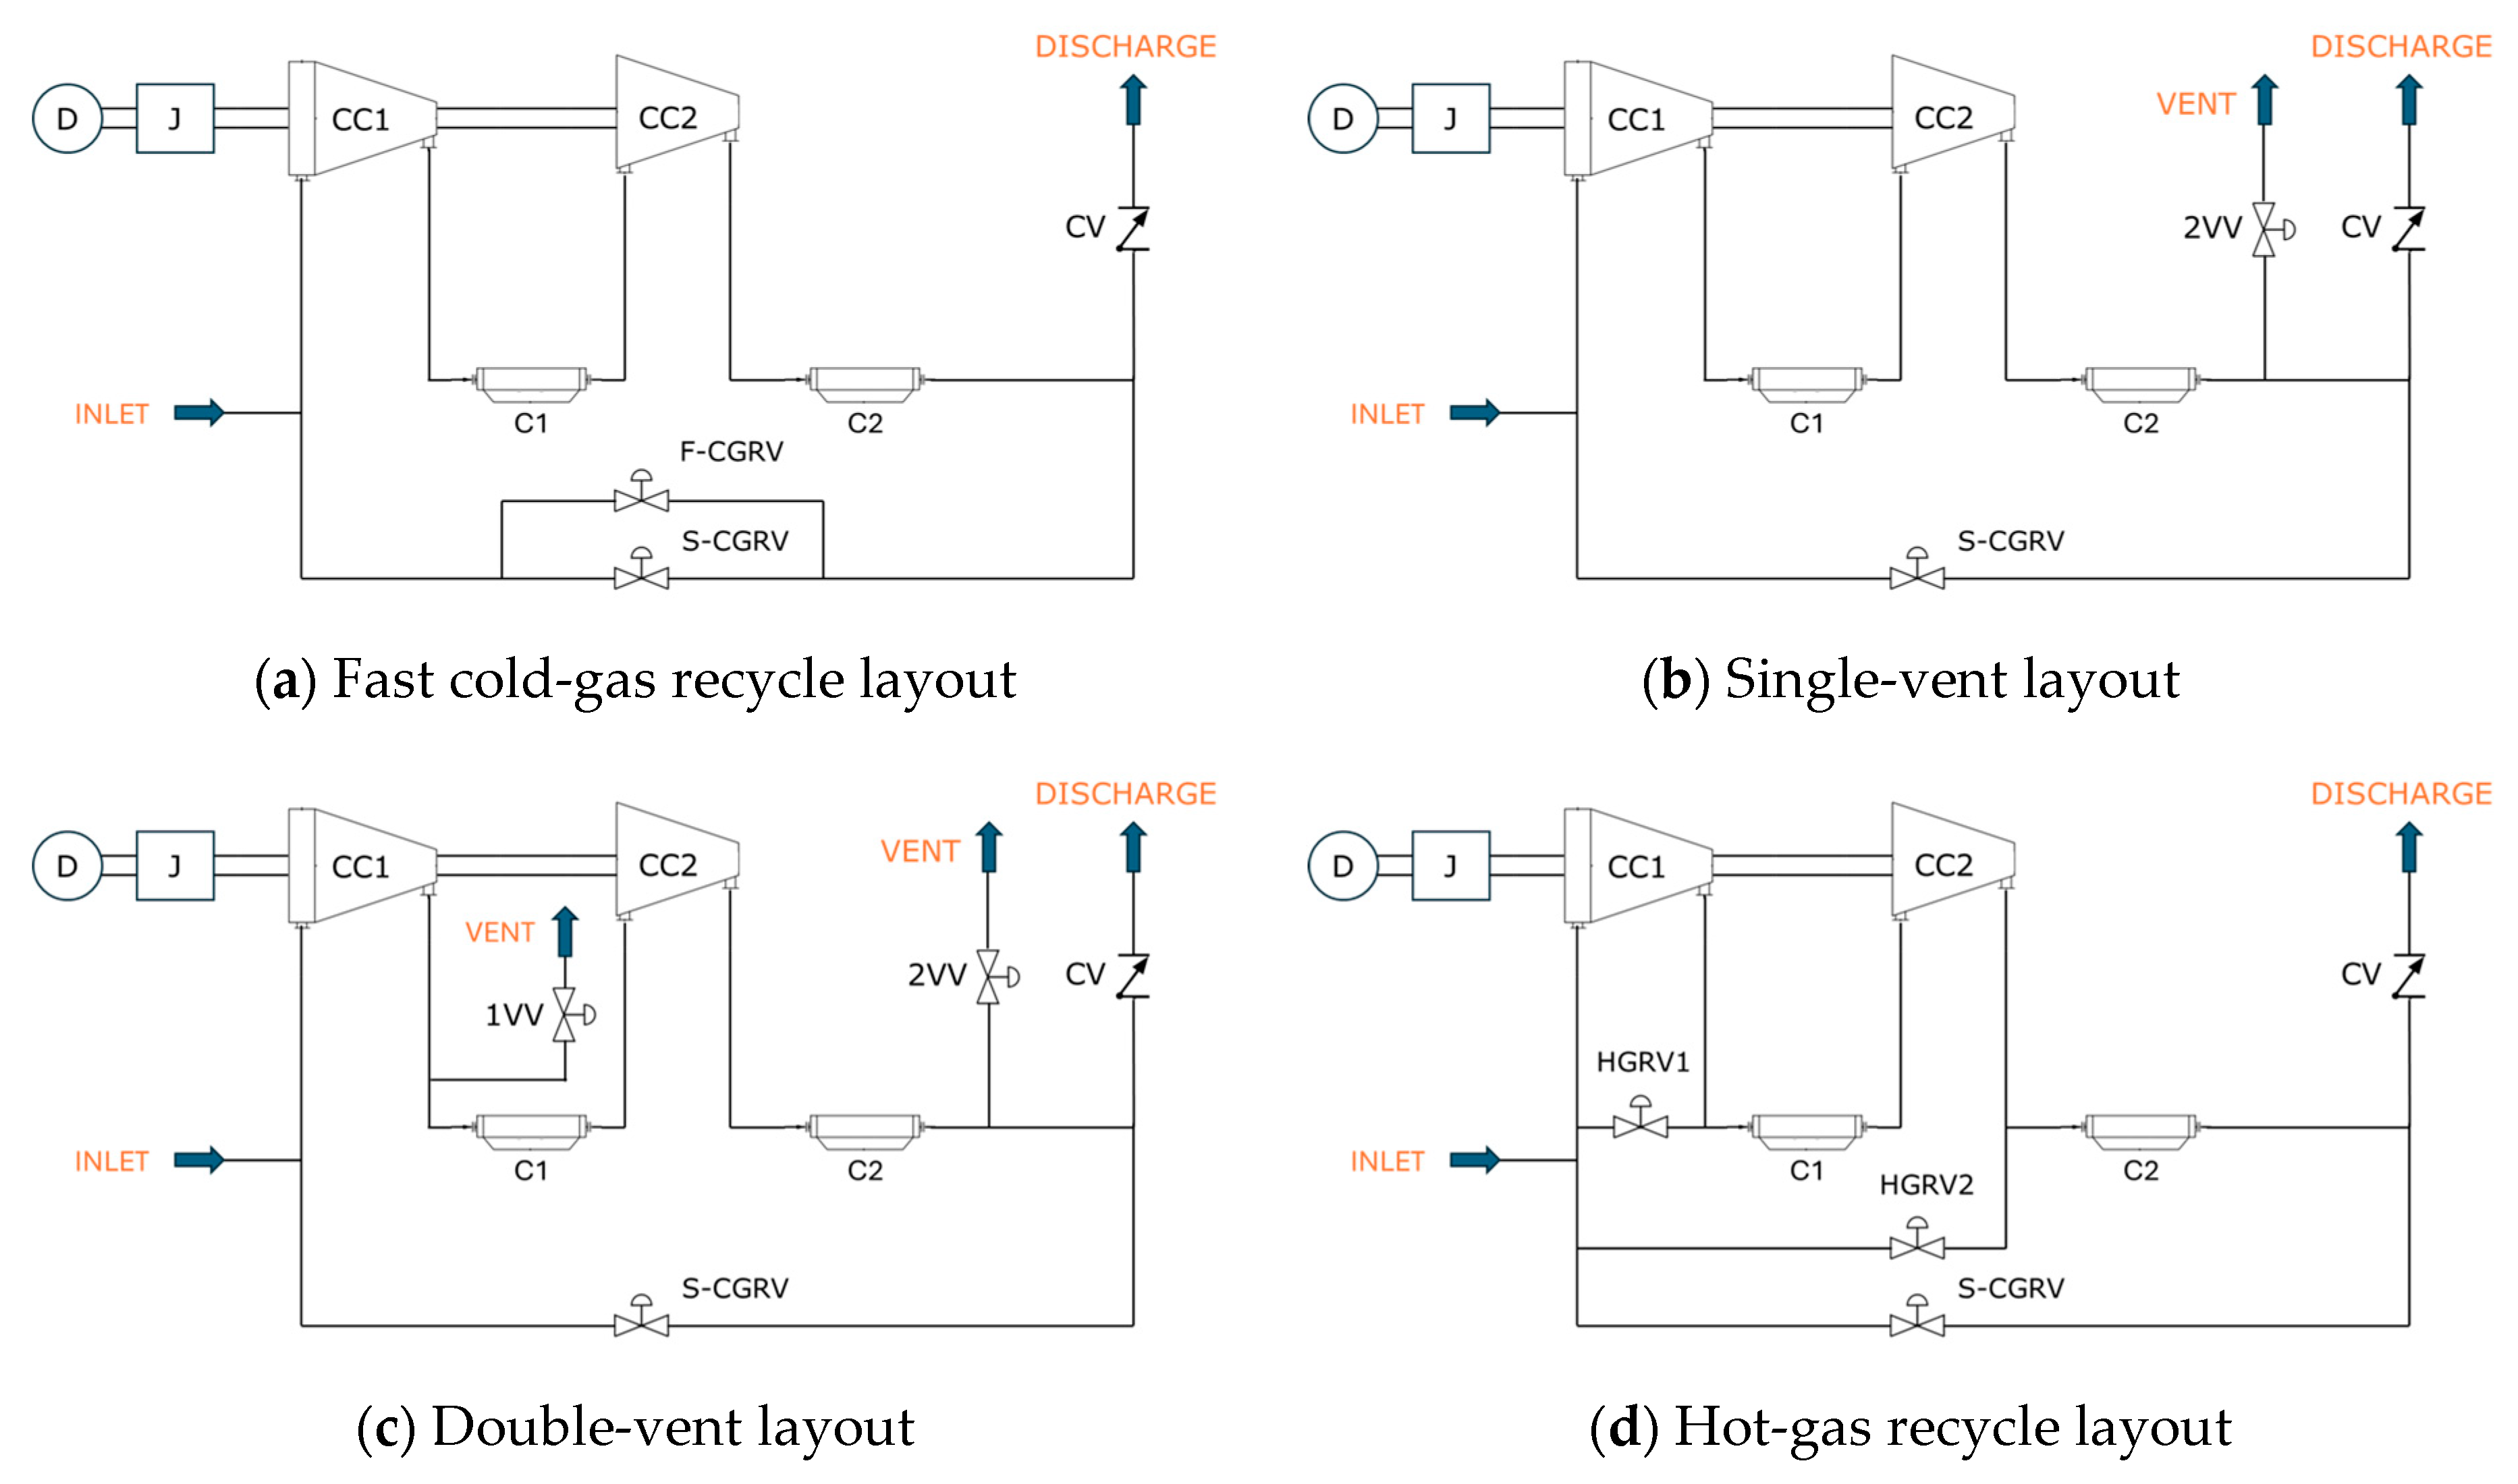
Five different plant layouts have been modeled:
- Basic layout;
- Fast cold-gas recycle (F-CGR);
- Single vent (1V);
- Double vent (2V);
- Hot-gas recycle (HGR).
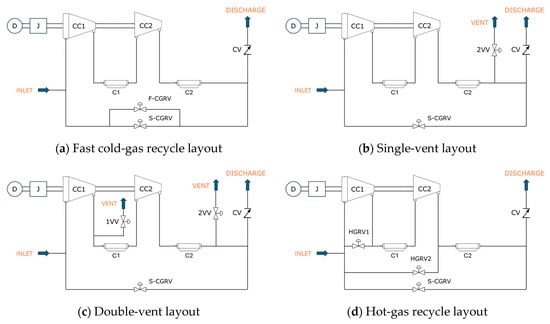
The first one (Figure 1) is the existing plant layout without any modifications. In the second one (Figure 3a), a fast-acting valve is installed in tandem with the S-CGR one. Here, the new valve is responsible for preventing surge occurrence during fast transient operations (such as ESD), while the slow one is more accurate during partial load operations. The third layout (Figure 3b) considers one vent valve on the second-stage discharge section after the cooler. This valve aims to depressurize this section of the plant during a shutdown operation to prevent the occurrence of surge. The fourth layout (Figure 3c) adds another vent valve to the single-vent layout in the inter-stage piping before the cooler. Here, the objective is to reduce the inter-stage pressure and prevent the first stage from surging. Simulation runs were performed assuming that both valves are the same size. Lastly, a hot-gas recycle layout was simulated (Figure 3d). Here, a hot-gas recirculation valve was added for each stage in the base model. The simulations assumed both valves to have the same size. The HGR valves have the same discharge coefficients and opening times as the fast-acting valves in Table 3.
Figure 3.
Sketch of the compression unit basic layout. (D: driver, J: inertia, CC1: first stage, CC2: second stage, C1: inter-stage cooler, C2: discharge cooler, S-CGRV: slow cold-gas recycle valve, CV: check valve, F-CGRV: fast cold-gas recycle valve, 1VV: inter-stage vent valve, 2VV: discharge vent valve, HGRV1: first-stage hot-gas recycle valve, HGRV2: second-stage hot-gas recycle valve).
3. Results and Discussion
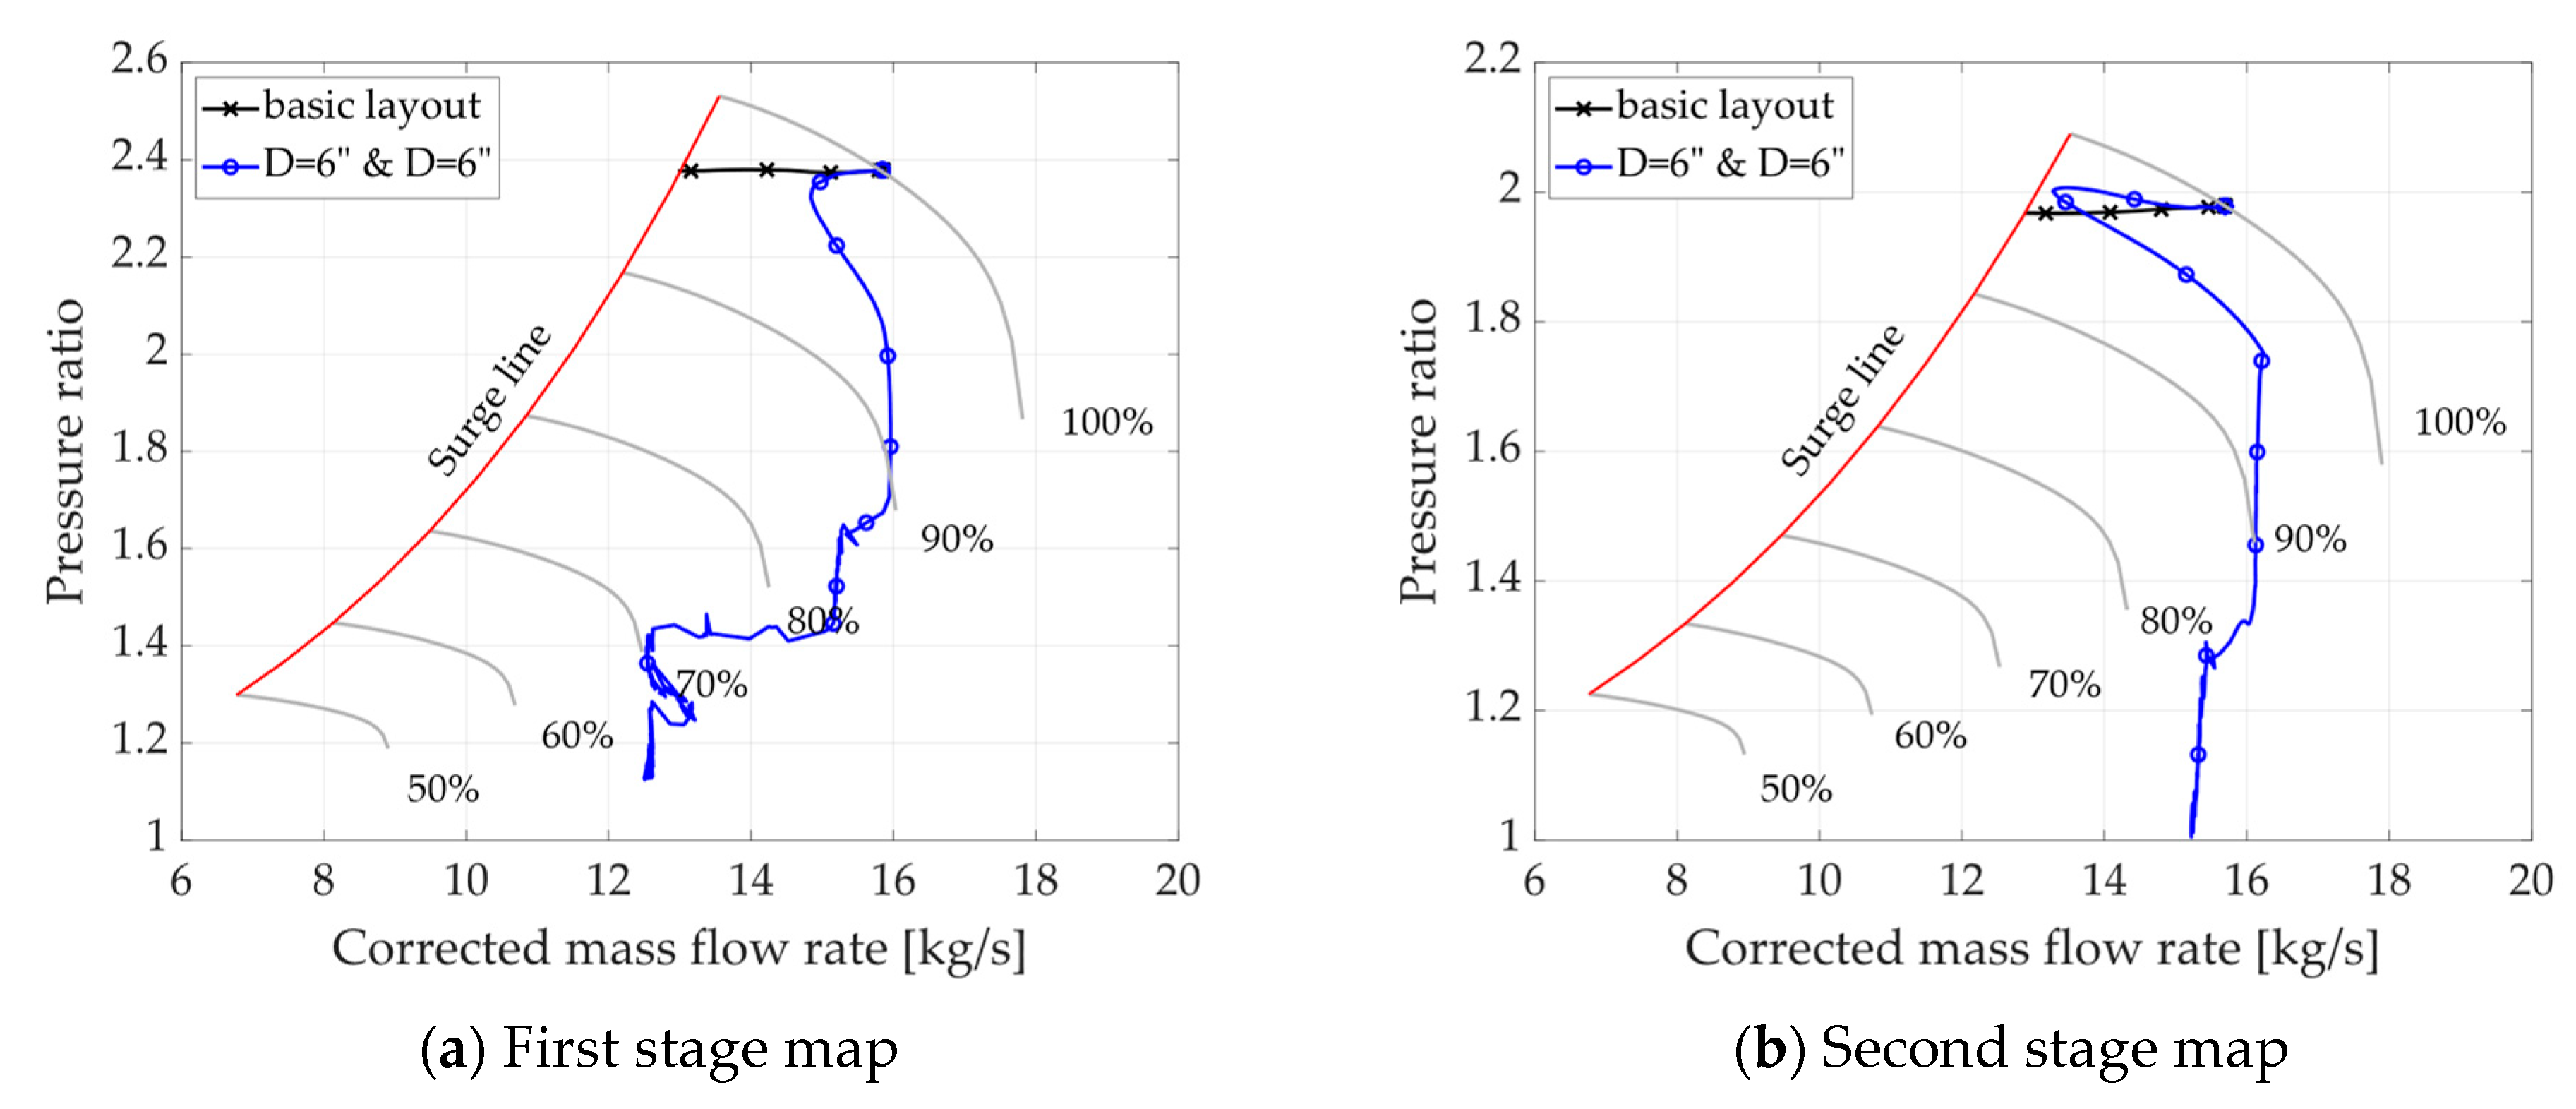
Different layouts and cases have been investigated. For each one, a shutdown operation was simulated starting from the rated operative conditions. For each layout, the conditions are represented on each stage’s map. Here, six isospeed curves (grey), the operative point trajectory, and the surge line (red) are represented. In the beginning, the operative point is located on the nominal speed curve (100%). After the shutdown operation starts, it moves to lower speeds. If the operative point moves to the left of the surge line, a surge occurs, and damage may happen to the machine. In these cases, the trajectory is trimmed at the red line, as the surge region is unstable. The assessment of this condition has to be performed for both stages. Additionally, the main surge onset times were collected for each case (Table 4) and are compared in the subsections below. A dash (-) is reported in the table if a surge did not occur. The surge phenomenon can be considered worse if it happens earlier and at higher shaft speeds.
Table 4.
Surge occurrence timing.
3.1. Basic Layout
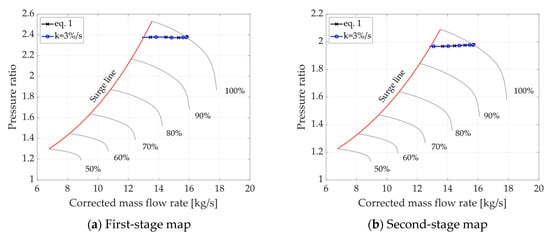
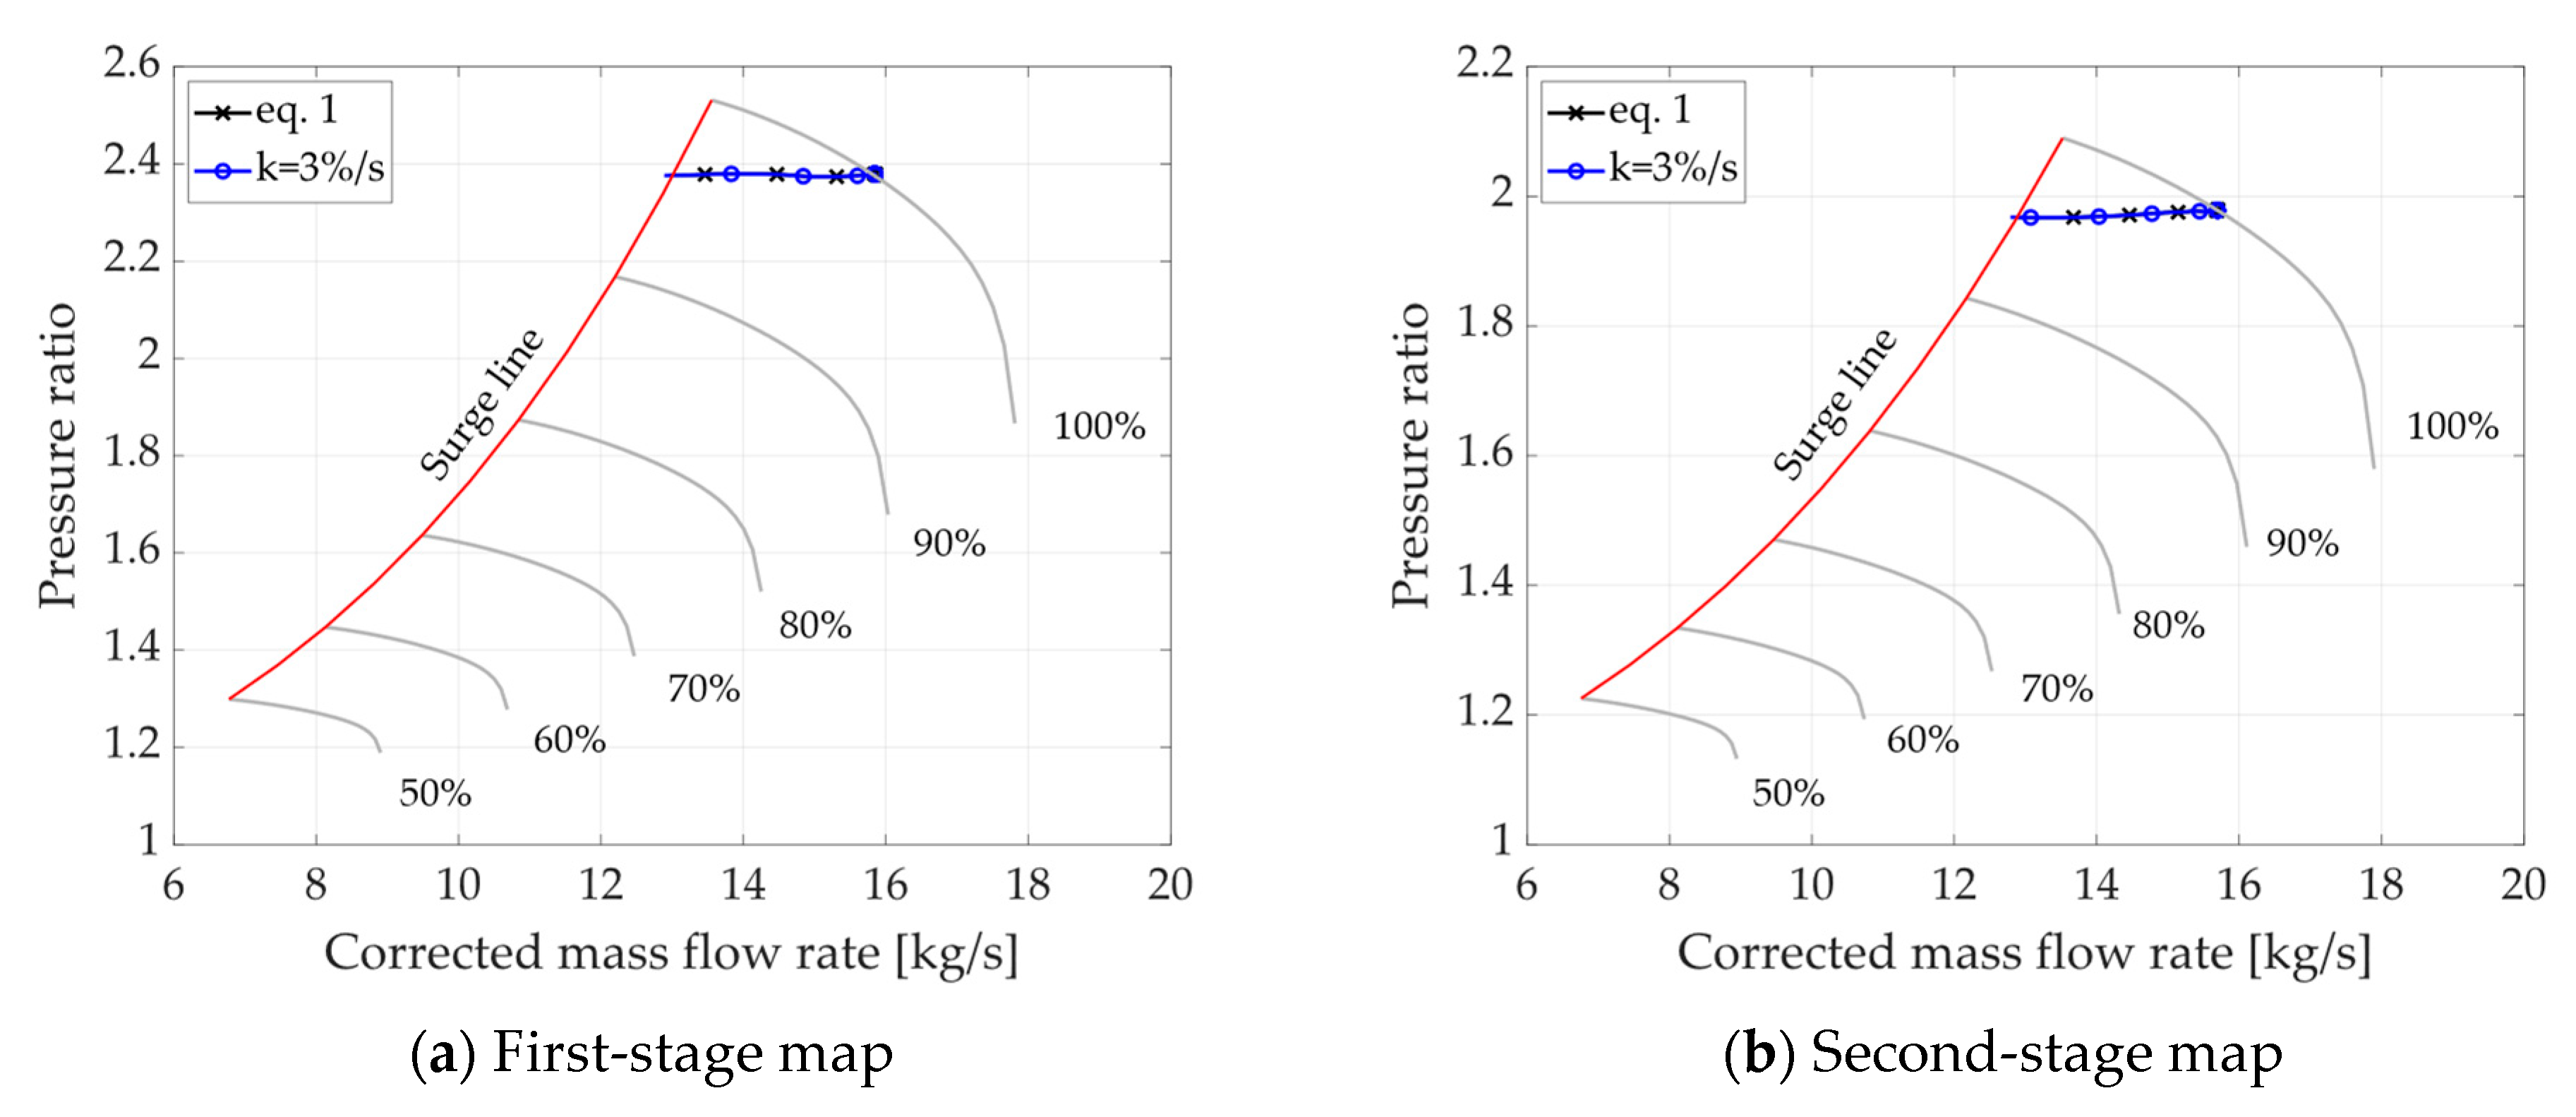
The first simulations concerned the basic layout in order to assess whether the plant would surge without any additional anti-surge device. The batch run involved all the speed trends in Figure 2. The results highlight how the compressor is prone to surge. Even for a decay rate of 2%/s, the surge occurs after about 2 s in both stages. Consequently, an additional anti-surge system is considered necessary to avoid surge during ESD operations. From the dynamic analysis results obtained using Equation (1) for speed, we can assume that the additional anti-surge system has about 1.3 s to effectively address the phenomenon, while the S-CGR takes 5.2 s after the shutdown to fully open. Figure 4 and Table 4 show how assuming a constant speed decay rate (3%/s) can provide a reasonable approximation for Equation (1).
Figure 4.
Basic layout results for Equation (1) and k = 3%/s on compressor maps. Surge line in red and isospeed lines in grey.
3.2. F-CGR Layout
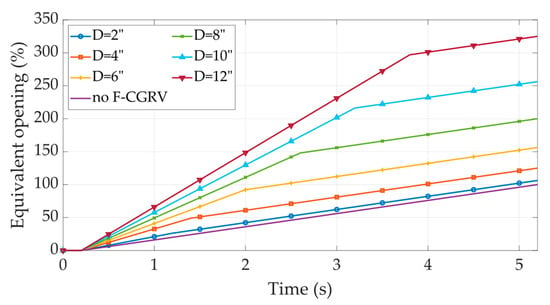
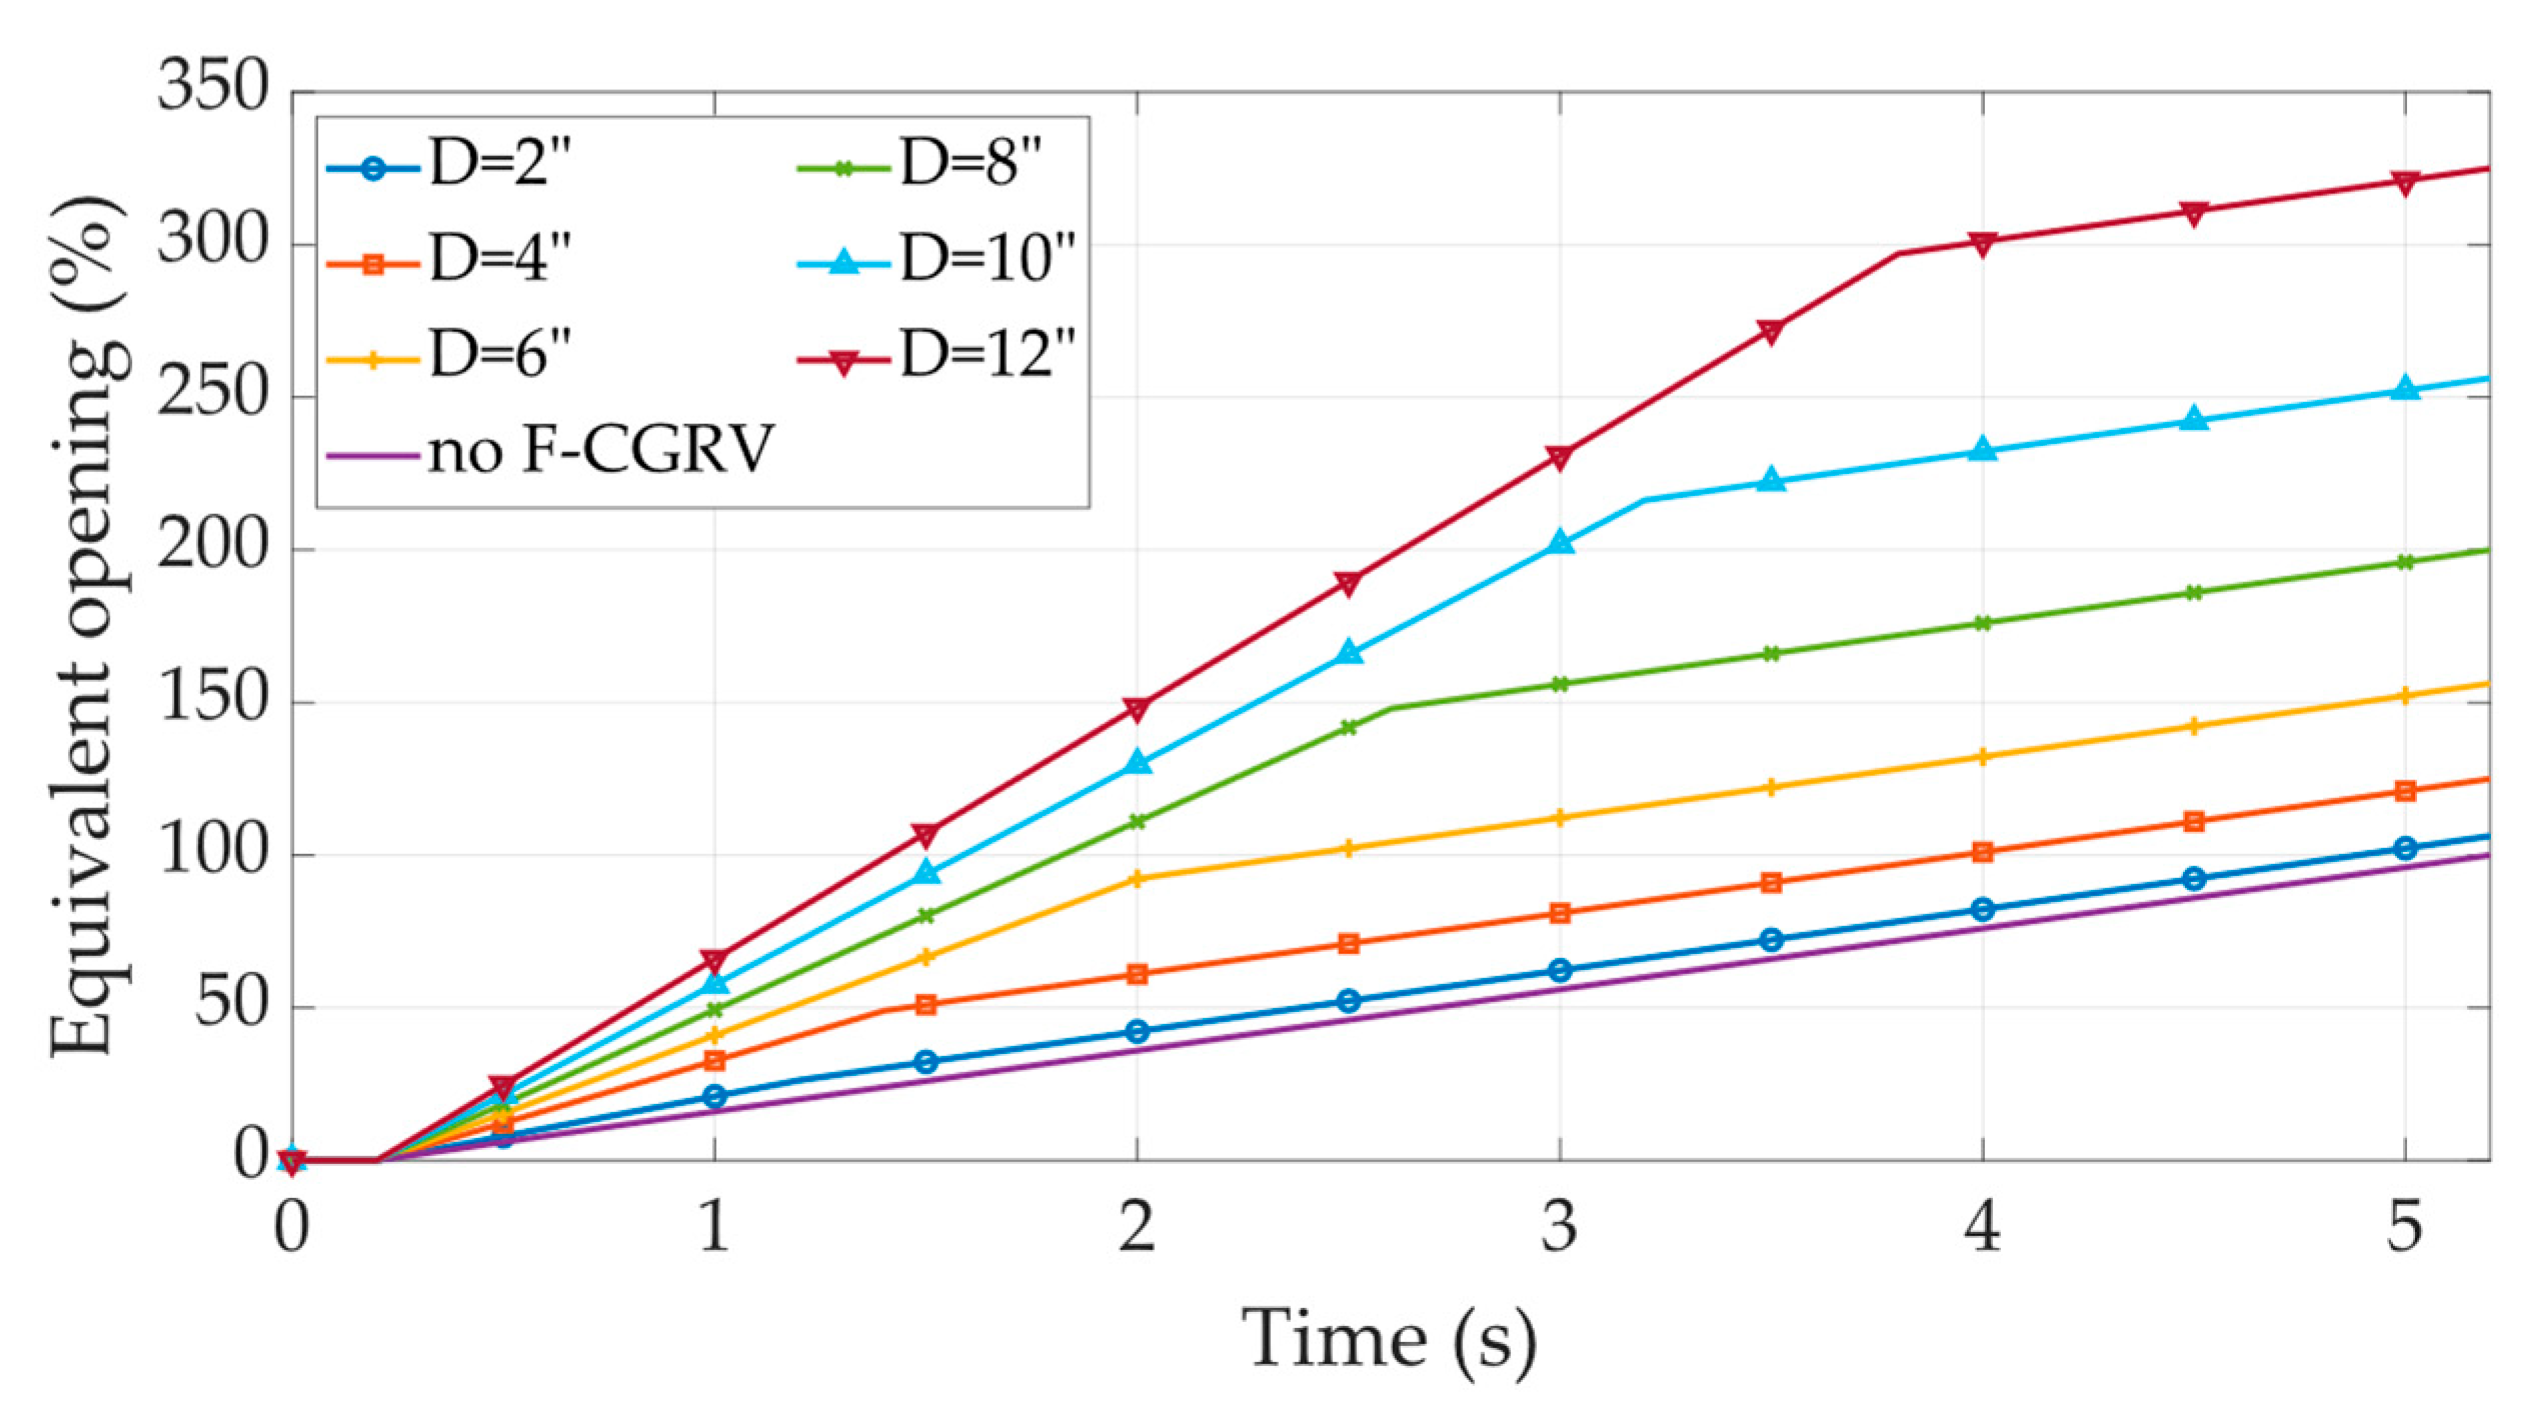
After the basic layout, the F-CGR one was analyzed. Here, Equation (1) was used as the input for the compressor shaft speed. As stated before, the simulations were performed for different values of the fast-acting valve size, between 2″ and 12″. However, as two valves are opening in parallel, the equivalent open area has been calculated over time as a percentage of the 8″ flow area.
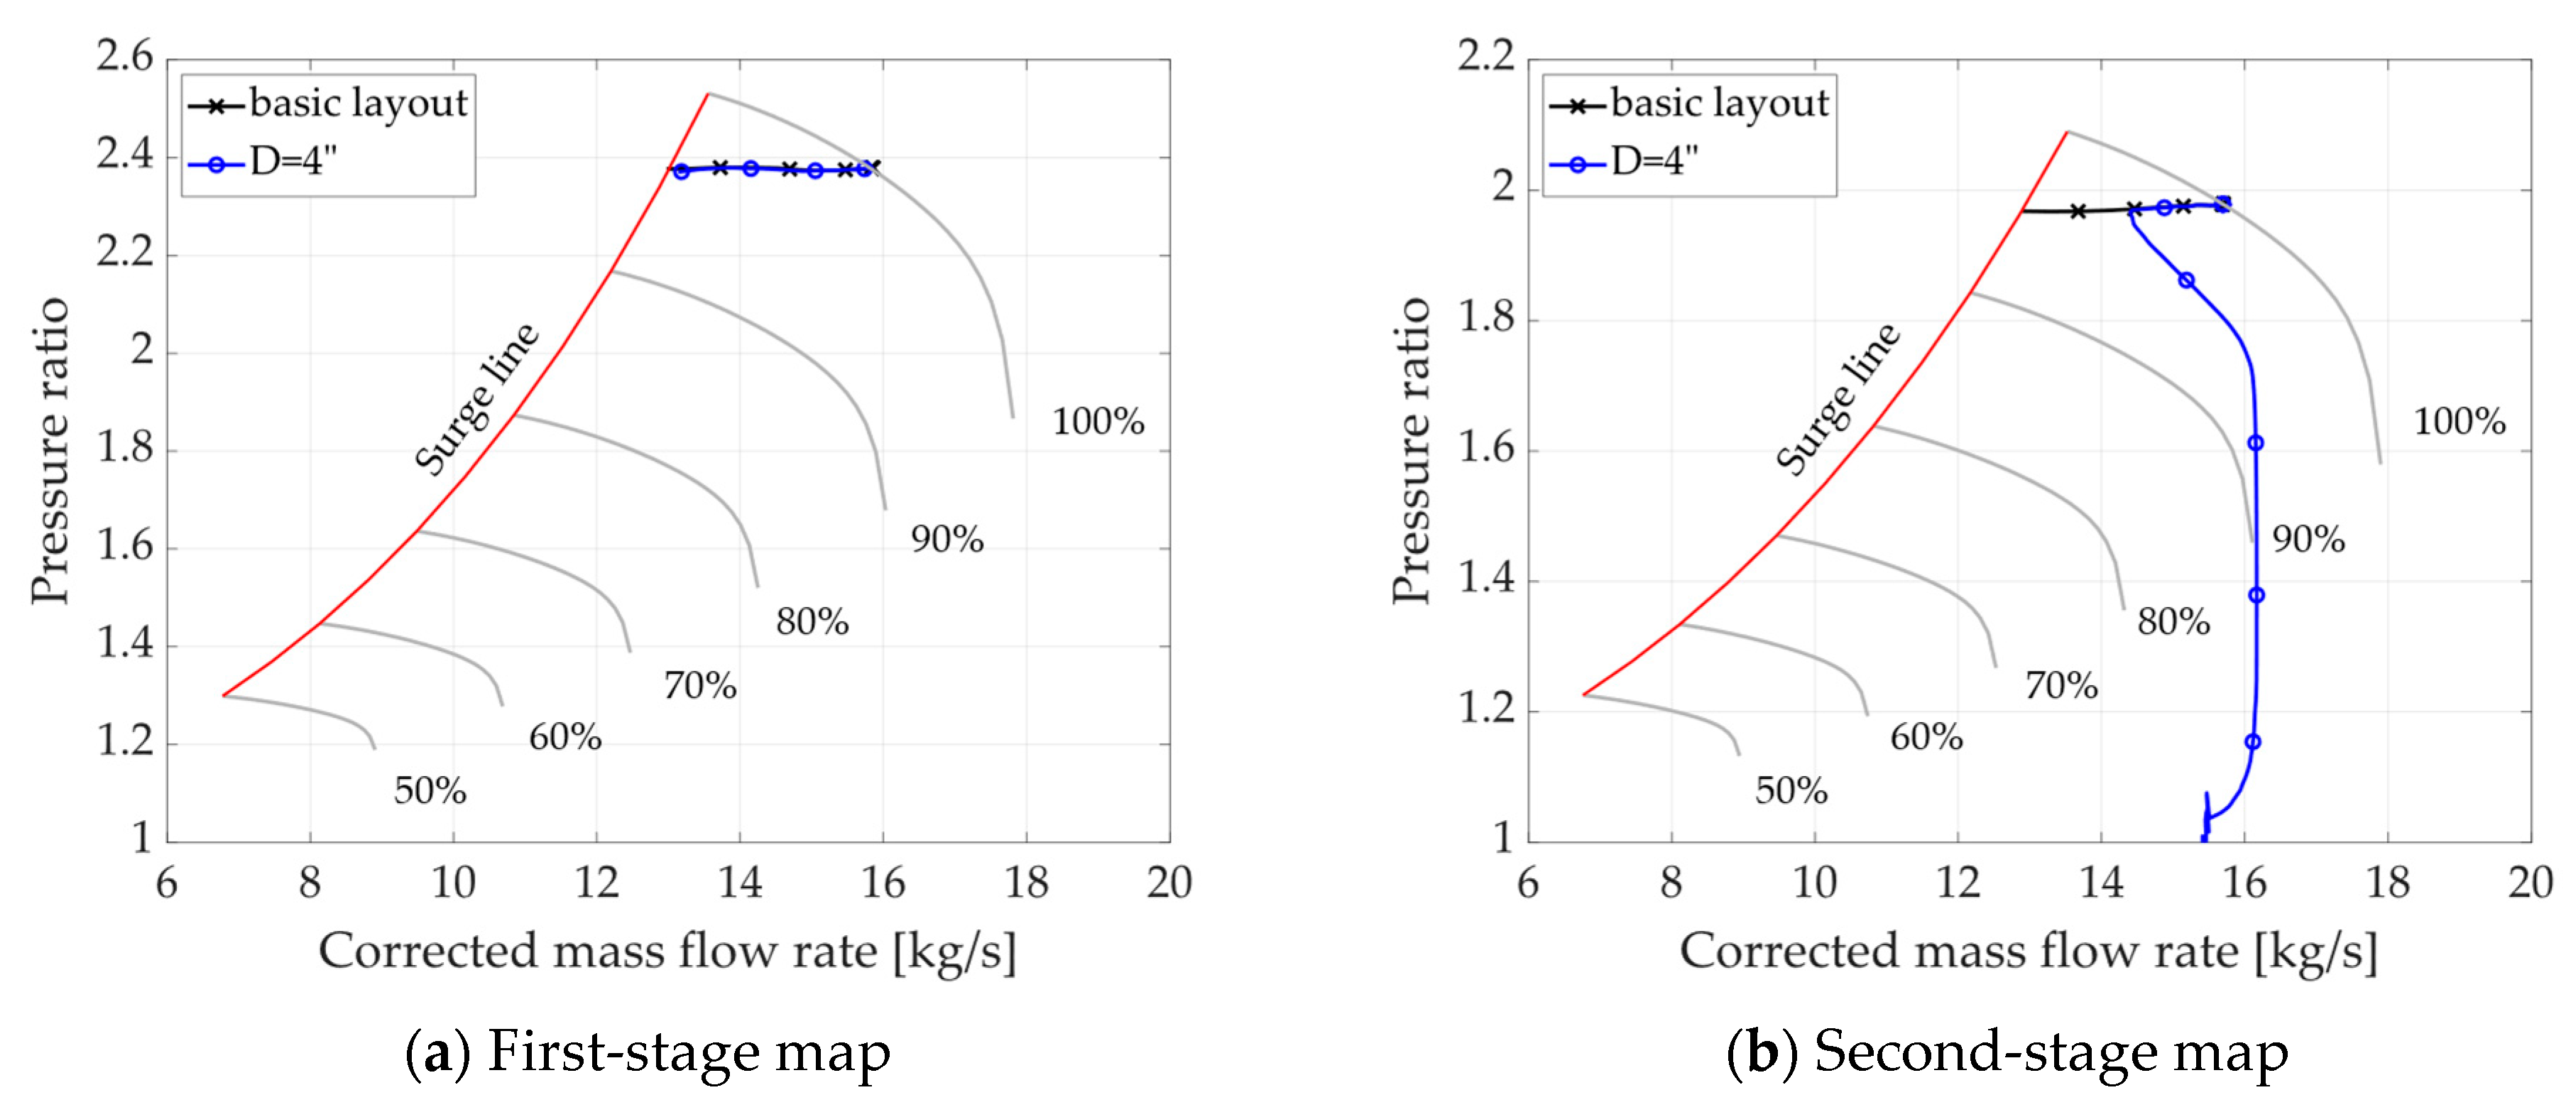
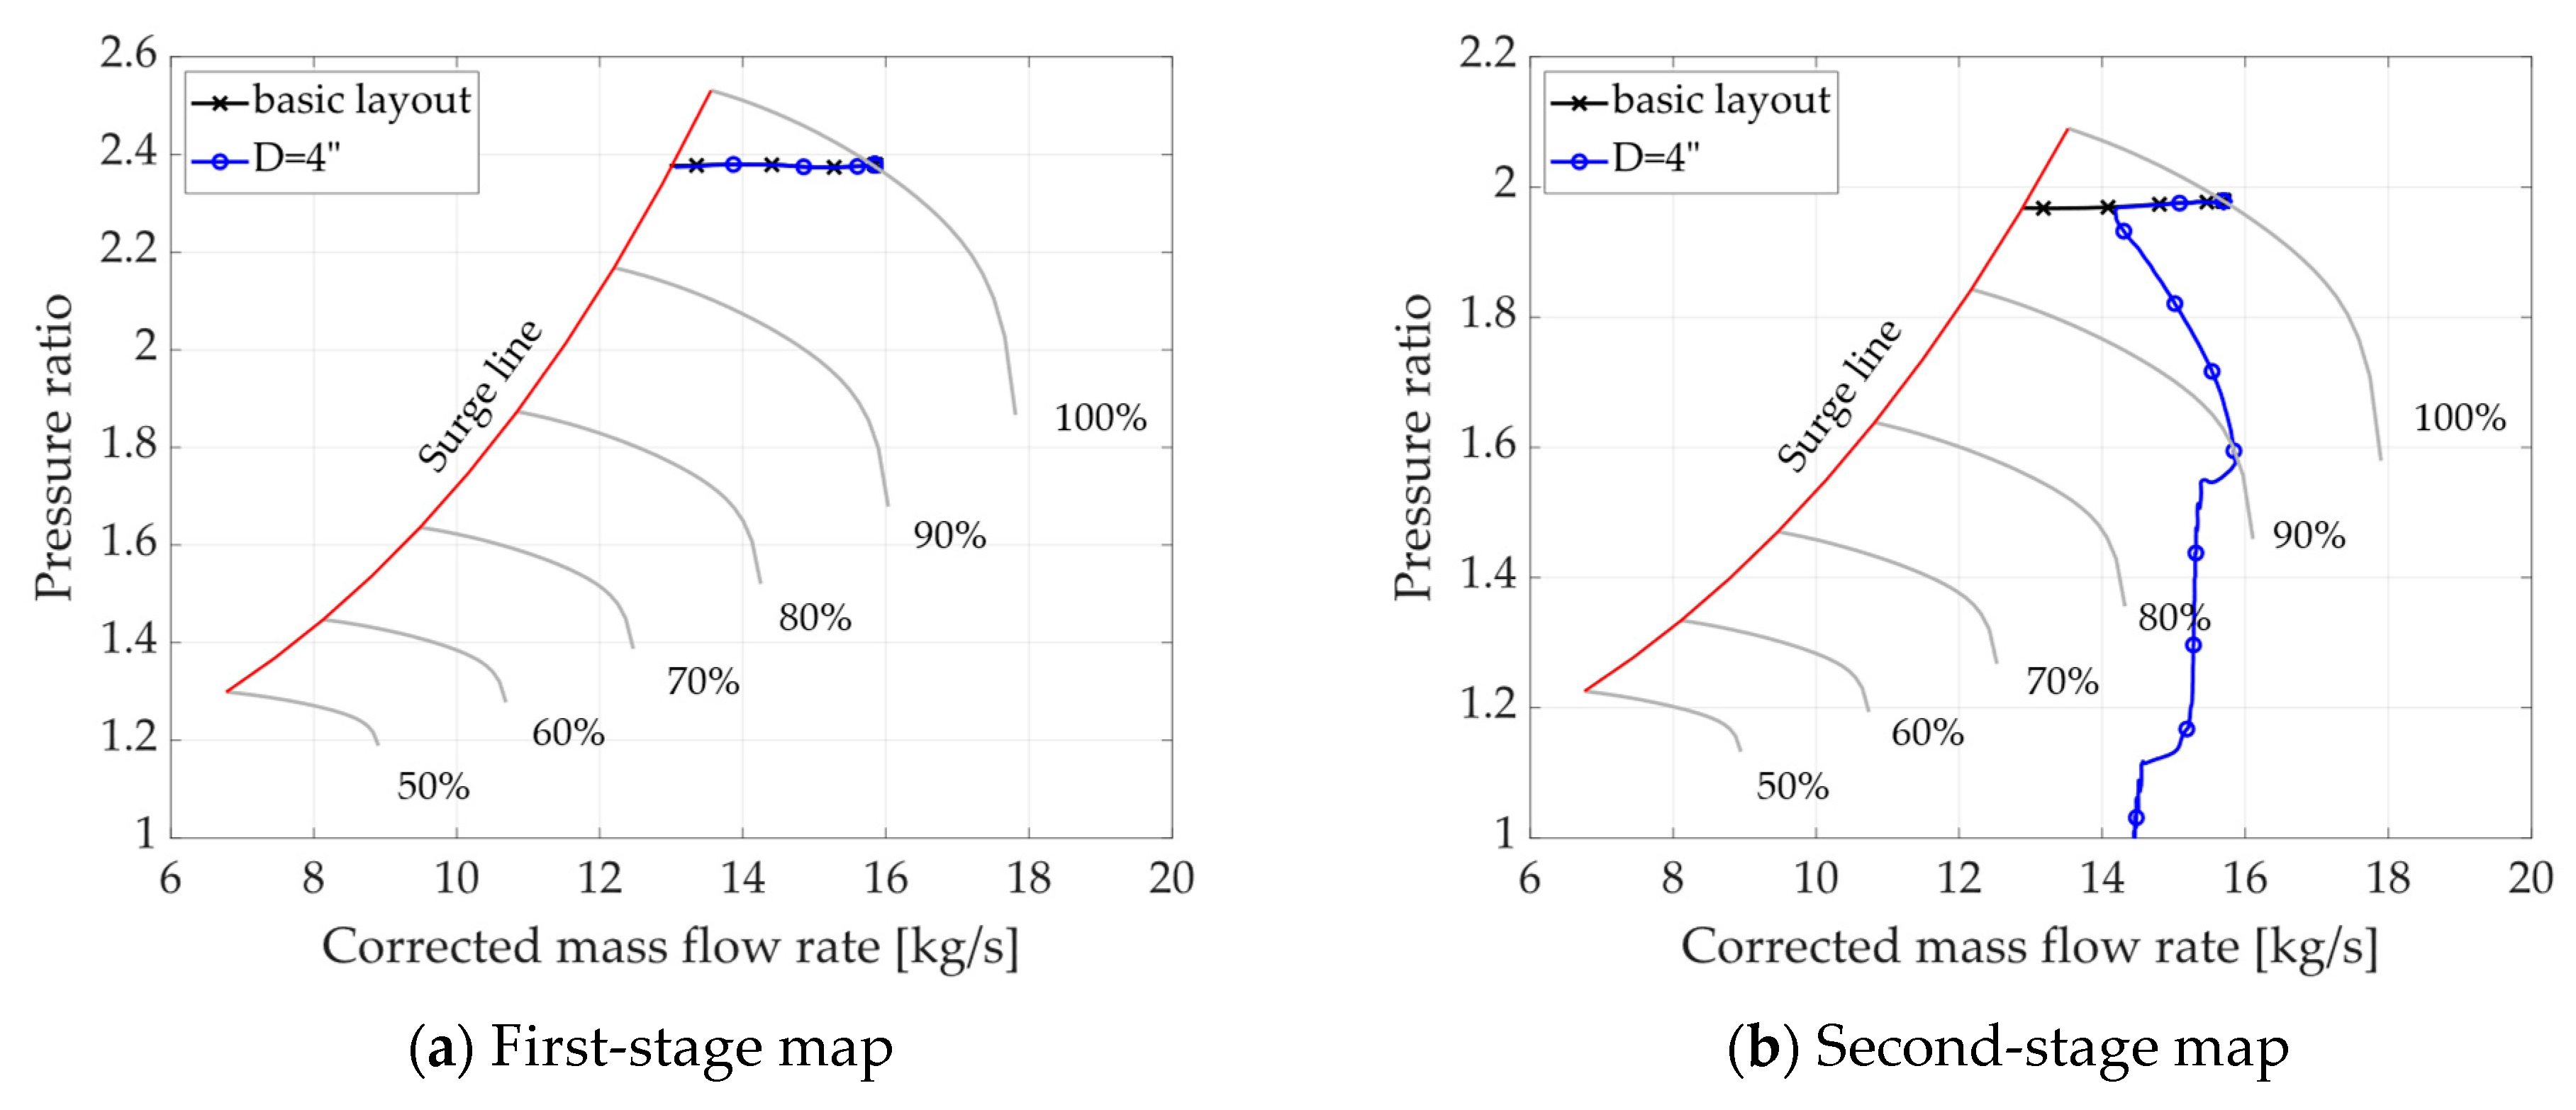
Here, it is possible to notice in Figure 5 how, for bigger F-CGR valves, the system achieves a 100% flow area earlier, providing a better resistance to surge. As the cold recycle system is modified, the new inertia and surge numbers are recalculated (Table 5). It is possible to notice how the inertia number remains unchanged. Then, the results in Figure 6 highlight how the 4″ size is the minimum value to prevent surge in the second stage. However, this solution is not adequate for addressing the phenomenon in the first stage. This happens because the inter-stage pressure remains relatively unchanged, maintaining a high first-stage pressure ratio.
Figure 5.
Equivalent recirculation flow area expressed as percentage of S-CGRV flow area at fully open conditions.
Table 5.
Surge and inertia numbers calculated for each F-CGRV size.
Figure 6.
Comparison of F-CGR layout with a 4″ valve with the basic layout results. Surge line in red and isospeed lines in grey.
3.3. 1V Layout
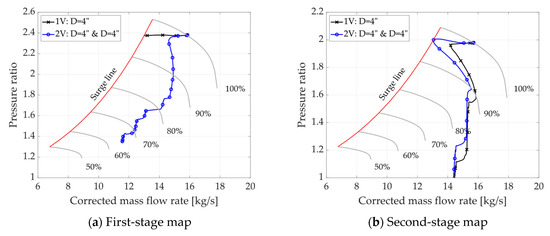
Then, the single-vent layout was investigated. The results highlight how this solution proves to be very similar to the F-CGR one. Figure 7 shows a comparison between the basic layout and the 4″ 1V layout. The operative-conditions trajectories for both stages appear similar to the previous case. Moreover, the surge timing (Table 4) shows how the 1V layout is slightly more effective, especially for larger valves. This effect is ascribed to the fact that the pressure drop over the vent valve is higher than that over the recirculation one. This implies that the mass flow rate is higher for the same flow coefficient. Consequently, the discharge volume’s pressure also varies with the same trend.
Figure 7.
Comparison of 1V layout with a 4″ valve with the basic layout results. Surge line in red and isospeed lines in grey.
3.4. 2V Layout
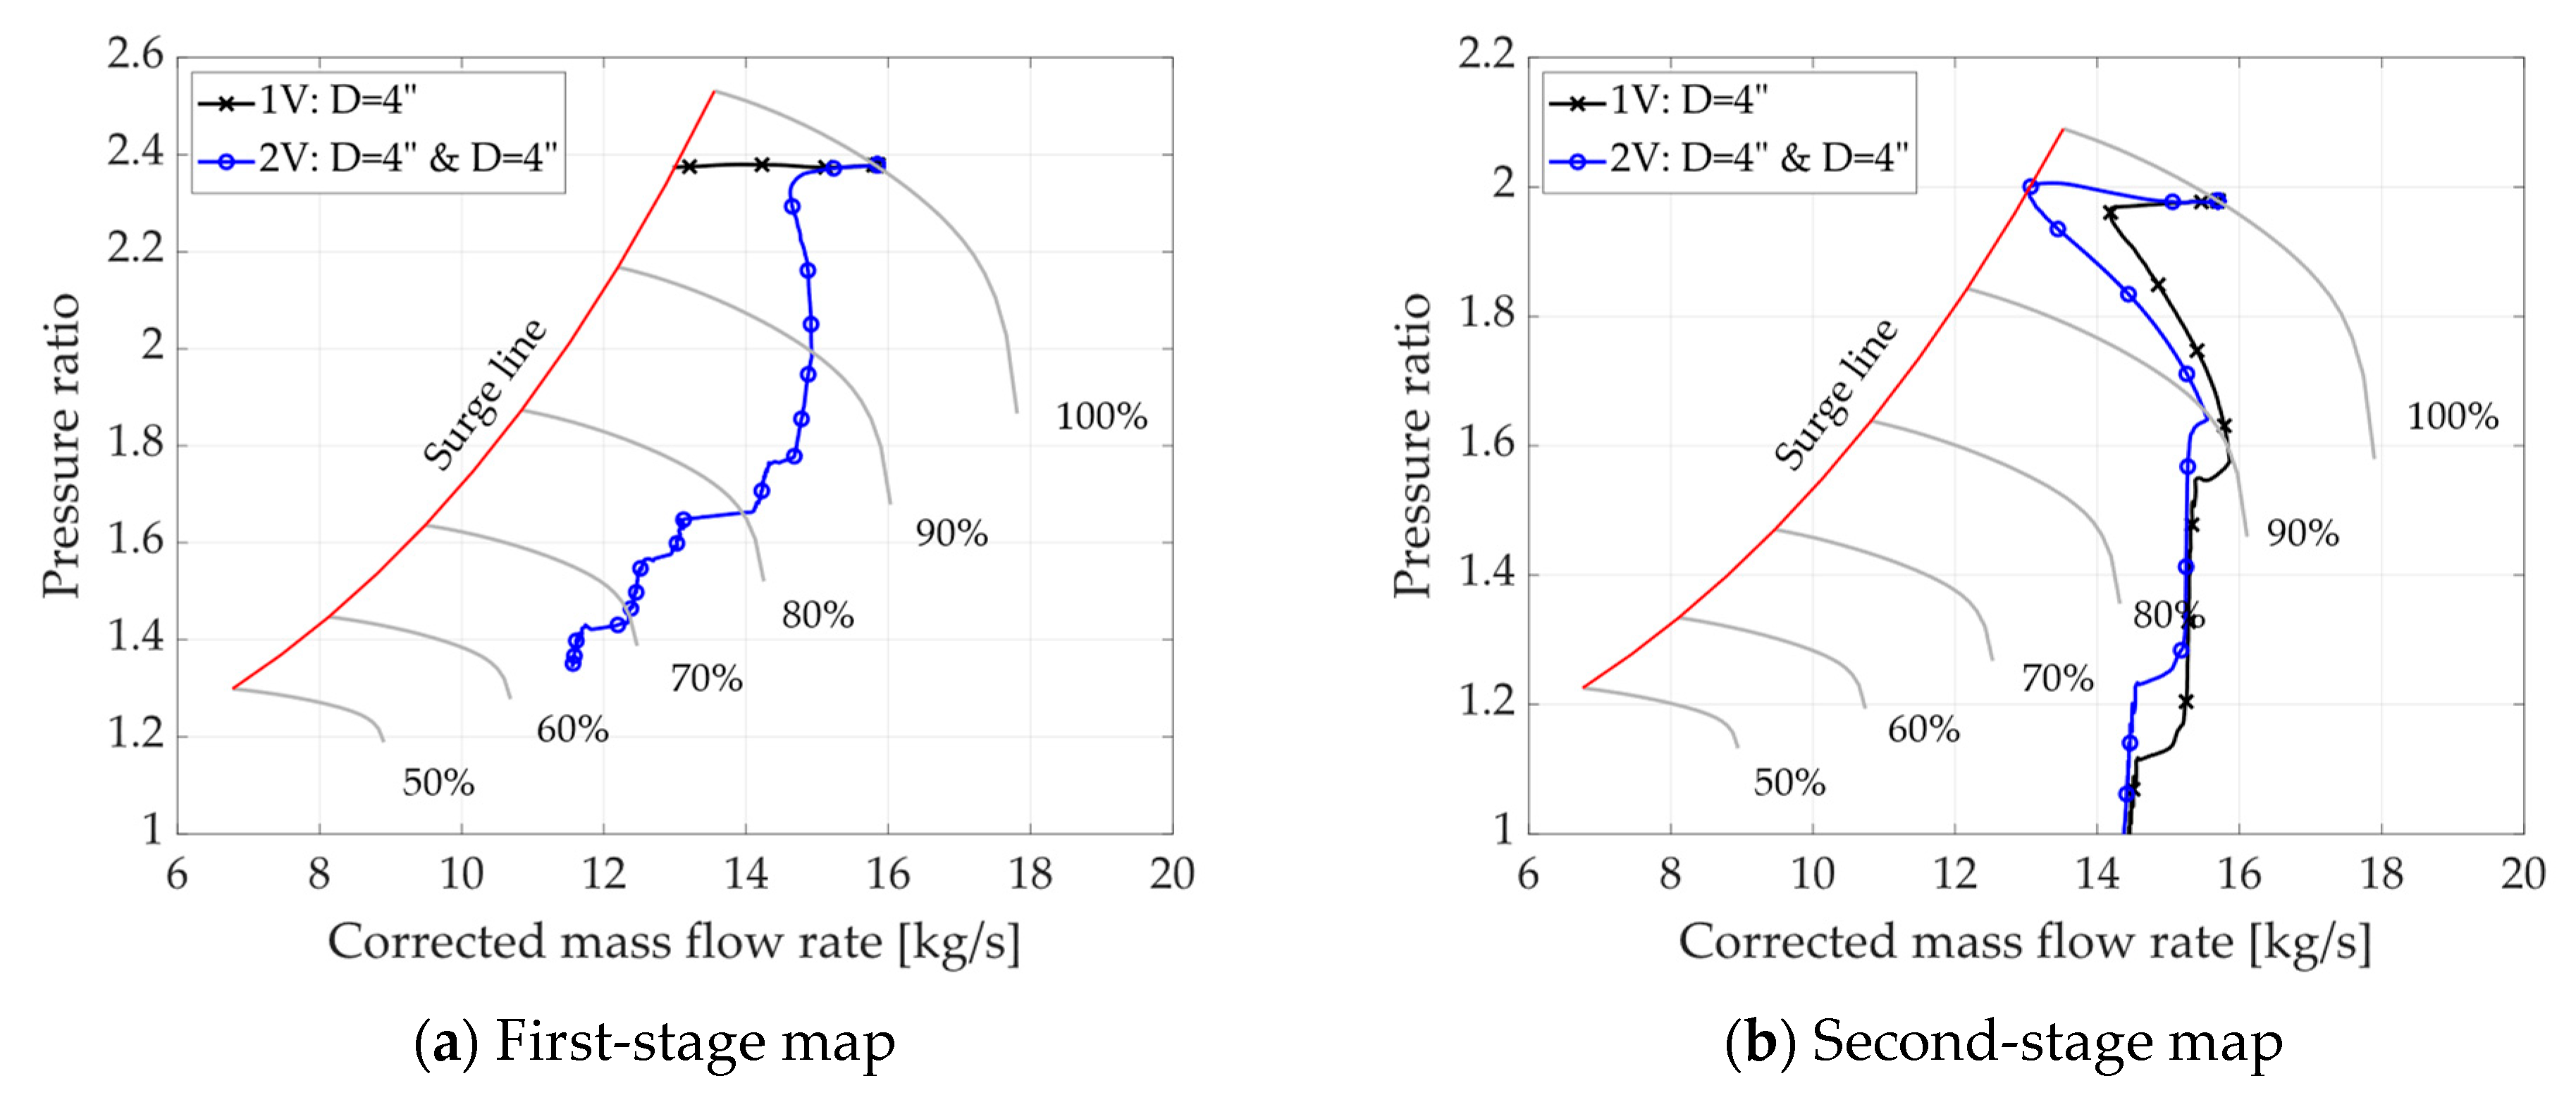
The double-vent layout was then investigated in order to address the influence of an inter-stage vent valve on the surge occurrence. Here, the results highlight how the additional valve helps mitigate the phenomenon in the first stage of the compressor, while it worsens the situation in the second one. The compressor maps in Figure 8 show how the first-stage compression ratio is reduced while the second one is increased in the first interval. This is related to the inter-stage pressure reduction. The surge timing (Table 4) confirms this, as the phenomenon may occur in the second stage even earlier than in the basic layout. Surge prevention is obtained for the 6” 2V layout, as using the 4″ size for both valves implies that the second stage falls into surge.
Figure 8.
Comparison of 2V layout with two 4″ valves with the 4″ 1V layout results. Surge line in red and isospeed lines in grey.
3.5. HGR Layout
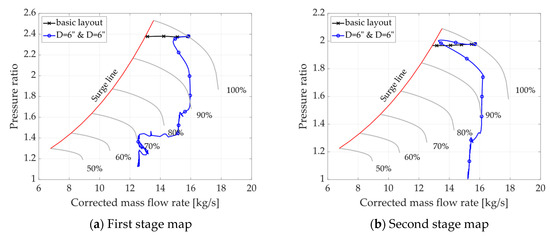
Lastly, the results from the HGR layout were collected. Here, the surge is prevented when both valves’ diameters are equal to 6″ (Figure 9). The first-stage recirculation valve increased the second-stage pressure ratio, as it happened with the inter-stage vent valve. This phenomenon reduced the surge margin of the second stage. Another important parameter for this layout is the intake temperature, as the hot discharge gas is sent to the machine intake without cooling. Consequently, the suction temperature peaks at about 100 °C a few seconds after the shutdown. With the installation of an intake check valve, this value may worsen further.
Figure 9.
Comparison of HGR layout with two 6″ valves with the basic layout results. Surge line in red and isospeed lines in grey.
4. Conclusions
In conclusion, this study focuses on the assessment of vent valves as a suitable solution for surge occurrence in comparison to the traditional layouts. In order to achieve this, a virtual model was created using the Amesim environment. The model allows for the simulation of transient operations, which is useful for the evaluation of compressor plant performance. The analysis started from a comparison of several speed trends derived from the literature. These offered a good approximation of the mechanical behavior of the compressor and provided the opportunity to implement more conservative conditions in the simulation. It allowed us to balance the uncertainties of the real system parameters. After the surge occurrence was assessed, the focus moved to the available solutions. The model’s results show how the 1V layout’s performance is similar to that of the F-CGR. While it is not always convenient (or possible) to release the processed gas into the environment, this solution is easier to implement. Then, the results highlight the importance of installing a second valve to avoid surge occurrence in the first stage. Consequently, the 2V and the HGR layout were developed. The first one proves to be more efficient than the second one (Table 4). Critically, the HGR layout leads to a peak suction temperature increase (reaching approximately 100 °C), which poses a significant risk of compressor damage and material degradation and, thus, makes this solution highly problematic in practice. Furthermore, the comparison reveals a key practical implication: to prevent the surge phenomenon from occurring, the HGR layout requires large 6″ valves, whereas the superior 2V configuration only requires 4″ valves. This substantial difference in layout and in the required valve sizing is a major finding, as it translates directly into lower system costs, a reduced physical footprint, and simplified piping complexity for the 2V system.
Then, the present model proved to be consistent with Yoon’s model. Despite the latter being able to predict if a hot-gas recycle valve is required to prevent surge during ESD, it does not provide information about the minimum HGR valve size. A detailed fluid dynamic model is necessary for choosing the valves’ diameter, evaluating different strategies (vent valves), and exploring the limits of simplified dimensionless models. In essence, this research sheds light on the challenges associated with surge control in compressor units, emphasizing the need for a comprehensive approach that considers various parameters. The results provide a roadmap for future investigations and system redesigns, ultimately contributing to the advancement of compressor technology.
Author Contributions
A.F., L.C., and L.T. conceived and organized the work; L.T., A.F., and A.B. designed the models and simulations, analyzed the data, and wrote the draft article; and L.T. and F.P. wrote the final article. All authors have read and agreed to the published version of the manuscript.
Funding
This research was supported by the European Union NextGenerationEU within the National Recovery and Resilience Plan (NRRP) Mission 4, “Education and Research”, Component 2 “From Research to Business”, under the Italian Ministry of University and Research (MUR) Decree No. 351 of 9 April 2022. CUP (Unique Project Code): F81J22000370006. PhD Scholarship code: 38-411-A7-DOT13A7511-1285.
Data Availability Statement
The original contributions presented in this study are included in this article. Further inquiries can be directed to the corresponding author.
Conflicts of Interest
Authors Andrea Betti, Leonardo Cappelli, Andrea Fusi were employed by the company Compression Service Technology s.r.l. The remaining authors declare that the research was conducted in the absence of any commercial or financial relationships that could be construed as a potential conflict of interest.
Abbreviations
The following abbreviations are used in this manuscript:
| 1D-CFD | One-dimensional computational fluid dynamics |
| ESD | Emergency shutdown |
| CGR | Cold-gas recycle |
| HGR | Hot-gas recycle |
| DSA | Dynamic system analysis |
| S-CGR | Slow cold-gas recycle |
| F-CGR | Fast cold-gas recycle |
| S-CGRV | Slow cold-gas recycle valve |
| F-CGRV | Fast cold-gas recycle valve |
| 1V | Single vent |
| 2V | Double vent |
References
- Botros, K. Single versus dual recycle system dynamics of high pressure ratio, low inertia centrifugal compressor stations. J. Eng. Gas Turbines Power 2011, 133, 122402. [Google Scholar] [CrossRef] [Scilit]
- Soriano, K.; Muñoz, J. Application of Dynamic Simulation for the Design of the LNG Inlet Gas Compressor Anti-Surge Protection. In IOP Conference Series: Materials Science and Engineering; IOP Publishing: Bristol, UK, 2024. [Google Scholar]
- Wright, T. Fluid Machinery: Performance, Analysis, and Design; CRC press: Boca Raton, FL, USA, 1999. [Google Scholar]
- Sparks, C.R. On the transient interaction of centrifugal compressors and their piping systems. J. Eng. Power 1983, 105, 891–901. [Google Scholar] [CrossRef] [Scilit]
- Kurz, R.; Garceau, S.; Ji, M.; Brun, K. Compressor speed decay during emergency shutdowns. In Turbo Expo: Power for Land, Sea, and Air; American Society of Mechanical Engineers: New York, NY, USA, 2019. [Google Scholar]
- Macdougal, I.; Elder, R. Simulation of centrifugal compressor transient performance for process plant applications. J. Eng. Power 1983, 105, 885–890. [Google Scholar] [CrossRef] [Scilit]
- Morini, M.; Pinelli, M.; Venturini, M. Development of a one-dimensional modular dynamic model for the simulation of surge in compression systems. J. Turbomach. 2007, 129, 437–447. [Google Scholar] [CrossRef] [Scilit]
- Pak, S.-j.; Yoon, J.W.; Kim, S.; Salim, F.; Lee, J.; Kim, I.-W. Case study of surge avoidance design for centrifugal compressor systems during emergency shut-down (ESD). Korean J. Chem. Eng. 2016, 33, 764–774. [Google Scholar] [CrossRef] [Scilit]
- Almasi, A. Latest techniques and practical notes on anti-surge systems for centrifugal compressors. Aust. J. Mech. Eng. 2012, 10, 81–90. [Google Scholar] [CrossRef] [Scilit]
- Haeckel, T.; Paul, D.; Leichtfuß, S.; Schiffer, H.-P.; Eißler, W. Determination of a Numerical Surge Limit by Means of an Enhanced Greitzer Compressor Model. Int. J. Turbomach. Propuls. Power 2023, 8, 48. [Google Scholar] [CrossRef] [Scilit]
- Cravero, C.; Marsano, D. Instability phenomena in centrifugal compressors and strategies to extend the operating range: A review. Energies 2024, 17, 1069. [Google Scholar] [CrossRef] [Scilit]
- Qiao, Y.; Chu, W.; Zhang, H.; Sun, Z.; Wang, K.; Chen, J. Secondary surge phenomenon of the compressor during surge recovery and its mechanism analysis. Phys. Fluids 2025, 37, 016127. [Google Scholar] [CrossRef] [Scilit]
- Botros, K.K.; Ganesan, S.T. Dynamic instabilities in industrial compression systems with centrifugal compressors. In Proceedings of the 37th Turbomachinery Symposium, College Station, TX, USA, 20–23 September 2008; Texas A&M University, Turbomachinery Laboratories: College Station, TX, USA, 2008. [Google Scholar]
- Yoon, J.-W.; Wilailak, S.; Bae, J.-E.; Lee, C.-J.; Kim, I.-W. Surge analysis in a centrifugal compressor using a dimensionless surge number. Chem. Eng. Res. Des. 2020, 164, 240–247. [Google Scholar] [CrossRef] [Scilit]
- Brun, K.; Simons, S.; Kurz, R.; Munari, E.; Morini, M.; Pinelli, M. Measurement and prediction of centrifugal compressor axial forces during surge—Part I: Surge force measurements. J. Eng. Gas Turbines Power 2018, 140, 012601. [Google Scholar] [CrossRef] [Scilit]
- Munari, E.; Morini, M.; Pinelli, M.; Brun, K.; Simons, S.; Kurz, R. Measurement and Prediction of Centrifugal Compressor Axial Forces During Surge—Part II: Dynamic Surge Model. J. Eng. Gas Turbines Power 2018, 140, 012602. [Google Scholar] [CrossRef] [Scilit]
- Epstein, A.; Ffowc, J.; Greitzer, E. Active suppression of compressor instabilities. In Proceedings of the 10th Aeroacoustics Conference, Washington, DC, USA, 9–11 July 1989. [Google Scholar]
- Tamaki, H. Effect of piping systems on surge in centrifugal compressors. J. Mech. Sci. Technol. 2008, 22, 1857–1863. [Google Scholar] [CrossRef] [Scilit]
- Powers, K.; Kennedy, I.; Archer, J.; Eynon, P.; Horsley, J.; Brace, C.; Copeland, C.; Milewski, P. A new first-principles model to predict mild and deep surge for a centrifugal compressor. Energy 2022, 244, 123050. [Google Scholar] [CrossRef] [Scilit]
- Pinsley, J.; Guenette, G.; Epstein, A.; Greitzer, E. Active stabilization of centrifugal compressor surge. J. Turbomach. 1991, 113, 723–732. [Google Scholar] [CrossRef] [Scilit]
- Gravdahl, J.T.; Egeland, O. Centrifugal compressor surge and speed control. IEEE Trans. Control Syst. Technol. 1999, 7, 567–579. [Google Scholar] [CrossRef]
- Blanchini, F.; Giannattasio, P.; Micheli, D.; Pinamonti, P. Experimental evaluation of a high-gain control for compressor surge suppression. J. Turbomach. 2002, 124, 27–35. [Google Scholar] [CrossRef] [Scilit]
- Zou, W.; He, X.; Zhang, W.; Niu, Z.; Zheng, X. Roles of vanes in diffuser on stability of centrifugal compressor. Proc. Inst. Mech. Eng. Part G J. Aerosp. Eng. 2019, 233, 5380–5392. [Google Scholar] [CrossRef] [Scilit]
- Siemens. Simcenter Amesim User’s Guide. 2022. Available online: https://resources.sw.siemens.com/en-US/presentation-simcenter-amesim-software-guide/ (accessed on 12 October 2022).
- Alix, G.; Pera, C.; Bohbot, J.; Baldari, A. Comparison of 0D and 1D Duct System Modeling for Naturally Aspirated Spark Ignition Engines; SAE Technical Paper: Warrendale, PA, USA, 2011. [Google Scholar]
- Wendroff, B. Difference methods for initial-value problems (Robert D. Richtmyer and KW Morton). SIAM Rev. 1968, 10, 381–383. [Google Scholar] [CrossRef] [Scilit]
- Bassett, M.; Pearson, R.; Fleming, N.; Winterbone, D. A multi-pipe junction model for one-dimensional gas-dynamic simulations. SAE Trans. 2003, 112, 565–583. [Google Scholar]

Disclaimer/Publisher’s Note: The statements, opinions and data contained in all publications are solely those of the individual author(s) and contributor(s) and not of MDPI and/or the editor(s). MDPI and/or the editor(s) disclaim responsibility for any injury to people or property resulting from any ideas, methods, instructions or products referred to in the content. |
© 2025 by the authors. Licensee MDPI, Basel, Switzerland. This article is an open access article distributed under the terms and conditions of the Creative Commons Attribution (CC BY) license.