


Abstract
Modern industrial equipment is a cyber-physical system (CPS) consisting of physical production components and digital controls. Lowering maintenance costs and increasing availability is important to improve its efficiency. Modern methods, based on solving event prediction problem, in particular, prediction of remaining useful life (RUL), are used as a crucial step in a framework of reliability-centered maintenance to increase efficiency. But modern methods of RUL forecasting fall short when dealing with real-world scenarios, where CPS are described by multidimensional continuous high-frequency data with working cycles with variable duration. To overcome this problem, we propose a new method for fault prediction, which is based on extraction of semantic state vectors (SSVs) from working cycles of equipment. To implement SSV extraction, a new method, based on convolutional autoencoder and extraction of hidden state, is proposed. In this method, working cycles are detected in input data stream, and then they are converted to images, on which an autoencoder is trained. The output of an intermediate layer of an autoencoder is extracted and processed into SSVs. SSVs are then combined into a time series on which RUL is forecasted. After optimization of hyperparameters, the proposed method shows the following results: RMSE = 1.799, MAE = 1.374. These values are significantly more accurate than those obtained using existing methods: RMSE = 14.02 and MAE = 10.71. Therefore, SSV extraction is a viable technique for forecasting RUL.
1. Introduction
Modern energy facilities and advanced manufacturing plants are essentially cyber-physical systems (CPSs), integrating physical production components with digital control mechanisms to ensure efficient and timely production [1,2]. Here, we focus on diverse cyber-physical systems in the energy domain, notably those in power generation, which include turbines, generators, and automatic control systems featuring data collection and control elements. Typically, the digital component of a CPS consists of sensors, actuators, software applications, and networking components that operate in real-time mode [3]. The implementation of such systems can substantially enhance production efficiency and elevate product quality while also reducing costs. As such, the operation of CPS has a profound impact on the competitive edge and operational efficiency of manufacturing companies [4].
The performance of cyber-physical systems depends on their reliability, particularly their ability to consistently perform intended functions or maintain availability of both physical and digital components [5]. Reliability management is a complex problem that requires comprehensive data collection and analysis, as well as decision making support to address technical impacts or control actions on an equipment. This problem is amplified by the unique nature of cyber-physical systems, which is expressed on the limits of such cyber-physical systems.
- Industrial energy CPSs are characterized by continuous high-frequency data collected by multiple sensors (multidimensional continuous high-frequency data, pMCHF).
- The operation of cyber-physical systems involves working cycles of varying duration (cycles’ time variation, pCTV).
Basically, there are approaches to maintenance within the framework of the reliability management process: corrective maintenance, preventive maintenance, and reliability-centered maintenance. Currently, the most promising concept is called prognosis and predictive health management (PPHM) and might be considered the next generation of a reliability-centered maintenance approach. PPHM is considered a very promising approach in Industry 4.0 despite current challenges and limitations [6,7].
PPHM is based on the idea of a threefold approach: (i) gathering data (an observe stage); (ii) assessing and predicting the technical condition of a cyber-physical system and predicting its remaining useful life and predicting potential failures (an analyze stage); and (iii) making and executing decisions (or act stage) [8]. The second stage includes the prediction problem, which can be decomposed into the following task: forecast the health indicator (or health index) for a certain horizon, estimate remaining useful life (RUL) and predict the faults (FP). Decisions initiate practical activities such as inspection, maintenance, and system configuration, all aimed at optimizing system performance and longevity [9].
A more accurate RUL forecast in the framework of prognosis and predictive health management in the second stage allows for more efficient scheduling in the third stage, therefore increasing the overall efficiency of the equipment by reducing downtime and optimizing maintenance intervals.
The main technical challenge, addressed in this paper, is building a precise RUL forecast for the cyber-physical systems that have aforementioned properties. These properties pose a challenge, since current forecasting models are not able to handle this kind of input as they are mostly target per-cycle aggregated data [10], like Turbofan dataset [11]. Therefore, by applying these models directly to the input data, inaccurate results are obtained. To address this problem and increase accuracy, additional steps are required to transform input data in a way that produces per-cycle aggregated data that can be handled by a forecasting model.
Based on formalization [12], consider a set O of cyber-physical systems of the same type . Each system is equipped with a range of sensors S to gather data on the performance of its components. Each sensor captures a set of measurements over a given observation period T. These sets are formed into a matrix of observations or dataset D. For given cyber-physical systems O, there may be numerous incident reports E containing information about timestamps of failure events and transition to the limiting state as a set of pairs . So, it is needed to find the best-performing model.
where is the model’s output, is a loss function, A is a finite set of models (algorithms), and is a model that minimizes the given loss function, i.e., it produces the most accurate forecast.
Given a new cyber-physical system of the same type , which has the same set of sensors and its own dataset of observations , it is necessary to determine the time at which failure and/or end of life occurs using .
Within this framework, two types of events are considered: the failure event and the transition to a limiting state or the end-of-life event. For the first type of event, the problem of Failure Prediction, or the FP problem, is considered, and for the second type, the remaining useful lifetime prediction, or the RUL problem, is considered. Formally, both the FP problem and RUL problem can be generalized as the prediction of the time at which a specific event occurs, or the Event Prediction problem, the EP problem. Consequently, the EP problem can be effectively formulated as a regression problem, where the aim is to predict the time until the occurrence of these critical events [13,14].
The EP problem is a well-known problem in the field of machinery and reliability management [15]. However, it is necessary to point out the following open question related to the above-mentioned limitation of cyber-physical systems. Most published solutions of the EP problem for complex equipment utilize well-known datasets, like TurboFan [16], which contains aggregated data over the working cycles. Models that have proven themselves well in solving show very limited results when applied to high-frequency data. This means it is necessary to find novel approaches to data preprocessing or to develop new forecasting models. Efforts to address the challenge of the EP problem without preprocessing have yielded unsatisfactory outcomes. This is also due to the fact that there are significant variations in the working cycle durations in other datasets. To address this issue, it is necessary to develop models with adaptive input layers that can accommodate such variability. As a result, even the most advanced techniques may demonstrate substantial inaccuracies when directly applied to this particular dataset [17].
In this context, an issue arises—the development of a method for RUL estimation of cyber-physical systems that are characterized by multi-dimensional and instantaneous measurements or have all of the above-mentioned limitations. The main contribution of the paper is a new method for forecasting RUL that is based on preprocessing multidimensional data into images that represent working cycle data and extracting semantic state vectors from these images by extracting and transforming hidden states from convolutional architecture.
2. Background
This section surveys recent academic works addressing EP problems for the limitations determined above, specifically focusing on intelligent fault diagnosis and RUL prediction mainly for rotating machinery like bearings and milling tools. The review is structured into two main parts:
- Innovative Model Architectures. The first part covers papers which propose novel deep learning model structures to improve diagnostic accuracy and prediction.
- Advanced Data Preprocessing and Representation. The second part highlights papers that focus on transforming raw, high-frequency sensor data (like vibration and acoustic signals) into more informative formats, primarily 2D time-frequency images, to enhance model performance.
2.1. Innovative Model Architectures
The opening series of papers examines innovative model architectures designed to solve core predictive maintenance tasks: estimating remaining useful life and forecasting failures for intelligent fault diagnosis. All papers provide results that improve performance indicators for datasets consisting of high-frequency data, like XJTU–SY [18] or the NASA Bearing Dataset [19].
The idea of an ensemble of deep learning models for intelligent fault diagnosis is proposed by Niyongabo et al. [20]. Particularly, the authors propose a fault diagnosis model for rolling bearings based on an ensemble of networks, combining improved DenseNet and SENet models.
Another idea is presented by Yu and Hu [21], where wide convolutional kernels are used for initial feature extraction. As a novel result, this paper proposes a Multi-Scale Convolutional Neural Network with Self-Knowledge Distillation (MSCNN-SKD) for bearing fault diagnosis.
Gong et al. [22] suggest applying the support vector machine (SVM) method and global average pooling technology to enhance the structure of CNN for fault classification.
Xiong et al. [23] propose a novel network named WPT-CNN (from Wavelet Packet Transform into Convolutional Neural Network Structures) for an end-to-end intelligent fault diagnosis of rolling bearings. The main idea is to fuse time-frequency analysis ability into the architecture of the classification model and automatically search for more suitable time-frequency coefficients during the training process.
Another interesting architecture with a high-performance double-pyramidal fusion module, or HDPF, is presented by Zhao and Luo in [24]. This module allows the extraction of more adequate and effective multiscale complex feature information.
Li et al. [25] propose a novel multi-branch feature cross-fusion bearing fault diagnosis model (MCFormer). The core of the paper is a multi-branch structure extracting local features from each sensor separately.
Sohaib et al. [26] suggest another hybrid feature pool that is used in combination with sparse stacked autoencoder (SAE)-based deep neural networks (DNNs) to perform an effective diagnosis of bearing faults of varying severity. The fusion model provides more accurate and reliable RUL predictions than models using only a single data source, highlighting the benefit of multimodal high-frequency data integration.
A bearing fault diagnosis method based on mixed pooling deep belief network (MP-DBN) is suggested by Tang et al. [27]. Morlet wavelet is used to obtain the corresponding time–frequency representation.
Another interesting model based on the domain adversarial neural network (DANN) and attention mechanism to identify rolling bearing faults is proposed by Wu et al. [28]. The authors claim that the feature extractor with an attention mechanism enables the model to learn and retain key features related to the faults during the training process.
Wang et al. [29] improve the sparrow search algorithm (ISSA) for configurable parameters in the Long Short-Term Memory (LSTM) network for RUL prediction. The experimental dataset featuring LDK UER204 rolling element bearings from the XJTU–SY bearing was used [18]. It is shown that the RMSE of the prediction is quite small (RMSE = 0.007).
2.2. Advanced Data Preprocessing and Representation
The next part of the review includes articles on EP problems that propose original solutions for data preprocessing, including transformation into another representation.
Time–frequency domain (TFD) features such as short-time Fourier transform (STFT) and different wavelet transforms (WTs) are considered preprocessing techniques for the RUL estimation of the milling cutter by Sayyad et al. [30]. The TFD feature extraction technique has been shown to be effective for RUL prediction with deep learning models such as LSTM, CNN, and hybrid CNN models with LSTM variants. The IEEE NUAA Ideahouse dataset was used in the paper.
Makrouf et al. presented a novel [31] multi-sensor fusion approach for bearing fault diagnosis that combines vibration and acoustic signals within a transfer learning framework. Continuous Wavelet Transform (CWT) is applied to multi-sensor inputs, and the resulting wavelet coefficients are fused using the Maximum-Energy-to-Shannon-Entropy Ratio (ME-to-SER) criterion to fine-tune pre-trained Convolutional Neural Networks (CNNs).
Interesting research regarding the search for an optimal (minimal) input vector is presented by Chen et al. [32]. In their work, the low bound for input size of 2D data is analyzed by considering the relationship between the characteristic vibration frequencies and the window size of short-time Fourier transform (STFT) to guide the determination of the minimum input size. CNN is also used as the main architecture of the model.
The idea of extracting features from multiple sensor data is presented in a paper by Liu et al. [33]. The authors use feature extraction and generation approaches, e.g., analyzing features in time domain (TD), frequency domain (FD) and time–frequency domain (TFD).
The paper by Liu et al. [34] addresses RUL prediction by converting raw high-frequency vibration signals into 2D time-frequency images (like spectrograms) using a Continuous Wavelet Transform (CWT). This transformation allows a Convolutional Neural Network (CNN) to learn features directly from these images. The method demonstrates superior accuracy in the RUL estimation for rolling bearings when compared to models using traditional hand-crafted features, verifying that time–frequency analysis is effective for leveraging high-frequency data.
Also, the idea to convert multimodal data into another representation is introduced by Rahmati and Rahmati [35], so by fusing features from Convolutional Neural Networks (CNNs) for image data, recurrent neural networks (RNNs) for acoustic sequences, and signal transformers for vibration time series.
The same idea of converting the original vibration signal into a grayscale image is proposed by Tang et al. [36].
According to Silva [37], semantic–functional approaches leverage the inherent meaning and function of system states to minimize explicit communication while maintaining system performance. By extracting a semantic state vector that encapsulates the functional and contextual information of a cyber-physical system, it becomes possible to monitor and predict fault events more effectively through event-triggered communication schemes that focus on significant semantic–functional states rather than raw data transmission.
Finally, note the brand new review by Wang et al. [38], where the main finding from a large number of research papers is as follows: “Despite the remarkable achievements of deep learning in diagnosing standard rotating components such as bearings and gearboxes, it faces a fundamental leap when transitioning from controlled laboratory environments to the complex realities of port industrial settings.”. The reason for this is correlated with the limitations of cyber-physical systems and provided in the paper.
2.3. Key Findings
The field of intelligent fault diagnosis and Remaining Useful Life prediction is undergoing a significant transformation, driven by advanced deep learning architectures and sophisticated data preprocessing techniques. The evolution from standard models to complex hybrid systems demonstrates a clear trend towards maximizing feature extraction and diagnostic accuracy from high-frequency, multimodal sensor data.
It is possible to highlight several key findings from the review:
- The dominant trend involves developing novel deep learning architectures—such as ensembles, hybrid CNN-SVM models, and networks with attention mechanisms—specifically designed to enhance feature learning and diagnostic precision for rotating machinery.
- Converting raw 1D vibration signals into 2D time–frequency images (e.g., via Wavelet Transform or STFT) has emerged as a powerful and widely adopted preprocessing paradigm. This allows CNNs to effectively learn discriminative spatio-temporal patterns, leading to superior performance in RUL estimation and fault classification.
- Strategies that intelligently fuse data from multiple sensors (vibration and acoustic) and domains (time and frequency) consistently yield more accurate and reliable predictions compared to models relying on a single data source.
Despite achieving remarkable accuracy on benchmark datasets (e.g., XJTU-SY and NASA), these advanced models face a challenge in transitioning from controlled laboratory environments to the variable and harsh conditions of real-world industrial settings. The main limitation of these models is their inability to directly process the data stream that comes from equipment and contains multiple sensor measurements within working cycles of varying duration, since these models work with already aggregated data.
This constitutes a critical research gap regarding the application of these models—the need to develop new techniques to convert multivariate input data stream with working cycles of varying duration into a more clear representation that can be used with current forecasting methods.
The proposed new method aims to address this gap by adding extraction of semantic state vectors—simple numerical vectors of fixed size that contain aggregated representation of working cycles of equipment. The use of SSV extraction allows for a continuous stream of input data to be transformed into a manageable time series.
3. Materials and Methods
3.1. The Main Idea
The proposed method is based on two ideas: preprocessing multiple sensor data to an image and extracting semantic state vectors.
It effectively addresses the challenge of estimating the remaining useful life for systems characterized by multidimensional, high-frequency time series with working cycles of varying lengths. The core mechanism involves identifying working cycles within the continuous data stream, converting the data from each working cycle into image representations, and subsequently applying a convolutional autoencoder. The intermediate layer outputs of this autoencoder are transformed into fixed-size semantic state vectors. This approach automates the generation of semantic state vectors and broadens their applicability by minimizing the reliance on domain experts in the reliability management process.
3.2. Working Cycles
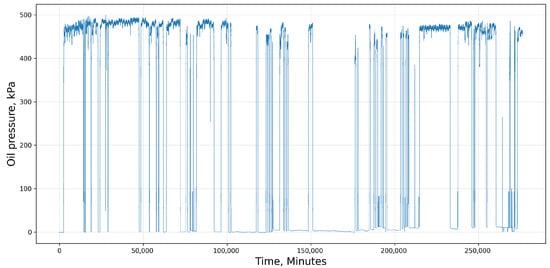
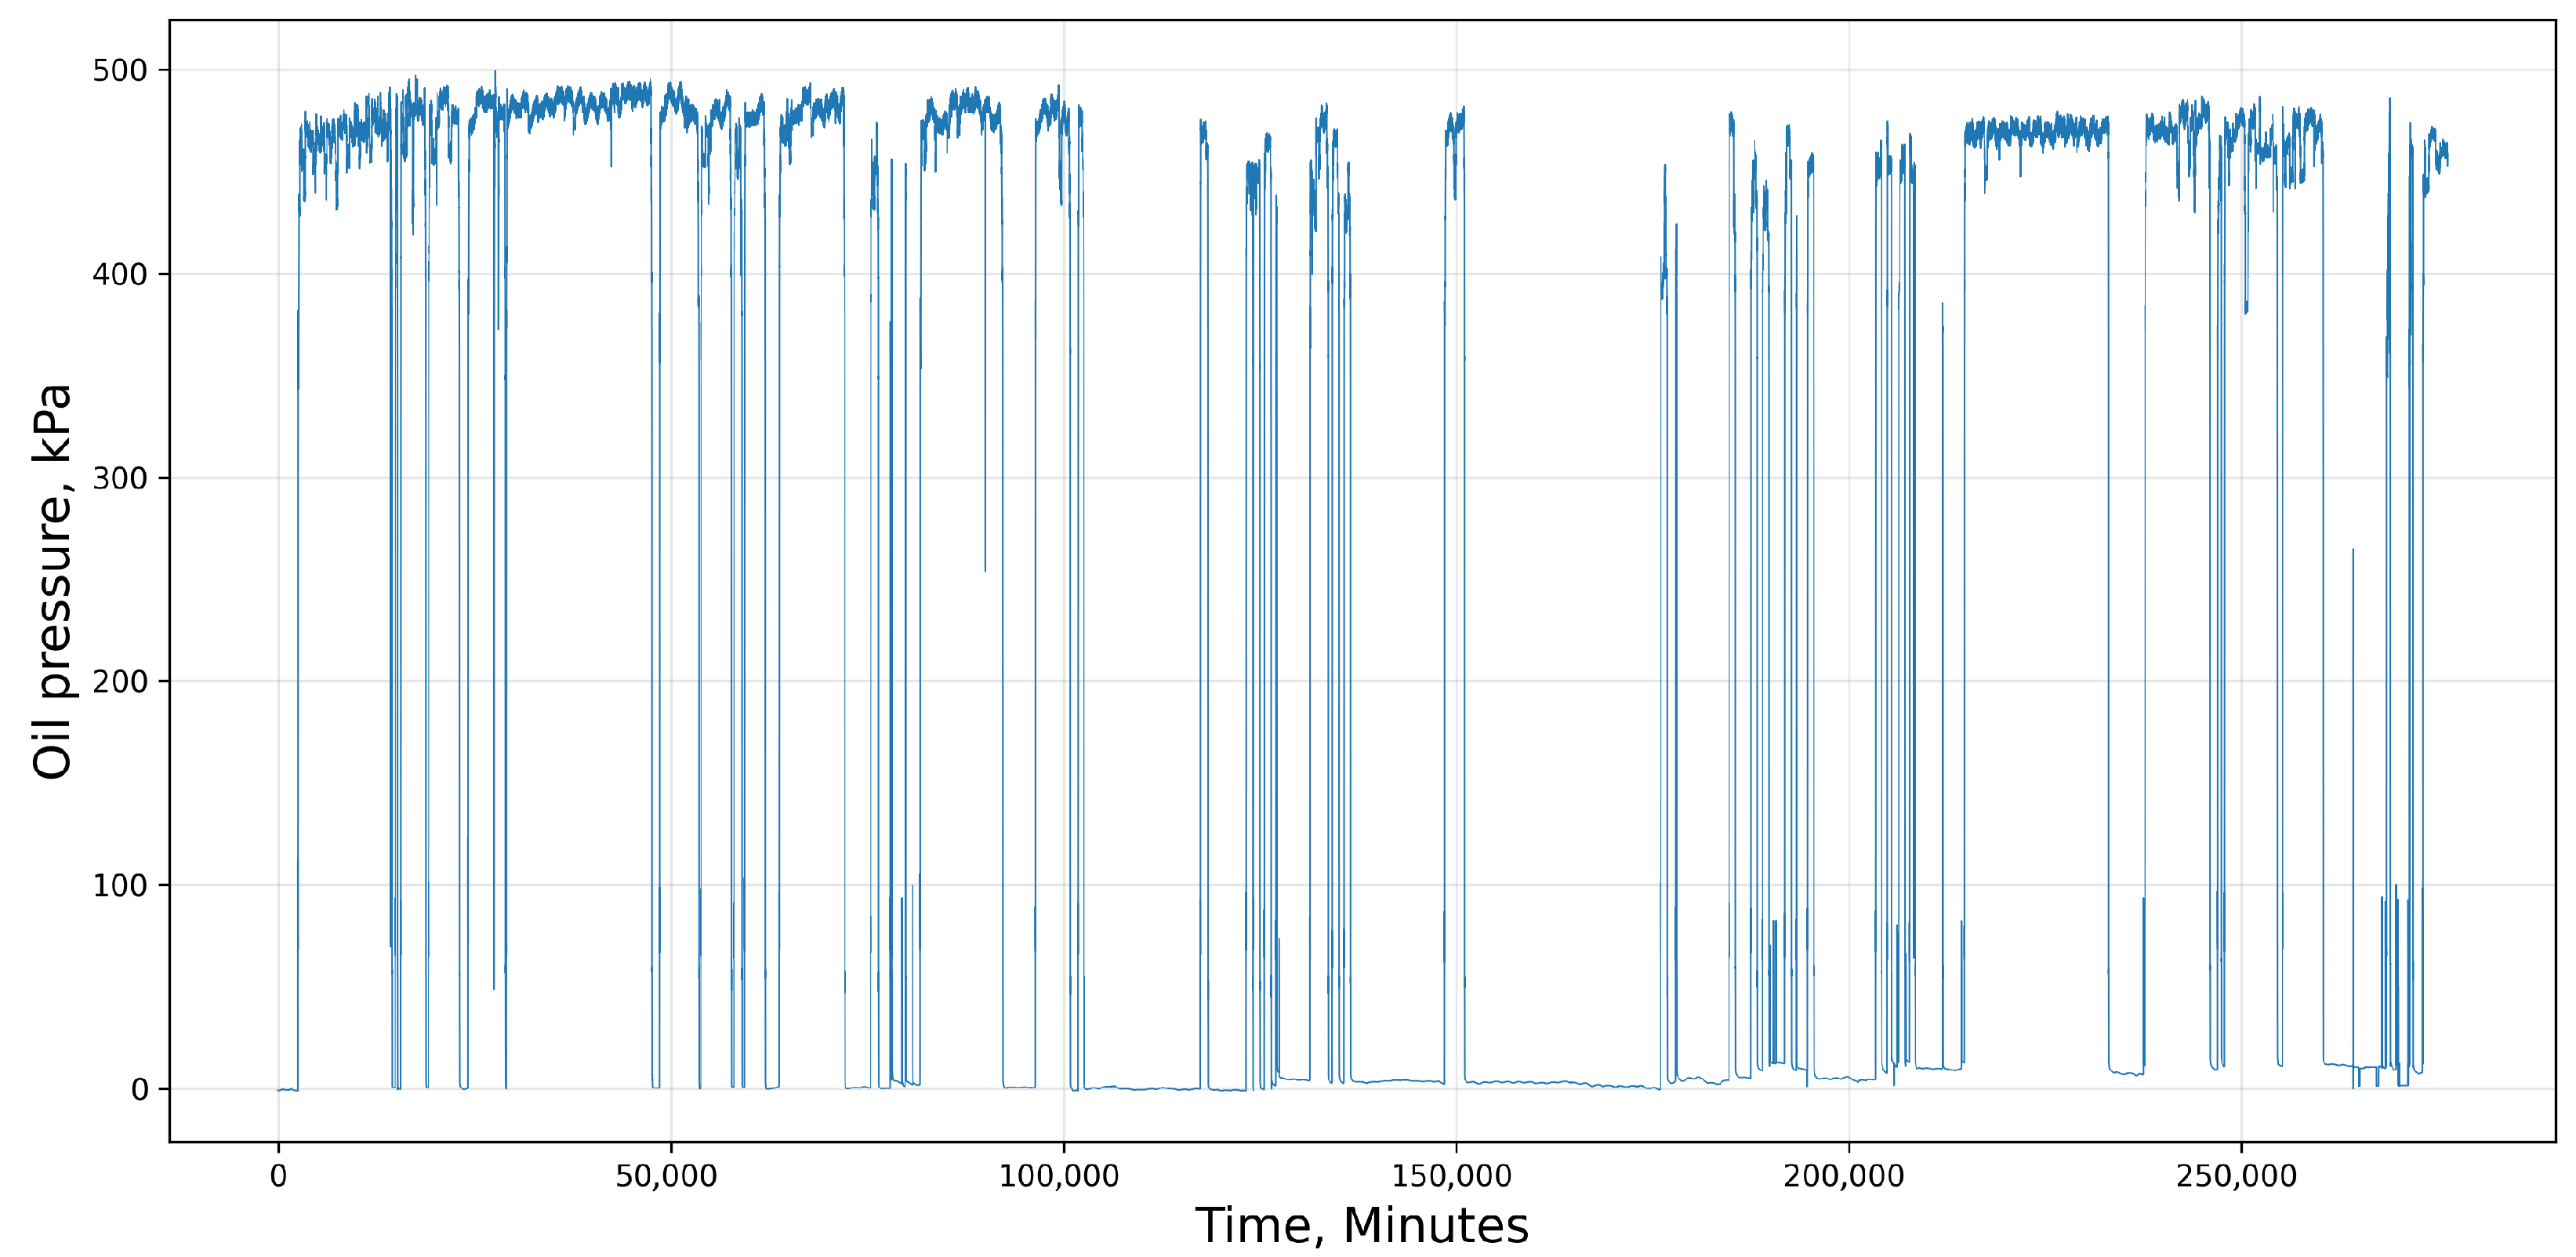
Cyber-physical systems can be systematically classified into two primary categories based on the temporal characteristics of their working cycles: continuous operation systems and discrete operation systems. Continuous operation systems are characterized by prolonged periods of activity with infrequent start-up and shutdown events, which typically coincide with planned maintenance or unplanned repair interventions. In contrast, discrete operation systems exhibit working cycles whose durations are influenced by external variables such as task requirements and control inputs, rendering the cycle length a stochastic variable. Additionally, the idle periods within these systems also demonstrate variability and randomness in duration. Figure 1 shows the illustration of the variability in work and idle states of CPS in discrete operation environment. The data in the figure is taken from a testing dataset and represents measurements of oil pressure over a period of time that includes multiple working cycles and periods of idling in between these cycles.
Figure 1.
An example of variability in data received from a cyber-physical system that operates in discrete mode. The chart shows the oil pressure of a lubrication system of a turbofan engine over a period of time and was constructed using historical data.
Such classification and understanding of CPS operational modes are critical for reliability engineering and fault prediction, as highlighted in recent studies on cyber-physical system management and data-driven reliability assessment techniques (e.g., fault prediction and remaining useful life estimation) that leverage high-frequency data and machine learning methodologies to optimize system performance and maintenance scheduling.
3.3. Semantic State Vector Obtaining as a Dimension Reduction Technique
The task of dimensionality reduction in the context of RUL forecasting involves converting data from working cycles by transforming a multivariate time series into a fixed-size semantic representation—semantic state vectors (SSVs).
The semantic state vector is a numerical vector of with a fixed length k and is declared as follows:
Each vector represents a single working cycle.
The input data for the working cycles is presented as a matrix, where n represents the number of parameters of the monitored equipment and m represents the duration of each working cycle.
The dimension of the resulting vector, k, is arbitrarily determined based on the specific problem being addressed, the available dataset, and the application domain, and can be adjusted to minimize prediction errors.
In general, elements of the semantic state vector do not have an inherent physical significance, although they can be used to analyze the dynamic changes in the system’s condition.
The nature of the data of a working cycle introduces additional challenges in its analysis. The typical working cycle of the equipment under consideration, a turbine engine as an integrated part of a cyber-physical system, comprises three stages: warm-up, operation under load, and cool-down (purge). Existing methods for dimensionality reduction employ heuristics, such as averaging, maximum, and minimum values, for the measured parameters [39].
A limitation of this approach is that heating and cooling data cannot be utilized for analysis despite containing important information regarding the technical condition. Additionally, the use of heuristic methods necessitates additional efforts from experts to select the optimal heuristics and parameters.
The use of more sophisticated deep machine learning models could address the limitations of current models and provide the following benefits:
- Automation of the process for creating semantic state vectors, eliminating the need for heuristics and manual data manipulation;
- Ability to utilize all data from the whole working cycle rather than just data from under load conditions, enhancing accuracy;
- Improved accuracy in the final RUL forecast by considering conditions during startup, warm-up, and purge periods.
3.4. Description of the Method
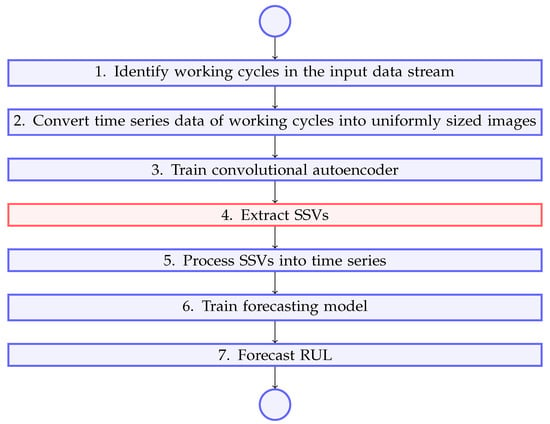
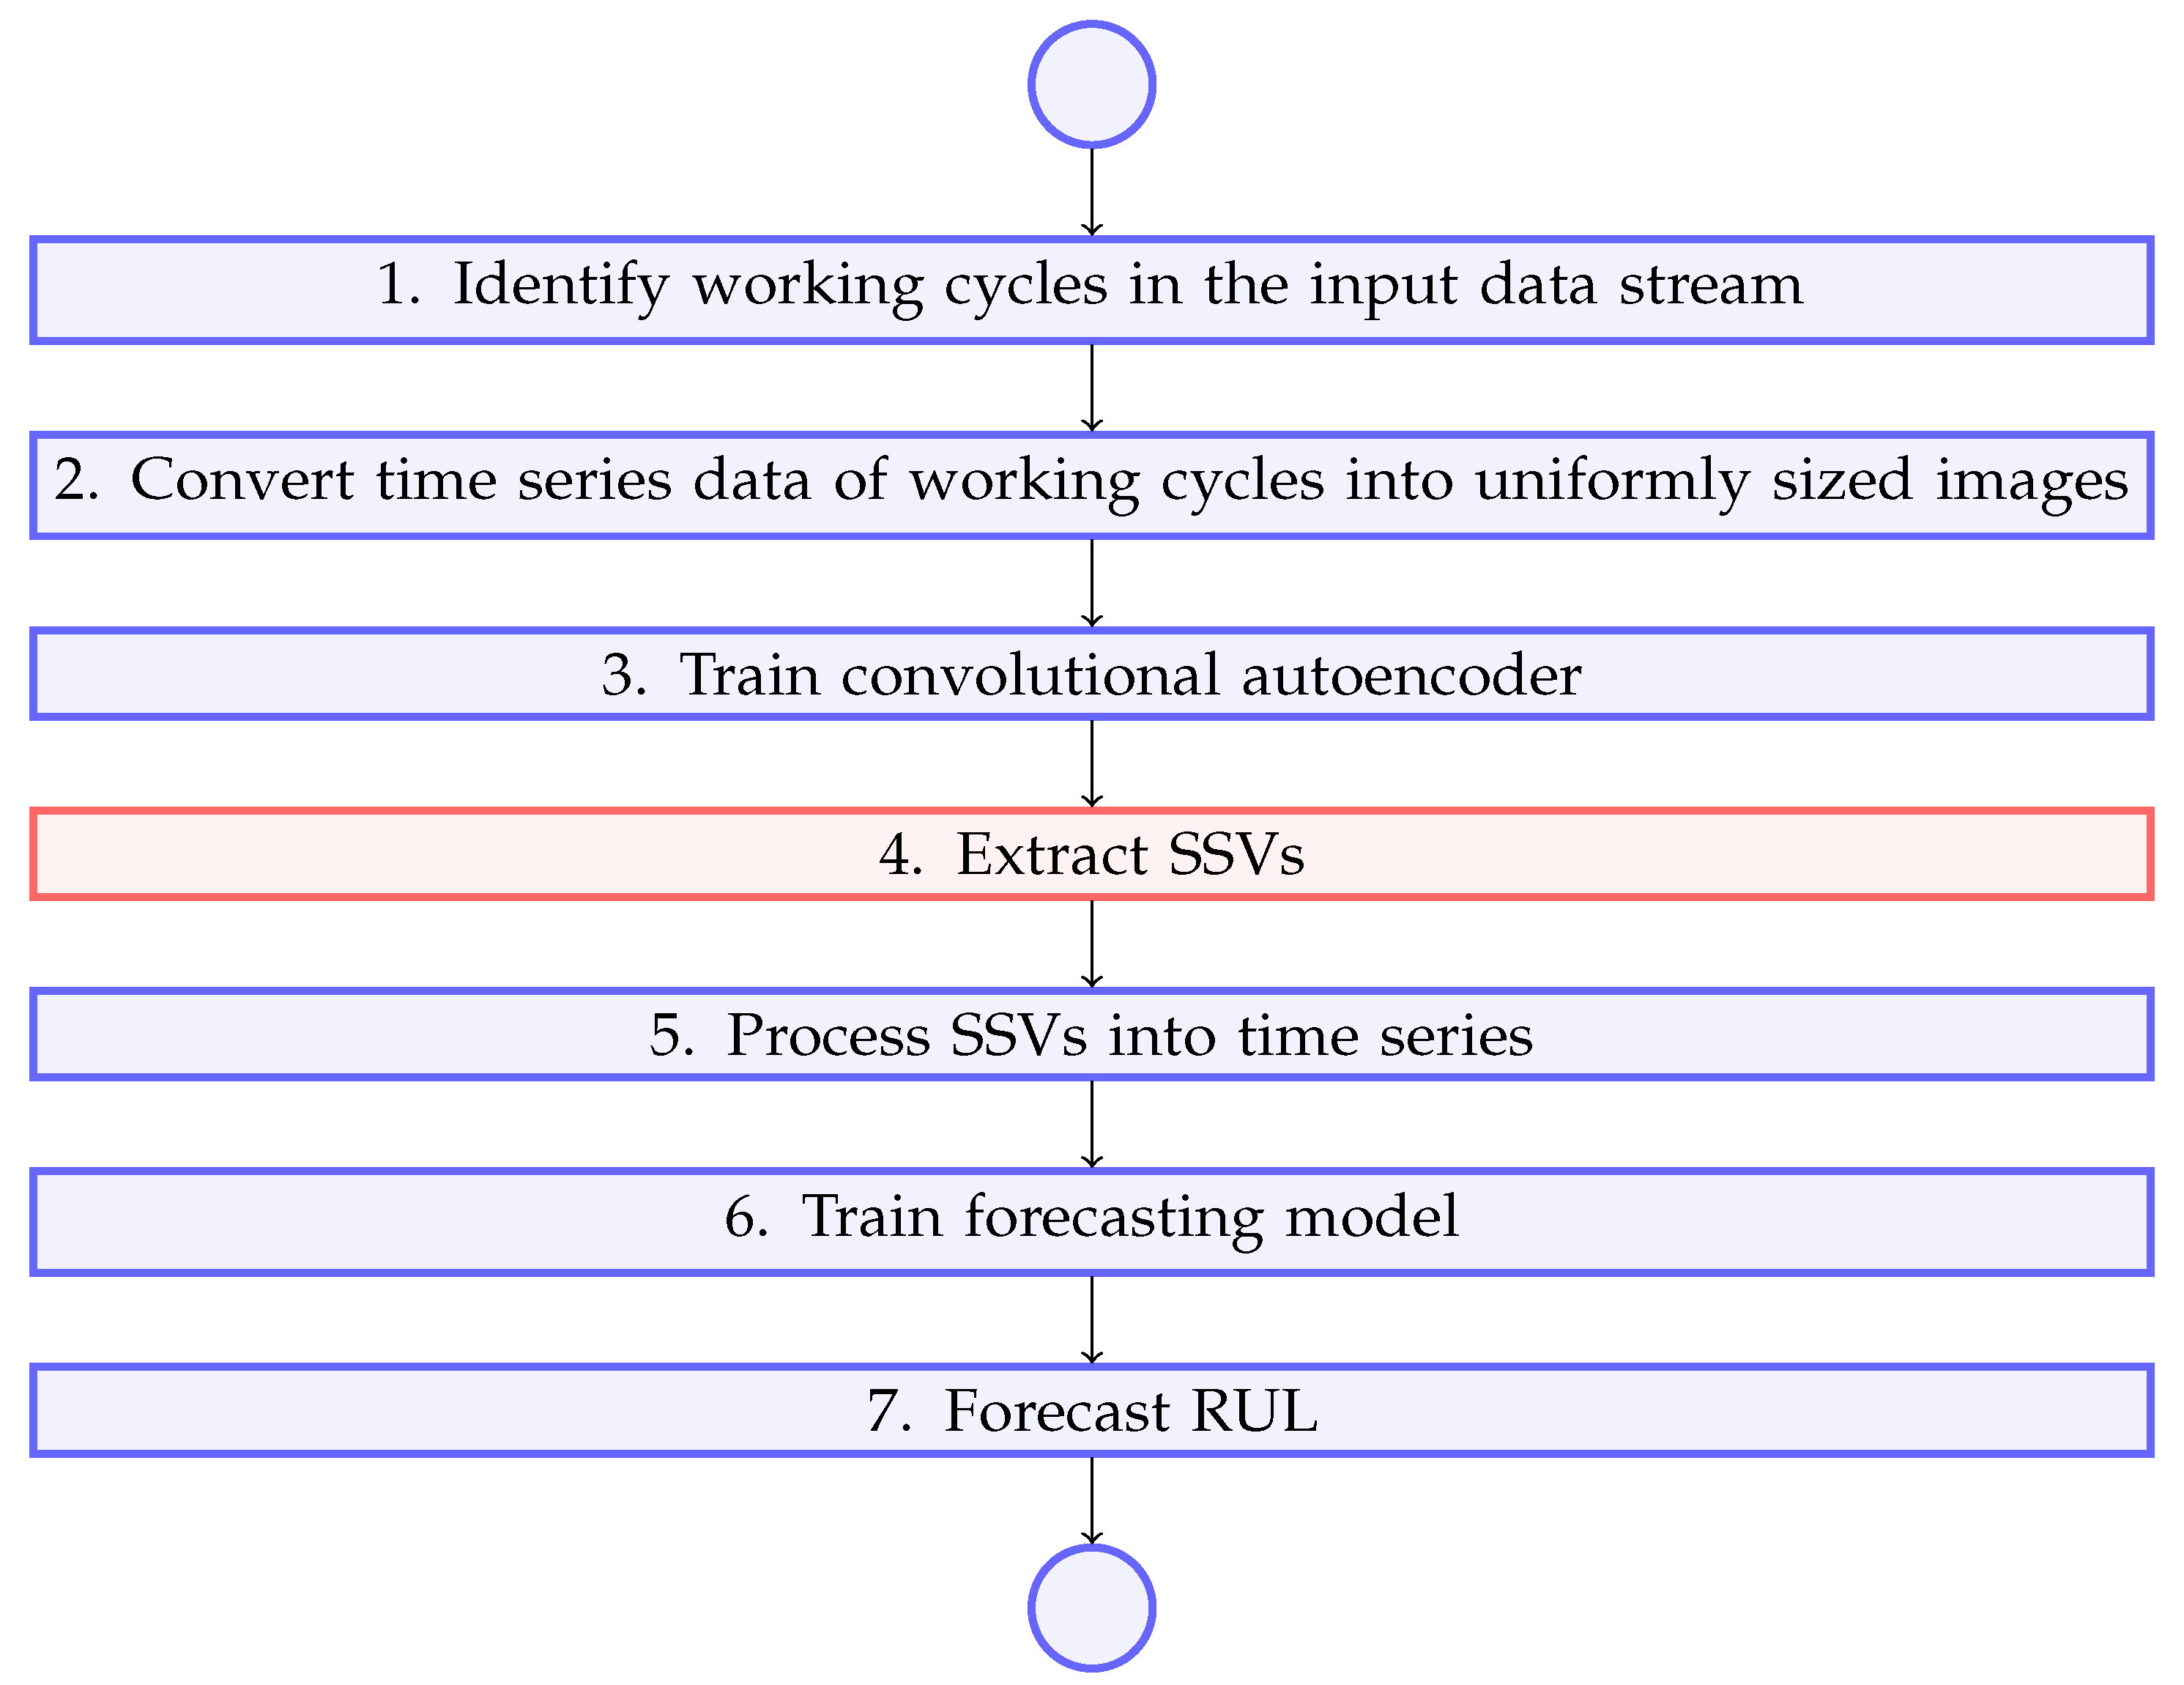
Figure 2 shows the general overview of the proposed method.
Figure 2.
An overview of the method. The key step is highlighted in red.
Input: A continuous stream of data from the sensors of equipment is represented as a multivariate time series. The stream has multiple variables, each one of which corresponds to a measured parameter of equipment. The number of parameters is represented as .
Output: Forecast of the remaining useful life of a piece of equipment built using semantic state vectors extracted from working cycles.
Let us look at each step of the method in detail and explain them.
The first step is to extract working cycles from the input data stream. Extraction procedure depends on available data. Measurable inputs, outputs of equipment, control signals or parameters of equipment can be used to identify working cycles. These parameters must have different values during periods of idling and operation. In general, to distinguish between idling (I), a state in which no useful output is produced, and operation (O), when equipment produces a useful output, we need to define a discrete function as follows:
which can be applied to every single data point of the input data stream to identify whether the equipment was idling or in operation at the time i.
When observed variables gradually change between two steady states of idling and operation, we can further split the working cycle into periods of rising value (R), steady operation, and decreasing value (D). For example, if we measure the temperature of equipment or one of its systems, these periods can be called warm-ups and cooldowns. Depending on the nature of the equipment, these periods of unsteady operation can be assigned either as a part of idling or a working cycle. In the current paper, we assume that these periods are a part of a working cycle. Then, an extended function can be defined as follows:
Afterwards, prolonged periods of continuous operation separated by prolonged periods of continuous idle can be identified as working cycles. Then, we can take each working cycle and create a separate time series from its data.
After performing this step, we are left with a set of time series, each one of which represents a single working cycle from the start to the end.
The second step is to convert these time series into a set of uniformly sized images.
Firstly, all data is normalized to the range [0, 1] using the following formula:
Normalization is handled per parameter, which means that for each parameter, we determine its own and values, which helps to properly scale parameters that have different ranges of values without parameters affecting each other.
After that, data arrays are converted into images with a single channel (black and white) while retaining the dimensions of a source time series. Thus, one pixel in the resulting image corresponds to one value of the measured working cycle parameter. For better visualization, a filter can be applied that adds a color palette to a black and white image.
After the conversion, we obtain images of different dimensions, which correspond to different working cycle lengths. At the same time, n remains the same for all images since the number of measured parameters of the equipment is fixed, and only the duration of a working cycle m changes.
The second part of this step is to convert the images to a single size. This procedure is crucial to bridge the gap between the variability of durations of working cycles and uniformly sized semantic state vectors. It is required for training the autoencoder since it requires images of the same size for input. This conversion enables the extraction of SSV later. The size is selected individually for each data sample. The images are converted to a single size using a standard transformation method, for example, bilinear or bicubic.
In the next step, the structure of a convolutional autoencoder is defined, and then it is trained. The autoencoder consists, in the following order, of several sequentially alternating layers of convolution and pooling, a dropout layer, and several consecutive alternating layers of convolution and upsampling. The output from the autoencoder is taken from the last convolution layer before the dropout. Training is performed on the entire data sample.
Table 1 presents an architecture of convolutional autoencoder.
Table 1.
The architecture of the convolutional autoencoder.
Having trained the autoencoder, we proceed to the step of forming semantic state vectors. To achieve this, we run all the data of the working cycles through the autoencoder, and for each take, the output of the intermediate layer specified earlier. Separately, it should be noted that this step uses the same data as when training the autoencoder because (i) the architecture of the autoencoder implies pre-known and matching input and output data, which makes it possible to use the same data sample for training and generating output data; (ii) the training time of the autoencoder is negligible compared to the frequency of incoming input data (equipment’s working cycles), so when new data arrives, the autoencoder can be retrained and the semantic state vector is rebuilt for each of the working cycles without significant time delays; and (iii) the data set used for the study is insufficient for a full-fledged process with the use of cross-validation. For these reasons, overfitting the model on the training sample is not an obstacle. If more data is available, cross-validation can be applied to increase the robustness of the autoencoder.
The output of the intermediate convolution layer is a three-dimensional tensor. To obtain a vector, we have to reduce the number of dimensions by two. The first step is to drop the third dimension. To achieve this, the sum function is applied over the third dimension. Then, the sigmoid activation function is applied to the result sum. The second step is to flatten the resulting two-dimensional tensor into a vector.
The result of this step is a sample containing semantic state vectors for each of the working cycles of the equipment.
The fifth step includes the formation of time series from semantic state vectors. Firstly, all semantic state vectors are combined into a single time series. Then, smoothing is applied using the moving average.
After processing the time series, a training set is created using the sliding window technique. For input data for time point i, the procedure is as follows. We take w preceding data points from the time series which we later group into a matrix. Then, the matrix is flattened into a vector, as shown in the following formula:
In the sixth step, the forecasting model is trained. K-fold cross-validation is used to eliminate potential inaccuracies. Since the amount of training data is relatively small, it is paramount to distribute RUL values across folds as evenly as possible. To achieve this, the approach where data points are staggered across folds is used. In this approach, belonging of a data point i to a specific fold k is denoted as and is described by the following function:
where is the RUL value of the data point i, and k is the number of folds.
In the seventh step, a forecast of the remaining life ot the equipment is created using existing forecasting models, in this case, XGBoost. The choice of the model is based on a previous study [39] in which several models (linear regression, CatBoost, and XGBoost) were compared and XGBoost was found to perform the best for RUL forecasting on the dataset under consideration. The accuracy of the model is measured using several metrics, and a chart of actual and forecast values is plotted.
4. Results
4.1. Dataset
The data set used in the experiments contains information about the functioning of the gas turbine engine over two years of operation. It contains a continuous stream of data from the equipment, regardless of whether it was working or idling. In total, there are
- A total of 60+ million records with a frequency of 1 Hz;
- Seven variables of temperature in various points of the lubrication system and oil pressure;
- A single end-of-life event.
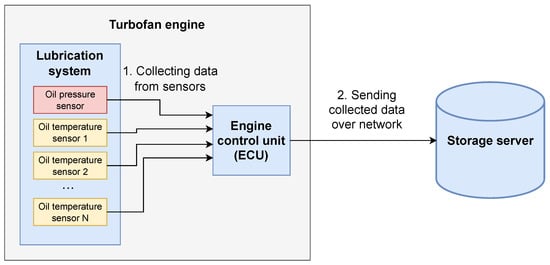
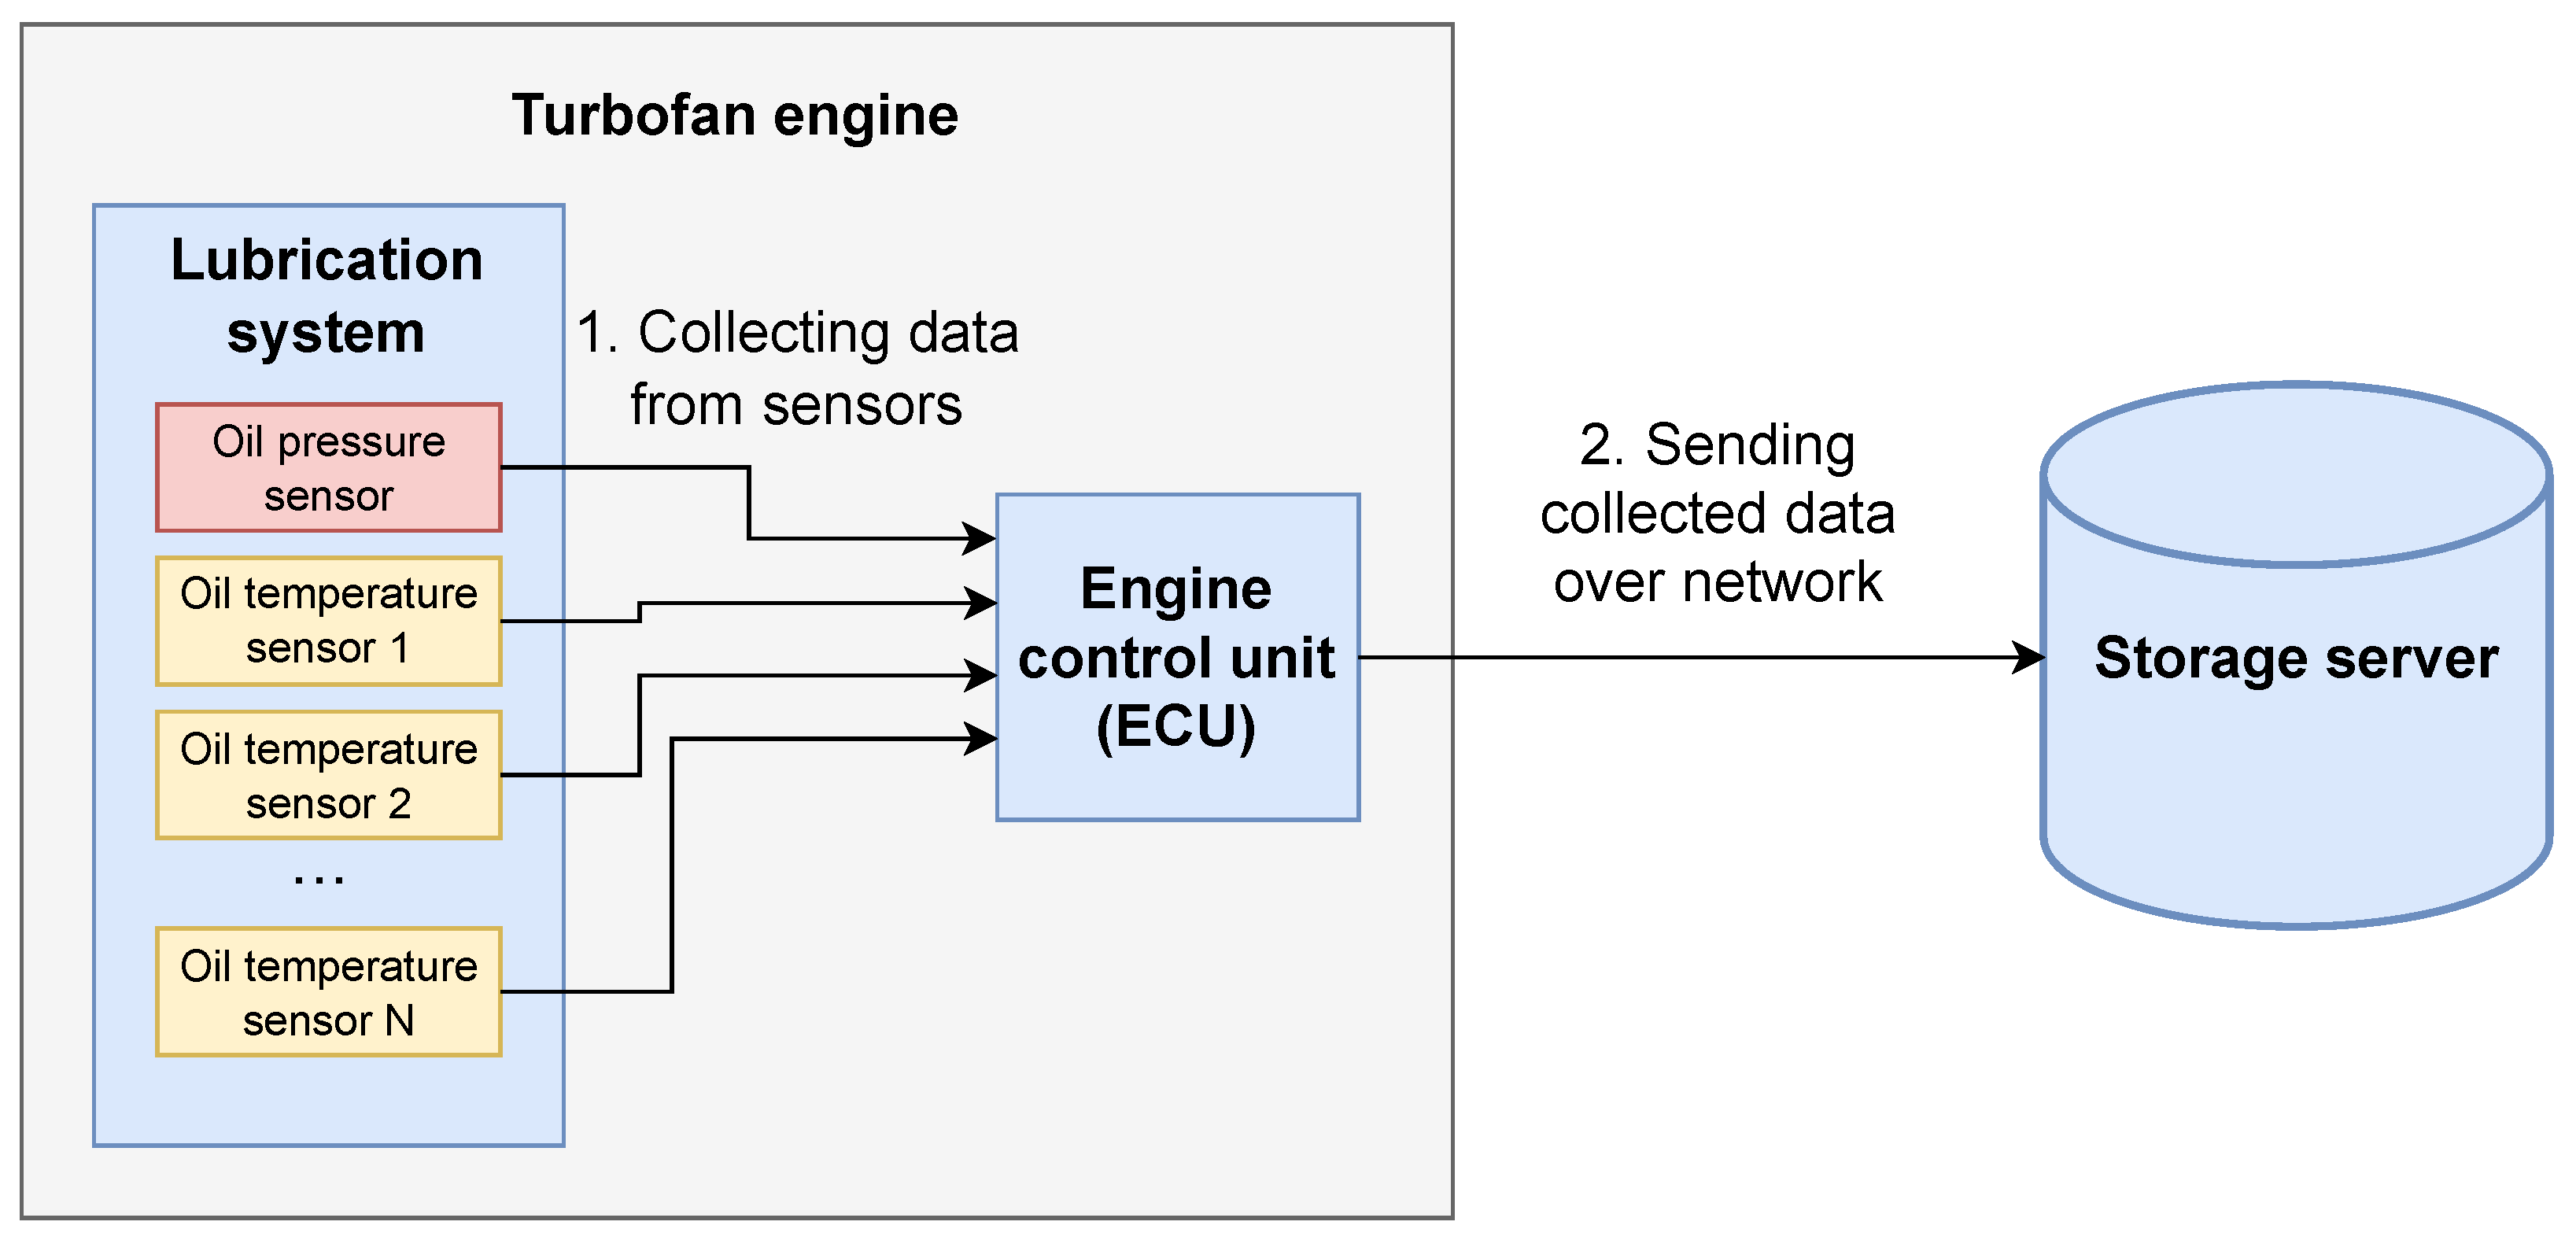
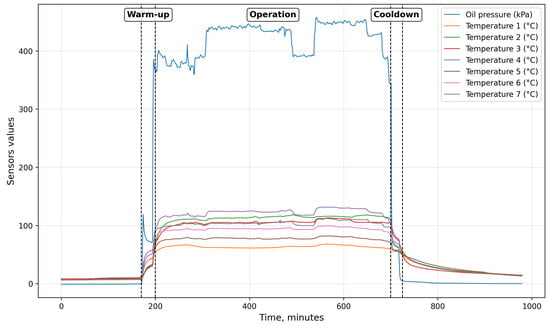
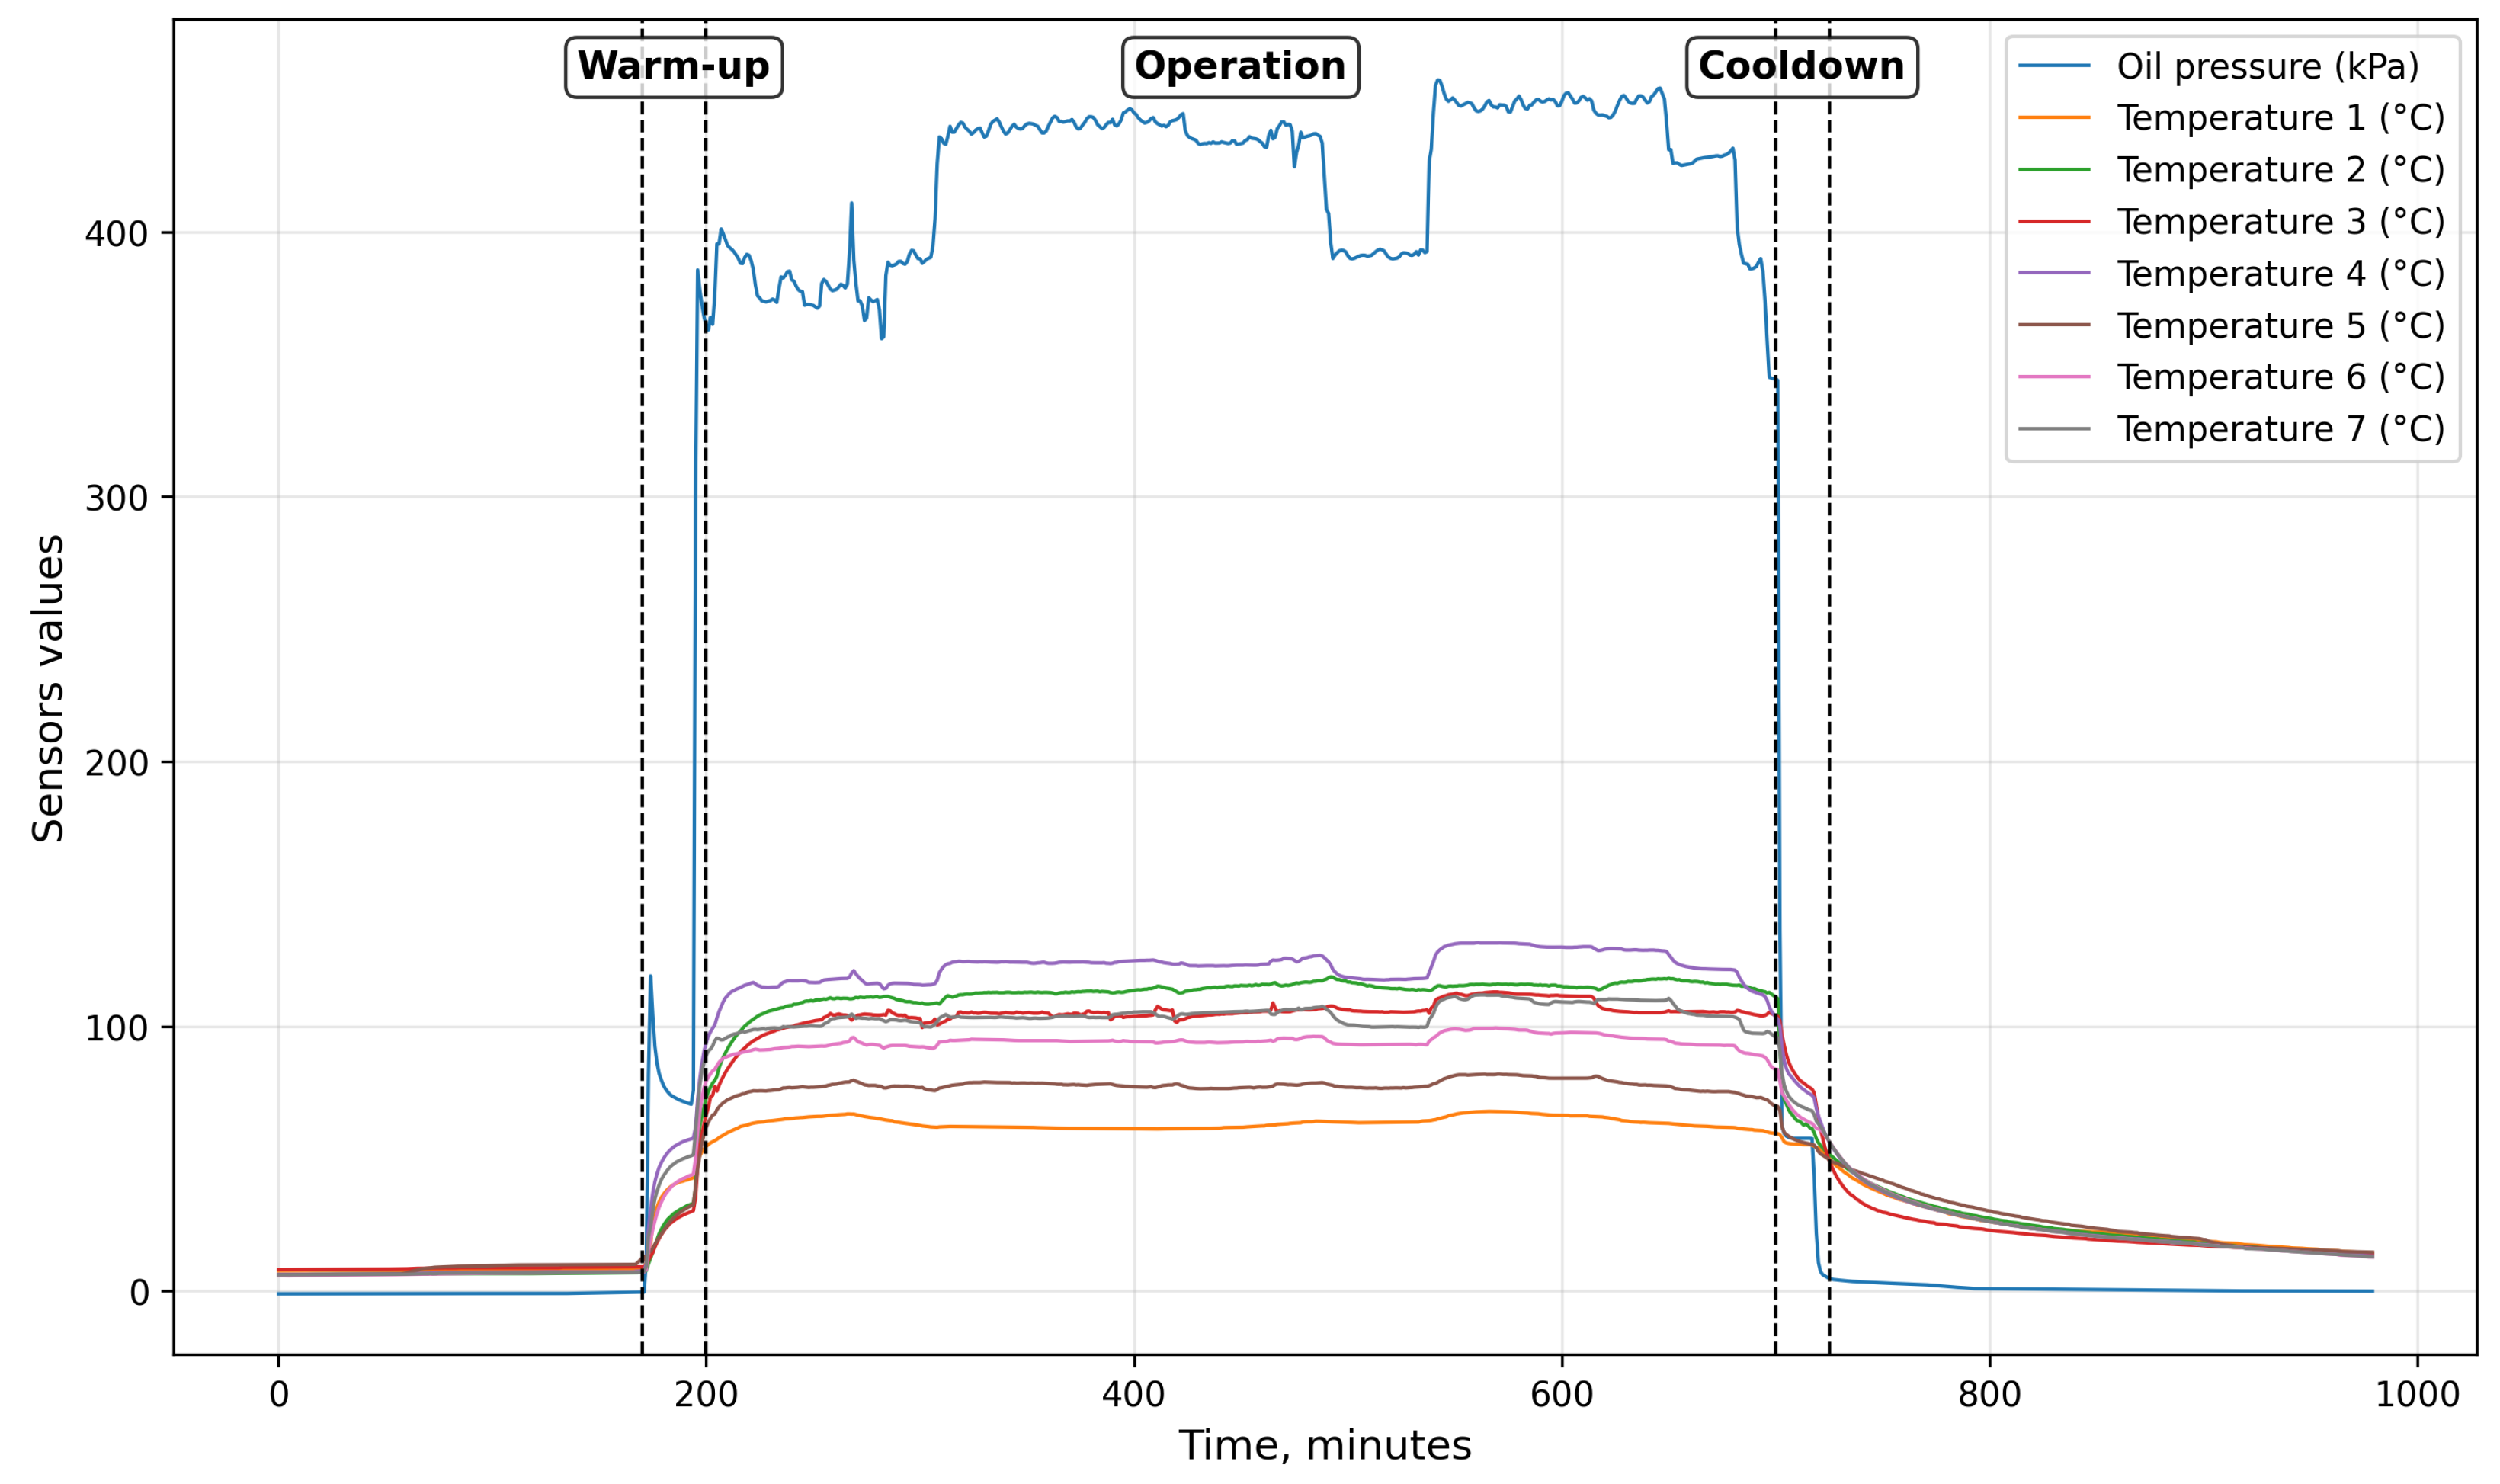
Data is collected from various sensors from the lubrication system of a turbofan engine by an ECU. The data is then sent over a network to a storage server, from which it is later retrieved in .csv format to train the model. The diagram is provided in Figure 3. The end-of-life event is determined by the staff using sensor data and error readings from an ECU. An example of a working cycle from historical data is provided in Figure 4.
Figure 3.
A diagram of the data flow in the equipment.
Figure 4.
An example of a working cycle of a gas turbine engine from historical data. Marked intervals represent periods as defined in function in Section 3.4: warm-up—R; operation—O; and cooldown—D. Unmarked parts of the chart show equipment in an idle or turned-off state—I.
4.2. Hyperparameters
The following parameters were optimized as part of the experiments:
- The target size of the images for the input of the convolutional autoencoder;
- The method of converting images to a single target size;
- The size of the semantic state vector.
Four different widths and heights and all combinations of those are used: 50 px, 100 px, 200 px, and 400 px. The images were resized using the method of the class from the Pillow (v.10.3) python library. The target dimensions and the resampling filter were passed as parameters. The following lengths of the semantic state vector were tested: 5, 10, 25, 50, and 100. The image size was varied by changing the size of the intermediate layers of the autoencoder.
4.3. Performance Metrics
The following performance metrics were used:
- MAE—mean absolute error:
- RMSE—root mean square error:
4.4. Experimental Results
4.4.1. Experimental Setup
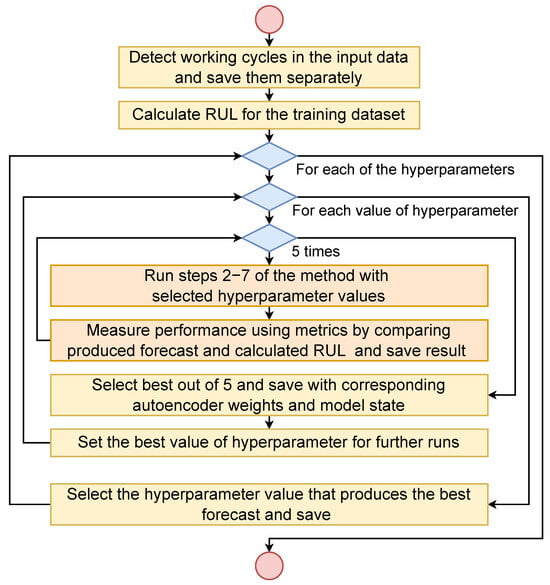
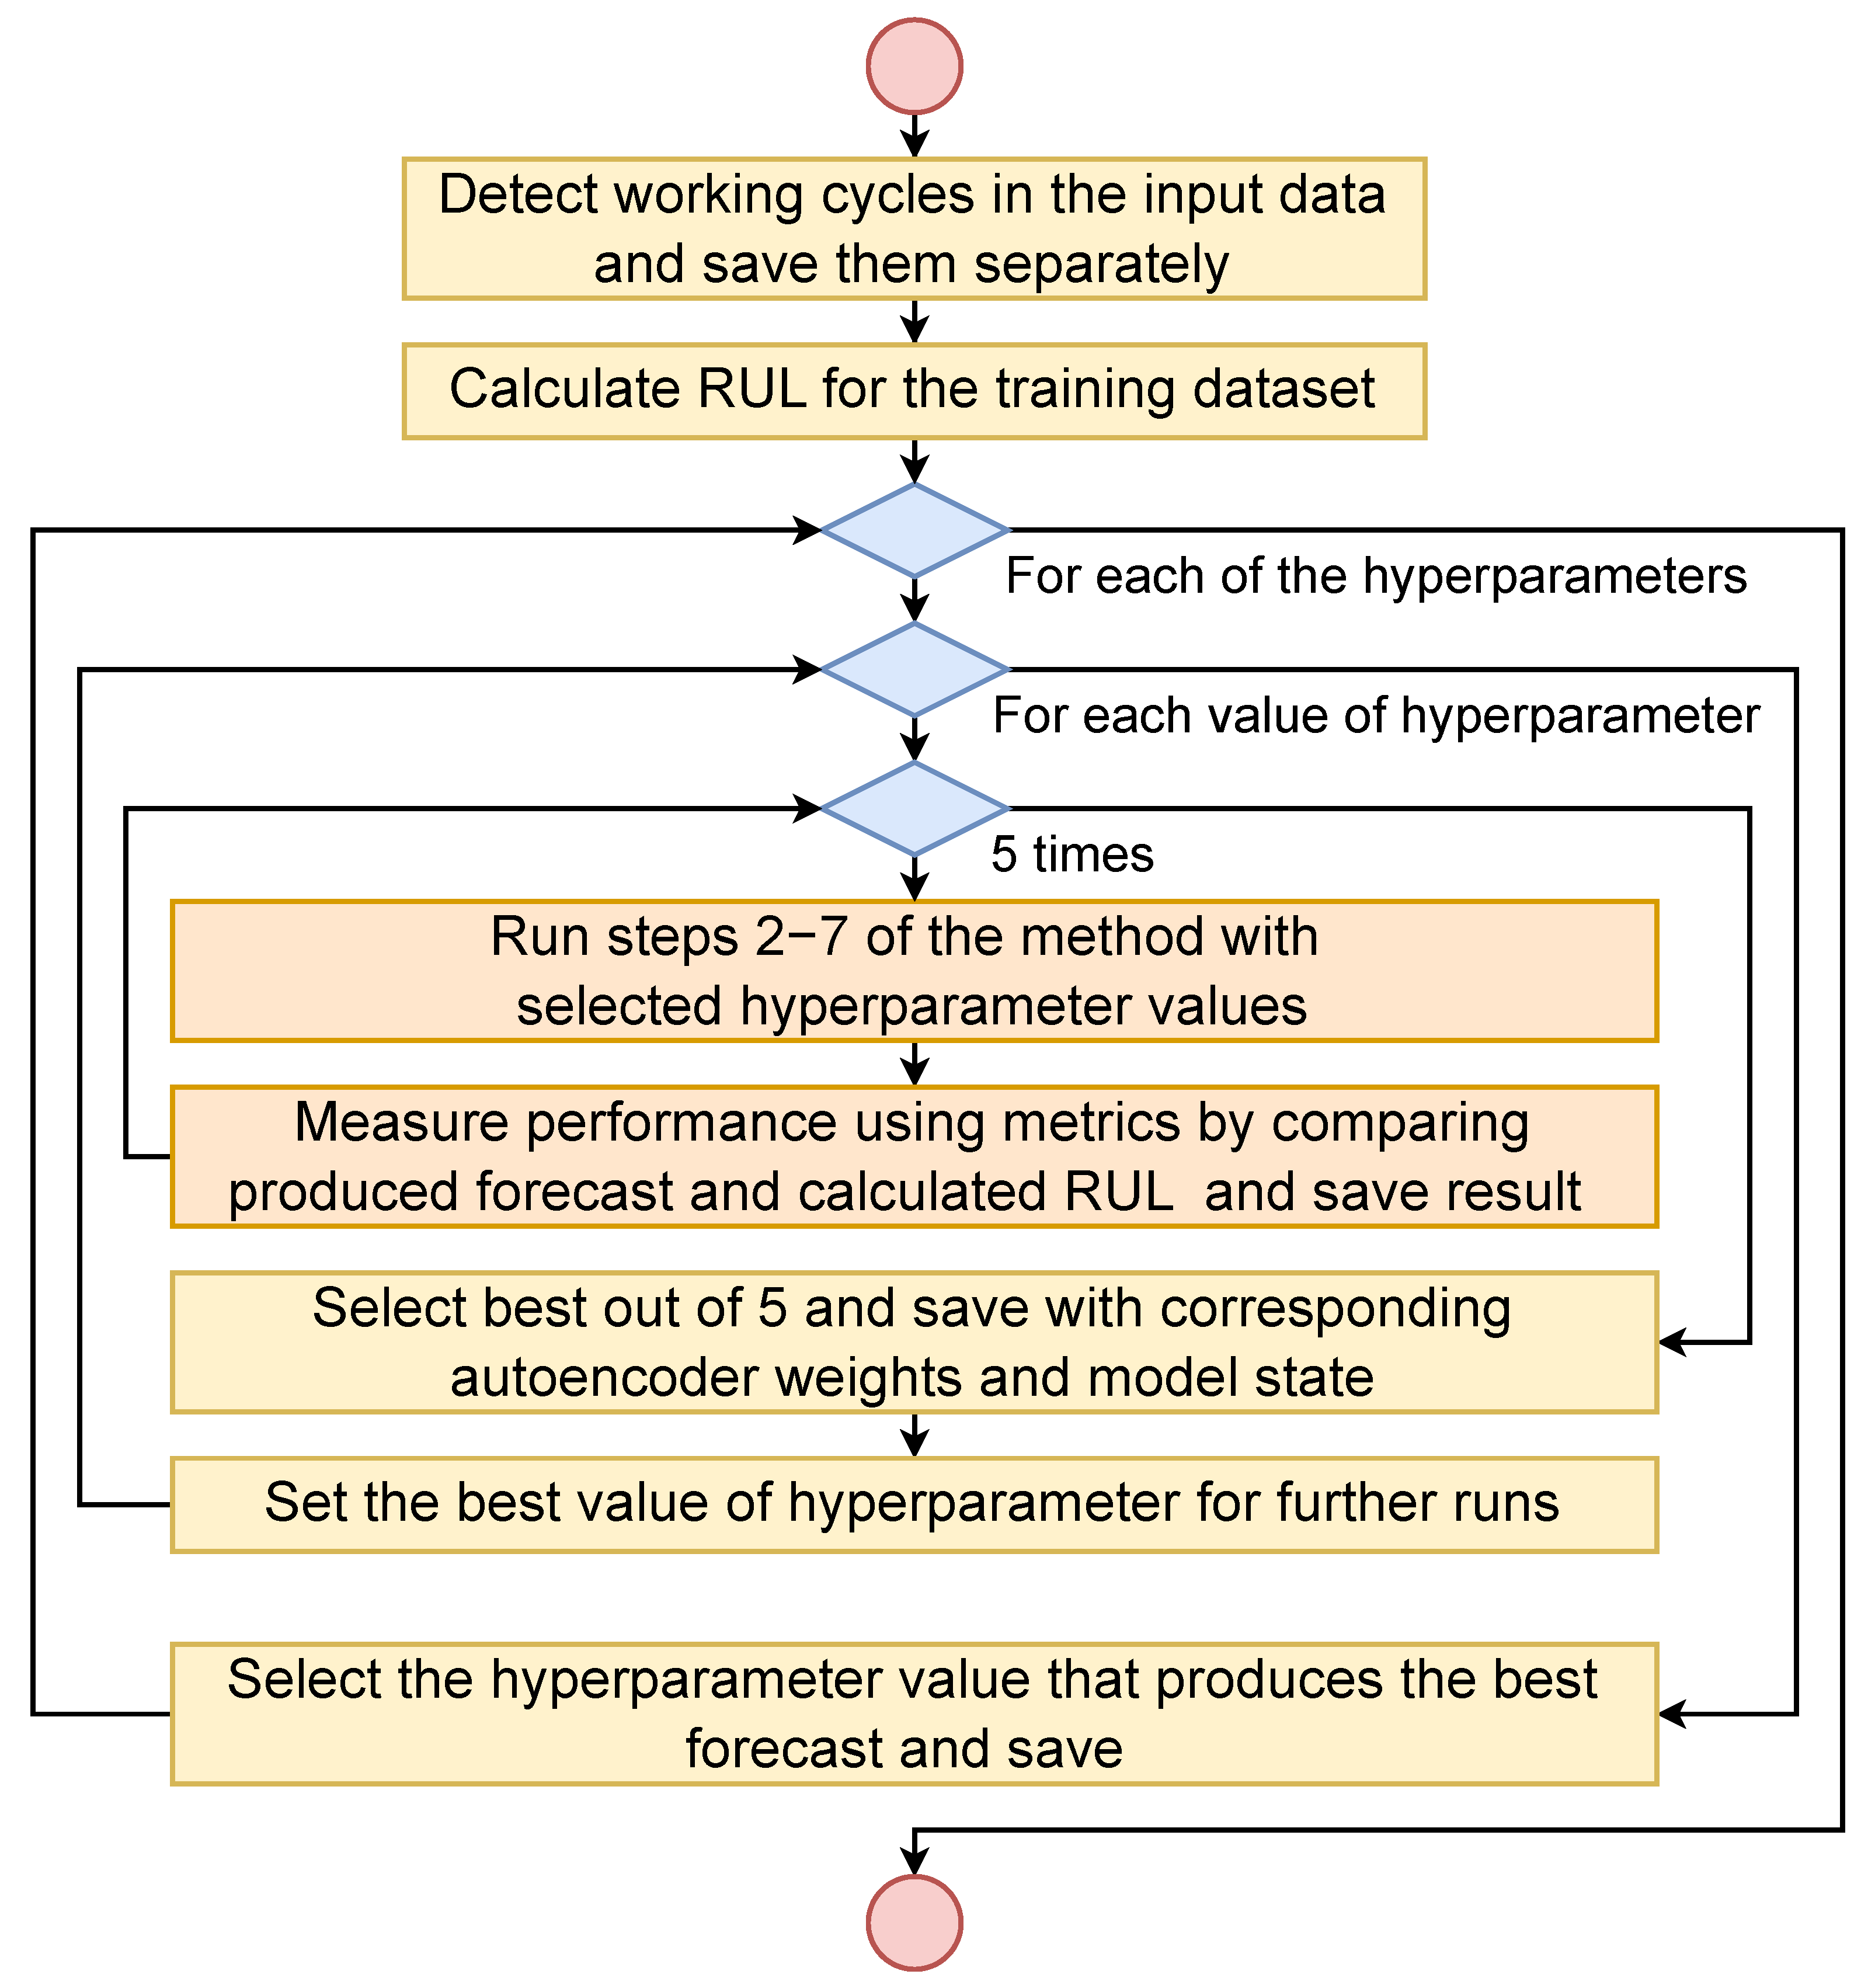
To optimize the hyperparameters, the following experiment was designed. The diagram of the experiment is provided in Figure 5.
Figure 5.
The diagram of the experiment.
The RUL value for the specific working cycle is calculated as the number of working cycles left after the current one to the end-of-life event.
The output forecast of the proposed method is the remaining number of working cycles to the end-of-life event as well.
The hyperparameters were optimized one by one in the order provided in Section 4.2.
To optimize the hyperparameters, a set of values was created that may produce the best result for each of the hyperparameters. After running the method with all values from a set for a specific hyperparameter, the set was adjusted if it seemed like the result could have been refined further.
The method was run five times for each evaluated value of each hyperparameter, performance metrics were calculated, and the best result with the lowest metric values was selected and saved for further comparison.
Details and results of optimization of the specific hyperparameters are provided in the following subsections.
The software used in the experiment was created using the Python 3.12 programming language. Pandas 2.2.1 and NumPy 1.26.4 were used to handle data. The Pillow 10.3 library was used to handle the following operations with images: transforming data arrays into images, resizing images, and adding a color filter. Keras 3.1.1 was used to build an autoencoder. Matplotlib 3.8.4 was used to generate charts and to provide color maps for coloring images.
The autoencoder was trained for 100 epochs using early stopping with a patience value of 10 to achieve maximal accuracy. A model checkpoint was set up to save the best model. Other parameters include the mean square error loss, Adam optimizer, a validation split of 0.2, a batch size of 8, and shuffle enabled. Other parameters include moving average smoothing with window size = 20, w = 50, and 8-fold cross validation.
4.4.2. Optimization of the Input Image Size
In this section, a size of input images is optimized.
First, all possible combinations of dimensions were produced. Then, for each combination, a set of images was made with the corresponding size. The method was run for each of the sets. The forecast of the RUL was obtained for each of the sets.
Other parameters included the bilinear method to resize images and a semantic state vector length of 25. Table 2 and Table 3 provide values of performance metrics that were calculated for the forecasts that were obtained using images of the corresponding size to train the autoencoder.
Table 2.
Method performance evaluation results, MAE.
Table 3.
Method performance evaluation results, RMSE.
As we can see, increasing the size of input images does not necessarily correspond with an increased accuracy.
Increasing the height of an image was found beneficial to up to 200 px with error measurements in the following ranges: RMSE—2.036 to 5.139; MAE—1.405 to 2.005. A further increase in height did not result in an increase in the overall accuracy with measurement ranges of 2.353 to 3.819 for RMSE and 1.624 to 1.828 for MAE for the height of 400 px. However, it should be noted that the higher image height led to a decrease in the highest error measurement.
At the same time, increasing the width of the input images negatively affected the performance, and the smallest width showed the best result with the following measurements: RMSE, 2.036 to 4.504, and MAE, 1.405 to 2.084.
Hence, input image size of 50 × 200 was selected as the best performing option, and all further experiments were carried out using that image size.
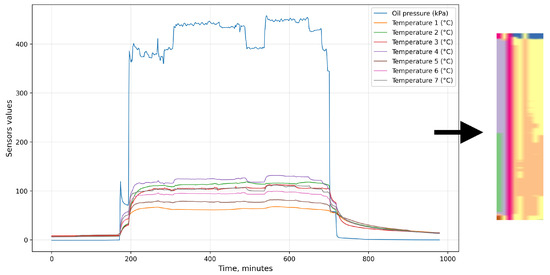
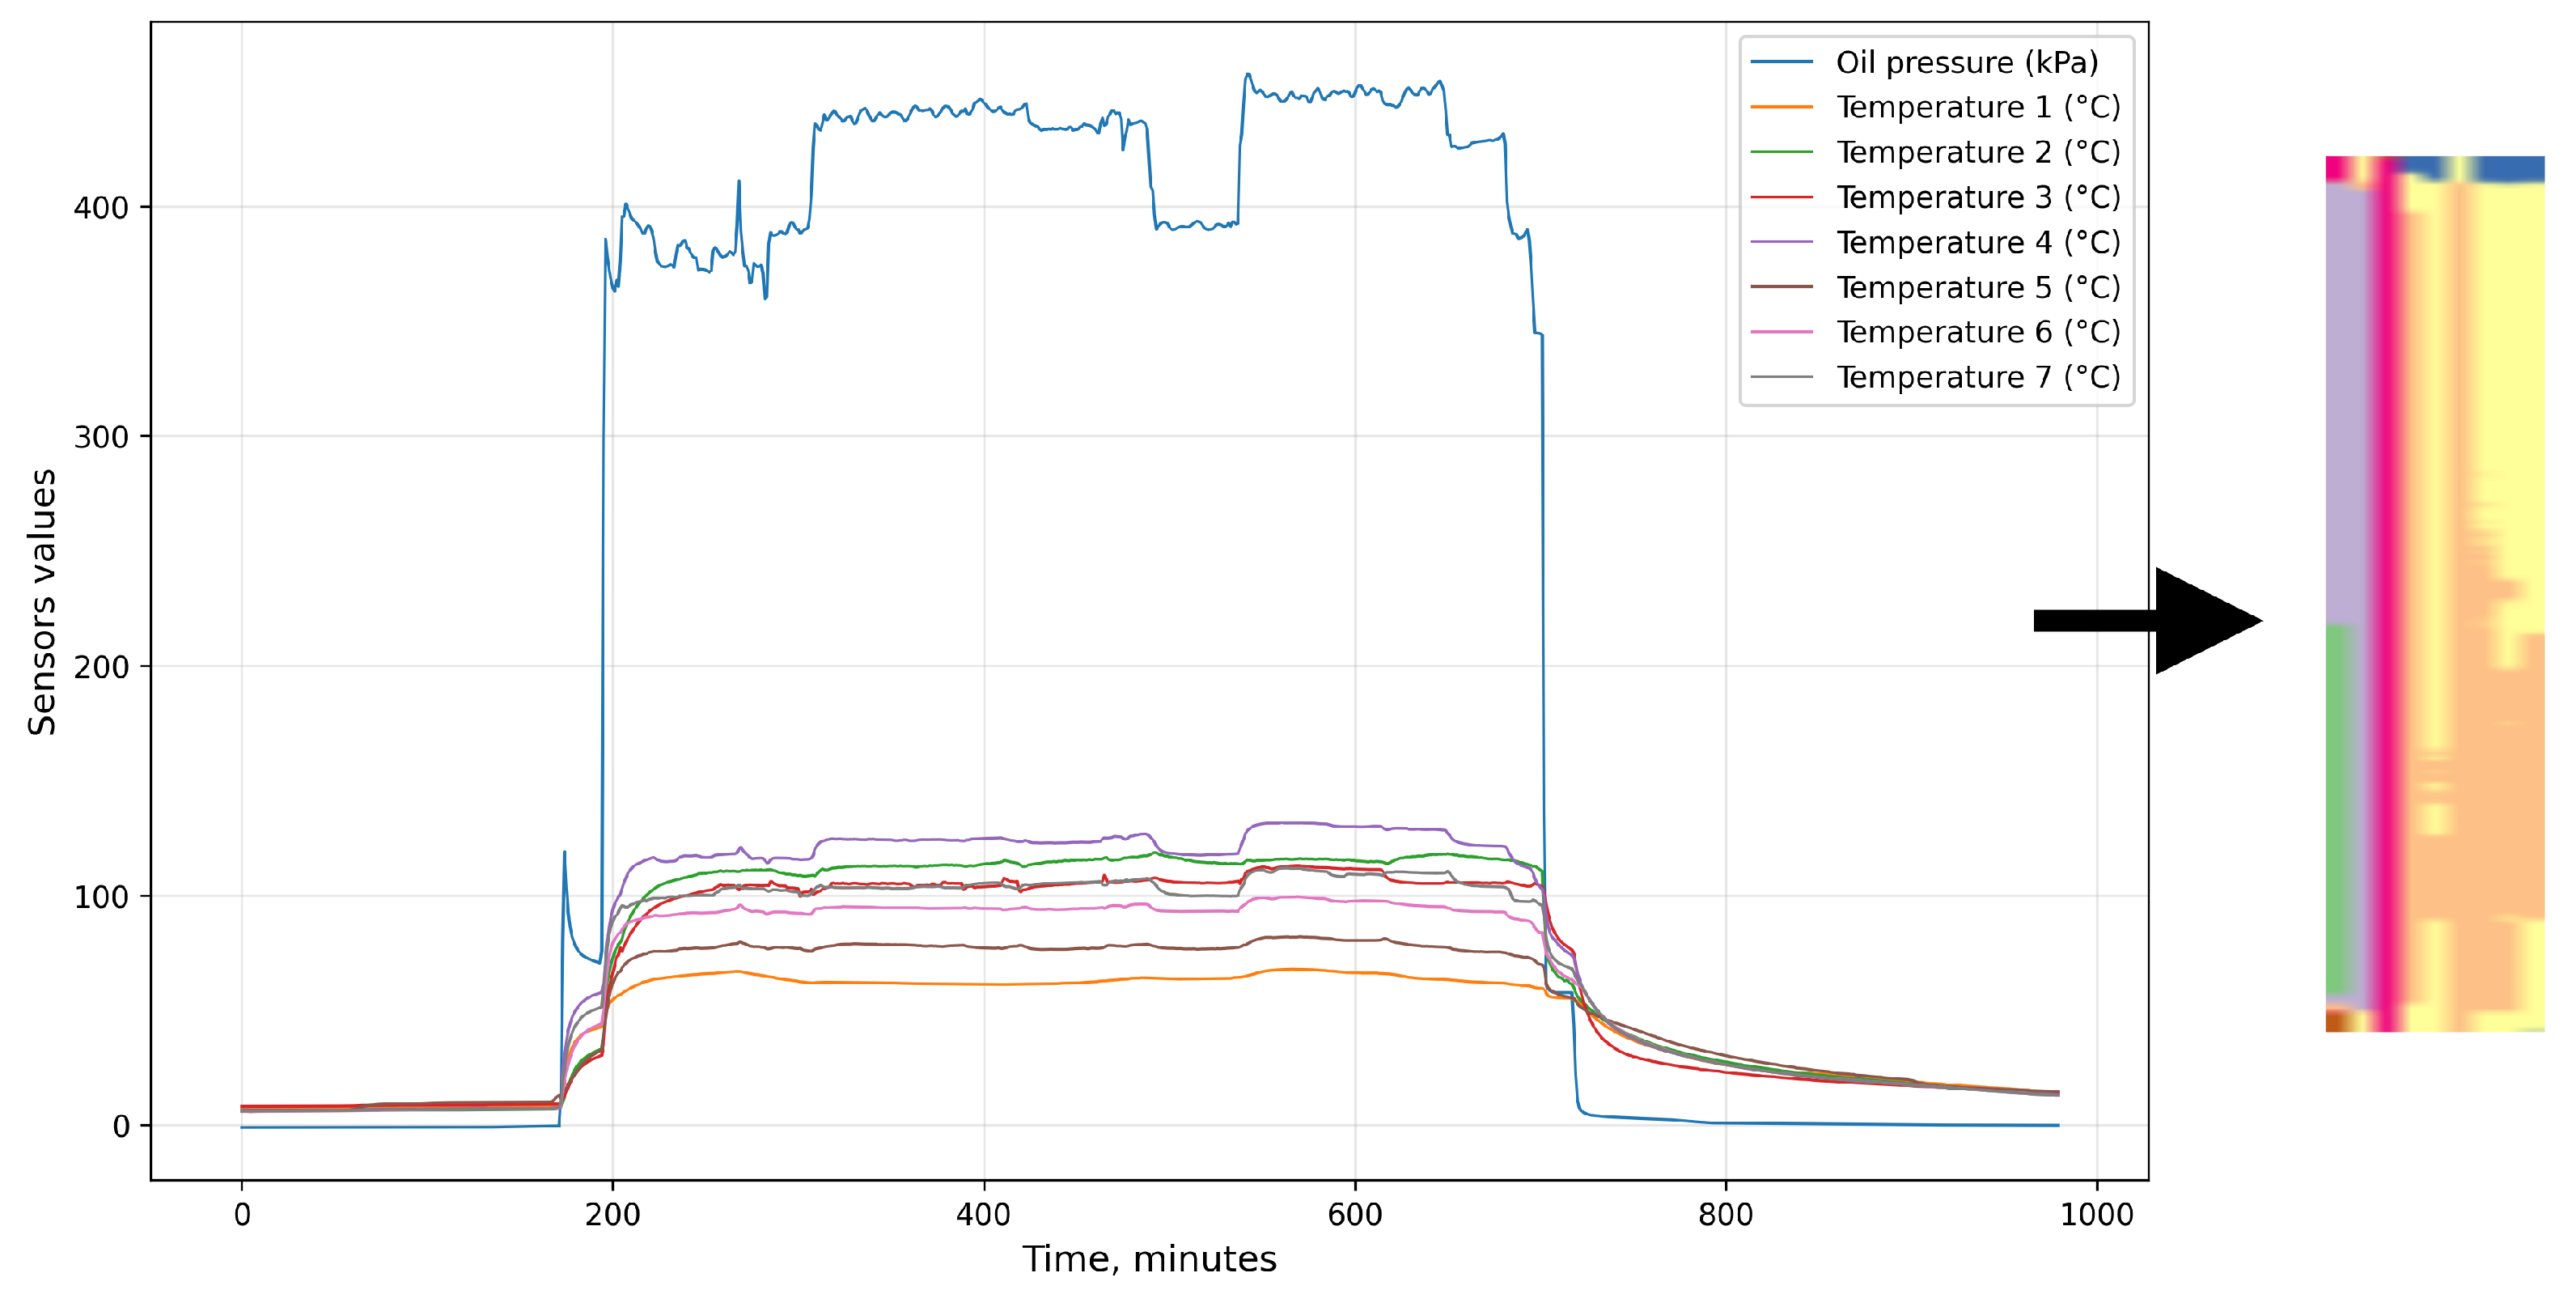
Figure 6 shows an example of the conversion of time series data of the working cycle into an image of the fixed size. In this example, the size of the image is 50 × 200 px.
Figure 6.
Visualization of the conversion of time series data of the working cycle into an image.
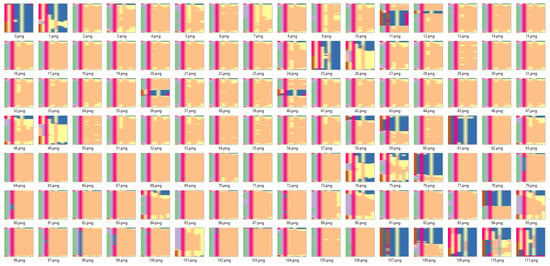
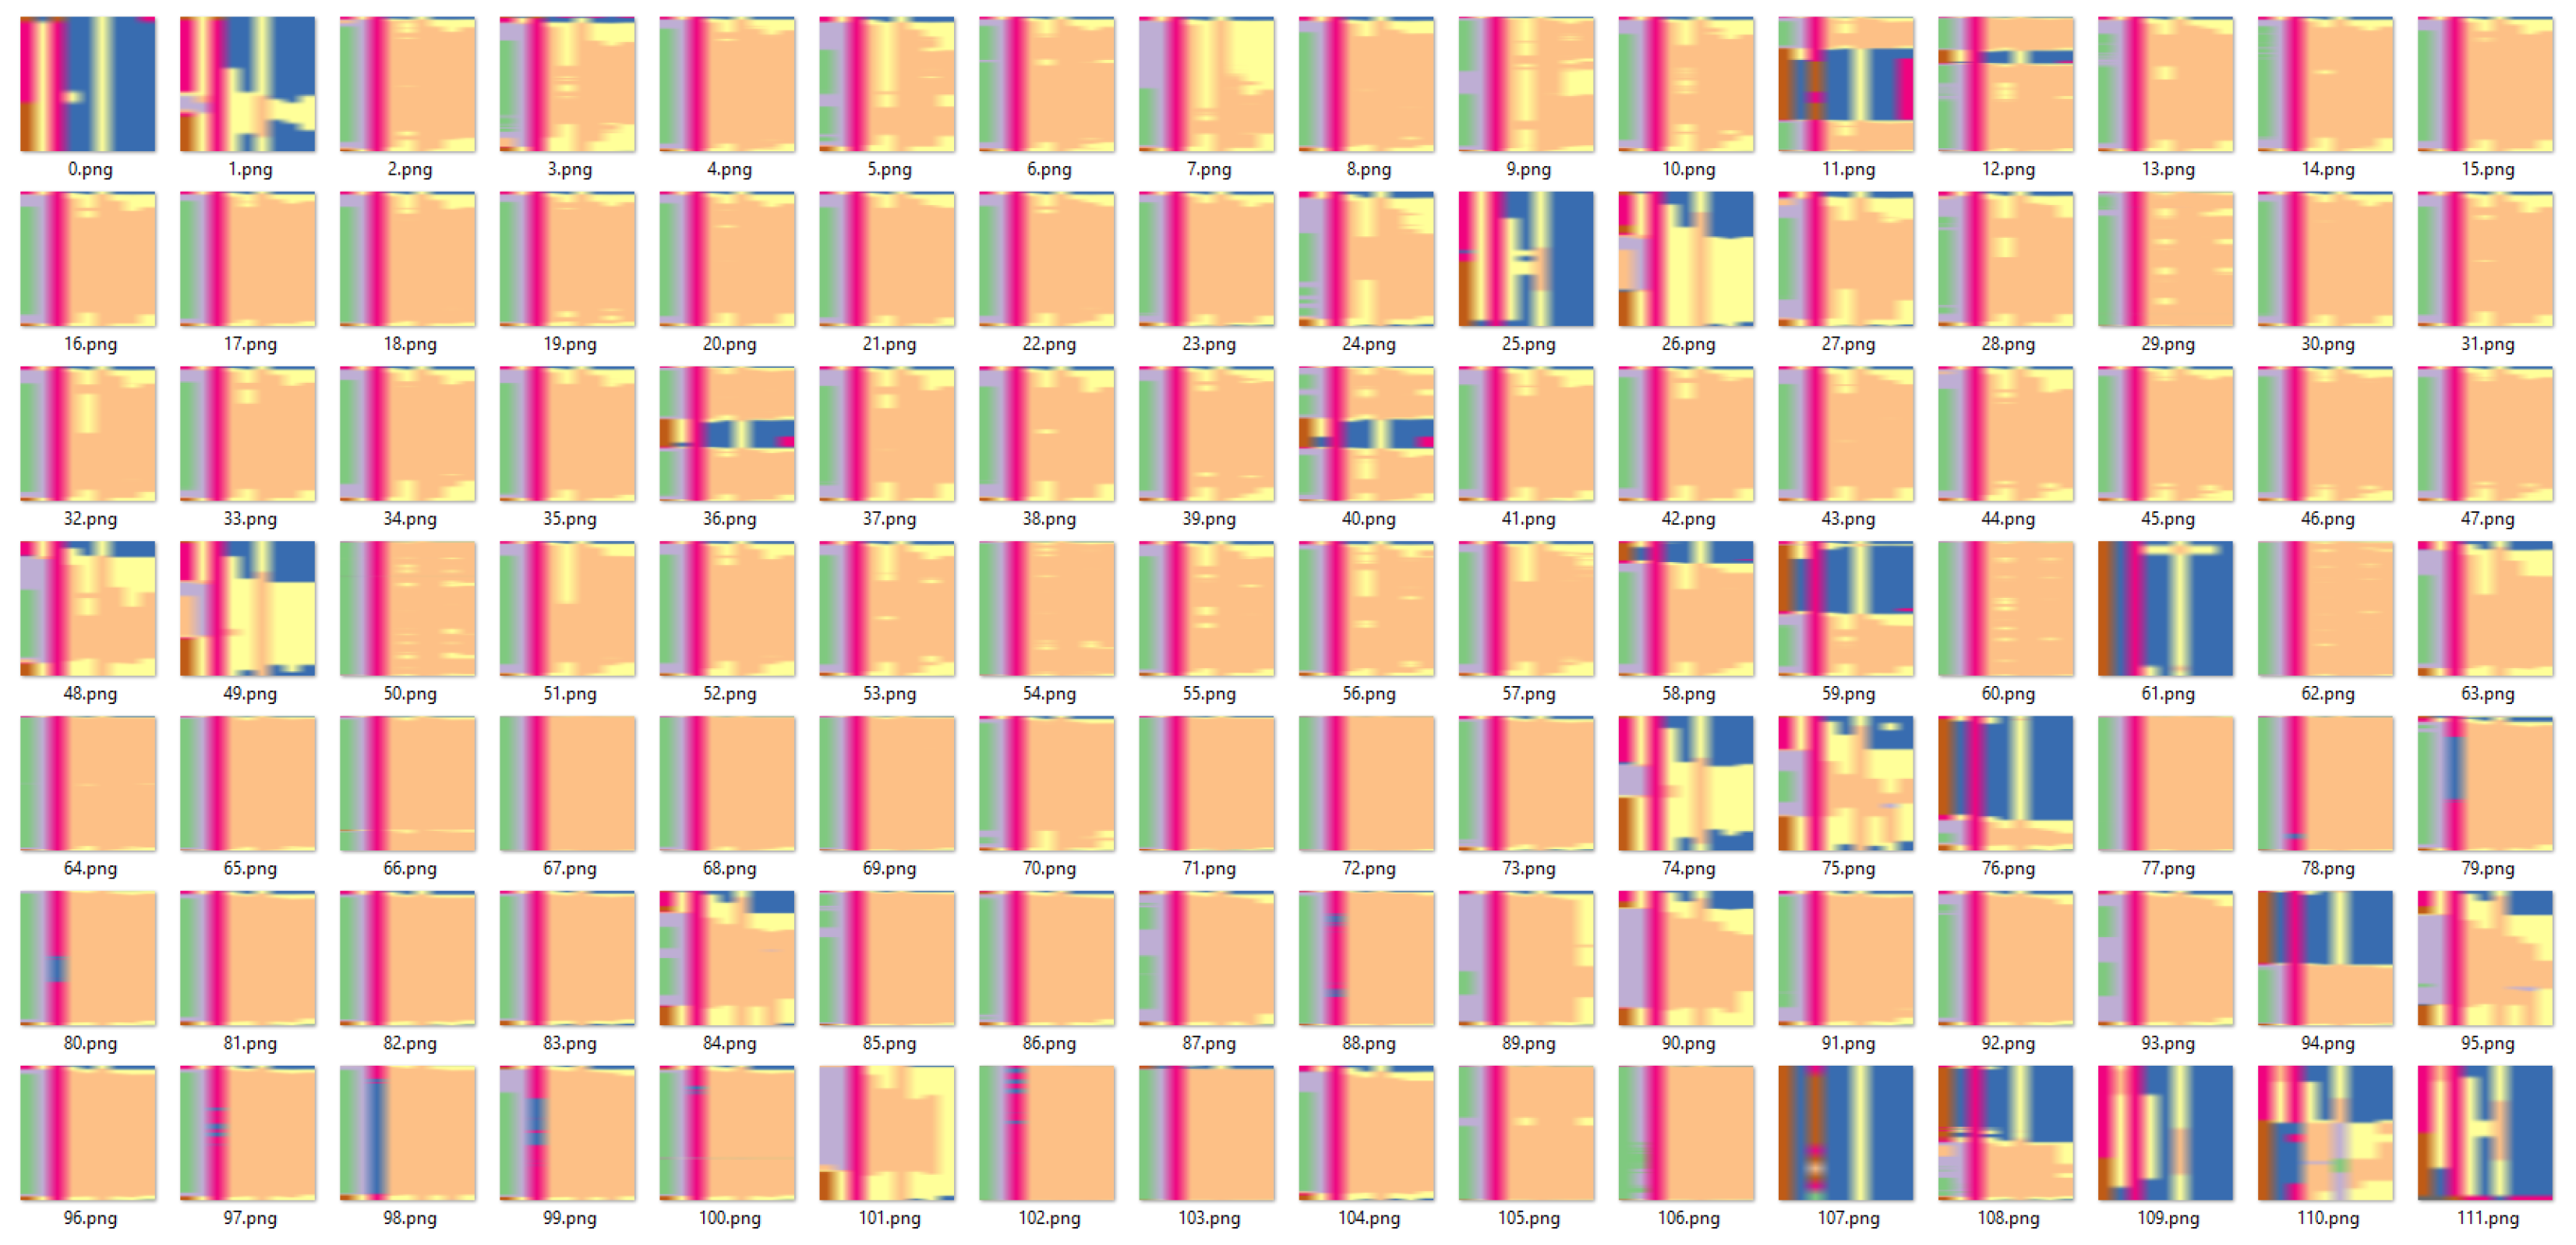
Figure 7 shows an example of images that were obtained after converting working cycles data into images and resizing them to a fixed size of 200 × 200 px.
Figure 7.
An example of a set of uniformly sized input images for autoencoder training.
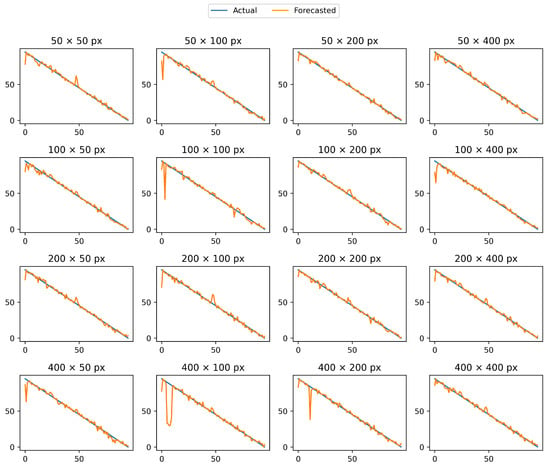
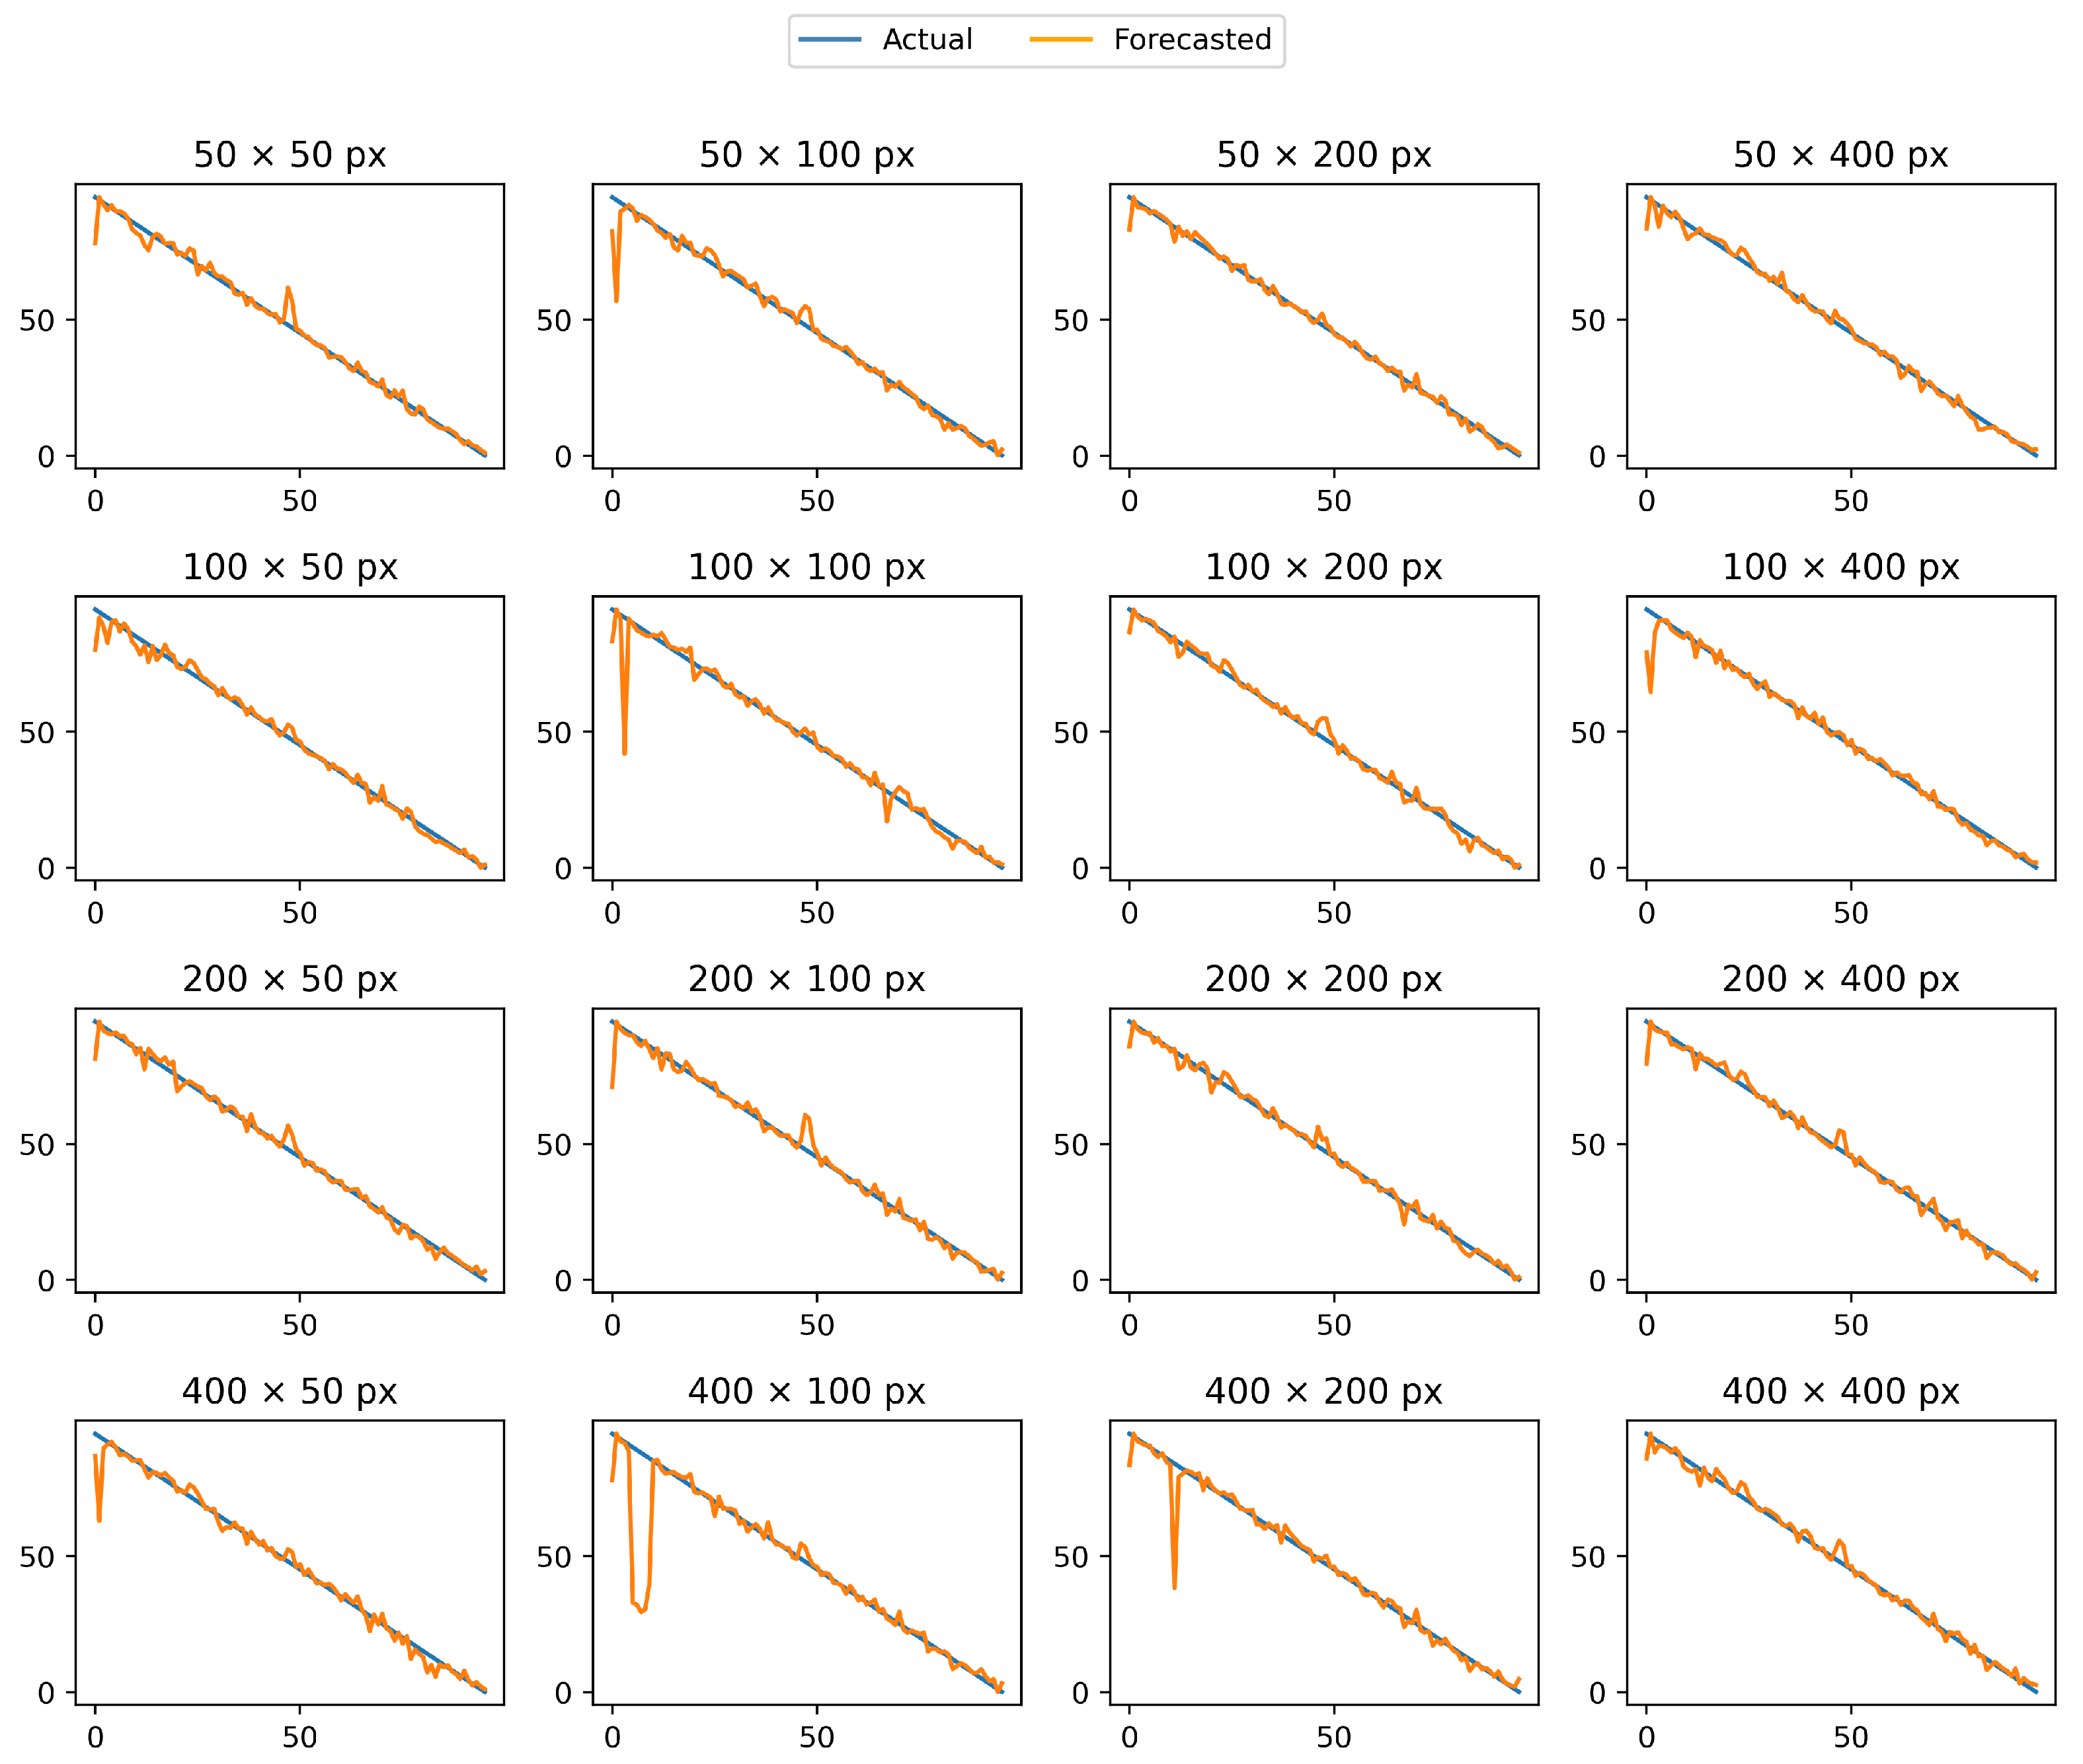
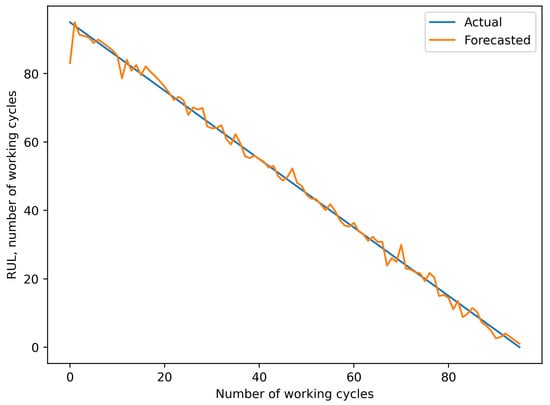
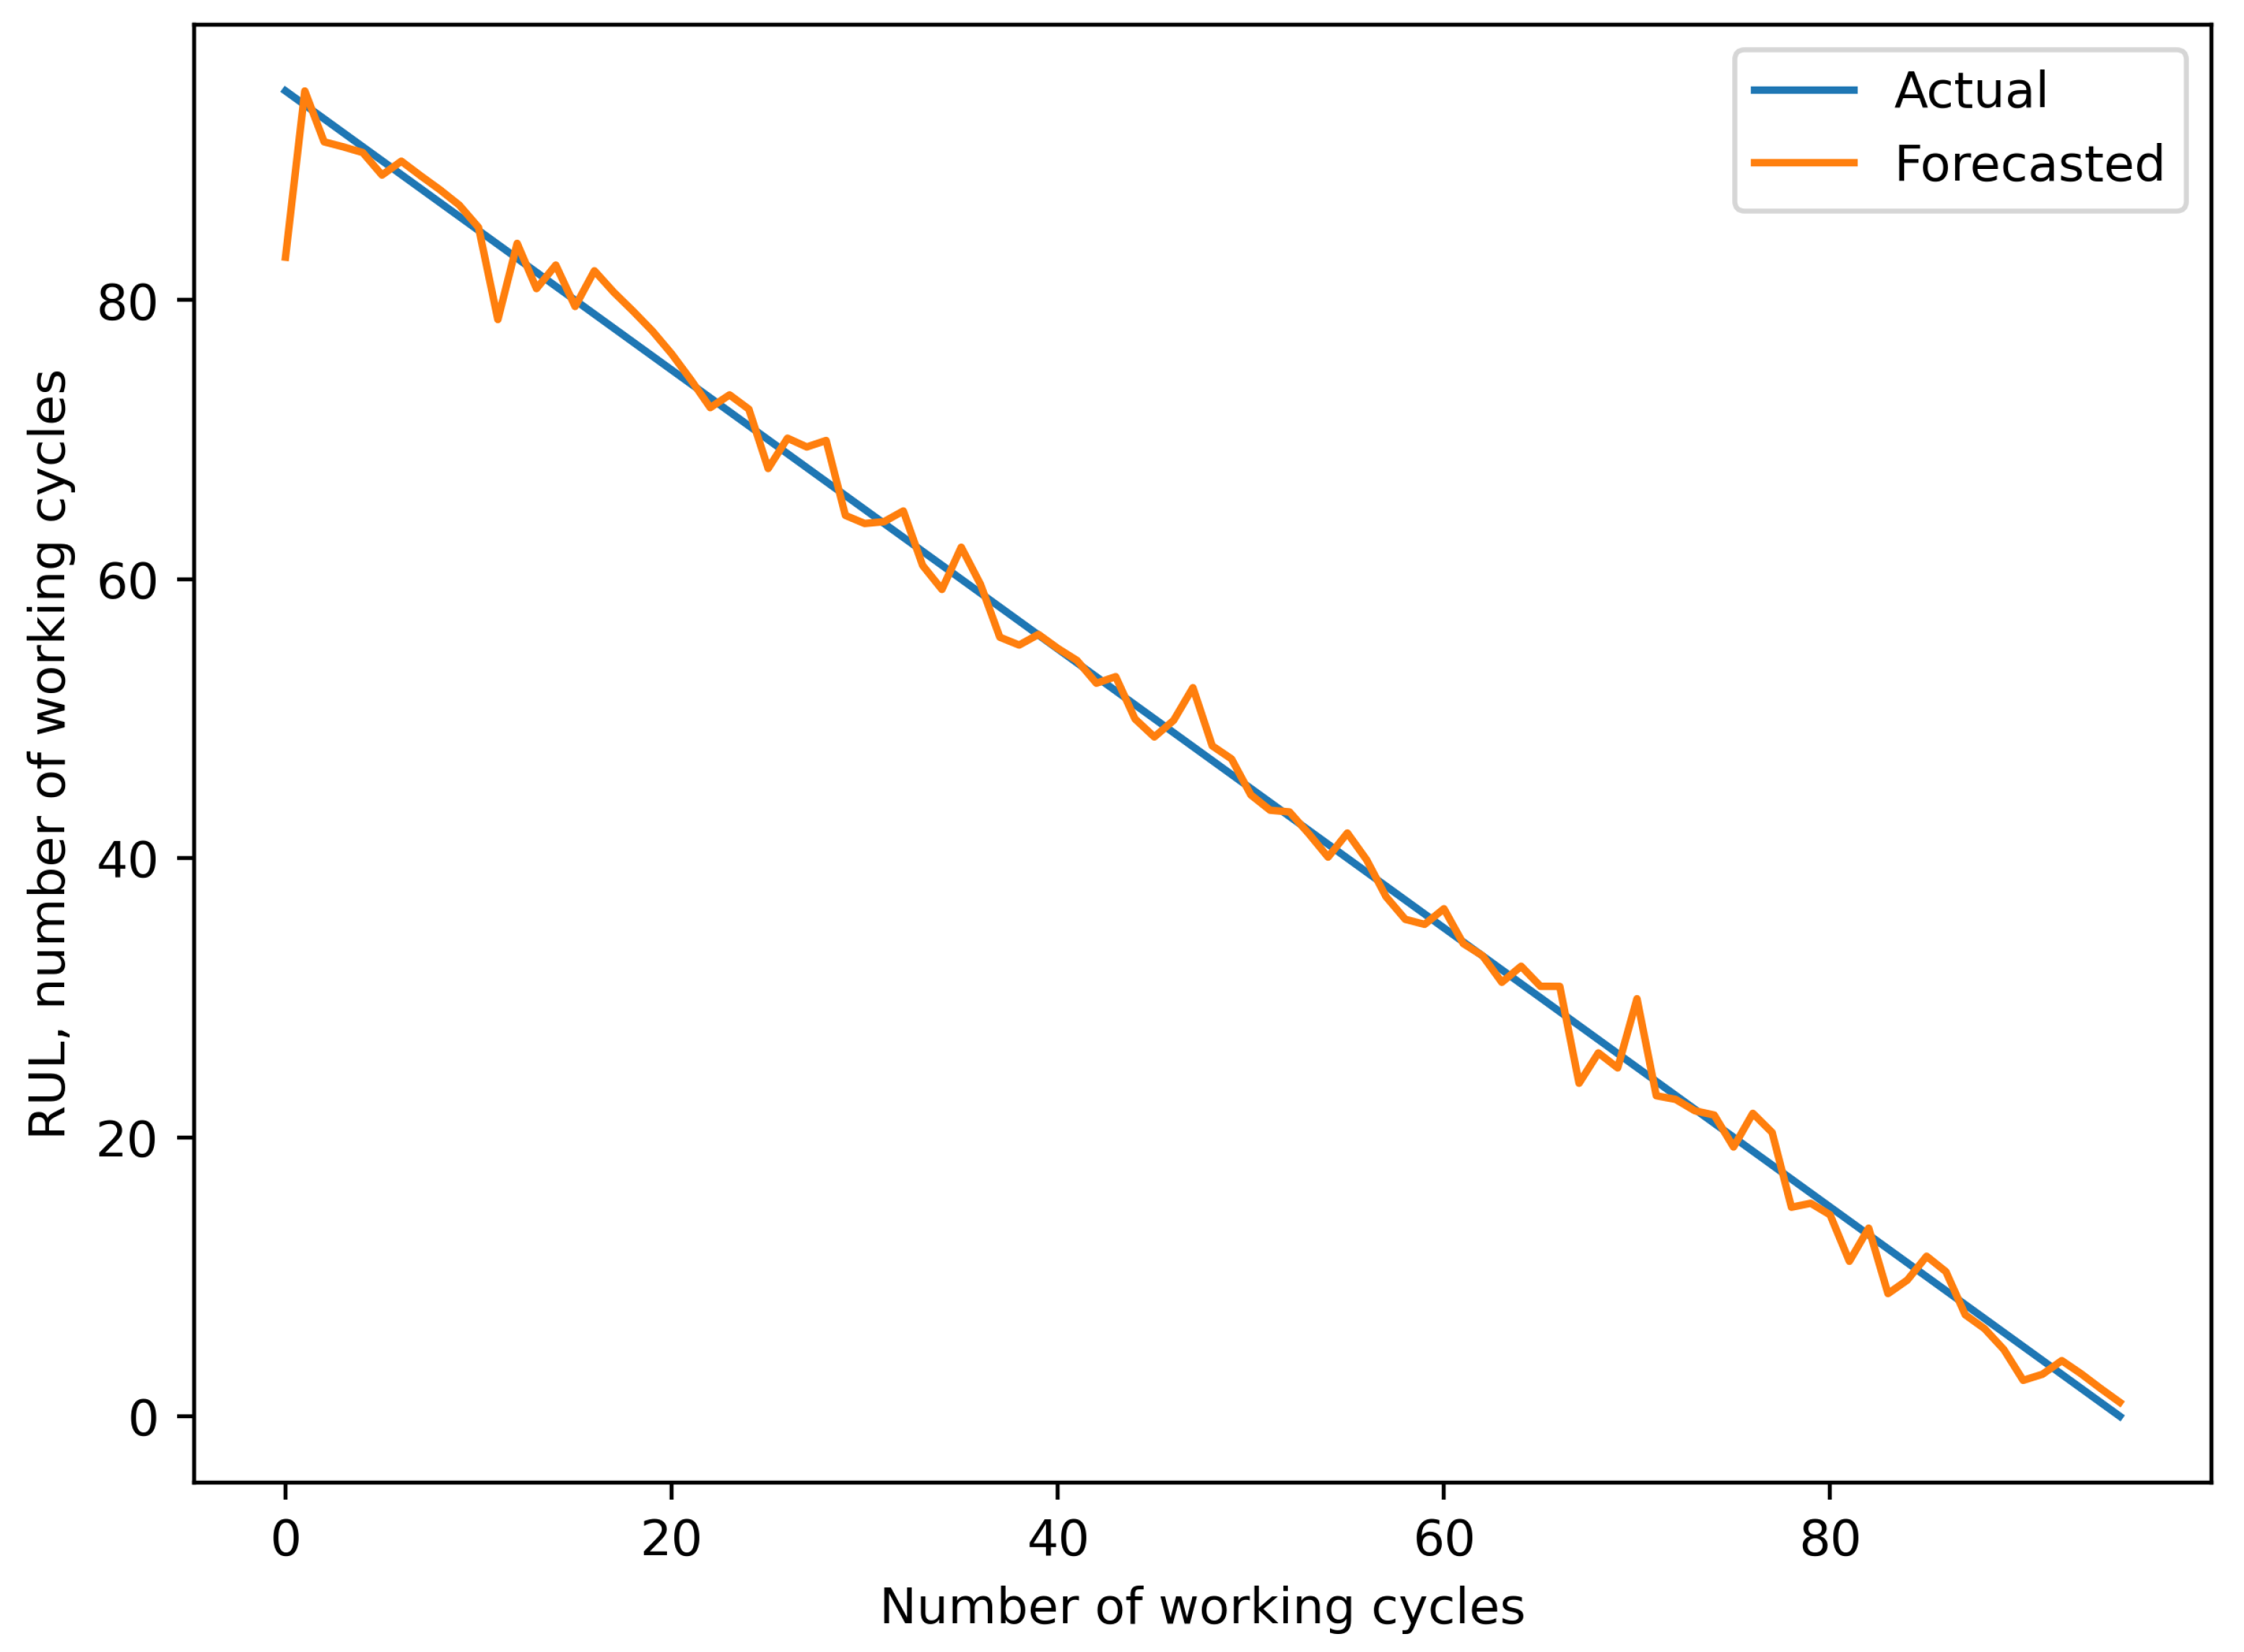
Figure 8 shows the forecast charts built with the proposed method using all combinations of input image sizes. The blue line shows an actual value of RUL from the dataset. The orange line shows the RUL forecast value for each working cycle. Thus, it is possible to visualize the difference between the forecast and actual RUL values for each of the working cycles.
Figure 8.
Charts of RUL forecast using different image sizes. X axis—number of working cycles; Y axis—RUL measured in number of working cycles.
A chart of the forecast with the best performance metrics that was built using a 50 × 200 input image size is provided in Figure 9.
Figure 9.
A chart of the forecast RUL using a 50 × 200 image size.
4.4.3. Optimization of the Method of Converting Images to the Same Size
In this step, the method that is used to convert all of the input images to the same size was selected. Several methods for resizing images were compared. Implementations of the methods were taken from the Pillow (v.10.3) python library. Table 4 contains calculated performance metrics for the forecasts that were built using these methods as part of the extraction of semantic state vectors.
Table 4.
Error measurements for different methods of conversion.
As can be seen in the table, the most accurate forecast was built using a bilinear method for resizing images. It was used in all subsequent experiments.
4.4.4. Optimization of the Semantic State Vector Length
In this section, the length of the semantic state vector is optimized. The length of the vector refers to the number of real numbers that that vector contains. To change the length, the window sizes of the max pooling and upsampling layers of the autoencoder were adjusted.
The calculated performance metrics of the forecasts built using different vector lengths are provided in Table 5. As can be seen, the most accurate forecast is built using a vector length of 10 elements.
Table 5.
Performance metric values for different vector lengths.
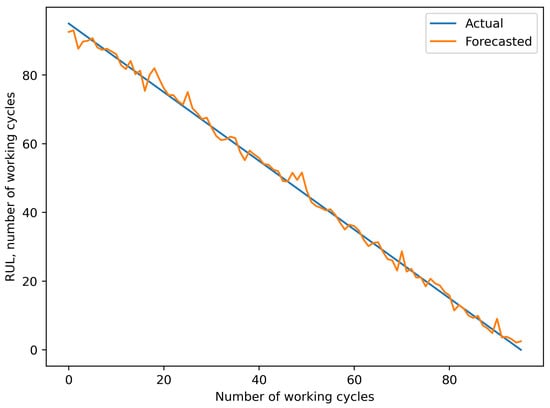
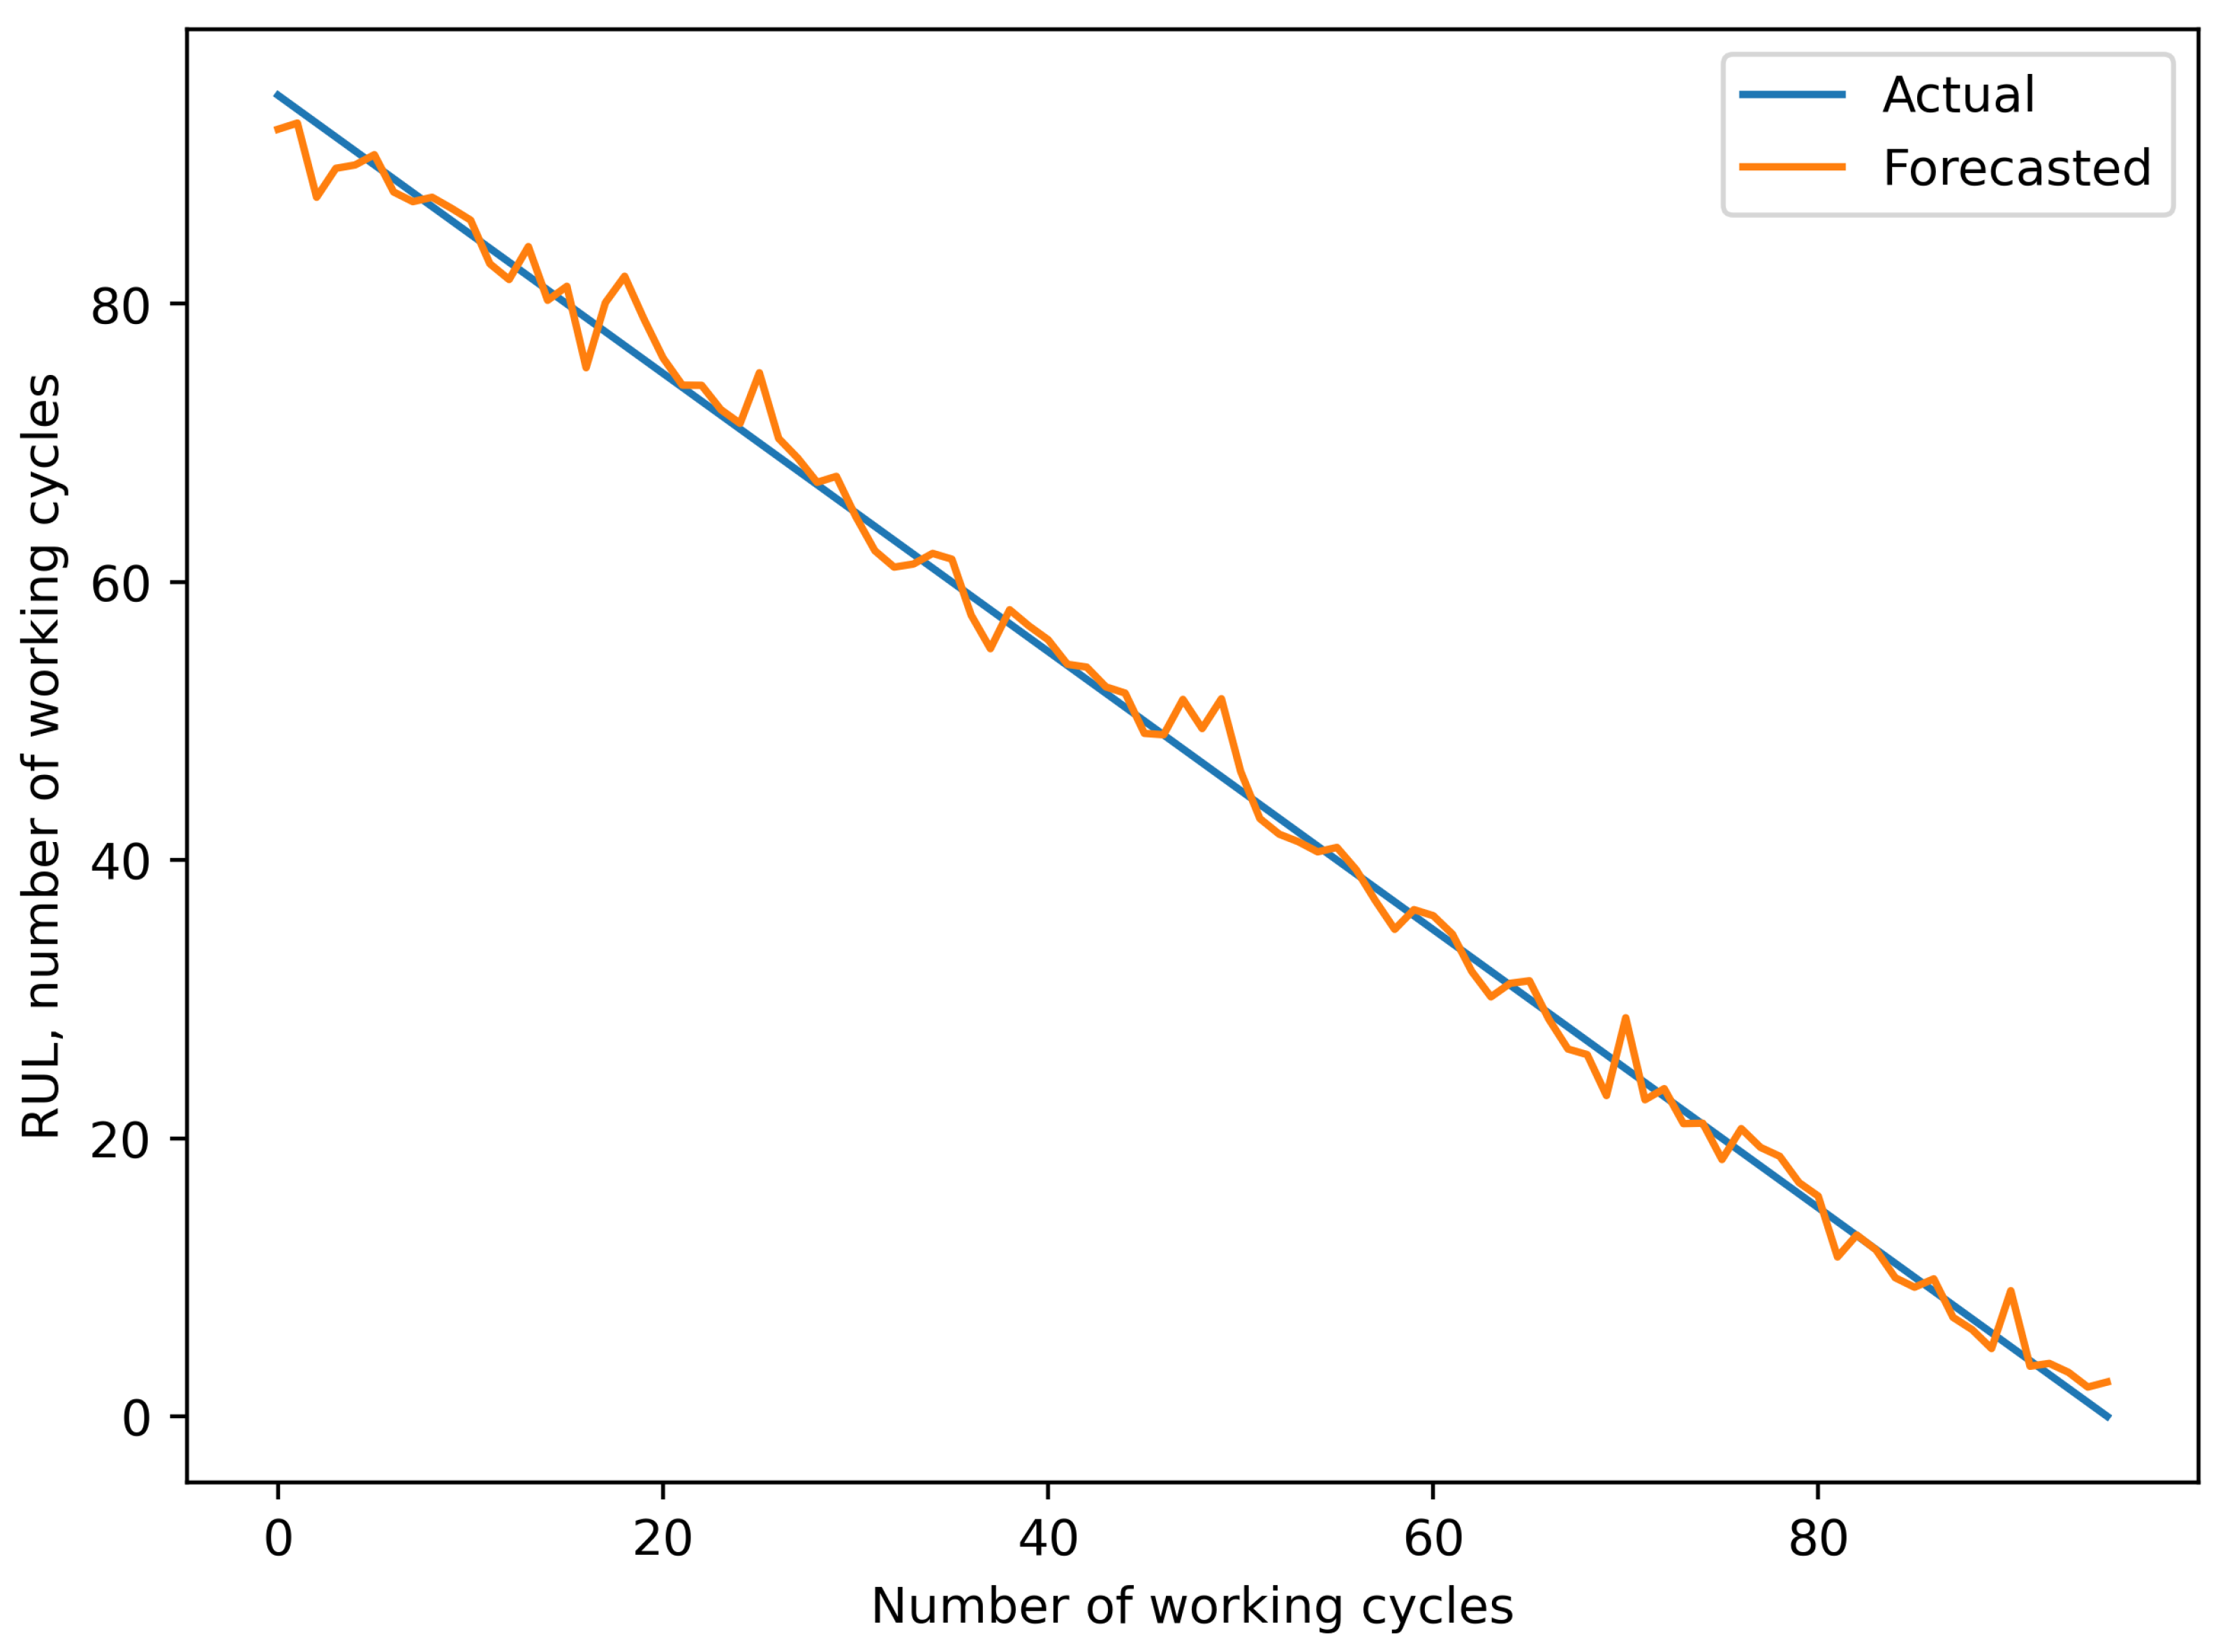
The graph of the final RUL forecast that was built using all of the optimized parameters, namely the image size of 50 × 200 px, the bilinear resampling method, and a semantic state vector length of 10, is provided in Figure 10.
Figure 10.
A chart of the forecast RUL using an image size of 50 × 200 px, the bilinear resampling method, and a semantic state vector length of 10. The forecast value is shown in orange and compared to the actual RUL value shown in blue.
Table 6 presents a comparison of the performance metrics for the forecast built with the proposed method with optimized hyperparamaters, named semantic state vector extraction, and another method for dimensionality reduction [39] that calculates the min, mean, and max values for each parameter of a working cycle, called MIN-AVG-MAX in the table.
Table 6.
Comparison of proposed method to existing analog.
The value of the method with optimized parameters is .
Performance was not directly measured, but it should be noted that a higher input image resolution and a longer vector increased the time it took to train the autoencoder.
5. Discussion
The proposed method is based on a convolutional autoencoder. The usage of the autoencoder allows us to create a semantic state vector of fixed length. This vector represents the whole working cycle. Its usage helps to alleviate problems in forecasting the remaining useful life of equipment when the collected data is multidimensional continuous high-frequency time series that contains working cycles of varying duration.
When compared to another implementation of a method that solves the problem of reducing dimensionality of input data for RUL forecasting, we found a significant increase of up to 8 times in accuracy—namely 1.799 and 14.02 for RMSE and 1.374 and 10.71 for MAE.
Several hyperparameters of the proposed method were optimized in this paper, which include the size of the input images, a method of converting images to the same size, and the size of the semantic state vector.
As can be seen in Figure 8, many experiments with different input image sizes have several outliers that significantly reduce accuracy. Tuning this parameter allows us to find an image size that has the highest outlier robustness. Furthermore, increasing the size of the images after a certain point (200 px height, 50 px width) did not lead to improved accuracy, possibly due to a higher amount of noise.
Optimization or selection of the best method to convert images to the same size showed that the method, while contributing to the final accuracy, is not the most impactful parameter.
To our surprise, a shorter vector length helped with improving the accuracy to some degree. This can be attributed to noise reduction.
6. Conclusions
In this paper, a convolutional autoencoder-based method for extracting semantic state vectors from working cycles was introduced. This method shows a significant improvement in the accuracy of RUL forecast when compared with existing methods.
Therefore, it was shown that this architecture is applicable for effectively solving the EP problem when forecasting RUL for CPSs, which exhibit pMCHF and pCTV properties.
The proposed method has the following limitations:
- The autoencoder is trained for a specific type of CPS and can be used only for other CPSs of the same type. To use this method with different types of CPSs, it must be retrained on corresponding data, although an architecture does not change.
- Experiments in this paper were conducted on a relatively small dataset; therefore, we had to train and verify the autoencoder on the same dataset, the motivation for which is described in Section 3.4. This means that the model can have lower-than-desired accuracy. Also, to use this method with larger datasets, a modification to the model learning procedure is required.
- To convert working cycle data into images, we have to normalize the data to a range, which may not be suitable for some variables that may perform better with normalization to the range.
We propose three directions for future work to improve the proposed method:
- Obtain more data and refine the method using more datasets;
- Apply the grid search technique to optimize all parameters at the same time to further improve accuracy.
- Implement the data augmentation approach to increase an amount of data available for training and testing the model.
The current implementation of the method was created for the real-world task of gas turbine lubrication system malfunction prediction, and the forecasting model was trained on the corresponding data. Based on the results, the method might be used in production environment CPSs. Information about the remaining useful life of equipment, expressed as the number of working cycles to the end-of-life event, serves as a beneficial addition when planning maintenance and repairs.
However, it is not limited to this specific application, since many other types of CPSs generate continuous multivariate data streams with working cycles of various duration. However, to use the proposed method with any other type of system, it would be required to adjust the algorithm to detect working cycles, retrain the autoencoder and forecasting model, and optimize hyperparameters.
Author Contributions
Conceptualization, K.Z. and M.S.; methodology, K.Z.; software, K.Z.; validation, K.Z. and M.S.; formal analysis, K.Z. and M.S.; investigation, K.Z. and M.S.; resources, K.Z. and M.S.; data curation, M.S.; writing—original draft preparation, K.Z. and M.S.; writing—review and editing, K.Z. and M.S.; visualization, K.Z.; supervision, M.S.; project administration, M.S.; funding acquisition, M.S. All authors have read and agreed to the published version of the manuscript.
Funding
This study was supported by a grant from the Russian Science Foundation (RSF), No. 24-21-00483, https://rscf.ru/en/project/24-21-00483/ (accessed on 1 December 2025).
Institutional Review Board Statement
Not applicable.
Data Availability Statement
The data presented in this study are available upon request from the corresponding author due to privacy restrictions.
Conflicts of Interest
The authors declare no conflicts of interest. The funders had no role in the design of the study; in the collection, analyses, or interpretation of data; in the writing of the manuscript; or in the decision to publish the results.
Abbreviations
The following abbreviations are used in this manuscript:
| CPS | Cyber-physical systems |
| pMCHF | Multidimensional continuous high-frequency data property |
| pCTV | Cycles’ time variation property |
| PPHM | Prognosis and predictive health management |
| FP | Failure prediction |
| EP | Event prediction |
| RUL | Remaining useful life |
| RMSE | Root mean square error |
| MAE | Mean absolute error |
| SSV | Semantic state vector |
References
- Mutua, E. Cyber-Physical Systems and Their Role in Industry 4.0. J. Technol. Syst. 2024, 6, 57–69. [Google Scholar] [CrossRef] [Scilit]
- Lee, E.A. Fundamental Limits of Cyber-Physical Systems Modeling. ACM Trans. Cyber-Phys. Syst. 2016, 1, 3. [Google Scholar] [CrossRef] [Scilit]
- Monostori, L.; Kádár, B.; Bauernhansl, T.; Kondoh, S.; Kumara, S.; Reinhart, G.; Sauer, O.; Schuh, G.; Sihn, W.; Ueda, K. Cyber-physical systems in manufacturing. CIRP Ann. 2016, 65, 621–641. [Google Scholar] [CrossRef] [Scilit]
- Shcherbakov, M.; Sai, C. A Hybrid Deep Learning Framework for Intelligent Predictive Maintenance of Cyber-physical Systems. ACM Trans. Cyber-Phys. Syst. 2022, 2, 17. [Google Scholar] [CrossRef] [Scilit]
- Wang, D. Data Reliability Challenge of Cyber-Physical Systems; Academic Press: Boston, MA, USA, 2017; pp. 91–101. [Google Scholar] [CrossRef] [Scilit]
- Zonta, T.; da Costa, C.A.; da Rosa Righi, R.; de Lima, M.J.; da Trindade, E.S.; Li, G.P. Predictive maintenance in the Industry 4.0: A systematic literature review. Comput. Ind. Eng. 2020, 150, 106889. [Google Scholar] [CrossRef] [Scilit]
- Artyushin, V.; Dereguzov, K.; Shcherbakov, M.; Zadiran, K.; Kravets, A. An Intelligent Support Method for the Formation of Control Actions in Proactive Management of Complex Systems. Appl. Syst. Innov. 2025, 9, 5. [Google Scholar] [CrossRef] [Scilit]
- Javed, K.; Gouriveau, R.; Zerhouni, N. State of the art and taxonomy of prognostics approaches, trends of prognostics applications and open issues towards maturity at different technology readiness levels. Mech. Syst. Signal Process. 2017, 94, 214–236. [Google Scholar] [CrossRef] [Scilit]
- LazarovaMolnar, S.; Mohamed, N. Reliability Analysis of Cyber-Physical Systems; Springer: Cham, Switzerland, 2020; pp. 385–405. [Google Scholar] [CrossRef] [Scilit]
- Zadiran, K.; Shcherbakov, M. New Method of Degradation Process Identification for Reliability-Centered Maintenance of Energy Equipment. Energies 2023, 16, 575. [Google Scholar] [CrossRef] [Scilit]
- Jardine, A.; Lin, D.; Banjevic, D. A review on machinery diagnostics and prognostics implementing condition-based maintenance. Mech. Syst. Signal Process. 2006, 20, 1483–1510. [Google Scholar] [CrossRef] [Scilit]
- Nan, X.; Zhang, B.; Liu, C.; Gui, Z.; Yin, X. Multi-Modal Learning-Based Equipment Fault Prediction in the Internet of Things. Sensors 2022, 22, 6722. [Google Scholar] [CrossRef] [Scilit]
- Si, X.; Wang, W.; Hu, C.; Zhou, D. Remaining useful life estimation—A review on the statistical data driven approaches. Eur. J. Oper. Res. 2011, 213, 1–14. [Google Scholar] [CrossRef] [Scilit]
- Dereguzov, K.; Artyushin, V.; Shcherbakov, M.; Zadiran, K. An AI-Based Method for Defining the Similarity of Cyber-Physical Systems. In Frontiers of Industrial Cyber-Physics; Springer: Cham, Switzerland, 2026; pp. 49–68. [Google Scholar] [CrossRef] [Scilit]
- Lei, J.; Zhang, W.; Jiang, Z.; Gao, Z. A Review: Prediction Method for the Remaining Useful Life of the Mechanical System. J. Fail. Anal. Prev. 2022, 22, 2119–2137. [Google Scholar] [CrossRef] [Scilit]
- Frederick, D.; DeCastro, J.; Litt, J. User’s Guide for the Commercial Modular Aero-Propulsion System Simulation (C-MAPSS); NASA: Washington, DC, USA, 2007.
- Li, X.; Ding, Q.; Sun, J. Remaining useful life estimation in prognostics using deep convolution neural networks. Reliab. Eng. Syst. Saf. 2018, 172, 1–11. [Google Scholar] [CrossRef] [Scilit]
- Wang, B.; Lei, Y.; Li, N. A Hybrid Prognostics Approach for Estimating Remaining Useful Life of Rolling Element Bearings. IEEE Trans. Reliab. 2018, 8, 401–412. [Google Scholar] [CrossRef] [Scilit]
- Tyagi, V. NASA Bearing Dataset. Available online: https://www.kaggle.com/datasets/vinayak123tyagi/bearing-dataset (accessed on 31 October 2025).
- Niyongabo, J.; Zhang, Y.; Ndikumagenge, J. An intelligent fault diagnosis method for rolling bearing based on a deep ensemble learning model. Appl. Math. Sci. 2022, 16, 453–464. [Google Scholar] [CrossRef] [Scilit]
- Yu, J.; Hu, H. A Multi-Scale Convolutional Neural Network with Self-Knowledge Distillation for Bearing Fault Diagnosis. Machines 2024, 12, 792. [Google Scholar] [CrossRef] [Scilit]
- Gong, W.; Chen, H.; Zhang, Z.; Zhang, M.; Wang, R.; Guan, C.; Wang, Q. A Novel Deep Learning Method for Intelligent Fault Diagnosis of Rotating Machinery Based on Improved CNN-SVM and Multichannel Data Fusion. Sensors 2019, 19, 1693. [Google Scholar] [CrossRef] [Scilit]
- Xiong, S.; Zhou, H.; He, S.; Zhang, L.; Xia, Q.; Xuan, J.; Shi, T. A Novel End-To-End Fault Diagnosis Approach for Rolling Bearings by Integrating Wavelet Packet Transform into Convolutional Neural Network Structures. Sensors 2020, 20, 4965. [Google Scholar] [CrossRef] [Scilit]
- Zhao, X.; Luo, W. A Deep Intelligent Hybrid Model for Fault Diagnosis of Rolling Bearing. J. Vib. Eng. Technol. 2022, 11, 721–737. [Google Scholar] [CrossRef] [Scilit]
- Li, X.; Xiao, S.; Li, Q.; Zhu, L.; Wang, T.; Chu, F. The bearing multi-sensor fault diagnosis method based on a multi-branch parallel perception network and feature fusion strategy. Reliab. Eng. Syst. Saf. 2025, 261, 111122. [Google Scholar] [CrossRef] [Scilit]
- Sohaib, M.; Kim, C.; Kim, J. A Hybrid Feature Model and Deep-Learning-Based Bearing Fault Diagnosis. Sensors 2017, 17, 2876. [Google Scholar] [CrossRef] [Scilit]
- Tang, J.; Wu, J.; Qing, J. A feature learning method for rotating machinery fault diagnosis via mixed pooling deep belief network and wavelet transform. Results Phys. 2022, 39, 105781. [Google Scholar] [CrossRef] [Scilit]
- Wu, H.; Li, J.; Zhang, Q.; Tao, J.; Meng, Z. Intelligent fault diagnosis of rolling bearings under varying operating conditions based on domain-adversarial neural network and attention mechanism. ISA Trans. 2022, 130, 477–489. [Google Scholar] [CrossRef] [Scilit]
- Wang, H.; Zhang, X.; Ren, M.; Xu, T.; Lu, C.; Zhao, Z. Remaining Useful Life Prediction of Rolling Bearings Based on Multi-scale Permutation Entropy and ISSA-LSTM. Entropy 2023, 25, 1477. [Google Scholar] [CrossRef] [Scilit]
- Sayyad, S.; Kumar, S.; Bongale, A.; Kotecha, K.; Abraham, A. Remaining Useful-Life Prediction of the Milling Cutting Tool Using Time–Frequency-Based Features and Deep Learning Models. Sensors 2023, 23, 5659. [Google Scholar] [CrossRef] [Scilit] [PubMed]
- Makrouf, I.; Zegrari, M.; Dahi, K.; Ouachtouk, I. A novel framework for multi-sensor data fusion in bearing fault diagnosis using continuous wavelet transform and transfer learning. e-Prime—Adv. Electr. Eng. Electron. Energy 2025, 13, 101025. [Google Scholar] [CrossRef] [Scilit]
- Chen, J.; Jiang, J.; Guo, X.; Tan, L. An Efficient CNN with Tunable Input-Size for Bearing Fault Diagnosis. Int. J. Comput. Intell. Syst. 2021, 14, 625–634. [Google Scholar] [CrossRef] [Scilit]
- Liu, M.; Yao, X.; Zhang, J.; Chen, W.; Jing, X.; Wang, K. Multi-Sensor Data Fusion for Remaining Useful Life Prediction of Machining Tools by IABC-BPNN in Dry Milling Operations. Sensors 2020, 20, 4657. [Google Scholar] [CrossRef] [Scilit] [PubMed]
- Liu, B.; Gao, Z.; Lu, B.; Dong, H.; An, Z. Deep Learning-Based Remaining Useful Life Estimation of Bearings with Time-Frequency Information. Sensors 2022, 22, 7402. [Google Scholar] [CrossRef] [Scilit]
- Rahmati, M.; Rahmati, N. A multimodal deep learning framework for real-time defect recognition in industrial components using visual, acoustic and vibration signals. J. Intell. Manuf. Spec. Equip. 2025, 6, 273–292. [Google Scholar] [CrossRef] [Scilit]
- Tang, H.; Gao, S.; Wang, L.; Li, X.; Li, B.; Pang, S. A Novel Intelligent Fault Diagnosis Method for Rolling Bearings Based on Wasserstein Generative Adversarial Network and Convolutional Neural Network under Unbalanced Dataset. Sensors 2021, 21, 6754. [Google Scholar] [CrossRef] [Scilit] [PubMed]
- Gória Silva, P.E. Communications in Cyber-Physical Systems: Semantic-Functional Approach, Vulnerability, and Physical Layer Performance. Ph.D. Thesis, Lappeenranta-Lahti University of Technology LUT, Lappeenranta, Finland, September 2024. [Google Scholar]
- Wang, H.; Wang, H.; Tang, X. A Review of Deep Learning in Rotating Machinery Fault Diagnosis and Its Prospects for Port Applications. Appl. Sci. 2025, 15, 11303. [Google Scholar] [CrossRef] [Scilit]
- Zadiran, K. A new method for predicting the remaining equipment life for high-frequency data with non-uniform duty cycles. Izv. SFedU. Eng. Sci. 2023, 3, 65–74. [Google Scholar] [CrossRef] [Scilit]

Disclaimer/Publisher’s Note: The statements, opinions and data contained in all publications are solely those of the individual author(s) and contributor(s) and not of MDPI and/or the editor(s). MDPI and/or the editor(s) disclaim responsibility for any injury to people or property resulting from any ideas, methods, instructions or products referred to in the content. |
© 2026 by the authors. Licensee MDPI, Basel, Switzerland. This article is an open access article distributed under the terms and conditions of the Creative Commons Attribution (CC BY) license.