


Abstract
Financial data analysis remains a significant challenge due to the inherent stochasticity, non-stationarity, and low signal-to-noise ratio of market data. Conventional methods often struggle to disentangle intrinsic trends from noise and frequently overlook the critical influence of investor sentiment on price dynamics. To address these issues, we propose an adaptive trading model named CBAM-BiLSTM-DDQN, which integrates signal decomposition, multi-source feature fusion, and deep reinforcement learning. First, we construct a comprehensive heterogeneous feature set by combining price signals decomposed via Variational Mode Decomposition (VMD) and investor sentiment indices extracted from financial texts. Subsequently, a Genetic Algorithm (GA) is employed to identify the most significant feature subset, effectively reducing dimensionality and redundancy. Finally, these optimized features are input into a Double Deep Q-Network (DDQN) agent equipped with a Convolutional Block Attention Module (CBAM) and a Bidirectional Long Short-Term Memory (BiLSTM) network to capture complex spatiotemporal dependencies. We evaluated this approach through simulated trading on three major Chinese stock indices—the Shanghai Stock Exchange Composite (SSEC), the Shenzhen Stock Exchange Component (SZSE), and the China Securities 300 (CSI 300). Experimental results demonstrate the superiority of our method over traditional strategies and standard baselines; specifically, the trading agent achieved robust cumulative returns across the SSEC and CSI 300 indices, confirming the model’s exceptional capability in balancing profitability and risk aversion in complex financial environments. Furthermore, additional experiments on individual stocks in the Chinese A-share market reinforce the robustness and generalization ability of our proposed model, validating its practical potential for diverse trading scenarios.
MSC:
62M10; 68W50; 65Y04
1. Introduction
Financial data, particularly stock prices, are influenced by the intricate interplay of economic fundamentals, policy changes, market microstructure effects, and collective investor sentiment. This interplay leads to significant non-linearity, non-stationarity, and high volatility. These properties cause real-world price data to be severely influenced by noise and short-lived fluctuations, effectively obscuring latent predictive signals and hindering the ability of conventional models to distill stable, structural patterns from pervasive market noise. Moreover, traditional feature representations primarily rely on price-volume indicators, which fail to sufficiently capture sentiment-driven behavioral dynamics. Consequently, essential information embedded in investor discussions and online opinions is often ignored, leading to an incomplete characterization of market states. Addressing these challenges requires a modeling framework capable of suppressing noise in raw price series and integrating heterogeneous information sources. We propose an effective mechanism that combines signal decomposition and the integration of textual information to extract discriminative features from complex sequential data, thereby supporting robust and adaptive trading decisions.
Signal decomposition serves as a critical preprocessing step for processing highly non-linear and non-stationary financial time series. The variational formulation of VMD is rooted in classical results on convex optimization and augmented Lagrangian methods [1,2], which provide theoretical guarantees for saddle-point convergence and stability under regularization. While the foundational empirical mode decomposition (EMD) [3] is often compromised by mode mixing, variational mode decomposition (VMD) [4] offers superior robustness by adaptively separating signals within a rigorous variational framework. A popular research trend involves hybrid decomposition strategies designed to maximize noise reduction. For example, recent studies have verified frameworks combining VMD with other mechanisms [5,6] and the optimization of decomposition parameters through meta-heuristic algorithms [7]. Recently, Zhang and Chen [8] demonstrated that providing such denoised and stationary state representations significantly stabilizes the convergence of downstream reinforcement learning agents.
Complementing historical price dynamics, the integration of unstructured textual information has become imperative to capture rapid expectation shocks. From an applied mathematics perspective, the extraction of semantic shocks from unstructured text can be viewed as a high-dimensional information processing problem [9,10], where textual signals act as nonlinear observations of latent market expectations. Extensive literature has been presented regarding these studies. For instance, a prevalent approach involves coupling these transformer-based encoders with Recurrent Neural Networks (RNNs) to model temporal dependencies for stock prediction [11,12], a framework also proven effective in general sentiment analysis [13,14]. Furthermore, another advanced strategy employs a second, distinct Transformer module to process and fuse the features extracted by the primary BERT-based encoder, demonstrating a powerful two-stage Transformer design [15,16,17]. The viability of both hybrid approaches hinges on the foundational step of accurate sentiment extraction, a task for which BERT-based models have demonstrated high precision and recall directly on financial social media data [18]. These findings demonstrated that such accurately extracted semantic factors can be synergistically aligned with technical indicators within complex predictive frameworks [19,20].
To effectively integrate these multimodal signals for trading, deep reinforcement learning (DRL) in quantitative finance has made advancements to more effectively handle market uncertainty. This is because the reinforcement learning component embeds the trading task within the mathematical framework of stochastic dynamic programming, where the convergence guarantees of stochastic approximation theory offer theoretical support for the stability and convergence of learned trading policies. Recent developments have addressed the limitations of early models, specifically concentrating on reducing instability and overestimation bias. Key improvements involve incorporating volatility penalties into objective functions [21,22] and devising innovative architectural paradigms such as DADE-DQN [23,24]. Moreover, the decision-making performance of agents has been enhanced by replacing standard layers with advanced feature extraction modules, such as Multi-Scale CNNs and attention mechanisms [25,26,27]. These advancements directly motivate our unified framework, which leverages VMD-decomposed price components and RoBERTa-based sentiment signals to develop a robust reinforcement learning trading agent.
In this paper, we develop a multi-stage stock forecasting and trading model designed to address the inherent challenges of financial time series, such as noise contamination, feature redundancy, and the integration of large-scale textual data. The primary strategy of our proposed framework can be divided into three parts. First, we employ the Dung Beetle Optimization (DBO) algorithm to adjust the hyperparameters of Variational Mode Decomposition (VMD), effectively refining price signals from noisy data. From an applied mathematics standpoint, this step corresponds to solving a regularized variational problem, where the decomposition of non-stationary financial series can be interpreted as an ill-posed inverse problem requiring stability and identifiability guarantees [28]. Based on these denoised components, we construct a comprehensive set of technical indicators—including moving averages and volatility measures—to characterize market behavior across multiple temporal horizons. Additionally, we adopt a RoBERTa-based transformer framework, trained on labeled financial data, to enable accurate sentiment classification and generate high-quality sentiment indices. Second, to mitigate the curse of dimensionality, we implement a GA-based deep learning mechanism to automatically select the most discriminative features from the combined technical and sentiment indicator set. Finally, a Double Deep Q-Network (DDQN) is integrated to learn optimal trading policies. This yields an end-to-end system that unifies signal decomposition, sentiment modeling, feature optimization, and reinforcement learning for systematic decision-making.
Based on this framework, our main contributions can be summarized as follows:
- Financial Sentiment Modeling Strategy: We introduce a strategy based on a RoBERTa Transformer head framework, which is designed for high data efficiency. The approach achieves strong classification accuracy with minimal labeled data, thus, providing a practical pathway for sentiment analysis under common data constraints.
- Attention-Enhanced Reinforcement Learning Approach: We develop an attention-enhanced CBAM-BiLSTM-DDQN reinforcement learning approach, in which the CBAM strengthens temporal feature extraction. This strategy improves the stability and sample efficiency of policy learning, demonstrating the effectiveness of CBAM in financial time series analysis.
- Multi-Modal Trading Framework: We integrate VMD-based signal denoising, BERT-based sentiment factor construction, evolutionary feature selection, and deep reinforcement learning into a unified multi-modal trading framework. This integrated design not only enhances predictive accuracy and execution efficiency but also advances the methodological understanding of how diverse financial information can be jointly modeled to support adaptive trading strategies. Beyond its empirical advantages, this architecture also contributes to the applied mathematics of financial decision-making.
The structure of this paper is organized as follows. Section 2 introduces the relevant models together with their theoretical foundations. Section 3 describes our proposed adaptive trading framework and its basic strategies. Section 4 presents the data sources and the corresponding preprocessing procedures. Section 5 describes the design of the reinforcement learning model and reports the experimental results. Finally, we conclude the paper and outline potential directions for future work in Section 6.
2. Preliminaries
2.1. Variational Mode Decomposition
The VMD method [4] represents a shift in adaptive signal processing. Unlike methods such as EMD, VMD is a parallel, variational approach that breaks down a multicomponent signal into a discrete number of band-limited intrinsic mode functions (IMFs). This mathematical framework allows it to effectively mitigate mode mixing and robustly handle noise, making it particularly suitable for the non-stationary characteristics of financial time series.
The goal of VMD is to break down the input signal into K discrete modes , each concentrated around a center frequency . This is formulated as a constrained variational optimization problem:
To solve this constrained problem, the Augmented Lagrangian method is employed, introducing a quadratic penalty term and a Lagrangian multiplier . The solution is obtained by the Alternating Direction Method of Multipliers (ADMM), which iteratively updates the modes , center frequencies , and the multiplier .
Mode Update: In the frequency domain, the mode is updated by Wiener filtering at each step :
Center Frequency Update: The center frequency is updated as the center of gravity of the mode’s power spectrum:
Dual Ascent: The Lagrangian multiplier is updated to enforce the reconstruction constraint:
The complete execution flow of the VMD [4] algorithm is summarized in Algorithm 1.
| Algorithm 1 Variational Mode Decomposition (VMD) |
|
While standard VMD is powerful, its performance heavily relies on the preset parameters K and . To address this, we introduce a Dung Beetle Optimization (DBO) mechanism to adaptively optimize these parameters. Specifically, the optimal values for K and are determined through DBO optimization on the training set and subsequently applied to the test set to ensure robust decomposition.
2.2. Convolutional Block Attention Module
To enhance feature representation, we integrate the Convolutional Block Attention Module (CBAM) to sequentially generate attention maps along the channel and temporal dimensions [29]. Let represent the input feature map, where C denotes the number of channels and T signifies the temporal length.
2.2.1. Channel Attention Module
The Channel Attention Module (CAM) aggregates temporal features by applying global average pooling and global max pooling to identify channel-wise significance. These descriptors are processed by a shared Multi-Layer Perceptron (MLP) with a reduction ratio r to model inter-channel dependencies. The channel attention map is computed as:
where is the sigmoid function, is ReLU, and are shared weights. The channel-refined feature is .
2.2.2. Temporal Attention Module
The Temporal Attention Module (TAM) refines the feature representation by localizing salient temporal features that are crucial for the downstream decision-making process. We apply channel-wise average pooling () and max pooling () to produce temporal descriptors. These descriptors are concatenated and further processed by a convolution layer (with a kernel size of ) to derive the temporal attention map :
The final refined output is obtained by element-wise multiplication: .
2.3. Bidirectional Long Short-Term Memory Networks
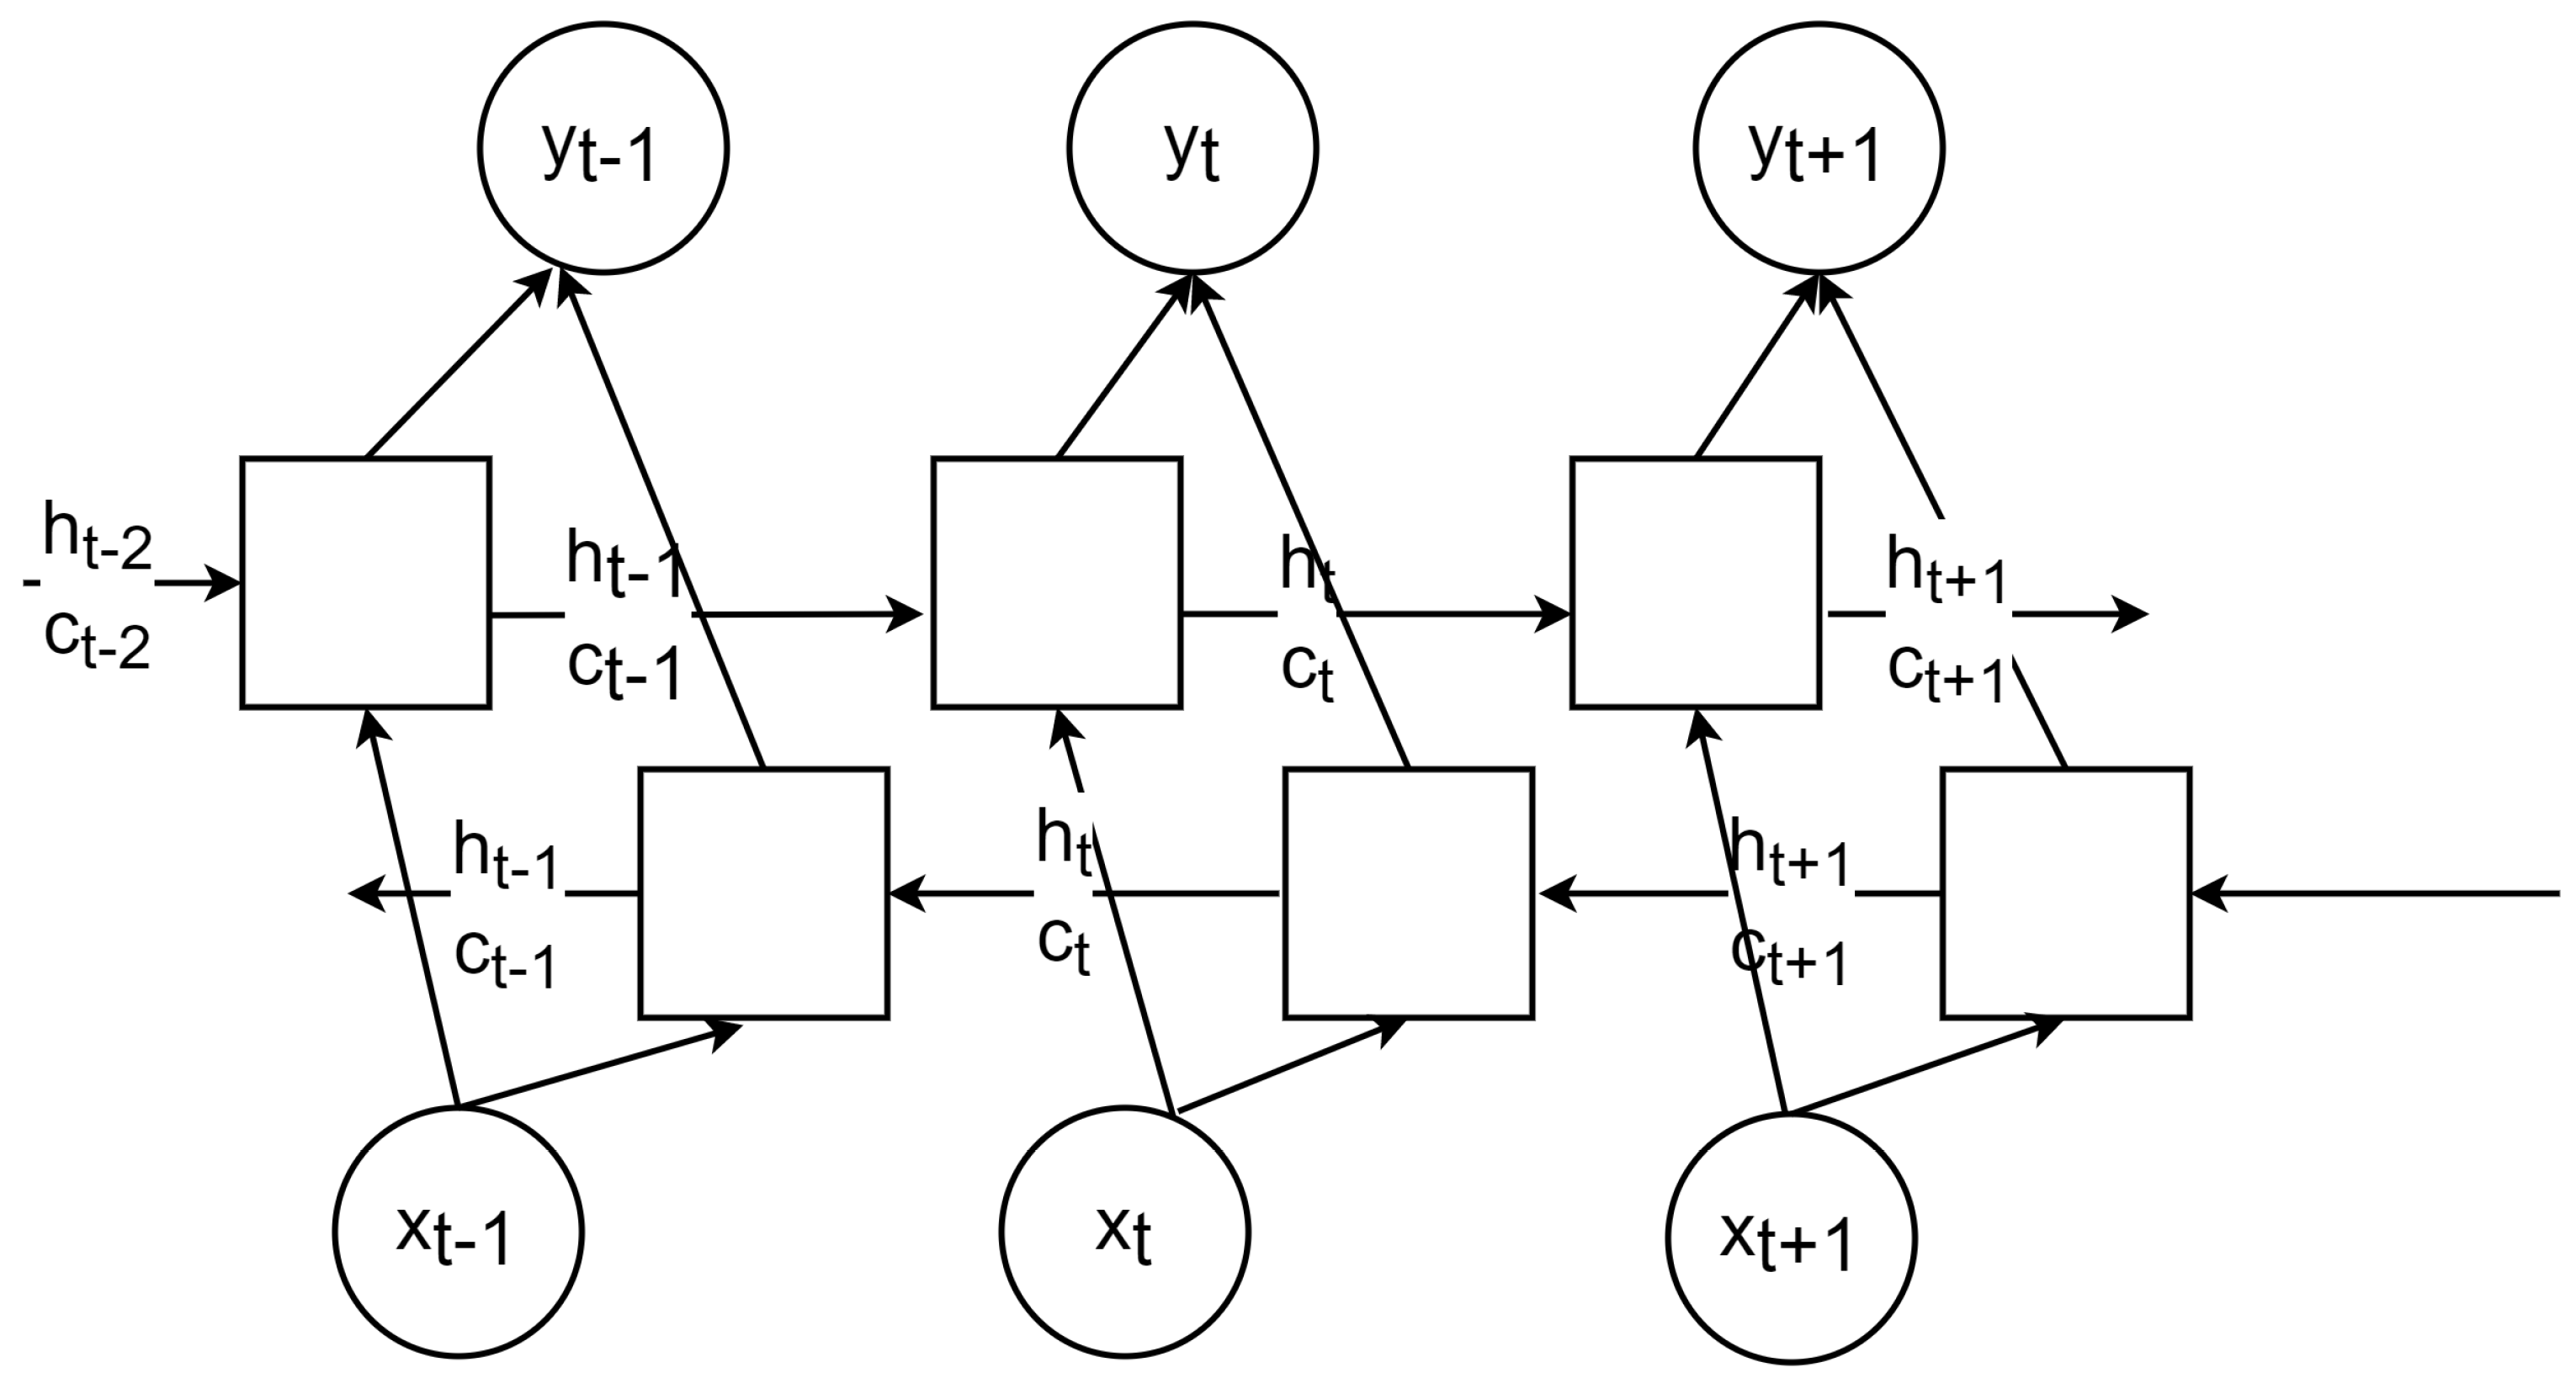
The Bidirectional Long Short-Term Memory (BiLSTM) network [30] enhances sequence modeling by processing data in both forward and reverse directions. Unlike a standard LSTM, this design captures both past and future contexts, significantly improving the representation of long-range dependencies in complex temporal data. The core LSTM unit at time step t processes input via the following transition equations:
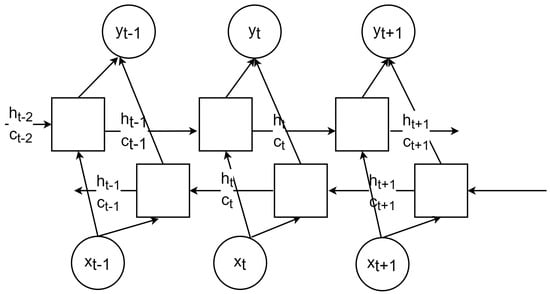
where represent the forget, input, and output gates, respectively. denotes the cell state, and is the hidden state. is the sigmoid function, and ⊙ represents element-wise multiplication. The final BiLSTM representation is obtained by concatenating the forward and backward hidden states: , where incorporates historical information and captures future context. Therefore, the concatenated vector provides a comprehensive bidirectional representation of the financial time series, as illustrated in Figure 1.
Figure 1.
Bidirectional Long Short-Term Memory.
2.4. RoBERTa-wwm-ext
To encode unstructured financial text, we adopt the RoBERTa-wwm-ext model [31], an optimized BERT variant designed for the Chinese language. Its core innovation is the Whole Word Masking (wwm) strategy, which masks complete meaningful units instead of individual characters. This constraint compels the model to infer meanings from broader bidirectional contexts rather than memorizing local character collocations. The prediction probability for a masked token is defined as:
where and denote the projection matrix and the hidden state of the masked token, respectively. Additionally, RoBERTa-wwm-ext enhances generalization by eliminating the Next Sentence Prediction (NSP) task and pre-training on extended corpora, ensuring robust coverage of domain-specific financial vocabulary.
2.5. Double Deep Q-Network (DDQN)
Deep Q-Networks (DQN) inherently suffer from overestimation bias because the maximization operator uses the same network for both action selection and evaluation:
To mitigate this, we employ the Double Deep Q-Network (DDQN) [32], which decouples these processes. The online network selects the greedy action, while the target network estimates its value. The target is formulated as:
This mechanism stabilizes training. Furthermore, we adopt the Huber loss (Smooth L1 Loss) for optimization to enhance robustness against outliers in volatile financial data.
3. CBAM-BiLSTM-DDQN Model
This section outlines our proposed model framework, which is composed of three primary components: multi-source feature construction, feature selection, and deep reinforcement learning for trade execution.
First, our feature engineering process involves two main types of data: numerical price series and unstructured textual data. Specifically, we apply adaptive VMD to the closing price to decompose it into distinct modes, effectively separating the underlying trend from high-frequency noise. Simultaneously, we construct a comprehensive set of technical indicators to capture market dynamics across dimensions such as trend, momentum, and volatility. Additionally, for the textual data, we employ a transfer learning strategy where a BERT-based sentiment classification model is trained on a small set of labeled financial comments. This model is then used to classify all posts, allowing us to create a sentiment index from the total count of positive and negative market views.
Second, we establish a high-dimensional feature pool by integrating raw market metrics, decomposed intrinsic modes, technical indicators, and textual sentiment indices. To address the curse of dimensionality and eliminate redundancy, we use a wrapper-based feature selection method. This method combines Genetic Algorithms (GAs) with deep learning prediction to find the most valuable features. These selected features are then passed to the reinforcement learning agent for the final decision-making stage.
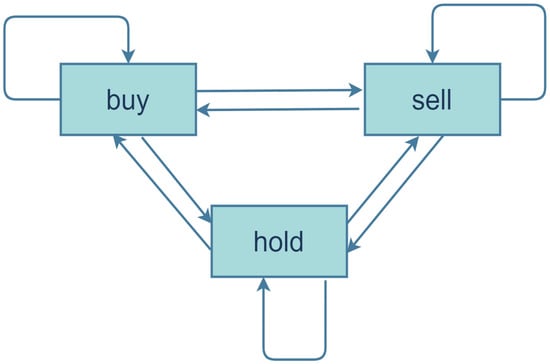
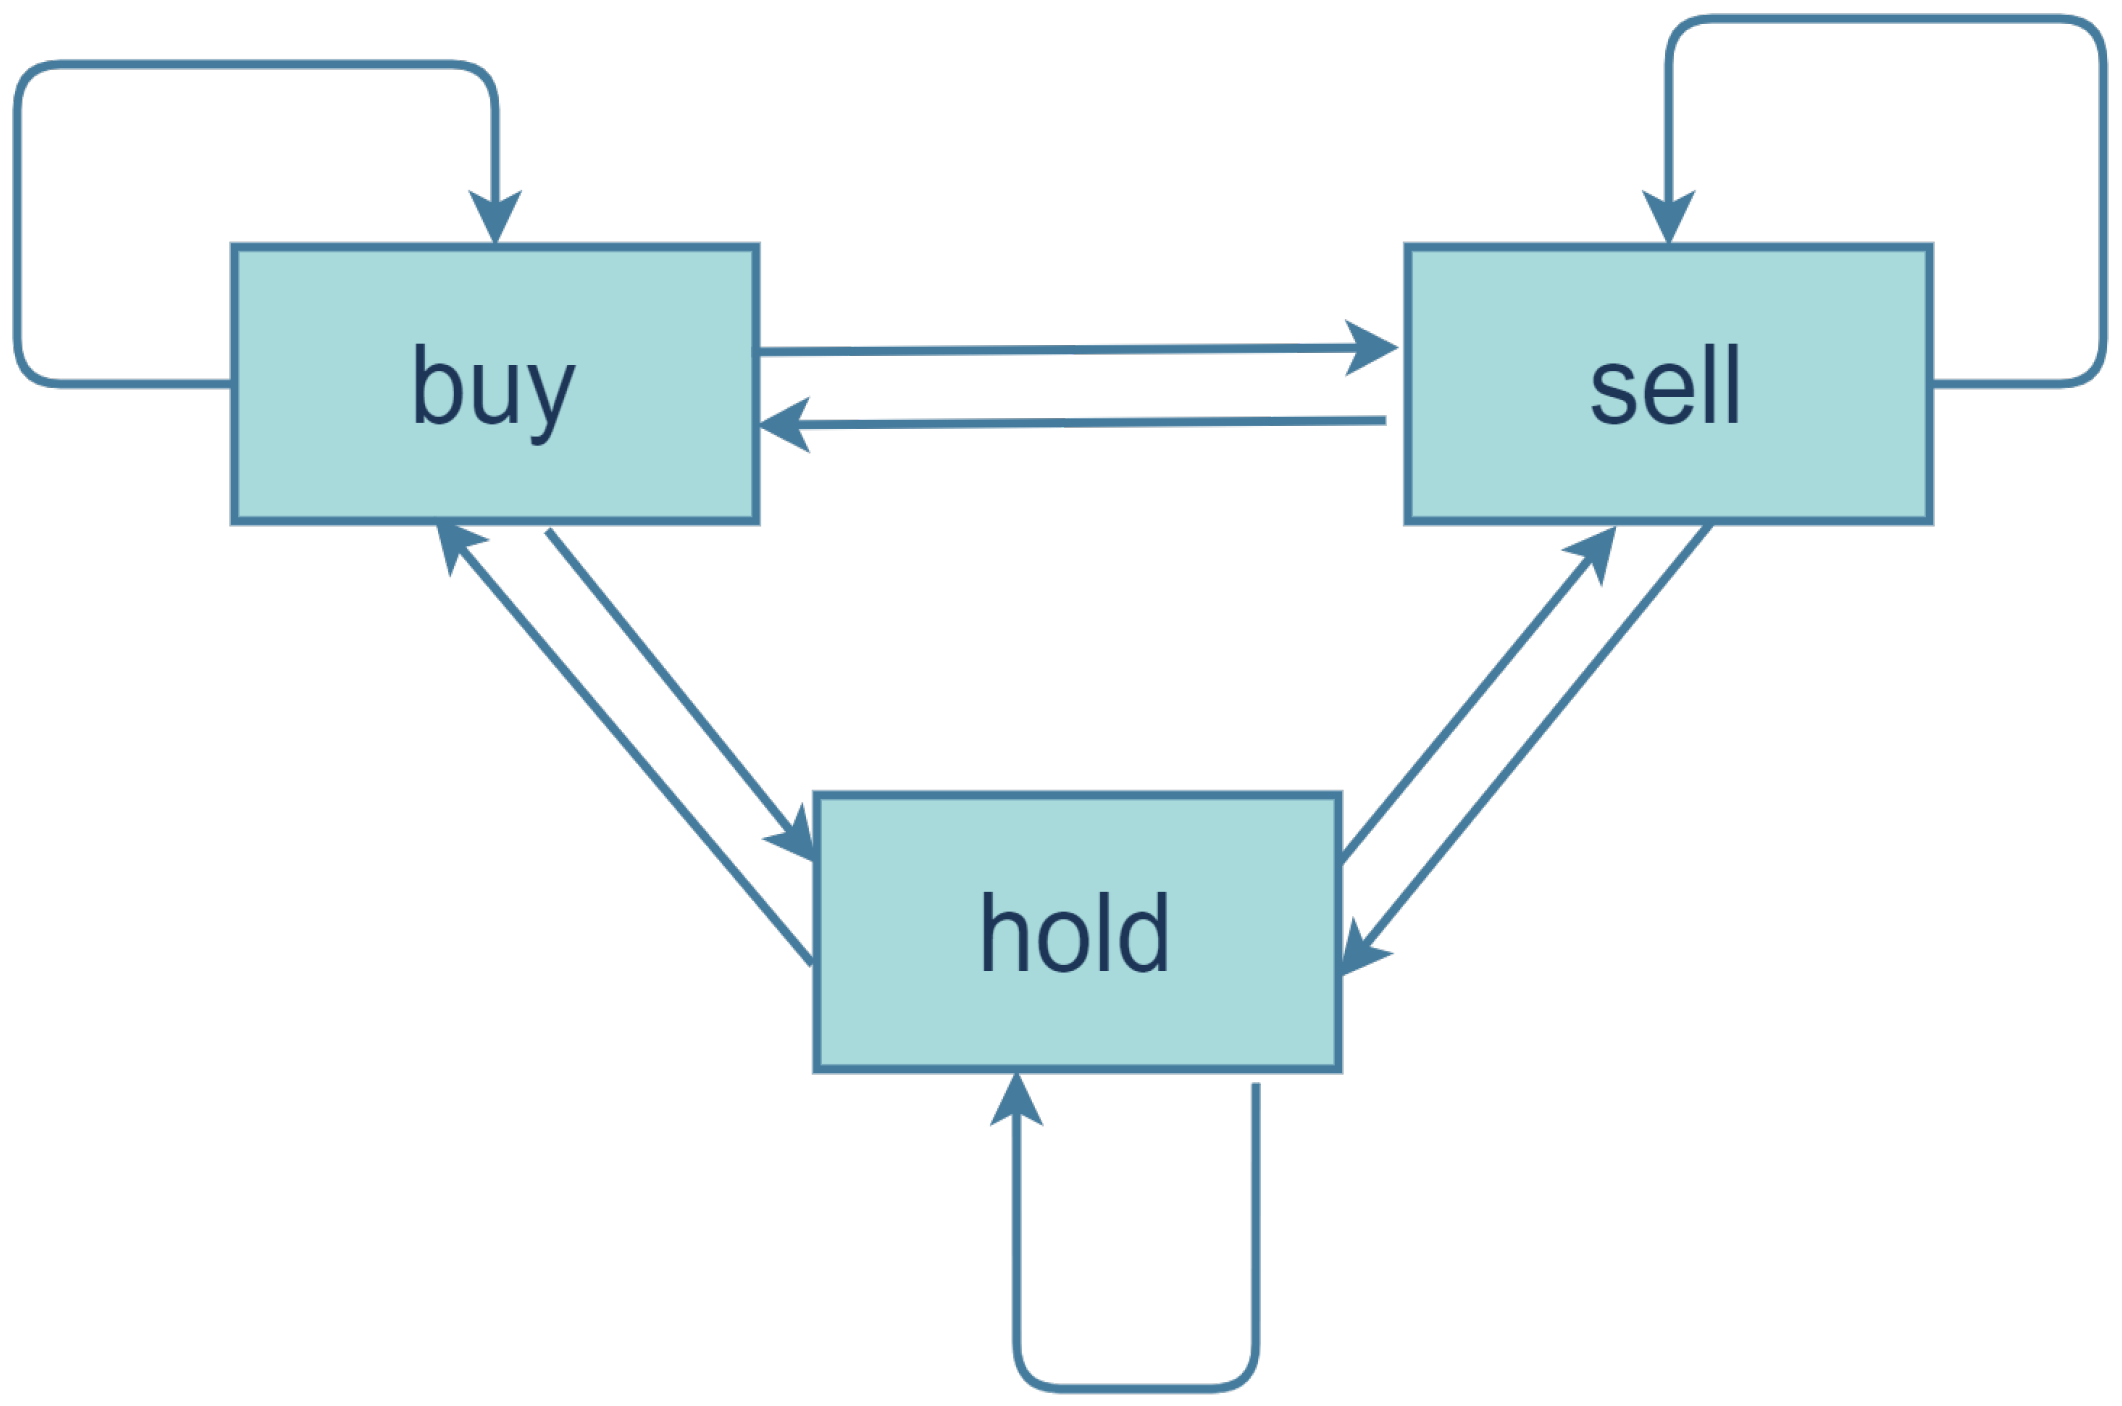
Finally, we utilize the deep reinforcement learning module for trade execution. The state space is constructed from the optimized features, which integrate market fundamentals, decomposed trends, and sentiment signals for a comprehensive market view. The action space consists of 21 discrete values from −1.0 to 1.0, where each value represents a specific proportion for buying or selling, as shown in Figure 2. This allows the model to perform finer adjustments rather than being restricted to “all-in” or “all-out” decisions. The reward function is the logarithmic rate of return, directly aligning the agent’s goal with maximizing profits. Within this module, our CBAM-BiLSTM-DDQN framework processes the sequential state data by using CBAM layers to refine features and highlight critical time steps. Stacked BiLSTM layers then model the temporal patterns within these enhanced features, enabling the agent to learn a superior policy for executing adaptive trading actions.
Figure 2.
State Transition Diagram of Trading Operations.
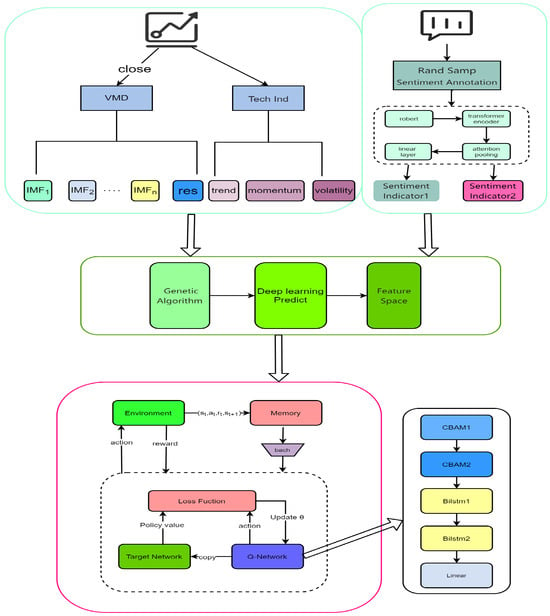
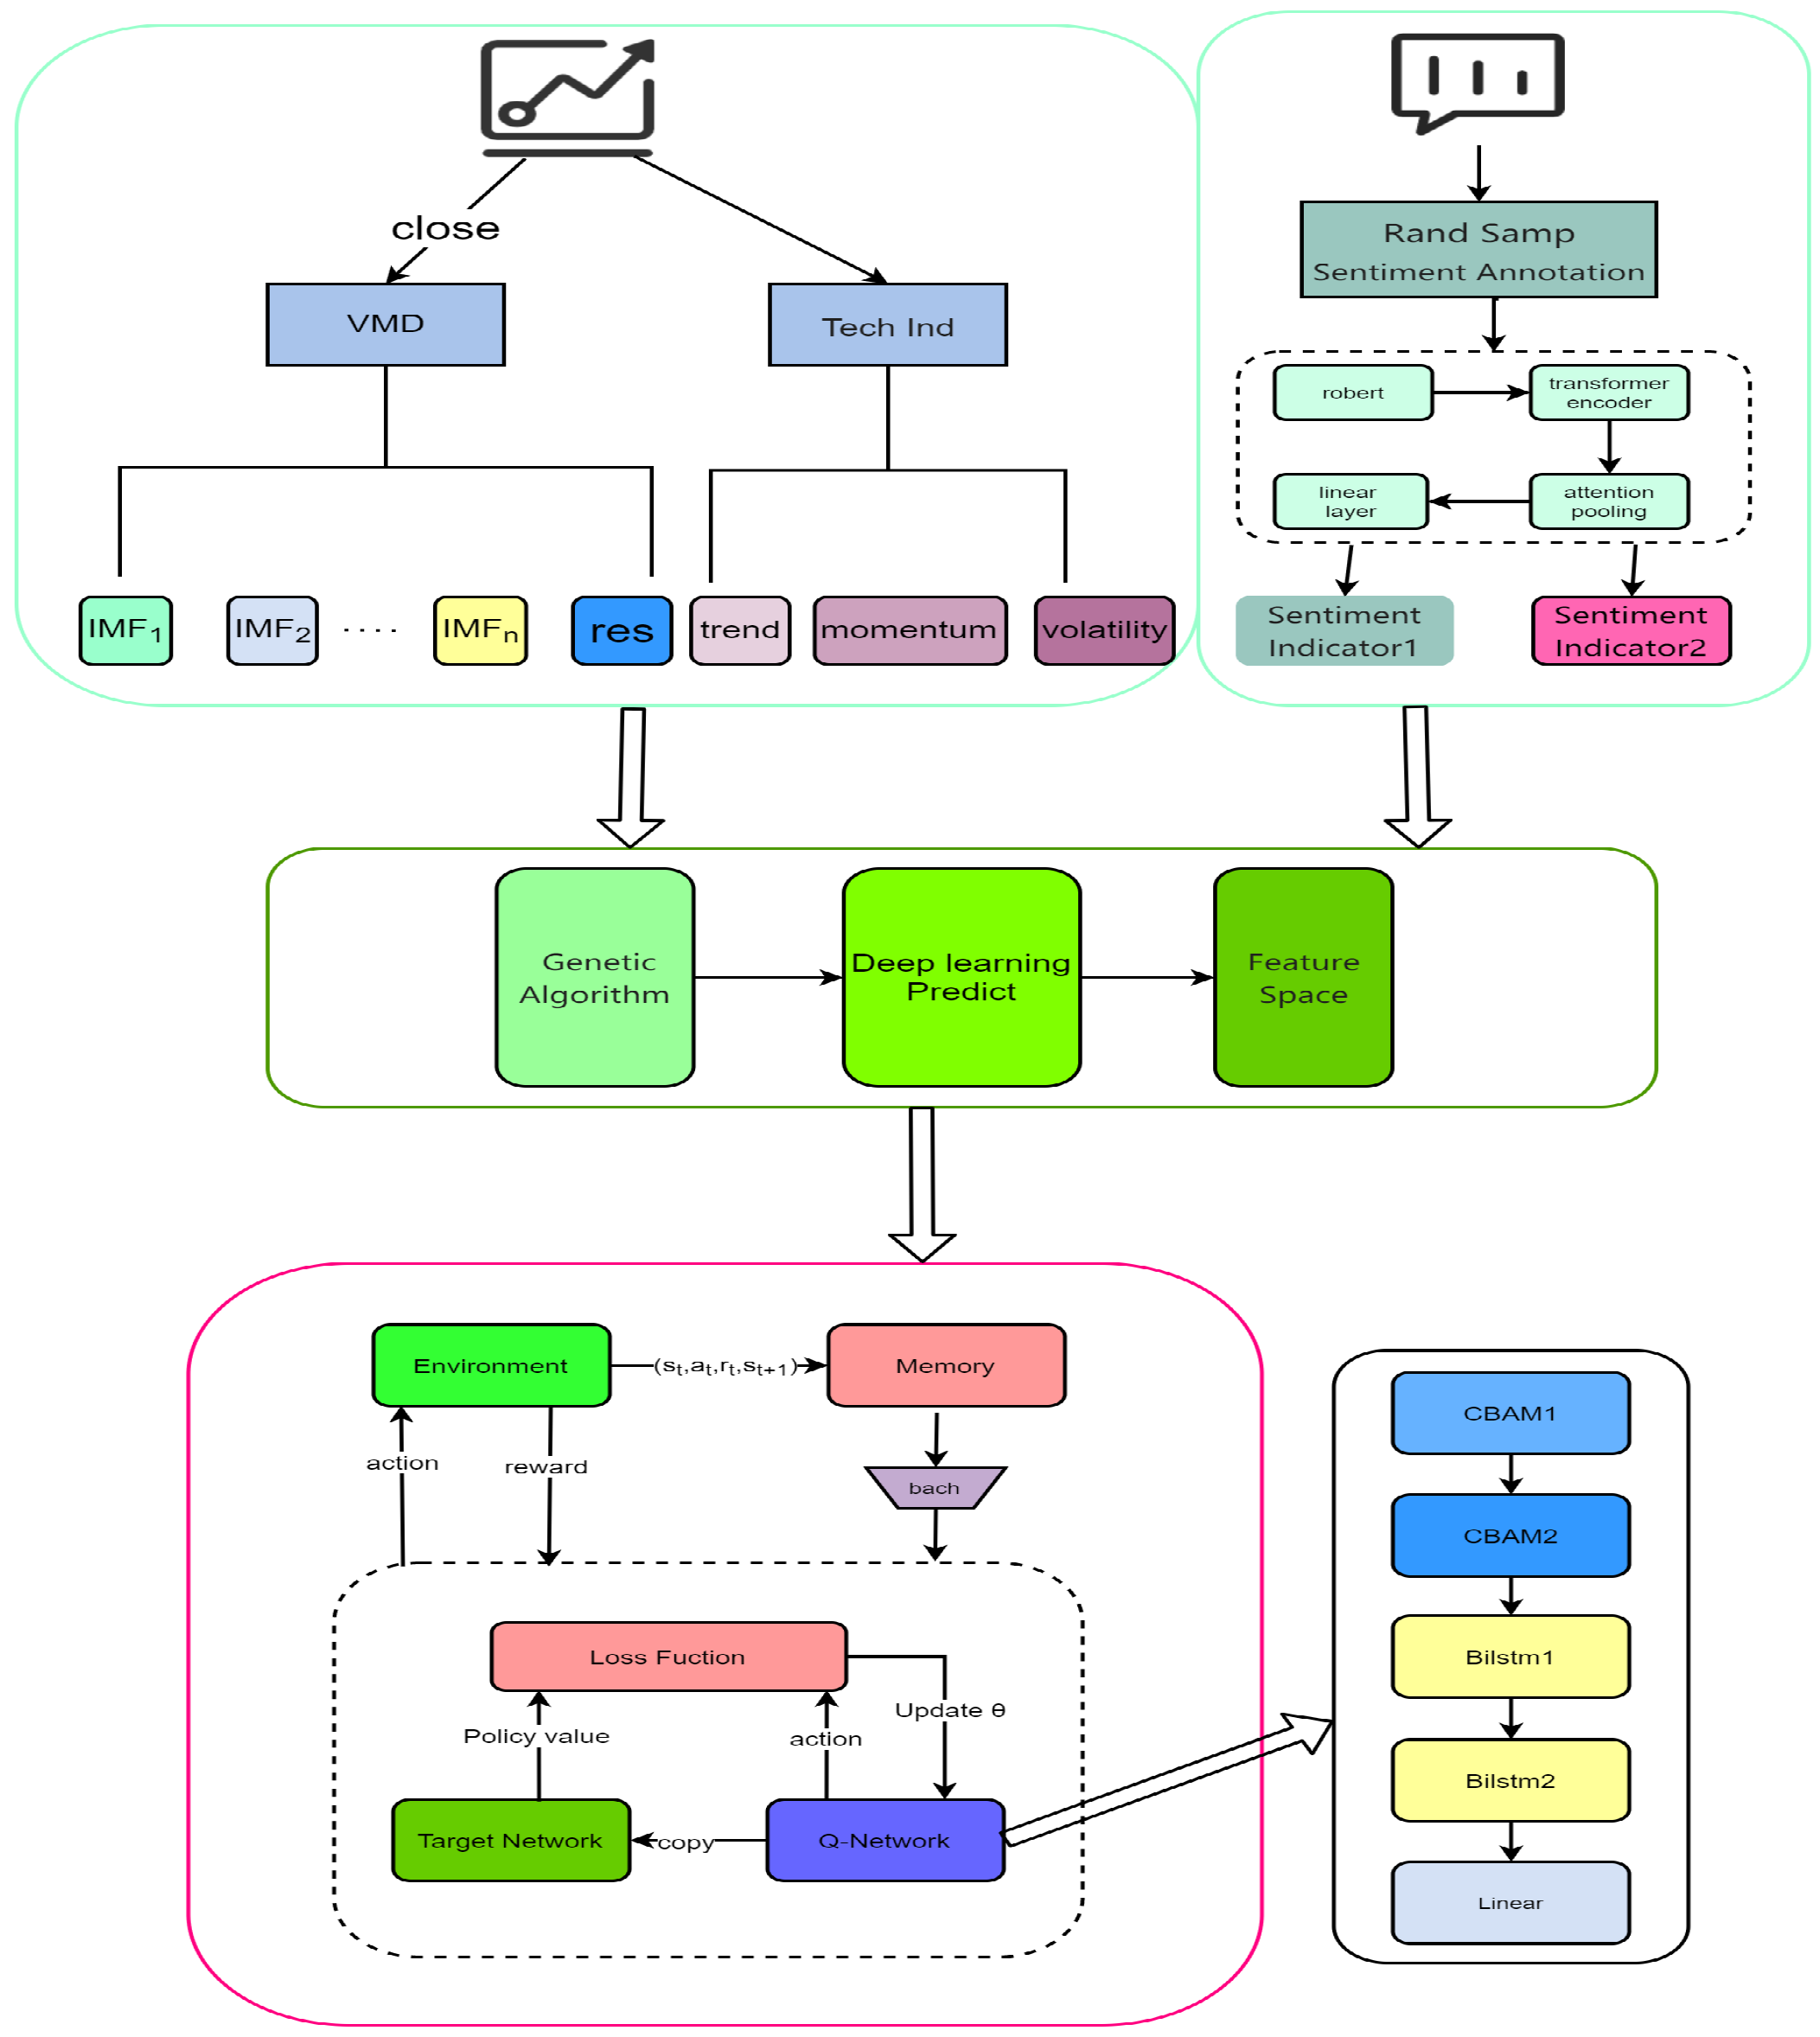
The overall structure of our proposed framework is depicted in Figure 3, consisting of three primary components arranged from top to bottom: multi-source feature construction, feature selection, and deep reinforcement learning for trade execution.
Figure 3.
CBAM-BiLSTM-DDQN Framework.
4. Stock Data Analysis
4.1. Stock Data Preprocessing
We selected raw daily data for the SSEC (8 October 2015–24 April 2025), SZSE (18 August 2015–16 June 2025), and CSI 300 (4 January 2016–17 November 2025) indices. The dataset includes variables such as date, opening price, highest price, lowest price, closing price, percentage change, and trading volume. All data were exported using the Eastmoney Choice Financial Terminal (https://choice.eastmoney.com/) (accessed on 6 February 2026). Table 1 presents the daily data we obtained from the Choice Financial Terminal. The specific training and testing periods are detailed in Table 2.
Table 1.
Daily Data from Choice Financial Terminal.
Table 2.
Data Split for Training and Testing Periods.
We utilize a set of technical indicators to capture various market characteristics, including trend, momentum, and volatility. The definitions and formulations are summarized in Table 3.
Table 3.
Technical Indicators.
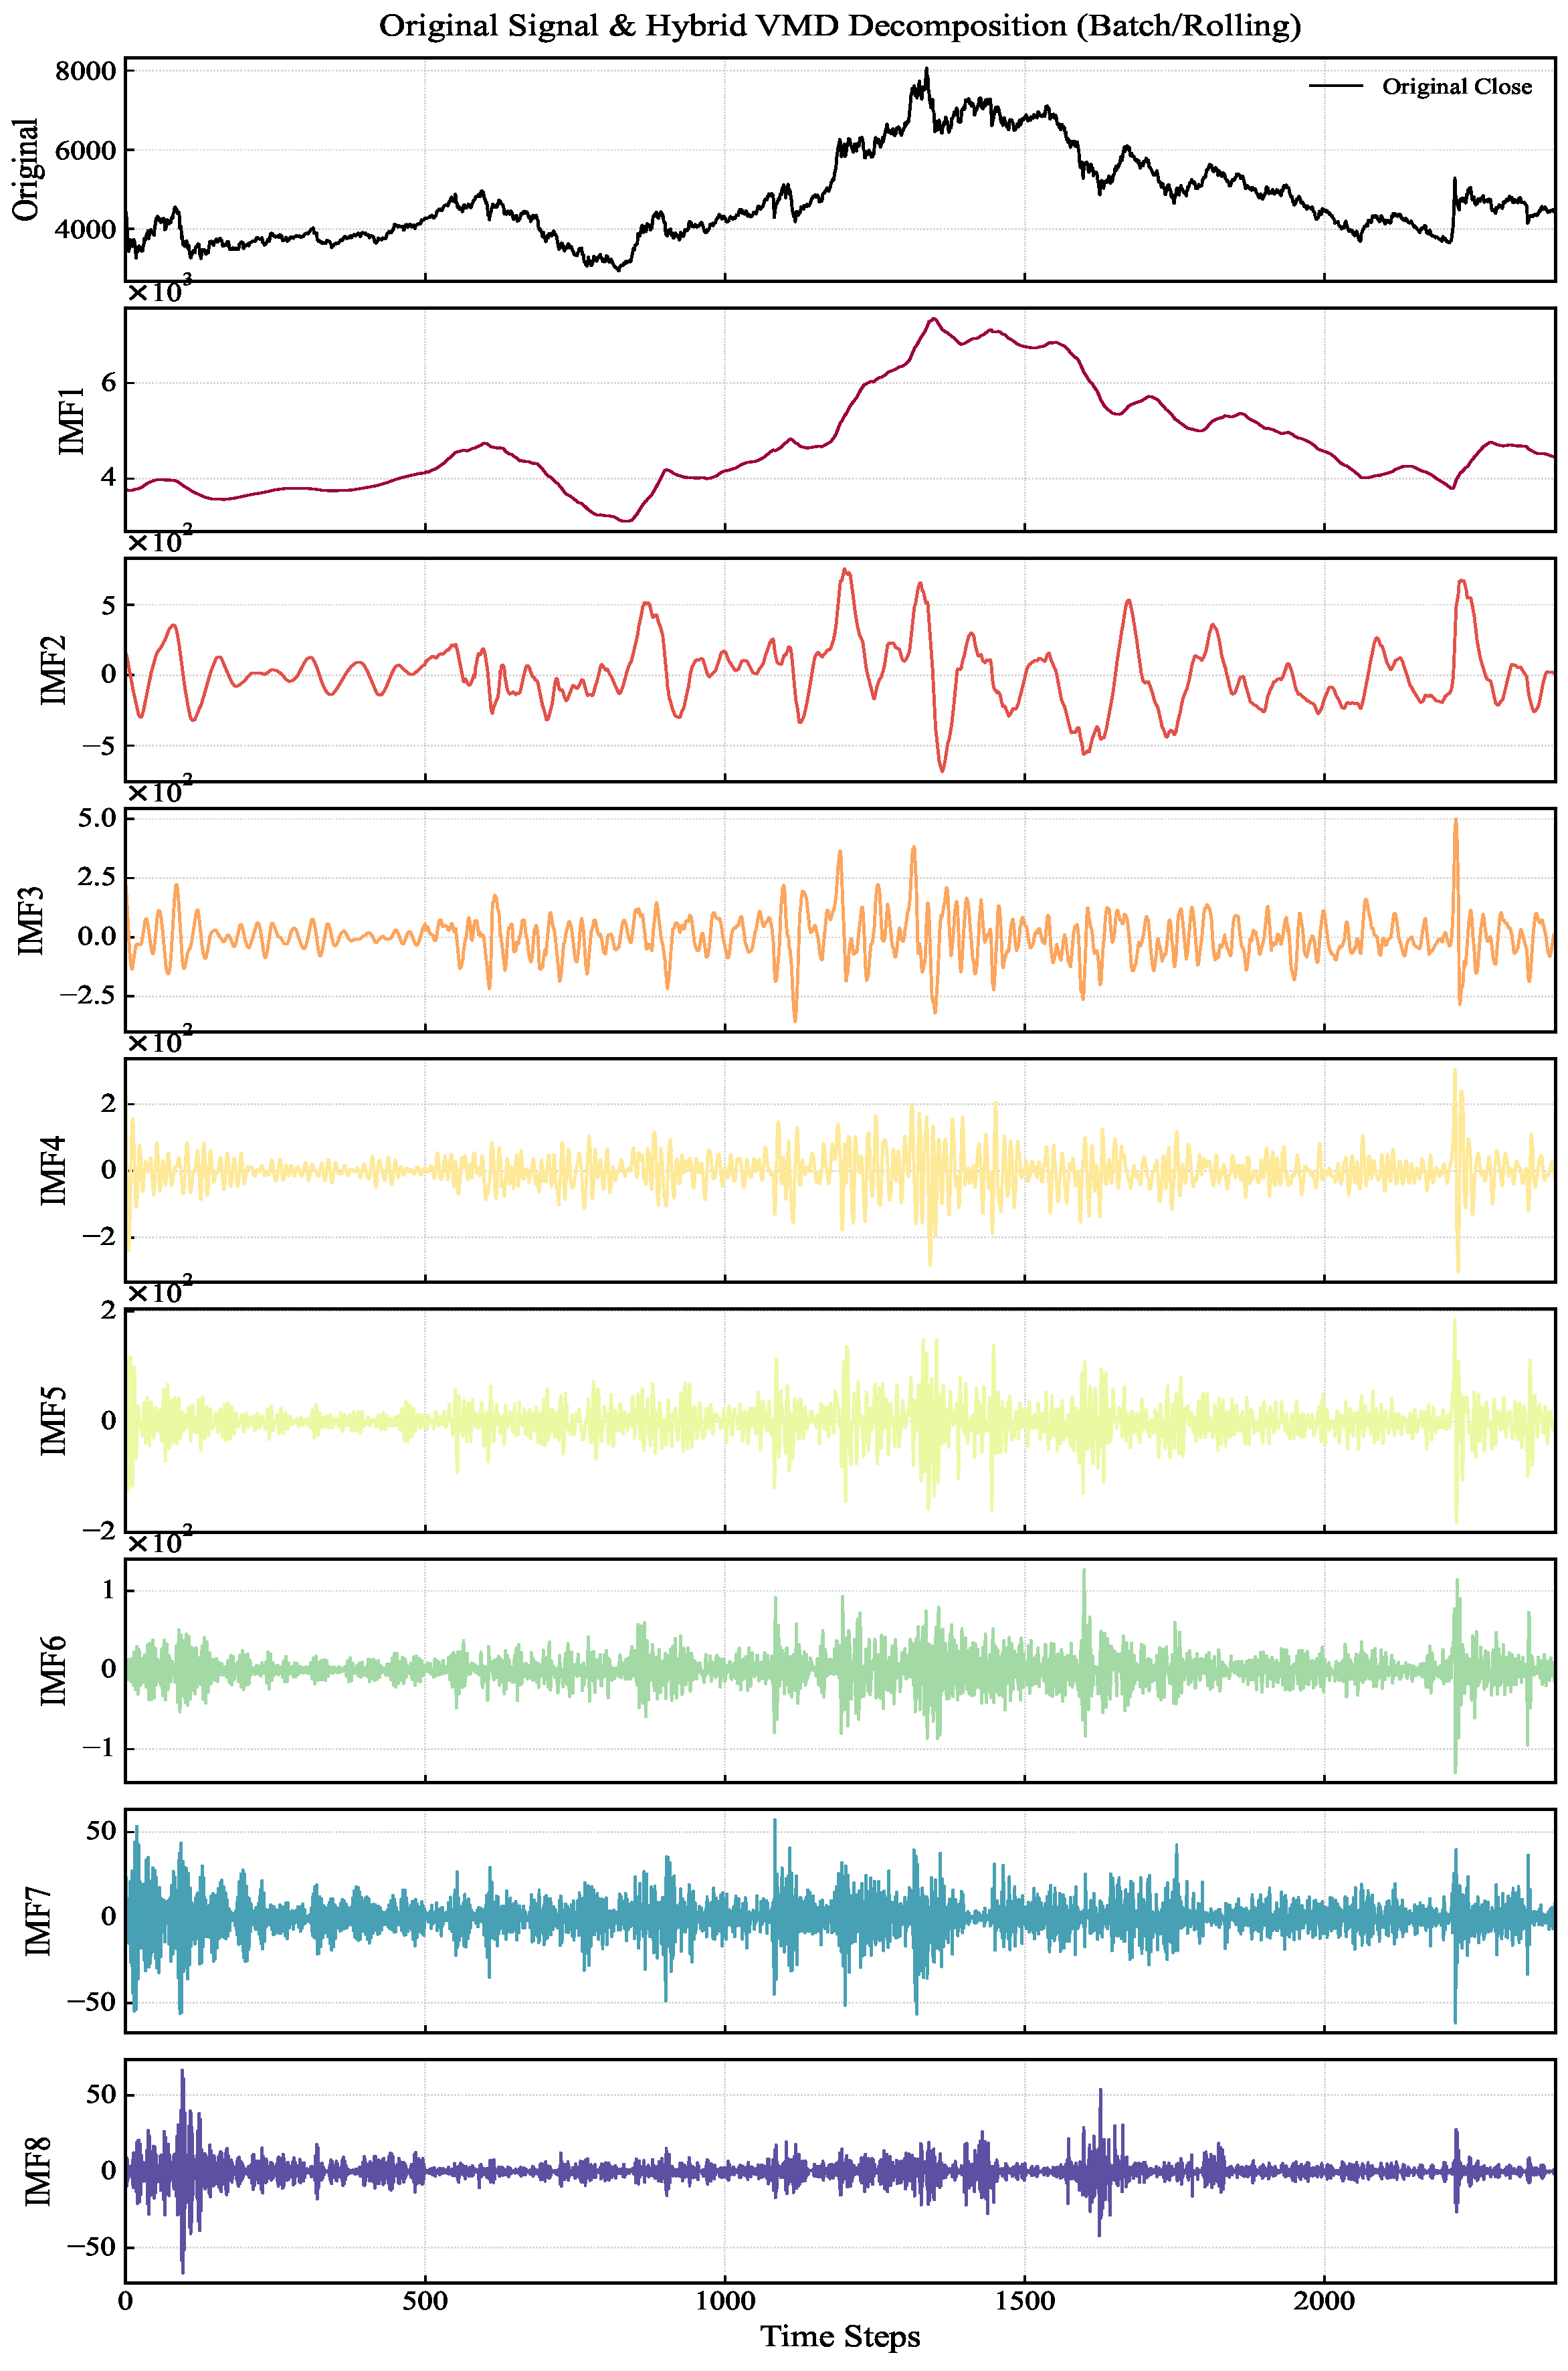
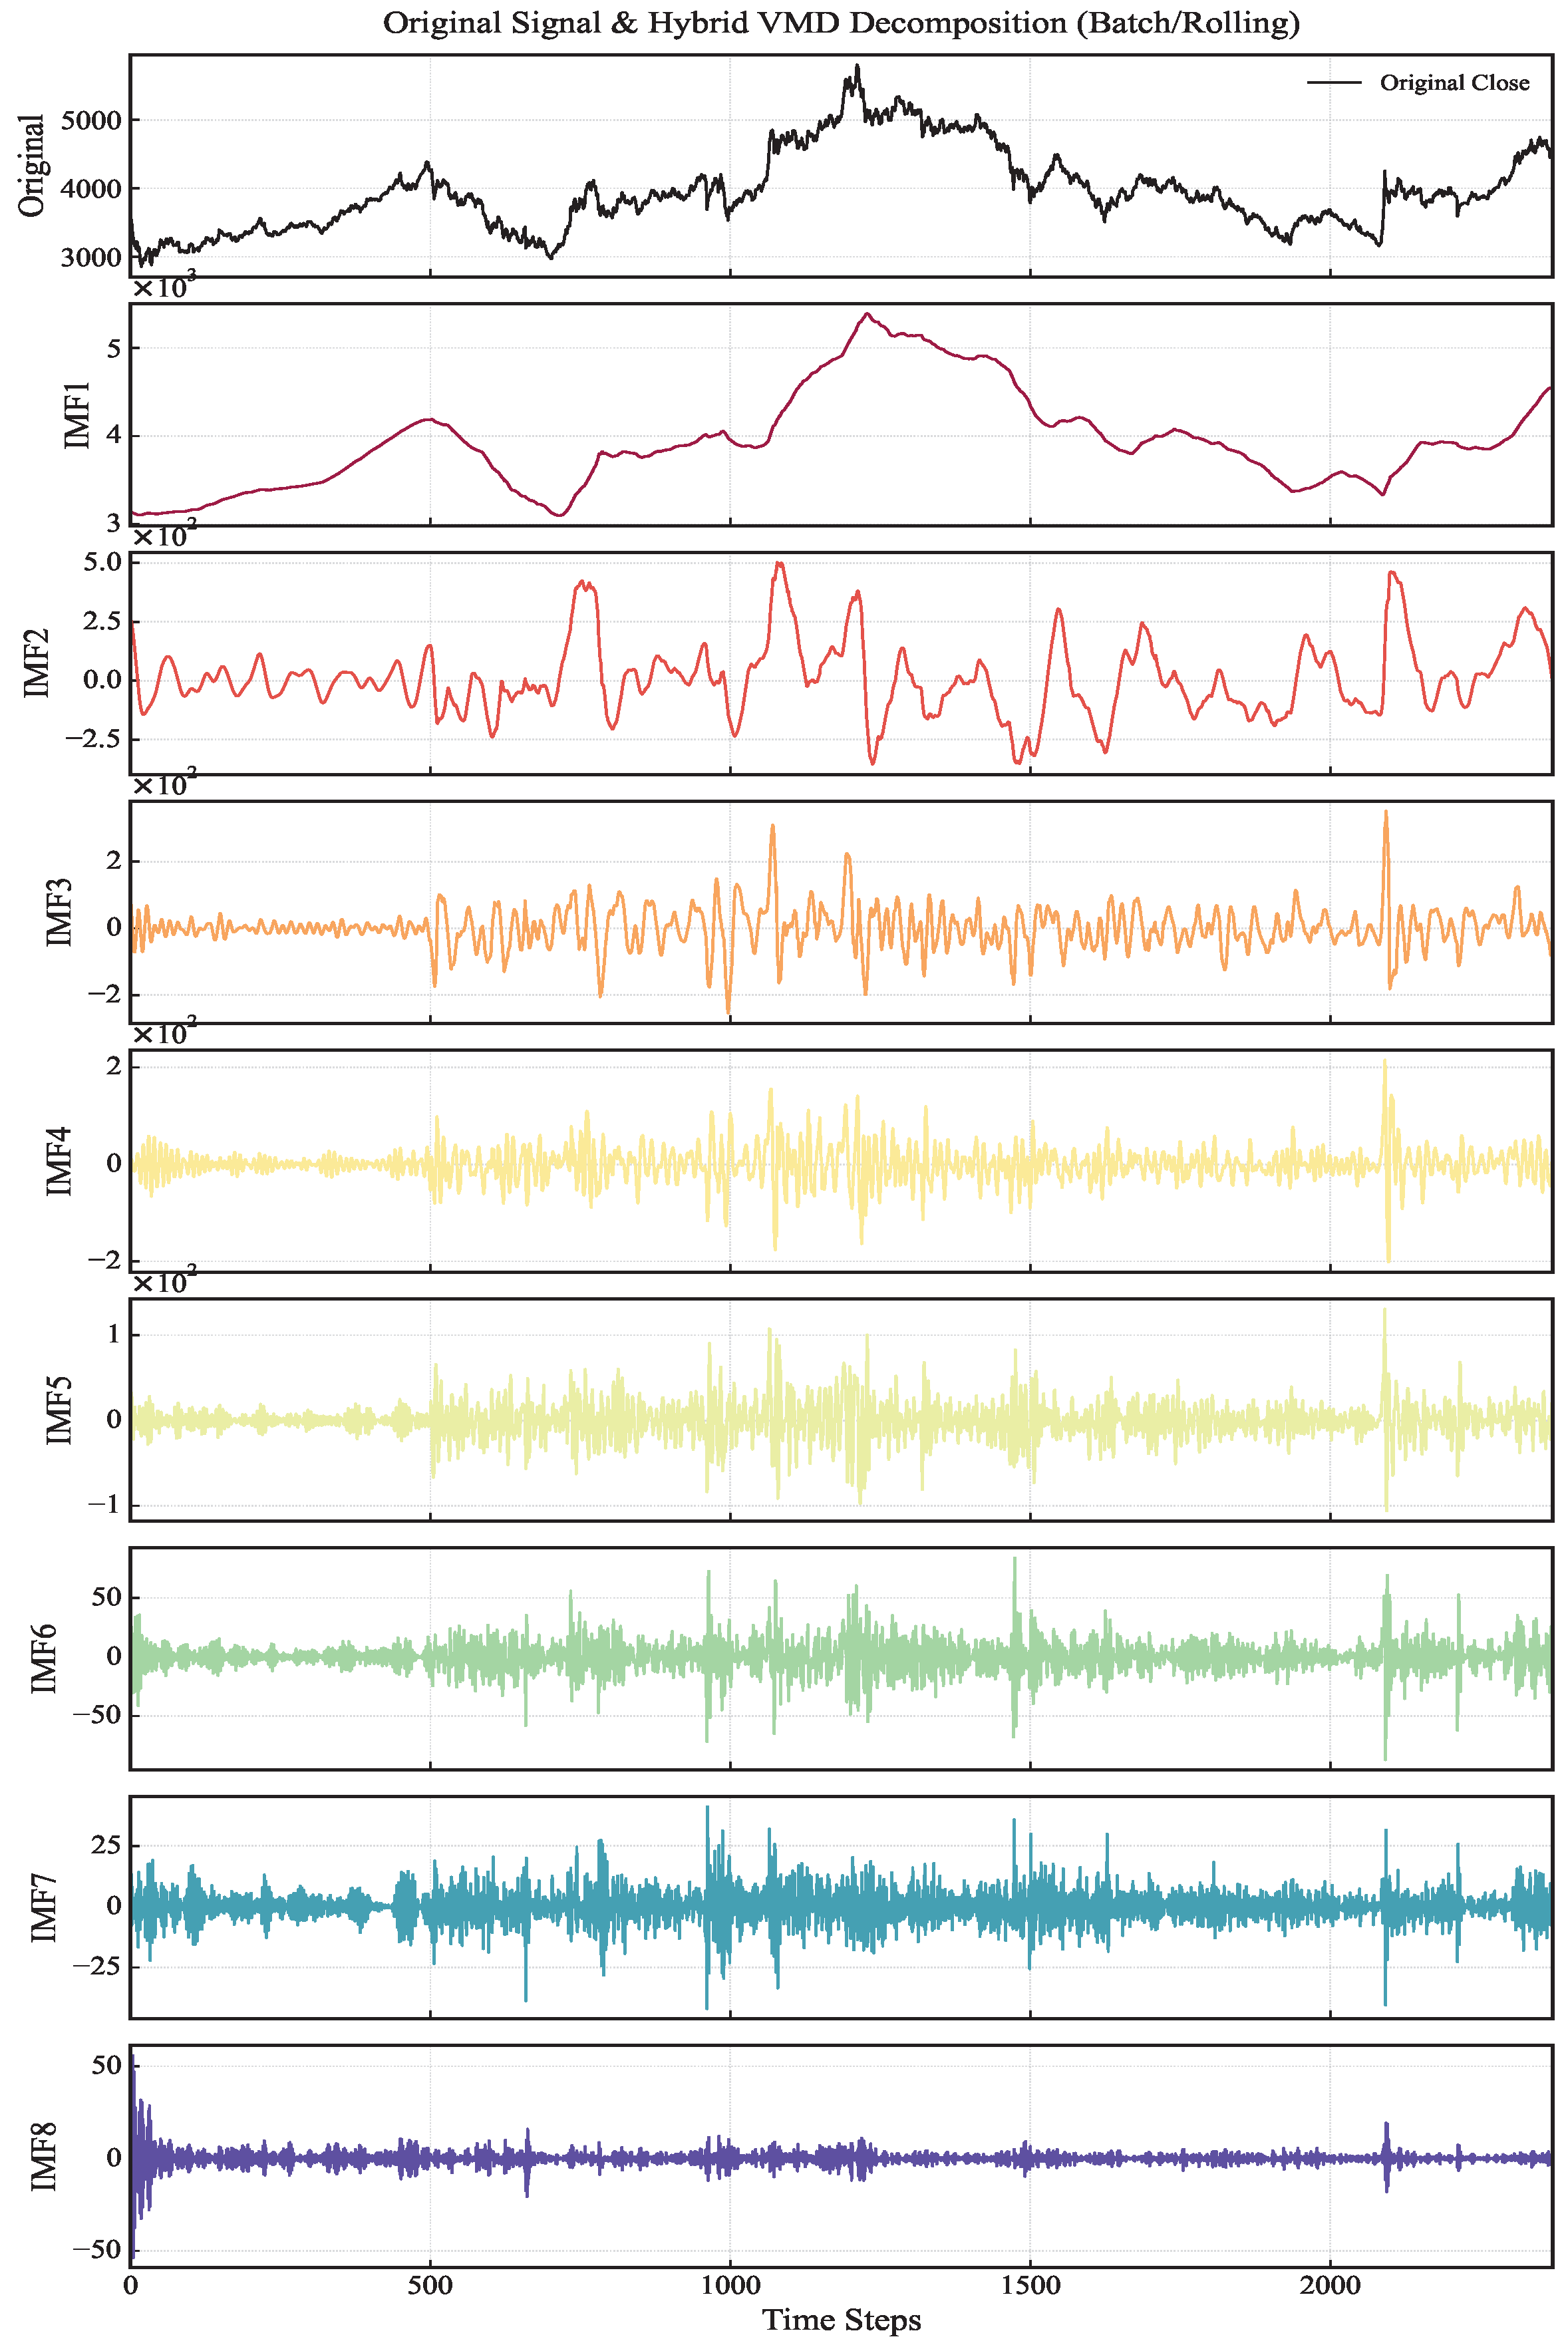
Following feature extraction, we apply VMD to the closing price series to decompose it into intrinsic modes. To achieve optimal signal decomposition, the Dung Beetle Optimizer (DBO) is employed to adjust the two critical hyperparameters: the number of modes (K) and the penalty factor (). The optimization search space is strictly defined with and . The fitness function minimizes a weighted sum () of five normalized metrics: Energy Entropy (EE), Correlation Coefficient (CC), Signal-to-Noise Ratio (SNR), Mean Squared Error (MSE), and Mode Overlap (MO), prioritizing signal fidelity and orthogonality. We employ the DBO algorithm to identify the optimal parameters based solely on training data. The resulting optimal parameters are applied to the VMD process, and both the training and test sets are subjected to rolling decomposition with a window size of 500 days.
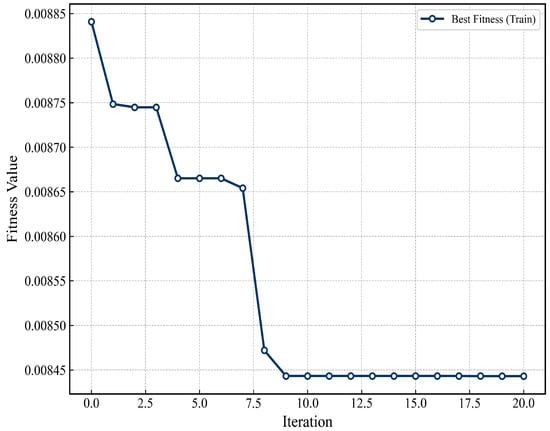
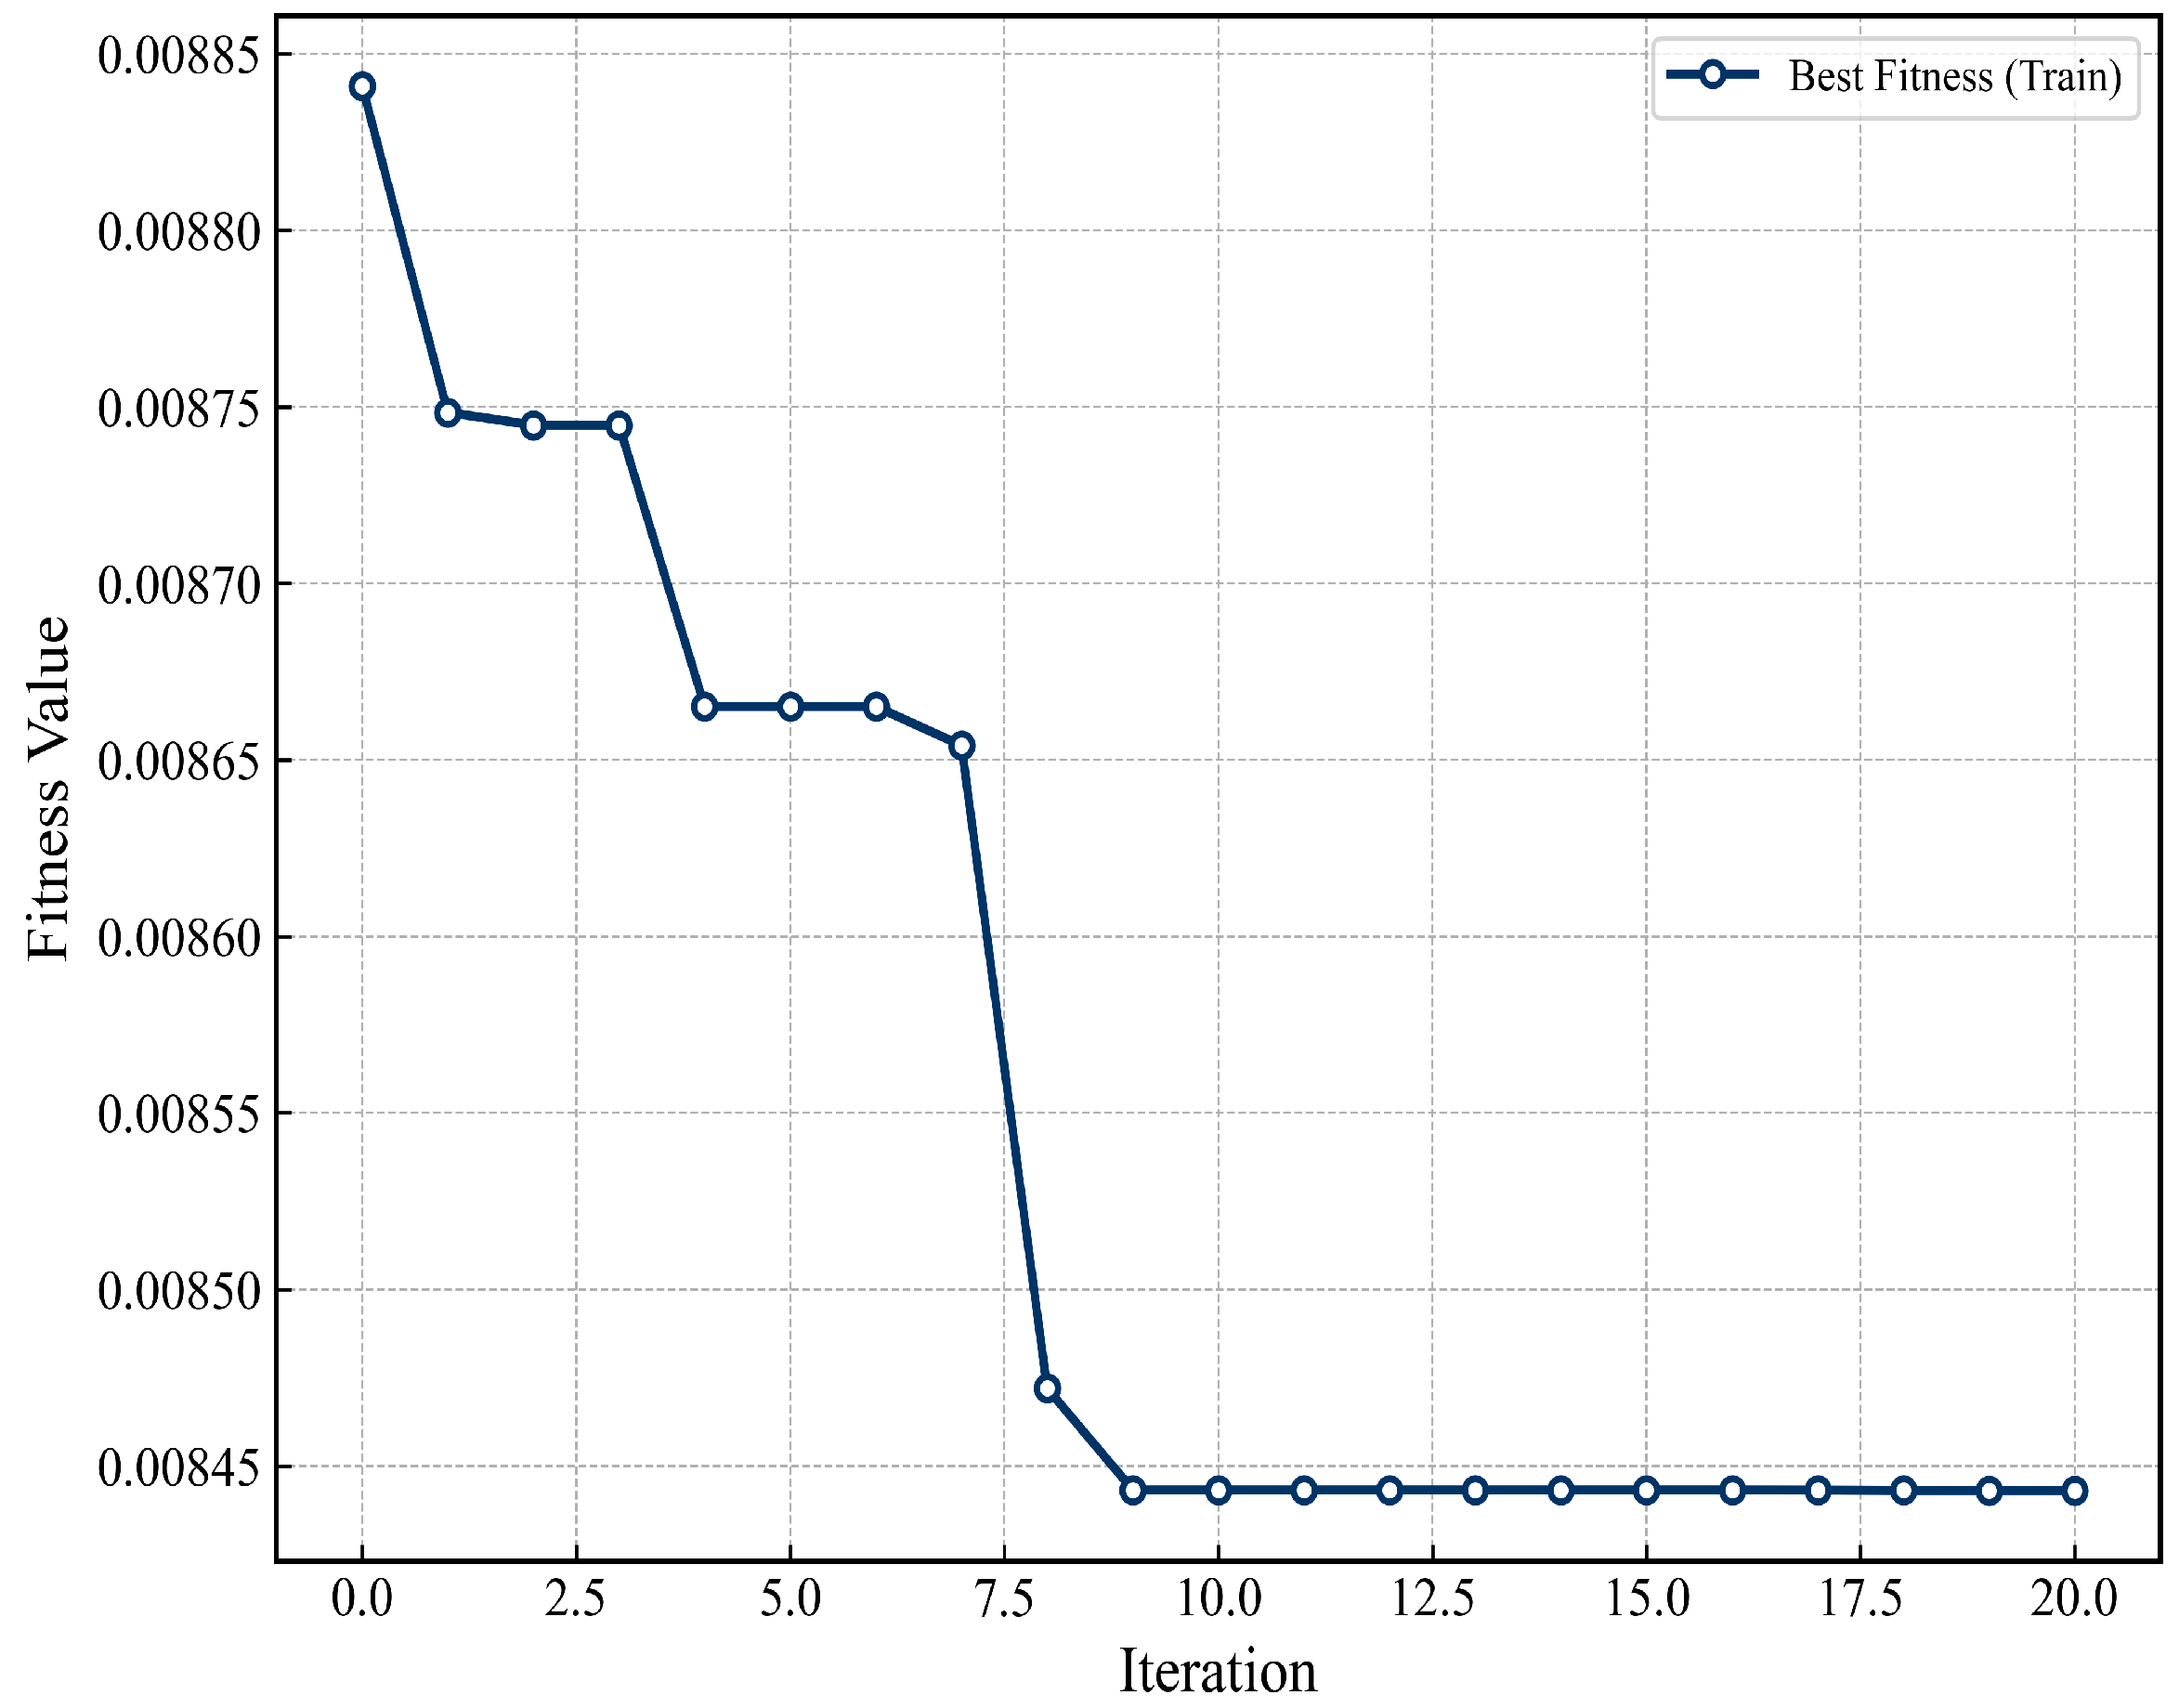
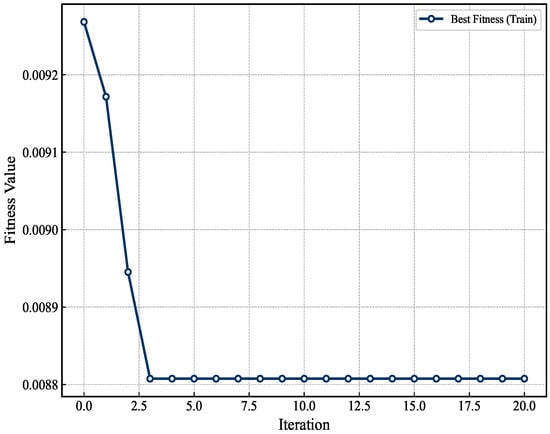
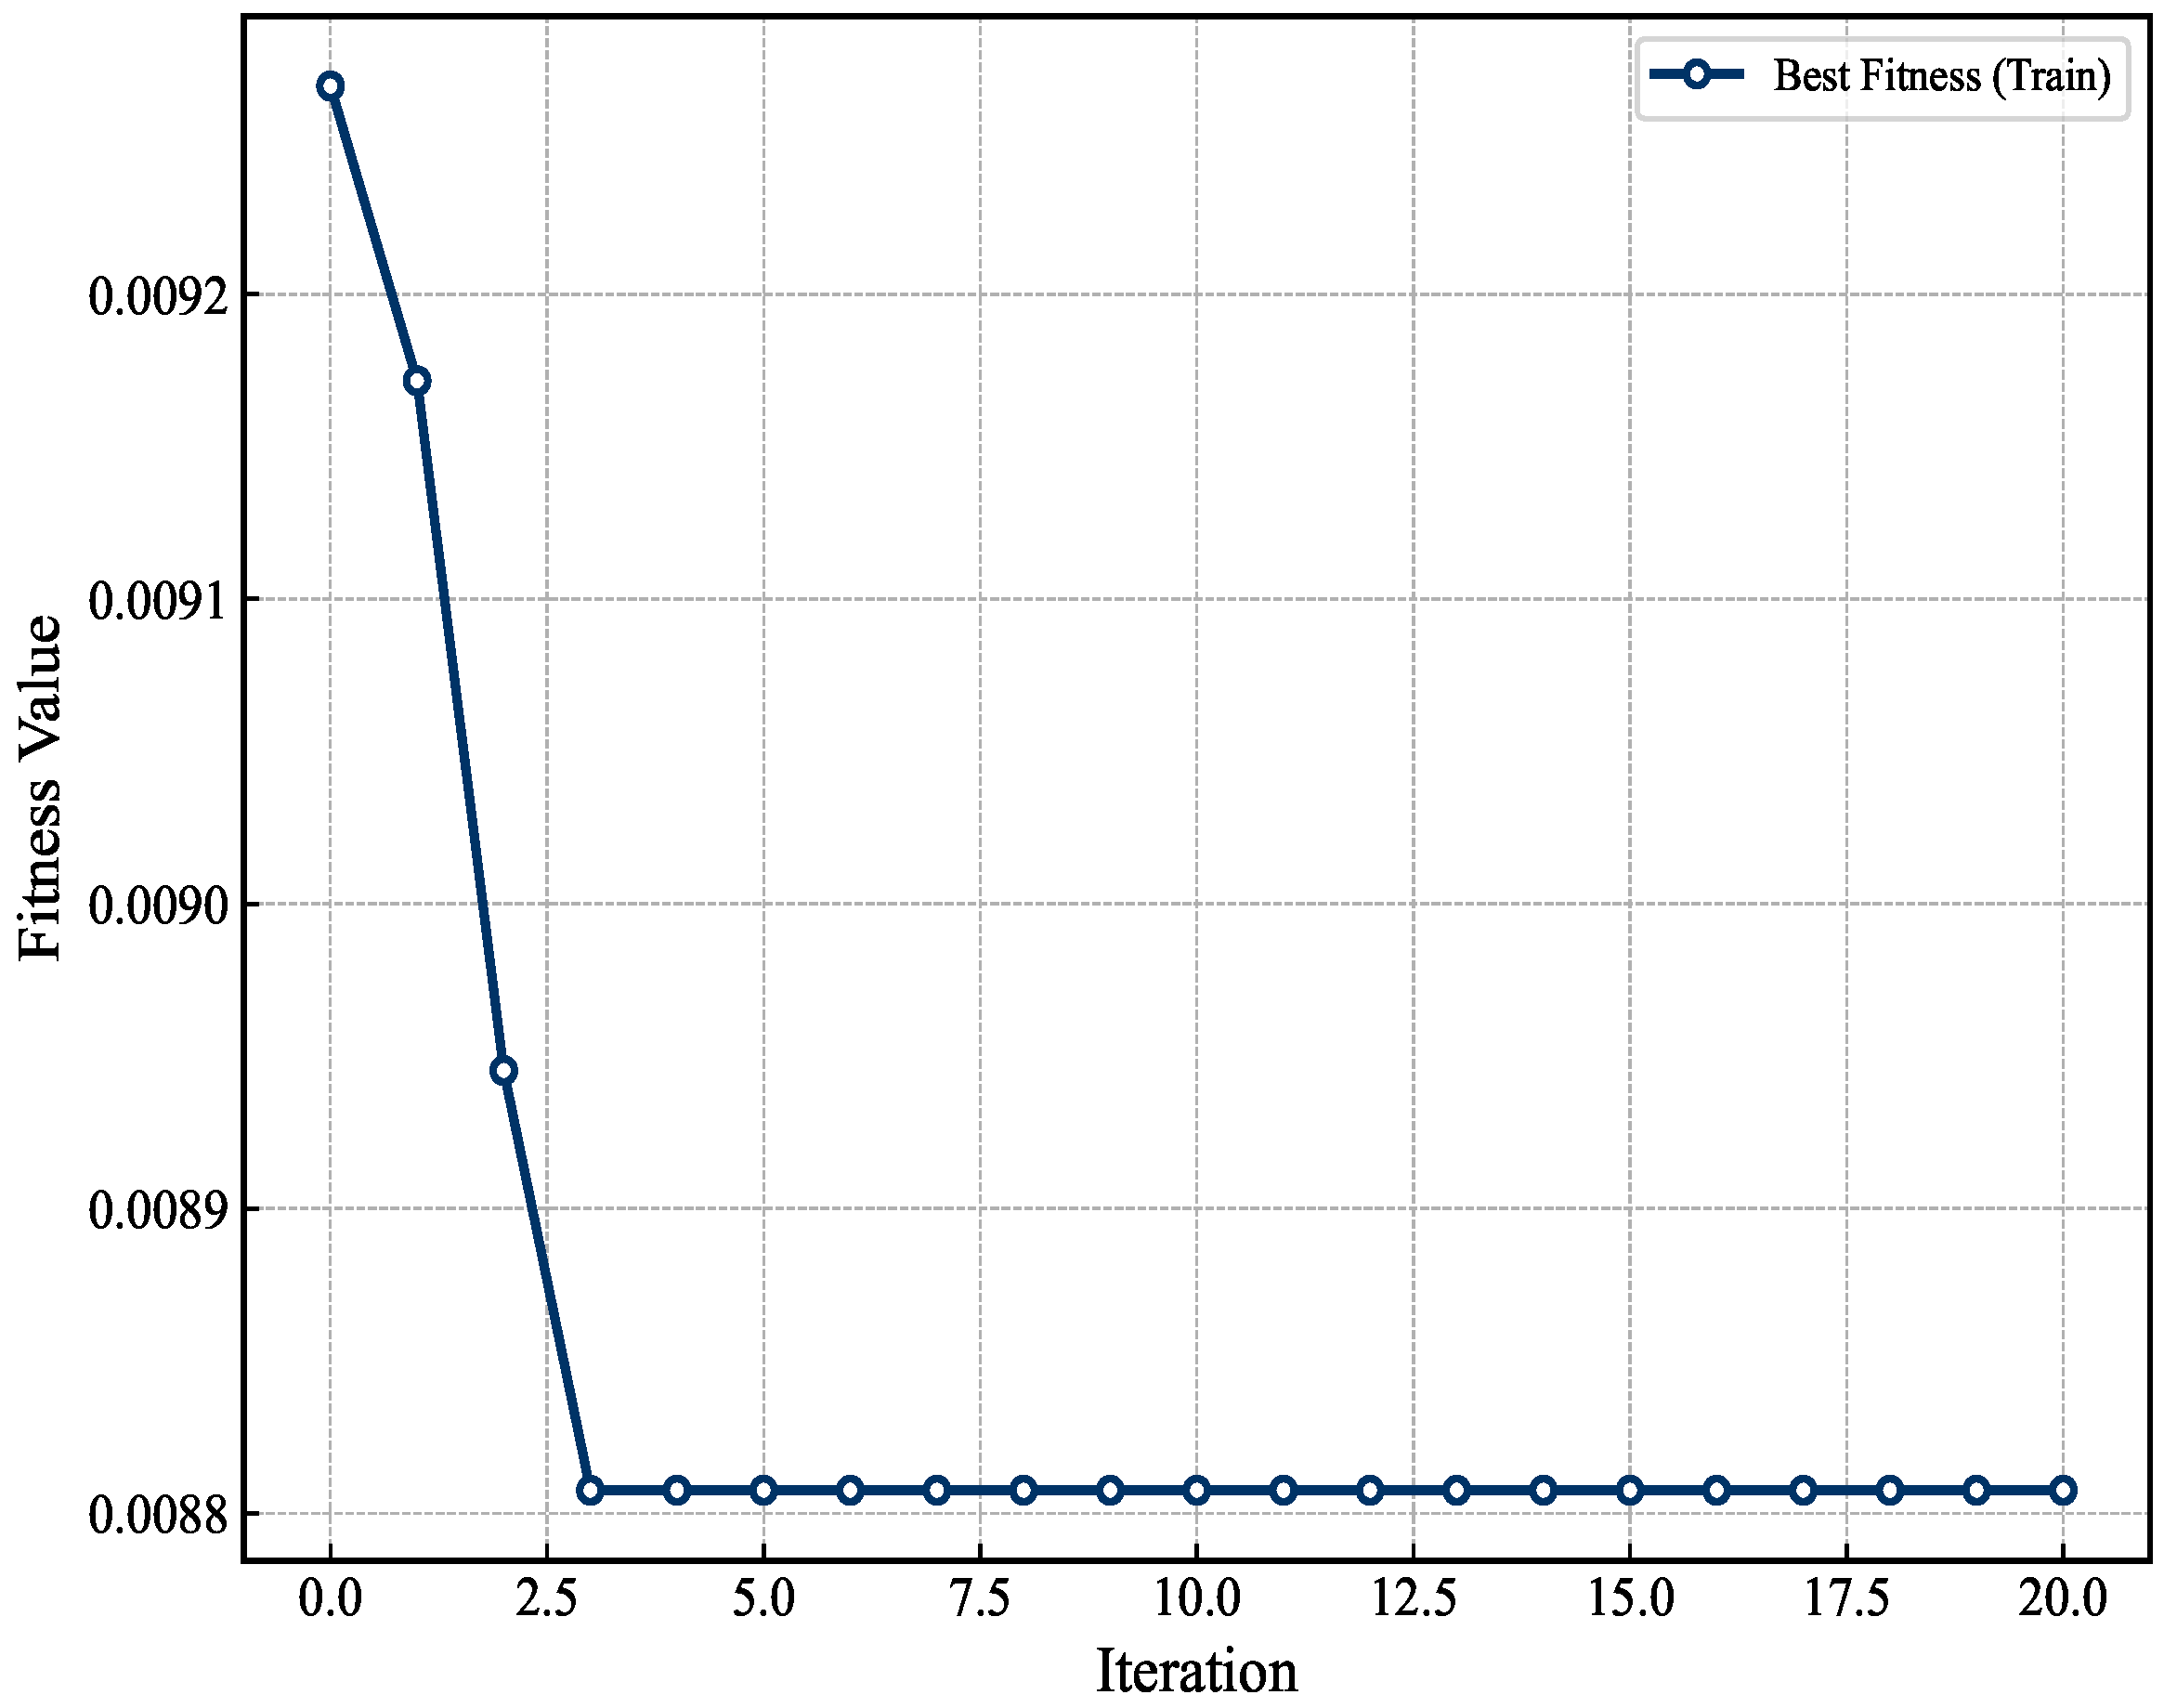
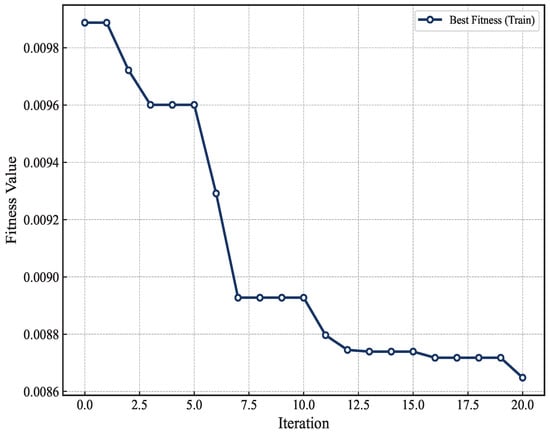
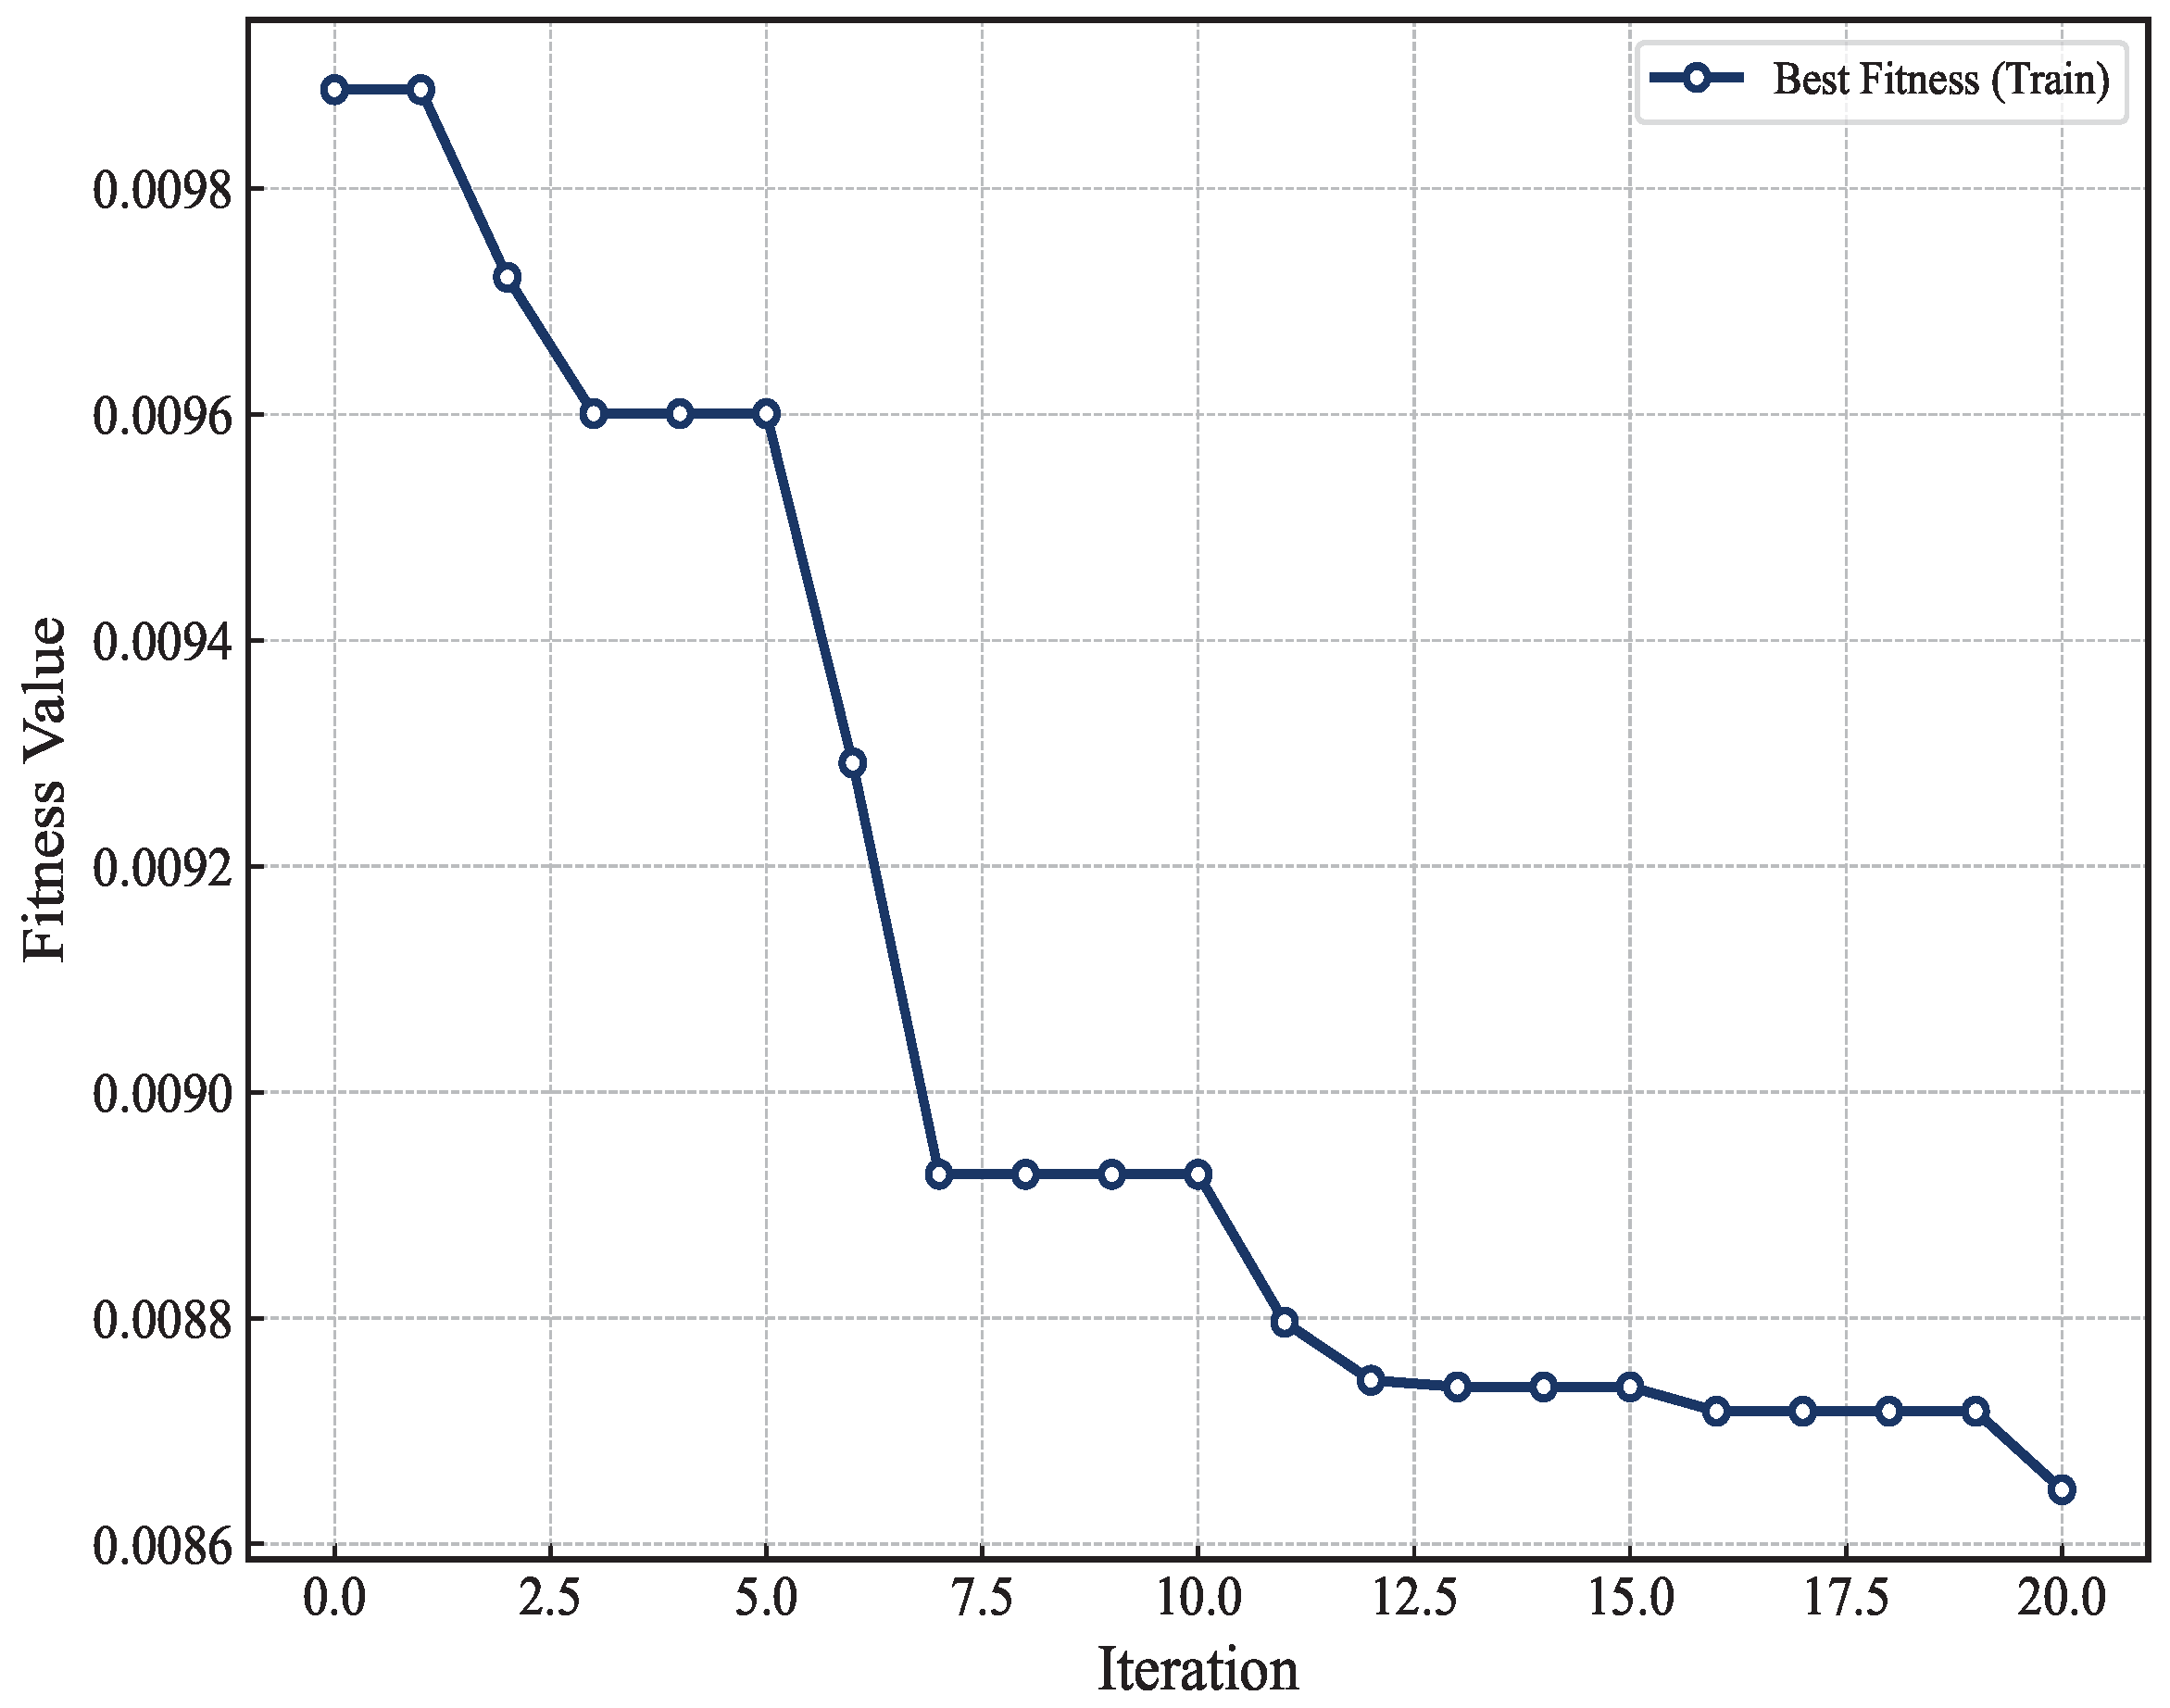
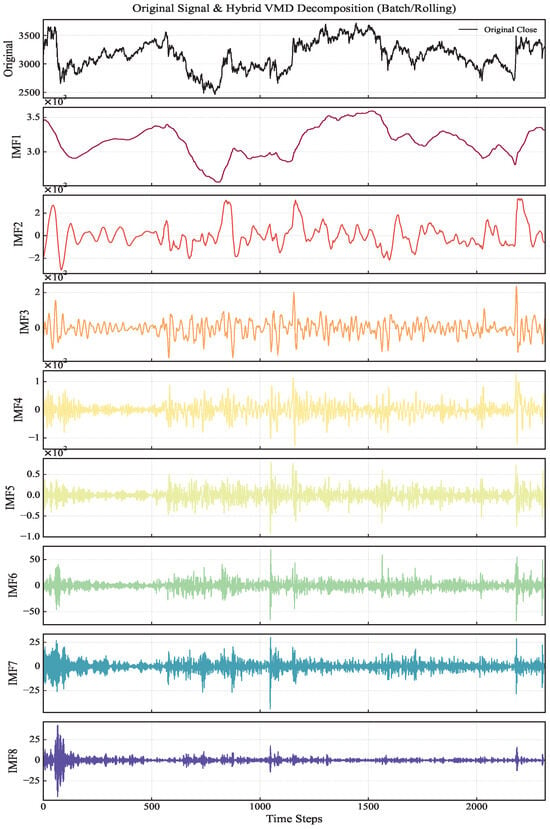
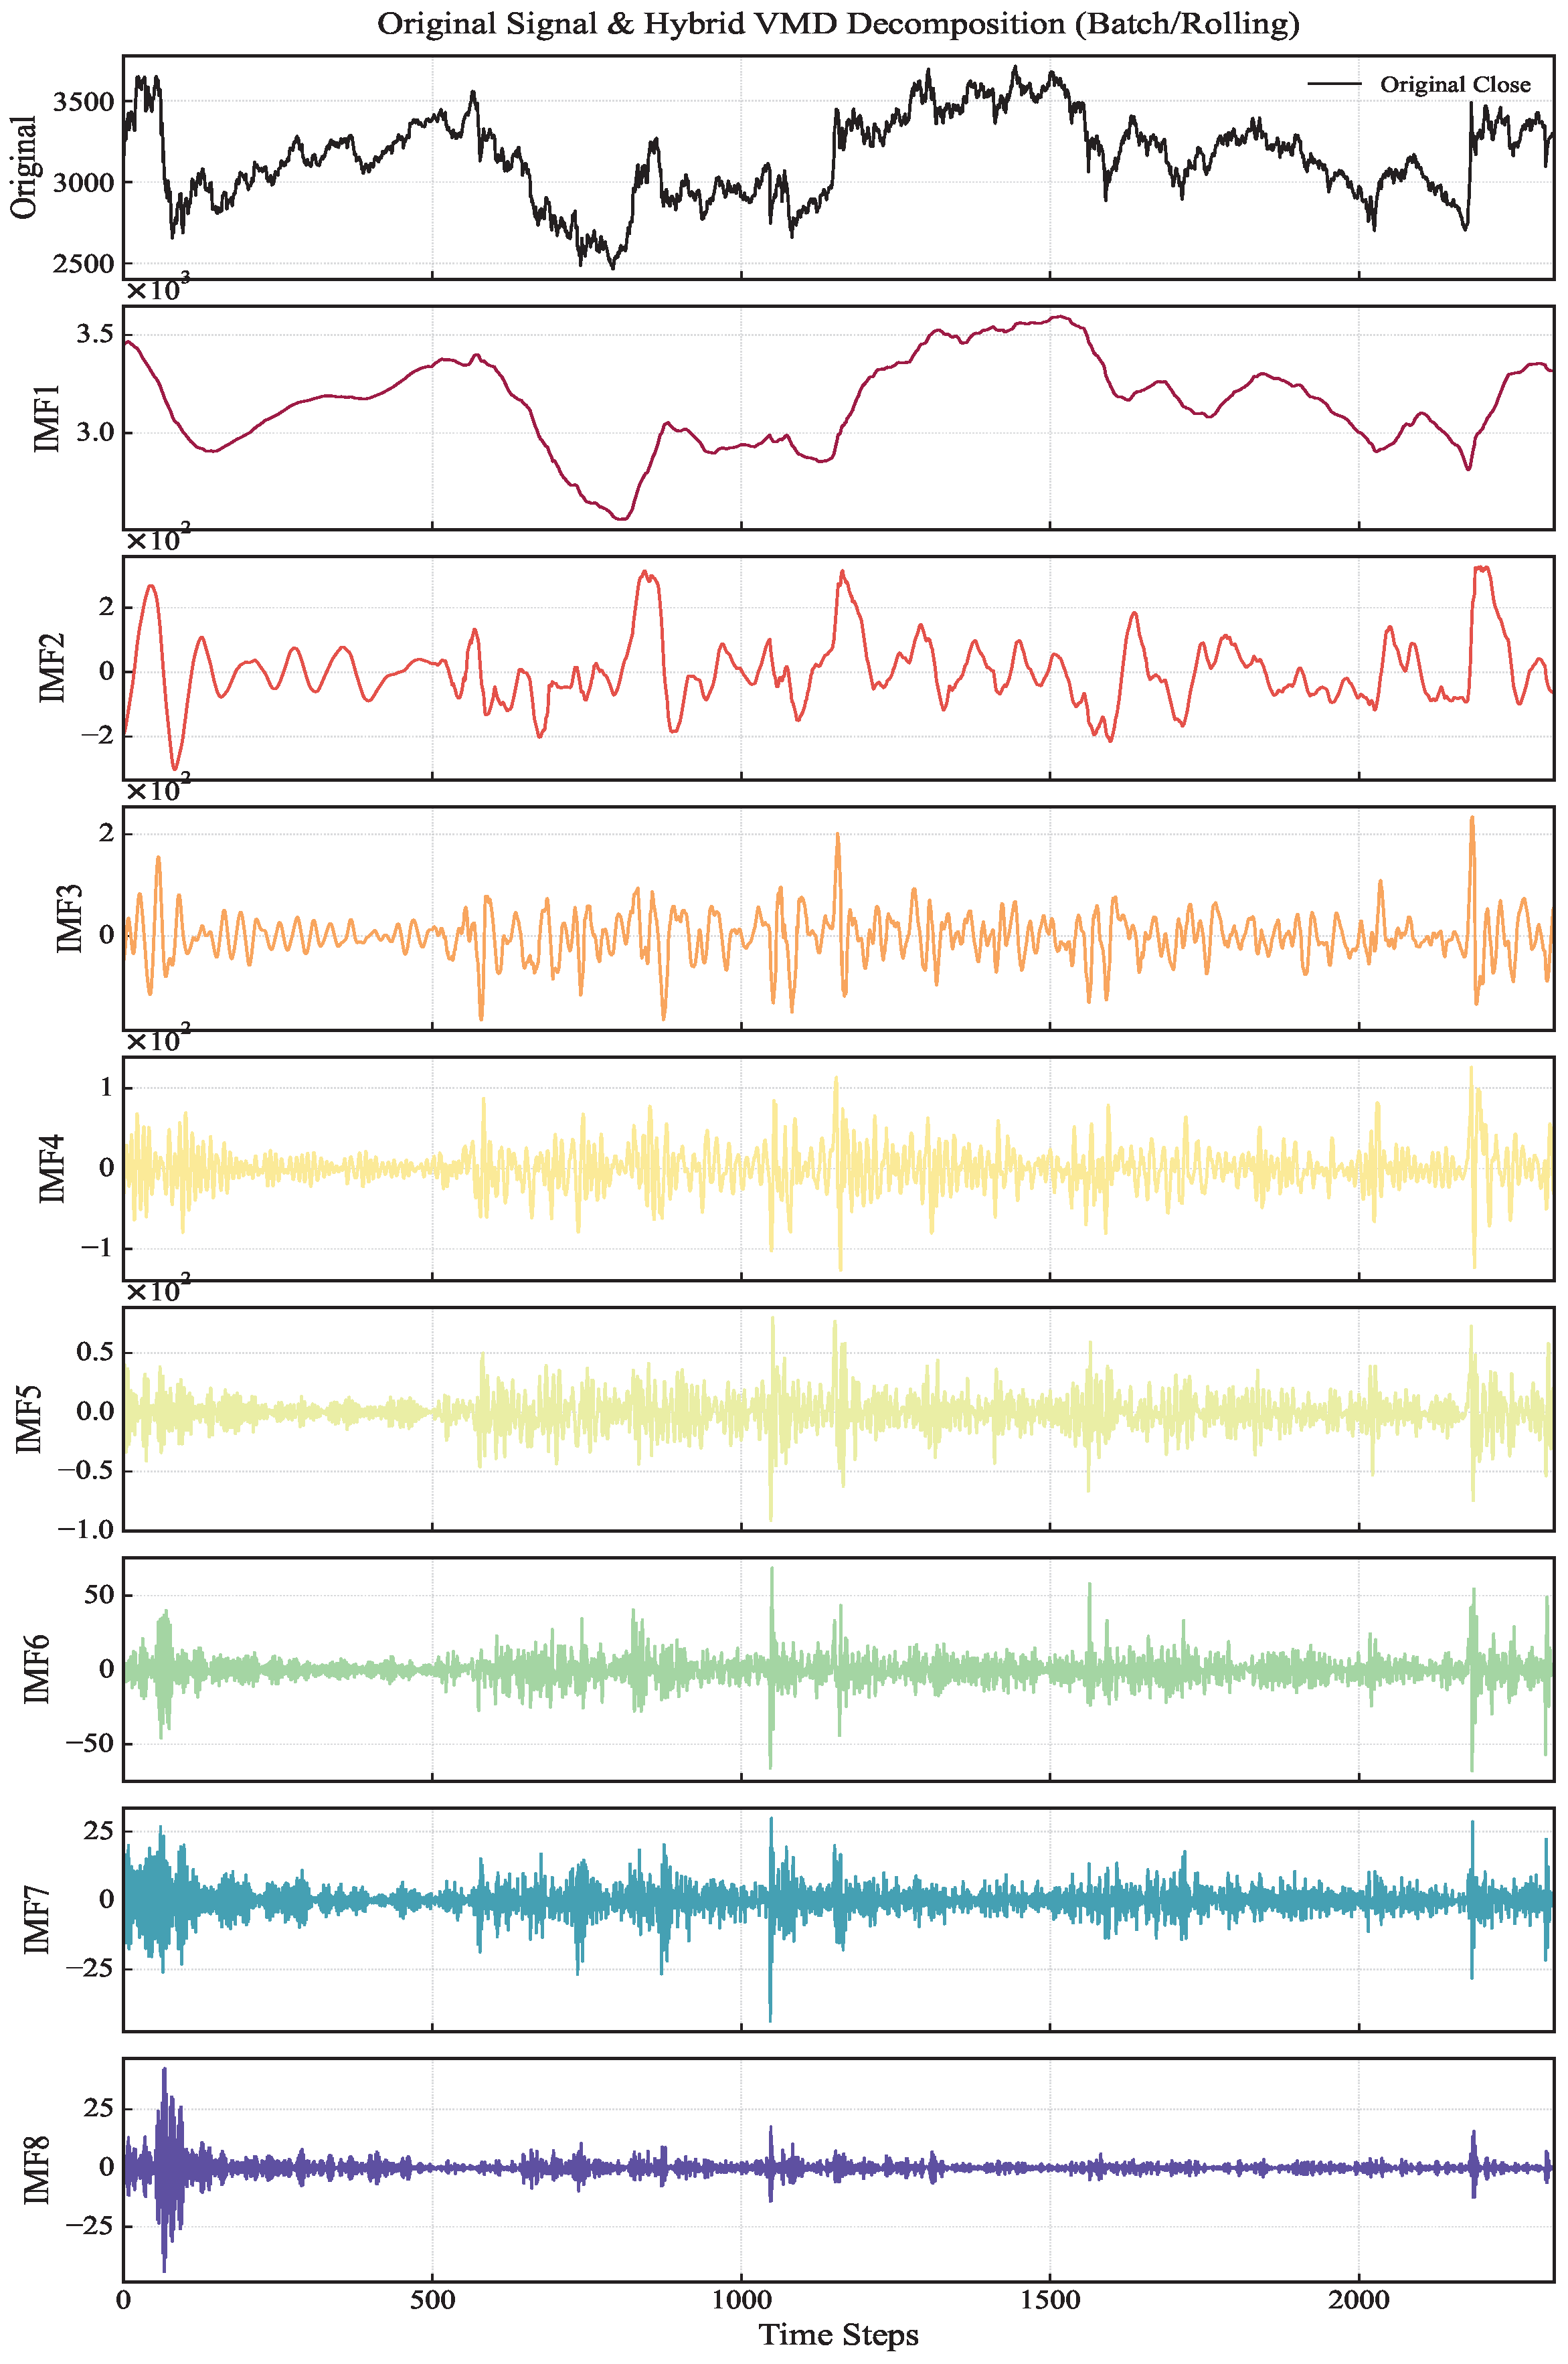
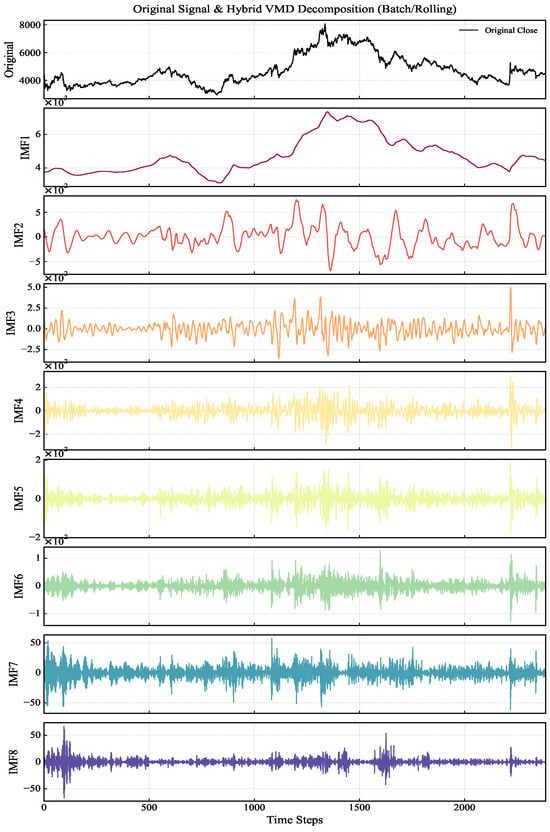
The optimization curves presented in Figure 4, Figure 5 and Figure 6 reveal a better search capability of the DBO algorithm when applied to VMD parameter tuning. In all test cases, the fitness values drop sharply and stabilize quickly within the early iterations, confirming the algorithm’s strong convergence speed and its ability to consistently locate the optimal decomposition parameters without getting trapped in local optima. By utilizing the optimal parameters listed in Table 4, we performed the final signal decomposition. Detailed visualizations of the resulting intrinsic mode functions (IMFs) for each stock are presented in Figure 7, Figure 8 and Figure 9.
Figure 4.
SSEC DBO Optimization Convergence.
Figure 5.
SZSE DBO Optimization Convergence.
Figure 6.
CSI 300 DBO Optimization Convergence.
Table 4.
Optimal VMD Decomposition Parameters Obtained by the DBO Algorithm.
Figure 7.
SSEC VMD Decomposition.
Figure 8.
SZSE VMD Decomposition.
Figure 9.
CSI 300 VMD Decomposition.
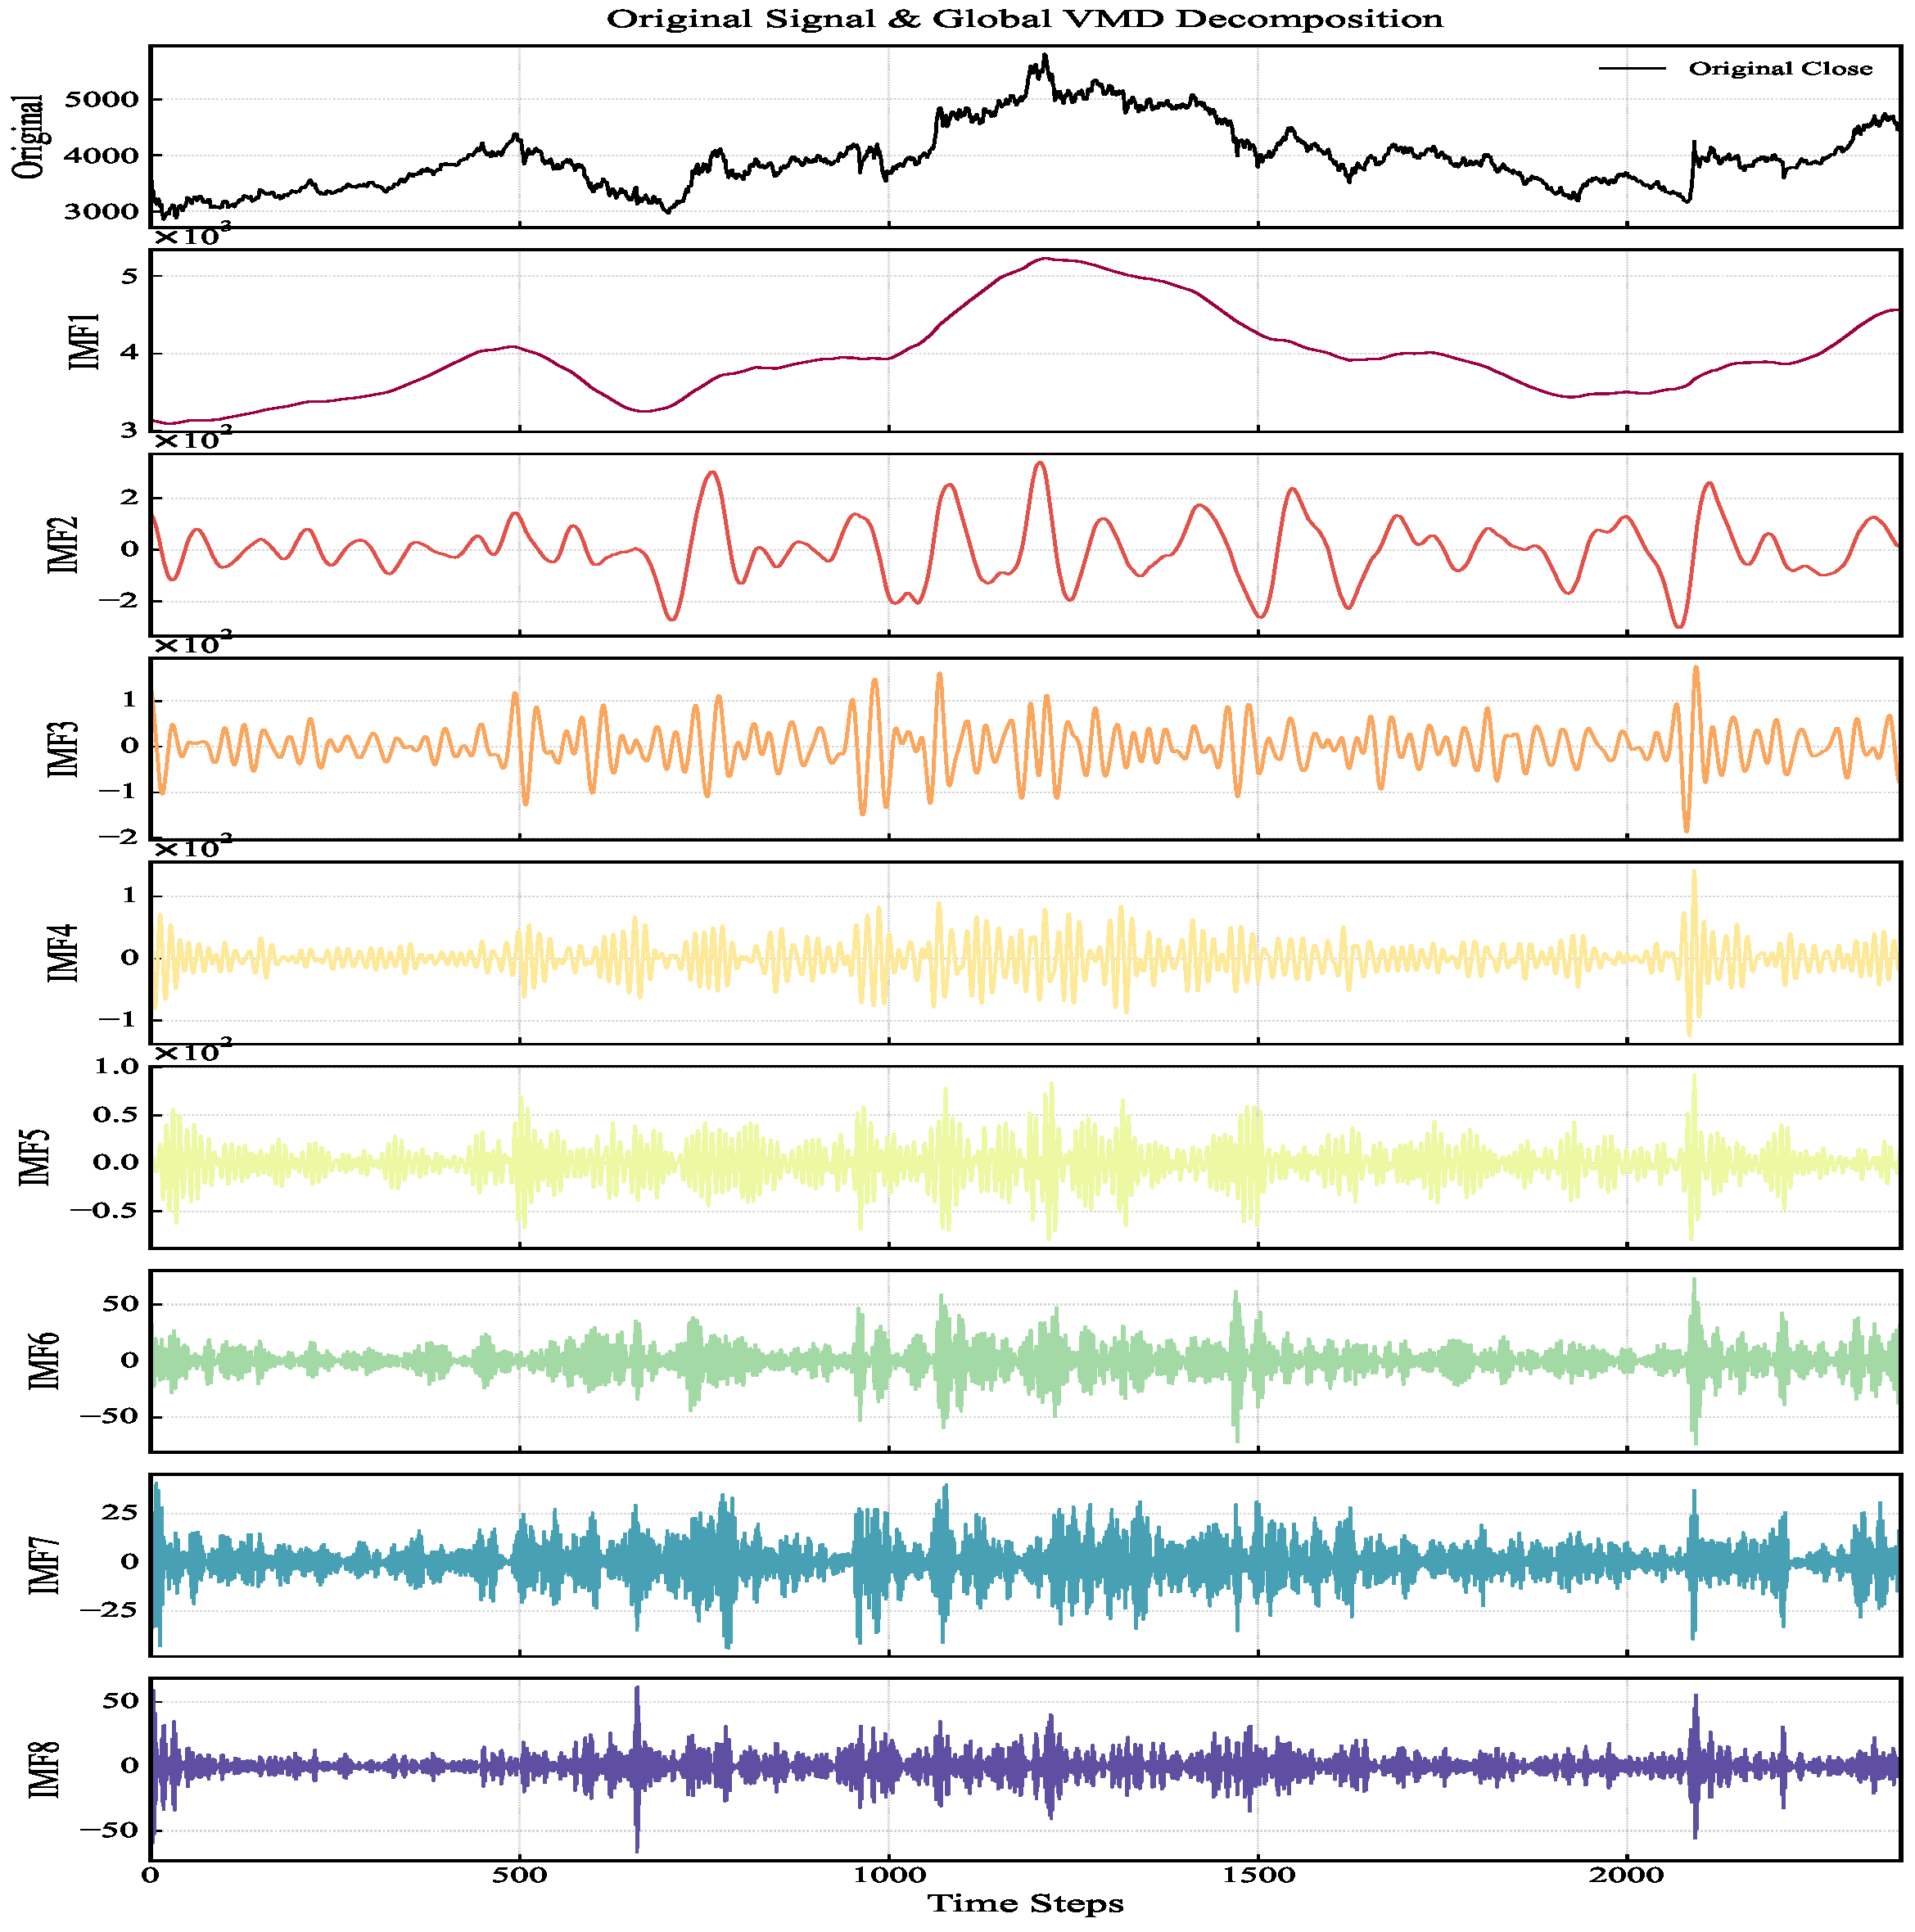
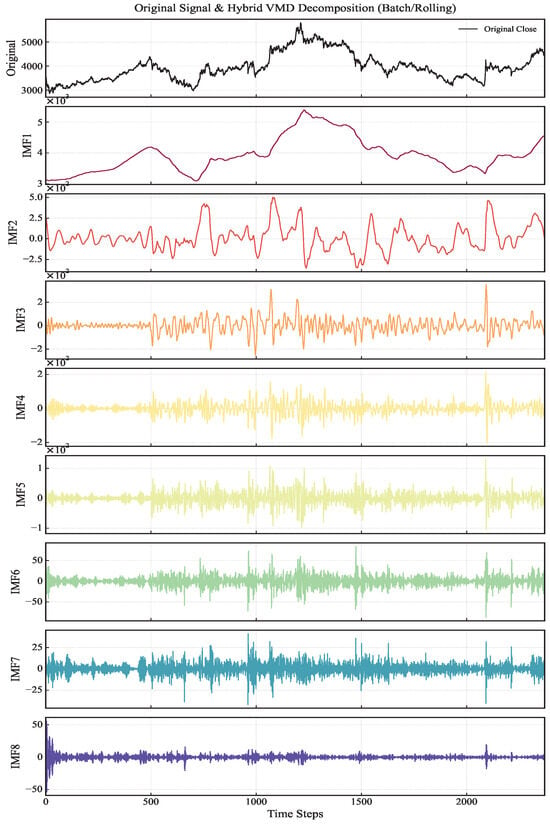
For comparison, we also conducted a global Variational Mode Decomposition (VMD) on the three datasets presented in Appendix A. A comparative analysis, as shown in Figure A1, Figure A2 and Figure A3, reveals that the global decomposition produces larger numerical values and demonstrates distinct volatility, particularly for the last two components. In contrast, the rolling decomposition leads to smaller values and substantially reduced volatility.
4.2. Text Data Collection and Preprocessing
The main source of textual data for this study is the “Guba” community on Eastmoney (https://guba.eastmoney.com/) (accessed on 6 February 2026), one of China’s most popular financial websites. As a central hub for investors, “Guba” allows for real-time discussions on individual stocks, market trends, and investment ideas. The community is known for its high user activity, rapidly updated information, and diverse opinions, making it an excellent source for understanding market and investor sentiment in the Chinese A-share market. Table 5 shows some examples of posts from the Eastmoney Guba community.
Table 5.
Some Posts from Eastmoney Guba.
To acquire this data, we developed a multi-threaded web crawler using the Selenium automation framework in Python 3.11.14, chosen for its ability to handle dynamic content and bypass anti-scraping measures.The program launches multiple instances of automated Chrome browsers with customized configurations to simulate real users. To enhance processing speed, a thread pool processes page indexes in parallel through a synchronous queue. Once the system confirms that page loading is complete, it utilizes CSS selectors to extract key metadata—including the number of reads, titles, and timestamps. Furthermore, to ensure stability and prevent IP blocking, the crawler integrates a random request delay mechanism and manages concurrent data aggregation through a global thread lock.
The textual data from the Eastmoney “Guba” reflects distinct financial sentiment polarities. However, the massive scale of the dataset poses a significant challenge for manual sentiment labeling. To automate this process, we developed a BERT-based classification framework incorporating a two-stage preprocessing pipeline. First, deduplication and noise filtering were performed to remove redundant and low-quality text. Second, the DeepSeek-chat large language model (LLM) was employed as a domain expert to label a randomly sampled subset of 40,000 posts. A specialized prompt was designed to ensure accurate labels by enforcing financial context awareness, as presented in Table 6.
Table 6.
The specialized Prompt Designed for the DeepSeek-chat Model to Perform Financial Sentiment Labeling.
We randomly selected a portion of the data for manual annotation and compared it with the annotation made by this large language model. The comparison results are shown in Table 7. The overall accuracy rate of the classification reached 87.3%. The classification accuracy rates for the positive and negative categories were relatively high, while the accuracy rate for the neutral category was slightly lower but remained within an acceptable rang.
Table 7.
Sentiment Classification Performance Report.
To address semantic sparsity and uneven information distribution in financial short texts, this study proposes a hybrid framework following an “Encoding-Refinement-Aggregation” approach. First, RoBERTa-wwm-ext serves as the foundational encoder, transforming discrete tokens into meaningful numerical representations using dynamic masking. These vectors are then refined by a two-layer Transformer Encoder, which utilizes multi-head self-attention to reinforce logical associations between financial words and sentiment words. To isolated key sentiment triggers from noise, we introduce an Attention Pooling mechanism that employs a learnable scoring function to generate a weighted representation selectively focused on important keywords. Finally, a Weighted Cross-Entropy Loss function is adopted to optimize decision boundaries by penalizing minority classes more heavily, ensuring robust performance across all sentiment categories.
The classification performance of the RoBERTa-Transformer-AttPool model is summarized in Table 8. As shown in Table 8, the proposed RoBERTa-Transformer-AttPool model achieves a robust overall accuracy of 89.28% on the test set, with a weighted average F1-score of 0.8924, confirming its efficacy in capturing complex sentiment features across the distribution. A more detailed analysis reveals that the model attains superior performance in the negative category, securing an F1-score of 0.9330. This performance is primarily driven by the high prevalence of negative sentiment in online discussion boards, which provides a rich source of discriminative training samples for the model to learn from.
Table 8.
Performance Metrics of the RoBERTa-Transformer-AttPool Model for Sentiment Classification.
In contrast, the performance on the neutral class is moderately lower, with an F1-score of 0.7947. This disparity stems from two inherent challenges: data imbalance, where neutral comments constitute the minority class, and the ambiguous meaning of neutral statements that are often difficult to distinguish from weak emotional expressions, complicating decision boundary definition. Nevertheless, the high macro-average F1-score of 0.8583 confirms that the model maintains generalized recognition capabilities and successfully migrates bias towards the majority class, ensuring reliable multi-class classification.
Based on the classified textual data, we subsequently construct quantitative sentiment indices to capture market psychology. To ensure robustness and capture investor sentiment from multiple dimensions, we employ two distinct calculation methodologies:
Method I [33]: Net Sentiment Ratio. This method quantifies the relative strength of bullish sentiment by calculating the normalized difference between positive and negative posts. It is defined as:
where and denote the total number of posts classified as positive and negative on day t, respectively. This index ranges from , providing a direct measure of market sentiment.
Method II: Logarithmic Sentiment Ratio. This method applies a log transformation to capture the amplified impact of divided sentiment while smoothing extreme values:
To capture variations in investor sentiment across different time frames, we construct Short-term, Medium-term, and Long-term indices by aggregating data over rolling windows of days, respectively. These multi-scale representations are designed to model the temporal dynamics of sentiment, specifically addressing how its influence on asset prices persists or decays over time.
We construct a comprehensive, high-dimensional feature space to serve as the input for the reinforcement learning agent. This feature set, as shown in Table 9, comprises four distinct categories of market information:
Table 9.
Summary of the Feature Set.
To mitigate the curse of dimensionality and eliminate redundant or noisy features, we employ a wrapper-based feature selection strategy utilizing a Genetic Algorithm (GA). The GA is configured with a population size of 20 and evolves over five generations using a binary encoding scheme. Key evolutionary settings include tournament selection (size = 3), a crossover rate of 0.8, and a mutation rate of 0.05. The fitness function is defined as the validation (Table 10 presents the division of the training set, validation set and test set.) score of a proxy CBAM-BiLSTM model trained for 300 epochs per individual. This approach ensures that the final feature set retains maximum predictive power while minimizing computational complexity. The specific selection results across different indices are detailed in Table 11.
Table 10.
Data Split for Training, Validation, and Testing Periods.
Table 11.
Feature Selection Results for Different Indices (1 = Selected, 0 = Excluded).
5. Experiment Results and Training
This section presents the construction and application of the proposed intelligent trading decision system. First, we define the state space, action space, and reward function. Subsequently, we introduce the framework of the proposed deep reinforcement learning model, CBAM-BiLSTM-DDQN, which uniquely integrates the Convolutional Block Attention Module (CBAM) with a Bidirectional Long Short-Term Memory (BiLSTM) network. Finally, the detailed network design, training strategy, and experimental validation steps are outlined to verify the model’s effectiveness.
5.1. Experiment Settings
5.1.1. Reinforcement Learning Environment
(1) State Space ()
The state vector integrates the selected features over a 10-day look-back period. It is augmented with three real-time account status vectors, namely the normalized cash balance, the number of shares held, and the proportion of equity relative to total assets, to reflect the agent’s instantaneous capital allocation.
(2) Action Space ()
To overcome the limitations of binary actions (“all-in” or “all-out”) in traditional RL, while still centering on the three basic operations of buying, selling, and holding (see Figure 2), we design a refined discretized action space consisting of 21 action levels. This granularity enables the agent to execute fractional position adjustments, approximating continuous control:
(3) Reward Function ()
We employ the logarithmic rate of return as the reward signal . Unlike simple percentage returns, logarithmic returns provide numerical symmetry for gains and losses and align with the objective of maximizing long-term compound growth:
where denotes the net asset value (NAV) at time t, and is a small constant to ensure numerical stability.
5.1.2. Market Assumptions and Portfolio Dynamics
(1) Market Assumptions
- Market Impact and Execution: We assume that the agent’s trading behavior exerts no influence on market prices. Furthermore, orders are assumed to be executed at the closing price, representing execution within the final 3 min of the trading session.
- Trading Constraints: Short selling and margin trading are strictly prohibited. Consequently, the agent’s maximum buying capacity is strictly limited by the current cash balance in the account.
- Transaction Costs: We have set the total transaction cost at 0.3% of the transaction amount. This conservative setting is designed to comprehensively cover brokerage commissions, stamp duty, potential market slippage, and bid-ask spreads.
(2) Portfolio Update Rules and Value Evolution
Based on the action output by the agent, the cash balance and stock holdings are updated as follows:
- When (Buy Action), the agent uses a proportion of the available cash to buy shares. Accounting for transaction costs, the updated shares and cash are:
- When (Sell Action), the agent sells a proportion of the current holdings . After deducting transaction costs, the updated shares and cash are:
- When (Hold or No Action), no transaction costs are incurred, and both cash and holdings remain unchanged:
where denotes the action taken on day t, signifies the available cash balance as of day t, represents the number of stock shares held as of day t, denotes the closing price of the stock on day t, and represents the one-way transaction cost.
Moreover, at any specific time t, the absolute total portfolio value is defined as . By combining the aforementioned update rules, the dynamic evolution of the total portfolio value from day t to can be formally expressed as:
where represents the total transaction cost incurred on day t, which is calculated as:
Remark 1.
Due to the T+1 mechanism and daily updates, generates unrealized profit/loss during the next day’s market price fluctuation , while the transaction cost is deducted directly from the total assets when the action occurs on day t.
5.2. Network Architecture and Training Strategy
The Q-network learns the optimal action-value function using a multi-layered framework. First, an input module accepts a state tensor representing the historical data window. The core of the network begins with the feature extraction stage, consisting of two CBAM layers. These attention layers are designed to selectively focus on and enhance the most important features within the input tensor. Subsequently, the refined feature sequence is passed to a module composed of a two-layer stacked BiLSTM module. This module’s specific role is to capture the complex, long-range temporal dependencies within the sequence. Finally, a fully connected layer maps the last hidden state of the BiLSTM to the final Q-values for each action.
In our study, the model is trained for 300 episodes without an early stopping mechanism. Network optimization is performed using the Adam optimizer with a batch size of 128, an experience pool size of 10,000, and a fixed learning rate of 0.001. We employ an exploration rate that decays from 1 to 0.1 with a decay rate of 0.995. The reward function of DDQN is defined as the logarithmic return rate of the total investment portfolio, as described in Section 5.1. A complete episode refers to a full backtest conducted by the agent over the entire time series of the training set. Regarding update frequency, the main network performs one sampling-based training update at each time step, while the target network is updated once every 100 time steps.
The training process strictly adheres to the Double DQN paradigm to mitigate overestimation bias. We utilize Experience Replay to decouple data correlation and a separate Target Network for stable TD-target calculation. The detailed algorithm is presented in Algorithm 2.
| Algorithm 2 CBAM-BiLSTM-DDQN Training Procedure |
|
5.3. Experimental Setup
To validate the proposed model, we compare it against two categories of baselines: traditional trading rules and standard DRL frameworks.
- Buy and Hold (BH): A simple baseline strategy where the asset is held throughout the entire evaluation period to reflect the underlying market trend.
- Mean Reversion (MR): A classic technical strategy based on the principle that prices tend to revert to their historical average. It executes trades when the price significantly deviates from its moving average (MA) or Bollinger Band boundaries.
- Trend Following (TF): A momentum-based approach that buys on “Golden Cross” signals, aiming to capitalize on and ride established market trends.
- Momentum (Mm): A strategy that makes trading decisions based on the persistence of an asset’s price returns over the preceding N days.
- BiLSTM: This baseline consists of two-layer BiLSTM network without any attention mechanism.
- BiLSTM Standard Attention (BiLSTM SATT): two-layer BiLSTM model enhanced with standard attention mechanism.
- BiLSTM Multi-Head Attention (BiLSTM MHATT): This model integrates two-layer BiLSTM with Multi-Head attention mechanism.
We evaluate model performance using a comprehensive suite of metrics to measure profitability (Cumulative Return and Annualized Return), quantify risk (Annualized Volatility and Maximum Drawdown), and assess risk-adjusted performance using the Sharpe Ratio. We summarized these evaluation metrics in Table 12.
Table 12.
Performance Evaluation Metrics (from 2023 to 2025).
To ensure statistical significance, each model is executed five times per dataset. All models are implemented in PyTorch 2.7.1 within a DDQN framework, using the Adam optimizer with a learning rate of 0.001 and a discount factor of 0.95. Shared settings for sequence modeling include an input window size of 10 and 64 hidden units for the BiLSTM layers. Our CBAM mechanism employs a channel reduction ratio of 8, and the Multi-Head Attention baseline is configured with four heads.
5.4. Results and Discussion
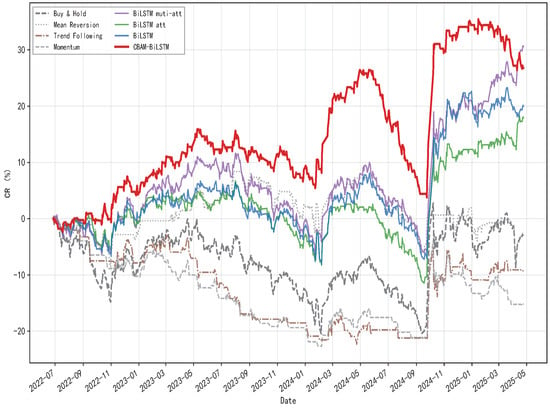
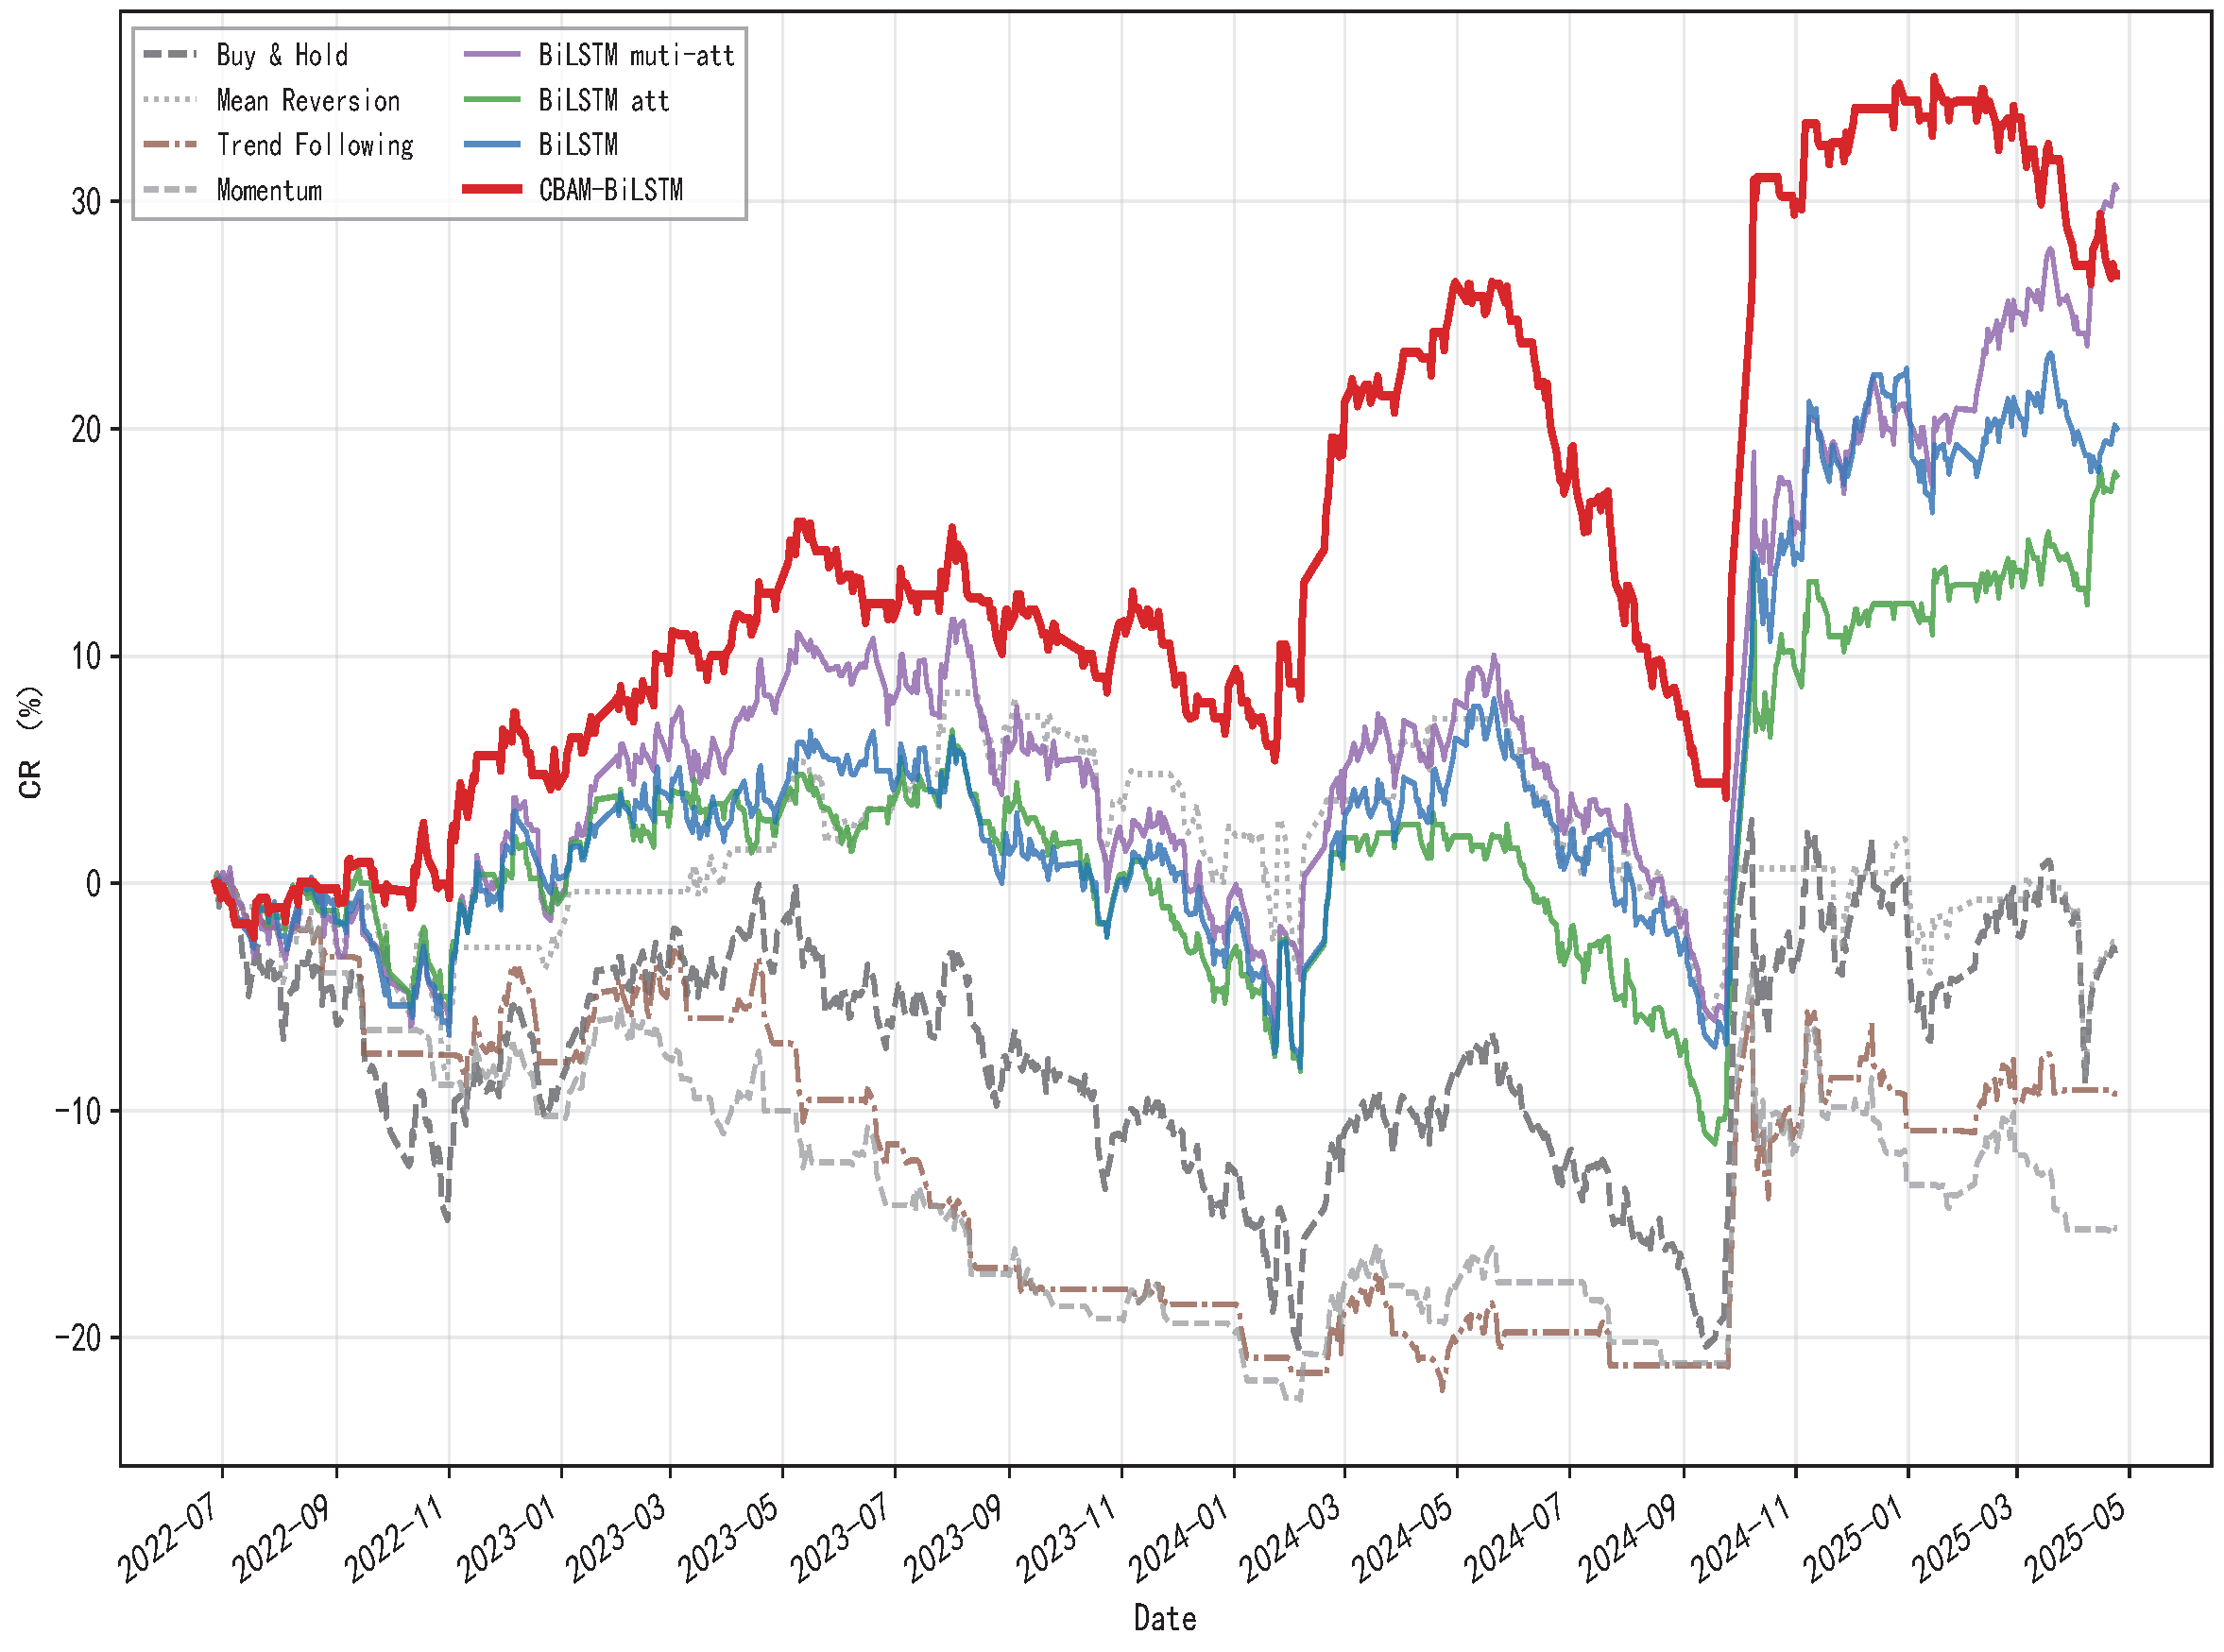
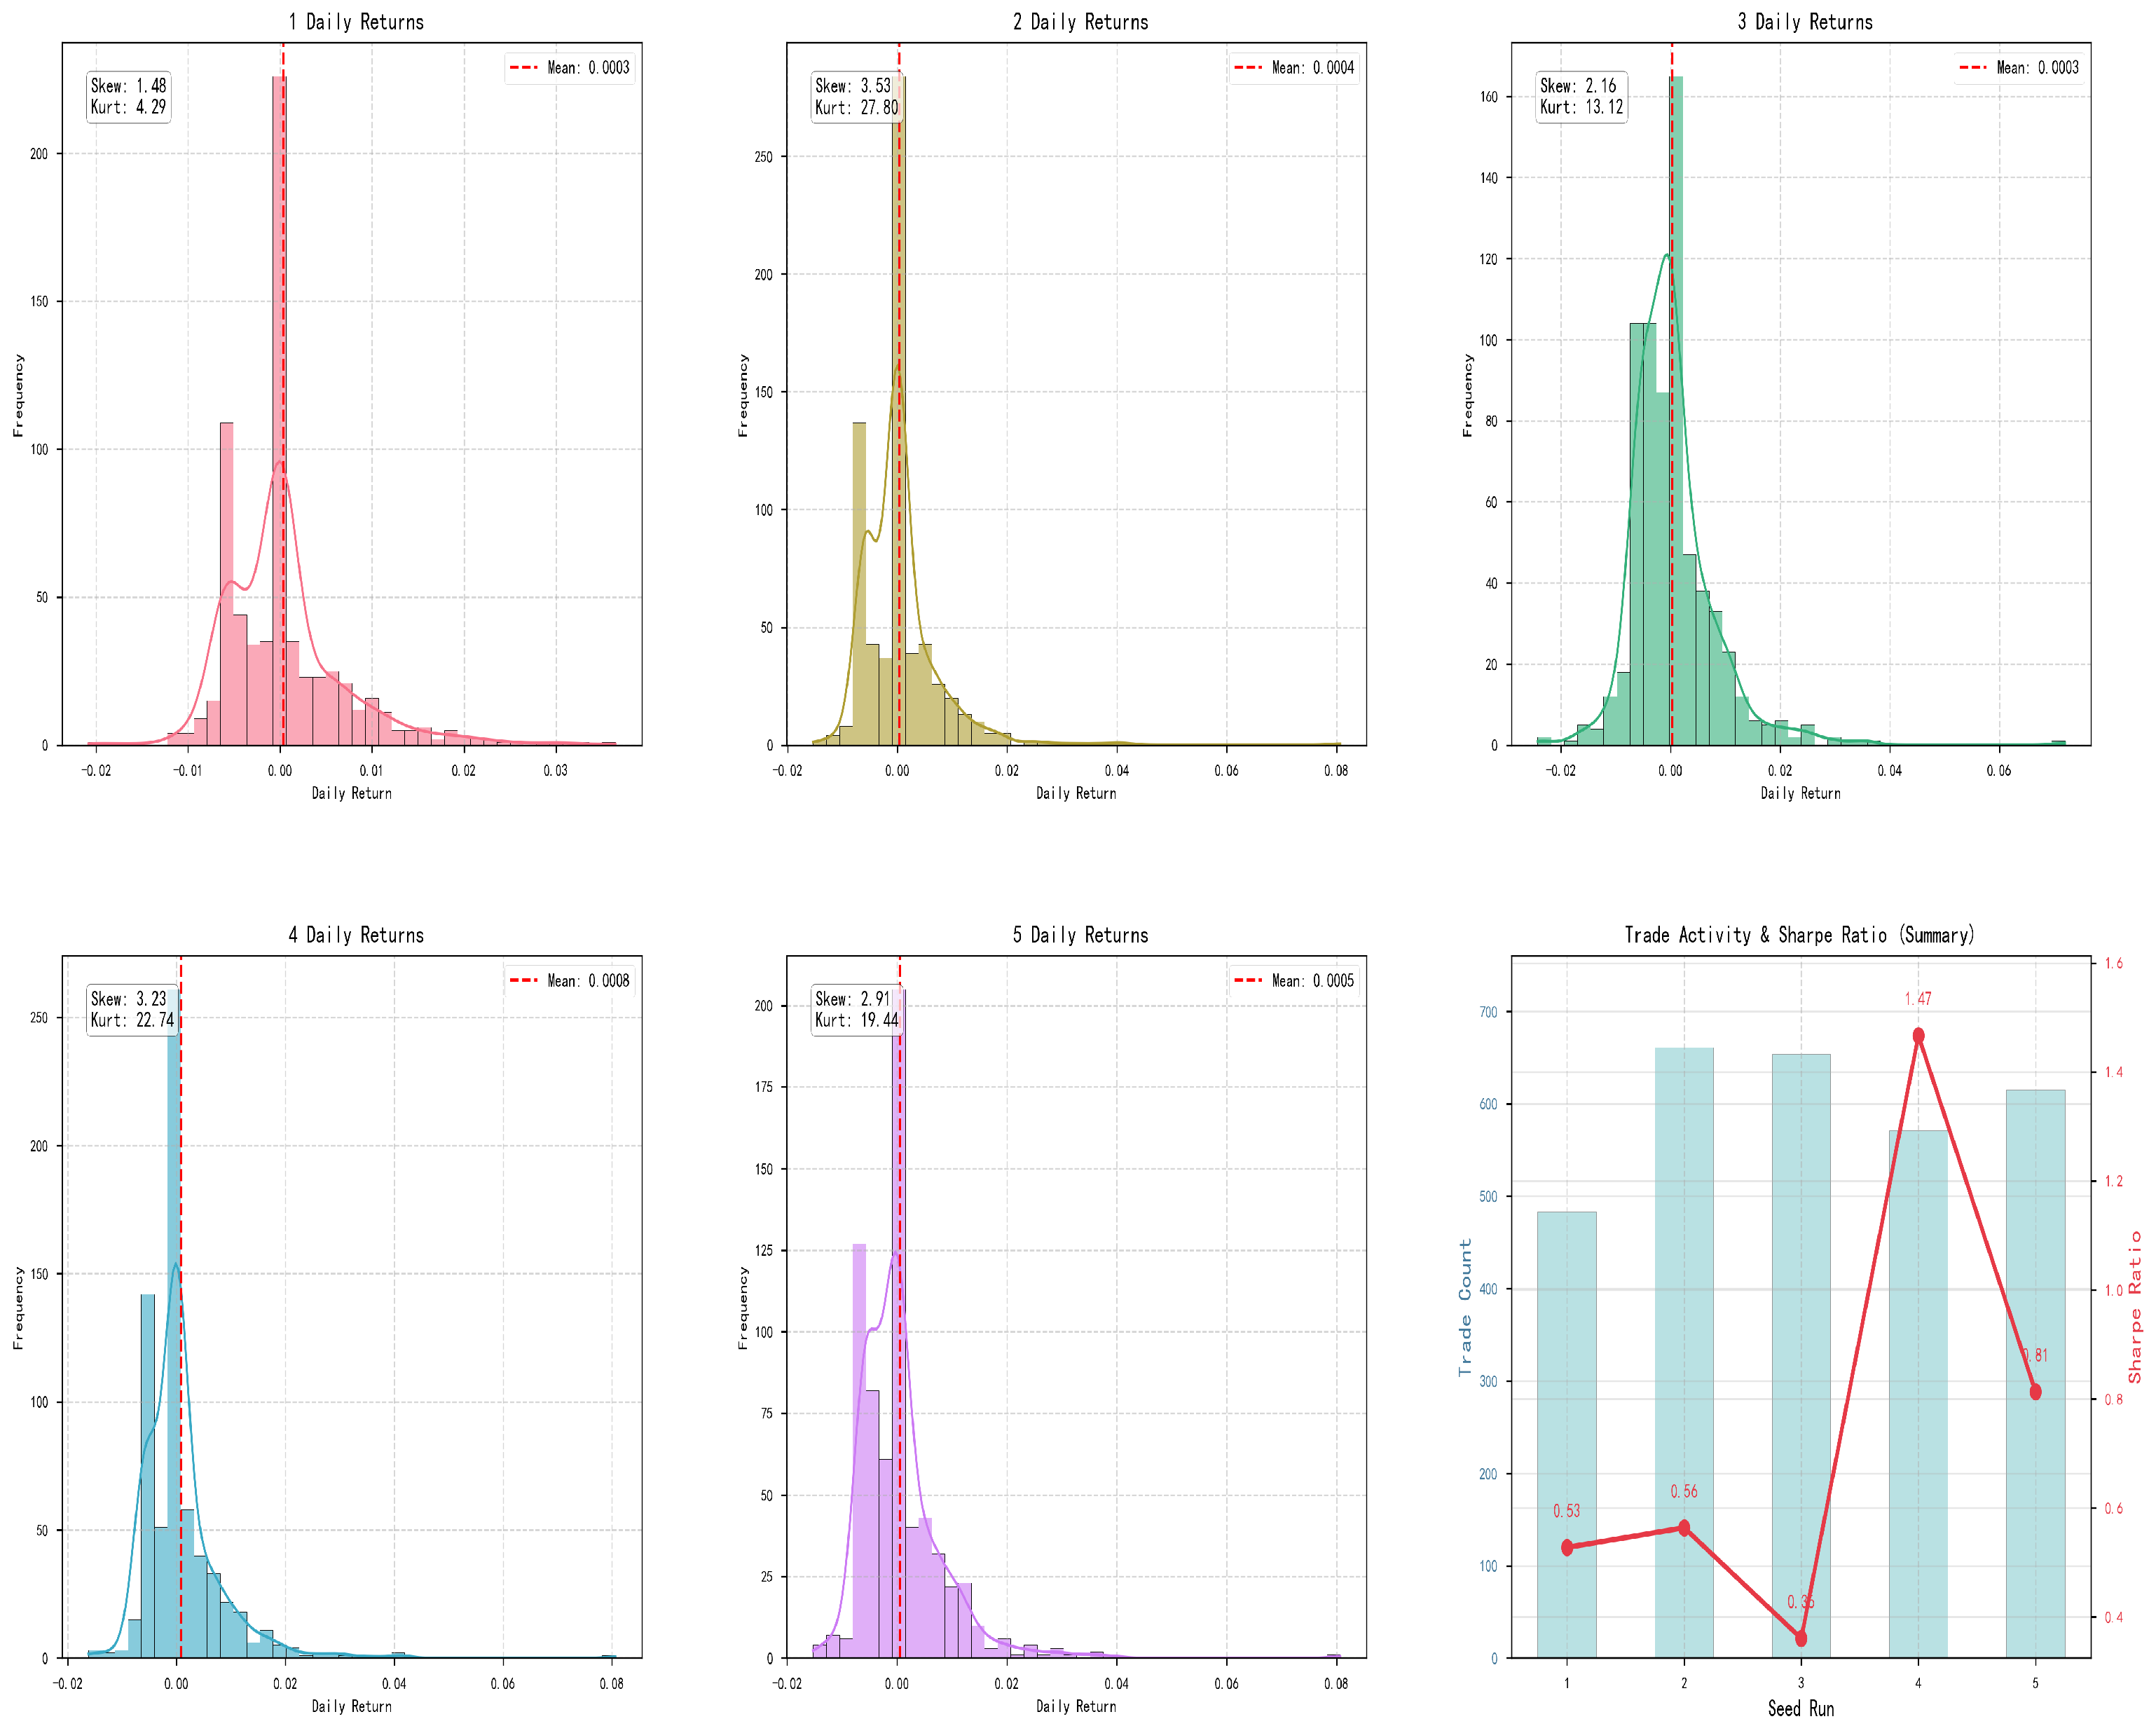
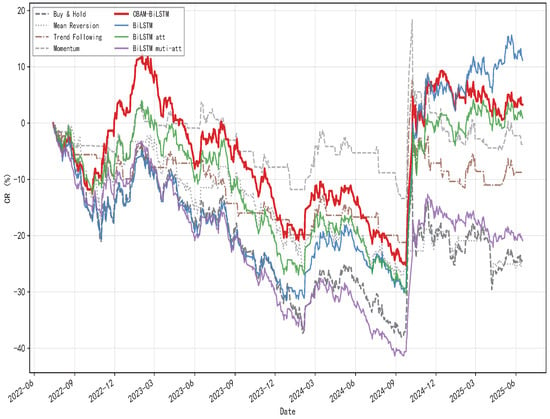
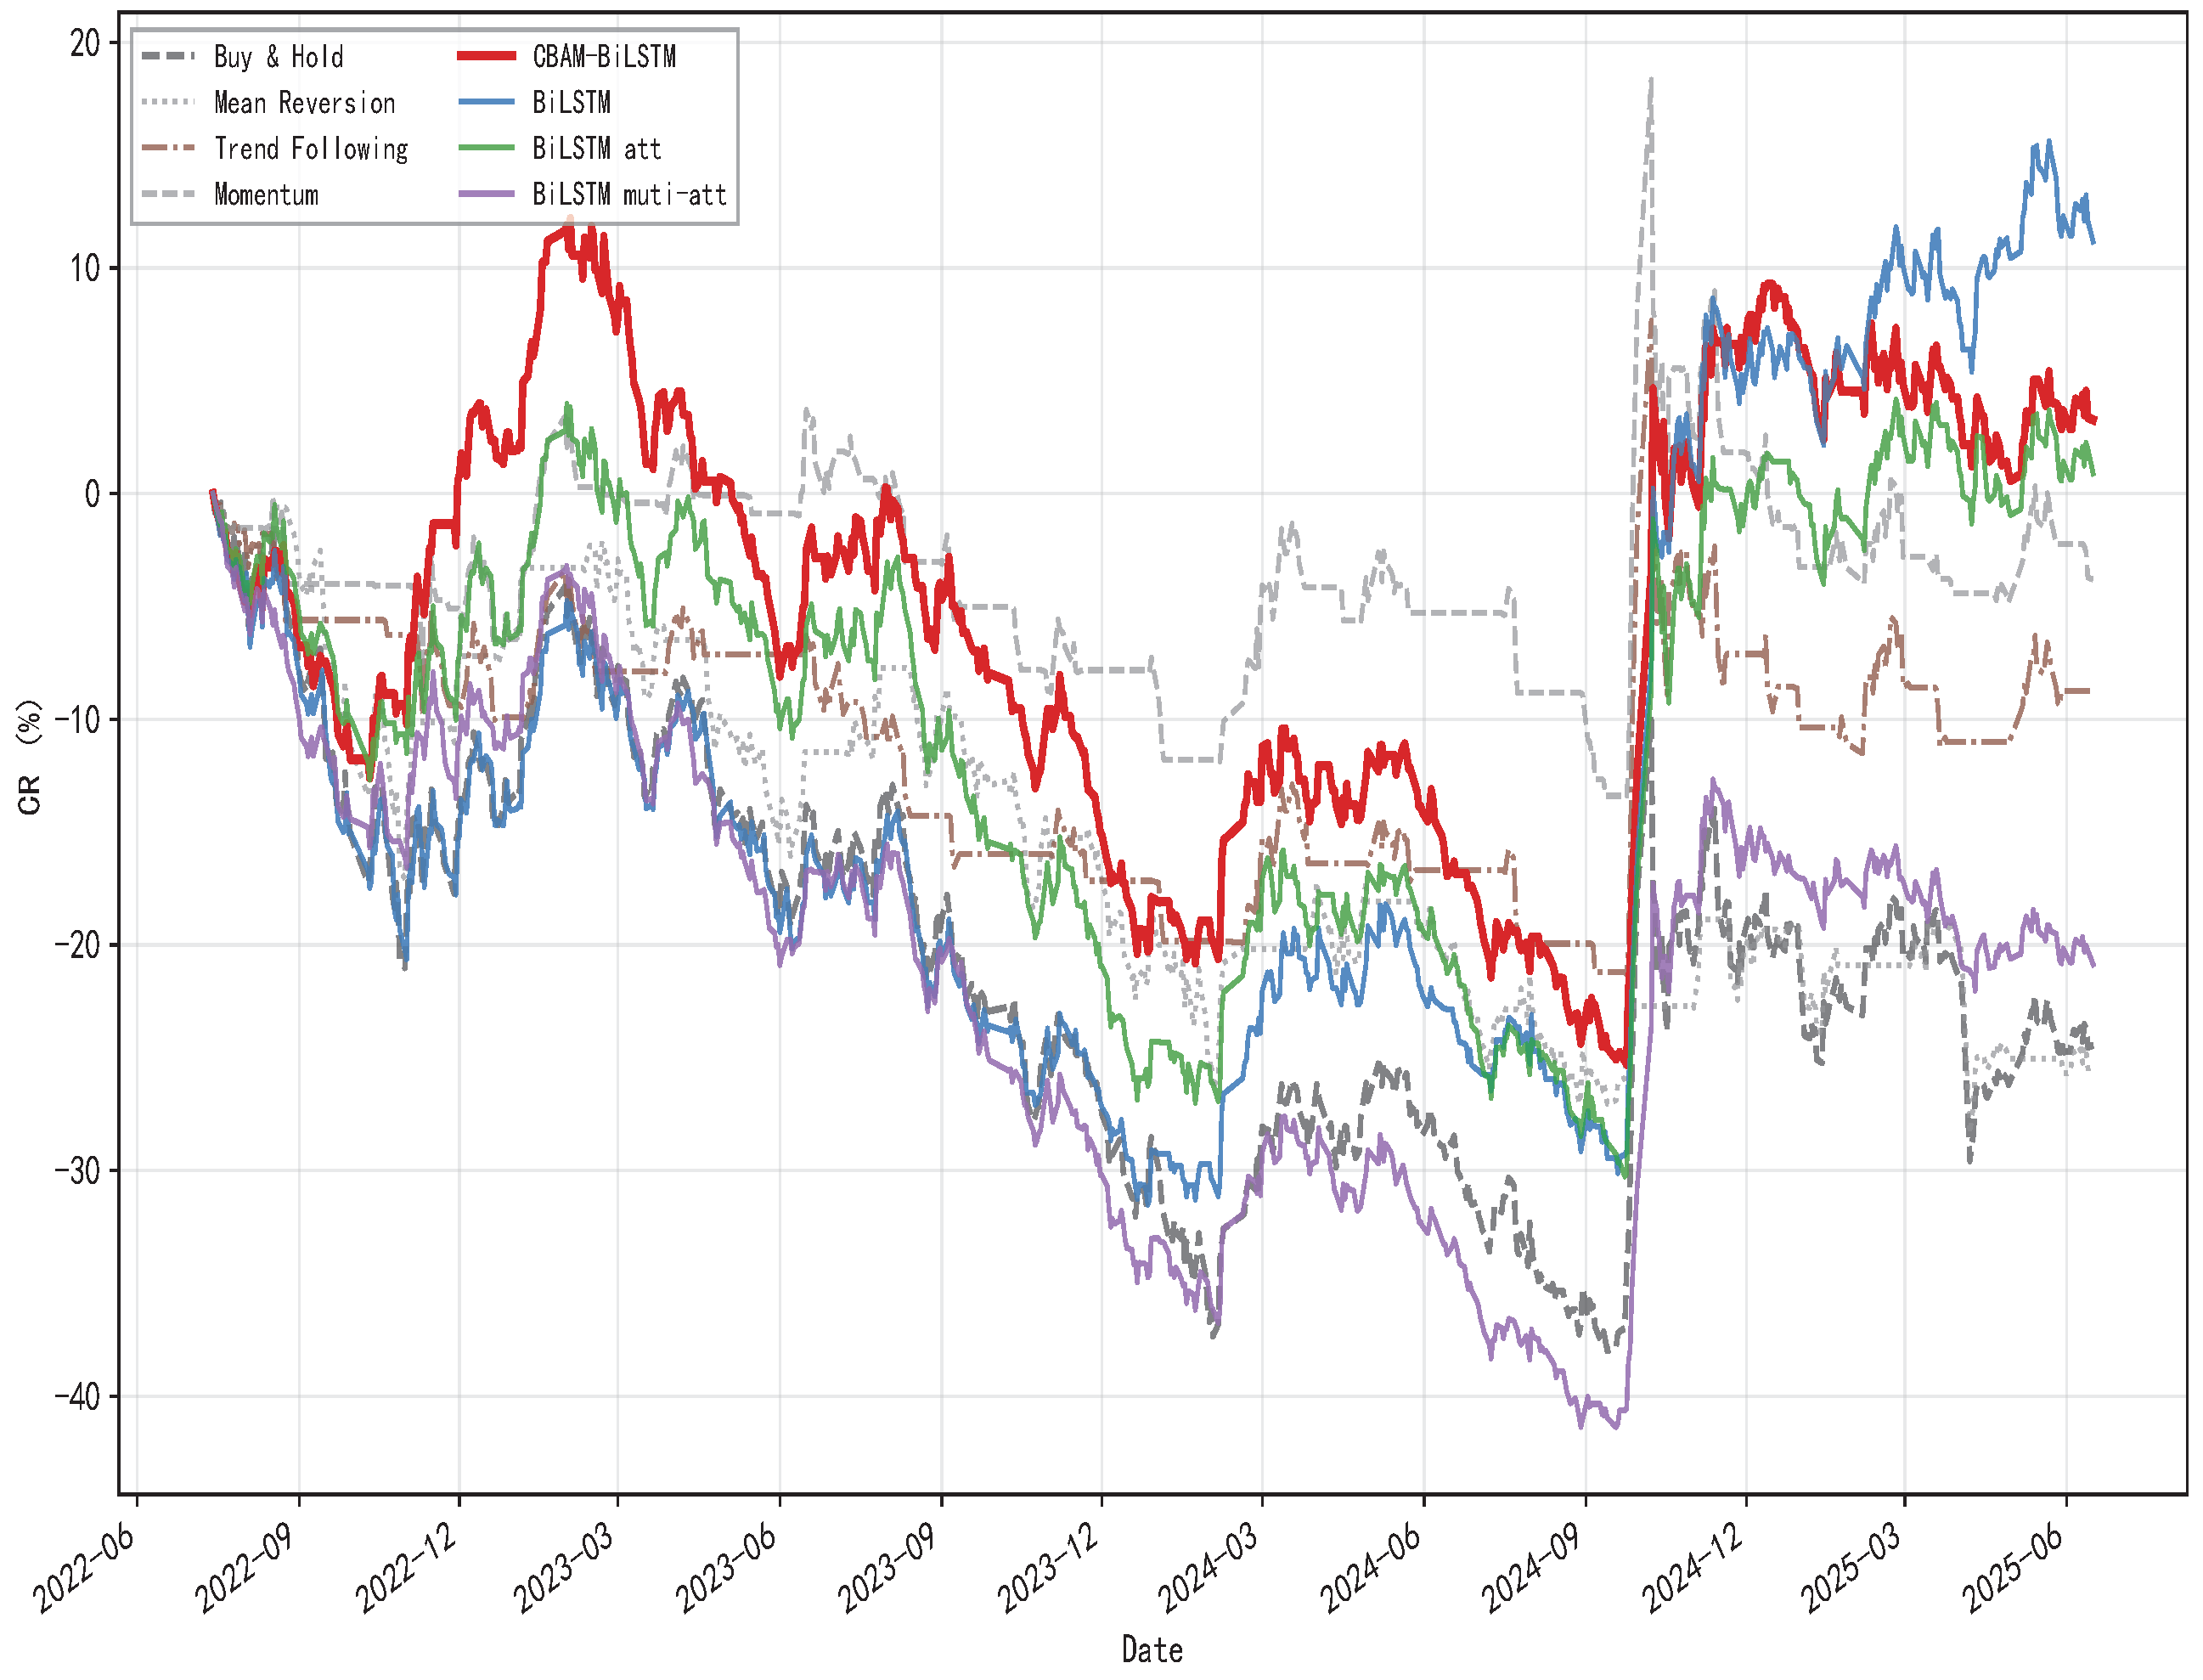
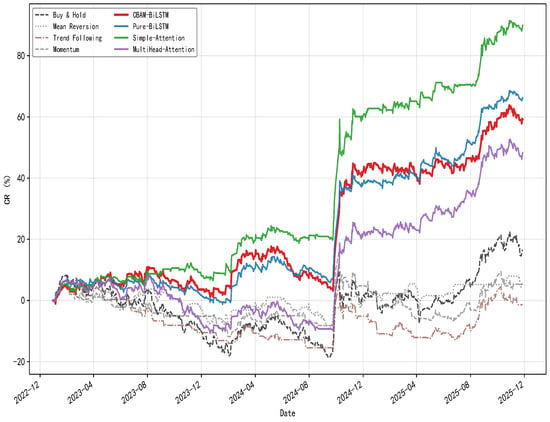
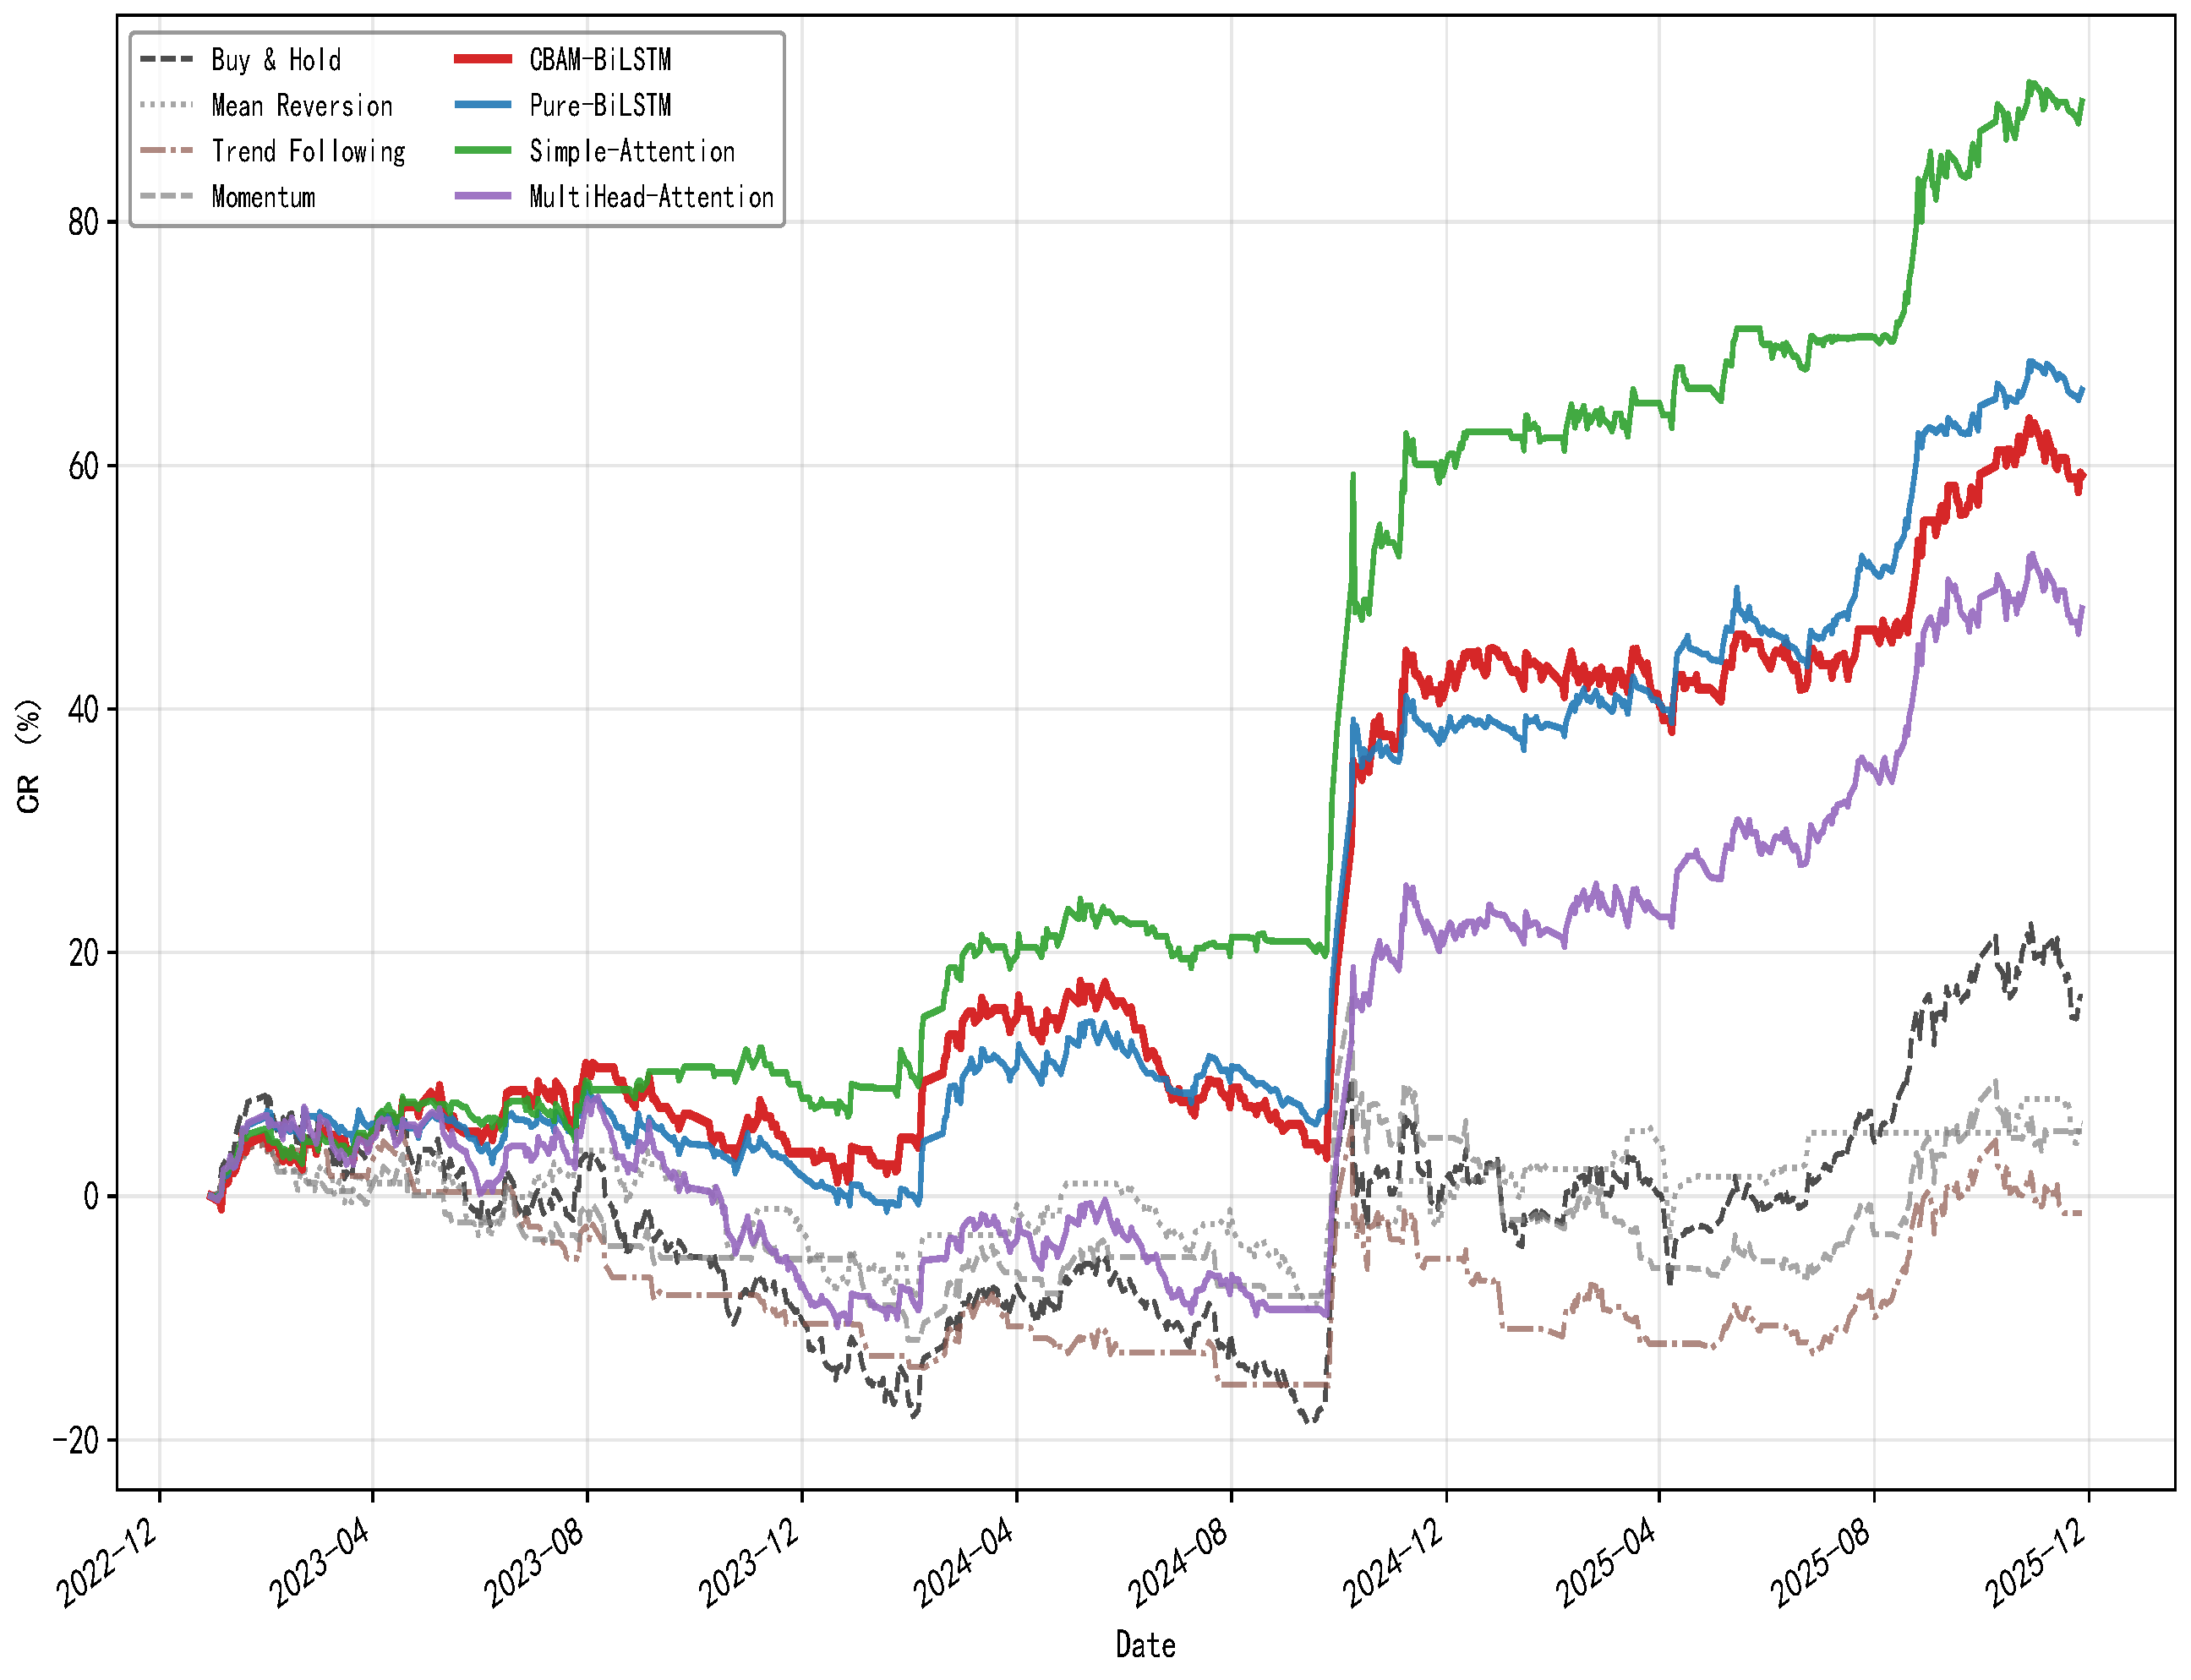
The comparative performance metrics across the three major market indices (i.e., SSEC, SZSE, and CSI 300) are detailed in Table 13, Table 14, Table 15, Table 16, Table 17, Table 18 and Table 19 and visually represented in Figure 10, Figure 11, Figure 12, Figure 13 and Figure 14. These results validate the superiority of the proposed CBAM-BiLSTM-DDQN framework.
Table 13.
Comparative Performance Metrics of Different Trading Strategies on SSEC.
Table 14.
Annualized Return 5 Random Seeds on SSEC.
Table 15.
Statistical Diagnostics on SSEC.
Table 16.
Comparative Performance Metrics of Different Trading Strategies on SZSE.
Table 17.
Annualized Return across 5 Random Seeds on SZSE.
Table 18.
Statistical Diagnostics on SZSE.
Table 19.
Comparative Performance Metrics of Different Trading Strategies on CSI 300.
Figure 10.
Comparative Analysis of Trading Strategies on SSEC.
Figure 11.
Daily Returns on SSEC.
Figure 12.
Comparative Analysis of Trading Strategies on SZSE.
Figure 13.
Daily Returns on SZSE.
Figure 14.
Comparative Analysis of Trading Strategies on CSI 300.
This study presents an empirical comparison of the proposed CBAM-BiLSTM-DDQN framework against various baseline strategies from 2023 to 2025. Table 13, Table 16 and Table 19 summarize the key performance metrics across the SSEC, SZSE, and CSI 300 indices. To objectively reflect typical behavior of our stochastic model, Figure 10, Figure 12 and Figure 14 illustrate the resulting median cumulative return curves. The experimental results indicate that the proposed framework demonstrates competitive profitability and risk control across distinct market regimes. On the CSI 300, which exhibited strong trend characteristics, the median performance of the CBAM-BiLSTM model achieved a CR of 59.18% and an SR of 1.18, showing a superior capacity to capture swing opportunities compared to the traditional BH strategy (CR = 16.33%) and the MR strategy. Notably, in the SZSE, characterized by a significant bearish trend where the BH strategy suffered a drawdown of −24.45%, the CBAM-BiLSTM strategy maintained a positive CR of 3.27%.
To evaluate the robustness of the reinforcement learning model under varying initialization conditions, Table 14, Table 17 and Table 20 detail the distribution of Annualized Returns (AR) for each deep learning model across five random seeds. The results suggest that the CBAM-BiLSTM-DDQN framework exhibits relatively stable convergence characteristics across multiple trials. For example, on the SSEC, the model achieved a mean AR of 10.78%, with returns ranging from 6.88% to 16.71% across the five seeds; significantly, all reported values are positive. In contrast, several comparative models, such as BiLSTM-MHATT and BiLSTM-SATT, registered negative returns under certain seeds despite achieving high returns in others, implying higher variance and lower reliability. On the CSI 300, the CBAM-BiLSTM achieved a mean AR of 20.23% with a minimum return of 15.82% across all seeds.
Table 20.
Annualized Return 5 Random Seeds on CSI 300.
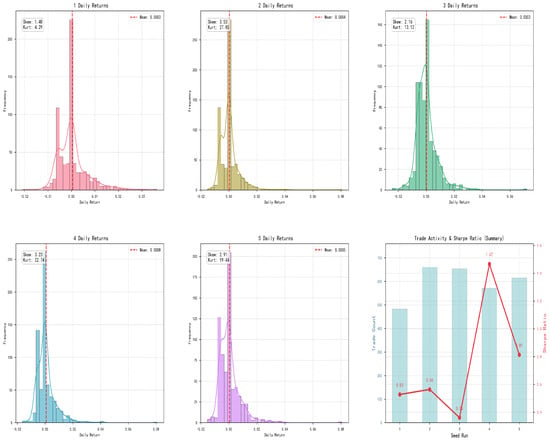
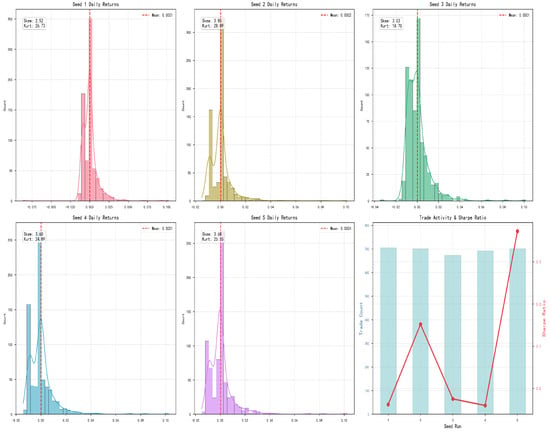
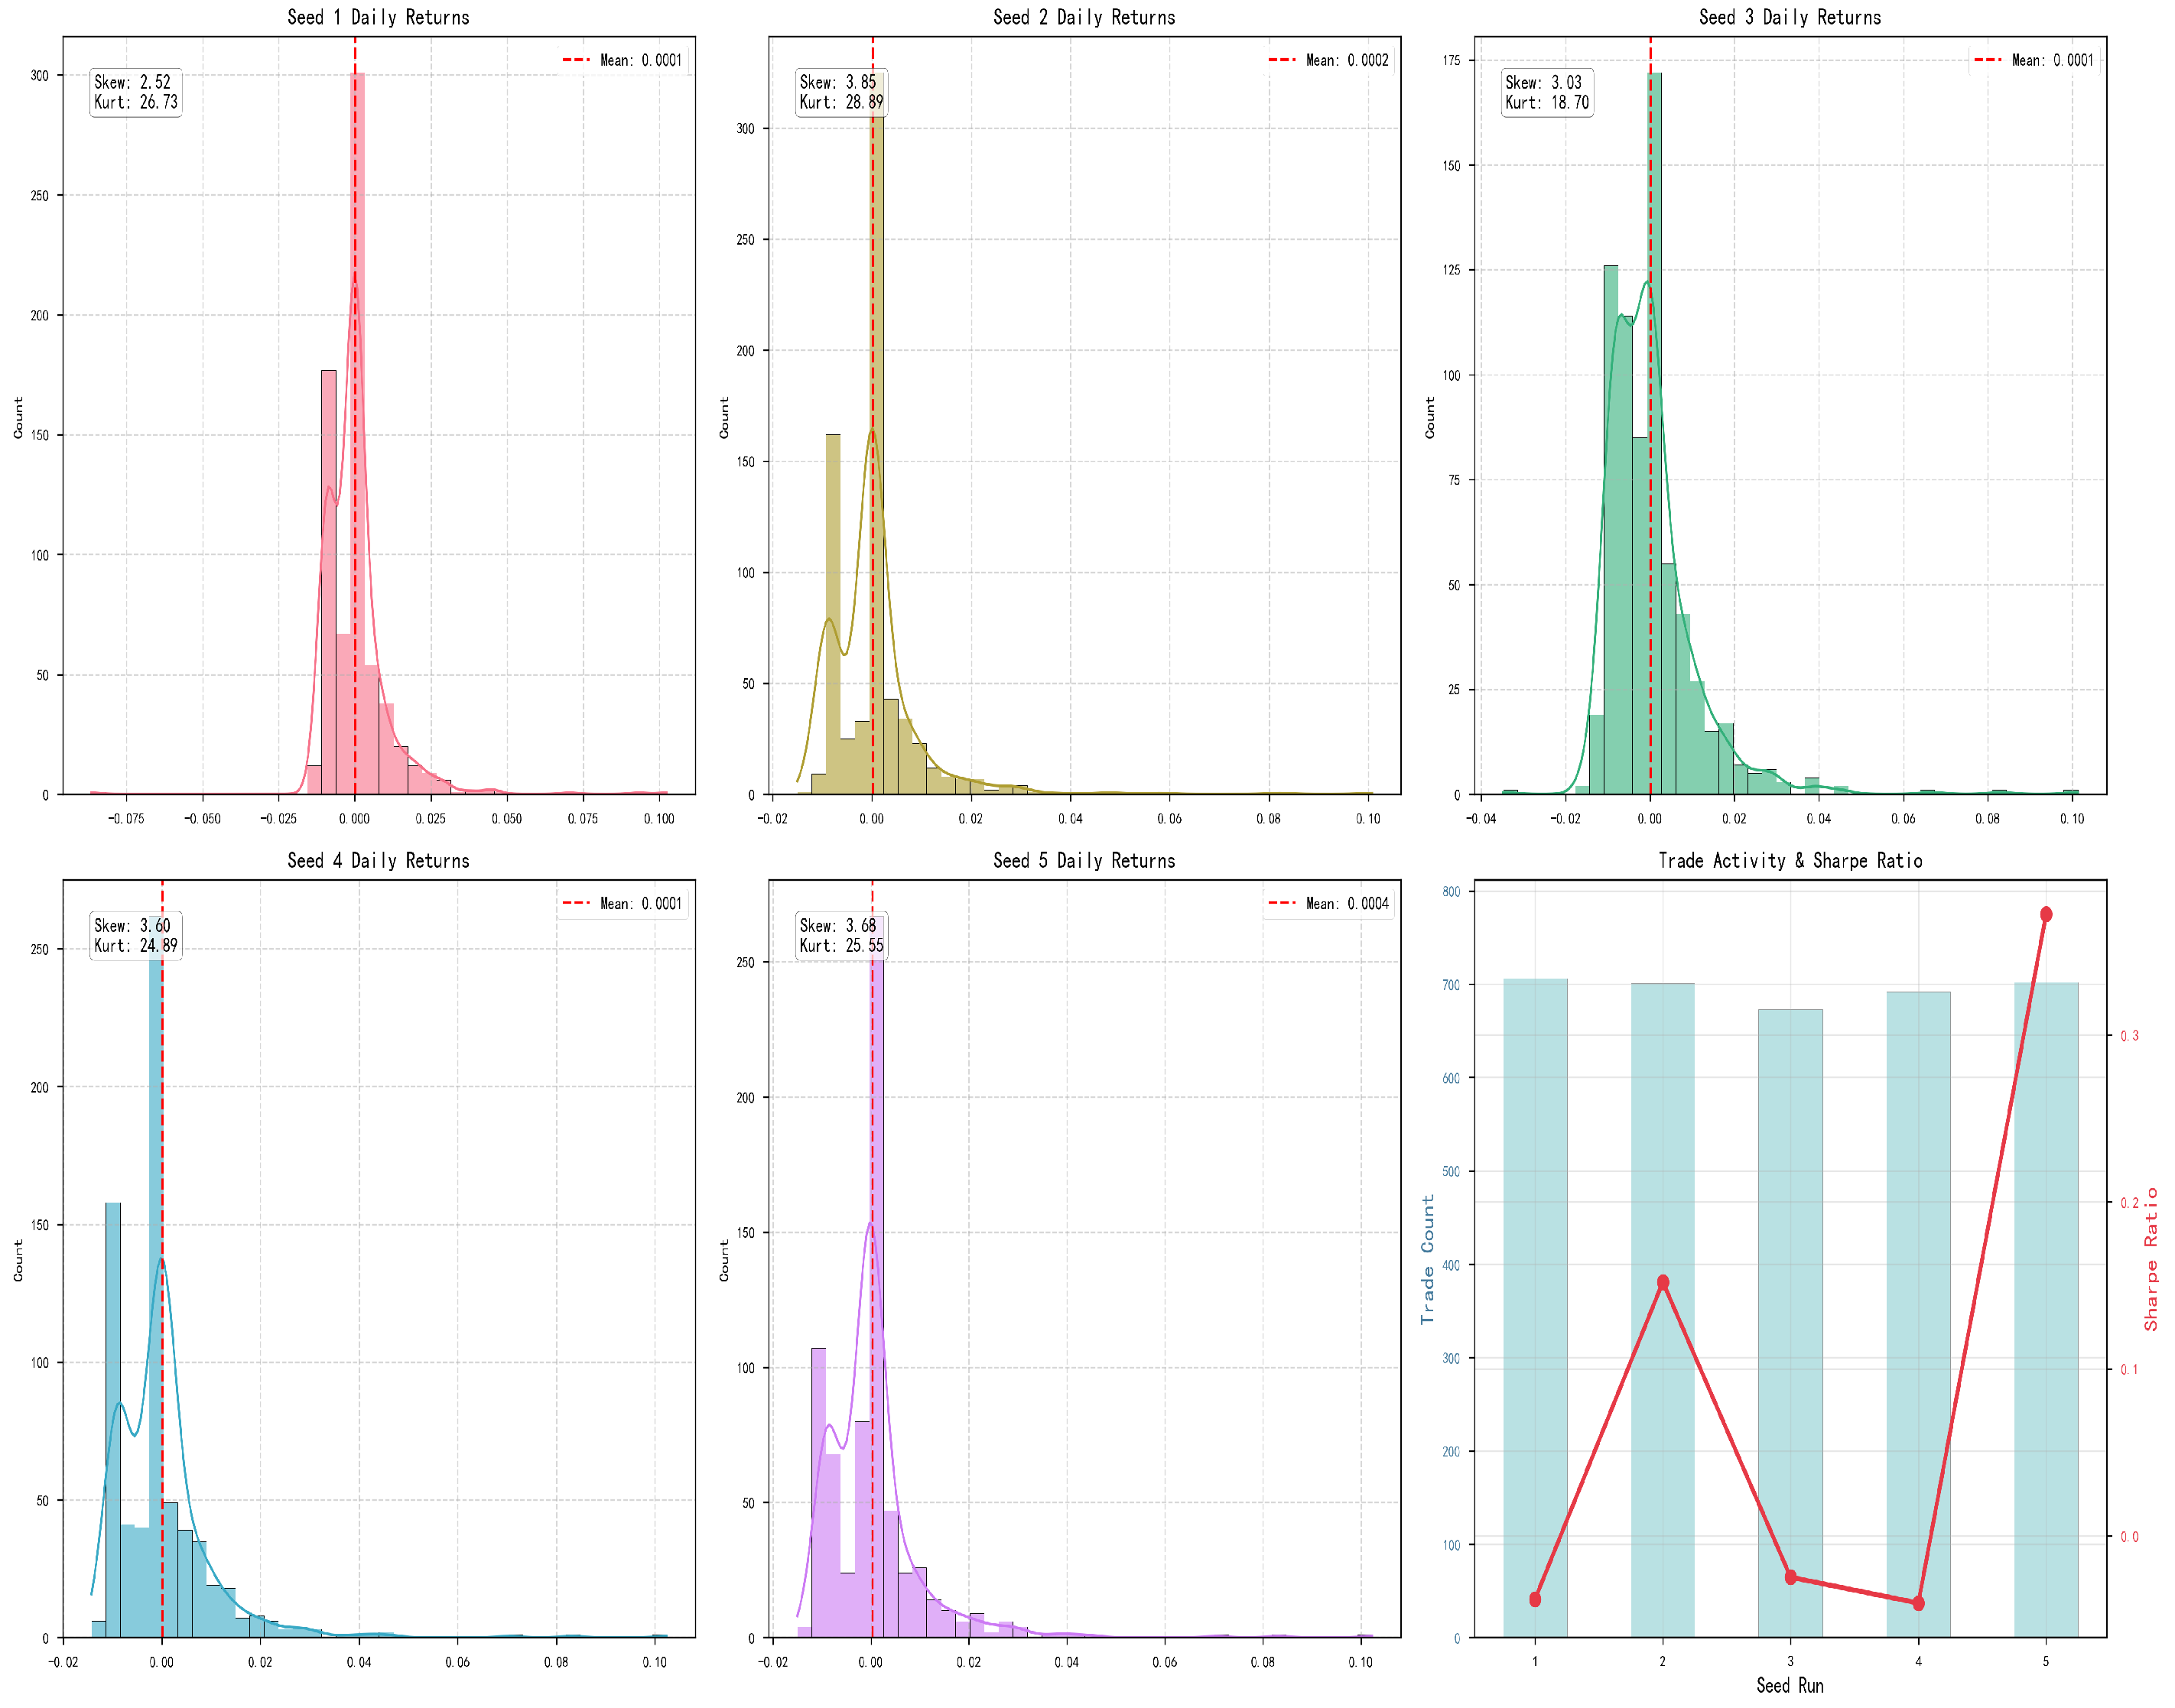
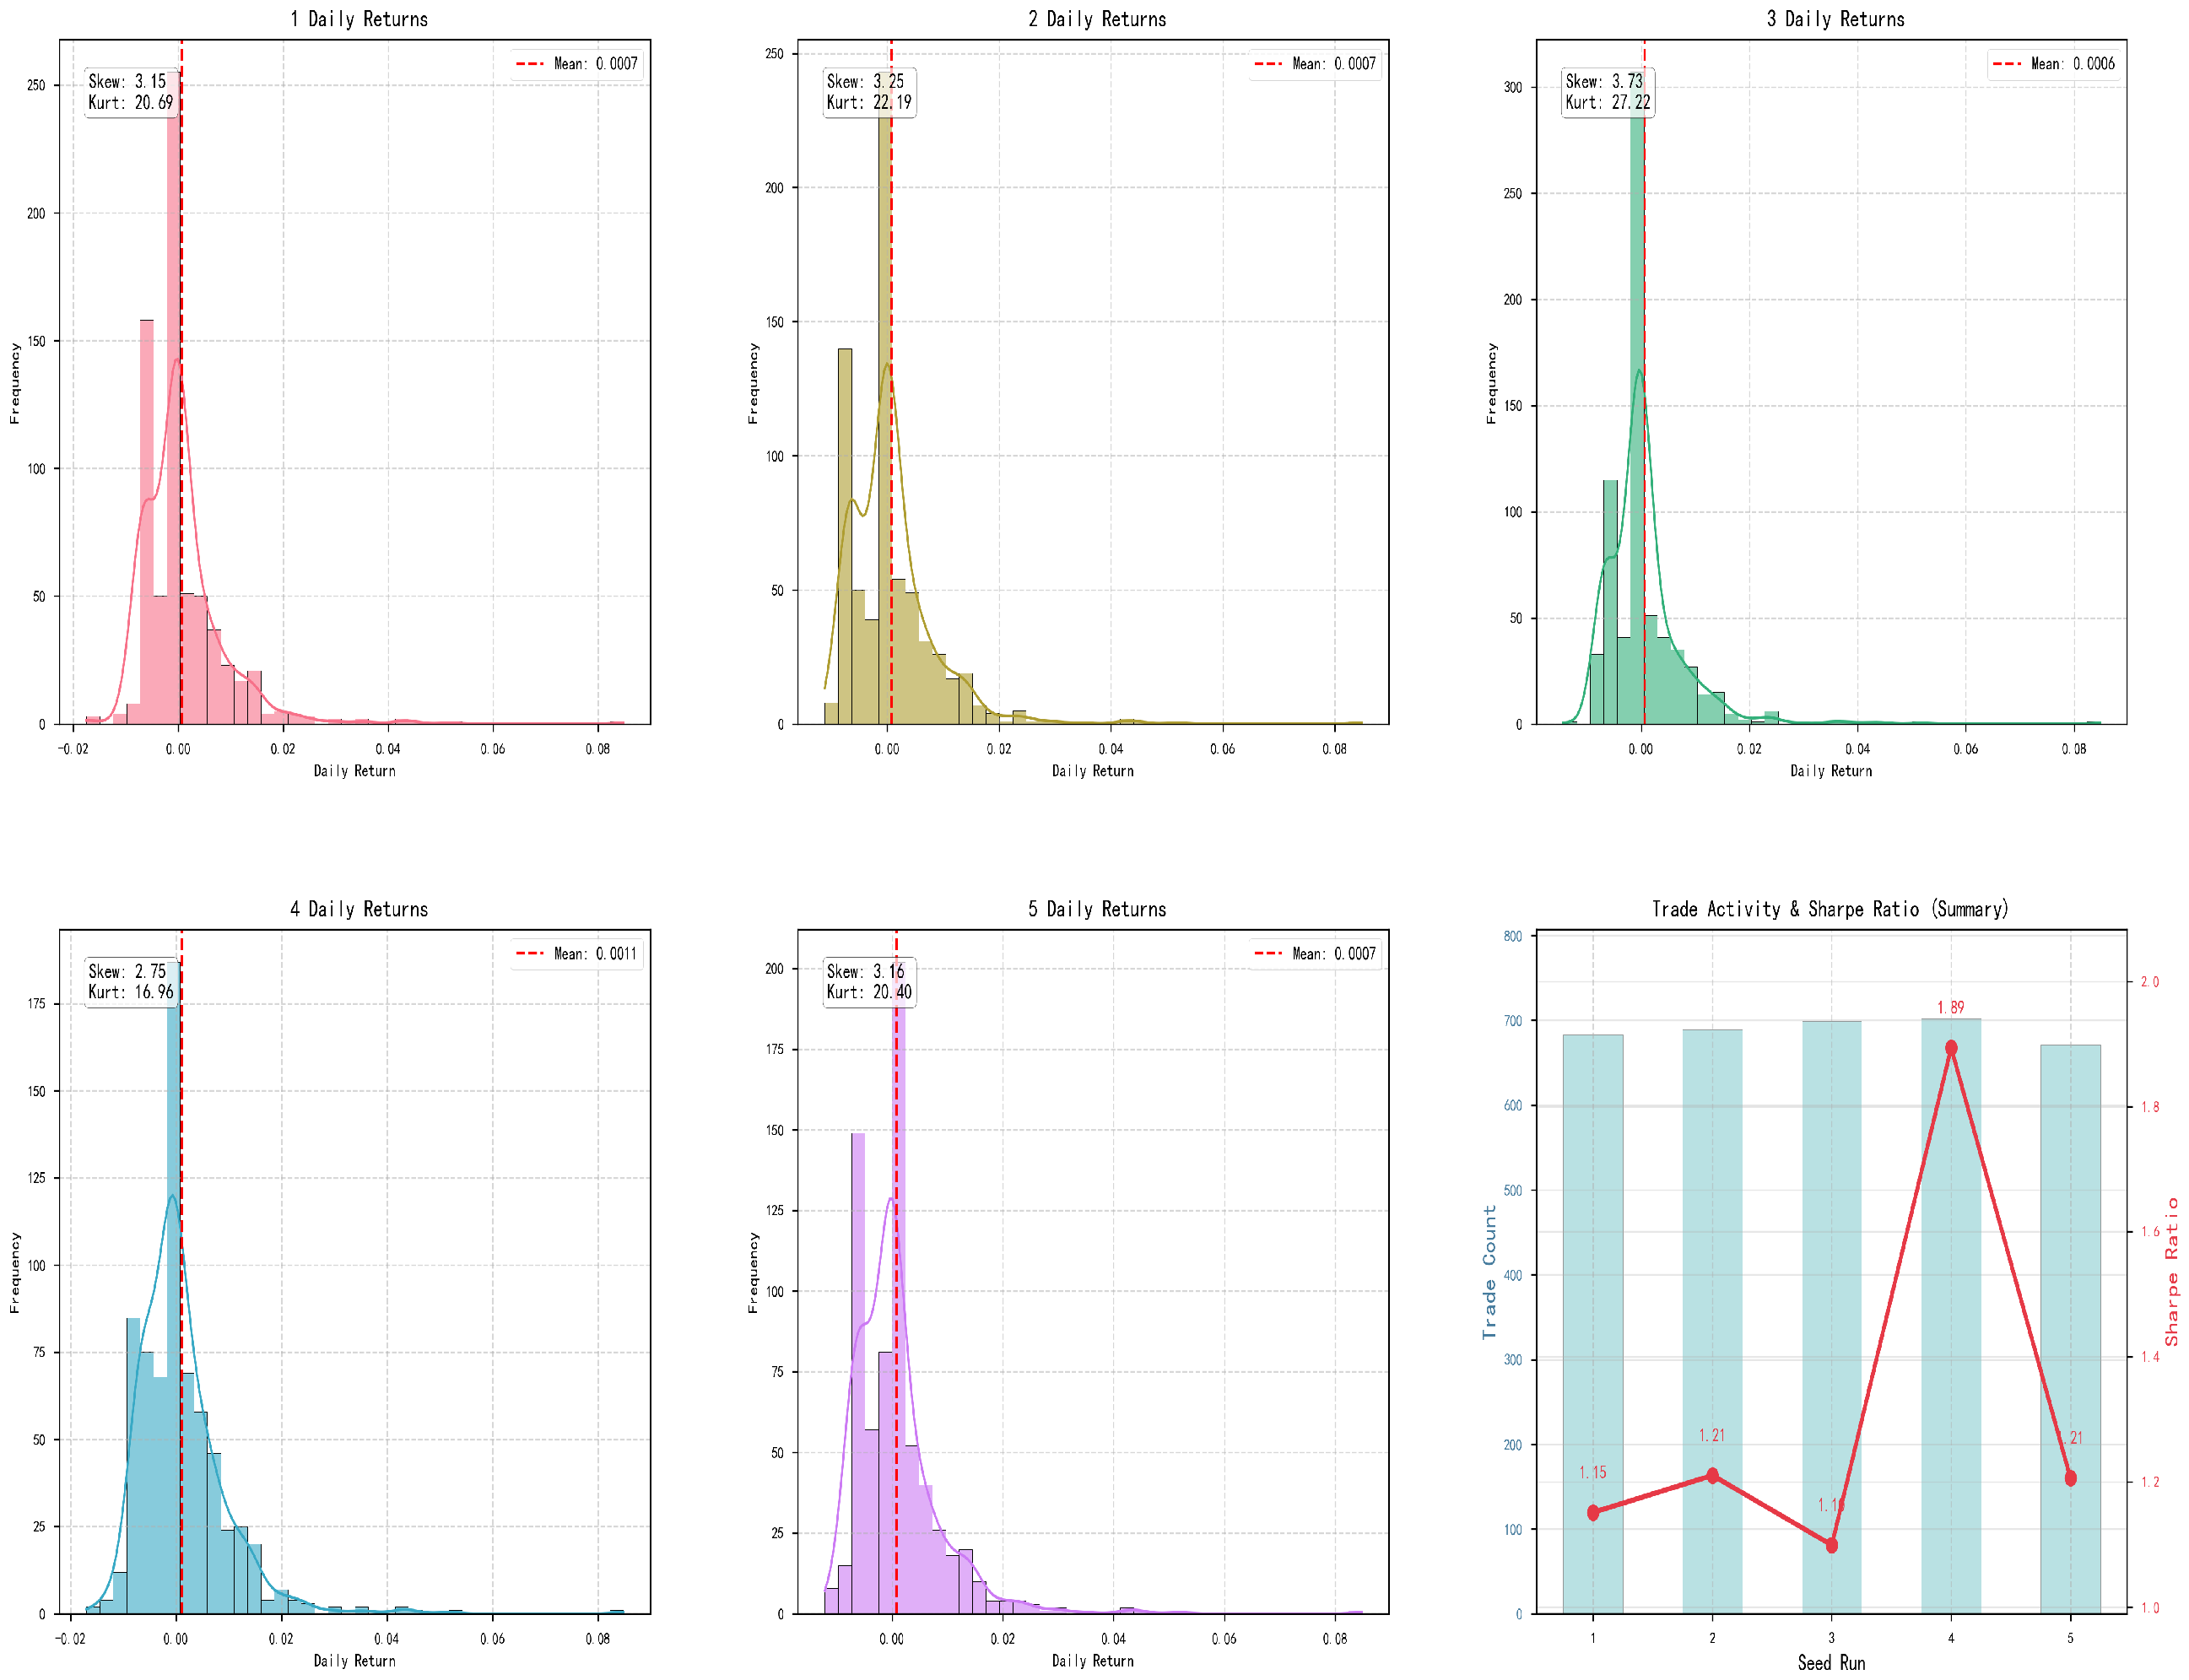
Figure 11, Figure 12, Figure 13, Figure 14 and Figure 15 present the statistical diagnostics of the models’ daily returns. In these figures, the frequency distribution histograms clearly exhibit “leptokurtic and fat-tailed” non-normal characteristics. Across all three indices, the daily return distributions demonstrate significantly high kurtosis (e.g., reaching 20.69–27.22 on CSI 300 and 28.89 on SZSE Seed 2) and positive skewness (consistently above 3.15 on CSI 300), indicating the agent’s tendency to profit from capturing long-tail opportunities. This distributional characteristic is further corroborated by the mean and standard deviation metrics summarized in Table 15, Table 18 and Table 21. Specifically, the CSI 300 model achieved an annualized return of , the SSEC model , and even for the weakest-performing stock (SZSE), the model maintained a positive return range of , demonstrating that the overall expected return remains high with controllable volatility despite experimental stochasticity. Furthermore, the “Trade Activity” bar charts reveal highly consistent trading frequencies across different random seeds (approximately 500 to 700 trades). This confirms that the DDQN agent relies on stable trading logic, thereby smoothing the equity curve over the three-year testing period.
Figure 15.
Daily Returns on CSI 300.
Table 21.
Statistical Diagnostics on CSI 300.
5.5. Market Regime Analysis
We further examine the performance of these three stocks under different market conditions. Here, we classify the markets into bull markets, bear markets, and volatile markets according to threshold rules and moving averages, as shown in Table 22.
Table 22.
Market segmentation.
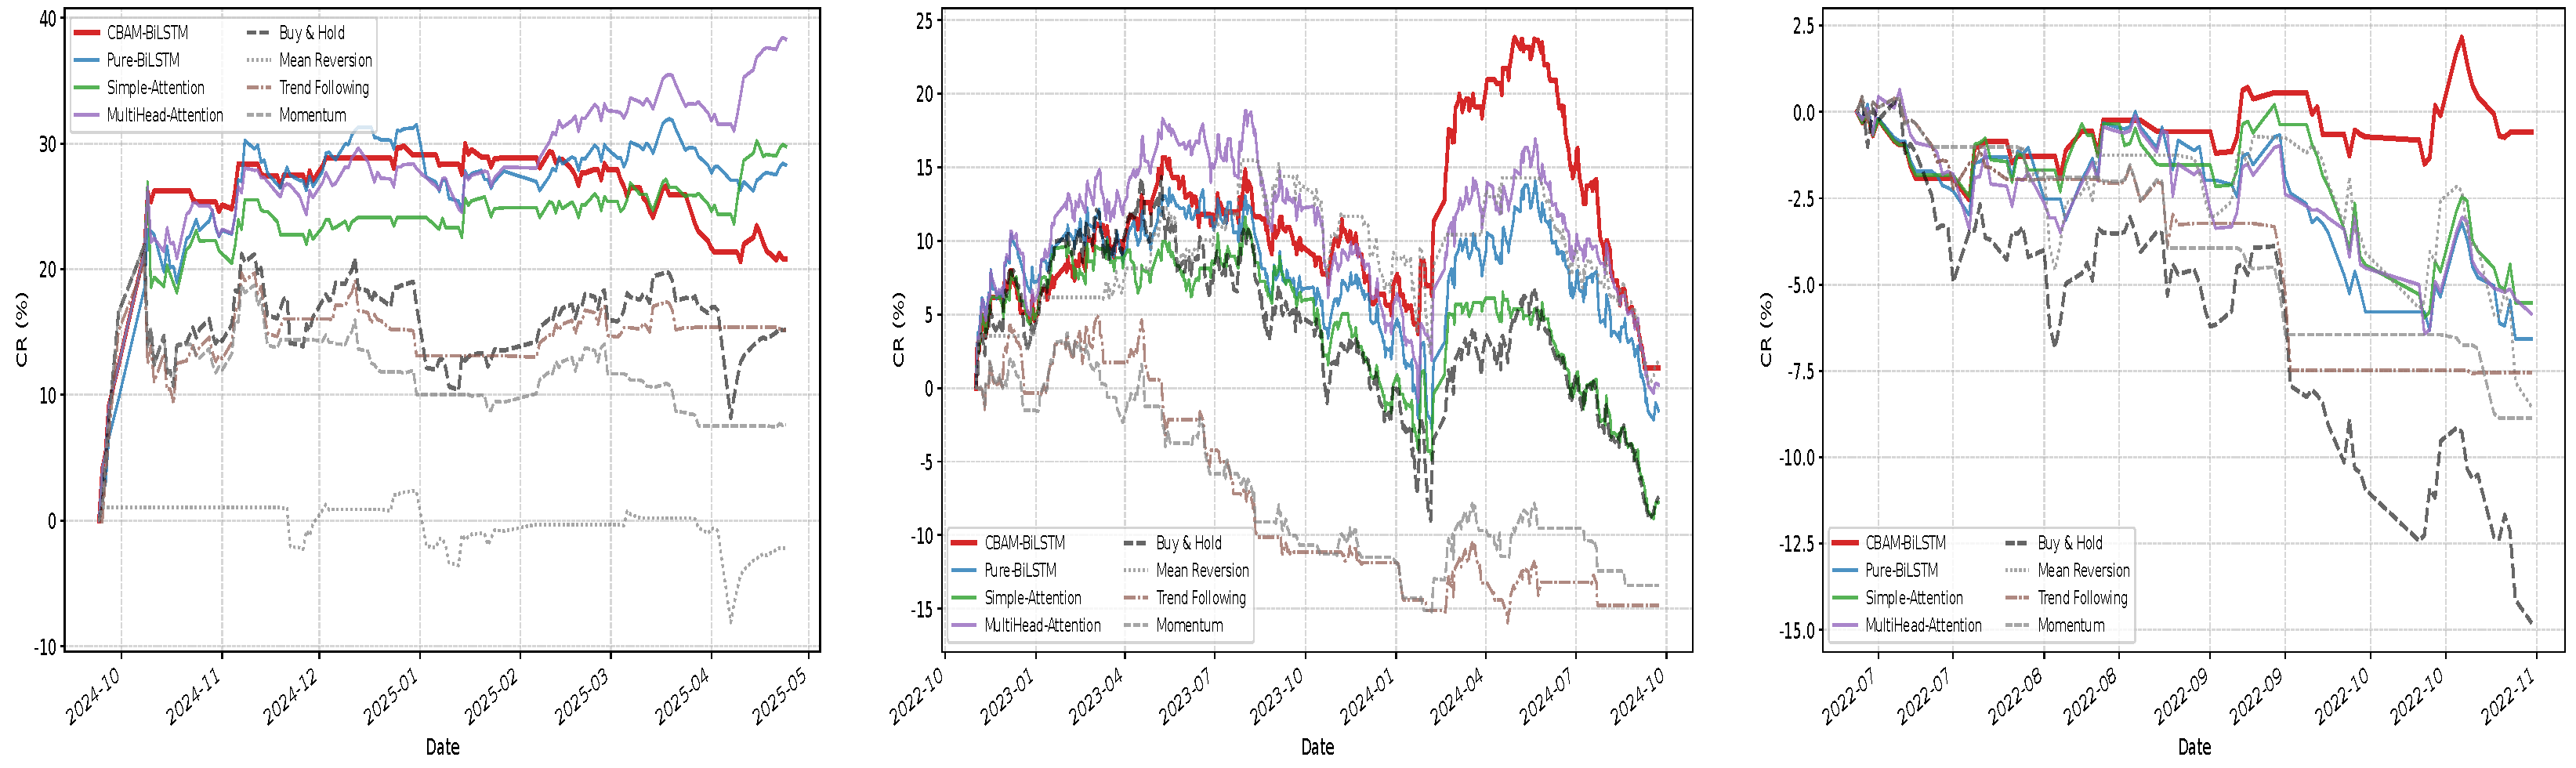
As presented in Table 23 and Figure 16, the deep reinforcement learning models demonstrate exceptional downside risk control capabilities for the SSEC. Under extreme bear-market conditions, while the traditional Buy and Hold (BH) strategy endures a severe maximum drawdown of , the proposed CBAM-BiLSTM model effectively alleviates continuous declines, stabilizing the cumulative return at with a maximum drawdown (MD) of only . Moreover, during the bull-market phase, the CBAM-BiLSTM model swiftly adapts to trend reversals, notably outperforming all traditional financial baselines and showcasing remarkable market adaptability.
Table 23.
Performance Comparison under Different Market Regimes for SSEC.
Figure 16.
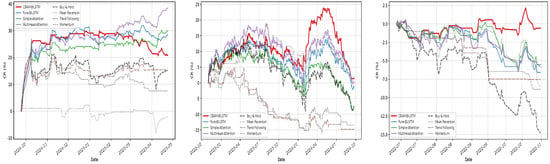
Returns of SSEC based on the different strategies across Market Regimes: Bull (left panel), Choppy (middle panel), and Bear (right panel).
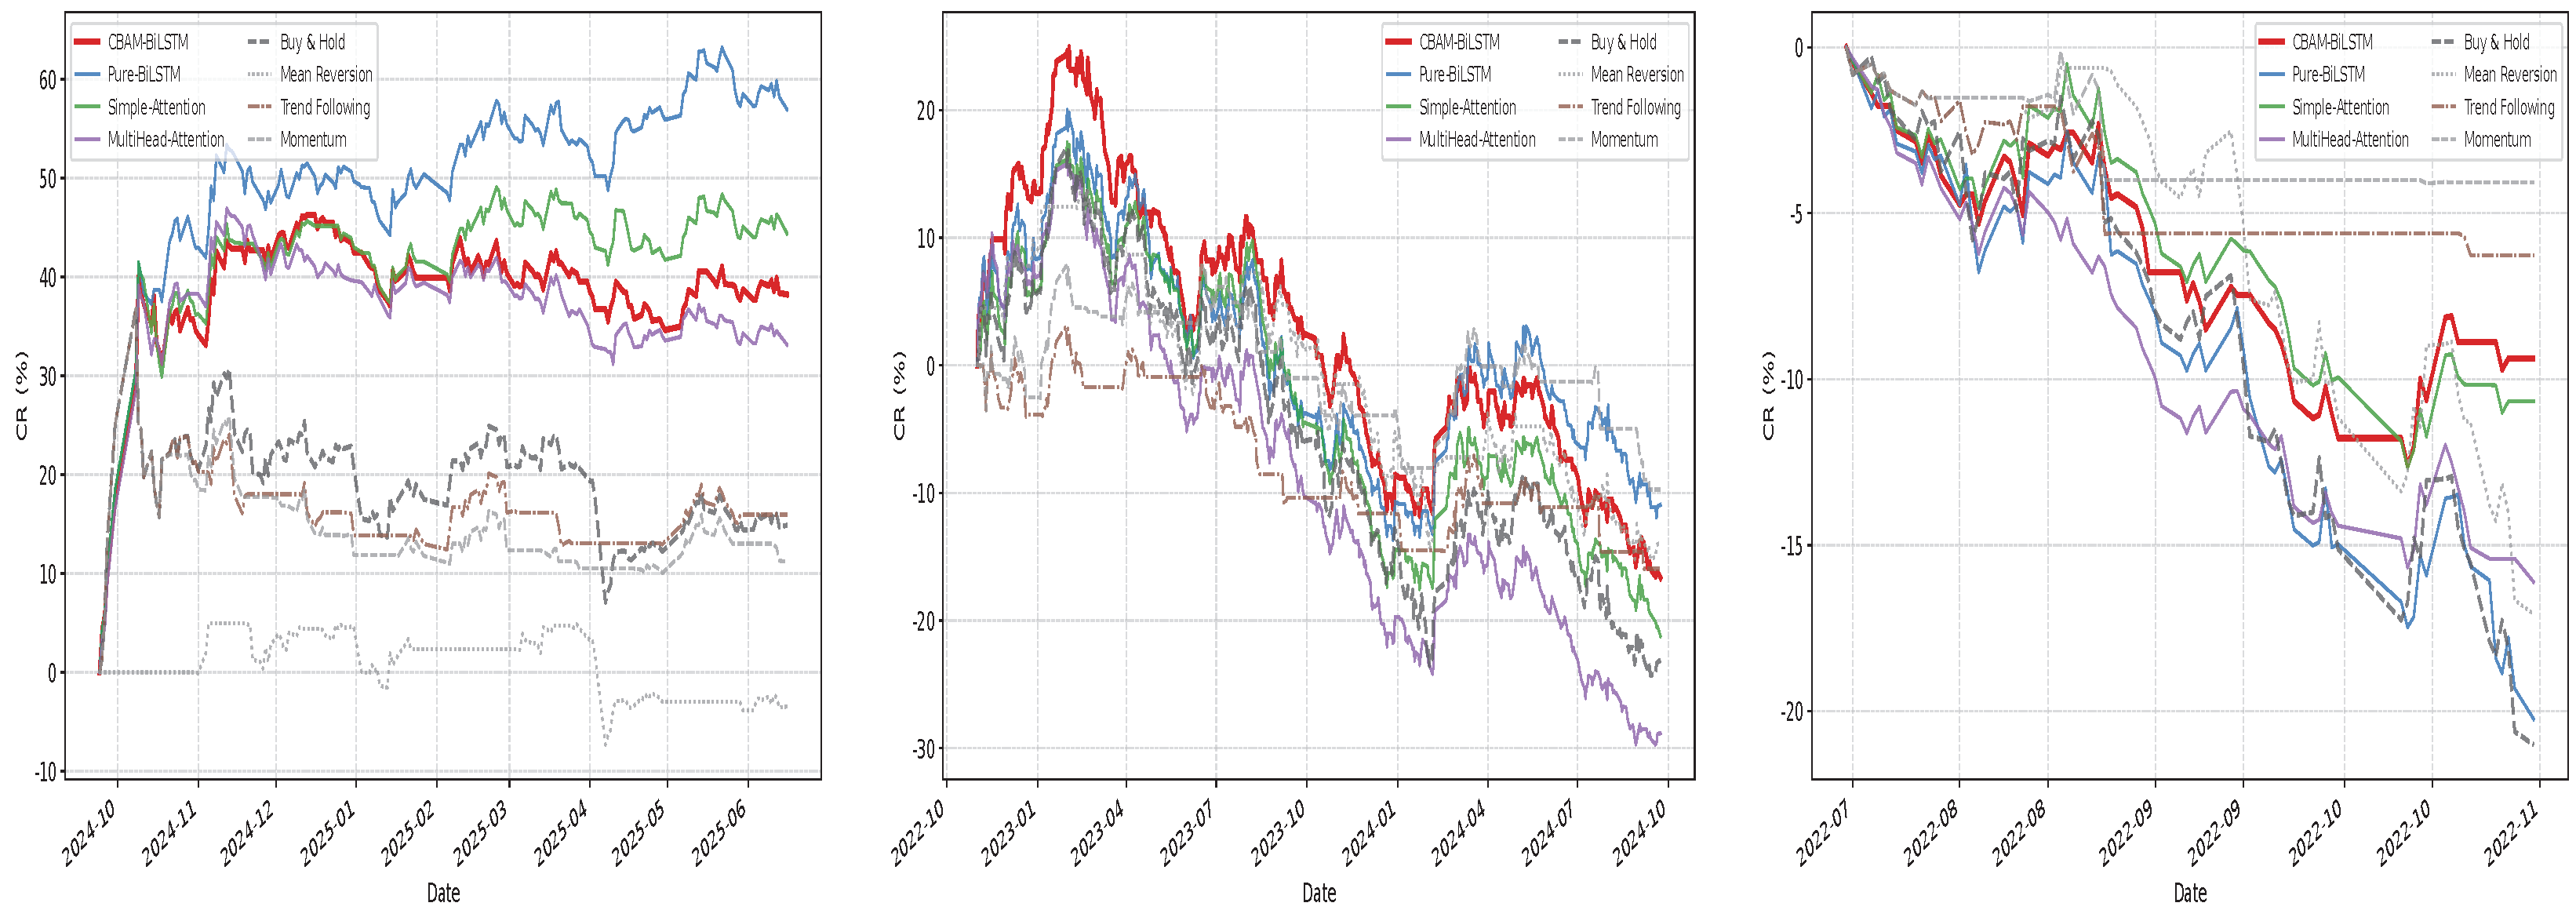
The Shenzhen Stock Exchange (SZSE) is generally characterized by relatively higher market volatility. The results of its regime analysis are presented in detail in Table 24 and Figure 17. Empirical data indicates that deep learning strategies possess strong “offensive” capabilities during upward market trends. Specifically, in the Bull Market, the Pure BiLSTM and BiLSTM SATT models achieve substantial cumulative returns of 56.95% and 44.39% respectively, along with excellent Sharpe Ratios (SR) of 3.46 and 2.67, while the Buy and Hold (BH) strategy only attains a CR value of 14.87%. Although these models also experience profit drawdowns during extended Choppy and Bear markets, they demonstrate remarkable resilience in risk-adjusted returns when compared to traditional benchmark strategies.
Table 24.
Performance Comparison under Different Market Regimes for SZSE.
Figure 17.
Returns of SZSE based on the different strategies across Market Regimes: Bull Market (left panel), Choppy Market (middle panel), and Bear Market (right panel).
Table 25 and Figure 18 illustrate the trading performance of the CSI 300 asset. During the Bear Market phase, while the BiLSTM SATT model achieves a unique counter-trend profit (), the proposed CBAM-BiLSTM model showcases critical risk resilience, effectively limiting the loss to compared to the massive plunge of the Buy and Hold (BH) strategy. In the Choppy Market, CBAM-BiLSTM outperforms all other architectures, delivering the highest stability with a CR of and an SR of , validating its superiority in uncertain environments. Furthermore, in the Bull Market, although the BiLSTM MHATT model leads with a return, CBAM-BiLSTM also exhibits strong momentum capture capabilities, achieving a robust return.
Table 25.
Performance Comparison under Different Market Regimes for CSI 300.
Figure 18.
Returns of CSI 300 based on the different strategies across Market Regimes: Bull Market (left panel), Choppy Market (middle panel), and Bear Market (right panel).
5.6. Ablation Study
We also conduct an ablation study to evaluate the contributions of various components within the CBAM-BiLSTM model. The comparative results, which encompass the model with the Genetic Algorithm removed (RM GA), the model with sentiment indicators removed (RM Sentiment), the model with VMD removed (RM VMD), the standard LSTM (LSTM), BiLSTM, and CBAM-BiLSTM, are presented in Table 26.
Table 26.
Ablation Study Results.
We used cumulative return rate (CR), annualized return rate (AR), annualized volatility (AV), sharpe ratio (SR), maximum drawdown (MD) and daily average turnover ratio (AT) as the evaluation indicators.
Table 26 presents the detailed ablation study results obtained by isolating specific components to quantify their contributions within the hybrid framework. The experimental data first confirm the necessity of multimodal feature engineering: removing either the VMD decomposition or sentiment indicators consistently degrades performance across indices; notably, on the SZSE, excluding VMD caused the CR to plummet from 3.27% to −2.97%, validating the necessity of decomposing non-stationary series into stationary modes to effectively capture market dynamics. Moreover, the proposed CBAM - BiLSTM significantly outperforms the baseline BiLSTM (with a CR of 20.03% on SSEC) and LSTM (with a CR of 14.92% on SSEC), indicating the advantage of the dual-attention mechanism in feature enhancement.
6. Conclusions
In this study, we propose an adaptive quantitative trading model that systematically integrates signal decomposition, multi-source feature fusion, and deep reinforcement learning. This model employs VMD to effectively mitigate the intrinsic non-stationarity of financial time series, combined with quantified sentiment indicators to provide enhanced market insights. To construct an efficient and low-noise state space, a Genetic Algorithm (GA) is utilized to intelligently select an optimal feature subset from the multi-source heterogeneous data, thereby eliminating redundant information. The core of our decision-making system employs a multi-level attention mechanism to dynamically reduce noise and capture long-term temporal dependencies. Through experiments across the SSEC, SZSE, and CSI 300 indices, we demonstrate that our proposed model significantly outperforms both traditional strategies and standard DRL baselines. Furthermore, to demonstrate our model’s effectiveness on single-name stocks, we conducted experiments on six individual stocks from Chinese A-share market. The comprehensive results, including performance metrics and cumulative return curves, have been presented in Appendix B. Thees results indicate that our model maintains a significant performance advantage over baseline strategies for these individual stocks, further validating its robustness. Future work will aim to verify the generalizability of the CBAM-BiLSTM-DDQN framework by applying it to a broader range of global markets, such as futures, foreign exchange, and international equity markets.
Author Contributions
Conceptualization, Y.Z. and Y.W.; methodology, Y.Z. and M.Z.; software, F.S.; validation, M.Z. and F.S.; formal analysis, M.Z.; data curation, M.Z. and F.S.; writing—original draft preparation, Y.Z. and M.Z.; writing—review and editing, Y.Z.; supervision, Y.W. All authors have read and agreed to the published version of the manuscript.
Funding
Yan Zhang’s research was supported by the National Social Science Foundation of China (No.23BTJ054), and open project of Joint Lab for Statistics and Finance of NAU (No.2025JLSF309, 2025JLSF315, 2025JLSF323). Yuehua Wu’s research was funded by the Natural Science and Engineering Research Council of Canada (No. RGPIN-2023-05655).
Data Availability Statement
The data supporting the findings of this study are available from the corresponding author upon reasonable request.
Conflicts of Interest
The authors declare no conflicts of interest.
Correction Statement
This article has been republished with a minor correction in the Abstract. This change does not affect the scientific content of the article.
Abbreviations
The following abbreviations are used in this manuscript:
| Abbr. | Full Name |
| DRL | Deep Reinforcement Learning |
| DQN | Deep Q-Network |
| DDQN | Double Deep Q-Network |
| LSTM | Long Short-Term Memory |
| BiLSTM | Bi-directional Long Short-Term Memory |
| CBAM | Convolutional Block Attention Module |
| VMD | Variational Mode Decomposition |
| DBO | Dung Beetle Optimizer |
| BERT | Bidirectional Encoder Representations from Transformers |
| GA | Genetic Algorithm |
| MLP | Multi-Layer Perceptron |
| EMD | Empirical Mode Decomposition |
| OHLC | Open, High, Low, Close Prices |
| IMF | Intrinsic Mode Function |
| MA | Moving Average |
| EMA | Exponential Moving Average |
| MACD | Moving Average Convergence Divergence |
| RSI | Relative Strength Index |
| ATR | Average True Range |
| BB | Bollinger Bands |
| MFI | Money Flow Index |
| SSEC | Shanghai Stock Exchange Composite Index |
| SZSE | Shenzhen Stock Exchange Component Index |
| CSI 300 | China Securities Index 300 |
| BH | Buy and Hold |
| MR | Mean Reversion |
| TF | Trend Following |
Appendix A. Global Variational Mode Decomposition
This appendix provides a global Variational Mode Decomposition (VMD) analysis for the three datasets, as presented in Section 4.
Figure A1.
SSEC VMD Global Decomposition Result.
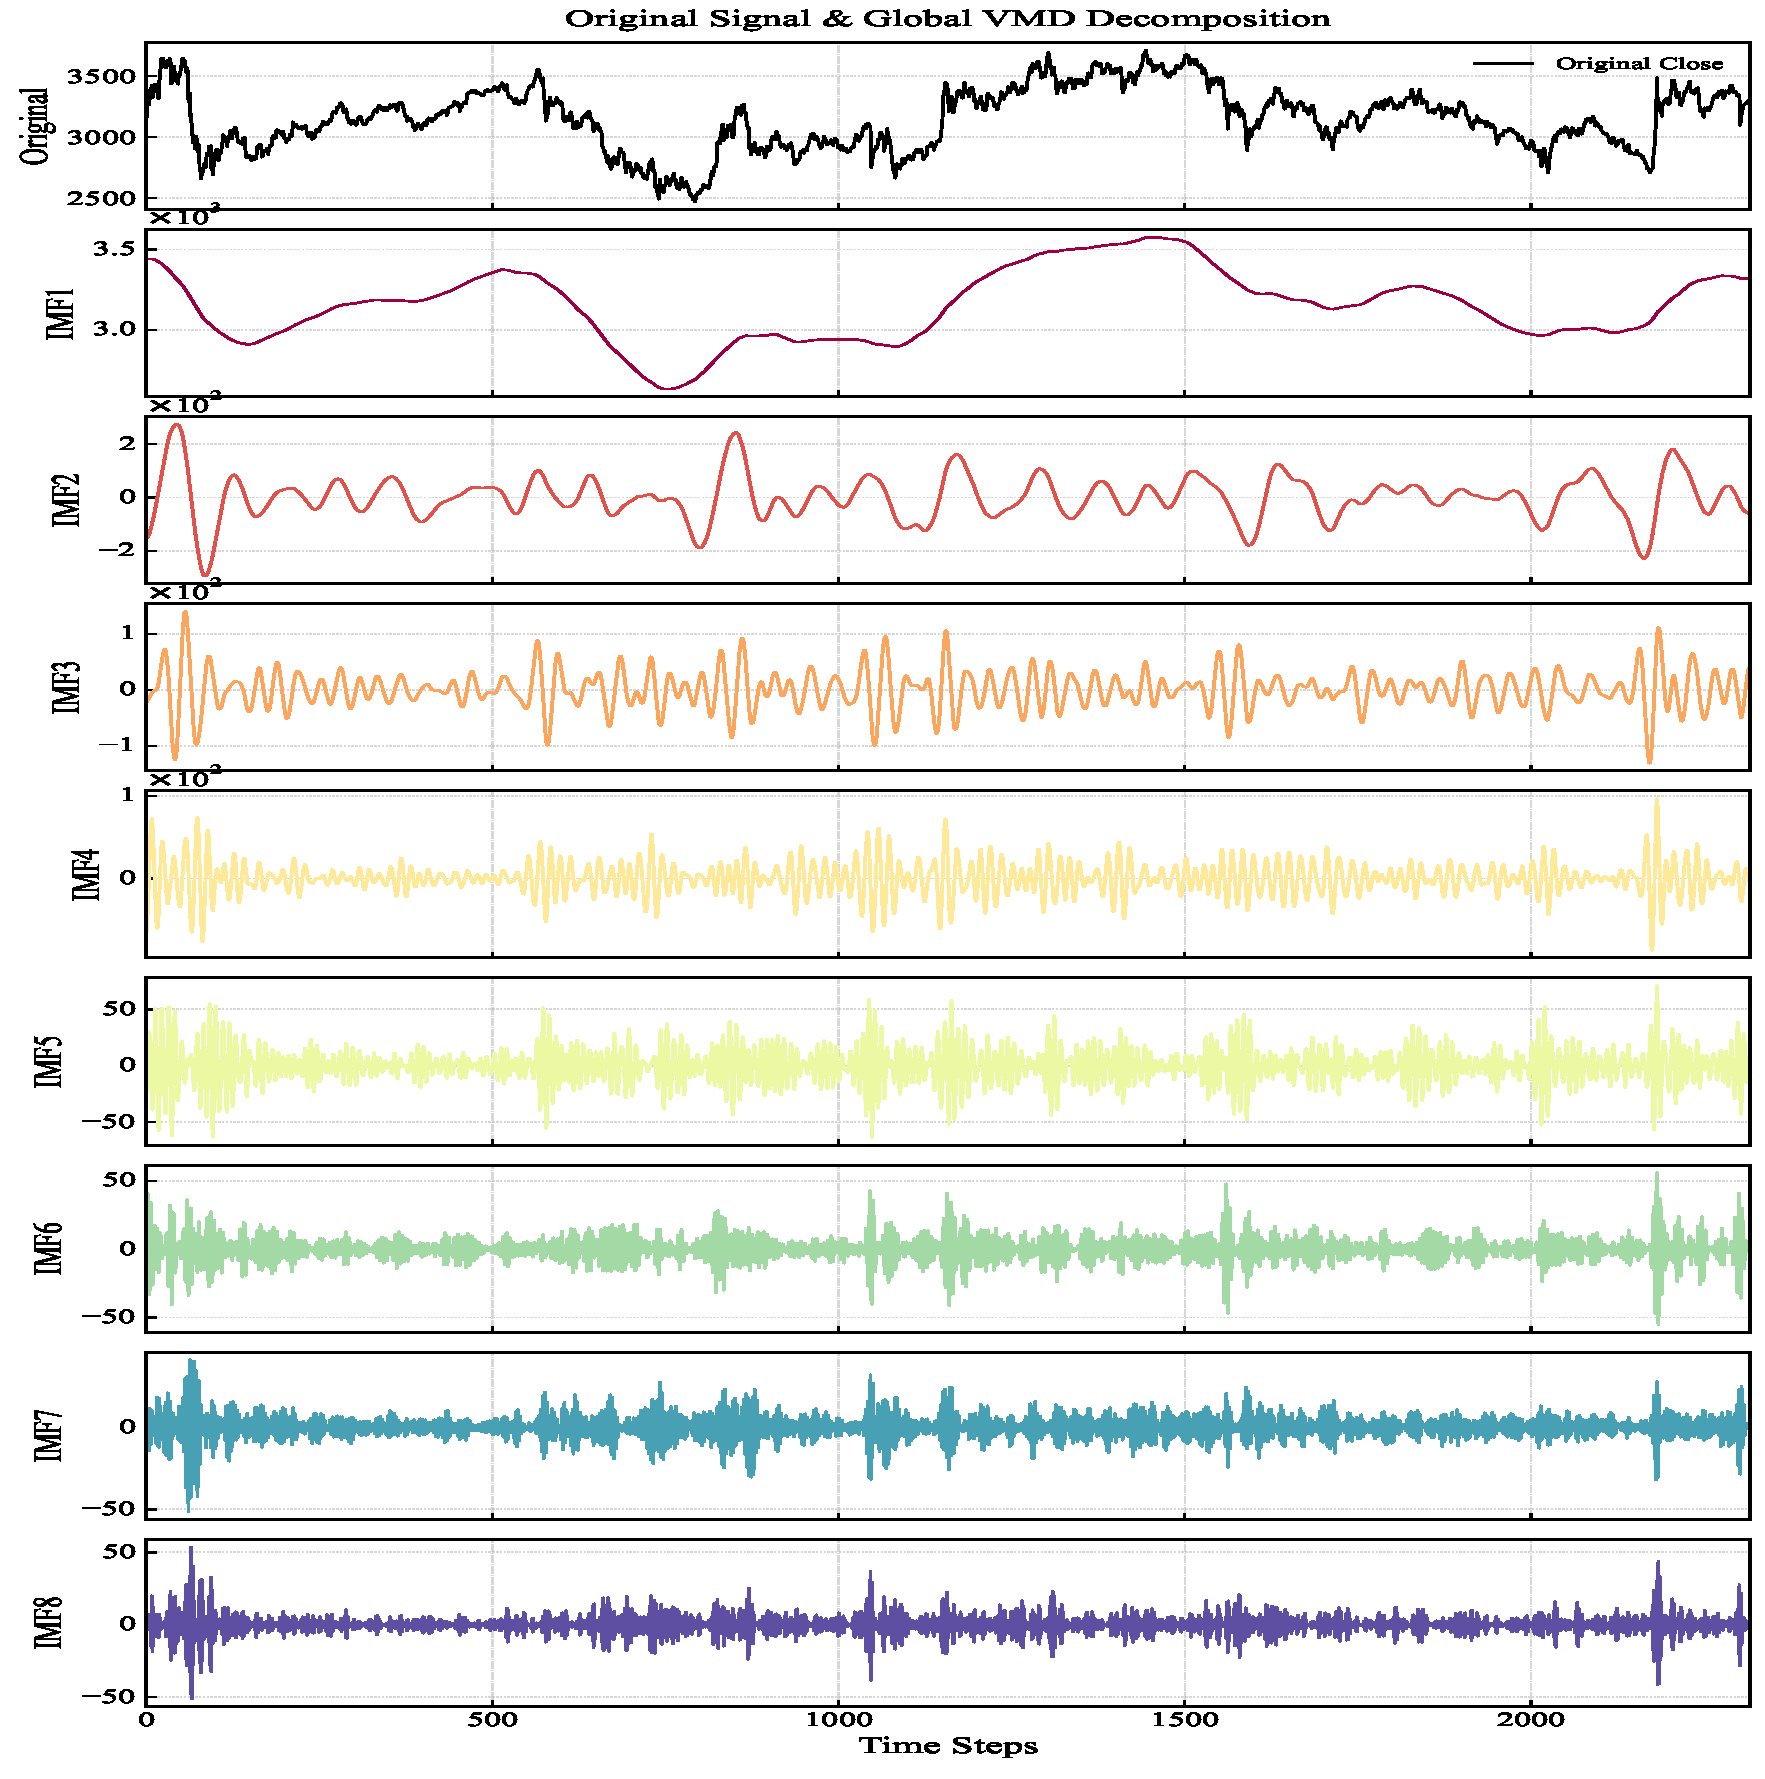
Figure A2.
SZSE VMD Global Decomposition Result.
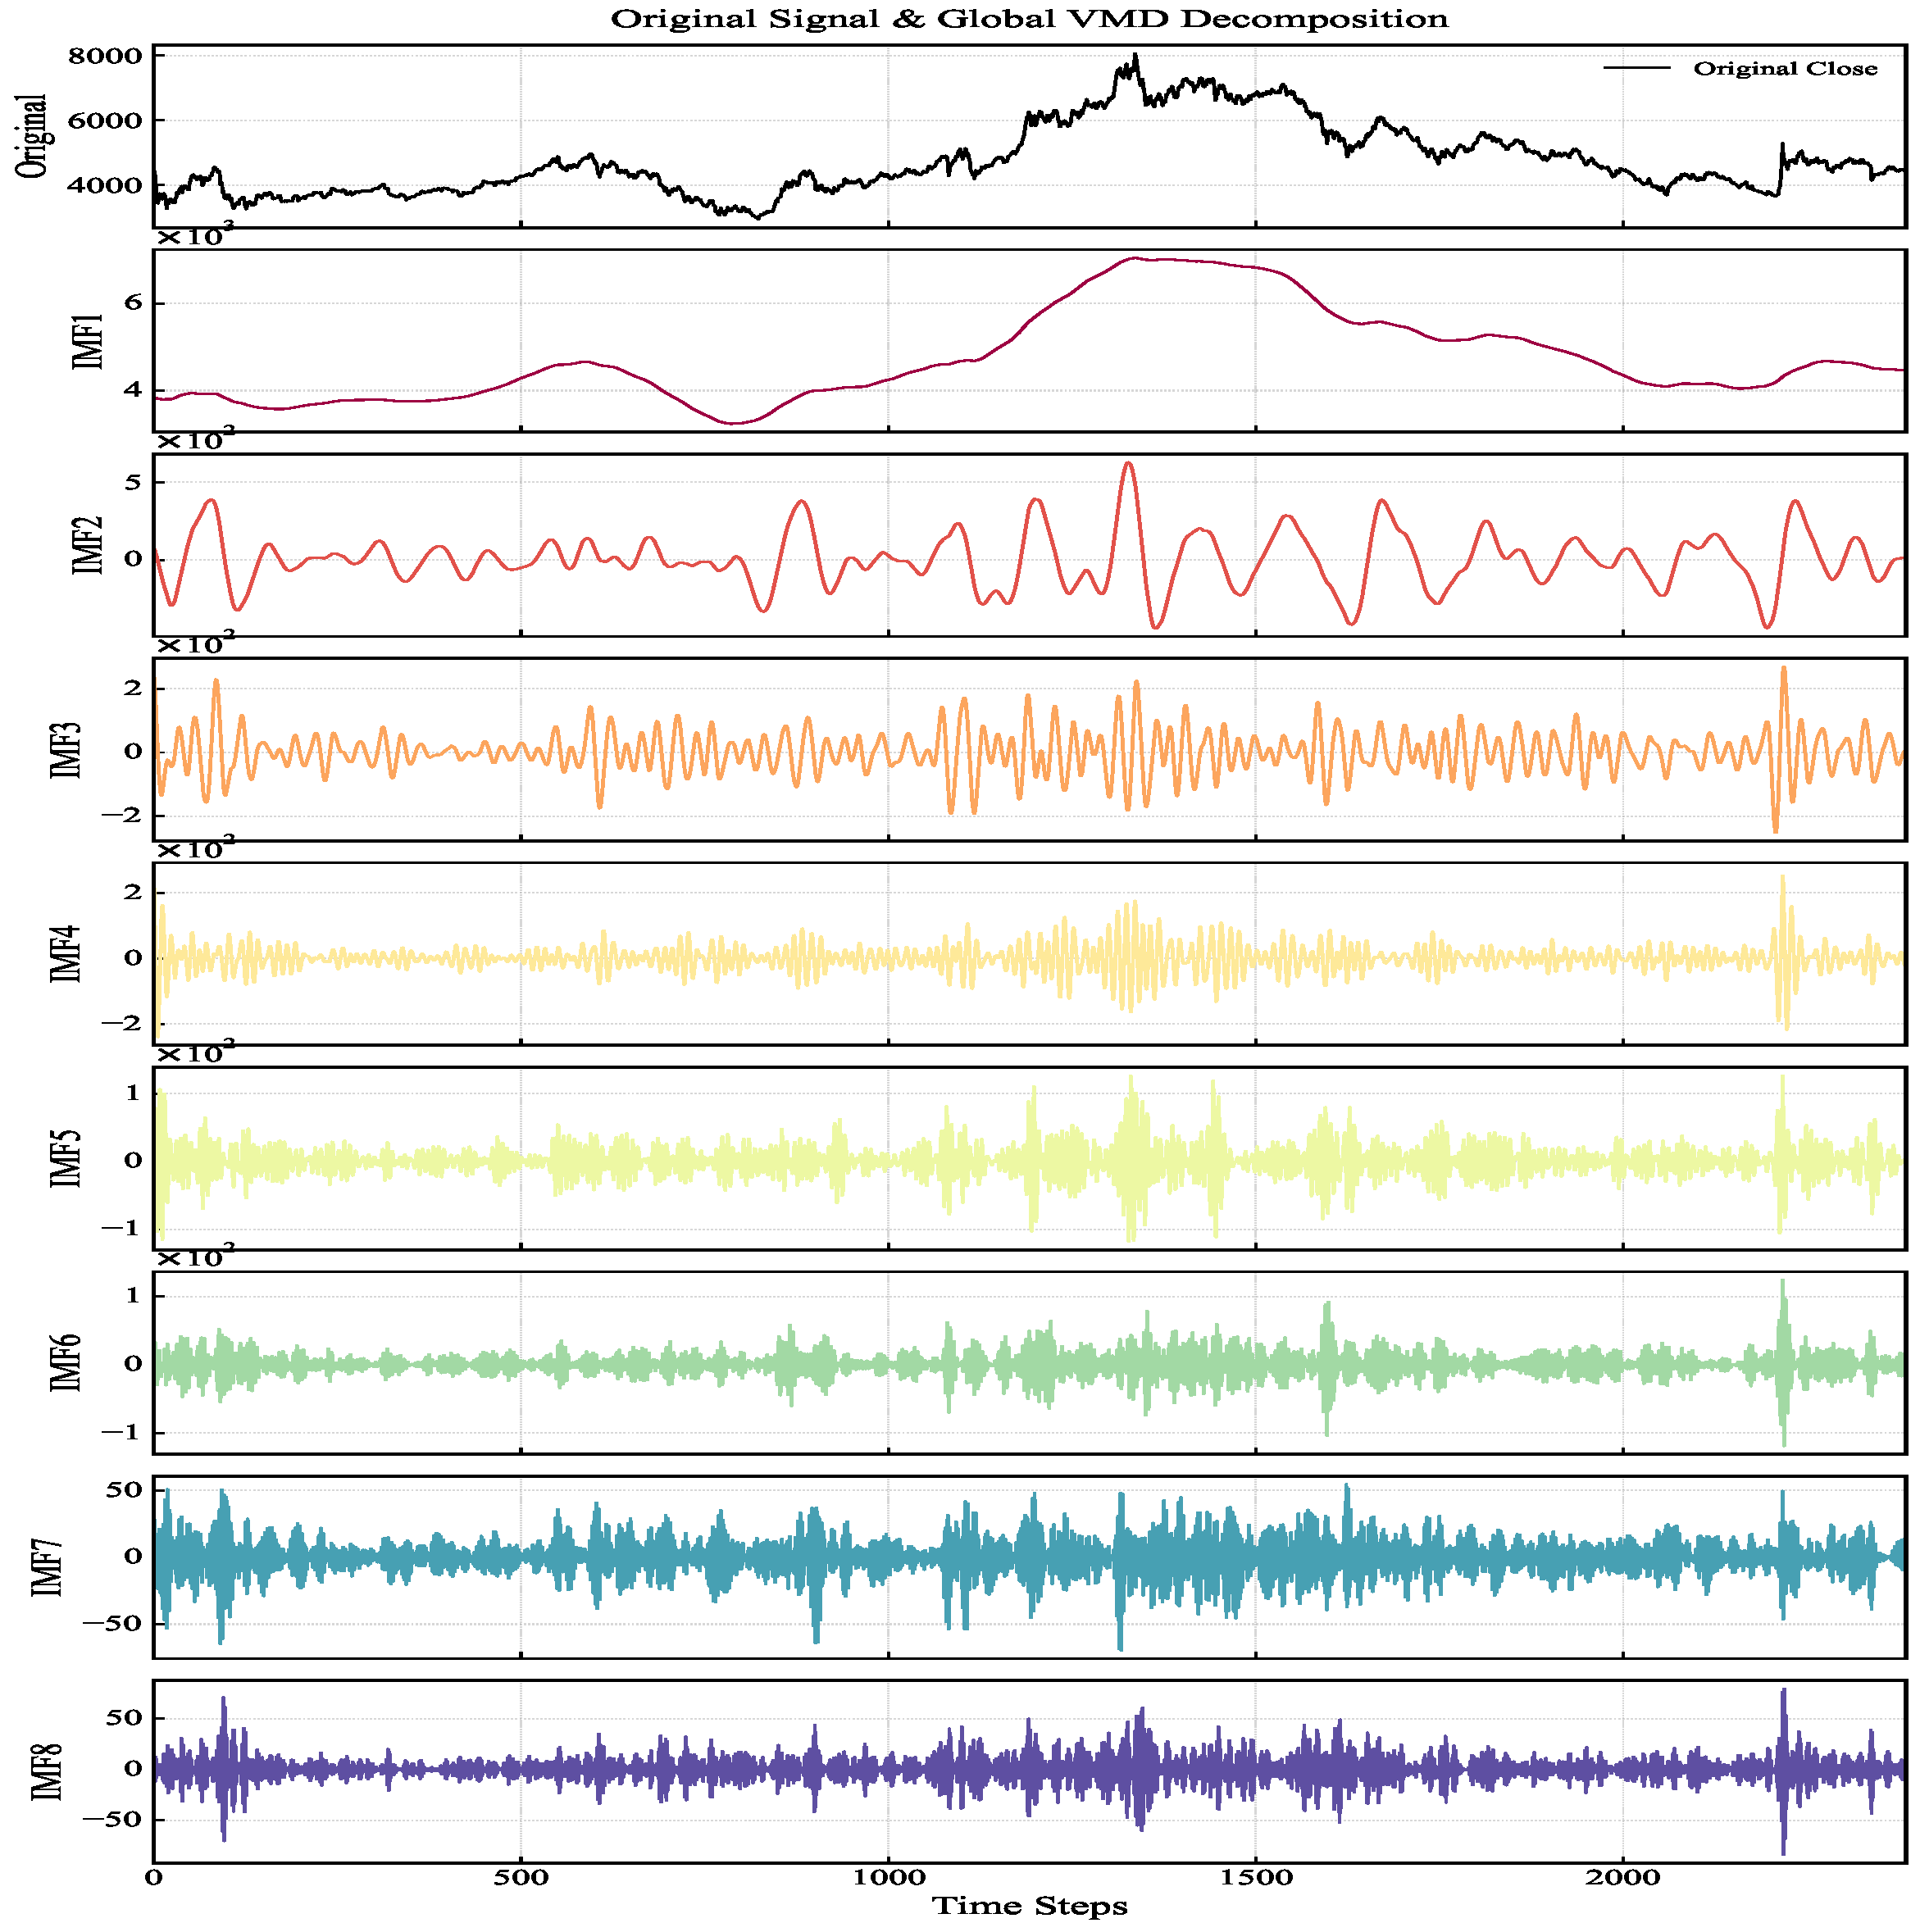
Figure A3.
CSI 300 VMD Global Decomposition Result.
Appendix B. Additional Results on Some Individual Stocks
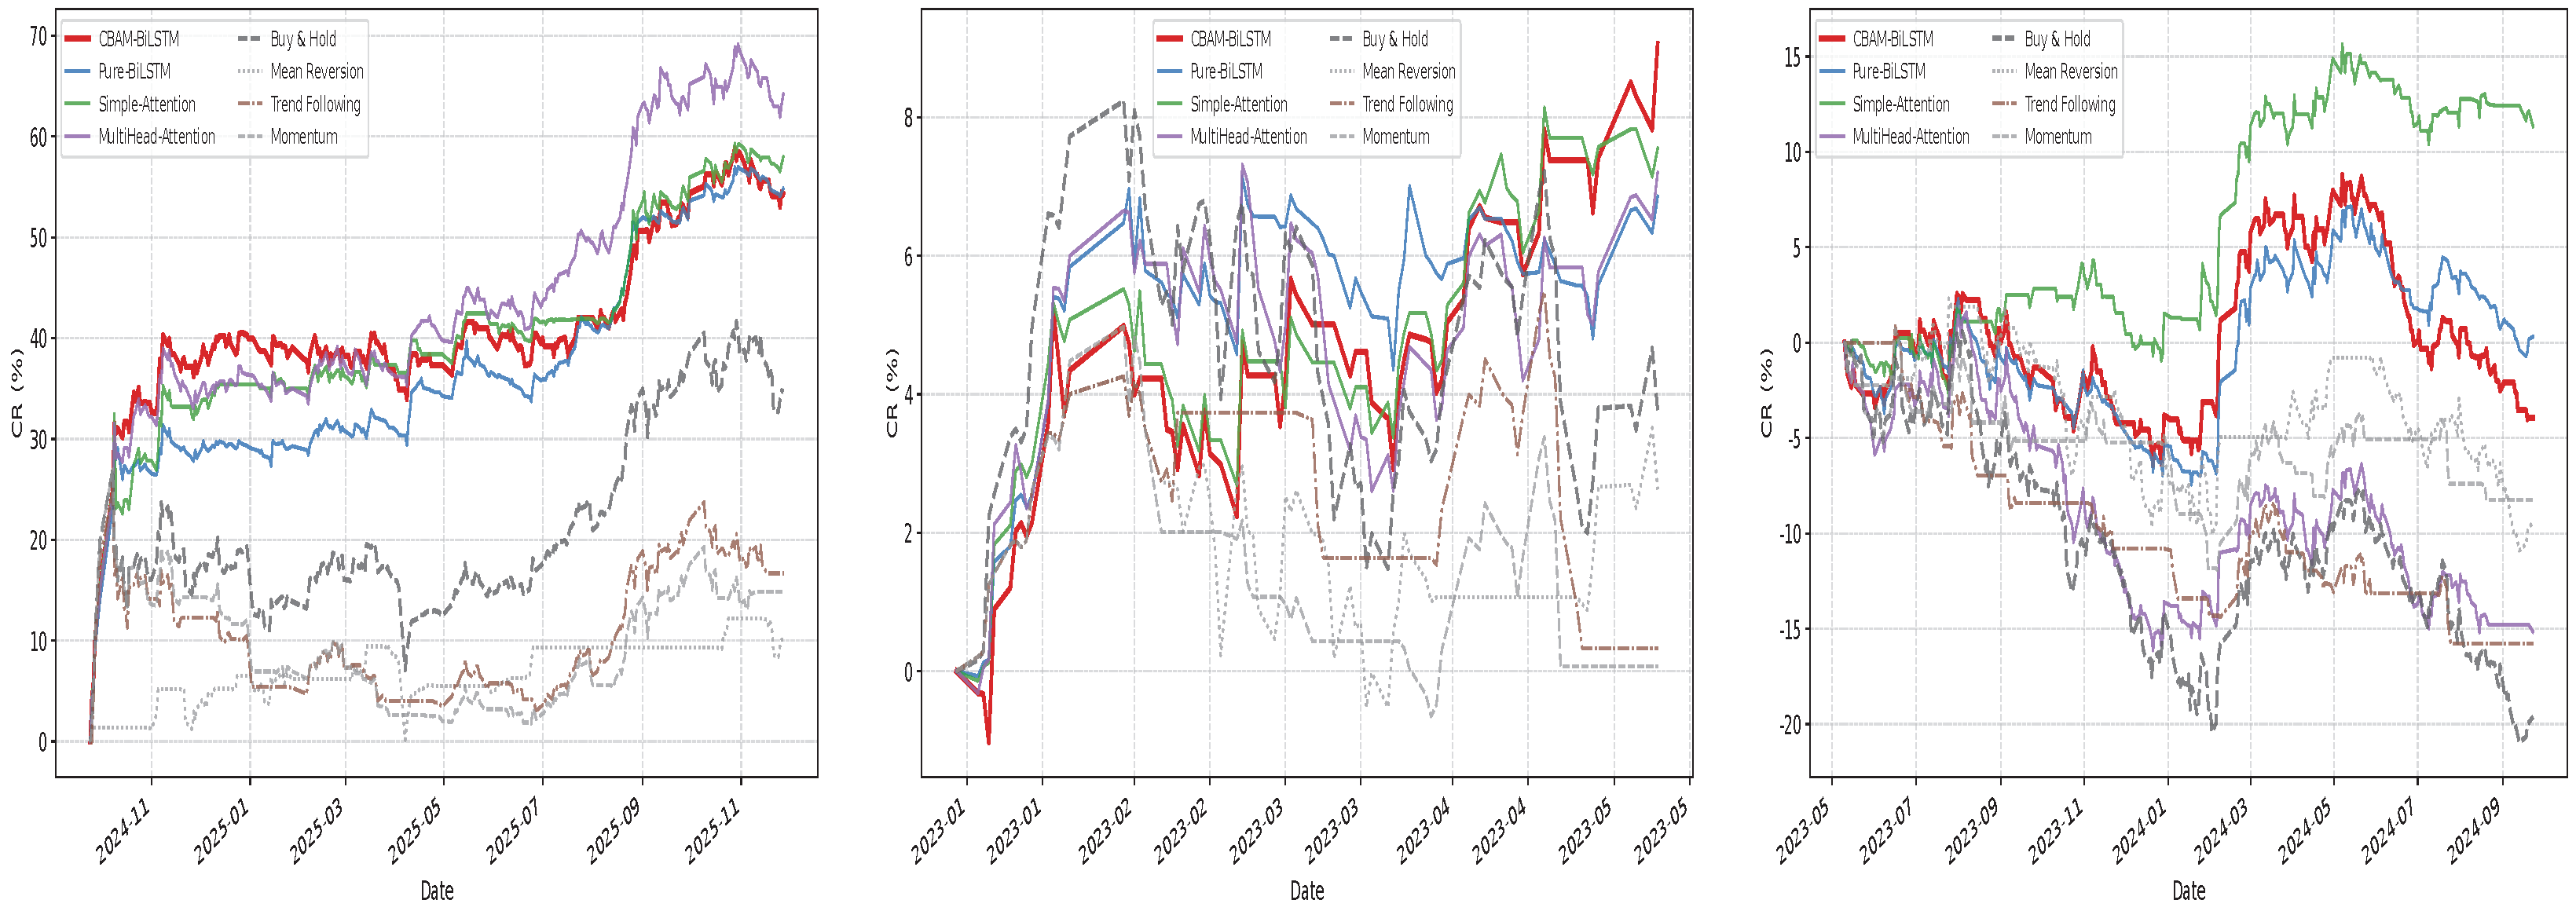
To further evaluate the performance of our model on additional individual stocks, we selected six additional stocks (002202, 600030, 600050, 600606, 601111, and 601601) from individual companies listed on the Chinese A-share market to showcase the superiority of the proposed model. The comparative performance results are illustrated in Figure A4, Figure A5, Figure A6, Figure A7, Figure A8 and Figure A9 and Table A1. All the data and feature extraction are derived from the corresponding stock data as well as the related opinions and news about the stocks.
Figure A4.
Comparative Analysis of Trading Strategies on 002202 Stock.
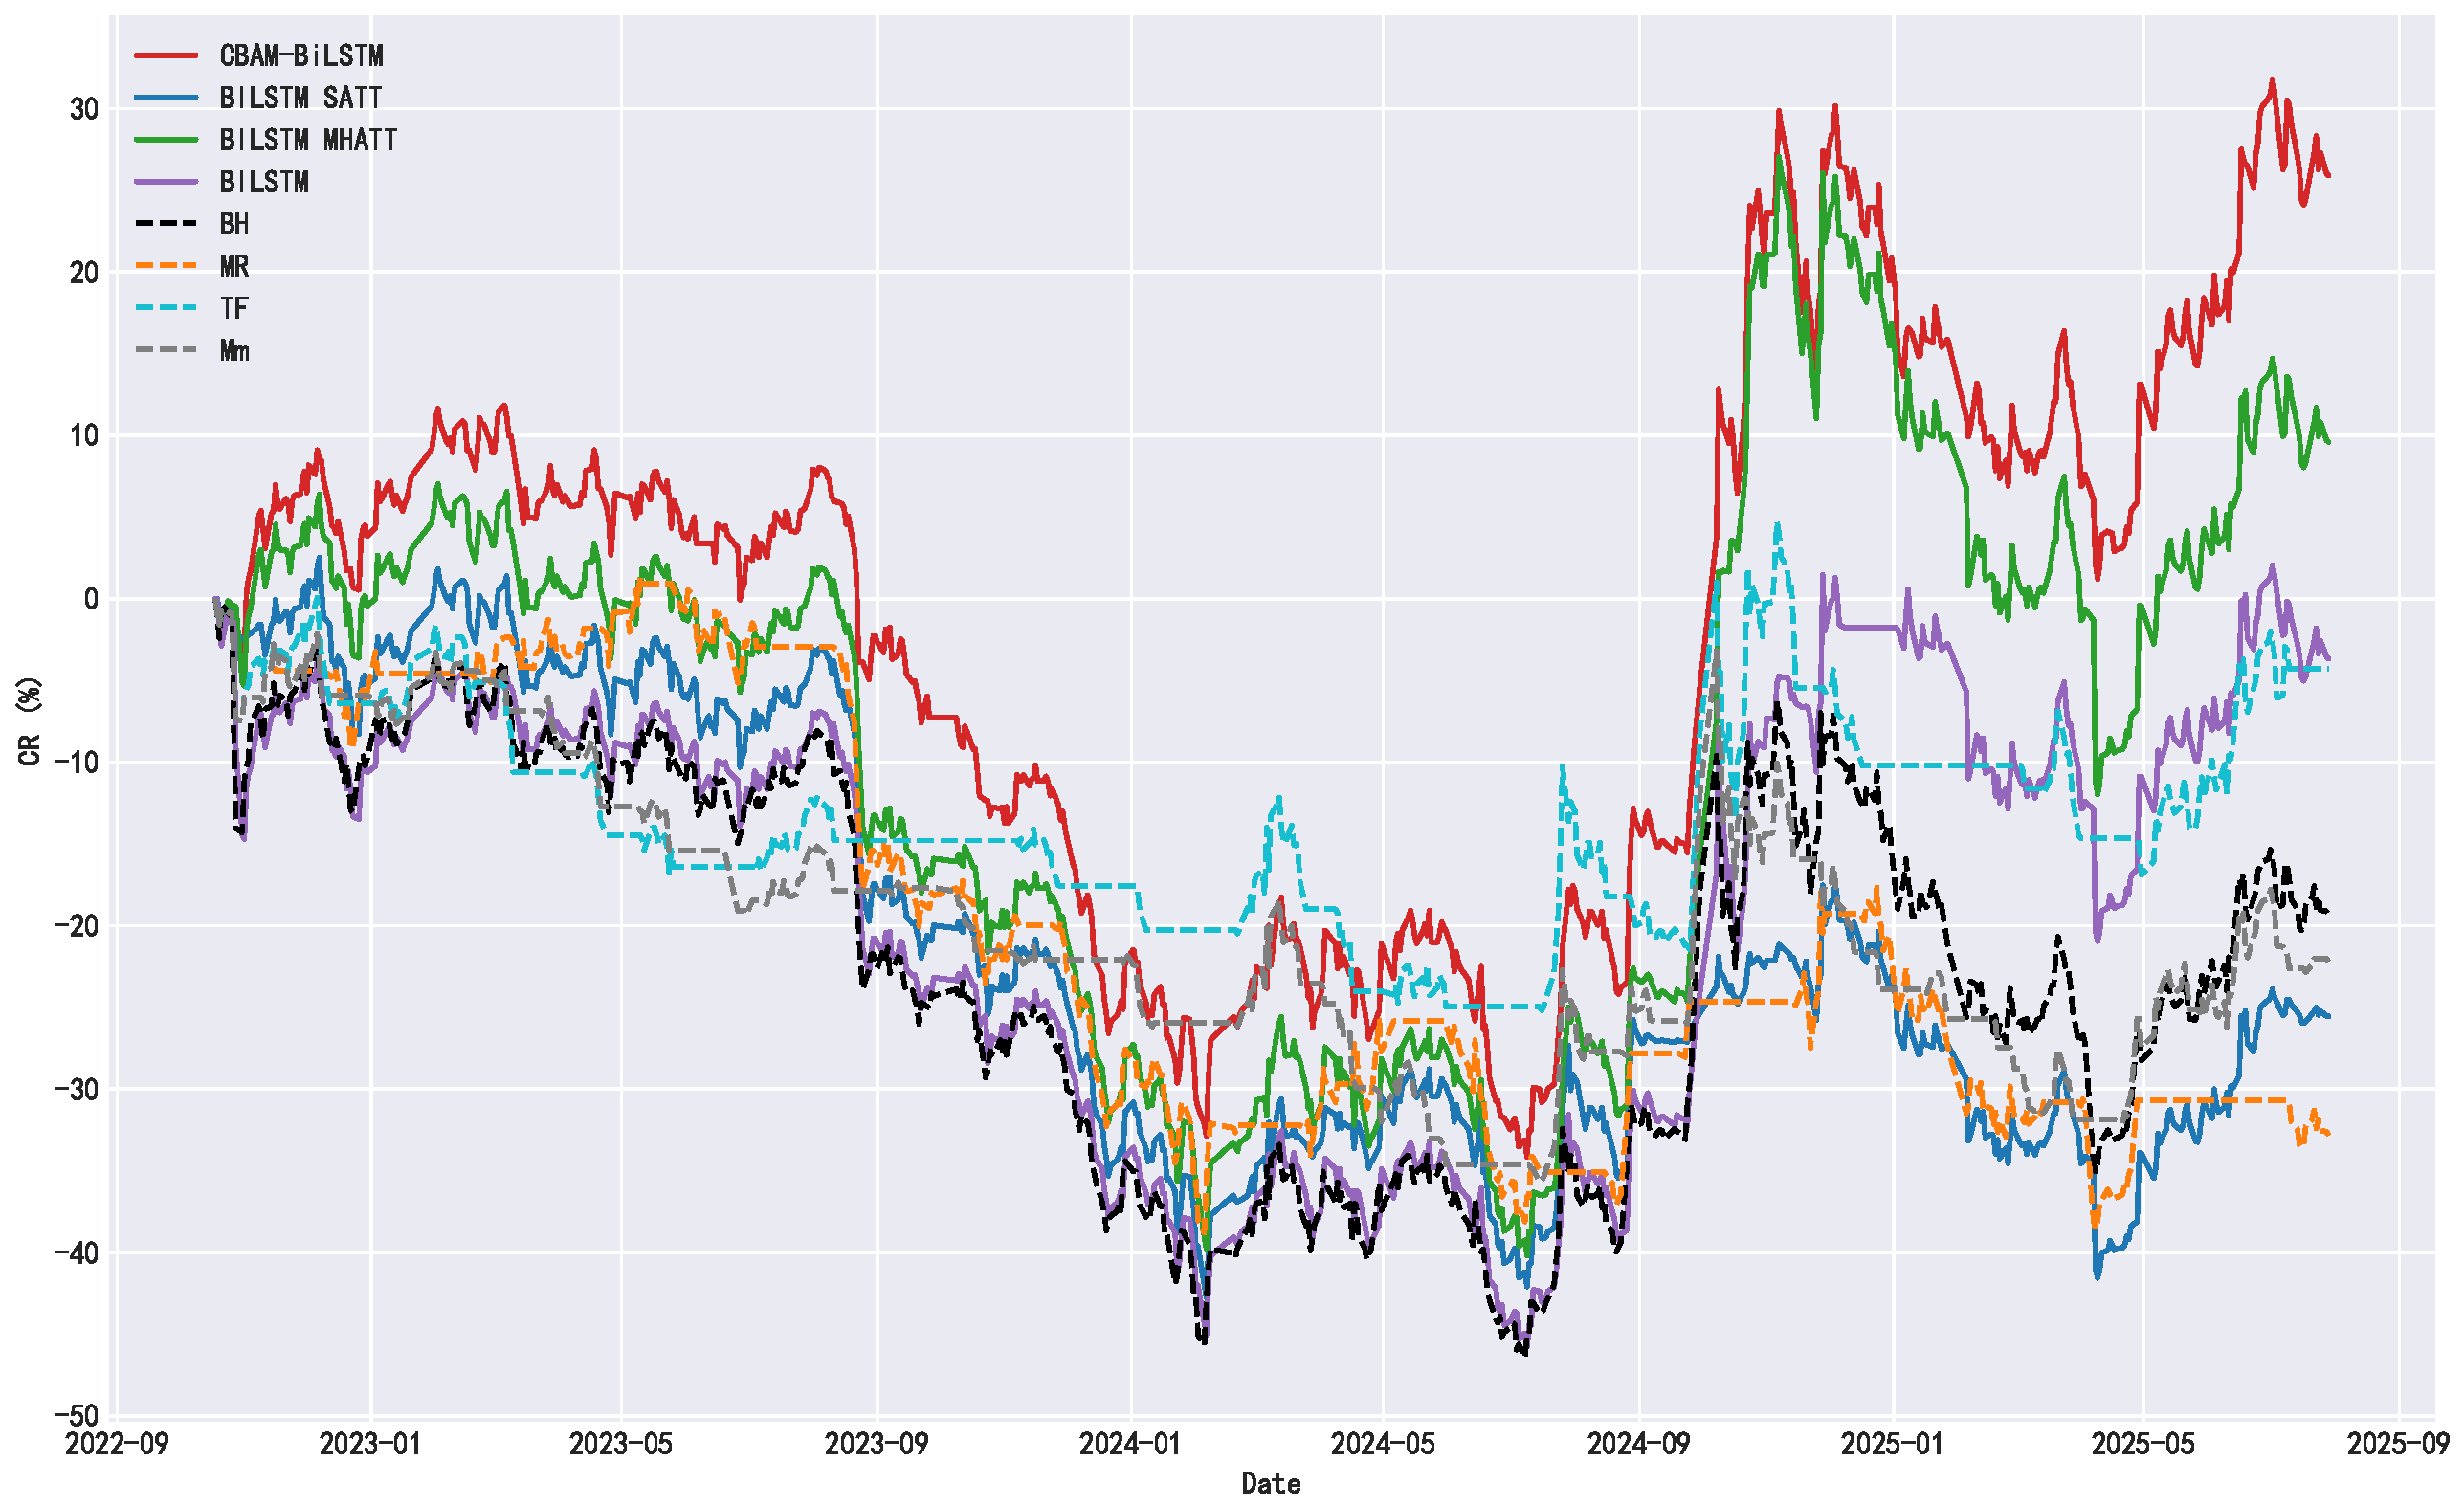
Figure A5.
Comparative Analysis of Trading Strategies on 600030 Stock.
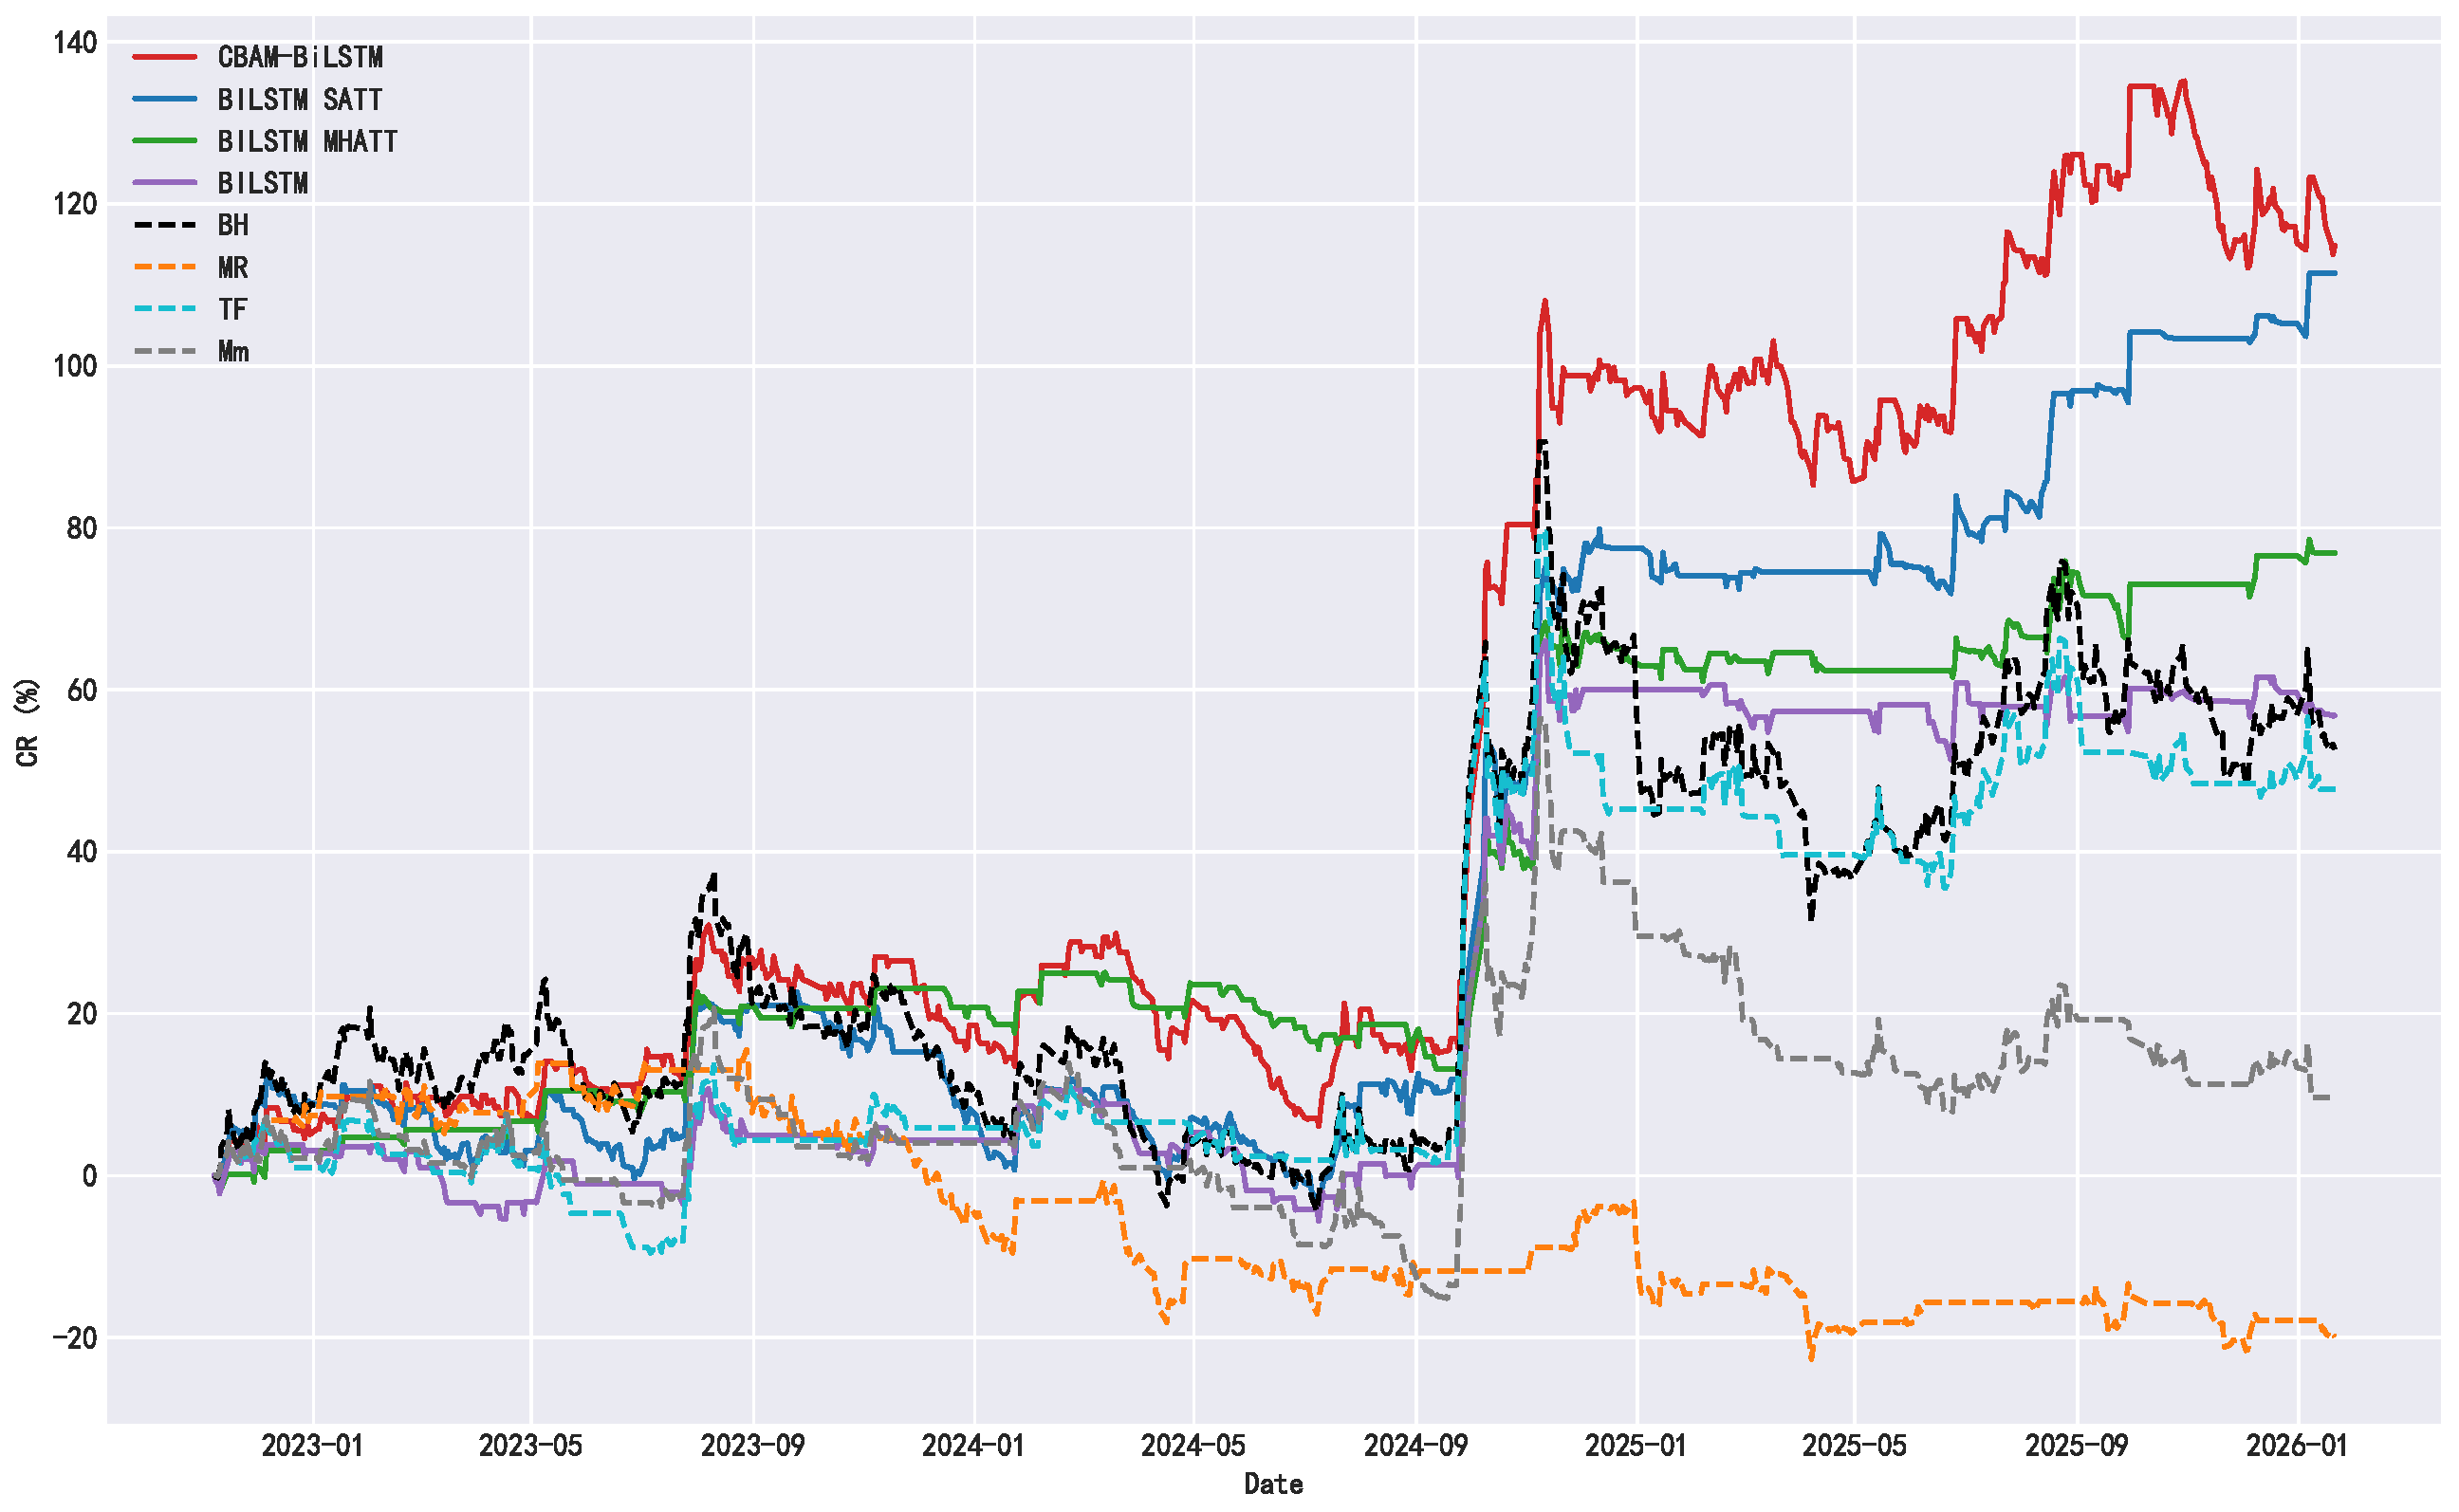
Figure A6.
Comparative Analysis of Trading Strategies on 600050 Stock.
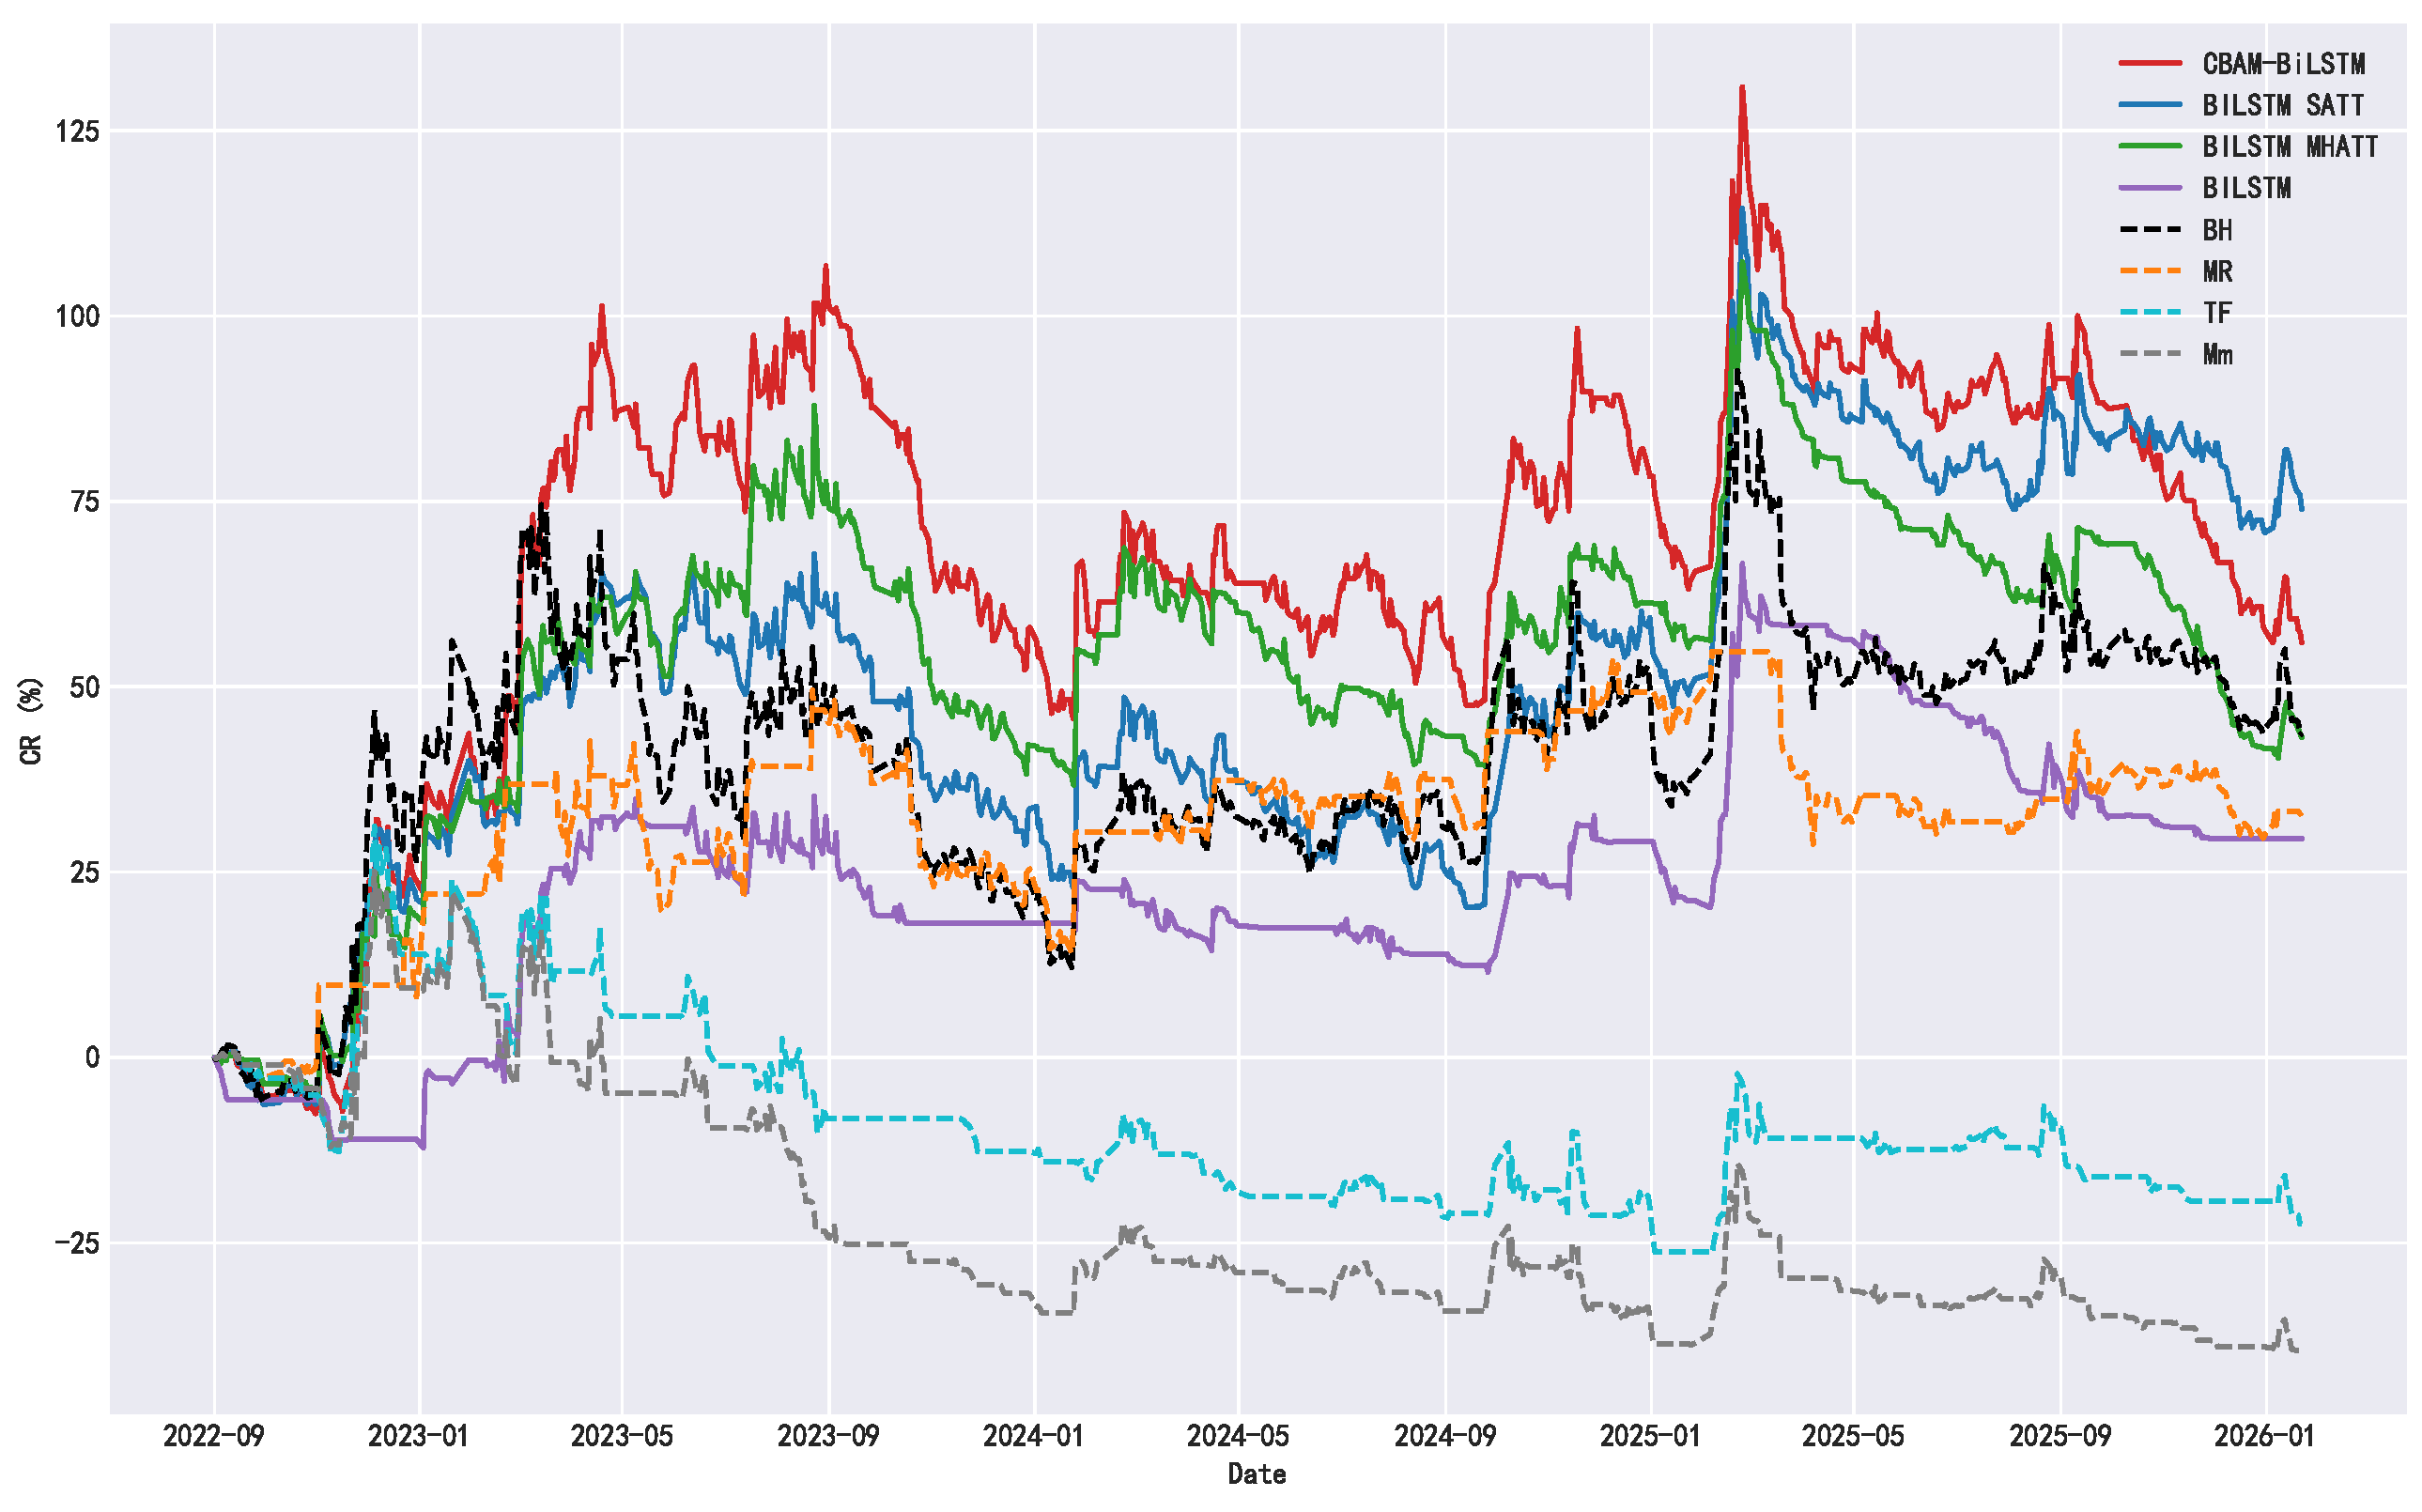
Figure A7.
Comparative Analysis of Trading Strategies on 600606 Stock.
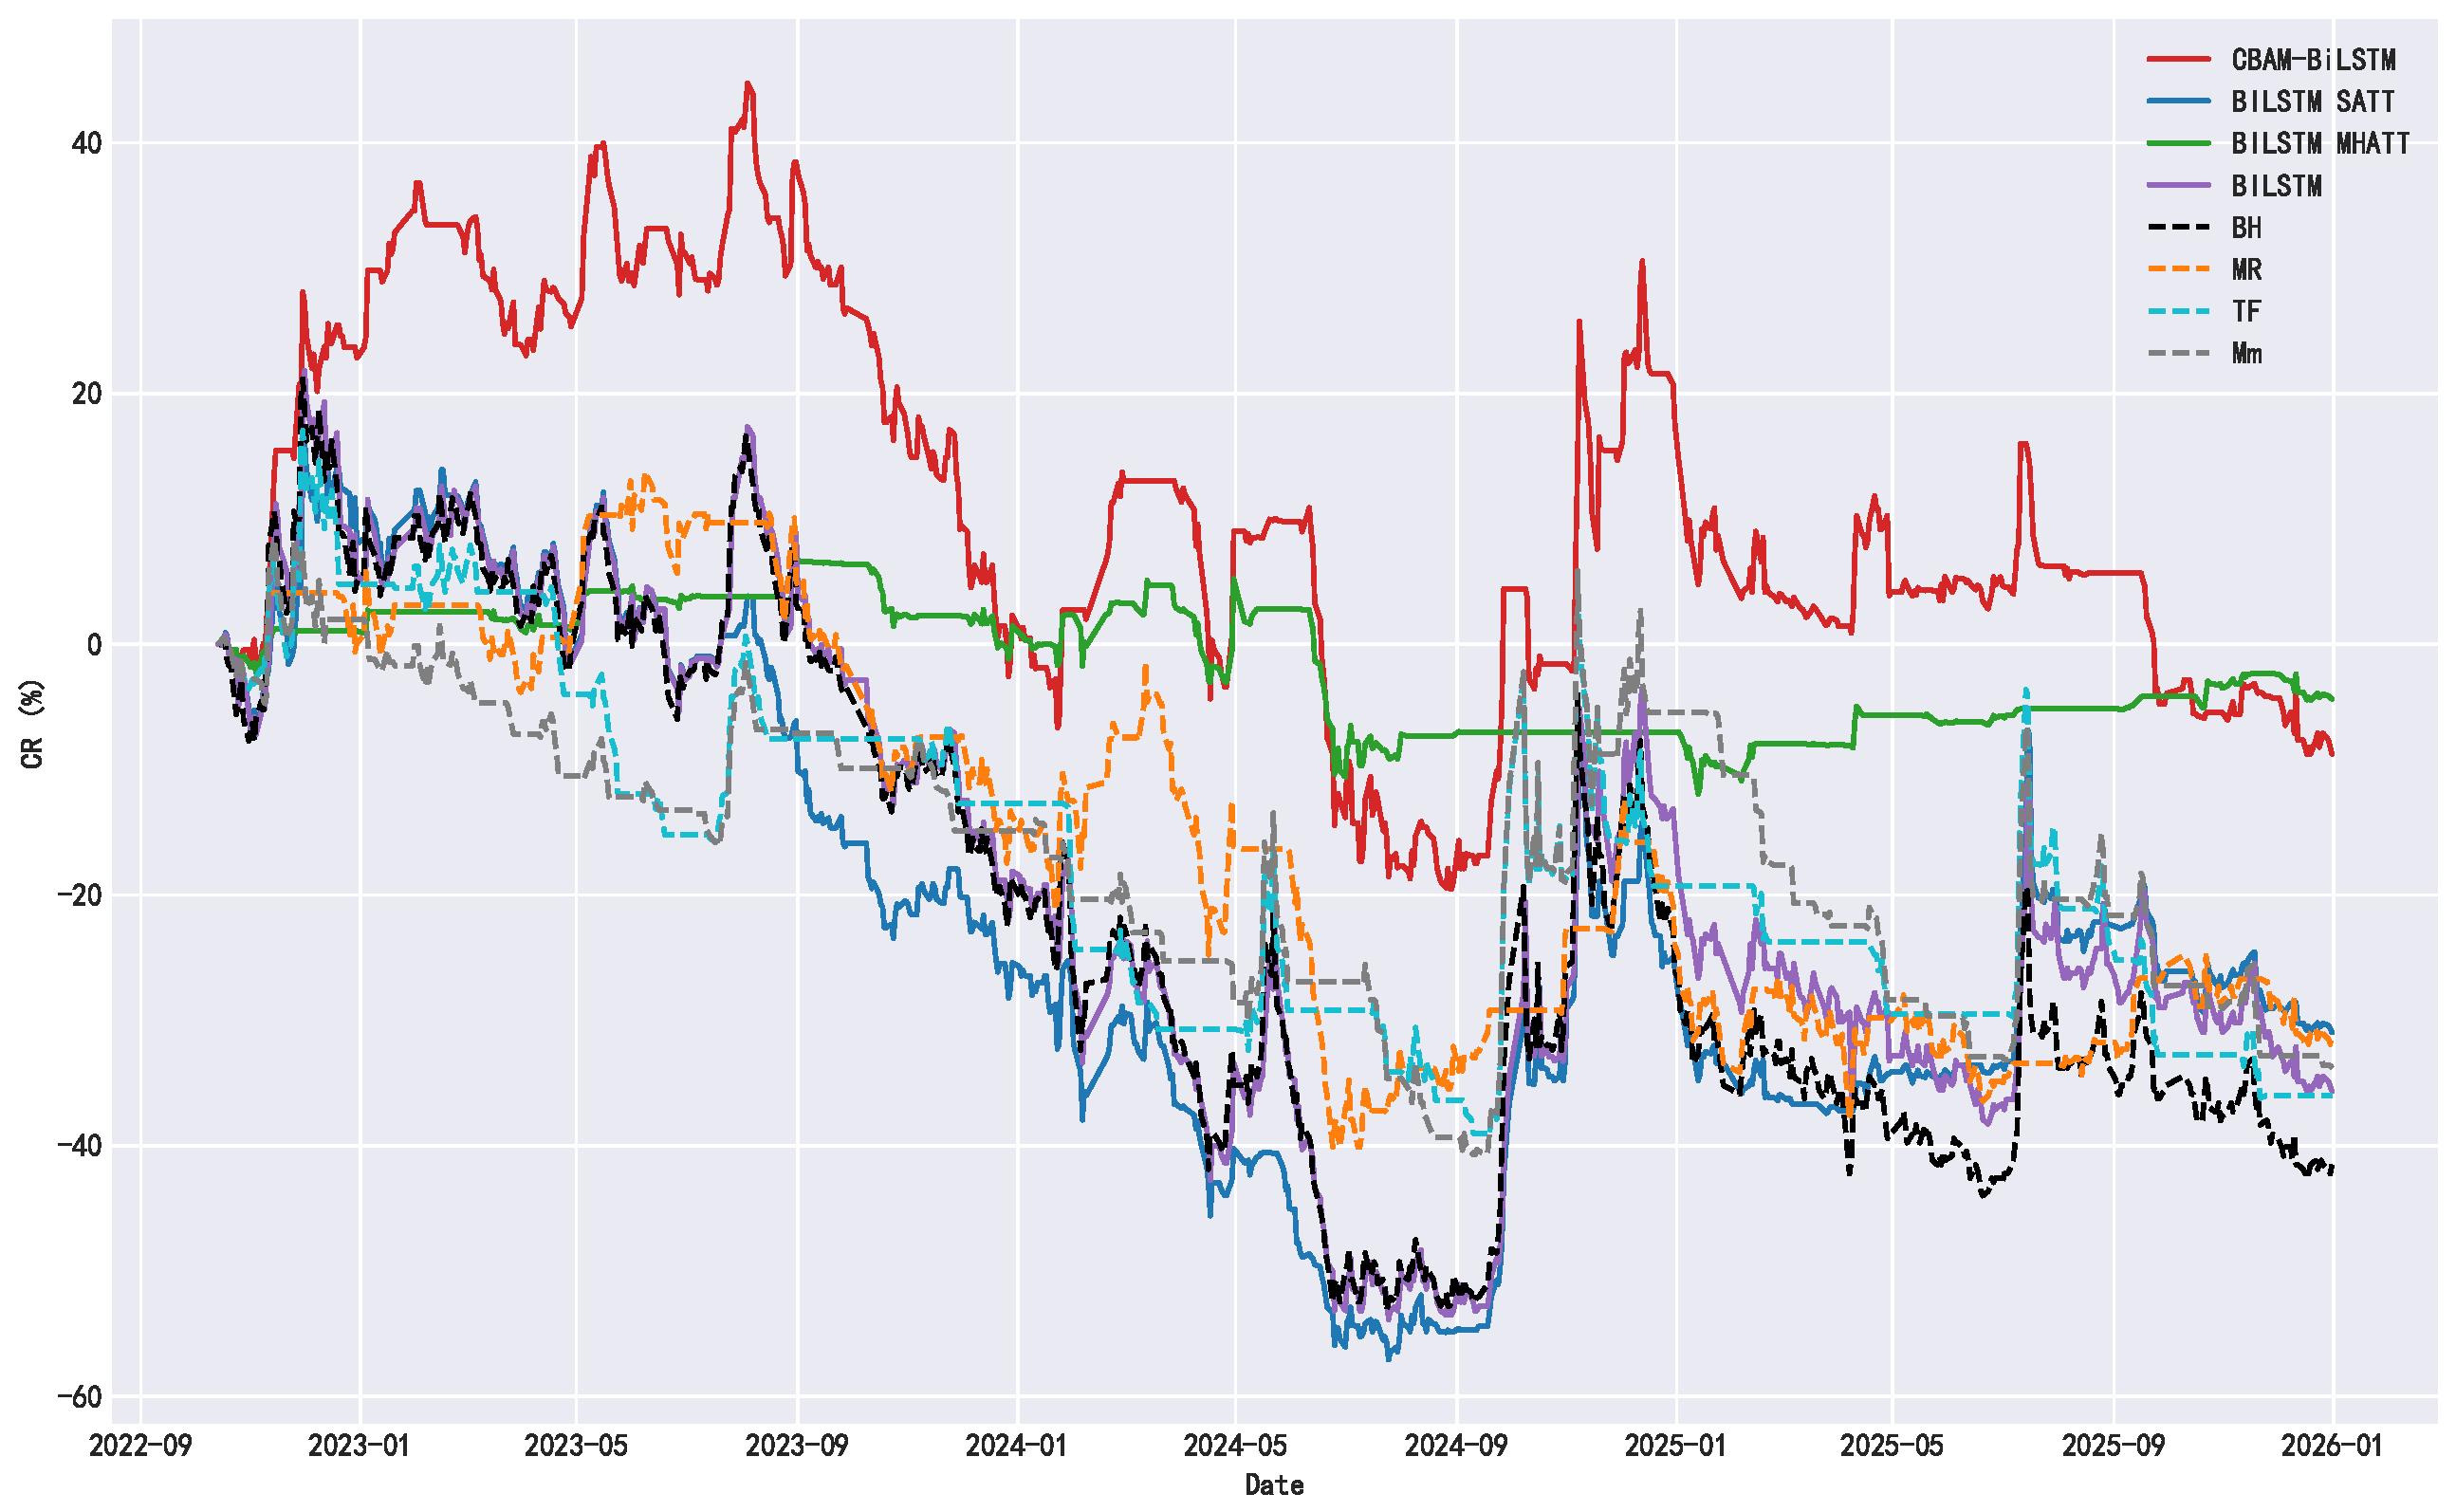
Figure A8.
Comparative Analysis of Trading Strategies on 601111 Stock.
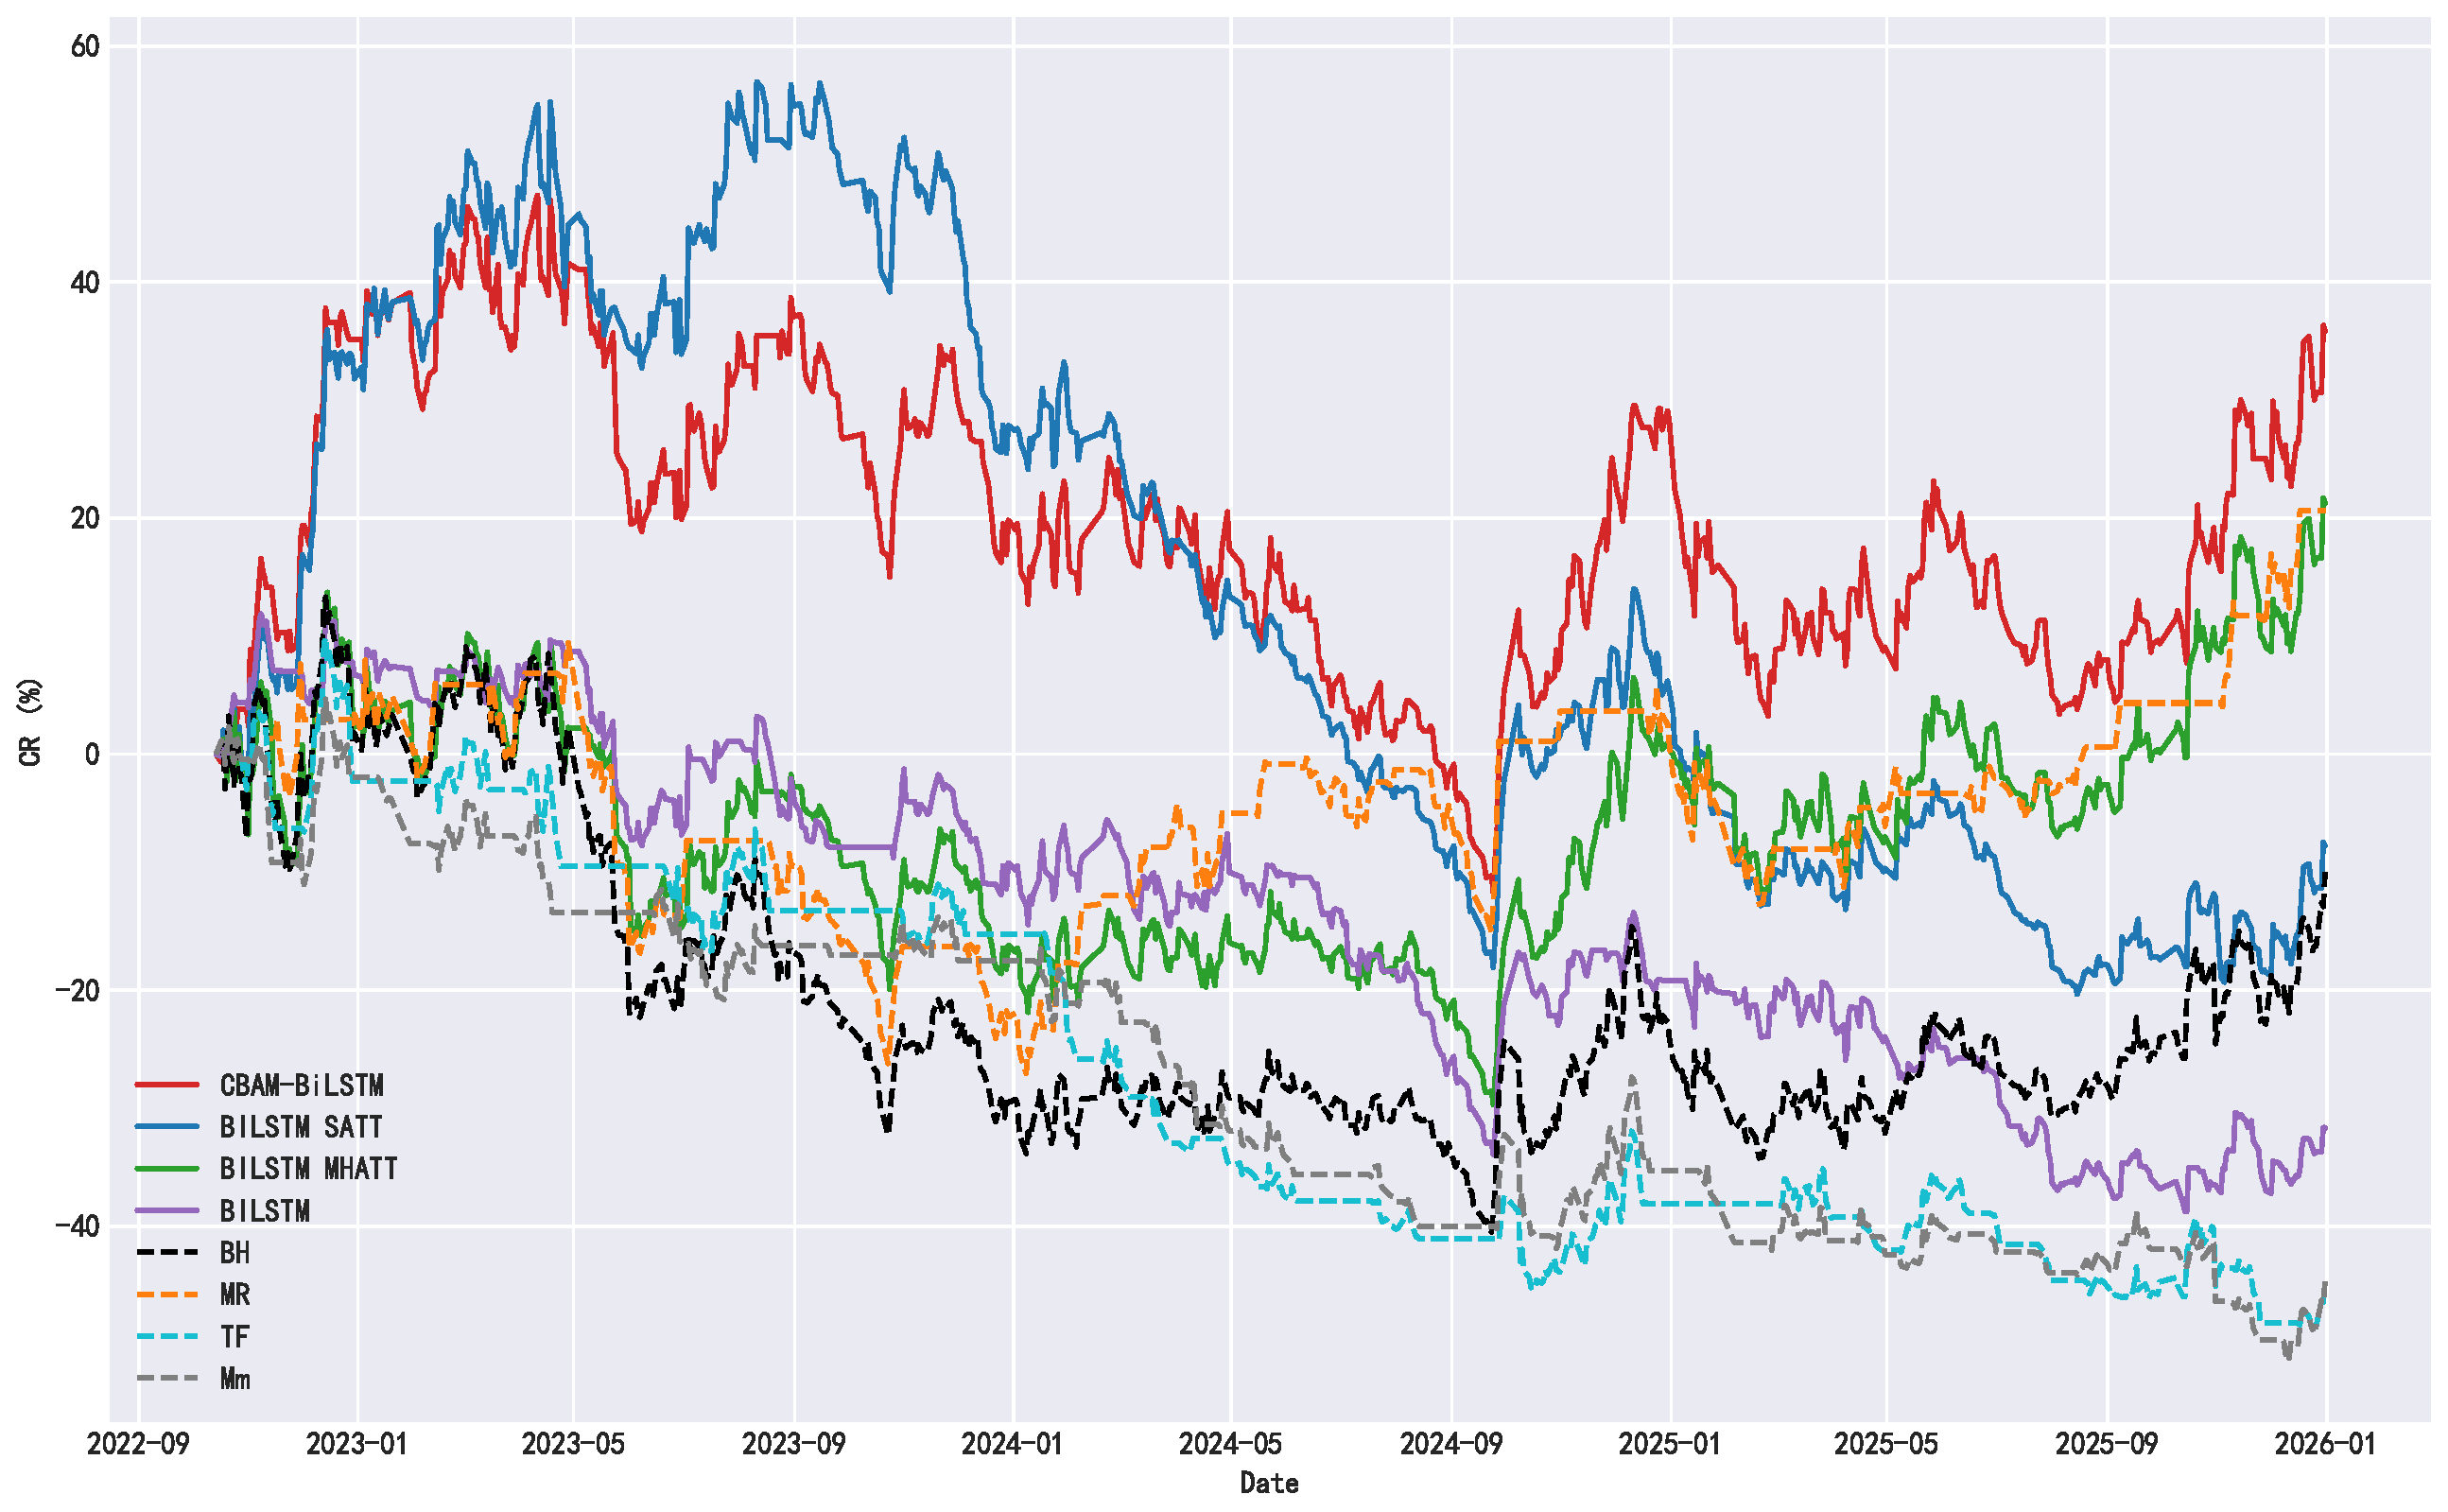
Figure A9.
Comparative Analysis of Trading Strategies on 601601 Stock.
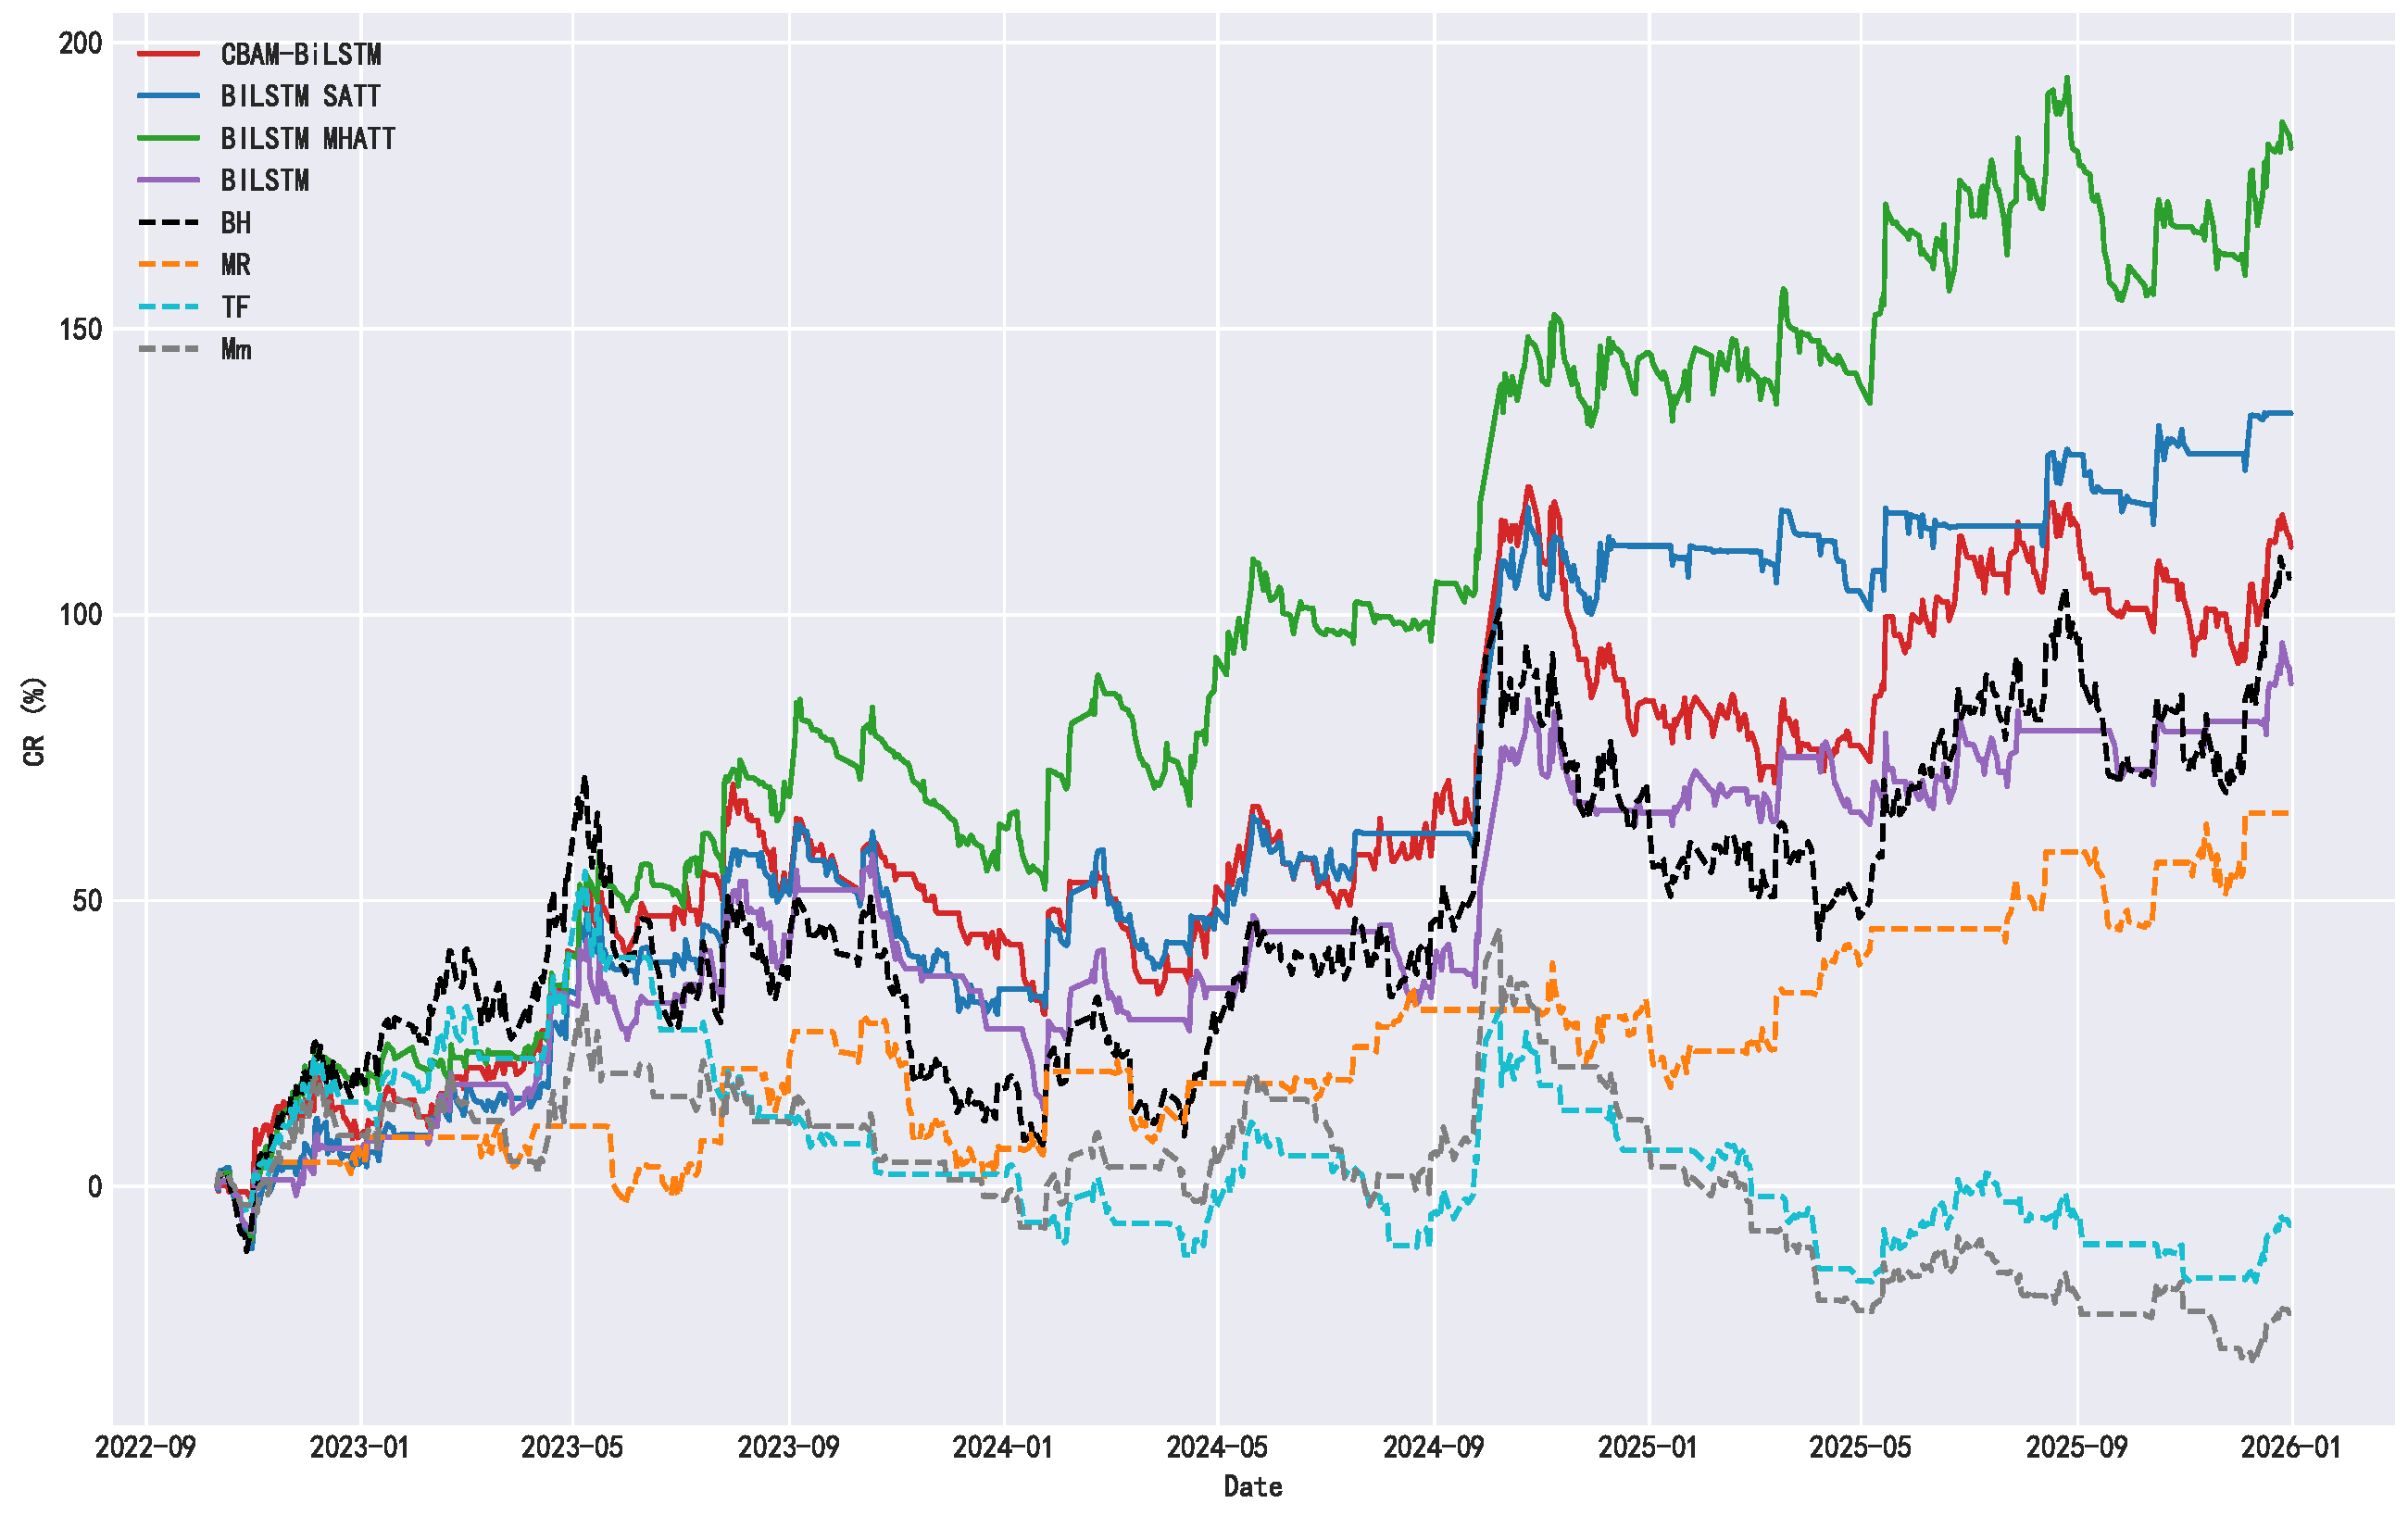
Table A1.
Comparative Performance Metrics of Different Trading Strategies on Other Stocks.
References
- Rockafellar, R.T. Augmented Lagrangians and applications of the proximal point algorithm in convex programming. Math. Oper. Res. 1976, 1, 97–116. [Google Scholar] [CrossRef] [Scilit]
- Boyd, S.; Parikh, N.; Chu, E.; Peleato, B.; Eckstein, J. Distributed optimization and statistical learning via the alternating direction method of multipliers. Found. Trends Mach. Learn. 2011, 3, 1–122. [Google Scholar] [CrossRef] [Scilit]
- Huang, N.E.; Shen, Z.; Long, S.R.; Wu, M.C.; Shih, H.H.; Zheng, Q.; Yen, N.C.; Tung, C.C.; Liu, H.H. The empirical mode decomposition and the Hilbert spectrum for nonlinear and non-stationary time series analysis. Proc. R. Soc. Lond. A 1998, 454, 903–995. [Google Scholar] [CrossRef] [Scilit]
- Dragomiretskiy, K.; Zosso, D. Variational mode decomposition. IEEE Trans. Signal Process. 2014, 62, 531–544. [Google Scholar] [CrossRef] [Scilit]
- Zhou, J.; Wang, S. A carbon price prediction model based on the secondary decomposition algorithm and influencing factors. Energies 2021, 14, 1328. [Google Scholar] [CrossRef] [Scilit]
- Pu, H.; Wu, Y.; Hua, C.; Song, Z.; Zhang, W.; Zhang, L.; Chu, Q.; Qiu, Y. Carbon trading based on quadratic modal decomposition and recurrent neural network price prediction model. In Proceedings of the 2022 5th International Conference on Pattern Recognition and Artificial Intelligence (PRAI), Chengdu, China, 19–21 August 2022; pp. 26–35. [Google Scholar]
- Ling, M.; Cao, G. Carbon trading price forecasting based on parameter optimization VMD and deep network CNN–LSTM model. Int. J. Financ. Eng. 2024, 11, 2450002. [Google Scholar] [CrossRef] [Scilit]
- Zhang, J.; Chen, K. Research on carbon asset trading strategy based on PSO-VMD and deep reinforcement learning. J. Clean. Prod. 2024, 435, 140322. [Google Scholar] [CrossRef] [Scilit]
- Cover, T.M.; Thomas, J.A. Elements of Information Theory, 2nd ed.; Wiley: Hoboken, NJ, USA, 2006. [Google Scholar]
- Vershynin, R. High-Dimensional Probability: An Introduction with Applications in Data Science; Cambridge University Press: Cambridge, UK, 2018. [Google Scholar]
- Singh, C.; Warraich, J.; Thakkar, R.; Vo, N. SABER: A multimodal sentiment aware regression framework using ROBERTa BiLSTM and deep batch active learning for stock market prediction. Int. J. Inf. Technol. 2025, 17, 5497–5502. [Google Scholar] [CrossRef] [Scilit]
- Poornima, N.; Abilash, D.; Theodaniel, M. Improvising the stock prediction by integrating with roBERTa and LSTM. In Proceedings of the 2023 International Conference on Signal Processing, Computation, Electronics, Power and Telecommunication (IConSCEPT), Karaikal, India, 25–26 May 2023; IEEE: Piscataway, NJ, USA, 2023; pp. 1–8. [Google Scholar]
- Tan, K.; Lee, C.; Anbananthen, K.; Lim, K. RoBERTa-LSTM: A hybrid model for sentiment analysis with transformer and recurrent neural network. IEEE Access 2022, 10, 21517–21525. [Google Scholar] [CrossRef] [Scilit]
- Tan, K.; Lee, C.; Lim, K. Roberta-gru: A hybrid deep learning model for enhanced sentiment analysis. Appl. Sci. 2023, 13, 3915. [Google Scholar] [CrossRef] [Scilit]
- Pradeep, P.; Premjith, B.; Nimal Madhu, M.; Gopalakrishnan, E.A. A transformer-based stock market price prediction by incorporating BERT embedding. In Proceedings of the International Conference on Mathematics and Computing, Nanjing, China, 8–10 November 2024; Springer: Cham, Switzerland, 2024; pp. 95–107. [Google Scholar]
- Lee, C.-C.; Sah, A. Stock price prediction based on investor sentiment using BERT and transformer models. Stat. Optim. Inf. Comput. 2023, 11, 1018–1032. [Google Scholar]
- Friday, I.K.; Mishra, S.; Pati, S.P.; Mishra, D. A transformer-based stock trend prediction with sentiment analysis of relevant and urgent tweets. In Proceedings of the 2025 International Conference on Innovations in Intelligent Systems: Advancements in Computing, Communication, and Cybersecurity (ISAC3), Silchar, India, 27–28 February 2025; IEEE: Piscataway, NJ, USA, 2025; pp. 1–6. [Google Scholar]
- Putri, R.A.; Oktavia, T. Analyzing Twitter Sentiment on Stock Using the Bidirectional Encoder Representations (BERT) Based on the Transformer Model. In Proceedings of the 2025 29th International Conference on Information Technology (IT), Hong Kong, China, 10–12 January 2025; IEEE: Piscataway, NJ, USA, 2025; pp. 1–6. [Google Scholar]
- Yu, Y. Multi-Factor Prediction of Stock Market Index Based on LSTM Neural Networks with BERT Embedding. Master’s Thesis, Univerzita Karlova, Prague, Czech Republic, 2025. [Google Scholar]
- Chen, G.W.; Hsu, I.C. Integrating Taiwan financial BERT sentiment analysis with CNN-BiLSTM-SA model for stock prediction. Discov. Comput. 2025, 28, 248. [Google Scholar] [CrossRef] [Scilit]
- Sakilam, A.; Rangarajan, P.K.; Bode, V.; Nalla, B.T. Deep Reinforcement Learning Algorithms for Profitable Stock Trading Strategies. In Proceedings of the 2024 IEEE International Conference on Contemporary Computing and Communications (InC4), Bangalore, India, 15–17 March 2024; pp. 1–6. [Google Scholar]
- Tran, M.; Pham-Hi, D.; Bui, M. Optimizing automated trading systems with deep reinforcement learning. Algorithms 2023, 16, 23. [Google Scholar] [CrossRef] [Scilit]
- Huang, Y.; Lu, X.; Zhou, C.; Zhang, L. DADE-DQN: Dual action and dual environment deep q-network for enhancing stock trading strategy. Mathematics 2023, 11, 3626. [Google Scholar] [CrossRef] [Scilit]
- Huang, Y.; Zhou, C.; Zhang, L.; Lu, X. A Self-Rewarding Mechanism in Deep Reinforcement Learning for Trading Strategy Optimization. Mathematics 2024, 12, 4020. [Google Scholar] [CrossRef] [Scilit]
- Cui, K.; Hao, R.; Huang, Y.; Zhang, J. A novel convolutional neural networks for stock trading based on DDQN algorithm. IEEE Access 2023, 11, 32308–32318. [Google Scholar] [CrossRef] [Scilit]
- Ma, C.; Zhang, J.; Liu, J.; Ji, L. A parallel multi-module deep reinforcement learning algorithm for stock trading. Neurocomputing 2021, 449, 290–302. [Google Scholar] [CrossRef] [Scilit]
- Chen, X.; Wang, Q.; Hu, C.; Zhu, Y. A stock market decision-making framework based on CMR-DQN. Appl. Sci. 2024, 14, 6881. [Google Scholar] [CrossRef] [Scilit]
- Engl, H.W.; Hanke, M.; Neubauer, A. Regularization of Inverse Problems; Springer: Berlin/Heidelberg, Germany, 1996. [Google Scholar]
- Woo, S.; Park, J.; Lee, J.-Y.; Kweon, I.S. CBAM: Convolutional block attention module. In Proceedings of the European Conference on Computer Vision (ECCV), Munich, Germany, 8–14 September 2018; pp. 3–19. [Google Scholar]
- Graves, A.; Schmidhuber, J. Framewise phoneme classification with bidirectional LSTM networks. In Proceedings of the IEEE International Joint Conference on Neural Networks, Montreal, QC, Canada, 31 July–4 August 2005; Volume 4, pp. 2047–2052. [Google Scholar]
- Cui, Y.; Che, W.; Liu, T.; Qin, B.; Wang, S.; Hu, G. Revisiting pre-trained models for Chinese natural language processing. arXiv 2020, arXiv:2004.13922. [Google Scholar] [CrossRef] [Scilit]
- Van Hasselt, H.; Guez, A.; Silver, D. Deep reinforcement learning with double q-learning. In Proceedings of the Thirtieth AAAI Conference on Artificial Intelligence, Phoenix, AZ, USA, 12–17 February 2016; Volume 30. [Google Scholar]
- Jing, N.; Wu, Z.; Wang, H. A hybrid model integrating deep learning with investor sentiment analysis for stock price prediction. Expert Syst. Appl. 2021, 178, 115019. [Google Scholar] [CrossRef] [Scilit]

Disclaimer/Publisher’s Note: The statements, opinions and data contained in all publications are solely those of the individual author(s) and contributor(s) and not of MDPI and/or the editor(s). MDPI and/or the editor(s) disclaim responsibility for any injury to people or property resulting from any ideas, methods, instructions or products referred to in the content. |
© 2026 by the authors. Licensee MDPI, Basel, Switzerland. This article is an open access article distributed under the terms and conditions of the Creative Commons Attribution (CC BY) license.