


Abstract
Although several laboratory- to semi-pilot-scale reactor–separator flotation units have recently been developed and manufactured by leading companies, substantial gaps remain in the understanding of their scale-up procedures. To this end, the current study identifies the advantages and constraints of the classical retention time-based approach, standard dilution tests, and the McCabe–Thiele diagram. The results revealed that the traditionally used retention-time-based flotation kinetic and/or its modified version scale-up approaches cannot be adapted to reactor–separator flotation cells, mainly due to differences in dispersion regime, conditioning tank, slurry volume, feed flowrate and the role of circulating load. Therefore, the number of passes at laboratory scale is proposed as a more appropriate scale-up parameter than flotation time for pneumatic flotation cells. The analysis suggests that a scale-up factor of 1 may be acceptable only when the conditioning tank, aerator, and separator collectively exhibit a plug-flow dispersion regime. A few uncertainties were discussed in detail in terms of utilizing standard dilution cleaner tests. A new flow diagram was proposed with respect to the integration of pneumatic cells with a particular focus on Imhoflot™ cell technology into existing concentration plants and the path toward test programs for greenfield projects. The presented case study demonstrated an alignment between the laboratory mechanical flotation kinetic test and the onsite lab/semi-pilot V-03 Imhoflot™ cell performance, providing a high degree of confidence in the proposed flowsheet. The selected 4xH Imhoflot™ cell configuration was well-suited to meet the projected industrial mass balance and product specifications.
1. Introduction
Over the last two decades, reactor–separator flotation cells, also known as dual-chamber, contact, pneumatic, and intensified flotation cells, have gained significant attention with respect to reducing overall capital and operating costs as well as high efficiencies in recovering (ultra)-fine and coarse particles [1,2]. In addition to historically applied Jameson and Imhoflot™ Cells, a number of new technologies, such as DFR (Direct Flotation Reactor) and Staged Flotation Reactor (SFR) from Woodgrove technologies, StackCell High Intensity Flotation and HydroFloat cells from Eriez, Reflux™ Flotation Cell (RFC), and CoarseAIR™ from FLSmidth, Concorde™ Cell (Metso), Nova Cell (Jord International Pty Ltd.), and others, have been introduced to the market [3,4]. One common and major challenge of all these technologies to be accepted by laboratories and mining companies is the serious lack of information concerning their scale-up procedures. The inability to deliver a clear scale-up process to mining and mineral processing organizations and EPCs (engineering, procurement, and construction) has resulted in very slow progress in their acceptance and application for brownfield and, most critically, for greenfield projects [5]. For this reason, most of these companies have so far preferred on-site pilot trials over laboratory commercial test works, which can often be time-consuming and relatively expensive. Establishing a solid and reliable scale-up approach for these cells adaptable to various commodities can be a game-changer for the current market and the respective relevant technology providers from different aspects. Other than this, it allows laboratories to optimize and customize operating parameters for specific ore types and particular duties by conducting a number of flotation tests using a relatively low amount of materials (5–20 kg), which is sometimes the bottleneck of pilot trials.
The scale-up approach for intensified flotation cells is significantly different than mechanical flotation cells. Some researchers believe that the scale-up factor is one for pneumatic cells; however, this assumption can only be correct if their dispersion regime follows the plug-flow pattern on the laboratory scale [6]. This has not been either confirmed or clearly disclosed for most of the newly developed cells except the Jameson L-150 [7], Imhoflot™ G-06 and V-03 Cells [6], and RFC-100 [8], which follow perfect mixing (PM) and plug-flow (PF) dispersion regimes, respectively. The authors believe that there is a serious misconception in the community that the volumetric flow rate passes through the aerator dictates the scale-up factor, but this will be true only if one excludes the separator and conditioning tanks. Unlike mechanical flotation cells, laboratory-scale pneumatic cells require a conditioning tank whose efficiency impacts the pneumatic cell; decoupling it from the cell itself has become relatively challenging. Vinnett et al. [9] recently discovered that a non-optimized volume of the conditioning tank can highly impact the flotation kinetics for cells operated in continuous modes. Conceptually speaking and based on the results presented and discussed by Hassanzadeh et al. [6], most of the intensified flotation cells do not follow the plug-flow dispersion regime once all components are considered. The only full industrial results available so far are the ones given for Siemens cell [10] (another reactor–separator flotation unit), where a perfect-mixing, one large perfect mixer and one small perfect mixer in series (LSTS) regime was identified at two feed flow rates, with the mean retention time varying between 4.1 and 5.2 min.
It is somehow believed that no scale-up factor is required for Jameson Cell design, as the jet velocity, air entrainment, and hydrodynamic mixing conditions remain consistent from laboratory to full-scale units. The downcomer operates on the same principles and process parameters regardless of cell size. Capacity increases in larger installations are achieved by employing additional downcomers rather than altering operating conditions. Although Jameson Cell and other intensified flotation cells are highlighted as fast flotation kinetic cells, there are limited scientifically proven case studies or concepts in the literature [11,12]. Nesset et al. [13] recently reported that the reason originates from the high gas hold-up value in the downcomer (roughly 60%) of the Jameson Cell, noting similar estimated values in the vicinity of the impeller of a mechanical cell obtained through cell power measurements. Over the last decade, researchers have attempted to create a comparative method among these cells with mechanical and column ones, but such comparisons may not be fully valid. The reasons are attributed to differences originating from the nature of cells, dosage of chemical reagents, influence of recirculation load within the reactor–separator cells, and presence/absence of wash water.
Despite strong interest from mining companies in reactor–separator flotation cells, particularly for recovering fine and ultrafine particles, there is no clear or universally accepted methodology for their scale-up. This paper reviews and discusses the available scale-up approaches, including the three-stage standard dilution test (Glencore Technology), modified residence time estimation, the McCabe–Thiele diagram approach (Maelgwyn Mineral Services Ltd.), and dispersion regime-based concepts, highlighting their respective advantages and limitations. Further, a process flow diagram is presented as a practical approach to address scale-up challenges, supported by a case study demonstrating the applicability of the McCabe–Thiele diagram method.
2. Cell Types and Methodologies
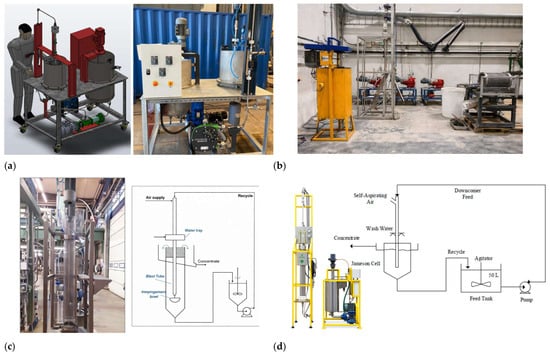
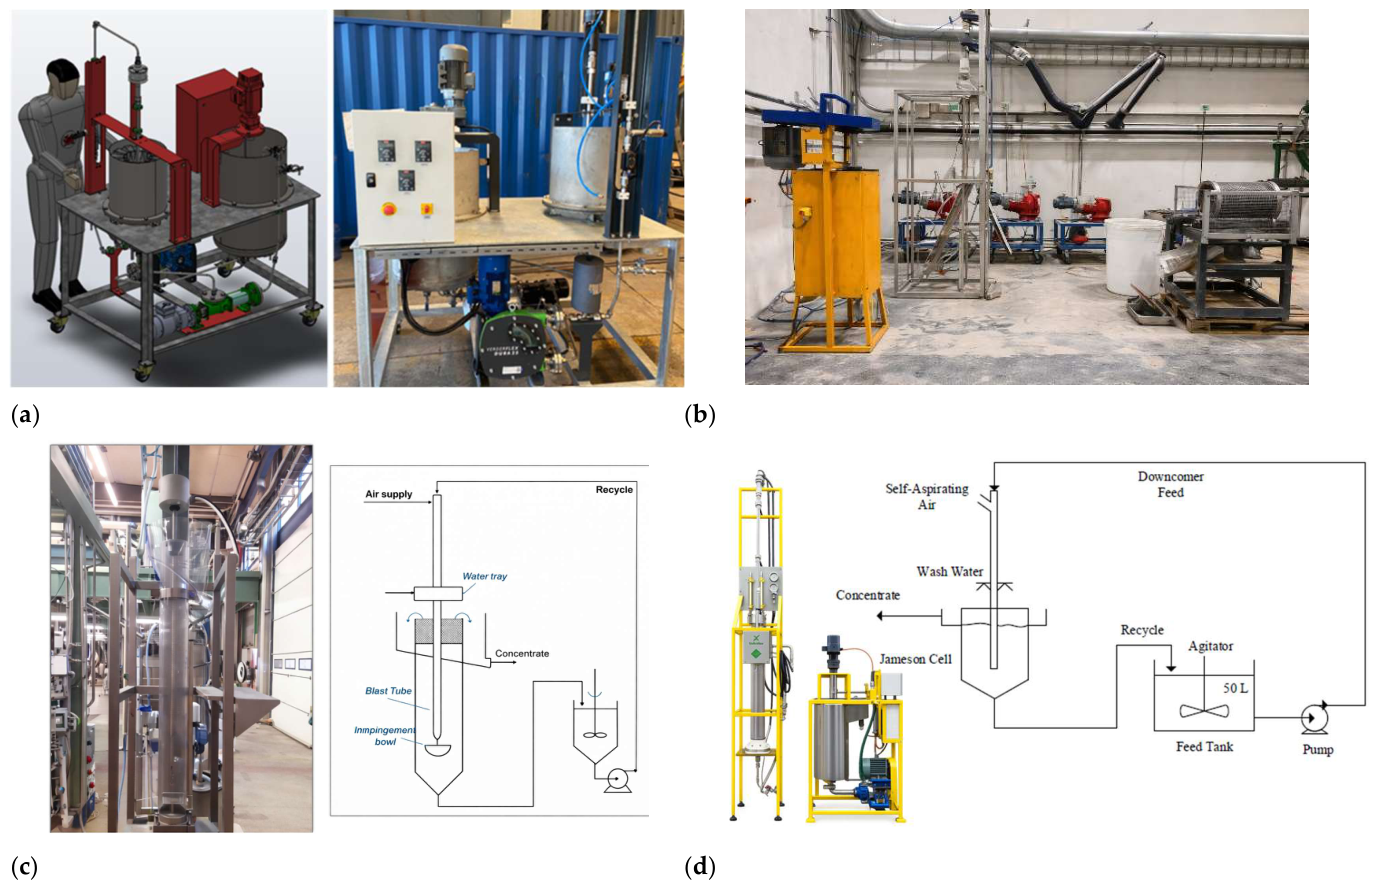
Figure 1 illustrates the reactor–separator flotation cell types currently available on the market (Imhoflot™, Reflux, Concorde, and Jameson), which are used for laboratory and semi-pilot testing in both batch and continuous modes. The following briefly summarizes their key characteristics and operating procedures. Imhoflot™ G-06/VM-04 cell (600 and 400 mm diameter) is designed and fabricated to treat ca. 10–20 kg fresh sample with a top size of 500 µm as a preliminary stage before pilot/industrial trials. The test rig is constructed with the total dimensions of 230 × 110 × 160 cm as height, width, and length, respectively. Two peristaltic pumps (Verderflex Dura 25) are considered, with a throughput up to 15 L/min, including a frequency inverter to adjust the feed flow rate with a digital display. A conditioning tank (130 L) is equipped with a two-blade type agitator, while the cell volumes for G-06 and VM-04 cells are 54 and 42 L, respectively [5]. The Concorde Cell Lab Unit consists of a flotation cell with a working volume of 20 L and a blast tube. During laboratory-scale flotation tests, the feed slurry is pumped at a constant flow rate of ca. 8 L/min. In the Concorde lab unit, 100% of the tailings are recycled back to the cell feed. A single pass is defined as the time required for the entire feed sample to circulate through the blast tube once, representing one complete processing cycle of the material. Whereas, in the semi-batch Concorde flotation test, a specified volume of slurry (30–40 L) is transferred to the conditioning feed tank and continuously recirculated together with the tailings until the predetermined flotation time is reached [14]. The RFC-100 consists of two pumps to control the feed and tailings flows, and one pump dedicated to the wash water. The material conditioning takes place in a separate agitator where the collector, frother, and other regulators are dosed. Subsequently, the pre-calibrated feed pump transfers the material to the cell, with forced-air flow already supplied. Wash water, containing the frother at a similar dosage as the slurry (depending on the bias). For the RFC-100, the feed, gas, and wash water fluxes vary in the ranges of 3–5, 0.5–2.5, and 0.75–1.5 cm/s [15]. A L-150 model Jameson Cell consists of a feed tank with an operational volume of ca. 74 L, a 25 mm diameter downcomer (1 L), a 5 mm orifice, and a 150 mm diameter separation chamber (17 L). The downcomer involves a column that receives water mixed with a frother through a nozzle, from which a high-speed water jet flow forms. With the fresh feed rate of 4.8 L/min and 60% circulating load, the feed to the downcomer equals 12 L/min (including the tailing flow rate of 2.4 L/min) to create a jet velocity of 16–20 m/s [7].
Figure 1.
A demographic picture of each laboratory/semi-pilot scale unit: (a) Imhoflot™ (G-06/VM-04) [5], (b) RFC-100 [15], (c) Concorde [16], and (d) Jameson L-150 Cell [17].
3. Scale-Up Approaches
3.1. Flotation Kinetic-Based Approach
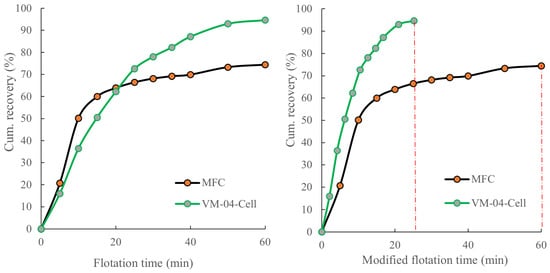
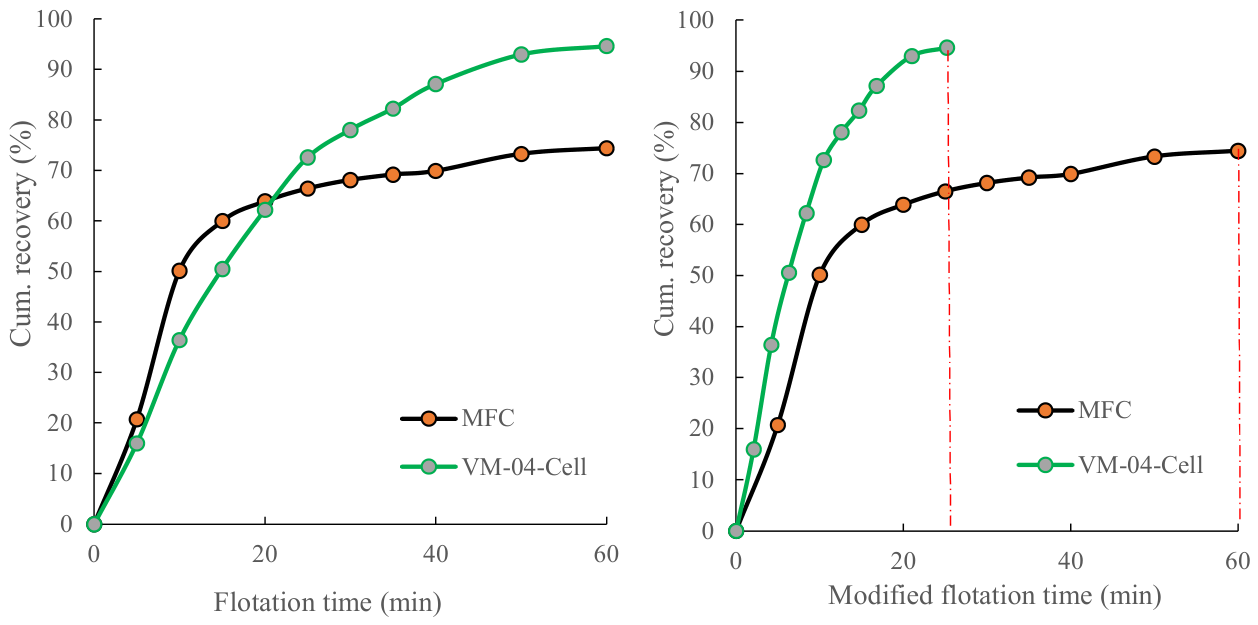
As is well-known, the most widely applied technique for scaling up mechanical flotation cells is based on residence time flotation [18,19]. This concept has been utilized for several decades [20,21]. There are serious concerns about it, which remains a highly operator/laboratory-sensitive method, and the ore mineralogy dictates the scale-up factor significantly. Such challenges were perfectly described in detail by Yianatos and Vallejos [22], addressing the role of the froth zone and particle size properly. Some researchers have attempted to introduce a modified method for scaling up pneumatic cells based on results given in the laboratory-scale units. In this regard, Hassanzadeh et al. [23] used a similar cell volume for both mechanical and Imhoflot™ VM-04 cells running rougher flotation kinetic tests on a sulfidic copper ore. It was reported that the flotation rate constant obtained using the Imhoflot™ cell was lower than the mechanical one, whereas the ultimate recovery was higher, mainly due to the recirculation load (Figure 2). The same pattern of relatively low flotation kinetics can be qualitatively observed for the Concorde lab-scale unit [24]. This low flotation rate constant was later also determined using the Imhoflot™ V-018 cell by Ayoglu et al. [25]. Plausible explanations for the low flotation rate were discussed by Hassanzadeh et al. [6], who highlighted the effects of low superficial gas velocity and a non-optimized air-to-pulp ratio. Their preliminary computational fluid dynamics (CFD) simulations on the Imhoflot™ G-06 cell also suggested intensive generation of fine bubbles [26]. In this regard, Vinnett et al. [9] also raised a main concern regarding the impact of the conditioning tank and the recirculation of tailings back to the cell, which, when combined with the cell itself, acts like a perfect mixing dispersion-based unit. This ultimately results in a lower flotation rate constant than the plug-flow dispersion mechanism frequently observed within laboratory-scale mechanical flotation cells. In general, this approach does not seem a promising method under the current conditions because (i) the meaning of the flotation time is different between the cells, (ii) pneumatic cells are operated using a conditioning tank, whereas the conditioning takes place within the mechanical cell, (iii) it is difficult to adjust the flotation cell and even active flotation volumes for both vessel types, (iv) the pneumatic cell is operated by recirculating part/all of the tailings back to the conditioning tank which is not the case for the mechanical one and (v) since intensified cells generate massive number of small bubbles the dosage of specially frother is often higher than the mechanical one affecting the froth properties.
Figure 2.
Cumulative recovery versus flotation time and modified flotation time for the Imhoflot™ VM-04 cell.
Another school of thought believes that since the volumes of a laboratory-scale mechanical and a pneumatic cell are different, the flotation time has to be back-calculated by correcting the pneumatic cell’s effective volume [6]. By this, a new flotation kinetic curve is introduced where the cumulative recovery is depicted versus the modified-flotation time, showing faster flotation kinetics for the reactor–separator cell type. As an example, this was performed for the VM-04 cell over a laboratory mechanical flotation cell (MFC) in Figure 2. Approximately 70% of copper was recovered via the VM-04 Imhoflot™ cell at 10 min, whereas to reach 70% copper recovery using a mechanical cell, 35 min was required.
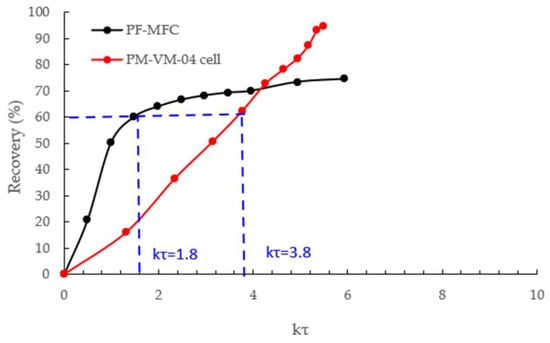
To overcome some of the challenges mentioned above and develop a relatively fair comparison between the cells, Hassanzadeh et al. [5] presented another method using kτ instead of flotation time or its modified version (Figure 3), where the k-values were estimated using two different equations. They acknowledged that, since the dispersion system within the Imhoflot™ laboratory-scale does not follow a plug-flow pattern due to the cell design and low shear rate, it results in poor flotation kinetics. They finally concluded that since the flotation time definition for pneumatic cells is relatively different than that for mechanical flotation cells, this technique has significant limitations. Instead, the number of passes was suggested as an appropriate alternative for these cells. In this regard, one pass/cycle refers to each frequency of passing the entire sample from the aerator. The duration of one pass is determined by dividing the pulp volume into the flotation system by the feed flowrate (Equation (1)). The number of passes/cycles accounts for the number of times the pulp passes through the aerator.
Figure 3.
A demonstration of flotation recovery versus kτ [5] (PF and PM denote the plug-flow and perfect mixing dispersion regimes, respectively).
One major difference between the classical scale-up procedure and the one that can be adapted for pneumatic cells is the dispersion regime within the cells. For a mechanical laboratory cell, the pattern follows plug flow; however, the results given for some of the laboratory-scale units, especially for the Imhoflot™ V-03 and G-06 cells, show that they follow the perfect mixing regime (Table 1). The only exception is RFC-100, following the plug flow, while operated in a batch mode [8]. In this regard, Benitez et al. [7] concluded that there is a significant difference between the mixing and residence time distribution (RTD) of batch and continuous mode operations for a Jameson L-150 Cell, recommending the batch mode as the scale-up approach for the continuous plants. In these evaluations, one needs to pay very close attention to the fresh feed and air flow rates, operation modes (batch, meaning without recirculation, and continuous, i.e., with recirculation), taking into account the degree of recirculation as well.
Table 1.
The measured and estimated required time per pass for various lab-scale pneumatic flotation cells.
It is interesting that for the Imhoflot™ cells, relatively favorable metallurgical results were reported with short retention times (2–4 min) in contradiction to their laboratory-scale units. Table 2 presents a few industrial operations and the metallurgical results obtained in comparison to the mechanical cells. It indeed highlights that the main challenge for this cell type remains in the kinetic performance of the laboratory-scale unit.
Table 2.
Examples of full-scale operations and the number of Imhoflot™ (IMF) and existing mechanical flotation cells (MFC), together with metallurgical outcomes.
3.2. Standard Dilution Cleaning Batch Tests
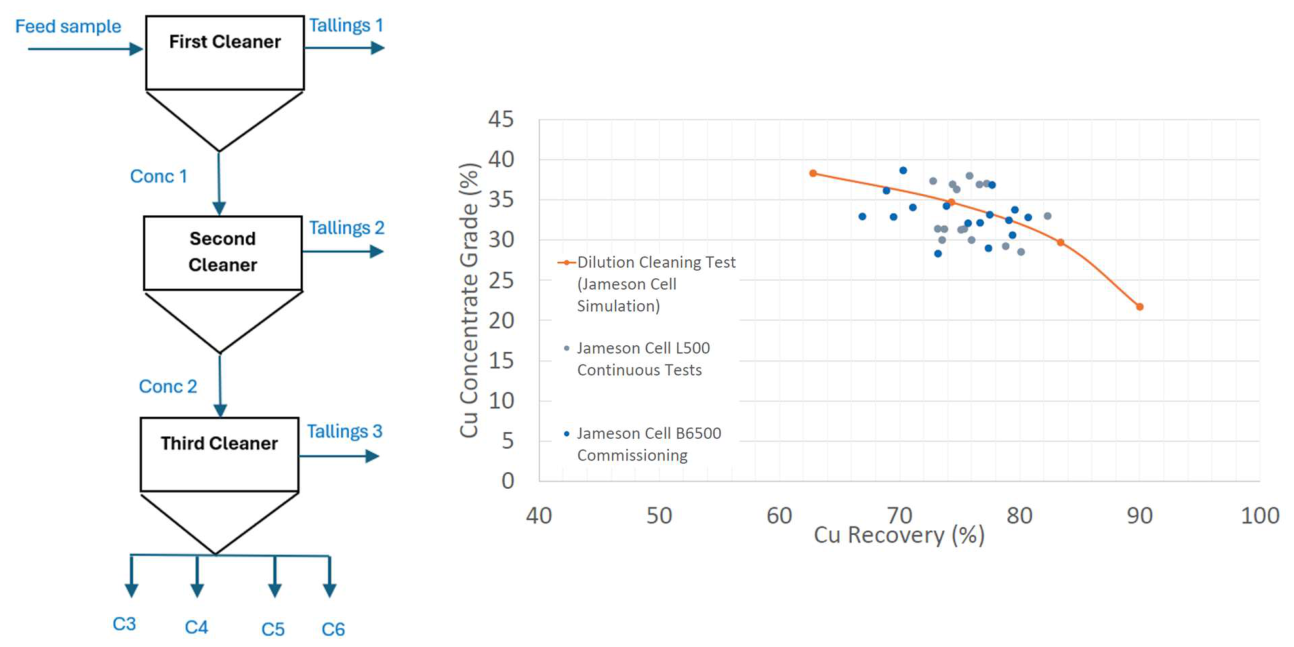
Standard dilution cleaning test on rougher concentrates performed using a mechanical flotation cell has been introduced and accepted by Glencore Technology as a method to simulate Jameson Cell performance and its scale-up [31,32,33]. The procedure is shown in Figure 4 and is found particularly effective when the sample quantity is relatively low to perform pilot-scale trials. This technique is also known as the infinite dilution cleaning method, which is believed to approach the maximum theoretical separation. As seen in Figure 4, the grade-recovery outcomes are in line with the results obtained through two other large-scale Jameson cells, i.e., L-500 and B6500, indicating a 1:1 outcome of the standard dilution cleaning tests and full-scale metallurgical results.
These tests are conducted with approximately 10% (w/w) solid content at scraping rates of 10–20 s to maximize the drainage of gangue particles in the froth zone using process water and only frother (if needed). The test is conducted by maintaining the frother concentration at the critical coalescence concentration (CCC) to ensure the formation and stability of fine bubbles, thereby simulating the bubble environment of a Jameson Cell. Results from these tests can be used to evaluate the suitability of Jameson Cell for improving concentrate grade in the flotation circuit under investigation. The grade–recovery curves generated from dilution cleaning tests scale on a 1:1 basis to full-scale industrial installations. Since it has been practically shown for several commodities that one Jameson Cell performance is equivalent to three mechanical ones in the cleaning stage, such laboratory tests often consist of three cleaning stages [34]. Although it was successfully applied for some operations, some open questions remain unanswered. Firstly, the commodity type should be considered and assessed in terms of selecting three cleaning stages before its generalization. Secondly, since the procedure undertaken is similar to the cleaning tests, it might only represent the cleaning stage, not the rougher, scavenger, and other duties. Thirdly, since the procedure still uses the mechanical flotation cells rather than the Jameson Cell for mimicking the industrial performance of the Jameson Cell, the operating conditions on the plant side should be optimized carefully. Other than this, it appears that there are two other self-standing rigs, i.e., L-150 and L/Z-500 can also be utilized for laboratory test works and on-site pilot trials to foresee/predict the Jameson Cell performance in plants. These units require 2–20 L/min and 2–12 m3/h feed rates for continuous operations, and 5–25 kg and 70–250 kg samples per batch mode test, respectively. Similar to the standard dilution tests, the scale-up factor for these cells is assumed to be one, too. In terms of the standard dilution tests, considering a 6%–10% mass pull from rougher tests for a sulfidic copper ore, the minimum sample amount for the rougher tests to generate a sufficient amount of sample for standard dilution tests should be approximately 20–25 kg, where the L-150 (the smallest Jameson Cell) operates in this range of sample amount. The question remains why those tests should be performed, although the L-150 can be operated under the same sample amount.
Figure 4.
Standard dilution test procedure for scaling up Jameson Cells [35].
3.3. McCabe–Thiele Diagram
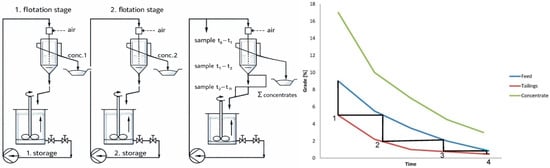
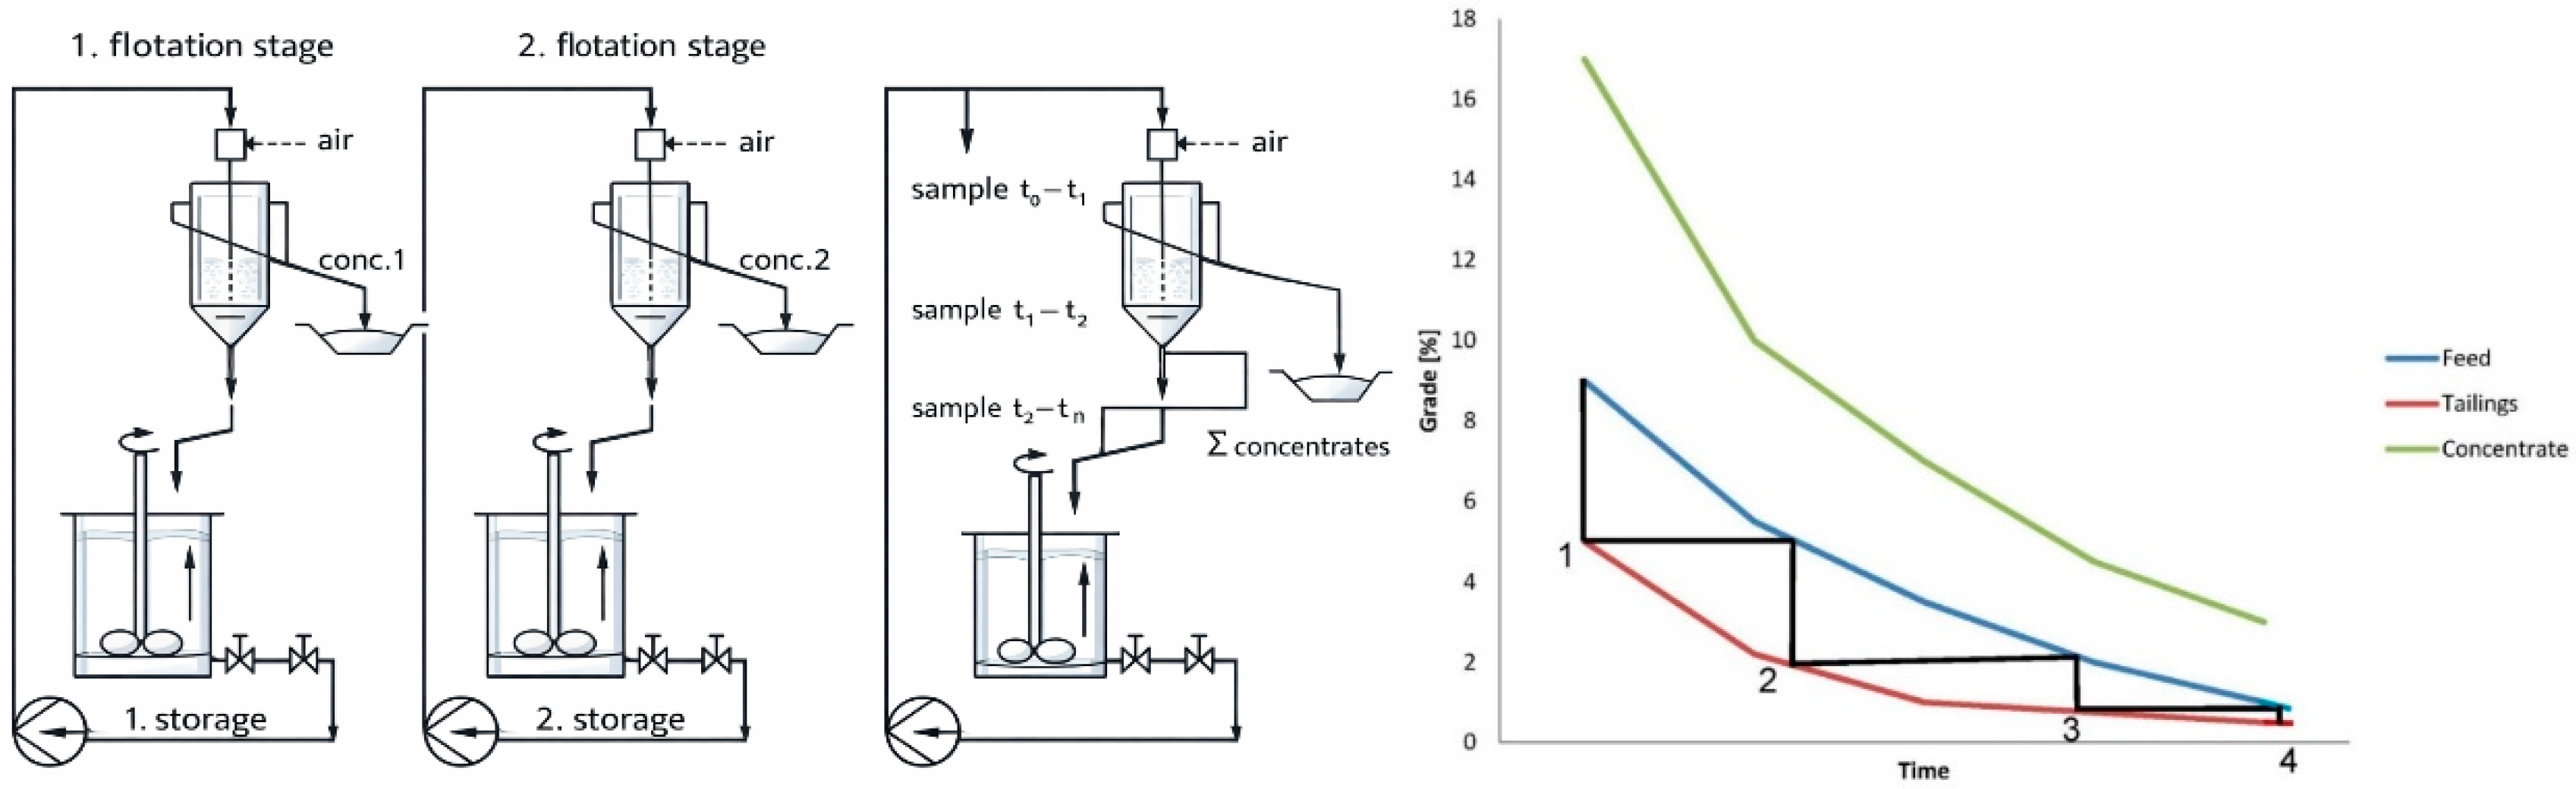
This approach was proposed by Maelgwyn Mineral Services [36] and later applied to a few case studies through both batch-scale test procedures and continuous mode [37]. In this approach, the number of pneumatic cells is selected based on the McCabe–Thiele diagram (Figure 5), where each cycle/pass requires a specific time under an optimum range of operating flow rate. This graph depicts the grade of the target element in tailing, concentrate, and feed as a function of time. The term time is not exactly the flotation time known by the mechanical cells because its magnitude will depend on the conditioning tank volume, flowrate and cell retention time. For mechanical cells, the time is defined from the moment the air is injected into the cell; however, while the material is fed to the Imhoflot laboratory cell, the air is already open, and the flotation time starts from the moment the first concentrate is gathered. By drawing the feed vertically to the tailings’ grade, then horizontally to the feed and pursuing this technique further, the number of Imhoflot™ cells will be obtained. This technique can be carried out by (i) recirculating tailing into the conditioning tank and/or (ii) treating each cycle separately by taking samples and re-floating the feed sample without re-circulation (batch test procedure). To run a batch test, it requires an additional storage tank where the tailings of each pass is collected, and later, it will be fed to the aerator for the second run/pass of the flotation. This loop will be followed until no loaded bubble is detected on the cell launder.
Figure 5.
A schematic graph showing the batch and continuous flotation test procedures and the McCabe–Thiele diagram.
Although it has been used for several cases, there are still some uncertainties and challenges involved with the approach that need to be clarified in the future. For instance, in the batch mode, (i) operating the unit requires significant manpower and considerable effort compared to the Denver-type mechanical cells, (ii) the definition of starting flotation time is unclear because of the filling of the tank at the beginning, as described above, and (iii) it is an operator-sensitive approach meaning the operator has to be well-trained to know how to operate the equipment to obtain reasonable results. For this reason, a continuous mode was selected for the presented case study as described in Section 4.2.
4. Proposed Methodology with a Case Study
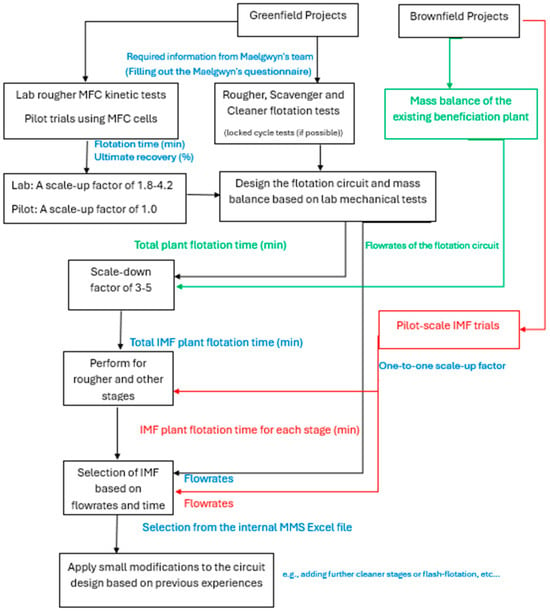
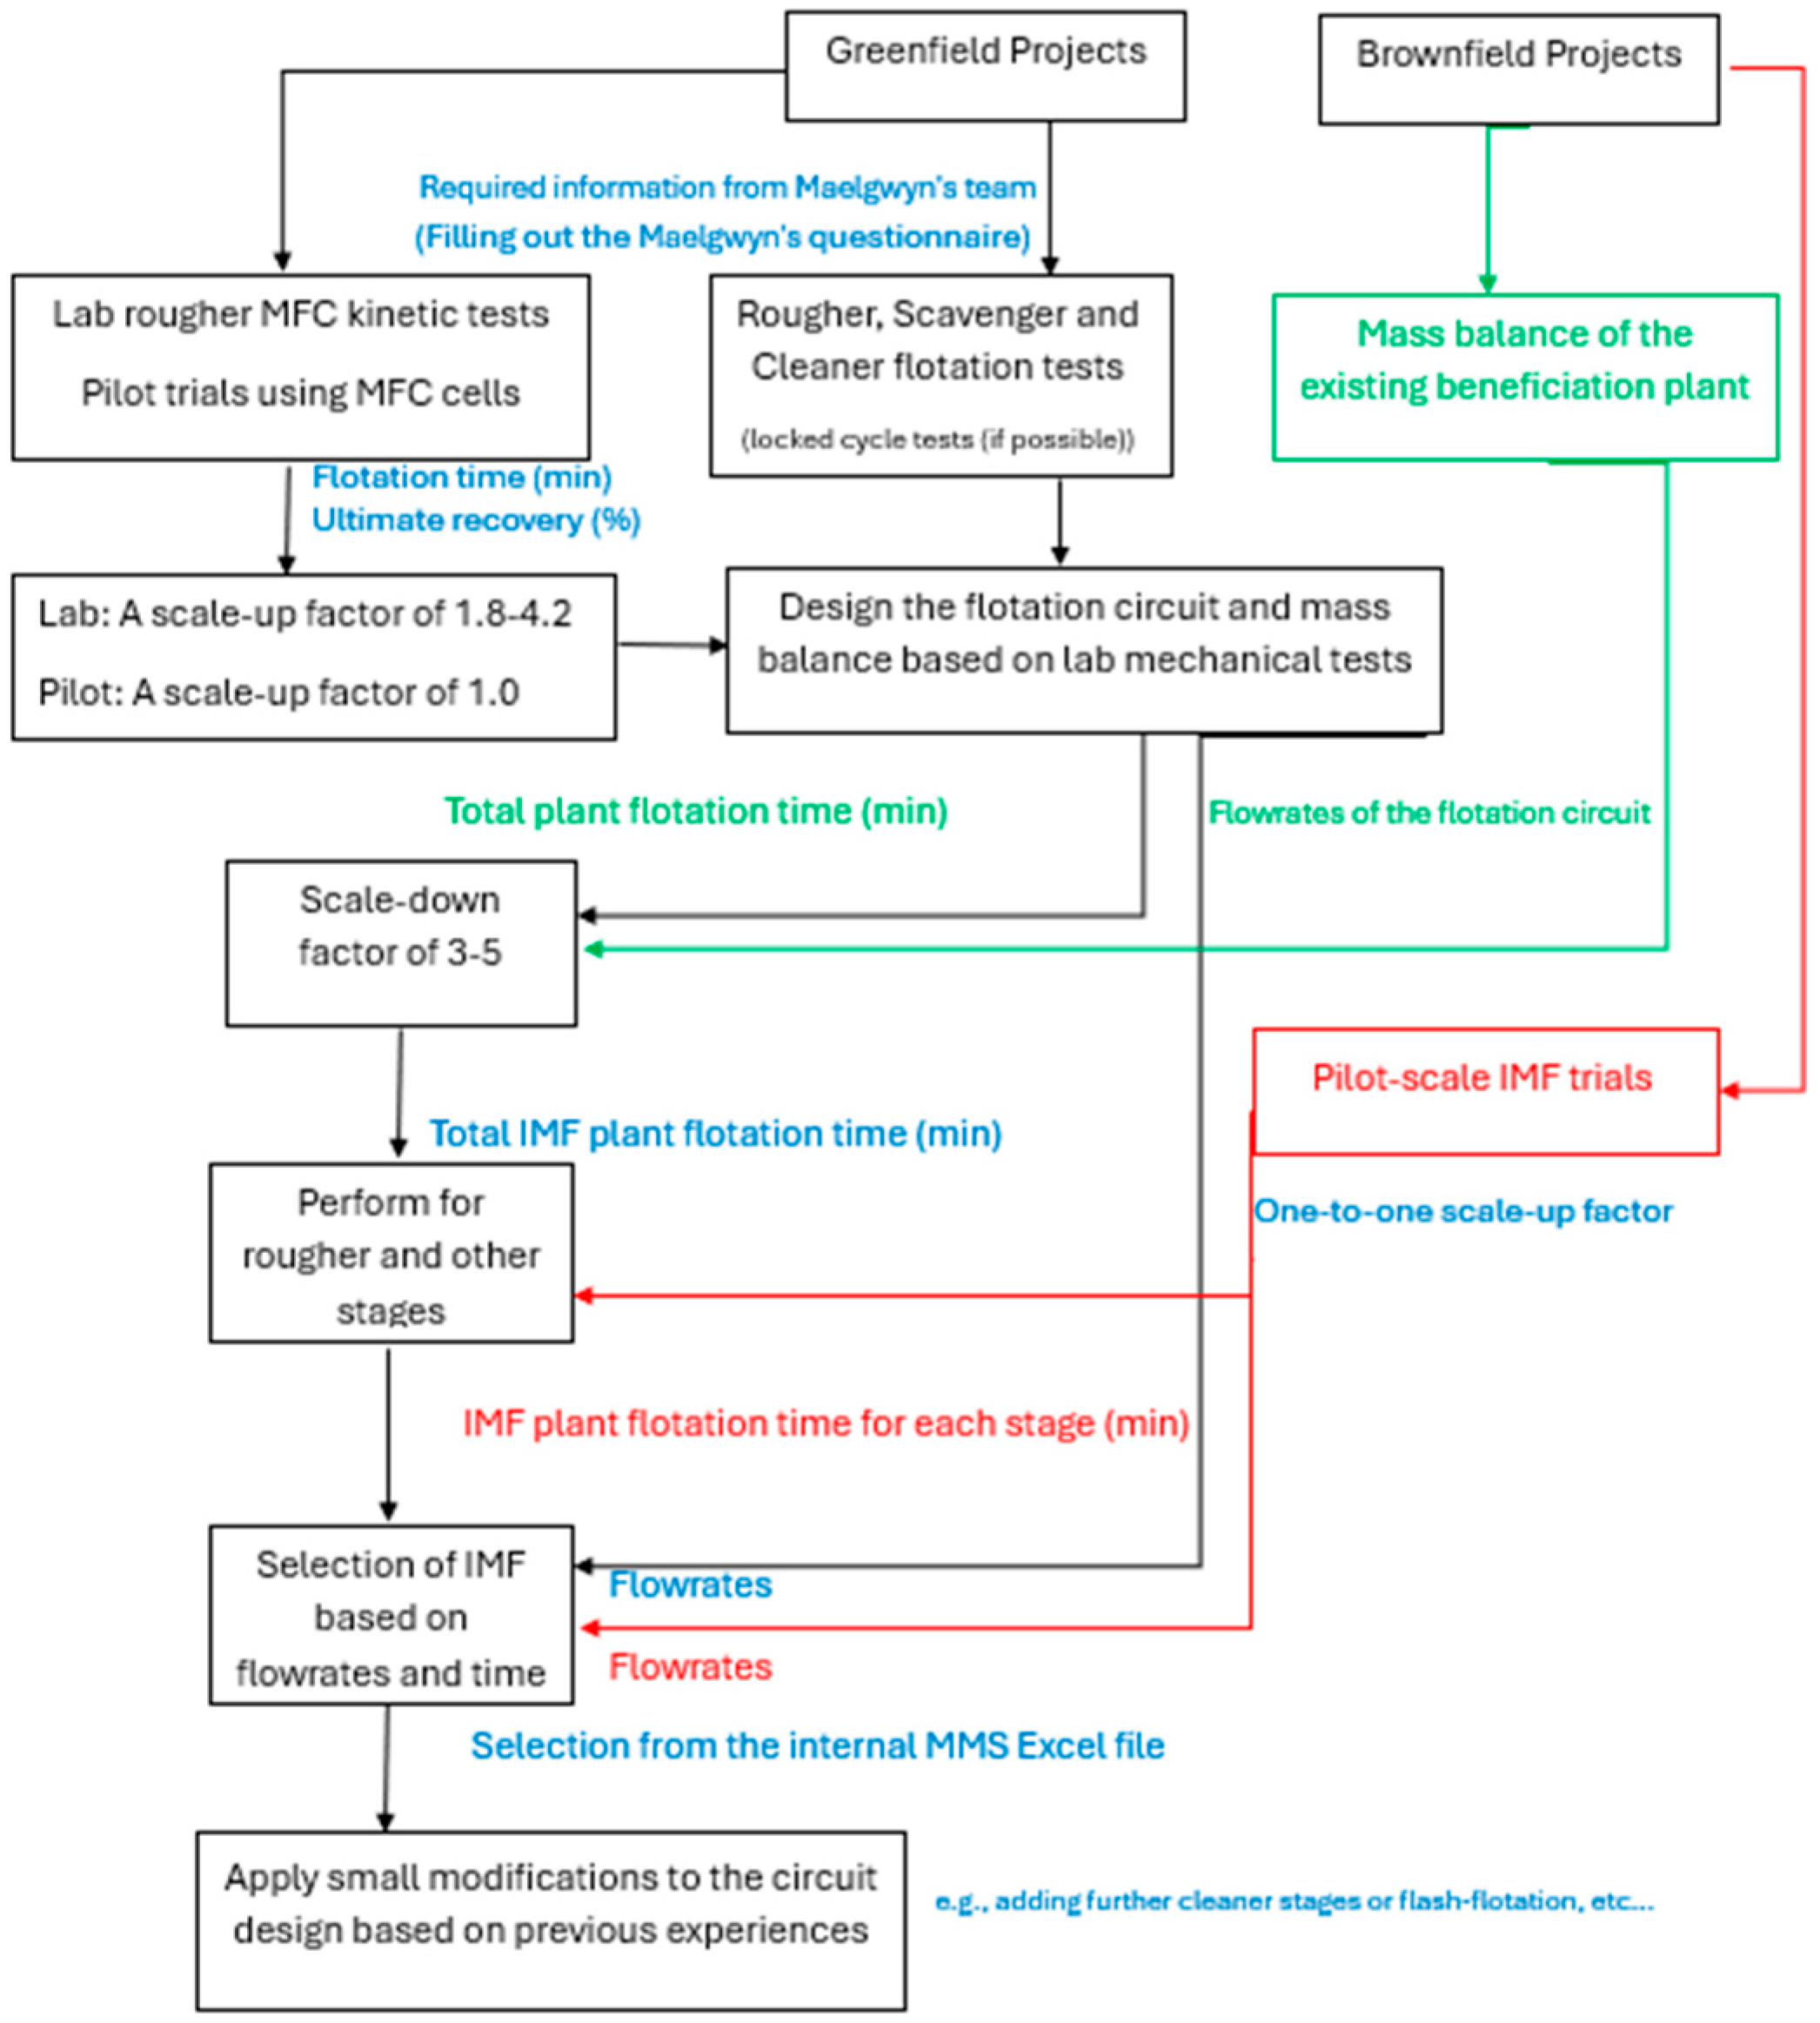
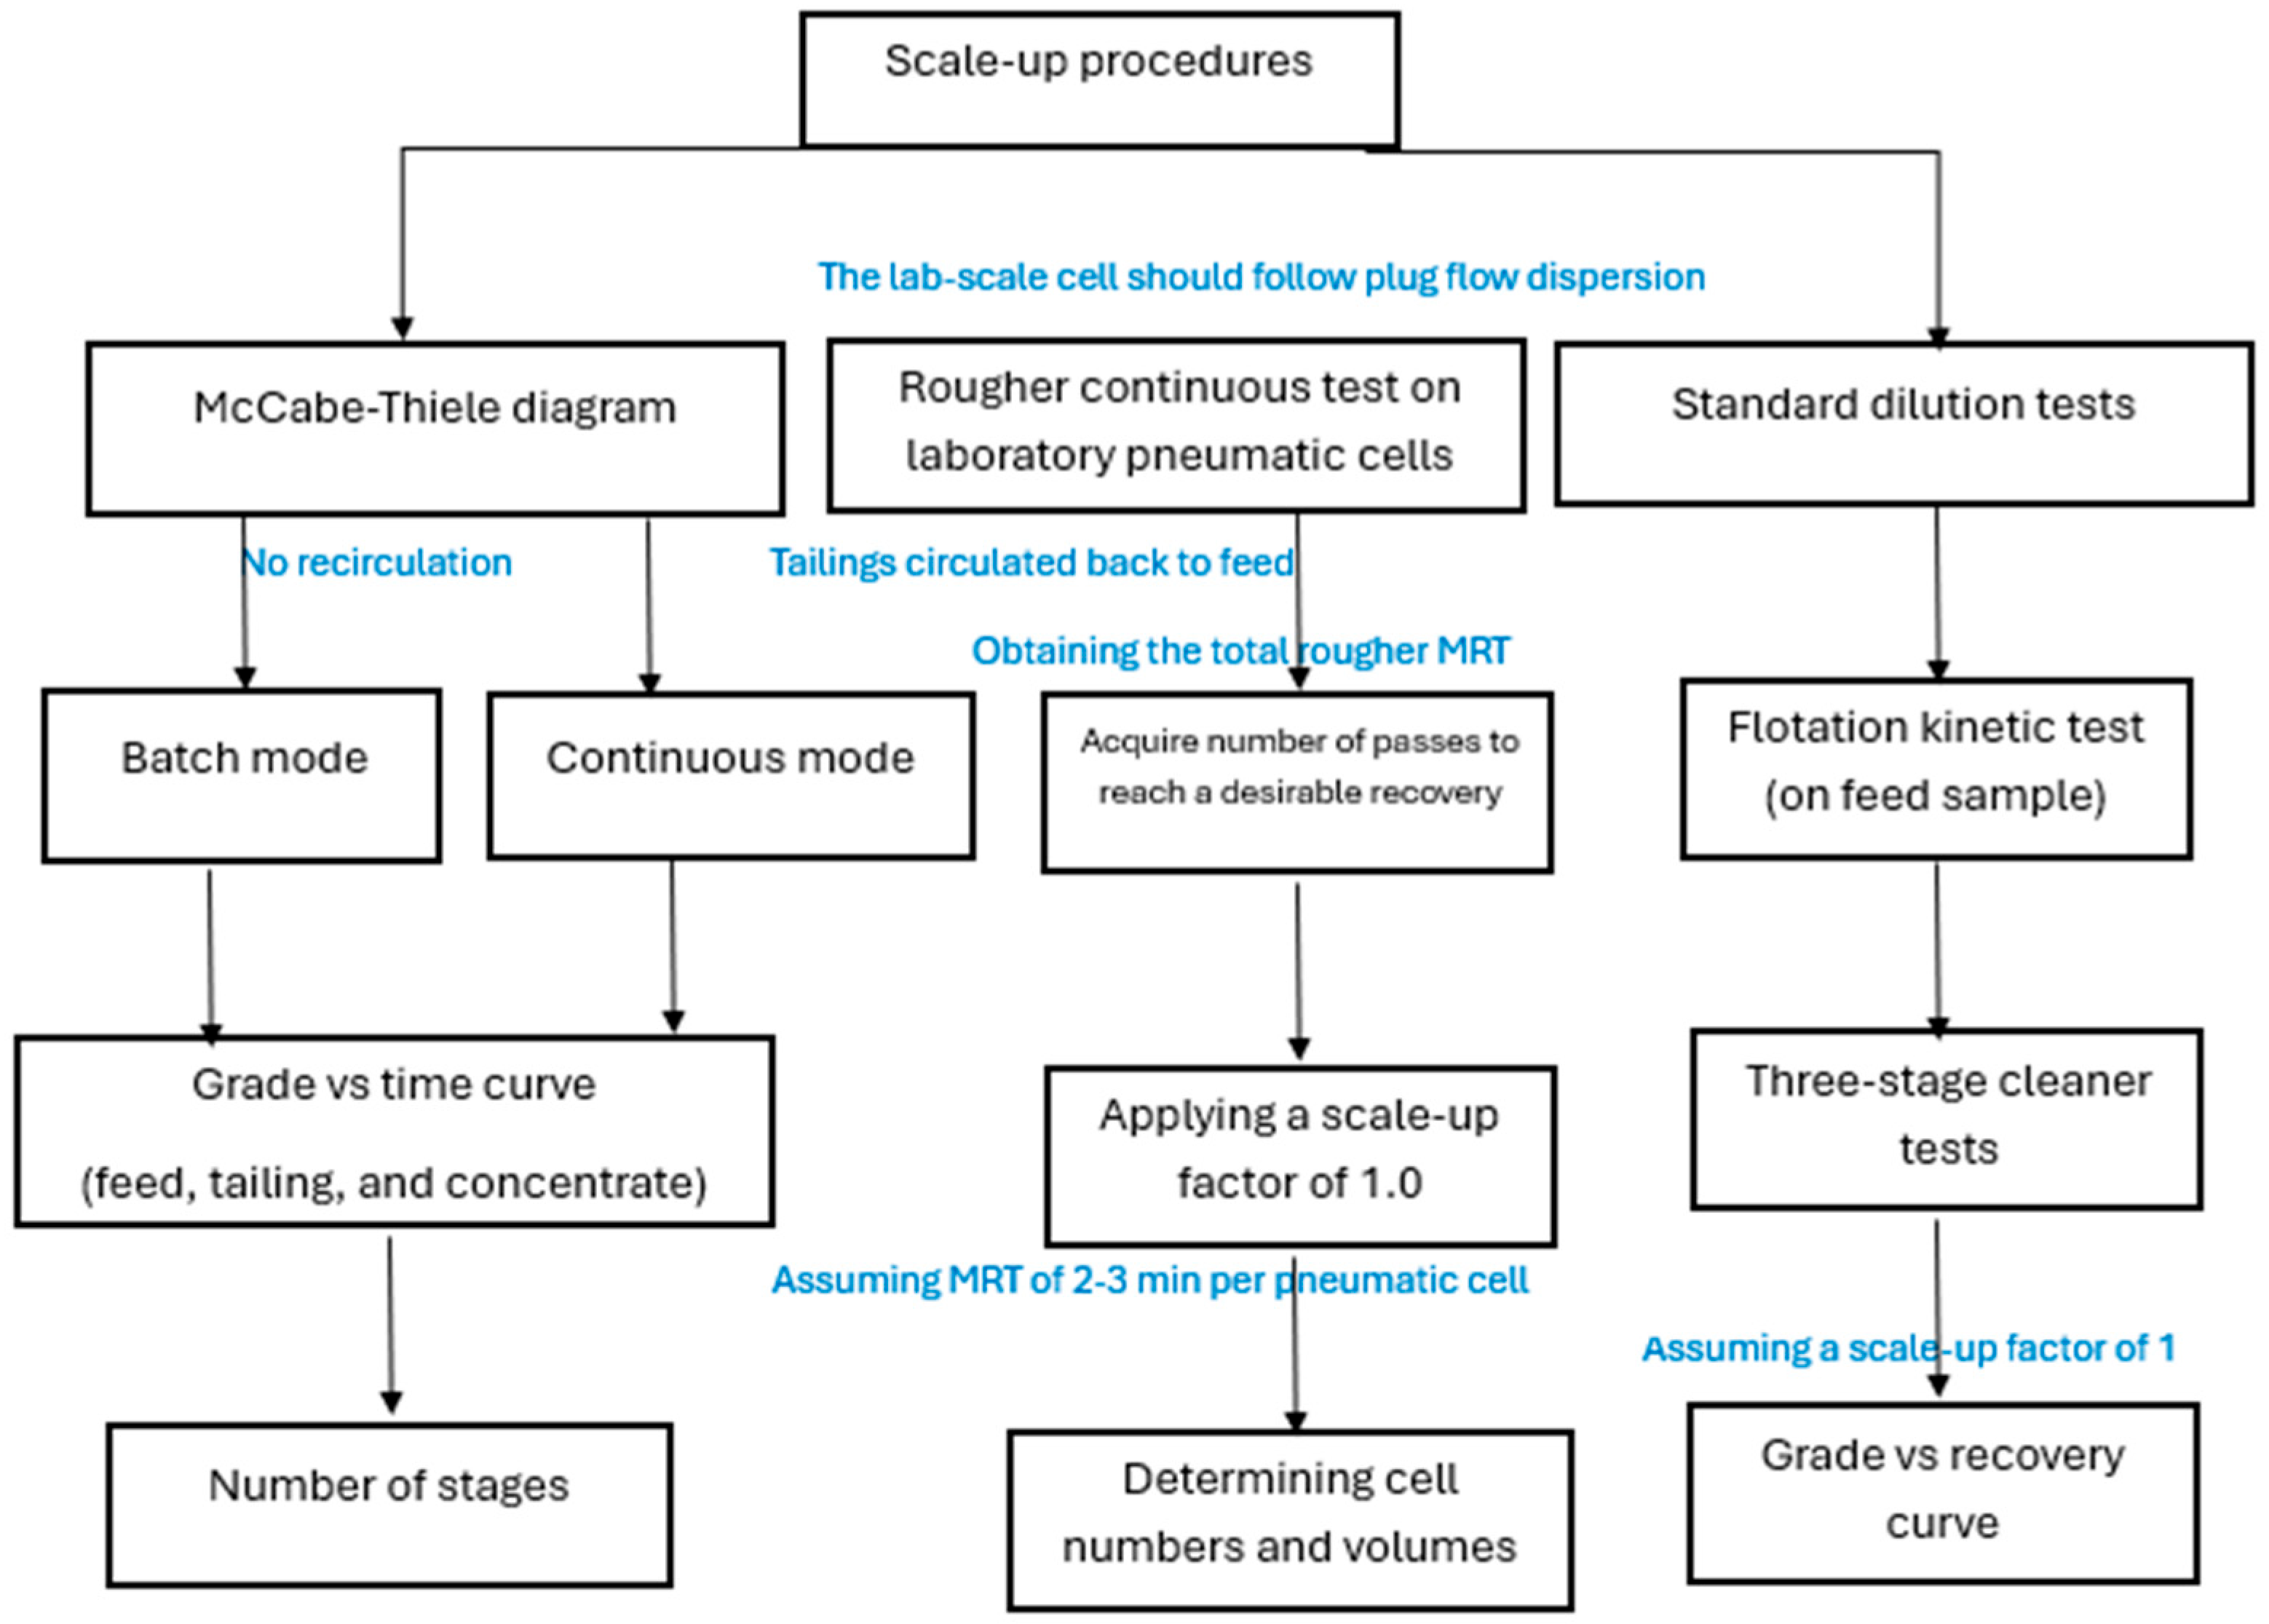
Figure 6 presents the potential approaches for scaling up, integrating, and selecting Imhoflot™ cells for both brownfield and greenfield projects. In brownfield applications, where existing operations are in place but suboptimal performance has been identified, Imhoflot™ cells can be integrated into current flotation circuits. At the first level, circuit mass balancing and determination of stage-wise residence times are undertaken, followed by application of a scale-down factor of 3–5 for each duty to define the required Imhoflot™ cell sizes and quantities. At the second level, pilot-scale and on-site trials are conducted and optimized at selected process streams to provide high confidence, with the scale-up factor assumed to be close to unity. For greenfield projects, rougher flotation kinetic testing using conventional mechanical flotation cells can be employed as a baseline approach. Based on these results, the overall circuit can be designed and the Imhoflot™ cells selected using the applicable scale-down factor and the design feed flow rate.
Figure 6.
A flow diagram for selecting and scaling the Imhoflot™ cells based on mechanical flotation cell rougher flotation test, Imhoflot™ lab cells, pilot trials for both green and brown fields.
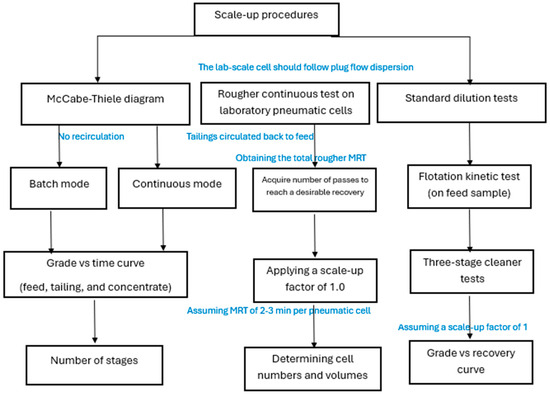
An alternative approach involves the use of McCabe–Thiele analysis together with laboratory-scale Imhoflot™ testing in batch and/or continuous operating modes, as illustrated in Figure 7. Continuous-mode tests conducted on the laboratory Imhoflot™ cell allow the determination of the number of passes required to achieve a target plant recovery. The required number of Imhoflot™ cells and retention time per cell/pass can be calculated using Equation (2). This, in turn, enables calculation of the total cell volume based on the process flow rate.
Figure 7.
A summary of three approaches to scale-up pneumatic flotation cells.
The following case study examines its performance in a greenfield project. The proposed approach shown in Figure 6 and Figure 7 was applied as a demonstrated case study, and the resulting flotation times are used to determine the required number of pneumatic Imhoflot™ cells. Based on the throughput into the flotation circuit, the cell sizes and numbers are also calculated. The feed was crushed and milled to a top size of 1 mm (d80 of 500–600 µm and d50 of 250–430 µm). Feed sample contained about 58.8 wt.% target mineral, 37.6 wt.% main gangue, and 3.6 wt.% other silicates.
4.1. Laboratory Mechanical Flotation Test
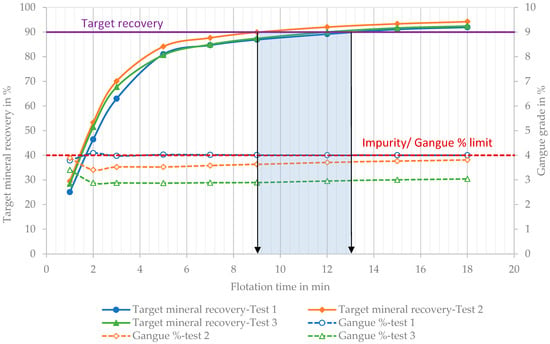
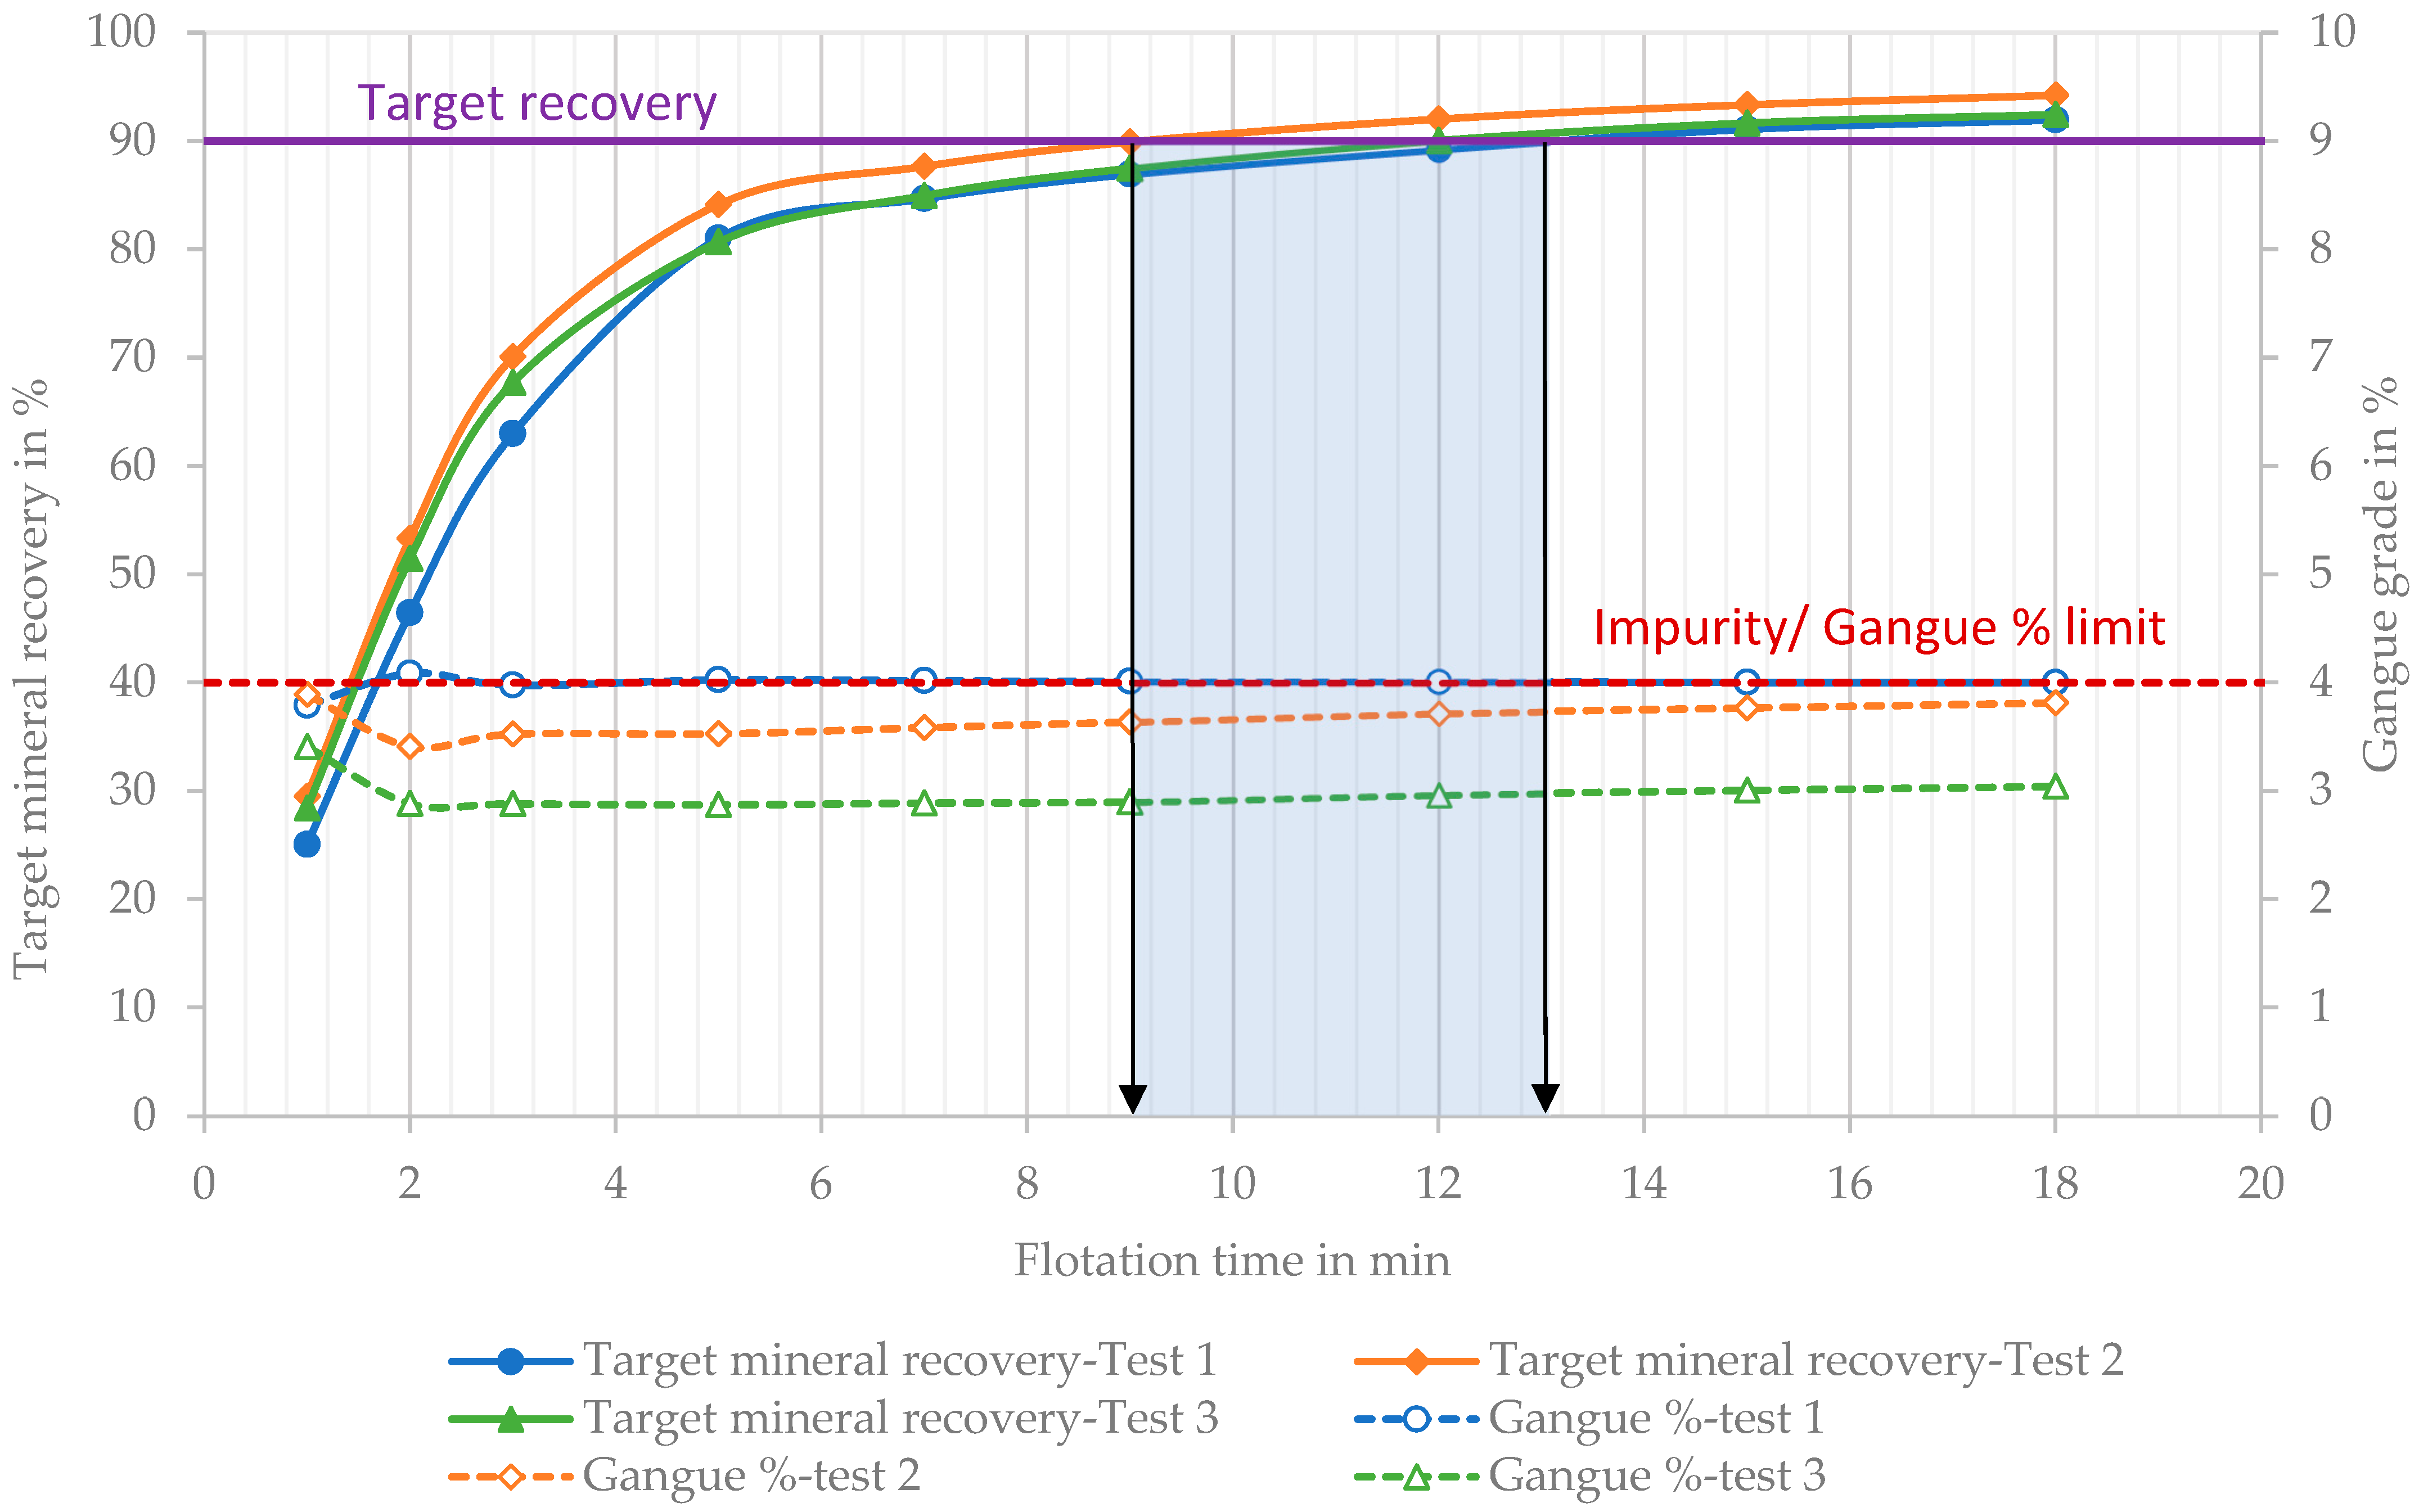
To design the cell sizes, flowsheet, and processes, laboratory flotation kinetic tests were performed using a mechanical cell as a substitute for continuous pilot trials, owing to restricted access to the feed material. Flotation test conditions were as follows: a cationic-based collector was added with a few minutes of conditioning time. The air flow rate and impeller speeds were maintained at specific levels. The total flotation time was 18 min, during which 6 rougher concentrates were collected for 9 min, followed by three scavenger concentrates collected over the final 9 min. The rougher kinetic test aimed to determine the optimal flotation time required to achieve a concentrate grade of ≥17.5% target element (90 wt.% target mineral) with a recovery above 90%, and a gangue content below 4%. The flotation kinetic test was conducted in triplicate to ensure reproducibility of metallurgical outcomes. The required flotation time to achieve 90% recovery was about 9 to 13 min, as exhibited in Figure 8. A scale-up factor of 2.0 [38] was applied to this type of ore, resulting in a required flotation time of about 18 to 26 min in the plant. Laboratory flotation results indicated that the final concentrate grade can be achieved using only roughing and scavenging stages at a high recovery. Depending on the ore mineralogy and commodity type, as well as duty, one pneumatic Imhoflot™ cell is equivalent to approximately 5 to 7 min of the industrial plant flotation time. Consequently, a configuration of 4 Imhoflot™ cells was calculated to achieve a total flotation time of 20 to 28 min, meeting the required residence time.
Figure 8.
Flotation kinetic tests with three replicates.
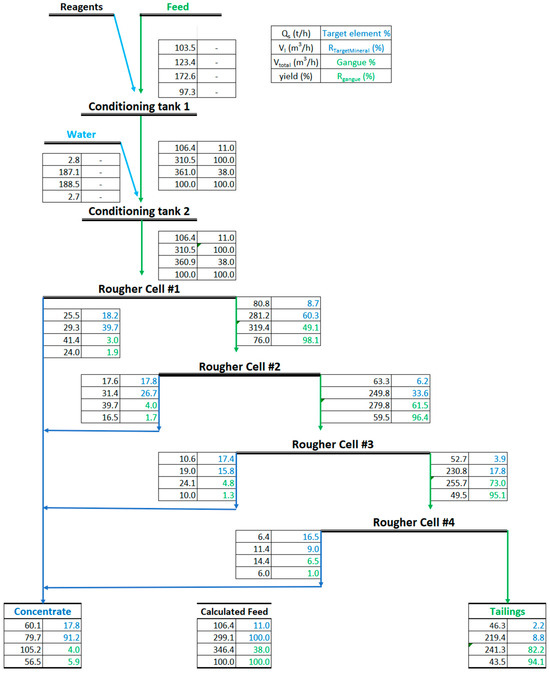
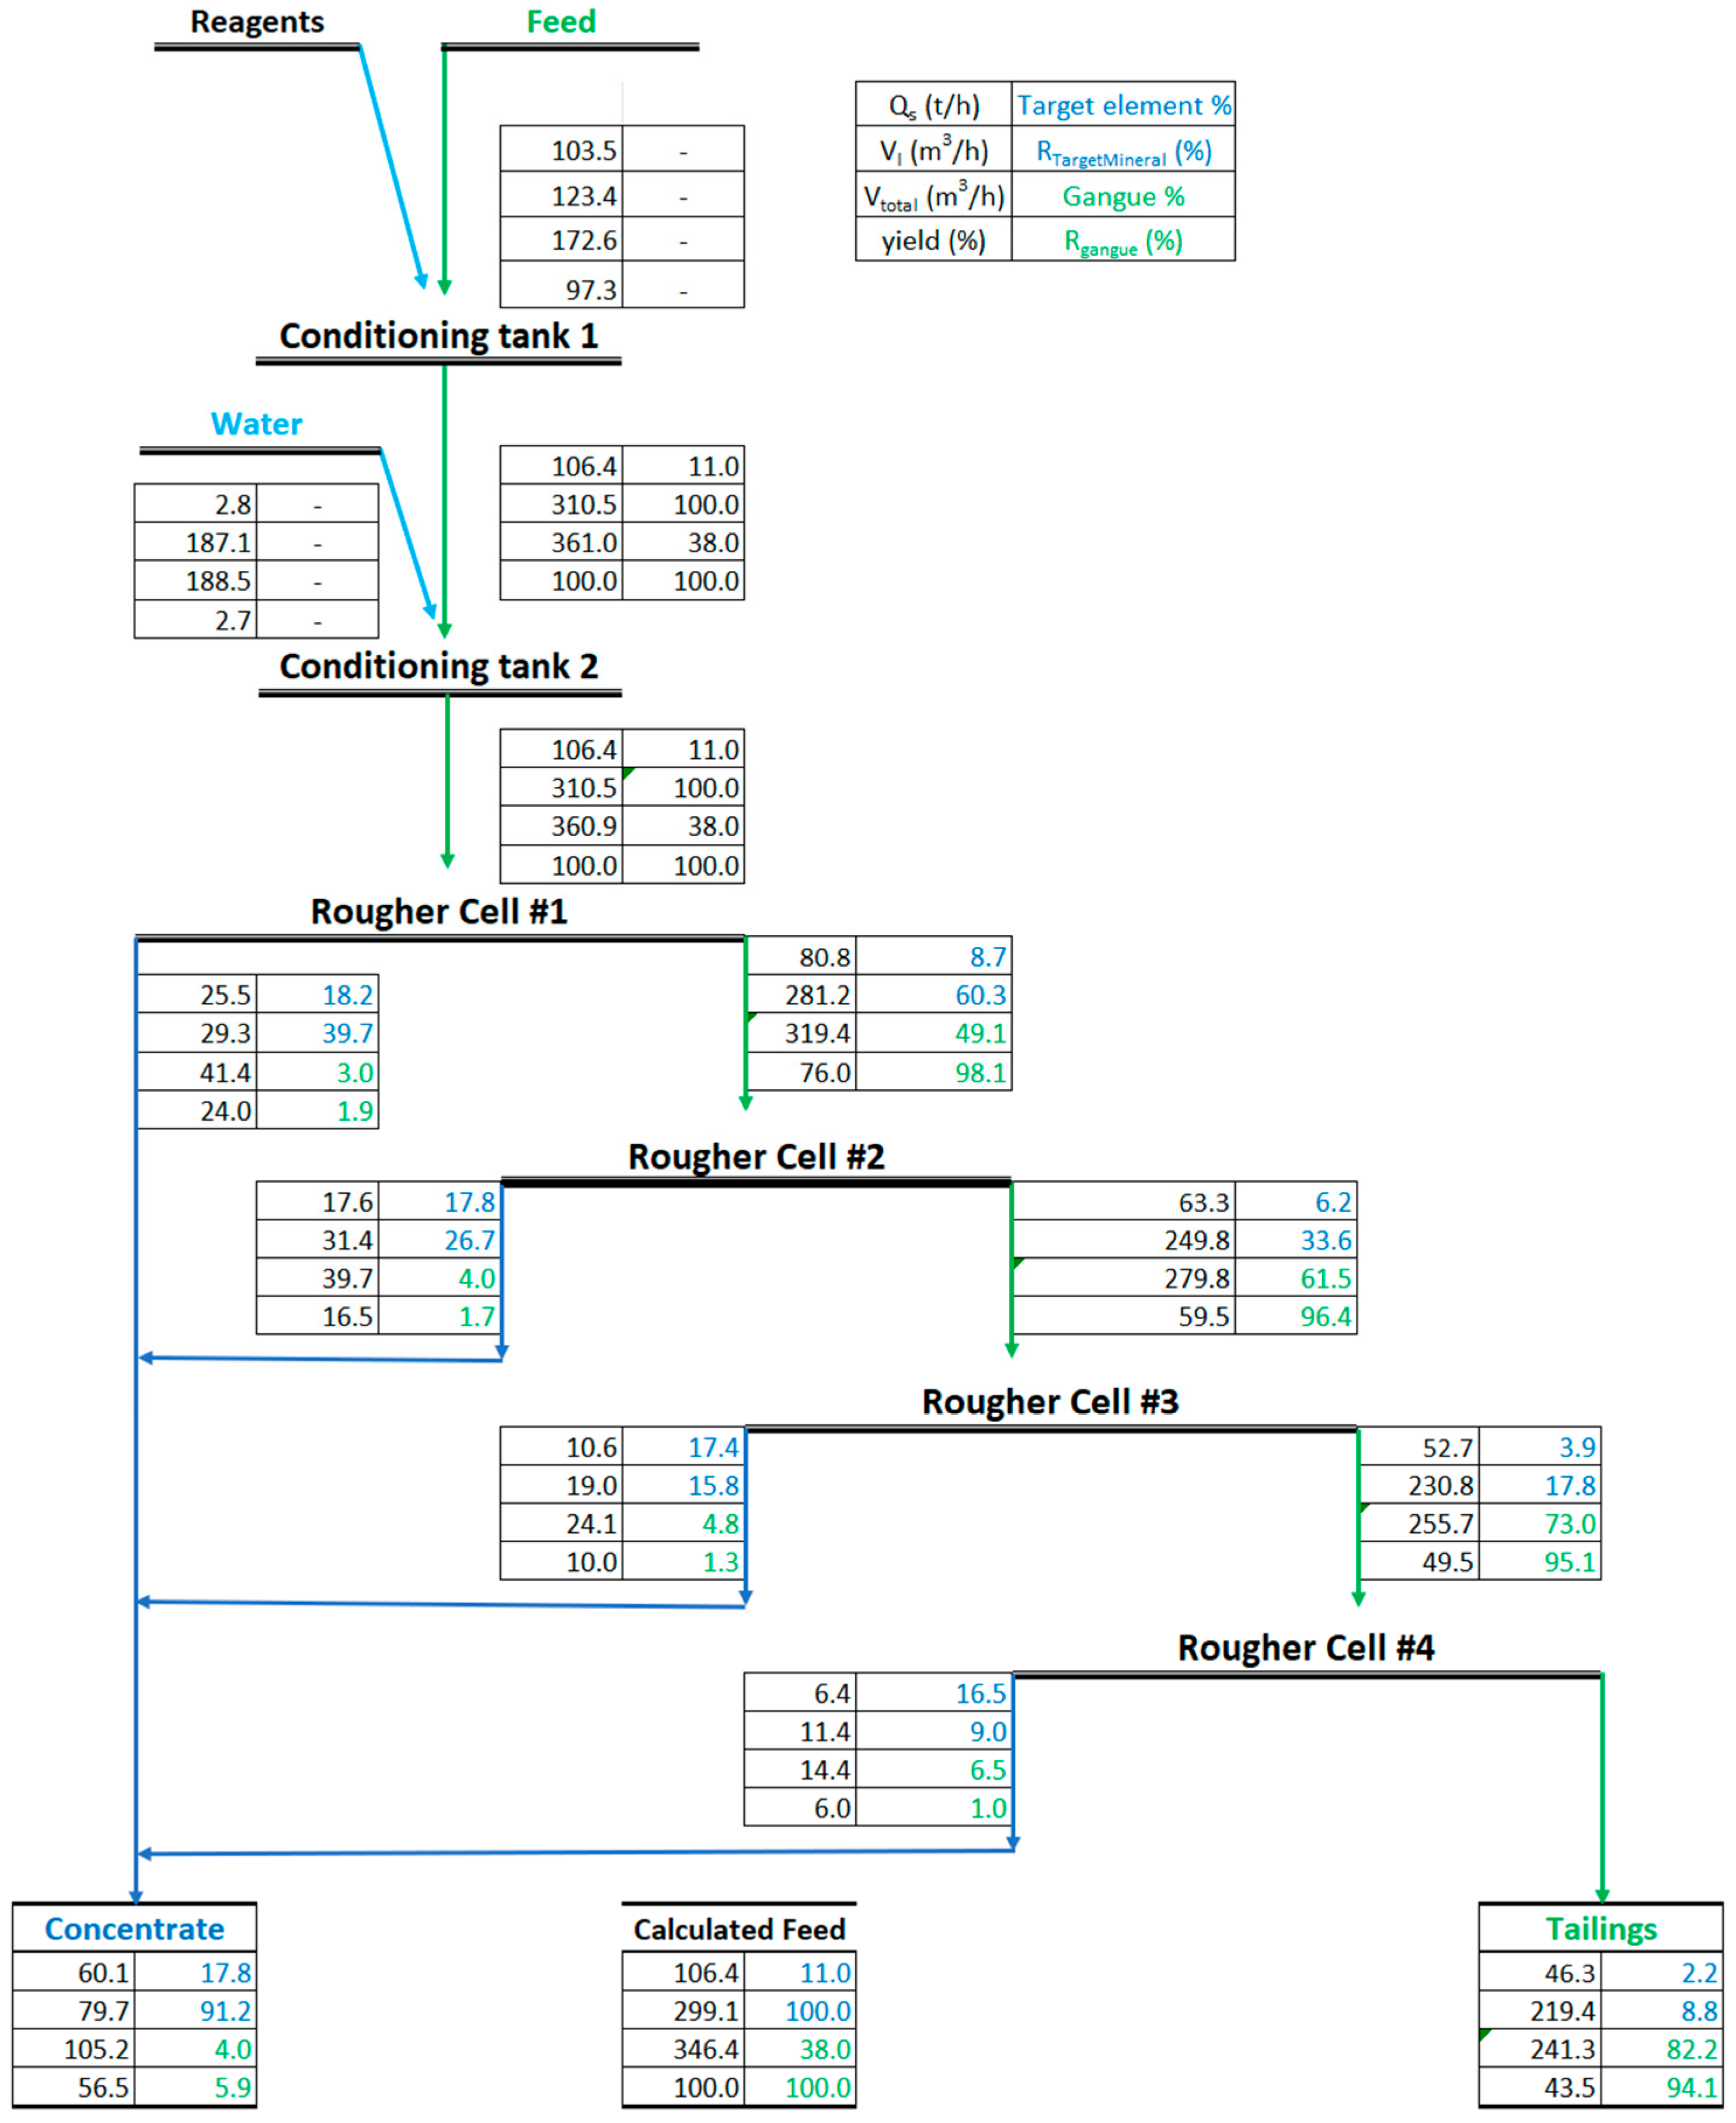
Based on the flotation test results and the projected throughput, a mass balance (Figure 9) was calculated to determine Imhoflot™ cell sizing and requirements for piping and pump selections. It can be seen that after treating the material with four rougher cells, the target mineral grade reaches 88%, maintaining the gangue mineral content desirably below 4%.
Figure 9.
Normalized mass-balanced data in the presence of 4 rougher cells.
4.2. Hot Lab/Semi-Pilot Pneumatic Imhoflot™ V-03 Test
During the operation, an Imhoflot™ V-03 (V-Cell type, 300 mm in diameter) was shipped to the site for the hot flotation test. The objective of this test was to validate the number of cells and optimize the conditioning time, reagent regime, and overall flotation process. The cell throughput is approximately 300–600 L/h with a cell volume of 27 L. The collection time for each concentrate was 15 min (Equation (1)), which corresponds to one theoretical pass (the time required to pump the entire slurry volume through the cell once). The V-03 Imhoflot™ test was conducted onsite using a 100 L slurry feed, which was taken directly from the feed stream to the industrial flotation circuit. Test conditions were as follows: feed flowrate 420 L/h at 1.4 bar slurry pressure, 2.5 L/min of air, 3–5 cm froth height using a cationic collector. The collection time for each concentrate was approximately 15 min. The theoretical time per pass-the time required to pump the entire slurry volume through the aerator-separator once-was determined using the feed slurry volume (VF) and the feed flow rate (QF):
The residence time can be calculated by dividing the cell/separator volume (VCell) to the feed flow rate (QF):
Following the description of the proposed methodology in Figure 5 and Figure 7, the McCabe–Thiele test method was applied for this case study. A total target mineral recovery of approximately 81% was achieved across four passes. This result, together with the outcome of recovery per pass, indicates the required number of cells (i.e., 4) to achieve a desirable recovery of 81%. Since the laboratory cell retention time (Equation (2)) was 3.8 min and 4 cells are required, the total retention time in the plant is approximately 16 min. By considering the plant’s volumetric feed flowrate of 360–500 m3/h, the mean retention time per H cell is in the range of 2.8–4.0 min (Equation (1), considering 24 m3 total volume for one H cell). By considering 4 min mean retention time per each full-scale cell and four cells in series, the total plant retention time of 16 min will be in line with the laboratory V-03 cell results. This outcome aligns with the number of cells estimated from lab-scale mechanical kinetic flotation tests.
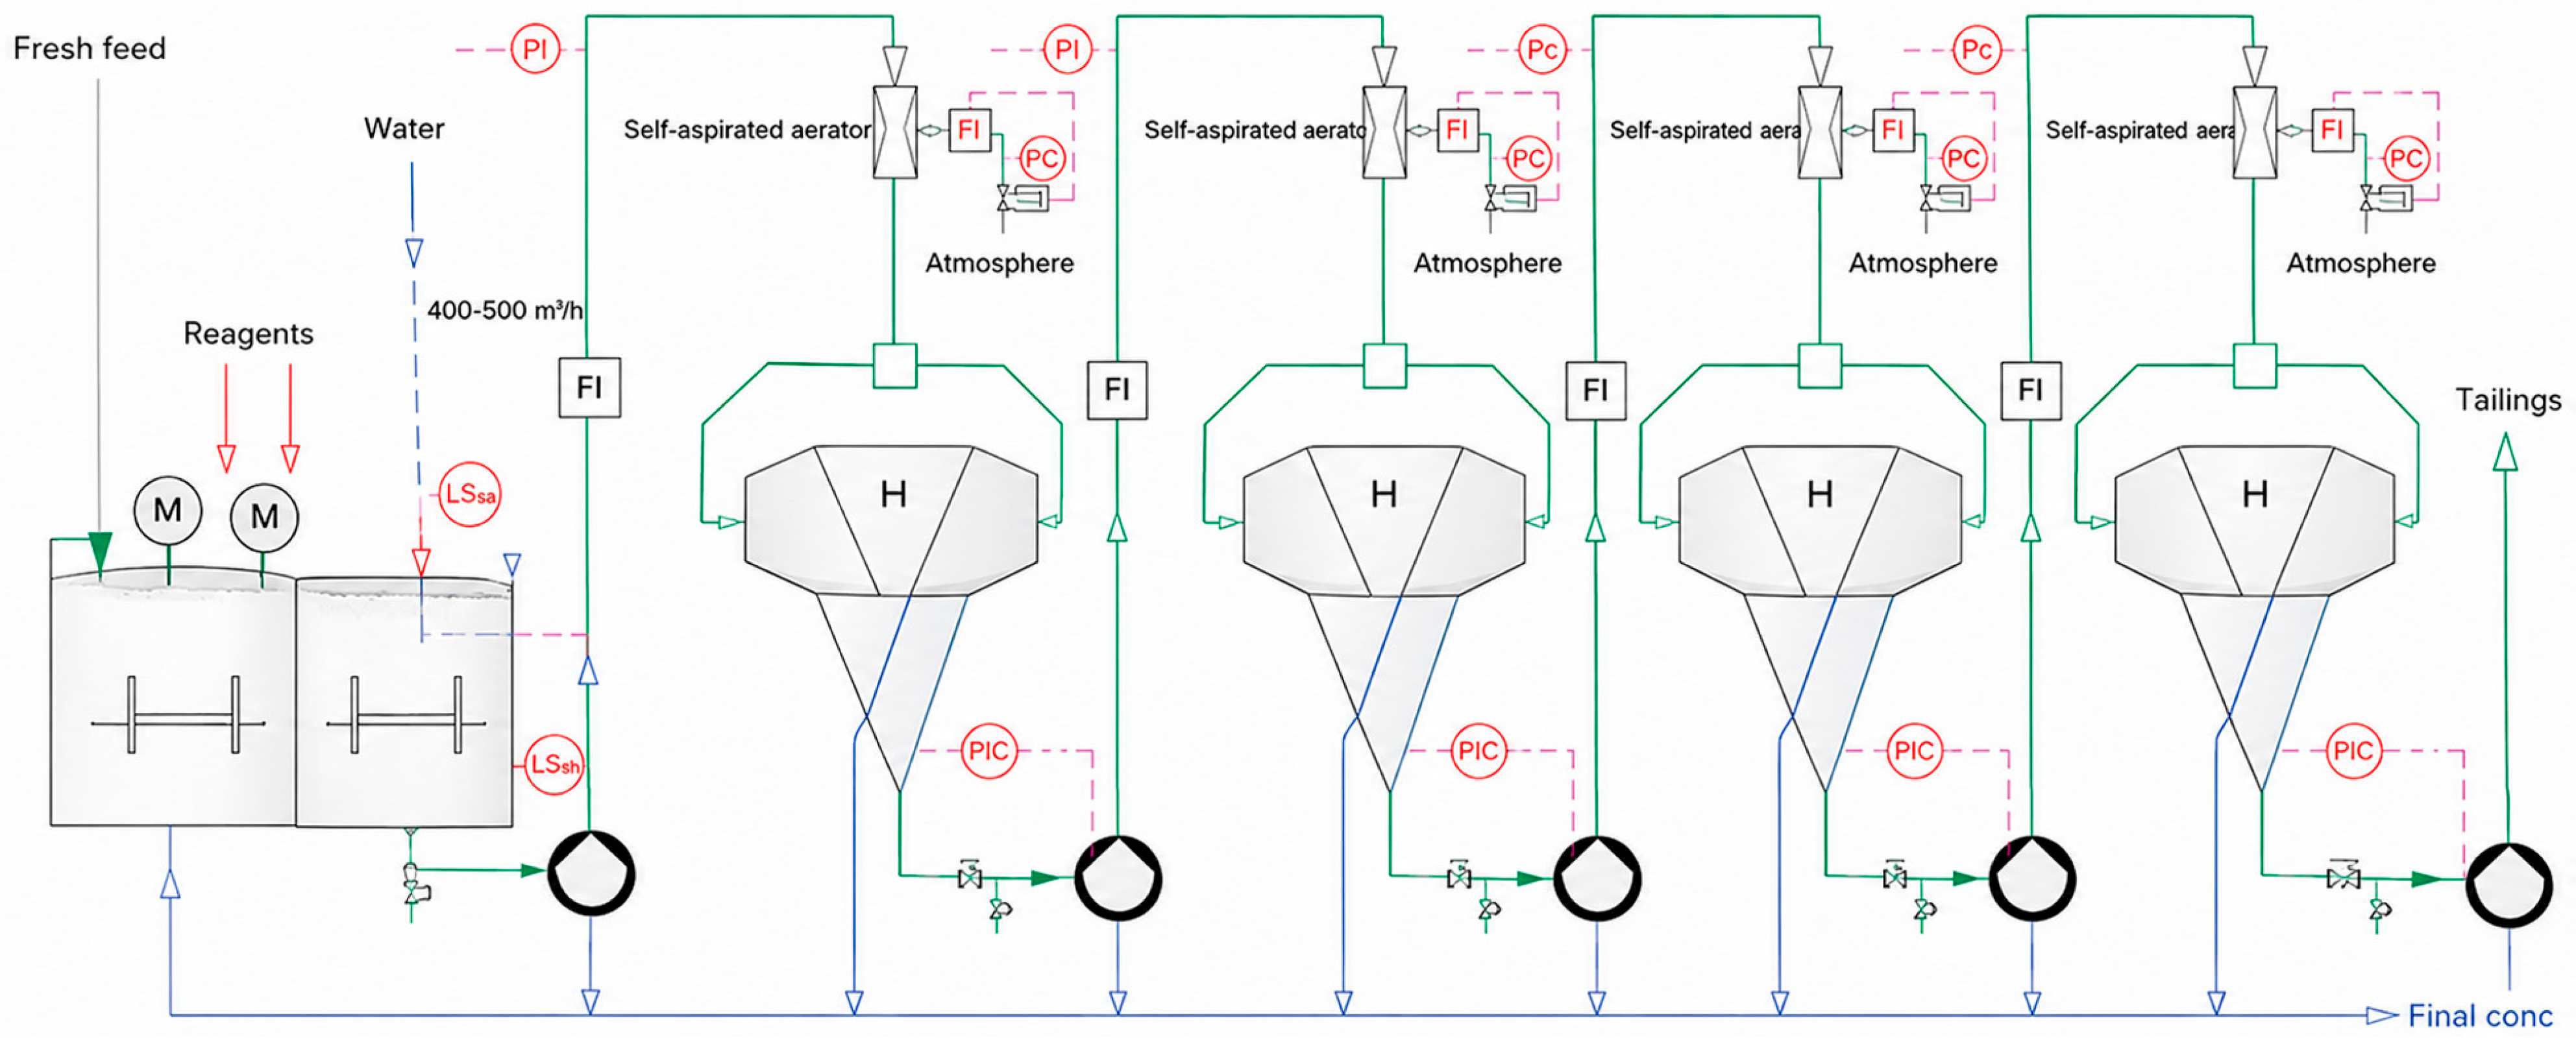
Based on the laboratory results, the throughput and mass balance information showed in Figure 9, four numbers of H-cells were selected to operate up to approximately 400–500 m3/h. Figure 10 shows a flowsheet that utilizes 4xH-cells (hybrid Imhoflot™ cell, combined V- and G-Cell types) and the relevant configurations.
Figure 10.
Flotation flowsheet with the PID (Proportional–Integral–Derivative) proportional-integral-derivative control.
5. Conclusions
This paper reviewed the scale-up concept for reactor–separator flotation cells, addressing currently available methods, and critically analyzed their advantages and constraints. Several approaches were argued from a technical perspective, including residence time and dispersion-based methods, standard dilution cleaner tests, and the McCabe–Thiele diagram. It was revealed that the flotation kinetic method, based on flotation time, its modified version, and kτ, is not a suitable approach for scaling up reactor–separator flotation cells, especially for the Imhoflot™ and Jameson lab/semi-pilot scale cells, because they followed the perfect mixing dispersion regime. The number of passes was suggested as an alternative method instead of presenting the flotation time for these cells. By conceptual evaluation of the matter and based on the results obtained here and previous ones presented by the authors, they believe that a scale-up factor of 1 is only acceptable when the conditioning tank, aerator, and separator all together follow the plug-flow dispersion pattern. Further laboratory experimental results are required to validate this statement. It was disclosed that the main bottleneck for standard dilution cleaner tests remains production of a sufficient amount of mass in the rougher stage prior to conducting these tests, as well as all relevant uncertainties involved in grinding, conditioning, reagent dosages, and operator sensitivity.
The method presented by Maelgwyn Mineral Services was evaluated critically, revealing that the technique requires further improvements, especially in the batch operation mode (without recirculation). A flow diagram for scaling up and selecting Imhoflot™ cells and their circuit design was proposed based on the kinetic mechanical flotation test, Imhoflot™ lab-scale tests, and pilot trials. The evaluation of Imhoflot™ pneumatic flotation technology successfully validated its application in high-grade concentrate through using lab kinetic flotation data and a scale-up factor, and the McCabe–Thiele diagram using a V-03 Lab/semi-pilot pneumatic Imhoflot™ cell for upscaling and determining the number of required pneumatic cells. Laboratory kinetic tests determined a required industrial flotation time of 18 to 26 min (including a scale-up factor of 2.0) to achieve the target 90% recovery. By applying a scale-up factor where one Imhoflot™ cell equates to 5–7 min of industrial residence time, a configuration of four H cells was selected to meet the requirement. Applying the lab/semi-pilot Imhoflot™ V-03 test results confirmed the theoretical model, achieving a target mineral recovery of approximately 81% after four passes. This was in correlation with the projected performance of the four industrial units. It was concluded that the proposed and installed circuit was capable of producing a final concentrate grade of ≥90 wt.% target valuable mineral while maintaining gangue impurities below the 4% threshold. Imhoflot™ pneumatic approach simplifies the circuit by achieving a high concentrate grade using only the roughing stage.
As future work, it was concluded that technology providers must develop clear scale-up procedures, including proof-of-concept case studies for various commodities and duties, to ease integration of pneumatic cells into flotation circuit designs.
Author Contributions
Conceptualization: A.H.; validation: A.H. and D.H.H.; investigation: A.H. and D.H.H.; resources: A.H.; software and modeling: A.H. and D.H.H.; writing—original draft preparation: A.H.; writing—review and editing: A.H. and D.H.H.; visualization: A.H. All authors have read and agreed to the published version of the manuscript.
Funding
This research received no external funding.
Data Availability Statement
Data will be made available upon request.
Acknowledgments
We truly appreciate Rainer Imhof and Heinrich A. Sprenger from Maelgwyn Mineral Services Ltd. for their support and the metallurgy team for their assistance during the hot semi-pilot test works onsite.
Conflicts of Interest
Ahmad Hassanzadeh and Duong Huu Hoang were employed by the company Maelgwyn Mineral Services Ltd. Ahmad Hassanzadeh was employed by Behraz Energy Ashkan Ltd. Authors declare that the research was conducted in the absence of any commercial or financial relationships that could be construed as a potential conflict of interest.
References
- Hassanzadeh, A.; Safari, M.; Hoang, D.H.; Khoshdast, H.; Albijanic, B.; Kowalczuk, P.B. Technological assessments on recent developments in fine and coarse particle flotation systems. Miner. Eng. 2022, 180, 107509. [Google Scholar] [CrossRef] [Scilit]
- Ghasemi Flavarjani, M.H.; Sobouti, A.; Rezai, B.; Ahmadi, A. A review of fine particle flotation: Mechanistic insights and advances. Miner. Eng. 2025, 234, 109685. [Google Scholar] [CrossRef] [Scilit]
- Wang, J.; Runge, K.; Wei, L.; Wang, L. Hydrodynamic improvement of flotation machines and alternative machine selections beyond mechanical cells: A comprehensive review. Miner. Process. Extr. Metall. Rev. 2025, 1–24. [Google Scholar] [CrossRef] [Scilit]
- Hassanzadeh, A.; Safari, M.; Hoang, D.H. Fine, coarse and fine-coarse particle flotation in mineral processing with a particular focus on the technological assessments. In Proceedings of the 2nd International Conference on Mineral Science, online, 1–15 March 2021. [Google Scholar] [CrossRef] [Scilit]
- Hassanzadeh, A.; Gungor, E.; Samet, E.; Durunesil, D.; Hoang, D.H.; Vinnett, L. Imhoflot™ flotation cell performance in mini-pilot and industrial scales on the acacia copper ore. Minerals 2024, 14, 590. [Google Scholar] [CrossRef] [Scilit]
- Hassanzadeh, A.; Guner, M.; Gungor, E.; Drunesil, D.; Azizi, A. Measurement and modeling of residence time distribution in a G-06 Imhoflot™ cell. Minerals 2025, 15, 1311. [Google Scholar] [CrossRef] [Scilit]
- Benitez, M.; Vallejos, P.; Yianatos, J.; Vinnett, L. The mixing effect on scale-up factor of Jameson cells. In Proceedings of the Procemin Geomet 2024. In Proceedings of the 20th International Conference on Mineral Processing and Geometallurgy, Santiago, Chile, 7–9 August 2024. [Google Scholar]
- Guner, M.K.; Hassanzadeh, A.; Vinnett, L.; Yianatos, J.; Kowalczuk, P.B. Effects of operating parameters on residence time distribution in a REFLUX flotation cell. Miner. Eng. 2023, 204, 108439. [Google Scholar] [CrossRef] [Scilit]
- Vinnett, L.; López, C.; Yianatos, J.; Justel, F.; Hassanzadeh, A. The effect of tailings recirculation on the kinetic response of laboratory-scale reactor-separator flotation cells well-described by a plug-flow regime. Miner. Eng. 2025, 227, 109272. [Google Scholar] [CrossRef] [Scilit]
- Vinnett, L.; Yianatos, J.; Hassanzadeh, A.; Díaz, F.; Henríquez, F. Residence time distribution measurements and modeling in an industrial-scale Siemens flotation cell. Minerals 2023, 13, 678. [Google Scholar] [CrossRef] [Scilit]
- Sahbaz, O.; Demir, M.K. Effects of frothers and particle size on the flotation kinetics of the Jameson Cell. Physicochem. Probl. Miner. Process. 2020, 56, 829–838. [Google Scholar] [CrossRef] [Scilit]
- Harbort, G.; De Bono, S.; Carr, D.; Lawson, V. Jameson Cell fundamentals—A revised perspective. Miner. Eng. 2003, 16, 1091–1101. [Google Scholar] [CrossRef] [Scilit]
- Nesset, J.E.; Tan, Y.H.; Finch, J.A. Gas holdup and flotation rate. Miner. Eng. 2025, 234, 109770. [Google Scholar] [CrossRef] [Scilit]
- Tunç, B.; Rao, S.; Peña Lavado, X.; Bilal, D.; Dube, R.; Yáñez, A. Concorde cell™ technology in reverse flotation: A new benchmark for iron ore upgrading performance. In Proceedings of the Flotation’25, Cape Town, South Africa, 17–20 November 2025. [Google Scholar]
- Guner, M.K.; Kowalczuk, P. Impact assessment and optimization of REFLUX flotation cell (RFC) primary settings on copper sulfide ore flotation. Miner. Eng. 2025, 233, 109653. [Google Scholar] [CrossRef] [Scilit]
- Tunç, B.; Duran, M.; Nikolov, S.; Kupka, N.; Grau, R.; Yáñez, A. The effect of operational changes on gas dispersion in Concorde Cell™. In Proceedings of the Flotation’23, Cape Town, South Africa, 6–9 November 2023. [Google Scholar]
- Vallejos, P.; Yianatos, J.; Benítez, M.; Sherrell, I.; Yáñez, A.; Betancourt, D. Modelling and simulation of intensified flotation cells for fine particles flotation. Minerals 2025, 15, 1270. [Google Scholar] [CrossRef] [Scilit]
- Yianatos, J.; Vallejos, P.; Rodriguez, M.; Cortinez, J. A scale-up approach for industrial flotation cells based on particle size and liberation data. Miner. Eng. 2022, 184, 107635. [Google Scholar] [CrossRef] [Scilit]
- Vallejos, P. The impact of batch flotation tests on the industrial plant prediction. Physicochem. Probl. Miner. Process. 2023, 59, 177609. [Google Scholar] [CrossRef] [Scilit]
- Boeree, C.R. Up-Scaling of Froth Flotation Equipment. MSC Thesis, Delft University of Technology, Delft, The Netherlands, 2014. [Google Scholar]
- Truter, M. Scale-Up of Mechanically Agitated Flotation Processes Based on the Principles of Dimensional Similitude. MSC Thesis, Department of Process Engineering, University of Stellenbosch, Stellenbosch, South Africa, 2010. [Google Scholar]
- Yianatos, J.; Vallejos, P. Challenges in flotation scale-up: The impact of flotation kinetics and froth transport. Miner. Eng. 2024, 207, 108541. [Google Scholar] [CrossRef] [Scilit]
- Hassanzadeh, A.; Gungor, E.; Samet, E.; Durunesil, D.; Hoang, D.H.; Köse, B. A comparative study between Imhoflot™ and mechanical flotation cells. In Proceedings of the MEI Conferences, Flotation 23, Cape Town, South Africa, 5 November 2023. [Google Scholar]
- Vallejos, P.; Yianatos, J.; Rodríguez, M.; Cortínez, J. Using intensified flotation cells to improve cleaning circuit performance. Minerals 2025, 15, 453. [Google Scholar] [CrossRef] [Scilit]
- Ayoglu, O.; Hoang, D.H.; Sinche-Gonzalez, M.; Hassanzadeh, A.; Rudolph, M. Investigating hydrodynamics of a laboratory-scale Imhoflot™ V-cell in recovering ultrafine magnesite from a dolomite-rich tailing. Miner. Eng. 2025, 232, 109548. [Google Scholar] [CrossRef] [Scilit]
- Afzali Gorouh, H.; Hassanzadeh, A.; Salmanzadeh, M. CFD study of two-phase flow hydrodynamics in the Imhoflot™ G-06 flotation cell using Eulerian and Lagrangian approaches. Miner. Eng. 2026, 237, 110039. [Google Scholar] [CrossRef] [Scilit]
- Hassanzadeh, A.; Safari, M.; Khoshdast, H.; Güner, M.K.; Hoang, D.H.; Sambrook, T.; Kowalczuk, P.B. Introducing key advantages of intensified flotation cells over conventionally used mechanical and column cells. Physicochem. Probl. Miner. Process 2022, 58, 155101. [Google Scholar] [CrossRef] [Scilit]
- Hoang, D.H.; Kurzydło, P.; Kwiatkowski, P.; Imhof, R.; Hassanzadeh, A.; Pereira, L.; Rudolph, M. Application of pneumatic Imhoflot™ G-Cell in recovering fine particles: A case study of KGHM copper ore. In Proceedings of the Flotation 23, MEi Conferences, Cape Town, South Africa, 6–9 November 2023. [Google Scholar]
- Hoang, D.H.; Imhof, R.; Sambrook, T.; Bakulin, A.E.; Murzabekov, K.M.; Abubakirov, B.A.; Baygunakova, R.K.; Rudolph, M. Recovery of fine gold loss to tailings using advanced reactor pneumatic flotation Imhoflot™. Miner. Eng. 2022, 184, 107649. [Google Scholar] [CrossRef] [Scilit]
- Hoang, D.H.; Gungor, E.; Imhof, R.; Murzabekov, K.M.; Abubakirov, B.A.; Baygunakova, R.K.; Bektemirov, D.; Almukhanova, A.; Rudolph, M. Flotation recovery of fine gold using pneumatic Imhoflot™ G-Cells. In Proceedings of the XXXI IMPC-International Mineral Processing Congress, Washington DC, USA, 29 September–3 October 2024. [Google Scholar]
- Seaman, D.R.; Burns, F.; Adamson, B.; Seaman, B.A.; Manton, P. Telfer processing plant upgrade-the implementation of additional cleaning capacity and the regrinding of copper and pyrite concentrates. In Proceeding of the 11th AusIMM Mill Operators’ Conference; The Australian Institute of Mining and Metallurgy: Melbourne, Australia, 2012; pp. 373–381. [Google Scholar]
- Huynh, L.; Araya, R.; Seaman, D.R.; Harbort, G.; Munro, P.D. Improved cleaner circuit design for better performance using the Jameson cell. In Proceedings of the 12th AUSIMM mill Operator’s conference, Townsville, QLD, Australia, 1–3 September 2014; pp. 141–152. [Google Scholar]
- Pyle, L.; Tabosa, E.; Vianna, S.; Sinclair, S.; Valery, W. 2022, Future (and present) trends in circuit design. In Proceedings of the IMPC Asia-Pacific 2022, Melbourne, Australia, 22–24 August 2022; pp. 1068–1083. [Google Scholar]
- Tabosa, E.; Vianna, S.; Valery, W.; Duffy, K.; Holtham, P.; Pyle, L.; Andrade, B. Modeling pneumatic flotation cells for circuit design and optimization. In Proceedings of the XXX International Mineral Processing Congress, Cape Town, South Africa, 18–22 October 2020; pp. 3081–3091. [Google Scholar]
- Price, A. Jameson Cell Workshop, Flotation 25. In Proceedings of the Mei Conferences, Cape Town, South Africa, 17–18 October 2025. [Google Scholar]
- Imhof, R.M.; Lotzien, R.M.; Sobek, S. Pneumatic flotation: A reliable procedure for a correct plant layout. In Proceedings of the XVIII International Mineral Processing Congress, Sydny, Australia, 23–28 May 1993; pp. 971–978. [Google Scholar]
- Imhof, R.; Battersby, M.; Parra, F.; Sanchez-Pino, S. The successful application of pneumatic flotation technology for the removal of silica by reverse flotation at the iron ore pellet plant of Compañía Minera Huasco, Chile. In Proceedings of the Centenary of Flotation Symposium, Brisbane, QLD, Australia, 6–9 June 2005; pp. 1–8. [Google Scholar]
- Metso. Basics in Minerals Processing, 5th Edition, Section 4—Separations, Metso Minerals. 2006. Available online: http://www.metso.com (accessed on 26 April 2026).

Disclaimer/Publisher’s Note: The statements, opinions and data contained in all publications are solely those of the individual author(s) and contributor(s) and not of MDPI and/or the editor(s). MDPI and/or the editor(s) disclaim responsibility for any injury to people or property resulting from any ideas, methods, instructions or products referred to in the content. |
© 2026 by the authors. Licensee MDPI, Basel, Switzerland. This article is an open access article distributed under the terms and conditions of the Creative Commons Attribution (CC BY) license.