1. Introduction
The processing of increasingly low-grade ores has generated large volumes of fine-grained mineral tailings worldwide [
1,
2,
3,
4,
5], creating substantial environmental and economic [
6,
7,
8] challenges. Sulphide-rich tailings are of particular concern because sulphide minerals in these tailings can undergo oxidation and weathering [
9,
10,
11] during long-term storage, potentially generating acidic mine drainage (AMD) and releasing associated metals [
12,
13,
14] into the surrounding environment. From an environmental perspective, these tailings represent a long-term management and environmental protection liability [
15]; therefore, the sustainable management of sulphide-rich tailings has become increasingly important for reducing environmental risk.
Pyrite is one of the most abundant minerals in sulphide-rich tailings and can be reutilised as an important raw material for a broad range of industrial applications [
16,
17,
18,
19,
20,
21], including ironmaking [
22,
23], environmental remediation [
24,
25], functional materials for water treatment [
19,
25,
26], and, most commonly, sulphuric acid production [
27,
28]. Normally, before its industrial application, pyrite needs to be recovered from the sulphide-rich tailings through specific beneficiation methods, such as flotation. Therefore, the recovery of pyrite from sulphide-rich tailings not only reduces the environmental pressure associated with tailings storage, but also creates additional economic value through the production of marketable pyrite concentrates for subsequent industrial applications. However, other valuable sulphide minerals and associated precious metals may remain in finely disseminated or locked forms within the tailings [
29,
30], making their recovery and upgrading technically difficult and costly [
31], potentially limiting the economic viability of tailings reutilisation. In this context, the recovery and upgrading of pyrite from sulphide-rich tailings represent an important pathway for tailings reutilisation and sustainable mineral resource use.
In a recently commissioned flotation plant in Luoyang, China, pyrite is recovered from upstream Mo–W–Cu flotation tailings and the resulting pyrite concentrate is mainly sold as a raw material for sulphuric acid production, where high sulphur grade and low impurity levels are desirable for commercial value. Industrial monitoring at this plant showed that the Zn content in the pyrite concentrate remained elevated during the initial production period, suggesting that Zn-bearing components could not be selectively separated from the pyrite concentrate during flotation. This may increase impurity loading and cause pipe blockage [
23,
32] during subsequent sulphuric acid production, hindering the effective reutilisation of sulphide tailings as secondary mineral resources. Therefore, Zn misreporting to the pyrite concentrate is not only a technical issue affecting flotation selectivity, but also an economic barrier limiting the effective reutilisation of pyrite-rich tailings. To address this problem, it is necessary to clarify the origins of Zn misreporting and identify the factors controlling Zn rejection during pyrite flotation.
Previous studies on sulphide flotation have shown that reagent adjustment and flowsheet optimisation may be insufficient when flotation selectivity is constrained by mineral association and incomplete liberation [
33,
34]. Process mineralogy provides a useful framework for diagnosing such problems by linking mineral hosts, particle texture, and liberation characteristics with flotation response. For example, plant-based studies have shown that sphalerite liberation can strongly affect Zn flotation performance and that fine grinding or regrinding may be required when sulphide minerals occur as locked or composite particles [
33]. These findings suggest that, in pyrite flotation systems, Zn rejection may also be limited by the occurrence of Zn-bearing minerals as locked or composite particles rather than by reagent or flowsheet conditions alone.
However, the mineralogical origins of Zn misreporting to the pyrite concentrate remain insufficiently understood, particularly in industrial systems where feed composition, mineral association, and flotation response may vary during the early production period. This study is a process mineralogy-guided case study with the objectives of identifying the mineralogical factors contributing to Zn misreporting to pyrite concentrate during pyrite flotation and evaluating whether regrinding-assisted flotation could mitigate this undesirable Zn misreporting to pyrite concentrate.
By combining elemental analysis, phase analysis, zinc occurrence analysis, particle-scale mineralogical characterisation, and flotation experiments, this work links Zn deportment with mineral association, liberation, and flotation response. The results show that Zn misreporting to the pyrite concentrate was mainly associated with close sphalerite–pyrite association and incomplete sphalerite liberation, rather than reagent or flowsheet conditions alone. The novelty of this industrial case study lies in using process mineralogy not only to diagnose the mineralogical origins of Zn misreporting to pyrite concentrate, but also to guide the selection of a targeted regrinding-assisted flotation strategy for impurity control in pyrite concentrate production. This combined approach provides practical industrial value by distinguishing mineral-locking-related selectivity limitations from conventional reagent or flowsheet limitations, thereby supporting a more targeted strategy for reducing Zn misreporting to the pyrite concentrate used for downstream sulphuric acid production.
2. Materials and Methods
2.1. Materials
The two samples used in this study, directly collected from the on site pulp conditioning tank and pyrite concentrate launder, were defined as the feed ore sample (FOS) and the pyrite concentrate sample (PCS), respectively. The elemental compositions of the FOS and the PCS samples were analysed by X-ray fluorescence (XRF), and the results are presented in
Section 3. The particle size distributions of the FOS and the PCS samples were determined by standard sieving using Tyler standard sieves, and the results are shown in
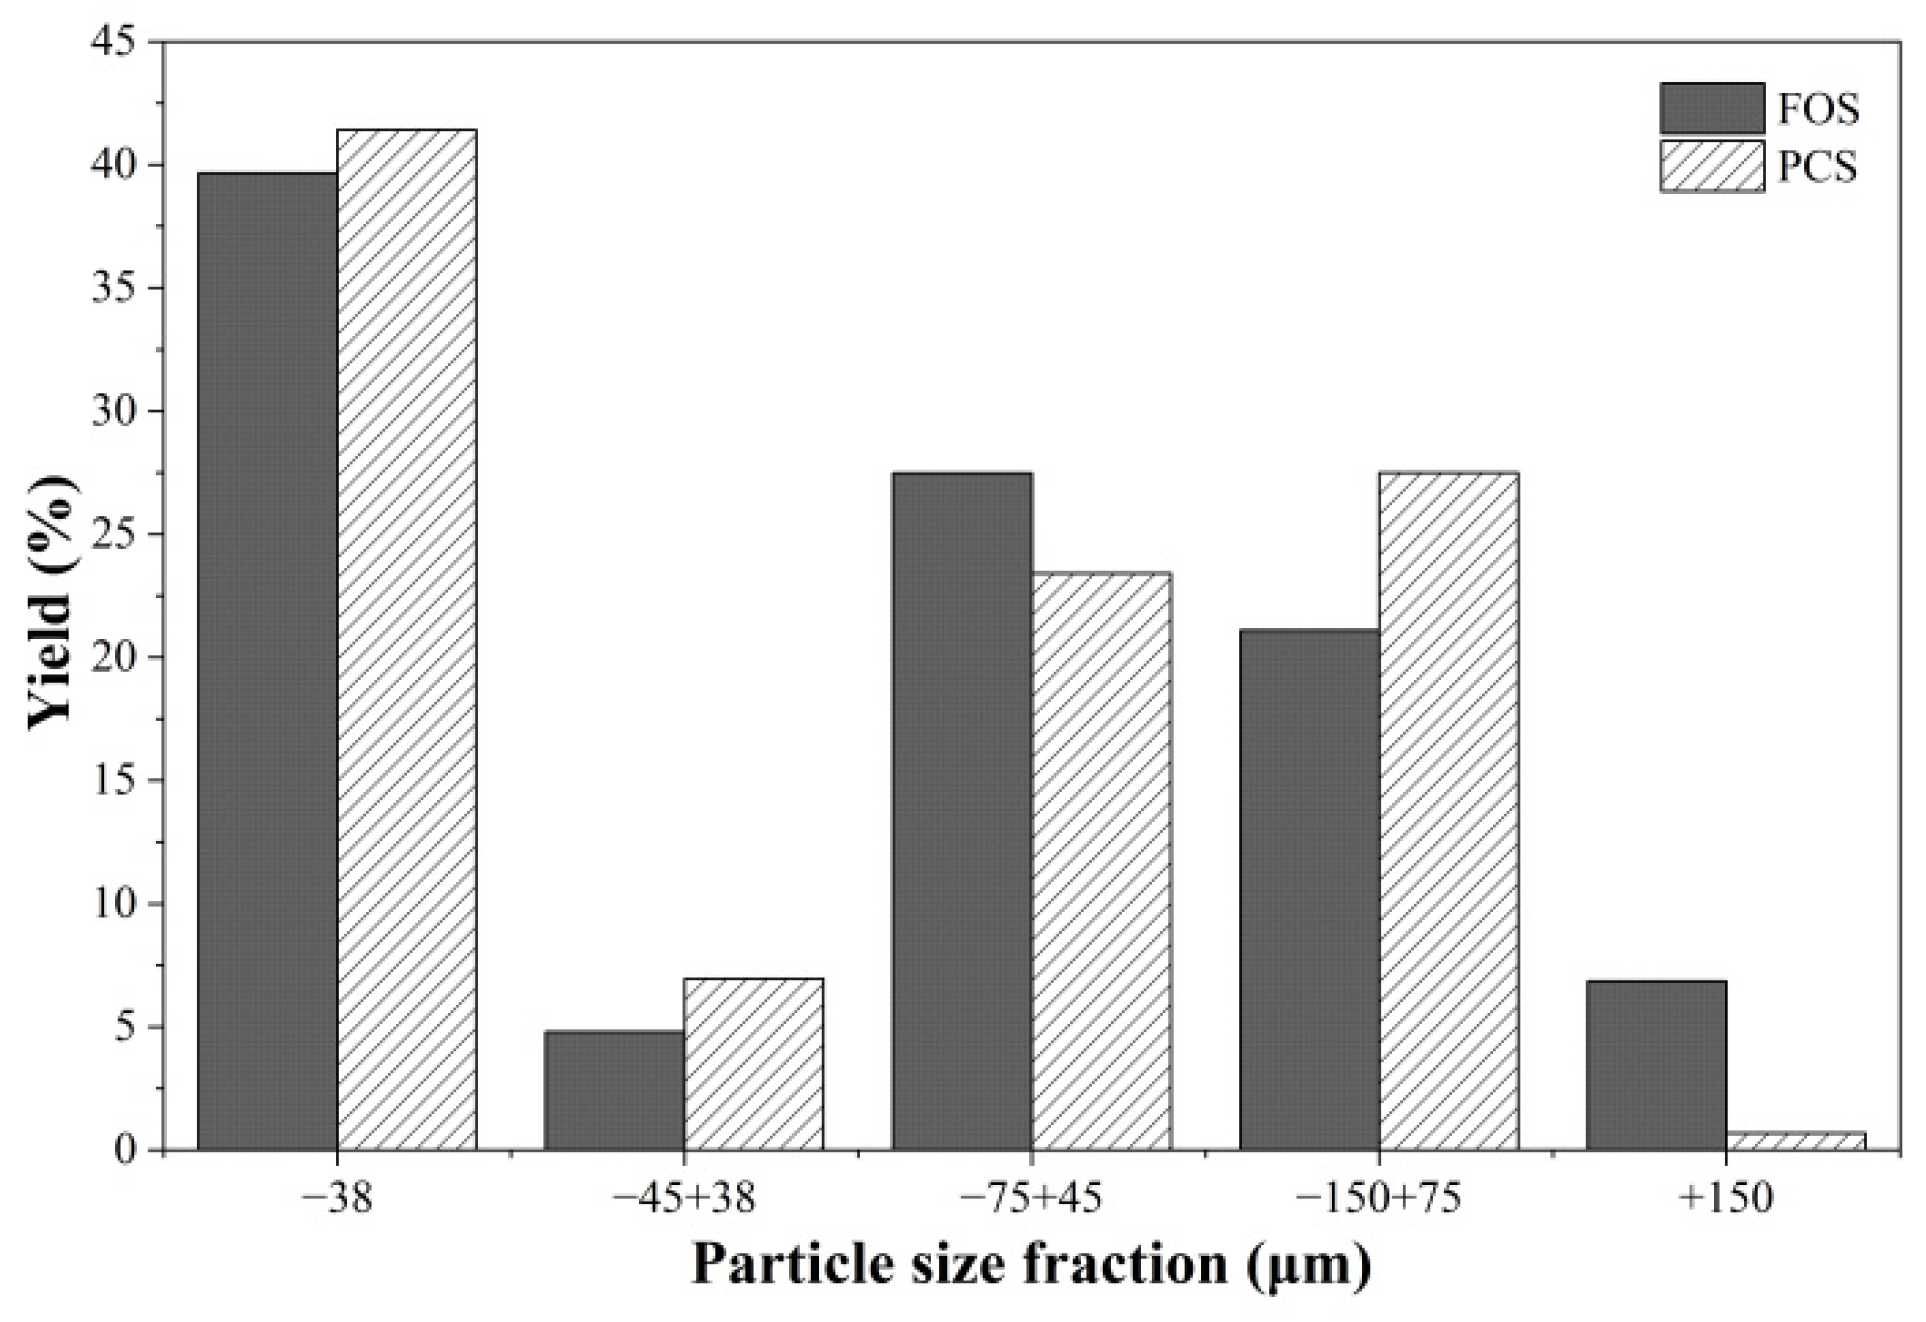
Figure 1. Both samples exhibited a fine particle size distribution, with a significant proportion of particles in the −38 μm fraction.
2.2. Reagents
Z200 and 2# oil were used as the pyrite collector and frother, respectively. They were supplied as pre-prepared solutions from the processing plant. All other reagents, including CuSO4, H2SO4, and Na2SiO3, involved in this work were of analytical grade and purchased from Sinopharm Chemical Reagent. Where applicable, solutions from analytical-grade reagents were prepared fresh daily using deionised water before each experiment.
2.3. Process Mineralogy Characterisation
2.3.1. XRF
Elemental compositions of the FOS and the PCS were determined using an XRF spectrometer (PANalytical Axios MAX, Almelo, The Netherlands). Prior to analysis, the samples were screened to collect the −75 μm fraction, followed by oven drying at 105 °C for 2 h. The dried samples were then pressed into pellets using boric acid as a binder to ensure sample integrity and surface uniformity. The XRF measurements were carried out using a Rh anode X-ray tube operated at 4 kW. Calibration of the instrument was performed using GBW-certified reference materials, and each sample was analysed in triplicate to ensure analytical reliability. The obtained spectra were processed using SuperQ software (version 4.0), with fundamental parameter (FP) matrix correction applied for quantitative analysis.
2.3.2. XRD
Crystalline phase identification of the FOS and the PCS was carried out using an XRD spectrometer (X’Pert 3 Powder, PANalytical, Almelo, The Netherlands). Prior to analysis, the samples were ground and sieved to collect particles smaller than 45 μm to ensure sample homogeneity. XRD measurements were performed over a scanning range of 5–80° at a scan speed of 2°/min. The diffraction data were collected and processed using JADE software (version 9.0) for phase identification, with standard databases used for peak matching. The obtained diffraction patterns were further plotted using OriginPro 2026 software. Qualitative phase analysis was conducted based on peak matching with reference patterns, while quantitative analysis was performed using diffraction intensity-based calculations. Minor unmatched peaks were attributed to limitations in the reference database or the presence of trace or poorly crystalline phases.
2.3.3. Zinc Phase Analysis
A chemical phase analysis of zinc in the FOS was conducted using a sequential selective leaching method to determine the distribution of zinc among different occurrence forms. It should be noted that the extracted zinc fractions are operationally defined based on the selectivity of the leaching reagents.
Prior to analysis, the FOS were dried at 105 °C to remove free moisture, ground, and screened to collect the −74 μm fraction, and thoroughly homogenised to ensure representativeness. The total zinc content was determined by inductively coupled plasma optical emission spectrometry (ICP–OES) (iCAP 7400, Thermo Fisher Scientific, Waltham, MA, USA) after complete acid digestion using a mixed acid system (HCl + HNO3+ HF + HClO4), which served as a reference value. The sequential leaching procedure was designed to selectively extract zinc associated with different occurrence forms, including water-soluble, oxide, sulphide, and refractory phases. Specifically, water-soluble zinc was first extracted using deionised water, followed by extraction of oxide-bound zinc using ammonium acetate solution. Sulphide-associated zinc was subsequently leached using a mixed oxidising solution of H2O2 and H2SO4. Finally, zinc in refractory phases (e.g., zinc–iron spinel) was determined by complete digestion of the residual solids using the mixed acid system (HCl + HNO3+ HF + HClO4). After each leaching step, the suspension was separated by centrifugation, and the residue was washed prior to the next extraction step. The Zn concentration in each leachate and residue digestion solution was quantified by ICP–OES in triplicate, with the average value reported as the final result. The zinc content and distribution ratio for each phase were calculated, and mass balance was verified by comparing the sum of phase-specific zinc contents with the total zinc content, with recoveries ranging from 97% to 103%.
2.3.4. Reflected Light Microscopy
Reflected light microscopy observations were conducted for the PCS using a polarised light microscope (Leica DM RXP, Leica Microsystems, Wetzlar, Germany) to examine the occurrence of valuable and gangue minerals, optical properties, and intergrowth relationships. Prior to analysis, representative samples were embedded in epoxy resin, followed by grinding and polishing to obtain smooth and flat surfaces suitable for microscopic observation. The polished sections were examined under reflected light using both plane-polarised and cross-polarised illumination. The observations focused on identifying the mineral assemblages and occurrence of iron- and zinc-bearing minerals (e.g., pyrite and sphalerite), as well as their optical properties under reflected light microscopy, including reflectance, colour, hardness, and internal reflections. Particular attention was given to the intergrowth and association relationships between sulphide minerals and gangue minerals, including features such as inclusions, banded structures, intergrowth textures, and irregular dissemination.
2.3.5. MLA
MLA was conducted using an automated MLA system (FEI MLA 650, Thermo Fisher Scientific, Waltham, MA, USA) to quantitatively determine the PCS mineral composition, grain size distribution, and liberation characteristics. Representative samples were embedded in epoxy resin, followed by grinding and polishing to obtain flat, well-polished sections suitable for automated mineralogical analysis. The prepared sections were carbon-coated prior to analysis to ensure electrical conductivity. The MLA measurements were performed in scanning electron microscopy (SEM) mode, equipped with an energy-dispersive X-ray spectroscopy (EDS) system for mineral identification based on elemental composition. Mineral phases were identified using a predefined mineral library, and quantitative data were processed using the software package integrated with the MLA system. The analysis provided quantitative information on mineral abundance, Fe and Zn deportment, particle size distribution, mineral liberation, and the association relationships among pyrite, sphalerite, and gangue minerals.
2.4. Flotation Experiments
For all the flotation experiments in this study, the PCS instead of the FOS was used for the reagent- and flowsheet-adjustment experiments because it represented the actual Zn-contaminated pyrite concentrate produced in the on site flotation circuit and was the direct target for Zn reduction in this study. In addition, using the PCS instead of the FOS reduced the influence of gangue minerals in the feed ore and allowed the flotation responses of sphalerite and pyrite to be compared more directly. During flotation, modification of the pulp pH of the PCS was not required, and before any reagent addition, each pulp pH was measured and reported to be approximately 8.0–8.5 under the experimental conditions applied in this study. Pyrite was the target mineral and was expected to report to the floated concentrate, whereas sphalerite and other non-target minerals were expected to remain in the pulp and report to the middlings and/or tailings where applicable. In this study, Zn, S, and Fe refer to the corresponding elements measured in the flotation products. Their grades and recoveries were used as flotation indicators, with Zn used as an elemental indicator of overall Zn misreporting, mainly associated with sphalerite, and S and Fe used as elemental indicators of pyrite recovery.
For the batch flotation experiments described in
Section 2.4.1, the PCS was used without further grinding. In contrast, for the regrinding-assisted flotation experiments described in
Section 2.4.2, the PCS was subjected to regrinding under the specified conditions before flotation.
2.4.1. Batch Flotation Experiments
Batch flotation experiments were carried out on the PCS. For each test, 125 g of the PCS was mixed with 150 mL of tap water and stirred in the flotation cell to form a pulp, which was then made up to 1.5 L with tap water before flotation. The pulp pH was maintained at its natural value of approximately 8.0–8.5, and reagents such as Na
2SiO
3 and CuSO
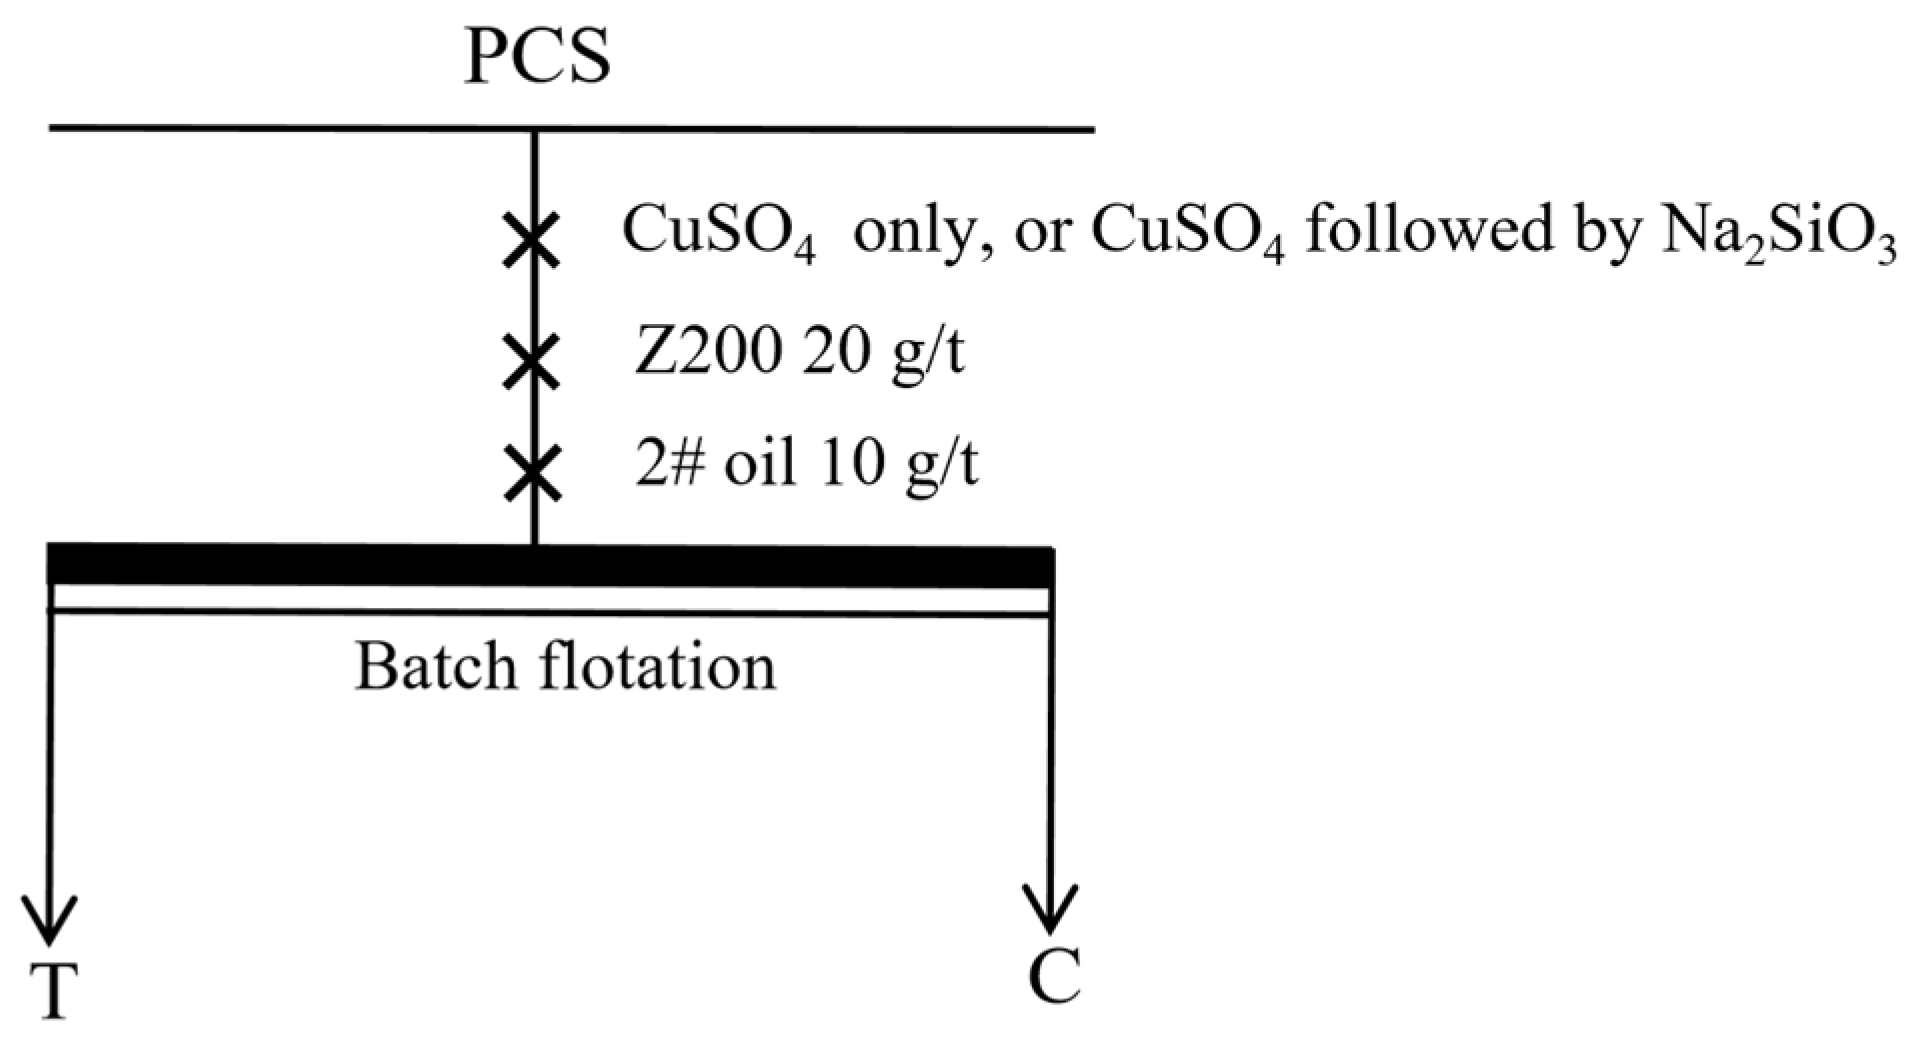
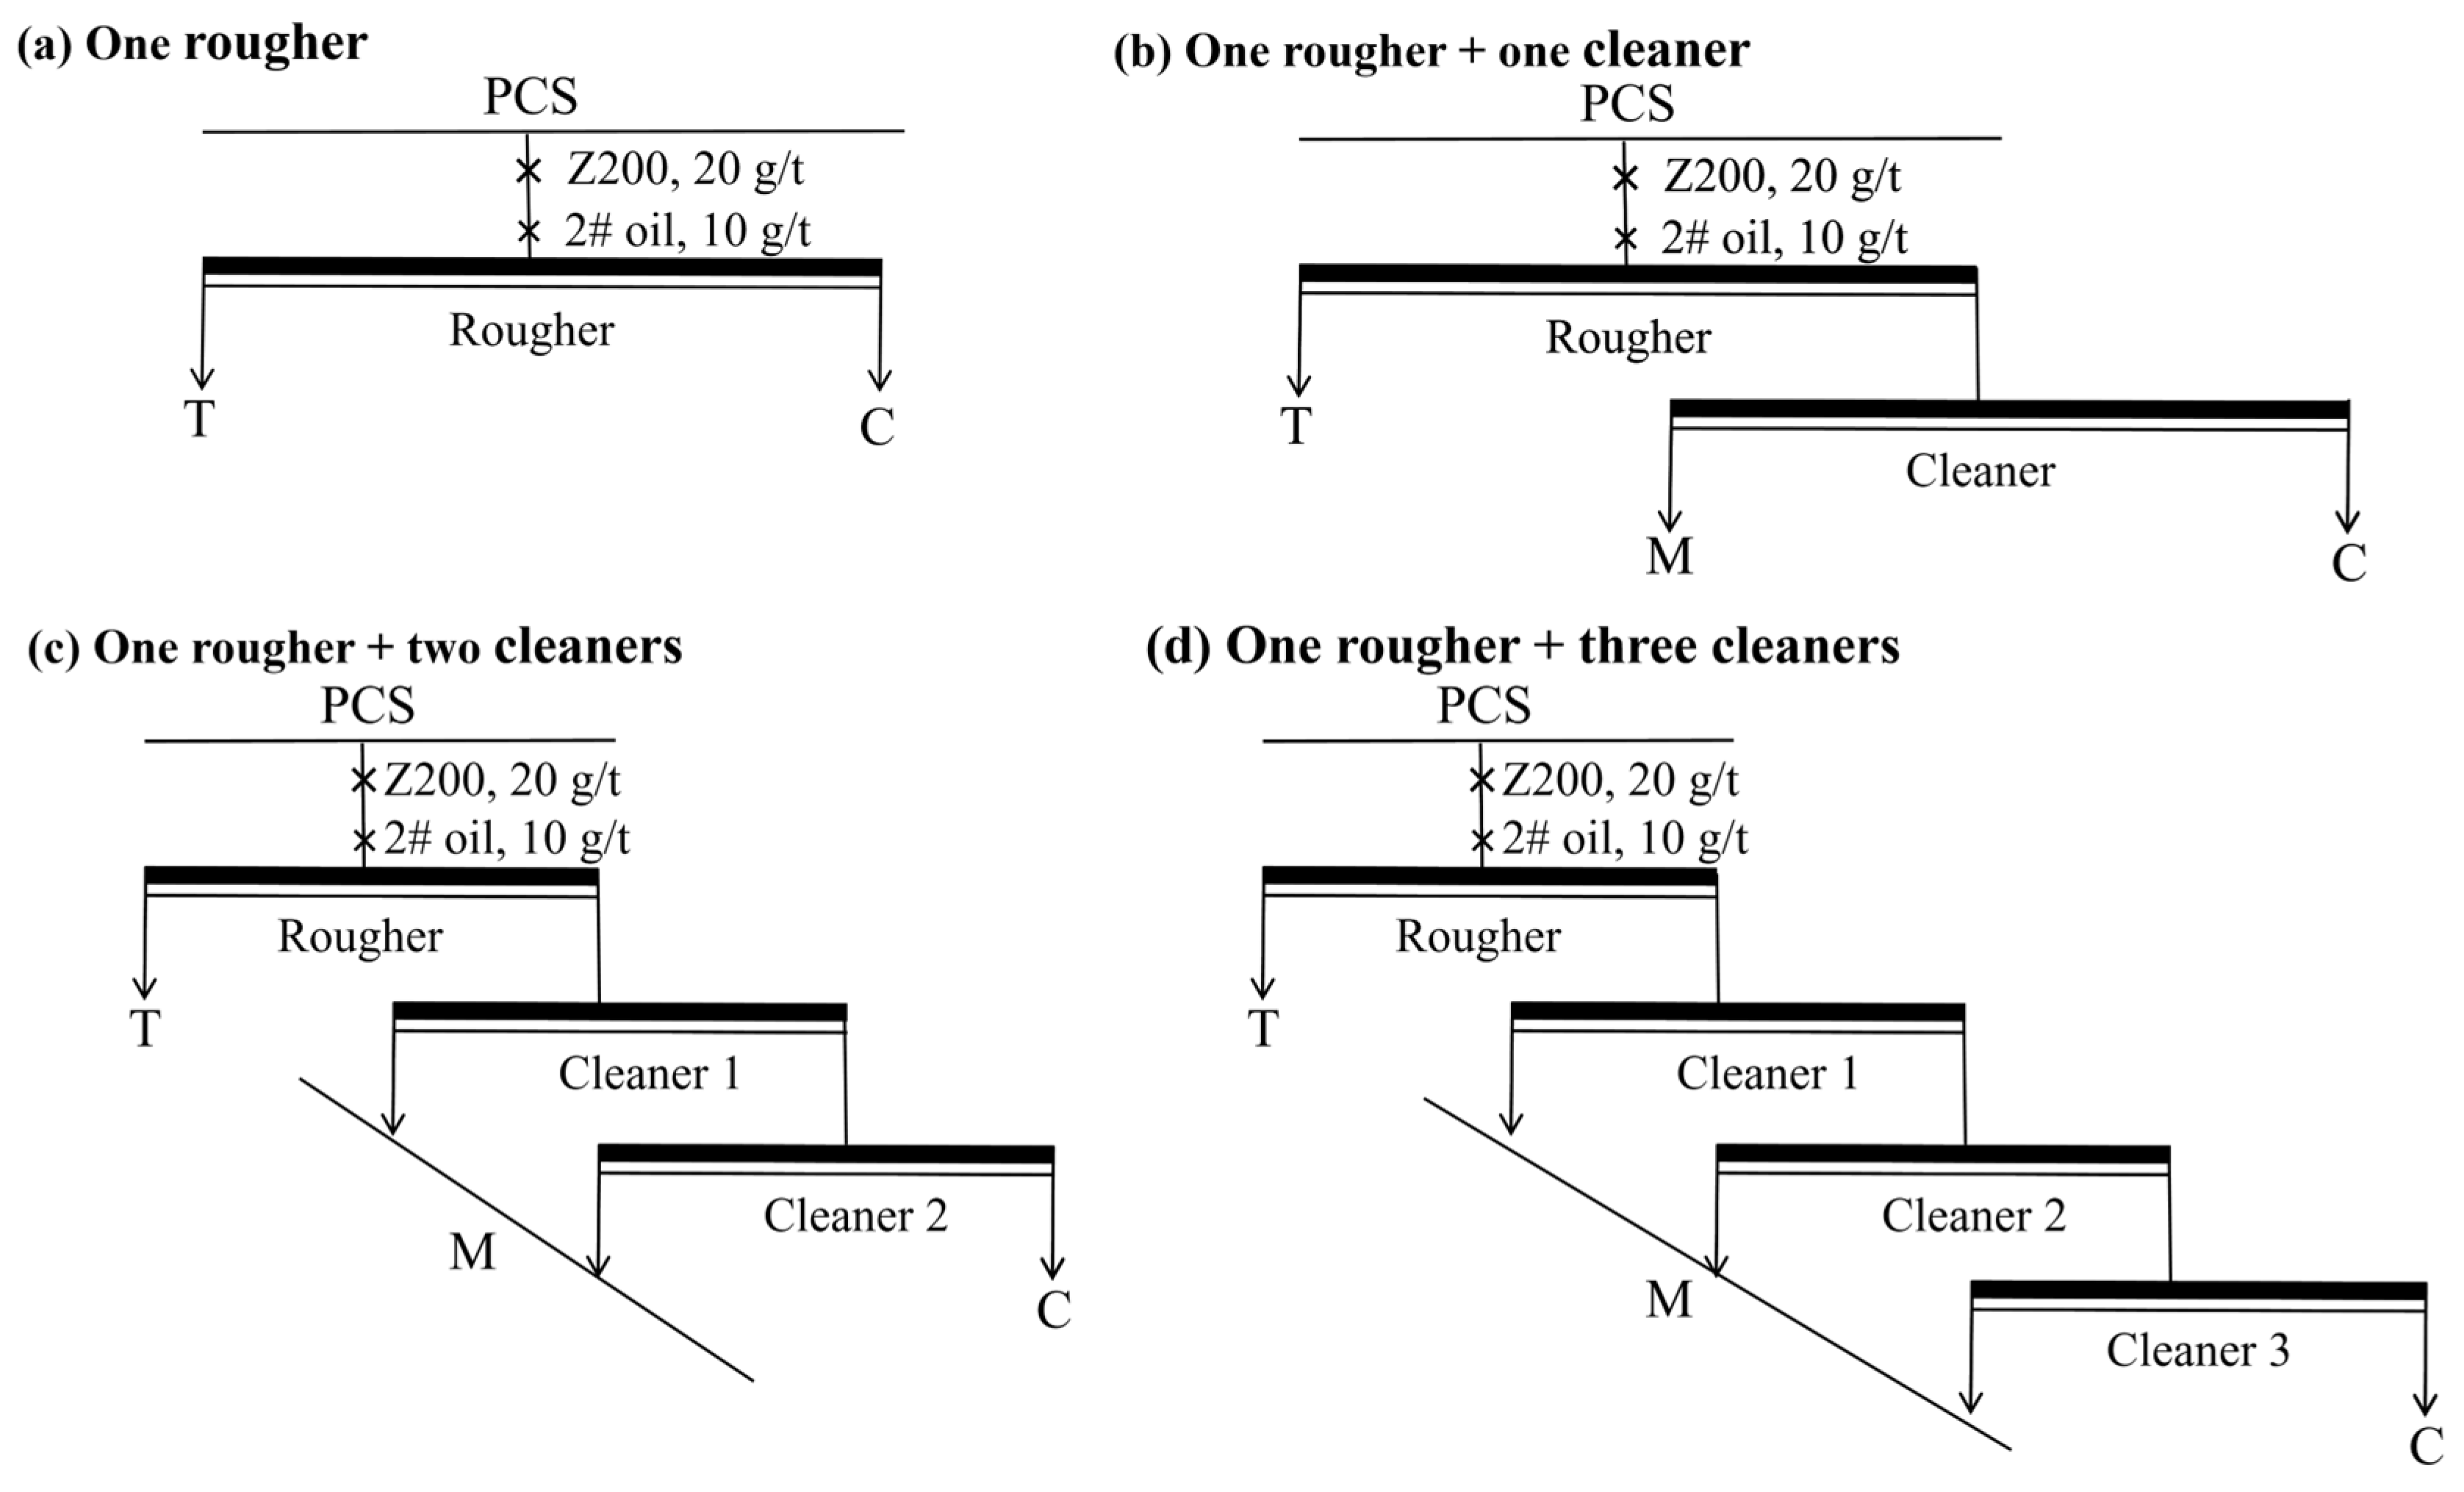
4 were added as required, followed by sequential collector and frother addition, with a conditioning time of 2 min after each reagent addition. Froth was scraped at 10 s intervals, and flotation concentrates were collected at 1, 2, 3, and 4 min, respectively. The batch flotation experiments for reagent adjustment and flowsheet adjustment were conducted according to the schematic flowsheets shown in
Figure 2 and
Figure 3, respectively. In these flowsheets, the floated pyrite concentrate, flotation tailings, and flotation middlings were denoted as C, T, and M, respectively. As shown in
Figure 3, no additional reagents were added during the cleaner stages for flowsheet-adjusted flotations.
2.4.2. Regrinding-Assisted Flotation Experiments
Regrinding was conducted using a laboratory-scale rod mill to improve sphalerite–pyrite separation. For each test, 125 g of the PCS was mixed with 100 mL of tap water to form a pulp. Steel rods, weighing a total of 3.6 kg, were used as the grinding media. The rod mill was operated at a rotational speed of 25 rpm, and grinding was carried out for 1.5 min.
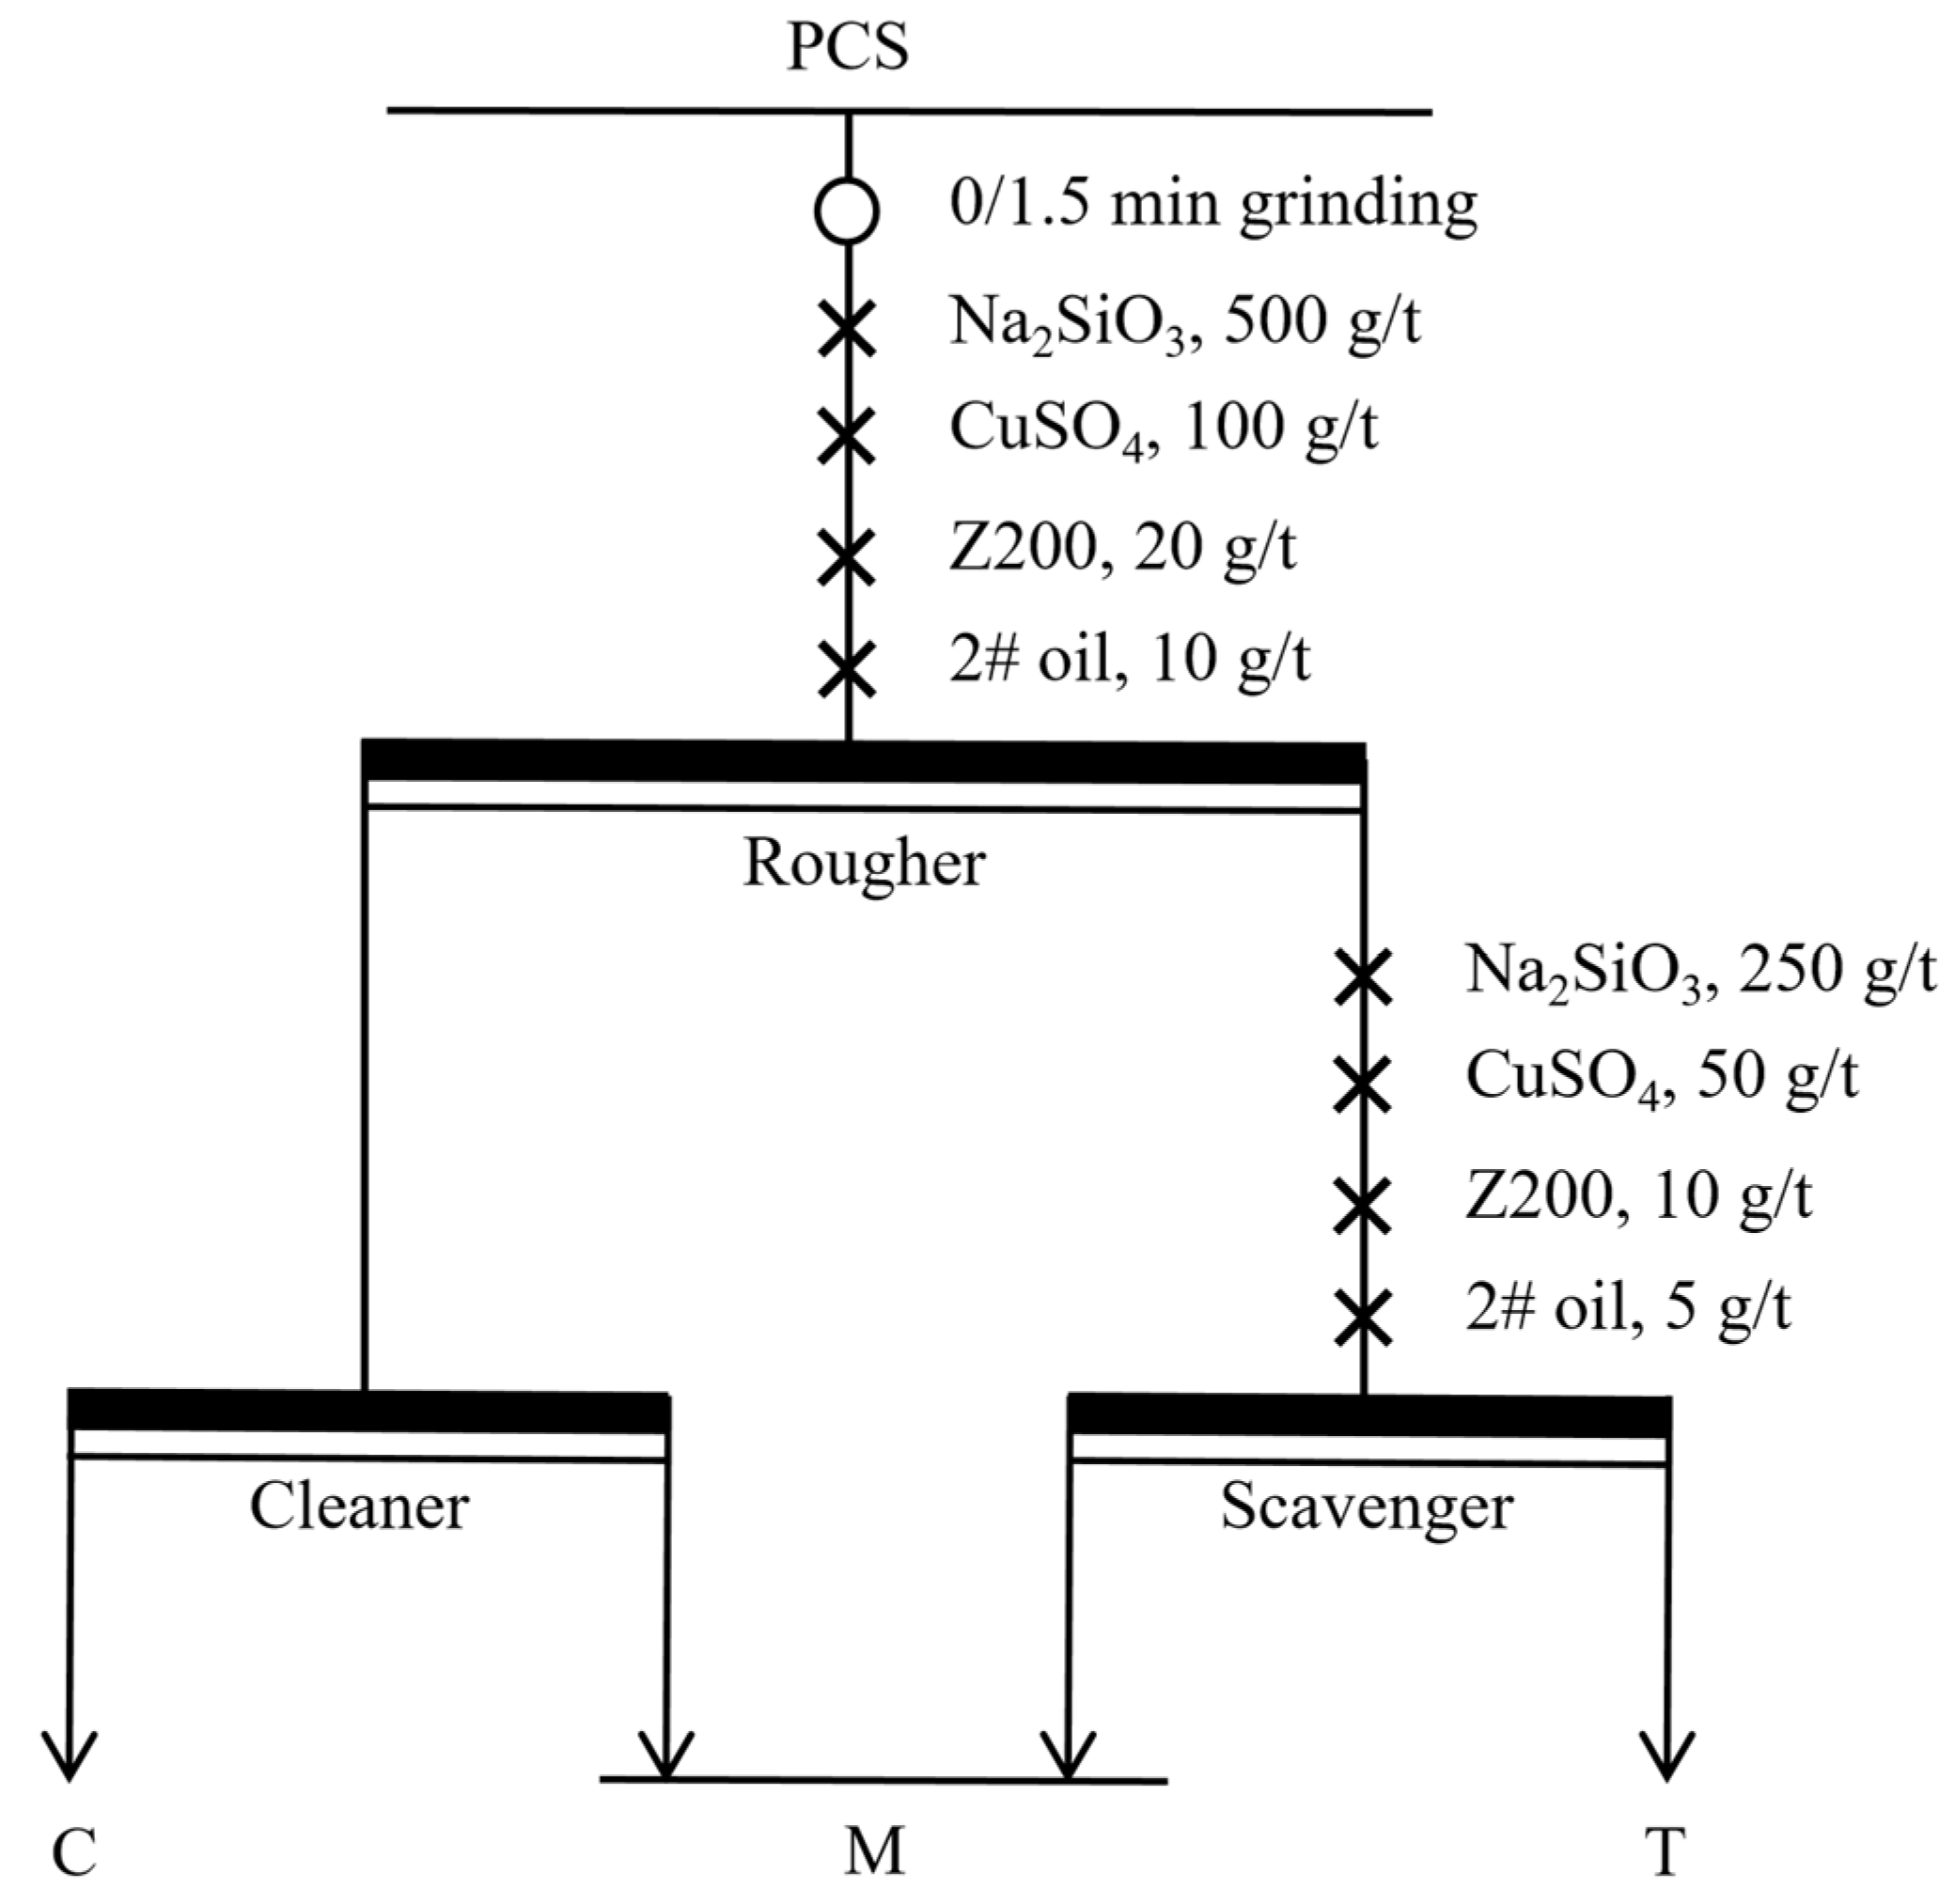
Following regrinding, the pulp was immediately subjected to one rougher flotation, one scavenger flotation, and one cleaner flotation, as shown in
Figure 4. The reagent scheme was designed according to the different functions of the roughing, cleaning, and scavenging stages. In the roughing stage (rougher), Na
2SiO
3, CuSO
4, Z200, and 2# oil were added at 500, 100, 20, and 10 g/t, respectively, to establish the main flotation response after regrinding. The cleaning stage (cleaner) was used to upgrade the rougher concentrate and obtain the final concentrate C; therefore, no reagent was added to avoid possible entrainment of other minerals. For the scavenging stage (scavenger), reduced supplementary dosages of Na
2SiO
3, CuSO
4, Z200, and 2# oil were added at 250, 50, 10, and 5 g/t, respectively, corresponding to approximately half of the rougher dosages. This design aimed to recover remaining floatable pyrite from the rougher tailings while limiting excessive reagent addition and entrainment. For each flotation, froth was scraped at 10 s intervals, and flotation concentrates were collected at 1, 2, 3, and 4 min. The floated pyrite from the cleaner and the tailings (T) from the scavenger were reported as the final pyrite flotation concentrate, denoted as C, and final tailings, denoted as T, while the tailings from the cleaner and concentrate from the scavenger were combined and reported together as middlings, denoted as M.
2.5. Quality Control and Data Reliability
To improve the reliability of the experimental results, the representative FOS and PCS samples collected from the industrial process were thoroughly mixed and homogenised before subsampling. The subsamples used for XRF, XRD, zinc phase analysis, reflected light microscopy, and MLA were prepared according to the corresponding analytical requirements to minimise sampling bias.
The flotation tests were conducted as single-run, laboratory-scale industrial case-study tests using representative plant samples. Duplicate or triplicate flotation tests were not conducted due to the practical diagnostic nature of this study. During flotation testing, the pulp concentration, reagent dosages, conditioning time, flotation time, and airflow rate were kept consistent between tests. The flotation products were collected, filtered, dried, weighed, and chemically analysed. Product mass and chemical assay data were used to perform mass-balance calculations and to check the internal consistency of the flotation results. However, a fixed mass-balance closure criterion or formal statistical uncertainty range was not established. Therefore, the flotation results should be interpreted as diagnostic and indicative evidence for identifying Zn misreporting and evaluating the potential effect of regrinding, rather than as statistically replicated flotation data.
3. Results
3.1. Occurrence Analysis of Sphalerite Misreporting to Pyrite Concentrate During Flotation
XRF analysis was conducted on the FOS and the PCS to investigate their elemental compositions, and the results are presented in
Table 1.
Significant differences in elemental distribution between the FOS and the PCS were observed. The results indicate that Fe and S are substantially recovered to the concentrate, with Fe increasing from 8.654% in the feed to 38.723% in the concentrate and S increasing from 1.932% to 29.581%. This confirms the effective recovery of pyrite during flotation as pyrite is an Fe- and S-bearing sulphide mineral with the chemical formula FeS2. In contrast, major gangue elements, such as Si and Ca, showed a significant decrease, suggesting their rejection into the tailings. Notably, Zn was also significantly misreported to the pyrite concentrate, increasing from 0.026% in the feed to 0.496%, corresponding to an approximately 19-fold enrichment. The simultaneous misreporting of Zn with pyrite suggests that Zn is recovered into the pyrite concentrate during flotation rather than being effectively rejected under the current conditions. Overall, the XRF results confirm the occurrence of significant Zn misreporting to the pyrite concentrate.
The on site production used ZnSO
4 to reduce Zn in pyrite concentrate. Therefore, the Zn detected in the concentrate may originate either from dissolved Zn species introduced by the ZnSO
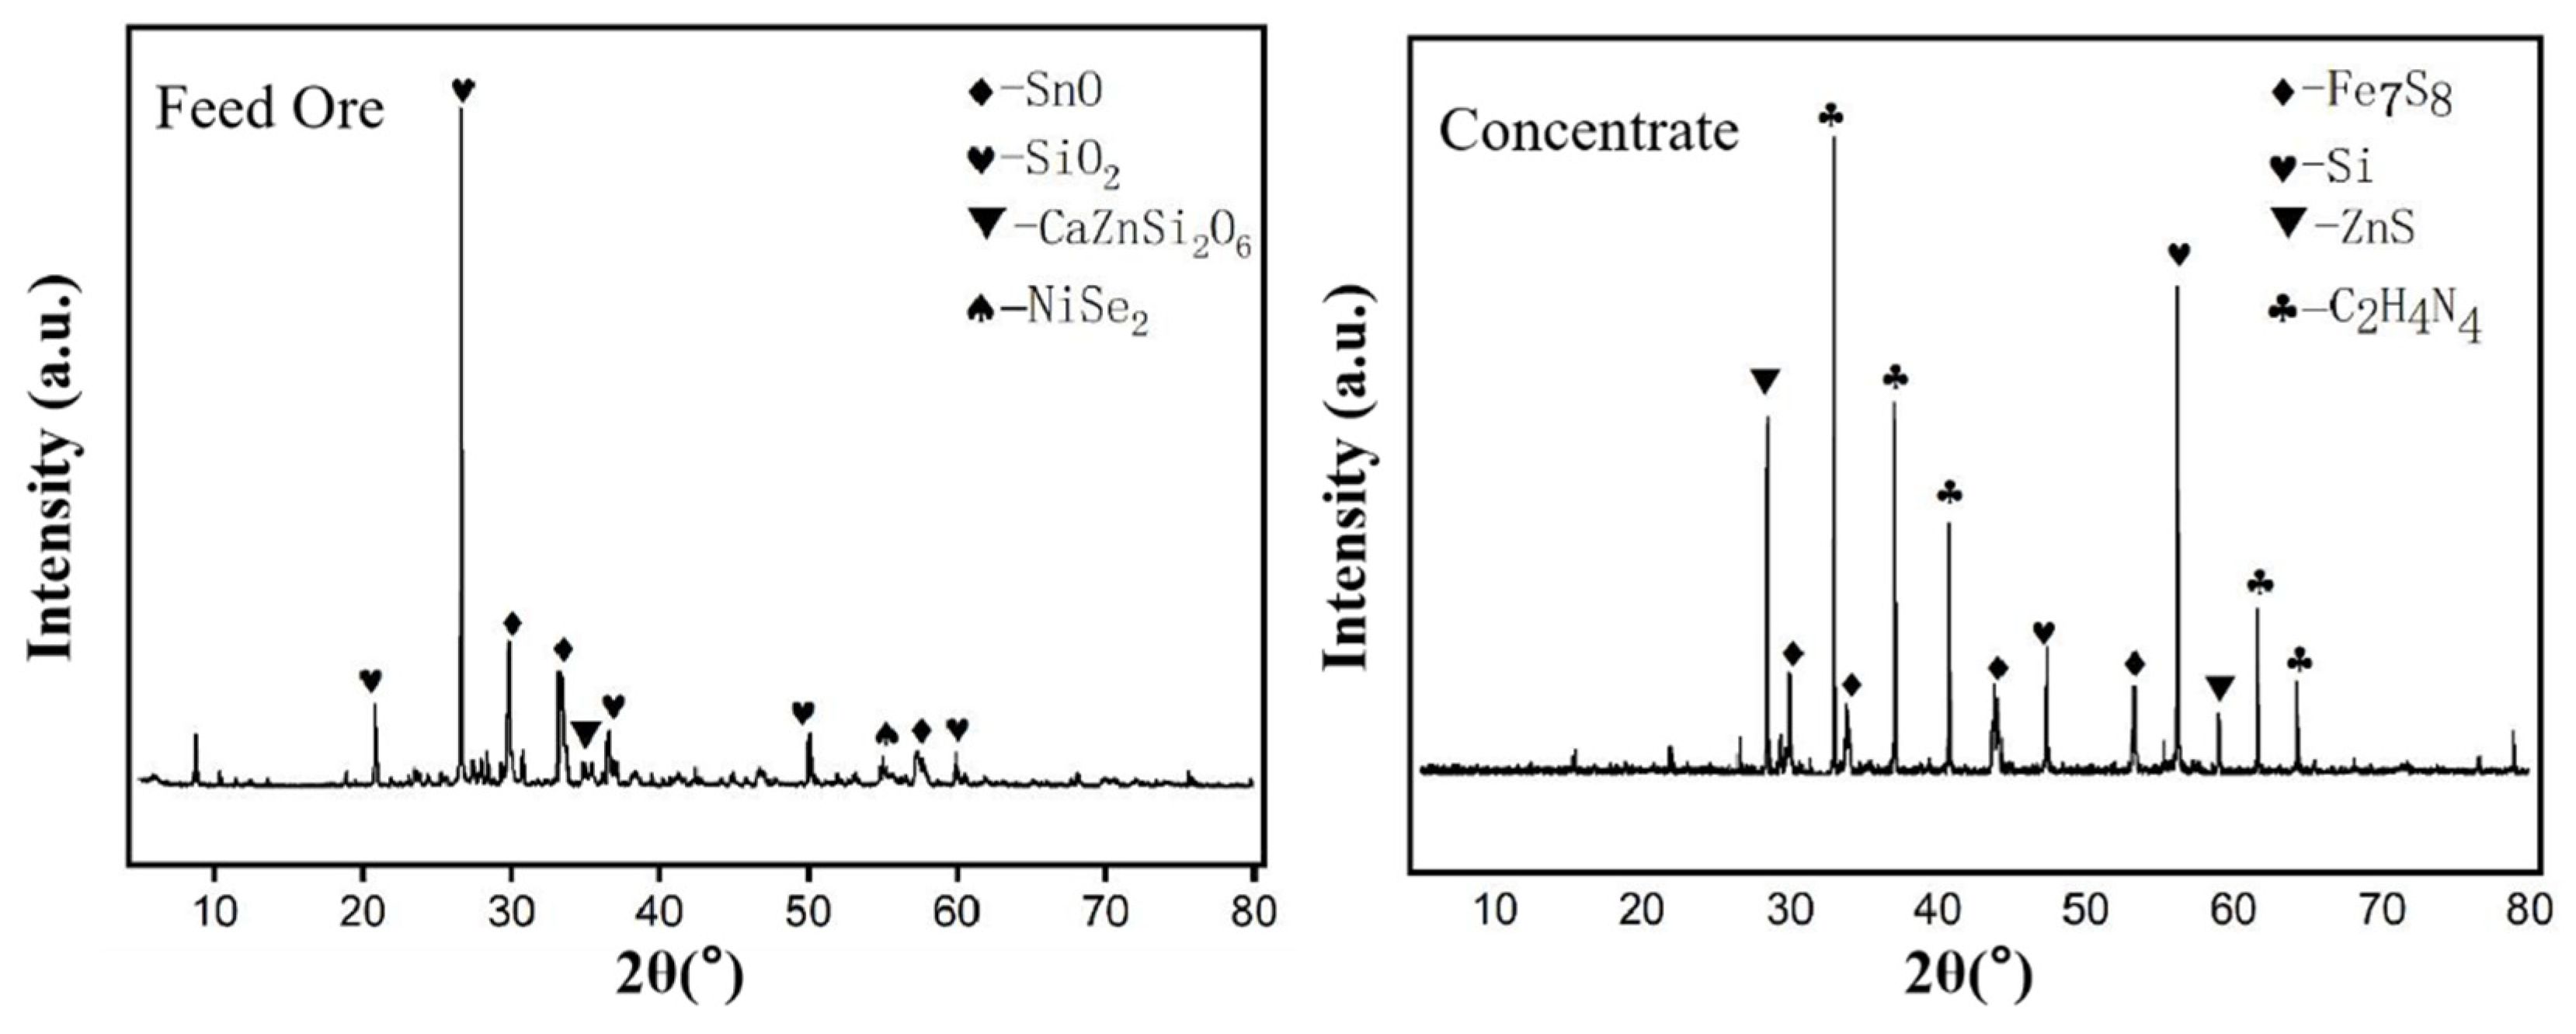
4 addition or from Zn-bearing mineral phases recovered during flotation. However, dissolved Zn alone is unlikely to account for the substantial Zn misreporting (approximately 19-fold) observed in the XRF results. This suggests that the misreported Zn is more likely associated with Zn-bearing minerals recovered together with pyrite during flotation. To further clarify the occurrence form of Zn responsible for the misreporting behaviour, XRD analysis was conducted to identify the crystalline Zn-bearing mineral phases in both the FOS and the PCS. The XRD results are presented in
Figure 5.
As shown in
Figure 5, the FOS was dominated by strong diffraction peaks corresponding to quartz (SiO
2), with minor Zn-bearing silicate phases such as CaZnSi
2O
6, while no detectable sphalerite (ZnS)- or pyrite-related peaks were identified. In contrast, the concentrate exhibited clear diffraction peaks corresponding to ZnS and Fe-bearing sulphides. This apparent inconsistency between the absence of detectable ZnS and pyrite-related phases in the FOS and their clear identification in the PCS was likely due to their low abundance in the feed, which may have been below the detection limit of XRD. More importantly, these results suggest that ZnS was substantially enriched along with pyrite during flotation, and eventually misreported to the PCS. It should also be noted that the Zn misreporting to the pyrite concentrate predominantly occurred in sulphide form, rather than being solely attributable to dissolved Zn species introduced by the ZnSO
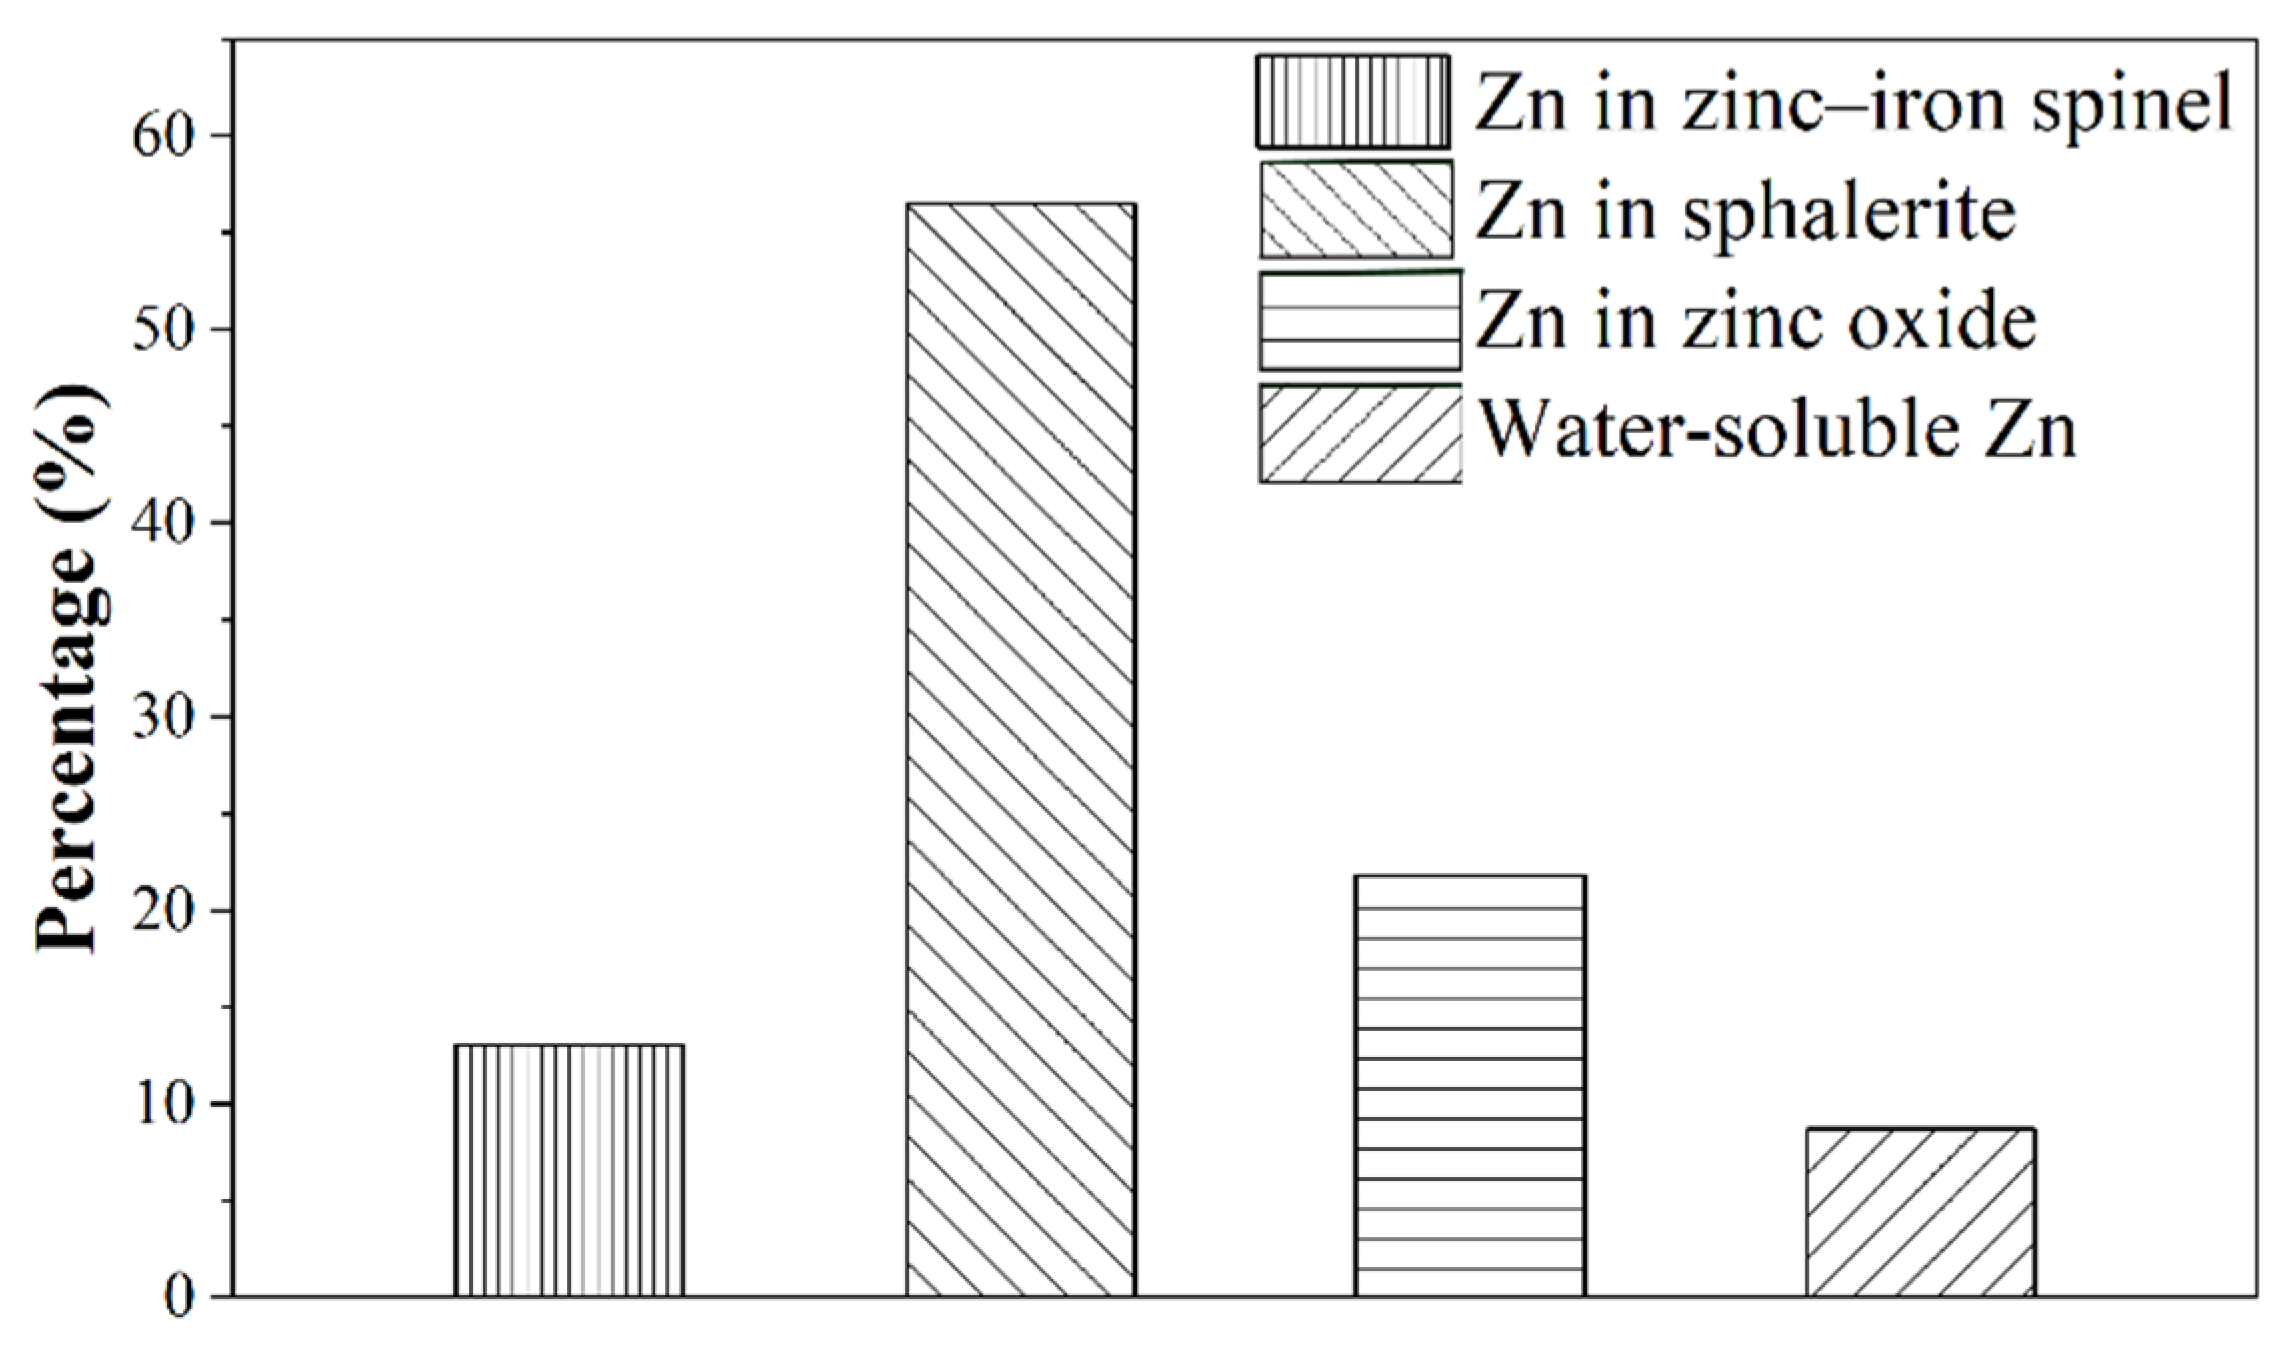
4 addition. To further quantify the types of Zn-bearing minerals, zinc phase analysis was subsequently conducted, and the results are shown in
Figure 6.
As shown in
Figure 6, sphalerite-associated Zn accounts for 56.52% of the total Zn distribution, confirming that Zn in the FOS is predominantly present in sulphide form. This result is consistent with the XRD identification of ZnS in the PCS after flotation enrichment.
Figure 6 also shows the presence of oxidised Zn forms, accounting for 21.74% of the total Zn distribution. This result appears inconsistent with the XRD results in
Figure 5, where no clear ZnO peak was identified for either the FOS or the PCS. The apparent difference can be attributed to the different analytical principles and detection sensitivities of the two methods. XRD mainly identifies crystalline mineral phases with sufficient abundance, whereas Zn phase analysis provides an operational classification of Zn occurrence based on selective chemical extraction. Therefore, the oxidised Zn fraction detected by phase analysis may occur as low-abundance, poorly crystalline, finely disseminated, or chemically extractable Zn species that were below the detection limit of XRD or were not present as well-crystallised ZnO. Accordingly, the absence of a clear ZnO peak in the XRD pattern does not exclude the presence of oxidised Zn species. However, the identification of ZnS by XRD in the PCS, together with the Zn phase analysis showing sphalerite-associated Zn as the largest single Zn fraction, indicates that sphalerite was the principal Zn carrier contributing to Zn misreporting during pyrite flotation. Therefore, the subsequent flotation results were interpreted mainly in relation to sphalerite misreporting and sphalerite–pyrite separation, while Zn grade and recovery were used as overall indicators of Zn misreporting in the flotation products. This interpretation is also consistent with the reagent-adjusted flotation design in the following
Section 3.2, which was based on a CuSO
4 activation scheme under sulphide-flotation conditions rather than a sulphidisation scheme for oxidised Zn minerals.
3.2. The Effects of Reagent and Flowsheet Adjustments on Sphalerite–Pyrite Separation
Based on the above mineralogical and Zn phase evidence, sphalerite was identified as the principal Zn carrier contributing to Zn misreporting in the pyrite concentrate. Therefore, the subsequent flotation experiments were examined mainly from the perspective of sphalerite misreporting and sphalerite–pyrite separation. The results, therefore, provide a more focused evaluation of the effects of reagent and flowsheet adjustments on sphalerite–pyrite separation during flotation.
3.2.1. The Effects of Reagent Adjustment on Sphalerite–Pyrite Separation
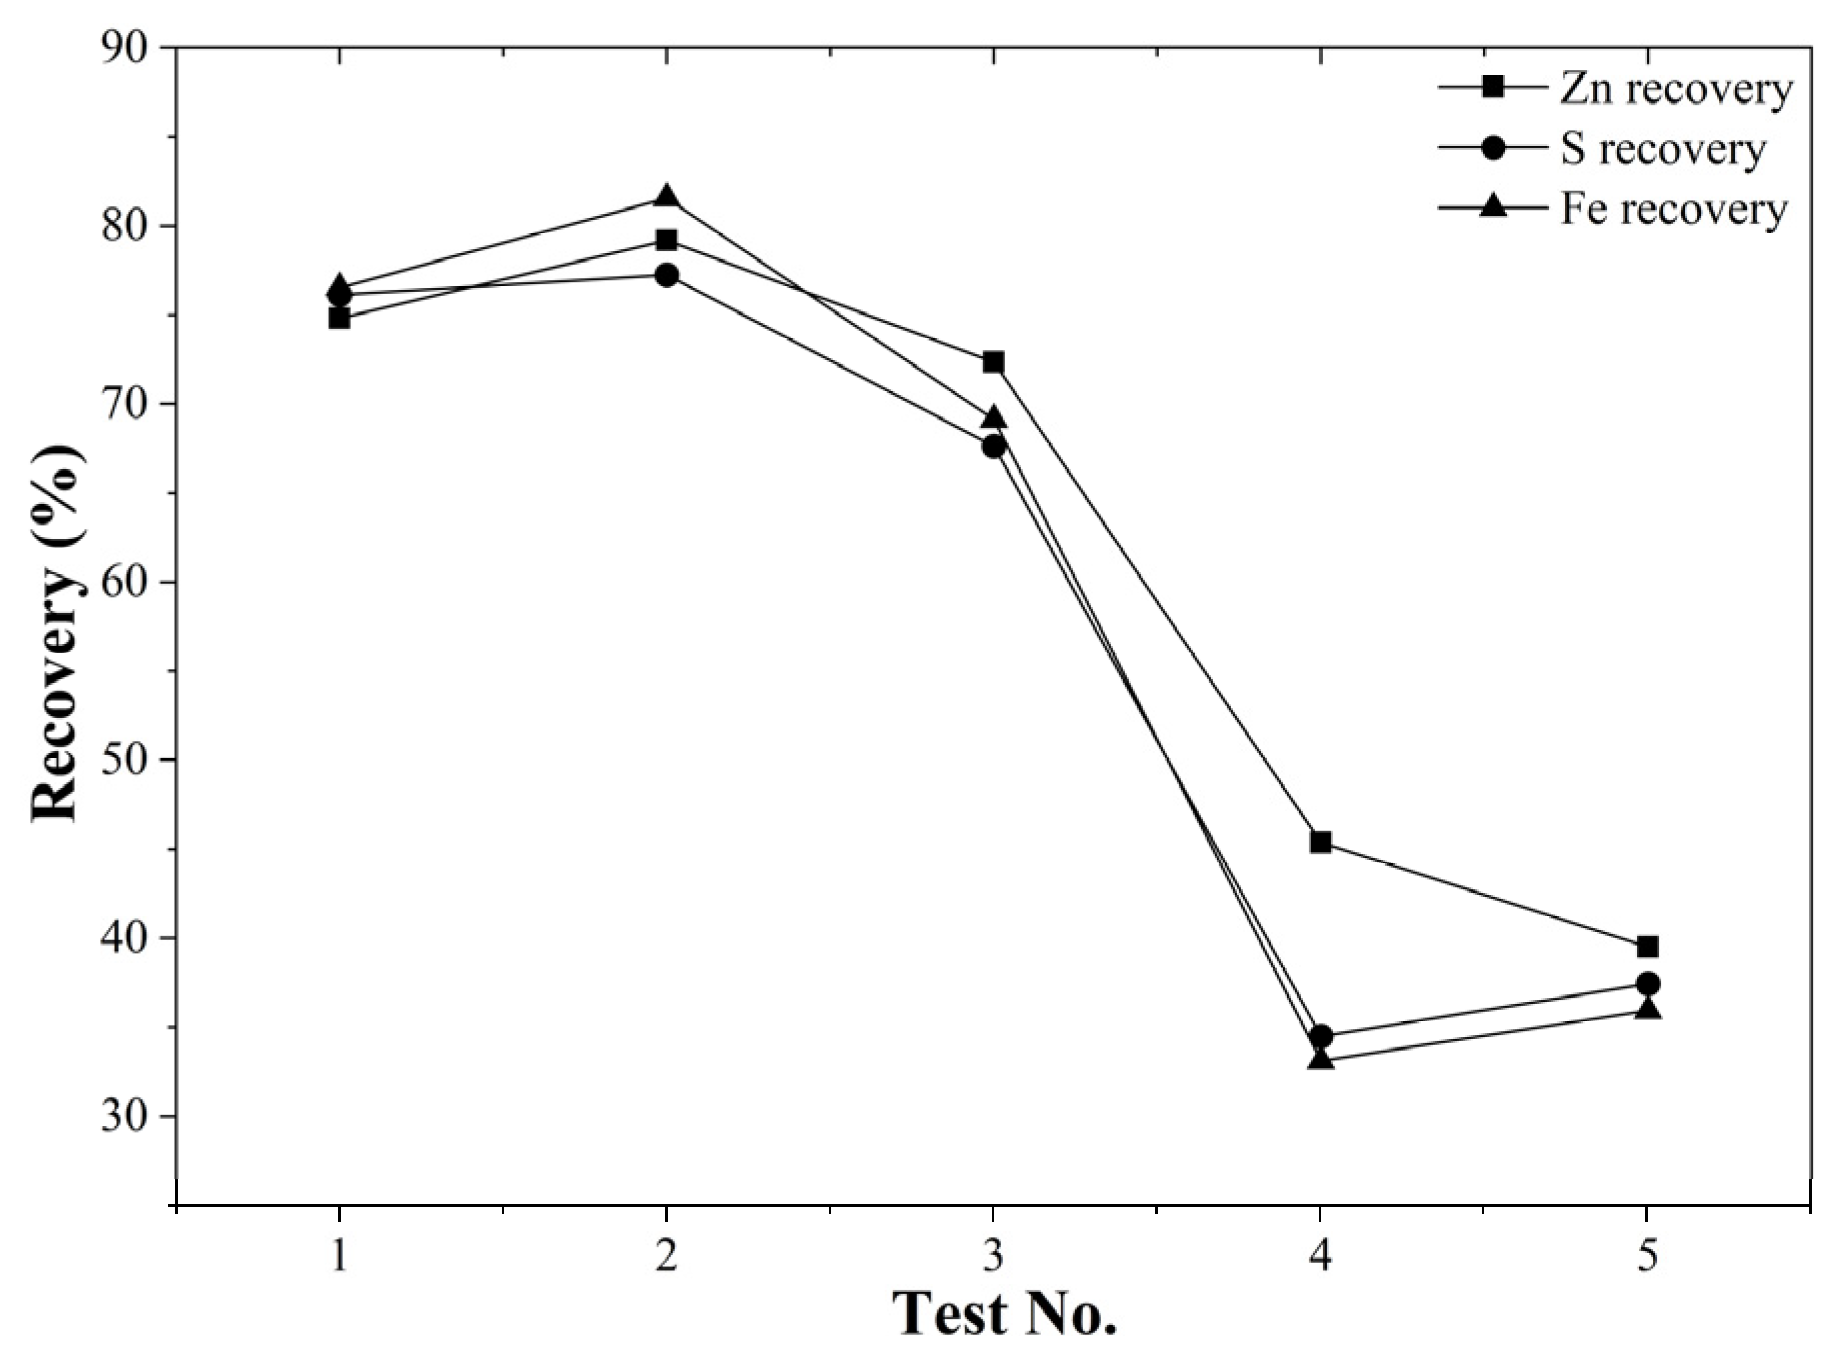
The effects of different reagent conditions on sphalerite–pyrite separation were investigated using the PCS, and the results are shown in
Figure 7 and
Table 2, where the Zn grade and the recoveries of Zn, S, and Fe in the floated pyrite concentrate (C) are listed.
The results in
Table 2 show that the flotation response varied under different reagent conditions. Under the CuSO
4-only condition, increasing the CuSO
4 dosage promoted Zn reporting to the floated pyrite, but this was accompanied by the simultaneous recovery of S and Fe. At CuSO
4 dosages of 1000–2000 g/t, Zn recovery in the concentrate ranged from 72.36% to 79.19%, while S and Fe recoveries also remained high, at 67.63%–77.26% and 69.13%–81.56%, respectively. Meanwhile, the Zn grade in the concentrate remained at 0.36%–0.41%, indicating that higher Zn recovery did not correspond to effective Zn rejection from the pyrite concentrate. For example, at 1500 g/t CuSO
4, 79.19% of Zn was recovered, together with 77.26% of S and 81.56% of Fe, with a Zn grade of 0.41%. This suggests that CuSO
4 enhanced the flotation response of sphalerite, but did not promote its selective rejection from pyrite.
Under the mixed-reagent condition involving CuSO4 and Na2SiO3, partial improvement in sphalerite rejection was observed. Under the Na2SiO3 600 g/t and CuSO4 300 g/t condition, 45.38% of Zn was recovered into the concentrate, together with 34.50% of S and 33.13% of Fe. Increasing the Na2SiO3 dosage to 900 g/t further reduced the Zn grade to 0.21% and decreased Zn recovery to 39.51%; however, S and Fe recoveries also remained low, at 37.45% and 35.94%, respectively. These results indicate that the mixed-reagent condition modified the overall flotation response and reduced sphalerite misreporting to some extent, but it was still insufficient to achieve selective sphalerite rejection while maintaining pyrite recovery.
This interpretation is further supported by
Figure 7, where the recoveries of Zn, S, and Fe show broadly similar variation trends under different reagent-adjusted conditions. Because Zn recovery was used as an indicator of sphalerite misreporting in this study, the coupled recovery behaviour of Zn, S, and Fe indicates that reagent adjustment influenced sphalerite–pyrite separation, but its selectivity was limited.
3.2.2. The Effects of Flowsheet Adjustment on Sphalerite–Pyrite Separation
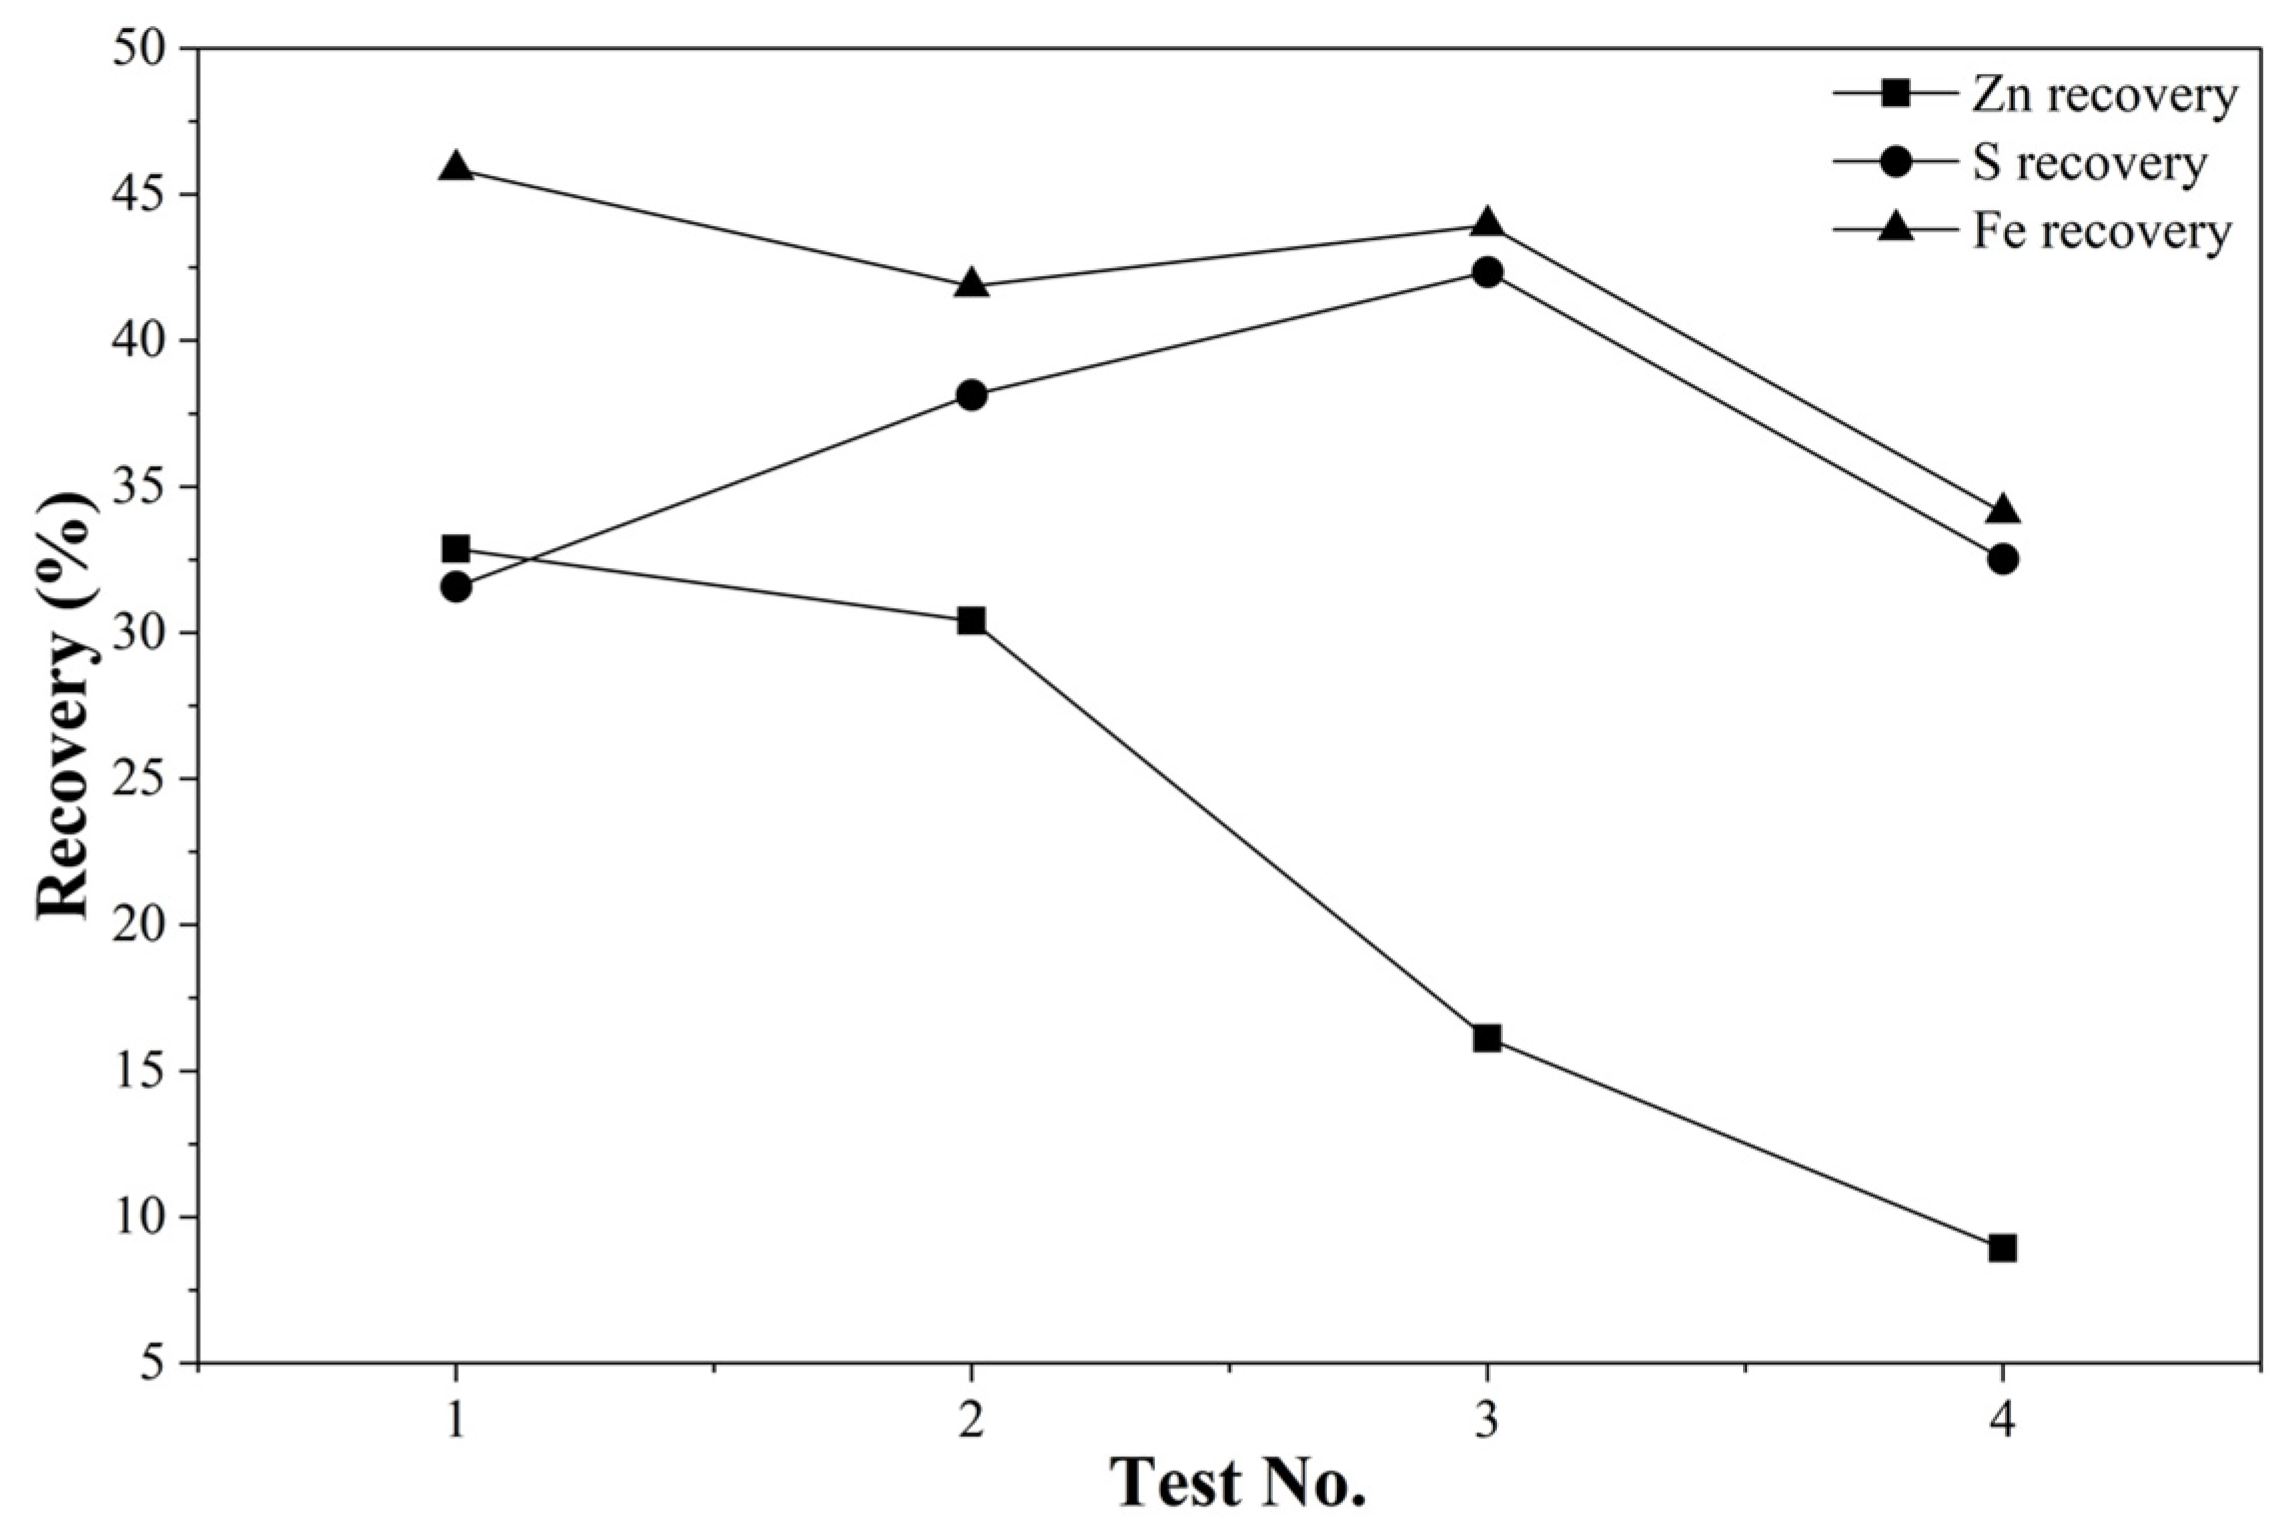
Flotation experiments with four different flowsheet configurations were performed to assess whether flowsheet adjustment could improve sphalerite–pyrite separation beyond reagent adjustment alone. The results are presented in
Figure 8 and
Table 3, where the Zn grade and the recoveries of Zn, S, and Fe in the floated pyrite concentrate (C) are listed.
Table 3 summarises the representative batch flotation results obtained under different flowsheet configurations. A detailed description of the four different flowsheet configurations is provided in
Figure 3 of
Section 2.4.1. In the “one rougher” experiment, the concentrate contained 0.41% Zn, with Zn, S, and Fe recoveries of 32.87%, 31.59%, and 45.86%, respectively, indicating that sphalerite was recovered together with pyrite during rough flotation. In the “one rougher + one cleaner” experiment, the Zn grade in C decreased from 0.41% to 0.34%, and Zn recovery slightly decreased from 32.87% to 30.41%; however, S recovery increased from 31.59% to 38.15%, while Fe recovery remained relatively high at 41.87%, suggesting that one cleaning stage improved C quality to a limited extent. In the “one rougher + two cleaners” experiment, the Zn grade was further reduced to 0.24%, and Zn recovery decreased markedly to 16.21%; in contrast, S and Fe recoveries remained high at 42.35% and 43.95%, respectively, indicating that additional cleaning enhanced sphalerite rejection while maintaining pyrite recovery. In the “one rougher + three cleaners” experiment, the Zn grade was only slightly further reduced to 0.23%, and Zn recovery decreased to 8.93%; however, this was accompanied by a clear decrease in S and Fe recoveries to 32.54% and 34.12%, respectively. As shown in
Figure 8, increasing the number of cleaning stages generally reduced Zn recovery, demonstrating that flotation cleaning can partially reduce sphalerite reporting to C. However, excessive cleaning also resulted in losses of S and Fe, indicating that sphalerite could not be further rejected without sacrificing pyrite recovery under the tested conditions.
Overall, the reagent- and flowsheet-adjustment flotation results show that sphalerite reporting to the floated pyrite concentrate could be reduced to some extent, as reflected by the decreases in Zn grade and Zn recovery. Nevertheless, these improvements were generally accompanied by changes in S and Fe recoveries, indicating that selective sphalerite rejection while maintaining pyrite recovery remained limited under the tested conditions. Therefore, further mineralogical analysis was required to better understand the mineral distribution, textural association, and liberation characteristics of sphalerite and pyrite in the PCS.
3.3. Mineralogical Characteristics of Sphalerite and Pyrite in the PCS
To investigate the mineralogical factors contributing to the limited sphalerite–pyrite separation observed in the flotation experiments, the PCS was further examined in terms of the mineral distribution, association, and liberation characteristics of sphalerite and pyrite. First, mineral composition, Fe and Zn deportment, and the particle size distributions of pyrite and sphalerite were analysed to characterise the distribution of sphalerite and pyrite within the PCS. Then, reflected light microscopy, MLA map images, and association-rate calculations were used to examine the textural association and liberation relationship between sphalerite and pyrite.
3.3.1. Mineral Distribution of Pyrite and Sphalerite in the PCS
The mineral distribution characteristics of pyrite and sphalerite in the PCS were first examined based on mineral composition, Fe and Zn deportment, and particle size distribution results. These analyses were used to identify the main mineral carriers of Fe and Zn and to evaluate whether sphalerite misreporting was related to fine-particle entrainment, gangue association, or the particle-scale association of sphalerite with pyrite.
As shown in
Table 4, the PCS was dominated by pyrite, which accounted for 82.21% of the +38 μm fraction and 77.91% of the −38 μm fraction. Sphalerite occurred at a much lower abundance, but it was clearly present in the PCS, especially in the +38 μm fraction. The sphalerite content was 0.439% in the +38 μm fraction, compared with only 0.026% in the −38 μm fraction, indicating that sphalerite was preferentially distributed in the coarse fraction of the PCS. By contrast, Ca–Al/Ca–Fe garnet, quartz, and other gangue/minor minerals were relatively more abundant in the −38 μm fraction.
The Fe and Zn deportment results further linked the mineral composition of the PCS with the elemental indicators used in the flotation and size-fraction analyses. As shown in
Table 5, pyrite hosted 96.64% and 94.04% of total Fe in the +38 μm and −38 μm fractions, respectively, confirming that Fe was mainly hosted in pyrite in the PCS. Therefore, Fe recovery and Fe size-fraction distribution could be used as indicators of pyrite recovery and size distribution, respectively. In contrast, as shown in
Table 6, Zn was entirely hosted in sphalerite in both size fractions, with no detectable Zn contribution from gangue minerals or other Zn-bearing phases. These results indicate that the residual Zn in the pyrite concentrate was mainly associated with sphalerite presence in the PCS, which may be attributed to either fine sphalerite particle entrainment with pyrite flotation froth or particle-scale association between sphalerite and pyrite.
The particle size distributions in
Table 7 and Fe and Zn size-fraction distributions in
Table 8 indicate different size-distribution tendencies for pyrite and sphalerite in the PCS. As shown in
Table 7, pyrite in the +38 μm fraction was mainly distributed in the 53–106 μm size range, accounting for 54.59%, whereas sphalerite was concentrated in coarser size ranges, with 75.09% of sphalerite in the +38 μm fraction distributed within 106–212 μm. In addition,
Table 8 shows that 64.65% of Fe was distributed in the −38 μm fraction, whereas 89.77% of Zn was distributed in the +38 μm fraction. Since Fe and Zn were mainly hosted in pyrite and sphalerite, respectively, these results indicate that pyrite was relatively more abundant in the fine fraction, while sphalerite was preferentially distributed in the coarse fraction. This size-distribution tendency suggests that sphalerite misreporting cannot be explained solely by fine-particle entrainment, because sphalerite was predominantly distributed in the +38 μm fraction rather than in the −38 μm fraction, where fine-particle entrainment would be expected to be more pronounced. However, these results alone do not reveal whether sphalerite occurred as liberated particles or as particles associated with pyrite; therefore, further MLA-based association and liberation analyses were required.
3.3.2. MLA-Based Association and Liberation Characteristics of Pyrite Particles in the PCS
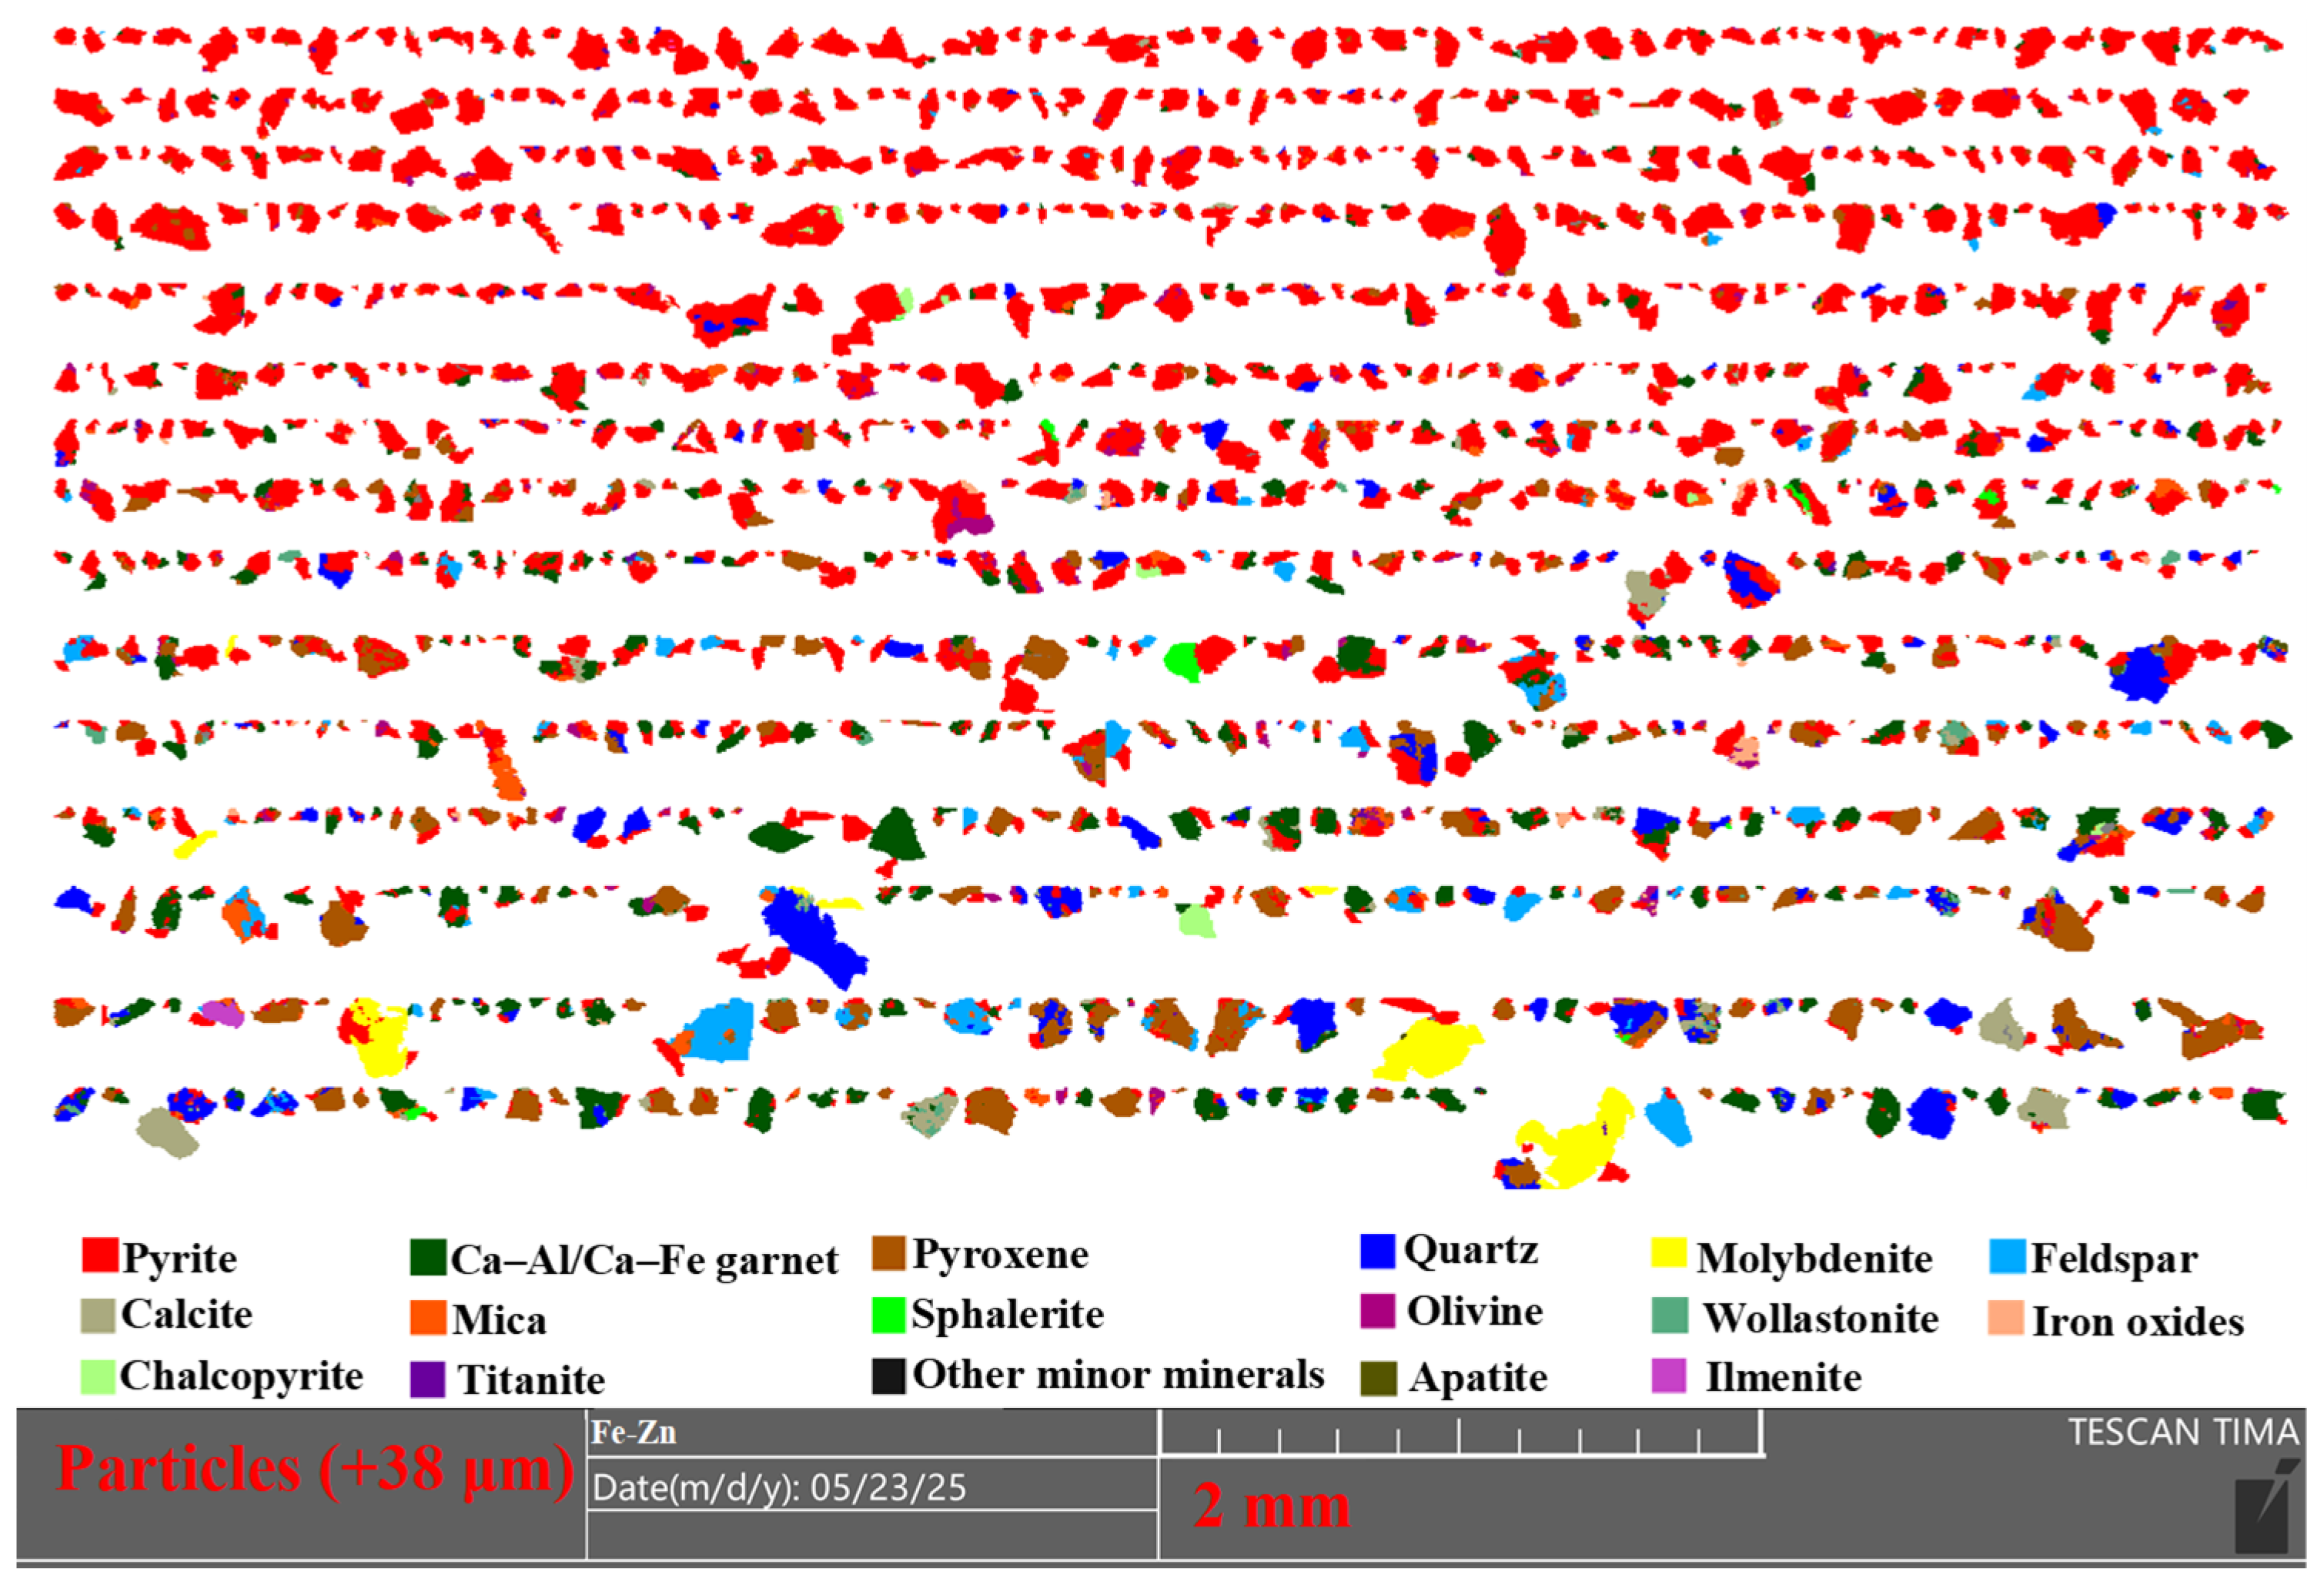
Pyrite-focused MLA map images were used to examine the association characteristics of pyrite particles in different size fractions of the PCS. As shown in
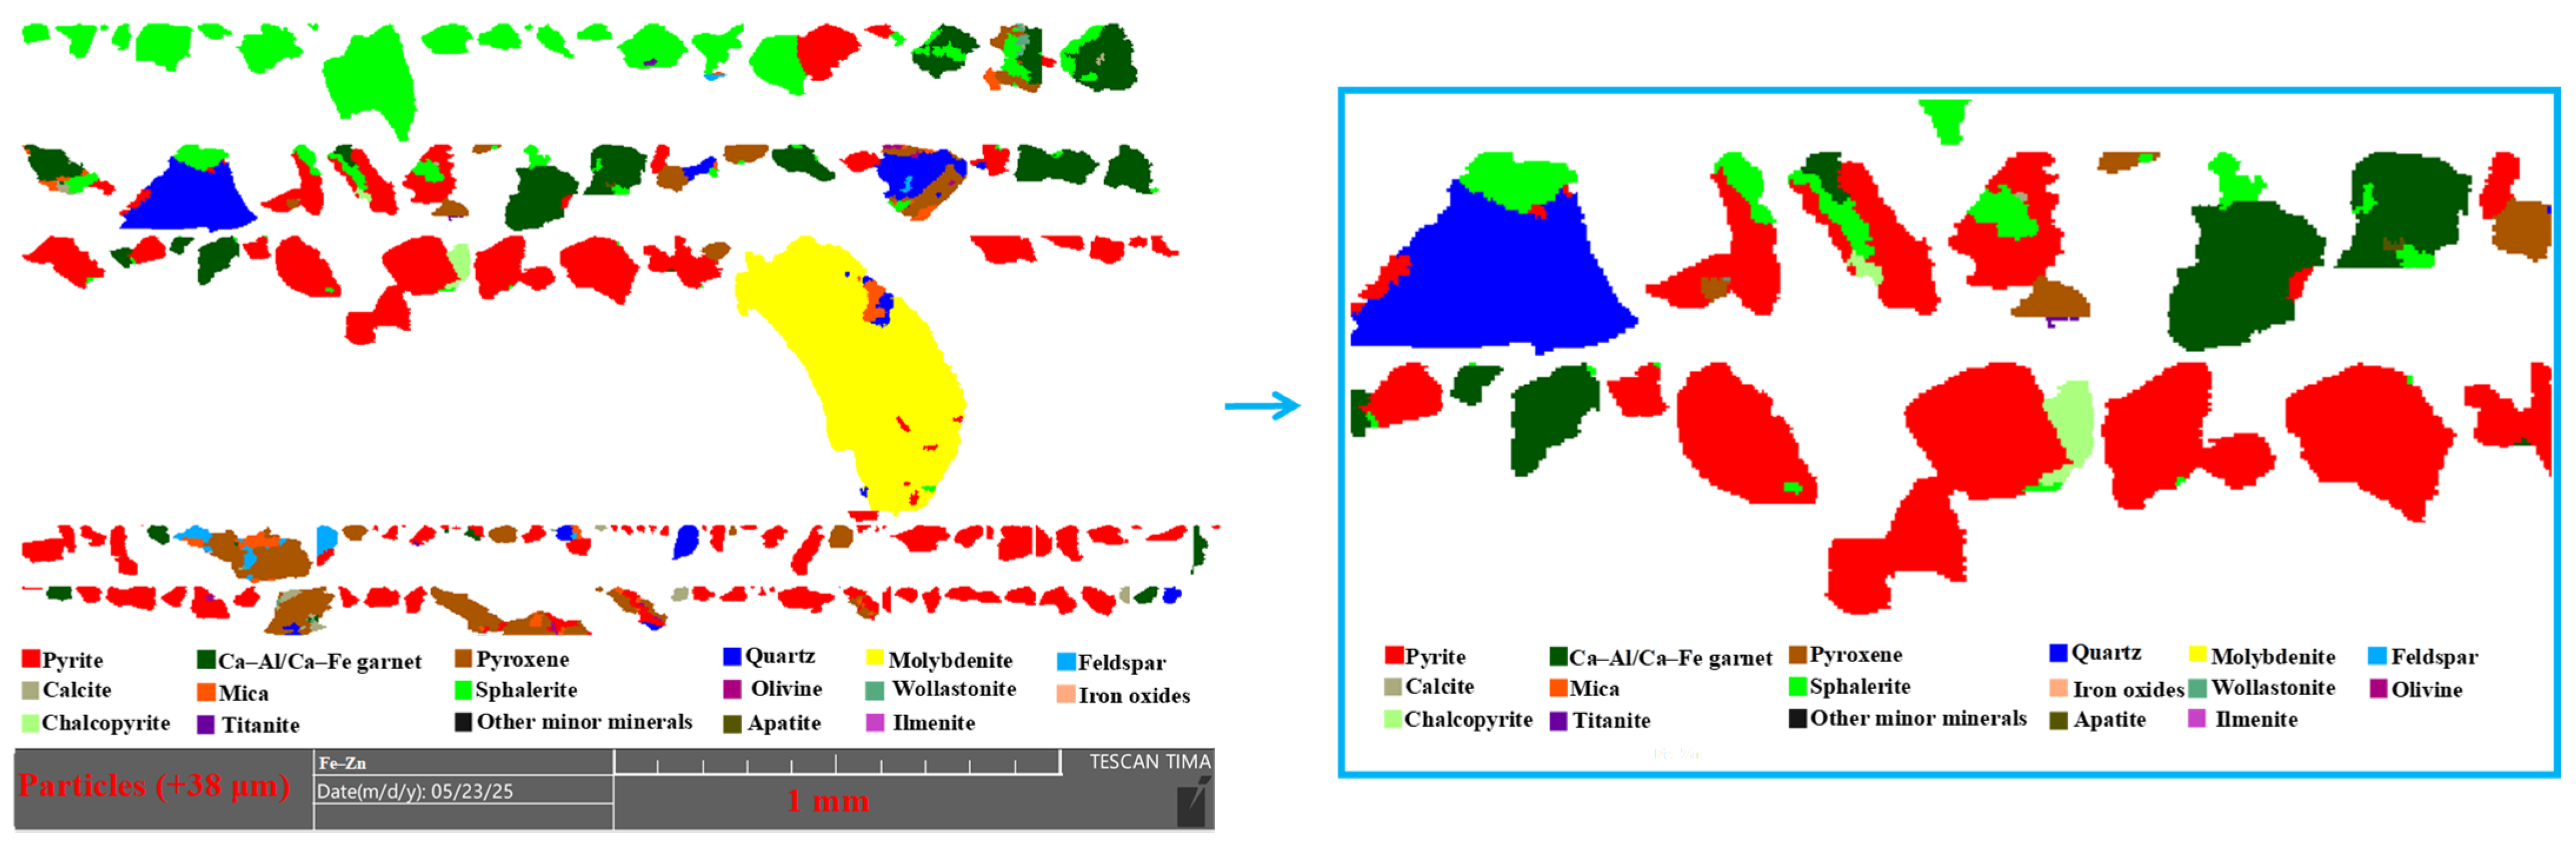
Figure 9, pyrite was the dominant mineral phase in the +38 μm fraction, and most pyrite particles were liberated or highly liberated. However, local associations between pyrite and other minerals were still observed, indicating that the +38 μm fraction was not composed entirely of liberated pyrite particles.
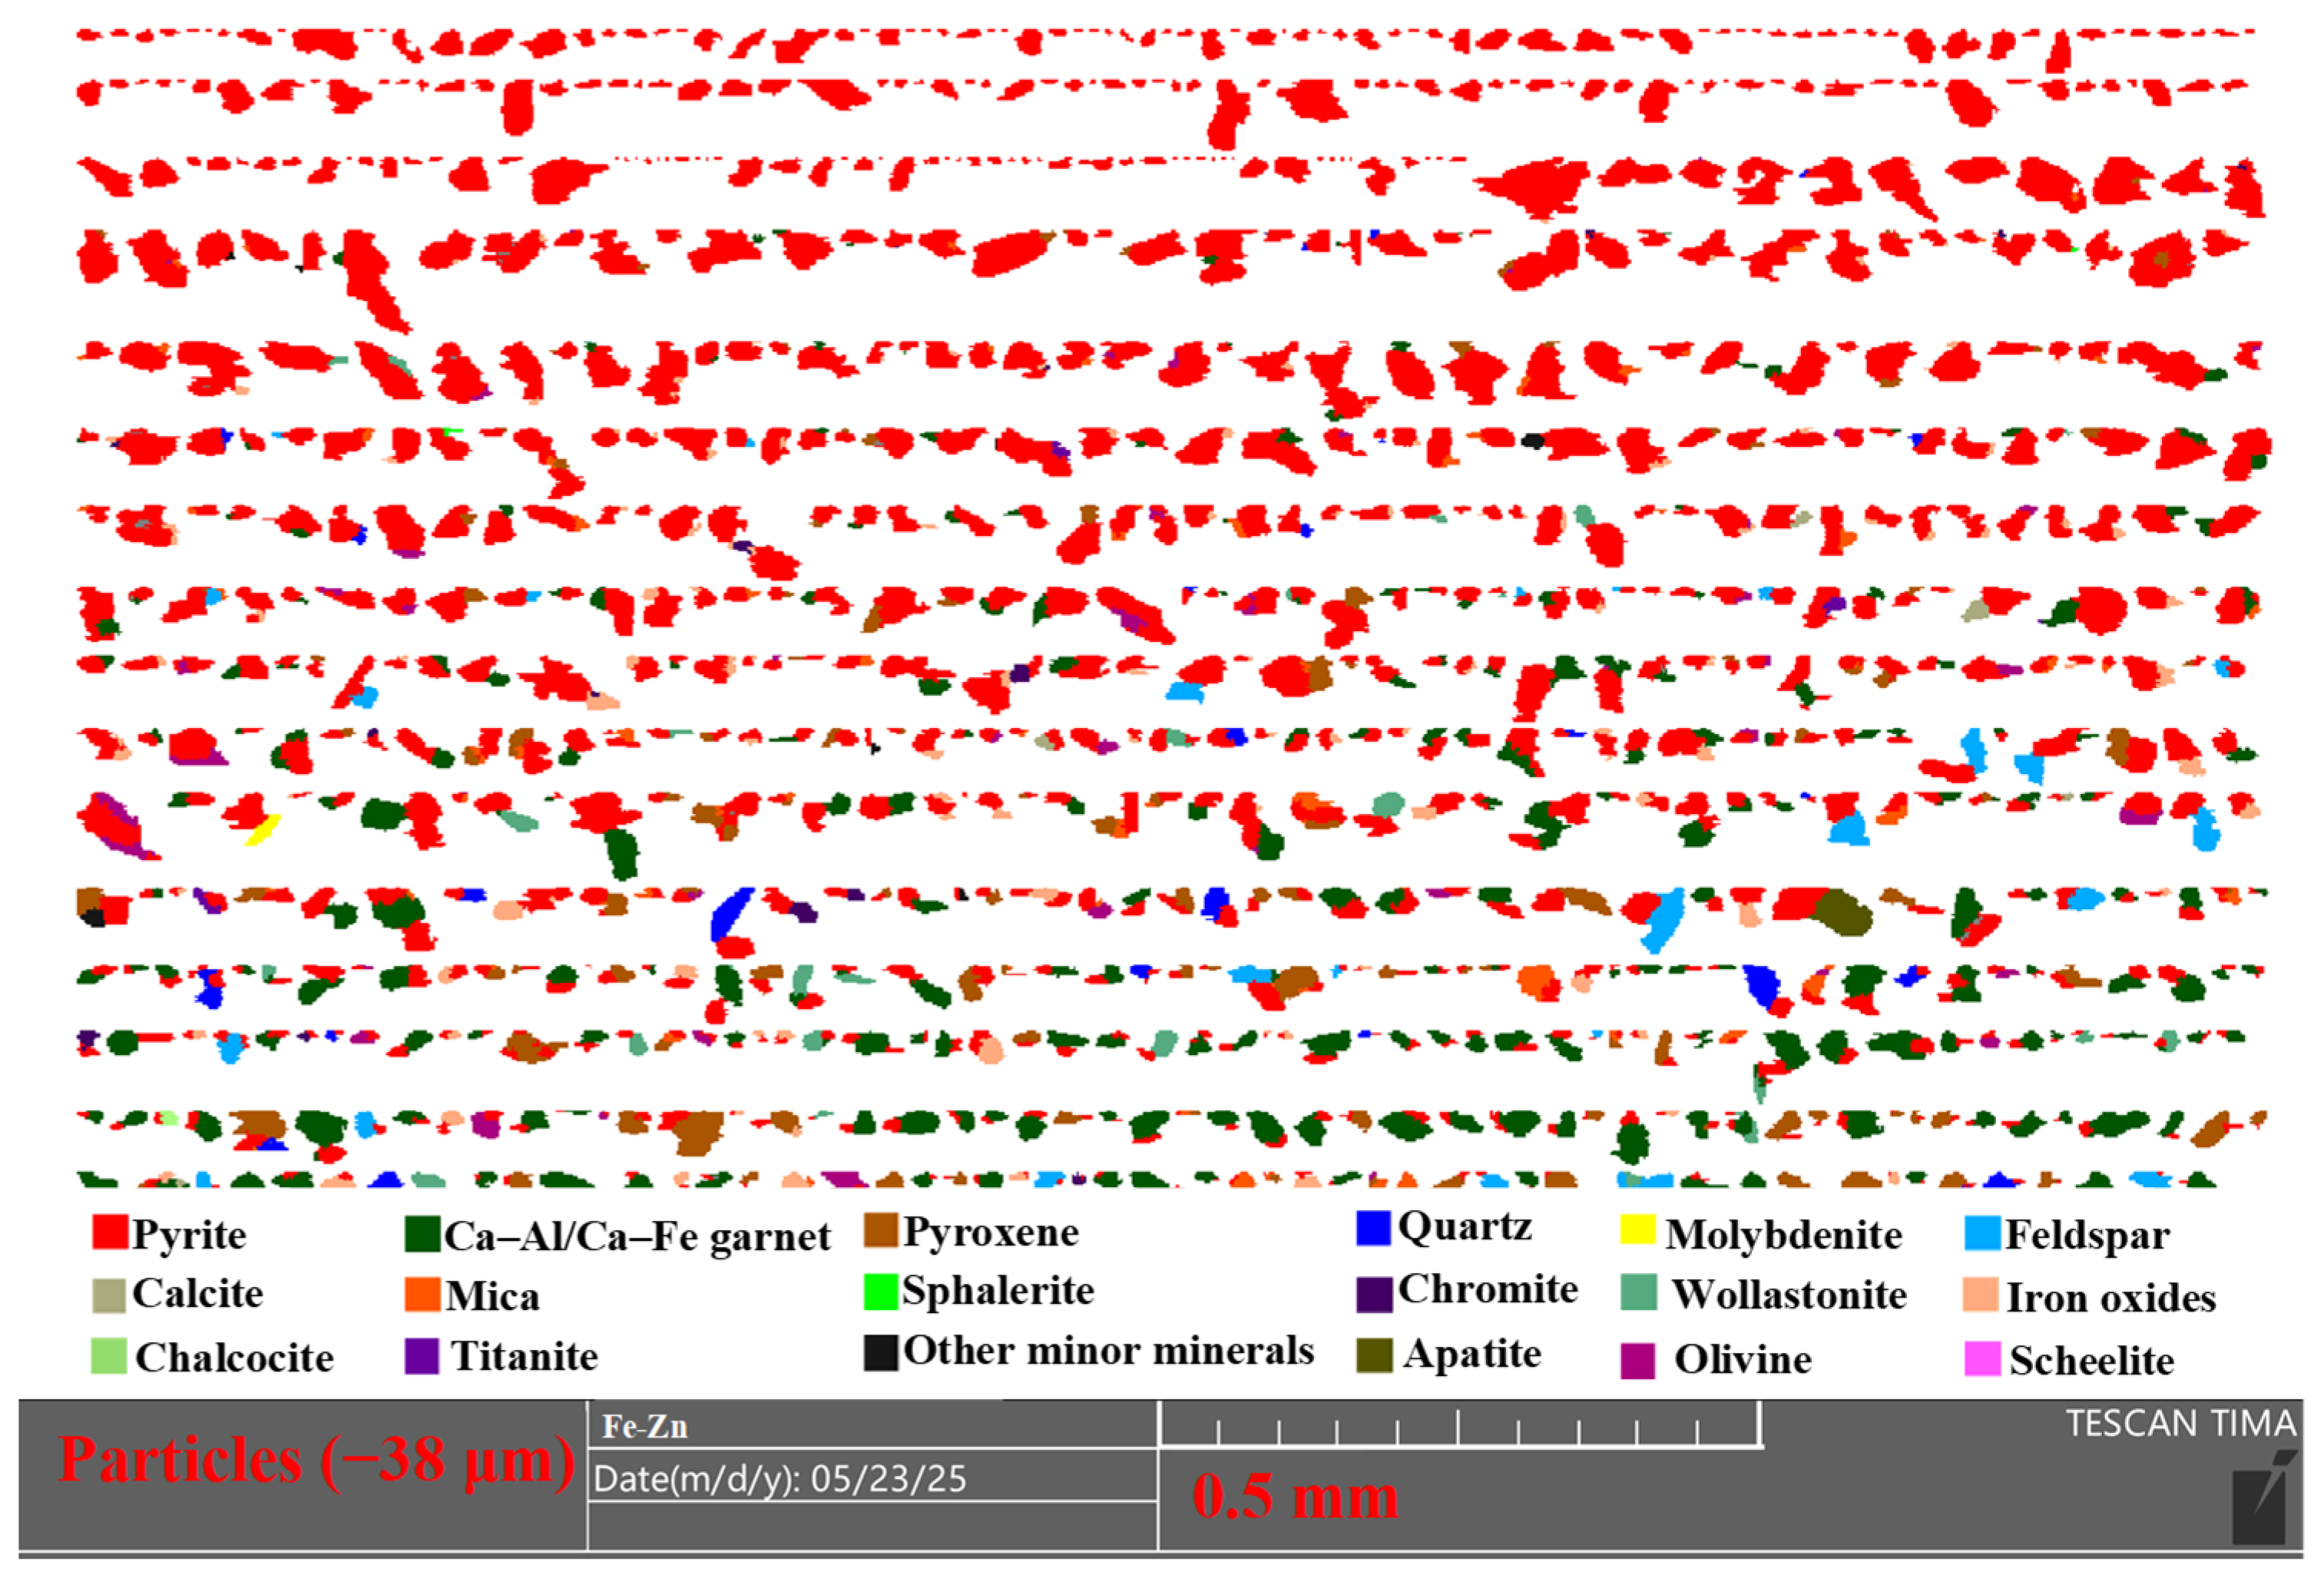
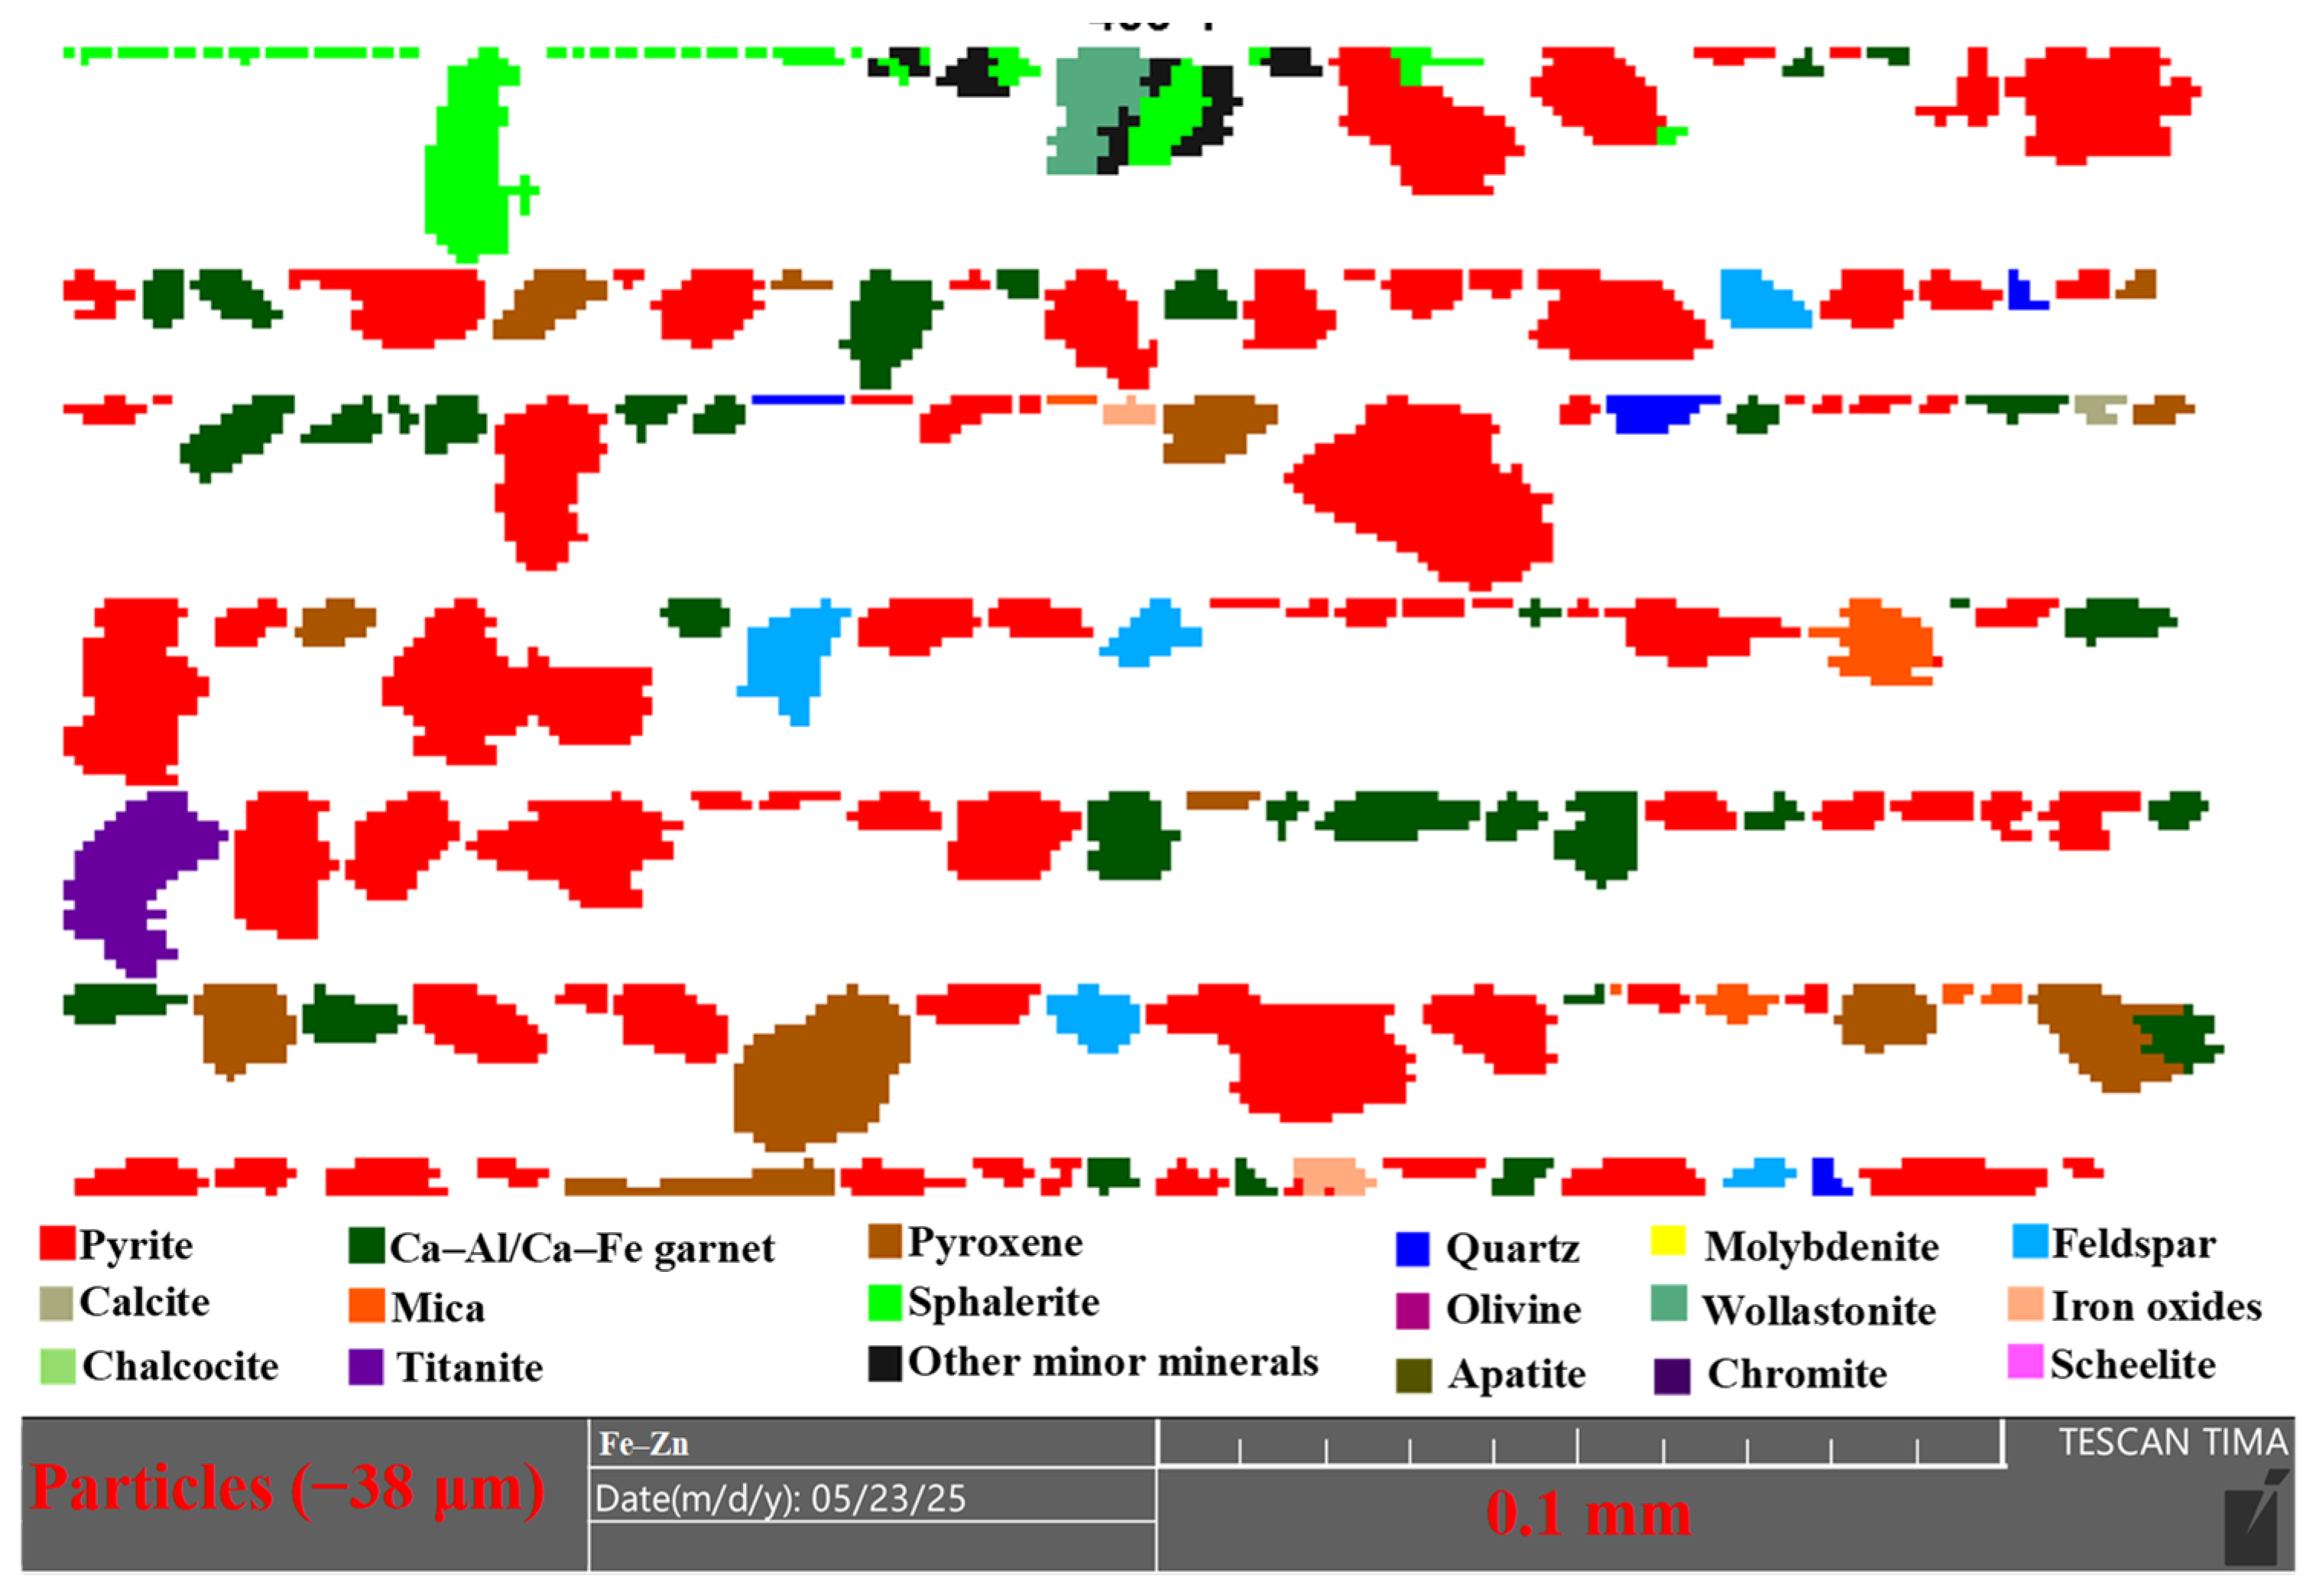
Figure 10 shows the association characteristics of pyrite particles in the −38 μm fraction. Similar to the +38 μm fraction, pyrite remained the dominant mineral phase in this finer fraction, and most pyrite particles were liberated or highly liberated. Only minor local associations between pyrite and other minerals were observed, suggesting that pyrite itself was generally well liberated in the PCS.
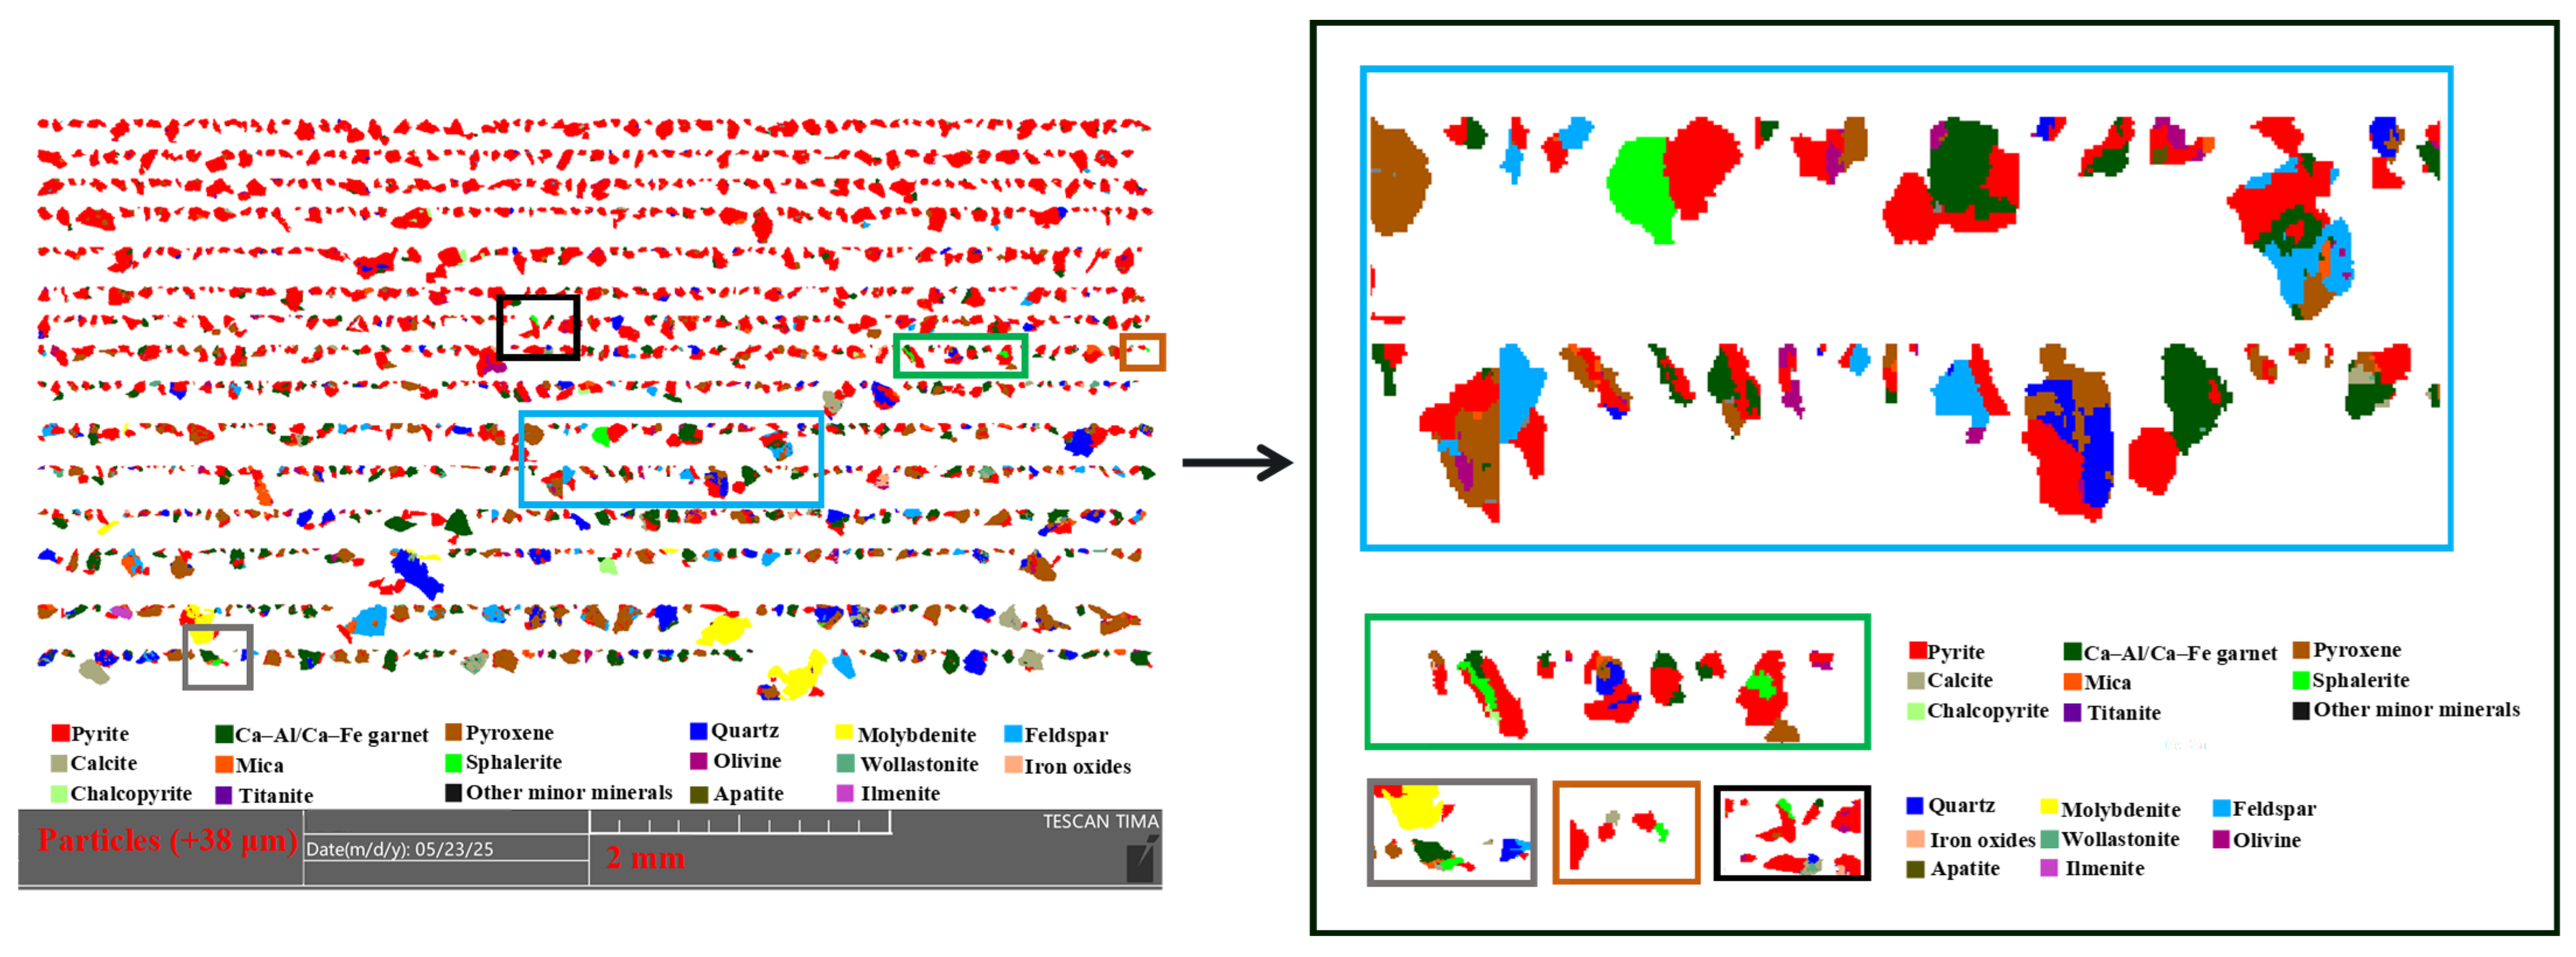
To further examine the local association between pyrite and sphalerite in the coarse fraction, an enlarged view of a selected area from
Figure 9 is shown in
Figure 11. The enlarged MLA image clearly shows pyrite particles occurring in close association with sphalerite particles in the +38 μm fraction. These observations indicate that, from the pyrite perspective, the PCS was mainly composed of well-liberated pyrite particles, but the pyrite–sphalerite association was still present and was more clearly observed in the +38 μm fraction than in the −38 μm fraction.
3.3.3. MLA-Based Association and Liberation Characteristics of Sphalerite Particles in the PCS
The sphalerite-focused MLA map images were used to further examine the association characteristics of sphalerite particles in different size fractions of the PCS. As shown in
Figure 12, sphalerite occurred at a much lower abundance than pyrite in the +38 μm fraction compared with the high pyrite abundance shown in
Figure 9, which is consistent with the relatively low Zn grade of the PCS. Although sphalerite was present in low abundance, several sphalerite-containing particles were observed in this coarse fraction. These particles were not always fully liberated and commonly occurred in association with pyrite and minor gangue minerals like Ca–Al/Ca–Fe garnet. This indicates that, in the +38 μm fraction, a proportion of sphalerite occurred as composite particles rather than as completely liberated sphalerite grains.
Figure 13 shows the association characteristics of sphalerite particles in the −38 μm fraction. Compared with the +38 μm fraction, sphalerite was less abundant in the fine fraction. In this fraction, only limited sphalerite particles were observed, and they were mainly associated with wollastonite and other minor mineral phases rather than showing clear association with pyrite. This indicates that the sphalerite–pyrite association was not pronounced in the −38 μm fraction. This suggests that the fine fraction was less likely to be the main source of sphalerite particles occurring in close association with pyrite in the PCS.
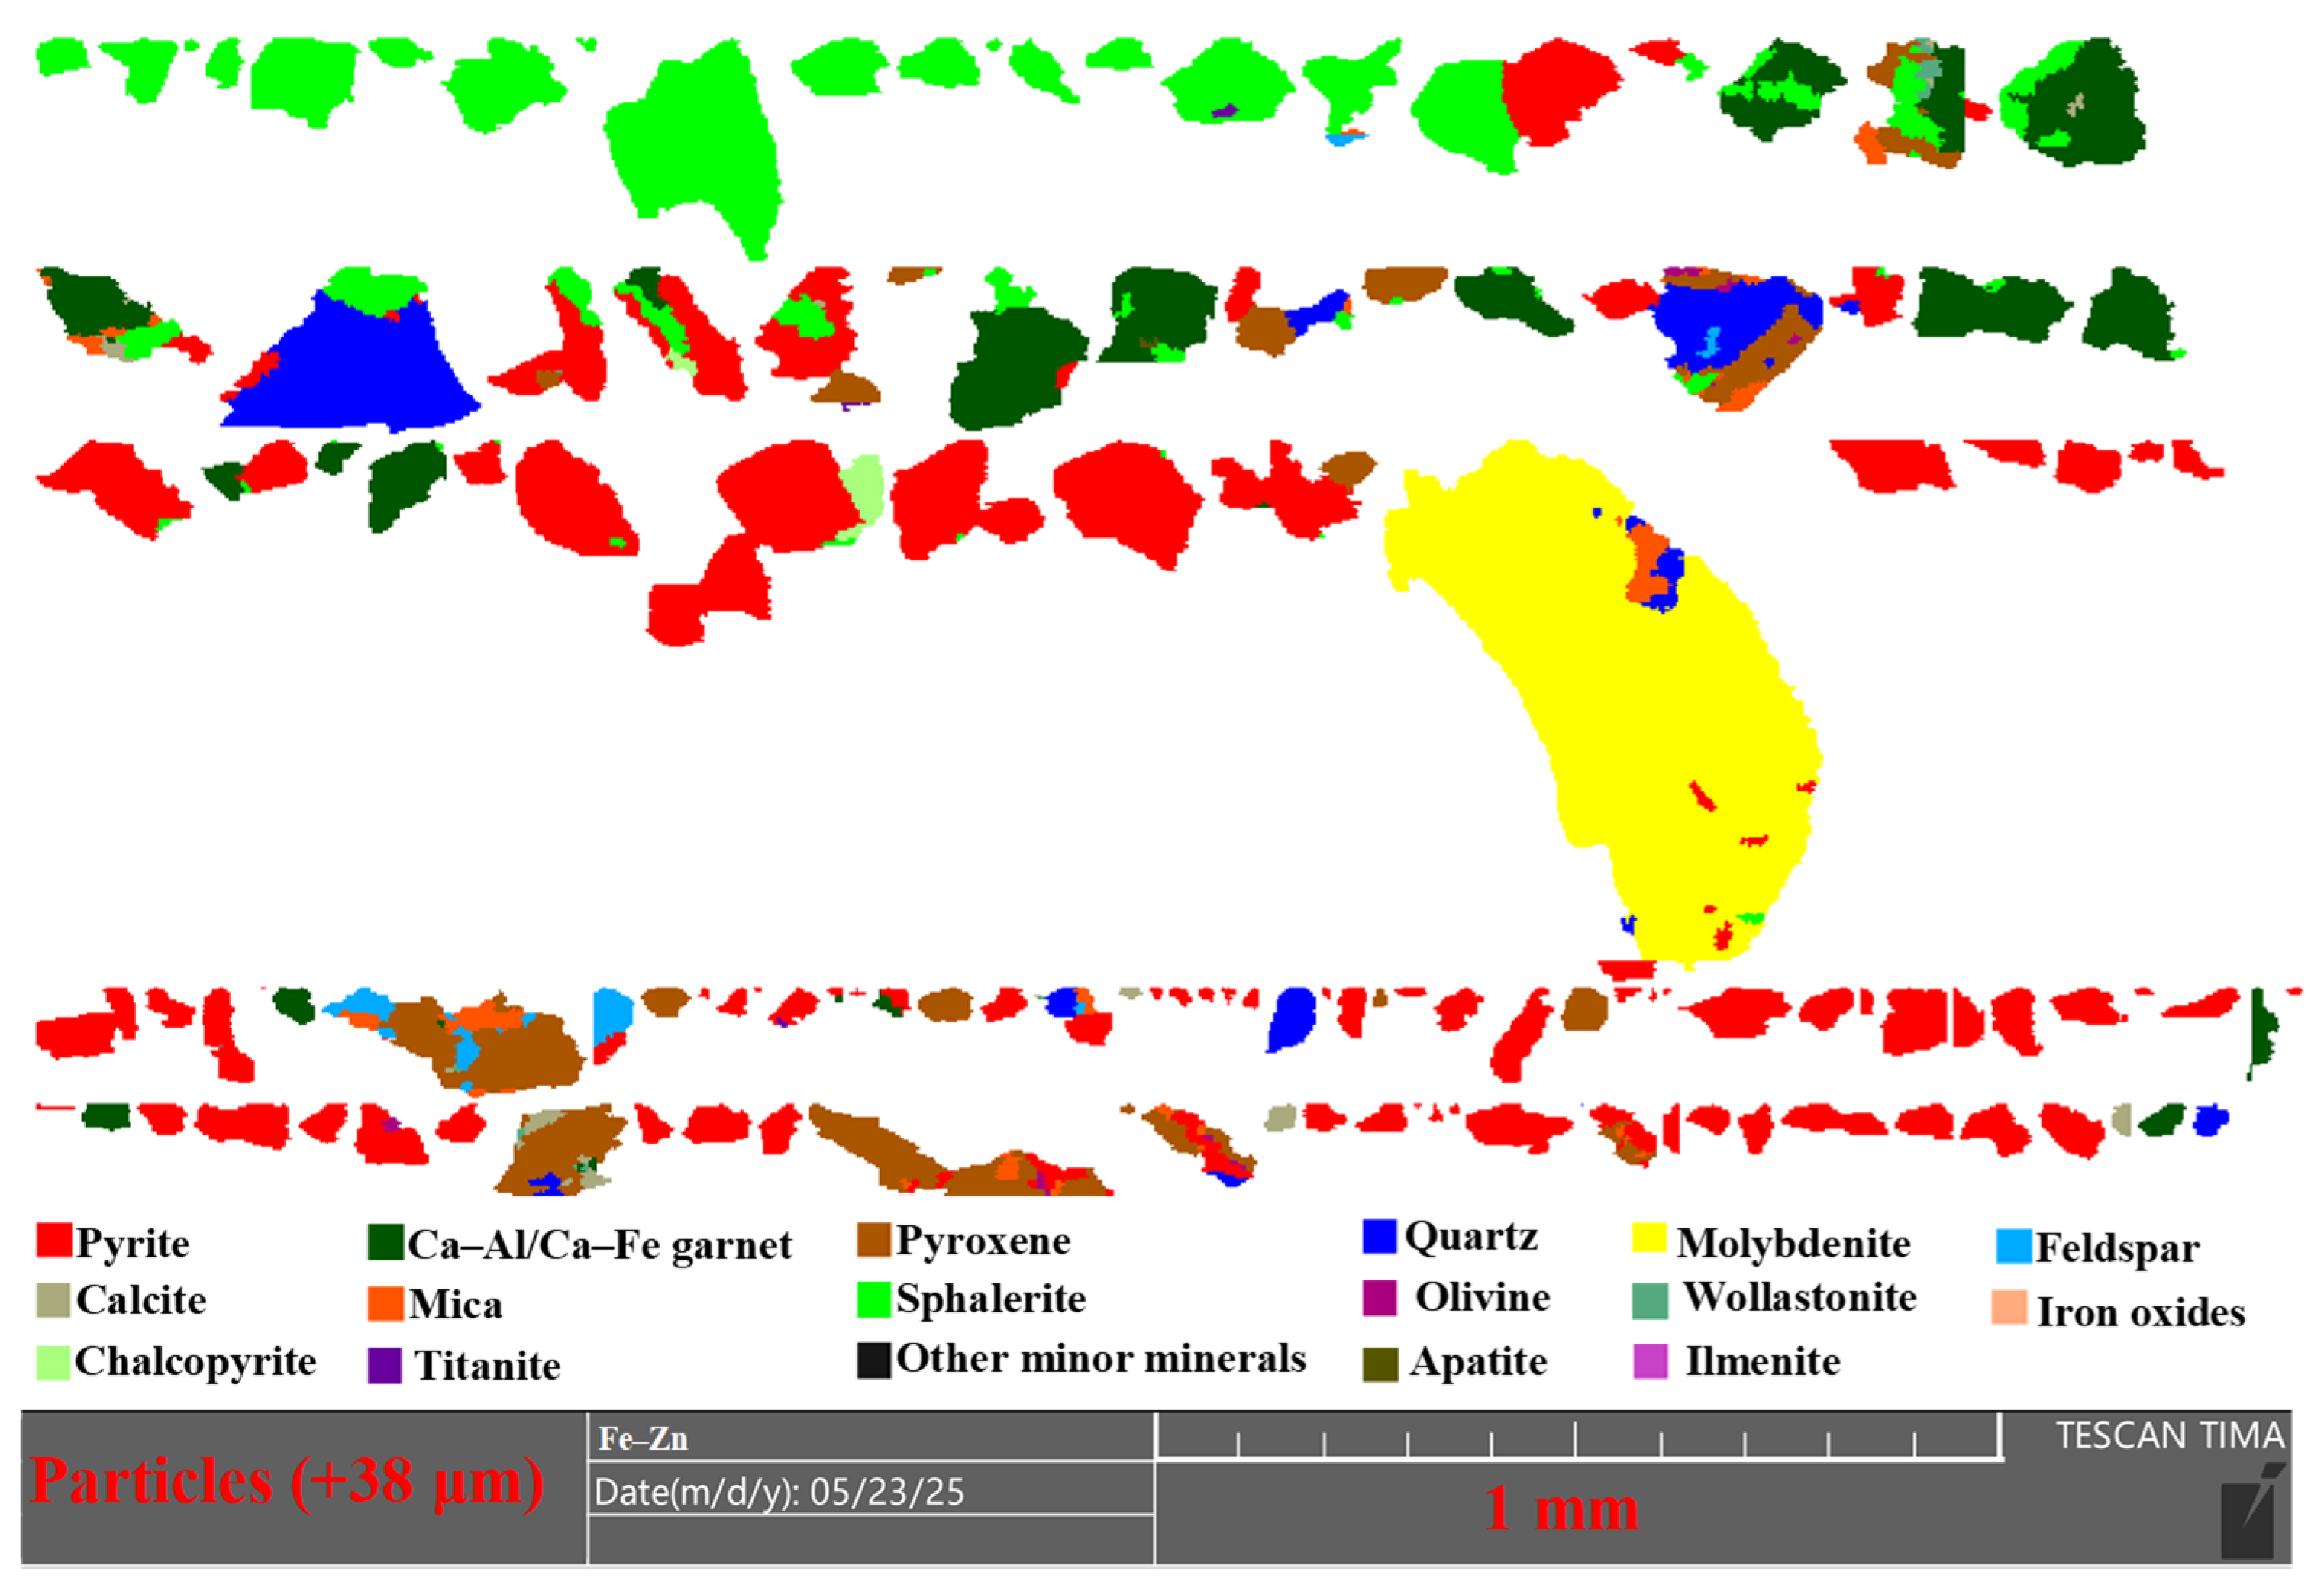
To further examine the particle-scale association of sphalerite in the coarse fraction, an enlarged view of selected sphalerite-containing particles from
Figure 12 is shown in
Figure 14. The enlarged MLA image clearly shows sphalerite occurring in close contact with pyrite-rich particles and associated gangue minerals. These features provide direct MLA evidence that some sphalerite particles were present as attached or locked composite particles in the PCS. These MLA observations indicate that, compared with pyrite, which was mostly well liberated, sphalerite showed poorer liberation and stronger association with pyrite and other minerals.
To quantitatively support this image-based observation, the liberation rates of pyrite and sphalerite in different size fractions were calculated based on MLA mineral map images, as listed in
Table 9. Pyrite showed a high degree of liberation, with liberated and highly liberated particles accounting for 93.10% and 96.83% in the +38 μm and −38 μm fractions, respectively. In contrast, sphalerite showed much poorer liberation, with liberated and highly liberated particles accounting for only 69.48% and 68.90%, respectively. This contrast indicates that sphalerite–pyrite separation was not mainly limited by pyrite liberation, but by the incomplete liberation of sphalerite from pyrite and associated gangue minerals.
In summary, reflected light microscopy and MLA evidence consistently show that sphalerite was closely associated with pyrite in the concentrate. Combined with the Zn deportment results showing that Zn was entirely hosted in sphalerite, these observations indicate that the high Zn content in the pyrite concentrate was primarily attributed to the sphalerite–pyrite association and incomplete sphalerite liberation, rather than random fine-particle entrainment or dissolved Zn species introduced by the ZnSO4 addition. When sphalerite is attached to or locked with pyrite, its flotation behaviour can be partly controlled by the associated pyrite-rich composite particles. As a result, sphalerite-bearing particles may still report to the pyrite concentrate during flotation, explaining why reagent adjustment and cleaning flotation reduced the Zn content but did not fully eliminate Zn from the concentrate.
3.3.4. Complementary Reflected Light Microscopy Evidence for Sphalerite–Pyrite Association
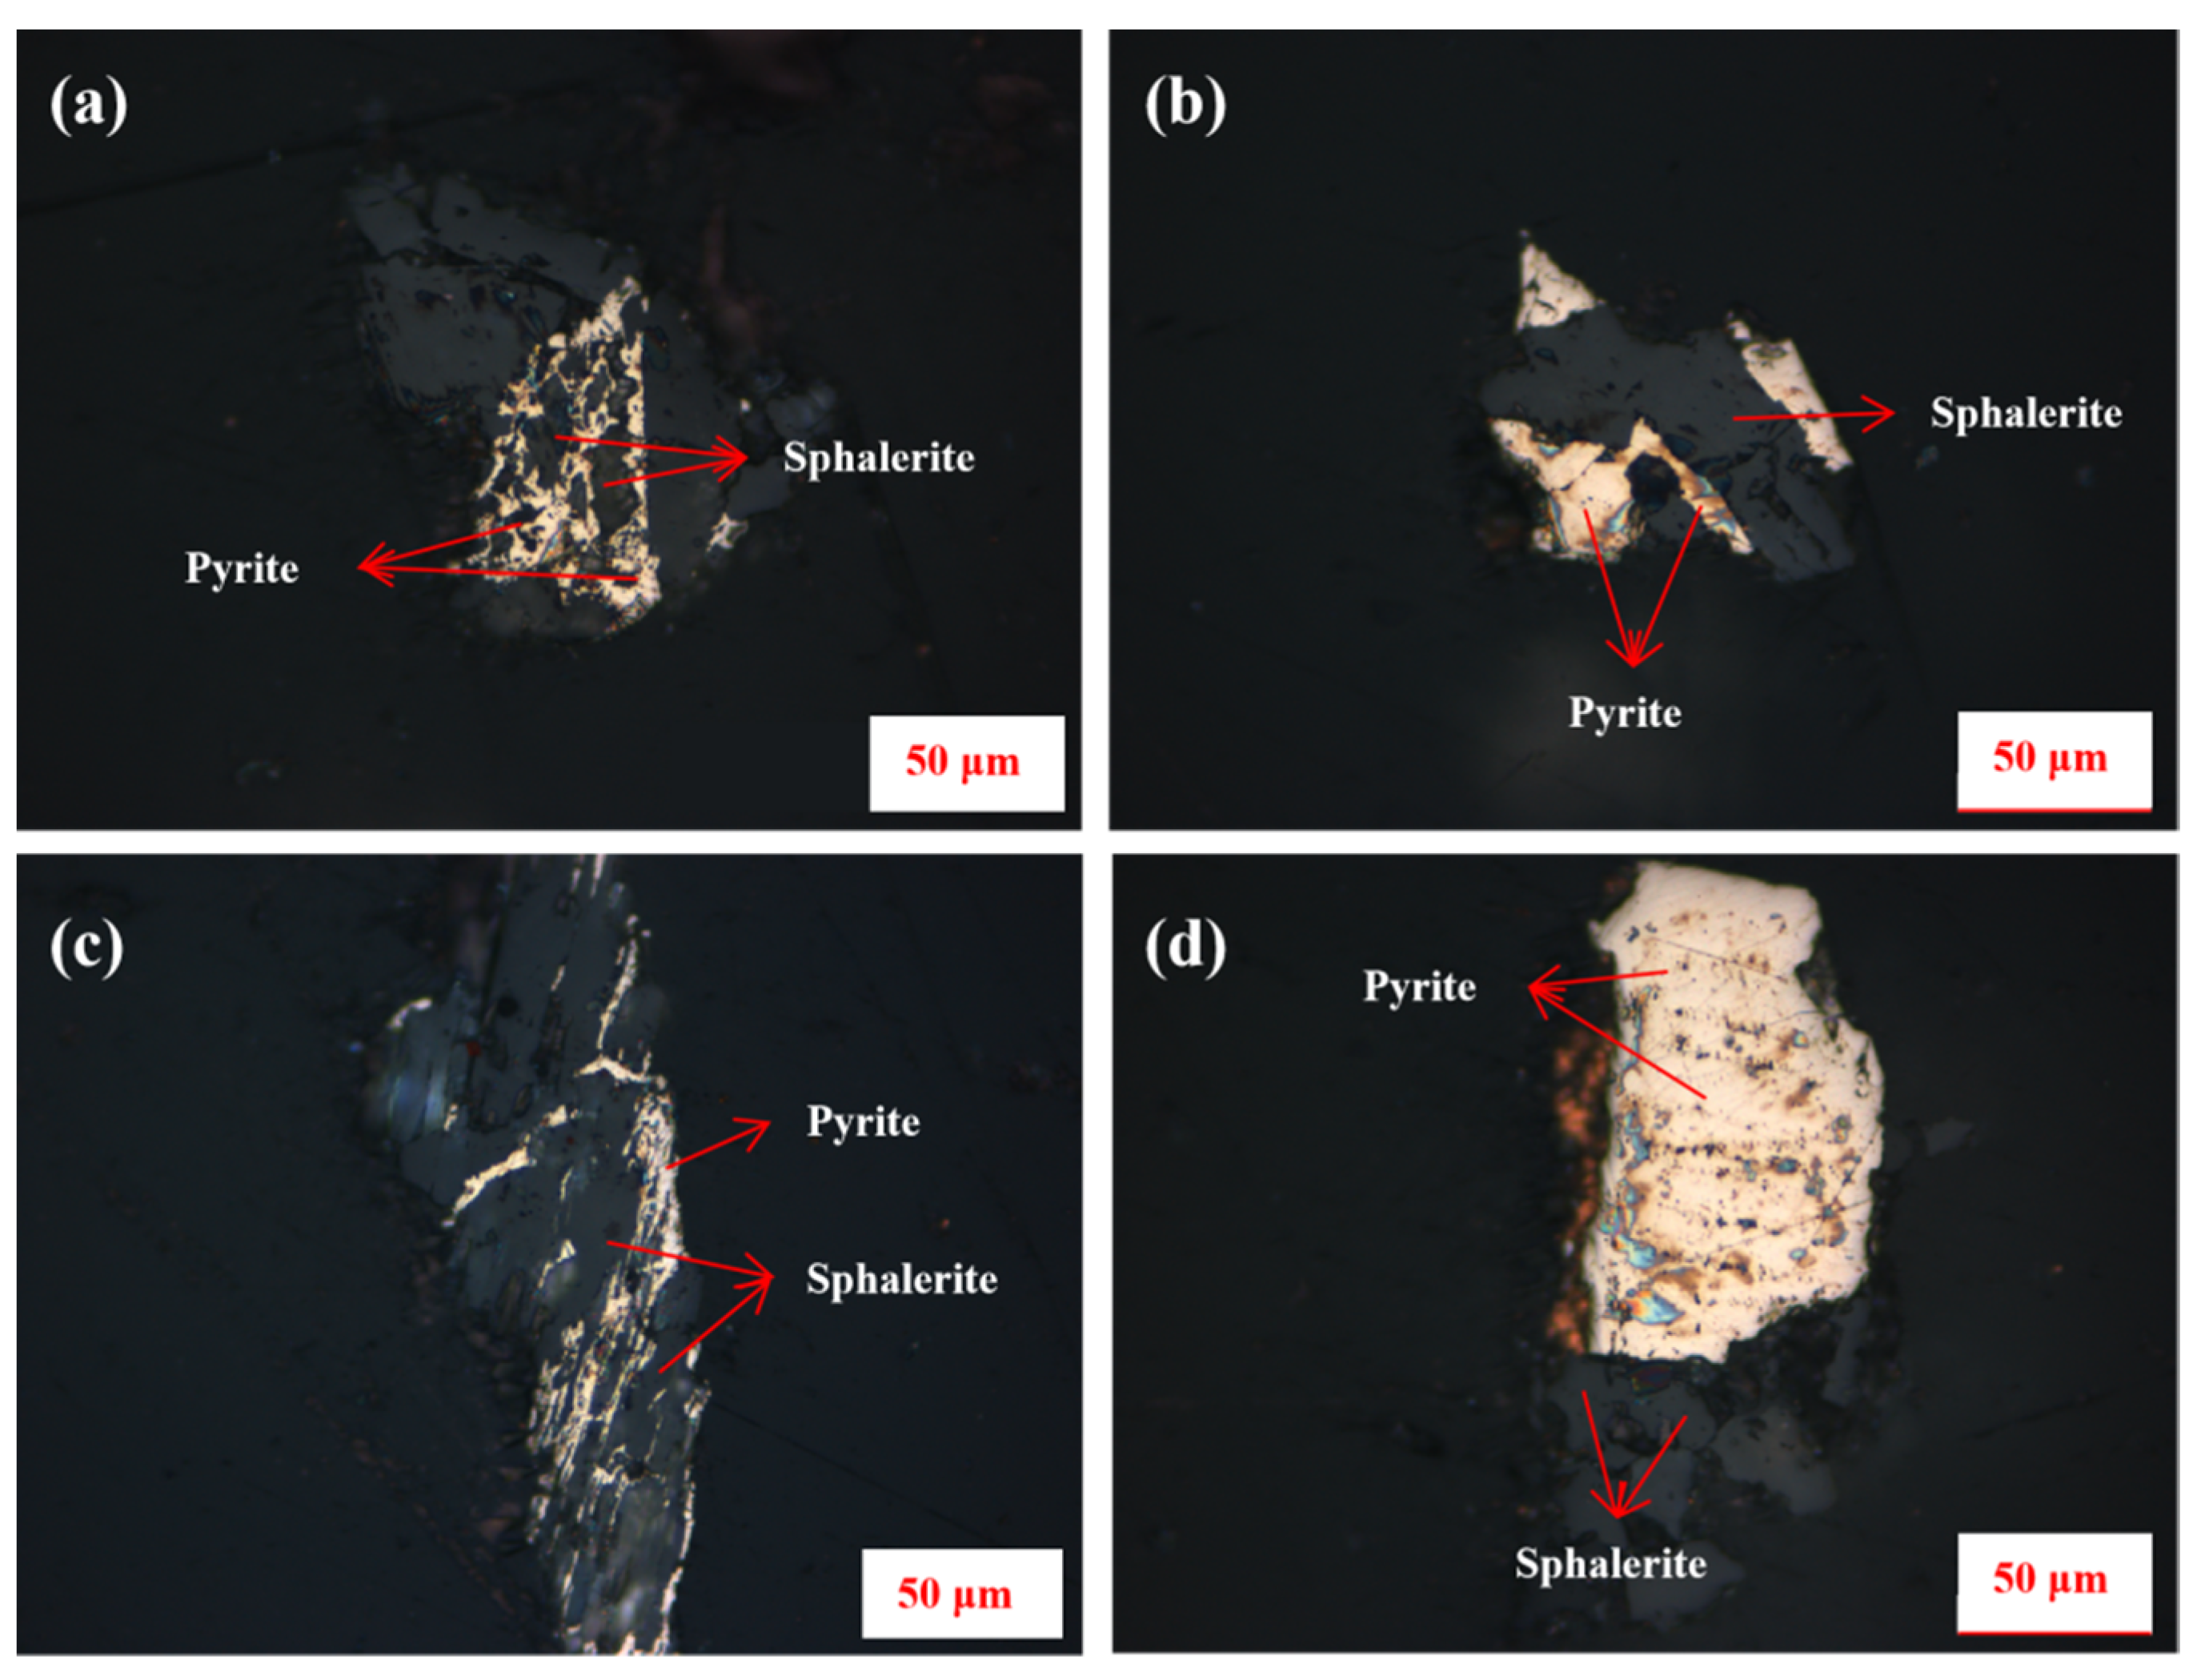
To further validate the MLA-based observations, reflected light microscopy was used to directly examine the textural relationship between sphalerite and pyrite in the PCS. As shown in
Figure 15, the bright yellow, highly reflective particles are mainly pyrite, whereas the grey, low-reflectance phases are attributed to sphalerite. Sphalerite was observed in close association with pyrite and occurred as irregular grains (
Figure 15a,b), banded aggregates (
Figure 15c), and blocky particles (
Figure 15d). The aggregate sizes were mainly in the range of 0.05–0.15 mm.
These textural features indicate that sphalerite did not occur solely as fully liberated particles, but was locally locked with or attached to pyrite. This provides complementary microscopic evidence supporting the MLA results, and further confirms the particle-scale association between sphalerite and pyrite in the PCS.
3.4. Improved Sphalerite–Pyrite Separation by Regrinding-Assisted Flotation
The above mineralogical analysis indicates that the high Zn content in the PCS was mainly related to the close association and incomplete liberation of sphalerite from pyrite. Regrinding was, therefore, introduced as a liberation-enhancing pretreatment to improve sphalerite–pyrite separation. In this section, the PCS was reground for a short period of 1.5 min before flotation, according to the flowsheet shown in
Figure 4, and the effect of regrinding on sphalerite rejection and pyrite recovery was evaluated using the flotation results shown in
Table 10. The floated pyrite concentrate, middlings, and tailings from the regrinding-assisted flotation tests were denoted as C, M, and T, respectively. Na
2SiO
3 was added in both tests as a dispersant to maintain comparable pulp dispersion conditions and to minimise the influence of particle aggregation during flotation.
The relatively short-duration regrinding time of 1.5 min was selected as a preliminary test condition considering the practical constraints of the on site operation. In this plant, the flotation tailings are intended for downstream utilisation as construction material feedstock. Therefore, excessive regrinding is not preferred because it may generate additional fine particles, which could affect the suitability of the tailings for subsequent utilisation. The short-duration regrinding condition was, therefore, used to examine whether limited regrinding could improve sphalerite rejection while avoiding unnecessary fines generation.
As shown in
Table 10, compared with the test without regrinding, regrinding for 1.5 min before flotation clearly reduced Zn misreporting to the floated pyrite concentrate under the same Na
2SiO
3 dosage. Without regrinding, the Zn grade and Zn recovery in C were 0.29% and 29.97%, respectively. After regrinding, the Zn grade in C decreased to 0.14%, and Zn recovery decreased markedly to 12.21%; meanwhile, the Zn recovery in T increased from 58.68% to 79.63%. These results indicate that regrinding promoted the rejection of sphalerite from the floated pyrite concentrate to the tailings. The effect of regrinding on pyrite recovery should also be considered, as the floated pyrite concentrate is intended for use as a raw material in sulphuric acid production. After regrinding, the S grade in C increased from 38.59% to 42.53%, indicating improved concentrate quality. However, the S recovery decreased from 55.96% to 41.47%, and the Fe recovery decreased from 53.93% to 37.89%. These results indicate a clear trade-off between Zn rejection and pyrite recovery: regrinding improved sphalerite rejection and increased the S grade of the floated pyrite concentrate, but it also caused part of the pyrite to be lost to the tailings. It should be noted that the Zn grade of 0.29% from the flotation test without regrinding, shown in
Table 10, was used as the baseline for evaluating the effect of regrinding. The Zn grade of 0.41% reported in the batch flotation results in
Section 3.2.1 and
Section 3.2.2 refers to a different flotation result and was not used as the baseline for the regrinding comparison.
4. Discussion
The present study aimed to identify the origins of Zn misreporting to the pyrite concentrate and to evaluate a feasible strategy for mitigating this problem. The combined results from XRF, XRD, zinc phase analysis, MLA, reflected light microscopy, and flotation tests indicate that Zn in the PCS was mainly hosted in sphalerite. More importantly, MLA and reflected light microscopy showed that sphalerite occurred in close association with pyrite and associated gangue minerals, particularly in the coarse +38 μm fraction. Therefore, Zn misreporting to the pyrite concentrate can be understood as a sphalerite–pyrite separation problem controlled not only by flotation chemistry, but also by mineralogical association and incomplete liberation.
The reagent- and flowsheet-adjustment results showed that flotation chemistry and circuit configuration influenced sphalerite–pyrite separation, but their selectivity was limited under the tested conditions. Under the CuSO4-only conditions, Zn recovery to the floated pyrite concentrate remained high, together with high S and Fe recoveries, indicating the co-recovery of Zn-bearing particles and pyrite. Under the mixed CuSO4-Na2SiO3 conditions, Zn grade and Zn recovery were reduced to some extent, but S and Fe recoveries also decreased, suggesting that Na2SiO3 modified the overall flotation response rather than selectively rejecting sphalerite while maintaining pyrite recovery. Similarly, additional cleaning stages reduced the Zn grade in the pyrite concentrate, but this improvement was achieved at the expense of a substantial decrease in S recovery. Therefore, reagent and flowsheet adjustments could reduce Zn contamination only to a limited extent and partly by sacrificing pyrite recovery, rather than by achieving true selective sphalerite–pyrite separation.
This limited selectivity is consistent with the mineralogical evidence. MLA and reflected light microscopy showed that sphalerite occurred locally as attached, intergrown, or locked particles within pyrite and associated gangue minerals. In addition, Zn deportment results showed that Zn was hosted in sphalerite, while MLA liberation data showed that sphalerite was less well liberated than pyrite. Under such conditions, sphalerite-bearing particles may still report to the floated pyrite concentrate because they are physically associated with pyrite-rich particles. This explains why Zn, S, and Fe showed coupled recovery behaviour during flotation and why repeated cleaning could not selectively remove sphalerite without causing pyrite loss. Therefore, the persistence of Zn in the pyrite concentrate was more closely related to mineralogical constraints, particularly the sphalerite–pyrite association and incomplete sphalerite liberation, than to reagent or flowsheet conditions alone.
Based on this interpretation, regrinding was introduced as a possible strategy to improve sphalerite–pyrite separation before flotation. The regrinding-assisted flotation test showed that the Zn grade in the final pyrite concentrate decreased from 0.29% to 0.14%, while Zn distribution to the tailings increased under the same Na2SiO3 dosage. Because Na2SiO3 was used at the same dosage in both tests, its dispersion effect was kept constant, and the comparison highlights the additional effect of regrinding under comparable dispersion conditions. Based on the pre-regrinding MLA evidence showing sphalerite–pyrite association and incomplete sphalerite liberation, a reasonable interpretation is that short-duration regrinding promoted the partial liberation or detachment of sphalerite-bearing particles, allowing more Zn-bearing particles to be rejected to the tailings rather than reporting to the pyrite concentrate.
Alternative effects of short-duration regrinding should also be considered. In addition to possible liberation improvement, short-duration regrinding may clean mineral surfaces, remove oxidation products or slime coatings, expose fresh mineral surfaces, and modify surface physicochemical properties. However, if surface cleaning or fresh surface generation were the dominant effect in this system, pyrite flotation would be expected to improve, and S and Fe recoveries to the concentrate would likely increase or at least be maintained. In contrast, the results showed that regrinding reduced Zn misreporting, while S and Fe recoveries also decreased. This suggests that the reduction in Zn grade cannot be explained primarily by enhanced pyrite surface floatability. The decrease in S and Fe recoveries also indicates a trade-off between impurity rejection and pyrite recovery. Further grinding may have increased the proportion of fine pyrite particles, thereby reducing their flotation efficiency and causing pyrite loss to the middlings or tailings.
It should be noted that the role of regrinding was inferred from the flotation response, particle size distribution, and mineralogical information obtained before regrinding. Because detailed post-regrinding MLA, surface-chemistry, mineral association, and size-by-liberation analyses were not conducted, the proposed liberation effect of regrinding should be considered a reasonable interpretation rather than a directly confirmed mechanism. Overall, this study demonstrates that reagent and flowsheet adjustments alone were insufficient to fully mitigate Zn misreporting in this system, because sphalerite reporting to the pyrite concentrate was strongly constrained by particle-scale association and incomplete liberation. The novelty of this industrial case study lies in using process mineralogy to diagnose the mineralogical origins of Zn misreporting to the pyrite concentrate and to guide a targeted regrinding-assisted flotation strategy for impurity control. This approach provides practical industrial value by distinguishing mineral-association-related selectivity limitations from conventional reagent or flowsheet limitations. Future optimisation should, therefore, focus on selectively treating particle size fractions or intermediate products enriched in sphalerite–pyrite-associated particles, so that sphalerite liberation can be improved while minimising unnecessary pyrite loss.
5. Conclusions
This industrial case study demonstrated that Zn contamination in the pyrite concentrate was mainly caused by sphalerite misreporting during pyrite flotation. The combined evidence from XRF, XRD, zinc phase analysis, reflected light microscopy, and MLA showed that Zn was mainly hosted in sphalerite and that sphalerite commonly occurred as attached, intergrown, or locked particles within pyrite and associated gangue minerals. These results indicate that sphalerite–pyrite association and incomplete sphalerite liberation were the key mineralogical constraints limiting selective sphalerite–pyrite separation.
Regrinding-assisted flotation reduced Zn misreporting to the pyrite concentrate, but this improvement was accompanied by a decrease in S recovery, indicating a trade-off between Zn rejection and pyrite recovery. Compared with flotation without regrinding under the same Na2SiO3 dosage, regrinding-assisted flotation reduced the Zn grade in the final concentrate from 0.29% to 0.14%, demonstrating its effectiveness in improving Zn rejection from a pyrite-rich concentrate. Based on the mineralogical evidence obtained before regrinding, this improvement is reasonably attributed to enhanced sphalerite liberation or detachment from sphalerite–pyrite-associated particles, although possible surface-related effects of short-duration regrinding cannot be fully excluded.
The novelty of this work lies in linking plant-scale Zn contamination with detailed process mineralogical diagnosis and using this diagnosis to guide a regrinding-assisted flotation strategy for impurity control. This provides a practical example of how process mineralogy can be used to identify the origins of impurity misreporting and guide targeted flowsheet improvement. From an industrial perspective, the findings highlight the value of mineralogy-guided impurity control in pyrite concentrate production, especially when conventional reagent adjustment and cleaning flotation are limited by mineral association and incomplete liberation. Because post-regrinding MLA and liberation data were not obtained, the liberation improvement should be regarded as a plausible interpretation rather than a directly demonstrated mechanism. Future optimisation should, therefore, focus on size-selective or mineralogy-guided regrinding strategies to reduce sphalerite misreporting while minimising unnecessary pyrite loss.
Author Contributions
Conceptualization, S.L., X.Y. (Xiaoxia Yang) and Y.W.; methodology, Y.W.; software, S.C.; formal analysis, S.C. and X.Y. (Xiang Yao); investigation, S.L., X.Y. (Xiaoxia Yang); resources, Y.W.; data curation, F.W., K.Z. and X.Z.; writing—original draft preparation, S.L. and L.N.; writing—review and editing, X.Y. (Xiaoxia Yang); supervision, Y.W.; project administration, Y.W.; funding acquisition, S.L., Y.W. and X.Y. (Xiaoxia Yang). All authors have read and agreed to the published version of the manuscript.
Funding
This research was funded by Luoyang Youxin Environmental Protection Technology Co., Ltd.; the Fundamental Research Program of Shanxi Province, grant number 202303021212229; and the Undergraduate Innovation and Entrepreneurship Training Program at Taiyuan University of Science and Technology, grant number DCX2025149; and the Research Project Supported by Shanxi Scholarship Council of China, grant number 2024-054. The APC was funded by Taiyuan University of Technology.
Data Availability Statement
The data supporting the findings of this study are available from the corresponding author upon reasonable request. Some industrial data are not publicly available due to confidentiality agreements with the collaborating company.
Acknowledgments
The authors thank Luoyang Youxin Environmental Protection Technology Co., Ltd. for providing industrial samples, production data, and technical support. The authors also thank the plant engineers for their assistance in sample collection and industrial data interpretation.
Conflicts of Interest
This research was conducted as an industry-sponsored project to investigate and mitigate Zn contamination in pyrite concentrate from plant operation. Luoyang Youxin Environmental Protection Technology Co., Ltd. provided financial support, industrial samples, and production background information. The experimental work, data analysis, interpretation of results, and manuscript preparation were conducted independently by the authors. The authors declare no other commercial or financial relationships that could be construed as potential conflicts of interest.
References
- Bulayani, M.M.; Raghupatruni, P.; Mamvura, T.; Danha, G. Exploring Low-Grade Iron Ore Beneficiation Techniques: A Comprehensive Review. Minerals 2024, 14, 796. [Google Scholar] [CrossRef]
- Özcan, Ö.; Aghlmandı Harzanagh, A.; Orhan, E.C.; Ergün, Ş.L. Beneficiation and flowsheet development of a low grade iron ore: A case study. Bull. Miner. Res. Explor. 2021, 165, 235–251. [Google Scholar] [CrossRef]
- Hu, X.; Zhu, Y.; Song, Z.; Chen, K. Beneficiation process reengineering under the background of green development-- take the full utilization of a low-grade lead-zinc ore as an example. J. Phys. Conf. Ser. 2024, 2738, 012006. [Google Scholar] [CrossRef]
- Nunna, V.; Suthers, S.P.; Pownceby, M.I.; Sparrow, G.J. Beneficiation Strategies for Removal of Silica and Alumina from Low-Grade Hematite-Goethite Iron Ores. Miner. Process. Extr. Metall. Rev. 2022, 43, 1049–1067. [Google Scholar] [CrossRef]
- Bragagnolo, L.; Prietto, P.D.M.; Korf, E.P. Compositional properties and geotechnical behavior of mining tailings: A review. Int. J. Environ. Sci. Technol. 2025, 22, 6305–6318. [Google Scholar] [CrossRef]
- Keskin, T.; Yilmaz, E.; Sari, M.; Kasap, T.; Cao, S. Reuse and valorization practices of mine tailings: A review of existing perspectives and advances. Clean Technol. Environ. Policy 2026, 28, 103. [Google Scholar] [CrossRef]
- Golik, V.I.; Klyuev, R.V.; Martyushev, N.V.; Zyukin, D.A.; Karlina, A.I. Prospects for Return of Valuable Components Lost in Tailings of Light Metals Ore Processing. Metallurgist 2023, 67, 96–103. [Google Scholar] [CrossRef]
- Kursunoglu, S. A Review on the Recovery of Critical Metals from Mine and Mineral Processing Tailings: Recent Advances. J. Sustain. Metall. 2025, 11, 2023–2050. [Google Scholar] [CrossRef]
- Czerewko Mourice, A.; Cripps John, C. Implications of sulfur mineralogy and consequences of pyrite oxidation for ground engineering. J. Geol. Soc. 2023, 180, jgs2022–jgs2101. [Google Scholar] [CrossRef]
- Yang, X.; Mu, Y.; Peng, Y. Comparing lead and copper activation on pyrite with different degrees of surface oxidation. Miner. Eng. 2021, 168, 106926. [Google Scholar] [CrossRef]
- Xu, S.; Zanin, M.; Skinner, W.; Brito e Abreu, S. Surface chemistry of oxidised pyrite during grinding: EDTA extraction analysis. Miner. Eng. 2021, 160, 106683. [Google Scholar] [CrossRef]
- Zhao, Z.; Chen, Y.; Wu, D. Reactive oxidative species generation in pyrite abiotic-oxidation process: Origins, influencing factors, applications for environmental remediation. Crit. Rev. Environ. Sci. Technol. 2025, 55, 397–421. [Google Scholar] [CrossRef]
- Liu, L.; Guo, D.; Qiu, G.; Liu, C.; Ning, Z. Photooxidation of Fe(II) to schwertmannite promotes As(III) oxidation and immobilization on pyrite under acidic conditions. J. Environ. Manag. 2022, 317, 115425. [Google Scholar] [CrossRef] [PubMed]
- Liao, R.; Yang, B.; Huang, X.; Hong, M.; Yu, S.; Liu, S.; Wang, J.; Qiu, G. Combined effect of silver ion and pyrite on AMD formation generated by chalcopyrite bio-dissolution. Chemosphere 2021, 279, 130516. [Google Scholar] [CrossRef] [PubMed]
- Bowker, L.N.; Chambers, D.M. The risk, public liability, & economics of tailings storage facility failures. Earthwork Act 2015, 24, 1–56. [Google Scholar]
- McDougall, H. Effective Processing and Analysis of Pyrite Concentrate for Industrial Application. Master’s Thesis, University of New South Wales, Kensington, Australia, 2022. [Google Scholar]
- León, R.; Macías, F.; Cánovas, C.R.; Pérez-López, R.; Ayora, C.; Nieto, J.M.; Olías, M. Mine waters as a secondary source of rare earth elements worldwide: The case of the Iberian Pyrite Belt. J. Geochem. Explor. 2021, 224, 106742. [Google Scholar] [CrossRef]
- Kaur, G.; Kaur, M.; Thakur, A.; Kumar, A. Recent progress on pyrite FeS2 nanomaterials for energy and environment applications: Synthesis, properties and future prospects. J. Clust. Sci. 2020, 31, 899–937. [Google Scholar]
- Zaka, A.; Alhassan, S.M.; Nayfeh, A. Iron pyrite in photovoltaics: A review on recent trends and challenges. ACS Appl. Electron. Mater. 2022, 4, 4173–4211. [Google Scholar] [CrossRef]
- Hong, Q.; Zhang, X.; Zhu, R.; Wang, C.; Mei, J.; Yang, S. Resource utilization of natural pyrite (FeS2) as the tailings after flotation of natural sphalerite (ZnS) for reclaiming high concentrations of gaseous Hg0 from Zn smelting flue gas. Chem. Eng. J. 2022, 427, 131644. [Google Scholar] [CrossRef]
- Chowdhury, M.O.; Talan, D. From Waste to Wealth: A Circular Economy Approach to the Sustainable Recovery of Rare Earth Elements and Battery Metals from Mine Tailings. Separations 2025, 12, 52. [Google Scholar] [CrossRef]
- Hu, G.; Dam-Johansen, K.; Wedel, S.; Hansen, J.P. Decomposition and oxidation of pyrite. Prog. Energy Combust. Sci. 2006, 32, 295–314. [Google Scholar] [CrossRef]
- Lin, Z.; Quvarfort, U. Predicting the mobility of Zn, Fe, Cu, Pb, Cd from roasted sulfide (pyrite) residues—A case study of wastes from the sulfuric acid industry in Sweden. Waste Manag. 1996, 16, 671–681. [Google Scholar] [CrossRef]
- Zhang, S.; Wang, S.; Pi, K.; Zhang, H.; Yang, X.; Gerson, A.R. Current understanding and challenges for the utilisation of pyrite for environmental remediation: A review. Environ. Technol. Rev. 2024, 13, 461–477. [Google Scholar] [CrossRef]
- Yang, T.; Liao, Y.; Wang, M.; Zheng, Z.; Yao, M. Remediation and resource utilization of petroleum-contaminated soil by pyrite-assisted pyrolysis as bifunctional materials to adsorb heavy metal and activate peroxymonosulfate oxidation. Sci. Total Environ. 2023, 892, 164742. [Google Scholar] [CrossRef] [PubMed]
- Feng, L.; Zhang, Y.; Yang, J.; Guo, Z.; Zhang, J.; Wu, H. Applying biochar coupled with pyrite substrates simultaneously enhanced nutrient and heavy metal removal in constructed wetland: Performance and mechanism. Chem. Eng. J. 2024, 488, 150868. [Google Scholar] [CrossRef]
- Yang, C.; Chen, Y.; Peng, P.a.; Li, C.; Chang, X.; Wu, Y. Trace element transformations and partitioning during the roasting of pyrite ores in the sulfuric acid industry. J. Hazard. Mater. 2009, 167, 835–845. [Google Scholar] [CrossRef] [PubMed]
- Hiji, M. Investigation of Chemical Kinetics of Pyrite Ore Roasting for Production of Sulphuric Acid. Ph.D. Thesis, University of Dodoma, Dodoma, Tanzania, 2019. [Google Scholar]
- Pollmann, O.; Meyer, S.; Blumenstein, O.; van Rensburg, L. Mine Tailings: Waste or Valuable Resource? Waste Biomass Valorization 2010, 1, 451–459. [Google Scholar] [CrossRef]
- Falagán, C.; Grail, B.M.; Johnson, D.B. New approaches for extracting and recovering metals from mine tailings. Miner. Eng. 2017, 106, 71–78. [Google Scholar] [CrossRef]
- Sun, W.; Ji, B.; Khoso, S.A.; Tang, H.; Liu, R.; Wang, L.; Hu, Y. An extensive review on restoration technologies for mining tailings. Environ. Sci. Pollut. Res. 2018, 25, 33911–33925. [Google Scholar] [CrossRef] [PubMed]
- Lin, Z. Mineralogical and chemical characterization of wastes from the sulfuric acid industry in Falun, Sweden. Environ. Geol. 1997, 30, 152–162. [Google Scholar] [CrossRef]
- Lotter, N.O.; Whiteman, E.; Bradshaw, D.J. Modern practice of laboratory flotation testing for flowsheet development—A review. Miner. Eng. 2014, 66–68, 2–12. [Google Scholar] [CrossRef]
- Lotter, N.O. Modern Process Mineralogy: An integrated multi-disciplined approach to flowsheeting. Miner. Eng. 2011, 24, 1229–1237. [Google Scholar] [CrossRef]
Figure 1.
Particle size distributions of the FOS and the PCS.
Figure 1.
Particle size distributions of the FOS and the PCS.
Figure 2.
Schematic flowsheet of the batch flotation experiments for sphalerite–pyrite separation through reagent adjustment (C and T denote the floated pyrite concentrate and flotation tailings, respectively).
Figure 2.
Schematic flowsheet of the batch flotation experiments for sphalerite–pyrite separation through reagent adjustment (C and T denote the floated pyrite concentrate and flotation tailings, respectively).
Figure 3.
Schematic flowsheet of the batch flotation experiments for sphalerite–pyrite separation through flowsheet adjustment: (a) one rougher; (b) one rougher plus one cleaner; (c) one rougher plus two cleaners; and (d) one rougher plus three cleaners. (C, M, and T denote the floated pyrite concentrate, flotation middlings, and flotation tailings, respectively.)
Figure 3.
Schematic flowsheet of the batch flotation experiments for sphalerite–pyrite separation through flowsheet adjustment: (a) one rougher; (b) one rougher plus one cleaner; (c) one rougher plus two cleaners; and (d) one rougher plus three cleaners. (C, M, and T denote the floated pyrite concentrate, flotation middlings, and flotation tailings, respectively.)
Figure 4.
Schematic flowsheet of regrinding-assisted flotation for sphalerite–pyrite separation.
Figure 4.
Schematic flowsheet of regrinding-assisted flotation for sphalerite–pyrite separation.
Figure 5.
XRD analysis of the FOS and the PCS.
Figure 5.
XRD analysis of the FOS and the PCS.
Figure 6.
Distribution of zinc occurrence forms in the FOS.
Figure 6.
Distribution of zinc occurrence forms in the FOS.
Figure 7.
Zn, S, and Fe recovery of the floated pyrite under different reagent conditions (Zn recovery mainly reflects sphalerite reporting to C, while S and Fe recoveries are used as indicators of the recovery of pyrite in C).
Figure 7.
Zn, S, and Fe recovery of the floated pyrite under different reagent conditions (Zn recovery mainly reflects sphalerite reporting to C, while S and Fe recoveries are used as indicators of the recovery of pyrite in C).
Figure 8.
Zn, S, and Fe recovery of C under different flowsheet configurations (Zn recovery mainly reflects sphalerite reporting to C, while S and Fe recoveries are used as indicators of the recovery of pyrite in C).
Figure 8.
Zn, S, and Fe recovery of C under different flowsheet configurations (Zn recovery mainly reflects sphalerite reporting to C, while S and Fe recoveries are used as indicators of the recovery of pyrite in C).
Figure 9.
Association characteristics of pyrite particles in the +38 μm fraction of the PCS.
Figure 9.
Association characteristics of pyrite particles in the +38 μm fraction of the PCS.
Figure 10.
Association characteristics of pyrite particles in the −38 μm fraction of the PCS.
Figure 10.
Association characteristics of pyrite particles in the −38 μm fraction of the PCS.
Figure 11.
Enlarged MLA map image of the selected area in
Figure 9, showing local association between pyrite particles and sphalerite particles in the +38 μm fraction of the PCS.
Figure 11.
Enlarged MLA map image of the selected area in
Figure 9, showing local association between pyrite particles and sphalerite particles in the +38 μm fraction of the PCS.
Figure 12.
Association characteristics of sphalerite particles in the +38 μm fraction of the PCS.
Figure 12.
Association characteristics of sphalerite particles in the +38 μm fraction of the PCS.
Figure 13.
Association characteristics of sphalerite particles in the −38 μm fraction of the PCS.
Figure 13.
Association characteristics of sphalerite particles in the −38 μm fraction of the PCS.
Figure 14.
Enlarged MLA map image of the selected area in
Figure 12, showing local association between sphalerite particles and pyrite particles in the +38 μm fraction of the PCS.
Figure 14.
Enlarged MLA map image of the selected area in
Figure 12, showing local association between sphalerite particles and pyrite particles in the +38 μm fraction of the PCS.
Figure 15.
Reflected light microscopy images showing sphalerite–pyrite association and intergrowth textures in the PCS: (a) sphalerite attached to pyrite; (b) sphalerite intergrown with pyrite; (c) sphalerite occurring along pyrite margins or fractures; and (d) sphalerite locked with or attached to pyrite particles.
Figure 15.
Reflected light microscopy images showing sphalerite–pyrite association and intergrowth textures in the PCS: (a) sphalerite attached to pyrite; (b) sphalerite intergrown with pyrite; (c) sphalerite occurring along pyrite margins or fractures; and (d) sphalerite locked with or attached to pyrite particles.
Table 1.
Elemental compositions of the FOS and the PCS determined by XRF.
Table 1.
Elemental compositions of the FOS and the PCS determined by XRF.
| Elements | Concentrate/% | Feed Ore/% |
|---|
| Fe | 38.723 | 8.654 |
| S | 29.581 | 1.932 |
| Zn | 0.496 | 0.026 |
| Si | 2.892 | 19.577 |
| Ca | 3.985 | 16.496 |
| O | 22.187 | 45.629 |
| Mg | 0.58 | 1.66 |
| Al | 0.56 | 3.051 |
| Na | 0.162 | 1.467 |
| Other trace elements | 0.835 | 1.509 |
Table 2.
Zn, S, and Fe recovery and Zn grade in C under different reagent conditions.
Table 2.
Zn, S, and Fe recovery and Zn grade in C under different reagent conditions.
| Test No. | Flotation Reagent Condition | Zn Grade (%) in the Floated Pyrite | Zn Recovery (%) in the Floated Pyrite | S Recovery (%) in the Floated Pyrite | Fe Recovery (%) in the Floated Pyrite |
|---|
| 1 | CuSO4 1000 g/t | 0.39 | 74.82 | 76.13 | 76.54 |
| 2 | CuSO4 1500 g/t | 0.41 | 79.19 | 77.26 | 81.56 |
| 3 | CuSO4 2000 g/t | 0.36 | 72.36 | 67.63 | 69.13 |
| 4 | Na2SiO3 600 g/t + CuSO4 300 g/t | 0.26 | 45.38 | 34.50 | 33.13 |
| 5 | Na2SiO3 900 g/t + CuSO4 300 g/t | 0.21 | 39.51 | 37.45 | 35.94 |
Table 3.
Zn, S, and Fe recovery and Zn grade in C under different flowsheet configurations.
Table 3.
Zn, S, and Fe recovery and Zn grade in C under different flowsheet configurations.
| Test No. | Flotation Flowsheet Configuration | Zn Grade (%) in the Floated Pyrite | Zn Recovery (%) in the Floated Pyrite | S Recovery (%) in the Floated Pyrite | Fe Recovery (%) in the Floated Pyrite |
|---|
| 1 | One rougher | 0.41 | 32.87 | 31.59 | 45.86 |
| 2 | One rougher + one cleaner | 0.34 | 30.41 | 38.15 | 41.87 |
| 3 | One rougher + two cleaners | 0.24 | 16.21 | 42.35 | 43.95 |
| 4 | One rougher + three cleaners | 0.23 | 8.93 | 32.54 | 34.12 |
Table 4.
Major mineral composition of the PCS determined by MLA.
Table 4.
Major mineral composition of the PCS determined by MLA.
| Minerals | Content/% (+38 μm Fraction) | Content/% (−38 μm Fraction) |
|---|
| Pyrite | 82.208 | 77.914 |
| Sphalerite | 0.439 | 0.026 |
| Ca–Al/Ca–Fe garnet | 5.108 | 12.169 |
| Pyroxene | 3.543 | 3.647 |
| Molybdenite | 3.814 | 0.058 |
| Quartz and other gangue/minor minerals | 4.888 | 6.186 |
| Total | 100.000 | 100.000 |
Table 5.
Fe deportment in different mineral phases and size fractions of the PCS.
Table 5.
Fe deportment in different mineral phases and size fractions of the PCS.
| Mineral Phase | Fe/% (+38 μm) | Fe/% (−38 μm) |
|---|
| Pyrite | 96.64 | 94.04 |
| Ca–Al/Ca–Fe garnet | 1.20 | 2.79 |
| Iron oxides | 0.28 | 1.69 |
| Pyroxene | 0.96 | 0.79 |
| Olivine | 0.52 | 0.33 |
| Mica/chlorite aluminosilicates | 0.22 | 0.20 |
| Chromite | 0.00 | 0.15 |
| Sphalerite | 0.08 | 0.00 |
| Chalcopyrite | 0.06 | 0.00 |
| Ilmenite | 0.03 | 0.01 |
| Total | 100.00 | 100.00 |
Table 6.
Zn deportment in different mineral phases and size fractions of the PCS.
Table 6.
Zn deportment in different mineral phases and size fractions of the PCS.
| Mineral Phase | Zn/% (+38 μm) | Zn/% (−38 μm) |
|---|
| Sphalerite | 100.00 | 100.00 |
| Total | 100.00 | 100.00 |
Table 7.
Particle size distributions of pyrite and sphalerite across different particle size fractions of the PCS.
Table 7.
Particle size distributions of pyrite and sphalerite across different particle size fractions of the PCS.
| Size Fraction (μm) | Pyrite | Sphalerite |
|---|
+38 μm
Distribution/% | +38 μm
Cumulative/% | −38 μm
Distribution/% | −38 μm
Cumulative/% | +38 μm
Distribution/% | +38 μm
Cumulative/% | −38 μm
Distribution/% | −38 μm
Cumulative/% |
|---|
| <10 | 0.12 | 0.12 | 9.68 | 0.12 | 0.00 | 0.00 | 23.75 | 23.75 |
| 10–25 | 2.43 | 2.55 | 45.22 | 54.90 | 0.44 | 0.44 | 6.02 | 29.77 |
| 25–38 | 4.85 | 7.40 | 30.80 | 85.70 | 0.09 | 0.53 | 70.23 | 100.00 |
| 38–53 | 14.11 | 21.51 | 12.97 | 98.67 | 6.43 | 6.96 | - | - |
| 53–75 | 24.60 | 46.11 | 1.33 | 100.00 | 8.22 | 15.18 | - | - |
| 75–106 | 29.99 | 76.10 | - | - | 9.51 | 24.69 | - | - |
| 106–150 | 18.62 | 94.72 | - | - | 38.49 | 63.18 | - | - |
| 150–212 | 4.69 | 99.41 | - | - | 36.60 | 99.78 | - | - |
| 212–500 | 0.59 | 100.00 | - | - | 0.21 | 100.00 | - | - |
| Total | 100.00 | - | 100.00 | - | 100.00 | - | 100.00 | - |
Table 8.
Distribution of Fe and Zn in the +38 μm and −38 μm size fractions.
Table 8.
Distribution of Fe and Zn in the +38 μm and −38 μm size fractions.
| Element | Content/% (+38 μm) | Content/% (−38 μm) |
|---|
| Fe | 35.35 | 64.65 |
| Zn | 89.77 | 10.23 |
Table 9.
Key liberation indicators of pyrite and sphalerite in different size fractions.
Table 9.
Key liberation indicators of pyrite and sphalerite in different size fractions.
| Mineral Phase | Size Fraction | Liberated (%) | Liberated + Highly Liberated (%) | Liberation Level |
|---|
| Pyrite | +38 μm | 79.35 | 93.10 | Well |
| Pyrite | −38 μm | 92.41 | 96.83 | Highly |
| Sphalerite | +38 μm | 57.30 | 69.48 | Poorly |
| Sphalerite | −38 μm | 68.90 | 68.90 | Incompletely |
Table 10.
Effect of regrinding-assisted flotation on sphalerite–pyrite separation.
Table 10.
Effect of regrinding-assisted flotation on sphalerite–pyrite separation.
| Condition | Products | Yield (%) | Grade (%) | Recovery (%) |
|---|
| Zn | Fe | S | Zn | Fe | S |
|---|
Regrinding for 1.5 min;
Na2SiO3 500 g/t | C | 35.58 | 0.14 | 43.79 | 42.53 | 12.21 | 37.89 | 41.47 |
| M | 14.45 | 0.24 | 45.59 | 39.72 | 8.16 | 16.02 | 15.72 |
| T | 49.97 | 0.63 | 37.93 | 31.26 | 79.63 | 46.09 | 42.81 |
| Total | 100.00 | 0.40 | 41.12 | 36.49 | 100.00 | 100.00 | 100.00 |
| Without regrinding; Na2SiO3 500 g/t | C | 51.11 | 0.29 | 42.87 | 38.59 | 29.97 | 53.93 | 55.96 |
| M | 16.80 | 0.32 | 45.74 | 37.69 | 11.35 | 18.91 | 17.96 |
| T | 32.09 | 0.70 | 34.38 | 28.64 | 58.68 | 27.16 | 26.08 |
| Total | 100.00 | 0.43 | 40.63 | 35.25 | 100.00 | 100.00 | 100.00 |
| Disclaimer/Publisher’s Note: The statements, opinions and data contained in all publications are solely those of the individual author(s) and contributor(s) and not of MDPI and/or the editor(s). MDPI and/or the editor(s) disclaim responsibility for any injury to people or property resulting from any ideas, methods, instructions or products referred to in the content. |




 ,
,