


Abstract
Palygorskite exhibits a complex surface chemistry resulting from its fibrous morphology, modulated ribbon structure, and coexistence of silanol- and octahedral-derived reactive sites. Despite its industrial and environmental relevance, previous studies report contradictory point-of-zero-charge values and inconsistent surface speciation models. In this work, the surface chemistry of a natural Mg-rich palygorskite from Senegal was investigated through mineralogical and crystallochemical characterization combined with potentiometric titrations performed at ionic strengths of 0.1, 0.01, and 0.001 M KCl. X-ray diffraction, scanning electron microscopy, BET and total surface area measurements, and TEM-EDX analyses indicate that the sample corresponds to a Type III magnesian palygorskite. Surface titration data were interpreted using a non-electrostatic surface complexation model implemented in PHREEQC. The results show that palygorskite surface charge is controlled by both permanent exchange charge and pH-dependent edge reactions. Three main reactive surface groups were identified from crystallographic and geochemical constraints: silanol (>SiOH), aluminol bridge sites associated with octahedral Al (>Al-O-Si), and Mg-coordinated edge water groups (>MgOH2). The point of zero net proton charge ranges from pH 8.19 to 8.30. The proposed model provides a crystallographically consistent description of palygorskite surface reactivity in aqueous systems.
1. Introduction
Palygorskite, also known as attapulgite, is a naturally occurring hydrated magnesium-aluminum silicate clay mineral. Together with sepiolite, it constitutes a group of silicates with particular characteristics in terms of structure, habit, and physico-chemical properties. Traditionally, they are included in the phyllosilicate group, although their structure also shows some affinities with chain silicates and modulated silicates [1]. Their peculiar structure and crystal chemistry have been studied by analogy with the other phyllosilicates. Furthermore, their deposits and geological environments of formation, particle size, and uses and applications are closer to those of clay minerals than to typical chain silicates.
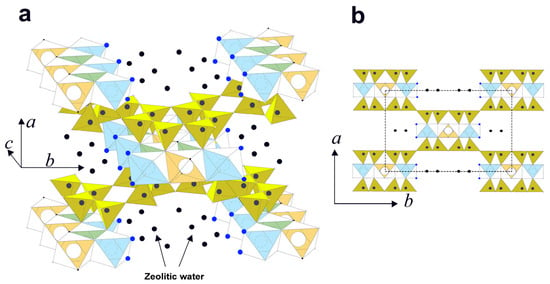
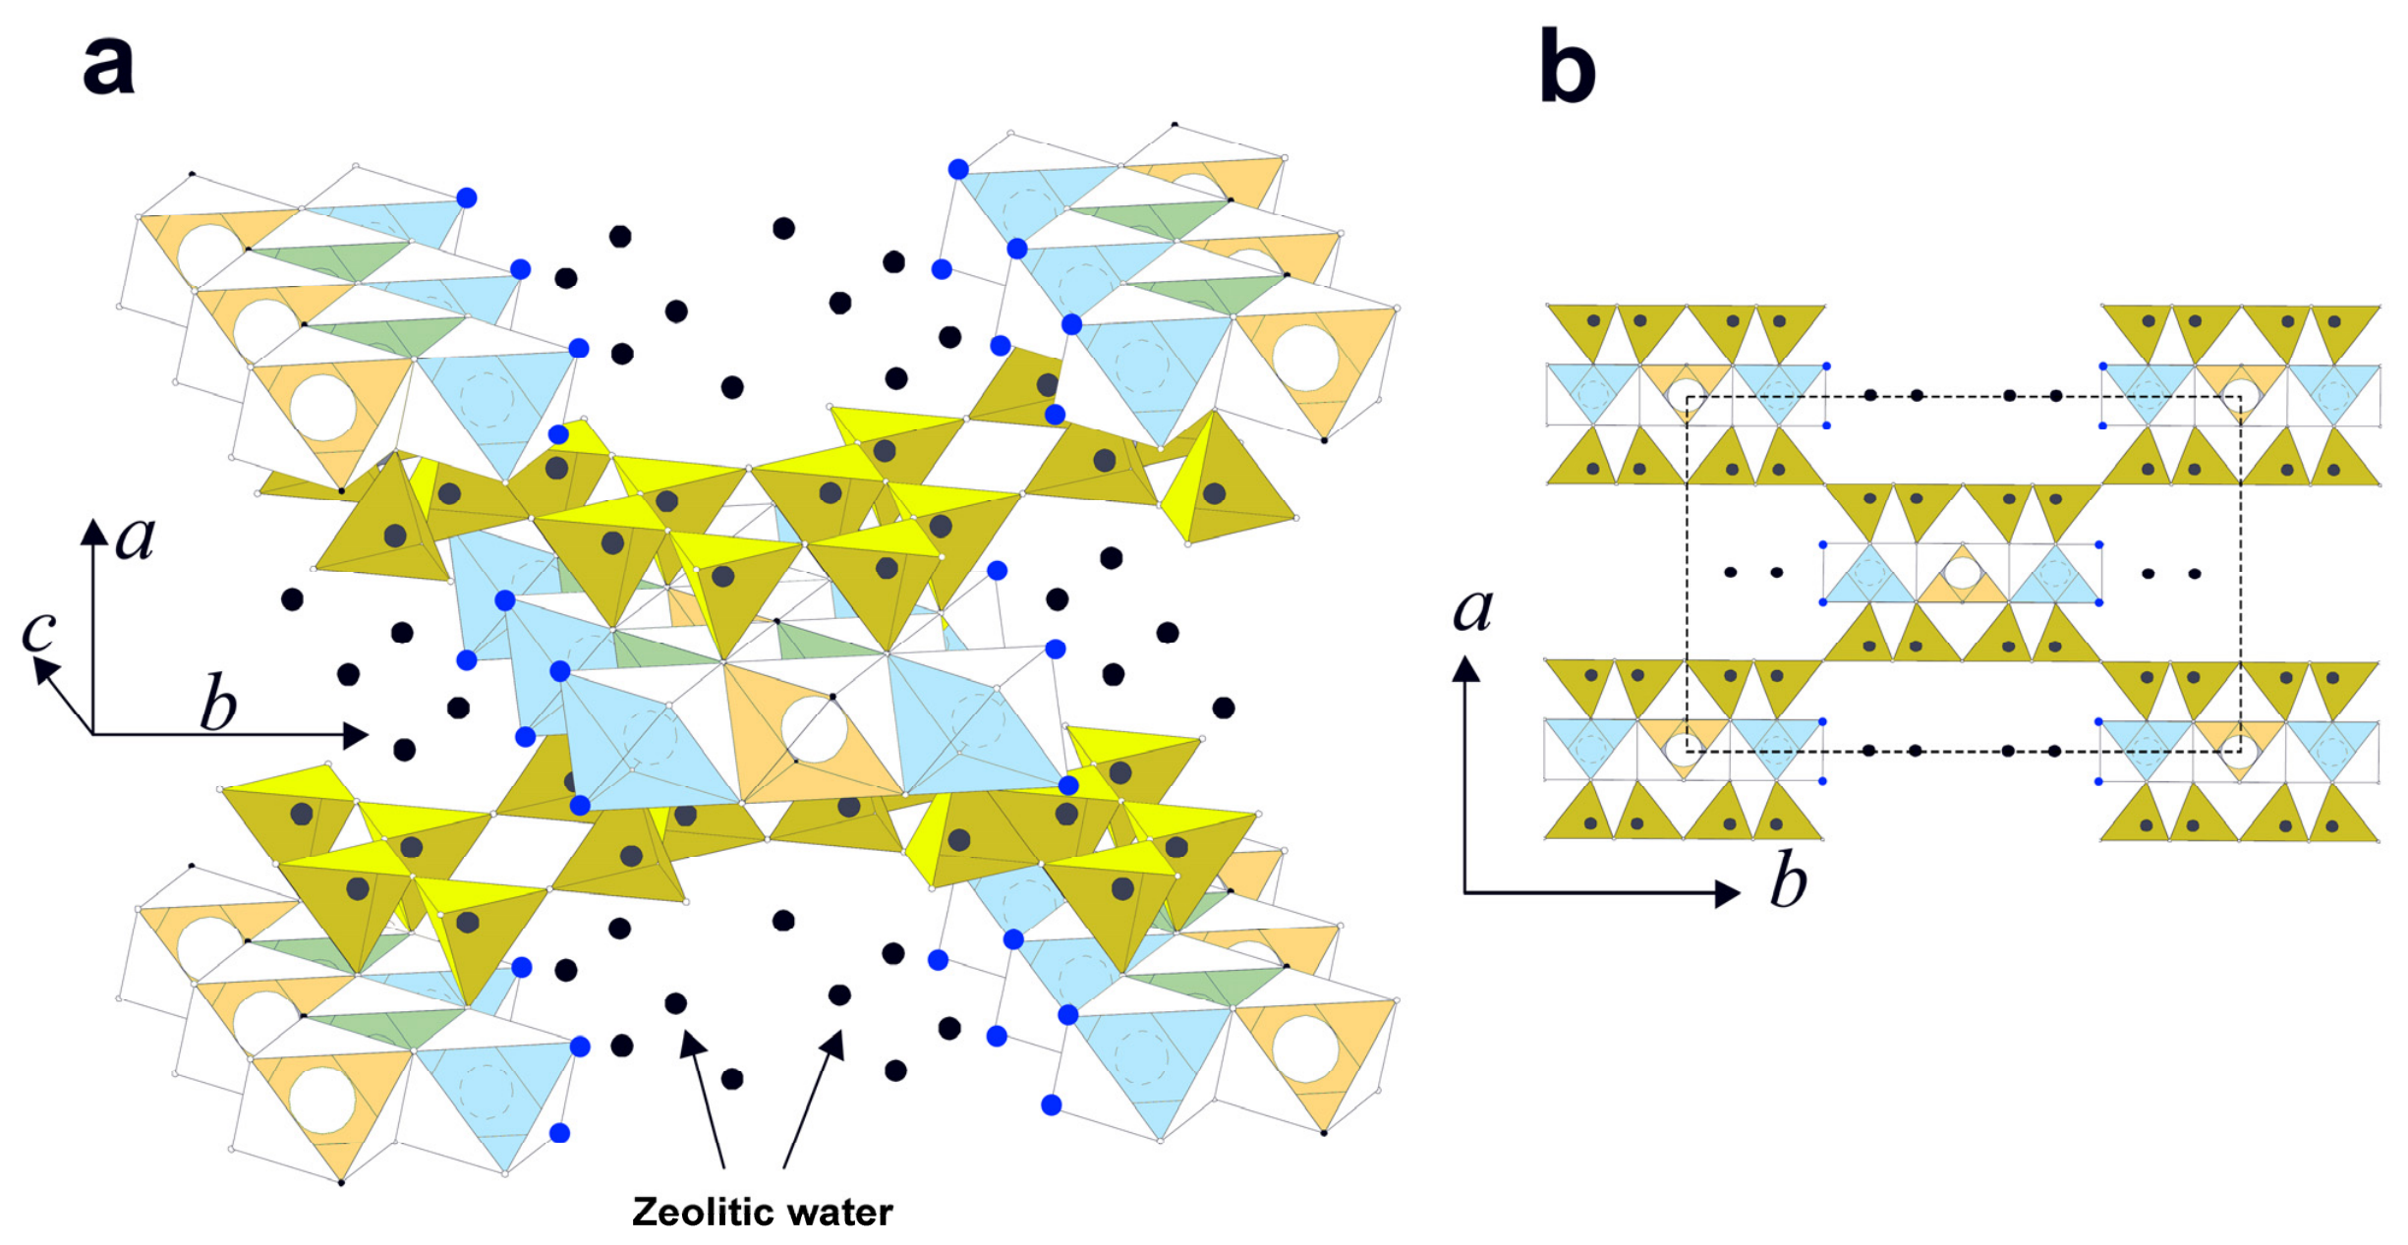
The ideal structure of palygorskite (Figure 1), like other 2:1 phyllosilicates, consists of an infinitely extended tetrahedral sheet involving six-fold rings of tetrahedra. The basal oxygen atoms form a continuous plane; however, unlike the ideal phyllosilicates, the apical oxygen atoms point out along either the [100] or the directions, that is, in opposing directions. Consequently, the apical oxygen atoms form a strip extended along the [001] direction, consisting of a sixfold tetrahedral ring (or two pyroxene-like chains). Strips with apices pointing in one direction are linked to Mg and Al cations to form a portion of the octahedral coordination. The remaining part of the coordination unit is completed by apical oxygen atoms from the opposing tetrahedral strip and two OH groups (or OH2). The octahedra do not form a continuous sheet, but a strip of five octahedra, which, combined with two adjacent strips of tetrahedra, form a polysome, resembling the 2:1 phyllosilicate layer. The modulated structure is formed by an inverted tetrahedra arrangement and the formation of nanochannels, in which the octahedral sheet becomes discontinuous (for an extended description, see, e.g., [2]).
Figure 1.
Palygorskite structure (modified from [3]). (a) Perspective view and (b) cross-section perpendicular to [001], where polysomes are clearly visible, and the unit cell is outlined by a dash-line square. Octahedral sites: green M1 (vacant), blue M2 (Al3+), and orange M3 (Mg2+). Dark blue spheres represent water molecules coordinated to octahedral sites at the edges and in channels, and black spheres represent zeolitic water within the channels.
Concerning the nature and occupancy of the octahedral positions, palygorskite can be considered dioctahedral. Al (Fe3+) atoms occupy the M2 positions, Mg occupies the most external M3, and M1 is vacant, with R2+/R3+ ~1.0 [4]. Tetrahedral substitutions of Al for Si are limited to 0.12–0.66 Al tetrahedral cations per 8 Si [5]. In palygorskite, the OH groups are part of the coordination of M1 (vacant) and M2 (Al) sites, and the OH2 groups are part of the coordination of M3 (Mg) sites along the edges of the octahedral strips. Zeolitic water and exchangeable cations may reside in the nanochannels.
The unusual crystal structure of this material is mainly responsible for its unique physicochemical properties, and important characteristics related to surface area, porosity, dehydration and high-temperature phases, and sorption active centers [6,7]. Particles usually exhibit a fibrous or needle-like morphology, 0.2–2.0 µm large and 50–300 Å in diameter, and contain nano-tunnels (3.7 Å × 6.4 Å) (see Figure 1). Total specific surface area, including channels, may reach 800–900 m2g−1, although the specific surface area obtained by nitrogen adsorption (BET) is 75–150 m2g−1 and corresponds to external surface and macropore porosity [8]. Unlike bentonites, for example, the channel surface allows the adsorption of nonpolar molecules. Owing to its high surface area with channels and low to moderate cation exchange capacity (10–50 cmol·kg−1 [8,9], palygorskite has a high capacity to adsorb and absorb cations and a variety of molecules, including nonpolar liquids.
At the atomic scale, polysome arrangements result in a fibrous habit and the existence of channels and tunnels, which give palygorskite a high internal and external surface area. The internal surface is associated with the channels and is dominated by Mg/Al octahedra, while the external surface corresponds to the crystal edges and is dominated by both Si tetrahedra and Mg/Al octahedra (see Figure 1). Palygorskite has three potential acid–base surface sites: tetrahedral Si, and octahedral Mg and Al. Palygorskite should also have cation-exchange sites arising from Mg substitution for octahedral Al or Al substitution for tetrahedral Si, resulting in a pH-independent negative charge.
Surface titrations are used to determine the surface chemistry of a mineral, helping to estimate the acid–base properties of its surface sites, which can be identified through crystal chemistry. The titration curves provide the point(s) of zero net proton charge (PZNPC) and the variation in the protons/hydroxyls adsorbed/desorbed with pH. Electric double-layer models and specific software (e.g., PHREEQC, FITEQL) were used to derive the surface charges and dissociation constants of the active sites. An alternative method for determining the point of zero total charge is to use the isoelectric point (IEP) from electrokinetic measurements, based on the electrophoretic mobility of a charged particle in an electric field.
There are only a few studies on palygorskite surface charge. The electrophoretic mobility of palygorskite in diluted electrolyte solutions suggested a point of zero charge (PZC) at pH 4–4.5 [10]. However, Frini-Srasra et al.’s [11] titrations reported a PZNPC of 8.4–9.4, and a negative surface from pH 3 to 11. The titrations were modeled using one or two surface sites that deprotonated only (basic sites). The study was extended to acid-activated palygorskite [12]; the surface was negative for the pH range 3–11, and they extended their model to include a new site that can adsorb protons. Rusmin et al. [13], on the other hand, reported a PZC of 9.5 and a positive surface charge from pH 3–11. In addition, titrations were performed on silanol- and aluminol-type surface sites.
The values for the point of zero charge varied by up to five pH units, and the signs of the surface charge along the titration curves were opposite in [11,13]. Based on the mineral structure, identifying reactive surface sites beyond silanol groups raises some doubts. The palygorskite fibers are crystals elongated along the [001] direction; therefore, the most exposed octahedral groups are >Mg-OH2 on the {010} edge faces, which were not considered in the cited studies. In contrast, only aluminol groups have been mentioned, in analogy to aluminum dioctahedral minerals such as kaolinite, montmorillonite or illite (e.g., [14,15,16,17,18]). The few available studies on palygorskite surface chemistry exhibit internal inconsistencies and discrepancies. In addition, the titrations and surface structure should be fully consistent.
These differences suggest that earlier models might not have completely captured the specific modulated structure of palygorskite, especially the significance of the channel and edge sites associated with octahedral cations. Unlike previous studies, the present work integrates crystallographic constraints, fiber morphology, and surface complexation modeling to identify reactive surface sites consistent with the modulated structure of palygorskite.
2. Materials and Methods
Palygorskite from Senegal was crushed, dried in an oven at 40 °C, and ground to a powder for characterization by X-ray fluorescence (XRF), X-ray diffraction (XRD), nitrogen adsorption for specific surface area, and scanning and transmission electron microscopy (SEM, TEM). The sample was ground with a mortar and pestle before analysis, and no other treatment was applied.
Chemical analysis was performed by XRF using a Bruker® S4 Pioneer spectrometer (Karlsruhe, Germany) operated at 60 kV and 150 mA, with LIF200, PET, an OVO55 lens, and a Rh anode X-ray tube. Elements (Si, Al, Ti, K, Mg, Fe, Na, Ca, Mn, and P) were measured in replicated samples prepared as fused beads using glass discs by fusing 0.9 g of sample in lithium tetraborate (Table 1). Analysis quality was monitored by measuring 25 different reference materials, with standard deviations of <0.3% for Si, <0.05% for Na, Mg, Al, and Fe, and <0.010% for K, Ca, and Ti. The reproducibility was higher than ±0.05%. The loss of ignition (LOI) was determined as the weight lost after 2 h at 1000 °C in a furnace.
Table 1.
Chemical composition of palygorskite obtained by XRF analysis. The major element concentrations and LOI are expressed as wt%.
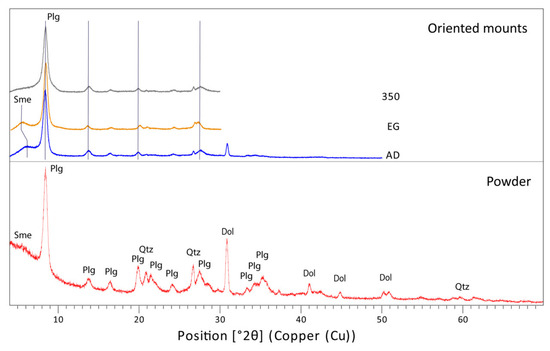
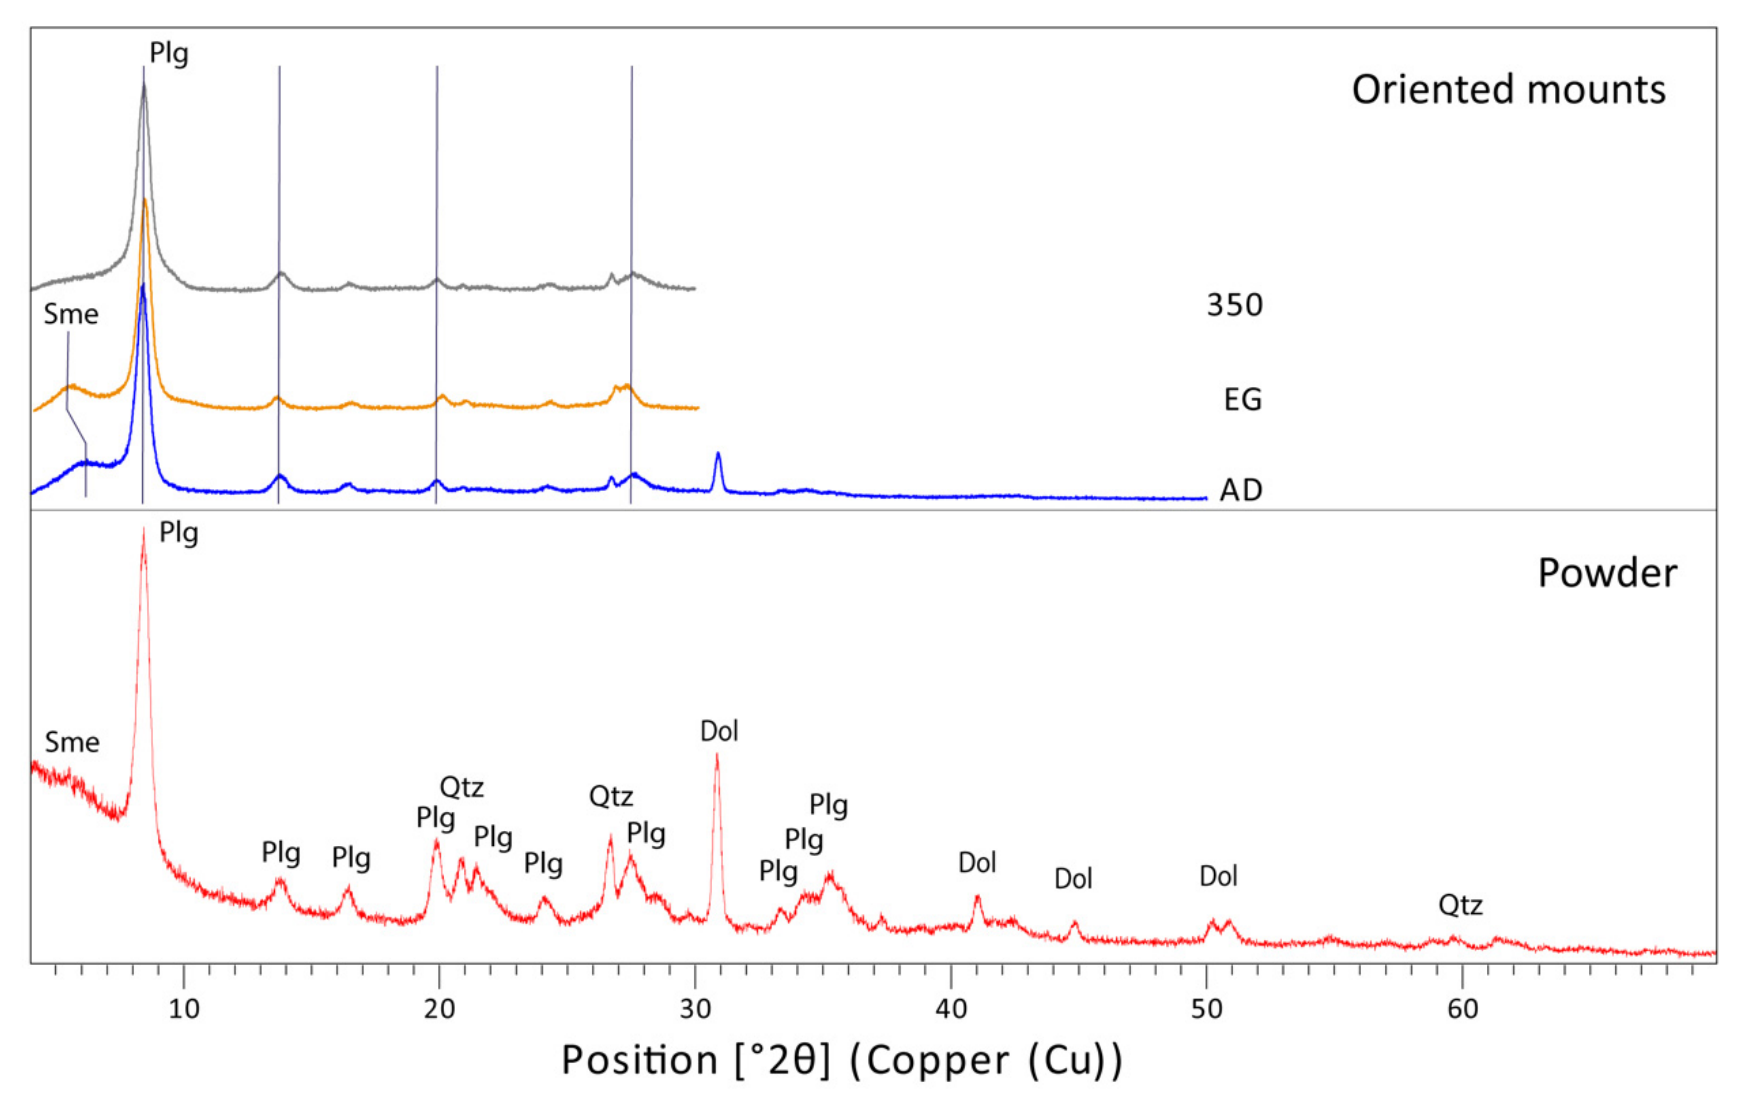
Mineralogical and crystallochemical analyses were performed on a PANalytical X’Pert Pro system (Almelo, The Netherlands), operated at 45 kV and 40 mA, equipped with an X’Celerator detector, Cu tube, Ni filter, and spinner platform. A monochromator was not used. The samples were prepared as random powders and oriented mounts. Powder samples were scanned in the 2θ range of 3° to 70° using a 0.25° divergence slit with a 0.5° anti-scatter slit. Oriented mounts were prepared by pipetting powder dispersions in deionized water (0.1 g in 5 mL) onto glass slides, and were continuously scanned in the 2θ range from 3° to 40°, using a 0.125° divergence slit, with a 0.25° antiscatter slit, in air-dried (AD), ethylene glycol-solvated (EG), and heated (sequentially, 350 °C for 1 h, then 550 °C for 2 h) conditions. Ethylene glycol solvation was performed in a desiccator in an oven at 60 °C for 4 h. Heating treatments were performed in a furnace at a fixed temperature. The XRD pattern is shown in Figure 2. According to the JCPCD database, the major mineral phases identified were palygorskite, dolomite, and quartz. In addition, a very weak band at 15–12 Å in powder and air-dried oriented mounts was observed that expanded to 16.5 Å in ethylene glycol-solvated mounts, indicating the presence of trace amounts of smectite. The mineralogical composition was calculated using the RIR (relative intensity ratio) method in HighScore+ software, constrained by the chemical composition derived from the XRF analysis. Palygorskite is the major mineral (85%), accompanied by dolomite (11%), quartz (3%), and smectite in trace amounts (<1%).
Figure 2.
XRD pattern of the palygorskite sample, in powder and oriented mounts (air-dried, ethylene glycol-solvated, and heated at 350 °C). The weak band of smectite (Sme) observed in powder is confirmed in AD (14.5 Å), which shifts to 16.2 Å in EG, and collapses after heating. Plg, palygorskite; Qtz, quartz; Dol, dolomite.
The external specific surface area was measured using a Bechman-Coulter SA3100, (Brea, CA, USA) using the Brunauer–Emmett–Teller (BET) method [19], which involves 5-point N2 adsorption isotherms, after degassing the sample with nitrogen for 2 h at 137 °C. The measurement was repeated twice, yielding values of 92 and 99 m2g−1, with a 10% uncertainty. Total specific surface area was calculated from water adsorption using the hygroscopicity method [20]. The palygorskite sample was heated at 110 °C overnight and then placed in a desiccator with an atmosphere at a relative humidity of 72% (NaCl-saturated solution at 22 °C). The test yielded 342 ± 4 m2g−1.
Particle morphology was studied by scanning electron microscopy (SEM) (CIC—University of Granada) using a Field Emission SEM (FESEM, Zeiss Supra 40, Oberkochen, Germany) equipped with an Energy-Dispersive X-ray Spectrometer (EDX) with a 50 mm X-Max detector. The samples were mounted on an aluminum stub (20 mm in diameter) coated with carbon sticky tape. The powder was directly deposited onto a carbon strip. To observe the single fiber bundles, the sample was dispersed in deionized water and filtered through a 0.22 µm filter. A small portion of the filter was attached to an aluminum stub. Prior to observation, the samples were coated with carbon. SEM observations were conducted under high-vacuum conditions and used a secondary electron (SE) detector. The SEM operating conditions were set to an accelerating voltage of 5–15 kV, a working distance of 2–8 mm, and an aperture size of 20–30 μm.
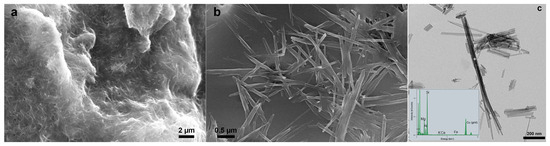
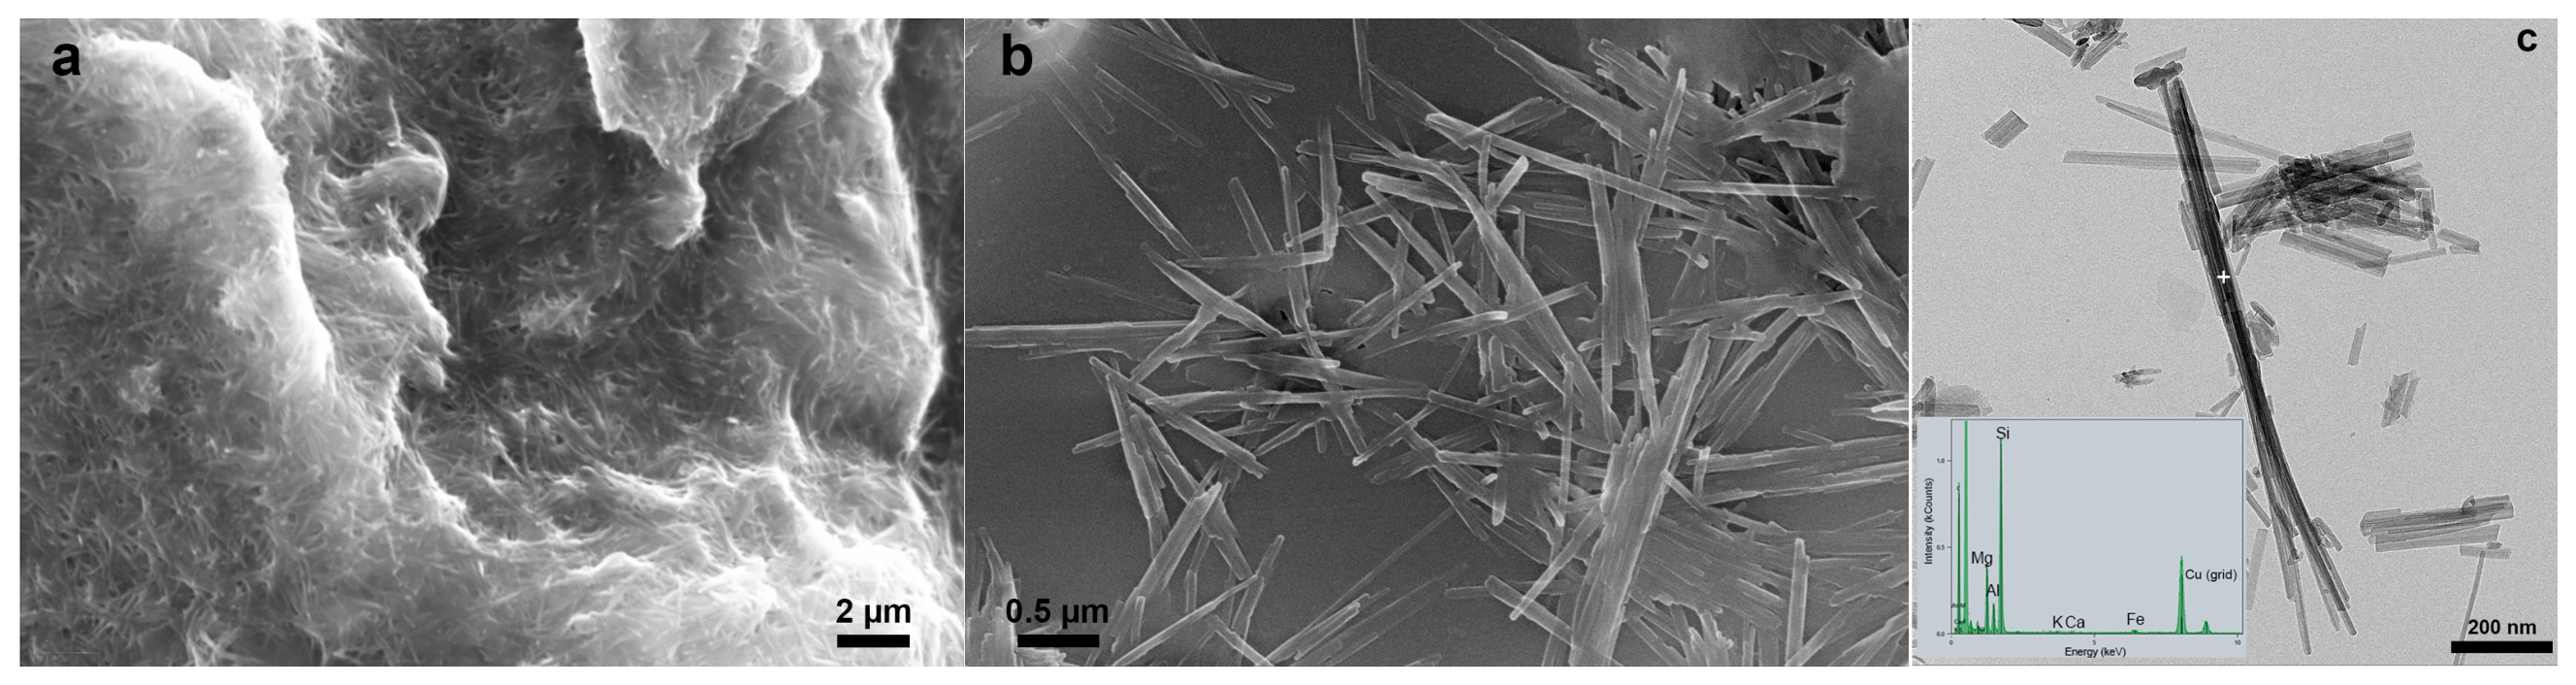
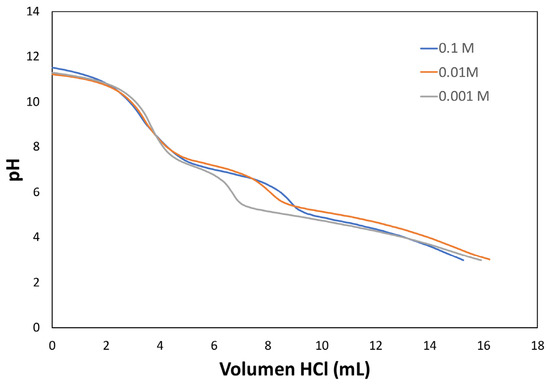
Natural palygorskite consists of a matrix of intertwined curved fibers, a few micrometers in length and tens of nanometers in thickness (Figure 3a). Idiomorphic dolomite crystals (<10 µm) were often coated with palygorskite fibers. The single fibers were tens of nanometers thick (Figure 3b), with a minimum thickness of 45 nm, which is approximately equivalent to 25-unit cells.
Figure 3.
SEM images of the natural sample, which consists of a matrix of intertwined curved fibers (a) of single bundles with nanometer thickness (b). TEM image of some fibers and EDX spectrum obtained at the spot (+) (c).
The minerals accompanying palygorskite prevented us from accurately determining the palygorskite structural formula from the XRF analysis; therefore, the mineral composition was analyzed using a Thermo-Fischer TALOS transmission electron microscope (TEM) operated at 200 kV (CIC, University of Granada). The TEM was equipped with a Schottky field-emission gun and a high-angle annular dark-field (HAADF) detector. The microanalytical system was equipped with an energy-dispersive X-ray (EDX) Super X with four detectors. The atomic proportions calculated from the peak intensities were converted to atomic concentrations using natural mineral standards, and quantitative calibration was performed [21]. A ground sample dispersed in ethanol was allowed to dry on a Cu-grid. Single-point analysis was performed in scanning transmission electron microscopy (STEM) mode (Figure 3c). Chemical analyses were converted to structural formulas. A total of 26 fibers were analyzed to obtain statistically significant results. All iron was assumed to be Fe3+. The average structural formula is as follows:
(Na0.12K0.04Ca0.24)(Mg2.58Al1.08Fe3+0.33)(Si7.82Al0.19)O20(OH)2(OH2)4·4H2O
This result is consistent with a magnesian palygorskite of Type III [22], with 3.99 octahedral cations and 1.061 vacant sites. The maximum cation exchange capacity (CEC) is estimated at 120 cmol(+)·kg−1, based on the structural formula. Taking into account that palygorskite is 85% in weight, the CEC of the bulk sample is estimated to be 102 cmol(+)·kg−1. The low CEC of dolomite is ignored.
Potentiometric surface titrations were used to quantify the distribution and reactivity of individual type sites, as has been previously done for other clay minerals (e.g., [16,23,24]). Palygorskite (0.5 g) was suspended in 100 mL of 0.1, 0.01, and 0.001 M KCl solutions at room temperature (22 ± 1 °C). A volume (4 mL) of 0.1 M KOH was added to bring each suspension to pH~11.5, taking approximately 5 min to stabilize, and then titrated stepwise to pH~3 with 0.1 M HCl. Titrations were performed using an automatic titrator (OMNIS, Metrohm, Herisau, Switzerland). A volume of 0.05 mL of acid was added every 50 s, and the total titration span was less than 5 h. Solutions were prepared using ultrapure water after purging with nitrogen to remove dissolved CO2. In the titrator, the suspension was continuously stirred at 1200 rpm, and nitrogen gas was pumped into the cell to purge the traces of CO2. Blanks were measured for each ionic strength using the same approach to verify that the titrator was working correctly. The pH electrode was calibrated against buffer solutions at pH values of 7, 4, and 10. The concentrations of Ca, Mg, Al, and Si in the titration splits were measured at pH 3–11. Because carbonate dissolution becomes increasingly important under acidic conditions, titrations were performed downward, from pH 11.5 to 3, and only titration data above pH 5 were used for surface-complexation modeling. Back-titration from alkaline conditions was selected to minimize rapid mineral dissolution during equilibration and to ensure that the complete protonation/deprotonation behavior of the surface could be monitored within a single experiment.
Silica concentration was measured by Visible/UV spectrophotometry (Agilent Cary UV/Vis Multicell Peltier, Ketsch, Germany) at 825 nm using the molybdate blue method [25]. Dissolved Al was measured by spectrofluorimetry (FluoDia T70 High Temperature Fluorescence Microplate Reader, Tokyo, Japan) using lumogallion as a complexing agent [26], with the excitation and emission wave-lengths being 486 and 550 nm, respectively. The concentrations of dissolved Mg and Ca were measured by ion chromatography using a Metrohm 883 Basic IC Plus Ion Chromatograph (Herisau, Switzerland) with a Metrosep C6 250/4.0 column. Separation was performed isocratically using an eluent composed of 1.7 mmol L−1 nitric acid and 1.7 mmol L−1 dipicolinic acid. The detection limits were 5 ppb for Si, 0.3 ppb for Al, and 1 ppb for Mg and Ca, respectively. The uncertainty was less than 3%.
3. Results
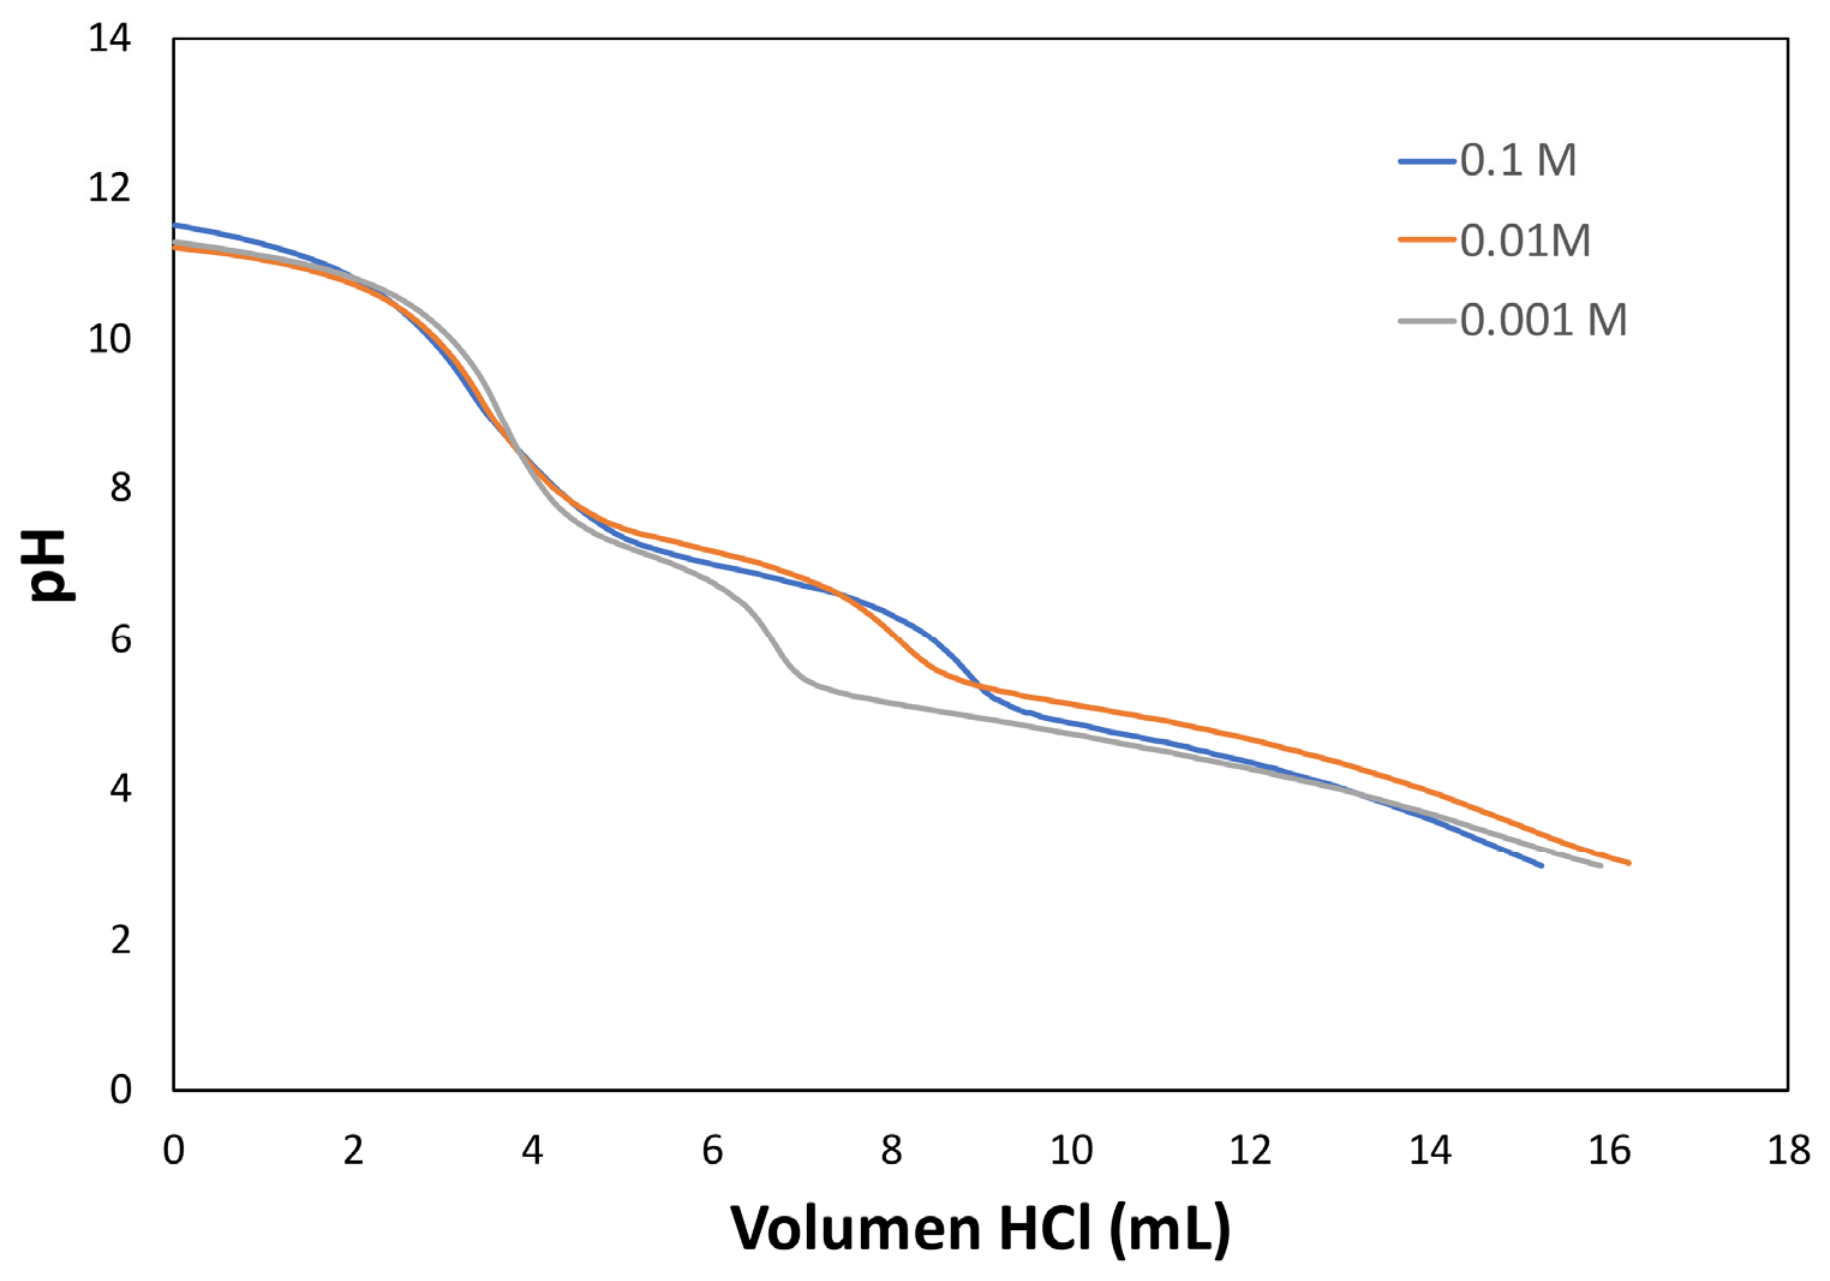
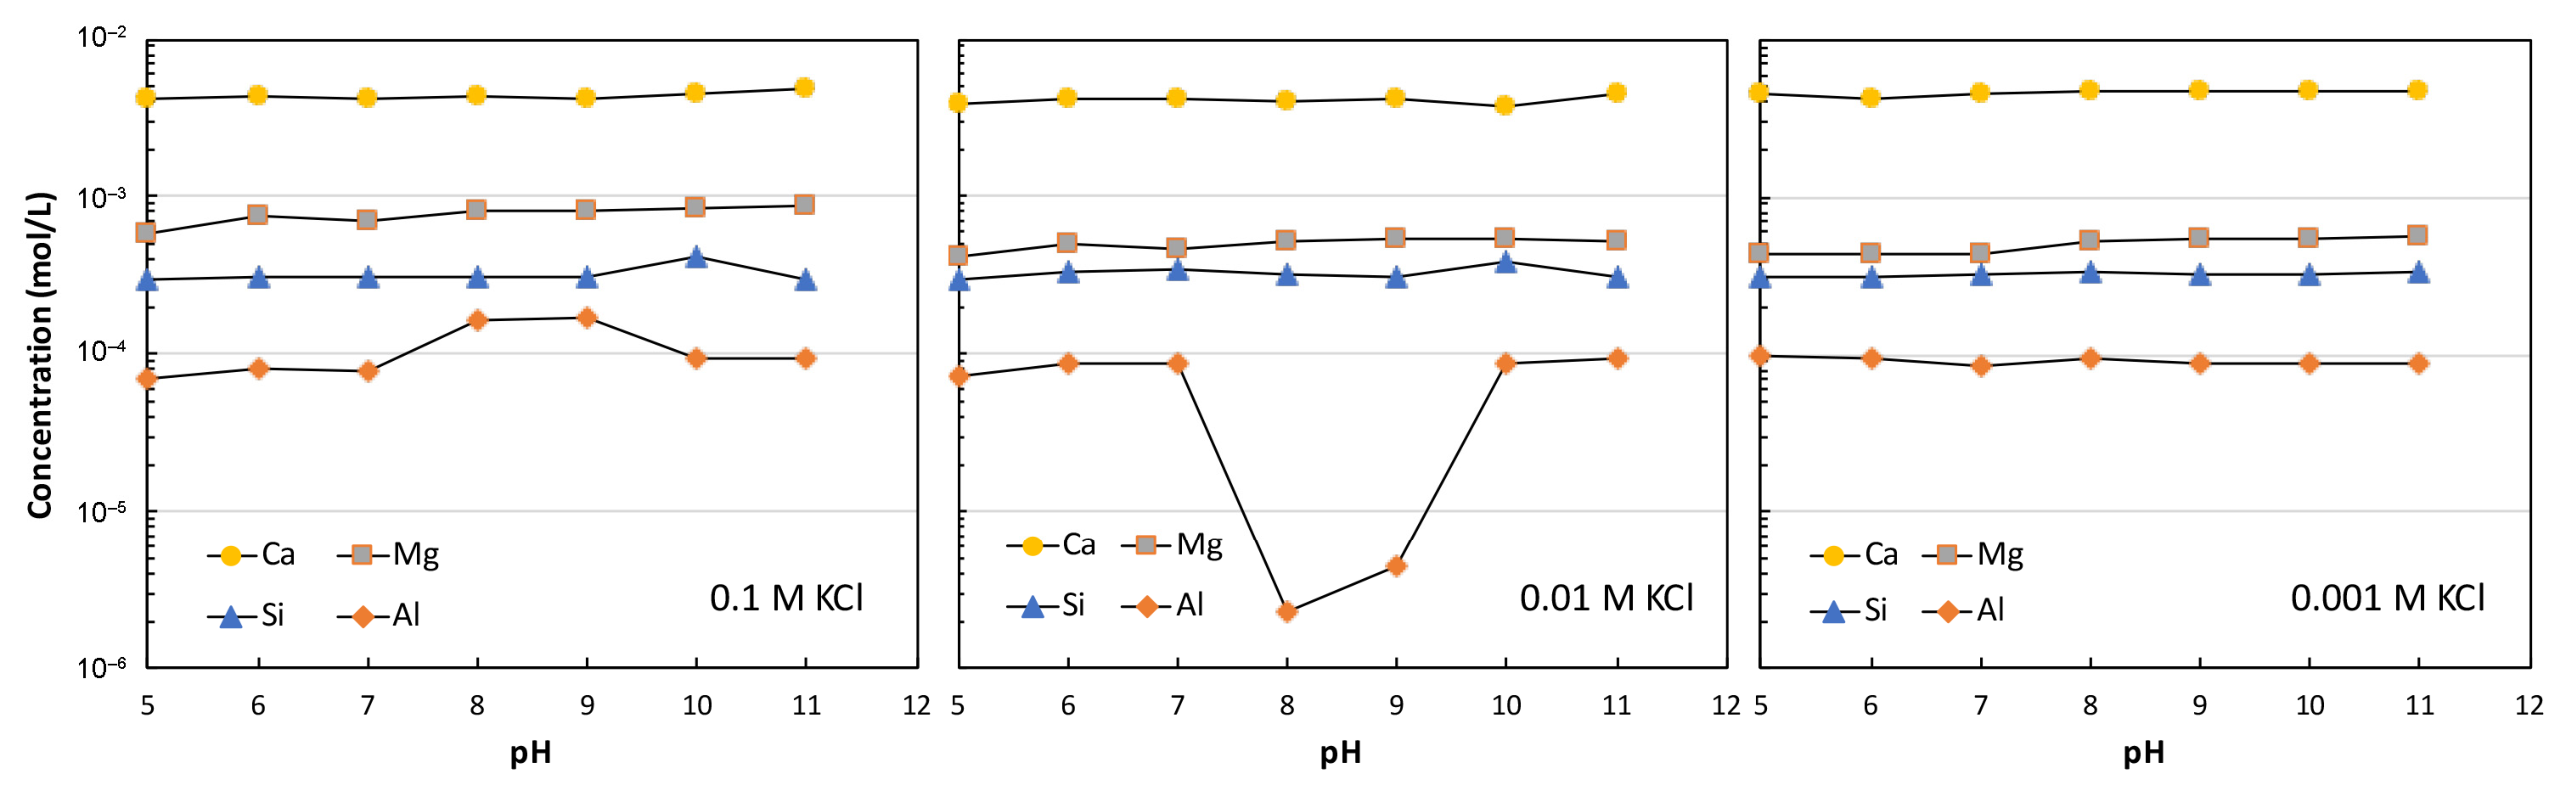
The titration curves at the three ionic strengths showed at least two steps: one in alkaline conditions and the other in neutral conditions (Figure 4, and Supplementary Materials). The titration data were used to develop a surface complexation model for Si, Mg, and Al charging and cation exchange on palygorskite. The titration data for pH > 5 were focused on. Dolomite, quartz, and smectite were ignored in the modeling process. The concentrations of Ca, Mg, Al, and Si in the titration splits are shown in Figure 5. These cations were released during the titration experiments by sample dissolution.
Figure 4.
Variation in the pH of the suspension as a function of the volume of the titrant solution.
Figure 5.
Concentration of cations released by palygorskite dissolution during titration experiments.
3.1. Palygorskite and Dolomite Dissolution During the Titration
From the measured dissolved Si levels of ~3.2 × 10⁻⁴ M, we estimate roughly 4 × 10⁻⁵ M of palygorskite fines dissolved during the first titration step. This contributes 1 × 10⁻⁴ M of Mg to the solution, based on the palygorskite structural formula above. The fact that Si levels did not increase steadily as the solution was titrated to a low pH suggests that the dissolution of palygorskite fines was confined to the start of the titration. Accelerated dissolution of palygorskite under acidic conditions was likely minimal because of the relatively limited duration of acidic conditions in the titration.
The notably high levels of Ca, ~4.4 × 10⁻³ M, seen in Figure 5 can only have come, at least in part, from dolomite dissolution. However, the measured Mg levels (6.6 × 10⁻⁴ M) were much lower than the Ca levels, whereas dolomite dissolution should produce equal amounts of Mg and Ca in solution. Again, the parallel dissolution of palygorskite added, at most, 1 × 10⁻⁴ M of Mg to the solution. This suggests that in the first titration step: (1) dissolved Ca and Mg were released in equimolar levels by dissolution of dolomite fines; (2) a lesser amount of Mg was released into solution by dissolution of palygorskite fines; (3) a large fraction of Mg was removed from solution by exchange of dissolved Mg for Ca originally on the palygorskite, or by brucite, Mg(OH)2, growth, or by formation of Mg-silicate minerals (e.g., sepiolite) or Mg-surface complexes on palygorskite Si tetrahedra. The relatively short duration of the first titration step (400–500 s) and the generally pH-independent Mg and Si trends (Figure 4) argue against brucite growth and Mg-Si interaction being important Mg removal mechanisms. We therefore assume palygorskite Ca/Mg exchange to be the reason for the observed Ca and Mg levels. The amount of dolomite fines dissolved (0.0025 M) and the amount of dissolved Mg exchanged onto palygorskite for the released Ca (0.0021 M) were solved algebraically using the average dissolved Ca and Mg concentrations from the 0.001 M KCl titrations. The low-K+ 0.001 M KCl results were used to minimize any effect of K+ exchange on the calculation. Mass balances of dissolved Ca and Mg were used to calculate the amount of dolomite fines that dissolved and the amount of Mg that was exchanged for Ca originally present on the palygorskite surface. Titration modeling was restricted to pH 5 and above to limit the influence of the eventual dolomite dissolution.
K+ exchange on palygorskite for Mg2+ likely occurred in the 0.1 M KCl titration as Mg levels increased by roughly half from their values in the 0.01 and 0.001 M KCl titrations. H+ exchange onto the palygorskite surface was unlikely under the experimental conditions because the measured Ca and Mg levels did not increase at low pH values.
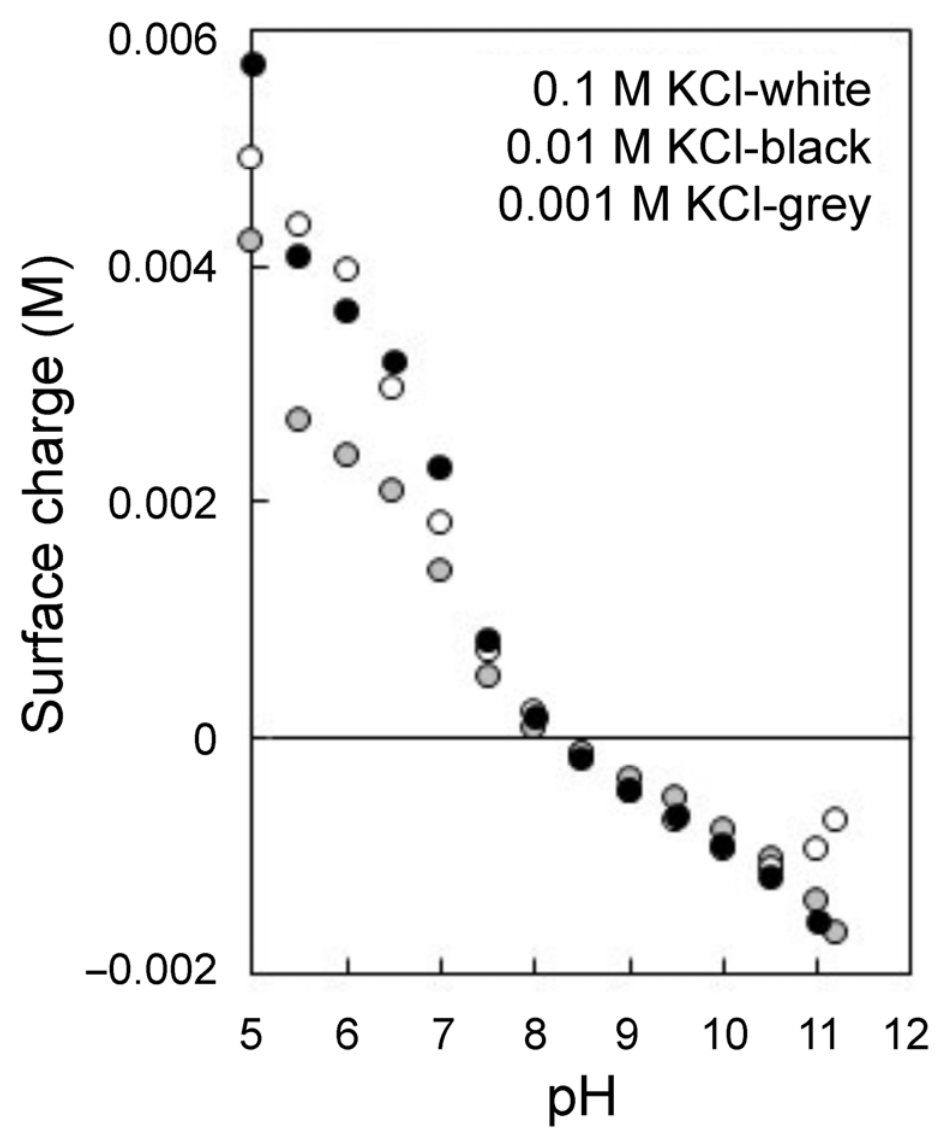
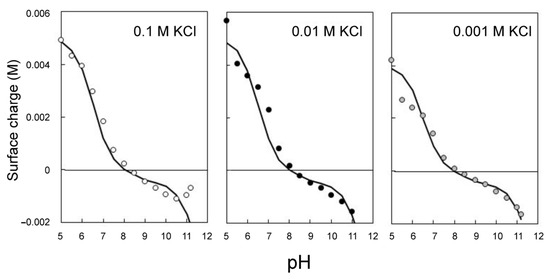
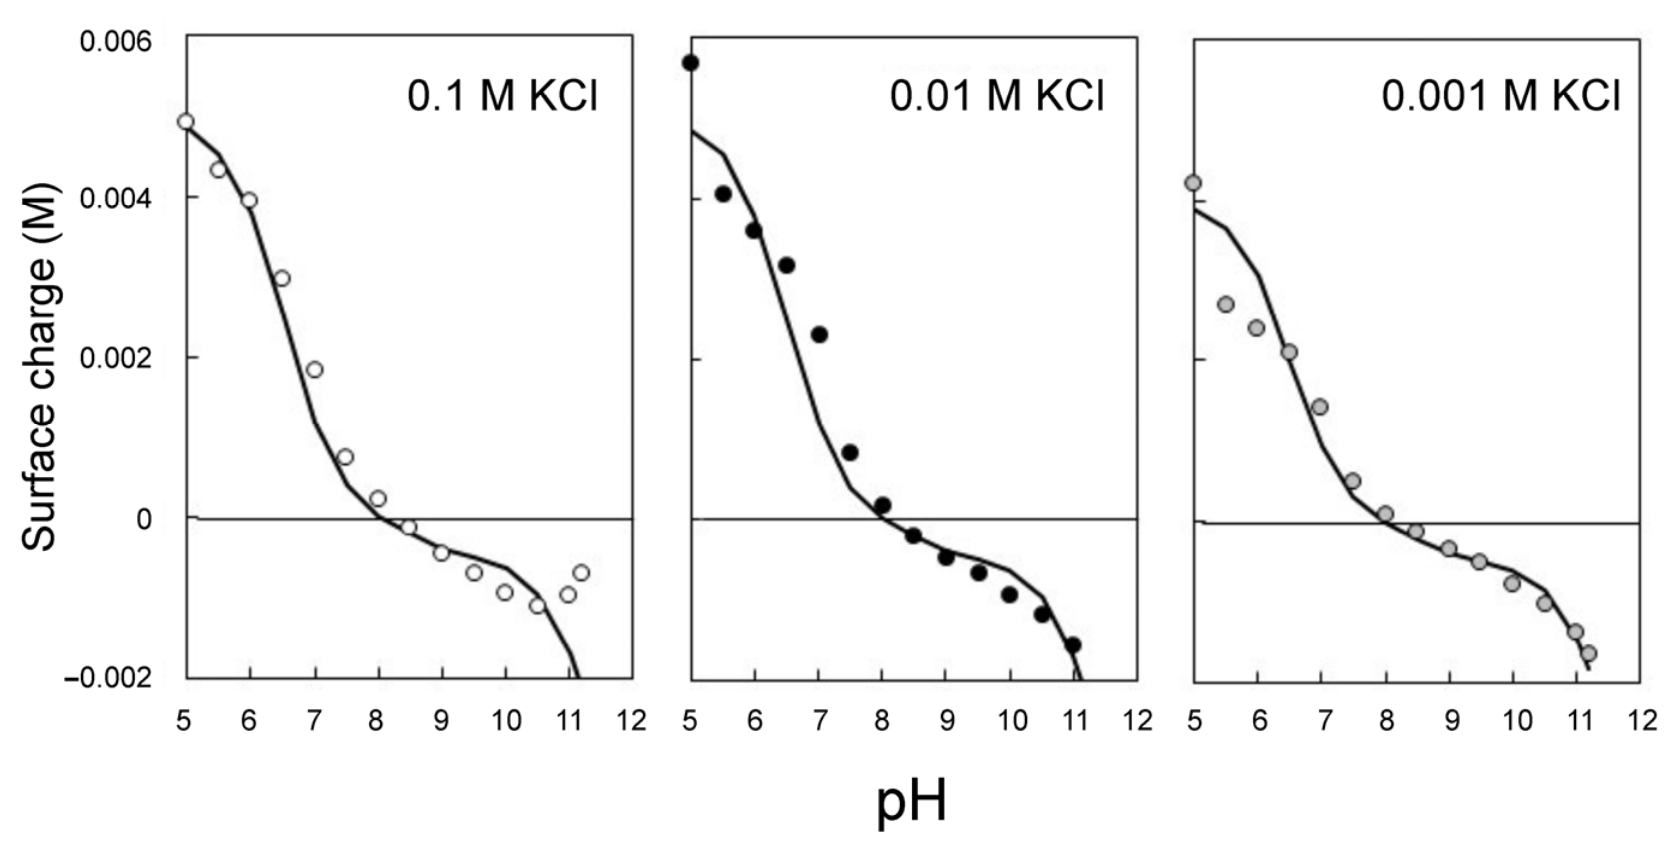
Figure 6 shows the calculated net surface charge, δ (M), as a function of pH for the three titrations performed:
Ca and Cb are the amounts of acid and base added, respectively [27], and [OH−] − [H+] are the hydroxyl and proton concentrations obtained from pH measurements. The net surface charge is shown for 14 pH values between 5 and 11.2.
δ = Ca − Cb + [OH−] − [H+];
Figure 6.
Palygorskite surface charge as a function of pH and ionic strength of the suspensions.
The potentiometric titration curves obtained at different ionic strengths are subparallel and exhibit a common intersection region near pH 8.2–8.3, corresponding to the PZNPC (Figure 6) as observed in multi-oxide minerals.
Published surface titration studies of palygorskite/attapulgite reveal substantial variability in reported surface charge properties [11,12,13,28,29,30,31]. For untreated attapulgite, ZPC values of pH 6–7 have been reported [28], whereas acid-treated samples yielded ZPC values ranging from approximately pH 4 to 6 depending on treatment conditions and electrolyte composition [30,31]. For palygorskite, both predominantly negative surface charge over the pH range 3–11 [11] and positive surface charge under similar pH conditions [13] have been reported. Acid treatment generally increased the positive surface charge and, in some cases, resulted in ZPC values of pH 6–7 [12,29]. In comparison, the ZPC measured here for untreated palygorskite (pH 8) is slightly higher than the value reported for untreated attapulgite (pH 6–7) [28] (Figure 6).
3.2. Model Fits to the Data
PHREEQC Version 2 [32] and the llnl.dat thermodynamic database were used to fit the data with a 2-site model. The aim was to achieve an acceptable fit using the least number of adjustable parameters. Fitting the data to a one-site model gave a poor fit at pH > 8; hence, the 2-site model was used. The site densities and deprotonation constants for each site were varied manually to fit the 0.1 M KCl dataset. The same deprotonation constants were then used to fit the 0.01 and 0.001 M KCl datasets, changing only the site densities; the fitted site densities changed only slightly between the datasets (Table 2). One of the sites is assumed to be a palygorskite silanol site, denoted as >SiOH, based on its high pKa2 value. The other is assumed to be a surface Al or Mg site, denoted as >XOH. The modeled deprotonation reactions are as follows:
>SiOH ↔ >SiO− + H+, KSi,2 = [>SiO−]·a(H+)/[>SiOH]
>XOH2+ ↔ >XOH + H+, KX,1 = [>XOH]·a(H+)/[>XOH2+]
>XOH ↔>XO− + H+, KX,2 = [>MO−]·a(H+)/[>XOH]
Table 2.
Fitted X and Si site concentrations in the electrolyte suspension, and the point of zero net proton charge (PZNPC).
A Non-Electrostatic Model (NEM) [33] of the surface was used because it was previously used by [24] to successfully describe the montmorillonite edge charge. NEM is the simplest surface model because it ignores the electrostatics of surface reactions. The electrostatics of clay edges remain the focus of ongoing research (e.g., [18,34]). The fitted site concentrations for >SiOH and >XOH sites are given in Table 2. The NEM fit to the data is shown in Figure 7.
Figure 7.
The surface complexation model fits the palygorskite surface charge data.
The surface dissociation constants corresponding to the protonation and deprotonation reactions were estimated to be KSi,2 = 10−8.5; KX,1 = 10−6.6, and KX,2 = 10−11.5 (Equations (2)–(4)). The NEM fit to the data is shown in Figure 7. The dissociation constants presented here should be considered apparent because electrostatic effects are not directly included in the NEM. However, the model offers a simple yet effective way to identify the main reactive surface groups and replicate the experimental titration behavior.
4. Discussion
The PZNPC derived from the intersection of the titration curves at the three ionic strengths was at pH 8.2–8.3 (Figure 6). The measured PZNPC values are comparable to those previously reported for palygorskite [11,13] and dioctahedral 2:1 aluminosilicates such as montmorillonite (7.6–8.1 [16]). The titration curves include several steps and run subparallel to each other, consistent with behavior expected for multisite protonation/deprotonation reactions superimposed on a permanent structural charge associated with isomorphic substitutions.
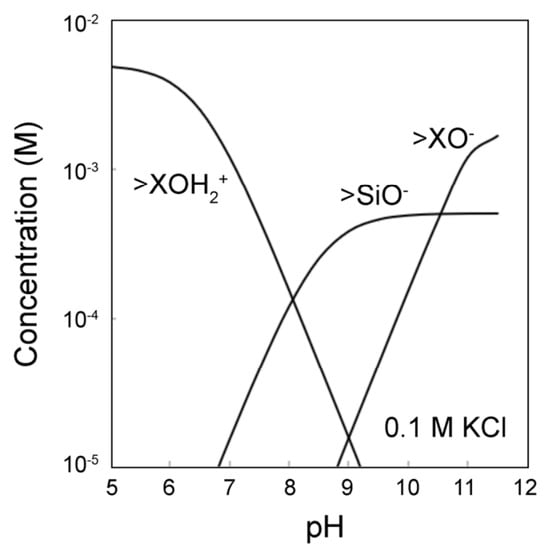
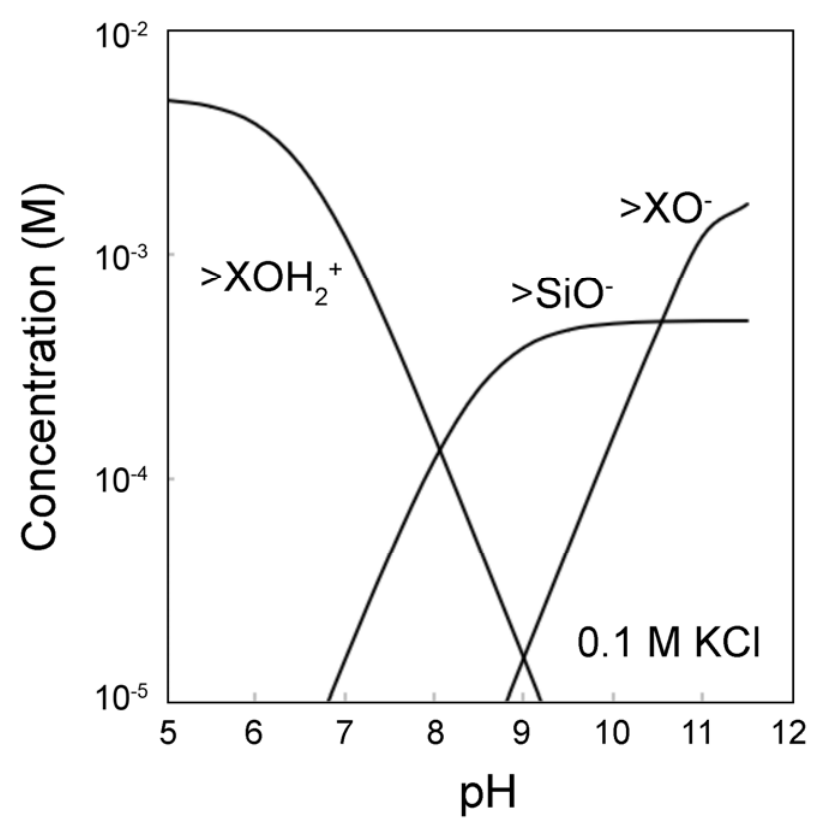
While the surface complexation modeling gives a non-unique solution, it provides a reasonable description of the major features of palygorskite surface chemistry, namely: pH-independent cation exchange (I), and pH-dependent surface charge controlled largely by edge Al/Mg protonation (Site X) below pH 8, and by edge Al/Mg and Si deprotonation above pH 8 (Figure 8).
Figure 8.
Predicted surface speciation of palygorskite in 0.1 M KCl. At the PZNPC, the concentrations of protonated and deprotonated surface species become equal, providing an internal consistency check for the proposed model.
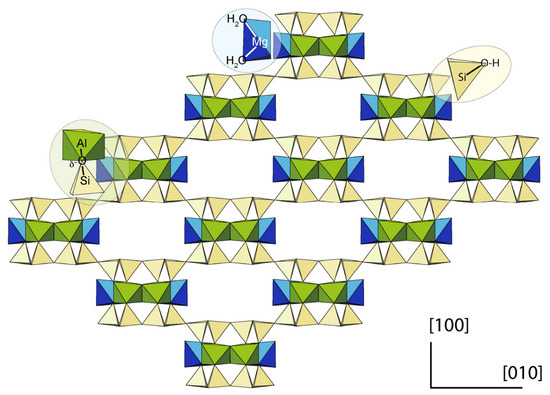
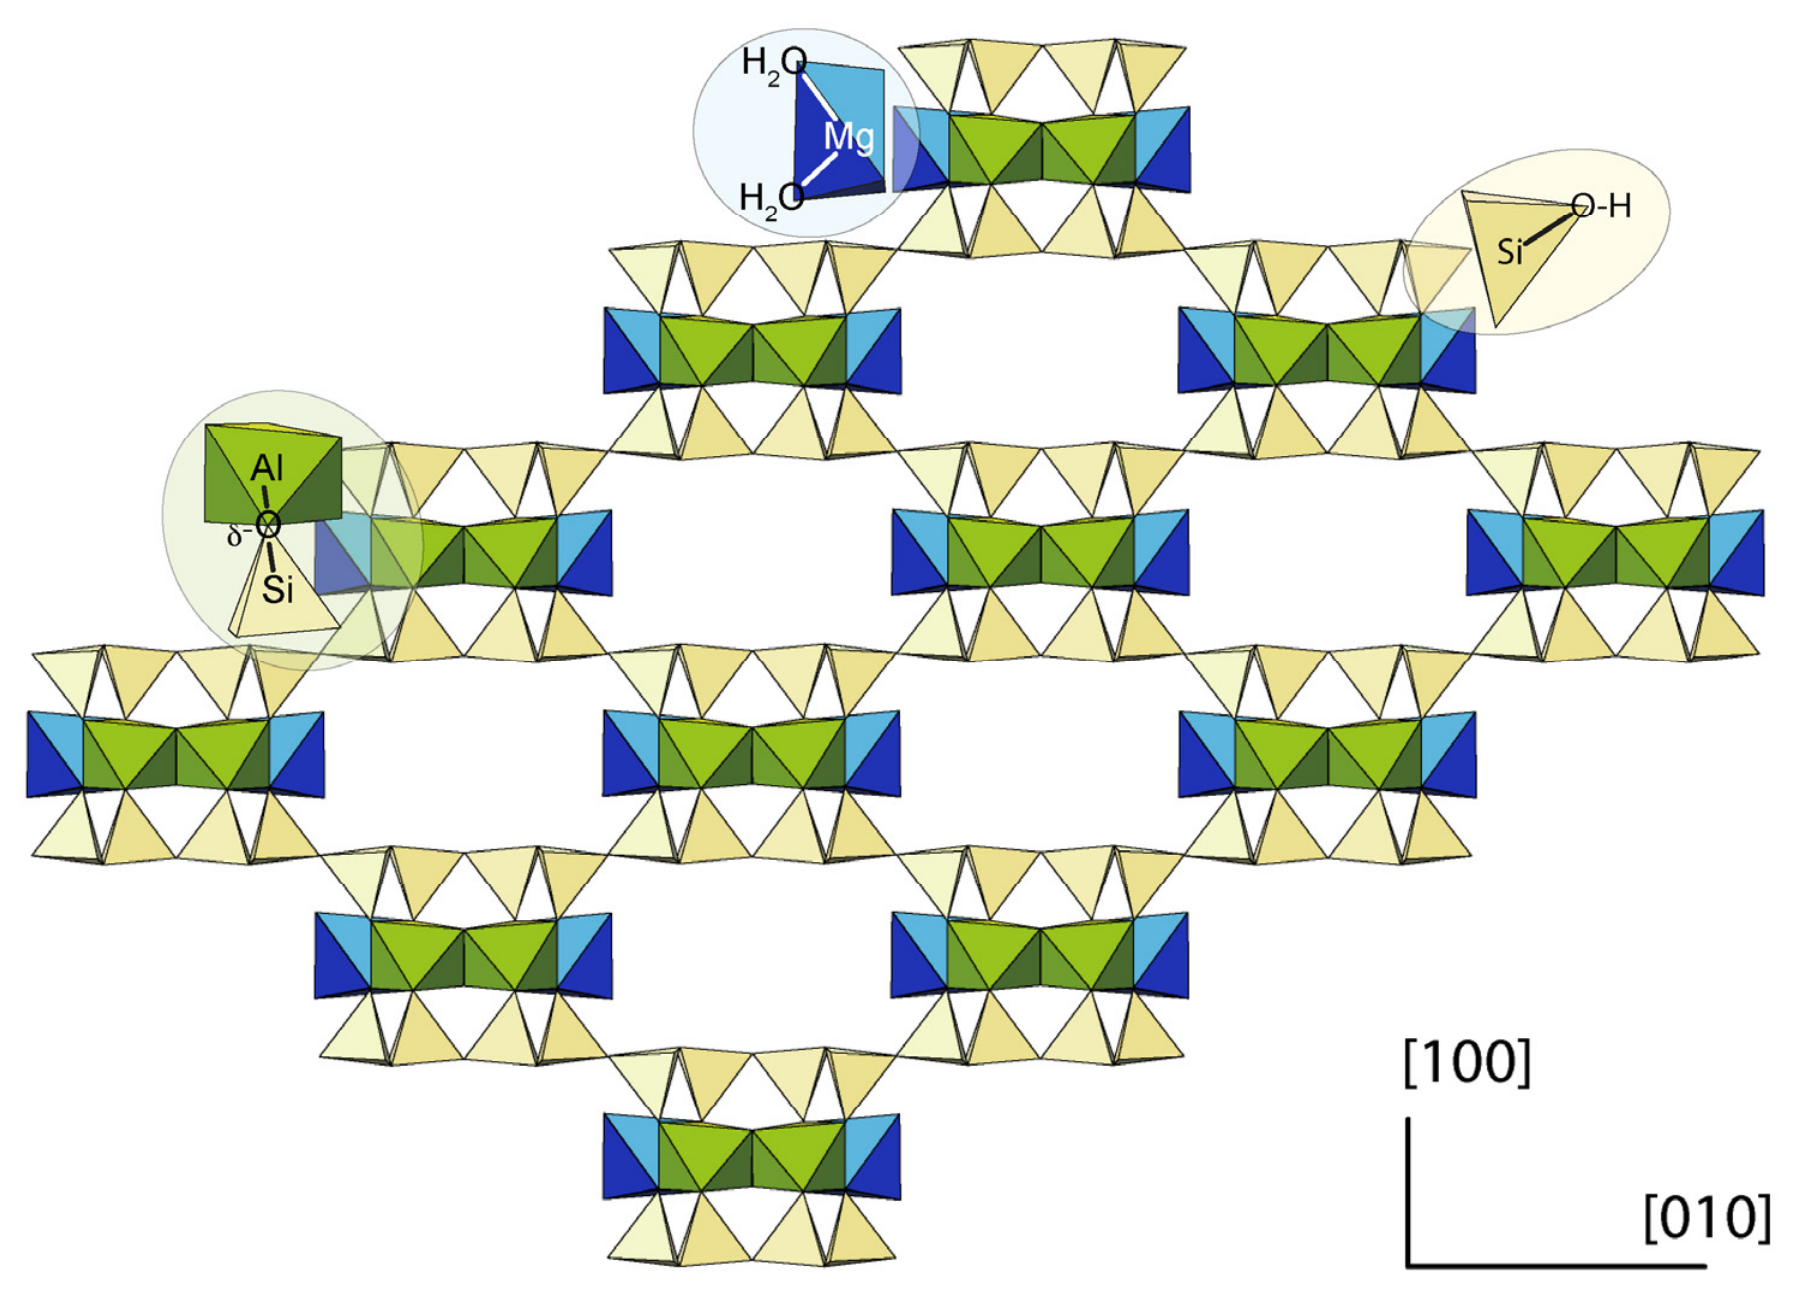
A section perpendicular to an idealized palygorskite fiber oriented along [001] is depicted in Figure 9 (see graphical abstract for more detail). This figure may facilitate a crystallographically consistent identification of the active surface sites. Moreover, the site concentration within the suspension can be converted to surface site density using the appropriate specific surface area. Silanol sites can be identified at the outer corners of the tetrahedral sheet (site T2), which are exposed along the fiber edges. Tetrahedra within the channels are linked to each other; thus, there are no silanol sites along the channel space. The BET specific surface area represents the external surface area and allows us to derive a silanol site density of 0.63 sites/nm2. This value is comparable to the silanol site densities estimated for other minerals, such as montmorillonite (2.04–3.16) [15,16] and kaolinite (0.50–1.1) [14,15,35]. Silanol sites contribute to negative charges above neutral conditions.
Figure 9.
Along [001] view of an idealized section of a palygorskite fiber, which is thus perpendicular to the fiber axis. Polyhedral correspondence: Si tetrahedra in yellow, Al octahedra (M2) in blue, and Mg octahedra (M3) in green. Zeolitic water was not included. Silanol sites are restricted to the external surface area, but sites associated with octahedral cations are located both at the external and channel surface area.
The X sites correspond to octahedral cations, Al3+ and Mg2+. Al is located at the M2 sites, connected to two neighboring Al atoms through a hydroxyl (Al–OH–Al) and to four bridging oxygens that link tetrahedral and octahedral sheets. The proton reactivity at several crystal edges was investigated by DFT modeling pyrophyllite-type clusters [36]. Two surface sites were identified: hydroxyls and bridge aluminol reactive sites. The hydroxyl groups (>Al-OH-Al<) did not protonate/deprotonate, but accommodated the structural distortion caused by the protonation of the bridge aluminol sites. The bridge aluminol sites were the groups that were actually protonated.
In the palygorskite structure, the hydroxyls are not accessible to the solution (Figure 1). Each bridge oxygen is bonded to one Si and is shared by Al and Mg cations. The charge balance on the bridge oxygens results in an excess of negative charge (Al,Mg–Oδ−–Si). Thus, under acidic conditions, bridge oxygens can adsorb protons. These sites may be labeled >XAlOH and may correspond to the aluminol sites.
The outer octahedral oxygens at the fiber edges consist of two water molecules bonded to an octahedral Mg2+ in an M3 structural site. Protonation reactions at octahedral Mg sites have been little studied due to the greater abundance of dioctahedral clay minerals and the lower stability of trioctahedral clays in acidic environments. In montmorillonite, molecular dynamics simulations [17] have shown that the few octahedral Mg sites can deprotonate under alkaline conditions, exhibiting a high pKa (13.2).
In palygorskite, however, Mg cations occupy approximately half of the octahedral positions and, in particular, the M3 located on the outside of the polysomes (Figure 1). Charge balance results in an excess of positive charge (H2Oδ+–Mg–Oδ+H2). This site cannot absorb additional protons, but, on the contrary, can release a proton in a deprotonation reaction under alkaline conditions. Mg-coordinated edge water groups can be labeled >XMgOH; by analogy, might they be called magnesiol sites?
According to crystallography, the X sites may correspond to two different surface sites: the aluminol acidic sites XAl, located at the bridge oxygen associated with octahedral Al, and the basic sites XMg, corresponding to octahedral Mg bonded to water molecules. Normalizing the X surface site density to the external surface area yields a site density of 6.3 sites/nm2, which is too high to be consistent with crystallography. According to Figure 9, unlike silanols, >X sites can be accessed from both the outer surface and the channels or inner surface. Therefore, the total specific surface area may be more suitable for normalizing the surface density of X sites. With an estimated total specific surface area of 342 m2/g, the corresponding site density for the X sites was 1.8 sites/nm2, comparable in magnitude to the site density of aluminols in montmorillonite and kaolinite ([14,15,16], and references therein). The palygorskite surface speciation is summarized in Table 3.
Table 3.
Palygorskite surface speciation according to NEM.
The fiber edges correspond to the {110} face. According to the unit cell parameters [37], this face has a surface area of ~2.4 nm2 for the monoclinic form and contains 2 silanol groups. Thus, the theoretical surface density of silanol sites is 0.84 sites/nm2. Concerning the reactive sites associated with octahedral cations, there are 2 Al and 2 Mg cations at the external surface per unit cell, which correspond to 0.84 sites/nm2 of aluminol and Mg-coordinated water. In addition, in the internal or channel surface, there are another 2 Al and 2 Mg cations per unit cell. This is also equivalent to 0.84 sites/nm2 of aluminol and Mg-coordinated water. Thus, the total surface density of both aluminol and Mg-coordinated water is 1.7 sites/nm2 for each type. These values are in the order of those derived from model fitting (Table 3).
5. Conclusions
The surface chemistry of palygorskite was investigated using potentiometric titrations combined with mineralogical, crystallochemical, and surface complexation analyses. These results provide a crystallographically consistent interpretation of palygorskite surface reactivity.
- Senegal palygorskite corresponds to Type III magnesian palygorskite with a fibrous morphology and high specific surface area, dominated by external siloxane surfaces and internal channel-associated octahedral sites.
- Potentiometric titrations performed at different ionic strengths showed a PZNPC between pH 8.19 and 8.30. The titration curves indicate the coexistence of permanent structural charge and pH-dependent surface protonation/deprotonation.
- Surface complexation modeling using a non-electrostatic model implemented in PHREEQC indicated that at least two pH-dependent surface site families were required to reproduce the experimental data.
- The integration of crystal chemistry and surface modeling suggests the existence of three main reactive surface groups: (i) silanol sites located mainly at fiber edges and tips, (ii) proton-reactive aluminol bridge sites associated with octahedral Al, and (iii) Mg-coordinated edge water groups capable of deprotonation under alkaline conditions.
- The surface site densities normalized to the accessible surface areas were consistent with the fibrous channeled structure of palygorskite and supported the participation of both external and internal surfaces in surface charging.
- The proposed model reconciles previous inconsistencies in the literature regarding palygorskite surface charge and provides a framework for understanding adsorption, colloidal stability, ion exchange, and mineral–fluid interactions in natural and engineered systems.
Supplementary Materials
The supplementary data presented in this study are openly available in DIGITALCSIC at http://hdl.handle.net/10261/401160 (accessed on 25 June 2026). The data have been included either in the main text or in the Supplementary Materials. Further specifications on the methodology and/or results will be provided upon request.
Author Contributions
Conceptualization, F.J.H. and M.B.; methodology, F.J.H. and P.A.; formal analysis, P.V.B.; investigation, P.A.; data curation, F.J.H.; writing—original draft preparation, F.J.H. and P.V.B.; writing—review and editing, F.J.H., P.V.B. and M.B.; funding acquisition, F.J.H. All authors have read and agreed to the published version of the manuscript.
Funding
Research supported by Grants PID2020-114355GB-I00 and PID2023-146856NB-I00, funded by MCIN/AEI/10.13039/501100011033 and by “ERDF A way of making Europe”, EU.
Data Availability Statement
The original contributions presented in this study are included in the article. For further inquiries, please contact the corresponding authors.
Acknowledgments
The authors thank E. Flores and A. Salido† (IACT-CSIC) for XRD, XRF, and BET analysis, and I. Guerra and J. Pedrajas (CIC-UGR) for SEM and TEM analysis. The authors gratefully acknowledge the editor and the two anonymous reviewers for their insightful comments and assistance in improving this manuscript. F.J.H., amdg.
Conflicts of Interest
The authors declare no conflicts of interest.
Abbreviations
The following abbreviations are used in this manuscript:
| BET | Brunauer–Emmett–Teller |
| CEC | Cation exchange capacity |
| EDX | Energy-Dispersive X-ray Spectrometer |
| HAADF | High-angle annular dark-field |
| IEP | Isoelectric point |
| LOI | Loss on ignition |
| JCPCD | Joint Committee on Powder Diffraction Standards |
| PZC | Point of zero charge |
| PZNPC | Point of zero net proton charge |
| STEM | Scanning transmission electron microscopy |
| SEM | Scanning Electron Microscopy |
| TEM | Transmission Electron Microscopy |
| XRD | X-ray diffraction |
| XRF | X-ray fluorescence |
References
- Suárez, M.; García-Romero, E. Advance in crystal chemistry of sepiolite and palygorskite. In Developments in Palygorskite-Sepiolite Research; Galán, E., Singer, E., Eds.; Developments in Clay Science; Elsevier: Amsterdam, The Netherlands, 2011; Volume 3, pp. 33–65. [Google Scholar] [CrossRef] [Scilit]
- Guggenheim, S.; Krekeler, M.P.S. The structure and microstructure of the palygorskite-sepiolite group minerals. In Developments in Palygorskite-Sepiolite Research; Galán, E., Singer, E., Eds.; Developments in Clay Science; Elsevier: Amsterdam, The Netherlands, 2011; Volume 3, pp. 3–32. [Google Scholar] [CrossRef] [Scilit]
- Suárez, M.; García-Romero, E.; Sánchez del Río, M.; Martinetto, P.; Dooryhée, E. The effect of octahedral cations on the dimensions of the palygorskite cell. Clay Miner. 2007, 42, 287–297. [Google Scholar] [CrossRef] [Scilit]
- Galán, E.; Carretero, M.I. A new approach to compositional limits for sepiolite and palygorskite. Clays Clay Miner. 1999, 47, 399–409. [Google Scholar] [CrossRef] [Scilit]
- Post, J.E.; Heaney, P.J. Synchrotron powder X-ray diffraction study of the structure and dehydration behavior of palygorskite. Am. Mineral. 2008, 93, 667–675. [Google Scholar] [CrossRef] [Scilit]
- Ruiz-Hitzky, E.; Aranda, P.; Álvarez, A.; Santarén, J.; Esteban-Cubillo, A. Advanced materials and new applications of sepiolite and palygorskite. In Developments in Palygorskite-Sepiolite Research; Galán, E., Singer, E., Eds.; Developments in Clay Science; Elsevier: Amsterdam, The Netherlands, 2011; Volume 3, pp. 393–452. [Google Scholar] [CrossRef] [Scilit]
- Lu, Y.; Wang, A. From structure evolution of palygorskite to functional material: A review. Micropor. Mesopor. Mater. 2022, 333, 111765. [Google Scholar] [CrossRef] [Scilit]
- Heivilin, F.G.; Murray, H.H. Hormites: Palygorskite (Attapulgite) and Sepiolite. In Industrial Minerals and Rocks, 6th ed.; Carr, D.D., Ed.; Society for Mining, Metallurgy, and Exploration (SME): Englewood, CO, USA, 1994; pp. 249–254. [Google Scholar]
- Bish, L.D.; Guthrie, G.D., Jr. Mineralogy of clay and zeolite dusts (exclusive of 1:1 layer silicates). In Health Effects of Mineral Dusts; Guthrie, G.D., Jr., Mossman, B.T., Eds.; Reviews in Mineralogy 28; The Mineralogical Society of America: Chantilly, VA, USA, 1994; pp. 139–184. [Google Scholar] [CrossRef] [Scilit]
- Neaman, A.; Singer, A. Rheological properties of aqueous suspensions of palygorskite. Soil Sci. Soc. Am. J. 2000, 64, 427–436. [Google Scholar] [CrossRef] [Scilit]
- F rini-Srasra, N.; Kriaa, A.; Srasra, E. Acid-base properties of Tunisian palygorskite in aqueous medium. Russ. J. Electrochem. 2007, 43, 795–802. [Google Scholar] [CrossRef] [Scilit]
- Frini-Srasra, N.; Srasra, E. Determination of acid–base properties of HCl acid activated palygorskite by potentiometric titration. Surf. Eng. Appl. Electrochem. 2008, 44, 401–409. [Google Scholar] [CrossRef] [Scilit]
- Rusmin, R.; Sarkar, B.; Biswas, B.; Churchman, J.G.; Liu, Y.; Naidu, R. Structural, electrokinetic and surface properties of activated palygorskite for environmental application. Appl. Clay Sci. 2016, 134, 95–102. [Google Scholar] [CrossRef] [Scilit]
- Huertas, F.J.; Chou, L.; Wollast, R. Mechanism of kaolinite dissolution at room temperature and pressure: Part 1. Surface speciation. Geochim. Cosmochim. Acta 1998, 62, 417–431. [Google Scholar] [CrossRef] [Scilit]
- Tertre, E.; Castet, G.; Loubet, M.; Giffaut, E. Surface chemistry of kaolinite and Na-montmorillonite in aqueous electrolyte solutions at 25 and 60 °C: Experimental and modeling study. Geochim. Cosmochim. Acta 2006, 70, 4579–4599. [Google Scholar] [CrossRef] [Scilit]
- Rozalen, M.; Brady, P.V.; Huertas, F.J. Surface chemistry of K-montmorillonite: Ionic strength, temperature dependence and dissolution kinetics. J. Colloids Interface Sci. 2009, 333, 474–484. [Google Scholar] [CrossRef] [Scilit] [PubMed]
- Liu, X.; Lu, X.; Sprik, M.; Cheng, J.; Meijer, E.J.; Wang, R. Acidity of edge surface sites of montmorillonite and kaolinite. Geochim. Cosmochim. Acta 2013, 117, 180–190. [Google Scholar] [CrossRef] [Scilit]
- Tournassat, C.; Davis, J.A.; Chiaberge, C.; Grangeon, S.; Bourg, I.C. Modeling the acid–base properties of montmorillonite edge surfaces. Environ. Sci. Technol. 2016, 50, 13436–13445. [Google Scholar] [CrossRef] [Scilit] [PubMed]
- Brunauer, S.; Emmett, P.H.; Teller, E. Adsorption of gases in multimolecular layers. J. Am. Chem. Soc. 1938, 60, 309–319. [Google Scholar] [CrossRef] [Scilit]
- Keeling, P.S. The examination of clays by IL/MA. Trans. Br. Ceram. Soc. 1961, 60, 217–244. [Google Scholar]
- Cliff, G.; Lorimer, G.W. The quantitative analysis of thin specimens. J. Microsc. 1975, 103, 203–207. [Google Scholar] [CrossRef] [Scilit]
- García-Romero, E.; Suárez, M. On the chemical composition of sepiolite and palygorskite. Clays Clay Miner. 2010, 58, 1–20. [Google Scholar] [CrossRef] [Scilit]
- Zachara, J.M.; Smith, S.C. Edge complexation reactions of cadmium on specimen and soil-derived smectite. Soil Sci. Soc. Am. J. 1994, 58, 762–769. [Google Scholar] [CrossRef] [Scilit]
- Bradbury, M.H.; Baeyens, B. A mechanistic description of Ni and Zn sorption on Na-montmorillonite. 2. Modelling. J. Contam. Hydrol. 1997, 27, 223–248. [Google Scholar] [CrossRef] [Scilit]
- Grasshoff, K.; Ehrhardt, M.; Kremling, K. (Eds.) Methods of Seawater Analysis, 2nd ed.; Verlag Chemie: New York, NY, USA, 1983; pp. 1–419. [Google Scholar] [CrossRef] [Scilit]
- Hydes, D.J.; Liss, P.S. Fluorimetric method for the determination of low concentrations of dissolved aluminium in natural waters. Analyst 1976, 101, 922–931. [Google Scholar] [CrossRef] [Scilit]
- Stumm, W.; Morgan, J.J. Aquatic Chemistry: Chemical Equilibria and Rates in Natural Waters, 3rd ed.; John Wiley & Sons: New York, NY, USA, 2012; p. 1040. [Google Scholar]
- Cao, E.; Bryant, R.; Williams, D. Electrochemical properties of Na-attapulgite. J. Colloids Interface Sci. 1996, 179, 143–150. [Google Scholar] [CrossRef] [Scilit]
- Fan, Q.; Li, Z.; Zhao, H.; Jia, Z.; Xu, J.; Wu, W. Adsorption of Pb (II) on palygorskite from aqueous solution: Effects of pH, ionic strength and temperature. Appl. Clay Sci. 2009, 45, 111–116. [Google Scholar] [CrossRef] [Scilit]
- Niu, Z.; Fan, Q.; Wang, W.; Xu, J.; Chen, L.; Wu, W. Effect of pH, ionic strength and humic acid on the sorption of uranium(VI) to attapulgite. Appl. Rad. Isot. 2009, 67, 1582–1590. [Google Scholar] [CrossRef] [Scilit] [PubMed]
- Chen, Z.; He, J.; Chen, L.; Lu, S. Sorption and desorption properties of Eu (III) on attapulgite. J. Radioanal. Nucl. Chem. 2016, 307, 1093–1104. [Google Scholar] [CrossRef] [Scilit]
- Parkhurst, D.L.; Appelo, A.C. User’s Guide to PHREEQC (Version 2): A Computer Program for Speciation, Batch-Reaction, One-Dimensional Transport, and Inverse Geochemical Calculations; Water-Resources Investigations Report 99, no. 4259; US Geological Survey: Reston, VA, USA, 1999; p. 312. [CrossRef] [Scilit]
- Davis, J.A.; Kent, D.B. Surface complexation modeling in aqueous geochemistry. In Mineral-Water Interface Geochemistry; Hochella, M.F., Jr., White, A.R., Eds.; The Mineralogical Society of America: Chantilly, VA, USA, 1990; Volume 23, pp. 177–260. [Google Scholar] [CrossRef] [Scilit]
- Delhorme, M.; Labbez, C.; Caillet, C.; Thomas, F. Acid− base properties of 2: 1 clays. I. Modeling the role of electrostatics. Langmuir 2010, 26, 9240–9249. [Google Scholar] [CrossRef] [Scilit] [PubMed]
- Brady, P.V.; Cygan, R.T.; Nagy, K.L. Molecular controls on kaolinite surface charge. J. Colloids Interface Sci. 1996, 183, 356–364. [Google Scholar] [CrossRef] [Scilit] [PubMed]
- Bentabol, M.; Pérez del Valle, C.; Hernández-Laguna, A.; Huertas, F.J. Protolysis reaction on pyrophyllite surface molecular models: A DFT Study. Molecules 2025, 30, 4530. [Google Scholar] [CrossRef] [Scilit] [PubMed]
- Artioli, G.; Galli, E. The crystal structure of orthorhombic and monoclinic palygorskite. Mater. Sci. Forum 1994, 166–169, 647–652. [Google Scholar] [CrossRef] [Scilit]

Disclaimer/Publisher’s Note: The statements, opinions and data contained in all publications are solely those of the individual author(s) and contributor(s) and not of MDPI and/or the editor(s). MDPI and/or the editor(s) disclaim responsibility for any injury to people or property resulting from any ideas, methods, instructions or products referred to in the content. |
© 2026 by the authors. Licensee MDPI, Basel, Switzerland. This article is an open access article distributed under the terms and conditions of the Creative Commons Attribution (CC BY) license.